Attached files
| file | filename |
|---|---|
| EX-32.1 - EXHIBIT 32.1 - AEROJET ROCKETDYNE HOLDINGS, INC. | exhibit3212017.htm |
| EX-31.2 - EXHIBIT 31.2 - AEROJET ROCKETDYNE HOLDINGS, INC. | exhibit3122017.htm |
| EX-31.1 - EXHIBIT 31.1 - AEROJET ROCKETDYNE HOLDINGS, INC. | exhibit3112017.htm |
| EX-24.1 - EXHIBIT 24.1 - AEROJET ROCKETDYNE HOLDINGS, INC. | exhibit2412017.htm |
| EX-23.1 - EXHIBIT 23.1 - AEROJET ROCKETDYNE HOLDINGS, INC. | exhibit2312017.htm |
| EX-21.1 - EXHIBIT 21.1 - AEROJET ROCKETDYNE HOLDINGS, INC. | exhibit2112017.htm |
UNITED STATES SECURITIES AND EXCHANGE COMMISSION
Washington, D.C. 20549
FORM 10-K
ý | ANNUAL REPORT PURSUANT TO SECTION 13 OR 15(d) OF THE SECURITIES EXCHANGE ACT OF 1934 |
For the fiscal year ended: December 31, 2017 | |
or
¨ | Transition Report Pursuant to Section 13 or 15(d) of the Securities Exchange Act of 1934 |
For the transition period from to | |
Commission File Number 1-01520
Aerojet Rocketdyne Holdings, Inc.
(Exact name of registrant as specified in its charter)
Delaware | 34-0244000 | |
(State of Incorporation) | (I.R.S. Employer Identification No.) | |
222 N. Sepulveda Blvd., Suite 500 El Segundo, California | 90245 | |
(Address of Principal Executive Offices) | (Zip Code) | |
Registrant’s telephone number, including area code
(310) 252-8100
Securities registered pursuant to Section 12(b) of the Act:
Title of each class | Name of each exchange on which registered | |
Common Stock, $0.10 par value per share | New York Stock Exchange | |
Securities registered pursuant to Section 12(g) of the Act: None
Indicate by check mark if the registrant is a well-known seasoned issuer, as defined in Rule 405 of the Securities Act. Yes ý No ¨
Indicate by check mark if the registrant is not required to file reports pursuant to Section 13 or Section 15(d) of the Act. Yes ¨ No ý
Indicate by check mark whether the registrant (1) has filed all reports required to be filed by Section 13 or 15(d) of the Securities Exchange Act of 1934 during the preceding 12 months (or for such shorter period that the registrant was required to file such reports), and (2) has been subject to such filing requirements for the past 90 days. Yes ý No ¨
Indicate by check mark whether the registrant has submitted electronically and posted on its corporate Web site, if any, every Interactive Data File required to be submitted and posted pursuant to Rule 405 of Regulation S-T during the preceding 12 months (or for such shorter period that the registrant was required to submit and post such files). Yes ý No ¨
Indicate by check mark if disclosure of delinquent filers pursuant to Item 405 of Regulation S-K is not contained herein, and will not be contained, to the best of the registrant’s knowledge, in definitive proxy or information statements incorporated by reference in Part III of this Form 10-K or any amendment to this Form 10-K. ¨
Indicate by check mark whether the registrant is a large accelerated filer, an accelerated filer, a non-accelerated filer, smaller reporting company, or an emerging growth company. See the definitions of “large accelerated filer,” “accelerated filer,” “smaller reporting company,” and "emerging growth company." in Rule 12b-2 of the Exchange Act. (Check one):
Large accelerated filer ý Accelerated filer ¨ Non-accelerated filer ¨ Smaller reporting company ¨ Emerging growth company ¨
If an emerging growth company, indicate by check mark if the registrant has elected not to use the extended transition period for complying with any new or revised financial accounting standards provided pursuant to Section 13(a) of the Exchange Act. ¨
Indicate by check mark whether the registrant is a shell company (as defined in Rule 12b-2 of the Act.) Yes ¨ No ý
The aggregate market value of the voting common equity held by nonaffiliates of the registrant as of June 30, 2017 was approximately $1.6 billion.
As of February 15, 2018, there were 75.1 million outstanding shares of the Company’s common stock, including unvested common shares, $0.10 par value.
Portions of the 2018 Proxy Statement of Aerojet Rocketdyne Holdings, Inc. relating to its annual meeting of stockholders scheduled to be held on May 8, 2018 are incorporated by reference into Part III of this Report.
Aerojet Rocketdyne Holdings, Inc.
Annual Report on Form 10-K
For the Fiscal Year Ended December 31, 2017
Table of Contents
Item Number | ||
PART I | ||
1. | Business | |
1A. | Risk Factors | |
1B. | Unresolved Staff Comments | |
2. | Properties | |
3. | Legal Proceedings | |
4. | Mine Safety Disclosures | |
PART II | ||
5. | Market for Registrant’s Common Equity, Related Stockholders’ Matters, and Issuer Purchases of Equity Securities | |
6. | Selected Financial Data | |
7. | Management’s Discussion and Analysis of Financial Condition and Results of Operations | |
7A. | Quantitative and Qualitative Disclosures about Market Risk | |
8. | Consolidated Financial Statements and Supplementary Data | |
9. | Changes in and Disagreements with Accountants on Accounting and Financial Disclosure | |
9A. | Controls and Procedures | |
9B. | Other Information | |
PART III | ||
10. | Directors, Executive Officers, and Corporate Governance | |
11. | Executive Compensation | |
12. | Security Ownership of Certain Beneficial Owners and Management and Related Stockholder Matters | |
13. | Certain Relationships and Related Transactions, and Director Independence | |
14. | Principal Accountant Fees and Services | |
PART IV | ||
15. | Exhibits and Financial Statement Schedules | |
16. | 10-K Summary | |
Signatures | ||
Part I
Item 1. Business
Unless otherwise indicated or required by the context, as used in this Annual Report on Form 10-K ("Report"), the terms “we,” “our,” “us,” and the "Company" refer to Aerojet Rocketdyne Holdings, Inc. and all of its subsidiaries that are consolidated in conformity with accounting principles generally accepted in the United States of America (“GAAP”).
Certain information contained in this Annual Report on Form 10-K should be considered “forward-looking statements” as defined by Section 21E of the Private Securities Litigation Reform Act of 1995. All statements in this Report other than historical information may be deemed forward-looking statements. These statements present (without limitation) the expectations, beliefs, plans, and objectives of management and future financial performance and assumptions underlying, or judgments concerning, the matters discussed in the statements. The words “believe,” “estimate,” “anticipate,” “project” and “expect,” and similar expressions, are intended to identify forward-looking statements. Forward-looking statements involve certain risks, estimates, assumptions, and uncertainties, including with respect to future sales and activity levels, cash flows, contract performance, the outcome of litigation and contingencies, environmental remediation, availability of capital, and anticipated costs of capital. A variety of factors could cause actual results or outcomes to differ materially from those expected and expressed in our forward-looking statements. Important risk factors that could cause actual results or outcomes to differ from those expressed in the forward-looking statements are described in the section “Risk Factors” in Item 1A of this Report. Additional risk factors may be described from time to time in our future filings with the Securities and Exchange Commission (“SEC”).
Overview
We are a manufacturer of aerospace and defense products and systems with a real estate segment. Our operations are organized into two segments:
Aerospace and Defense — includes the operations of our wholly-owned subsidiary Aerojet Rocketdyne, Inc. (“Aerojet Rocketdyne”), a leading technology-based designer, developer and manufacturer of aerospace and defense products and systems for the United States (“U.S.”) government, including the Department of Defense (“DoD”), the National Aeronautics and Space Administration (“NASA”), and major aerospace and defense prime contractors.
Real Estate — includes the activities of our wholly-owned subsidiary Easton Development Company, LLC (“Easton”) related to the re-zoning, entitlement, sale, and leasing of our excess real estate assets. We currently are in the process of seeking zoning changes and other governmental approvals on our excess real estate assets to optimize their value.
Sales, segment performance, total assets, and other financial data of our segments for fiscal 2017, fiscal 2016, fiscal 2015, and one month ended December 31, 2015 are set forth in Note 10 in notes to consolidated financial statements included in Item 8 of this Report.
In January 2016, our Board of Directors approved a change in our fiscal year-end from November 30 of each year to December 31 of each year. The fiscal year of our subsidiary, Aerojet Rocketdyne, ends on the last Saturday in December. As a result of the change, we had a one month transition period in December 2015. The audited results for the one month ended December 31, 2015 are included in Item 8 of this Report. Further, as a result of the 2016 calendar, Aerojet Rocketdyne had 53 weeks of operations in fiscal 2016 compared with 52 weeks of operations in fiscal 2017 and fiscal 2015. The additional week of operations, which occurred in the fourth quarter of fiscal 2016, accounted for $32.2 million in additional net sales. Financial information for the twelve months ended December 31, 2015 has not been included in this Form 10-K for the following reasons: (i) the twelve months ended November 30, 2015 provide a meaningful comparison for the twelve months ended December 31, 2017 and 2016; (ii) there are no significant factors, seasonal or other, that would impact the comparability of information if the results for the twelve months ended December 31, 2015 were presented in lieu of results for the twelve months ended November 30, 2015; and (iii) it was not practicable or cost justified to prepare this information.
We were incorporated in Ohio in 1915 and reincorporated to the State of Delaware on April 11, 2014. Our principal executive offices are located at 222 N. Sepulveda Blvd., Suite 500, El Segundo, California 90245.
Our Internet website address is www.AerojetRocketdyne.com. We have made available through our Internet website, free of charge, our Annual Report on Form 10-K, Quarterly Reports on Form 10-Q, Current Reports on Form 8-K and amendments to those reports filed or furnished pursuant to Section 13(a) or 15(d) of the Securities Exchange Act of 1934 as soon as reasonably practicable after such materials were electronically filed with, or furnished to, the SEC. We also make available on our Internet website our corporate governance guidelines and the charters for each of the following committees of our Board of Directors: Audit; Corporate Governance & Nominating; and Organization & Compensation. Our corporate governance guidelines and such charters are also available in print to anyone who requests them.
1
Aerospace and Defense
Aerojet Rocketdyne is a world-recognized technology-based engineering and manufacturing company that develops and produces specialized propulsion systems, as well as armament systems. We develop and manufacture all four propulsion types (liquid, solid, air-breathing, and electric) for space, defense, civil and commercial applications. Principal customers and end users include the DoD, NASA, The Boeing Company (“Boeing”), Lockheed Martin Corporation (“Lockheed Martin”), Raytheon Company (“Raytheon”), and United Launch Alliance (“ULA”).
Primary Markets and Programs
The markets and key programs we serve are:
Aerospace. We specialize in the development and production of propulsion systems for space applications and our products include a broad market offering of both chemical (liquid propellant engines and solid rocket motors) and electric propulsion required for launch vehicle and in-space applications in the defense, civil and commercial propulsion markets.
Our space launch systems have a long, successful history with the DoD where we continue to project strong support related to National Security Space requirements enabling communications, navigation, intelligence, surveillance, and reconnaissance activities. We provide booster and upper stage propulsion for ULA’s Delta IV and Atlas V launch vehicles in support of the Evolved Expendable Launch Vehicle (“EELV”) program, as well as a limited number of Delta II vehicles which are supporting commercial customers launching earth observation spacecraft.
During fiscal 2017, we achieved a number of significant milestones on the NASA Space Launch System (“SLS”) program. We made significant progress on our production restart and affordability activities on the RS-25 engines that will power the first SLS flight. Also, in our NASA business we completed the qualification of and delivered many of the propulsion subsystems for the Boeing Starliner vehicle which will support commercial manned services for NASA. In addition, the Lithium Ion batteries we developed as an upgrade to the International Space Station ("ISS") power system were delivered to the ISS in 2017 and are in full operation.
We continued to mature critical technologies for our nation’s next generation of advanced hydrocarbon engines for future high-performance booster systems with the ability to eliminate the U.S. dependence on Russian-provided booster systems for National Security Space Launch. The U.S. Air Force awarded us an Other Transaction Agreement (“OTA”) that can provide up to $536 million of U.S. government funding in addition to our investment to qualify our AR1 engine. In fiscal 2017, we passed the AR1 Critical Design Review which represented a culmination of hundreds of development tests and manufacturing demonstrations.
A critical new research and development effort secured in 2017 was the propulsion system to power the Boeing XSP advance reusable launcher. We will be adapting our RS-25 engine to this new strategic application that could significantly lower the cost of access to space. In addition, we were awarded several significant follow-on contracts in 2017 in the high power electric propulsion area to support both NASA’s human and scientific exploration goals.
A subset of our key space programs include: RS-68, RS-27, and RL10 engines/boosters that power EELV launch vehicles, the AR1 large liquid engine for the next generation of launch vehicles, propulsion for the Orion human space capsule and the Starliner Commercial Crew Transportation Capability capsule, and multiple in-space electric and chemical propulsion systems to provide orbit raising and satellite station positioning.
Defense. We specialize in the development and production of propulsion systems for defense applications including armament systems for precision tactical systems and missile defense propulsion, tactical missile propulsion and hypersonic propulsion systems.
We develop and manufacture liquid and solid divert and attitude control ("DACs") propulsion systems and booster motors for missile defense applications. These are complex systems that provide multi-directional thrust and variable thrust levels to steer or control an intercept missile. Additionally, we develop and manufacture boost and post-boost rocket motors for strategic missiles. These systems provide launch capability and directional control for critical missile defense interceptors and for ground and sea-based strategic missiles.
We design, develop, and produce propulsion and warhead systems for tactical missiles. Our tactical products have been successfully fielded on numerous active U.S. and international weapon system platforms.
During fiscal 2017, we continued to expand our strong legacy propulsion franchises on the Standard Missile, Patriot Advanced Capability-3 ("PAC-3"), Terminal High Altitude Area Defense ("THAAD") and Guided Multiple Launch Rocket System ("GMLRS") missile propulsion systems. These franchise programs experienced backlog growth during 2017.
As part of our Competitive Improvement Program ("CIP") in 2017, we completed validation of activity to move energetic production of the Standard Missile-3 DACs from our Sacramento, California facility to our Orange County, Virginia, facility. Also, the THAAD Boost Motor program energetic production moved from Sacramento, California, to our Camden, Arkansas production facility. These production consolidation activities in 2017 helped to reduce costs and strengthen competitiveness.
2
In a new and developing business arena, we were awarded a full-scale engineering development project for an advanced air-launched propulsion system that will transition to production. In the hypersonic propulsion technology area, we were awarded a contract for the Advanced Full Range Engine that will demonstrate reusable propulsion that can function from “takeoff” to Mach 5+. Finally, we initiated early development contract work in support of the nation’s future Ground Based Strategic Deterrent missile propulsion program.
Finally, our recently integrated Aerojet Rocketdyne Coleman Aerospace ("Coleman") business successfully delivered and supported flight of our extended-long-range air-launched ballistic missile target that is C-17 aircraft deployed. Coleman also continued to expand its scope on the Missile Defense Agency’s medium-range ballistic missile target program.
A subset of our key defense programs include: Exoatmospheric Kill Vehicle (“EKV”) Liquid DACs, booster and Liquid DACs for THAAD, boosters and solid DACs for the Navy’s Standard Missile family, PAC-3, GMLRS, HAWK, Javelin, Tactical Tomahawk, and Tube-launched Optically-tracked Wire-guided warhead.
Our Competitive Strengths
Leadership in Propulsion - For over 70 years, we have demonstrated a legacy of successfully meeting the most challenging missions by producing some of the world’s most technologically advanced propulsion systems for our customers.
Diversified and Well Balanced Portfolio - We have been and continue to be a pioneer in the development of many enabling technologies and products that have strengthened multiple branches of the U.S. military and enabled the exploration of space. We believe Aerojet Rocketdyne maintains a unique competitive position due to a strategic focus on creating and maintaining a broad spectrum of propulsion and energetic products assisted by the growing market demand for its innovative energy management technologies.
High Visibility of Revenue with Multi-year Contracts and Sizable Backlog - The highly visible nature of our revenue comes from the long-term nature of the programs with which we are involved, our diverse and attractive contract base and our deep customer relationships. A substantial portion of our sales are derived from multi-year contract awards from major aerospace and defense prime contractors. In many cases, we operate under sole source contracts, some of which are follow-on contracts to contracts initially competed years ago and others have been sole source contracts since inception. High renewal rates, supported by our market leading technology provide us with a highly stable business base from which to grow. As of December 31, 2017, our contract backlog (funded and unfunded) was $4.6 billion and our funded backlog, which includes only amounts for which funding has been authorized by a customer and a purchase order has been received, totaled $2.1 billion.
Exceptional Long-Term Industry Relationships - We serve a broad set of customers and are major suppliers of propulsion products to top original equipment manufacturers such as Boeing, Lockheed Martin, Raytheon and ULA, as well as to the DoD, NASA and other U.S. government agencies. We have a long history of partnering with their respective prime contractors and have developed close relationships with key decision-makers in the rocket and missile propulsion markets. We are, in many instances, approached by multiple prime contractors early in the bidding process, which is a testament to the strength of our relationships and technological leadership in the industry.
Competition
The competitive dynamics of our multi-faceted marketplace vary by product line and customer as we experience many of the same influences felt by the broader aerospace and defense industry. The large majority of products we manufacture are highly complex, technically sophisticated and extremely hazardous to build, demanding rigorous manufacturing procedures and highly specialized manufacturing equipment. While historically these factors, coupled with the high cost to establish the infrastructure required to meet these needs, posed substantial barriers to entry, modern design tools and manufacturing techniques (e.g., additive manufacturing) available to new entrants with the ability to self-fund start-up as well as development costs has led to increased competition in space related markets. To date, competition has been limited to a few participants who tend to be narrowly focused on products that are sub-elements of our overall product portfolio. For example, entrepreneurs such as SpaceX and Blue Origin, who have been or are in the process of developing liquid fuel propulsion capabilities are primarily focused on the development of space propulsion systems for heavy lift launch vehicles and are not pursuing or participating in the missile defense or tactical propulsion products that make up a substantial portion of our overall business. These new entrepreneurs have signaled their intent to compete primarily on price and are therefore bringing pressure to bear on existing cost paradigms and manufacturing methodologies.
3
The table below lists the primary participants in the propulsion market:
Company | Parent | Propulsion Type |
Aerojet Rocketdyne | Aerojet Rocketdyne Holdings, Inc. | Solid, liquid, air- breathing, electric |
Airbus Defence and Space (formerly Astrium) | Airbus Group | Solid, liquid |
Alliant Techsystems | Orbital ATK, Inc. | Solid, air-breathing |
Avio | Avio S.p.A | Solid, liquid |
Blue Origin LLC | Blue Origin | Liquid |
Electron Technologies, Inc. | L-3 Communications Corporation | Electric |
General Dynamics OTS | General Dynamics | Solid |
Moog Inc. | Moog Inc. | Liquid, electric |
Nammo Talley | Nammo Talley | Solid |
Northrop Grumman Aerospace Systems | Northrop Grumman Corporation (“Northrop”) | Liquid |
Safran | Safran | Liquid, solid |
SpaceX | SpaceX | Liquid |
Industry Overview
Our primary aerospace and defense customers include the DoD and its agencies, NASA, and the prime contractors that supply products to these customers. We rely on U.S. government spending on aerospace and defense products and systems, and our backlog depends, in large part, on continued funding by the U.S. government for the programs in which we are involved. These funding levels are not generally correlated with any specific economic cycle, but rather follow the cycle of general public policy and political support for this type of funding. Moreover, although our contracts often contemplate that our services will be performed over a period of several years, the U.S. Congress must appropriate funds for a given program and the U.S. President must sign into law such appropriations legislation each government fiscal year (“GFY”) and may significantly increase, decrease or eliminate, funding for a program. A decrease in DoD and/or NASA expenditures, the elimination or curtailment of a material program in which we are or hope to be involved, or changes in payment patterns of our customers as a result of changes in U.S. government outlays, could have a material adverse effect on our operating results, financial condition, and/or cash flows.
Congress was not able to pass full year appropriations for either DoD or NASA prior to the start of GFY 2017 on October 1, 2016, necessitating a short-term Continuing Resolution (“CR”) into December 2016. After the 2016 U.S. Presidential Election in November 2016, Congress passed another CR into mid-2017 to allow the new Administration an opportunity to shape federal spending. On May 5, 2017, President Trump signed into law the Consolidated Appropriations Act of 2017, an omnibus appropriations bill for GFY 2017, including appropriations for DoD and NASA; however, the delayed completion of the GFY2017 spending bills resulted in a delay to the release of the President’s Budget Request for GFY2018. With a truncated legislative cycle, Congress was unable to pass GFY 2018 appropriation bills before October 1, 2017, culminating in a series of CRs, with the latest through March 23, 2018.
The SLS appears to remain a top Congressional priority as the CR included a provision to allow NASA the funding flexibility for SLS and deep exploration to remain on track. The SLS program also has enjoyed wide, bipartisan support in both chambers of Congress. We maintain a strong relationship with NASA and our propulsion systems have been powering NASA launch vehicles and spacecraft since the inception of the U.S. space program. Our booster, upper stage and Orion vehicle propulsion systems are currently baselined on the new SLS vehicle and both upper stage and booster engines are in development for future SLS variants. Due to the retirement of the space shuttle fleet, U.S. astronauts have been dependent on Russian Soyuz flights for access to and from the ISS for the better part of this decade. NASA has been working to re-establish U.S. manned space capability as soon as possible through development of a new “space taxi” to ferry astronauts and cargo to the ISS. In 2014, Boeing’s CST-100 Starliner capsule, powered by Aerojet Rocketdyne propulsion, was selected by NASA to transport astronauts to and from the ISS. As Boeing’s business partner, Aerojet Rocketdyne will be providing the propulsion system for this new capsule, thereby supplementing its work for NASA on the SLS designed for manned deep space exploration. In both instances, we have significant propulsion content and we look forward to supporting these programs for NASA.
Major Customers
Information concerning major customers appears in Part II, Item 7. Management’s Discussion and Analysis of Financial Condition and Results of Operations under the caption “Major Customers.”
4
Contract Types
Research and development contracts are awarded during the inception stage of a program’s development. Production contracts provide for the production and delivery of mature products for operational use. Aerojet Rocketdyne’s contracts are largely categorized as either “fixed-price” (largely used by the U.S. government for production-type contracts) or “cost-reimbursable” (largely used by the U.S. government for development-type contracts). During fiscal 2017, approximately 60% of our net sales were from fixed-price contracts, 36% from cost-reimbursable contracts, and 4% from other sales including commercial contracts.
Fixed-price contracts are typically (i) firm fixed-price, (ii) fixed-price-incentive fee, or (iii) fixed-price level of effort contracts. For firm fixed-price contracts, Aerojet Rocketdyne performs work for a fixed price and realizes all of the profit or loss resulting from variations in costs during contract performance. For fixed-price-incentive fee contracts, Aerojet Rocketdyne receives increased or decreased fees or profits based upon actual performance against established targets or other criteria. For fixed-price level of effort contracts, Aerojet Rocketdyne generally receives a structured fixed price per labor hour, dependent upon the customer’s labor hour needs. All fixed-price contracts present the risk of unreimbursed cost overruns potentially resulting in lower than expected contract profit margin and losses.
Cost-reimbursable contracts are typically (i) cost plus fixed fee, (ii) cost plus incentive fee, or (iii) cost plus award fee contracts. For cost plus fixed fee contracts, Aerojet Rocketdyne typically receives reimbursement of its costs, to the extent the costs are allowable under contractual and regulatory provisions, in addition to receiving a fixed fee. For cost plus incentive fee contracts and cost plus award fee contracts, Aerojet Rocketdyne receives adjustments to the contract fee, within designated limits, based on actual results as compared with contractual targets for factors such as cost, performance, quality, and schedule.
In addition, OTA contracts are becoming more prevalent in initial phases of U.S. government procurements. An OTA is a special vehicle used by federal agencies for obtaining or advancing research and development or prototypes. The U.S. government's procurement regulations and certain procurement statutes do not apply to OTAs, and accordingly, other transaction authority gives agencies the flexibility necessary to develop agreements tailored to a particular transaction. Our sales and backlog figures do not include work we have under contracts obligated by the customer under an OTA. See our discussion below under "Research and Development" on our OTA with the U.S. Air Force in a public-private partnership to jointly develop the AR1 engine.
Some programs under contract have product life cycles exceeding ten years. It is typical for U.S. government propulsion contracts to be of relatively small contract value during development phases that can last from two to five years, followed by low-rate and then full-rate production, where annual funding can grow significantly.
Government Contracts and Regulations
U.S. government contracts generally are subject to Federal Acquisition Regulations (“FAR”), agency-specific regulations that supplement FAR, such as the DoD’s Defense Federal Acquisition Regulations, and other applicable laws and regulations. These regulations impose a broad range of requirements, many of which are unique to U.S. government contracting, including various procurement, import and export, security, contract pricing and cost, contract termination and adjustments, mandatory disclosure, and audit requirements. Our failure to comply with these regulations and requirements could result in reductions of the value of contracts, contract modifications or termination, inability to bill and collect receivables from customers, and the assessment of penalties and fines that could lead to suspension or debarment from U.S. government contracting or subcontracting. In addition, as a U.S. government contractor, we are subject to routine audits, reviews, and investigations by the Defense Contract Audit Agency (“DCAA”), the Defense Contract Management Agency, and other similar U.S. government agencies. Such reviews include but are not limited to our contract performance, compliance with applicable laws, regulations, and standards as well as the review of the adequacy of our accounting systems, purchasing systems, property management systems, estimating systems, earned value management systems, and material management and accounting systems.
The U.S. government’s ability to unilaterally modify or terminate a contract or to discontinue funding for a particular program at any time could have a material adverse effect on our operating results, financial condition, and/or cash flows. The cancellation of a contract, if terminated for cause, could also subject us to liability for the excess costs incurred by the U.S. government in procuring undelivered items from another source. If terminated for convenience, our recovery of costs would be limited to amounts already incurred or committed (including severance costs for terminated employees), and our profit would be limited based on the work completed prior to termination.
Additional information about the risks relating to government contracts and regulations appears in "Risk Factors" in Item 1A of this Report.
Backlog
Information concerning backlog appears in Part II, Item 7. Management’s Discussion and Analysis of Financial Condition and Results of Operations under the caption “Operating Segment Information.”
5
Seasonality
Aerojet Rocketdyne’s business is not subject to predictable seasonality. Primary factors affecting the timing of our sales include the timing of U.S. government awards, the availability of U.S. government funding, contractual product delivery requirements, and customer acceptances.
Research and Development ("R&D")
We view R&D efforts as critical to maintaining our leadership position in markets in which we compete. Our R&D is primarily supported by customer funding.
Our company-funded R&D efforts include expenditures for technical activities that are vital to the development of new products, services, processes or techniques, as well as those expenses for significant improvements to existing products or processes.
Our R&D expenditures for the periods presented were as follows:
Year Ended | One month ended | ||||||||||||||
December 31, | December 31, | November 30, | December 31, | ||||||||||||
2017 | 2016 | 2015 | 2015 | ||||||||||||
(In millions) | |||||||||||||||
Customer-sponsored | $ | 561.1 | $ | 513.0 | $ | 485.8 | $ | 33.7 | |||||||
Company-sponsored | 44.6 | 43.0 | 74.4 | 4.6 | |||||||||||
Total R&D expenditures | $ | 605.7 | $ | 556.0 | $ | 560.2 | $ | 38.3 | |||||||
The Company-sponsored R&D expenditures in fiscal 2017, 2016, 2015, and the one month ended December 31, 2015 included $16.8 million, $20.5 million, $48.2 million, and $2.7 million, respectively, of AR1 R&D expenses, see discussion below.
AR1
In February 2016, pursuant to an OTA, the U.S. Air Force selected Aerojet Rocketdyne and ULA to share in a public-private partnership to develop jointly the AR1 engine. The total agreement is valued at $804.0 million with the U.S. Air Force investing two-thirds of the funding required to complete development of the AR1 engine by 2019, and is being conducted in four phases, with each being an option to progress the project at pre-defined decision points. The work is expected to be completed no later than December 31, 2019. Through December 31, 2017, the U.S. Air Force has obligated $174.0 million with Aerojet Rocketdyne contributing $77.3 million and ULA contributing $6.1 million in cash and $3.6 million in "in-kind" R&D expenses. On February 1, 2018, the U.S. Air Force authorized phase two of the program, which obligates the U.S. Air Force to an additional $95.5 million and Aerojet Rocketdyne and ULA to an additional $47.8 million. The total potential investment by Aerojet Rocketdyne and its partners, if all options are exercised, is $268.0 million. The U.S. Air Force contributions are recognized proportionately as an offset to R&D expenses. The AR1 inception to date project costs at December 31, 2017, were as follows (in millions):
AR1 R&D costs incurred | $ | 245.6 | |
Less amounts funded by the U.S. Air Force | (147.7 | ) | |
Less amounts funded by ULA | (9.7 | ) | |
AR1 R&D costs net of reimbursements | $ | 88.2 | |
Of the $88.2 million AR1 investment, $32.1 million was expensed and $56.1 million was applied to our contracts.
Suppliers and Raw Materials
The national aerospace supply base continues to consolidate due to economic, environmental, and marketplace circumstances beyond our control. The loss of key qualified suppliers of technologies, components, and materials can cause significant disruption to our program performance and cost.
Availability of raw materials and supplies has been generally sufficient. We sometimes are dependent, for a variety of reasons, upon sole-source or qualified suppliers and have, in some instances in the past, experienced difficulties meeting production and delivery obligations because of delays in delivery or reliance on such suppliers. Further, as a U.S. government contractor, we are often required to procure materials from certain suppliers capable of meeting rigorous customer and government specifications.
6
The supply of ammonium perchlorate, a principal raw material used in solid propellant, is limited to a domestic independent single source that supplies the majority of the domestic solid propellant industry and actual pricing is based on the total industry demand. In the majority of our contracts, we anticipated this price increase and incorporated abnormal escalation pricing language into our proposals and contracts.
We are also impacted, as is the rest of the industry, by fluctuations in the sustained availability, prices and lead-times of raw materials used in production on various fixed-price contracts, particularly on multi-year programs. We continue to experience volatility in the price and lead-times of certain commodity metals, electronic components, and constituent chemicals. An emerging challenge to the extended supply chain is the regulatory requirements to comply with stringent cyber security regulations that may influence the cost of materials and services on U.S. government contracts. We are actively working to identify these costs to obtain protection in our contracts.
Additional information about the risks relating to suppliers and raw materials appears in "Risk Factors" in Item 1A of this Report.
Intellectual Property
Where appropriate, Aerojet Rocketdyne obtains patents in the U.S. and other countries for new and useful processes, machines, manufactures or compositions of matter, or any new and useful improvements thereof relating to its products and services. We use patents selectively to protect from an unauthorized third party making, using, selling, offering to sell and importing the claimed inventions of the patents. Our patents are maintained through the statutory limit of time, which is typically 20 years from the date of filing of the patent application, where the claimed invention has value in the markets in which we compete. We rely on trade secret protection for financial, technical and personnel information that provides an economic competitive advantage by virtue of not being known by the relevant public. If properly protected, trade secrets can be maintained in perpetuity. Aerojet Rocketdyne takes reasonable steps to prevent disclosure of its trade secrets in order to maintain protection under applicable state and federal laws. As our products and services typically embody complex systems that include many technologies, no single patent or trade secret is material to us.
Real Estate
We own 11,451 acres of land adjacent to U.S. Highway 50 between Rancho Cordova and Folsom, California east of Sacramento (“Sacramento Land”). Acquired in the early 1950s for our aerospace and defense operations, large portions were used solely to provide safe buffer zones around hazardous operations. Modern changes in propulsion technology coupled with the relocation of certain of our propulsion operations led us to determine large portions of the Sacramento Land were no longer needed for operations. Consequently, our plan has been to re-entitle the Sacramento Land for new uses and explore various opportunities to optimize its value.
The Sacramento Land is made up of 5,203 acres used for our aerospace and defense operations, 685 acres available for future entitlement, and 5,563 acres for future development under the brand name “Easton”. Easton has 3,904 acres that are fully entitled. The term “entitlement” is generally used to denote the required set of regulatory approvals required to allow land to be zoned for new requested uses. Required regulatory approvals vary with each jurisdiction and each zoning proposal and may include permits, land use master plans, zoning designations, state and federal environmental documentation, and other regulatory approvals unique to the land. The entitlement and development process in California is long and uncertain with approvals required from various authorities, including local jurisdictions, and in select projects, permits required by federal agencies such as the U.S. Army Corps of Engineers and the U.S. Department of Interior, Fish and Wildlife Service, and others prior to construction.
As Easton continues to execute re-entitlement and pre-development activities, we are pursuing all monetization options and are exploring how to maximize value from Easton. Value creation and monetization may include outright land sales and/or joint ventures with real estate developers, residential builders, and/or other third parties. The new housing market and local economy in the Sacramento region are in recovery, and we expect this trend to continue. We believe the long-term prospect for the Sacramento region represents an attractive and affordable alternative to the San Francisco Bay Area and other large metropolitan areas of California.
7
The following table summarizes the Sacramento Land (in acres):
Environmentally Unrestricted | Environmentally Restricted (1) | Total | Entitled | |||||||||
Glenborough and Easton Place | 1,043 | 349 | 1,392 | 1,392 | ||||||||
Rio del Oro | 1,818 | 491 | 2,309 | 2,309 | ||||||||
Westborough | 1,387 | 272 | 1,659 | — | ||||||||
Hillsborough (2) | 51 | 97 | 148 | 148 | ||||||||
Office Park and Auto Mall | 47 | 8 | 55 | 55 | ||||||||
Total Easton acreage | 4,346 | 1,217 | 5,563 | 3,904 | ||||||||
Operations land (3) | 24 | 5,179 | 5,203 | |||||||||
Land available for future entitlement (4) | 443 | 242 | 685 | |||||||||
Total Sacramento Land | 4,813 | 6,638 | 11,451 | |||||||||
_________
(1) | Indicates land subject to restrictions imposed by state and/or federal regulatory agencies because of our historical propulsion system testing and manufacturing activities. We are actively working with the various regulatory agencies to have the restrictions removed as early as practicable, and the solutions to use these lands within Easton have been accounted for in the various land use plans and granted entitlements. See Note 8(c) in notes to consolidated financial statements for a discussion of the federal and/or state environmental restrictions affecting portions of the Sacramento Land. |
(2) The remaining 148 acres designated in Hillsborough will be transferred, per the completed purchase and sale contract, when the required environmental remediation work is completed. See Note 1(t) of the notes to the consolidated financial statements.
(3) | We believe that the operations land is adequate for our long-term needs. |
(4) | We believe it will be several years before any of this excess Sacramento Land is available for future change in entitlement. Some of this excess land is outside the current Urban Services Boundary established by the County of Sacramento and all of it is far from existing infrastructure, making it uneconomical to pursue entitlement for this land at this time. |
Leasing & Other Real Estate
We currently lease approximately 0.4 million square feet of office space in Sacramento to various third parties. These leasing activities generated $6.4 million in revenue in fiscal 2017.
We also own approximately 580 acres of land in Chino Hills, California. This property was used for the manufacture and testing of ordnance. With the sale of our ordnance business in the mid-1990s, we closed this facility and commenced clean-up of the site. We continue to work with state regulators and the City of Chino Hills to complete those efforts.
Environmental Matters
Our current and former business operations are subject to, and affected by, federal, state, local, and foreign environmental laws and regulations relating to the discharge, treatment, storage, disposal, investigation, and remediation of certain materials, substances, and wastes. Our policy is to conduct our business with due regard for the preservation and protection of the environment. We continually assess compliance with these regulations, and we believe our current operations are materially in compliance with all applicable environmental laws and regulations.
On January 12, 1999, Aerojet Rocketdyne and the U.S. government reached a settlement agreement (“Global Settlement”) which established a cost-sharing ratio with respect to the cleanup costs of prior environmental contamination. Additionally, in conjunction with the sale of our Electronics and Information Systems ("EIS") business in 2001, we entered into an agreement with Northrop (the “Northrop Agreement”) whereby Aerojet Rocketdyne is reimbursed by Northrop for a portion of environmental expenditures eligible for recovery under the Global Settlement, subject to an annual and a cumulative limitation.
Operation and maintenance costs associated with environmental compliance and management of contaminated sites are a normal, recurring part of operations. Most of our environmental costs are incurred by our Aerospace and Defense segment, and certain of these future costs are allowed to be included in our contracts with the U.S. government.
Allowable environmental costs are charged to our contracts as the costs are incurred. Because these costs are recovered through forward-pricing arrangements, the ability of Aerojet Rocketdyne to continue recovering these costs from the U.S. government depends on Aerojet Rocketdyne’s sustained business volume from U.S. government contracts and programs.
8
The inclusion of environmental costs in our contracts with the U.S. government impacts our competitive pricing; however, we believe that this impact is mitigated by driving improvements and efficiencies across our operations as well as our ability to deliver innovative and quality products to our customers.
Under existing U.S. environmental laws, Potentially Responsible Parties (“PRPs”), are jointly and severally liable, and therefore we are potentially liable to the U.S. government or other third parties for the full cost of remediating the contamination at our facilities or former facilities or at third-party sites where we have been designated as a PRP by the EPA or state environmental agencies. The nature of environmental investigation and cleanup activities requires significant management judgment to determine the timing and amount of any estimated future costs that may be required for remediation measures. Further, environmental standards change from time to time. However, we perform quarterly reviews of these matters and accrue for costs associated with environmental remediation when it becomes probable that a liability has been incurred and the amount of the liability, usually based on proportionate sharing, can be reasonably estimated. These liabilities have not been discounted to their present value as the amounts and timing of cash payments are not fixed or reliably determinable.
We did not incur material capital expenditures for environmental control facilities in fiscal 2017 nor do we anticipate any material capital expenditures in fiscal 2018 and 2019. See Management’s Discussion and Analysis in Part II, Item 7 “Environmental Matters” of this Report for additional information.
Additional information on the risks related to environmental matters can be found under “Risk Factors” in Item 1A of this Report, including the material effects on compliance with environmental regulations that may impact our competitive position and operating results.
Employees
As of December 31, 2017, 14% of our 5,157 employees were covered by collective bargaining agreements. Significant collective bargaining agreements are due to expire in the fall of 2018. We believe that our relations with our employees and unions are good.
Item 1A. Risk Factors
Future reductions or changes in U.S. government spending could adversely affect our financial results.
Our primary aerospace and defense customers include the DoD and its agencies, NASA, and the prime contractors that supply products to these customers. We rely on particular levels of U.S. government spending on propulsion systems for defense, space and armament systems for precision tactical weapon systems and munitions applications, and our backlog depends, in a large part, on continued funding by the U.S. government for the programs in which we are involved. These spending levels are not generally correlated with any specific economic cycle, but rather follow the cycle of general public policy and political support for this type of spending. Moreover, although our contracts often contemplate that our services will be performed over a period of several years, the U.S. President must propose and Congress must appropriate funds for a given program each GFY and may significantly change, increase, reduce or eliminate, funding for a program.
A decrease in DoD and/or NASA expenditures, the elimination or curtailment of a material program in which we are involved, or changes in payment patterns of our customers as a result of changes in U.S. government spending, could have a material adverse effect on our operating results, financial condition, and/or cash flows.
The cancellation or material modification of one or more significant contracts could adversely affect our financial results.
Sales, directly and indirectly, to the U.S. government and its agencies accounted for approximately 92% of our total net sales in fiscal 2017. Our contracts typically permit the U.S. government to unilaterally modify or terminate a contract or to discontinue funding for a particular program at any time. The cancellation of a contract, if terminated for cause, could also subject us to liability for the excess costs incurred by the U.S. government in procuring undelivered items from another source. If terminated for convenience, our recovery of costs would be limited to amounts already incurred or committed (including severance costs for terminated employees), and our profit would be limited based on the work completed prior to termination.
In addition, termination or suspension of any of our significant commercial contracts could result in the loss of future sales and unreimbursable expenses that could have a material adverse effect on our operating results, financial condition, and/or cash flows. Furthermore, the termination of any such contracts for default could also have a material adverse effect on our reputation and ability to obtain new business in the future.
If we experience cost overruns on our contracts, we would have to absorb the excess costs which could adversely affect our financial results and our ability to win new contracts.
In fiscal 2017, approximately 60% of our net sales were from fixed-price contracts, most of which are in mature production mode. Under fixed-price contracts, we agree to perform specified work for a fixed price and realize all of the profit or loss resulting from variations in the costs of performing the contract. As a result, all fixed-price contracts involve the inherent risk of unreimbursed cost overruns. To the extent we were to incur unanticipated cost overruns on a program or
9
platform subject to a fixed-price contract, our profitability would be adversely affected. Future profitability is subject to risks including the ability of suppliers to deliver components of acceptable quality on schedule and the successful implementation of automated tooling in production processes.
In fiscal 2017, approximately 36% of our net sales were from cost reimbursable contracts. Under cost reimbursable contracts, we agree to be reimbursed for allowable costs and be paid a fee. If our costs are in excess of the final target cost, fees and our margin may be adversely affected. If our costs exceed authorized contract funding or they do not qualify as allowable costs under applicable regulations, those costs are expensed, and we will not be reimbursed for those costs. Cost overruns may adversely affect our financial performance and our ability to win new contracts.
Also, certain costs such as those related to charitable contributions, advertising, interest expense, and public relations are generally not allowable, and therefore not recoverable through U.S. government contracts. Unexpected variances in unallowable costs may adversely affect our financial performance.
If our subcontractors or suppliers fail to perform their contractual obligations, our contract performance and our ability to win new contracts may be adversely affected.
We rely on subcontractors to perform a portion of the services we agree to provide our customers, and on suppliers to provide raw materials and component parts for our contract performance. A failure by one or more of our subcontractors or suppliers to satisfactorily provide on a timely basis the agreed-upon services or supplies may affect our ability to perform our contractual obligations. Deficiencies in the performance of our subcontractors and/or suppliers could result in liquidated damages or our customer terminating our contract for default. A termination for default could expose us to liability and adversely affect our financial performance and our ability to win new contracts.
Our success and growth in our Aerospace and Defense segment depends on our ability to execute long-standing programs and periodically secure new contracts in a competitive environment.
Aerojet Rocketdyne’s revenue is primarily derived from long-standing contracts (often sole source) where Aerojet Rocketdyne is the long-term incumbent. The challenge for Aerojet Rocketdyne is to successfully utilize its technical, engineering, manufacturing, and management skills to execute these programs for the customer, to continue to innovate and refine its solutions, and to offer the customer increasing affordability in an era of fiscal restraint. If Aerojet Rocketdyne is unable to successfully execute these long-standing programs, our ability to retain existing customers and attract new customers may be impaired.
In addition, in sectors where there is competition, it can be intense. For example, we face increasing competition from entrepreneurs such as SpaceX and Blue Origin, who have been or are in the process of developing liquid fuel propulsion capabilities which are primarily focused on the development of space propulsion systems for heavy lift launch vehicles. These new entrepreneurs have signaled their intent to compete primarily on price and are therefore bringing pressure to bear on existing cost paradigms and our manufacturing methodologies. The U.S. government also has its own manufacturing capabilities in some areas. We may be unable to compete successfully with our competitors and our inability to do so could result in a decrease in sales, profits, and cash flows that we historically have generated from certain contracts. Further, the U.S. government may open to competition programs on which we are currently the sole supplier, which could have a material adverse effect on our operating results, financial condition, and/or cash flows.
Our Aerospace and Defense segment is subject to procurement and other related laws and regulations inherent in contracting with the U.S. government, non-compliance with which could adversely affect our financial results.
In the performance of contracts with the U.S. government, we operate in a highly regulated environment and are routinely audited and reviewed by the U.S. government and its agencies, such as the DCAA. These agencies review performance under our contracts, our cost structure and our compliance with applicable laws, regulations and standards, as well as the adequacy of, and our compliance with, our internal control systems and policies. Systems that are subject to review include, but are not limited to, our accounting systems, purchasing systems, property management systems, estimating systems, earned value management systems, and material management and accounting system. Any costs ultimately found to be unallowable or improperly allocated to a specific contract will not be reimbursed or must be refunded if already reimbursed. If an audit uncovers improper or illegal activities, we may be subject to civil and criminal penalties, sanctions or suspension or debarment from doing business with the U.S. government. Whether or not illegal activities are alleged, the U.S. government also has the ability to decrease or withhold certain payments when it deems systems subject to its review to be inadequate. In addition, we could suffer serious reputational harm if allegations of impropriety were made against us. If such actions were to result in suspension or debarment, this could have a material adverse effect on our business.
These laws and regulations provide for ongoing audits and reviews of incurred costs as well as contract procurement, performance and administration. The U.S. government may, if it deems appropriate, conduct an investigation into possible illegal or unethical activity in connection with these contracts. Investigations of this nature are common in the aerospace and defense industry, and lawsuits may result. In addition, the U.S. government and its principal prime contractors periodically investigate the financial viability of their contractors and subcontractors as part of its risk assessment process associated with
10
the award of new contracts. If the U.S. government or one or more prime contractors were to determine that we were not financially viable, our ability to continue to act as a U.S. government contractor or subcontractor would be impaired.
Our competitive improvement program (“CIP”) may not be successful in aligning our operations to current market conditions.
During fiscal 2015, we initiated the first phase ("Phase I") of the CIP comprised of activities and initiatives aimed at reducing costs in order for us to continue to compete successfully. Phase I is composed of three major components: (i) facilities optimization and footprint reduction; (ii) product affordability; and (iii) reduced administrative and overhead costs. On April 6, 2017, the Board of Directors approved the second phase (“Phase II”) of our previously announced CIP. Pursuant to Phase II, we expanded CIP and further consolidated our Sacramento, California, and Gainesville, Virginia sites, while centralizing and expanding our existing presence in Huntsville, Alabama. We have incurred and will continue to incur significant expenditures to implement the CIP, and we expect to realize significant future cost savings as a result. The cost savings will be realized by the U.S government in the form of more competitive pricing. The CIP may not be successful in achieving these cost savings and other benefits within the expected timeframes, may be insufficient to successfully restructure our operations through, among other ways, the relocation of programs or the inability to transition institutional program knowledge, to conform with the changes affecting our industry, may disrupt our operations, or may be more costly than currently anticipated. See additional information in Note 11 in notes to the consolidated financial statements.
We may expand our operations through acquisitions, which may divert management’s attention and expose us to unanticipated liabilities and costs. Also, acquisitions may increase our non-reimbursable costs. We may experience difficulties integrating any acquired operations, and we may incur costs relating to acquisitions that are never consummated.
Our business strategy may lead us to expand our Aerospace and Defense segment through acquisitions. However, our ability to consummate any future acquisitions on terms that are favorable to us may be limited by U.S. government regulations, the number of attractive acquisition targets, internal demands on our resources, and our ability to obtain financing. Our success in integrating newly acquired businesses will depend upon our ability to retain key personnel, avoid diversion of management’s attention from operational matters, implement internal controls, integrate general and administrative services and key information processing systems and, where necessary, re-qualify our customer programs. In addition, future acquisitions could result in the incurrence of additional debt, costs, and/or contingent liabilities. We may also incur costs and divert management attention to acquisitions that are never consummated. Integration of acquired operations may take longer, or be more costly or disruptive to our business, than originally anticipated.
Although we undertake a due diligence investigation of each business that we have acquired or may acquire, there may be liabilities of the acquired companies that we fail to, or were unable to, discover during the due diligence investigation and for which we, as a successor owner, may be responsible. In connection with acquisitions, we generally seek to minimize the impact of these types of potential liabilities through indemnities and warranties from the seller. However, these indemnities and warranties, if obtained, may not fully cover the liabilities due to limitations in scope, amount or duration, financial limitations of the indemnitor or warrantor, or other reasons.
Our inability to adapt to rapid technological changes could impair our ability to remain competitive.
The aerospace and defense industry continues to undergo rapid and significant technological development. Our competitors may implement new technologies before us, allowing them to provide more effective products at more competitive prices. Future technological developments could:
• | adversely impact our competitive position if we are unable to react to these developments in a timely or efficient manner; |
• | require us to write-down obsolete facilities, equipment, and technology; |
• | require us to discontinue production of obsolete products before we can recover any or all of our related research, development and commercialization expenses; or |
• | require significant capital expenditures for research, development, and launch of new products or processes. |
Our business and operations could be adversely impacted in the event of a failure of our information technology infrastructure or adversely impacted by a successful cyber-attack.
As a U.S. defense contractor, we face cyber threats, insider threats, threats to the physical security of our facilities and employees, and terrorist acts, as well as the potential for business disruptions associated with information technology failures, natural disasters, or public health crises.
We routinely experience cyber security threats, threats to our information technology infrastructure and unauthorized attempts to gain access to our sensitive information, as do our customers, suppliers, subcontractors, and other partners. We may experience similar security threats at customer sites that we operate and manage as a contractual requirement.
11
Prior cyber attacks directed at us have not had a material impact on our financial results, however this may not continue to be the case in the future. Cyber security assessment analyses undertaken by us identified and prioritized steps to enhance our cyber security safeguards. We are in the process of implementing these recommendations to enhance our threat detection and mitigation processes and procedures. Despite the implementation of these new safeguards, there can be no assurance that we will adequately protect our information or that we will not experience any future successful attacks. The threats we face vary from attacks common to most industries to more advanced and persistent, highly organized adversaries who target us because we protect national security information. If we are unable to protect sensitive information, our customers or governmental authorities could question the adequacy of our threat mitigation and detection processes and procedures. Due to the evolving nature of these security threats, however, the impact of any future incident cannot be predicted.
We recently outsourced certain information technology and cyber security functions to third-party contractors in order to take advantage of advanced cyber security technologies. The transition may present unexpected security vulnerabilities, additional costs, and result in our having less control over the performance and delivery of such services.
Although we work cooperatively with our customers, suppliers, and subcontractors to seek to minimize the impact of cyber threats, other security threats or business disruptions, we must rely on the safeguards put in place by these entities, which may affect the security of our information. These entities have varying levels of cyber security expertise and safeguards and their relationships with U.S. government contractors, such as Aerojet Rocketdyne, may increase the likelihood that they are targeted by the same cyber threats we face.
The DoD and NASA have contract provisions that require contractors at the prime and subcontract level to comply with Safeguarding Covered Defense Information and Cyber Incident Reporting and Security Requirements for Unclassified Information Technology Resources in accordance with their agency guidelines. These clauses are being inserted in or made applicable to U.S. government contracts and non-compliance may impact our ability to receive contracts if we cannot comply or use alternative approaches to comply with the contract information security requirements.
We may be required to expend significant additional resources to modify our cyber security protective measures, to investigate and remediate vulnerabilities or other exposures or to make required notifications, and we may be subject to litigation and financial losses. These costs related to cyber or other security threats or disruptions may not be fully insured or indemnified by other means. Occurrence of any of these events could adversely affect our internal operations, the services we provide to our customers, our future financial results, our reputation or our stock price; or such events could result in the loss of competitive advantages derived from our research and development efforts or other intellectual property, early obsolescence of our products and services, or contractual penalties.
We may experience warranty claims for product failures, schedule delays or other problems with existing or new products and systems.
Many of the products we develop and manufacture are technologically advanced systems that must function under demanding operating conditions. Even though we believe that we employ sophisticated and rigorous design, manufacturing and testing processes and practices, we may not be able to successfully launch or manufacture our products on schedule or our products may not perform as intended.
If our products fail to perform adequately, some of our contracts require us to forfeit a portion of our expected profit, receive reduced payments, provide a replacement product or service or reduce the price of subsequent sales to the same customer. Performance penalties may also be imposed if we fail to meet delivery schedules or other measures of contract performance. We do not generally insure against potential costs resulting from any required remedial actions or costs or loss of sales due to postponement or cancellation of scheduled operations or product deliveries.
The release, unplanned ignition, explosion, or improper handling of dangerous materials used in our business could disrupt our operations and could adversely affect our financial results.
Our business operations involve the handling, production, and disposition of potentially explosive and ignitable energetic materials and other dangerous chemicals, including motors and other materials used in rocket propulsion. Despite our use of specialized facilities to handle dangerous materials and intensive employee training programs, the handling, production, transport, and disposition of hazardous materials could result in incidents that temporarily shut down or otherwise disrupt our manufacturing operations and could cause production delays. It is possible that a release of these chemicals or an unplanned ignition or explosion could result in death or significant injuries to employees and others. Material property damage to us and third parties could also occur. The use of these products in applications by our customers could also result in liability if an explosion, unplanned ignition or fire were to occur. Extensive regulations apply to the handling of explosive and energetic materials, including but not limited to, regulations governing hazardous substances and hazardous waste. The failure to properly store and ultimately dispose of such materials could create significant liability and/or result in regulatory sanctions. Any release, unplanned ignition or explosion could expose us to adverse publicity or liability for damages or cause production delays, any of which could have a material adverse effect on our operating results, financial condition, and/or cash flows.
12
Disruptions in the supply of key raw materials, difficulties in the supplier qualification process or increases in prices of raw materials could adversely affect our financial results.
We use a significant quantity of raw materials that are subject to market fluctuations and government regulations. Further, as a U.S. government contractor, we are often required to procure materials from suppliers capable of meeting rigorous customer and government specifications. As market conditions change for these companies, they often discontinue materials with low sales volumes or profit margins. We are often forced to either qualify new materials or pay higher prices to maintain the supply. Although to-date we have been successful in establishing replacement materials and securing customer funding to address specific qualification needs of the programs, we may be unable to continue to do so.
The supply of ammonium perchlorate, a principal raw material used in solid propellant, is limited to a domestic independent single source that supplies the majority of the domestic solid propellant industry and actual pricing is based on the total industry demand. The completion of the Space Shuttle Program reduced demand, resulting in significant unit price increases. In the majority of our contracts, we anticipated this price increase and incorporated abnormal escalation pricing language into our proposals and contracts.
We are also impacted, as is the rest of the industry, by fluctuations in the sustained availability, prices and lead-times of raw materials used in production on various fixed-price contracts, particularly on multi-year programs. We continue to experience volatility in the price and lead-times of certain commodity metals, electronic components, and constituent chemicals. Additionally, we may not be able to continue to negotiate with our customers for economic and/or price adjustment clauses tied to obsolete materials and commodity indices to reduce program impact. The DoD also continues to rigorously enforce the provisions of the “Berry Amendment” which imposes a requirement to procure certain strategic materials critical to national security only from U.S. sources. While availability has not been a significant issue, cost remains a concern as this industry continues to quote “price in effect” at time of shipment terms, increasing the cost risk to our programs. An emerging challenge to the extended supply chain is the U.S. government contracting regulations to comply with stringent cyber security regulations that may influence the cost of material and services on U.S. government contracts. We are actively working to identify these costs to obtain protection in our contracts. Further, a relatively recent Missile Defense Agency ("MDA") requirement to pre-approve supplier background screening processes of personnel that will have access to “controlled unclassified information” and separately approve any supplier personnel with dual citizenship has been challenging due to delays at MDA in approving requests which will potentially impact the award of subcontracts while approval is pending.
Prolonged disruptions in the supply of any of our key raw materials, difficulty qualifying new sources of supply, implementing use of replacement materials or new sources of supply, and/or a continuing volatility in the prices of raw materials could have a material adverse effect on our operating results, financial condition, and/or cash flows.
Our pension plans are currently underfunded and we expect to be required to make cash contributions in future periods, which may reduce the cash available for our businesses.
As of the last measurement date at December 31, 2017, the assets, projected benefit obligations, and unfunded pension obligation were $931.2 million, $1,442.9 million, and $511.7 million, respectively. We expect to make cash contributions of approximately $42.0 million to our tax-qualified defined benefit pension plan in fiscal 2018 of which $37.5 million is expected to be recoverable from our U.S. government contracts in fiscal 2018 with the remaining $4.5 million being potentially recoverable from our U.S. government contracts in the future. During fiscal 2017, we made cash contributions of $75.8 million to our tax-qualified defined benefit pension plan of which $33.7 million was recoverable from our U.S. government contracts in fiscal 2017 with the remaining $42.1 million expected to be recoverable from our U.S. government contracts in the future. We generally are able to recover cash contributions related to our tax-qualified defined benefit pension plan as allowable costs on our U.S. government contracts, but there can be differences between when we contribute cash to our tax-qualified defined benefit pension plan under pension funding rules and recover it under Cost Accounting Standards ("CAS").
The funded status of our pension plans may be adversely affected by the investment experience of the plans' assets, by any changes in U.S. law and by changes in the statutory interest rates used by tax-qualified pension plans in the U.S. to calculate funding requirements. Accordingly, if the performance of our plans' assets does not meet our assumptions, if there are changes to the Internal Revenue Service ("IRS") regulations or other applicable law or if other actuarial assumptions are modified, our future contributions to our underfunded pension plans could be higher than we expect.
Additionally, the level of returns on retirement benefit assets, changes in interest rates, increases in Pension Benefit Guaranty Corporations premiums, changes in regulations, changes in mortality rate assumptions, and other factors affect our financial results. The timing of recognition of retirement benefit expense or income in our financial statements differs from the timing of the required funding under the Pension Protection Act ("PPA") or the amount of funding that can be recorded in our overhead rates through our U.S. government contracting business. Significant cash contributions in future periods could materially adversely affect our business, operating results, financial condition, and/or cash flows.
13
The level of returns on retirement benefit assets, changes in interest rates, changes in legislation, and other factors affect our financial results.
Our earnings are positively or negatively impacted by the amount of expense or income we record for our employee retirement benefit plans. We calculate the expense for the plans based on actuarial valuations. These valuations are based on assumptions that we make relating to financial market and other economic conditions. Changes in key economic indicators result in changes in the assumptions we use. The key assumptions used to estimate retirement benefit expense for the following year are the discount rate and expected long-term rate of return on assets. Our pension expense or income can also be affected by legislation and other government regulatory actions.
Our operations and properties are currently the subject of significant environmental liabilities, and the numerous environmental and other government requirements to which we are subject may become more stringent in the future.
We are subject to federal, state, local, and foreign environmental laws and regulations that, among other things, require us to obtain permits to operate and install pollution control equipment and regulate the generation, storage, handling, transportation, treatment, and disposal of hazardous and solid wastes. These requirements may become more stringent in the future. Additional regulations dictate how and to what level we remediate contaminated soils and the level to which we are required to clean contaminated groundwater. These requirements may also become more stringent in the future. We may also be subject to fines and penalties relating to the operation of our existing and formerly owned businesses. We have been and are subject to toxic tort and asbestos lawsuits as well as other third-party lawsuits, due to either our past or present use of hazardous substances or the alleged on-site or off-site contamination of the environment through past or present operations. We may incur material costs in defending these claims and lawsuits and any similar claims and lawsuits that may arise in the future. Contamination at our current and former properties is subject to investigation and remediation requirements under federal, state and local laws and regulations, and the full extent of the required remediation has not yet been determined. Any adverse judgment or cash outlay could have a significant adverse effect on our operating results, financial condition, and/or cash flows.
Although some of our environmental expenditures may be recoverable and we have established reserves, given the many uncertainties involved in assessing liability for environmental claims, our reserves may not be sufficient, which could adversely affect our financial results and cash flows.
As of December 31, 2017, the aggregate range of our estimated future environmental obligations was $341.4 million to $503.4 million and the accrued amount was $341.4 million. We believe the accrued amount for future remediation costs represents the costs that could be incurred by us over the contractual term, if any, or the next fifteen years of the estimated remediation, to the extent they are probable and reasonably estimable. However, in many cases the nature and extent of the required remediation has not yet been determined. Given the many uncertainties involved in assessing liability for environmental claims, our reserves may prove to be insufficient. For example, in fiscal 2016, we reached a decision with the U.S. government on the treatment of certain utility costs related to the Sacramento site resulting in a reserve increase of $59.4 million. We evaluate the adequacy of those reserves on a quarterly basis, and adjust them as appropriate. In addition, the reserves are based only on known sites and the known contamination at those sites. It is possible that additional sites needing remediation may be identified or that unknown contamination at previously identified sites may be discovered. It is also possible that the regulatory agencies may change clean-up standards for chemicals of concern such as ammonium perchlorate and trichloroethylene. This could lead to additional expenditures for environmental remediation in the future and, given the uncertainties involved in assessing liability for environmental claims, our reserves may prove to be insufficient.
Most of our environmental costs are incurred by our Aerospace and Defense segment, and certain of these future costs are allowable to be included in our contracts with the U.S. government. We currently estimate approximately 24% of our Aerospace and Defense segment environmental costs will not likely be reimbursable.
Our environmental expenses related to non-Aerojet Rocketdyne sites are generally not recoverable and a significant increase in these estimated environmental expenses could have a significant adverse effect on our operating results, financial condition, and/or cash flows.
We face certain significant risk exposures and potential liabilities that may not be adequately covered by indemnity or insurance.
A significant portion of our business relates to developing and manufacturing propulsion systems for defense and space applications, armament systems for precision tactical weapon systems, and munitions applications. New technologies may be untested or unproven. In addition, we may incur significant liabilities that are unique to our products and services. In some, but not all, circumstances, we may receive indemnification from the U.S. government. While we maintain insurance for certain risks, the amount of our insurance coverage may not be adequate to cover all claims or liabilities, and it is not possible to obtain insurance to protect against all operational risks and liabilities. Accordingly, we may be forced to bear substantial costs resulting from risks and uncertainties of our business, which could have a material adverse effect on our operating results, financial condition, and/or cash flows.
14
Our inability to protect our patents and proprietary rights could adversely affect our businesses’ prospects and competitive positions.
We seek to protect proprietary technology and inventions through patents and other proprietary-right protection. If we are unable to obtain or maintain these protections, we may not be able to prevent third parties from using our proprietary rights. In addition, we may incur significant expense in protecting our intellectual property.
We also rely on trade secrets, proprietary know-how and continuing technological innovation to remain competitive. We have taken measures to protect our trade secrets and know-how, including the use of confidentiality agreements with our employees, consultants and advisors. These agreements may be breached and remedies for a breach may not be sufficient to compensate us for damages incurred. We generally control and limit access to our product documentation and other proprietary information. Other parties may independently develop our know-how or otherwise obtain access to our technology.
Business disruptions could seriously affect us.
Our business may be affected by disruptions including, but not limited to: threats to physical security of our facilities and employees, including senior executives; terrorist acts; information technology attacks or failures; damaging weather or other acts of nature; and pandemics or other public health crises. The costs related to these events may not be fully mitigated by insurance or other means. Disruptions could affect our internal operations or services provided to customers, which could have a material adverse effect on our operating results, financial condition, and/or cash flows.
If our operating subsidiaries do not generate sufficient cash flow or if they are not able to pay dividends or otherwise distribute their cash to us, or if we have insufficient funds on hand, we may not be able to service our debt.
All of the operations of our Aerospace and Defense and Real Estate segments are conducted through subsidiaries. Consequently, our cash flow and ability to service our debt obligations will be largely dependent upon the earnings and cash flows of our operating subsidiaries and the distribution of those earnings to us, or upon loans, advances or other payments made by these subsidiaries to us. The ability of our subsidiaries to pay dividends or make other payments or advances to us will depend upon their operating results and cash flows and will be subject to applicable laws and any contractual restrictions contained in the agreements governing their debt, if any.
We have a substantial amount of debt. Our ability to operate is limited by the agreements governing our debt.
We have a substantial amount of debt for which we are required to make interest and principal payments. Interest on long-term financing is not a recoverable cost under our U.S. government contracts. As of December 31, 2017, we had $670.9 million of debt principal. Subject to the limits contained in some of the agreements governing our outstanding debt, we may incur additional debt in the future. Our maintenance of higher levels of indebtedness could have adverse consequences including impairing our ability to obtain additional financing in the future.
Our level of debt places significant demands on our cash resources, which could:
• | make it more difficult to satisfy our outstanding debt obligations; |
• | require us to dedicate a substantial portion of our cash for payments related to our debt, reducing the amount of cash flow available for working capital, capital expenditures, entitlement of our real estate assets, contributions to our tax-qualified pension plan, and other general corporate purposes; |
• | limit our flexibility in planning for, or reacting to, changes in the industries in which we compete; |
• | place us at a competitive disadvantage with respect to our competitors, some of which have lower debt service obligations and greater financial resources than we do; |
• | limit our ability to borrow additional funds; |
• | limit our ability to expand our operations through acquisitions; and |
• | increase our vulnerability to general adverse economic and industry conditions. |
If we are unable to generate sufficient cash flow to service our debt and fund our operating costs, our liquidity may be adversely affected.
We are obligated to comply with financial and other covenants outlined in our debt indentures and agreements that could restrict our operating activities. A failure to comply could result in a default which would, if not waived by the lenders, likely would come with substantial cost and accelerate the payment of our debt.
Our debt instruments generally contain various restrictive covenants which include, among others, provisions which may restrict our ability to:
• | access the full amount of our revolving credit facility and/or incur additional debt; |
• | enter into certain leases; |
15
• | make certain distributions, investments, and other restricted payments; |
• | cause our restricted subsidiaries to make payments to us; |
• | enter into transactions with affiliates; |
• | create certain liens; |
• | purchase assets or businesses; |
• | sell assets and, if sold, retain excess cash flow from these sales; and |
• | consolidate, merge or sell all or substantially all of our assets. |
Our secured debt also contains other customary covenants, including, among others, provisions:
• | relating to the maintenance of the property collateralizing the debt; and |
• | restricting our ability to pledge assets or create other liens. |
In addition, certain covenants in our bank facility require that we maintain certain financial ratios.
Based on our existing debt agreements, we were in compliance with our financial and non-financial covenants as of December 31, 2017. Any of the covenants described in this risk factor may restrict our operations and our ability to pursue potentially advantageous business opportunities. Our failure to comply with these covenants could result in an event of default that, if not cured or waived, could result in the acceleration of our amended and restated senior credit facility entered into on June 17, 2016 (the “Senior Credit Facility”) with the lenders identified therein and Bank of America, N.A., as administrative agent and the 2.25% Convertible Senior Notes ("2 1/4% Notes"). In addition, our failure to pay principal and interest when due is a default under the Senior Credit Facility, and in certain cases, would cause cross defaults on the 2 1/4% Notes.
The real estate market involves significant risk, which could adversely affect our financial results.
Our real estate activities involve significant risks, which could adversely affect our financial results. We are subject to various risks, including the following:
• | we may be unable to obtain, or suffer delays in obtaining, necessary re-zoning, land use, building, occupancy, and other required governmental permits and authorizations, which could result in increased costs or our abandonment of these projects; |
• | we may be unable to complete environmental remediation or to have state and federal environmental restrictions on our property lifted, which could cause a delay or abandonment of these projects; |
• | we may be unable to obtain sufficient water sources to service our projects, which may prevent us from executing our plans; |
• | our real estate activities may require significant expenditures and we may not be able to obtain financing on favorable terms, which may render us unable to proceed with our plans; |
• | economic and political uncertainties could have an adverse effect on consumer buying habits, construction costs, availability of labor and materials and other factors affecting us and the real estate industry in general; |
• | our property is subject to federal, state, and local regulations and restrictions that may impose significant limitations on our plans; |
• | much of our property is raw land that includes the natural habitats of various endangered or protected wildlife species requiring mitigation; |
• | if our land use plans are approved by the appropriate governmental authorities, we may face lawsuits from those who oppose such plans (such lawsuits and the costs associated with such opposition could be material and have an adverse effect on our ability to sell property or realize income from our projects); and |
• | the time frame required for approval of our plans means that we will have to wait years for a significant cash return. |
Substantially all of our excess real estate, that we are in the process of entitling for new opportunities, is located in Sacramento County, California, making us vulnerable to changes in economic and other conditions in that particular market.
As a result of the geographic concentration of our properties, our long-term real estate performance and the value of our properties will depend upon conditions in the Sacramento region, including:
• | the sustainability and growth of industries located in the Sacramento region; |
• | the financial strength and spending of the State of California; |
• | local real estate market conditions; |
16
• | changes in neighborhood characteristics; |
• | changes in interest rates; and |
• | real estate tax rates. |
If unfavorable economic or other conditions continue in the region, our plans and business strategy could be adversely affected.
We may incur additional costs related to past or future divestitures, which could adversely affect our financial results.
In connection with our divestitures in prior periods, we have incurred and may incur additional costs. As part of our divestitures, we have provided customary indemnification to the purchasers for such matters as claims arising from the operation of the businesses prior to disposition, including income tax matters and the liability to investigate and remediate certain environmental contamination existing prior to disposition. These additional costs and the indemnification of the purchasers of our former or current businesses may require additional cash expenditures, which could have a material adverse effect on our operating results, financial condition, and/or cash flows.
In order to be successful, we must attract and retain key employees.
Our business has a continuing need to attract large numbers of skilled personnel, including personnel holding security clearances, to support the growth of the enterprise and to replace individuals who have terminated employment due to retirement or for other reasons. To the extent that the demand for qualified personnel exceeds supply, we could experience higher labor, recruiting, or training costs in order to attract and retain such employees, or could experience difficulties in performing under our contracts if our needs for such employees were unmet. In addition, our inability to appropriately plan for the transfer or replacement of appropriate intellectual capital and skill sets critical to us could result in business disruptions and impair our ability to achieve business objectives.
A strike or other work stoppage, or our inability to renew collective bargaining agreements on favorable terms, could adversely affect our financial results.
As of December 31, 2017, 14% of our 5,157 employees were covered by collective bargaining agreements. In the future, if we are unable to negotiate acceptable new agreements with the unions, upon expiration of the existing contracts, we could experience a strike or work stoppage. Even if we are successful in negotiating new agreements, the new agreements could call for higher wages or benefits paid to union members, which would increase our operating costs and could adversely affect our profitability. If our unionized workers were to engage in a strike or other work stoppage, or other non-unionized operations were to become unionized, we could experience a significant disruption of operations at our facilities or higher ongoing labor costs. A strike or other work stoppage in the facilities of any of our major customers or suppliers could also have similar effects on us.
Due to the nature of our business, our sales levels may fluctuate causing our quarterly operating results to fluctuate.
Our quarterly and annual sales are affected by a variety of factors that may lead to significant variability in our operating results. In our Aerospace and Defense segment, sales earned under long-term contracts are recognized either on a cost basis, when deliveries are made, or when contractually defined performance milestones are achieved. The timing of deliveries or milestones may fluctuate from quarter to quarter. In our Real Estate segment, sales of land may be made from time to time, which may result in variability in our operating results and cash flows.
The restatement of our previously issued financial statements has been time-consuming, expensive and could expose us to additional risks that could materially adversely affect our financial position, results of operations and cash flows.
We have incurred expenses, including audit, legal, consulting and other professional fees, in connection with the restatement of our previously issued financial statements and the remediation of weaknesses in our internal control over financial reporting. We have taken a number of steps, including adding significant internal resources and implemented a number of additional procedures, in order to strengthen our accounting function and attempt to reduce the risk of additional misstatements in our financial statements. To the extent these steps are not successful, we could be forced to incur additional time and expense. Our management’s attention has also been diverted from the operation of our business in connection with the restatements and remediation of material weaknesses in our internal controls.
In addition, any stockholder, U.S. governmental or other actions brought based on the restatement of our previously issued financial statements could, regardless of the outcome, consume management’s time and attention and result in additional legal, accounting, insurance and other costs.
Failure to maintain effective internal controls in accordance with the Sarbanes-Oxley Act could negatively impact the market price of our common stock.
Effective internal controls are necessary for us to provide reliable financial reports and to effectively prevent fraud. We rely on numerous manual processes to manage our business, which increases our risk of having an internal control failure. The SEC, as directed by Section 404 of the Sarbanes-Oxley Act of 2002, adopted rules requiring public companies to include a
17
report by management on the effectiveness of our internal control over financial reporting in our Annual Reports on Form 10-K. In addition, our independent registered public accounting firm must report on the effectiveness of the internal control over financial reporting. Although we review our internal control over financial reporting in order to ensure compliance with the Section 404 requirements, if we or our independent registered public accounting firm is not satisfied with our internal control over financial reporting or the level at which these controls are documented, designed, operated or reviewed, or if our independent registered public accounting firm interprets the requirements, rules and/or regulations differently from our interpretation, then they may issue a report that is qualified. This could result in an adverse reaction in the financial marketplace due to a loss of investor confidence in the reliability of our financial statements, which ultimately could negatively impact our stock price.
In addition, we have in the past recorded, and may in the future record, revisions or out of period adjustments to our consolidated financial statements. In making such adjustments we apply the analytical framework of SEC Staff Accounting Bulletin No. 99, “Materiality” (“SAB 99”), to determine whether the effect of any adjustment to our consolidated financial statements is material and whether such adjustments, individually or in the aggregate, would require us to restate our consolidated financial statements for previous periods. Under SAB 99, companies are required to apply quantitative and qualitative factors to determine the “materiality” of particular adjustments. In the future, we may identify further errors impacting our interim or annual consolidated financial statements. Depending upon the complete qualitative and quantitative analysis, this could result in us restating previously issued consolidated financial statements.
Item 1B. Unresolved Staff Comments
None.
Item 2. Properties
Significant operating, manufacturing, research, design, and/or marketing locations are set forth below.
Facilities
Corporate Headquarters
Aerojet Rocketdyne Holdings, Inc.
222 N. Sepulveda Blvd., Suite 500
El Segundo, California 90245
El Segundo, California 90245
Operating/Manufacturing/Research/Design/Marketing Locations
Aerospace and Defense El Segundo, California* | Design/Manufacturing Facilities: Camden, Arkansas (owned and leased); Carlstadt, New Jersey*; Chatsworth, California; Gainesville, Virginia*; Hancock County, Mississippi*; Huntsville, Alabama*; Jonesborough, Tennessee**; Orange, Virginia; Orlando, Florida*; Rancho Cordova, California; Redmond, Washington; Socorro, New Mexico; West Palm Beach, Florida* | Marketing/Sales Offices: Arlington, Virginia* |
Real Estate | ||
Rancho Cordova, California | ||
__________
* | Indicates a leased property. |
** | Owned and operated by Aerojet Ordnance Tennessee, Inc., a 100% owned subsidiary of Aerojet Rocketdyne. |
We believe each of the facilities is suitable and adequate for the business conducted at that facility taking into account current and planned future needs.
18
Item 3. Legal Proceedings
The Company and its subsidiaries are subject to legal proceedings, including litigation in U.S. federal and state courts, which arise out of, and are incidental to, the ordinary course of the Company’s on-going and historical businesses. The Company is also subject from time to time to suits under the federal False Claims Act, known as “qui tam” actions, and to governmental investigations by federal and state agencies. The Company cannot predict the outcome of such proceedings with any degree of certainty. Loss contingency provisions are recorded for probable losses at management’s best estimate of a loss, or when a best estimate cannot be made, a minimum loss contingency amount is recorded. These estimates are often initially developed substantially earlier than when the ultimate loss is known, and are refined each quarterly reporting period as additional information becomes available.
Asbestos Litigation
The Company has been, and continues to be, named as a defendant in lawsuits alleging personal injury or death due to exposure to asbestos in building materials, products, or in manufacturing operations. The majority of cases are pending in Texas and Illinois. There were 59 asbestos cases pending as of December 31, 2017.
Given the lack of any significant consistency to claims (i.e., as to product, operational site, or other relevant assertions) filed against the Company, the Company is generally unable to make a reasonable estimate of the future costs of pending claims or unasserted claims.
The aggregate settlement costs and legal and administrative fees associated with asbestos cases were immaterial for fiscal 2017, 2016, 2015, and the one month ended December 31, 2015.
Socorro
On May 12, 2015, a complaint for personal injuries, loss of consortium and punitive damages was filed by James Chavez, Andrew Baca, and their respective spouses, against Aerojet Rocketdyne and the Board of Regents of New Mexico Tech in the Seventh Judicial District, County of Socorro, New Mexico, James Chavez, et al., vs. Aerojet Rocketdyne, Inc., et al., Case No. D725CV201500047. Messrs. Chavez and Baca were employees of Aerotek, a contractor to Aerojet Rocketdyne, who were injured when excess energetic materials being managed by the Energetic Materials Research and Testing Center, a research division of New Mexico Tech, ignited in an unplanned manner. The complaint alleges causes of action based on negligence and negligence per se, strict liability, and willful, reckless and wanton conduct against Aerojet Rocketdyne, and seeks unspecified compensatory and punitive damages. Trial is scheduled for June 18, 2018. No liability for this matter has been recorded by the Company as of December 31, 2017.
Department of Justice ("DOJ") Investigation
The Company is responding to a civil investigative demand issued by the DOJ in the first quarter of fiscal 2017 requesting information relating to allegations under the False Claims Act that the Company may have previously made false representations to the U.S. government regarding the Company’s compliance with certain regulatory cybersecurity requirements. The Company is cooperating with the DOJ in its investigation of the false claim allegations.
Item 4. Mine Safety Disclosures
None.
19
PART II
Item 5. | Market for Registrant’s Common Equity, Related Stockholders’ Matters and Issuer Purchases of Equity Securities |
As of February 15, 2018, there were 6,070 holders of record of our common stock. On February 15, 2018, the last reported sale price of our common stock on the New York Stock Exchange was $27.59 per share.
Information concerning long-term debt appears in Part II, Item 7. Management’s Discussion and Analysis of Financial Condition and Results of Operations under the caption “Liquidity and Capital Resources” and in Part II, Item 8. Consolidated Financial Statements and Supplementary Data at Note 6 in notes to consolidated financial statements. Our Senior Credit Facility restricts the payment of dividends, and we do not anticipate paying cash dividends in the foreseeable future.
Information concerning securities authorized for issuance under our equity compensation plans appears in Part III, Item 12. Security Ownership of Certain Beneficial Owners and Management and Related Stockholder Matters under the caption “Equity Compensation Plan Information.”
Common Stock
Our common stock is listed on the New York Stock Exchange under the trading symbol “AJRD.” The following table lists, on a per share basis for the periods indicated, the high and low sale prices for the common stock as reported by the New York Stock Exchange:
Common Stock Price | |||||||
High | Low | ||||||
Fiscal 2017 | |||||||
First Quarter | $ | 22.99 | $ | 17.69 | |||
Second Quarter | $ | 23.27 | $ | 20.06 | |||
Third Quarter | $ | 36.25 | $ | 20.77 | |||
Fourth Quarter | $ | 35.91 | $ | 27.66 | |||
Fiscal 2016 | |||||||
First Quarter | $ | 17.20 | $ | 13.98 | |||
Second Quarter | $ | 18.86 | $ | 15.52 | |||
Third Quarter | $ | 19.16 | $ | 16.80 | |||
Fourth Quarter | $ | 21.40 | $ | 16.04 | |||
20
Stock Performance Graph
The following graph compares the cumulative total stockholder returns, calculated on a dividend reinvested basis, on $100 invested in our common stock in November 2012 with the cumulative total return of (i) the Standard & Poor’s 500 Composite Stock Price Index (“S&P 500 Index”), and (ii) the Standard & Poor’s 500 Aerospace & Defense Index. The stock price performance shown on the graph is not necessarily indicative of future performance.
Comparison of Cumulative Total Stockholder Return Among
Aerojet Rocketdyne, S&P 500 Index, and the S&P 500 Aerospace & Defense Index,
November 2012 through December 2017
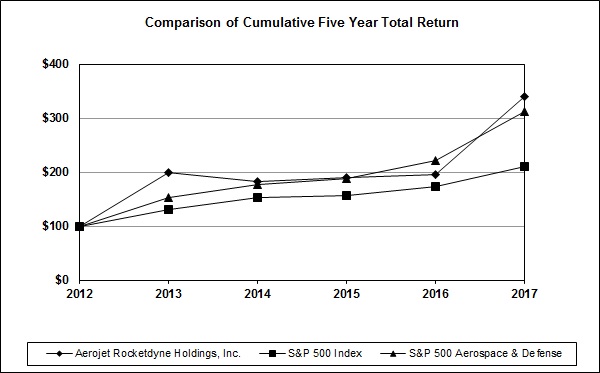
Company/Index | Base Period 2012 | Year ended | ||||||||||||||||||||||
November 30, | November 30, | November 30, | December 31, | December 31, | ||||||||||||||||||||
2013 | 2014 | 2015 | 2016 | 2017 | ||||||||||||||||||||
Aerojet Rocketdyne Holdings, Inc. | $ | 100.00 | $ | 199.35 | $ | 181.52 | $ | 190.65 | $ | 195.11 | $ | 339.13 | ||||||||||||
S&P 500 Index | 100.00 | 130.30 | 152.27 | 156.45 | 172.40 | 210.04 | ||||||||||||||||||
S&P 500 Aerospace & Defense | 100.00 | 153.67 | 175.96 | 187.61 | 221.31 | 312.90 | ||||||||||||||||||
21
Item 6. Selected Financial Data
The following selected financial data is qualified by reference to and should be read in conjunction with the consolidated financial statements, including the notes thereto in Item 8. Consolidated Financial Statements and Supplementary Data and Item 7. Management’s Discussion and Analysis of Financial Condition and Results of Operations.
Year end | One month ended | ||||||||||||||||||||||
December 31, | December 31, | November 30, | November 30, | November 30, | December 31, | ||||||||||||||||||
2017 | 2016 | 2015 | 2014 | 2013 | 2015 | ||||||||||||||||||
(In millions, except per share amounts) | |||||||||||||||||||||||
Net sales | $ | 1,877.2 | $ | 1,761.3 | $ | 1,708.3 | $ | 1,602.2 | $ | 1,378.1 | $ | 96.3 | |||||||||||
Net (loss) income | (9.2 | ) | 18.0 | (16.2 | ) | (50.0 | ) | 162.9 | 7.0 | ||||||||||||||
Basic (loss) income per share of common stock | (0.13 | ) | 0.27 | (0.27 | ) | (0.86 | ) | 2.68 | 0.11 | ||||||||||||||
Diluted (loss) income per share of common stock | (0.13 | ) | 0.27 | (0.27 | ) | (0.86 | ) | 2.05 | 0.10 | ||||||||||||||
Supplemental statement of operations information: | |||||||||||||||||||||||
Net (loss) income | $ | (9.2 | ) | $ | 18.0 | $ | (16.2 | ) | $ | (50.0 | ) | $ | 162.9 | $ | 7.0 | ||||||||
Income tax provision (benefit) | 96.1 | 11.2 | 0.3 | 16.3 | (198.4 | ) | 2.0 | ||||||||||||||||
Interest expense | 30.9 | 32.5 | 50.4 | 52.7 | 48.7 | 3.8 | |||||||||||||||||
Interest income | (3.5 | ) | (0.6 | ) | (0.3 | ) | (0.1 | ) | (0.2 | ) | — | ||||||||||||
Depreciation and amortization | 72.6 | 64.9 | 65.1 | 63.7 | 43.5 | 5.1 | |||||||||||||||||
Retirement benefits, net (1) | 39.5 | 41.4 | 67.6 | 36.5 | 65.0 | 5.6 | |||||||||||||||||
Unusual items: | |||||||||||||||||||||||
Acquisition costs | 1.0 | — | — | — | 20.0 | — | |||||||||||||||||
(Gain) loss on legal matters and settlements | (2.0 | ) | — | 50.0 | 0.9 | (0.5 | ) | 0.4 | |||||||||||||||
Loss on bank amendment | — | 0.1 | — | 0.2 | — | — | |||||||||||||||||
Loss on debt repurchased/redeemed | — | 34.4 | 1.9 | 60.6 | 5.0 | — | |||||||||||||||||
Adjusted EBITDAP (Non-GAAP measure) | $ | 225.4 | $ | 201.9 | $ | 218.8 | $ | 180.8 | $ | 146.0 | $ | 23.9 | |||||||||||
Adjusted EBITDAP (Non-GAAP measure) as a percentage of net sales | 12.0 | % | 11.5 | % | 12.8 | % | 11.3 | % | 10.6 | % | 24.8 | % | |||||||||||
Net (loss) income as percentage of net sales | (0.5 | )% | 1.0 | % | (0.9 | )% | (3.1 | )% | 11.8 | % | 7.3 | % | |||||||||||
Stock-based compensation expense (benefit) | $ | 22.0 | $ | 12.9 | $ | 8.6 | $ | 5.7 | $ | 14.1 | $ | (0.4 | ) | ||||||||||
Environmental remediation provision adjustments | 8.2 | 18.3 | 17.3 | 10.8 | 8.4 | (0.1 | ) | ||||||||||||||||
Cash flow information: | |||||||||||||||||||||||
Cash flow provided by operating activities | $ | 212.8 | $ | 158.7 | $ | 67.6 | $ | 151.9 | $ | 77.6 | $ | 0.1 | |||||||||||
Cash flow used in investing activities | (66.4 | ) | (47.1 | ) | (35.8 | ) | (35.7 | ) | (474.9 | ) | (1.2 | ) | |||||||||||
Cash flow (used in) provided by financing activities | (21.7 | ) | 90.2 | (86.6 | ) | (47.9 | ) | 432.8 | (1.5 | ) | |||||||||||||
Balance Sheet information: | |||||||||||||||||||||||
Total assets | $ | 2,258.7 | $ | 2,249.5 | $ | 2,034.9 | $ | 1,918.6 | $ | 1,752.1 | $ | 2,023.3 | |||||||||||
Total debt principal | 670.9 | 725.6 | 652.0 | 782.2 | 699.2 | 650.6 | |||||||||||||||||
________
(1) Retirement benefits are net of cash funding to our tax-qualified defined benefit pension plan which are recoverable costs under our U.S. government contracts. Our recoverable tax-qualified pension costs in fiscal 2017 and 2016 totaled $33.7 million and $27.5 million, respectively.
22
Item 7. Management’s Discussion and Analysis of Financial Condition and Results of Operations
The following discussion should be read in conjunction with the other sections of this Report, including the consolidated financial statements and notes thereto appearing in Item 8. Consolidated Financial Statements and Supplementary Data of this Report, the risk factors appearing in Item 1A. Risk Factors of this Report, and the disclaimer regarding forward-looking statements appearing at the beginning of Item 1. Business of this Report. Historical results set forth in Item 6. Selected Financial Data and Item 8. Consolidated Financial Statements and Supplementary Data of this Report should not be taken as indicative of our future operations.
Overview
A summary of the significant financial highlights for fiscal 2017 which management uses to evaluate our operating performance and financial condition is presented below.
• | Net sales for fiscal 2017 totaled $1,877.2 million compared with $1,761.3 million for fiscal 2016. |
• | Net loss for fiscal 2017 was $(9.2) million, or $(0.13) loss per share, compared with net income of $18.0 million, or $0.27 diluted income per share, for fiscal 2016. |
• | On December 22, 2017, the U.S. government enacted comprehensive tax legislation commonly referred to as the Tax Cuts and Jobs Act (the “Tax Act”). The Tax Act makes broad and complex changes to the U.S. tax code. Among other provisions, the Tax Act reduced the federal corporate statutory income tax rate from 35% to 21% beginning in 2018. In accordance with the rate reduction, we wrote down our net deferred tax assets by $64.6 million which unfavorably affected our effective tax rate by 74.4%. We expect the tax rate in future years to be between 27% and 29%. |
• | Adjusted EBITDAP (Non-GAAP measure*) for fiscal 2017 was $225.4 million, compared with $201.9 million for fiscal 2016. |
• | Segment performance before environmental remediation provision adjustments, retirement benefits, net, and unusual items (Non-GAAP measure*) was $205.4 million for fiscal 2017, compared with $188.4 million for fiscal 2016. |
• | Cash provided by operating activities in fiscal 2017 totaled $212.8 million, compared with $158.7 million in fiscal 2016. |
• | Free cash flow (Non-GAAP measure*) in fiscal 2017 totaled $183.4 million, compared with $111.1 million in fiscal 2016. |
• | Total contract backlog as of December 31, 2017 was $4.6 billion compared with $4.5 billion as of December 31, 2016. |
• | Total funded backlog as of December 31, 2017 was $2.1 billion compared with $2.3 billion as of December 31, 2016. |
_________
* We provide Non-GAAP measures as a supplement to financial results based on GAAP. A reconciliation of the Non-GAAP measures to the most directly comparable GAAP measures is presented later in the Management’s Discussion and Analysis under the heading “Operating Segment Information” and “Use of Non-GAAP Financial Measures.”
We have a long-term view on value creation and may take initiatives that we believe offer substantial future prospects even if they may dampen near term performance. In addition, our portfolio of contracts includes programs which last for decades and range from lower margin cost-plus development programs to higher margin fixed-price production programs. Further, the mix of those programs can vary substantially. We intend to strengthen our competitive advantage by continuously improving operational excellence through our CIP programs and continue to invest in R&D initiatives. We also intend to grow our business and plan to work with our customers to expand markets for current products, develop upgrades to extend product life, and develop the requirements for future systems. We plan to maintain a diversified and broad business mix, a favorable balance of cost-reimbursable and fixed-price type contracts, a significant follow-on business and an attractive customer profile. Finally, we intend to complement our growth strategy through select acquisitions that broaden our product and service offerings, deepen our capabilities, and provide entry into new markets.
Some of the significant challenges we face are dependence upon U.S. government programs and contracts, future reductions or changes in U.S. government spending in our markets, implementation of the CIP, environmental matters, capital structure, and our underfunded retirement benefit plans.
Major Customers
The principal end user customers of our products and technology are primarily agencies of the U.S. government. Since a majority of our sales are, directly or indirectly, to the U.S. government, funding for the purchase of our products and services generally follows trends in U.S. aerospace and defense spending. However, individual U.S. government agencies, which include the military services, NASA, the Missile Defense Agency, and the prime contractors that serve these agencies, exercise independent purchasing power within “budget top-line” limits. Therefore, sales to the U.S. government are not regarded as sales to one customer, but rather each contracting agency is viewed as a separate customer.
23
Sales to the U.S. government and its agencies, including sales to our significant customers disclosed below, were as follows:
Percentage of Net Sales | ||
Fiscal 2017 | 92 | % |
Fiscal 2016 | 91 | % |
Fiscal 2015 | 90 | % |
One month ended December 31, 2015 | 85 | % |
The following are percentages of net sales by principal end user in fiscal 2017:
NASA | 30 | % |
U.S. Air Force | 23 | |
U.S. Army | 16 | |
Missile Defense Agency | 12 | |
U.S. Navy | 9 | |
Other U.S. government | 2 | |
Total U.S. government customers | 92 | |
Other customers | 8 | |
Total | 100 | % |
The following are percentages of net sales for significant programs, all of which are included in the U.S. government sales and are comprised of multiple contracts.
Year Ended | One month ended | ||||||||||
December 31, | December 31, | November 30, | December 31, | ||||||||
2017 | 2016 | 2015 | 2015 | ||||||||
RS-25 program | 14 | % | 12 | % | 12 | % | 10 | % | |||
Standard Missile program | 9 | 12 | 14 | 12 | |||||||
THAAD program | 9 | 13 | 13 | 13 | |||||||
The demand for certain of our services and products is directly related to the level of funding of U.S. government programs.
Customers that represented more than 10% of net sales for the periods presented were as follows:
Year Ended | One month ended | ||||||||||
December 31, | December 31, | November 30, | December 31, | ||||||||
2017 | 2016 | 2015 | 2015 | ||||||||
Lockheed Martin | 24 | % | 27 | % | 29 | % | 24 | % | |||
ULA | 22 | 21 | 19 | 28 | |||||||
Raytheon | 17 | 20 | 20 | 19 | |||||||
NASA | 17 | 13 | 11 | 10 | |||||||
Our sales to each of the major customers listed above involve several product lines and programs.
Industry Update
Information concerning our industry appears in Part I, Item 1. Business under the caption “Industry Overview.”
Competitive Improvement Program
During fiscal 2015, we initiated Phase I of the CIP comprised of activities and initiatives aimed at reducing costs in order for us to continue to compete successfully. Phase I is composed of three major components: (i) facilities optimization and
24
footprint reduction; (ii) product affordability; and (iii) reduced administrative and overhead costs. On April 6, 2017, the Board of Directors approved Phase II of our previously announced CIP. Pursuant to Phase II, our plans are to expand CIP and further consolidate our Sacramento, California, and Gainesville, Virginia sites, while centralizing and expanding our existing presence in Huntsville, Alabama. When fully implemented, we anticipate that the CIP will result in annual cost reductions of $230 million.
We currently estimate that we will incur restructuring and related costs of the Phase I and II programs of approximately $235.1 million (including approximately $60.5 million of capital expenditures). We incurred $79.5 million of such costs through December 31, 2017, including $32.5 million in capital expenditures.
Environmental Matters
Our current and former business operations are subject to, and affected by, federal, state, local, and foreign environmental laws and regulations relating to the discharge, treatment, storage, disposal, investigation, and remediation of certain materials, substances, and wastes. See Notes 8(c) and 8(d) of the notes to consolidated financial statements and "Environmental Matters" below for summary of our environmental reserve activity.
Capital Structure
We have a substantial amount of debt for which we are required to make interest and principal payments. Interest on long-term financing is not a recoverable cost under our U.S. government contracts. As of December 31, 2017, we had $670.9 million of debt principal outstanding.
Retirement Benefits
We expect to make cash contributions of approximately $42.0 million to our tax-qualified defined benefit pension plan in fiscal 2018 of which $37.5 million is expected to be recoverable from our U.S. government contracts in fiscal 2018 with the remaining $4.5 million being potentially recoverable from our U.S. government contracts in the future. During fiscal 2017, we made cash contributions of $75.8 million to our tax-qualified defined benefit pension plan of which $33.7 million was recoverable from our U.S. government contracts in fiscal 2017 with the remaining $42.1 million expected to be recoverable from our U.S. government contracts in the future. We generally are able to recover cash contributions related to our tax-qualified defined benefit pension plan as allowable costs on our U.S. government contracts, but there can be differences between when we contribute cash to our tax-qualified defined benefit pension plan under pension funding rules and recover it under CAS.
The funded status of our retirement benefit plans may be adversely affected by investment experience, by any changes in U.S. law and by changes in the statutory interest rates used by tax-qualified pension plans in the U.S. to calculate funding requirements. Accordingly, if the performance of our retirement benefit assets does not meet our assumptions, if there are changes to the IRS regulations or other applicable law or if other actuarial assumptions are modified, our future contributions to our underfunded retirement benefit plans could be higher than we expect.
Additionally, the level of returns on retirement benefit assets, changes in interest rates, changes in legislation, and other factors affect our financial results. The timing of recognition of retirement benefit expense or income in our financial statements differs from the timing of the required funding under the PPA or the amount of funding that can be recorded in our overhead rates through our U.S. government contracting business.
Results of Operations:
Net Sales:
Year Ended | Year Ended | ||||||||||||||||||||||
December 31, | December 31, | December 31, | November 30, | ||||||||||||||||||||
2017 | 2016 | Change* | 2016 | 2015 | Change** | ||||||||||||||||||
(In millions) | |||||||||||||||||||||||
Net sales: | $ | 1,877.2 | $ | 1,761.3 | $ | 115.9 | $ | 1,761.3 | $ | 1,708.3 | $ | 53.0 | |||||||||||
* Primary reason for change. The increase in net sales was primarily due to an increase of $158.0 million in space programs primarily driven by the following (i) the RS-25 program development and integration effort in support of the SLS development program; (ii) increased development effort and volume on the Commercial Crew Development program; and (iii) increased deliveries on the Atlas V program. The increase in net sales was partially offset by a decrease of $36.5 million in defense programs primarily driven by the timing of deliveries on the THAAD and Standard Missile programs partially offset by the net sales generated from the Coleman Aerospace acquisition. Further, as a result of the 2016 calendar, Aerojet Rocketdyne had 53 weeks of operations in fiscal 2016 compared with 52 weeks of operations in fiscal 2017. The additional week of operations, which occurred in the fourth quarter of fiscal 2016 and accounted for $32.2 million in additional net sales, is included in the above discussion of program changes.
25
** Primary reason for change. The increase in net sales was primarily due to the following (i) an increase of $95.0 million on space launch programs primarily driven by increased deliveries on the RL10 program and the transition of the Commercial Crew Development program from development activities to initial production and (ii) an increase of $37.2 million on air defense programs primarily driven by the transition of the PAC-3 contracts to full-rate production. These factors were partially offset by (i) the sale of approximately 550 acres of our Sacramento Land for $42.0 million in fiscal 2015 and (ii) a decrease of $36.8 million in the various Standard Missile contracts primarily from the timing of deliveries on the Standard Missile-3 Block IB contract and Standard Missile MK72 booster contract. Further, as a result of the 2016 calendar, Aerojet Rocketdyne had 53 weeks of operations in fiscal 2016 compared with 52 weeks of operations in fiscal 2015. The additional week of operations, which occurred in the fourth quarter of fiscal 2016 and accounted for $32.2 million in additional net sales, is included in the above discussion of program changes.
One month ended December 31, | |||
2015 | |||
(In millions) | |||
Net sales: | $ | 96.3 | |
Net sales for the month ended December 31, 2015 was primarily comprised of the following: (i) sales of $32.4 million in missile defense and strategic systems programs primarily driven by the deliveries on the THAAD and Standard Missile programs; (ii) sales of $26.4 million in our space launch programs primarily associated with the RL10 program as a result of deliveries on this multi-year contract and deliveries on the Atlas V program; and (iii) sales of $26.1 million in space advanced programs primarily driven by work on the Commercial Crew Development program and the RS-25 program which is currently engaged in a significant development and integration effort in support of the SLS program.
Cost of Sales (exclusive of items shown separately below):
Year Ended | Year Ended | ||||||||||||||||||||||
December 31, | December 31, | December 31, | November 30, | ||||||||||||||||||||
2017 | 2016 | Change* | 2016 | 2015 | Change** | ||||||||||||||||||
(In millions, except percentage amounts) | |||||||||||||||||||||||
Components of cost of sales: | |||||||||||||||||||||||
Cost of sales excluding retirement benefits | $ | 1,562.2 | $ | 1,477.4 | $ | 84.8 | $ | 1,477.4 | $ | 1,409.3 | $ | 68.1 | |||||||||||
Retirement benefits | 53.2 | 50.0 | 3.2 | 50.0 | 50.2 | (0.2 | ) | ||||||||||||||||
Cost of sales | $ | 1,615.4 | $ | 1,527.4 | $ | 88.0 | $ | 1,527.4 | $ | 1,459.5 | $ | 67.9 | |||||||||||
Percentage of net sales | 86.1 | % | 86.7 | % | 86.7 | % | 85.4 | % | |||||||||||||||
Percentage of net sales excluding retirement benefits | 83.2 | % | 83.9 | % | 83.9 | % | 82.5 | % | |||||||||||||||
* Primary reason for change. The decrease in cost of sales as a percentage of net sales excluding retirement benefits was primarily due to favorable contract performance on numerous programs as a result of overhead cost reductions and reduced program risks, most notably on the THAAD program, partially offset by cost growth and manufacturing inefficiencies in fiscal 2017 on electric propulsion contracts.
** Primary reason for change. The increase in cost of sales as a percentage of net sales excluding retirement benefits was primarily due to the fiscal 2015 land sale of approximately 550 acres of Sacramento Land resulting in gross profit of $30.6 million.
26
One month ended December 31, | |||
2015 | |||
(In millions, except percentage amounts) | |||
Components of cost of sales: | |||
Cost of sales excluding retirement benefits | $ | 71.3 | |
Retirement benefits | 4.1 | ||
Cost of sales | $ | 75.4 | |
Percentage of net sales | 78.3 | % | |
Percentage of net sales excluding retirement benefits | 73.9 | % | |
Cost of sales as a percentage of net sales excluding retirement benefits for the month ended December 31, 2015 included favorable changes in contract estimates due to better than expected performance primarily on the Standard Missile and THAAD programs as a result of manufacturing efficiencies and risk mitigation. These favorable factors were partially offset by contract losses on an electric propulsion contract.
AR1 Research and Development:
Year Ended | Year Ended | ||||||||||||||||||||||
December 31, | December 31, | December 31, | November 30, | ||||||||||||||||||||
2017 | 2016 | Change | 2016 | 2015 | Change* | ||||||||||||||||||
(In millions, except percentage amounts) | |||||||||||||||||||||||
AR1 R&D: | $ | — | $ | — | $ | — | $ | — | $ | 32.1 | $ | 32.1 | |||||||||||
Percentage of net sales | — | % | — | % | — | % | 1.9 | % | |||||||||||||||
* Primary reason for change. Our company-sponsored R&D expenses (reported as a component of cost of sales) are generally allocated among all contracts and programs in progress under U.S. government contractual arrangements. From time to time, we believe it is in our best interests to self-fund and not allocate costs for certain R&D activities to the U.S. government contracts. In fiscal 2015, we self-funded $32.1 million of engine development expenses associated with our newest liquid booster engine, the AR1, and did not allocate these costs to the U.S. government. The table below summarizes total AR1 R&D costs net of reimbursements:
Year Ended | One month ended | ||||||||||||||
December 31, | December 31, | November 30, | December 31, | ||||||||||||
2017 | 2016 | 2015 | 2015 | ||||||||||||
(In millions) | |||||||||||||||
AR1 R&D costs allocated to U.S. government contracts | $ | 16.8 | $ | 20.5 | $ | 16.1 | $ | 2.7 | |||||||
AR1 R&D costs not allocated to U.S. government contracts | — | — | 32.1 | — | |||||||||||
Total | $ | 16.8 | $ | 20.5 | $ | 48.2 | $ | 2.7 | |||||||
27
Selling, General and Administrative Expense (“SG&A”):
Year Ended | Year Ended | ||||||||||||||||||||||
December 31, | December 31, | December 31, | November 30, | ||||||||||||||||||||
2017 | 2016 | Change* | 2016 | 2015 | Change** | ||||||||||||||||||
(In millions, except percentage amounts) | |||||||||||||||||||||||
Components of SG&A: | |||||||||||||||||||||||
SG&A excluding retirement benefits and stock-based compensation | $ | 25.0 | $ | 21.8 | $ | 3.2 | $ | 21.8 | $ | 23.0 | $ | (1.2 | ) | ||||||||||
Stock-based compensation | 22.0 | 12.9 | 9.1 | 12.9 | 8.6 | 4.3 | |||||||||||||||||
Retirement benefits | 20.0 | 18.9 | 1.1 | 18.9 | 17.4 | 1.5 | |||||||||||||||||
SG&A | $ | 67.0 | $ | 53.6 | $ | 13.4 | $ | 53.6 | $ | 49.0 | $ | 4.6 | |||||||||||
Percentage of net sales | 3.6 | % | 3.0 | % | 3.0 | % | 2.9 | % | |||||||||||||||
Percentage of net sales excluding retirement benefits and stock-based compensation | 1.3 | % | 1.2 | % | 1.2 | % | 1.3 | % | |||||||||||||||
* Primary reason for change. The increase in SG&A expense was primarily driven by an increase of $9.1 million in stock-based compensation primarily as a result of increases in the fair value of stock appreciation rights, the accelerated vesting of stock awards to a former executive officer, and the August 2016 stock award granted to the Executive Chairman that vested according to the attainment of share prices ranging from $22 per share to $27 per share of our common stock.
** Primary reason for change. The increase in SG&A expense was primarily driven by an increase of $4.3 million in stock-based compensation which was primarily a result of an increase in performance based stock compensation.
One month ended December 31, | |||
2015 | |||
(In millions, except percentage amounts) | |||
Components of SG&A: | |||
SG&A excluding retirement benefits and stock-based compensation | $ | 1.7 | |
Stock-based compensation | (0.4 | ) | |
Retirement benefits | 1.5 | ||
SG&A | $ | 2.8 | |
Percentage of net sales | 2.9 | % | |
SG&A expense as a percentage of net sales for the month ended December 31, 2015 was relatively proportional to the first quarter of fiscal 2016.
28
Depreciation and Amortization:
Year Ended | Year Ended | ||||||||||||||||||||||
December 31, | December 31, | December 31, | November 30, | ||||||||||||||||||||
2017 | 2016 | Change* | 2016 | 2015 | Change** | ||||||||||||||||||
(In millions) | |||||||||||||||||||||||
Components of depreciation and amortization: | |||||||||||||||||||||||
Depreciation | $ | 56.7 | $ | 49.6 | $ | 7.1 | $ | 49.6 | $ | 49.8 | $ | (0.2 | ) | ||||||||||
Amortization | 13.7 | 13.3 | 0.4 | 13.3 | 13.4 | (0.1 | ) | ||||||||||||||||
Accretion | 2.2 | 2.0 | 0.2 | 2.0 | 1.9 | 0.1 | |||||||||||||||||
Depreciation and amortization | $ | 72.6 | $ | 64.9 | $ | 7.7 | $ | 64.9 | $ | 65.1 | $ | (0.2 | ) | ||||||||||
* Primary reason for change. The increase in depreciation expense was primarily the result of increased accelerated depreciation associated with changes in the estimated useful lives of long-lived assets and capital projects being placed in service to support the cost saving initiatives of the CIP.
** Primary reason for change. Depreciation and amortization expense was essentially unchanged for the period.
One month ended December 31, | |||
2015 | |||
(In millions) | |||
Components of depreciation and amortization: | |||
Depreciation | $ | 3.8 | |
Amortization | 1.1 | ||
Accretion | 0.2 | ||
Depreciation and amortization | $ | 5.1 | |
Depreciation and amortization expense for the month ended December 31, 2015 was relatively proportional to the first quarter of fiscal 2016.
Other Expense, Net and Loss On Debt:
Year Ended | Year Ended | ||||||||||||||||||||||
December 31, | December 31, | December 31, | November 30, | ||||||||||||||||||||
2017 | 2016 | Change* | 2016 | 2015 | Change** | ||||||||||||||||||
(In millions) | |||||||||||||||||||||||
Other expense, net and loss on debt: | $ | 7.9 | $ | 54.3 | $ | (46.4 | ) | $ | 54.3 | $ | 68.4 | $ | (14.1 | ) | |||||||||
* Primary reason for change. The decrease was primarily due to a decrease of $35.5 million in unusual items (discussed below) and a decrease of $10.1 million in environmental remediation expenses (see discussion of "Environmental Matters" below).
** Primary reason for change. The decrease in other expense, net was primarily due to a decrease of $17.4 million in unusual items charges (see discussion of unusual items below).
One month ended December 31, | |||
2015 | |||
(In millions) | |||
Other expense, net: | $ | 0.2 | |
The $0.2 million of other expense, net for the month ended December 31, 2015 was insignificant.
29
Total unusual items, comprised of a component of other expense, net and loss on debt in the consolidated statements of operations, was as follows:
Year Ended | One month ended | ||||||||||||||
December 31, | December 31, | November 30, | December 31, | ||||||||||||
2017 | 2016 | 2015 | 2015 | ||||||||||||
(In millions) | |||||||||||||||
Aerospace and Defense: | |||||||||||||||
(Gain) loss on legal matters and settlements (1) | $ | (2.0 | ) | $ | — | $ | 50.0 | $ | 0.4 | ||||||
Aerospace and defense unusual items | (2.0 | ) | — | 50.0 | 0.4 | ||||||||||
Corporate: | |||||||||||||||
Loss on debt repurchased (2) | — | 34.4 | 1.9 | — | |||||||||||
Acquisition costs (1) | 1.0 | — | — | ||||||||||||
Loss on bank amendment (1) | — | 0.1 | — | — | |||||||||||
Corporate unusual items | 1.0 | 34.5 | 1.9 | — | |||||||||||
Total unusual items | $ | (1.0 | ) | $ | 34.5 | $ | 51.9 | $ | 0.4 | ||||||
________
(1) Operating (income) expense
(2) Non-operating expense
Fiscal 2017 Activity:
We recorded $2.0 million of realized gains, net of interest associated with the failure to register with the SEC the issuance of certain of our common shares under the defined contribution 401(k) employee benefit plan. On May 30, 2017, we made a registered rescission offer to buy back unregistered shares from eligible Plan participants at the original purchase price plus interest, or to reimburse eligible Plan participants for losses they may have incurred if their shares had been sold. The actual cost of the registered rescission offer was less than the previously estimated costs. The registered rescission offer expired on June 30, 2017 and settlement payments of $3.5 million under the offer have been completed in the third quarter of fiscal 2017.
We recorded $1.0 million of costs related to the acquisition of Coleman Aerospace from L3 Technologies, Inc.
Fiscal 2016 Activity:
On July 18, 2016, we redeemed $460.0 million principal amount of our 7.125% Second-Priority Senior Secured Notes (“7 1/8% Notes”), representing all of the outstanding 7 1/8% Notes, at a redemption price equal to 105.344% of the principal amount, plus accrued and unpaid interest. We incurred a pre-tax charge of $34.1 million in fiscal 2016 associated with the extinguishment of the 7 1/8% Notes. The $34.1 million pre-tax charge was the result of the $24.6 million paid in excess of the par value and $9.5 million associated with the write-off of unamortized deferred financing costs.
We retired $13.0 million principal amount of our delayed draw term loan resulting in a loss of $0.3 million.
We recorded a charge of $0.1 million associated with an amendment to the Senior Credit Facility.
Fiscal 2015 Activity:
We recorded an expense of $50.0 million associated with a legal settlement. Aerojet Rocketdyne entered into a Settlement and Mutual Release Agreement (the “Agreement”) with Orbital Sciences Corporation (“Orbital”) pursuant to which the parties mutually agreed to a termination for convenience of the contract relating to the provision by Aerojet Rocketdyne of 20 AJ-26 liquid propulsion rocket engines to Orbital for the Antares program (the “Contract”). The Agreement also settles all claims the parties may have had against one another arising out of the Contract and the launch failure that occurred on October 28, 2014 of an Antares launch vehicle carrying the Cygnus ORB-3 service and cargo module.
We retired $76.0 million principal amount of our delayed draw term loan resulting in $1.9 million of losses associated with the write-off of deferred financing fees.
December 2015 Activity:
We recorded $0.4 million for realized losses and interest associated with the failure to register with the SEC the issuance of certain of our common shares under the defined contribution 401(k) employee benefit plan.
30
Interest Income:
Year Ended | Year Ended | ||||||||||||||||||||||
December 31, | December 31, | December 31, | November 30, | ||||||||||||||||||||
2017 | 2016 | Change* | 2016 | 2015 | Change** | ||||||||||||||||||
(In millions) | |||||||||||||||||||||||
Interest income: | $ | 3.5 | $ | 0.6 | $ | 2.9 | $ | 0.6 | $ | 0.3 | $ | 0.3 | |||||||||||
* Primary reason for change. The increase in interest income was primarily due to higher average cash balances and interest rates.
** Primary reason for change. Interest income was immaterial for the period presented.
Interest Expense:
Year Ended | Year Ended | ||||||||||||||||||||||
December 31, | December 31, | December 31, | November 30, | ||||||||||||||||||||
2017 | 2016 | Change* | 2016 | 2015 | Change** | ||||||||||||||||||
(In millions) | |||||||||||||||||||||||
Components of interest expense: | |||||||||||||||||||||||
Contractual interest and other | $ | 22.4 | $ | 30.2 | $ | (7.8 | ) | $ | 30.2 | $ | 47.7 | $ | (17.5 | ) | |||||||||
Amortization of debt discount and deferred financing costs | 8.5 | 2.3 | 6.2 | 2.3 | 2.7 | (0.4 | ) | ||||||||||||||||
Interest expense | $ | 30.9 | $ | 32.5 | $ | (1.6 | ) | $ | 32.5 | $ | 50.4 | $ | (17.9 | ) | |||||||||
* Primary reason for change. The decrease in interest expense was primarily due to the retirement of the principal amount of our delayed draw term loan in the first quarter of fiscal 2016, the redemption of the 7 1/8% Senior Secured Notes in the third quarter of fiscal 2016, and the conversion of 4 1/16% Convertible Subordinated Debentures (“4 1/16% Debentures”) to common shares. The decrease was partially offset by interest expense on the debt incurred on the Senior Credit Facility at a variable interest rate of 3.82% as of December 31, 2017 and the issuance of the 2 1/4% Notes in December 2016 at an effective interest rate of 5.8%.
** Primary reason for change. The decrease in interest expense was primarily due to the retirement of the principal amount of our delayed draw term loan in the first quarter of fiscal 2016 and the redemption of the 7 1/8% Notes in the third quarter of fiscal 2016. The decrease was partially offset by interest expense on the debt incurred on the Senior Credit Facility at a lower variable interest rate (3.02% as of December 31, 2016).
One month ended December 31, | |||
2015 | |||
(In millions) | |||
Components of interest expense: | |||
Contractual interest and other | $ | 3.6 | |
Amortization of deferred financing costs | 0.2 | ||
Interest expense | $ | 3.8 | |
Interest expense for the month ended December 31, 2015 was proportional to our interest expense for the first quarter of fiscal 2016.
Income Tax Provision:
Year Ended | One month ended | ||||||||||||||
December 31, | December 31, | November 30, | December 31, | ||||||||||||
2017 | 2016 | 2015 | 2015 | ||||||||||||
(In millions) | |||||||||||||||
Income tax provision | $ | 96.1 | $ | 11.2 | $ | 0.3 | $ | 2.0 | |||||||
In fiscal 2017, our effective tax rate was an income tax expense of 110.6% on pre-tax income of $86.9 million. Our effective tax rate differed from the 35.0% statutory federal income tax rate primarily due to the change in the federal statutory tax rate from 35% to 21% under the Tax Act of 2017. The one time reduction to deferred tax assets due to the Tax Act was
31
$64.6 million or a 74.4% increase to the effective tax rate. Before applying the effects of the Tax Act, the effective tax rate was 36.2%. This rate differs from the 35% federal income tax rate due to an increase from state income taxes partially offset by R&D credits and favorable adjustments to uncertain tax positions. We expect the tax rate in future years to be between 27% and 29%.
In fiscal 2016, the income tax provision recorded differs from the expected tax that would be calculated by applying the federal statutory rate to our income before income taxes primarily due to the impacts from state income taxes, and certain expenditures which are permanently not deductible for tax purposes, partially offset by the impact of R&D credits.
In fiscal 2015, the income tax provision recorded differs from the expected tax that would be calculated by applying the federal statutory rate to our loss before income taxes primarily due to state income taxes and certain non-deductible interest expense, partially offset by the retroactive reinstatement of the federal R&D credit and benefits allowed by Section 199 of the IRS code allowed to manufacturers.
In the month ended December 31, 2015, the income tax provision recorded differs from the expected tax that would be calculated by applying the federal statutory rate to our income before income taxes primarily due to the re-enactment of the federal R&D credit in December 2015 for calendar year 2015 which has been treated as a discrete event for the December 2015 one-month period, as well as impacts from state income taxes, benefits allowed by Section 199 of the IRS code allowed to manufacturers, and R&D credits.
The carrying value of our deferred tax assets is dependent on our ability to generate sufficient taxable income in the future. Our valuation allowance of $1.7 million remained unchanged from prior year.
As of December 31, 2017, the liability for uncertain income tax positions was $2.8 million. Due to the uncertainty regarding the timing of potential future cash flows associated with these liabilities, we are unable to make a reasonably reliable estimate of the amount and period in which these liabilities might be paid.
Retirement Benefit Plans:
Components of retirement benefits are:
Year Ended | One month ended | ||||||||||||||
December 31, | December 31, | November 30, | December 31, | ||||||||||||
2017 | 2016 | 2015 | 2015 | ||||||||||||
(In millions) | |||||||||||||||
Service cost | $ | 15.0 | $ | 14.0 | $ | 10.8 | $ | 1.1 | |||||||
Interest cost on benefit obligation | 59.1 | 66.0 | 65.5 | 5.5 | |||||||||||
Assumed return on assets | (64.5 | ) | (70.1 | ) | (88.1 | ) | (6.0 | ) | |||||||
Amortization of prior service credits | (0.1 | ) | (1.1 | ) | (1.1 | ) | (0.1 | ) | |||||||
Amortization of net losses | 63.7 | 60.1 | 80.5 | 5.1 | |||||||||||
$ | 73.2 | $ | 68.9 | $ | 67.6 | $ | 5.6 | ||||||||
We estimate that our retirement benefits expense will be approximately $60 million in fiscal 2018.
See “Critical Accounting Policies - Retirement Benefit Plans” for more information about our accounting practices with respect to retirement benefits.
Operating Segment Information:
We evaluate our operating segments based on several factors, of which the primary financial measure is segment performance. Segment performance represents net sales less applicable costs, expenses and provisions for unusual items relating to the segment. Excluded from segment performance are: corporate income and expenses, interest expense, interest income, income taxes, legacy income or expenses, and unusual items not related to the segment. We believe that segment performance provides information useful to investors in understanding our underlying operational performance. In addition, we provide the Non-GAAP financial measure of our operational performance called segment performance before environmental remediation provision adjustments, retirement benefits, and segment unusual items. We believe the exclusion of the items listed above permits an evaluation and a comparison of results for ongoing business operations, and it is on this basis that management internally assesses operational performance.
32
Aerospace and Defense Segment
Year Ended | Year Ended | ||||||||||||||||||||||
December 31, | December 31, | December 31, | November 30, | ||||||||||||||||||||
2017 | 2016 | Change* | 2016 | 2015 | Change** | ||||||||||||||||||
(In millions, except percentage amounts) | |||||||||||||||||||||||
Net sales | $ | 1,870.8 | $ | 1,753.9 | $ | 116.9 | $ | 1,753.9 | $ | 1,660.0 | $ | 93.9 | |||||||||||
Segment performance | 177.9 | 143.3 | 34.6 | 143.3 | 48.9 | 94.4 | |||||||||||||||||
Segment margin | 9.5 | % | 8.2 | % | 8.2 | % | 2.9 | % | |||||||||||||||
Segment margin before environmental remediation provision adjustments, retirement benefits, net, and unusual items (Non-GAAP measure) | 10.8 | % | 10.5 | % | 10.5 | % | 10.0 | % | |||||||||||||||
Components of segment performance: | |||||||||||||||||||||||
Aerospace and Defense before environmental remediation provision adjustments, retirement benefits, net, and unusual items (Non-GAAP measure) | $ | 202.9 | $ | 184.1 | $ | 18.8 | $ | 184.1 | $ | 165.7 | $ | 18.4 | |||||||||||
Environmental remediation provision adjustments | (7.5 | ) | (18.3 | ) | 10.8 | (18.3 | ) | (16.6 | ) | (1.7 | ) | ||||||||||||
Retirement benefits, net (1) | (19.5 | ) | (22.5 | ) | 3.0 | (22.5 | ) | (50.2 | ) | 27.7 | |||||||||||||
Unusual items | 2.0 | — | 2.0 | — | (50.0 | ) | 50.0 | ||||||||||||||||
Aerospace and Defense total | $ | 177.9 | $ | 143.3 | $ | 34.6 | $ | 143.3 | $ | 48.9 | $ | 94.4 | |||||||||||
________
(1) Retirement benefits are net of cash funding to our tax-qualified defined benefit pension plan which are recoverable costs under our U.S. government contracts. Our recoverable tax-qualified pension costs in fiscal 2017 and 2016 totaled $33.7 million and $27.5 million, respectively.
* Primary reason for change. The increase in net sales was primarily due to an increase of $158.0 million in space programs primarily driven by the following (i) the RS-25 program development and integration effort in support of the SLS development program; (ii) increased development effort and volume on the Commercial Crew Development program; and (iii) increased deliveries on the Atlas V program. The increase in net sales was partially offset by a decrease of $36.5 million in defense programs primarily driven by the timing of deliveries on the THAAD and Standard Missile programs partially offset by the net sales generated from the Coleman Aerospace acquisition. Further, as a result of the 2016 calendar, Aerojet Rocketdyne had 53 weeks of operations in fiscal 2016 compared with 52 weeks of operations in fiscal 2017. The additional week of operations, which occurred in the fourth quarter of fiscal 2016 and accounted for $32.2 million in additional net sales, is included in the above discussion of program changes.
Segment margin before environmental remediation provision adjustments, retirement benefits, net, and unusual items in fiscal 2017 compared with fiscal 2016 was up 30 basis points. Items that had a significant impact were favorable contract performance on numerous programs as a result of overhead cost reductions and reduced program risks, most notably on the THAAD program, partially offset by cost growth and manufacturing inefficiencies in fiscal 2017 on electric propulsion contracts.
** Primary reason for change. The increase in net sales was primarily due to the following (i) an increase of $95.0 million on space launch programs primarily driven by increased deliveries on the RL10 program, and the transition of the Commercial Crew Development program from development activities to initial production and (ii) an increase of $37.2 million on air defense programs primarily driven by the transition of the PAC-3 contracts to full-rate production. These factors were partially offset by a decrease of $36.8 million in the various Standard Missile contracts primarily from the timing of deliveries on the Standard Missile-3 Block IB contract and Standard Missile MK72 booster contract. Further, as a result of the 2016 calendar, Aerojet Rocketdyne had 53 weeks of operations in fiscal 2016 compared with 52 weeks of operations in fiscal 2015. The additional week of operations, which occurred in the fourth quarter of fiscal 2016 and accounted for $32.2 million in additional net sales, is included in the above discussion of program changes.
Segment margin before environmental remediation provision adjustments, retirement benefits, net, and unusual items in fiscal 2016 compared with fiscal 2015 was up 50 basis points. Items that had a significant impact include the following: (i) favorable contract performance on the THAAD program as a result of operating performance and lower overhead costs; (ii) a gross contract benefit of $8.1 million in fiscal 2015 associated with the Antares AJ-26 Settlement Agreement; and (iii) cost growth and manufacturing inefficiencies in the current period on electric propulsion contracts.
33
One month ended December 31, | |||
2015 | |||
(In millions, except percentage amounts) | |||
Net sales | $ | 95.8 | |
Segment performance | 15.2 | ||
Segment margin | 15.9 | % | |
Segment margin before environmental remediation provision adjustments, retirement benefits, net, and unusual items (Non-GAAP measure) | 20.5 | % | |
Components of segment performance: | |||
Aerospace and Defense before environmental remediation provision adjustments, retirement benefits, net, and unusual items (Non-GAAP measure) | $ | 19.6 | |
Environmental remediation provision adjustments | 0.1 | ||
Retirement benefits, net | (4.1 | ) | |
Unusual items | (0.4 | ) | |
Aerospace and Defense total | $ | 15.2 | |
Net sales for the month ended December 31, 2015 was primarily comprised of the following: (i) sales of $32.4 million in missile defense and strategic systems programs primarily driven by the deliveries on the THAAD and Standard Missile programs; (ii) sales of $26.4 million in our space launch programs primarily associated with the RL10 program as a result of deliveries on this multi-year contract and deliveries on the Atlas V program; and (iii) sales of $26.1 million in space advanced programs primarily driven by development work on the Commercial Crew Development program and the RS-25 program which is currently engaged in a significant development and integration effort in support of the SLS program.
The segment margin before environmental remediation provision adjustments, retirement benefits, net and unusual items included (i) favorable changes in contract estimates due to better than expected performance on the Standard Missile and THAAD programs as a result of manufacturing efficiencies and risk mitigation and (ii) costs recoveries on retirement benefit plan contributions. These favorable factors were partially offset by contract losses on an electric propulsion contract.
The following table summarizes our backlog:
As of December 31, | |||||||
2017 | 2016 | ||||||
(In billions) | |||||||
Funded backlog | $ | 2.1 | $ | 2.3 | |||
Unfunded backlog | 2.5 | 2.2 | |||||
Total contract backlog | $ | 4.6 | $ | 4.5 | |||
Total contract backlog expected to be filled within one year | $ | 1.7 | $ | 1.7 | |||
Total backlog includes both funded backlog (unfilled orders for which funding is authorized, appropriated and contractually obligated by the customer) and unfunded backlog (firm orders for which funding has not been appropriated). Indefinite delivery and quantity contracts and unexercised options are not reported in total backlog. Backlog is subject to funding delays or program restructurings/cancellations which are beyond our control.
Real Estate Segment
Year Ended | Year Ended | ||||||||||||||||||||||
December 31, | December 31, | December 31, | November 30, | ||||||||||||||||||||
2017 | 2016 | Change* | 2016 | 2015 | Change* | ||||||||||||||||||
(In millions) | |||||||||||||||||||||||
Net sales | $ | 6.4 | $ | 7.4 | $ | (1.0 | ) | $ | 7.4 | $ | 48.3 | $ | (40.9 | ) | |||||||||
Segment performance | 2.5 | 4.3 | (1.8 | ) | 4.3 | 34.4 | (30.1 | ) | |||||||||||||||
* Primary reason for change. During fiscal 2017 and 2016, net sales and segment performance consisted primarily of rental property operations. During fiscal 2015, we recognized net sales of $42.0 million associated with a land sale of approximately 550 acres which resulted in a pre-tax gain of $30.6 million.
34
One month ended December 31, | |||
2015 | |||
(In millions) | |||
Net sales | $ | 0.5 | |
Segment performance | 0.2 | ||
Net sales and segment performance consisted primarily of rental property operations.
Use of Non-GAAP Financial Measures:
In addition to segment performance (discussed above), we provide the Non-GAAP financial measure of our operational performance called Adjusted EBITDAP. We use this metric to measure our operating performance. We believe that to effectively compare core operating performance from period to period, the metric should exclude items relating to retirement benefits (pension and postretirement benefits), significant non-cash expenses, the impacts of financing decisions on earnings, and items incurred outside the ordinary, on-going and customary course of our operations. Accordingly, we define Adjusted EBITDAP as GAAP net (loss) income adjusted to exclude income taxes, interest expense, interest income, depreciation and amortization, retirement benefits net of cash funding to our tax-qualified defined benefit pension plan that are recoverable under our U.S. government contracts, and unusual items which we do not believe are reflective of such ordinary, on-going and customary activities. Adjusted EBITDAP does not represent, and should not be considered an alternative to, net (loss) income, as determined in accordance with GAAP.
Year Ended | One month ended | ||||||||||||||
December 31, | December 31, | November 30, | December 31, | ||||||||||||
2017 | 2016 | 2015 | 2015 | ||||||||||||
(In millions) | |||||||||||||||
Net (loss) income | $ | (9.2 | ) | $ | 18.0 | $ | (16.2 | ) | $ | 7.0 | |||||
Income tax provision | 96.1 | 11.2 | 0.3 | 2.0 | |||||||||||
Interest expense | 30.9 | 32.5 | 50.4 | 3.8 | |||||||||||
Interest income | (3.5 | ) | (0.6 | ) | (0.3 | ) | — | ||||||||
Depreciation and amortization | 72.6 | 64.9 | 65.1 | 5.1 | |||||||||||
Retirement benefits, net (1) | 39.5 | 41.4 | 67.6 | 5.6 | |||||||||||
Unusual items | (1.0 | ) | 34.5 | 51.9 | 0.4 | ||||||||||
Adjusted EBITDAP | $ | 225.4 | $ | 201.9 | $ | 218.8 | $ | 23.9 | |||||||
Adjusted EBITDAP as a percentage of net sales | 12.0 | % | 11.5 | % | 12.8 | % | 24.8 | % | |||||||
Net (loss) income as a percentage of net sales | (0.5 | )% | 1.0 | % | (0.9 | )% | 7.3 | % | |||||||
________
(1) Retirement benefits are net of cash funding to our tax-qualified defined benefit pension plan which are recoverable costs under our U.S. government contracts. Our recoverable tax-qualified pension costs in fiscal 2017 and 2016 totaled $33.7 million and $27.5 million, respectively.
In addition to segment performance and Adjusted EBITDAP, we provide the Non-GAAP financial measure of free cash flow. We use this financial measure, both in presenting our results to stakeholders and the investment community, and in our internal evaluation and management of the business. Management believes that this financial measure is useful because it provides supplemental information to assist investors in viewing the business using the same tools that management uses to evaluate progress in achieving our goals (including under our annual cash and long-term compensation incentive plans).
Year Ended | One month ended | ||||||||||||||
December 31, | December 31, | November 30, | December 31, | ||||||||||||
2017 | 2016 | 2015 | 2015 | ||||||||||||
(In millions) | |||||||||||||||
Net cash provided by operating activities | $ | 212.8 | $ | 158.7 | $ | 67.6 | $ | 0.1 | |||||||
Capital expenditures | (29.4 | ) | (47.6 | ) | (36.8 | ) | (1.2 | ) | |||||||
Free cash flow(1) | $ | 183.4 | $ | 111.1 | $ | 30.8 | $ | (1.1 | ) | ||||||
_________
35
(1) Free Cash Flow, a Non-GAAP financial measure, is defined as cash flow from operating activities less capital expenditures. Free Cash Flow should not be considered in isolation, as a measure of residual cash flow available for discretionary purposes, or as an alternative to cash flows from operations presented in accordance with GAAP.
Because our method for calculating these Non-GAAP measures may differ from other companies’ methods, the Non-GAAP measures presented above may not be comparable to similarly titled measures reported by other companies. These measures are not recognized in accordance with GAAP, and we do not intend for this information to be considered in isolation or as a substitute for GAAP measures.
Environmental Matters:
Our policy is to conduct our businesses with due regard for the preservation and protection of the environment. We devote a significant amount of resources and management attention to environmental matters and actively manage our ongoing processes to comply with environmental laws and regulations. We are involved in the remediation of environmental conditions that resulted from generally accepted manufacturing and disposal practices at certain plants in the 1950s and 1960s. In addition, we have been designated a PRP with other companies at third party sites undergoing investigation and remediation.
Estimating environmental remediation costs is difficult due to the significant uncertainties inherent in these activities, including the extent of remediation required, changing governmental regulations and legal standards regarding liability, evolving technologies and the long period of time over which most remediation efforts take place. We:
• | accrue for costs associated with the remediation of environmental pollution when it becomes probable that a liability has been incurred and when our proportionate share of the costs can be reasonably estimated; and |
• | record related estimated recoveries when such recoveries are deemed probable. |
In addition to the costs associated with environmental remediation discussed above, we incur expenditures for recurring costs associated with managing hazardous substances or pollutants in ongoing operations which were immaterial for fiscal 2017, 2016, 2015, and the one month ended December 31, 2015.
The following table summarizes our recoverable amounts, environmental reserves, and range of liability, as of December 31, 2017:
Recoverable Amount (1) | Reserve | Estimated Range of Liability | |||||||
(In millions) | |||||||||
Aerojet Rocketdyne - Sacramento | $ | 156.6 | $ | 206.5 | $206.5 - $325.2 | ||||
Aerojet Rocketdyne - Baldwin Park Operable Unit ("BPOU") | 88.2 | 116.4 | 116.4 - 152.5 | ||||||
Other Aerojet Rocketdyne sites | 11.2 | 13.7 | 13.7 - 19.2 | ||||||
Other sites | 0.7 | 4.8 | 4.8 - 6.5 | ||||||
Total | $ | 256.7 | $ | 341.4 | $341.4 - $503.4 | ||||
_____
(1) | Excludes the receivable from Northrop of $64.5 million as of December 31, 2017 related to environmental costs already paid (and therefore not reserved) by us in prior years and reimbursable under our agreement with Northrop. The cumulative limitation under our agreement with Northrop was reached in the second quarter of fiscal 2017. See Notes 8(c) and 8(d) of the Notes to Consolidated Financial Statements for additional information. |
Environmental Reserves
On a quarterly basis, we review estimated future remediation costs and have an established practice of estimating environmental remediation costs over a fifteen year period, except for those environmental remediation costs with a specific contractual term. Environmental liabilities at the BPOU site are currently estimated through the term of the new project agreement which expires in May 2027. As the period for which estimated environmental remediation costs lengthens, the reliability of such estimates decreases. These estimates consider the investigative work and analysis of engineers, outside environmental consultants, and the advice of legal staff regarding the status and anticipated results of various administrative and legal proceedings. In most cases, only a range of reasonably possible costs can be estimated. In establishing our reserves, the most probable estimate is used when determinable; otherwise, the minimum amount is used when no single amount in the range is more probable. Accordingly, such estimates can change as we periodically evaluate and revise these estimates as new information becomes available. We cannot predict whether new information gained as projects progress will affect the estimated liability accrued. The timing of payment for estimated future environmental costs is influenced by a number of factors such as the regulatory approval process, and the time required designing, constructing, and implementing the remedy.
A summary of our environmental reserve activity:
36
Year ended | One month ended | ||||||||||||||
December 31, 2017 | December 31, 2016 | November 30, 2015 | December 31, 2015 | ||||||||||||
(In millions) | |||||||||||||||
Opening balance | $ | 349.7 | $ | 302.3 | $ | 166.0 | $ | 306.1 | |||||||
Additions | 31.3 | 87.4 | 176.6 | 0.5 | |||||||||||
Expenditures | (39.6 | ) | (40.0 | ) | (36.5 | ) | (4.3 | ) | |||||||
Ending balance | $ | 341.4 | $ | 349.7 | $ | 306.1 | $ | 302.3 | |||||||
The $31.3 million of environmental reserve additions in fiscal 2017 was primarily due to the following items: (i) $13.4 million of additional operations and maintenance for treatment facilities; (ii) $6.7 million of additional estimated costs related to the Camden, Arkansas site; (iii) $2.3 million associated with water replacement; and (iv) $8.9 million related to other environmental clean-up matters.
The $87.4 million of environmental reserve additions in fiscal 2016 was primarily due to the following items: (i) in fiscal 2016 we reached a decision with the U.S. government on the treatment of certain utility costs related to the Sacramento site resulting in a reserve increase of $59.4 million for the estimated impact over the current period and a fifteen year reserve period; (ii) $10.4 million of additional operations and maintenance for treatment facilities; (iii) $5.9 million of remediation related to inactive test sites and landfill clean-up; and (iv) $2.7 million of remediation related to operable treatment units; and (v) $9.0 million related to other environmental clean-up matters.
The $0.5 million of environmental reserve additions in the one month ended December 31, 2015 were insignificant.
The $176.6 million of environmental reserve additions in fiscal 2015 was primarily due to the following items: (i) $126.3 million associated with our detailed review estimate related to the BPOU site to reflect the anticipated costs through the term of a new project agreement, and the amount reserved is based on the proposal by Aerojet Rocketdyne; (ii) $13.8 million associated with water replacement; (iii) $13.5 million of remediation related to operable treatment units; (iv) $5.2 million of additional operations and maintenance for treatment facilities; and (v) $17.8 million related to other environmental clean-up matters.
The effect of the final resolution of environmental matters and our obligations for environmental remediation and compliance cannot be accurately predicted due to the uncertainty concerning both the amount and timing of future expenditures and due to regulatory or technological changes. We continue our efforts to mitigate past and future costs through pursuit of claims for recoveries from insurance coverage and other PRPs and continued investigation of new and more cost effective remediation alternatives and associated technologies.
Estimated Recoveries
Environmental remediation costs are primarily incurred by our Aerospace and Defense segment, and certain of these costs are recoverable from our contracts with the U.S. government. We currently estimate approximately 24% of our future Aerospace and Defense segment environmental remediation costs will not likely be reimbursable and are expensed.
Allowable environmental remediation costs are charged to our contracts as the costs are incurred. Because these costs are recovered through forward-pricing arrangements, the ability of Aerojet Rocketdyne to continue recovering these costs from the U.S. government depends on Aerojet Rocketdyne’s sustained business volume from U.S. government contracts and programs.
While we are currently seeking an arrangement with the U.S. government to recover environmental expenditures in excess of the reimbursement ceiling identified in the Northrop Agreement and Global Settlement, there can be no assurances that such a recovery will be obtained, or if not obtained, that such unreimbursed environmental expenditures will not have a materially adverse effect on our operating results, financial condition, and/or cash flows.
37
The following table summarizes the activity in the current and non-current recoverable amounts from the U.S. government and Northrop:
Year ended | One month ended | ||||||||||||||
December 31, 2017 | December 31, 2016 | November 30, 2015 | December 31, 2015 | ||||||||||||
(In millions) | |||||||||||||||
Opening balance | $ | 333.0 | $ | 300.4 | $ | 181.4 | $ | 303.1 | |||||||
Additions | 21.4 | 67.3 | 133.6 | 0.4 | |||||||||||
Reimbursements | (31.5 | ) | (35.1 | ) | (31.2 | ) | (3.8 | ) | |||||||
Other adjustments | 1.8 | 1.6 | 25.4 | 0.2 | |||||||||||
Change in Northrop receivable | (3.5 | ) | (1.2 | ) | (6.1 | ) | 0.5 | ||||||||
Ending balance | $ | 321.2 | $ | 333.0 | $ | 303.1 | $ | 300.4 | |||||||
The activity for recoveries is commensurate with the activity associated with the environmental reserve activity.
Environmental reserves and recoveries impact to the consolidated statements of operations
The expenses associated with adjustments to the environmental reserves are recorded as a component of other expense, net in the consolidated statements of operations. Summarized financial information for the impact of environmental reserves and recoveries to the consolidated statements of operations were as follows:
Year Ended | One month ended | ||||||||||||||
December 31, | December 31, | November 30, | December 31, | ||||||||||||
2017 | 2016 | 2015 | 2015 | ||||||||||||
(In millions) | |||||||||||||||
Estimated recoverable amounts from U.S. government contracts and other third parties | $ | 23.1 | $ | 69.1 | $ | 159.3 | $ | 0.6 | |||||||
Expense (benefit) to consolidated statement of operations | 8.2 | 18.3 | 17.3 | (0.1 | ) | ||||||||||
Total environmental reserve adjustments | $ | 31.3 | $ | 87.4 | $ | 176.6 | $ | 0.5 | |||||||
Recently Adopted Accounting Pronouncements:
See Note 1(w) to our consolidated financial statements in Item 8. Consolidated Financial Statements of this Report for information relating to our discussion of the effects of recent accounting pronouncements.
Liquidity and Capital Resources:
Net Cash Provided By (Used In) Operating, Investing, and Financing Activities
The change in cash and cash equivalents was as follows:
Year Ended | One month ended | ||||||||||||||
December 31, | December 31, | November 30, | December 31, | ||||||||||||
2017 | 2016 | 2015 | 2015 | ||||||||||||
(In millions) | |||||||||||||||
Net Cash Provided by Operating Activities | $ | 212.8 | $ | 158.7 | $ | 67.6 | $ | 0.1 | |||||||
Net Cash Used in Investing Activities | (66.4 | ) | (47.1 | ) | (35.8 | ) | (1.2 | ) | |||||||
Net Cash (Used in) Provided by Financing Activities | (21.7 | ) | 90.2 | (86.6 | ) | (1.5 | ) | ||||||||
Net Increase (Decrease) in Cash and Cash Equivalents | $ | 124.7 | $ | 201.8 | $ | (54.8 | ) | $ | (2.6 | ) | |||||
Net Cash Provided by Operating Activities
The $212.8 million of cash provided by operating activities in fiscal 2017 was primarily the result of cash provided by income before income taxes adjusted for non-cash items which generated $263.9 million and income tax refunds of $19.9 million which was partially offset by cash of $75.8 million to fund our tax-qualified defined benefit pension plan.
38
The $158.7 million of cash provided by operating activities in fiscal 2016 was primarily the result of cash provided by income before income taxes adjusted for non-cash items which generated $213.2 million, primarily offset by cash used to fund working capital (defined as accounts receivables, inventories, other current assets, accounts payable, contract advances, real estate activities, and other current liabilities) and cash contributions of $32.8 million to our tax-qualified defined benefit pension plan. The cash used to fund working capital was primarily due to (i) a decrease of $37.4 million in other current liabilities primarily due to the timing of payments associated with income taxes and interest expense and (ii) an increase of $28.9 million in inventories primarily due to the timing of milestone billings and deliveries on the Atlas V and Standard Missile programs. The funding of working capital was partially offset by a decrease of $33.1 million in accounts receivable primarily due to the timing of cash receipts.
The $67.6 million of cash provided by operating activities in fiscal 2015 was primarily the result of cash provided by net loss before income taxes adjusted for non-cash items which generated $129.7 million, offset by cash used to fund the following: (i) a decrease of $18.8 million in other current liabilities primarily related to the CIP, cost reduction initiatives, and the amounts paid to UTC related to Transition Service Agreements; (ii) an increase of $19.5 million in inventories primarily due to the timing of milestone billings and deliveries on the PAC-3 and Standard Missile programs; and (iii) $7.8 million of real estate activities.
The $0.1 million of cash provided by operating activities in December 2015 was primarily due to the cash used to fund working capital offset by net income before income taxes adjusted for non-cash items.
Net Cash Used in Investing Activities
During fiscal 2017, 2016, and 2015 and the one month ended December 31, 2015, we had capital expenditures of $29.4 million, $47.6 million, $36.8 million, and $1.2 million, respectively. The increase in capital expenditures in fiscal 2016 compared with fiscal 2015 is primarily related to construction projects associated with supporting our CIP.
During fiscal 2017, we purchased Coleman Aerospace for $17.0 million and we made a net cash investment of $20.0 million in marketable securities.
Net Cash (Used in) Provided by Financing Activities
During fiscal 2017, we had debt cash payments of $20.0 million (see below). During fiscal 2016, we had $700.6 million in debt cash payments and borrowings of $800.0 million. During fiscal 2015, we had debt cash payments of $81.2 million. During the one month ended December 31, 2015, we had immaterial financing activities.
Debt Activity and Covenants
Our debt principal activity since December 31, 2016 was as follows:
December 31, 2016 | Cash Payments | Non-cash Activity | December 31, 2017 | ||||||||||||
(In millions) | |||||||||||||||
Term loan | $ | 390.0 | $ | (20.0 | ) | $ | — | $ | 370.0 | ||||||
2 1/4% Notes | 300.0 | — | — | 300.0 | |||||||||||
4 1/16% Debentures | 35.6 | — | (35.6 | ) | — | ||||||||||
Capital lease obligations | — | — | 0.9 | 0.9 | |||||||||||
Total Debt Activity | $ | 725.6 | $ | (20.0 | ) | $ | (34.7 | ) | $ | 670.9 | |||||
Our Senior Credit Facility contains covenants requiring us to (i) maintain an interest coverage ratio (the "Consolidated Interest Coverage Ratio") of not less than 3.00 to 1.00 and (ii) maintain a leverage ratio ( the "Consolidated Net Leverage Ratio") not to exceed 3.75 to 1.00 for periods ending from December 31, 2017 through September 30, 2018; and 3.50 to 1.00 for periods ending from December 31, 2018 thereafter, provided that the maximum leverage ratio for all periods shall be increased by 0.50 to 1.00 for two quarters after consummation of a qualified acquisition. We may generally make certain investments, redeem debt subordinated to the Senior Credit Facility and make certain restricted payments (such as stock repurchases) if our Consolidated Net Leverage Ratio does not exceed 3.25 to 1.00 pro forma for such transaction. We are otherwise subject to customary covenants including limitations on asset sales, incurrence of additional debt, and limitations on certain investments and restricted payments.
Financial Covenant | Actual Ratios as of December 31, 2017 | Required Ratios | ||
Consolidated Interest Coverage Ratio, as defined under the Senior Credit Facility | 10.13 to 1.00 | Not less than: 3.00 to 1.00 | ||
Consolidated Net Leverage Ratio, as defined under the Senior Credit Facility | 2.64 to 1.00 | Not greater than: 3.75 to 1.00 | ||
39
We were in compliance with our financial and non-financial covenants as of December 31, 2017.
Outlook
Short-term liquidity requirements consist primarily of recurring operating expenses, including but not limited to costs related to our capital and environmental expenditures, company-funded R&D expenditures, debt service requirements, and retirement benefit plans. We believe that our existing cash and cash equivalents and availability under our revolving credit facility coupled with cash generated from our future operations will provide sufficient funds to meet our operating plan, which includes our CIP Phase I and Phase II, and AR1 engine development costs, for the next twelve months. The operating plan for this period provides for full operation of our businesses, and interest and principal payments on our debt. As of December 31, 2017, we had $535.0 million of cash and cash equivalents and $20.0 million of marketable securities as well as $311.4 million of available borrowings under our Senior Credit Facility. Based on our existing debt agreements, we were in compliance with our financial and non-financial covenants as of December 31, 2017. Our failure to comply with these covenants could result in an event of default that, if not cured or waived by the lenders, could result in the acceleration of the Senior Credit Facility and 2¼% Notes. In addition, our failure to pay principal and interest when due is a default under the Senior Credit Facility, and in certain cases, would cause a cross default on the 2¼% Notes.
We are committed to a cash management strategy that maintains liquidity to adequately support the operation of the business, our growth strategy and to withstand unanticipated business volatility. Our cash management strategy includes maintaining the flexibility to pay down debt and/or repurchase shares depending on economic and other conditions. In connection with the implementation of our cash management strategy, our management may seek to retire or purchase our outstanding debt through cash purchases and/or exchanges for equity securities, in open market purchases, privately negotiated transactions or otherwise if we believe that it is in our best interests. Such repurchases or exchanges, if any, will depend on prevailing market conditions, our liquidity requirements, contractual restrictions and other factors. The amounts involved may be material.
Potential future acquisitions depend, in part, on the availability of financial resources at an acceptable cost of capital. We expect to utilize cash on hand and cash generated by operations, as well as cash available under our Senior Credit Facility, which may involve renegotiation of credit limits to finance any future acquisitions. Other sources of capital could include the issuance of common and/or preferred stock, and the placement of debt. We periodically evaluate capital markets and may access such markets when circumstances appear favorable. We believe that sufficient capital resources will be available from one or several of these sources to finance any future acquisitions. However, no assurances can be made that acceptable financing will be available, or that acceptable acquisition candidates will be identified, or that any such acquisitions will be accretive to earnings.
As disclosed in Notes 8(b) and 8(c) of the notes to consolidated financial statements, we have exposure for certain legal and environmental matters. We believe that it is currently not possible to estimate the impact, if any, that the ultimate resolution of certain of these matters will have on our financial position, results of operations, or cash flows.
Major factors that could adversely impact our forecasted operating cash flows and our financial condition are described in Part I, Item 1A. Risk Factors. In addition, our liquidity and financial condition will continue to be affected by changes in prevailing interest rates on the portion of debt that bears interest at variable interest rates.
40
Contractual Obligations:
We have contractual obligations and commitments in the form of debt obligations, operating leases, certain other liabilities, and other commitments. The following table summarizes our contractual obligations as of December 31, 2017:
Payments due by period | |||||||||||||||||||
Total | Less than 1 year | 1-3 years | 3-5 years | After 5 years | |||||||||||||||
(In millions) | |||||||||||||||||||
Contractual Obligations: | |||||||||||||||||||
Long-term debt: | |||||||||||||||||||
Senior debt | $ | 370.0 | $ | 25.0 | $ | 65.0 | $ | 280.0 | $ | — | |||||||||
Convertible senior notes | 300.0 | — | — | — | 300.0 | ||||||||||||||
Capital lease obligations | 0.9 | 0.2 | 0.4 | 0.3 | — | ||||||||||||||
Interest on long-term debt (1) | 84.5 | 20.7 | 38.2 | 19.1 | 6.5 | ||||||||||||||
Huntsville building commitments (2) | 83.1 | 2.2 | 7.4 | 7.5 | 66.0 | ||||||||||||||
Outsourced information technology commitment | 121.9 | 29.4 | 52.7 | 39.8 | — | ||||||||||||||
Postretirement medical and life insurance benefits (3) | 33.6 | 4.8 | 8.7 | 7.4 | 12.7 | ||||||||||||||
Operating leases | 95.1 | 15.1 | 28.7 | 27.4 | 23.9 | ||||||||||||||
Conditional asset retirement obligations (4) | 44.0 | 1.3 | 2.6 | 17.6 | 22.5 | ||||||||||||||
Total | $ | 1,133.1 | $ | 98.7 | $ | 203.7 | $ | 399.1 | $ | 431.6 | |||||||||
________
(1) | Includes interest on variable debt calculated based on interest rates at December 31, 2017. |
(2) See Note 6(d) to our consolidated financial statements in Item 8. Consolidated Financial Statements of this Report for additional information.
(3) | The payments presented above are expected payments for the next 10 years. The payments for postretirement medical and life insurance benefits reflect the estimated benefit payments of the plans using the provisions currently in effect. The obligation related to postretirement medical and life insurance benefits is actuarially determined on an annual basis. A substantial portion of these amounts are recoverable through our contracts with the U.S. government. |
(4) | The conditional asset retirement obligations presented are related to our Aerospace and Defense segment and are allowable costs under our contracts with the U.S. government. |
We may be required to make significant cash contributions in the future to fund our retirement benefit plans, a portion of which we may not be able to immediately recover from our U.S. government contracts. We expect to make cash contributions of approximately $42.0 million to our tax-qualified defined benefit pension plan in fiscal 2018 of which $37.5 million is expected to be recoverable from our U.S. government contracts in fiscal 2018 with the remaining $4.5 million being potentially recoverable from our U.S. government contracts in the future.
We also issue purchase orders and make other commitments to suppliers for equipment, materials, and supplies in the normal course of business. These purchase commitments are generally for volumes consistent with anticipated requirements to fulfill purchase orders or contracts for product deliveries received, or expected to be received, from customers and would be subject to reimbursement if a cost-plus contract was terminated.
Arrangements with Off-Balance Sheet Risk:
As of December 31, 2017, arrangements with off-balance sheet risk consisted of:
• | $38.6 million in outstanding commercial letters of credit, the majority of which may be renewed, primarily to collateralize obligations for environmental remediation and insurance coverage. |
• | $52.8 million in outstanding surety bonds to primarily satisfy indemnification obligations for environmental remediation coverage. |
• | Up to $120.0 million aggregate in guarantees by us of Aerojet Rocketdyne’s obligations to U.S. government agencies for environmental remediation activities. |
• | $121.9 million in commitments associated with outsourcing certain information technology and cyber security functions. |
• | $83.1 million in commitments associated with our new facilities located in Huntsville, Alabama. |
• | Guarantees, jointly and severally, by our material domestic subsidiaries of their obligations under our Senior Credit Facility. |
41
In addition to the items discussed above, we have and will from time to time enter into certain types of contracts that require us to indemnify parties against potential third-party and other claims. These contracts primarily relate to: (i) divestiture agreements, under which we may provide customary indemnification to purchasers of our businesses or assets including, for example, claims arising from the operation of the businesses prior to disposition, liability to investigate and remediate environmental contamination existing prior to disposition; (ii) certain real estate leases, under which we may be required to indemnify property owners for claims arising from the use of the applicable premises; and (iii) certain agreements with officers and directors, under which we may be required to indemnify such persons for liabilities arising out of their relationship with us. The terms of such obligations vary. Generally, a maximum obligation is not explicitly stated.
Additionally, we issue purchase orders and make other commitments to suppliers for equipment, materials, and supplies in the normal course of business. These purchase commitments are generally for volumes consistent with anticipated requirements to fulfill purchase orders or contracts for product deliveries received, or expected to be received, from customers and would be subject to reimbursement if the contract is terminated.
We provide product warranties in conjunction with certain product sales. The majority of our warranties are one-year standard warranties for parts, workmanship, and compliance with specifications. On occasion, we have made commitments beyond the standard warranty obligation. While we have contracts with warranty provisions, there is not a history of any significant warranty claims experience. A reserve for warranty exposure is made on a product by product basis when it is both estimable and probable. These costs are included in the program’s estimate at completion and are expensed in accordance with our revenue recognition methodology as allowed under GAAP for that particular contract.
Critical Accounting Policies:
Our financial statements are prepared in accordance with GAAP that offer acceptable alternative methods for accounting for certain items affecting our financial results, such as determining inventory cost, depreciating long-lived assets, and recognizing revenues.
The preparation of financial statements requires the use of estimates, assumptions, judgments, and interpretations that can affect the reported amounts of assets, liabilities, revenues, and expenses, the disclosure of contingent assets and liabilities and other supplemental disclosures. The development of accounting estimates is the responsibility of our management. Management discusses those areas that require significant judgment with the audit committee of our Board of Directors. All of our financial disclosures in our filings with the SEC have been reviewed with the audit committee. Although we believe that the positions we have taken with regard to uncertainties are reasonable, others might reach different conclusions and our positions can change over time as more information becomes available. If an accounting estimate changes, its effects are accounted for prospectively and, if significant, disclosed in notes of the consolidated financial statements.
The areas most affected by our accounting policies and estimates are revenue recognition, other contract considerations, goodwill, retirement benefit plans, litigation, environmental remediation costs and recoveries, and income taxes. Except for income taxes, which are not allocated to our operating segments, these areas affect the financial results of our business segments.
For a discussion of all of our accounting policies, including the accounting policies discussed below, see Note 1 of the consolidated financial statements.
Revenue Recognition
We consider the nature of the individual underlying contract and the type of products and services provided in determining the proper accounting for a particular contract. Each method is applied consistently to all contracts having similar characteristics, as described below.
Under the percentage of completion method, we recognize sales based upon our progress against the contracted performance objectives. Progress is generally measured as costs are incurred (cost-to-cost) or as units are delivered to customers (units-of-delivery) depending on the contractual terms and scope of work of each contract. We use the cost-to-cost measure where the scope of work on contracts principally relates to research and/or development efforts, or the contract is predominantly a development effort with few deliverable units. Under cost-to-cost, we recognize sales as costs are incurred. We use the units-of-delivery measure to recognize sales when contracts require unit deliveries on a frequent and routine basis. Under units-of-delivery, we recognize sales at the contractually agreed upon unit price as units are sold.
For fixed-priced contracts, variance in actual costs from the cost estimates used in determining the fixed price impact the overall profit from the contract. We recognize these variances during the contact performance period. Fixed-priced and cost-reimbursable contracts may provide for variable consideration including awards, incentives, and/or penalties based upon the customer’s assessment of our performance against pre-established targets or other criteria. These targets may include factors such as cost, performance, quality, and schedule. We recognize variable consideration over the contract performance period based upon estimates of performance against the established criteria.
42
In our Aerospace and Defense segment, recognition of profit on long-term contracts requires the use of assumptions and estimates related to total contract revenue, the total cost at completion and the measurement of progress towards completion. Due to the nature of the programs, developing the estimated total contract revenue and cost at completion requires the use of significant judgment. Estimates are continually evaluated as work progresses and are revised as necessary. Factors that must be considered in estimating the work to be completed include, but are not limited to: labor productivity, the nature and technical complexity of the work to be performed, availability and cost volatility of materials, subcontractor and vendor performance, warranty costs, volume assumptions, anticipated labor agreements, inflationary trends, schedule delays, availability of funding from the customer, and the recoverability of costs incurred outside the original contract included in any estimates to complete. We review contract performance and cost estimates at least quarterly and more frequently when circumstances significantly change. When a change in estimate is determined to have an impact on contract profit, we will record a positive or negative adjustment to the statement of operations. Changes in estimates and assumptions related to the status of certain long-term contracts may have a material effect on our operating results. The following table summarizes the impact of the change in significant contract accounting estimates on our Aerospace and Defense segment operating results accounted for under the percentage-of-completion method of accounting:
Year Ended | One month ended | ||||||||||||||
December 31, | December 31, | November 30, | December 31, | ||||||||||||
2017 | 2016 | 2015 | 2015 | ||||||||||||
(In millions, except per share amounts) | |||||||||||||||
Favorable effect of the changes in contract estimates on income (loss) before income taxes | $ | 37.2 | $ | 14.1 | $ | 41.2 | $ | 11.7 | |||||||
Favorable effect of the changes in contract estimates on net (loss) income | 22.3 | 8.5 | 24.7 | 7.0 | |||||||||||
Favorable effect of the changes in contract estimates on basic net (loss) income per share | 0.31 | 0.13 | 0.40 | 0.11 | |||||||||||
Favorable effect of the changes in contract estimates on diluted net (loss) income per share | 0.31 | 0.11 | 0.40 | 0.09 | |||||||||||
The fiscal 2017 favorable changes in contract estimates were primarily driven by improved performance on numerous programs as a result of overhead cost reductions and reduced program risks, most notably on the THAAD program, partially offset by cost growth and manufacturing inefficiencies in fiscal 2017 on electric propulsion contracts. The fiscal 2016 favorable changes in contract estimates were primarily driven by improved performance on space launch systems primarily due to affordability initiatives and lower overhead costs, partially offset by cost growth and manufacturing inefficiencies on electric propulsion contracts. The one month ended December 31, 2015 favorable changes in contract estimates were primarily driven by improved performance on tactical and missile defense programs primarily due to affordability initiatives and lower overhead costs, partially offset by cost growth and manufacturing inefficiencies on an electric propulsion contract. The fiscal 2015 favorable changes in contract estimates were primarily due to improved performance on space launch systems and missile defense programs primarily due to affordability initiatives and lower overhead costs, and unexpected favorable contract performance on close-out activities on the J-2X program.
Revenue on service or time and material contracts is recognized when performed.
If at any time expected costs exceed the value of the contract, the loss is recognized immediately.
If change orders are in dispute or are unapproved in regard to both scope and price they are evaluated as claims. We recognize revenue on claims when recovery of the claim is probable and the amount can be reasonably estimated. Revenue on claims is recognized only to the extent that contract costs related to the claims have been incurred and when it is probable that the claim will result in a bona fide addition to contract value that can be reliably estimated. No profit is recognized on a claim until final settlement occurs.
Revenue from real estate asset sales is recognized when a sufficient down-payment has been received, financing has been arranged and title, possession and other attributes of ownership have been transferred to the buyer. The allocation to cost of sales on real estate asset sales is based on a relative fair market value computation of the land sold which includes the basis on our books, capitalized entitlement costs, and an estimate of our continuing financial commitment.
Revenue that is not derived from long-term development and production contracts, or real estate asset transactions, is recognized when persuasive evidence of a final agreement exists, delivery has occurred, the selling price is fixed or determinable and payment from the customer is reasonably assured. Sales are recorded net of provisions for customer pricing allowances.
43
Other Contract Considerations
The majority of Aerospace and Defense segment sales are driven by pricing based on costs incurred to produce products and perform services under contracts with the U.S. government. Cost-based pricing is determined under the FAR and CAS. The FAR and CAS provide guidance on the types of costs that are allowable and allocable in establishing prices for goods and services from U.S. government contracts. For example, costs such as charitable contributions, advertising, interest expense, and public relations are unallowable, and therefore not recoverable through sales. In addition, we may enter into agreements with the U.S. government that address the subjects of allowability and allocability of costs to contracts for specific matters.
We closely monitor compliance with and the consistent application of our critical accounting policies related to contract accounting. We review the status of contracts through periodic contract status and performance reviews. Also, regular and recurring evaluations of contract cost, scheduling and technical matters are performed by management personnel independent from the business segment performing work under the contract. Costs incurred and allocated to contracts with the U.S. government are reviewed for compliance with regulatory standards by our personnel, and are subject to audit by the DCAA. Accordingly, we record an allowance on our unbilled receivables for amounts of potential contract overhead costs which may not be successfully negotiated and collected.
Goodwill
Goodwill represents the excess of the purchase price of an acquired enterprise or assets over the fair values of the identifiable assets acquired and liabilities assumed. All of our recorded goodwill resides in the Aerospace and Defense reporting unit. Tests for impairment of goodwill are performed on an annual basis, or at any other time if events occur or circumstances indicate that the carrying amount of goodwill may not be recoverable. Circumstances that could trigger an impairment test include but are not limited to: a significant adverse change in the business climate or legal factors; adverse cash flow trends; an adverse action or assessment by a regulator; unanticipated competition; loss of key personnel; decline in stock price; and results of testing for recoverability of a significant asset group within a reporting unit.
We evaluate qualitative factors (including macroeconomic conditions, industry and market considerations, cost factors, and overall financial performance) to determine whether it is necessary to perform the first step of the goodwill test. This step is referred to as the “Step Zero" analysis. If it is determined that it is more likely than not (a likelihood of more than 50%) that the fair value of a reporting unit is less than its carrying amount, we will proceed to the quantitative (“Step One”) analysis to determine the existence and amount of any goodwill impairment. We evaluated goodwill using a “Step Zero" analysis as of October 1, 2017, October 1, 2016, and September 1, 2016 (first day of our fourth quarter), and determined that goodwill was not impaired. On a periodic basis, we will perform a Step One analysis to determine any potential goodwill impairment.
There can be no assurance that our estimates and assumptions made for purposes of our goodwill impairment testing will prove to be accurate predictions of the future. If our assumptions and estimates are incorrect, we may be required to record goodwill impairment charges in future periods.
Retirement Benefit Plans
We discontinued future benefit accruals for our defined benefit pension plans in fiscal 2009. In addition, we provide medical and life insurance benefits to certain eligible retired employees, with varied coverage by employee group. Annual charges are made for the cost of the plans, including administrative costs, interest costs on benefit obligations, and net amortization and deferrals, increased or reduced by the return on assets. We also sponsor a defined contribution 401(k) plan and participation in the plan is available to all employees.
Retirement benefits are a significant cost of doing business and represent obligations that will be ultimately settled far in the future and therefore are subject to estimates. We generally are able to recover cash contributions related to our tax-qualified defined benefit pension plan as allowable costs on our U.S. government contracts, but there is a lag between when we contribute cash to our tax-qualified defined benefit pension plan under pension funding rules and recover it under our U.S. government contracts. Our pension and medical and life insurance benefit obligations and related costs are calculated using actuarial concepts in accordance with GAAP. We are required to make assumptions regarding such variables as the expected long-term rate of return on assets and the discount rate applied to determine service cost and interest cost to arrive at income or expense for the year.
44
We used the following discount rate to determine the benefit obligations for the applicable period:
Pension Benefits | Medical and Life Insurance Benefits | ||||||||||
As of December 31, | As of December 31, | ||||||||||
2017 | 2016 | 2017 | 2016 | ||||||||
Discount rate | 3.59 | % | 4.02 | % | 3.37 | % | 3.68 | % | |||
We used the following assumptions to determine the retirement benefits expense (income) for the applicable period:
Pension Benefits | Medical and Life Insurance Benefits | ||||||||||||||||||||||
Year Ended | One month ended | Year Ended | One month ended | ||||||||||||||||||||
December 31, | November 30, | November 30, | December 31, | December 31, | November 30, | November 30, | December 31, | ||||||||||||||||
2017 | 2016 | 2015 | 2015 | 2017 | 2016 | 2015 | 2015 | ||||||||||||||||
Discount rate | 4.02 | % | 4.36 | % | 3.96 | % | 4.26 | % | 3.68 | % | 3.99 | % | 3.54 | % | 3.87 | % | |||||||
Expected long-term rate of return on assets | 7.00 | % | 7.00 | % | 8.00 | % | 7.00 | % | * | * | * | * | |||||||||||
______
* | Not applicable as our medical and life insurance benefits are unfunded. |
The discount rate represents the current market interest rate used to determine the present value of future cash flows currently expected to be required to settle pension obligations. Based on market conditions, discount rates can experience significant variability. Changes in discount rates can significantly change the liability and, accordingly, the funded status of the pension plan. The assumed discount rate represents the market rate available for investments in high-quality fixed income instruments with maturities matched to the expected benefit payments for pension and medical and life insurance benefit plans.
The expected long-term rate of return on assets represents the rate of earnings expected in the funds invested, and funds to be invested, to provide for anticipated benefit payments to plan participants. We evaluated the historical investment performance, current and expected asset allocation, and, with input from our external advisors, developed best estimates of future investment performance.
Market conditions and interest rates significantly affect assets and liabilities of our pension plans. Pension accounting permits market gains and losses to be deferred and recognized over a period of years. This “smoothing” results in the creation of other accumulated income or loss which will be amortized to pension costs in future years. The accounting method we utilize recognizes one-fifth of the unamortized gains and losses in the market-related value of pension assets and all other gains and losses including changes in the discount rate used to calculate the benefit obligation each year. Investment gains or losses for this purpose are the difference between the expected return and the actual return on the market-related value of assets which smoothes asset values over three years. Although the smoothing period mitigates some volatility in the calculation of annual pension costs, future pension costs are impacted by changes in the market value of assets and changes in interest rates.
A one percentage point change in the key assumptions would have the following effects on the projected benefit obligations as of December 31, 2017 and on retirement benefits for fiscal 2017:
Pension Benefits and Medical and Life Insurance Benefits Discount Rate | Expected Long-term Rate of Return | Assumed Healthcare Cost Trend Rate | |||||||
Net Periodic Benefit Expense | Projected Benefit Obligation | Net Periodic Pension Benefit Expense | Net Periodic Medical and Life Insurance Benefit Expense | Accumulated Benefit Obligation | |||||
(In millions) | |||||||||
1% decrease | $21.7 | $153.5 | $9.2 | $(0.2) | $(0.7) | ||||
1% increase | (18.5) | (128.9) | (9.2) | 0.3 | 0.8 | ||||
Contingencies and Litigation
We are currently involved in certain legal proceedings and, as required, have accrued our estimate of the probable costs and recoveries for resolution of these claims. These estimates are based upon an analysis of potential results, assuming a combination of litigation and settlement strategies. It is possible, however, that future results of operations for any particular quarterly or annual period could be materially affected by changes in assumptions or the effectiveness of strategies related to
45
these proceedings. See Notes 8(b) and 8(c) in notes to consolidated financial statements for more detailed information on litigation exposure.
Environmental Reserves and Estimated Recoveries
For a discussion of our accounting for environmental remediation obligations and costs and related legal matters, see “Environmental Matters” above and Notes 8(c) and 8(d) in notes to consolidated financial statements.
We accrue for costs associated with the remediation of environmental contamination when it becomes probable that a liability has been incurred, and when our costs can be reasonably estimated. Management has a well-established process in place to identify and monitor our environmental exposures. In most cases, only a range of reasonably probable costs can be estimated. In establishing the reserves, the most probable estimated amount is used when determinable, and the minimum amount is used when no single amount in the range is more probable. Environmental reserves include the costs of completing remedial investigation and feasibility studies, remedial and corrective actions, regulatory oversight costs, the cost of operation and maintenance of the remedial action plan, and employee compensation costs for employees who are expected to devote a significant amount of time to remediation efforts. Calculation of environmental reserves is based on the evaluation of currently available information with respect to each individual environmental site and considers factors such as existing technology, presently enacted laws and regulations, and prior experience in remediation of contaminated sites. Such estimates are based on the expected costs of investigation and remediation and the likelihood that other potentially responsible parties will be able to fulfill their commitments at sites where we may be jointly or severally liable.
At the time a liability is recorded for future environmental costs, we record an asset for estimated future recoveries that are estimable and probable. Some of our environmental costs are eligible for future recovery in the pricing of our products and services to the U.S. government and under existing third party agreements. We consider the recovery probable based on the Global Settlement, Northrop Agreement, U.S. government contracting regulations, and our long history of receiving reimbursement for such costs.
Income Taxes
We file a consolidated U.S. federal income tax return for the Company and our 100% owned consolidated subsidiaries. The deferred tax assets and/or liabilities are determined by multiplying the differences between the financial reporting and tax reporting bases for assets and liabilities by the enacted tax rates expected to be in effect when such differences are recovered or settled. The effect on deferred taxes of a change in tax rates is recognized in the period of the enactment date of the change.
On December 22, 2017, the U.S. government enacted comprehensive tax legislation commonly referred to as the Tax Act of 2017. The Tax Act makes broad and complex changes to the U.S. tax code. Among other provisions, the Tax Act reduced the federal corporate statutory income tax rate from 35% to 21% beginning in 2018. In accordance with the rate reduction, we wrote down our net deferred tax assets by $64.6 million which unfavorably affected our effective tax rate by 74.4%.
The carrying value of our deferred tax assets is dependent upon our ability to generate sufficient taxable income in the future. A valuation allowance is required when it is more likely than not that all or a portion of a deferred tax asset will not be realized. A review of all available positive and negative evidence is considered, including our past and future performance, the market environment in which we operate, the utilization of tax attributes in the past, the length of carryback and carryforward periods, and evaluation of potential tax planning strategies.
Despite our belief that our tax return positions are consistent with applicable tax laws, we believe that certain positions are likely to be challenged by taxing authorities. Settlement of any challenge can result in no change, a complete disallowance, or some partial adjustment reached through negotiations or litigation. Our tax reserves reflect the difference between the tax benefit claimed on tax returns and the amount recognized in the financial statements. The accounting standards provide guidance for the recognition and measurement in financial statements for uncertain tax positions taken or expected to be taken in a tax return. The evaluation of a tax position is a two-step process, the first step being recognition. We determine whether it is more likely than not that a tax position will be sustained upon tax examination, including resolution of any related appeals or litigation, based on only the technical merits of the position. The technical merits of a tax position are derived from both statutory and judicial authority (legislation and statutes, legislative intent, regulations, rulings, and case law) and their applicability to the facts and circumstances of the tax position. If a tax position does not meet the more likely than not recognition threshold, the benefit of that position is not recognized in the financial statements. The second step is measurement. A tax position that meets the more likely than not recognition threshold is measured to determine the amount of benefit to recognize in the financial statements. The tax position is measured as the largest amount of benefit that is greater than 50% likely of being realized upon ultimate resolution with a taxing authority. As the examination process progresses with tax authorities, adjustments to tax reserves may be necessary to reflect taxes payable upon settlement. Tax reserve adjustments related to positions impacting the effective tax rate affect the provision for income taxes. Tax reserve adjustments related to positions impacting the timing of deductions impact deferred tax assets and liabilities.
46
Item 7A. Quantitative and Qualitative Disclosures about Market Risk
Policies and Procedures
As an element of our normal business practice, we have established policies and procedures for managing our exposure to changes in interest rates.
The objective in managing exposure to interest rate changes is to limit the impact of interest rate changes on earnings and cash flow and to make overall borrowing costs more predictable. To achieve this objective, we may use interest rate hedge transactions or other interest rate hedge instruments to manage the net exposure to interest rate changes related to our portfolio of borrowings and to balance our fixed rate compared to floating rate debt. We did not enter into any interest rate hedge transactions or instruments during the past three fiscal years.
Interest Rate Risk
We are exposed to market risk principally due to changes in interest rates. Debt with interest rate risk includes borrowings under our Senior Credit Facility. The interest rate risk related to our tax-qualified pension plan assets and liabilities can be found in the "Retirement Benefit Plans" discussion above. As of December 31, 2017, our debt principal amounts totaled $670.9 million: $300.9 million, or 45%, was at an average fixed rate of 2.26%; and $370.0 million, or 55%, was at a variable rate of 3.82%.
The following table summarizes the estimated fair value and principal amount for outstanding debt obligations:
Fair Value | Principal Amount | ||||||||||||||
December 31, 2017 | December 31, 2016 | December 31, 2017 | December 31, 2016 | ||||||||||||
(In millions) | |||||||||||||||
Term loan | $ | 370.0 | $ | 390.0 | $ | 370.0 | $ | 390.0 | |||||||
2 1/4% Notes | 415.3 | 294.9 | 300.0 | 300.0 | |||||||||||
4 1/16% Debentures | — | 70.8 | — | 35.6 | |||||||||||
Capital leases | 0.9 | — | 0.9 | — | |||||||||||
$ | 786.2 | $ | 755.7 | $ | 670.9 | $ | 725.6 | ||||||||
The fair values of the 2 1/4% Notes and 4 1/16% Debentures were determined using broker quotes that are based on open markets for our debt securities (Level 2 securities). The term loan bore interest at variable rates, which adjusted based on market conditions, and its carrying value approximated fair value.
47
Item 8. Consolidated Financial Statements and Supplementary Data
REPORT OF INDEPENDENT REGISTERED PUBLIC ACCOUNTING FIRM
To the Board of Directors and Stockholders of Aerojet Rocketdyne Holdings, Inc.
Opinions on the Financial Statements and Internal Control over Financial Reporting
We have audited the accompanying consolidated balance sheets of Aerojet Rocketdyne Holdings, Inc. and its subsidiaries (the “Company”) as of December 31, 2017 and 2016, and the related consolidated statements of operations, of comprehensive income (loss), of stockholders’ equity (deficit), and of cash flows for the years then ended, for the one month ended December 31, 2015, and for the year ended November 30, 2015, including the related notes (collectively referred to as the “consolidated financial statements”). We also have audited the Company's internal control over financial reporting as of December 31, 2017, based on criteria established in Internal Control - Integrated Framework (2013) issued by the Committee of Sponsoring Organizations of the Treadway Commission (COSO).
In our opinion, the consolidated financial statements referred to above present fairly, in all material respects, the financial position of the Company as of December 31, 2017 and 2016, and the results of its operations and its cash flows for the years then ended, the one month ended December 31, 2015, and the year ended November 30, 2015 in conformity with accounting principles generally accepted in the United States of America. Also in our opinion, the Company maintained, in all material respects, effective internal control over financial reporting as of December 31, 2017, based on criteria established in Internal Control - Integrated Framework (2013) issued by the COSO.
Basis for Opinions
The Company's management is responsible for these consolidated financial statements, for maintaining effective internal control over financial reporting, and for its assessment of the effectiveness of internal control over financial reporting, included in Management's Report on Internal Control Over Financial Reporting appearing under Item 9A. Our responsibility is to express opinions on the Company’s consolidated financial statements and on the Company's internal control over financial reporting based on our audits. We are a public accounting firm registered with the Public Company Accounting Oversight Board (United States) ("PCAOB") and are required to be independent with respect to the Company in accordance with the U.S. federal securities laws and the applicable rules and regulations of the Securities and Exchange Commission and the PCAOB.
We conducted our audits in accordance with the standards of the PCAOB. Those standards require that we plan and perform the audits to obtain reasonable assurance about whether the consolidated financial statements are free of material misstatement, whether due to error or fraud, and whether effective internal control over financial reporting was maintained in all material respects.
Our audits of the consolidated financial statements included performing procedures to assess the risks of material misstatement of the consolidated financial statements, whether due to error or fraud, and performing procedures that respond to those risks. Such procedures included examining, on a test basis, evidence regarding the amounts and disclosures in the consolidated financial statements. Our audits also included evaluating the accounting principles used and significant estimates made by management, as well as evaluating the overall presentation of the consolidated financial statements. Our audit of internal control over financial reporting included obtaining an understanding of internal control over financial reporting, assessing the risk that a material weakness exists, and testing and evaluating the design and operating effectiveness of internal control based on the assessed risk. Our audits also included performing such other procedures as we considered necessary in the circumstances. We believe that our audits provide a reasonable basis for our opinions.
Definition and Limitations of Internal Control over Financial Reporting
A company’s internal control over financial reporting is a process designed to provide reasonable assurance regarding the reliability of financial reporting and the preparation of financial statements for external purposes in accordance with generally accepted accounting principles. A company’s internal control over financial reporting includes those policies and procedures that (i) pertain to the maintenance of records that, in reasonable detail, accurately and fairly reflect the transactions and dispositions of the assets of the company; (ii) provide reasonable assurance that transactions are recorded as necessary to permit preparation of financial statements in accordance with generally accepted accounting principles, and that receipts and expenditures of the company are being made only in accordance with authorizations of management and directors of the company; and (iii) provide reasonable assurance regarding prevention or timely detection of unauthorized acquisition, use, or disposition of the company’s assets that could have a material effect on the financial statements.
Because of its inherent limitations, internal control over financial reporting may not prevent or detect misstatements. Also, projections of any evaluation of effectiveness to future periods are subject to the risk that controls may become inadequate because of changes in conditions, or that the degree of compliance with the policies or procedures may deteriorate.
/s/ PricewaterhouseCoopers LLP
Los Angeles, California
February 21, 2018
We have served as the Company’s auditor since 2006.
48
Aerojet Rocketdyne Holdings, Inc.
Consolidated Statements of Operations
Year Ended | One month ended | ||||||||||||||
December 31, | December 31, | November 30, | December 31, | ||||||||||||
2017 | 2016 | 2015 | 2015 | ||||||||||||
(In millions, except per share amounts) | |||||||||||||||
Net sales | $ | 1,877.2 | $ | 1,761.3 | $ | 1,708.3 | $ | 96.3 | |||||||
Operating costs and expenses: | |||||||||||||||
Cost of sales (exclusive of items shown separately below) | 1,615.4 | 1,527.4 | 1,459.5 | 75.4 | |||||||||||
AR1 research and development | — | — | 32.1 | — | |||||||||||
Selling, general and administrative expense | 67.0 | 53.6 | 49.0 | 2.8 | |||||||||||
Depreciation and amortization | 72.6 | 64.9 | 65.1 | 5.1 | |||||||||||
Other expense, net: | |||||||||||||||
Legal settlement | — | — | 50.0 | — | |||||||||||
Other | 7.9 | 19.8 | 16.5 | 0.2 | |||||||||||
Total operating costs and expenses | 1,762.9 | 1,665.7 | 1,672.2 | 83.5 | |||||||||||
Operating income | 114.3 | 95.6 | 36.1 | 12.8 | |||||||||||
Non-operating (income) expense: | |||||||||||||||
Loss on debt | — | 34.5 | 1.9 | — | |||||||||||
Interest income | (3.5 | ) | (0.6 | ) | (0.3 | ) | — | ||||||||
Interest expense | 30.9 | 32.5 | 50.4 | 3.8 | |||||||||||
Total non-operating expense, net | 27.4 | 66.4 | 52.0 | 3.8 | |||||||||||
Income (loss) before income taxes | 86.9 | 29.2 | (15.9 | ) | 9.0 | ||||||||||
Income tax provision | 96.1 | 11.2 | 0.3 | 2.0 | |||||||||||
Net (loss) income | $ | (9.2 | ) | $ | 18.0 | $ | (16.2 | ) | $ | 7.0 | |||||
(Loss) income per share of common stock | |||||||||||||||
Basic: | |||||||||||||||
Net (loss) income per share | $ | (0.13 | ) | $ | 0.27 | $ | (0.27 | ) | $ | 0.11 | |||||
Diluted: | |||||||||||||||
Net (loss) income per share | $ | (0.13 | ) | $ | 0.27 | $ | (0.27 | ) | $ | 0.10 | |||||
Weighted average shares of common stock outstanding, basic | 73.0 | 65.6 | 61.1 | 62.9 | |||||||||||
Weighted average shares of common stock outstanding, diluted | 73.0 | 65.7 | 61.1 | 72.5 | |||||||||||
See Notes to Consolidated Financial Statements.
49
Aerojet Rocketdyne Holdings, Inc.
Consolidated Statements of Comprehensive Income (Loss)
Year Ended | One month ended | ||||||||||||||
December 31, | December 31, | November 30, | December 31, | ||||||||||||
2017 | 2016 | 2015 | 2015 | ||||||||||||
(In millions) | |||||||||||||||
Net (loss) income | $ | (9.2 | ) | $ | 18.0 | $ | (16.2 | ) | $ | 7.0 | |||||
Other comprehensive income (loss): | |||||||||||||||
Amortization of net actuarial losses, net of $24.5 million, $23.2 million, $31.3 million, and $1.7 million of income taxes in fiscal 2017, 2016, 2015, and one month ended December 31, 2015, respectively | 39.0 | 37.1 | 49.4 | 3.4 | |||||||||||
Actuarial (losses) gains, net of $2.9 million, $4.8 million, $36.9 million, and $4.6 million of income taxes in fiscal 2017, 2016, 2015, and one month ended December 31, 2015, respectively | (8.5 | ) | 7.5 | (56.6 | ) | (8.6 | ) | ||||||||
Amortization of prior service credits, net of $0.0 million, $0.4 million, $0.4 million, and $0.0 million of income taxes in fiscal 2017, 2016, 2015, and one month ended December 31, 2015, respectively | (0.1 | ) | (0.6 | ) | (0.8 | ) | (0.1 | ) | |||||||
Other comprehensive income (loss), net of income taxes | 30.4 | 44.0 | (8.0 | ) | (5.3 | ) | |||||||||
Comprehensive income (loss) | $ | 21.2 | $ | 62.0 | $ | (24.2 | ) | $ | 1.7 | ||||||
See Notes to Consolidated Financial Statements.
50
Aerojet Rocketdyne Holdings, Inc.
Consolidated Balance Sheets
As of December 31, | |||||||
2017 | 2016 | ||||||
(In millions, except per share amounts) | |||||||
ASSETS | |||||||
Current Assets | |||||||
Cash and cash equivalents | $ | 535.0 | $ | 410.3 | |||
Marketable securities | 20.0 | — | |||||
Accounts receivable | 215.5 | 136.4 | |||||
Inventories | 136.4 | 185.1 | |||||
Other current assets, net | 109.8 | 122.9 | |||||
Total Current Assets | 1,016.7 | 854.7 | |||||
Noncurrent Assets | |||||||
Property, plant and equipment, net | 359.0 | 366.0 | |||||
Recoverable from the U.S. government and other third parties for environmental remediation costs | 231.1 | 239.8 | |||||
Deferred income taxes | 145.8 | 292.5 | |||||
Goodwill | 161.3 | 158.1 | |||||
Intangible assets | 85.5 | 94.4 | |||||
Other noncurrent assets, net | 259.3 | 244.0 | |||||
Total Noncurrent Assets | 1,242.0 | 1,394.8 | |||||
Total Assets | $ | 2,258.7 | $ | 2,249.5 | |||
LIABILITIES, REDEEMABLE COMMON STOCK, AND STOCKHOLDERS’ EQUITY | |||||||
Current Liabilities | |||||||
Current portion of long-term debt | $ | 25.0 | $ | 55.6 | |||
Accounts payable | 100.9 | 96.2 | |||||
Reserves for environmental remediation costs | 35.2 | 37.1 | |||||
Advance payments on contracts | 237.8 | 221.8 | |||||
Other current liabilities | 195.9 | 173.0 | |||||
Total Current Liabilities | 594.8 | 583.7 | |||||
Noncurrent Liabilities | |||||||
Long-term debt | 591.4 | 608.0 | |||||
Reserves for environmental remediation costs | 306.2 | 312.6 | |||||
Pension benefits | 492.8 | 548.2 | |||||
Other noncurrent liabilities | 171.1 | 161.4 | |||||
Total Noncurrent Liabilities | 1,561.5 | 1,630.2 | |||||
Total Liabilities | 2,156.3 | 2,213.9 | |||||
Commitments and contingencies (Note 8) | |||||||
Redeemable common stock, par value of $0.10; none issued and outstanding December 31, 2017; 0.1 million shares issued and outstanding as of December 31, 2016 | — | 1.1 | |||||
Stockholders’ Equity | |||||||
Preference stock, par value of $1.00; 15.0 million shares authorized; none issued or outstanding | — | — | |||||
Common stock, par value of $0.10; 150.0 million shares authorized; 73.6 million shares issued and outstanding as of December 31, 2017; 69.2 million shares issued and outstanding as of December 31, 2016 | 7.4 | 6.9 | |||||
Other capital | 503.1 | 456.9 | |||||
Treasury stock at cost, 3.5 million shares as of December 31, 2017 and 2016 | (64.5 | ) | (64.5 | ) | |||
Accumulated deficit | (71.0 | ) | (61.8 | ) | |||
Accumulated other comprehensive loss, net of income taxes | (272.6 | ) | (303.0 | ) | |||
Total Stockholders’ Equity | 102.4 | 34.5 | |||||
Total Liabilities, Redeemable Common Stock and Stockholders’ Equity | $ | 2,258.7 | $ | 2,249.5 | |||
See Notes to Consolidated Financial Statements.
51
Aerojet Rocketdyne Holdings, Inc.
Consolidated Statements of Stockholders’ Equity (Deficit)
Common Stock | Accumulated Other Comprehensive Loss | Total Stockholders' Equity (Deficit) | ||||||||||||||||||||||||
Shares | Amount | Other Capital | Treasury Stock | Accumulated Deficit | ||||||||||||||||||||||
(In millions) | ||||||||||||||||||||||||||
November 30, 2014 | 56.9 | $ | 5.9 | $ | 287.4 | $ | (64.5 | ) | $ | (70.6 | ) | $ | (333.7 | ) | $ | (175.5 | ) | |||||||||
Net loss | — | — | — | — | (16.2 | ) | — | (16.2 | ) | |||||||||||||||||
Other comprehensive loss, net of income taxes | — | — | — | — | — | (8.0 | ) | (8.0 | ) | |||||||||||||||||
Reclassification of redeemable common stock | (0.1 | ) | — | 0.7 | — | — | — | 0.7 | ||||||||||||||||||
Tax benefit from shares issued under equity plans | — | — | 2.5 | — | — | — | 2.5 | |||||||||||||||||||
Conversion of debt to common stock | 5.5 | 0.5 | 48.5 | — | — | — | 49.0 | |||||||||||||||||||
Repurchase of shares to satisfy tax withholding obligations | (0.3 | ) | — | (6.7 | ) | — | — | — | (6.7 | ) | ||||||||||||||||
Stock-based compensation and shares issued under equity plans, net | 0.9 | 0.1 | 7.7 | — | — | — | 7.8 | |||||||||||||||||||
November 30, 2015 | 62.9 | 6.5 | 340.1 | (64.5 | ) | (86.8 | ) | (341.7 | ) | (146.4 | ) | |||||||||||||||
Net income | — | — | — | — | 7.0 | — | 7.0 | |||||||||||||||||||
Other comprehensive loss, net of income taxes | — | — | — | — | — | (5.3 | ) | (5.3 | ) | |||||||||||||||||
Reclassification from redeemable common stock | — | — | (0.7 | ) | — | — | — | (0.7 | ) | |||||||||||||||||
Tax benefit from shares issued under equity plans | — | — | 2.4 | — | — | — | 2.4 | |||||||||||||||||||
Repurchase of shares to satisfy tax withholding obligations | — | — | (0.2 | ) | — | — | — | (0.2 | ) | |||||||||||||||||
Stock-based compensation and other, net | — | — | 1.0 | — | — | — | 1.0 | |||||||||||||||||||
December 31, 2015 | 62.9 | 6.5 | 342.6 | (64.5 | ) | (79.8 | ) | (347.0 | ) | (142.2 | ) | |||||||||||||||
Net income | — | — | — | — | 18.0 | — | 18.0 | |||||||||||||||||||
Other comprehensive income, net of income taxes | — | — | — | — | — | 44.0 | 44.0 | |||||||||||||||||||
Reclassification of redeemable common stock | — | — | 0.5 | — | — | — | 0.5 | |||||||||||||||||||
Tax benefit from shares issued under equity plans | — | — | 0.3 | — | — | — | 0.3 | |||||||||||||||||||
Equity component of convertible debt | — | — | 54.5 | — | — | — | 54.5 | |||||||||||||||||||
Conversion of debt to common stock | 5.4 | 0.4 | 48.6 | — | — | — | 49.0 | |||||||||||||||||||
Repurchase of shares for option cost and to satisfy tax withholding obligations | (0.3 | ) | — | (3.9 | ) | — | — | — | (3.9 | ) | ||||||||||||||||
Stock-based compensation and shares issued under equity plans, net | 1.2 | — | 14.3 | — | — | — | 14.3 | |||||||||||||||||||
December 31, 2016 | 69.2 | 6.9 | 456.9 | (64.5 | ) | (61.8 | ) | (303.0 | ) | 34.5 | ||||||||||||||||
Net loss | — | — | — | — | (9.2 | ) | — | (9.2 | ) | |||||||||||||||||
Other comprehensive income, net of income taxes | — | — | — | — | — | 30.4 | 30.4 | |||||||||||||||||||
Reclassification of redeemable common stock | 0.1 | — | 0.9 | — | — | — | 0.9 | |||||||||||||||||||
Cumulative effect of change in accounting guidance | — | — | 0.3 | — | — | — | 0.3 | |||||||||||||||||||
Conversion of debt to common stock | 3.9 | 0.4 | 35.2 | — | — | — | 35.6 | |||||||||||||||||||
Repurchase of shares for option cost and to satisfy tax withholding obligations | — | — | (6.2 | ) | — | — | — | (6.2 | ) | |||||||||||||||||
Stock-based compensation and shares issued under equity plans, net | 0.4 | 0.1 | 16.0 | — | — | — | 16.1 | |||||||||||||||||||
December 31, 2017 | 73.6 | $ | 7.4 | $ | 503.1 | $ | (64.5 | ) | $ | (71.0 | ) | $ | (272.6 | ) | $ | 102.4 | ||||||||||
See Notes to Consolidated Financial Statements.
52
Aerojet Rocketdyne Holdings, Inc.
Consolidated Statements of Cash Flows
Year Ended | One month ended | ||||||||||||||
December 31, | December 31, | November 30, | December 31, | ||||||||||||
2017 | 2016 | 2015 | 2015 | ||||||||||||
(In millions) | |||||||||||||||
Operating Activities | |||||||||||||||
Net (loss) income | $ | (9.2 | ) | $ | 18.0 | $ | (16.2 | ) | $ | 7.0 | |||||
Adjustments to reconcile net (loss) income to net cash provided by operating activities: | |||||||||||||||
Depreciation and amortization | 72.6 | 64.9 | 65.1 | 5.1 | |||||||||||
Amortization of debt discount and deferred financing costs | 8.5 | 2.3 | 2.7 | 0.2 | |||||||||||
Stock-based compensation | 22.0 | 12.9 | 8.6 | (0.4 | ) | ||||||||||
Retirement benefits, net | (8.2 | ) | 30.5 | 61.4 | 5.4 | ||||||||||
Loss on debt repurchased | — | 34.4 | 1.9 | — | |||||||||||
Other, net | 0.7 | 0.6 | (0.3 | ) | — | ||||||||||
Changes in assets and liabilities, net of effects from acquisition: | |||||||||||||||
Accounts receivable | (67.6 | ) | 33.1 | (1.0 | ) | 2.0 | |||||||||
Inventories | 48.6 | (28.9 | ) | (19.5 | ) | 1.3 | |||||||||
Other current assets, net | 13.0 | (23.8 | ) | (25.7 | ) | (4.8 | ) | ||||||||
Recoverable from the U.S. government and other third parties for environmental remediation costs | 8.7 | (32.6 | ) | (127.8 | ) | 3.2 | |||||||||
Other noncurrent assets | (31.4 | ) | (12.6 | ) | 10.2 | (0.1 | ) | ||||||||
Accounts payable | 1.6 | 27.0 | (5.1 | ) | (41.0 | ) | |||||||||
Advance payments on contracts | 16.0 | (9.1 | ) | 6.3 | 27.2 | ||||||||||
Other current liabilities | 8.2 | (37.4 | ) | (18.8 | ) | 5.6 | |||||||||
Deferred income taxes | 125.7 | 4.8 | (27.6 | ) | (7.1 | ) | |||||||||
Reserves for environmental remediation costs | (8.3 | ) | 47.4 | 140.1 | (3.8 | ) | |||||||||
Other noncurrent liabilities and other | 11.9 | 27.2 | 13.3 | 0.3 | |||||||||||
Net Cash Provided by Operating Activities | 212.8 | 158.7 | 67.6 | 0.1 | |||||||||||
Investing Activities | |||||||||||||||
Purchases of marketable securities | (24.0 | ) | — | — | |||||||||||
Sale of marketable securities | 4.0 | — | — | ||||||||||||
Purchase of Coleman Aerospace | (17.0 | ) | — | — | — | ||||||||||
Proceeds from sale of technology | — | 0.5 | 1.0 | — | |||||||||||
Capital expenditures | (29.4 | ) | (47.6 | ) | (36.8 | ) | (1.2 | ) | |||||||
Net Cash Used in Investing Activities | (66.4 | ) | (47.1 | ) | (35.8 | ) | (1.2 | ) | |||||||
Financing Activities | |||||||||||||||
Proceeds from issuance of debt | — | 800.0 | — | — | |||||||||||
Debt issuance costs including equity component of convertible debt | — | (9.5 | ) | — | — | ||||||||||
Debt repayments/repurchases | (20.0 | ) | (700.6 | ) | (81.2 | ) | (1.3 | ) | |||||||
Proceeds from shares issued under equity plans, net | 4.5 | 4.2 | 1.3 | — | |||||||||||
Repurchase of shares for option cost and to satisfy tax withholding obligations | (6.2 | ) | (3.9 | ) | (6.7 | ) | (0.2 | ) | |||||||
Net Cash (Used in) Provided by Financing Activities | (21.7 | ) | 90.2 | (86.6 | ) | (1.5 | ) | ||||||||
Net Increase (Decrease) in Cash and Cash Equivalents | 124.7 | 201.8 | (54.8 | ) | (2.6 | ) | |||||||||
Cash and Cash Equivalents at Beginning of Period | 410.3 | 208.5 | 265.9 | 211.1 | |||||||||||
Cash and Cash Equivalents at End of Period | $ | 535.0 | $ | 410.3 | $ | 211.1 | $ | 208.5 | |||||||
Supplemental disclosures of cash flow information | |||||||||||||||
Cash paid for interest | $ | 22.2 | $ | 39.0 | $ | 49.3 | $ | 2.7 | |||||||
Cash paid for income taxes | 3.0 | 31.2 | 27.9 | — | |||||||||||
Cash refund for income taxes | 22.9 | 0.1 | — | — | |||||||||||
Capital leases | 0.9 | — | — | — | |||||||||||
Conversion of debt to common stock | 35.6 | 49.0 | 49.0 | — | |||||||||||
See Notes to Consolidated Financial Statements.
53
Aerojet Rocketdyne Holdings, Inc.
Notes to Consolidated Financial Statements
Note 1. Summary of Significant Accounting Policies
a. Basis of Presentation and Nature of Operations
The consolidated financial statements of Aerojet Rocketdyne Holdings, Inc. (“Aerojet Rocketdyne Holdings” or the “Company”) include the accounts of the parent company and its 100% owned and majority owned subsidiaries. All significant intercompany accounts and transactions have been eliminated in consolidation. Certain reclassifications have been made to financial information for prior years to conform to the current year’s presentation.
The Company is a manufacturer of aerospace and defense products and systems with a real estate segment. The Company’s operations are organized into two segments:
Aerospace and Defense — includes the operations of the Company’s wholly-owned subsidiary Aerojet Rocketdyne, Inc. (“Aerojet Rocketdyne”), a leading technology-based designer, developer and manufacturer of aerospace and defense products and systems for the United States (“U.S.”) government, including the Department of Defense (“DoD”), the National Aeronautics and Space Administration (“NASA”), and major aerospace and defense prime contractors.
Real Estate — includes the activities of the Company’s wholly-owned subsidiary Easton Development Company, LLC (“Easton”) related to the re-zoning, entitlement, sale, and leasing of the Company’s excess real estate assets. The Company is currently in the process of seeking zoning changes and other governmental approvals on its excess real estate assets to optimize its value.
In January 2016, the Company's Board of Directors approved a change in the Company's fiscal year-end from November 30 of each year to December 31 of each year. The fiscal year of the Company's subsidiary, Aerojet Rocketdyne, ends on the last Saturday in December. As a result of the change, the Company had a one month transition period in December 2015. Further, as a result of the 2016 calendar, Aerojet Rocketdyne had 53 weeks of operations in fiscal 2016 compared with 52 weeks of operations in fiscal 2017 and fiscal 2015. The additional week of operations, which occurred in the fourth quarter of fiscal 2016, accounted for $32.2 million in additional net sales.
The preparation of the consolidated financial statements in conformity with accounting principles generally accepted in the United States of America (“GAAP”) requires the Company to make estimates and assumptions that affect the amounts reported in the consolidated financial statements and accompanying notes. Actual results could differ from those estimates.
b. Cash and Cash Equivalents
All highly liquid debt instruments purchased with a remaining maturity at the date of purchase of three months or less are considered to be cash equivalents. The Company aggregates its cash balances by bank, and reclassifies any negative balances, if applicable, to accounts payable.
c. Fair Value of Financial Instruments
Financial instruments are classified using a three-tiered fair value hierarchy, which prioritizes the inputs used in measuring fair value. These tiers include: Level 1, defined as observable inputs such as quoted prices in active markets; Level 2, defined as inputs other than quoted prices in active markets that are either directly or indirectly observable; and Level 3, defined as unobservable inputs in which little or no market data exists, therefore requiring an entity to develop its own assumptions. The following are measured at fair value:
54
Fair value measurement at December 31, 2017 | |||||||||||||||
Total | Quoted Prices in Active Markets for Identical Assets (Level 1) | Significant Other Observable Inputs (Level 2) | Significant Unobservable Inputs (Level 3) | ||||||||||||
(In millions) | |||||||||||||||
Money market funds | $ | 155.0 | $ | 155.0 | $ | — | $ | — | |||||||
Commercial paper | 135.6 | — | 135.6 | — | |||||||||||
U.S. treasury notes | 4.1 | — | 4.1 | — | |||||||||||
Total | $ | 294.7 | $ | 155.0 | $ | 139.7 | $ | — | |||||||
Fair value measurement at December 31, 2016 | |||||||||||||||
Total | Quoted Prices in Active Markets for Identical Assets (Level 1) | Significant Other Observable Inputs (Level 2) | Significant Unobservable Inputs (Level 3) | ||||||||||||
(In millions) | |||||||||||||||
Money market funds | $ | 328.5 | $ | 328.5 | $ | — | $ | — | |||||||
The carrying amounts of certain of the Company’s financial instruments, including cash and cash equivalents, accounts receivable, accounts payable, accrued compensation, and other accrued liabilities, approximate fair value because of their short maturities.
The following table summarizes the estimated fair value and principal amount for outstanding debt obligations:
Fair Value | Principal Amount | ||||||||||||||
December 31, 2017 | December 31, 2016 | December 31, 2017 | December 31, 2016 | ||||||||||||
(In millions) | |||||||||||||||
Term loan | $ | 370.0 | $ | 390.0 | $ | 370.0 | $ | 390.0 | |||||||
2.25% Convertible Senior Notes ("2 1/4% Notes") | 415.3 | 294.9 | 300.0 | 300.0 | |||||||||||
4 1/16% Convertible Subordinated Debentures (“4 1/16% Debentures”) | — | 70.8 | — | 35.6 | |||||||||||
Capital leases | 0.9 | — | 0.9 | — | |||||||||||
$ | 786.2 | $ | 755.7 | $ | 670.9 | $ | 725.6 | ||||||||
The fair values of the 2 1/4% Notes and 4 1/16% Debentures were determined using broker quotes that are based on open markets for the Company’s debt securities (Level 2 securities). The term loan bore interest at variable rates, which adjusted based on market conditions, and its carrying value approximated fair value.
d. Accounts Receivable
Accounts receivable associated with long-term contracts consist of billed and unbilled amounts. Billed amounts include invoices presented to customers that have not been paid. Unbilled amounts relate to sales that have been recorded and billings that have not been presented to customers. Amounts for overhead disallowances or billing decrements are reflected in unbilled receivables and primarily represent estimates of potential overhead costs which may not be successfully negotiated and collected.
Other receivables represent amounts billed where sales were not derived from long-term contracts.
e. Inventories
Inventories are stated at the lower of cost or market, generally using the average cost method. Costs on long-term contracts and programs in progress represent recoverable costs incurred for production, contract-specific facilities and equipment, allocable operating overhead, advances to suppliers, environmental expenses and, in the case of contracts with the U.S. government, allocable costs deemed allowable from U.S. government procurement regulations for bid and proposal, research and development, and selling, general and administrative expenses. The Company capitalizes costs incurred in advance of contract award or funding in inventories if it determines that contract award or funding is probable. Amounts previously capitalized are expensed when a contract award or funding is no longer probable. Pursuant to contract provisions, agencies of the U.S. government and certain other customers have title to, or a security interest in, inventories related to such
55
contracts as a result of performance-based and progress payments. Such progress payments are reflected as an offset against the related inventory balances.
f. Income Taxes
The Company files a consolidated U.S. federal income tax return with its 100% owned consolidated subsidiaries. The deferred tax assets and/or liabilities are determined by multiplying the differences between the financial reporting and tax reporting bases for assets and liabilities by the enacted tax rates expected to be in effect when such differences are recovered or settled. The effect on deferred taxes of a change in tax rates is recognized in the period of the enactment date of the change.
The carrying value of the Company’s deferred tax assets is dependent upon its ability to generate sufficient taxable income in the future. A valuation allowance is required when it is more likely than not that all or a portion of a deferred tax asset will not be realized. A review of all available positive and negative evidence is considered, including the Company’s past and future performance, the market environment in which it operates, the utilization of tax attributes in the past, the length of carryback and carryforward periods, and evaluation of potential tax planning strategies.
Despite the Company’s belief that its tax return positions are consistent with applicable tax laws, the Company believes that certain positions are likely to be challenged by taxing authorities. Settlement of any challenge can result in no change, a complete disallowance, or some partial adjustment reached through negotiations or litigation. The Company’s tax reserves reflect the difference between the tax benefit claimed on tax returns and the amount recognized in the financial statements. The accounting standards provide guidance for the recognition and measurement in financial statements for uncertain tax positions taken or expected to be taken in a tax return. The evaluation of a tax position is a two-step process, the first step being recognition. The Company determines whether it is more likely than not that a tax position will be sustained upon tax examination, including resolution of any related appeals or litigation, based on only the technical merits of the position. The technical merits of a tax position are derived from both statutory and judicial authority (legislation and statutes, legislative intent, regulations, rulings, and case law) and their applicability to the facts and circumstances of the tax position. If a tax position does not meet the more likely than not recognition threshold, the benefit of that position is not recognized in the financial statements. The second step is measurement. A tax position that meets the more likely than not recognition threshold is measured to determine the amount of benefit to recognize in the financial statements. The tax position is measured as the largest amount of benefit that is greater than 50% likely of being realized upon ultimate resolution with a taxing authority. As the examination process progresses with tax authorities, adjustments to tax reserves may be necessary to reflect taxes payable upon settlement. Tax reserve adjustments related to positions impacting the effective tax rate affect the provision for income taxes. Tax reserve adjustments related to positions impacting the timing of deductions impact deferred tax assets and liabilities.
g. Property, Plant and Equipment, net
Property, plant and equipment are recorded at cost. Refurbishment costs are capitalized in the property accounts, whereas ordinary maintenance and repair costs are expensed as incurred. Depreciation is computed principally by accelerated methods based on the following useful lives:
Buildings and improvements | 3 - 40 years |
Machinery and equipment | 6 - 10 years |
Costs related to software acquired, developed or modified solely to meet the Company's internal requirements and for which there are no substantive plans to market for sale are capitalized. Only costs incurred after the preliminary planning stage of the project and after management has authorized and committed funds to the project are eligible for capitalization.
h. Real Estate Held for Entitlement and Leasing
The Company capitalizes all costs associated with the real estate entitlement and leasing process. The Company classifies activities related to the entitlement, sale, and leasing of its excess real estate assets as operating activities in the consolidated statements of cash flows. Real estate held for entitlement and leasing is included as a component of other noncurrent assets.
i. Goodwill
Goodwill represents the excess of the purchase price of an acquired enterprise or assets over the fair values of the identifiable assets acquired and liabilities assumed. All of the Company's recorded goodwill resides in the Aerospace and Defense reporting unit. Tests for impairment of goodwill are performed on an annual basis, or at any other time if events occur or circumstances indicate that the carrying amount of goodwill may not be recoverable. Circumstances that could trigger an impairment test include but are not limited to: a significant adverse change in the business climate or legal factors; adverse cash flow trends; an adverse action or assessment by a regulator; unanticipated competition; loss of key personnel; decline in stock price; and results of testing for recoverability of a significant asset group within a reporting unit.
The Company evaluates qualitative factors (including macroeconomic conditions, industry and market considerations, cost factors, and overall financial performance) to determine whether it is necessary to perform the first step of the goodwill test. This step is referred to as the “Step Zero" analysis. If it is determined that it is more likely than not (a likelihood of more
56
than 50%) that the fair value of a reporting unit is less than its carrying amount, the Company will proceed to the quantitative (“Step One”) analysis to determine the existence and amount of any goodwill impairment. The Company evaluated goodwill using a “Step Zero" analysis as of October 1, 2017, October 1, 2016, and September 1, 2016 (first day of the Company's fourth quarter), and determined that goodwill was not impaired.
There can be no assurance that the Company’s estimates and assumptions made for purposes of its goodwill impairment testing will prove to be accurate predictions of the future. If the Company’s assumptions and estimates are incorrect, the Company may be required to record goodwill impairment charges in future periods.
During the year ended December 31, 2016, and in connection with the Company's change in fiscal year end, as described in Note 1(a), from November 30 to December 31, the Company changed its annual test of goodwill impairment from September 1 of each year to October 1 of each year. With respect to its annual goodwill testing date, management believes that this voluntary change in accounting method is preferable as it aligns the annual impairment testing date with the Company's long-range planning cycle, the timing of which has changed consistent with the change in the Company's fiscal year end and which is a significant element in the testing process. In connection with this change, the Company first performed an impairment test as of September 1, 2016 and then performed an additional test as of October 1, 2016. This change in annual testing date did not delay, accelerate or avoid an impairment charge.
j. Intangible Assets
Identifiable intangible assets, such as patents, trademarks, and licenses are recorded at cost or when acquired as part of a business combination at estimated fair value. Identifiable intangible assets are amortized based on when they provide the Company economic benefit, or using the straight-line method, over their estimated useful life. Amortization periods for identifiable intangible assets range from 7 years to 30 years.
k. Environmental Remediation
The Company expenses, on a current basis, recurring costs associated with managing hazardous substances and contamination in ongoing operations. The Company accrues for costs associated with the remediation of environmental contamination when it becomes probable that a liability has been incurred, and the amount can be reasonably estimated. In most cases only a range of reasonably possible costs can be estimated. In establishing the Company’s reserves, the most probable estimated amount is used when determinable, and the minimum amount is used when no single amount in the range is more probable. Environmental reserves include the costs of completing remedial investigation and feasibility studies, remedial and corrective actions, regulatory oversight costs, the cost of operation and maintenance of the remedial action plan, and employee compensation costs for employees who are expected to devote a significant amount of time to remediation efforts. Calculation of environmental reserves is based on the evaluation of currently available information with respect to each individual environmental site and considers factors such as existing technology, presently enacted laws and regulations, and prior experience in remediation of contaminated sites. Such estimates are based on the expected costs of investigation and remediation and the likelihood that other potentially responsible parties will be able to fulfill their commitments at sites where the Company may be jointly or severally liable.
At the time a liability is recorded for future environmental costs, the Company records an asset for estimated future recoveries that are estimable and probable. Some of the Company’s environmental costs are eligible for future recovery in the pricing of its products and services to the U.S. government and under existing third party agreements. The Company considers the recovery probable based on the Global Settlement, Northrop Grumman Corporation ("Northrop") Agreement, U.S. government contracting regulations, and its long history of receiving reimbursement for such costs (see Notes 8(c) and 8(d)).
l. Retirement Benefits
The Company's defined benefit pension plan future benefit accrual was discontinued in fiscal 2009. In addition, the Company provides medical and life insurance benefits (“postretirement benefits”) to certain eligible retired employees, with varied coverage by employee group. Annual charges are made for the cost of the plans, including administrative costs, interest costs on benefit obligations, and net amortization and deferrals, increased or reduced by the return on assets. The Company also sponsors a defined contribution 401(k) plan and participation in the plan is available to all employees (see Note 7).
m. Conditional Asset Retirement Obligations
Conditional asset retirement obligations (“CAROs”) are legal obligations associated with the retirement of long-lived assets. These liabilities are initially recorded at fair value and the related asset retirement costs are capitalized by increasing the carrying amount of the related assets by the same amount as the liability. Asset retirement costs are subsequently depreciated over the useful lives of the related assets. Subsequent to initial recognition, the Company records period-to-period changes in the CARO liability resulting from the passage of time and revisions to either the timing or the amount of the estimate of the undiscounted cash flows.
The Company’s estimate of CAROs associated with owned properties relates to estimated costs necessary for the legally required removal or remediation of various regulated materials, primarily asbestos disposal and radiological decontamination of
57
an ordnance manufacturing facility. For leased properties, such obligations relate to the estimated cost of contractually required property restoration.
The changes in the carrying amount of CAROs since November 30, 2014 were as follows (in millions):
Balance as of November 30, 2014 | $ | 24.4 | |
Additions and other, net | 3.0 | ||
Accretion | 1.9 | ||
Balance as of November 30, 2015 | 29.3 | ||
Accretion | 0.2 | ||
Balance as of December 31, 2015 | 29.5 | ||
Additions and other, net | (0.9 | ) | |
Accretion | 2.0 | ||
Balance as of December 31, 2016 | 30.6 | ||
Additions and other, net | 11.2 | ||
Accretion | 2.2 | ||
Balance as of December 31, 2017 | $ | 44.0 | |
n. Advance Payments on Contracts
The Company receives advances from customers which may exceed costs incurred on certain contracts. Such advances or billings in excess of cost and estimated earnings, other than those reflected as a reduction of inventories as progress payments, are classified as current liabilities.
o. Loss Contingencies
The Company is currently involved in certain legal proceedings and has accrued its estimate of the probable costs and recoveries (in relation to environmental costs) for resolution of these claims. These estimates are based upon an analysis of potential results, assuming a combination of litigation and settlement strategies. It is possible, however, that future results of operations or cash flows for any particular period could be materially affected by changes in estimates or the effectiveness of strategies related to these proceedings.
p. Warranties
The Company provides product warranties in conjunction with certain product sales. The majority of the Company’s warranties are a one-year standard warranty for parts, workmanship, and compliance with specifications. On occasion, the Company has made commitments beyond the standard warranty obligation. While the Company has contracts with warranty provisions, there is not a history of any significant warranty claims experience. A reserve for warranty exposure is made on a product by product basis when it is both estimable and probable. These costs are included in the program’s estimate at completion and are expensed in accordance with the Company’s revenue recognition methodology for that particular contract.
q. Revenue Recognition
The Company considers the nature of the individual underlying contract and the type of products and services provided in determining the proper accounting for a particular contract. Each method is applied consistently to all contracts having similar characteristics, as described below.
Under the percentage of completion method, the Company recognizes sales based upon the Company's progress against the contracted performance objectives. Progress is generally measured as costs are incurred (cost-to-cost) or as units are delivered to customers (units-of-delivery) depending on the contractual terms and scope of work of each contract. The Company uses the cost-to-cost measure where the scope of work on contracts principally relates to research and/or development efforts, or the contract is predominantly a development effort with few deliverable units. Under cost-to-cost, the Company recognizes sales as costs are incurred. The Company uses the units-of-delivery measure to recognize sales when contracts require unit deliveries on a frequent and routine basis. Under units-of-delivery, the Company recognizes sales at the contractually agreed upon unit price as units are sold.
For fixed-priced contracts, variance in actual costs from the cost estimates used in determining the fixed price impact the overall profit from the contract. The Company recognizes these variances during the contact performance period. Fixed-priced and cost-reimbursable contracts may provide for variable consideration including awards, incentives, and/or penalties based upon the customer’s assessment of performance against pre-established targets or other criteria. These targets may include factors such as cost, performance, quality, and schedule. The Company recognizes variable consideration over the contract performance period based upon the Company's estimates of performance against the established criteria.
58
In the Company’s Aerospace and Defense segment, recognition of profit on long-term contracts requires the use of assumptions and estimates related to total contract revenue, the total cost at completion and the measurement of progress towards completion. Due to the nature of the programs, developing the estimated total contract revenue and cost at completion requires the use of significant judgment. Estimates are continually evaluated as work progresses and are revised as necessary. Factors that must be considered in estimating the work to be completed include, but are not limited to: labor productivity, the nature and technical complexity of the work to be performed, availability and cost volatility of materials, subcontractor and vendor performance, warranty costs, volume assumptions, anticipated labor agreements, inflationary trends, schedule delays, availability of funding from the customer, and the recoverability of costs incurred outside the original contract included in any estimates to complete. The Company reviews contract performance and cost estimates at least quarterly and more frequently when circumstances significantly change. When a change in estimate is determined to have an impact on contract profit, the Company will record a positive or negative adjustment to the statement of operations. Changes in estimates and assumptions related to the status of certain long-term contracts may have a material effect on the Company’s operating results. The following table summarizes the impact of the change in significant contract accounting estimates on the Company’s Aerospace and Defense segment operating results accounted for under the percentage-of-completion method of accounting:
Year Ended | One month ended | ||||||||||||||
December 31, | December 31, | November 30, | December 31, | ||||||||||||
2017 | 2016 | 2015 | 2015 | ||||||||||||
(In millions, except per share amounts) | |||||||||||||||
Favorable effect of the changes in contract estimates on income (loss) before income taxes | $ | 37.2 | $ | 14.1 | $ | 41.2 | $ | 11.7 | |||||||
Favorable effect of the changes in contract estimates on net (loss) income | 22.3 | 8.5 | 24.7 | 7.0 | |||||||||||
Favorable effect of the changes in contract estimates on basic net (loss) income per share | 0.31 | 0.13 | 0.40 | 0.11 | |||||||||||
Favorable effect of the changes in contract estimates on diluted net (loss) income per share | 0.31 | 0.11 | 0.40 | 0.09 | |||||||||||
The fiscal 2017 favorable changes in contract estimates were primarily driven by improved performance on numerous programs as a result of overhead cost reductions and reduced program risks, most notably on the Terminal High Altitude Area Defense ("THAAD") program, partially offset by cost growth and manufacturing inefficiencies in fiscal 2017 on electric propulsion contracts. The fiscal 2016 favorable changes in contract estimates were primarily driven by improved performance on space launch systems primarily due to affordability initiatives and lower overhead costs, partially offset by cost growth and manufacturing inefficiencies on electric propulsion contracts. The one month ended December 31, 2015 favorable changes in contract estimates were primarily driven by improved performance on tactical and missile defense programs primarily due to affordability initiatives and lower overhead costs, partially offset by cost growth and manufacturing inefficiencies on an electric propulsion contract. The fiscal 2015 favorable changes in contract estimates were primarily due to improved performance on space launch systems and missile defense programs primarily due to affordability initiatives and lower overhead costs, and unexpected favorable contract performance on close-out activities on the J-2X program.
Revenue on service or time and material contracts is recognized when performed.
If at any time expected costs exceed the value of the contract, the loss is recognized immediately.
If change orders are in dispute or are unapproved in regard to both scope and price they are evaluated as claims. The Company recognizes revenue on claims when recovery of the claim is probable and the amount can be reasonably estimated. Revenue on claims is recognized only to the extent that contract costs related to the claims have been incurred and when it is probable that the claim will result in a bona fide addition to contract value that can be reliably estimated. No profit is recognized on a claim until final settlement occurs.
Revenue from real estate asset sales is recognized when a sufficient down-payment has been received, financing has been arranged and title, possession and other attributes of ownership have been transferred to the buyer. The allocation to cost of sales on real estate asset sales is based on a relative fair market value computation of the land sold which includes the basis on the Company’s book value, capitalized entitlement costs, and an estimate of the Company’s continuing financial commitment.
Revenue that is not derived from long-term development and production contracts, or real estate asset transactions, is recognized when persuasive evidence of a final agreement exists, delivery has occurred, the selling price is fixed or determinable and payment from the customer is reasonably assured. Sales are recorded net of provisions for customer pricing allowances.
59
r. Research and Development ("R&D")
Company-sponsored R&D expenses (reported as a component of cost of sales) were $44.6 million, $43.0 million, $74.4 million, and $4.6 million in fiscal 2017, 2016, 2015 and the one month ended December 31, 2015, respectively. Company-sponsored R&D expenses include the costs of technical activities that are useful in developing new products, services, processes, or techniques, as well as expenses for technical activities that may significantly improve existing products or processes. These expenses are generally allocated among all contracts and programs in progress under U.S. government contractual arrangements. From time to time, the Company believes it is in its best interests to self-fund and not allocate costs for certain R&D activities to the U.S. government contracts and the Company had $32.1 million of such costs in fiscal 2015 related to the AR1 engine, see discussion below.
Customer-sponsored R&D expenditures, which are funded from U.S. government contracts, totaled $561.1 million, $513.0 million, $485.8 million, and $33.7 million in fiscal 2017, 2016, 2015, and the one month ended December 31, 2015, respectively. Expenditures under customer-sponsored R&D funded U.S. government contracts are accounted for as sales and cost of products sold.
AR1 Research and Development
Company-sponsored R&D expenses (reported as a component of cost of sales) are generally reimbursed via allocation of such expenses among all contracts and programs in progress under U.S. government contractual arrangements. The newest large liquid booster engine development project, the AR1, accounted for $56.1 million of such reimbursable costs from inception through December 31, 2017. In February 2016, pursuant to an Other Transaction Agreement, the U.S. Air Force selected Aerojet Rocketdyne and United Launch Alliance ("ULA") to share in a public-private partnership to develop jointly the AR1 engine. The total agreement is valued at $804.0 million with the U.S. Air Force investing two-thirds of the funding required to complete development of the AR1 engine by 2019. The work is expected to be completed no later than December 31, 2019, and is being conducted in four phases, with each being an option to progress the project at pre-defined decision points. Through December 31, 2017, the U.S. Air Force has obligated $174.0 million with Aerojet Rocketdyne contributing $77.3 million and ULA contributing $6.1 million in cash and $3.6 million in "in-kind" R&D expenses. On February 1, 2018, the U.S. Air Force authorized phase two of the program, which obligates the U.S. Air Force to an additional $95.5 million and Aerojet Rocketdyne and ULA to an additional $47.8 million. The total potential investment by Aerojet Rocketdyne and its partners, if all options are exercised, is $268.0 million. The U.S. Air Force contributions are recognized proportionately as an offset to R&D expenses. In the event the Company records a receivable for a milestone prior to expending the prospective proportional share to be contributed by the Company, the amount is recorded as an accrued liability until earned. The AR1 inception to date project costs at December 31, 2017, were as follows (in millions):
AR1 R&D costs incurred | $ | 245.6 | |
Less amounts funded by the U.S. Air Force | (147.7 | ) | |
Less amounts funded by ULA | (9.7 | ) | |
AR1 R&D costs net of reimbursements | $ | 88.2 | |
Of the $88.2 million AR1 investment, $32.1 million was expensed and $56.1 million was applied to the Company's contracts.
s. Stock-based Compensation
The Company recognizes stock-based compensation in the statements of operations at the grant-date fair value of stock awards issued to employees and directors over the vesting period. The Company also grants Stock Appreciation Rights (“SARs”) awards which are similar to the Company’s employee stock options, but are settled in cash rather than in shares of common stock, and are classified as liability awards. Compensation cost for these awards is determined using a fair-value method and remeasured at each reporting date until the date of settlement. The Company accounts for forfeitures when they occur for consistency with the U.S. government recovery accounting practice.
t. Impairment or Disposal of Long-Lived Assets
Impairment of long-lived assets is recognized when events or circumstances indicate that the carrying amount of the asset, or related groups of assets, may not be recoverable. Circumstances which could trigger a review include, but are not limited to: significant decreases in the market price of the asset; significant adverse changes in the business climate or legal factors; accumulation of costs significantly in excess of the amount originally expected for the acquisition or construction of the asset; current period cash flow or operating losses combined with a history of losses or a forecast of continuing losses associated with the use of the asset; or a current expectation that the asset will more likely than not be sold or disposed of significantly before the end of its estimated useful life. The carrying amount of a long-lived asset is not recoverable if it exceeds the sum of the undiscounted cash flows expected to result from the use and eventual disposition of the asset. If the Company determines that an asset is not recoverable, then the Company would record an impairment charge if the carrying value of the asset exceeds its fair value.
60
A long-lived asset classified as “held for sale” is initially measured at the lower of its carrying amount or fair value less costs to sell. In the period that the “held for sale” criteria are met, the Company recognizes an impairment charge for any initial adjustment of the long-lived asset amount. Gains or losses not previously recognized resulting from the sale of a long-lived asset are recognized on the date of sale.
As of February 28, 2015, the Company classified approximately 550 acres, known as Hillsborough and representing a portion of the 5,563 acre Easton plan, as assets held for sale as a result of its plans to sell the Hillsborough land. During fiscal 2015, the Company finalized the Hillsborough land sale for a total purchase price of $57.0 million which was comprised of $46.7 million cash and $10.3 million of promissory notes. The total acreage covered by the Hillsborough land transaction was approximately 700 acres, of which approximately 550 acres was recognized as a sale in fiscal 2015. At the initial closing, the buyer paid $40.0 million cash and executed a $9.0 million promissory note secured by a first lien Deed of Trust on a portion of the sale property which resulted in a pre-tax gain of $30.6 million in fiscal 2015. In addition, approximately 150 acres of this land, including a 50-acre portion known as “Area 40,” was held back from the initial closing. Upon receipt of regulatory approvals, a closing will take place for the sale of the developable portions of such holdback acreage for a purchase price of $6.7 million in cash. For operating segment reporting, the Hillsborough land has been reported as a part of the Real Estate segment. A summary of the impact of the land sale on the consolidated statement of operations for fiscal 2015 was as follows (in millions):
Net sales from land sale | $ | 42.0 | |
Cost of sales from land sale | 11.4 | ||
Income before income taxes from land sale | 30.6 | ||
Income tax provision related to land sale | 12.7 | ||
Net income from land sale | $ | 17.9 | |
u. Concentrations
Dependence upon U.S. government programs and contracts
Sales to the U.S. government and its agencies, including sales to the Company’s significant customers discussed below, were as follows:
Percentage of Net Sales | ||
Fiscal 2017 | 92 | % |
Fiscal 2016 | 91 | % |
Fiscal 2015 | 90 | % |
One month ended December 31, 2015 | 85 | % |
The following are percentages of net sales for significant programs, all of which are included in the U.S. government sales and are comprised of multiple contracts.
Year Ended | One month ended | ||||||||||
December 31, | December 31, | November 30, | December 31, | ||||||||
2017 | 2016 | 2015 | 2015 | ||||||||
RS-25 program | 14 | % | 12 | % | 12 | % | 10 | % | |||
Standard Missile program | 9 | 12 | 14 | 12 | |||||||
THAAD program | 9 | 13 | 13 | 13 | |||||||
The demand for certain of the Company’s services and products is directly related to the level of funding of U.S. government programs.
61
Major customers
Customers that represented more than 10% of net sales for the periods presented were as follows:
Year Ended | One month ended | ||||||||||
December 31, | December 31, | November 30, | December 31, | ||||||||
2017 | 2016 | 2015 | 2015 | ||||||||
Lockheed Martin Corporation ("Lockheed Martin") | 24 | % | 27 | % | 29 | % | 24 | % | |||
ULA | 22 | 21 | 19 | 28 | |||||||
Raytheon Company ("Raytheon") | 17 | 20 | 20 | 19 | |||||||
NASA | 17 | 13 | 11 | 10 | |||||||
The Company's sales to each of the major customers listed above involve several product lines and programs.
Credit Risk
Aside from investments held in the Company’s retirement benefit plans, financial instruments that could potentially subject the Company to concentration of credit risk consist primarily of cash, cash equivalents, and trade receivables. The Company’s cash and cash equivalents are held and managed by recognized financial institutions and are subject to the Company’s investment policy. The investment policy outlines minimum acceptable credit ratings for each type of investment and limits the amount of credit exposure to any one security issue. The Company does not believe significant concentration of credit risk exists with respect to these investments.
Customers that represented more than 10% of accounts receivable for the periods presented were as follows:
As of December 31, | |||||
2017 | 2016 | ||||
The Boeing Company ("Boeing") | 35 | % | 13 | % | |
Raytheon | 16 | 17 | |||
Lockheed Martin | 12 | 17 | |||
NASA | 11 | 14 | |||
ULA | 11 | 20 | |||
Dependence on Single Source and Other Third Party Suppliers
The Company uses a significant quantity of raw materials that are highly dependent on market fluctuations and government regulations. Further, as a U.S. government contractor, the Company is often required to procure materials from suppliers capable of meeting rigorous customer and government specifications. As market conditions change for these companies, they often discontinue materials with low sales volumes or profit margins. The Company is often forced to either qualify new materials or pay higher prices to maintain the supply. To date the Company has been successful in establishing replacement materials and securing customer funding to address specific qualification needs of the programs. Prolonged disruptions in the supply of any of the Company’s key raw materials, difficulty qualifying new sources of supply, implementing use of replacement materials or new sources of supply, and/or a continuing volatility in the prices of raw materials could have a material adverse effect on the Company’s operating results, financial condition, and/or cash flows.
Workforce
As of December 31, 2017, 14% of the Company’s employees were covered by collective bargaining agreements.
v. Related Parties
Warren G. Lichtenstein, the Executive Chairman of the Company is also the Executive Chairman of Steel Partners Holdings L.P. (“Steel Holdings”) and the Chief Executive Officer of Steel Partners Ltd. (“SPL”), which entities beneficially own 5.6% and less than 1%, respectively, of the Company’s common stock according to a Schedule 13D/A filed on December 26, 2017 by Steel Holdings, SPL and certain other reporting persons listed therein. The Company received services of $0.6 million, $0.9 million, $1.1 million, and zero in fiscal 2017, 2016, 2015, and the one month ended December 31, 2015, respectively, from Steel Holdings and SPL, which primarily included administrative services and the use of an aircraft for business travel. As of December 31, 2017 and 2016, the Company had liabilities due to such entities of $0.2 million and $0.2 million, respectively.
62
FMR LLC (“FMR”) owned 3% and 13% of the Company’s Common Stock at December 31, 2017 and 2016, respectively. FMR is the parent company of Fidelity Workplace Services, LLC, Fidelity Stock Plan Services, LLC and other Fidelity subsidiaries which provide certain benefit services such as 401(k) plan administration, Health Savings Accounts administration, stock-based compensation administration, and Employee Stock Purchase Plan administration. In addition, certain of the investment alternatives provided through the Company’s 401(k) plan include funds managed by FMR. The Company received services of $0.8 million, $0.3 million, $0.4 million, and zero in fiscal 2017, 2016, 2015, and the one month ended December 31, 2015, respectively, from FMR primarily for employee benefit services. These amounts exclude expenses charged to the Company’s employees by FMR for investment management services. As of December 31, 2017 and 2016, the Company had a payable due to FMR of less than $0.1 million for both periods.
Lucas-Milhaupt, Inc., an indirect wholly-owned subsidiary of Steel Holdings, sold $0.2 million in raw materials to the Company for the manufacture of its products in fiscal 2017.
GAMCO Investors, Inc. (“GAMCO”) owned 12% of the Company's common stock at December 31, 2017 and 2016. The Company received services of $1.1 million, $1.1 million, $1.1 million, and $0.1 million in fiscal 2017, 2016, 2015, and the one month ended December 31, 2015, respectively, from GAMCO for investment management fees of the Company’s defined benefit pension plan assets.
BlackRock, Inc. (“BlackRock”) owned 15% and 12% of the Company's common stock at December 31, 2017 and 2016, respectively. The Company invests in money market funds managed by BlackRock.
The Vanguard Group, Inc. (“Vanguard”) owned 10% of the Company’s common stock at December 31, 2017. Certain of the investment alternatives offered through the Company’s 401(k) plan include funds managed by Vanguard.
w. Accounting Pronouncements
Recently Adopted Accounting Pronouncements
In August 2014, the Financial Accounting Standards Board (“FASB”) issued an amendment to the accounting guidance related to the evaluation of an entity's ability to continue as a going concern. The amendment establishes management’s responsibility to evaluate whether there is substantial doubt about an entity’s ability to continue as a going concern in connection with preparing financial statements for each annual and interim reporting period. The update also gives guidance to determine whether to disclose information about relevant conditions and events when there is substantial doubt about an entity’s ability to continue as a going concern. The Company adopted this guidance as of December 31, 2016 and no additional information was required to be presented as a result of the adoption. As such, the new standard did not have an impact on the Company's financial position, results of operations, or cash flows.
In November 2015, the FASB issued guidance that requires deferred tax liabilities and assets to be classified as noncurrent in the consolidated balance sheet. The standard is effective for financial statements issued for annual periods beginning after December 15, 2016, and interim periods within those annual periods. Early adoption is permitted for financial statements that have not been previously issued. The Company adopted this guidance retrospectively to all periods presented as of December 31, 2016, which resulted in $36.5 million of current deferred income taxes as of December 31, 2015, being reclassified as noncurrent. As the accounting standard only impacted presentation, the new standard did not have an impact on the Company's financial position, results of operations, or cash flows.
In March 2016, the FASB amended the existing accounting guidance related to stock compensation. The amendment requires all income tax effects of awards to be recognized in the income statement when awards vest and allows a choice to account for forfeitures on an estimated or actual basis. There is also a requirement to present excess income tax benefits as an operating activity on the statement of cash flows. Effective January 1, 2017, the Company adopted the amendment requiring recognition of excess tax benefits and tax deficiencies in the income statement prospectively. In addition, the Company elected to change its accounting policy to account for forfeitures when they occur for consistency with the U.S. government recovery accounting practices on a modified retrospective basis. The Company also elected to adopt the amendment related to the presentation of excess tax benefits within operating activities on the statement of cash flows, retrospectively.
In January 2017, the FASB issued an amendment to the accounting guidance related to goodwill impairment. The update eliminates "Step 2" which involves determining the implied fair value of goodwill and comparing it to the carrying amount of goodwill to measure the goodwill impairment loss, if any. The quantitative assessment "Step 1" will be used to determine both the existence and amount of goodwill impairment. The standard should be applied on a prospective basis and is effective for annual or any interim goodwill impairment tests in fiscal years beginning after December 15, 2019, with early adoption permitted. The Company adopted this new accounting guidance in conjunction with its annual impairment test on October 1, 2017. The adoption did not have an impact on the Company's financial position, results of operations, or cash flows.
In August 2016, the FASB issued an amendment to the accounting guidance related to classification of certain cash receipts and cash payments in the statement of cash flows. The standard provides guidance for eight targeted changes with respect to how cash receipts and cash payments are classified in the statement of cash flows, with the objective of reducing
63
diversity in practice. The Company adopted this new accounting guidance on December 31, 2017. The adoption did not have an impact on the Company's financial position, results of operations, or cash flows.
In November 2016, the FASB issued an amendment to the accounting guidance for the presentation of restricted cash in the statement of cash flows. The new guidance requires that the statement of cash flows explain the difference during the period in total cash, cash equivalents, and restricted cash. Also, when cash, cash equivalents, and restricted cash are presented on more than one line item within the statement of financial position, a reconciliation of those line items to the total cash, cash equivalents, and restricted cash presented on the statement of cash flows must be disclosed. The Company adopted this new accounting guidance on December 31, 2017. The adoption did not have an impact on the Company's financial position, results of operations, or cash flows.
On December 22, 2017, Staff Accounting Bulletin No. 118 ("SAB 118") was issued to address the application of U.S. GAAP in situations when a registrant does not have the necessary information available, prepared, or analyzed in reasonable detail to complete the accounting for certain income tax effects of the Tax Cuts and Jobs Act ("Tax Act"). In accordance with SAB 118, we have recorded $64.6 million of deferred tax expense in connection with the remeasurement of certain deferred tax assets and liabilities. The Company does not expect any additional material adjustments; however, since the Tax Act was passed late in the fourth quarter of fiscal 2017 and ongoing guidance and accounting interpretation is expected over the next several months, it is reasonably possible that additional adjustments will be required during the one year measurement period.
Recently Issued Accounting Pronouncements
In May 2014, the FASB amended the existing accounting standards for revenue recognition. The amendments are based on the principle that revenue should be recognized to depict the transfer of promised goods or services to customers in an amount that reflects the consideration to which the entity expects to be entitled in exchange for those goods or services. The effective date of the new standard is for fiscal years beginning after December 15, 2017, and interim periods within those fiscal years. The amendments may be applied retrospectively to each prior period presented or retrospectively with the cumulative effect recognized as of the date of initial application (modified retrospective method). The Company plans to adopt the guidance during the first quarter of fiscal 2018 using the modified retrospective method. The Company has developed a comprehensive implementation plan across all segments that include evaluating the impact of the new guidance on existing contracts, and updating impacted accounting policies, processes, controls and systems. The Company expects the primary impact of the new guidance will be a change in the timing of when revenue is recognized on certain fixed price and cost reimbursable type contracts. The new guidance prescribes that an entity recognizes revenue when (or as) it satisfies a performance obligation by transferring a promised good or service to a customer. A good or service is transferred when (or as) the customer obtains control of that asset. Under this new guidance, the Company expects to discontinue the use of the units-of-delivery measure on certain customer contracts and remeasure progress toward completion using the cost-to-cost method. The units-of-delivery method totaled 48% of net sales for fiscal 2017. The Company expects the adoption of this new standard will have a material impact on net sales and operating results recognized in any given fiscal year and a material impact on the amount reported for contract backlog. The adoption will also result in the reclassification of certain contract related assets and liabilities on the consolidated balance sheet.
In February 2016, the FASB issued guidance requiring lessees to recognize a right-of-use asset and a lease liability on the balance sheet for all leases with the exception of short-term leases. For lessees, leases will continue to be classified as either operating or finance leases in the income statement. Lessor accounting is similar to the current model but updated to align with certain changes to the lessee model. Lessors will continue to classify leases as operating, direct financing or sales-type leases. The effective date of the new standard is for fiscal years beginning after December 15, 2018, and interim periods within those fiscal years. Early adoption is permitted. The new standard must be adopted using a modified retrospective transition method and requires application of the new guidance at the beginning of the earliest comparative period presented. The Company is evaluating the impact of adopting this new accounting guidance on its financial position, results of operations, or cash flows.
In March 2017, the FASB amended the existing accounting guidance relating to the presentation of net periodic pension cost and net periodic postretirement benefit cost ( the “NPPC”) in the income statement. The amended guidance requires the service cost component to be presented in the same line item or items as other compensation arising from the services rendered by the pertinent employees during the period, and other components of the NPPC to be presented in the statement of operations separately from service cost components and outside a subtotal of income from operations. If a separate line item or items are used to present the other components of the NPPC, that line item or items must be appropriately described. If a separate line item or items are not used, the line item or items used in the statement of operations to present the other components of NPPC must be disclosed. The new guidance is effective for financial statements issued for fiscal years beginning after December 15, 2017, including interim periods within those fiscal years. The Company plans to adopt this new accounting guidance in the first quarter of fiscal 2018. The Company expects the adoption to result in an increase in operating income of $73.2 million and $68.9 million for fiscal 2017 and 2016, respectively, and a corresponding increase in total non-operating expense, net for each fiscal year. The Company does not expect any impact to segment performance, net (loss) income, or cash flows as a result of the adoption.
64
In February 2018, the FASB issued guidance that permits the reclassification of the income tax effects of the 2017 Tax Cuts and Jobs Act on items within accumulated other comprehensive loss to accumulated deficit. The FASB refers to these amounts as "stranded tax effects." The amended guidance also requires certain new disclosures. The new guidance is effective for financial statements issued for fiscal years beginning after December 15, 2018, including interim periods within those fiscal years. The Company is evaluating the impact of adopting this new accounting guidance on its financial position, results of operations, or cash flows.
Note 2. (Loss) Income Per Share of Common Stock
A reconciliation of the numerator and denominator used to calculate basic and diluted (loss) income per share of common stock ("EPS"):
Year Ended | One month ended | ||||||||||||||
December 31, | December 31, | November 30, | December 31, | ||||||||||||
2017 | 2016 | 2015 | 2015 | ||||||||||||
(In millions, except per share amounts) | |||||||||||||||
Numerator: | |||||||||||||||
Net (loss) income | $ | (9.2 | ) | $ | 18.0 | $ | (16.2 | ) | $ | 7.0 | |||||
Income allocated to participating securities | — | (0.4 | ) | — | (0.2 | ) | |||||||||
Net (loss) income for basic EPS | (9.2 | ) | 17.6 | (16.2 | ) | 6.8 | |||||||||
Interest on 4 1/16% Debentures | — | — | — | 0.3 | |||||||||||
Net (loss) income for diluted EPS | $ | (9.2 | ) | $ | 17.6 | $ | (16.2 | ) | $ | 7.1 | |||||
Denominator: | |||||||||||||||
Basic weighted average shares | 73.0 | 65.6 | 61.1 | 62.9 | |||||||||||
Effect of: | |||||||||||||||
4 1/16% Debentures | — | — | — | 9.4 | |||||||||||
Employee stock options and stock purchase plan | — | 0.1 | — | 0.2 | |||||||||||
Diluted weighted average shares | 73.0 | 65.7 | 61.1 | 72.5 | |||||||||||
Basic: | |||||||||||||||
Net (loss) income per share | $ | (0.13 | ) | $ | 0.27 | $ | (0.27 | ) | $ | 0.11 | |||||
Diluted: | |||||||||||||||
Net (loss) income per share | $ | (0.13 | ) | $ | 0.27 | $ | (0.27 | ) | $ | 0.10 | |||||
The following table sets forth the potentially dilutive securities excluded from the computation because their effect would have been anti-dilutive:
Year Ended | One month ended | ||||||||||
December 31, | December 31, | November 30, | December 31, | ||||||||
2017 | 2016 | 2015 | 2015 | ||||||||
(In millions) | |||||||||||
4 1/16% Debentures | 0.1 | 7.1 | 11.0 | — | |||||||
Employee stock options and stock purchase plan | 0.1 | — | 0.2 | — | |||||||
Unvested restricted shares | 1.6 | 1.6 | 1.6 | 1.3 | |||||||
Total potentially dilutive securities | 1.8 | 8.7 | 12.8 | 1.3 | |||||||
The Company's 2 1/4% Notes were not included in the computation of diluted EPS for fiscal 2017 and 2016 because the average market price of the common stock did not exceed the conversion price and the Company only expects the conversion premium for the 2 1/4% Notes to be settled in common shares.
65
Note 3. Balance Sheet Accounts and Supplemental Disclosures
a. Marketable Securities
As of December 31, 2017, the Company's short-term available-for-sale investments were as follows:
Amortized Cost | Gross Unrealized Gains | Gross Unrealized Losses | Estimated Fair Value | ||||||||||||
(In millions) | |||||||||||||||
Commercial paper | $ | 135.6 | $ | — | $ | — | $ | 135.6 | |||||||
U.S. treasury notes | 4.1 | — | — | 4.1 | |||||||||||
Marketable securities | $ | 139.7 | $ | — | $ | — | $ | 139.7 | |||||||
As of December 31, 2017, of the total estimated fair value, $119.7 million was classified as cash and cash equivalents as the remaining maturity at date of purchase was less than three months, and $20.0 million was classified as marketable securities. At December 31, 2017, the contractual maturities of the Company’s available-for-sale marketable securities were less than one year.
b. Accounts Receivable
As of December 31, | |||||||
2017 | 2016 | ||||||
(In millions) | |||||||
Billed | $ | 62.1 | $ | 55.7 | |||
Unbilled | 195.5 | 124.1 | |||||
Reserve for overhead rate disallowance | (42.8 | ) | (44.5 | ) | |||
Total receivables under long-term contracts | 214.8 | 135.3 | |||||
Other receivables | 0.7 | 1.1 | |||||
Accounts receivable | $ | 215.5 | $ | 136.4 | |||
The gross unbilled receivable amounts as of December 31, 2017 expected to be collected after one year are $113.7 million.
c. Inventories
As of December 31, | |||||||
2017 | 2016 | ||||||
(In millions) | |||||||
Long-term contracts at average cost | $ | 562.3 | $ | 551.9 | |||
Progress payments | (427.1 | ) | (368.2 | ) | |||
Total long-term contract inventories | 135.2 | 183.7 | |||||
Total other inventories | 1.2 | 1.4 | |||||
Inventories | $ | 136.4 | $ | 185.1 | |||
Long-term contract inventories included an allocation of general and administrative costs incurred throughout fiscal 2017 and 2016 amounting to $238.4 million and $257.4 million, respectively, and the cumulative amount of general and administrative costs in long-term contract inventories is estimated to be $11.4 million and $21.1 million as of December 31, 2017 and 2016, respectively.
66
d. Other Current Assets, net
As of December 31, | |||||||
2017 | 2016 | ||||||
(In millions) | |||||||
Recoverable from the U.S. government for acquisition integration costs | $ | 10.9 | $ | 11.9 | |||
Recoverable from the U.S. government and other third parties for environmental remediation costs | 25.6 | 25.2 | |||||
Receivable from Northrop for environmental remediation costs | 6.0 | 6.0 | |||||
Prepaid expenses | 19.2 | 16.5 | |||||
Cost-share and other receivables, net | 7.5 | 17.8 | |||||
Recoverable from the U.S. government for competitive improvement program obligations | 14.9 | 7.6 | |||||
Income tax receivable | 20.5 | 26.8 | |||||
Other | 5.2 | 11.1 | |||||
Other current assets, net | $ | 109.8 | $ | 122.9 | |||
e. Property, Plant and Equipment, net
As of December 31, | |||||||
2017 | 2016 | ||||||
(In millions) | |||||||
Land | $ | 71.2 | $ | 71.4 | |||
Buildings and improvements | 368.3 | 345.1 | |||||
Machinery and equipment | 493.2 | 499.9 | |||||
Construction-in-progress | 30.3 | 30.4 | |||||
963.0 | 946.8 | ||||||
Less: accumulated depreciation | (604.0 | ) | (580.8 | ) | |||
Property, plant and equipment, net | $ | 359.0 | $ | 366.0 | |||
Depreciation expense for fiscal 2017, 2016, 2015, and one month ended December 31, 2015 was $56.7 million, $49.6 million, $49.8 million, and $3.8 million, respectively. The Company had $2.9 million of non-cash property, plant and equipment additions as of December 31, 2017.
f. Goodwill.
The goodwill balance as of December 31, 2017 and 2016 relates to the Company’s Aerospace and Defense segment. The change of $3.2 million in the carrying amount of goodwill since December 31, 2015 was due to the Coleman Aerospace acquisition in fiscal 2017 (see Note 4).
g. Intangible Assets
As of December 31, 2017 | |||||||||||
Gross Carrying Amount | Accumulated Amortization | Net Carrying Amount | |||||||||
(In millions) | |||||||||||
Customer related | $ | 87.2 | $ | 46.9 | $ | 40.3 | |||||
Intellectual property\trade secrets | 34.2 | 11.8 | 22.4 | ||||||||
Trade name | 21.0 | 3.1 | 17.9 | ||||||||
Acquired technology | 19.2 | 14.3 | 4.9 | ||||||||
Intangible assets | $ | 161.6 | $ | 76.1 | $ | 85.5 | |||||
67
As of December 31, 2016 | |||||||||||
Gross Carrying Amount | Accumulated Amortization | Net Carrying Amount | |||||||||
(In millions) | |||||||||||
Customer related | $ | 83.8 | $ | 37.4 | $ | 46.4 | |||||
Intellectual property\trade secrets | 34.2 | 9.2 | 25.0 | ||||||||
Non-compete agreements | 0.5 | 0.5 | — | ||||||||
Trade name | 20.5 | 2.4 | 18.1 | ||||||||
Acquired technology | 18.3 | 13.4 | 4.9 | ||||||||
Intangible assets | $ | 157.3 | $ | 62.9 | $ | 94.4 | |||||
Amortization expense related to intangible assets was $13.7 million, $13.3 million, $13.4 million, and $1.1 million in fiscal 2017, 2016, 2015, and one month ended December 31, 2015, respectively.
Future amortization expense for the five succeeding years is estimated to be as follows:
Year Ending December 31, | Future Amortization Expense | ||
(In millions) | |||
2018 | $ | 13.7 | |
2019 | 13.6 | ||
2020 | 13.4 | ||
2021 | 9.9 | ||
2022 | 6.6 | ||
$ | 57.2 | ||
h. Other Noncurrent Assets, net
As of December 31, | |||||||
2017 | 2016 | ||||||
(In millions) | |||||||
Real estate held for entitlement and leasing | $ | 94.0 | $ | 91.8 | |||
Receivable from Northrop for environmental remediation costs | 58.5 | 62.0 | |||||
Recoverable from the U.S. government for acquisition integration costs | — | 10.9 | |||||
Recoverable from the U.S. government for conditional asset retirement obligations | 22.7 | 20.3 | |||||
Recoverable from the U.S. government for competitive improvement program obligations | 18.4 | 1.3 | |||||
Recoverable from the U.S. government for restructuring costs | 25.5 | 12.8 | |||||
Grantor trust | 24.2 | 16.6 | |||||
Note receivable, net | 9.0 | 9.0 | |||||
Income tax receivable | — | 10.8 | |||||
Other | 7.0 | 8.5 | |||||
Other noncurrent assets, net | $ | 259.3 | $ | 244.0 | |||
68
i. Other Current Liabilities
As of December 31, | |||||||
2017 | 2016 | ||||||
(In millions) | |||||||
Accrued compensation and employee benefits | $ | 113.4 | $ | 105.7 | |||
Contract related liabilities | 41.7 | 24.7 | |||||
Income taxes | 0.8 | 2.1 | |||||
Competitive improvement program obligations | 15.0 | 7.6 | |||||
Postretirement medical and life insurance benefits | 4.8 | 5.2 | |||||
Interest payable | 0.6 | 4.1 | |||||
Contract loss provisions | 3.8 | 6.8 | |||||
Other | 15.8 | 16.8 | |||||
Other current liabilities | $ | 195.9 | $ | 173.0 | |||
j. Other Noncurrent Liabilities
As of December 31, | |||||||
2017 | 2016 | ||||||
(In millions) | |||||||
Conditional asset retirement obligations | $ | 44.0 | $ | 30.6 | |||
Pension benefits, non-qualified | 17.6 | 17.5 | |||||
Deferred compensation | 29.4 | 19.8 | |||||
Deferred revenue | 12.7 | 13.3 | |||||
Postretirement medical and life insurance benefits | 32.7 | 37.4 | |||||
Competitive improvement program obligations | 18.4 | 1.3 | |||||
Uncertain income tax positions | 2.8 | 28.4 | |||||
Other | 13.5 | 13.1 | |||||
Other noncurrent liabilities | $ | 171.1 | $ | 161.4 | |||
k. Accumulated Other Comprehensive Loss, Net of Income Taxes
Changes in accumulated other comprehensive loss by components, net of income taxes:
Actuarial Losses, Net | Prior Service Credits, Net | Total | |||||||||
(In millions) | |||||||||||
November 30, 2015 | $ | (342.6 | ) | $ | 0.9 | $ | (341.7 | ) | |||
Actuarial losses arising during the period, net of income taxes | (8.6 | ) | — | (8.6 | ) | ||||||
Amortization of actuarial losses and prior service credits, net of income taxes | 3.4 | (0.1 | ) | 3.3 | |||||||
December 31, 2015 | (347.8 | ) | 0.8 | (347.0 | ) | ||||||
Actuarial gains arising during the period, net of income taxes | 7.5 | — | 7.5 | ||||||||
Amortization of actuarial losses and prior service credits, net of income taxes | 37.1 | (0.6 | ) | 36.5 | |||||||
December 31, 2016 | (303.2 | ) | 0.2 | (303.0 | ) | ||||||
Actuarial losses arising during the period, net of income taxes | (8.5 | ) | — | (8.5 | ) | ||||||
Amortization of actuarial losses and prior service credits, net of income taxes | 39.0 | (0.1 | ) | 38.9 | |||||||
December 31, 2017 | $ | (272.7 | ) | $ | 0.1 | $ | (272.6 | ) | |||
69
The estimated amounts that will be amortized from accumulated other comprehensive loss into net periodic benefit expense in fiscal 2018:
Pension Benefits | Medical and Life Insurance Benefits | ||||||
(In millions) | |||||||
Actuarial losses (gains), net | $ | 70.7 | $ | (3.7 | ) | ||
Prior service costs (credits), net | 0.1 | (0.2 | ) | ||||
$ | 70.8 | $ | (3.9 | ) | |||
l. Redeemable Common Stock
The Company inadvertently failed to register with the Securities Exchange Commission ("SEC") the issuance of certain of its common shares in its defined contribution 401(k) employee benefit plan (the “Plan”). As a result, certain Plan participants who purchased such securities pursuant to the Plan may have had the right to rescind certain of their purchases for consideration equal to the purchase price paid for the securities (or if such security has been sold, to receive consideration with respect to any loss incurred on such sale) plus interest from the date of purchase. In June 2008, the Company filed a registration statement on Form S-8 to register future transactions in the Company's stock fund in the Plan.
On May 30, 2017, the Company made a registered rescission offer to buy back unregistered shares from eligible Plan participants at the original purchase price plus interest, or to reimburse eligible Plan participants for losses they may have incurred if their shares had been sold. The registered rescission offer expired on June 30, 2017, and settlement payments of $3.5 million under the offer were completed in the third quarter of fiscal 2017 (see Note 13).
Note 4. Acquisition
On February 24, 2017, the Company closed on an agreement to purchase substantially all of the assets of Coleman Aerospace, a systems engineering and integration provider, from L3 Technologies, Inc. ("L3"). Coleman Aerospace operates now as a subsidiary of Aerojet Rocketdyne and was renamed Aerojet Rocketdyne Coleman Aerospace, Inc. ("Coleman"). The acquisition builds upon and expands the Company’s capabilities in mission analysis and systems engineering, and increases its product portfolio to include vehicle integration for small-, medium- and intermediate-range ballistic missile targets and other small launch vehicles.
The aggregate consideration paid to L3 for the purchase of Coleman was $17.0 million, which included $15.0 million of cash paid at closing and a $2.0 million working capital adjustment paid in the third quarter of fiscal 2017. The Company incurred $1.0 million of expenses related to the acquisition of Coleman.
The preliminary purchase price allocation has been developed based on preliminary estimates of the fair value of the assets and liabilities of Coleman that the Company acquired. In addition, the allocation of the preliminary purchase price to acquired intangible assets is based on preliminary fair value estimates.
The following table summarizes the estimated fair values of the assets acquired and liabilities assumed at the acquisition date (in millions):
Current assets | $ | 12.0 | |
Property, plant and equipment | 1.9 | ||
Total tangible assets acquired | 13.9 | ||
Intangible assets acquired | 4.8 | ||
Deferred income taxes | 0.3 | ||
Total assets acquired | 19.0 | ||
Liabilities assumed, current | (5.2 | ) | |
Total identifiable net assets acquired | 13.8 | ||
Goodwill (Consideration less total identifiable net assets acquired) | $ | 3.2 | |
The purchase price allocation resulted in the recognition of $3.2 million in goodwill, all of which is deductible for tax purposes and included within the Company’s Aerospace and Defense segment. Goodwill recognized from the acquisition primarily relates to the expected contributions of Coleman to the Company’s overall corporate strategy.
The estimated fair value of Coleman's intangible assets acquired included the following:
70
Gross Carrying Amount (in millions) | Amortization Period (years) | |||
Trade name | $ | 0.5 | 8 | |
Customer related | 3.4 | 7 | ||
Acquired technology | 0.9 | 10 | ||
Total intangible assets | $ | 4.8 | ||
The acquisition of Coleman was not considered a significant business combination.
Note 5. Income Taxes
The Company files a consolidated U.S. federal income tax return with its wholly-owned subsidiaries. The components of the Company’s income tax provision:
Year Ended | One month ended | ||||||||||||||
December 31, | December 31, | November 30, | December 31, | ||||||||||||
2017 | 2016 | 2015 | 2015 | ||||||||||||
(In millions) | |||||||||||||||
Current | |||||||||||||||
U.S. federal | $ | (30.6 | ) | $ | 3.2 | $ | 33.0 | $ | 7.9 | ||||||
State and local | 1.0 | 3.2 | 3.4 | 1.2 | |||||||||||
(29.6 | ) | 6.4 | 36.4 | 9.1 | |||||||||||
Deferred | |||||||||||||||
U.S. federal | 116.0 | 2.8 | (41.2 | ) | (6.2 | ) | |||||||||
State and local | 9.7 | 2.0 | 5.1 | (0.9 | ) | ||||||||||
125.7 | 4.8 | (36.1 | ) | (7.1 | ) | ||||||||||
Income tax provision | $ | 96.1 | $ | 11.2 | $ | 0.3 | $ | 2.0 | |||||||
The following table shows the reconciling items between the income tax provision using the U.S. federal statutory rate and the Company's reported income tax provision.
Year Ended | One month ended | ||||||||||||||
December 31, | December 31, | November 30, | December 31, | ||||||||||||
2017 | 2016 | 2015 | 2015 | ||||||||||||
Statutory U.S. federal income tax - provision (benefit) | $ | 30.4 | $ | 10.2 | $ | (5.6 | ) | $ | 3.1 | ||||||
State income taxes | 7.0 | 3.2 | 5.9 | 0.4 | |||||||||||
Reserve adjustments | (4.6 | ) | (0.3 | ) | 0.4 | — | |||||||||
Non-deductible convertible subordinated notes interest | — | 0.8 | 1.4 | 0.1 | |||||||||||
R&D credits | (1.2 | ) | (4.1 | ) | — | (0.2 | ) | ||||||||
Retroactive change in federal tax law | — | — | (1.9 | ) | (1.7 | ) | |||||||||
Benefit of manufacturing deductions | — | 0.5 | (1.0 | ) | (0.6 | ) | |||||||||
Lobbying costs | 0.7 | 0.8 | 0.6 | — | |||||||||||
Deferred tax adjustment | (0.1 | ) | (0.4 | ) | — | 0.7 | |||||||||
Stock compensation excess tax benefits | (1.4 | ) | — | — | — | ||||||||||
Other, net | 0.7 | 0.5 | 0.5 | 0.2 | |||||||||||
New legislation - tax rate changes | 64.6 | — | — | — | |||||||||||
Income tax provision | $ | 96.1 | $ | 11.2 | $ | 0.3 | $ | 2.0 | |||||||
71
A reconciliation of the U.S. federal statutory income tax rate to the Company’s effective income tax rate on earnings in percentages was as follows:
Year Ended | One month ended | ||||||||||
December 31, | December 31, | November 30, | December 31, | ||||||||
2017 | 2016 | 2015 | 2015 | ||||||||
Statutory U.S. federal income tax rate | 35.0 | % | 35.0 | % | (35.0 | )% | 35.0 | % | |||
State income taxes | 8.0 | 11.0 | 35.2 | 4.9 | |||||||
Reserve adjustments | (5.3 | ) | (1.0 | ) | 2.2 | (0.3 | ) | ||||
Non-deductible convertible subordinated notes interest | — | 2.7 | 8.0 | 1.2 | |||||||
R&D credits | (1.4 | ) | (14.0 | ) | — | (2.8 | ) | ||||
Retroactive change in federal tax law | — | — | (11.6 | ) | (19.4 | ) | |||||
Benefit of manufacturing deductions | — | 1.7 | (5.8 | ) | (7.0 | ) | |||||
Lobbying costs | 0.8 | 2.7 | 3.6 | 0.4 | |||||||
Deferred tax adjustment | (0.1 | ) | (1.4 | ) | — | 7.8 | |||||
Stock compensation excess tax benefits | (1.6 | ) | — | — | — | ||||||
Other, net | 0.8 | 1.7 | 5.3 | 2.4 | |||||||
New legislation - tax rate changes | 74.4 | — | — | — | |||||||
Effective income tax rate | 110.6 | % | 38.4 | % | 1.9 | % | 22.2 | % | |||
In fiscal 2017, the Company’s effective tax rate was an income tax expense of 110.6% on pre-tax income of $86.9 million. The Company’s effective tax rate differed from the 35.0% statutory federal income tax rate primarily due to the change in the federal statutory tax rate from 35% to 21% under the recently enacted comprehensive tax legislation commonly referred to as the Tax Cuts and Jobs Act (the “Tax Act”). In accordance with the rate reduction, the Company wrote down its net deferred tax assets by $64.6 million which unfavorably affected the effective tax rate by 74.4%. The effective tax rate also includes an increase from state income taxes partially offset by favorable adjustments to the Company's uncertain tax positions and R&D credits.
In fiscal 2016, the Company’s effective tax rate was an income tax expense of 38.4% on pre-tax income of $29.2 million. The Company’s effective tax rate differed from the 35.0% statutory federal income tax rate due largely to state income taxes and certain expenditures which are permanently not deductible for tax purposes, partially offset by the impact of R&D credits.
In fiscal 2015, the Company’s effective tax rate was an income tax expense of 1.9% on a pre-tax loss of $15.9 million. The Company’s effective tax rate differed from the 35.0% statutory federal income tax rate due largely to state income taxes and certain non-deductible interest expense partially offset by the retroactive reinstatement of the federal R&D credit and benefits allowed by Section 199 of the Internal Revenue Service ("IRS") code allowed to manufacturers.
In the one month ended December 31, 2015, the Company’s effective tax rate was an income tax expense of 22.2% on pre-tax income of $9.0 million. The Company’s effective tax rate differed from the 35% statutory federal income tax rate primarily due to the re-enactment of the federal R&D credit in December 2015 for calendar year 2015 which has been treated as a discrete event for the December 2015 one-month period, as well as impacts from state income taxes, benefits allowed by Section 199 of the IRS code allowed to manufacturers, and R&D credits.
The timing of recording or releasing a valuation allowance requires significant management judgment. The amount of the valuation allowance released by the Company represents a portion of deferred tax assets that was deemed more-likely-than-not that the Company will realize the benefits based on the analysis in which the positive evidence outweighed the negative evidence.
A valuation allowance is required when it is more-likely-than-not that all or a portion of deferred tax assets may not be realized. Establishment and removal of a valuation allowance requires management to consider all positive and negative evidence and to make a judgmental decision regarding the amount of valuation allowance required as of a reporting date. The weight given to the evidence is commensurate with the extent to which it can be objectively verified. In the evaluation as of December 31, 2017, management has considered all available evidence, both positive and negative, including but not limited to the following:
Positive evidence
• | The Company is in a three year cumulative income position as of December 31, 2017; |
• | Positive operating results before income taxes for fiscal 2017; |
72
• | Eligibility of some of the Company’s environmental costs for future recovery in the pricing of its products and services to the U.S. government and under existing third party agreements; |
• | Establishment and execution of the Competitive Improvement Program evidencing increasing growth and profitability; and |
• | Increase in the Company’s contract backlog. |
Negative evidence
• | The Company’s exposure to environmental remediation obligations and the related uncertainty as to the ultimate exposure upon settlement; and |
• | The significance of the Company’s defined benefit pension obligation and related impact it could have in future years. |
As of December 31, 2017, management believes that the weight of the positive evidence outweighed the negative evidence regarding the realization of the net deferred tax assets. Management will continue to evaluate the ability to realize the Company’s net deferred tax assets and the remaining valuation allowance on a quarterly basis.
The Company is routinely examined by domestic and foreign tax authorities. While it is difficult to predict the outcome or timing of a particular tax matter, the Company believes it has adequately provided reserves for any reasonable foreseeable outcome related to these matters.
Tax returns for the years ended November 30, 2014 through December 31, 2016 remain open to examination for U.S. federal tax jurisdiction. Tax returns for the years ended November 30, 2013 through December 31, 2016 remain open to examination for state income tax jurisdictions.
A reconciliation of the beginning and ending amount of unrecognized tax benefits consisted of the following:
Year Ended | One month ended | ||||||||||||||
December 31, | December 31, | November 30, | December 31, | ||||||||||||
2017 | 2016 | 2015 | 2015 | ||||||||||||
(In millions) | |||||||||||||||
Balances at beginning of fiscal year | $ | 29.5 | $ | 7.1 | $ | 6.8 | $ | 6.7 | |||||||
Increases based on tax positions in prior years | 1.0 | 25.8 | 1.0 | 0.6 | |||||||||||
Decreases based on tax position in prior years | (25.1 | ) | (1.2 | ) | (1.8 | ) | (0.2 | ) | |||||||
Increases based on tax positions in current year | 0.4 | 0.7 | 0.7 | — | |||||||||||
Lapse of statute of limitations | (1.4 | ) | (2.9 | ) | — | — | |||||||||
Balances at end of fiscal year | $ | 4.4 | $ | 29.5 | $ | 6.7 | $ | 7.1 | |||||||
As of December 31, 2017, the total amount of unrecognized tax benefits is $4.4 million. Of the $4.4 million of unrecognized tax benefits, $4.2 million would affect the effective tax rate. The Company recognizes interest and penalties related to uncertain tax positions in income tax expense. As of December 31, 2017, the Company’s accrued interest and penalties related to uncertain tax positions was $0.3 million. It is reasonably possible that a reduction of up to $0.5 million of unrecognized tax benefits and related interest and penalties may occur within the next 12 months as a result of the expiration of certain statutes of limitations.
Deferred Income Taxes
Deferred income taxes reflect the net tax effects of temporary differences between the carrying amounts of the Company’s assets and liabilities for financial reporting and income tax purposes. Deferred tax assets and liabilities are determined by multiplying such differences by the enacted tax rates expected to be in effect when such differences are recovered or settled. In December 2017, as a result of the Tax Act, the Company remeasured its federal deferred tax assets and liabilities from 35% to 21%.
73
Deferred tax assets and liabilities were as follows:
As of December 31, | |||||||
2017 | 2016 | ||||||
(In millions) | |||||||
Deferred Tax Assets | |||||||
Accrued estimated costs | $ | 56.1 | $ | 82.0 | |||
Basis difference in assets and liabilities | 2.1 | 8.5 | |||||
Tax losses and credit carryforwards | 12.9 | 6.5 | |||||
Net cumulative defined benefit pension plan losses | 114.7 | 212.9 | |||||
Retiree medical and life insurance benefits | 9.2 | 16.2 | |||||
Valuation allowance | (1.7 | ) | (1.7 | ) | |||
Total deferred tax assets | 193.3 | 324.4 | |||||
Deferred Tax Liabilities | |||||||
Revenue recognition differences | 40.4 | 21.7 | |||||
Basis differences in intangible assets | 7.1 | 10.2 | |||||
Total deferred tax liabilities | 47.5 | 31.9 | |||||
Total net deferred tax assets | $ | 145.8 | $ | 292.5 | |||
Realization of deferred tax assets is primarily dependent on generating sufficient taxable income in future periods. The Company believes it is more-likely-than not its deferred tax assets, net of valuation allowances, will be realized. The Company’s valuation allowance of $1.7 million remained unchanged from prior year. The changes in the Company's valuation allowance by period was as follows:
Balance at Beginning of Period | Tax Valuation Allowance Charged to Income Tax Provision | Tax Valuation Allowance Credited to Income Tax Provision | Balance at End of Period | |||||||||
(In millions) | ||||||||||||
Fiscal 2017 | $ | 1.7 | $ | — | $ | — | $ | 1.7 | ||||
Fiscal 2016 | 1.2 | 0.5 | — | 1.7 | ||||||||
One month ended December 31, 2015 | 1.7 | — | (0.5 | ) | 1.2 | |||||||
Fiscal 2015 | 2.6 | 0.6 | (1.5 | ) | 1.7 | |||||||
The Company’s federal net operating loss carryforwards of $20.4 million are set to expire from December 31, 2036 through December 31, 2037. The Company’s state net operating loss carryforwards of $33.0 million are set to expire from December 31, 2032 through December 31, 2037. The Company’s foreign net operating loss carryforwards of $8.0 million have a full valuation allowance and no expiration date.
The Company’s federal and California credit carryovers are $3.4 million and $3.4 million, respectively. The federal credit carryovers are set to expire from December 31, 2036 through December 31, 2037. The Company’s California credit carryovers have no expiration date.
Note 6. Long-Term Debt
As of December 31, | |||||||
2017 | 2016 | ||||||
(In millions) | |||||||
Senior debt | $ | 368.3 | $ | 388.0 | |||
Convertible senior notes | 247.2 | 240.0 | |||||
Convertible subordinated notes | — | 35.6 | |||||
Capital lease obligations | 0.9 | — | |||||
Total debt, carrying amount | 616.4 | 663.6 | |||||
Less: Amounts due within one year | (25.0 | ) | (55.6 | ) | |||
Total long-term debt, carrying amount | $ | 591.4 | $ | 608.0 | |||
74
As of December 31, 2017, the earlier of the Company’s contractual debt principal maturities or the next debt redemption date that could be exercised at the option of the debt holder, are summarized by fiscal year:
Total | 2018 | 2019 | 2020 | 2021 | Thereafter | ||||||||||||||||||
(In millions) | |||||||||||||||||||||||
Senior debt | $ | 370.0 | $ | 25.0 | $ | 30.0 | $ | 35.0 | $ | 280.0 | $ | — | |||||||||||
Convertible senior notes | 300.0 | — | — | — | — | 300.0 | |||||||||||||||||
Total debt principal | $ | 670.0 | $ | 25.0 | $ | 30.0 | $ | 35.0 | $ | 280.0 | $ | 300.0 | |||||||||||
See a summary of the minimum payments under capital lease obligations in Note 6(d).
The Company amortizes deferred financing costs over the estimated life of the related debt (a portion of which is classified as a contra liability). Amortization of deferred financing costs was $1.8 million, $2.0 million, $2.7 million and $0.2 million in fiscal 2017, 2016, 2015 and the one month ended December 31, 2015, respectively.
a. Senior Debt:
As of December 31, | |||||||
2017 | 2016 | ||||||
(In millions) | |||||||
Term loan, bearing interest at variable rates (rate of 3.82% as of December 31, 2017), maturing in June 2021 | $ | 370.0 | $ | 390.0 | |||
Unamortized deferred financing costs | (1.7 | ) | (2.0 | ) | |||
Total senior debt | $ | 368.3 | $ | 388.0 | |||
On June 17, 2016, the Company entered into a new $750.0 million senior secured senior credit facility (the "Senior Credit Facility"). The Senior Credit Facility matures on June 17, 2021 and consists of (i) a $350.0 million revolving line of credit (the "Revolver") and (ii) a $400.0 million term loan (the "Term Loan"). Under the Revolver, up to an aggregate of $100.0 million is available for the issuance of letters of credit and up to an aggregate of $10.0 million is available for swingline loans. The Senior Credit Facility amends and replaces the prior $300.0 million credit facility which was set to mature in May 2019.
On the closing date, the Company borrowed $100.0 million of loans under the Revolver and used the proceeds to repay in full the $90.0 million of outstanding term loans under the prior credit facility, fees incurred for the Senior Credit Facility, and for general corporate purposes. As of December 31, 2017, the Company had $370.0 million outstanding under the Term Loan, zero borrowings under the Revolver, and had issued $38.6 million letters of credit.
The Term Loan and loans under the Revolver bear interest at LIBOR (or the base rate) plus an applicable margin ranging from 175 to 250 basis points based on the Company's leverage ratio (the "Consolidated Net Leverage Ratio") at the end of the most recent fiscal quarter. In addition to interest, the Company must also pay certain fees including (i) letter of credit fees ranging from 175 to 250 basis points per annum on the amount of issued but undrawn letters of credit and (ii) commitment fees ranging from 30 to 45 basis points per annum on the unused portion of the Revolver.
The Term Loan amortizes at a rate of 5.0% per annum of the original drawn amount starting on September 30, 2016, increasing to 7.5% per annum on September 30, 2018, and increasing to 10.0% per annum from September 30, 2020 to be paid in equal quarterly installments with any remaining amounts, along with outstanding borrowings under the Revolver, due on the maturity date. Outstanding borrowings under the Revolver and the Term Loan may be voluntarily repaid at any time, in whole or in part, without premium or penalty.
Subject to certain restrictions, all the obligations under the Senior Credit Facility are guaranteed by the Company and the existing and future material domestic subsidiaries, other than Easton (the "Guarantors"). As collateral security for the amount outstanding under the Senior Credit Facility and the guarantees thereof, the Company and the Guarantors (collectively, the "Loan Parties") have granted to the administrative agent for the benefit of the lenders: (i) certain equity interests of the Loan Parties; (ii) first priority liens on substantially all of the tangible and intangible personal property of the Loan Parties; and (iii) first priority liens on certain real properties located in Los Angeles, California, Culpepper, Virginia and Redmond, Washington (but excluding all other owned real properties).
The Senior Credit Facility contains covenants requiring the Company to (i) maintain an interest coverage ratio (the "Consolidated Interest Coverage Ratio") of not less than 3.00 to 1.00 and (ii) maintain a Consolidated Net Leverage Ratio not to exceed 3.75 to 1.00 for periods ending from December 31, 2017 through September 30, 2018; and 3.50 to 1.00 for periods ending from December 31, 2018 thereafter, provided that the maximum leverage ratio for all periods shall be increased by 0.50 to 1.00 for two quarters after consummation of a qualified acquisition.
75
The Company may generally make certain investments, redeem debt subordinated to the Senior Credit Facility and make certain restricted payments (such as stock repurchases) if the Company's Consolidated Net Leverage Ratio does not exceed 3.25 to 1.00 pro forma for such transaction. The Company is otherwise subject to customary covenants including limitations on asset sales, incurrence of additional debt, and limitations on certain investments and restricted payments.
Financial Covenant | Actual Ratios as of December 31, 2017 | Required Ratios | |
Consolidated Interest Coverage Ratio, as defined under the Senior Credit Facility | 10.13 to 1.00 | Not less than: 3.00 to 1.00 | |
Consolidated Net Leverage Ratio, as defined under the Senior Credit Facility | 2.64 to 1.00 | Not greater than: 3.75 to 1.00 | |
The Company was in compliance with its financial and non-financial covenants as of December 31, 2017.
b. Convertible Senior Notes:
As of December 31, | |||||||
2017 | 2016 | ||||||
(In millions) | |||||||
Senior convertible notes, bearing interest at 2.25% per annum, interest payments due in June and December, maturing in December 2023 | $ | 300.0 | $ | 300.0 | |||
Unamortized discount and deferred financing costs | (52.8 | ) | (60.0 | ) | |||
Total convertible senior notes | $ | 247.2 | $ | 240.0 | |||
On December 14, 2016, the Company issued $300.0 million aggregate principal amount of 2¼% Notes in a private placement to qualified institutional buyers pursuant to Rule 144A under the Securities Act of 1933, as amended (the “Securities Act”). The 2¼% Notes bear cash interest at a rate of 2.25% per annum on the principal amount of the 2¼% Notes from December 14, 2016, payable semi-annually in arrears on June 15 and December 15 of each year, beginning June 15, 2017. The 2¼% Notes will mature on December 15, 2023, subject to earlier repurchase, redemption or conversion in certain circumstances described below.
The 2¼% Notes are general unsecured senior obligations, which (i) rank senior in right of payment to all of the Company’s existing and future senior indebtedness that is expressly subordinated in right of payment to the 2¼% Notes; (ii) rank equal in right of payment with all of the Company’s existing and future unsecured indebtedness that is not so subordinated; (iii) rank effectively junior in right of payment to any of the Company’s secured indebtedness to the extent of the value of the assets securing such indebtedness; and (iv) rank structurally junior to all indebtedness and other liabilities (including trade payables) of the Company’s subsidiaries.
The 2¼% Notes may be converted into cash, shares of the Company’s common stock or a combination thereof initially at a conversion rate of 38.4615 shares of common stock per $1,000 principal amount of 2¼% Notes (equivalent to a conversion price of approximately $26.00 per share of common stock), subject to adjustment from time to time as described in the indenture governing the 2¼% Notes. Holders may convert their 2¼% Notes at their option (i) at any time prior to the close of business on the business day immediately preceding September 15, 2023 under certain circumstances and (ii) at any time on or after September 15, 2023 until the close of business on the business day immediately preceding the maturity date, irrespective of such circumstances. In addition, if holders of the 2¼% Notes elect to convert their 2¼% Notes in connection with the occurrence of a make-whole fundamental change, as defined in the indenture governing the 2¼% Notes, such holders will be entitled to an increase in the conversion rate upon conversion in certain circumstances.
76
The Company may redeem for cash all or any portion of the 2¼% Notes, at its option, on or after December 21, 2020, if the last reported sale price of the Company’s common stock has been at least 150% of the conversion price then in effect for at least 20 trading days (whether or not consecutive) during any 30 consecutive trading day period (including the last trading day of such period) ending on, and including, the trading day immediately preceding the date on which the Company provides notice of redemption at a redemption price equal to 100% of the principal amount of the 2¼% Notes to be redeemed, plus accrued and unpaid interest to, but excluding, the redemption date.
If a fundamental change, as defined in the indenture governing the 2¼% Notes, occurs prior to maturity, subject to certain conditions, holders of the 2¼% Notes will have the right to require the Company to repurchase all or part of their 2¼% Notes for cash at a fundamental change repurchase price equal to 100% of their principal amount, plus accrued and unpaid interest, if any, up to, but excluding, the fundamental change repurchase date.
The 2¼% Notes contain customary events of default, including, among other things, payment default, covenant default and certain cross-default provisions linked to the payment of other indebtedness of the Company or its significant subsidiaries.
Issuance of the 2¼% Notes generated proceeds of $294.2 million net of debt issuance costs, which were used to repurchase long-term debt and for working capital and other general corporate purposes.
The Company separately accounted for the liability and equity components of the 2¼% Notes. The initial liability component of the 2¼% Notes was valued based on the present value of the future cash flows using an estimated borrowing rate at the date of the issuance for similar debt instruments without the conversion feature, which equals the effective interest rate of 5.8% on the liability component. The equity component, or debt discount, was initially valued equal to the principal value of the 2¼% Notes, less the liability component. The debt discount is being amortized as a non-cash charge to interest expense over the period from the issuance date through December 15, 2023.
The debt issuance costs of $5.8 million incurred in connection with the issuance of the 2¼% Notes were capitalized and bifurcated into deferred financing costs of $4.7 million and equity issuance costs of $1.1 million. The deferred financing costs are being amortized to interest expense from the issuance date through December 15, 2023.
The 2¼% Notes consisted of the following (in millions, except years, percentages, conversion rate, and conversion price):
As of December 31, | |||||||
2017 | 2016 | ||||||
Carrying value, long-term | $ | 247.2 | $ | 240.0 | |||
Unamortized discount and deferred financing costs | 52.8 | 60.0 | |||||
Principal amount | $ | 300.0 | $ | 300.0 | |||
Carrying amount of equity component, net of equity issuance costs | $ | 54.5 | $ | 54.5 | |||
Remaining amortization period (years) | 6.0 | 7.0 | |||||
Effective interest rate | 5.8 | % | 5.8 | % | |||
Conversion rate (shares of common stock per $1,000 principal amount) | 38.4615 | 38.4615 | |||||
Conversion price (per share of common stock) | $ | 26.00 | $ | 26.00 | |||
Based on the Company's closing stock price of $31.20 on December 31, 2017, the if-converted value of the 2¼% Notes exceeded the aggregate principal amount of the 2¼% Notes by $60.0 million.
The following table presents the interest expense components for the 2¼% Notes:
________
Year-Ended December 31, | |||||||
2017 | 2016 | ||||||
(In millions) | |||||||
Interest expense-contractual interest | $ | 6.8 | $ | 0.3 | |||
Interest expense-amortization of debt discount | 6.7 | 0.3 | |||||
Interest expense-amortization of deferred financing costs (1) | 0.6 | — | |||||
(1) Less than $0.1 million in fiscal 2016.
77
c. Convertible Subordinated Notes:
As of December 31, | |||||||
2017 | 2016 | ||||||
(In millions) | |||||||
Convertible subordinated debentures, bearing interest at 4.0625% per annum, interest payments due in June and December, maturing in December 2039 | $ | — | $ | 35.6 | |||
Total convertible subordinated notes | $ | — | $ | 35.6 | |||
As of December 31, 2017, the Company fully redeemed the outstanding principal amount of its 4 1/16% Debentures. In December 2016, the Company notified holders of its 4 1/16% Debentures that the Company would redeem, on February 3, 2017, all of their 4 1/16% Debentures at a purchase price equal to 100% of the principal amount of the 4 1/16% Debentures to be redeemed, plus any accrued and unpaid interest. In January 2017, $35.6 million of the 4 1/16% Debentures (the entire amount outstanding as of December 31, 2016) were converted to 3.9 million shares of common stock.
d. Capital Lease Obligations:
As of December 31, | |||||||
2017 | 2016 | ||||||
(In millions) | |||||||
Capital lease obligations | $ | 0.9 | $ | — | |||
Total capital lease obligations | $ | 0.9 | $ | — | |||
As of December 31, 2017, the Company has capital lease obligations for certain information technology equipment. The future minimum rental commitments under non-cancelable capital leases as of December 31, 2017 were as follows (in millions):
Fiscal 2018 | $ | 0.2 | |
Fiscal 2019 | 0.2 | ||
Fiscal 2020 | 0.2 | ||
Fiscal 2021 | 0.2 | ||
Fiscal 2022 | 0.2 | ||
Total minimum rentals | 1.0 | ||
Less: imputed interest | (0.1 | ) | |
Present value of minimum capital lease payments | $ | 0.9 | |
In September 2017, the Company entered into an agreement to lease 122,000-square feet of office space in Huntsville, Alabama. The term of the lease is twenty years and is expected to commence in March 2018 resulting in an estimated financial commitment of $47.8 million representing a present value of $24.9 million. The liability has not been recorded as of December 31, 2017 and the commitment minimum payments over the next five fiscal years is as follows: $1.1 million in fiscal 2018, $2.0 million each year for fiscal 2019 through fiscal 2021, $2.1 million in fiscal 2022.
In October 2017, the Company entered into an agreement to lease a new 136,000-square-foot advanced manufacturing facility located in Huntsville, Alabama. The term of the lease is thirty-one years and is expected to commence in December 2018 resulting in an estimated financial commitment of $35.3 million representing a present value of $21.0 million. The liability has not been recorded as of December 31, 2017 and the commitment minimum payments over the next five fiscal years is as follows: $1.1 million in fiscal 2018 and $1.7 million each year for fiscal 2019 through fiscal 2022.
Note 7. Retirement Benefits
a. Plan Descriptions
Pension Benefits
The Company's defined benefit pension plan future benefit accrual was discontinued in fiscal 2009. As of December 31, 2017, the assets, projected benefit obligations, and unfunded pension obligation were $931.2 million, $1,442.9 million, and $511.7 million, respectively.
The Company expects to make cash contributions of approximately $42.0 million to its tax-qualified defined benefit pension plan in fiscal 2018. The Company is generally able to recover these contributions related to its tax-qualified defined
78
benefit pension plan as allowable costs on its U.S. government contracts, but there is a lag between when the Company contributes cash to its tax-qualified defined benefit pension plan under pension funding rules and recovers the cash under the U.S. government Cost Accounting Standards. During fiscal 2017, the Company made cash contributions of $75.8 million to its tax-qualified defined benefit pension plan of which $33.7 million was recoverable from the Company's U.S. government contracts in fiscal 2017 with the remaining $42.1 million expected to be recoverable from the Company's U.S. government contracts in the future.
The funded status of the Company's tax-qualified pension plan may be adversely affected by the investment experience of the plan's assets, by any changes in U.S. law and by changes in the statutory interest rates used by tax-qualified pension plans in the U.S. to calculate funding requirements. Accordingly, if the performance of the plan's assets does not meet assumptions, if there are changes to the Internal Revenue Service regulations or other applicable law, or if other actuarial assumptions are modified, future contributions to the underfunded pension plans could be higher than the Company expects.
Medical and Life Insurance Benefits
The Company provides medical and life insurance benefits to certain eligible retired employees, with varied coverage by employee group. Generally, employees hired after January 1, 1997 are not eligible for retiree medical and life insurance benefits. The medical benefit plan provides for cost sharing between the Company and its retirees in the form of retiree contributions, deductibles, and coinsurance. Medical and life insurance benefit obligations are unfunded. Medical and life insurance benefit cash payments for eligible retired employees are recoverable from the Company’s U.S. government contracts.
Defined Contribution 401(k) Benefits
The Company sponsors a defined contribution 401(k) plan and participation in the plan is available to all employees. The Company makes matching contributions in cash equal to 100% of the first 3% of the participants’ compensation contributed and 50% of the next 3% of the compensation contributed. The cost of the 401(k) plan was $21.2 million, $20.7 million, $24.9 million, and $1.3 million in fiscal 2017, 2016, 2015, and the one month ended December 31, 2015, respectively.
b. Plan Results
Summarized below is the balance sheet impact of the Company’s pension benefits and medical and life insurance benefits. Pension benefits include the consolidated tax-qualified plan and the unfunded non-qualified plan for benefits provided to employees beyond those provided by the Company’s tax-qualified plan. Assets, benefit obligations, and the funded status of the plans were determined at December 31, 2017 and 2016.
79
Pension Benefits | Medical and Life Insurance Benefits | ||||||||||||||
As of December 31, | |||||||||||||||
2017 | 2016 | 2017 | 2016 | ||||||||||||
(In millions) | |||||||||||||||
Change in fair value of assets: | |||||||||||||||
Fair value - beginning of period | $ | 925.1 | $ | 931.4 | $ | — | $ | — | |||||||
Gain on assets | 96.8 | 93.7 | — | — | |||||||||||
Employer contributions | 77.2 | 34.1 | 4.2 | 4.3 | |||||||||||
Benefits paid (1) | (133.2 | ) | (134.1 | ) | (4.2 | ) | (4.3 | ) | |||||||
Settlements (2) | (34.7 | ) | — | — | — | ||||||||||
Fair value - end of period | $ | 931.2 | $ | 925.1 | $ | — | $ | — | |||||||
Change in benefit obligation: | |||||||||||||||
Benefit obligation - beginning of period | $ | 1,492.1 | $ | 1,531.0 | $ | 42.6 | $ | 50.8 | |||||||
Service cost | 15.0 | 14.0 | — | — | |||||||||||
Interest cost | 57.6 | 64.1 | 1.5 | 1.9 | |||||||||||
Actuarial losses (gains) | 46.1 | 17.1 | (2.4 | ) | (5.8 | ) | |||||||||
Benefits paid | (133.2 | ) | (134.1 | ) | (4.2 | ) | (4.3 | ) | |||||||
Settlements (2) | (34.7 | ) | — | — | — | ||||||||||
Benefit obligation - end of period (3) | $ | 1,442.9 | $ | 1,492.1 | $ | 37.5 | $ | 42.6 | |||||||
Funded status of the plans | $ | (511.7 | ) | $ | (567.0 | ) | $ | (37.5 | ) | $ | (42.6 | ) | |||
Amounts recognized in the consolidated balance sheets: | |||||||||||||||
Postretirement medical and life insurance benefits, current | $ | — | $ | — | $ | (4.8 | ) | $ | (5.2 | ) | |||||
Postretirement medical and life insurance benefits, noncurrent | — | — | (32.7 | ) | (37.4 | ) | |||||||||
Pension liability, non-qualified current (component of other current liabilities) | (1.3 | ) | (1.3 | ) | — | — | |||||||||
Pension liability, non-qualified (component of other noncurrent liabilities) | (17.6 | ) | (17.5 | ) | — | — | |||||||||
Pension benefits, noncurrent (4) | (492.8 | ) | (548.2 | ) | — | — | |||||||||
Net liability recognized in the consolidated balance sheets | $ | (511.7 | ) | $ | (567.0 | ) | $ | (37.5 | ) | $ | (42.6 | ) | |||
__________
(1) | Benefits paid for medical and life insurance benefits are net of the Medicare Part D Subsidy of $0.1 million and $0.1 million received in fiscal 2017 and 2016, respectively. |
(2) | On October 17, 2017, the Company's tax-qualified defined benefit pension plan purchased non-participating annuity contracts in the amount of $34.7 million for approximately 2,800 participants. |
(3) | Pension benefit obligation includes $18.9 million and $18.8 million as of December 31, 2017 and 2016, respectively, for the non-qualified plan. |
(4) | The net cash flow impact of the pension benefit obligation in fiscal 2017 was $42.3 million. |
The accumulated benefit obligation for the defined benefit pension plans was $1,442.9 million and $1,492.1 million as of the December 31, 2017 and 2016 measurement dates, respectively.
80
Components of retirement benefit expense (income) were:
Pension Benefits | Medical and Life Insurance Benefits | ||||||||||||||||||||||||||||||
Year Ended | One month ended | Year Ended | One month ended | ||||||||||||||||||||||||||||
December 31, | December 31, | November 30, | December 31, | December 31, | December 31, | November 30, | December 31, | ||||||||||||||||||||||||
2017 | 2016 | 2015 | 2015 | 2017 | 2016 | 2015 | 2015 | ||||||||||||||||||||||||
(In millions) | |||||||||||||||||||||||||||||||
Service cost | $ | 15.0 | $ | 14.0 | $ | 10.8 | $ | 1.1 | $ | — | $ | — | $ | — | $ | — | |||||||||||||||
Interest cost on benefit obligation | 57.6 | 64.1 | 63.6 | 5.3 | 1.5 | 1.9 | 1.9 | 0.2 | |||||||||||||||||||||||
Assumed return on assets (1) | (64.5 | ) | (70.1 | ) | (88.1 | ) | (6.0 | ) | — | — | — | — | |||||||||||||||||||
Amortization of prior service costs (credits) | 0.1 | 0.1 | — | — | (0.2 | ) | (1.2 | ) | (1.1 | ) | (0.1 | ) | |||||||||||||||||||
Amortization of net losses (gains) | 67.8 | 63.7 | 84.0 | 5.4 | (4.1 | ) | (3.6 | ) | (3.5 | ) | (0.3 | ) | |||||||||||||||||||
$ | 76.0 | $ | 71.8 | $ | 70.3 | $ | 5.8 | $ | (2.8 | ) | $ | (2.9 | ) | $ | (2.7 | ) | $ | (0.2 | ) | ||||||||||||
__________
(1) | The actual return and rate of return on assets was as follows: |
Year Ended | One month ended | ||||||||||||||
December 31, | December 31, | November 30, | December 31, | ||||||||||||
2017 | 2016 | 2015 | 2015 | ||||||||||||
(In millions, except rate of return) | |||||||||||||||
Actual gain (loss) on assets | $ | 96.8 | $ | 93.7 | $ | (64.2 | ) | $ | (22.2 | ) | |||||
Actual rate of return on assets | 10.8 | % | 11.0 | % | (6.1 | )% | (2.3 | )% | |||||||
Market conditions and interest rates significantly affect assets and liabilities of the pension plans. Pension accounting permits market gains and losses to be deferred and recognized over a period of years. This “smoothing” results in the creation of other accumulated income or loss which will be amortized to pension costs in future years. The accounting method the Company utilizes recognizes one-fifth of the unamortized gains and losses in the market-related value of pension assets and all other gains and losses including changes in the discount rate used to calculate the benefit obligation each year. Investment gains or losses for this purpose are the difference between the expected return and the actual return on the market-related value of assets which smoothes asset values over three years. Although the smoothing period mitigates some volatility in the calculation of annual retirement benefit expense, future expenses are impacted by changes in the market value of assets and changes in interest rates.
c. Plan Assumptions
The Company used the following assumptions, calculated based on a weighted-average, to determine the benefit obligations:
Pension Benefits | Medical and Life Insurance Benefits | ||||||||||
As of December 31, | As of December 31, | ||||||||||
2017 | 2016 | 2017 | 2016 | ||||||||
Discount rate | 3.59 | % | 4.02 | % | 3.37 | % | 3.68 | % | |||
Discount rate (non-qualified plan) | 3.62 | % | 4.07 | % | * | * | |||||
Ultimate healthcare trend rate | * | * | 5.00 | % | 5.00 | % | |||||
Initial healthcare trend rate (pre 65/post 65) | * | * | 6.50 | % | 7.00 | % | |||||
Year ultimate rate attained (pre 65/post 65) | * | * | 2021 | 2021 | |||||||
______
* | Not applicable |
The Company used the following assumptions, calculated based on a weighted-average, to determine the retirement benefit expense (income):
81
Pension Benefits | Medical and Life Insurance Benefits | ||||||||||||||||||||||
Year Ended | One month ended | Year Ended | One month ended | ||||||||||||||||||||
December 31, | December 31, | November 30, | December 31, | December 31, | December 31, | November 30, | December 31, | ||||||||||||||||
2017 | 2016 | 2015 | 2015 | 2017 | 2016 | 2015 | 2015 | ||||||||||||||||
Discount rate | 4.02 | % | 4.36 | % | 3.96 | % | 4.26 | % | 3.68 | % | 3.99 | % | 3.54 | % | 3.87 | % | |||||||
Discount rate (non-qualified plan) | 4.07 | % | 4.41 | % | 4.01 | % | 4.32 | % | * | * | * | * | |||||||||||
Expected long-term rate of return on assets | 7.00 | % | 7.00 | % | 8.00 | % | 7.00 | % | * | * | * | * | |||||||||||
Ultimate healthcare trend rate | * | * | * | * | 5.00 | % | 5.00 | % | 5.00 | % | 5.00 | % | |||||||||||
Initial healthcare trend rate (pre 65/post 65) | * | * | * | * | 7.00 | % | 7.00 | % | 7.00 | % | 7.00 | % | |||||||||||
Year ultimate rate attained (pre 65/post 65) | * | * | * | * | 2021 | 2021 | 2021 | 2021 | |||||||||||||||
______
* | Not applicable |
Certain actuarial assumptions, such as assumed discount rate, long-term rate of return, and assumed healthcare cost trend rates can have a significant effect on amounts reported for periodic cost of pension benefits and medical and life insurance benefits, as well as respective benefit obligation amounts. The assumed discount rate represents the market rate available for investments in high-quality fixed income instruments with maturities matched to the expected benefit payments for pension and medical and life insurance benefit plans.
The expected long-term rate of return on assets represents the rate of earnings expected in the funds invested, and funds to be invested, to provide for anticipated benefit payments to plan participants. The Company evaluated historical investment performance, current and expected asset allocation, and, with input from the Company’s external advisors, developed best estimates of future investment performance. Based on this analysis, the Company assumed a long-term expected rate of return of 7.0% in fiscal 2017.
The Company reviews external data and its own historical trends for healthcare costs to determine the healthcare cost trend rates for the medical benefit plans. For fiscal 2017 medical benefit obligations, the Company assumed a 6.5% annual rate of increase for pre and post 65 participants in the per capita cost of covered healthcare claims with the rate decreasing over three years until reaching 5.0%.
A one percentage point change in the key assumptions would have the following effects on the projected benefit obligations as of December 31, 2017 and on retirement benefit expense for fiscal 2017:
Pension Benefits and Medical and Life Insurance Benefits Discount Rate | Expected Long-term Rate of Return | Assumed Healthcare Cost Trend Rate | |||||||
Net Periodic Benefit Expense | Projected Benefit Obligation | Net Periodic Pension Benefit Expense | Net Periodic Medical and Life Insurance Benefit Expense | Accumulated Benefit Obligation | |||||
(In millions) | |||||||||
1% decrease | $21.7 | $153.5 | $9.2 | $(0.2) | $(0.7) | ||||
1% increase | (18.5) | (128.9) | (9.2) | 0.3 | 0.8 | ||||
d. Plan Assets and Investment Policy
The Company’s investment policy is to maximize the total rate of return within a prudent risk framework, while maintaining adequate liquidity throughout volatile market cycles to meet benefit obligations when due. The Company's strategies employ active management and are generally focused on minimizing the permanent loss of capital. The Company's asset diversification objectives target a global portfolio that invests across the capital structure via strategies with complimentary risk and return profiles. Diversification is achieved by investing in various asset types, which may include cash, fixed income, equities, and private equity and credit holdings. Further, the Company's strategy allows for diversification as to the types of investment vehicle structures, investment and redemption periods, and the number of investment managers used to carry out its strategy. Allocations between asset types, structures and managers may change as a result of changing market conditions, tactical investment opportunities, planned Company contributions, and cash obligations of the plan.
82
The asset allocations by asset category were as follows:
As of December 31, | |||||
2017 | 2016 | ||||
Cash and cash equivalents | 6 | % | 26 | % | |
Equity securities | 52 | 43 | |||
Fixed income | 16 | 15 | |||
Private assets | 10 | 8 | |||
Hedge funds | 16 | 8 | |||
Total | 100 | % | 100 | % | |
The fair value by asset category and by level was as follows:
Total | Quoted Prices in Active Markets for Identical Assets (Level 1) | Significant Other Observable Inputs (Level 2) | Significant Unobservable Inputs (Level 3) | ||||||||||||
(In millions) | |||||||||||||||
December 31, 2017 | |||||||||||||||
Cash and cash equivalents | $ | 28.2 | $ | 28.2 | $ | — | $ | — | |||||||
Equity securities: | |||||||||||||||
Domestic equity securities | 440.9 | 437.1 | — | 3.8 | |||||||||||
International equity securities | 39.9 | 39.9 | — | — | |||||||||||
Fixed income: | |||||||||||||||
Corporate debt securities | 87.1 | — | 75.8 | 11.3 | |||||||||||
Asset-backed securities | 33.8 | — | 33.8 | — | |||||||||||
Foreign bonds | 0.1 | — | 0.1 | — | |||||||||||
U.S. government securities | 10.7 | — | 10.7 | — | |||||||||||
Private assets | 25.7 | — | — | 25.7 | |||||||||||
Total | 666.4 | $ | 505.2 | $ | 120.4 | $ | 40.8 | ||||||||
Investment measured at Net Asset Value ("NAV") | |||||||||||||||
Private assets | 69.0 | ||||||||||||||
Hedge funds | 153.7 | ||||||||||||||
Registered investment companies | 10.5 | ||||||||||||||
Common/collective trusts ("CCTs") | 39.3 | ||||||||||||||
Total investments measured at NAV | 272.5 | ||||||||||||||
Receivables | 1.0 | ||||||||||||||
Payables | (8.7 | ) | |||||||||||||
Total assets | $ | 931.2 | |||||||||||||
83
Total | Quoted Prices in Active Markets for Identical Assets (Level 1) | Significant Other Observable Inputs (Level 2) | Significant Unobservable Inputs (Level 3) | ||||||||||||
(In millions) | |||||||||||||||
December 31, 2016 | |||||||||||||||
Cash and cash equivalents | $ | 31.3 | $ | 31.3 | $ | — | $ | — | |||||||
Equity securities: | |||||||||||||||
Domestic equity securities | 377.2 | 373.8 | 1.2 | 2.2 | |||||||||||
International equity securities | 16.2 | 16.2 | — | — | |||||||||||
Derivatives: | |||||||||||||||
Written options | (0.1 | ) | (0.1 | ) | — | — | |||||||||
Short sales | (0.1 | ) | (0.1 | ) | — | — | |||||||||
Fixed income: | |||||||||||||||
Corporate debt securities | 33.8 | — | 27.0 | 6.8 | |||||||||||
Asset-backed securities | 71.5 | — | 71.5 | — | |||||||||||
Municipal bonds | 26.3 | — | 26.3 | — | |||||||||||
Short sales | (0.2 | ) | — | (0.2 | ) | — | |||||||||
Real estate investments | 0.5 | — | — | 0.5 | |||||||||||
Total | 556.4 | $ | 421.1 | $ | 125.8 | $ | 9.5 | ||||||||
Investment measured at NAV | |||||||||||||||
Private assets | 70.7 | ||||||||||||||
Hedge funds | 79.3 | ||||||||||||||
CCTs | 219.4 | ||||||||||||||
Total investments measured at NAV | 369.4 | ||||||||||||||
Receivables | 1.8 | ||||||||||||||
Payables | (2.5 | ) | |||||||||||||
Total assets | $ | 925.1 | |||||||||||||
Below is a description of the significant investment strategies and valuation methodologies used for the investments measured at fair value, including the general classification of such investments pursuant to the valuation hierarchy. There have been no changes in the methodologies used at December 31, 2017 and 2016.
Cash and cash equivalents
Cash and cash equivalents are held in money market accounts or invested in Short-Term Investment Funds (“STIFs”). Cash and cash equivalents held in money market accounts are classified as Level 1 investments. STIFs are measured at NAV and included in CCTs as a reconciling item to the fair value tables above.
Equity securities
Equity securities are invested broadly in U.S. and non-U.S. companies in a variety of sectors and market capitalizations. These investments are comprised of common stocks, exchange-traded funds (“ETFs”), CCTs, derivatives and other investment vehicles. Common stocks and ETFs are stated at fair value as quoted on a recognized securities exchange and are valued at the last reported sales price on the last business day of the fiscal year and are classified as Level 1 investments. Derivatives include call and put options on common stocks or ETFs, which are all listed on an exchange and active market and classified as Level 1 investments. Short sales are short equity positions which are all listed on an exchange and active market and classified as Level 1 investments. Equity securities that are invested in common stock or preferred stock and priced using observable inputs are classified as Level 2 investments. Equity securities that are invested in common stock of private companies and priced using unobservable inputs are classified as Level 3 investments. CCTs invested in equity securities are measured at NAV and included as a reconciling item to the fair value tables above.
Fixed income securities
Fixed income securities are invested in a variety of instruments, including, but not limited to, corporate debt securities, CCTs, registered investment companies, asset-backed securities, and other investment vehicles. Corporate debt securities are invested in corporate bonds or ETFs. ETFs are traded in an exchange and active market and classified as Level 1 investments.
84
Corporate bonds that are valued at bid evaluations using observable and market-based inputs are classified as Level 2 investments. Corporate bonds that are priced by brokers using unobservable inputs are classified as Level 3 investments. Asset-backed securities, including government-backed mortgage securities, non-government-backed collateralized mortgage obligations, asset-backed securities, and commercial mortgage-backed securities, are valued at bid evaluations and are classified as Level 2 investments. Short sales are short fixed income positions which are classified as Level 1 investments if they are listed on an exchange and active market, and are classified as Level 2 investments if they are valued at bid evaluation using observable and market-based inputs. Registered investment companies and CCTs invested in fixed income securities are measured at NAV and included as a reconciling item to the fair value tables above.
Real estate investments
Real estate investments include residential lots located in Benicia, California and are classified as Level 3 investments.
Private assets
Private assets are primarily limited partnerships and fund-of-funds that mainly invest in U.S. and non-U.S. leveraged buyout, venture capital and special situation strategies. Generally, the individual investments within the partnerships or funds are valued at public market, private market, or appraised value. Private assets are valued by investment managers using unobservable inputs such as extrapolated data, proprietary data, or indicative quotes. The majority of the private assets are valued at NAV and included as a reconciling item to the fair value tables above. Private assets for which there is no NAV are classified as Level 3 investments. Valuations of certain assets were based on the NAV or market value three months prior to the fiscal year-end. The Company made adjustments amounting to an increase of $0.3 million and $11.3 million for fiscal 2017 and 2016, respectively, to account for changes since the valuation date.
Hedge funds
Hedge funds primarily consist of multi-strategy hedge funds that invest across a range of equity and debt securities in a variety of industry sectors. Hedge funds are valued at NAV calculated by investment managers using unobservable inputs such as extrapolated data, proprietary data, or indicative quotes and are included as a reconciling item to the fair value tables above. Valuations of certain assets were based on the NAV or total market value three months prior to the fiscal year-end. The Company made adjustments amounting to an increase of $0.3 million for fiscal 2017 to account for changes since the valuation date.
Changes in the fair value of the Level 3 investments were as follows:
December 31, 2016 | Unrealized Gains | Purchases, Sales, and Settlements, net | December 31, 2017 | ||||||||||||
(In millions) | |||||||||||||||
Domestic equity securities | $ | 2.2 | $ | 2.9 | $ | (1.3 | ) | $ | 3.8 | ||||||
Corporate debt securities | 6.8 | 2.0 | 2.5 | 11.3 | |||||||||||
Real estate investments | 0.5 | — | (0.5 | ) | — | ||||||||||
Private assets | — | 1.2 | 24.5 | 25.7 | |||||||||||
Total | $ | 9.5 | $ | 6.1 | $ | 25.2 | $ | 40.8 | |||||||
December 31, 2015 | Unrealized Gains | Purchases, Sales, and Settlements, net | December 31, 2016 | ||||||||||||
(In millions) | |||||||||||||||
Domestic equity securities | $ | 0.5 | $ | 0.1 | $ | 1.6 | $ | 2.2 | |||||||
Corporate debt securities | — | — | 6.8 | 6.8 | |||||||||||
Real estate investments | 0.7 | — | (0.2 | ) | 0.5 | ||||||||||
Total | $ | 1.2 | $ | 0.1 | $ | 8.2 | $ | 9.5 | |||||||
85
e. Benefit Payments
The following table presents estimated future benefit payments:
Pension Benefit Payments | Medical and Life Insurance Benefits | ||||||||||||||
Year Ending December 31, | Gross Benefit Payments | Medicare D Subsidy | Net Benefit Payments | ||||||||||||
(In millions) | |||||||||||||||
2018 | $ | 116.2 | $ | 5.0 | $ | 0.2 | $ | 4.8 | |||||||
2019 | 113.9 | 4.7 | 0.2 | 4.5 | |||||||||||
2020 | 110.7 | 4.4 | 0.2 | 4.2 | |||||||||||
2021 | 107.2 | 4.0 | 0.1 | 3.9 | |||||||||||
2022 | 103.6 | 3.6 | 0.1 | 3.5 | |||||||||||
Years 2023 - 2027 | 463.2 | 13.1 | 0.4 | 12.7 | |||||||||||
Note 8. Commitments and Contingencies
a. Operating Lease Commitments and Income
The Company and its subsidiaries lease certain facilities, machinery and equipment, and office buildings under long-term, non-cancelable operating leases. The leases generally provide for renewal options ranging from one to five years and require the Company to pay for utilities, insurance, taxes, and maintenance. Rent expense was $20.7 million in fiscal 2017, $21.2 million in fiscal 2016, $18.5 million in fiscal 2015, and $1.8 million in the one month ended December 31, 2015.
The Company also leases certain surplus facilities to third parties. The Company recorded lease income of $6.4 million in fiscal 2017, $6.5 million in fiscal 2016, $6.3 million in fiscal 2015, and $0.5 million in the one month ended December 31, 2015 related to these arrangements, which have been included in net sales.
The future minimum rental commitments under non-cancelable operating leases with initial or remaining terms of one year or more and lease revenue in effect as of December 31, 2017 were as follows:
Year Ending December 31, | Future Minimum Rental Commitments | Future Minimum Rental Income | |||||
(In millions) | |||||||
2018 | $ | 15.1 | $ | 4.8 | |||
2019 | 14.6 | 2.5 | |||||
2020 | 14.1 | 0.7 | |||||
2021 | 14.2 | 0.7 | |||||
2022 | 13.2 | 0.2 | |||||
Thereafter | 23.9 | — | |||||
$ | 95.1 | $ | 8.9 | ||||
b. Legal Matters
The Company and its subsidiaries are subject to legal proceedings, including litigation in U.S. federal and state courts, which arise out of, and are incidental to, the ordinary course of the Company’s on-going and historical businesses. The Company is also subject from time to time to suits under the U.S. federal False Claims Act, known as “qui tam” actions, and to governmental investigations by federal and state agencies. The Company cannot predict the outcome of such proceedings with any degree of certainty. Loss contingency provisions are recorded for probable losses at management’s best estimate of a loss, or when a best estimate cannot be made, a minimum loss contingency amount is recorded. These estimates are often initially developed substantially earlier than when the ultimate loss is known, and are refined each quarterly reporting period as additional information becomes available.
Asbestos Litigation
The Company has been, and continues to be, named as a defendant in lawsuits alleging personal injury or death due to exposure to asbestos in building materials, products, or in manufacturing operations. The majority of cases are pending in Texas and Illinois. There were 59 asbestos cases pending as of December 31, 2017.
Given the lack of any significant consistency to claims (i.e., as to product, operational site, or other relevant assertions) filed against the Company, the Company is generally unable to make a reasonable estimate of the future costs of pending
86
claims or unasserted claims. As of December 31, 2017, the Company has accrued an immaterial amount related to pending claims.
Socorro
On May 12, 2015, a complaint for personal injuries, loss of consortium and punitive damages was filed by James Chavez, Andrew Baca, and their respective spouses, against Aerojet Rocketdyne and the Board of Regents of New Mexico Tech in the Seventh Judicial District, County of Socorro, New Mexico, James Chavez, et al., vs. Aerojet Rocketdyne, Inc., et al., Case No. D725CV201500047. Messrs. Chavez and Baca were employees of Aerotek, a contractor to Aerojet Rocketdyne, who were injured when excess energetic materials being managed by the Energetic Materials Research and Testing Center, a research division of New Mexico Tech, ignited in an unplanned manner. The complaint alleges causes of action based on negligence and negligence per se, strict liability, and willful, reckless and wanton conduct against Aerojet Rocketdyne, and seeks unspecified compensatory and punitive damages. Trial is scheduled for June 18, 2018. No liability for this matter has been recorded by the Company as of December 31, 2017.
Department of Justice ("DOJ") Investigation
The Company is responding to a civil investigative demand issued by the DOJ in the first quarter of fiscal 2017 requesting information relating to allegations under the False Claims Act that the Company may have previously made false representations to the U.S. government regarding the Company’s compliance with certain regulatory cybersecurity requirements. The Company is cooperating with the DOJ in its investigation of the false claim allegations.
c. Environmental Matters
The Company is involved in approximately forty environmental matters under the Comprehensive Environmental Response Compensation and Liability Act, the Resource Conservation Recovery Act, and other federal, state, local, and foreign laws relating to soil and groundwater contamination, hazardous waste management activities, and other environmental matters at some of its current and former facilities. The Company is also involved in a number of remedial activities at third party sites, not owned by the Company, where it is designated a potentially responsible party (“PRP”) by either the U.S. Environmental Protection Agency ("EPA") and/or a state agency. In many of these matters, the Company is involved with other PRPs. In some instances, the Company’s liability and proportionate share of costs have not been determined largely due to uncertainties as to the nature and extent of site conditions and the Company’s involvement. While government agencies frequently claim PRPs are jointly and severally liable at such sites, in the Company’s experience, interim and final allocations of liability and costs are generally made based on relative contributions of waste or contamination. Anticipated costs associated with environmental remediation that are probable and estimable are accrued. In cases where a date to complete remedial activities at a particular site cannot be determined by reference to agreements or otherwise, the Company projects costs over an appropriate time period not exceeding fifteen years. In such cases, generally the Company does not have the ability to reasonably estimate environmental remediation costs that are beyond this period. Factors that could result in changes to the Company’s estimates include completion of current and future soil and groundwater investigations, new claims, future agency demands, discovery of more or less contamination than expected, discovery of new contaminants, modification of planned remedial actions, changes in estimated time required to remediate, new technologies, and changes in laws and regulations.
As of December 31, 2017, the aggregate range of these anticipated environmental costs was $341.4 million to $503.4 million and the accrued amount was $341.4 million. See Note 8(d) for a summary of the environmental reserve activity. Of these accrued liabilities, approximately 99% relates to the Company’s U.S. government contracting business and a portion of this liability is recoverable. The significant environmental sites are discussed below. The balance of the accrued liabilities, which are not recoverable from the U.S. government, relate to other sites for which the Company’s obligations are probable and estimable.
Sacramento, California Site
In 1989, a federal district court in California approved a Partial Consent Decree (“PCD”) requiring Aerojet Rocketdyne, among other things, to conduct a Remedial Investigation and Feasibility Study to determine the nature and extent of impacts due to the release of chemicals from the Sacramento, California site, monitor the American River and offsite public water supply wells, operate Groundwater Extraction and Treatment facilities that collect groundwater at the site perimeter, and pay certain government oversight costs. The primary chemicals of concern for both on-site and off-site groundwater are trichloroethylene, perchlorate, and n-nitrosodimethylamine. The 2002 PCD revision (a) separated the Sacramento site into multiple operable units to allow quicker implementation of remedy for critical areas; (b) required the Company to guarantee up to $75 million (in addition to a prior $20 million guarantee) to assure that Aerojet Rocketdyne’s Sacramento remediation activities are fully funded; and (c) removed approximately 2,600 acres of non-contaminated land from the EPA superfund designation.
Aerojet Rocketdyne is involved in various stages of soil and groundwater investigation, remedy selection, design, construction, operation and maintenance associated with the operable units, all of which are conducted under the direction and oversight of the EPA, including unilateral administrative orders, and the California Department of Toxic Substances Control
87
("DTSC") and Regional Water Quality Control Board, Central Valley Region ("RWQCB"). On September 22, 2016, the EPA completed its first five-year remedy review of the Sacramento superfund site. The five-year review required by statute and regulation applies to all remedial actions which result in hazardous substances above levels that allow unlimited use and unrestricted exposure. The Company is working with the EPA to address the findings of the five-year remedy review.
The entire southern portion of the site known as Rio Del Oro was under state orders issued in the 1990s from DTSC and the RWQCB to investigate and remediate soil and groundwater contamination. In 2008, the DTSC released all but approximately 400 acres of the Rio Del Oro property from DTSC’s environmental orders regarding soil contamination although the property remains subject to the RWQCB’s orders to investigate and remediate groundwater environmental contamination emanating offsite from the property.
As of December 31, 2017, the estimated range of anticipated costs discussed above for the Sacramento, California site was $206.5 million to $325.2 million and the accrued amount was $206.5 million included as a component of the Company’s environmental reserves. Expenditures associated with this matter are partially recoverable. See Note 8(d) below for further discussion on recoverability.
Baldwin Park Operable Unit (“BPOU”)
As a result of its former Azusa, California operations, in 1994 Aerojet Rocketdyne was named a PRP by the EPA in the area of the San Gabriel Valley Basin superfund site known as the BPOU. In 2002, Aerojet Rocketdyne, along with seven other PRPs (the "Cooperating Respondents”) signed a project agreement in late March 2002 with the San Gabriel Basin Water Quality Authority, the Main San Gabriel Basin Watermaster, and five water companies (the “Water Entities”). The 2002 project agreement terminated in 2017 and the parties executed a new project agreement which became operational on May 9, 2017. The new agreement has a ten-year term and requires the Cooperating Respondents to fund through an escrow account the ongoing operation, maintenance, and administrative costs of certain treatment and water distribution facilities owned and operated by the water companies. There are also provisions in the project agreement for maintaining financial assurance.
Pursuant to an agreement with the remaining Cooperating Respondents, Aerojet Rocketdyne's current share of future BPOU costs will be approximately 74%.
As of December 31, 2017, the estimated range of anticipated costs was $116.4 million to $152.5 million and the accrued amount was $116.4 million included as a component of the Company’s environmental reserves. Expenditures associated with this matter are partially recoverable. See Note 8(d) below for further discussion on recoverability.
d. Environmental Reserves and Estimated Recoveries
Environmental Reserves
The Company reviews on a quarterly basis estimated future remediation costs and has an established practice of estimating environmental remediation costs over a fifteen year period, except for those environmental remediation costs with a specific contractual term. Environmental liabilities at the BPOU site are currently estimated through the term of the new project agreement which expires in May 2027. As the period for which estimated environmental remediation costs lengthens, the reliability of such estimates decreases. These estimates consider the investigative work and analysis of engineers, outside environmental consultants, and the advice of legal staff regarding the status and anticipated results of various administrative and legal proceedings. In most cases, only a range of reasonably possible costs can be estimated. In establishing the Company’s reserves, the most probable estimate is used when determinable; otherwise, the minimum amount is used when no single amount in the range is more probable. Accordingly, such estimates can change as the Company periodically evaluates and revises these estimates as new information becomes available. The Company cannot predict whether new information gained as projects progress will affect the estimated liability accrued. The timing of payment for estimated future environmental costs is influenced by a number of factors such as the regulatory approval process, and the time required designing, constructing, and implementing the remedy.
88
A summary of the Company’s environmental reserve activity:
Aerojet Rocketdyne- Sacramento | Aerojet Rocketdyne- BPOU | Other Aerojet Rocketdyne Sites | Total Aerojet Rocketdyne | Other | Total Environmental Reserve | ||||||||||||||||||
(In millions) | |||||||||||||||||||||||
November 30, 2014 | $ | 130.4 | $ | 21.7 | $ | 8.1 | $ | 160.2 | $ | 5.8 | $ | 166.0 | |||||||||||
Additions | 44.3 | 129.7 | 2.0 | 176.0 | 0.6 | 176.6 | |||||||||||||||||
Expenditures | (21.7 | ) | (11.3 | ) | (2.3 | ) | (35.3 | ) | (1.2 | ) | (36.5 | ) | |||||||||||
November 30, 2015 | 153.0 | 140.1 | 7.8 | 300.9 | 5.2 | 306.1 | |||||||||||||||||
Additions | 0.5 | — | — | 0.5 | — | 0.5 | |||||||||||||||||
Expenditures | (0.9 | ) | (3.4 | ) | — | (4.3 | ) | — | (4.3 | ) | |||||||||||||
December 31, 2015 | 152.6 | 136.7 | 7.8 | 297.1 | 5.2 | 302.3 | |||||||||||||||||
Additions | 80.0 | 3.5 | 3.9 | 87.4 | — | 87.4 | |||||||||||||||||
Expenditures | (22.5 | ) | (13.4 | ) | (3.2 | ) | (39.1 | ) | (0.9 | ) | (40.0 | ) | |||||||||||
December 31, 2016 | 210.1 | 126.8 | 8.5 | 345.4 | 4.3 | 349.7 | |||||||||||||||||
Additions | 19.2 | 3.3 | 8.0 | 30.5 | 0.8 | 31.3 | |||||||||||||||||
Expenditures | (22.8 | ) | (13.7 | ) | (2.8 | ) | (39.3 | ) | (0.3 | ) | (39.6 | ) | |||||||||||
December 31, 2017 | $ | 206.5 | $ | 116.4 | $ | 13.7 | $ | 336.6 | $ | 4.8 | $ | 341.4 | |||||||||||
The effect of the final resolution of environmental matters and the Company’s obligations for environmental remediation and compliance cannot be accurately predicted due to the uncertainty concerning both the amount and timing of future expenditures and due to regulatory or technological changes. The Company continues its efforts to mitigate past and future costs through pursuit of claims for recoveries from insurance coverage and other PRPs and continued investigation of new and more cost effective remediation alternatives and associated technologies.
As part of the acquisition of the Atlantic Research Corporation (“ARC”) propulsion business in 2003, Aerojet Rocketdyne entered into an agreement with ARC pursuant to which Aerojet Rocketdyne is responsible for up to $20.0 million of costs (“Pre-Close Environmental Costs”) associated with environmental issues that arose prior to Aerojet Rocketdyne’s acquisition of the ARC propulsion business. ARC is responsible for any cleanup costs relating to the ARC acquired businesses in excess of $20.0 million. Pursuant to a separate agreement with the U.S. government which was entered into prior to the completion of the ARC acquisition, these costs are recovered through the establishment of prices for Aerojet Rocketdyne’s products and services sold to the U.S. government. The Company reached the $20.0 million cap on cleanup costs in the first quarter of fiscal 2017 and expects that additional costs will be incurred due to contamination existing at the time of the acquisition and still requiring remediation and monitoring. On May 6, 2016, ARC informed Aerojet Rocketdyne that it was disputing certain costs that Aerojet Rocketdyne attributed to the $20.0 million Pre-Close Environmental Costs (“ARC Claim”). The Company has met with ARC and responded to the ARC Claim on June 23, 2017. Certain costs related to the ARC Claim will be determined in conjunction with the Company’s evaluation and ultimate resolution of the ARC Claim.
Estimated Recoveries
On January 12, 1999, Aerojet Rocketdyne and the U.S. government reached a settlement agreement (“Global Settlement”) which established a cost-sharing ratio with respect to the clean-up costs of prior environmental contamination. Additionally, in conjunction with the sale of the EIS business in 2001, Aerojet Rocketdyne entered into an agreement with Northrop (the “Northrop Agreement”) whereby Aerojet Rocketdyne is reimbursed by Northrop for a portion of environmental expenditures eligible for recovery under the Global Settlement, subject to an annual billing limitation of $6.0 million and a cumulative limitation of $189.7 million. The cumulative expenditure limitation of $189.7 million was reached in the second quarter of fiscal 2017. A summary of the Northrop Agreement activity is shown below (in millions):
Total reimbursable costs under the Northrop Agreement | $ | 189.7 | |
Amount reimbursed through December 31, 2017 | (125.2 | ) | |
Receivable from Northrop included in the consolidated balance sheet as of December 31, 2017 | $ | 64.5 | |
Environmental remediation costs are primarily incurred by the Company's Aerospace and Defense segment, and certain of these costs are recoverable from the Company's contracts with the U.S. government. The Company currently estimates approximately 24% of its future Aerospace and Defense segment environmental remediation costs will not likely be reimbursable and are expensed.
89
Allowable environmental remediation costs are charged to the Company’s contracts as the costs are incurred. Because these costs are recovered through forward-pricing arrangements, the ability of Aerojet Rocketdyne to continue recovering these costs from the U.S. government depends on Aerojet Rocketdyne’s sustained business volume from U.S. government contracts and programs.
While the Company is currently seeking an arrangement with the U.S. government to recover environmental expenditures in excess of the reimbursement ceiling identified in the Northrop Agreement and Global Settlement, there can be no assurances that such a recovery will be obtained, or if not obtained, that such unreimbursed environmental expenditures will not have a materially adverse effect on the Company’s operating results, financial condition, and/or cash flows.
Environmental reserves and estimated recoveries impact to the consolidated statements of operations
The expenses associated with adjustments to the environmental reserves are recorded as a component of other expense, net in the consolidated statements of operations. Summarized financial information for the impact of environmental reserves and recoveries to the consolidated statements of operations were as follows:
Year Ended | One month ended | ||||||||||||||
December 31, | December 31, | November 30, | December 31, | ||||||||||||
2017 | 2016 | 2015 | 2015 | ||||||||||||
(In millions) | |||||||||||||||
Estimated recoverable amounts from U.S. government contracts and other third parties | $ | 23.1 | $ | 69.1 | $ | 159.3 | $ | 0.6 | |||||||
Expense (benefit) to consolidated statement of operations | 8.2 | 18.3 | 17.3 | (0.1 | ) | ||||||||||
Total environmental reserve adjustments | $ | 31.3 | $ | 87.4 | $ | 176.6 | $ | 0.5 | |||||||
e. Arrangements with Off-Balance Sheet Risk
As of December 31, 2017, arrangements with off-balance sheet risk consisted of:
• | $38.6 million in outstanding commercial letters of credit, the majority of which may be renewed, primarily to collateralize obligations for environmental remediation and insurance coverage. |
• | $52.8 million in outstanding surety bonds to primarily satisfy indemnification obligations for environmental remediation coverage. |
• | Up to $120.0 million aggregate in guarantees by the Company of Aerojet Rocketdyne’s obligations to U.S. government agencies for environmental remediation activities. |
• | $121.9 million in commitments associated with outsourcing certain information technology and cyber security functions. |
• | $83.1 million in commitments associated with the Company's new facilities located in Huntsville, Alabama. |
• | Guarantees, jointly and severally, by the Company’s material domestic subsidiaries of their obligations under the Senior Credit Facility. |
In addition to the items discussed above, the Company has and will from time to time enter into certain types of contracts that require the Company to indemnify parties against potential third-party and other claims. These contracts primarily relate to: (i) divestiture agreements, under which the Company may provide customary indemnification to purchasers of its businesses or assets including, for example, claims arising from the operation of the businesses prior to disposition, and liability to investigate and remediate environmental contamination existing prior to disposition; (ii) certain real estate leases, under which the Company may be required to indemnify property owners for claims arising from the use of the applicable premises; and (iii) certain agreements with officers and directors, under which the Company may be required to indemnify such persons for liabilities arising out of their relationship with the Company. The terms of such obligations vary. Generally, a maximum obligation is not explicitly stated.
Additionally, the Company issues purchase orders to suppliers for equipment, materials, and supplies in the normal course of business. These purchase commitments are generally for volumes consistent with anticipated requirements to fulfill purchase orders or contracts for product deliveries received, or expected to be received, from customers and would be subject to reimbursement if a cost-plus contract is terminated.
The Company provides product warranties in conjunction with certain product sales. The majority of the Company’s warranties are a one-year standard warranty for parts, workmanship, and compliance with specifications. On occasion, the Company has made commitments beyond the standard warranty obligation. While the Company has contracts with warranty provisions, there is not a history of any significant warranty claims experience. A reserve for warranty exposure is made on a product by product basis when it is both estimable and probable. These costs are included in the program’s estimate at
90
completion and are expensed in accordance with the Company’s revenue recognition methodology as allowed under GAAP for that particular contract.
Note 9. Stockholders’ Equity
a. Preference Stock
As of December 31, 2017 and 2016, 15.0 million shares of preferred stock were authorized and none were issued or outstanding.
b. Common Stock
As of December 31, 2017, the Company had 150.0 million authorized shares of common stock, par value $0.10 per share, of which 73.6 million shares were issued and outstanding, and 20.2 million shares were reserved for future issuance for the exercise of stock options (seven and ten year contractual life) and restricted stock (no maximum contractual life), payment of awards under stock-based compensation plans, and conversion of the Company’s convertible debt.
c. Treasury Stock
The Company has repurchased 3.5 million of its common shares at a cost of $64.5 million. The Company reflects stock repurchases in its financial statements on a “settlement” basis.
d. Stock-based Compensation
Total stock-based compensation expense (benefit) by type of award was as follows:
Year Ended | One month ended | ||||||||||||||
December 31, | December 31, | November 30, | December 31, | ||||||||||||
2017 | 2016 | 2015 | 2015 | ||||||||||||
(In millions) | |||||||||||||||
SARs | $ | 9.3 | $ | 2.2 | $ | 1.8 | $ | (1.4 | ) | ||||||
Restricted stock, service based | 4.1 | 3.6 | 5.6 | 0.3 | |||||||||||
Restricted stock, performance based | 6.8 | 5.7 | 0.1 | 0.6 | |||||||||||
Employee stock purchase plan ("ESPP") | 0.6 | 0.5 | 0.3 | — | |||||||||||
Stock options | 1.2 | 0.9 | 0.8 | 0.1 | |||||||||||
Total stock-based compensation expense (benefit) | $ | 22.0 | $ | 12.9 | $ | 8.6 | $ | (0.4 | ) | ||||||
Stock Appreciation Rights: As of December 31, 2017, a total of 1.0 million SARs were outstanding under the 1999 Equity and Performance Incentive Plan (“1999 Plan”) and 2009 Equity and Performance Incentive Plan (“2009 Plan”). SARs granted to employees generally vest in one-third increments at one year, two years, and three years from the date of grant and have a ten year contractual life under the 1999 Plan and a seven year contractual life under the 2009 Plan. SARs granted to directors of the Company typically vest over a one year service period (half after six months and half after one year) and have a ten year contractual life under the 1999 Plan and a seven year contractual life under the 2009 Plan. These awards are similar to the Company’s employee stock options, but are settled in cash rather than in shares of common stock, and are classified as liability awards. Compensation cost for these awards is determined using a fair-value method and remeasured at each reporting date until the date of settlement.
A summary of the status of the Company’s SARs as of December 31, 2017 and changes during fiscal 2017:
SARs (In millions) | Weighted Average Exercise Price | Weighted Average Remaining Contractual Life (years) | Aggregate Intrinsic Value (In millions) | |||||||||
Outstanding at December 31, 2016 | 1.0 | $ | 11.52 | |||||||||
Granted | 0.4 | 22.35 | ||||||||||
Exercised | (0.3 | ) | 6.97 | |||||||||
Canceled | (0.1 | ) | 17.21 | |||||||||
Outstanding at December 31, 2017 | 1.0 | $ | 16.62 | 4.7 | $ | 14.6 | ||||||
Exercisable at December 31, 2017 | 0.2 | $ | 8.17 | 1.2 | $ | 5.4 | ||||||
The weighted average grant date fair value for SARs granted in fiscal 2017 and 2016 was $15.41 and $7.66, respectively. No SARs were granted in fiscal 2015 and the one month ended December 31, 2015. The total intrinsic value for SARs liabilities paid in fiscal 2017, 2016, and 2015 was $4.9 million, $2.3 million, and $3.3 million, respectively. As of
91
December 31, 2017, there was $7.5 million of total stock-based compensation related to nonvested SARs. That cost is expected to be recognized over an estimated weighted-average amortization period of 23 months.
Restricted Stock, service-based: As of December 31, 2017, a total of 0.4 million shares of service-based restricted stock were outstanding which vest based on years of service under the 2009 Plan. Restricted shares are granted to key employees and directors of the Company. The fair value of the restricted stock awards was based on the closing market price of the Company’s common stock on the date of award and is being amortized on a straight line basis over the service period.
A summary of the status of the Company’s service-based restricted stock as of December 31, 2017 and changes during fiscal 2017:
Service Based Restricted Stock (In millions) | Weighted Average Grant Date Fair Value | |||||
Outstanding at December 31, 2016 | 0.6 | $ | 18.06 | |||
Granted | 0.1 | 24.98 | ||||
Exercised | (0.3 | ) | 18.12 | |||
Outstanding at December 31, 2017 | 0.4 | $ | 20.14 | |||
Expected to vest at December 31, 2017 | 0.4 | $ | 20.14 | |||
As of December 31, 2017, there was $5.0 million of total stock-based compensation related to nonvested service-based restricted stock. That cost is expected to be recognized over an estimated weighted-average amortization period of six months. At December 31, 2017, the intrinsic value of the service-based restricted stock outstanding and expected to vest was $11.7 million. The weighted average grant date fair values for service-based restricted stock granted in fiscal 2016 and 2015 was $17.65 and $20.70, respectively.
Restricted Stock, performance-based Company metrics: As of December 31, 2017, a total of 1.0 million shares of performance-based restricted shares were outstanding under the 2009 Plan. The performance-based restricted stock vests if the Company meets various operations and earnings targets set by the Organization & Compensation Committee of the Board of Directors. The fair value of the performance-based restricted stock awards was based on the closing market price of the Company’s common stock on the date of award and is being amortized over the estimated service period to achieve the operations and earnings targets.
A summary of the status of the Company’s performance-based restricted stock as of December 31, 2017 and changes during fiscal 2017:
Performance Based Restricted Stock (In millions) | Weighted Average Grant Date Fair Value | |||||
Outstanding at December 31, 2016 | 1.1 | $ | 17.85 | |||
Granted | 0.5 | 22.35 | ||||
Exercised | (0.3 | ) | 15.80 | |||
Canceled | (0.3 | ) | 18.48 | |||
Outstanding at December 31, 2017 | 1.0 | $ | 19.73 | |||
Expected to vest at December 31, 2017 | 0.6 | $ | 19.74 | |||
As of December 31, 2017, there was $4.9 million of total stock-based compensation related to nonvested performance-based restricted stock. That cost is expected to be recognized over an estimated weighted-average amortization period of 17 months. At December 31, 2017, the intrinsic value of the performance-based restricted stock outstanding was $32.7 million and the intrinsic value of the performance-based restricted stock expected to vest was $17.8 million. The weighted average grant date fair values for performance-based restricted stock granted in fiscal 2016 and 2015 was $15.97 and $21.33, respectively.
Employee Stock Purchase Plan: The ESPP enables eligible employees the opportunity to purchase the Company’s common stock at a price not less than 85% of the fair market value of the common stock on the last day of the respective offering period. A maximum of 1.5 million shares are authorized for issuance under the ESPP under the 2009 Plan. During fiscal 2017, 0.1 million shares were issued under the ESPP at an average price of $25.43 per share. During fiscal 2016, 0.2 million shares were issued under the ESPP at an average price of $18.11 per share. During the one month ended December 31, 2015, 0.1 million shares were issued under the ESPP at an average price of $15.66 per share. During fiscal 2015, 0.1 million shares were issued under the ESPP at an average price of $20.61 per share.
92
Stock Options: As of December 31, 2017, a total of 0.4 million stock options were outstanding under the 1999 Plan and 2009 Plan. The stock options granted in fiscal 2016 related to an award granted to the Executive Chairman, see the discussion below.
A summary of the status of the Company’s stock options as of December 31, 2017 and changes during fiscal 2017:
Stock Options (In millions) | Weighted Average Exercise Price | Weighted Average Remaining Contractual Life (years) | Intrinsic Value (In millions) | |||||||||
Outstanding at December 31, 2016 | 0.6 | $ | 15.48 | |||||||||
Exercised | (0.2 | ) | 6.54 | |||||||||
Outstanding at December 31, 2017 | 0.4 | $ | 18.86 | 4.6 | $ | 5.1 | ||||||
Exercisable at December 31, 2017 | 0.3 | $ | 17.09 | 4.8 | $ | 4.1 | ||||||
Expected to vest at December 31, 2017 | 0.1 | $ | 23.06 | 4.2 | $ | 1.0 | ||||||
The total intrinsic value for options exercised in fiscal 2017, 2016, and 2015 was $2.9 million, $2.1 million, and $3.9 million, respectively. No options were exercised in the one month ended December 31, 2015. The weighted average grant date fair value for stock options granted in fiscal 2016 and 2015 was $18.01 and $23.04.
The following table summarizes the range of exercise prices and weighted-average exercise prices for options outstanding as of December 31, 2017 under the Company’s stock option plans:
Outstanding | |||||||||||
Period Granted | Range of Exercise Prices | Stock Options Outstanding (In millions) | Weighted Average Exercise Price | Weighted Average Remaining Contractual Life (years) | |||||||
Fiscal 2015 | $20.48 - $23.06 | 0.2 | $ | 23.03 | 4.2 | ||||||
Fiscal 2016 | $18.01 | 0.2 | $ | 18.01 | 5.6 | ||||||
0.4 | |||||||||||
Common Shares and Stock Options, performance-based: In August 2016, the Company granted the Executive Chairman 0.2 million performance-based common shares and 0.2 million performance-based stock options that vest according to the attainment of share prices ranging from $22.00 per share to $27.00 per share of the Company's stock. The performance-based common shares were valued at a weighted average price of $12.99 using a Monte Carlo model. The performance-based stock options were valued at a weighted average price of $5.81 using a Monte Carlo model. The Company recognized the grant-date fair value of these awards as stock-based compensation expense ratably over the estimated vesting period based on the number of awards expected to vest at each reporting date or earlier if the market condition was satisfied. All of the performance based awards vested during fiscal 2017 as a result of the attainment of share prices. The Company used the following weighted average assumptions to value the awards for the year ended December 31, 2016:
Performance- based common shares | Performance-based stock options | ||||
Expected life (in years) | 1.04 | 0.99 | |||
Volatility | 32.97 | % | 39.58 | % | |
Risk-free interest rate | 1.17 | % | 1.43 | % | |
The Monte Carlo Model requires a single expected dividend yield as an input. The Senior Credit Facility restricts the payment of dividends and the Company does not anticipate paying cash dividends in the foreseeable future. Accordingly, the Company did not apply an expected dividend yield to the Monte Carlo Model.
93
Valuation Assumptions: The fair value of stock options was estimated using a Black-Scholes Model (except for the performance-based stock options discussed in the section above) with the following weighted average assumptions:
Year ended | ||
November 30, | ||
2015 | ||
Expected life (in years) | 7.0 | |
Volatility | 58.06 | % |
Risk-free interest rate | 1.94 | % |
The Company did not grant any stock options during fiscal 2017.
The fair value of SARs was estimated using a Black-Scholes Model with the following weighted average assumptions:
Year Ended | One month ended | ||||||||||
December 31, | December 31, | November 30, | December 31, | ||||||||
2017 | 2016 | 2015 | 2015 | ||||||||
Expected life (in years) | 4.8 | 4.0 | 2.1 | 2.0 | |||||||
Volatility | 34.00 | % | 36.00 | % | 34.00 | % | 34.00 | % | |||
Risk-free interest rate | 2.23 | % | 1.65 | % | 0.94 | % | 0.79 | % | |||
Expected Term: The Company’s expected term represents the period that the Company’s stock-based awards are expected to be outstanding and was determined based on historical experience of similar awards, giving consideration to the contractual terms of the stock-based awards and vesting schedules.
Expected Volatility: The fair value of stock-based payments was determined using the Black-Scholes Model with a volatility factor based on the Company’s historical stock prices. The range of expected volatility used in the Black-Scholes Model was 32.2% to 42.7% as of December 31, 2017.
Expected Dividend: The Black-Scholes Model requires a single expected dividend yield as an input. The Senior Credit Facility restricts the payment of dividends and the Company does not anticipate paying cash dividends in the foreseeable future. Accordingly, the Company did not apply an expected dividend yield to the Black-Scholes Model for all periods presented.
Risk-Free Interest Rate: The Company bases the risk-free interest rate used in the Black-Scholes Model on the implied yield currently available on U.S. Treasury zero-coupon issues with an equivalent remaining term. The range of risk-free interest rates used in the Black-Scholes Model was 1.66% to 2.40% as of December 31, 2017.
94
Note 10. Operating Segments and Related Disclosures
The Company’s operations are organized into two operating segments based on different products and customer bases: Aerospace and Defense, and Real Estate. Sales to significant customers and other concentrations information is presented in Note 1(u). The accounting policies of the operating segments are the same as those described in the summary of significant accounting policies (see Note 1).
The Company evaluates its operating segments based on several factors, of which the primary financial measure is segment performance. Segment performance represents net sales less applicable costs, expenses and unusual items relating to the segment operations. Segment performance excludes corporate income and expenses, unusual items not related to the segment operations, interest expense, interest income, and income taxes.
Selected financial information for each reportable segment:
Year Ended | One month ended | ||||||||||||||
December 31, | December 31, | November 30, | December 31, | ||||||||||||
2017 | 2016 | 2015 | 2015 | ||||||||||||
(In millions) | |||||||||||||||
Net Sales: | |||||||||||||||
Aerospace and Defense | $ | 1,870.8 | $ | 1,753.9 | $ | 1,660.0 | $ | 95.8 | |||||||
Real Estate | 6.4 | 7.4 | 48.3 | 0.5 | |||||||||||
Total Net Sales | $ | 1,877.2 | $ | 1,761.3 | $ | 1,708.3 | $ | 96.3 | |||||||
Segment Performance: | |||||||||||||||
Aerospace and Defense | $ | 202.9 | $ | 184.1 | $ | 165.7 | $ | 19.6 | |||||||
Environmental remediation provision adjustments | (7.5 | ) | (18.3 | ) | (16.6 | ) | 0.1 | ||||||||
Retirement benefits, net (1) | (19.5 | ) | (22.5 | ) | (50.2 | ) | (4.1 | ) | |||||||
Unusual items | 2.0 | — | (50.0 | ) | (0.4 | ) | |||||||||
Aerospace and Defense Total | 177.9 | 143.3 | 48.9 | 15.2 | |||||||||||
Real Estate | 2.5 | 4.3 | 34.4 | 0.2 | |||||||||||
Total Segment Performance | $ | 180.4 | $ | 147.6 | $ | 83.3 | $ | 15.4 | |||||||
Reconciliation of segment performance to income (loss) before income taxes: | |||||||||||||||
Segment performance | $ | 180.4 | $ | 147.6 | $ | 83.3 | $ | 15.4 | |||||||
Interest expense | (30.9 | ) | (32.5 | ) | (50.4 | ) | (3.8 | ) | |||||||
Interest income | 3.5 | 0.6 | 0.3 | — | |||||||||||
Stock-based compensation | (22.0 | ) | (12.9 | ) | (8.6 | ) | 0.4 | ||||||||
Corporate retirement benefits | (20.0 | ) | (18.9 | ) | (17.4 | ) | (1.5 | ) | |||||||
Corporate and other | (23.1 | ) | (20.1 | ) | (22.1 | ) | (1.5 | ) | |||||||
Unusual items | (1.0 | ) | (34.5 | ) | (1.9 | ) | — | ||||||||
Income (loss) before income taxes | $ | 86.9 | $ | 29.3 | $ | (16.8 | ) | $ | 9.0 | ||||||
Aerospace and Defense | $ | 29.3 | $ | 46.4 | $ | 36.8 | $ | 1.2 | |||||||
Real Estate | — | — | — | — | |||||||||||
Corporate | 0.1 | 1.2 | — | — | |||||||||||
Capital Expenditures | $ | 29.4 | $ | 47.6 | $ | 36.8 | $ | 1.2 | |||||||
Aerospace and Defense | $ | 71.6 | $ | 64.2 | $ | 64.4 | $ | 5.0 | |||||||
Real Estate | 0.7 | 0.6 | 0.7 | 0.1 | |||||||||||
Corporate | 0.3 | 0.1 | — | — | |||||||||||
Depreciation and Amortization | $ | 72.6 | $ | 64.9 | $ | 65.1 | $ | 5.1 | |||||||
________
(1) Retirement benefits are net of cash funding to the Company's tax-qualified defined benefit pension plan which are recoverable costs under its U.S. government contracts. The Company's recoverable tax-qualified pension costs in fiscal 2017 and 2016 totaled $33.7 million and $27.5 million, respectively.
95
As of December 31, | |||||||
2017 | 2016 | ||||||
(In millions) | |||||||
Assets: | |||||||
Aerospace and Defense (1) | $ | 1,477.8 | $ | 1,571.3 | |||
Real Estate | 125.9 | 128.7 | |||||
Operating segment assets | 1,603.7 | 1,700.0 | |||||
Corporate | 655.0 | 549.5 | |||||
Total Assets | $ | 2,258.7 | $ | 2,249.5 | |||
_________
(1) | The Aerospace and Defense operating segment had $161.3 million and $158.1 million of goodwill as of December 31, 2017 and 2016, respectively. In addition, as of December 31, 2017 and 2016, intangible assets balances (other than goodwill) were $85.5 million and $94.4 million, respectively, in the Aerospace and Defense operating segment. |
Note 11. Cost Reduction Plans
During fiscal 2015, the Company initiated the first phase ("Phase I") of the competitive improvement program (the "CIP”) comprised of activities and initiatives aimed at reducing costs in order for the Company to continue to compete successfully. Phase I is composed of three major components: (i) facilities optimization and footprint reduction; (ii) product affordability; and (iii) reduced administrative and overhead costs. On April 6, 2017, the Board of Directors approved the second phase (“Phase II”) of the Company’s previously announced CIP. Pursuant to Phase II, the Company plans to expand its CIP and further consolidate its Sacramento, California, and Gainesville, Virginia sites, while centralizing and expanding its existing presence in Huntsville, Alabama. The Company currently estimates that it will incur restructuring and related costs of the Phase I and II programs of approximately $235.1 million (including approximately $60.5 million of capital expenditures). The Company has incurred $79.5 million of such costs through December 31, 2017, including $32.5 million in capital expenditures. A summary of the Company's severance and retention liabilities related to Phase I and II activity is shown below:
Severance | Retention | Total | |||||||||
(In millions) | |||||||||||
November 30, 2014 | $ | — | $ | — | $ | — | |||||
Accrual established | 12.9 | 2.7 | 15.6 | ||||||||
Payments | (1.8 | ) | — | (1.8 | ) | ||||||
November 30, 2015 | 11.1 | 2.7 | 13.8 | ||||||||
Accrual | (0.2 | ) | 0.2 | — | |||||||
Payments | — | (1.2 | ) | (1.2 | ) | ||||||
December 31, 2015 | 10.9 | 1.7 | 12.6 | ||||||||
Accrual | — | 2.3 | 2.3 | ||||||||
Payments | (0.9 | ) | (1.9 | ) | (2.8 | ) | |||||
Adjustments | (3.2 | ) | — | (3.2 | ) | ||||||
December 31, 2016 | 6.8 | 2.1 | 8.9 | ||||||||
Accrual | 26.1 | 2.2 | 28.3 | ||||||||
Payments | (2.9 | ) | (0.9 | ) | (3.8 | ) | |||||
December 31, 2017 | $ | 30.0 | $ | 3.4 | $ | 33.4 | |||||
The costs associated with the CIP will be a component of the Company’s U.S. government forward pricing rates, and therefore, will be recovered through the pricing of the Company’s products and services to the U.S. government. In addition to the employee-related CIP obligations, the Company incurred non-cash accelerated depreciation expense of $3.9 million, $0.7 million and $0.8 million in fiscal 2017, 2016, and 2015, respectively, associated with changes in the estimated useful life of long-lived assets impacted by the CIP.
96
Note 12. | Quarterly Financial Data (Unaudited) |
First Quarter | Second Quarter | Third Quarter | Fourth Quarter | ||||||||||||
(In millions, except per share amounts) | |||||||||||||||
Fiscal 2017 | |||||||||||||||
Net sales | $ | 405.3 | $ | 459.6 | $ | 484.1 | $ | 528.2 | |||||||
Cost of sales (exclusive of items shown separately on Statement of Operations) | 352.7 | 383.9 | 417.1 | 461.7 | |||||||||||
Income before income taxes | 9.2 | 36.2 | 18.6 | 22.9 | |||||||||||
Net income (loss) | 5.9 | 24.3 | 12.6 | (52.0 | ) | ||||||||||
Basic and Diluted net income (loss) per share | 0.08 | 0.32 | 0.17 | (0.71 | ) | ||||||||||
First Quarter | Second Quarter | Third Quarter | Fourth Quarter | ||||||||||||
(In millions, except per share amounts) | |||||||||||||||
Fiscal 2016 | |||||||||||||||
Net sales | $ | 356.9 | $ | 408.4 | $ | 463.8 | $ | 532.2 | |||||||
Cost of sales (exclusive of items shown separately on Statement of Operations) | 309.7 | 356.5 | 405.4 | 455.8 | |||||||||||
Income (loss) before income taxes | 8.6 | 11.5 | (25.3 | ) | 34.4 | ||||||||||
Net income (loss) | 5.1 | 5.9 | (11.1 | ) | 18.1 | ||||||||||
Basic net income (loss) per share | 0.08 | 0.09 | (0.17 | ) | 0.26 | ||||||||||
Diluted net income (loss) per share | 0.08 | 0.09 | (0.17 | ) | 0.25 | ||||||||||
Note 13. | Unusual Items |
Total unusual items, comprised of a component of other expense, net and loss on debt in the consolidated statements of operations, was as follows:
Year Ended | One month ended | ||||||||||||||
December 31, | December 31, | November 30, | December 31, | ||||||||||||
2017 | 2016 | 2015 | 2015 | ||||||||||||
(In millions) | |||||||||||||||
Aerospace and Defense: | |||||||||||||||
(Gain) loss on legal matters and settlements (1) | $ | (2.0 | ) | $ | — | $ | 50.0 | $ | 0.4 | ||||||
Aerospace and defense unusual items | (2.0 | ) | — | 50.0 | 0.4 | ||||||||||
Corporate: | |||||||||||||||
Loss on debt repurchased (2) | — | 34.4 | 1.9 | — | |||||||||||
Acquisition costs (1) | 1.0 | — | — | ||||||||||||
Loss on bank amendment (1) | — | 0.1 | — | — | |||||||||||
Corporate unusual items | 1.0 | 34.5 | 1.9 | — | |||||||||||
Total unusual items | $ | (1.0 | ) | $ | 34.5 | $ | 51.9 | $ | 0.4 | ||||||
________
(1) Operating (income) expense
(2) Non-operating expense
Fiscal 2017 Activity:
The Company recorded $2.0 million of realized gains, net of interest associated with the failure to register with the SEC the issuance of certain of the Company’s common shares under the defined contribution 401(k) employee benefit plan (see Note 3(l)).
The Company recorded $1.0 million of costs related to the acquisition of Coleman (see Note 4).
Fiscal 2016 Activity:
97
On July 18, 2016, the Company redeemed $460.0 million principal amount of its 7 1/8% Notes, representing all of the outstanding 7 1/8% Notes, at a redemption price equal to 105.344% of the principal amount, plus accrued and unpaid interest. The Company incurred a pre-tax charge of $34.1 million in the third quarter of fiscal 2016 associated with the extinguishment of the 7 1/8% Notes. The $34.1 million pre-tax charge was the result of the $24.6 million paid in excess of the par value and $9.5 million associated with the write-off of unamortized deferred financing costs. The Company funded the redemption in part through a $400.0 million term loan under the Company's Senior Credit Facility.
The Company retired $13.0 million principal amount of its delayed draw term loan resulting in a loss of $0.3 million.
The Company recorded a charge of $0.1 million associated with an amendment to the Senior Credit Facility.
Fiscal 2015 Activity:
The Company recorded an expense of $50.0 million associated with a legal settlement.
The Company retired $76.0 million principal amount of its delayed draw term loan resulting in $1.9 million of losses associated with the write-off of deferred financing fees.
December 2015 Activity:
The Company recorded $0.4 million for realized losses and interest associated with the failure to register with the SEC the issuance of certain of the Company’s common shares under the defined contribution 401(k) employee benefit plan.
Item 9. Changes in and Disagreements with Accountants on Accounting and Financial Disclosure
None.
Item 9A. Controls and Procedures
Disclosure Controls and Procedures
As of December 31, 2017, we conducted an evaluation under the supervision and with the participation of our management, including our Chief Executive Officer and Chief Financial Officer, of the effectiveness of the design and operation of our disclosure controls and procedures. The term “disclosure controls and procedures,” as defined in Rules 13a-15(e) and 15d-15(e) under the Securities Exchange Act of 1934, as amended (“Exchange Act”), means controls and other procedures of a company that are designed to provide reasonable assurance that information required to be disclosed by the Company in the reports it files or submits under the Exchange Act is recorded, processed, summarized and reported, within the time periods specified in the SEC’s rules and forms. Disclosure controls and procedures are also designed to provide reasonable assurance that such information is accumulated and communicated to the Company’s management, including its Chief Executive Officer and Chief Financial Officer, to allow timely decisions regarding required disclosure. Based on this evaluation, our Chief Executive Officer and Chief Financial Officer concluded as of December 31, 2017 that our disclosure controls and procedures were effective at the reasonable assurance level.
Management’s Report on Internal Control Over Financial Reporting
Our management is responsible for establishing and maintaining adequate “internal control over financial reporting,” as defined in Rules 13a-15(f) and 15d-15(f) under the Exchange Act. The rules define internal control over financial reporting as a process designed by, or under the supervision of, the Company’s Chief Executive Officer and Chief Financial Officer, to provide reasonable assurance regarding the reliability of financial reporting and the preparation of financial statements for external purposes in accordance with generally accepted accounting principles. Our internal control over financial reporting includes those policies and procedures that:
• | Pertain to the maintenance of records that, in reasonable detail, accurately and fairly reflect the transactions and dispositions of the assets of the Company; |
• | Provide reasonable assurance that transactions are recorded as necessary to permit preparation of financial statements in accordance with generally accepted accounting principles, and that receipts and expenditures of the Company are being made only in accordance with authorizations of management and directors of the Company; and |
• | Provide reasonable assurance regarding prevention or timely detection of unauthorized acquisition, use or disposition of the Company’s assets that could have a material effect on the financial statements. |
Because of its inherent limitations, internal control over financial reporting may not prevent or detect misstatements. In addition, projections of any evaluation of effectiveness to future periods are subject to the risk that controls may become inadequate because of changes in conditions, or that the degree of compliance with the policies or procedures may deteriorate.
With the participation of the Chief Executive Officer and the Chief Financial Officer, our management conducted an evaluation of the effectiveness of our internal control over financial reporting based on the criteria established in Internal Control - Integrated Framework (2013) issued by the Committee of Sponsoring Organizations of the Treadway Commission
98
(“COSO”). Based on this evaluation, our management has concluded that our internal control over financial reporting was effective as of December 31, 2017.
The effectiveness of our internal control over financial reporting as of December 31, 2017 has been audited by PricewaterhouseCoopers LLP, our independent registered public accounting firm. Their report appears in Item 8 of this Form 10-K.
Remediation of Prior Year Material Weakness
We previously identified and disclosed in our Form 10-K for the year ended December 31, 2016, as well as in our Forms 10-Q for each interim period in fiscal 2017, a material weakness in our internal control over financial reporting as we did not maintain adequate controls over the completeness and accuracy of our accounting for income taxes, including the income tax provision and related tax assets and liabilities.
Throughout fiscal 2017, we implemented changes to our processes to improve our internal control over financial reporting related to the controls over the completeness and accuracy of our accounting for income taxes. The following steps have been taken to remediate the conditions leading to the above stated material weakness:
• | Management has strengthened the income tax function by hiring additional key internal tax personnel with the requisite background and knowledge. |
• | Beginning in the third quarter of fiscal 2017, management, including the key tax resources noted above, has designed and implemented quarterly controls to validate the completeness and accuracy of financial information utilized in the preparation of our income tax provision, including the related income tax assets and liabilities. |
• | During the fourth quarter of fiscal 2017, key tax resources, including the Vice President and Director of Tax, designed and implemented an annual control to validate the tax return-to-provision adjustment to ensure the completeness and accuracy of our deferred tax balances. |
Changes in Internal Control Over Financial Reporting
The control implemented during the fourth quarter of fiscal 2017, as described in the “Remediation of Prior Year Material Weakness” section above, was a change in internal control over financial reporting that occurred during the most recent fiscal quarter that has materially affected, or is reasonably likely to materially affect, the effectiveness of our internal control over financial reporting.
Item 9B. Other Information
On February 20, 2018, the Company appointed Daniel L. Boehle, Vice President and Controller, to serve as the Company’s principal accounting officer for purposes of its filings with the U.S. Securities and Exchange Commission.
Mr. Boehle, 46, has served as the Company’s Vice President and Controller since August 2017. Prior to joining the Company, Mr. Boehle held several senior level accounting positions with Northrop Grumman Corporation (“Northrop”), including as Director, Aerospace Systems Sector Financial Planning, Reporting, and Analysis from February 2013 through July 2017, and as Director, Corporate Internal Audit - Financial Audits from June 2012 to January 2013. Before joining Northrop in 2001, Mr. Boehle was an Audit Senior Manager with KPMG LLP. Mr. Boehle is a certified public accountant in the State of California and holds a bachelor’s degree in Accounting from Loyola Marymount University and a master’s degree in Business Administration from UCLA.
The Company has not entered into or amended any material plan, contract or arrangement in connection with Mr. Boehle’s appointment to serve as principal accounting officer. Mr. Boehle does not have any family relationships with any of the directors, executive officers, or any people nominated or chosen by the Company to become a director or executive officer. Mr. Boehle is not a party to any transactions listed in Item 404(a) of Regulation S-K.
PART III
Item 10. Directors, Executive Officers and Corporate Governance
Directors of the Registrant
Information with respect to directors of the Company who will stand for election at the 2018 Annual Meeting of Stockholders is set forth under the heading “PROPOSAL 1 - ELECTION OF DIRECTORS” in our 2018 Proxy Statement for our 2018 Annual Meeting of Stockholders (“2018 Proxy Statement”), which will be filed with the SEC within 120 days after the close of our fiscal year. Such information is incorporated herein by reference.
The information in our 2018 Proxy Statement set forth under the caption “Section 16(a) Beneficial Ownership Reporting Compliance” is incorporated herein by reference. Information regarding stockholder communications with our Board of Directors may be found under the caption “Communications with Directors” in our 2018 Proxy Statement and is incorporated herein by reference.
99
Executive Officers of the Registrant
The following is as of February 15, 2018:
Name | Title | Other Business Experience | Age | |||
Warren G. Lichtenstein | Executive Chairman (since June 2016) | Chairman, March 2013 - June 2016 (Director since 2008); Executive Chairman of Steel Partners Holdings GP Inc., the general partner of Steel Partners Holdings L.P. February 2013 - Present; Chairman and CEO of general partner of Steel Partners Holdings L.P. July 2009 - February 2013; Chairman, Handy & Harman Ltd. (formerly known as WHX Corporation) July 2005 - Present; Executive Chairman, ModusLink June 2016 - Present; Interim CEO, ModusLink March 2016 - June 2016; Chairman, ModusLink March 2013 - June 2016. Chairman Steel Excel May 2011 - Present (director since 2010); Director SL Industries, Inc. March 2010 - Present; Director (formerly Chairman) SL Industries January 2002 - May 2008; CEO SL Industries February 2002 - August 2005. | 52 | |||
Eileen P. Drake | Chief Executive Officer and President (since June 2015) | Chief Operating Officer, March 2015 - June 2015; Director, Woodward, Inc. February 2017 - Present; President of Pratt & Whitney AeroPower’s auxiliary power unit and small turbojet propulsion business, UTC 2012 - 2015; VP of Operations, UTC 2009 - 2012; VP of Quality, Environmental Health & Safety, and Achieving Competitive Excellence, UTC 2003 - 2009; Product Line Manager and Plant Manager, Ford Motor Company 1996 - 2003; United States Army 1989 - 1996. | 52 | |||
Mark A. Tucker | Chief Operating Officer (since June 2015) | Senior VP, Enterprise Operations and Engineering, Aerojet Rocketdyne, Inc. October 2013 - June 2015; VP Special Programs, Aerospace Systems Sector, Northrop Grumman 1983 - 2013. | 59 | |||
Paul R. Lundstrom | Vice President, Chief Financial Officer (since November 2016) | VP, Investor Relations, UTC 2014 - 2016; VP, Chief Financial Officer, Building & Industrial systems - North Asia (a UTC division) 2013 - 2014; VP, Chief Financial Officer, Climate/Controls/Security - Asia (a UTC division) 2011 - 2013; VP, Chief Financial Officer, Carrier Building Systems and Services, Carrier Corporation (a UTC division) 2009 - 2011. | 42 | |||
100
John D. Schumacher | Vice President, Washington Operations (since June 2015) | VP, Business Relations April 2013 - June 2015; President, Aerojet Rocketdyne Foundation since October 2013; President, Astrium Americas and VP, Space, EADS North America April 2011 - April 2013; VP, Washington Operations, Aerojet May 2006 - April 2011; Director, Whitney, Bradley & Brown Consulting September 2005 - May 2006; Chief of Staff, National Aeronautics and Space Administration (“NASA”) May 2003 - September 2005; Associate Administrator for External Relations, NASA 1994 - 2003; Deputy Associate Administrator, NASA 1990 - 1994; Advisor to the Administrator, NASA 1989 - 1990; Associate, Rogers & Wells, NY, 1987 - 1989; Captain, Naval Reserve 1984 - 2006; Active Duty U.S. Navy 1972 - 1984. | 63 | |||
Arjun L. Kampani | Vice President, General Counsel and Secretary (since April 2016) | VP, General Counsel and Corporate Secretary, General Dynamics Land Systems, Inc. 2010 - 2016; Director & Assistant General Counsel, Mergers and Acquisitions, General Dynamics Corporation 2006 - 2009; Assistant General Counsel and Assistant Corporate Secretary, Anteon International Corporation 2004 - 2006; Attorney, Business and Finance Department, Thelen Reid & Priest, LLP 1999 - 2004. | 46 | |||
Gregory A. Jones | Senior Vice President, Strategy and Business Development (since February 2018) | VP, Corporate Business Development & International Programs, Orbital ATK February 2015 - January 2018; VP, Corporate Strategy & Business Development, Orbital Sciences Corporation, 2005 - 2015; Senior Director of Strategy & Business Development, IDS, The Boeing Company 2003 - 2005. | 56 | |||
The Company’s executive officers generally hold terms of office of one year and/or until their successors are elected and serve at the discretion of the Board.
Code of Ethics and Corporate Governance Guidelines
The Company has adopted a code of ethics known as the Code of Business Conduct that applies to the Company’s employees including the principal executive officer and principal financial officer. Amendments to the Code of Business Conduct and any grant of a waiver from a provision of the Code of Business Conduct requiring disclosure under applicable SEC rules will be disclosed on the Company’s website at www.AerojetRocketdyne.com. Copies of the Code of Business Conduct and the Company’s Corporate Governance Guidelines are available on the Company’s web site at www.AerojetRocketdyne.com (copies are available in print to any stockholder or other interested person who requests them by writing to Secretary, Aerojet Rocketdyne Holdings, Inc., 222 N. Sepulveda Blvd., Suite 500, El Segundo, California 90245).
Audit Committee and Audit Committee Financial Expert
Information regarding the Audit Committee and the Audit Committee’s Financial Expert is set forth under the heading “Board Committees” in our 2018 Proxy Statement and is incorporated herein by reference.
Item 11. Executive Compensation
Information concerning executive compensation may be found under the captions “Executive Compensation,” “2017 Director Compensation Table,” “Compensation Discussion and Analysis,” “Summary Compensation Table,” “2017 Grants of Plan-Based Awards,” “Outstanding Equity Awards at 2017 Fiscal Year End,” “2017 Option/SAR Exercises and Stock Vested,” “2017 Pension Benefits,” “2017 Non-Qualified Deferred Compensation,” “Potential Payments upon Termination of Employment or Change in Control,” “Employment Agreement and Indemnity Agreements,” “Director Compensation,” “Organization & Compensation Committee Report” and “Compensation Committee Interlocks and Insider Participation” of our 2018 Proxy Statement. Such information is incorporated herein by reference.
101
Item 12. Security Ownership of Certain Beneficial Owners and Management and Related Stockholder Matters
The information under the headings “Security Ownership of Certain Beneficial Owners” and “Security Ownership of Officers and Directors” in our 2018 Proxy Statement is incorporated herein by reference.
Equity Compensation Plan Information
The table below sets forth certain information regarding the following equity compensation plans of the Company, pursuant to which we have made equity compensation available to eligible persons, as of December 31, 2017: (i) 1999 Equity and Performance Incentive Plan; and (ii) 2009 Equity and Performance Incentive Plan. Both plans have been approved by our stockholders.
Plan Category | Number of Securities to be Issued Upon Exercise of Outstanding Options,Warrants and Rights | Weighted-Average Exercise Price of Outstanding Options, Warrants and Rights | Number of Securities Remaining Available for Future Issuance Under Equity Compensation Plans (Excluding Securities Reflected in Column (a)) | ||||||||
(a) | (b) | (c) | |||||||||
Equity compensation plans approved by stockholders | |||||||||||
Stock options | 412,694 | $ | 18.86 | ||||||||
Restricted shares (2) | — | ||||||||||
Total | 412,694 | $ | 18.86 | 2,902,177 | (1) | ||||||
Equity compensation plans not approved by stockholders (3) | — | N/A | — | ||||||||
Total | 412,694 | $ | 18.86 | 2,902,177 | |||||||
_________
(1) | As of December 31, 2017, there are no more shares available to be issued under any type of incentive award under the 1999 Equity and Performance Incentive Plan. The maximum number of shares available for issuance to participants under the 2009 Equity and Performance Incentive Plan is 7,450,000 shares, all of which may be awarded as incentive stock options. Subject to the total shares available to be issued under the plan, the following specific limits apply: (A) no more than 300,000 shares may be issued to nonemployee directors and no nonemployee director may receive more than 150,000 shares in any fiscal year; (B) no more than 200,000 shares subject to stock options, including incentive stock options, may be granted to any participant in any fiscal year; (C) no more than 200,000 shares subject to stock appreciation rights may be granted to any participant in any fiscal year; (D) no more than 200,000 shares may be granted to any participant in any fiscal year pursuant to an award of restricted stock or restricted stock units; (E) no more than 200,000 shares may be granted to any participant in any fiscal year pursuant to an award of performance shares or performance units; and (F) no more than 100,000 shares may be granted to any participant in any fiscal year pursuant to a stock-based award other than described above. |
(2) | As of December 31, 2017, 1,422,555 shares had been granted as restricted shares that had not yet vested. |
(3) | The Company also maintains the Aerojet Rocketdyne Holdings, Inc. and Participating Subsidiaries Deferred Bonus Plan. Prior to 2016, this plan allowed participating employees to defer a portion of their compensation for future distribution. All or a portion of such deferrals made prior to November 30, 2009 could be allocated to an account based on the Company’s common stock and does permit limited distributions in the form of Company common shares. However, distributions in the form of common shares are permitted only at the election of the Organization & Compensation Committee of the Board of Directors and, according to the terms of the plan, individuals serving as officers or directors of the Company are not permitted to receive distributions in the form of Company common shares until at least six months after such individual ceases to be an officer or director of the Company. The table does not include information about this plan because no options, warrants or rights are available under this plan and no specific number of shares is set aside under this plan as available for future issuance. Based upon the price of Company common shares on December 31, 2017, the maximum number of shares that could be distributed to employees not subject to the restrictions on officers and directors (if permitted by the Organization & Compensation Committee) would be 1,331. This plan was amended effective November 30, 2009 to prevent the application of future deferrals to the Company common stock investment program. |
Item 13. Certain Relationships and Related Transactions, and Director Independence
Information regarding certain transactions and employment agreements with management is set under the headings “Employment Agreement and Indemnity Agreements,” “Related Person Transaction Policy” and “Potential Payments upon Termination of Employment or Change in Control” in our 2018 Proxy Statement and is incorporated herein by reference.
102
Information regarding director independence is set forth under the heading “Determination of Independence of Directors” in our 2018 Proxy Statement and is incorporated herein by reference.
Item 14. Principal Accountant Fees and Services
The information in our 2018 Proxy Statement set forth under the captions “Proposal 3 - Ratification of the Appointment of Independent Auditors,” “Audit Fees,” “Audit-Related Fees,” “Tax Fees,” “All Other Fees,” and “Policy on Audit Committee Pre-Approval of Audit and Permissible Non-Audit Services of the Company’s Independent Auditors” is incorporated herein by reference.
Part IV
Item 15. Exhibits and Financial Statement Schedules
(a) | The following documents are filed as part of this report: |
(1) | FINANCIAL STATEMENTS |
Page Number | |
Report of Independent Registered Public Accounting Firm | |
Consolidated Statements of Operations for the twelve months ended December 31, 2017 and 2016, one month ended December 31, 2015, and for the twelve months ended November 30, 2015 | |
Consolidated Statements of Comprehensive Income (Loss) for the twelve months ended December 31, 2017 and 2016, one month ended December 31, 2015, and for the twelve months ended November 30, 2015 | |
Consolidated Balance Sheets as of December 31, 2017 and 2016 | |
Consolidated Statements of Stockholders’ Equity (Deficit) for the twelve months ended December 31, 2017 and 2016, one month ended December 31, 2015, and for the twelve months ended November 30, 2015 | |
Consolidated Statements of Cash Flows for the twelve months ended December 31, 2017 and 2016, one month ended December 31, 2015, and for the twelve months ended November 30, 2015 | |
Notes to Consolidated Financial Statements | |
(b) | EXHIBITS |
Refer to Exhibit Index.
Item 16. 10-K Summary
Not applicable.
103
SIGNATURES
Pursuant to the requirements of Section 13 or 15(d) of the Securities Exchange Act of 1934, the registrant has duly caused this report to be signed on its behalf by the undersigned, thereunto duly authorized.
February 21, 2018
Aerojet Rocketdyne Holdings, Inc. | ||||
By: | /s/ EILEEN P. DRAKE | |||
Eileen P. Drake | ||||
Chief Executive Officer and President | ||||
Pursuant to the requirements of the Securities Exchange Act of 1934, this report has been signed below by the following persons on behalf of the registrant and in the capacities and on the dates indicated.
Signature | Title | Date | |||
/s/ EILEEN P. DRAKE Eileen P. Drake | Chief Executive Officer, President and Director (Principal Executive Officer) | February 21, 2018 | |||
/s/ PAUL R. LUNDSTROM Paul R. Lundstrom | Vice President, Chief Financial Officer (Principal Financial Officer) | February 21, 2018 | |||
/s/ DANIEL L. BOEHLE Daniel L. Boehle | Vice President, Controller (Principal Accounting Officer) | February 21, 2018 | |||
* Warren G. Lichtenstein | Executive Chairman | February 21, 2018 | |||
* Thomas A. Corcoran | Director | February 21, 2018 | |||
* James R. Henderson | Director | February 21, 2018 | |||
* Lance W. Lord | Director | February 21, 2018 | |||
* Merrill A. McPeak | Director | February 21, 2018 | |||
* James H. Perry | Director | February 21, 2018 | |||
* Martin Turchin | Director | February 21, 2018 | |||
* By: | /s/ PAUL R. LUNDSTROM Paul R. Lundstrom | Attorney-in-Fact pursuant to Power of Attorney | February 21, 2018 | ||
104
EXHIBIT INDEX
Table Item No. | Exhibit Description |
2.1 | |
2.2 | |
3.1 | |
3.2 | |
3.3 | |
3.4 | |
4.1 | |
4.2 | |
4.3 | |
4.4 | |
4.5 | |
10.1 | |
10.2† | |
10.3† | |
10.4† | |
10.5† | |
10.6† | |
10.7† | |
10.8† | |
105
10.9† | ||
10.10† | ||
10.11† | ||
10.12† | ||
10.13† | ||
10.14† | ||
10.15† | ||
10.16† | ||
10.17 | ||
10.18† | ||
10.19† | ||
10.20† | ||
10.21† | ||
10.22† | ||
10.23† | ||
10.24† | ||
10.25 | ||
106
10.26 | |
10.27† | |
10.28† | |
10.29† | |
10.30 | |
10.31 | |
10.32† | |
10.33† | |
10.34† | |
10.35† | |
10.36† | |
10.37† | |
10.38† | |
10.39 | |
10.40† | |
10.41† | |
10.42† | |
10.43† | |
107
10.44† | |
21.1* | |
23.1* | |
24.1* | |
31.1* | |
31.2* | |
32.1* | |
101.INS | XBRL Instance Document |
101.SCH | XBRL Taxonomy Extension Schema |
101.CAL | XBRL Taxonomy Extension Calculation Linkbase |
101.DEF | XBRL Taxonomy Extension Definition Linkbase |
101.LAB | XBRL Taxonomy Extension Label Linkbase |
101.PRE | XBRL Taxonomy Extension Presentation Linkbase |
_____
* | Filed herewith. All other exhibits have been previously filed. |
** | Schedules and Exhibits have been omitted, but will be furnished to the SEC upon request. |
† | Management contract or compensatory plan or arrangement. |
108