Attached files
| file | filename |
|---|---|
| EX-99.2 - EX-99.2 - Trinseo S.A. | a18-6410_1ex99d2.htm |
| EX-99.1 - EX-99.1 - Trinseo S.A. | a18-6410_1ex99d1.htm |
| 8-K - 8-K - Trinseo S.A. | a18-6410_18k.htm |
Fourth Quarter and Full Year 2017 Financial Results February 19, 2018 ™ Trademark of Trinseo S.A. or its affiliates
Introductions & Disclosure Rules 2 Disclosure Rules Cautionary Note on Forward-Looking Statements. This presentation contains forward-looking statements including, without limitation, statements concerning plans, objectives, goals, projections, strategies, future events or performance, and underlying assumptions and other statements, which are not statements of historical facts or guarantees or assurances of future performance. Forward-looking statements may be identified by the use of words like “expect,” “anticipate,” “intend,” “forecast,” “outlook,” “will,” “may,” “might,” “potential,” “likely,” “target,” “plan,” “contemplate,” “seek,” “attempt,” “should,” “could,” “would” or expressions of similar meaning. Forward-looking statements reflect management’s evaluation of information currently available and are based on our current expectations and assumptions regarding our business, the economy and other future conditions. Because forward-looking statements relate to the future, they are subject to inherent uncertainties, risks and changes in circumstances that are difficult to predict. Factors that might cause such a difference include, but are not limited to, those discussed in our Annual Report on Form 10-K, under Part I, Item 1A — “Risk Factors” and elsewhere in that report. As a result of these or other factors, our actual results may differ materially from those contemplated by the forward-looking statements. Therefore, we caution you against relying on any of these forward-looking statements. The forward-looking statements included in this presentation are made only as of the date hereof. We undertake no obligation to publicly update or revise any forward-looking statement as a result of new information, future events or otherwise, except as otherwise required by law. This presentation contains financial measures that are not in accordance with generally accepted accounting principles in the US (“GAAP”) including Adjusted EBITDA, Adjusted Net Income, Adjusted EPS, and Free Cash Flow. We believe these measures provide relevant and meaningful information to investors and lenders about the ongoing operating results of the Company. Such measures when referenced herein should not be viewed as an alternative to GAAP measures of performance or liquidity, as applicable. We have provided a reconciliation of these measures to the most comparable GAAP metric in the Appendix section of this presentation. Introductions Chris Pappas, President & CEO Barry Niziolek, Executive Vice President & CFO David Stasse, Vice President, Treasury & Investor Relations

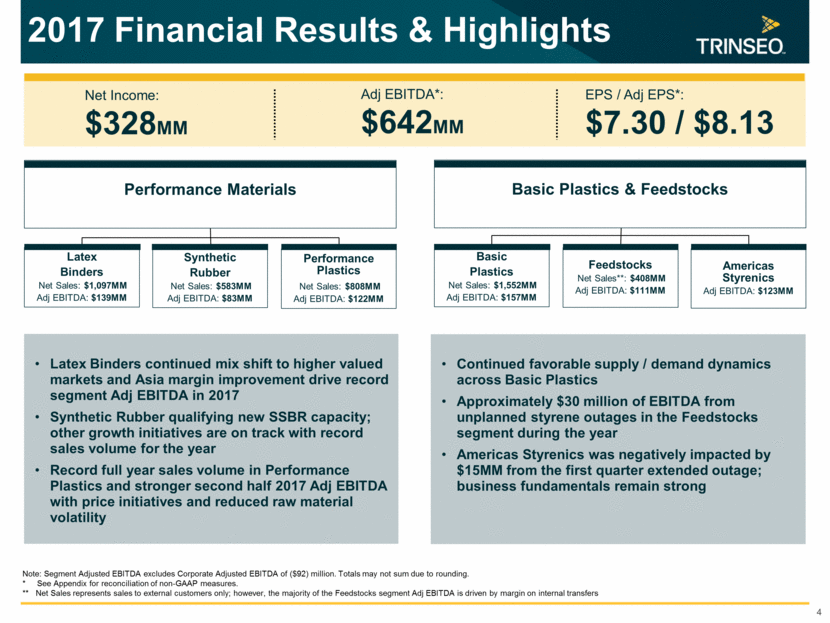
3 Key Points * See Appendix for reconciliation of non-GAAP measures. Q4 and Full Year 2017 Results Exceeded Guidance Q4 net income higher by $45MM including one-time gain of $22MM (pre-tax) from certain pension plan changes Q4 included higher than expected margins in Basic Plastics, Performance Plastics, and Latex Binders, partially offset by lower than expected Synthetic Rubber volumes Full year record net income, EPS, Adj EBITDA*, and Adj EPS* Continued Progress on Initiatives to meet Growth Targets On track for $100MM EBITDA growth from 2016 to 2019 Latex Binders improvement – record Adj EBITDA in 2017 Synthetic Rubber SSBR expansion and pilot plant onstream – ongoing product qualifications ABS plant in China onstream; ramping up sales Q1 2018 Outlook Net income of $104MM to $113MM, Diluted EPS of $2.34 to $2.52 Adj EBITDA* of $175MM to $185MM, Adj EPS* of $2.34 to $2.52 Includes estimated impact from known planned and unplanned styrene outages New Segmentation New Performance Plastics combines Compounds & Blends with ABS, Polycarbonate, and SAN – similar high value products, technologies, and markets Polystyrene becomes a standalone segment Improves internal alignment of businesses to capitalize on external opportunities Full Year 2018 Outlook Net income of $369MM to $386MM, Diluted EPS of $8.26 to $8.63 Adj EBITDA* of $640MM to $660MM, Adj EPS* of $8.26 to $8.63 Outlook excludes additional unplanned styrene outages
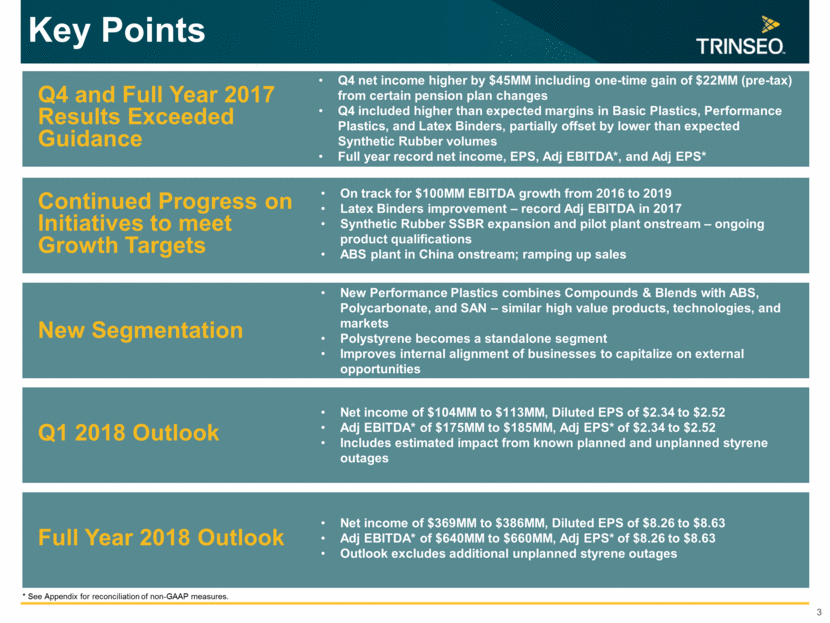
4 Note: Segment Adjusted EBITDA excludes Corporate Adjusted EBITDA of ($92) million. Totals may not sum due to rounding. * See Appendix for reconciliation of non-GAAP measures. ** Net Sales represents sales to external customers only; however, the majority of the Feedstocks segment Adj EBITDA is driven by margin on internal transfers 2017 Financial Results & Highlights Latex Binders continued mix shift to higher valued markets and Asia margin improvement drive record segment Adj EBITDA in 2017 Synthetic Rubber qualifying new SSBR capacity; other growth initiatives are on track with record sales volume for the year Record full year sales volume in Performance Plastics and stronger second half 2017 Adj EBITDA with price initiatives and reduced raw material volatility Continued favorable supply / demand dynamics across Basic Plastics Approximately $30 million of EBITDA from unplanned styrene outages in the Feedstocks segment during the year Americas Styrenics was negatively impacted by $15MM from the first quarter extended outage; business fundamentals remain strong Performance Materials Latex Binders Net Sales: $1,097MM Adj EBITDA: $139MM Synthetic Rubber Net Sales: $583MM Adj EBITDA: $83MM Performance Plastics Net Sales: $808MM Adj EBITDA: $122MM Basic Plastics & Feedstocks Basic Plastics Net Sales: $1,552MM Adj EBITDA: $157MM Feedstocks Net Sales**: $408MM Adj EBITDA: $111MM Americas Styrenics Adj EBITDA: $123MM Net Income: $328MM Adj EBITDA*: $642MM EPS / Adj EPS*: $7.30 / $8.13
Strong performance in the quarter with solid fundamentals Net income and Adjusted EBITDA* include a favorable net timing impact of about $15 million on a pre-tax basis Strong cash generation and $24 million of share repurchases during the quarter Trinseo Q4 2017 Financial Results 5 * See Appendix for reconciliation of non-GAAP measures. $2.63 $2.14 $1.72 $1.68 Diluted EPS Adj EPS* EPS ($) Q4'17 Q4'16 $1,102 $118 $917 $79 Net Sales Net Income Sales & Net Income ($MM) Q4'17 Q4'16 $169 $142 Q4'17 Q4'16 Adjusted EBITDA* ($MM)
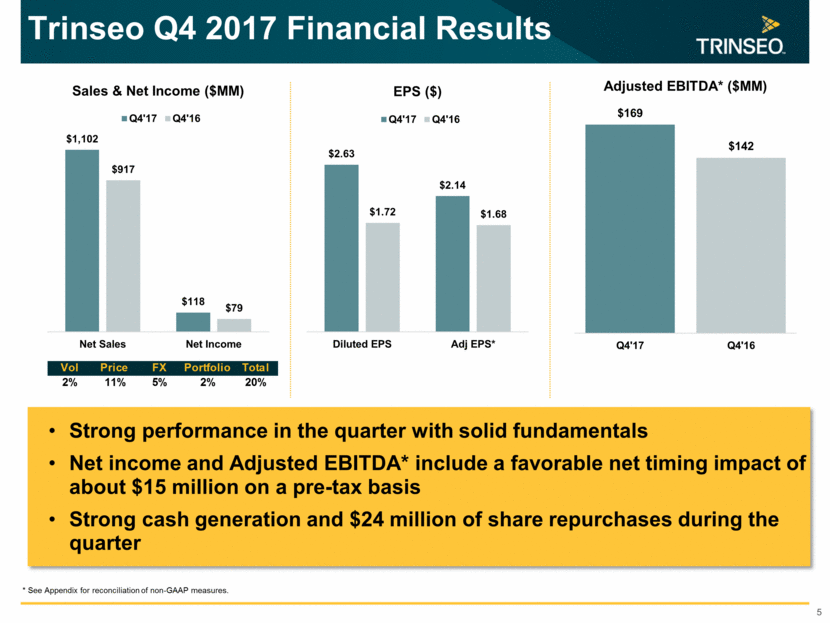
Lower volume versus prior year due to market declines in Europe and North America carpet and coated paper Record full year Adjusted EBITDA from diversified chemistries and geographies, stronger Asia margins, cost actions, and raw material tailwinds Latex Binders 6 $250 $241 Q4'17 Q4'16 Net Sales ($ MM) $33 $24 Q4'17 Q4'16 Adjusted EBITDA ($MM) 276 309 Q4'17 Q4'16 Volume (MM Lbs)
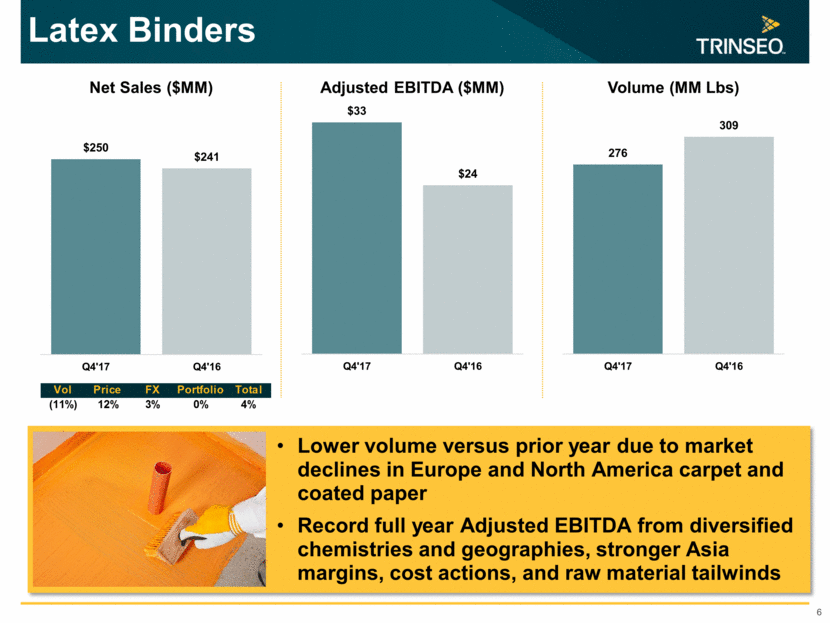
Latex Binders Business Progression 7 2012 2017 Portfolio Shift Geographic Shift Chemistry Shift NOTE: 2012 and 2017 data is based on sales volume; 2012 excludes divested Latin America business Adjusted EBITDA Growth Drivers Offsetting secular market declines in North American and European graphical paper Paper volumes replaced with growth in specialty segments Volume growth in Asian graphical paper, board and textile markets Margin expansion in Asia Tight market conditions lead to higher operating rates Growing higher margin specialty chemistries Acrylic based latexes for board and adhesives & construction Starch containing emulsions Rationalized paper assets leading to very high operating rates across the network Adjusted EBITDA increase from $79 million in 2015 to an estimated $120 million in 2018 (15% CAGR) Other Markets 54% Graphical Paper 46% Other Markets 64% Graphical Paper 36% Rest of World 76% Asia 24% Rest of World 70% Asia 30% SB Latex 91% Non - SB Latex 9% SB Latex 83% Non - SB Latex 17%
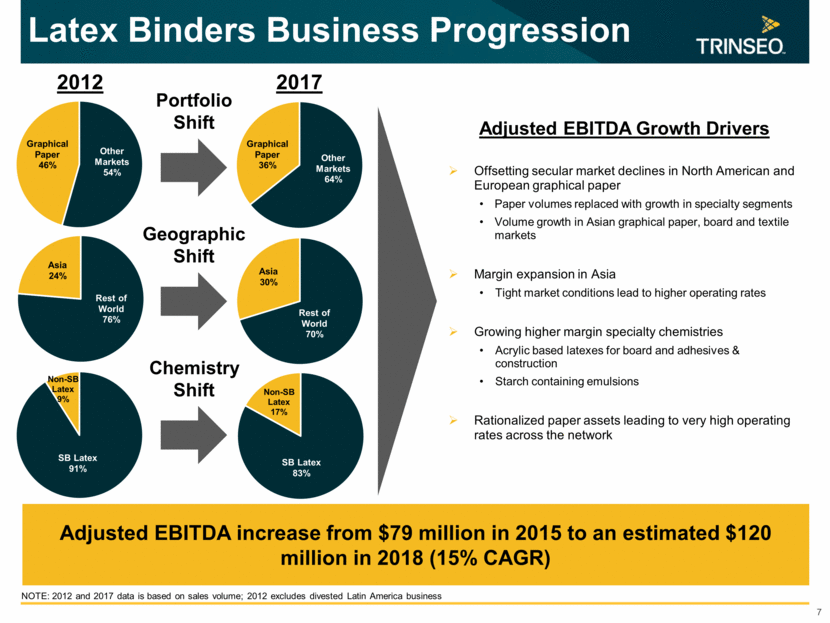
Lower Adjusted EBITDA versus prior year due to lower volume (customer destocking, shipping delays, softer tire market) and prior year favorable net timing impact Expect rebound in Q1 sales volume Synthetic Rubber 8 $127 $124 Q4'17 Q4'16 Net Sales ($ MM) $15 $29 Q4'17 Q4'16 Adjusted EBITDA ($MM) 144 159 Q4'17 Q4'16 Volume (MM Lbs)
Synthetic Rubber Business Progression 9 2012 2017 Volume Growth Mix Improvement SSBR Volume Adjusted EBITDA Growth Drivers Focused on performance tire segment Growing 2 – 3x the rate of the overall tire market Favorable macro trends such as tire labelling, lower auto emissions standards Adding SSBR capacity 50kt capacity expansion completed in Q4; qualifying at customers now Pilot plant completed in Q4 Improving mix Highly specialized enhanced SSBR is an increasing percentage of SSBR portfolio Superior rolling resistance, wet grip, noise level Adjusted EBITDA increase from $93 million in 2015 to an estimated $110 million in 2018 (6% CAGR) 617mm lbs. 477mm lbs. NOTE: 2012 and 2017 data is based on sales volume Non - SSBR 70% SSBR 30% Non - SSBR 52% SSBR 48% Base SSBR 62% Enhanced SSBR 38% Base SSBR 50% Enhanced SSBR 50%
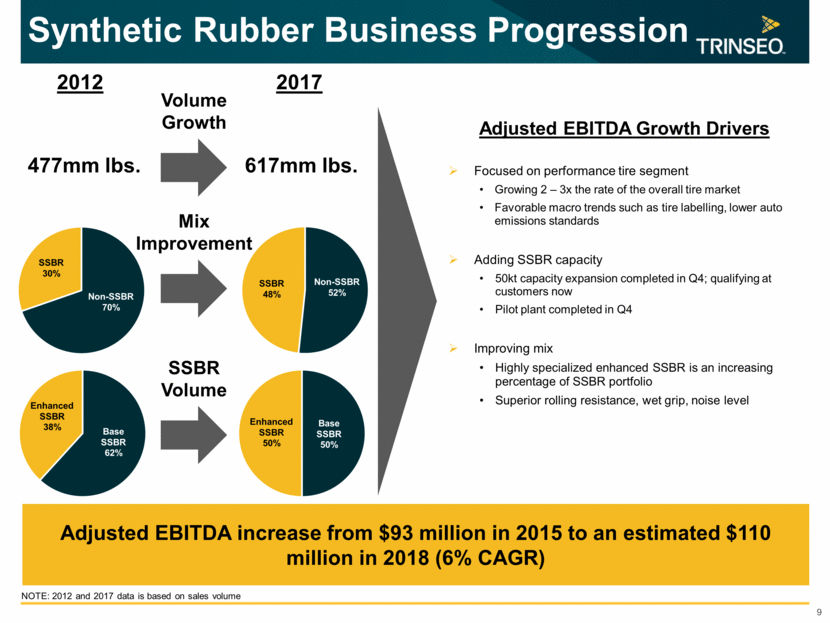
Net sales increase vs prior year driven by higher volumes in North America automotive and Asia consumer electronics and automotive, as well as raw material pass through Adjusted EBITDA increase due primarily to higher sales volume Performance Plastics 10 $227 $166 Q4'17 Q4'16 Net Sales ($ MM) $43 $32 Q4'17 Q4'16 Adjusted EBITDA ($MM) 163 137 Q4'17 Q4'16 Volume (MM Lbs)
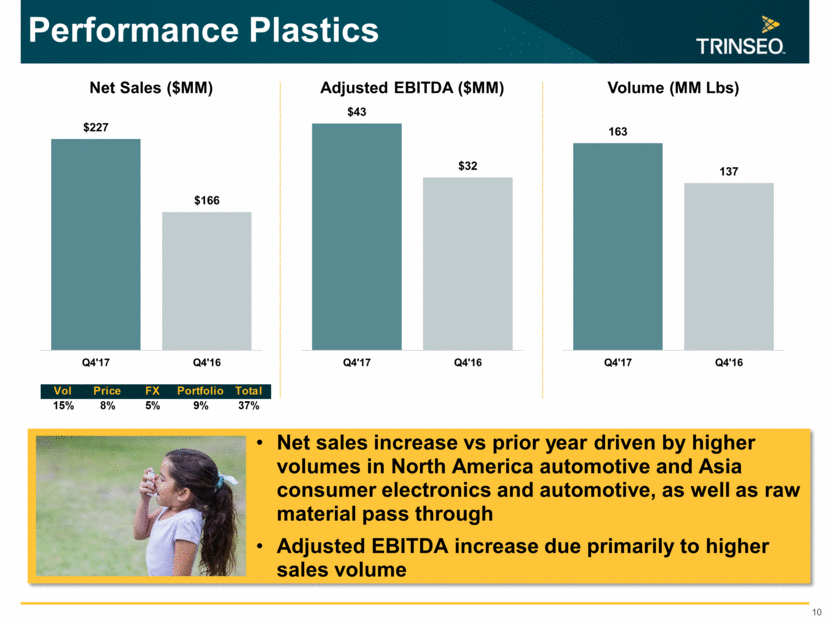
Net sales increase vs prior year due to higher ABS sales volume as well as the pass through of higher raw material costs Adjusted EBITDA higher than prior year due primarily to higher polystyrene and polycarbonate margin as well as higher ABS sales volume Basic Plastics 11 $395 $323 Q4'17 Q4'16 Net Sales ($ MM) $44 $33 Q4'17 Q4'16 Adjusted EBITDA ($MM) 518 506 Q4'17 Q4'16 Volume (MM Lbs)
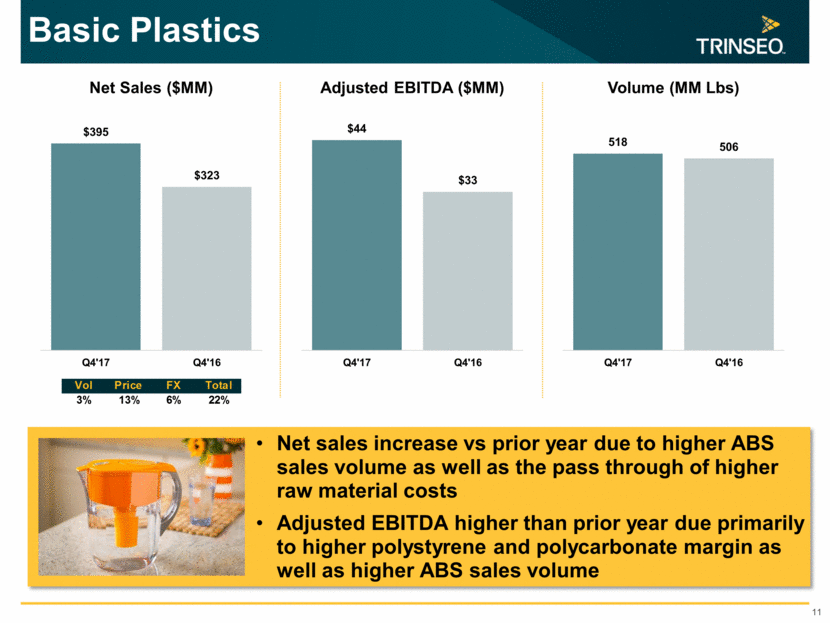
Higher YoY due primarily to higher styrene margin in Europe Feedstocks & Americas Styrenics 12 FEEDSTOCKS Continued solid performance Dividends $40 million in Q4 $120 million in 2017 AMERICAS STYRENICS $24 $14 Q4'17 Q4'16 Adjusted EBITDA ($MM) $31 $31 Q4'17 Q4'16 Adjusted EBITDA ($MM)
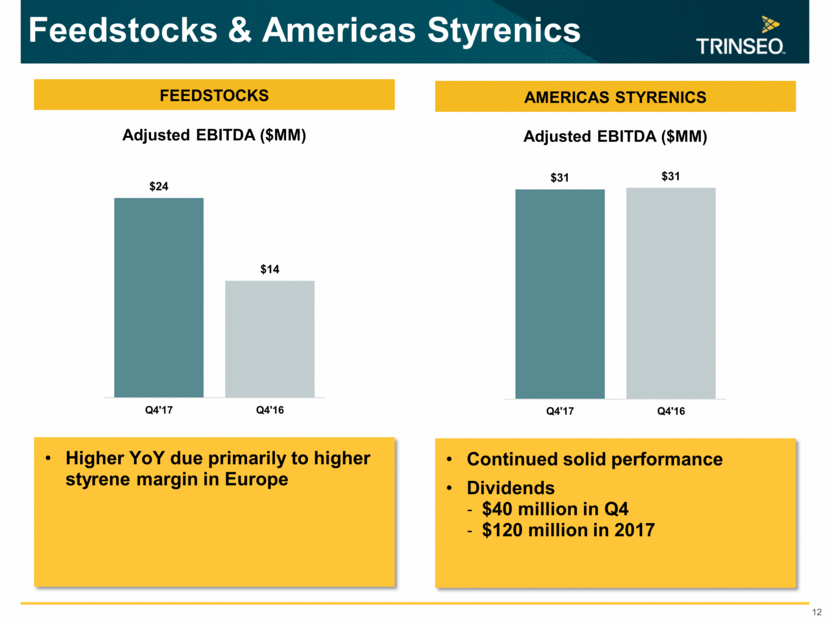
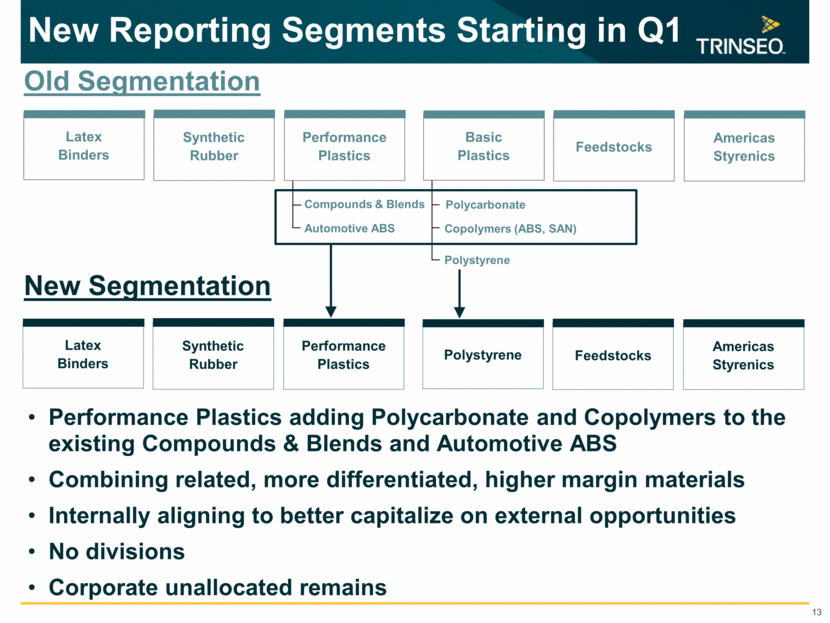
13 Synthetic Rubber Latex Binders Performance Plastics New Reporting Segments Starting in Q1 Feedstocks Basic Plastics Americas Styrenics Old Segmentation New Segmentation Synthetic Rubber Latex Binders Performance Plastics Feedstocks Polystyrene Americas Styrenics Polycarbonate Copolymers (ABS, SAN) Polystyrene Compounds & Blends Performance Plastics adding Polycarbonate and Copolymers to the existing Compounds & Blends and Automotive ABS Combining related, more differentiated, higher margin materials Internally aligning to better capitalize on external opportunities No divisions Corporate unallocated remains Automotive ABS
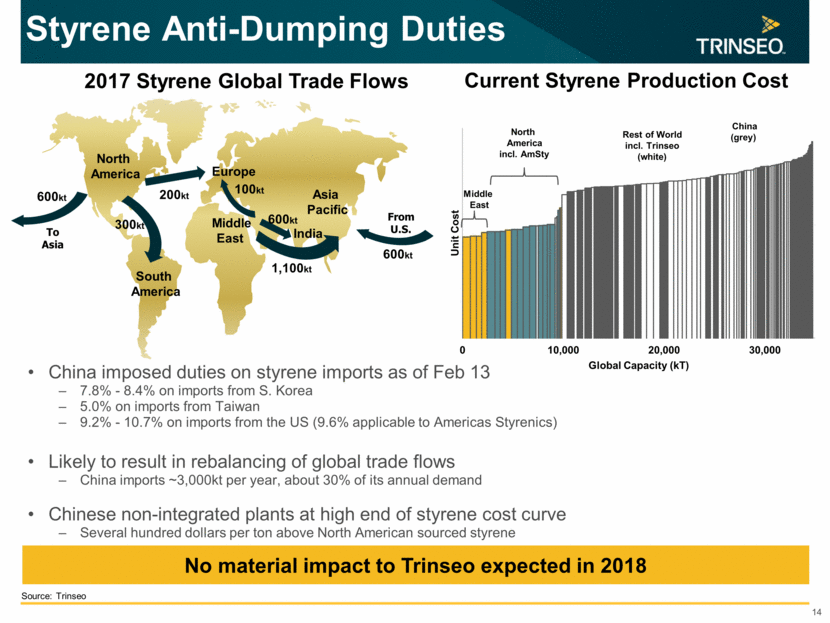
Styrene Anti-Dumping Duties China imposed duties on styrene imports as of Feb 13 7.8% - 8.4% on imports from S. Korea 5.0% on imports from Taiwan 9.2% - 10.7% on imports from the US (9.6% applicable to Americas Styrenics) Likely to result in rebalancing of global trade flows China imports ~3,000kt per year, about 30% of its annual demand Chinese non-integrated plants at high end of styrene cost curve Several hundred dollars per ton above North American sourced styrene 14 North America Europe Asia Pacific 300kt 1,100kt 600kt 100kt 200kt From U.S. South America Middle East India 600kt 2017 Styrene Global Trade Flows North America incl. AmSty Rest of World incl. Trinseo (white) China (grey) Middle East Current Styrene Production Cost No material impact to Trinseo expected in 2018 600kt To Asia Source: Trinseo 0 10,000 20,000 30,000 Unit Cost Global Capacity (kT)
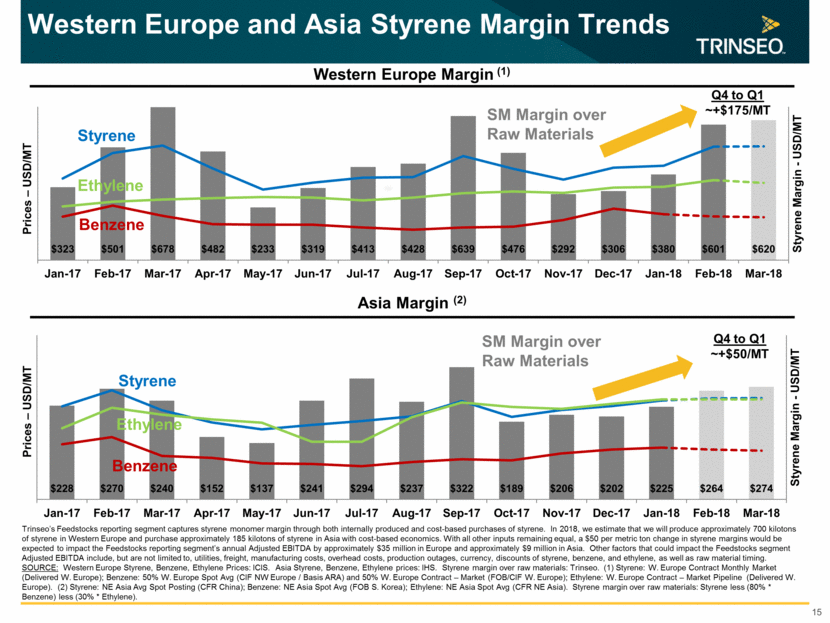
Western Europe and Asia Styrene Margin Trends 15 Western Europe Margin (1) Asia Margin (2) Q4 to Q1 ~+$175/MT Trinseo’s Feedstocks reporting segment captures styrene monomer margin through both internally produced and cost-based purchases of styrene. In 2018, we estimate that we will produce approximately 700 kilotons of styrene in Western Europe and purchase approximately 185 kilotons of styrene in Asia with cost-based economics. With all other inputs remaining equal, a $50 per metric ton change in styrene margins would be expected to impact the Feedstocks reporting segment’s annual Adjusted EBITDA by approximately $35 million in Europe and approximately $9 million in Asia. Other factors that could impact the Feedstocks segment Adjusted EBITDA include, but are not limited to, utilities, freight, manufacturing costs, overhead costs, production outages, currency, discounts of styrene, benzene, and ethylene, as well as raw material timing. SOURCE: Western Europe Styrene, Benzene, Ethylene Prices: ICIS. Asia Styrene, Benzene, Ethylene prices: IHS. Styrene margin over raw materials: Trinseo. (1) Styrene: W. Europe Contract Monthly Market (Delivered W. Europe); Benzene: 50% W. Europe Spot Avg (CIF NW Europe / Basis ARA) and 50% W. Europe Contract – Market (FOB/CIF W. Europe); Ethylene: W. Europe Contract – Market Pipeline (Delivered W. Europe). (2) Styrene: NE Asia Avg Spot Posting (CFR China); Benzene: NE Asia Spot Avg (FOB S. Korea); Ethylene: NE Asia Spot Avg (CFR NE Asia). Styrene margin over raw materials: Styrene less (80% * Benzene) less (30% * Ethylene). Styrene Ethylene Benzene SM Margin over Raw Materials Styrene Ethylene Benzene SM Margin over Raw Materials Q4 to Q1 ~+$50/MT $228 $270 $240 $152 $137 $241 $294 $237 $322 $189 $206 $202 $225 $264 $274 Jan-17 Feb-17 Mar-17 Apr-17 May-17 Jun-17 Jul-17 Aug-17 Sep-17 Oct-17 Nov-17 Dec-17 Jan-18 Feb-18 Mar-18 Styrene Margin - USD/MT Prices – USD/MT $323 $501 $678 $482 $233 $319 $413 $428 $639 $476 $292 $306 $380 $601 $620 Jan-17 Feb-17 Mar-17 Apr-17 May-17 Jun-17 Jul-17 Aug-17 Sep-17 Oct-17 Nov-17 Dec-17 Jan-18 Feb-18 Mar-18 Styrene Margin - USD/MT Prices – USD/MT
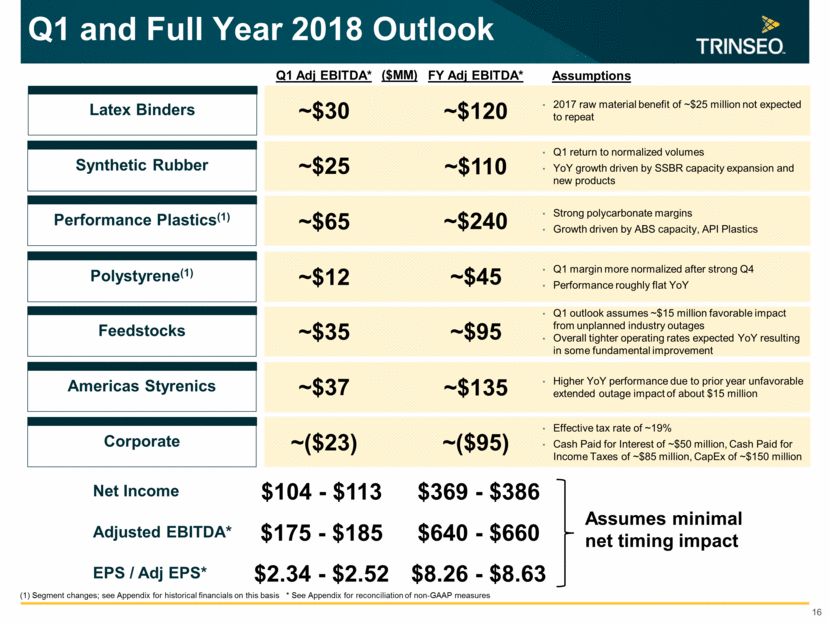
Strong polycarbonate margins Growth driven by ABS capacity, API Plastics Q1 and Full Year 2018 Outlook 16 2017 raw material benefit of ~$25 million not expected to repeat Q1 return to normalized volumes YoY growth driven by SSBR capacity expansion and new products Corporate Q1 Adj EBITDA* (1) Segment changes; see Appendix for historical financials on this basis * See Appendix for reconciliation of non-GAAP measures Q1 margin more normalized after strong Q4 Performance roughly flat YoY Q1 outlook assumes ~$15 million favorable impact from unplanned industry outages Overall tighter operating rates expected YoY resulting in some fundamental improvement Higher YoY performance due to prior year unfavorable extended outage impact of about $15 million Effective tax rate of ~19% Cash Paid for Interest of ~$50 million, Cash Paid for Income Taxes of ~$85 million, CapEx of ~$150 million FY Adj EBITDA* ~$120 ~$110 ~$240 ~$45 ~$95 ~$135 ~($95) Assumptions ~$65 ~$12 ~$35 ~$37 ~($23) ~$25 ~$30 ($MM) Net Income Adjusted EBITDA* EPS / Adj EPS* $8.26 - $8.63 $2.34 - $2.52 $175 - $185 $640 - $660 $104 - $113 $369 - $386 Latex Binders Synthetic Rubber Performance Plastics(1) Polystyrene(1) Feedstocks Americas Styrenics Assumes minimal net timing impact
Appendix

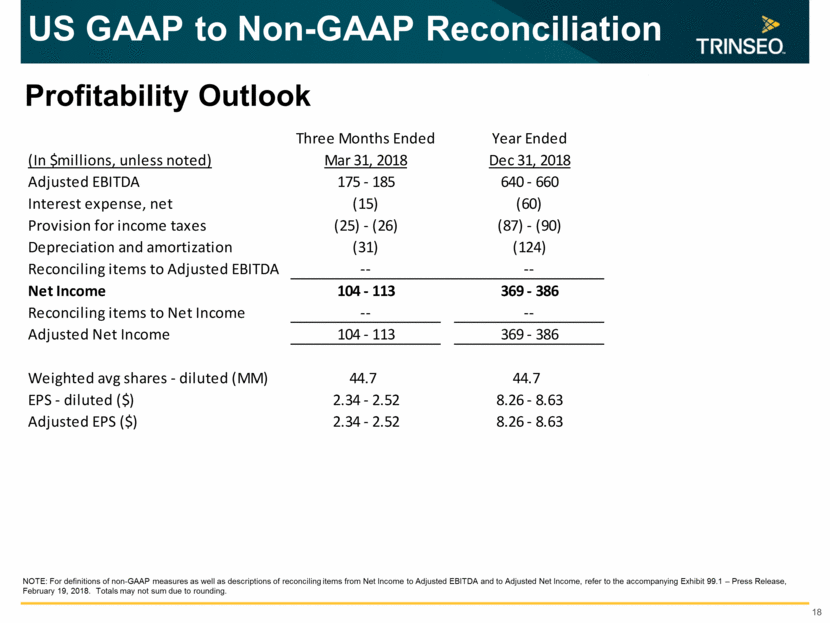
US GAAP to Non-GAAP Reconciliation 18 NOTE: For definitions of non-GAAP measures as well as descriptions of reconciling items from Net Income to Adjusted EBITDA and to Adjusted Net Income, refer to the accompanying Exhibit 99.1 – Press Release, February 19, 2018. Totals may not sum due to rounding. Profitability Outlook
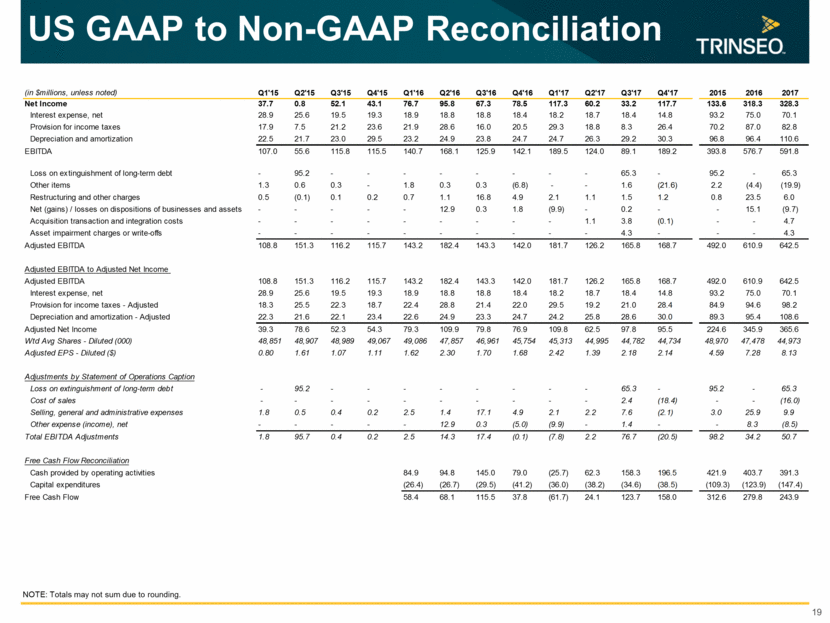
US GAAP to Non-GAAP Reconciliation 19 NOTE: Totals may not sum due to rounding.
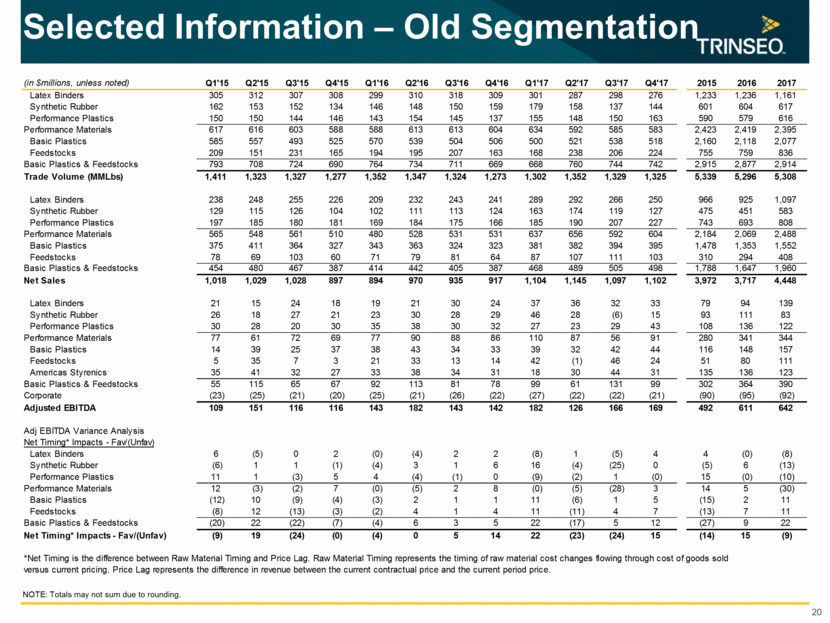
Selected Information – Old Segmentation 20 NOTE: Totals may not sum due to rounding.
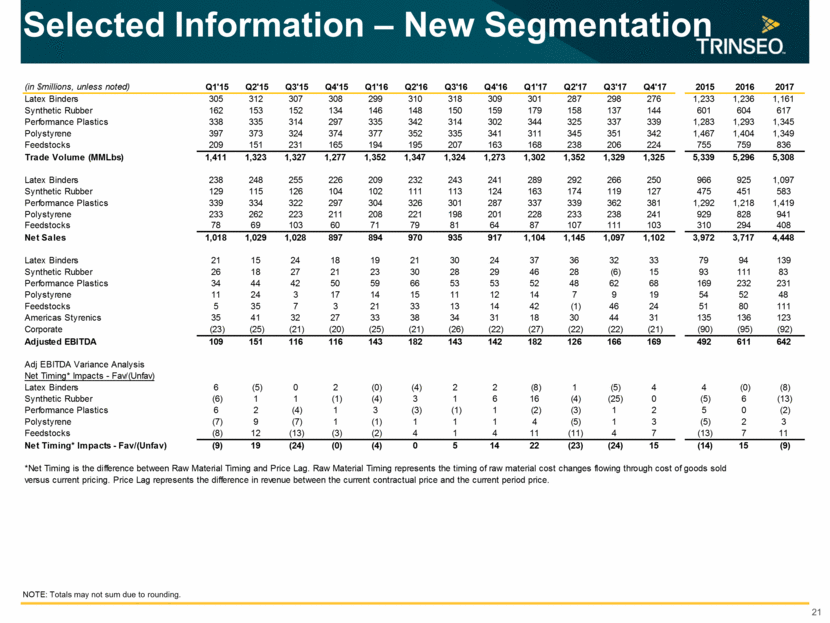
Selected Information – New Segmentation 21 NOTE: Totals may not sum due to rounding.
