Attached files
| file | filename |
|---|---|
| EX-32.1 - EXHIBIT 32.1 - Knowles Corp | a20171231exhibit321.htm |
| EX-31.2 - EXHIBIT 31.2 - Knowles Corp | a20171231exhibit312.htm |
| EX-31.1 - EXHIBIT 31.1 - Knowles Corp | a20171231exhibit311.htm |
| EX-23.1 - EXHIBIT 23.1 - Knowles Corp | a20171231exhibit231.htm |
| EX-21.1 - EXHIBIT 21.1 - Knowles Corp | a20171231exhibit211.htm |
UNITED STATES
SECURITIES AND EXCHANGE COMMISSION
Washington, D.C. 20549
FORM 10-K
(Mark One)
x ANNUAL REPORT PURSUANT TO SECTION 13 or 15(d) OF THE SECURITIES EXCHANGE ACT OF 1934
For the fiscal year ended December 31, 2017.
or
o TRANSITION REPORT PURSUANT TO SECTION 13 OR 15(d) OF THE SECURITIES EXCHANGE ACT
OF 1934
For the transition period from to
Commission File Number: 001-36102
Knowles Corporation
(Exact name of registrant as specified in its charter)
Delaware | 90-1002689 |
(State or other jurisdiction of incorporation or organization) | (I.R.S. Employer Identification No.) |
1151 Maplewood Drive | |
Itasca, Illinois | 60143 |
(Address of principal executive offices) | (Zip Code) |
(630) 250-5100
(Registrant’s telephone number, including area code)
Securities registered pursuant to Section 12(b) of the Act: | ||
Title of each class | Name of each exchange on which registered | |
Common Stock, par value $0.01 per share | New York Stock Exchange | |
Securities registered pursuant to Section 12(g) of the Act: None | ||
Indicate by check mark if the registrant is a well-known seasoned issuer, as defined in Rule 405 of the Securities Act.
Yes þ No o
Indicate by check mark if the registrant is not required to file reports pursuant to Section 13 or 15(d) of the Act. Yes o No þ
Indicate by check mark whether the registrant: (1) has filed all reports required to be filed by Section 13 or 15(d) of the Securities Exchange Act of 1934 during the preceding 12 months (or for such shorter period that the registrant was required to file such reports) and (2) has been subject to such filing requirements for the past 90 days.
Yes þ No o
Indicate by check mark whether the registrant has submitted electronically and posted on its corporate Web site, if any, every Interactive Data File required to be submitted and posted pursuant to Rule 405 of Regulation S-T (§232.405 of this chapter) during the preceding 12 months (or for such shorter period that the registrant was required to submit and post such files).
Yes þ No o
Indicate by check mark if disclosure of delinquent filers pursuant to Item 405 of Regulation S-K (§229.405) is not contained herein, and will not be contained, to the best of registrant’s knowledge, in definitive proxy or information statements incorporated by reference in Part III of this Form 10-K or any amendment to this Form 10-K. þ
Indicate by check mark whether the registrant is a large accelerated filer, an accelerated filer, a non-accelerated filer, a smaller reporting company, or an emerging growth company. See the definitions of “large accelerated filer,” “accelerated filer,” “smaller reporting company,” and "emerging growth company" in Rule 12b-2 of the Exchange Act. (Check one):
Large accelerated filer þ | Accelerated filer o | |
Non-accelerated filer o | (Do not check if a smaller reporting company) | Smaller reporting company o |
Emerging growth company o | ||
If an emerging growth company, indicate by check mark if the registrant has elected not to use the extended transition period for complying with any new or revised financial accounting standards provided pursuant to Section 13(a) of the Exchange Act. o
Indicate by check mark whether the registrant is a shell company (as defined in Rule 12b-2 of the Act). Yes o No þ
The aggregate market value of the voting and non-voting common stock held by non-affiliates of the registrant as of the close of business on June 30, 2017 was approximately $1,477,000,000. The number of outstanding shares of the registrant’s common stock as of February 16, 2018 was 89,491,800.
DOCUMENTS INCORPORATED BY REFERENCE
Certain information contained in the registrant's Proxy Statement for its 2018 Annual Meeting of Stockholders is incorporated by reference into Part III hereof.
Table of Contents
Page | ||
2
PART I
ITEM 1. BUSINESS
Unless the context otherwise requires, references in this Annual Report on Form 10-K to “Knowles,” the “Company,” “we,” “our,” or “us” refer to Knowles Corporation and its consolidated subsidiaries.
Our Company
Founded in 1946 and headquartered in Itasca, Illinois, we are a market leader and global supplier of advanced micro-acoustic, audio processing, and precision device solutions, serving the mobile consumer electronics, industrial, defense, aerospace medical, and telecommunications markets. We use our leading position in micro-electro-mechanical systems ("MEMS") microphones and strong capabilities in audio processing technologies to optimize audio systems and improve the user experience in mobile, ear, and Internet of Things ("IoT") applications. We are also the leader in acoustics components used in hearing aids and have a strong position in high-end capacitors. Our focus on our customers, combined with our unique technology, proprietary manufacturing techniques, rigorous testing, and global scale, enables us to deliver innovative solutions that optimize the user experience. Knowles has approximately 7,900 employees in 11 countries around the world.
Our Strategy
Since the Company’s spin-off from Dover Corporation ("Dover" or "Former Parent") in 2014 (the "Separation"), our primary focus has been to position the Company to benefit from the positive trends we are seeing in our Audio segment. With products ranging from mobile phones to headsets, and from smart speakers to household appliances, voice-powered interactions are emerging as a critical and necessary feature. Consumers want to engage with technology through natural, spoken commands, across the mobile, ear, and IoT markets, and original equipment manufacturers (“OEMs") are racing to develop and deploy the technology to enable it. Our unique capabilities in acoustics, digital signal processing, and algorithms place us in a competitive position to enable voice and audio input.
Over the past 4 years, we have been focused on strategically positioning the business to support these broader trends around audio input including the acquisition of Audience, Inc. in 2015, which brought us essential digital signal processing and algorithm capabilities, and the divestiture of our low-margin speaker and receiver product line ("Speaker and Receiver Product Line") in 2016. During this time, we have also invested significantly in our core MEMS microphone and hearing health businesses to maintain our leadership positions and optimize our manufacturing footprint across our business units.
In our Precision Devices segment, we continue to improve our operations and enhance profitability. In 2017, we reshaped our portfolio by divesting our timing device business ("Timing Device Business") to increase our focus on growth platforms in precision devices where we have strong market positions and attractive margin profiles. We believe this multi-year transformation positions us well for growth in the future.
Our Business Segments
In January 2017, the Company changed its internal reporting to drive growth in our core business. Given the changes in the allocation of resources and in its internal reporting structure, the Company now reports two segments, Audio and Precision Devices ("PD"). As a result of this change, transducer products used in hearing health and premium headset applications were moved from the historical Specialty Components segment into the new Audio segment, which includes the historical Mobile Consumer Electronics segment. The capacitor products formerly in the Specialty Components segment are now included in the PD segment.
• Audio Segment
Our Audio group designs and manufactures innovative audio products, including microphones and balanced armature speakers, signal processing technologies, and software and algorithms used in applications that serve the mobile, ear, and IoT markets. Locations include the sales, support, and engineering facilities in North America, Europe, and Asia, as well as the manufacturing facilities in Asia.
• PD Segment
Our PD group specializes in the design and delivery of highly engineered capacitors and radio frequency devices ("RF") for technically demanding applications. Our devices are used in applications including power supplies, radar, medical implants, and satellites, serving the industrial, defense, aerospace, medical, and telecommunications markets. Locations include the sales, support, engineering, and manufacturing facilities in North America, Europe, and Asia.
3
We sell our products directly to OEMs and to their contract manufacturers and suppliers and to a lesser extent through distributors worldwide. Our products by segment on a continuing operations basis are as follows:
• | Audio - Includes analog and digital MEMS microphones, electret condenser microphones , smart microphones, ultrasonic sensors, acoustic processors, and balanced armature speakers. |
• | PD - Includes capacitors and filters. |
The following table shows the percentage of total revenues generated by each of our segments on a continuing operations basis for the years ended December 31, 2017, 2016, and 2015:
Years Ended December 31, | ||||||||
2017 | 2016 | 2015 | ||||||
Audio | 86 | % | 88 | % | 87 | % | ||
Precision Devices | 14 | % | 12 | % | 13 | % | ||
The following table shows total assets by segment on a continuing operations basis as of December 31, 2017 and 2016:
As of December 31, | |||||||
(in millions) | 2017 | 2016 | |||||
Audio | $ | 1,430.9 | $ | 1,348.5 | |||
Precision Devices | 103.4 | 84.1 | |||||
Corporate / eliminations | 13.8 | 2.3 | |||||
Discontinued operations | 1.7 | 80.1 | |||||
Total | $ | 1,549.8 | $ | 1,515.0 | |||
Market Trends
In our Audio segment, we have seen an inflection point with voice being embraced as a primary user interface across consumer electronic devices. Voice assistants are proliferating throughout a variety of applications from mobile phones to headsets, and from smart speakers to household appliances. Consumers want to engage with technology through natural, spoken commands, across the mobile, ear, and IoT markets, and OEMs are racing to develop and deploy the technology to enable it. Our core capabilities in acoustics, digital signal processing, and algorithms are unparalleled and place us in an ideal position to enable voice and audio input.
Within the hearing aid market, sales are largely driven by aging demographics, healthcare spending, increasing affluence in emerging markets, and government subsidies.
Our Precision Devices segment sells multi-layer ceramic capacitors, electromagnetic interference filters, high reliability capacitors, single layer capacitors, precision variable capacitors, and thin film devices across diverse end markets, including industrial, defense, aerospace, medical, and telecommunications markets. Portions of this segment face much greater exposure to capital investment cycles and government spending, both direct and indirect, as some of these end markets are largely dependent on project upgrades, expansion, and government contracts.
Geographic Trends
We strive to maintain our manufacturing facilities in close proximity to our direct customers. In the case of Audio, we currently operate 6 facilities in Asia to serve the contract manufacturers who build OEM equipment on behalf of our end-customers. These contract manufacturers are largely based in China, Taiwan, India, Singapore, Indonesia, and Vietnam. Although end-user demand for consumer electronics and hearing aids is global and marketing activities occur globally, the majority of our manufacturing is located in Asia, primarily in China, Malaysia, and the Philippines.
In the case of PD, we operate 3 facilities in North America and 1 facility in Asia for the manufacturing of capacitors that support our global customers, as well as their suppliers and contract manufacturers.
4
Competitive Landscape
Success in the electronic components industry is primarily driven by innovation and flexibility as customers compete to gain a share of the growing consumer device market. We compete across handset, wearables, and other consumer platforms to deliver superior acoustic performance through customized products. Our investments in research and development enable us to capture new design wins across consumer OEMs. Our ability to balance and shift between full and semi-automation is key to our ability to optimize our operations and operating expenses. Additionally, it is important for suppliers to have flexibility and quick time-to-market to meet clients’ needs. Notably, according to industry estimates, the product cycle for mobile handsets has shortened over recent years. Key competitors include:
• | Audio - AAC Technologies, Goertek, Sonion, and Synaptics; and |
• | PD - AVX Corporation, Kyocera, and Murata. |
In the Audio segment, our investments in research and development enable us to continually introduce new products with higher performance. Our customers are adopting these higher value microphones to improve the overall audio performance of their devices which in turn improves the end user experience. Typically our new products have higher average selling prices than the products they are replacing. Once introduced, the pricing for these products trend lower, as is typical in the consumer electronics market.
For products that were introduced more than 18 months ago, we strive to offset anticipated price erosion through bill of material cost reductions, yield improvements, equipment efficiency, and movement to lower-cost manufacturing locations.
In the PD segment, the end markets tend to be more stable. We see a highly fragmented set of competitors across capacitor products for a diverse set of end markets including industrial, defense, aerospace, medical, and telecommunications.
Customers, Sales, and Distribution
We serve customers in the mobile consumer electronics, industrial, defense, aerospace, medical, and telecommunications markets. Our customers include some of the largest OEMS and operators in these markets. In addition, many of our OEM customers outsource their manufacturing to Electronic Manufacturing Services (“EMS”) companies. Other customers include global mobile phone manufacturers, hearing aid manufacturers, and many of the largest global EMS companies, particularly in China. For the year ended December 31, 2017, Apple Inc. and Samsung Electronics Co., Ltd. accounted for approximately 19% and 10% of our total revenues, respectively. For the year ended December 31, 2016, Apple Inc. and Samsung Electronics Co., Ltd. accounted for approximately 20% and 12% of our total revenues, respectively. For the year ended December 31, 2015, Apple Inc. and Samsung Electronics Co., Ltd. accounted for approximately 21% and 11% of our total revenues, respectively. No other customer accounted for more than 10% of total revenues during these periods.
The following table details our sales by geographic location for the years ended December 31, 2017, 2016, and 2015. These results do not necessarily indicate the geographies where our products are deployed or where end-customer demand is originated.
Years Ended December 31, | |||||||||||
(in millions) | 2017 | 2016 | 2015 | ||||||||
Asia | $ | 560.8 | $ | 578.7 | $ | 564.9 | |||||
Europe | 72.3 | 75.1 | 77.1 | ||||||||
Other Americas | 4.4 | 3.1 | 3.6 | ||||||||
Other | 5.4 | 5.5 | 4.9 | ||||||||
Subtotal non-United States | 642.9 | 662.4 | 650.5 | ||||||||
United States | 101.3 | 93.3 | 103.1 | ||||||||
Total | $ | 744.2 | $ | 755.7 | $ | 753.6 | |||||
5
We manufacture and develop our products at facilities located throughout the world. We maintain sales and technical customer support offices and operating facilities in North America, Europe, and Asia. In our PD segment, we supplement our direct sales force with external sales representatives and distributors. Our global distribution center is located in Penang, Malaysia. Our worldwide sales force provides geographically specific support to our customers and specialized selling of product lines to various customer bases. For further detail and for additional disclosures regarding sales and property, plant, and equipment, net, by geographic location, see Note 17. Segment Information to our Consolidated Financial Statements under Item 8, "Financial Statements and Supplementary Data."
Raw Materials
We use a wide variety of raw materials, primarily metals, and semi-processed or finished components. Commodity pricing for various metals, such as palladium, gold, brass, stainless steel, and copper, fluctuates. As a result, our operating results are exposed to such fluctuations. Although some cost increases may be recovered through increased prices to customers, if commodity prices trend upward, we attempt to control such costs through fixed-price contracts with suppliers and various other programs.
We rely on highly specialized suppliers or foundries for critical materials, components, or subassemblies that are used in our products which, in some cases, may be sole sourced from such suppliers or foundries or, such suppliers or foundries may also be a strategic supplier to one of our competitors or a customer. The loss of any single supplier has not had a material impact on operating profits. However, should an event occur which affects the ability or willingness of any supplier or foundry to continue to deliver materials or components to us in a timely manner, we may not be able to identify or qualify an alternative supplier in a timely manner which, in any such period and future periods, could have a material adverse impact on our results of operations. See Item 1A. Risk Factors for additional information regarding risks related to our business.
Research and Development
We concentrate our research and development efforts on the design and development of new products for each of our principal markets. We also fund certain other emerging product and technology opportunities. Expenditures for research and development in fiscal years 2017, 2016, and 2015 were $93.4 million, $92.0 million, and $83.2 million, respectively. Our future success is highly dependent upon our ability to develop complex new products, transfer new products to volume production, introduce them into the marketplace in a timely fashion, and have them selected for design into our customers’ products at competitive prices. Our future success may also depend on increasing acoustic content in our customers’ products including assisting our customers with integration of our products and software into their new products and providing support from the concept stage through design, launch, and production ramp.
Intellectual Property and Intangible Assets
We rely on patent, copyright, trademark, and trade secret laws to protect our intellectual property, products, and technology. Our U.S. patents expire in calendar years 2018 through 2036. While our patents are an important element of our success, our business as a whole is not dependent on any one patent or group of patents. We do not anticipate any material effect on our business due to any patents expiring in 2018, and we continue to obtain new patents through our ongoing research and development. We have maintained U.S. federal trademark registrations for KNOWLES, Knowles logo designs, along with various other trademarks. These U.S. registrations may be renewed as long as the marks continue to be used in interstate commerce. We have also filed or obtained foreign registration for these marks in other countries or jurisdictions where we conduct, or anticipate conducting, international business. To complement our own research and development efforts, we have also licensed and expect to continue to license, a variety of intellectual property and technologies important to our business from third parties.
Seasonality
In general, our businesses tend to have higher revenues in the third and fourth quarters of each fiscal year. This is particularly true of those businesses that serve the consumer electronics market. Our businesses tend to have short product cycles due to the highly technical nature of the industries they serve which can result in new OEM product launches that can impact quarterly revenues, earnings, and cash flow.
6
Environmental and Social Responsibility Matters
Our operations are governed by a variety of international, national, state, and local environmental laws. These regulations include limitations on discharge of pollutants to the air, water, and soil; manufacturing chemical use and handling restrictions; and requirements with respect to the treatment, transport, storage, and disposal of solid and hazardous wastes. We are committed to continued compliance and believe our operations generally are in substantial compliance with these laws.
We are dedicated to the preservation and improvement of our global environment. We have established a Green Materials Policy, pursuant to which we have established a Green Materials Standard. Our products are in compliance with the European Union Restriction of Hazardous Substances ("EU RoHS") and Waste Electrical and Electronic Equipment ("WEEE") directives. This standard is based on the list of substances identified in the Joint Industry Guide-101 Standard which is endorsed by the Electronic Industry Association, the Joint Electronics Device Engineering Council, and the Japan Green Procurement Survey Standardization Initiative associations as well as the Sony Standard-00259. As part of Knowles’s commitment to social responsibility and compliance with Rule 13p-1 under the Securities Exchange Act of 1934, as amended, ( the "Exchange Act") it is our goal to only use 3TG minerals in our products that do not directly or indirectly finance or benefit armed groups in the Democratic Republic of the Congo region.
Employees
We currently employ approximately 7,900 persons across our facilities in 11 countries. Approximately 85% of these employees are located in Asia. We are subject to various local, national, and multi-national laws and regulations relating to our relationships with our employees. Our workforce in the United States is not unionized. We believe we generally have good relationships with employees and their representative organizations.
Other Information
Knowles was incorporated in Delaware on June 12, 2013. The address of our principal executive offices is 1151 Maplewood Drive, Itasca, Illinois 60143. Our telephone number is 630-250-5100.
We post our annual reports on Form 10-K, quarterly reports on Form 10-Q, current reports on Form 8-K, and any amendments to these reports on the "SEC Filings” link on the Investor Relations section of our website, www.knowles.com. We post each of these reports on the website as soon as reasonably practicable after the report is filed with or furnished to the Securities and Exchange Commission ("SEC"). The information on our website is not incorporated into this Form 10-K.
ITEM 1A. RISK FACTORS
Cautionary Statement Concerning Forward-Looking Statements
This Annual Report on Form 10-K, as well as our Annual Report to Stockholders, quarterly reports and other filings with the SEC, press releases, and other oral and written communications, contains certain statements regarding business strategies, market potential, future financial performance, future action, results, and any other statements that do not directly relate to any historical or current fact which are “forward-looking” statements within the meaning of the Securities Act of 1933, as amended (the "Securities Act"), the Exchange Act, and the Private Securities Litigation Reform Act of 1995. The words “believe,” “expect,” “anticipate,” “project,” “estimate,” “budget,” “continue,” “could,” “intend,” “may,” “plan,” “potential,” “predict,” “seek,” “should,” “will,” “would,” “expect,” “objective,” “forecast,” “goal,” “guidance,” “outlook,” “effort,” “target,” and similar expressions, among others, generally identify forward-looking statements, which speak only as of the date the statements were made.
In particular, information included under the sections entitled “Business,” “Risk Factors,” and “Management’s Discussion and Analysis of Financial Condition and Results of Operations” contain forward-looking statements.
7
Readers are cautioned that the matters discussed in these forward-looking statements are subject to risks, uncertainties, assumptions, and other factors that are difficult to predict and which could cause actual results to differ materially from those projected, anticipated, or implied in the forward-looking statements. Where, in any forward-looking statement, an expectation or belief as to future results or events is expressed, such expectation or belief is based on the current plans and expectations of management and expressed in good faith and believed to have a reasonable basis, but there can be no assurance that the expectation or belief will be achieved or accomplished. Many factors that could cause actual results or events to differ materially from those anticipated include those matters described under the sections entitled “Risk Factors” and “Management’s Discussion and Analysis of Financial Condition and Results of Operations.” We caution you not to place undue reliance on these forward-looking statements, which speak only as of the date on which they are made and Knowles does not assume any obligation to update any forward-looking statement as a result of new information, future events, or otherwise, except as required by applicable law. All forward-looking statements, expressed or implied, included in this Annual Report on Form 10-K and attributable to Knowles are expressly qualified in their entirety by this cautionary statement. This cautionary statement should also be considered in connection with any subsequent written or oral forward-looking statements that we may make or persons acting on our behalf may issue. We undertake no obligation to revise or update publicly any forward looking statement for any reason.
You should consider each of the following factors as well as the other information in this Annual Report on Form 10-K, including our financial statements and the related notes, in evaluating our business and our prospects. The risks and uncertainties described below are not the only ones we face. In general, we are subject to the same general risks and uncertainties that impact many other companies such as general economic, industry, and/or market conditions and growth rates; possible future terrorist threats or armed conflicts and their effect on the worldwide economy; and changes in laws or accounting rules. Additional risks and uncertainties not presently known to us or that we currently consider immaterial may also impair our business operations. If any of these risks occur, our business and financial results could be harmed. In that case, the trading price of our common stock could decline.
Risks Related To Our Business
We depend on the mobile handset market for a significant portion of our revenues, and any downturn or slower than expected growth in this market could significantly reduce our revenues and adversely impact our operating results.
Our Audio segment accounted for 86% of our consolidated revenues for the year ended December 31, 2017, and the mobile handset market accounted for approximately 36% of our consolidated revenues. While other markets such as mobile headsets, wearables, and IoT are gaining in significance, we expect that a substantial portion of our consolidated revenues will continue to be attributable to the mobile handset market, which is cyclical and characterized by continuous and rapid technological change, product obsolescence, price erosion, evolving standards, short product life cycles, and significant fluctuations in product supply and demand. Moreover, the mobile handset market may not continue to grow at the rate experienced in recent years or may decline for reasons outside of our control including competition among market participants, market saturation, and global economic conditions. The mobile handset market has experienced and may experience periodic downturns which may be characterized by diminished product demand, production overcapacity, high inventory levels, and accelerated erosion of average selling prices. Given that the strength of the mobile handset market is a primary driver of revenues for our Audio segment, any downturn in the mobile handset market could have a material adverse effect on our business and operating results. In addition, a decline in global economic conditions, particularly in geographic regions with high concentrations of mobile handset users, could have adverse, wide-ranging effects on demand for our products or technologies, the products and services of our customers or licensees, particularly OEM handset manufacturers, the solvency of key suppliers, failures by counterparties, and negative effects on mobile handset inventories. In addition, our customers’ ability to purchase or pay for our products and services and their customers’ ability to upgrade their mobile handsets could be adversely affected by economic conditions, leading to a reduction, cancellation, or delay of orders for our products or services.
We derive the majority of our Audio revenues from MEMS microphones sold to the mobile handset market and a significant reduction in our sales of MEMS microphones could significantly reduce our revenues and adversely impact our operating results.
Within our Audio segment, revenues are generated primarily from the sales of our MEMS microphones. Sales of MEMS microphones accounted for approximately 60% of our total revenues for fiscal 2017. We expect that a substantial portion of our revenues will continue to be attributable to sales of MEMS microphones and any weakening of demand, loss of market share, or other factors adversely affecting our levels and the timing of our sales of MEMS microphones, including our customers’ product release cycles, market acceptance, product competition, the performance and reliability of our MEMS microphones, and economic and market conditions could cause our Audio revenues to substantially decline, which may adversely affect our operating results.
8
Our largest segment, Audio, derives a significant portion of its revenues from a limited number of OEM customers. If revenues derived from these customers decrease or the timing of such revenues fluctuates, our operating results could be negatively affected.
Our Audio segment derives a significant portion of revenues from a small number of OEM customers. For 2017, Audio top five customers accounted for approximately 52% of Audio’s revenues. For the year ended December 31, 2017, Apple Inc. and Samsung Electronics Co., Ltd. accounted for approximately 22% and 12% of Audio’s revenues, respectively, and 19% and 10% of total company revenues, respectively. The mobile handset industry is also subject to intense competition that could result in decreased demand and/or declining average selling prices for our products and those of our OEM customers. The loss of any one of Audio’s top customers or a reduction in the purchases of Audio’s products by such customers would reduce our total revenues and may impair our ability to achieve or sustain expected operating results, and any delay of a significant volume of purchases by any one of our top customers, even if only temporary, would reduce our revenues in the period of the delay. Further, concentration of market share among a few companies and the corresponding increase in purchasing power of these companies, may result in lower prices for our products which, if not accompanied by a sufficient increase in the volume of purchases of our products, could have an adverse effect on our revenues and margins. In addition, the timing and size of purchases by our significant customers may be impacted by the timing of such customers’ new or next generation product introductions, and the timing of such introductions may cause our operating results to be adversely impacted. Accordingly, if current market and industry dynamics continue, our Audio segment’s revenues will continue to depend largely upon, and be impacted by the timing, volumes, and pricing of future purchases by a limited number of our OEM customers.
Average selling prices in our Audio segment have generally been decreasing, which may reduce our gross margins or revenues.
The mobile handset industry has traditionally experienced an erosion of average selling prices due to a number of factors, including competitive pricing pressures, industry pricing trends, and technology advances. Within our Audio segment, while average selling prices vary significantly on a product to product basis, we anticipate the average selling prices of our products will generally decrease in the short term in response to competitive pricing pressures, excess inventories, increased sale discounts, and new product introductions by us or our competitors. We may experience decreases in future operating results due to the erosion of our average selling prices. To maintain our gross margins, we must develop and introduce on a timely basis new or differentiated products or product enhancements and continually reduce our product costs. Our failure to do so will likely cause our revenues and gross margin to decline.
We rely on highly specialized suppliers for a variety of highly engineered or specialized components, and other inputs which we may not be able to readily identify alternatives or substitutes in the event of a business or supply disruption or capacity constraint at or by any of these suppliers, which could have a material adverse impact on our results of operations.
Certain of our businesses rely on highly specialized suppliers or foundries for critical materials, components, or subassemblies that are used in our products. In some cases, such suppliers or foundries may be our sole source of supply or, such suppliers or foundries may also be a strategic supplier to one of our competitors or a customer. In either of these cases, should an event occur which affects the ability or willingness of any of such supplier or foundry to continue to deliver materials or components to us in a timely manner, we may not be able to identify or qualify an alternative supplier in a timely manner which, in any such period and future periods, could have a material adverse impact on our results of operations. Potential events or occurrences which could cause business or supply disruptions or affect the ability or willingness of a supplier or foundry to continue to supply us include changes in market strategy, the acquisition of, sale, or other change in control or ownership structure of a supplier or foundry, strategic divestiture, bankruptcy, insolvency or other financial difficulties, business disruptions, operational issues, or capacity constraints at a supplier or foundry.
Global markets for our products are highly competitive and subject to rapid technological change. If we are unable to develop new products and compete effectively in these markets, our financial condition and operating results could be materially adversely affected.
We compete in highly competitive, technology-based, industries that are highly dynamic as new technologies are developed and introduced. Our competitors may introduce products that are as or more technologically advanced than our products or launch new products faster than we can, which may lead to a loss of market share or revenues. If we are unable to anticipate or match our competitors’ development or launch of new products, identify customer needs and preferences on a timely basis, or successfully launch or ramp production of our new products, our operating results may be adversely affected.
9
We operate in the highly competitive mobile handset industry, which requires us to invest significant capital in developing, qualifying, and ramping production of new products without any assurance of product sales which could negatively impact our operating results and profits.
A significant portion of our consolidated revenues are derived from acoustic components and audio solutions, including software, that are required to go through extensive customer qualification processes before being selected by customers for inclusion in their end products. In order to meet the product launch schedules of our top customers, we may invest capital and devote substantial resources, including design, engineering, sales, marketing, and programming efforts, based on non-binding forecasts provided by these customers, without any assurance that our products will be designed into a customer’s product or qualified by the customer. In such cases, if our product is not designed into or qualified by the customer, we may not recover or realize any return on the capital that we invested and our operating results may be adversely affected.
In addition, the time required and costs incurred by us to ramp-up production for new products can be significant. Certain non-recurring costs and expenditures for tooling and other equipment may not be reusable in manufacturing products for other customers or different products for the same customer. Product ramps typically involve greater volumes of scrap and risks to execution such as higher costs due to inefficiencies and delays in production, all of which can adversely impact our operating results.
Our foreign operations, supply chain, and footprint optimization strategies are each subject to various risks that could adversely impact our results of operations and financial position.
Many of our manufacturing operations, research and development operations, vendors, and suppliers are located outside the United States and if we are unable to successfully manage the risks associated with our global operations, our results of operations and financial position could be negatively impacted. These risks include:
o | labor unrest and strikes, particularly in Asia, where the majority of our manufacturing operations are located; |
o | earthquakes, floods, and other natural disasters or catastrophic events, particularly in Asia, where the majority of our manufacturing operations are located; |
o | acts of terrorism or armed conflicts; |
o | government embargoes, trade restrictions, and import and export controls; and |
o | transportation delays and interruptions. |
Given that many of our manufacturing operations are located outside the United States, a border tax, if enacted, could have an unfavorable impact on our earnings.
Our success depends on our ability to attract and retain key employees, and if we are unable to attract and retain such qualified employees, our business and our ability to execute our business strategies may be impaired.
Our future success depends largely on the continued service and efforts of our executive officers and other key management and technical personnel and on our ability to continue to identify, attract, retain, and motivate them, particularly in an environment of cost reductions and a general move toward more performance-based compensation for executives and key management.
Implementing our business strategy also requires specialized engineering and other talent, as our revenues are highly dependent on technological and product innovations. Competition for such experienced technical personnel in our industry and where we are located is intense, and we cannot assure that we can continue to recruit and retain such personnel. For example, there is substantial competition in China for experienced engineers and technical personnel where most of our operations are located and for machine learning and software engineers in California and India where we primarily conduct research and development for our software and intelligent audio products, which may make it difficult for us to recruit and retain key employees. If we are unable to attract and retain such qualified employees, our business and our ability to execute our business strategies may be impaired.
10
Our revenues, operating profits, and cash flows could be adversely affected if we are unable to protect or obtain patent and other intellectual property rights or if intellectual property litigation is successful against us.
We employ various measures to maintain, protect, and defend our intellectual property, including enforcing our intellectual property rights in various jurisdictions and forums throughout the world. However, policing unauthorized use of our products, technologies, and proprietary information is difficult and time consuming and these measures may not prevent our intellectual property from being challenged, invalidated, copied, disclosed, or circumvented. We also may not be successful in litigation or other actions to enforce our intellectual property rights, particularly in countries where intellectual property rights are not highly developed or protected. Litigation, if necessary, may result in retaliatory legal proceedings alleging infringement by us of intellectual property owned by others. We have had and may in the future have difficulty in certain circumstances in protecting or enforcing our intellectual property rights, including collecting royalties for use of certain patents included in our patent portfolio in certain foreign jurisdictions due to, among other things: policies of foreign governments; challenges to our licensing practices under such jurisdictions’ competition laws; failure of foreign courts to recognize and enforce judgments of contract breach and damages issued by courts in the United States; and/or challenges pending before foreign patent authorities as to the validity of our patents and those owned by competitors and other parties.
The expense of protecting, defending, and enforcing our intellectual property, or defending claims that our products, technology, or manufacturing processes infringe the intellectual property rights of others, can vary significantly period to period and, in any given period, could be material and adversely impact our operating results. In addition, in any period, we may have liability for damages arising out of adverse judgments for intellectual property claims that may be material and adversely affect our operating results.
We have invested and continue to invest in strategic acquisitions and make strategic investments that, if not successful, could adversely affect our financial results or fail to create or sustain stockholder value.
We engage in strategic acquisitions and make strategic investments, which are important to our business strategy, with the goal of maximizing stockholder value. We have acquired businesses and other assets, including patents, technology, and other intangible assets and may enter into joint ventures or other strategic transactions, purchase minority equity interests in or make loans to companies that may be private and early-stage. Our acquisitions and strategic investments are generally focused on opening new or expanding opportunities for our technologies and supporting the design and introduction of new products and services (or enhancing existing products or services) for voice and data communications. Many of our acquisitions or strategic investments entail a high degree of risk and require the use of domestic and/or foreign capital. We cannot assure that our acquisitions or strategic investments will be successful in realizing anticipated cost synergies, generate financial returns, be accretive within projected time frames, or result in increased adoption or continued use of our technologies, products, or services.
In part due to our inexperience with certain adjacent or complimentary technologies and in geographic regions that may be served by acquired businesses, we may underestimate the costs or overestimate the benefits that we expect to realize from such acquisitions or investments, and we may not achieve them.
Further, our ability to achieve the anticipated cost synergies and other benefits from acquisitions and strategic investments within expected time frames is subject to many estimates and assumptions, which are subject to significant economic, competitive, and other uncertainties, some of which are beyond our control. We may not, for example, be able to retain key employees, customers, or suppliers of the acquired company, integrate critical business systems, or derive commercial value from the acquired company’s technology and, as a result or, for other unrelated reasons, we may experience either delays in our timing for achieving cost synergies or higher than expected costs in implementing them. If we do not succeed in these efforts, if these efforts are more costly or time-consuming than expected, if our estimates and assumptions are not correct, if we experience delays, or if other unforeseen events occur, our business and results of operations may be adversely affected.
11
Our stock price has been and may continue to be volatile and may fluctuate significantly which may adversely impact investor confidence and increase the likelihood of securities class action litigation.
Our common stock price has experienced substantial volatility in the past and may remain volatile in the future. Volatility in our stock price can be driven by many factors including divergence between our actual or anticipated financial results and published expectations of analysts or the expectations of the market, market conditions in our industry, announcements that we, our competitors, vendors, or our customers may make regarding their operating results, technological innovations, the gain or loss of customers, or key opportunities as a result of the risks identified and discussed in this “Risk Factors” section. During 2017, our closing stock price ranged from a high of $19.90 per share to a low of $14.11 per share. Our common stock is also included in certain market indices, and any change in the composition of these indices to exclude our company may adversely affect our stock price. Increased volatility in the financial markets and/or overall economic conditions may reduce the amounts that we realize in the future on our cash equivalents and/or marketable securities and may reduce our earnings as a result of any impairment charges that we record to reduce recorded values of marketable securities to their fair values.
Further, securities class action litigation is often brought against a public company following periods of volatility in the market price of its securities. Due to changes in our stock price, we may be the target of securities litigation in the future. Securities litigation could result in substantial uninsured costs and divert management’s attention and our resources.
Our credit agreement requires us to comply with certain financial covenants and our failure to comply could have a material adverse effect on our financial condition.
The credit agreement governing our revolving credit facility contains covenants requiring us to, among other things, maintain a minimum ratio of consolidated EBITDA to consolidated interest expense and a maximum ratio of consolidated total indebtedness to consolidated EBITDA. In the past, we have obtained amendments from the lenders under the credit agreement which have allowed us to comply with the financial covenants, but there can be no assurance that in the future the lenders will agree to such amendments, and our inability to comply with the covenants could result in an event of default which, if not cured or waived, could have a material adverse effect on our business, financial condition, and operating results.
We are subject to counterparty risk with respect to the convertible note hedge transactions.
As discussed in Note 11. Borrowings to our audited Consolidated Financial Statements under Item 8, "Financial Statements and Supplementary Data", we issued convertible senior notes and concurrently entered into convertible note hedge transactions and separate warrants. The option counterparties are financial institutions, and we are subject to the risk that one or more of the option counterparties may default under the convertible note hedge transactions. Our exposure to the credit risk of the option counterparties will not be secured by any collateral. If any of the option counterparties become subject to insolvency proceedings, we will become an unsecured creditor in those proceedings with a claim equal to our exposure at that time under our transactions with such counterparties. Our exposure will depend on many factors but, generally, the increase in our exposure will be correlated to the increase in the market price and in the volatility of our common stock. In addition, upon a default by the option counterparties, we may suffer adverse tax consequences and more dilution than we currently anticipate with respect to our common stock. We can provide no assurances as to the financial stability or viability of the option counterparties.
Our effective tax rate may fluctuate which will impact our future financial results.
Our effective tax rate may be adversely impacted by, among other things, changes in the mix of our earnings among countries having differing statutory tax rates, changes in the valuation of deferred tax assets, or changes in tax laws where we operate. We cannot give any assurance as to the stability or predictability of our effective tax rate in the future because of, among other things, uncertainty regarding the tax laws and policies of the countries where we operate.
On December 22, 2017, the Tax Cuts and Jobs Act ("Tax Reform Act") was enacted in the United States, which we expect will increase our effective tax rate in the future. The estimated effects based upon current interpretation of the Tax Reform Act have been incorporated into our financial results. As additional data is prepared and analyzed, and as additional clarification and implementation guidance is issued on the Tax Reform Act, it may be necessary to adjust the provisional amounts. Any adjustments could have a material impact on provisional amounts. In addition, there is a risk that states or foreign jurisdictions may amend their tax laws in response to the Tax Reform Act, which could have a material impact on our future results.
12
Further, our tax returns are subject to periodic reviews or audits by domestic and international authorities, and these audits may result in allocations of income and/or deductions that result in tax assessments different from amounts that we have estimated. We regularly assess the likelihood of an adverse outcome resulting from these audits to determine the adequacy of our provision for taxes. There can be no assurance as to the outcome of these audits or that our tax provisions will ultimately be adequate to satisfy any associated tax liability. If our effective tax rates were to increase or if our tax liabilities exceed our estimates and provisions for such taxes, our operating results could be adversely affected.
Our effective tax rate is favorably impacted by tax holidays granted to us by certain foreign jurisdictions, which lowers the tax rates we are subject to for a period of time as compared to the countries' statutory tax rates. These tax holidays are subject to the satisfaction of certain conditions, including exceeding certain annual thresholds of operating expenses and gross sales. If we fail to satisfy such conditions, our effective tax rate may be significantly adversely impacted. For additional detail, see Note 12. Income Taxes to our Consolidated Financial Statements under Item 8, "Financial Statements and Supplementary Data."
Moreover, tax rates and laws in the countries where we operate may change, or tax reforms may be enacted domestically or in foreign jurisdictions which adversely affect our liquidity, cash flows, and future reported financial results or our ability to continue to structure and conduct our business as is done currently.
We are subject to potentially material liability for breaches of confidentiality agreements with certain of our top customers.
We have entered into non-disclosure agreements with several of our top customers which require us not to disclose and to protect certain information regarding, among other things, aspects of those customers’ businesses plans, products, and technology. These confidentiality agreements, in some cases, impose strict liability on us in the event of any breach of these agreements by us or our employees or agents and, should such a breach occur, our operating results may be adversely affected.
Our business and operations could suffer in the event of security breaches or other unauthorized disclosures.
We have taken and continue to actively take measures to protect the various proprietary information, algorithms, source code, and confidential data relating to both our and our customers’ business and products that is stored on our computer networks, servers, and peripheral devices, as well as on servers owned or managed by third party vendors whom we leverage. Such data and information remains vulnerable to cyber attacks, cyber breaches, theft, or other unauthorized disclosure which, if successful, could result in loss of valuable intellectual property, disclosure of confidential customer or commercial data, disclosure of government classified information, or system disruptions and subject us to civil liability and fines or penalties, damage our brand and reputation or otherwise harm our business, any of which could be material. Should any secu rity breach result in the disclosure of certain of our customers’ or business partners’ confidential information, we may incur liability to such customers or business partners under confidentiality agreements that we are party to with such parties. In addition, delayed sales, lower margins, or lost customers resulting from security breaches or network disruptions could reduce our revenues, increase our expenses, damage our reputation, and adversely affect our stock price.
There is also a danger of industrial espionage, unauthorized disclosures, theft of information or assets (including source code), or damage to assets by people who have gained unauthorized access to the Company's facilities, systems, or information. Such breaches, misuse, or other disruptions could lead to unauthorized disclosure of confidential or proprietary information or improper usage or sale of the Company's products or intellectual property without compensation and theft, manipulation, and destruction of private and proprietary data, which could result in defective products, production downtimes, lost revenue, or damage to our reputation, and adversely affect our stock price.
13
Our net exposure to exchange rate fluctuations could negatively impact our results of operations.
We conduct a significant amount of business outside the United States and adverse movements in currency exchange rates, particularly the Malaysian ringgit, the euro, the Chinese renminbi (yuan), and the Philippine peso, may, in any period or period(s), negatively affect our business and our operating results due to a number of factors, including, among others:
o | our products are manufactured and sold outside the United States which increases our net exposure to changes in foreign exchange rates; |
o | our products, which are typically sold in U.S. dollars, may become less price-competitive outside the United States as a result of unfavorable foreign exchange rates; |
o | certain of our revenues that are derived from customer sales denominated in foreign currencies could decrease; |
o | our foreign suppliers may raise their prices if they are impacted by currency fluctuations, resulting in higher than expected costs and lower margins; |
o | foreign exchange hedging transactions that we engage in to reduce the impact of currency fluctuations may require the payment of structuring fees, limit the U.S. dollar value of royalties from licensees’ sales that are denominated in foreign currencies, cause earnings volatility if the hedges do not qualify for hedge accounting, and expose us to counterparty risk if the counterparty fails to perform; |
o | the cost of materials, products, services, and other expenses outside the United States could be adversely impacted by a weakening of the U.S. dollar; and |
o | based on our current sales and manufacturing activity, a sustained 10% weakening of the U.S. dollar for a period of one year would reduce our operating results by approximately $17.9 million pre-tax. |
Our products are complex and could contain defects, which could result in material costs to us and harm our business.
Our products are complex and could contain defects, which could result in material costs to us. Product development in the markets we serve is becoming more focused on audio signal processing for improved audio performance and to enable intelligent and more sophisticated audio solutions. The increasing complexity of our products increases the risk that we or our customers or end users could discover latent defects or subtle faults after significant volumes of product have been shipped. This could result in material costs and other adverse consequences to us including, but not limited to: loss of customers, reduced margins, damage to our reputation, a material product recall, replacement costs for product warranty and support, payments to our customers related to recall claims as a result of various industry or business practices, a delay in recognition or loss of revenues, loss of market share, or failure to achieve market acceptance, and a diversion of the attention of our engineering personnel from our product development efforts. In addition, any defects or other problems with our products could result in financial losses or other damages to our customers who could seek damages from us for their losses. A product liability or warranty claim brought against us, even if unsuccessful, would likely be time consuming and costly to defend. In particular, the sale of systems and components that are incorporated into mobile handsets for the global mobile phone industry involves a high degree of risk that such claims may be made. Due to the complex nature of our products, quality, and reliability issues may arise after significant volumes of a product have shipped. While we have attempted to contractually limit our financial exposure with many of our customers for such claims, a warranty or product liability claim against us in excess of our available insurance coverage and established reserves, or a requirement that we participate in a customer product recall, could have material adverse effects on our business, results of operations, and financial condition.
In addition, our products are typically sold to customers at prices that are significantly lower than the cost of the customer’s products in which they are incorporated. Given that a defect in one of our products could give rise to failures in the products that incorporate them, we may face claims for damages that are disproportionate to the revenues we receive from the products involved and because we are self-insured for matters relating to product quality a significant claim(s) could adversely affect our financial position. Moreover, to the extent a defect in one of our products is caused by a defective component supplied to us by a third party, we may, nonetheless, be liable to the customer and be unsuccessful in seeking indemnification from that third party.
14
Our goodwill, other intangible assets, or long-lived assets may become impaired, which could result in a significant charge to earnings.
We hold significant amounts of goodwill, other intangible assets, and long-lived assets, and the balances of these assets could increase in the future if we acquire other businesses. At December 31, 2017, the balance of our goodwill, other intangible assets, and long-lived assets was $1.1 billion and the total market value of the Company’s outstanding shares was $1.3 billion. Under generally accepted accounting principles in the United States ("U.S. GAAP"), we review our goodwill, other intangible assets, and long-lived assets for impairment when events or changes in circumstances indicate the carrying value of such goodwill, other intangible assets, or long-lived assets may not be recoverable. In addition, we test goodwill and other indefinite-lived intangible assets for impairment annually. Factors that may be considered a change in circumstances, indicating that the carrying value of our goodwill, other intangible assets, or long-lived assets may not be recoverable, include, but are not limited to, a sustained decline in stock price and market capitalization, significant negative variances between actual and expected financial results, reduced future cash flow estimates, adverse changes in legal factors, failure to realize anticipated synergies from acquisitions, and slower growth rates in our industry. We may be required to record a significant charge to earnings in our financial statements during the period in which any impairment of our goodwill, other intangible assets, or long-lived assets is determined to exist, negatively impacting our results of operations. If our market capitalization was to fall below the book value of our total stockholders’ equity for a sustained period, we may conclude that the fair value of certain of our intangible or long-lived assets is materially impaired. In this case, we would be required under U.S. GAAP to record a non-cash charge to our earnings which could adversely impact our financial results.
There are risks associated with our indebtedness, which could adversely affect our financial condition.
Our outstanding indebtedness and any additional indebtedness we incur may have negative consequences, including:
o | requiring us to use cash to pay the principal of and interest on our indebtedness, thereby reducing the amount of cash flow available for other purposes; |
o | limiting our ability to obtain additional financing for working capital, capital expenditures, acquisitions, stock repurchases, dividends, or other general corporate and other purposes; |
o | limiting our flexibility in planning for, or reacting to, changes in our business and our industry; and |
o | increasing our vulnerability to interest rate fluctuations to the extent a portion of our debt has variable interest rates. |
Our ability to make payments of principal and interest on our indebtedness depends upon our future performance, which is subject to general economic conditions, industry cycles, and financial, business, and other factors, many of which are beyond our control. If we are unable to generate sufficient cash flow from operations in the future to service our debt, we may be required to, among other things: refinance or restructure all or a portion of our indebtedness; reduce or delay planned capital or operating expenditures; or sell selected assets. Such measures might not be sufficient to enable us to service our debt. In addition, any such financing, refinancing, or sale of assets might not be available on economically favorable terms or at all, and if prevailing interest rates at the time of any such financing and/or refinancing are higher than our current rates, interest expense related to such financing and/or refinancing would increase. If there are adverse changes in the ratings assigned to our debt securities by credit rating agencies, our borrowing costs, our ability to access debt in the future, and/or the terms of the financing could be adversely affected.
Risks Related to Our Spin-Off From Our Former Parent
We have certain indemnification obligations to our Former Parent pursuant to the Separation and Distribution Agreement which, if triggered, could materially and adversely affect our business, financial condition, results of operations, and cash flows.
The Separation and Distribution Agreement between us and our Former Parent provides, among other things, that we will indemnify our Former Parent for substantially all liabilities relating to our business activities, whether incurred prior to or after the Separation. If we are required to indemnify our Former Parent under the Separation and Distribution Agreement or other agreements in any period or periods, we may be subject to substantial liabilities that may adversely impact our operating results.
15
We are subject to continuing contingent tax liabilities of our Former Parent following the Separation.
Under the Internal Revenue Code and the related rules and regulations, each corporation that was a member of our Former Parent’s U.S. consolidated group for all or a portion of a taxable period ending on or before the effective time of the distribution is jointly and severally liable for the U.S. federal income tax liability of the entire U.S. consolidated group of our Former Parent. Consequently, if our Former Parent is unable to pay the consolidated U.S. federal income tax liability for a prior period, we could be required to pay the entire amount of such tax which could be substantial and in excess of the amount allocated to us under the Tax Matters Agreement between us and our Former Parent. Other provisions of federal and state law establish similar liability for other matters, including laws governing tax-qualified pension plans as well as other contingent liabilities. These potential tax liabilities could be material in any period or periods, and should we be held liable for such liabilities, our operating results in any such period or periods may be adversely affected.
If the Distribution (as defined below), together with certain related transactions, does not qualify as a transaction that is tax-free for U.S. federal income tax purposes, we, our Former Parent, and our stockholders could be subject to a significant tax liability and, in certain circumstances, we could be required to indemnify our Former Parent for material taxes pursuant to indemnification obligations under the Tax Matters Agreement.
Under the Tax Matters Agreement between our Former Parent and us, we are required to indemnify our Former Parent against taxes incurred by our Former Parent that arise as a result of our taking or failing to take, as the case may be, certain actions that result in the Distribution failing to qualify for tax-free treatment. Also, under the Tax Matters Agreement, we are required to indemnify our Former Parent for one-half of the taxes and other liabilities incurred by our Former Parent if the Distribution fails to meet the requirements of a tax-free distribution for reasons other than an act or failure to act on the part of us or our Former Parent and therefore we might be required to indemnify our Former Parent for such taxes and liabilities due to circumstances and events not within our control. Under the Tax Matters Agreement, we are also required to indemnify our Former Parent for one-half of certain taxes incurred as a result of the restructuring activities undertaken to effectuate the Distribution. Our indemnification obligations to our Former Parent under the Tax Matters Agreement are not limited by a maximum amount. If we are required to indemnify our Former Parent under the circumstances set forth in the Tax Matters Agreement, we may be subject to substantial tax liabilities, which could materially adversely affect our financial position.
Our Former Parent has secured a tax opinion from its tax counsel which concluded that the distribution of all of the shares of our common stock to stockholders of our Former Parent in connection with the Separation (the “Distribution”) qualifies as tax-free for U.S. federal income tax purposes. Our Former Parent also requested and received a Private Letter Ruling from the Internal Revenue Service (the “IRS”) which reached the same conclusion regarding the tax-free qualification of Distribution. The Private Letter Ruling relied on certain facts, assumptions, representations, and undertakings from our Former Parent and us, which, if incorrect, inaccurate, or reneged upon may invalidate the Private Letter Ruling and any binding effect on the IRS. Should the Private Letter Ruling be invalidated, we and our Former Parent could be subject to significant tax liabilities which could materially adversely affect our financial position. As of the end of fiscal 2017, we were not aware of anything that would make the facts, assumptions, representations, and undertakings represented in the Private Letter Ruling incorrect, or inaccurate.
Risks Related to Our Corporate Governance
Our business could be negatively affected as a result of the actions of activist or hostile stockholders.
Our business could be negatively affected as a result of stockholder activism, which could cause us to incur significant expense, hinder execution of its business strategy, and impact the trading value of our securities. Stockholder activism, which could take many forms or arise in a variety of situations, has been increasing in publicly traded companies in recent years and we are subject to the risks associated with such activism. Stockholder activism, including potential proxy contests, requires significant time and attention by management and the Board of Directors, potentially interfering with our ability to execute our strategic plan. Additionally, such stockholder activism could give rise to perceived uncertainties as to our future direction, adversely affect our relationships with key executives and business partners, and make it more difficult to attract and retain qualified personnel. Also, we may be required to incur significant legal fees and other expenses related to activist stockholder matters. Any of these impacts could materially and adversely affect our business and operating results. Further, the market price of our common stock could be subject to significant fluctuation or otherwise be adversely affected by the events, risks, and uncertainties described in this “Risk Factors” section.
16
Certain provisions in our certificate of incorporation, by-laws, and Delaware law may prevent or delay an acquisition of the Company, which could decrease the trading price of our common stock.
Each of our certificate of incorporation, our by-laws, and Delaware law, as currently in effect, contain provisions that are intended to deter coercive takeover practices and inadequate takeover bids by making such practices or bids unacceptably expensive to the bidder and to encourage prospective acquirers to negotiate with our Board of Directors rather than to attempt a hostile takeover. These provisions include, among others:
o | the inability of our stockholders to call a special meeting or act by written consent; |
o | rules regarding how stockholders may present proposals or nominate directors for election at stockholder meetings; |
o | the right of our Board of Directors to issue preferred stock without stockholder approval; |
o | the division of our Board of Directors into three approximately equal classes of directors, with each class serving a staggered three-year term; |
o | a provision that stockholders may only remove directors for cause; |
o | the ability of our directors, without a stockholder vote, to fill vacancies on our Board of Directors (including those resulting from an enlargement of the Board of Directors); and |
o | the requirement that stockholders holding at least 80% of our voting stock are required to amend certain provisions in our certificate of incorporation and our by-laws. |
In addition, current Delaware law includes provisions which limit the ability of persons that, without prior board approval, acquire more than 15% of the outstanding voting stock of a Delaware corporation from engaging in any business combination with that corporation, including by merger, consolidation, or purchases of additional shares, for a three-year period following the acquisition by such persons of more than 15% of the corporation’s outstanding voting stock.
In light of present circumstances, we believe these provisions taken as a whole protect our stockholders from coercive or otherwise unfair takeover tactics by requiring potential acquirers to negotiate with our Board of Directors and by providing our Board of Directors with more time to assess any acquisition proposal. These provisions are not intended to make us immune from takeovers. However, these provisions will apply even if the offer may be considered beneficial by some stockholders and could delay or prevent an acquisition that our Board of Directors determines is not in the best interests of the Company and our stockholders. These provisions may also prevent or discourage attempts to remove and replace incumbent directors.
ITEM 1B. UNRESOLVED STAFF COMMENTS
None.
17
ITEM 2. PROPERTIES
Our corporate headquarters is located in Itasca, Illinois. We maintain technical customer support offices and operating facilities in North America, Europe, and Asia. Our principal manufacturing locations for the Audio segment are located in China, Malaysia, and the Philippines. Our principal manufacturing locations for the PD segment are located in the U.S and the Dominican Republic.
The number, type, location, and size of the properties used by our continuing operations as of December 31, 2017 are shown in the following chart:
Total | |||
Number and nature of facilities: | |||
Manufacturing and Distribution | 9 | ||
Other Facilities (principally sales, research and development, and headquarters) | 13 | ||
Square footage (in 000s): | |||
Owned | 630 | ||
Leased (1) | 918 | ||
Locations: | |||
Asia | 14 | ||
North America | 6 | ||
Europe | 2 | ||
(1) Expiration dates on leased facilities range from 1 to 7 years.
We believe that our owned and leased facilities are well-maintained and suitable for our operations.
ITEM 3. LEGAL PROCEEDINGS
From time to time, we are involved in various legal proceedings and claims arising in the ordinary course of our business, including those related to intellectual property, which may be owned by us or others. We own many patents covering products, technology, and manufacturing processes. Some of these patents have been and may continue to be challenged by others. In appropriate cases, we have taken and will take steps to protect and defend our patents and other intellectual property, including through the use of legal proceedings in various jurisdictions around the world. Such steps have resulted in and may continue to result in retaliatory legal proceedings, including litigation or other legal proceedings in various jurisdictions and forums around the world alleging that we infringe on patents owned by others. The costs of investigations and legal proceedings, particularly multi-forum litigation, relating to the enforcement and defense of our intellectual property, may be substantial. Additionally, in multi-forum disputes, we may incur adverse judgments with regard to certain claims in certain jurisdictions and forums while still contesting other related claims against the same opposing party in other jurisdictions and forums. Although the ultimate outcome of any legal proceeding or claim cannot be predicted with certainty, based on present information, including management’s assessment of the merits of each claim, we do not expect that any asserted or unasserted legal proceedings or claims, individually or in the aggregate, will have a material adverse effect on our cash flow, results of operations, or financial condition.
ITEM 4. MINE SAFETY DISCLOSURES
Not applicable.
18
EXECUTIVE OFFICERS OF THE REGISTRANT
The following sets forth information regarding our executive officers, as of February 16, 2018.
Name | Age | Position |
Jeffrey S. Niew | 51 | President & Chief Executive Officer |
John S. Anderson | 54 | Senior Vice President & Chief Financial Officer |
Christian U. Scherp | 52 | President, Performance Audio |
Raymond D. Cabrera | 51 | Senior Vice President, Human Resources & Chief Administrative Officer |
Daniel J. Giesecke | 50 | Senior Vice President & Chief Operating Officer |
Thomas G. Jackson | 52 | Senior Vice President, General Counsel & Secretary |
Michael S. Polacek | 54 | President, Intelligent Audio |
Bryan E. Mittelman | 47 | Vice President, Controller |
Jeffrey S. Niew has served as President & Chief Executive Officer since September 2013 and as a member of our Board of Directors since February 2014. From November 2011 until the Separation in February 2014, Mr. Niew served as a Vice President of Dover Corporation and as President and Chief Executive Officer of Dover Communication Technologies. Mr. Niew joined Knowles Electronics LLC (“Knowles Electronics”) in May 2000 and became Chief Operating Officer in January 2007, President in January 2008, and President and Chief Executive Officer in February 2010. Prior to joining Knowles Electronics, Mr. Niew was employed by Littelfuse, Inc., from 1995 to 2000, where he held various positions in product management, sales, and engineering in the Electronic Products group and by Hewlett-Packard Company, from 1988 to 1994, where he served in various engineering and product management roles in the Optoelectronics Group in California.
John S. Anderson has served as Senior Vice President & Chief Financial Officer since December 2013. From January 2013 until the Separation in February 2014, Mr. Anderson served as Vice President and Chief Financial Officer of Dover Communication Technologies. Previously, Mr. Anderson served as Vice President and Chief Financial Officer of Dover Energy (from August 2010 to January 2013) and Vice President and Chief Financial Officer of Dover Fluid Management (from October 2009 to August 2010). Previous experience includes the roles of Corporate Controller and Director Financial Planning & Analysis for Sauer-Danfoss Inc. (from October 2004 to October 2009) and Director of Finance and Controller for Borg Warner Turbo Systems GmbH (from August 2002 to October 2004).
Christian U. Scherp has served as President, Performance Audio since July 2015 and prior thereto he was Co-President, Mobile Consumer Electronics - Speakers and Receivers (from September 2012 to June 2015). Prior to joining Knowles Electronics, Mr. Scherp served as the Global Head of Sales for the Consumer Devices business of TE Connectivity, a manufacturer of connectivity and sensor platforms (from November 2011 to August 2012). Additional previous experience includes the following roles at Conexant Systems: Executive Vice President of Sales (from January 2011 to June 2011), Co-President, WW Sales, Marketing, Program Management (from July 2009 to December 2010), and President (from 2008 to 2009).
Raymond D. Cabrera has served as Senior Vice President, Human Resources & Chief Administrative Officer since February 2014. From November 2011 until the Separation in February 2014, Mr. Cabrera served as Vice President, Human Resources of Dover Communication Technologies. Previously, Mr. Cabrera served in the following capacities at Knowles: as Vice President, Human Resources and Chief Administrative Officer (from January 2004 to November 2011), Vice President, Human Resources (from March 2000 to January 2004), and Director, Human Resources (from June 1997 to March 2000) of Knowles Electronics.
Daniel J. Giesecke has served as Senior Vice President & Chief Operating Officer since February 2014. From January 2012 until the Separation in February 2014, Mr. Giesecke served as Vice President, Global Operations of Dover Communication Technologies. Previously, Mr. Giesecke served as Vice President, Advanced Manufacturing Engineering, Knowles Electronics (from February 2009 to January 2012), Senior Director, Advanced Manufacturing Engineering, Knowles Electronics (from January 2008 to February 2009), Director of Engineering Operations, Knowles Electronics (from November 2003 to January 2008), and various operations, supply chain, and engineering positions since he joined Knowles Electronics in 1995.
19
Thomas G. Jackson has served as Senior Vice President, Secretary since February 2014 and effective April 1, 2014, General Counsel. Prior to joining Knowles, Mr. Jackson served as Vice President and Assistant General Counsel at Jabil Circuit, Inc., a provider of electronic manufacturing services (from March 2012 to December 2013). In addition, he served as Vice President, General Counsel and Secretary at P.H. Glatfelter Company, a manufacturer of specialty papers and fiber-based engineered materials (from June 2008 to November 2011) and as its Assistant General Counsel, Assistant Secretary, and Director of Compliance (from September 2006 to June 2008).
Michael S. Polacek has served as President, Intelligent Audio since February 2017. Prior to joining Knowles, Mr. Polacek was a partner with Eachwin Capital, L.P., a management investment firm, from December 2012 to January 2017 and served as a strategic adviser for KKR Private Equity during 2012. In addition, he held numerous management and other senior positions, including Senior Vice President, Corporate Development and Key Market Segments at National Semiconductor, a semiconductor manufacturer, from 1992 to 2011.
Bryan E. Mittelman has served as Vice President, Controller since February 2014. Mr. Mittelman started his career at Knowles in September 2013. Previously, Mr. Mittelman served as the Controller for Morningstar, Inc., an investment research and investment management company from December 2011 to September 2013. Additional prior experience includes operating his consulting business from June 2010 to December 2011 and the following roles at Siemens Healthcare Diagnostics and Dade Behring (which was acquired by Siemens in 2007): Vice President, Finance, North America (from January 2008 to May 2010), Vice President, Finance, Americas (from January 2007 to December 2007), Vice President, Corporate Audit and Advisory Services (from March 2006 to December 2006), Assistant Corporate Controller (from April 2005 to February 2006), and Director of Financial Reporting (from July 2002 to April 2005).
20
PART II
ITEM 5. MARKET FOR REGISTRANT'S COMMON EQUITY, RELATED STOCKHOLDER MATTERS, AND ISSUER PURCHASES OF EQUITY SECURITIES
Market Information
Our common stock is listed on the New York Stock Exchange ("NYSE") under the ticker symbol “KN”. The following table presents the high and low prices for our common stock as reported on the NYSE for each of the periods indicated below.
2017 | 2016 | ||||||||||||||
Market Prices | Market Prices | ||||||||||||||
High | Low | High | Low | ||||||||||||
First Quarter | $ | 19.82 | $ | 16.06 | $ | 14.04 | $ | 9.98 | |||||||
Second Quarter | $ | 19.90 | $ | 16.73 | $ | 15.82 | $ | 12.27 | |||||||
Third Quarter | $ | 17.15 | $ | 14.11 | $ | 16.20 | $ | 12.87 | |||||||
Fourth Quarter | $ | 16.98 | $ | 14.27 | $ | 17.36 | $ | 13.91 | |||||||
Dividends
Since our common stock began trading on the NYSE, we have not paid cash dividends and we do not anticipate paying a cash dividend on our common stock in the immediate future. Any determination to pay dividends in the future will be at the discretion of our Board of Directors and will depend on many factors, such as our financial condition, earnings, capital requirements, debt service obligations, industry practice, legal requirements, regulatory constraints, and other factors that the Board of Directors deems relevant. Our ability to pay dividends will depend on our ongoing ability to generate cash from operations and access to the capital markets.
Holders
The number of holders of record of our common stock as of February 16, 2018 was approximately 1,072.
Securities Authorized for Issuance Under Equity Compensation Plans
For information regarding securities authorized for issuance under our equity compensation plans, see Part III, Item 12 of this Form 10-K.
Recent Sales of Unregistered Securities
None.
Issuer Purchases of Equity Securities
None.
21
Performance Graph
This performance graph does not constitute soliciting material, is not deemed filed with the SEC, and is not incorporated by reference in any of our filings under the Securities Act or the Exchange Act, whether made before or after the date of this Annual Report on Form 10-K and irrespective of any general incorporation language in any such filing, except to the extent we specifically incorporate this performance graph by reference therein.
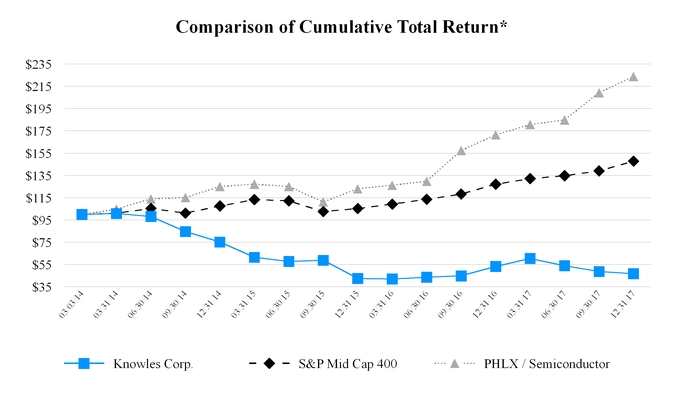
Data Source: NYSE
*Total return assumes reinvestment of dividends.
This graph assumes $100 invested on March 3, 2014, the date our common stock began "regular way" trading on the NYSE, in Knowles Corporation common stock, the S&P Mid Cap 400® index, and PHLX / Semiconductor Sector IndexSM.
22
ITEM 6. SELECTED FINANCIAL DATA
The following table presents selected financial data on a continuing operations basis as derived from our audited Consolidated Financial Statements.
The selected financial data includes costs of Knowles’ businesses, which include the allocation of certain corporate expenses from our Former Parent through the date of the Separation. We believe that these allocations were made on a reasonable basis. The selected historical financial data for the period prior to the Separation may not be indicative of our future performance as an independent publicly traded company. The selected financial data should be read in conjunction with "Management's Discussion and Analysis of Financial Condition and Results of Operations" included under Item 7 and the Consolidated Financial Statements and accompanying notes included under Item 8, "Financial Statements and Supplementary Data."
Years Ended December 31, | ||||||||||||||||||||
Statement of Earnings Data (1) (in millions, except share and per share amounts) | 2017 | 2016 | 2015 (2) | 2014 | 2013 | |||||||||||||||
Revenues | $ | 744.2 | $ | 755.7 | $ | 753.6 | $ | 785.0 | $ | 835.0 | ||||||||||
Gross profit | 286.3 | 295.9 | 281.8 | 308.6 | 393.9 | |||||||||||||||
Earnings from continuing operations | $ | 6.5 | $ | 19.8 | $ | 17.4 | $ | 111.0 | $ | 188.1 | ||||||||||
Adjusted for: | ||||||||||||||||||||
Interest expense, net (3) | $ | 20.6 | $ | 20.4 | $ | 12.7 | $ | 6.6 | $ | 13.7 | ||||||||||
Provision for income taxes | 12.9 | 8.3 | 3.2 | 8.4 | 17.8 | |||||||||||||||
EBIT (4) | $ | 40.0 | $ | 48.5 | $ | 33.3 | $ | 126.0 | $ | 219.6 | ||||||||||
Basic earnings per share from continuing operations | $ | 0.07 | $ | 0.22 | $ | 0.20 | $ | 1.31 | $ | 2.21 | ||||||||||
Diluted earnings per share from continuing operations | $ | 0.07 | $ | 0.22 | $ | 0.20 | $ | 1.30 | $ | 2.21 | ||||||||||
Basic shares outstanding (5) | 89,329,794 | 88,667,098 | 86,802,828 | 85,046,042 | 85,019,159 | |||||||||||||||
Diluted shares outstanding (5) | 90,490,007 | 89,182,967 | 86,992,254 | 85,292,959 | 85,019,159 | |||||||||||||||
As of December 31, | ||||||||||||||||||||
Balance Sheet Data (in millions) | 2017 | 2016 | 2015 (2) | 2014 | 2013 | |||||||||||||||
Total assets | $ | 1,549.8 | $ | 1,515.0 | $ | 1,696.4 | $ | 1,998.4 | $ | 2,170.1 | ||||||||||
Total third party debt and lease obligations (6)(7) | $ | 207.4 | $ | 313.8 | $ | 447.5 | $ | 404.3 | $ | 1.6 | ||||||||||
Years Ended December 31, | ||||||||||||||||||||
Other Data (1) (in millions) | 2017 | 2016 | 2015 (2) | 2014 | 2013 | |||||||||||||||
Depreciation and amortization | $ | 53.8 | $ | 69.0 | $ | 72.4 | $ | 70.1 | $ | 99.2 | ||||||||||
Capital expenditures | $ | 49.5 | $ | 32.2 | $ | 36.8 | $ | 59.2 | $ | 59.9 | ||||||||||
(1) | On November 28, 2017, the Company completed the sale of its Timing Device Business. On July 7, 2016, the Company completed the sale of its Speaker and Receiver Product Line. All amounts presented are on a continuing operations basis. For additional information, refer to Note 2. Disposed and Discontinued Operations to our Consolidated Financial Statements under Item 8, "Financial Statements and Supplementary Data." |
(2) | On July 1, 2015, the Company completed its acquisition of all of the outstanding shares of common stock of Audience, Inc. ("Audience"). The Consolidated Statements of Earnings and Consolidated Balance Sheets include the results of operations, net assets acquired, and depreciation and amortization expense related to Audience since the date of acquisition. For additional information on the Audience acquisition, refer to Note 3. Acquisitions to our Consolidated Financial Statements under Item 8, "Financial Statements and Supplementary Data." |
23
(3) | On January 27, 2014, we entered into five-year credit facilities totaling $500.0 million and borrowed $400.0 million on February 28, 2014 to finance a cash payment to our Former Parent in connection with the Separation. On April 27, 2016, the Company entered into a fourth amendment to its Credit Facilities in connection with the Company's offering of the 3.25% Convertible Senior Notes due November 1, 2021 ("the Notes"). On October 11, 2017, the Company entered into a new five-year senior secured revolving credit facility totaling $400.0 million and borrowed $172.7 million. The revolving credit facility as of December 31, 2017 is $50.7 million. The interest expense, net for the periods ending December 31, 2017, 2016, 2015, and 2014 relates to these borrowings. The interest expense, net during fiscal year 2013 relates to interest expense on the net notes payable to our Former Parent that was settled during the fourth quarter of 2013 in anticipation of the Separation. See "Management's Discussion and Analysis of Financial Condition and Results of Operations—Borrowings" section for additional information related to our debt. |
(4) | We use the term “EBIT” throughout this Annual Report on Form 10-K, defined as net earnings plus (i) interest expense, net and (ii) income taxes. EBIT is not presented in accordance with accounting principles generally accepted in the United States of America ("GAAP" or "U.S. GAAP") and may not be comparable to similarly titled measures used by other companies. We use EBIT as a supplement to our GAAP results of operations in evaluating certain aspects of our business, and our Board of Directors and executive management team focus on EBIT as a key measure of our performance for business planning purposes. This measure assists us in comparing performance between various reporting periods on a consistent basis, as this measure removes from operating results the impact of items that, in our opinion, do not reflect our core operating performance. We believe that our presentation of EBIT is useful because it provides investors and securities analysts with the same information that we use internally for purposes of assessing our core operating performance. For a reconciliation of EBIT to net earnings, the most directly related GAAP measure, please see the Statement of Earnings Data table above. The Company does not consider these non-GAAP financial measures to be a substitute for the information provided by GAAP financial results. |
(5) | On July 1, 2015, the Company issued 3.2 million shares to former stockholders of Audience and for the conversion of vested in-the-money Audience stock options. The Company also converted unvested in-the-money Audience stock options and restricted stock units for an aggregate of 461,371 shares of its common stock. On February 28, 2014, in connection with the Separation, Former Parent stockholders received one share of Knowles common stock for every two shares of Former Parent's common stock held as of the record date. Basic and diluted earnings per common share and the average number of common shares outstanding for the periods prior to the Separation were calculated using the number of Knowles common shares outstanding immediately following the Separation. See Note 18. Earnings per Share to our Consolidated Financial Statements under Item 8, "Financial Statements and Supplementary Data" for information regarding earnings per common share. |
(6) | On January 27, 2014, we, as a borrower, entered into a $200.0 million five-year senior secured revolving credit facility with a group of lenders, as well as a $300.0 million five-year senior secured term loan facility pursuant to a Credit Agreement ("Original Credit Agreement"), which are referred to collectively as the “Prior Credit Facilities.” In connection with the Separation, we incurred $100.0 million of borrowings under the revolving credit facility and $300.0 million of borrowings under the term loan facility, in each case to finance a cash payment to our Former Parent immediately prior to the Separation. On December 31, 2014, we amended our Prior Credit Facilities to increase the amount of the revolving credit facility in the Original Credit Agreement to $350.0 million but incurred no additional borrowings. On July 1, 2015, we amended our Prior Credit Facilities to facilitate our ability to consummate the Audience acquisition. We funded the cash portion of the consideration through a drawdown of our existing revolving credit facility and cash on hand. On February 9, 2016, the Company entered into a third amendment to its Prior Credit Facilities in connection with the Company’s decision to sell the Speaker and Receivers Product Line, which also included permanent reduction by the Company of the aggregate revolving commitment under the Original Credit Agreement from $350.0 million to $300.0 million. On April 27, 2016, the Company entered into a fourth amendment to its Prior Credit Facilities in connection with the Company's offering of the Notes. On October 11, 2017, the Company entered into a Revolving Credit Facility Agreement (the "New Credit Facility"). The new agreement is being used for working capital and other general corporate purposes of the Company, including refinancing of indebtedness under the Company’s Prior Credit Facilities. The New Credit Facility contains a five-year senior secured revolving credit facility providing for borrowings in aggregate principal amount of up to $400.0 million. See Item 7. "Management's Discussion and Analysis of Financial Condition and Results of Operations—Borrowings" section for additional information related to our debt. |
(7) | Also includes current portion of long-term debt and capital lease obligations. |
24
ITEM 7. MANAGEMENT'S DISCUSSION AND ANALYSIS OF FINANCIAL CONDITION AND RESULTS OF OPERATIONS
The discussion and analysis presented below refer to and should be read in conjunction with our audited Consolidated Financial Statements and related notes under Item 8. "Financial Statements and Supplementary Data." The following discussion contains forward-looking statements. The matters discussed in these forward-looking statements are subject to risks, uncertainties, and other factors that could cause actual results to differ materially from those made, projected, or implied in the forward-looking statements. Factors that could cause or contribute to these differences include those discussed below and elsewhere in this Form 10-K, particularly in “Risk Factors” and “Cautionary Statement Concerning Forward-Looking Statements.”
Management’s discussion and analysis, which we refer to as “MD&A,” of our results of operations, financial condition, and cash flows should be read together with the audited Consolidated Financial Statements and accompanying notes included under Item 8. "Financial Statements and Supplementary Data," to provide an understanding of our financial condition, changes in financial condition, and results of our operations. We believe the assumptions underlying the Consolidated Financial Statements are reasonable. However, the Consolidated Financial Statements included herein may not necessarily reflect our results of operations, financial position, and cash flows in the future.
As discussed in Note 2. Disposed and Discontinued Operations to our audited Consolidated Financial Statements under Item 8, "Financial Statements and Supplementary Data", we completed the sale of our high-end oscillators business ("Timing Device Business") in the fourth quarter of 2017 and the sale of our speaker and receiver product line ("Speaker and Receiver Product Line" in the fourth quarter of 2016. Accordingly, the results of operations and related assets and liabilities for the Timing Device Business and the Speaker and Receiver Product Line have been reclassified as discontinued operations for all periods presented. Unless otherwise indicated, discussion within this MD&A and elsewhere within this Annual Report Form 10-K refers to results from continuing operations.
Our Business
We are a market leader and global supplier of advanced micro-acoustic, audio processing, and precision device solutions, serving the mobile consumer electronics, communications, medical, military, aerospace, and industrial markets. We use our leading position in micro-electro-mechanical systems ("MEMS") microphones and strong capabilities in audio processing technologies to optimize audio systems and improve the user experience in mobile, ear, and Internet of Things ("IoT") applications. We are also the leader in acoustics components used in hearing aids and have a strong position in high-end capacitors. Our focus on the customer, combined with our unique technology, proprietary manufacturing techniques, rigorous testing, and global scale, enables us to deliver innovative solutions that optimize the user experience. References to "Knowles," the "Company," "we," "our," or "us" refer to Knowles Corporation and its consolidated subsidiaries, unless the context otherwise requires.
Our Business Segments
In January 2017, the Company changed its internal reporting to facilitate delivering growth in its core business. Given the changes in the allocation of resources and in its internal reporting structure, the Company now reports two segments, Audio and Precision Devices ("PD"). As a result of this change, transducer products used in hearing health and premium headset applications were moved from the historical Specialty Components segment into the new Audio segment, which includes the historical Mobile Consumer Electronics segment. The capacitor products formerly in the Specialty Components segment are now included in the PD segment.
We are organized into two reportable segments based on how management analyzes performance, allocates capital, and makes strategic and operational decisions. These segments were determined in accordance with Accounting Standards Codification 280, Segment Reporting, and are comprised of (i) Audio and (ii) PD. The segments are aligned around similar product applications serving our key end markets, to enhance focus on end market growth strategies.
• | Audio Segment |
Our Audio group designs and manufactures innovative audio products, including microphones and balanced armature speakers, signal processing technologies, and software and algorithms used in applications that serve the mobile, ear, and IoT markets. Locations include the sales, support, and engineering facilities in North America, Europe, and Asia, as well as the manufacturing facilities in Asia.
25
• | PD Segment |
Our PD group specializes in the design and delivery of highly engineered capacitors and radio frequency devices for technically demanding applications. Our devices are used in applications including power supplies, radar, medical implants, and satellites, serving the industrial, defense, aerospace, medical, and telecommunications markets. Locations include the sales, support, engineering, and manufacturing facilities in North America, Europe, and Asia.
We sell our products directly to original equipment manufacturers ("OEMs") and to their contract manufacturers and suppliers and to a lesser extent through distributors worldwide.
On November 28, 2017, we completed the sale of the Timing Device Business, part of the PD segment, to Microsemi Corporation for $130.0 million, subject to purchase price adjustments. For additional information, refer to Note 2. Disposed and Discontinued Operations to our Consolidated Financial Statements under Item 8, "Financial Statements and Supplementary Data."
On January 11, 2017, we completed an acquisition of certain assets of a capacitors manufacturer for cash consideration of $3.7 million, of which $2.5 million was paid during the first quarter of 2017, with the remaining $1.2 million to be paid in quarterly installments from 2018 through the first quarter of 2019, less any purchase price adjustments ("Capacitors Acquisition"). This acquisition's operations are included in the PD segment.
On July 7, 2016, we completed the sale of our Speaker and Receiver Product Line for $45.0 million in cash, less purchase price adjustments, for a net amount received of $40.6 million. For additional information, refer to Note 2. Disposed and Discontinued Operations to our Consolidated Financial Statements under Item 8, "Financial Statements and Supplementary Data."
On July 1, 2015, we completed our acquisition of all of the outstanding shares of common stock of Audience, Inc. ("Audience"), a leading provider of intelligent voice and audio solutions that improve voice quality and the user experience in mobile devices. Results for Audience are included in the Audio segment. For additional information on the Audience acquisition, refer to Note 3. Acquisitions to our Consolidated Financial Statements under Item 8, "Financial Statements and Supplementary Data."
Results of Operations for the Year Ended December 31, 2017 compared with the Years Ended December 31, 2016 and December 31, 2015
In addition to the GAAP financial measures included herein, we have presented certain non-GAAP financial measures. We use non-GAAP measures as supplements to our GAAP results of operations in evaluating certain aspects of our business and our executive management team focuses on non-GAAP items as key measures of our performance for business planning purposes. These measures assist us in comparing our performance between various reporting periods on a consistent basis, as these measures remove from operating results the impact of items that, in our opinion, do not reflect our core operating performance. We believe that our presentation of non-GAAP financial measures is useful because it provides investors and securities analysts with the same information that we use internally for purposes of assessing our core operating performance. The Company does not consider these non-GAAP financial measures to be a substitute for the information provided by GAAP financial results. For a reconciliation of these non-GAAP financial measures to the most directly comparable GAAP financial measures, see the reconciliation included herein.
26
Years Ended December 31, | ||||||||||||
(in millions, except per share amounts) | 2017 | 2016 | 2015 | |||||||||
Revenues | $ | 744.2 | $ | 755.7 | $ | 753.6 | ||||||
Gross profit | $ | 286.3 | $ | 295.9 | $ | 281.8 | ||||||
Non-GAAP gross profit | $ | 300.2 | $ | 302.2 | $ | 307.0 | ||||||
Earnings from continuing operations before interest and income taxes | $ | 40.0 | $ | 48.5 | $ | 33.3 | ||||||
Adjusted earnings from continuing operations before interest and income taxes | $ | 110.6 | $ | 99.7 | $ | 111.7 | ||||||
Provision for income taxes | $ | 12.9 | $ | 8.3 | $ | 3.2 | ||||||
Non-GAAP provision for income taxes | $ | 14.9 | $ | 3.2 | $ | 5.6 | ||||||
Earnings from continuing operations | $ | 6.5 | $ | 19.8 | $ | 17.4 | ||||||
Non-GAAP net earnings from continuing operations | $ | 81.2 | $ | 80.5 | $ | 93.4 | ||||||
Earnings per share from continuing operations - diluted (1) | $ | 0.07 | $ | 0.22 | $ | 0.20 | ||||||
Non-GAAP diluted earnings per share from continuing operations | $ | 0.88 | $ | 0.89 | $ | 1.06 | ||||||
(1) On July 1, 2015, the Company issued 3.2 million shares to former holders of Audience shares and for the conversion of vested in-the-money Audience stock options. The Company also converted unvested in-the-money Audience stock options and restricted stock units for an aggregate of 461,371 shares of its common stock. See Note 18. Earnings per Share to our Consolidated Financial Statements under Item 8, "Financial Statements and Supplementary Data" for information regarding earnings per share.
Revenues
2017 Versus 2016
Revenues for the year ended December 31, 2017 were $744.2 million, compared with $755.7 million for the year ended December 31, 2016, a decrease of $11.5 million or 1.5%. This was due to a decrease in Audio revenues of $24.5 million primarily due to lower average selling prices on mature products in the Audio segment. In addition, shipments of hearing health transducers decreased from the prior year as we have been more disciplined with our pricing. The decreases were partially offset by the $13.6 million of revenue from a settlement of a royalty dispute and higher shipments of MEMS microphones to the IoT market. Our future royalty revenues are not expected to be material. PD revenues had an increase of $13.0 million primarily due to higher capacitor product shipments for the defense, medical, and automotive markets, as well as increased revenues related to our Capacitors Acquisition in January 2017, partially offset by lower pricing.
2016 Versus 2015
Revenues for the year ended December 31, 2016 were $755.7 million, compared with $753.6 million for the year ended December 31, 2015, an increase of $2.1 million or 0.3%. This was due to an increase in Audio revenues of $7.6 million and partially offset by a decrease in PD revenues of $5.5 million. Audio revenues increased due to increased shipments of MEMS microphones, driven by market growth, share gains, and multiple microphone adoption at key Chinese OEMs, partially offset by lower average selling prices on mature products and unfavorable product mix impacts. PD revenues decreased due to lower pricing and lower market demand for capacitor products.
27
Cost of Goods Sold
2017 Versus 2016
Cost of goods sold ("COGS") for the year ended December 31, 2017 was $452.5 million, compared with $458.0 million for the year ended December 31, 2016, a decrease of $5.5 million or 1.2%. This decrease was primarily due to favorable impacts from productivity initiatives and foreign currency exchange rate changes, partially offset by lower fixed overhead absorption. In addition, we experienced higher capacitor and MEMS microphone shipment volume to the IoT market, along with increases in both production transfer costs and restructuring charges.
2016 Versus 2015
COGS for the year ended December 31, 2016 was $458.0 million, compared with $465.8 million for the year ended December 31, 2015, a decrease of $7.8 million or 1.7%. This decrease was primarily due to favorable impacts from productivity initiatives, lower production transfer costs and other charges, a lower cost product mix, favorable foreign currency exchange rate changes, and cost savings from our production transfer activities, partially offset by increased shipments of MEMS microphones and lower fixed overhead absorption in the first half of 2016.
Impairment Charges
In 2017 we recorded total impairment charges of $21.3 million, which relates to a specific product line within the Audio segment. We concluded that the projected cash flows from this product line were not sufficient to recover the carrying value of the associated long-lived assets. Total impairment charges of $1.4 million were classified as COGS and $19.9 million were classified as Operating expenses. For additional information on impairments of long-lived assets, refer to Note 4. Impairments to our Consolidated Financial Statements.
Restructuring Charges
We undertake restructuring programs from time to time to better align our operations with current market conditions. Such activities include facility consolidations, headcount reductions, and other measures to further optimize operations. It is likely that we will have restructuring charges in the future as we continue to consolidate our manufacturing footprint. Details regarding restructuring programs undertaken during the reporting period are as follows:
2017
During the year ended December 31, 2017, we recorded restructuring charges of $10.2 million. The charges consist primarily of actions associated with rationalizing the research and development workforce and the continued transfer of our hearing health manufacturing into a lower-cost Asian manufacturing facility. Charges of $4.0 million were classified as COGS and charges of $6.2 million were classified as Operating expenses.
2016
During the year ended December 31, 2016, we recorded restructuring charges of $10.1 million, comprised primarily of actions associated with the integration of Audience. Other charges relate to actions associated with lowering operating expenses and the continued expenses for the transfer of our capacitor business into lower-cost Asian manufacturing facilities. Charges of $1.5 million were classified as COGS and charges of $8.6 million were classified as Operating expenses.
2015
During the year ended December 31, 2015, we recorded restructuring charges of $14.3 million comprised primarily of $9.5 million of charges associated with the integration of Audience. The remaining charges relate to the transfer of our hearing health business into lower cost Asian manufacturing facilities. Charges of $2.7 million were classified as COGS and charges of $11.6 million were classified as Operating expenses.
28
Gross Profit and Non-GAAP Gross Profit
2017 Versus 2016
Gross profit for the year ended December 31, 2017 was $286.3 million, compared with $295.9 million for the year ended December 31, 2016, a decrease of $9.6 million or 3.2%. Gross profit margin (gross profit as a percentage of revenues) for the year ended December 31, 2017 was 38.5%, compared with 39.2% for the year ended December 31, 2016. The gross profit and margin decreased primarily due to lower average selling prices on mature products, lower fixed overhead absorption, higher production transfer costs, and increased restructuring charges. The decreases were partially offset by favorable impacts from productivity initiatives, a settlement of a royalty dispute, and foreign currency exchange rate changes.
Non-GAAP gross profit for the year ended December 31, 2017 was $300.2 million, compared with $302.2 million for the year ended December 31, 2016, a decrease of $2.0 million or 0.7%. Non-GAAP gross profit margin (non-GAAP gross profit as a percentage of revenues) for the year ended December 31, 2017 was 40.3%, as compared with 40.0% for the year ended December 31, 2016. The Non-GAAP gross profit decreased primarily due to lower average selling prices on mature products and lower fixed overhead absorption. The decreases were partially offset by favorable impacts from productivity initiatives, a settlement of a royalty dispute, and foreign currency exchange rate changes. The Non-GAAP gross profit margin increased slightly as Non-GAAP gross profit remained relatively consistent with prior year while revenues decreased $11.5 million.
2016 Versus 2015
Gross profit for the year ended December 31, 2016 was $295.9 million, compared with $281.8 million for the year ended December 31, 2015, an increase of $14.1 million or 5.0%. Gross profit margin for the year ended December 31, 2016 was 39.2%, compared with 37.4% for the year ended December 31, 2015. The gross profit and margin increases were primarily due to higher microphone shipments, favorable impacts from productivity initiatives, lower production transfer costs and other charges, favorable foreign currency exchange rate changes, and cost savings from our production transfer activities, partially offset by lower average selling prices on mature products, lower fixed overhead absorption in the first half of 2016, and unfavorable product mix.
Non-GAAP gross profit for the year ended December 31, 2016 was $302.2 million, compared with $307.0 million for the year ended December 31, 2015, a decrease of $4.8 million or 1.6%. Non-GAAP gross profit margin for the year ended December 31, 2016 was 40.0%, as compared with 40.7% for the year ended December 31, 2015. The Non-GAAP gross profit and margin decreases were primarily due to lower average selling prices on mature products, lower fixed overhead absorption in the first half of 2016, and unfavorable product mix, partially offset by higher microphone shipments, favorable impacts from productivity initiatives, favorable foreign currency exchange rate changes, and cost savings from our production transfer activities.
Research and Development Expenses
2017 Versus 2016
Research and development expenses for the years ended December 31, 2017 and 2016 were $93.4 million and $92.0 million, respectively. Research and development expenses as a percentage of revenues for the years ended December 31, 2017 and 2016 were 12.6% and 12.2%, respectively. The increase in research and development expenses was driven by compensation increases, partially offset by lower headcount.
2016 Versus 2015
Research and development expenses for the years ended December 31, 2016 and 2015 were $92.0 million and $83.2 million, respectively. Research and development expenses as a percentage of revenues for the years ended December 31, 2016 and 2015 were 12.2% and 11.0%, respectively. The increase in research and development expenses and as a percentage of revenues was primarily driven by our acquired Audience research and development operations and an increase in new product development spending, partially offset by cost reduction initiatives.
29
Selling and Administrative Expenses
2017 Versus 2016
Selling and administrative expenses for the year ended December 31, 2017 were $126.3 million, compared with $149.9 million for the year ended December 31, 2016, a decrease of $23.6 million or 15.7%. Selling and administrative expenses as a percentage of revenues for the year ended December 31, 2017 were 17.0%, compared with 19.8% for the year ended December 31, 2016. The decrease in selling and administrative expenses and as a percentage of revenues was primarily driven by lower intangible amortization costs, benefits of our cost reduction initiatives, and a reduction in legal fees. The reduction in legal fees was driven by a settlement of a royalty dispute, which included a $5.6 million allocation against previously incurred expenses.
2016 Versus 2015
Selling and administrative expenses for the year ended December 31, 2016 were $149.9 million, compared with $149.7 million for the year ended December 31, 2015, an increase of $0.2 million or 0.1%. Selling and administrative expenses as a percentage of revenues for the year ended December 31, 2016 were 19.8%, compared with 19.9% for the year ended December 31, 2015. The expense increase was primarily driven by our acquired Audience operations and increased compensation, partially offset by cost reduction initiatives, and lower acquisition costs.
Earnings and Adjusted Earnings from Continuing Operations Before Interest and Income Taxes
2017 Versus 2016
Earnings before interest and income taxes ("EBIT") from continuing operations for the year ended December 31, 2017 was $40.0 million, compared with $48.5 million for the year ended December 31, 2016, a decrease of $8.5 million or 17.5%. EBIT margin (EBIT from continuing operations as a percentage of revenues) for the year ended December 31, 2017 was 5.4%, as compared with 6.4% for the year ended December 31, 2016. This decrease was primarily due to lower gross profit and higher impairment charges in Operating expense, partially offset by lower intangible amortization costs, benefits of our operating cost reduction initiatives, and the reduction in legal fees driven by a settlement of a royalty dispute.
Adjusted earnings before interest and income taxes ("Adjusted EBIT") from continuing operations for the year ended December 31, 2017 was $110.6 million, compared with $99.7 million for the year ended December 31, 2016, an increase of $10.9 million or 10.9%. Adjusted EBIT margin (adjusted EBIT from continuing operations as a percentage of revenues) for the year ended December 31, 2017 was 14.9%, as compared with 13.2% for the year ended December 31, 2016. The increase is primarily due to lower non-GAAP operating expenses, driven by our operating cost reduction initiatives, and the reduction in legal fees driven by a settlement of a royalty dispute.
2016 Versus 2015
EBIT for the year ended December 31, 2016 was $48.5 million, compared with $33.3 million for the year ended December 31, 2015, an increase of $15.2 million or 45.6%. EBIT margin for the year ended December 31, 2016 was 6.4%, as compared to 4.4% for the year ended December 31, 2015. This increase was primarily due to higher gross profit, benefits from cost reduction initiatives, and lower acquisition costs, partially offset by higher operating expenses related to our acquired Audience operations, increased compensation, and new product development.
Adjusted EBIT for the year ended December 31, 2016 was $99.7 million, compared with $111.7 million for the year ended December 31, 2015, a decrease of $12.0 million or 10.7%. Adjusted EBIT margin (adjusted EBIT as a percentage of revenues) for the year ended December 31, 2016 was 13.2%, as compared with 14.8% for the year ended December 31, 2015. This decrease was primarily due to higher operating expenses related to our acquired Audience operations, increased compensation, new product development costs, and a decrease in non-GAAP gross profit, partially offset by operating cost reduction initiatives and lower acquisition costs.
30
Interest Expense, net
2017 Versus 2016
Interest expense, net for the year ended December 31, 2017 was $20.6 million, compared with $20.4 million for the year ended December 31, 2016, an increase of $0.2 million or 1.0%. The increase in interest expense is primarily due to non-cash interest expense related to the Company's issuance of $172.5 million aggregate principal amount of 3.25% convertible senior notes due November 1, 2021 in a private placement in May 2016 (the "Notes") and higher interest rates, partially offset by lower outstanding borrowings. For additional information on borrowings and interest expense, refer to Note 11. Borrowings to our Consolidated Financial Statements.
2016 Versus 2015
Interest expense, net for the year ended December 31, 2016 was $20.4 million, compared with $12.7 million for the year ended December 31, 2015, an increase of $7.7 million or 60.6%. The increase in interest expense is due to non-cash interest related to the convertible senior notes issued in May 2016 and higher interest rates, partially offset by lower outstanding borrowings.
Provision for Income Taxes and Non-GAAP Provision for Income Taxes
2017 Versus 2016
The effective tax rate ("ETR") for the year ended December 31, 2017 was a 66.5% provision, compared with a 29.5% provision for the year ended December 31, 2016. The change in the ETR is due primarily to the mix of earnings by taxing jurisdictions, the change to the terms of our tax holiday in Malaysia, and the Tax Reform Act. We recorded a provisional tax benefit of $11.7 million related to the reassessment of the beginning of the year valuation allowance, and a $5.6 million provisional benefit related to the remeasurement of our net deferred tax liability as a result of the Tax Reform Act. We also recorded a provisional tax expense of $56.0 million, net of expected foreign tax credits, related to the deemed repatriation of unremitted earnings for foreign subsidiaries, which was partially offset by the use of existing tax attributes primarily consisting of net operating loss carryforwards and research and development tax credits. The final impact may differ from these provisional amounts, possibly materially, due to, among other things, issuance of additional regulatory guidance, changes in interpretations and assumptions we made, and actions we may take as a result of the Tax Reform Act.
The ETR for the years ended December 31, 2017 and 2016 was favorably impacted by two tax holidays granted to us by Malaysia. The ETR for the year ended December 31, 2017 was unfavorably impacted by losses incurred in jurisdictions with zero tax benefit recorded. The ETR for the year ended December 31, 2016 was unfavorably impacted by valuation allowances recorded in certain jurisdictions, primarily the United States (“U.S.”) and the United Kingdom (“U.K”). For additional information on this tax holiday, see Note 12. Income Taxes to our Consolidated Financial Statements under Item 8, “Financial Statements and Supplementary Data."
The non-GAAP ETR for the year ended December 31, 2017 was a 15.5% provision, compared with a 3.8% provision for the year ended December 31, 2016. The change in the non-GAAP ETR was due to the mix of earnings by taxing jurisdictions.
The ETR and non-GAAP ETR deviate from the statutory U.S. federal income tax rate, mainly due to the taxing jurisdictions in which we generate taxable income or loss, the favorable impact of our tax holidays in Malaysia, and judgments as to the realizability of our deferred tax assets. A significant portion of our pre-tax income is not subject to tax as a result of our tax holidays in Malaysia, subject to our satisfaction of certain conditions that we expect to continue to satisfy. Unless extended or otherwise renegotiated, our existing tax holidays in Malaysia will expire December 31, 2021. During 2016, the Company applied for and received final approval to modify the terms of its main tax holiday in Malaysia, reducing the rate to 7.2% versus the statutory rate of 24.0%, effective January 1, 2017 through December 31, 2021. The U.S. and U.K. operations were in a cumulative loss position as of December 31, 2017 and 2016, respectively. Based on this, and other relevant information, the Company concluded that tax losses and deferred tax assets generated in the U.S. and the U.K. would not be benefited currently or in the future.
2016 Versus 2015
The ETR for the year ended December 31, 2016 was a 29.5% provision, compared with a 15.5% provision for the year ended December 31, 2015. The ETR for the year ended December 31, 2016 was unfavorably impacted by valuation allowances recorded in certain jurisdictions, primarily in the U.S. and the U.K. The ETR for the year ended December 31, 2015 was unfavorably impacted by valuation allowances recorded in certain jurisdictions, primarily the U.S.
31
The non-GAAP ETR for the year ended December 31, 2016 was a 3.8% provision, compared with a 5.7% provision for the year ended December 31, 2015. The change in the non-GAAP ETR was due to the mix of earnings by taxing jurisdictions.
The ETR and non-GAAP ETR deviate from the statutory U.S. federal income tax rate, mainly due to the taxing jurisdictions in which we generate taxable income or loss and the favorable impact of our tax holidays in Malaysia. A significant portion of our pre-tax income is not subject to tax as a result of our tax holidays in Malaysia, subject to our satisfaction of certain conditions that we expect to continue to satisfy. During 2016, the Company applied for and received final approval to modify the terms of its main tax holiday in Malaysia, reducing the rate to 7.2% versus the statutory rate of 24.0% effective January 1, 2017 through December 31, 2021. Unless extended or otherwise renegotiated, our existing tax holidays in Malaysia will expire December 31, 2021.
Earnings (loss) from Discontinued Operations, net
2017 Versus 2016
The earnings from discontinued operations was $61.8 million net of tax for the year ended December 31, 2017, compared with a loss of $62.1 million for the year ended December 31, 2016. The earnings in 2017 primarily relates to the $62.3 million pre-tax gain on sale of our timing device business. The 2016 loss was primarily related to the high unabsorbed fixed costs in our Speaker and Receiver Product Line due to lower production activity and the $25.6 million pre-tax loss on the sale of our Speaker and Receiver Product Line.
2016 Versus 2015
The loss from discontinued operations was $62.1 million net of tax for the year ended December 31, 2016, compared with a loss of $251.2 million for the year ended December 31, 2015. The reduction in loss from discontinued operations was primarily driven by the absence of intangible and fixed asset impairments in 2016 compared to 2015. We incurred total impairment charges of $191.5 million in 2015 when intangible assets and fixed assets were written down to their fair values. In addition, during 2016 we incurred lower depreciation and amortization expenses due to the impairments of intangible and fixed assets in 2015, partially offset by higher unabsorbed fixed costs due to lower production activity, a $25.6 million pre-tax loss on the sale of our Speaker and Receiver Product Line, and increased restructuring charges.
Diluted Earnings per Share from Continuing Operations and Non-GAAP Diluted Earnings per Share from Continuing Operations
2017 Versus 2016
Diluted earnings per share from continuing operations was $0.07 for the year ended December 31, 2017, compared with diluted earnings per share with $0.22 for the year ended December 31, 2016. The decrease in diluted earnings per share was primarily due to lower EBIT.
Non-GAAP diluted earnings per share from continuing operations for the year ended December 31, 2017 was $0.88, compared with $0.89 for the year ended December 31, 2016. The decrease in non-GAAP diluted earnings per share was primarily due to higher adjusted EBIT, which was more than offset by a higher effective tax rate.
2016 Versus 2015
Diluted earnings per share from continuing operations was $0.22 for the year ended December 31, 2016, compared with $0.20 for the year ended December 31, 2015. The increase in diluted earnings per share was primarily due to higher EBIT.
Non-GAAP diluted earnings per share from continuing operations for the year ended December 31, 2016 was $0.89, compared with $1.06 for the year ended December 31, 2015. The decrease in non-GAAP diluted earnings per share was mainly driven by lower adjusted EBIT.
32
Reconciliation of GAAP Financial Measures to Non-GAAP Financial Measures (1)
Years Ended December 31, | ||||||||||||
(in millions, except share and per share amounts) | 2017 | 2016 | 2015 | |||||||||
Gross profit | $ | 286.3 | $ | 295.9 | $ | 281.8 | ||||||
Stock-based compensation expense | 1.8 | 1.5 | 1.2 | |||||||||
Fixed asset, inventory, and other charges | 1.4 | 0.3 | 3.3 | |||||||||
Restructuring charges | 4.0 | 1.5 | 2.7 | |||||||||
Production transfer costs (2) | 6.7 | 3.0 | 16.0 | |||||||||
Other (3) | — | — | 2.0 | |||||||||
Non-GAAP gross profit | $ | 300.2 | $ | 302.2 | $ | 307.0 | ||||||
Earnings from continuing operations | $ | 6.5 | $ | 19.8 | $ | 17.4 | ||||||
Interest expense, net | 20.6 | 20.4 | 12.7 | |||||||||
Provision for income taxes | 12.9 | 8.3 | 3.2 | |||||||||
Earnings from continuing operations before interest and income taxes | 40.0 | 48.5 | 33.3 | |||||||||
Stock-based compensation expense | 24.7 | 20.9 | 15.0 | |||||||||
Intangibles amortization expense | 7.3 | 18.2 | 18.2 | |||||||||
Impairment charges | 21.3 | 0.5 | 5.6 | |||||||||
Restructuring charges | 10.2 | 10.1 | 14.3 | |||||||||
Production transfer costs (2) | 6.8 | 3.0 | 16.0 | |||||||||
Other loss (gain) (3) | 0.3 | (1.5 | ) | 9.3 | ||||||||
Adjusted earnings from continuing operations before interest and income taxes | $ | 110.6 | $ | 99.7 | $ | 111.7 | ||||||
Interest expense, net | $ | 20.6 | $ | 20.4 | $ | 12.7 | ||||||
Interest expense, net non-GAAP reconciling adjustments (4) | 6.1 | 4.4 | — | |||||||||
Non-GAAP interest expense | $ | 14.5 | $ | 16.0 | $ | 12.7 | ||||||
Provision for income taxes | $ | 12.9 | $ | 8.3 | $ | 3.2 | ||||||
Income tax effects of non-GAAP reconciling adjustments | 2.0 | (5.1 | ) | 2.4 | ||||||||
Non-GAAP provision for income taxes | $ | 14.9 | $ | 3.2 | $ | 5.6 | ||||||
(Loss) earnings from continuing operations | $ | 6.5 | $ | 19.8 | $ | 17.4 | ||||||
Non-GAAP reconciling adjustments (5) | 70.6 | 51.2 | 78.4 | |||||||||
Interest expense, net non-GAAP reconciling adjustments (4) | 6.1 | 4.4 | — | |||||||||
Income tax effects of non-GAAP reconciling adjustments | 2.0 | (5.1 | ) | 2.4 | ||||||||
Non-GAAP net earnings from continuing operations | $ | 81.2 | $ | 80.5 | $ | 93.4 | ||||||
Diluted earnings per share from continuing operations | $ | 0.07 | $ | 0.22 | $ | 0.20 | ||||||
Earnings per share non-GAAP reconciling adjustment | 0.81 | 0.67 | 0.86 | |||||||||
Non-GAAP diluted earnings per share from continuing operations | $ | 0.88 | $ | 0.89 | $ | 1.06 | ||||||
Diluted average shares outstanding | 90,490,007 | 89,182,967 | 86,992,254 | |||||||||
Non-GAAP adjustment (6) | 1,959,801 | 1,758,522 | 961,841 | |||||||||
Non-GAAP diluted average shares outstanding (6) | 92,449,808 | 90,941,489 | 87,954,095 | |||||||||
33
(1) | In addition to the GAAP financial measures included herein, Knowles has presented certain non-GAAP financial measures. Knowles uses non-GAAP measures as supplements to its GAAP results of operations in evaluating certain aspects of its business, and its executive management team focuses on non-GAAP items as key measures of Knowles' performance for business planning purposes. These measures assist Knowles in comparing its performance between various reporting periods on a consistent basis, as these measures remove from operating results the impact of items that, in Knowles' opinion, do not reflect its core operating performance. Knowles believes that its presentation of non-GAAP financial measures is useful because it provides investors and securities analysts with the same information that Knowles uses internally for purposes of assessing its core operating performance. The Company does not consider these non-GAAP financial measures to be a substitute for the information provided by GAAP financial results. |
(2) | Production transfer costs represent duplicate costs incurred to migrate manufacturing to new or existing facilities in Asia. These amounts are included in the corresponding Gross profit and Earnings from continuing operations before interest and income taxes for each period presented. |
(3) | In 2017, Other loss (gain) primarily represents expenses related to the Capacitors Acquisition. In 2016, Other primarily represents a gain on the sale of investment related to a non-controlling interest in a MEMs timing device company, partially offset by expenses related to the Audience Inc. acquisition. In 2015, Other loss (gain) represents expenses related to the Audience acquisition. |
(4) | Under GAAP, the accounting for the Company's convertible debt instrument requires separate consideration of the debt and conversion option components of the instrument in a manner that reflects a nonconvertible debt borrowing rate. Accordingly, for GAAP purposes we are required to recognize imputed interest expense on the Company’s Notes. The imputed interest rate was 8.12% for the Notes, while the actual coupon interest rate of the Notes was 3.25%. The difference between the imputed interest expense and the coupon interest expense is excluded from management’s assessment of the Company’s operating performance because management believes that this non-cash expense is not indicative of its core, ongoing operating performance. |
(5) | The Non-GAAP reconciling adjustments are those adjustments made to reconcile Earnings from continuing operations before interest and income taxes to Adjusted earnings from continuing operations before interest and income taxes. |
(6) | The number of shares used in the diluted per share calculations on a non-GAAP basis excludes the impact of stock-based compensation expense expected to be incurred in future periods and not yet recognized in the financial statements, which would otherwise be assumed to be used to repurchase shares under the GAAP treasury stock method. |
34
Segment Results of Operations for the Year Ended December 31, 2017 Compared with the Years Ended December 31, 2016 and December 31, 2015
Audio
Years Ended December 31, | ||||||||||||||||||
(in millions) | 2017 | Percent of Revenues | 2016 | Percent of Revenues | 2015 | Percent of Revenues | ||||||||||||
Revenues | $ | 637.4 | $ | 661.9 | $ | 654.3 | ||||||||||||
Operating earnings | $ | 76.1 | 11.9% | $ | 88.5 | 13.4% | $ | 85.4 | 13.1% | |||||||||
Other (income) expense, net | — | (0.3 | ) | 0.7 | ||||||||||||||
Earnings from continuing operations before interest and income taxes | $ | 76.1 | 11.9% | $ | 88.8 | 13.4% | $ | 84.7 | 12.9% | |||||||||
Stock-based compensation expense | 11.5 | 9.7 | 6.1 | |||||||||||||||
Intangibles amortization expense | 6.5 | 18.0 | 18.0 | |||||||||||||||
Impairment charges | 21.3 | 0.5 | 3.5 | |||||||||||||||
Restructuring charges | 8.1 | 7.1 | 13.4 | |||||||||||||||
Production transfer costs (1) | 6.3 | 1.0 | 11.1 | |||||||||||||||
Other loss(2) | — | 0.1 | 2.7 | |||||||||||||||
Adjusted earnings from continuing operations before interest and income taxes | $ | 129.8 | 20.4% | $ | 125.2 | 18.9% | $ | 139.5 | 21.3% | |||||||||
(1) Production transfer costs represent duplicate costs incurred to migrate manufacturing to new or existing facilities in Asia. These amounts are included in earnings before interest and income taxes for each period presented. | ||||||||||||||||||
(2) In 2015, Other represents expenses related to the Audience acquisition. | ||||||||||||||||||
Revenues
2017 Versus 2016
Audio revenues were $637.4 million for the year ended December 31, 2017, compared with $661.9 million for the year ended December 31, 2016, a decrease of $24.5 million or 3.7%. Revenues decreased primarily due to lower average selling prices on mature products in the Audio segment. In addition, shipments of hearing health transducers decreased from prior year as we have been more disciplined with our pricing. The decreases were partially offset by $13.6 million of revenue from a settlement of a royalty dispute and higher shipments of MEMS microphones to the IoT market. Our future royalty revenues are not expected to be material.
2016 Versus 2015
Audio revenues were $661.9 million for the year ended December 31, 2016, compared with $654.3 million for the year ended December 31, 2015, an increase of $7.6 million or 1.2%. Audio revenues increased due to increased shipments of MEMS microphones, driven by market growth, share gains, and multiple microphone adoption at key Chinese OEMs, partially offset by lower average selling prices on mature products and unfavorable product mix impacts.
35
Earnings and Adjusted Earnings from Continuing Operations Before Interest and Income Taxes
2017 Versus 2016
Audio EBIT from continuing operations was $76.1 million for the year ended December 31, 2017, compared with $88.8 million for the year ended December 31, 2016, a decrease of $12.7 million or 14.3%. EBIT margin (EBIT from continuing operations as a percentage of revenues) for the year ended December 31, 2017 was 11.9%, compared to 13.4% for the year ended December 31, 2016. The decrease was primarily due to lower average selling prices on mature products, higher impairments of long-lived assets, lower fixed overhead absorption, higher production transfer costs, increased stock-based compensation and higher restructuring charges. These decreases were partially offset by benefits from our productivity initiatives, $19.2 million received from a settlement of a royalty dispute, lower amortization expenses, benefits of our operating cost reduction initiatives, favorable impacts from foreign currency exchange rate changes, and higher shipments of MEMS microphones.
Audio adjusted EBIT was $129.8 million for the year ended December 31, 2017, compared with $125.2 million for the year ended December 31, 2016, an increase of $4.6 million or 3.7%. Adjusted EBIT margin for the year ended December 31, 2017 was 20.4%, compared with 18.9% for the year ended December 31, 2016. The increase was primarily due to benefits from our productivity initiatives, $19.2 million received from a settlement of a royalty dispute, benefits of our operating cost reduction initiatives, favorable impacts from foreign currency exchange rate changes, and higher shipments of MEMS microphones. These increases were partially offset by lower average selling prices on mature products and lower fixed overhead absorption.
2016 Versus 2015
Audio EBIT from continuing operations was $88.8 million for the year ended December 31, 2016, compared with $84.7 million for the year ended December 31, 2015, an increase of $4.1 million or 4.8%. EBIT margin (EBIT from continuing operations as a percentage of revenues) for the year ended December 31, 2016 was 13.4%, compared to 12.9% for the year ended December 31, 2015. The increases were primarily due to an increase in shipments, benefits from productivity initiatives, our cost reduction initiatives in operating expenses, favorable impacts from foreign currency exchange rate changes, lower production transfer costs, and reduced restructuring charges, partially offset by lower average selling prices on mature products, higher operating expenses related to our acquired Audience operations, and unfavorable product mix.
Audio adjusted EBIT was $125.2 million for the year ended December 31, 2016, compared with $139.5 million for the year ended December 31, 2015, a decrease of $14.3 million or 10.3%. Adjusted EBIT margin for the year ended December 31, 2016 was 18.9%, compared with 21.3% for the year ended December 31, 2015. The decreases were primarily due to lower average selling prices on mature products, higher operating expenses related to our acquired Audience operations, and unfavorable product mix, partially offset by an increase in shipments, benefits from productivity initiatives, our cost reduction initiatives in operating expenses, and favorable impacts from foreign currency exchange rate changes.
36
Precision Devices
Years Ended December 31, | ||||||||||||||||||
(in millions) | 2017 | Percent of Revenues | 2016 | Percent of Revenues | 2015 | Percent of Revenues | ||||||||||||
Revenues | $ | 106.8 | $ | 93.8 | $ | 99.3 | ||||||||||||
Operating earnings | $ | 18.7 | 17.5% | $ | 12.3 | 13.1% | $ | 5.4 | 5.4% | |||||||||
Other income, net | (0.5 | ) | (0.1 | ) | — | |||||||||||||
Earnings from continuing operations before interest and income taxes | $ | 19.2 | 18.0% | $ | 12.4 | 13.2% | $ | 5.4 | 5.4% | |||||||||
Stock-based compensation expense | 0.4 | 0.3 | 0.4 | |||||||||||||||
Intangibles amortization expense | 0.8 | 0.2 | 0.2 | |||||||||||||||
Impairment charges | — | — | 2.1 | |||||||||||||||
Restructuring charges | 0.1 | 1.4 | 0.3 | |||||||||||||||
Production transfer costs (1) | 0.5 | 2.0 | 4.9 | |||||||||||||||
Other loss | 0.1 | 0.1 | — | |||||||||||||||
Adjusted earnings from continuing operations before interest and income taxes | $ | 21.1 | 19.8% | $ | 16.4 | 17.5% | $ | 13.3 | 13.4% | |||||||||
(1) Production transfer costs represent duplicate costs incurred to migrate manufacturing to new or existing facilities in Asia. These amounts are included in earnings before interest and income taxes for each period presented. | ||||||||||||||||||
Revenues
2017 Versus 2016
PD revenues were $106.8 million for the year ended December 31, 2017, compared with $93.8 million for the year ended December 31, 2016, an increase of $13.0 million or 13.9%. Revenues increased due to higher capacitor product shipments primarily for the defense, medical, and automotive markets, as well as increased revenues related to our Capacitors Acquisition in January 2017, partially offset by lower pricing.
2016 Versus 2015
PD revenues were $93.8 million for the year ended December 31, 2016, compared with $99.3 million for the year ended December 31, 2015, a decrease of $5.5 million or 5.5%. Revenues decreased due to lower pricing and lower market demand for capacitor products.
Earnings and Adjusted Earnings from Continuing Operations Before Interest and Income Taxes
2017 Versus 2016
PD EBIT from continuing operations was $19.2 million for the year ended December 31, 2017, compared with $12.4 million for the year ended December 31, 2016, an increase of $6.8 million or 54.8%. EBIT margin (EBIT from continuing operations as a percentage of revenues) for the year ended December 31, 2017 was 18.0%, compared with 13.2% for the year ended December 31, 2016. The increases were primarily due to benefits from increased shipments, productivity initiatives, lower restructuring charges, and production transfer costs, along with realized cost savings from our production transfers to lower-cost Asian manufacturing facilities, partially offset by lower pricing and increased operating expenses.
37
PD adjusted EBIT was $21.1 million for the year ended December 31, 2017, compared with $16.4 million for the year ended December 31, 2016, an increase of $4.7 million or 28.7%. Adjusted EBIT margin for the year ended December 31, 2017 was 19.8%, compared with 17.5% for the year ended December 31, 2016. The increases were primarily due to benefits from increased shipments, productivity initiatives, and realized cost savings from our production transfers to lower-cost Asian manufacturing facilities, partially offset by lower pricing and increased operating expenses.
2016 Versus 2015
PD EBIT from continuing operations was $12.4 million for the year ended December 31, 2016, compared with $5.4 million for the year ended December 31, 2015, an increase of $7.0 million or 129.6%. EBIT margin for the year ended December 31, 2016 was 13.2%, compared with 5.4% for the year ended December 31, 2015. The increase was primarily due to benefits from productivity initiatives, lower production transfer costs, lower impairment charges, and realized cost savings from our production transfers to lower-cost Asian manufacturing facilities. In addition, we experienced favorable impacts from foreign currency exchange rate changes. These increases were partially offset by reduced pricing and lower market demand for capacitor products.
PD adjusted EBIT was $16.4 million for the year ended December 31, 2016, compared with $13.3 million for the year ended December 31, 2015, an increase of $3.1 million or 23.3%. Adjusted EBIT margin for the year ended December 31, 2016 was 17.5%, compared with 13.4% for the year ended December 31, 2015. The increase in adjusted EBIT was primarily due to the benefits from productivity initiatives and realized cost savings from our production transfers to lower-cost Asian manufacturing facilities. In addition, we experienced favorable impacts from foreign currency exchange rate changes. These increases were partially offset by reduced pricing and lower market demand for capacitor products.
Financial Condition
Historically, we have generated and expect to continue to generate positive cash flow from operations. Our ability to fund our operations and capital needs will depend on our ongoing ability to generate cash from operations and access to capital markets. We believe that our future cash flow from operations and access to capital markets will provide adequate resources to fund our working capital needs, dividends (if any), capital expenditures, and strategic investments. We have secured a revolving line of credit in the United States from a syndicate of commercial banks to provide additional liquidity. Furthermore, if we were to require additional cash above and beyond our cash on the balance sheet, the free cash flow generated by the business, and availability under our revolving credit facility, we would most likely seek to raise long-term financing through the U.S. debt or bank markets.
On July 1, 2015, we completed our acquisition of Audience. Under the terms of the transaction, we issued 3.2 million shares and paid $61.6 million in cash to former holders of Audience shares and for the settlement of vested Audience stock options. We funded the cash portion of the consideration through a draw down from our existing revolving credit facility and cash on hand. In addition, the amendment to our existing credit agreement to modify specific terms and conditions, including the definition of certain covenants to permit the acquisition, became effective upon the closing of the transaction.
In May 2016, we sold the Notes and concurrently entered into convertible note hedge transactions and separate warrants. The Notes will mature in November 2021, unless earlier repurchased by us or converted pursuant to their terms. The Notes are unsecured, senior obligations and interest is payable semiannually in arrears. The Notes will be convertible into cash, shares of our common stock, or a combination thereof, at our election. We have primarily used the net proceeds to reduce borrowings outstanding under our term loan facility. For additional information, refer to Note 11. Borrowings to our Consolidated Financial Statements under Item 8, "Financial Statements and Supplementary Data."
On July 7, 2016, we completed the sale of our Speaker and Receiver Product Line for $45.0 million in cash, less purchase price adjustments for a net amount received of $40.6 million. We used the net proceeds to reduce borrowings outstanding under our revolving credit facility. Refer to Note 2. Disposed and Discontinued Operations to our Consolidated Financial Statements under Item 8, "Financial Statements and Supplementary Data" for additional information.
On January 11, 2017, we completed an acquisition of certain assets of a capacitors manufacturer for cash consideration of $3.7 million, of which $2.5 million was paid during 2017, with the remaining $1.2 million to be paid in installments from 2018 through the first quarter of 2019. This acquisition's operations are included in the PD segment. Refer to Note 3. Acquisitions to our Consolidated Financial Statements under Item 8, "Financial Statements and Supplementary Data" for additional information.
On October 11, 2017, we entered into the New Credit Facility. Refer to Note 11. Borrowings to our Consolidated Financial Statements under Item 8, "Financial Statements and Supplementary Data" for additional information.
38
On November 28, 2017, the Company completed its sale of the Timing Device Business, part of the PD segment, to Microsemi Corporation for $130.0 million, subject to purchase price adjustments. Refer to Note 2. Disposed and Discontinued Operations to our Consolidated Financial Statements under Item 8, "Financial Statements and Supplementary Data" for additional information.
Our ability to make payments on and to refinance our indebtedness, as well as any debt that we may incur in the future, will depend on our ability in the future to generate cash from operations, financings, and asset sales. Due to the global nature of our operations, a significant portion of our cash is generated and held outside the United States. Our cash and cash equivalents totaled $111.7 million and $63.4 million at December 31, 2017 and 2016, respectively. Of these amounts, cash held by our non-U.S. operations totaled $75.7 million and $55.6 million as of December 31, 2017 and 2016, respectively.
As a result of U.S. tax reform, the $75.7 million held by our non-U.S. operations was subject to current tax in the U.S. in 2017. As of December 31, 2017, we had not repatriated any of these funds to the U.S. However, to the extent we repatriate these funds to the U.S., we will be required to pay income taxes in certain U.S. states and applicable foreign withholding taxes on those amounts during the period when such repatriation occurs.
Management will continue to reassess our need to repatriate the earnings of our foreign subsidiaries.
Cash Flow Summary
Cash flows from operating, investing, and financing activities as reflected in our Consolidated Statements of Cash Flows and are presented on a consolidated basis (includes discontinuing operations). Cash flows are summarized in the following table:
Years Ended December 31, | ||||||||||||
(in millions) | 2017 | 2016 | 2015 | |||||||||
Net cash flows provided by (used in): | ||||||||||||
Operating activities | $ | 92.9 | $ | 107.5 | $ | 78.4 | ||||||
Investing activities | 69.5 | 5.9 | (95.2 | ) | ||||||||
Financing activities | (117.9 | ) | (109.9 | ) | 26.1 | |||||||
Effect of exchange rate changes on cash and cash equivalents | 1.0 | (0.6 | ) | (1.2 | ) | |||||||
Net increase in cash and cash equivalents | $ | 45.5 | $ | 2.9 | $ | 8.1 | ||||||
Operating Activities
Cash provided by operating activities in 2017 decreased $14.6 million compared to 2016, primarily due to a higher investment in adjusted working capital (a non-GAAP measure calculated as receivables, net of allowances, plus inventories, less accounts payable) of $57.9 million, partially offset by lower cash operating expenses. During 2017, inventories increased to support the launch of new handsets at our largest customer and in conjunction with the transfer of certain hearing health production from China to our facility in the Philippines.
Cash provided by operating activities in 2016 increased $29.1 million compared to 2015, primarily due to beneficial changes in deferred taxes and a lower investment in adjusted working capital (a non-GAAP measure calculated as receivables, net of allowances, plus net inventories, less accounts payable) of $17.0 million.
Investing Activities
Cash provided by and used in investing activities results primarily from cash inflows from the sale of a business and outflows for capital expenditures, acquisitions, and investment activity.
39
Capital spending. Capital expenditures, primarily to support capacity expansion, innovation and cost savings, were $51.6 million, $38.7 million, and $63.1 million, for the years ended December 31, 2017, 2016, and 2015, respectively. The largest drivers of the capital expenditures have been related to investments in new product launches, ongoing investments in MEMS manufacturing capacity expansion to support growth in the handset and IoT markets, and manufacturing footprint optimization projects. The cash used in investing activities during 2017 was driven by capital expenditures to support our manufacturing capacity expansion and the Capacitors Acquisition. The reduction in capital spending in 2016 is primarily due to the sale of the Speaker and Receiver Product Line during 2016.
Sales of business, acquisitions, and investments. We received net proceeds of $123.1 million from the sale of our Timing Device Business during the year ended December 31, 2017. We received net proceeds of $40.6 million from the sale of our Speaker and Receiver Product Line during the year ended December 31, 2016. We paid $35.1 million, net of cash acquired during the year ended December 31, 2015 to acquire Audience. We also received proceeds of $4.0 million during the year ended December 31, 2015 from the sale of investments, which were part of the acquisition of Audience.
Financing Activities
Cash used in financing activities during 2017 is primarily related to the $118.5 million principal payment on our term loan and the $5.1 million payment of taxes related to net share settlement of equity awards, partially offset by net borrowings under our revolving credit facility of $5.7 million and the $3.3 million of proceeds received for option exercises. Cash used in financing activities during the year ended December 31, 2016 primarily related to $166.5 million in principal payments on our term loan, a $44.5 million purchase of convertible note hedges, $100.0 million in net payments on our revolving credit facility, and $6.7 million of debt issuance costs, partially offset by proceeds of $172.5 million from the issuance of the Notes and the $39.1 million of proceeds from the issuance of warrants. Cash provided by financing activities during the year ended December 31, 2015 primarily related to $45.0 million in additional net borrowings under our revolving credit facility, partially offset by the $15.0 million in scheduled principal payments on our term loan. For additional information on our debt, see Note 11. Borrowings to our Consolidated Financial Statements under Item 8, "Financial Statements and Supplementary Data."
Liquidity and Capital Resources
Free Cash Flow
In addition to measuring our cash flow generation and usage based upon the operating, investing, and financing classifications included in the Consolidated Statements of Cash Flows, we also measure free cash flow and free cash flow as a percentage of revenues. Free cash flow is calculated as cash flow provided by operating activities less capital expenditures. Our management believes these measures are useful in measuring our cash generated from operations that is available to repay debt, pay dividends, fund acquisitions, and repurchase Knowles’ common stock. Free cash flow and free cash flow as a percentage of revenues are not presented in accordance with GAAP and may not be comparable to similarly titled measures used by other companies in our industry. As such, free cash flow and free cash flow as a percentage of revenues should not be considered in isolation from, or as an alternative to, any other liquidity measures determined in accordance with GAAP.
Our businesses tend to have stronger revenues in the third and fourth quarters of each fiscal year. This is particularly true of those businesses that serve the consumer electronics market. Our businesses tend to have short product cycles due to the highly technical nature of the industries they serve, which can result in new OEM product launches that can impact quarterly revenues, earnings, and cash flow.
The following table reconciles our free cash flow to cash flow provided by operating activities:
(in millions) | Years Ended December 31, | |||||||||||
Free Cash Flow | 2017 | 2016 | 2015 | |||||||||
Cash flow provided by operating activities | $ | 92.9 | $ | 107.5 | $ | 78.4 | ||||||
Less: Capital expenditures | (51.6 | ) | (38.7 | ) | (63.1 | ) | ||||||
Free cash flow | $ | 41.3 | $ | 68.8 | $ | 15.3 | ||||||
Free cash flow as a percentage of revenues | 5.5 | % | 9.1 | % | 2.0 | % | ||||||
40
In 2017, we generated free cash flow of $41.3 million, representing 5.5% of revenues, compared to free cash flow in 2016 of $68.8 million, representing 9.1% of revenues and free cash flow in 2015 of $15.3 million, or 2.0% of revenues. The decrease in free cash flow in 2017 compared to 2016, was primarily due to increased capital expenditures to support our manufacturing capacity expansion and a higher investment in adjusted working capital, partially offset by lower cash operating expenses. The higher free cash flow in 2016 compared to 2015 was primarily due to lower losses from discontinued operations and lower capital investments in our discontinued operations.
In 2018, we expect capital expenditures to be in the range of 7.0% to 9.0% of revenues.
Contingent Obligations
We are involved in various legal proceedings, claims, and investigations arising in the normal course of business. Legal contingencies are discussed in Note 14. Commitments and Contingent Liabilities to our Consolidated Financial Statements under Item 8, "Financial Statements and Supplementary Data."
Contractual Obligations and Off-Balance Sheet Arrangements
A summary of our contractual obligations and commitments as of December 31, 2017 and the years when these obligations are expected to be due is as follows:
Payments Due by Period | ||||||||||||||||||||
(in millions) | Total | Less than 1 Year | 1-3 Years | 3-5 Years | More than 5 Years | |||||||||||||||
Short-term and long-term debt (1) | $ | 223.2 | $ | — | $ | — | $ | 223.2 | $ | — | ||||||||||
Operating leases (2) | 59.9 | 9.2 | 17.0 | 15.2 | 18.5 | |||||||||||||||
Purchase obligations (3) | 117.1 | 117.1 | — | — | — | |||||||||||||||
Capital leases (4) | 17.3 | 2.4 | 4.8 | 4.8 | 5.3 | |||||||||||||||
Post-retirement benefits (5) | 1.8 | 1.8 | — | — | — | |||||||||||||||
Income tax payable (6) | 18.0 | 0.1 | 2.9 | 2.9 | 12.1 | |||||||||||||||
Total obligations | $ | 437.3 | $ | 130.6 | $ | 24.7 | $ | 246.1 | $ | 35.9 | ||||||||||
(1) Relates to the maturity of indebtedness under our New Credit Facility due in October 2022 and our Notes due in November 2021. Does not give effect to any early repayment of or future amounts which may be drawn under the New Credit Facility. |
(2) Represents off-balance sheet commitments related to operating leases. See Note 14. Commitments and Contingent Liabilities to our Consolidated Financial Statements under Item 8, "Financial Statements and Supplementary Data." |
(3) Represents off-balance sheet commitments for purchase obligations related to open purchase orders with our vendors. |
(4) Represents obligations related to capital leases. See Note 14. Commitments and Contingent Liabilities to our Consolidated Financial Statements under Item 8, "Financial Statements and Supplementary Data." |
(5) Amounts represent estimated contributions under our subsidiary's non-U.S. defined benefit pension plan through 2027. See Note 15. Employee Benefit Plans to our Consolidated Financial Statements under Item 8, "Financial Statements and Supplementary Data." |
(6) The Tax Reform Act provided for a one-time deemed repatriation of post-1986 undistributed foreign subsidiary earnings and profits ("E&P") through the year ended December 31, 2017. The expected gross payable due to the Tax Reform Act is $25.9 million, which will be reduced by the use of approximately $7.9 million of existing deferred tax assets resulting in an $18.0 million net expected liability as of December 31, 2017. At this time, we are unable to make a reasonably reliable estimate of the timing of payments for uncertain tax positions in individual years beyond 12 months due to uncertainties in the timing of tax audit outcomes. See Note 12. Income Taxes to our Consolidated Financial Statements under Item 8, "Financial Statements and Supplementary Data." |
41
Borrowings
In May 2016, we issued $172.5 million aggregate principal amount of 3.25% convertible senior notes due November 1, 2021, unless earlier repurchased by us or converted pursuant to their terms. Interest is payable semiannually in arrears on May 1 and November 1 of each year, commencing on November 1, 2016. The Notes are governed by an indenture (the "Indenture") between us, as issuer, and U.S. Bank National Association as trustee. Upon conversion, we will pay or deliver cash, shares of our common stock or a combination of cash and shares of common stock, at our election. The initial conversion rate is 54.2741 shares of common stock per $1,000 principal amount of Notes. The initial conversion price is $18.4250 per share of common stock. The conversion rate will be subject to adjustment upon the occurrence of certain specified events but will not be adjusted for accrued and unpaid interest. In addition, upon the occurrence of a make-whole fundamental change (as defined in the Indenture), we may be required, in certain circumstances, to increase the conversion rate by a number of additional shares for a holder that elects to convert the Notes in connection with such make-whole fundamental change.
On October 11, 2017, Knowles entered into the New Credit Facility which contains a five-year senior secured revolving credit facility providing for borrowings in an aggregate principal amount at any time outstanding not to exceed $400.0 million. The New Credit Facility replaced the Company's Prior Credit Facilities discussed in Note 11. Borrowings to our Consolidated Financial Statements under Item 8, "Financial Statements and Supplementary Data." Up to $100.0 million of the New Credit Facility will be available in Euro, Sterling, and other currencies requested by the Company and agreed to by each Lender and up to $50.0 million of the New Credit Facility will be made available in the form of letters of credit denominated in any currencies agreed by the issuing bank. The New Credit Facility serves as refinancing of indebtedness under and terminates the Prior Credit Facilities.
At any time during the term of the New Credit Facility, the Company will be permitted to increase the commitments under the New Credit Facility or to establish one or more incremental term loan facilities under the New Credit Facility in an aggregate principal amount not to exceed $200.0 million for all such incremental facilities.
Commitments under the New Credit Facility will terminate, and loans outstanding thereunder will mature, on October 11, 2022; provided, that if all the Company’s 3.25% Convertible Senior Notes Due November 1, 2021 have not been repaid, refinanced and/or converted to common stock of the Company by April 30, 2021, then the commitments under the New Credit Facility will terminate, and the loans outstanding thereunder will mature, on such earlier date.
The interest rates under the New Credit Facility will be, at the Borrowers’ option (1) LIBOR (or, in the case of borrowings under the New Credit Facility denominated in Euro, EURIBOR) plus the rates per annum determined from time to time based on the total leverage ratio of the Company as of the end of and for the most recent period of four fiscal quarters for which financial statements have been delivered (the “Applicable Rate”); or (2) in the case of borrowings denominated in U.S. dollars, alternate base rate (“ABR”); provided, however, that any swingline borrowings shall bear interest at the rate applicable to ABR borrowings or, prior to the purchase of participations in such borrowings by the Lenders, at such other rate as shall be agreed between the Company and the swingline lender.
The interest rate under the New Credit Facility is variable based on LIBOR at the time of the borrowing and the Company’s leverage as measured by a total indebtedness to Consolidated EBITDA ratio. Based upon the Company’s total indebtedness to Consolidated EBITDA ratio, the Company’s borrowing rate could range from LIBOR + 1.25% to LIBOR + 2.25%. In addition, a commitment fee accrues on the average daily unused portion of the New Credit Facility at a rate of 0.20% to 0.35%.
We have the right to prepay borrowings under the facilities and to reduce the unutilized portion of the New Credit Facility, in each case, at any time without premium or penalty (except for Eurodollar breakage fees, if any). We are required to prepay borrowings under the term facility with 100% of the net cash proceeds of sales or dispositions of assets or other property (including, among others, the proceeds of issuances of equity interests by subsidiaries), subject to certain reinvestment rights and other exceptions. As we are exposed to market risk for changes in interest rates based on the structure of our indebtedness, we entered into an interest rate swap on November 12, 2014 to convert variable interest rate payments into a fixed rate on a notional amount of $100.0 million of debt for monthly interest payments starting in January 2016 and ending in July 2018. In December 2017, the Company entered into a partial termination of the interest rate swap and reduced the notional amount to $50.0 million.
42
The facilities contain customary covenants, which include, among others, limitations or restrictions on the incurrence of indebtedness, the incurrence of liens, entry into sales and leaseback transactions, mergers, transfers of all or substantially all assets, transactions with affiliates, and certain transactions limiting the ability of subsidiaries to pay dividends, in each case, subject to certain exceptions. The New Credit Facility includes requirements, to be tested quarterly, that the Company maintains (i) a minimum ratio of Consolidated EBITDA to consolidated interest expense of 3.25 to 1.0, (the "Interest Coverage Ratio"), (ii) a maximum ratio of Consolidated total indebtedness to Consolidated EBITDA of 3.75 to 1.0 ("the Leverage Ratio"), and (iii) a maximum ratio of senior secured indebtedness to Consolidated EBITDA of 3.25 to 1.0 (the "Senior Secured Leverage Ratio"). For these ratios, Consolidated EBITDA and consolidated interest expense are calculated using the most recent four consecutive fiscal quarters in a manner defined in the New Credit Facility. At December 31, 2017, the Company was in compliance with these covenants and it expects to remain in compliance with all of its debt covenants over the next twelve months.
Risk Management
We are exposed to certain market risks which exist as part of our ongoing business operations, including changes in currency exchange rates, the dependence on key customers, and price volatility for certain commodities. We do not engage in speculative or leveraged transactions and do not hold or issue financial instruments for trading purposes.
Foreign Currency Exposure
We conduct business through our subsidiaries in many different countries and fluctuations in currency exchange rates could have a significant impact on the reported results of operations, which are presented in U.S. dollars. A significant and growing portion of our products are manufactured in lower-cost locations and sold in various countries. Cross-border transactions, both with external parties and intercompany relationships, could result in increased foreign exchange exposures. A weakening of foreign currencies relative to the U.S. dollar would adversely affect the U.S. dollar value of the Company’s foreign currency-denominated sales, but would be beneficial to the cost of materials, products, and services purchased overseas. A strengthening of foreign currencies relative to the U.S. dollar would positively affect the U.S. dollar value of the Company’s foreign currency-denominated sales, but adversely would have a negative effect on the cost of materials, products, and services purchased overseas. Our foreign currency exposure is primarily driven by changes in the Chinese renminbi (yuan), the euro, the Malaysian ringgit, and the Philippine peso. Based on our current sales and manufacturing activity, a sustained 10% weakening of the U.S. dollar for a period of one year would reduce our operating results by approximately $17.9 million pre-tax.
Dependence on Key Customers; Concentration of Credit
The loss of any key customer and our inability to replace revenues provided by a key customer may have a material adverse effect on our business and financial condition. For the years ended December 31, 2017, 2016, and 2015, Apple Inc. accounted for approximately 19%, 20%, and 21% of our total revenues, respectively. For the years ended December 31, 2017, 2016, and 2015, Samsung Electronics Co., Ltd. accounted for 10%, 12%, and 11% of our total revenues, respectively. No other customer accounted for more than 10% of total revenues during these periods. If a key customer fails to meet payment obligations, our operating results and financial condition could be adversely affected.
Commodity Pricing
We use a wide variety of raw materials, primarily metals, and semi-processed or finished components, which are generally available from a number of sources. While the required raw materials are generally available, commodity pricing for various precious metals, such as such as palladium, gold, brass, stainless steel, and copper, fluctuates. As a result, our operating results are exposed to such fluctuations. Although some cost increases may be recovered through increased prices to customers if commodity prices trend upward, we attempt to control such costs through fixed-price contracts with suppliers and various other programs, such as our global supply chain activities.
43
Interest Rates
A hypothetical 100 basis point change in interest rates affecting our external variable rate borrowings as of December 31, 2017 would be $0.2 million on a pre-tax basis. In 2014, we entered into a forward interest rate swap agreement to fix the interest rate on $100.0 million of our outstanding debt. In December 2017, we entered into a partial termination of the interest rate swap and reduced the notional amount to $50.0 million. The swap has been in effect since January 2016 and matures in July 2018, and the interest rate expense on the $50.0 million will be approximately $0.5 million on a pre-tax basis for the year ending December 31, 2018. Changes to variable interest rates during January 2018 through July 2018 will impact interest received on the notional amount of the swap.
Critical Accounting Policies
Our Consolidated Financial Statements are based on the application of GAAP. GAAP requires the use of estimates, assumptions, judgments, and subjective interpretations of accounting principles that have an impact on the assets, liabilities, revenues, and expense amounts we report. These estimates can also affect supplemental information contained in our public disclosures, including information regarding contingencies, risk, and our financial condition. The significant accounting policies used in the preparation of our Consolidated Financial Statements are discussed in Note 1. Summary of Significant Accounting Policies to the Consolidated Financial Statements under Item 8, "Financial Statements and Supplementary Data." The accounting assumptions and estimates discussed in the section below are those that we consider most critical to an understanding of our financial statements because they inherently involve significant judgments and estimates. We believe our use of estimates and underlying accounting assumptions conforms to GAAP and is consistently applied. We review valuations based on estimates for reasonableness on a consistent basis.
Revenue Recognition: Revenue is recognized when all of the following conditions are satisfied: a) persuasive evidence of an arrangement exists, b) price is fixed or determinable, c) collectability is reasonably assured, and d) delivery has occurred or services have been rendered. The majority of our revenue is generated through the manufacture and sale of a broad range of specialized products and components, with revenue recognized upon transfer of title and risk of loss. We do not have significant service revenue or multiple deliverable arrangements. We recognize third-party licensing or royalty income as revenue over the related contract term. Revenue is recognized net of customer discounts, rebates, and returns. Rebates are recognized over the contract period based on expected revenue levels. Sales discounts and rebates totaled $9.1 million, $8.7 million, and $9.0 million for the years ended December 31, 2017, 2016, and 2015, respectively. Returns and allowances totaled $8.5 million, $5.1 million, and $6.7 million for the years ended December 31, 2017, 2016, and 2015, respectively.
See Note 1. Summary of Significant Accounting Policies to the Consolidated Financial Statements under Item 8, "Financial Statements and Supplementary Data" for information regarding the Financial Accounting Standards Board's Accounting Standards Updates on revenue recognition, which will be adopted by the Company on January 1, 2018.
Inventories: Inventories are stated at the lower of cost or net realizable value, determined on the first-in, first-out ("FIFO") basis. The value of inventory may decline as a result of surplus inventory, price reductions, or technological obsolescence. It is the Company’s policy to carry reserves against the carrying value of inventory when items have no future demand (obsolete inventory) and additionally, where inventory items on hand have demand, yet have insufficient forecasted activity to consume the entire stock within a reasonable period. It is the Company’s policy to carry reserves against the carrying value of such at-risk inventory items after considering the nature of the risk and any mitigating factors.
44
Goodwill and Indefinite-Lived Assets: Goodwill represents the excess of purchase consideration over the fair value of the net assets of businesses acquired. Goodwill and certain other intangible assets deemed to have indefinite lives (primarily trademarks) are not amortized. Instead, goodwill and indefinite-lived intangible assets are tested for impairment at least annually, or more frequently if indicators of impairment exist. The Company conducts its annual impairment evaluation in the fourth quarter of each year on October 1. Recoverability of goodwill is measured at the reporting unit level. The Company identified four reporting units for its annual goodwill impairment test. Following the sale of the Timing Device Business, the Company has three reporting units. The test compares the fair value of each reporting unit using a discounted cash flow method to its carrying value. Impairment is measured as the amount by which the carrying value of a reporting unit exceeds its fair value. This method uses the Company’s market participant assumptions including projections of future cash flows, determinations of appropriate discount rates, and other assumptions which are considered reasonable and inherent in the discounted cash flow analysis. The projections are based on historical performance and future estimated results. These assumptions require significant judgment and actual results may differ from estimated amounts. The fair value of all of the Company’s reporting units exceeded the carrying values by at least 40%, resulting in no goodwill impairment charges. Potential circumstances that could have a negative effect on the fair value of our reporting units include, but are not limited to, lower than forecasted growth rates or profit margins and changes in the weighted average cost of capital. A reduction in the estimated fair value of the reporting units could trigger an impairment in the future. The Company cannot predict the occurrence of certain events or changes in circumstances that might adversely affect the carrying value of goodwill and intangible assets.
In testing its other indefinite-lived intangible assets for impairment, the Company uses a relief from royalty method to calculate and compare the fair value of the intangible asset to its carrying value. This method estimates the fair value of trademarks by calculating the present value of royalty income that could hypothetically be earned by licensing the trademark to a third party over the remaining useful life. Any excess of carrying value over the estimated fair value is recognized as an impairment loss. No impairment of indefinite-lived intangibles was indicated for the years ended December 31, 2017, 2016, or 2015.
See Note 7. Goodwill and Other Intangible Assets to our Consolidated Financial Statements under Item 8, "Financial Statements and Supplementary Data" for additional information on goodwill and indefinite-lived assets.
Other Intangible and Long-Lived Assets: Other intangible assets with determinable lives consist primarily of customer relationships, unpatented technology, patents, and trademarks and are amortized over their estimated useful lives, historically ranging from 5 to 15 years. We rely on patents and proprietary technology, and seek patent protection for products and production methods. We capitalize external legal costs incurred in the defense of our patents when we believe that a significant, discernible increase in value will result from the defense and a successful outcome of the legal action is probable. These costs are amortized over the remaining estimated useful life of the patent, which is typically 7 to 10 years. We assess future economic benefit and/or the successful outcome of legal action related to patent defense, which involves considerable management judgment and a different outcome could result in material write-offs of the carrying value of these assets. During the years ended December 31, 2017 and 2016, we capitalized no legal costs related to the defense of its patents. For the year ending December 31, 2015, we capitalized $0.5 million in legal costs related to the defense of its patents.
Long-lived assets (including intangible assets with determinable lives) are reviewed for impairment whenever events or changes in circumstances indicate that the carrying amount of an asset may not be recoverable. If an indicator of impairment exists for any grouping of assets, an estimate of undiscounted future cash flows is produced and compared to its carrying value. If an asset is determined to be impaired, the loss is measured by the excess of the carrying amount of the asset over its fair value as determined by an estimate of discounted future cash flows.
During 2015, we recorded a pre-tax impairment charge of $191.5 million resulting from the carrying value of the Speaker and Receiver Product Line’s net assets being greater than the fair market value. In addition, we identified other asset impairments related to the Speaker and Receiver Product Line of $4.1 million during the year ended December 31, 2015. See Note 2. Disposed and Discontinued Operations for additional details.
During 2017, we recorded pre-tax impairment charges of $21.3 million, of which $5.1 million was related to fixed assets and $16.2 million was related to intangible assets, resulting from an updated strategic plan that was completed for Audio segment product lines. The updated strategic plan identified a decline of future demand for a specific product line, which indicated projected future cash flows may not be sufficient to recover the carrying value of the associated unpatented technologies and property, plant, and equipment assets. See Note 4. Impairments for additional details.
During the years ended December 31, 2016 and 2015, we recorded impairments and other charges related to its continuing operations of $0.5 million, and $5.6 million, respectively. See Note 4. Impairments for additional details.
45
Income Taxes and Deferred Tax Balances: We record a provision for income taxes for the anticipated tax consequences of the reported results of operations using the asset and liability method. Under this method, we recognize deferred tax assets and liabilities for the expected future tax consequences of temporary differences between the financial reporting and tax bases of assets and liabilities, as well as for operating loss and tax credit carryforwards. Deferred tax assets and liabilities are measured using the tax rates that are expected to apply to taxable income for the years in which those tax assets and liabilities are expected to be realized or settled. A valuation allowance is recorded to reduce deferred tax assets to the net amount that is more likely than not to be realized.
We establish valuation allowances for our deferred tax assets if, based on all available positive and negative evidence, it is more likely than not that some portion or all of the deferred tax assets will not be realized. In making such assessments, significant weight is given to evidence that can be objectively verified. The assessment of the need for a valuation allowance requires considerable judgment on the part of management with respect to the benefits that could be realized from future taxable income, as well as other positive and negative factors.
We have evaluated our deferred tax assets for each of the reporting periods, including an assessment of cumulative income over the prior three-year period. Since we are in a cumulative loss position in the U.S., there is significant negative evidence that impairs the ability to rely on projections of future income. Due to a lack of significant positive evidence and cumulative losses in the respective prior three-year periods, a valuation allowance was required for the 2017, 2016, and 2015 periods. The existing valuation allowance was reduced as a result of income recognized under the Internal Revenue Code Section 965 tax on foreign deferred earnings and changes to the net operating loss carryforward periods, allowing the use of existing deferred tax liabilities to reduce existing valuation allowances.
We recognize tax benefits from uncertain tax positions only if we believe that it is more likely than not that the tax position will be sustained on examination by the taxing authorities based on the technical merits of the position. Adjustments are made to these reserves when facts and circumstances change, such as the closing of a tax audit or the refinement of an estimate. To the extent that the final tax outcome of these matters is different than the amounts recorded, such differences will affect the provision for income taxes in the period in which such determination is made and could have a material impact on our financial condition and operating results. The provision for income taxes includes the effects of any reserves that are believed to be appropriate, as well as the related net interest and penalties. The effective tax rates on a continuing operations basis for 2017, 2016, and 2015 were 66.5%, 29.5%, and 15.5%, respectively.
On December 22, 2017, the Tax Reform Act was enacted, which significantly changes U.S. tax law by, among other things, lowering corporate income tax rates, implementing a territorial tax system, and imposing a repatriation tax on deemed repatriated earnings of foreign subsidiaries. The Tax Reform Act permanently reduces the U.S. corporate income tax rate from a maximum of 35% to a flat 21% rate, effective January 1, 2018. The Tax Reform Act also provided for a one-time deemed repatriation of post-1986 undistributed foreign subsidiary E&P through the year ended December 31, 2017. The Global Intangible Low-Taxed Income ("GILTI") provisions of the Tax Reform Act also require us to include in our U.S. income tax return foreign subsidiary earnings in excess of an allowable return on the foreign subsidiary’s tangible assets. We expect that we will be subject to incremental U.S. tax on GILTI income beginning in 2018. We have elected to account for GILTI tax in the period in which it is incurred, and therefore have not provided any deferred tax impacts of GILTI in our Consolidated Financial Statements under Item 8, "Financial Statements and Supplementary Data," for the year ended December 31, 2017.
On December 22, 2017, the SEC staff issued Staff Accounting Bulletin No. 118 (“SAB 118”) to address the application of U.S. GAAP in situations when a registrant does not have the necessary information available, prepared, or analyzed (including computations) in reasonable detail to complete the accounting for certain income tax effects of the Tax Reform Act. We have recognized the provisional tax impacts related to deemed repatriated earnings, the change in beginning of year valuation allowance, and the benefit for the remeasurement of deferred tax assets and liabilities, and included these amounts in our Consolidated Financial Statements under Item 8, "Financial Statements and Supplementary Data," for the year ended December 31, 2017. The final impact may differ from these provisional amounts, possibly materially, due to, among other things, additional analysis, changes in interpretations and assumptions we made, additional regulatory guidance that may be issued, and actions we may take as a result of the Tax Reform Act. In accordance with SAB 118 the financial reporting impact of the Tax Reform Act will be completed in the fourth quarter of 2018.
46
Accruals and Reserves: We have accruals and reserves that require the use of estimates and judgment with regard to risk exposure and ultimate liability. We estimate losses under these programs using certain factors, which include but are not limited to, actuarial assumptions, our experience, and relevant industry data. We review these factors quarterly and consider the current level of accruals and reserves adequate relative to current market conditions and experience. Most recently, we have established liabilities for restructuring activities, in accordance with appropriate accounting principles. These liabilities, for both severance and exit costs, require the use of estimates. Though we believe that these estimates accurately reflect the anticipated costs, actual results may be different than the estimated amounts.
Stock-Based Compensation: The principal awards issued under the stock-based compensation plans include stock options, restricted stock units, and performance share units ("PSUs"). The cost for such awards is measured at the grant date based on the fair value of the award. The value of the portion of the award that is expected to ultimately vest is generally recognized as expense on a straight-line basis, generally over the explicit service period and is included in Cost of goods sold, Research and development expenses, and Selling and administrative expenses in the Consolidated Statements of Earnings, depending on the functional area of the underlying employees.
We use the Black-Scholes valuation model to estimate the fair value of stock options granted to employees. The fair value of each restricted stock unit granted is equal to the share price at the date of the grant. The fair value of the PSUs is determined by using a binomial model simulation. At the time of grant, we estimate forfeitures, based on historical experience, in order to estimate the portion of the award that will ultimately vest. See Note 13. Equity Incentive Program to our Consolidated Financial Statements under Item 8, "Financial Statements and Supplementary Data" for additional information related to our stock-based compensation.
47
ITEM 7A. QUANTITATIVE AND QUALITATIVE DISCLOSURES ABOUT MARKET RISK
The information required by this section is incorporated by reference to the section “Risk Management,” included in Item 7 of this Annual Report on Form 10-K.
48
ITEM 8. FINANCIAL STATEMENTS AND SUPPLEMENTARY DATA
INDEX TO CONSOLIDATED FINANCIAL STATEMENTS AND | ||
FINANCIAL STATEMENT SCHEDULE | ||
Page | ||
49
Report of Independent Registered Public Accounting Firm
To the Board of Directors and Stockholders of Knowles Corporation:
Opinions on the Financial Statements and Internal Control over Financial Reporting
We have audited the accompanying consolidated balance sheets of Knowles Corporation and its subsidiaries as of December 31, 2017 and 2016, and the related consolidated statements of earnings, comprehensive earnings, stockholders’ equity and cash flows for each of the three years in the period ended December 31, 2017, including the related notes and schedule of valuation and qualifying accounts for each of the three years in the period ending December 31, 2017 appearing under Item 8 (collectively referred to as the “consolidated financial statements”). We also have audited the Company's internal control over financial reporting as of December 31, 2017, based on criteria established in Internal Control - Integrated Framework (2013) issued by the Committee of Sponsoring Organizations of the Treadway Commission (COSO).
In our opinion, the consolidated financial statements referred to above present fairly, in all material respects, the financial position of the Company as of December 31, 2017 and 2016, and the results of their operations and their cash flows for each of the three years in the period ended December 31, 2017 in conformity with accounting principles generally accepted in the United States of America. Also in our opinion, the Company maintained, in all material respects, effective internal control over financial reporting as of December 31, 2017, based on criteria established in Internal Control - Integrated Framework (2013) issued by the COSO.
Basis for Opinions
The Company's management is responsible for these consolidated financial statements, for maintaining effective internal control over financial reporting, and for its assessment of the effectiveness of internal control over financial reporting, included in Management’s Report on Internal Control over Financial Reporting appearing under Item 9A. Our responsibility is to express opinions on the Company’s consolidated financial statements and on the Company's internal control over financial reporting based on our audits. We are a public accounting firm registered with the Public Company Accounting Oversight Board (United States) ("PCAOB") and are required to be independent with respect to the Company in accordance with the U.S. federal securities laws and the applicable rules and regulations of the Securities and Exchange Commission and the PCAOB.
We conducted our audits in accordance with the standards of the PCAOB. Those standards require that we plan and perform the audits to obtain reasonable assurance about whether the consolidated financial statements are free of material misstatement, whether due to error or fraud, and whether effective internal control over financial reporting was maintained in all material respects.
Our audits of the consolidated financial statements included performing procedures to assess the risks of material misstatement of the consolidated financial statements, whether due to error or fraud, and performing procedures that respond to those risks. Such procedures included examining, on a test basis, evidence regarding the amounts and disclosures in the consolidated financial statements. Our audits also included evaluating the accounting principles used and significant estimates made by management, as well as evaluating the overall presentation of the consolidated financial statements. Our audit of internal control over financial reporting included obtaining an understanding of internal control over financial reporting, assessing the risk that a material weakness exists, and testing and evaluating the design and operating effectiveness of internal control based on the assessed risk. Our audits also included performing such other procedures as we considered necessary in the circumstances. We believe that our audits provide a reasonable basis for our opinions.
Definition and Limitations of Internal Control over Financial Reporting
A company’s internal control over financial reporting is a process designed to provide reasonable assurance regarding the reliability of financial reporting and the preparation of financial statements for external purposes in accordance with generally accepted accounting principles. A company’s internal control over financial reporting includes those policies and procedures that (i) pertain to the maintenance of records that, in reasonable detail, accurately and fairly reflect the transactions and dispositions of the assets of the company; (ii) provide reasonable assurance that transactions are recorded as necessary to permit preparation of financial statements in accordance with generally accepted accounting principles, and that receipts and expenditures of the company are being made only in accordance with authorizations of management and directors of the company; and (iii) provide reasonable assurance regarding prevention or timely detection of unauthorized acquisition, use, or disposition of the company’s assets that could have a material effect on the financial statements.
50
Because of its inherent limitations, internal control over financial reporting may not prevent or detect misstatements. Also, projections of any evaluation of effectiveness to future periods are subject to the risk that controls may become inadequate because of changes in conditions, or that the degree of compliance with the policies or procedures may deteriorate.
/s/ PricewaterhouseCoopers LLP
Chicago, Illinois
February 20, 2018
We have served as the Company’s auditor since 2013.
51
KNOWLES CORPORATION
CONSOLIDATED STATEMENTS OF EARNINGS
(in millions, except share and per share amounts)
Years Ended December 31, | |||||||||||
2017 | 2016 | 2015 | |||||||||
Revenues | $ | 744.2 | $ | 755.7 | $ | 753.6 | |||||
Cost of goods sold | 452.5 | 458.0 | 465.8 | ||||||||
Impairment charges | 1.4 | 0.3 | 3.3 | ||||||||
Restructuring charges - cost of goods sold | 4.0 | 1.5 | 2.7 | ||||||||
Gross profit | 286.3 | 295.9 | 281.8 | ||||||||
Research and development expenses | 93.4 | 92.0 | 83.2 | ||||||||
Selling and administrative expenses | 126.3 | 149.9 | 149.7 | ||||||||
Impairment charges | 19.9 | 0.2 | 2.3 | ||||||||
Restructuring charges | 6.2 | 8.6 | 11.6 | ||||||||
Operating expenses | 245.8 | 250.7 | 246.8 | ||||||||
Operating earnings | 40.5 | 45.2 | 35.0 | ||||||||
Interest expense, net | 20.6 | 20.4 | 12.7 | ||||||||
Other expense (income), net | 0.5 | (3.3 | ) | 1.7 | |||||||
Earnings before income taxes and discontinued operations | 19.4 | 28.1 | 20.6 | ||||||||
Provision for income taxes | 12.9 | 8.3 | 3.2 | ||||||||
Earnings from continuing operations | 6.5 | 19.8 | 17.4 | ||||||||
Earnings (loss) from discontinued operations, net | 61.8 | (62.1 | ) | (251.2 | ) | ||||||
Net earnings (loss) | $ | 68.3 | $ | (42.3 | ) | $ | (233.8 | ) | |||
Earnings per share from continuing operations: | |||||||||||
Basic | $ | 0.07 | $ | 0.22 | $ | 0.20 | |||||
Diluted | $ | 0.07 | $ | 0.22 | $ | 0.20 | |||||
Earnings (loss) per share from discontinued operations: | |||||||||||
Basic | $ | 0.69 | $ | (0.70 | ) | $ | (2.89 | ) | |||
Diluted | $ | 0.68 | $ | (0.69 | ) | $ | (2.89 | ) | |||
Net earnings (loss) per share: | |||||||||||
Basic | $ | 0.76 | $ | (0.48 | ) | $ | (2.69 | ) | |||
Diluted | $ | 0.75 | $ | (0.47 | ) | $ | (2.69 | ) | |||
Weighted-average common shares outstanding: | |||||||||||
Basic | 89,329,794 | 88,667,098 | 86,802,828 | ||||||||
Diluted | 90,490,007 | 89,182,967 | 86,992,254 | ||||||||
See accompanying Notes to Consolidated Financial Statements
52
KNOWLES CORPORATION
CONSOLIDATED STATEMENTS OF COMPREHENSIVE EARNINGS
(in millions)
Years Ended December 31, | |||||||||||
2017 | 2016 | 2015 | |||||||||
Net earnings (loss) | $ | 68.3 | $ | (42.3 | ) | $ | (233.8 | ) | |||
Other comprehensive earnings (loss), net of tax | |||||||||||
Foreign currency translation | 27.1 | 0.8 | (71.7 | ) | |||||||
Employee benefit plans: | |||||||||||
Actuarial gains (losses) arising during period | 0.7 | (5.6 | ) | (0.6 | ) | ||||||
Amortization or settlement of actuarial losses and prior service costs | 0.6 | 0.5 | 0.8 | ||||||||
Net change in employee benefit plans | 1.3 | (5.1 | ) | 0.2 | |||||||
Changes in fair value of cash flow hedges: | |||||||||||
Unrealized net gains (losses) arising during period | 3.4 | (2.5 | ) | (1.4 | ) | ||||||
Net losses reclassified into earnings | 0.3 | 0.9 | — | ||||||||
Total cash flow hedges | 3.7 | (1.6 | ) | (1.4 | ) | ||||||
Other comprehensive earnings (loss), net of tax | 32.1 | (5.9 | ) | (72.9 | ) | ||||||
Comprehensive earnings (loss) | $ | 100.4 | $ | (48.2 | ) | $ | (306.7 | ) | |||
See accompanying Notes to Consolidated Financial Statements
53
KNOWLES CORPORATION
CONSOLIDATED BALANCE SHEETS
(in millions, except share and per share amounts)
December 31, 2017 | December 31, 2016 | ||||||
Current assets: | |||||||
Cash and cash equivalents | $ | 111.7 | $ | 63.4 | |||
Receivables, net of allowances of $0.7 and $1.5 | 137.7 | 126.4 | |||||
Inventories, net | 125.6 | 90.8 | |||||
Prepaid and other current assets | 19.9 | 10.3 | |||||
Total current assets | 394.9 | 290.9 | |||||
Property, plant, and equipment, net | 183.0 | 172.9 | |||||
Goodwill | 884.9 | 871.6 | |||||
Intangible assets, net | 53.5 | 73.8 | |||||
Other assets and deferred charges | 31.8 | 25.7 | |||||
Assets of discontinued operations | 1.7 | 80.1 | |||||
Total assets | $ | 1,549.8 | $ | 1,515.0 | |||
Current liabilities: | |||||||
Current maturities of long-term debt | $ | — | $ | 9.7 | |||
Accounts payable | 85.6 | 65.5 | |||||
Accrued compensation and employee benefits | 31.2 | 31.4 | |||||
Other accrued expenses | 28.2 | 22.4 | |||||
Federal and other taxes on income | 6.6 | 3.2 | |||||
Total current liabilities | 151.6 | 132.2 | |||||
Long-term debt | 192.6 | 288.5 | |||||
Deferred income taxes | — | 21.6 | |||||
Other liabilities | 67.9 | 40.6 | |||||
Liabilities of discontinued operations | 5.6 | 23.7 | |||||
Commitments and contingencies (Note 14) | |||||||
Stockholders' equity: | |||||||
Preferred stock - $0.01 par value; 10,000,000 shares authorized; none issued | — | — | |||||
Common stock - $0.01 par value; 400,000,000 shares authorized; 89,491,471 and 88,737,284 shares issued and outstanding at December 31, 2017 and 2016, respectively | 0.9 | 0.9 | |||||
Additional paid-in capital | 1,523.1 | 1,499.8 | |||||
Accumulated deficit | (291.9 | ) | (360.2 | ) | |||
Accumulated other comprehensive loss | (100.0 | ) | (132.1 | ) | |||
Total stockholders' equity | 1,132.1 | 1,008.4 | |||||
Total liabilities and stockholders' equity | $ | 1,549.8 | $ | 1,515.0 | |||
See accompanying Notes to Consolidated Financial Statements
54
KNOWLES CORPORATION
CONSOLIDATED STATEMENTS OF STOCKHOLDERS’ EQUITY
(in millions)
Common Stock | Additional Paid-In Capital | Accumulated Deficit | Accumulated Other Comprehensive Loss | Total Equity | |||||||||||||||
Balance at January 1, 2015 | $ | 0.9 | $ | 1,372.6 | $ | (84.1 | ) | $ | (53.3 | ) | $ | 1,236.1 | |||||||
Net loss | — | — | (233.8 | ) | — | (233.8 | ) | ||||||||||||
Other comprehensive loss, net of tax | — | — | — | (72.9 | ) | (72.9 | ) | ||||||||||||
Stock-based compensation expense | — | 16.5 | — | — | 16.5 | ||||||||||||||
Stock-based restructuring charges | — | 1.4 | — | — | 1.4 | ||||||||||||||
Tax on restricted stock unit vesting | — | (2.2 | ) | — | — | (2.2 | ) | ||||||||||||
Common stock issues for acquisition | — | 61.6 | — | — | 61.6 | ||||||||||||||
Balance at December 31, 2015 | $ | 0.9 | $ | 1,449.9 | $ | (317.9 | ) | $ | (126.2 | ) | $ | 1,006.7 | |||||||
Net loss | — | — | (42.3 | ) | — | (42.3 | ) | ||||||||||||
Other comprehensive loss, net of tax | — | — | — | (5.9 | ) | (5.9 | ) | ||||||||||||
Purchase of convertible note hedges | — | (44.5 | ) | — | — | (44.5 | ) | ||||||||||||
Issuance of warrants | — | 39.1 | — | — | 39.1 | ||||||||||||||
Equity component of the convertible notes issuance, net | — | 35.3 | — | — | 35.3 | ||||||||||||||
Stock-based compensation expense | — | 21.5 | — | — | 21.5 | ||||||||||||||
Tax on restricted stock unit vesting | — | (1.5 | ) | — | — | (1.5 | ) | ||||||||||||
Balance at December 31, 2016 | $ | 0.9 | $ | 1,499.8 | $ | (360.2 | ) | $ | (132.1 | ) | $ | 1,008.4 | |||||||
Net earnings | — | — | 68.3 | — | 68.3 | ||||||||||||||
Other comprehensive earnings, net of tax | — | — | — | 32.1 | 32.1 | ||||||||||||||
Stock-based compensation expense | — | 25.1 | — | — | 25.1 | ||||||||||||||
Common stock issued for exercise of stock options | — | 3.3 | — | — | 3.3 | ||||||||||||||
Tax on restricted stock unit vesting | — | (5.1 | ) | — | — | (5.1 | ) | ||||||||||||
Balance at December 31, 2017 | $ | 0.9 | $ | 1,523.1 | $ | (291.9 | ) | $ | (100.0 | ) | $ | 1,132.1 | |||||||
See accompanying Notes to Consolidated Financial Statements
55
KNOWLES CORPORATION
CONSOLIDATED STATEMENTS OF CASH FLOWS
(in millions)
Years Ended December 31, | |||||||||||
2017 | 2016 | 2015 | |||||||||
Operating Activities | |||||||||||
Net earnings (loss) | $ | 68.3 | $ | (42.3 | ) | $ | (233.8 | ) | |||
Adjustments to reconcile net earnings (loss) to cash from operating activities: | |||||||||||
Depreciation and amortization | 57.3 | 73.7 | 135.7 | ||||||||
Stock-based compensation | 25.1 | 21.5 | 16.5 | ||||||||
Impairment of intangibles | 16.2 | — | 144.7 | ||||||||
Non-cash interest expense and amortization of debt issuance costs | 7.6 | 5.6 | 0.8 | ||||||||
Impairment charges on fixed and other assets | 5.5 | 0.9 | 56.5 | ||||||||
(Gain) loss on sale of business | (62.3 | ) | 25.6 | — | |||||||
Deferred income taxes | (30.1 | ) | 4.0 | (25.0 | ) | ||||||
Other, net | 4.9 | (3.2 | ) | (1.1 | ) | ||||||
Cash effect of changes in assets and liabilities (excluding effects of foreign exchange): | |||||||||||
Receivables, net | 2.4 | 35.9 | 45.2 | ||||||||
Inventories, net | (34.0 | ) | 21.9 | 11.7 | |||||||
Prepaid and other current assets | (8.4 | ) | (1.2 | ) | 1.6 | ||||||
Accounts payable | 4.9 | (26.6 | ) | (42.7 | ) | ||||||
Accrued compensation and employee benefits | (0.9 | ) | (0.7 | ) | 0.3 | ||||||
Other accrued expenses | 7.3 | (9.6 | ) | (14.9 | ) | ||||||
Accrued taxes | 0.9 | 5.3 | (12.9 | ) | |||||||
Other non-current assets and non-current liabilities | 28.2 | (3.3 | ) | (4.2 | ) | ||||||
Net cash provided by operating activities | 92.9 | 107.5 | 78.4 | ||||||||
Investing Activities | |||||||||||
Proceeds from the sale of business | 123.1 | 40.6 | — | ||||||||
Proceeds from the sale of property, plant, and equipment | 0.5 | 2.0 | 0.5 | ||||||||
Proceeds from the sale of investments | — | 2.0 | 4.0 | ||||||||
Additions to property, plant, and equipment | (51.6 | ) | (38.7 | ) | (63.1 | ) | |||||
Acquisitions of business (net of cash acquired) | (2.5 | ) | — | (35.1 | ) | ||||||
Capitalized patent defense costs | — | — | (1.0 | ) | |||||||
Purchase of intellectual property license | — | — | (0.5 | ) | |||||||
Net cash provided by (used in) investing activities | 69.5 | 5.9 | (95.2 | ) | |||||||
Financing Activities | |||||||||||
Payments under revolving credit facility | (185.0 | ) | (132.0 | ) | (85.0 | ) | |||||
Borrowings under revolving credit facility | 190.7 | 32.0 | 130.0 | ||||||||
Principal payments on term loan debt | (118.5 | ) | (166.5 | ) | (15.0 | ) | |||||
Proceeds from issuance of convertible senior notes | — | 172.5 | — | ||||||||
Proceeds from issuance of warrants | — | 39.1 | — | ||||||||
Purchase of convertible note hedges | — | (44.5 | ) | — | |||||||
Debt issuance costs | (1.7 | ) | (6.7 | ) | (0.3 | ) | |||||
Payments of capital lease obligations | (1.6 | ) | (2.3 | ) | (1.4 | ) | |||||
Tax on restricted stock unit vesting | (5.1 | ) | (1.5 | ) | (2.2 | ) | |||||
Net proceeds from exercise of stock-based awards | 3.3 | — | — | ||||||||
Net cash (used in) provided by financing activities | (117.9 | ) | (109.9 | ) | 26.1 | ||||||
Effect of exchange rate changes on cash and cash equivalents | 1.0 | (0.6 | ) | (1.2 | ) | ||||||
Net increase in cash and cash equivalents | 45.5 | 2.9 | 8.1 | ||||||||
Cash and cash equivalents at beginning of period | 63.4 | 61.3 | 52.7 | ||||||||
Add: Cash and cash equivalents at beginning of period from discontinued operations | 2.8 | 2.0 | 2.5 | ||||||||
Less: Cash and cash equivalents at end of period from discontinued operations | — | (2.8 | ) | (2.0 | ) | ||||||
Cash and cash equivalents at end of period | $ | 111.7 | $ | 63.4 | $ | 61.3 | |||||
Supplemental information - cash paid during the year for: | |||||||||||
Income taxes | $ | 13.1 | $ | 4.2 | $ | 19.3 | |||||
Interest | $ | 11.3 | $ | 12.2 | $ | 11.2 | |||||
See accompanying Notes to Consolidated Financial Statements
56
NOTES TO CONSOLIDATED FINANCIAL STATEMENTS | ||
1. Summary of Significant Accounting Policies
Background - Knowles Corporation (NYSE:KN) is a market leader and global supplier of advanced micro-acoustic, audio processing, and precision device solutions, serving the mobile consumer electronics, communications, medical, military, aerospace, and industrial markets. The Company uses its leading position in micro-electro-mechanical systems ("MEMS") microphones and strong capabilities in audio processing technologies to optimize audio systems and improve the user experience in mobile, ear, and Internet of Things ("IoT") applications. Knowles is also the leader in acoustics components used in hearing aids and has a strong position in high-end capacitors. The Company's focus on its customers, combined with its unique technology, proprietary manufacturing techniques, rigorous testing, and global scale, enable the Company to deliver innovative solutions that optimize the user experience. References to "Knowles," "the Company," "we," "our," and "us" refer to Knowles Corporation and its consolidated subsidiaries.
In January 2017, the Company changed its allocation of resources and its internal reporting structure to facilitate delivering growth in its core business. Given these changes, beginning in January 2017, the Company's two reportable segments are as follows:
• Audio Segment
Our Audio group designs and manufactures innovative audio products, including microphones and balanced armature speakers, signal processing technologies, and software and algorithms used in applications that serve the mobile, ear, and IoT markets. Locations include the sales, support, and engineering facilities in North America, Europe, and Asia, as well as the manufacturing facilities in Asia.
• Precision Devices ("PD") Segment
Our PD group specializes in the design and delivery of highly engineered capacitors and radio frequency devices ("RF") for technically demanding applications. Our devices are used in applications including power supplies, radar, medical implants, and satellites, serving the industrial, defense, aerospace, medical, and telecommunications markets. Locations include the sales, support, engineering, and manufacturing facilities in North America, Europe, and Asia.
Financial reporting under this new structure is included within this report on Form 10-K and historical financial segment information has been recast to conform to this new presentation within our financial statements. See Note 17. Segment Information for additional information related to the Company’s segments.
The Company was spun-off from Dover Corporation ("Dover" or "Former Parent") in 2014 (the "Separation") and our common stock began trading under the ticker symbol “KN” on the New York Stock Exchange (the “NYSE”) on March 3, 2014.
On November 28, 2017, the Company completed its sale of the high-end oscillators business ("Timing Device Business"). On July 7, 2016, the Company completed its sale of the speaker and receiver product line (“Speaker and Receiver Product Line”). In accordance with Accounting Standards Codification ("ASC") 205-20, Presentation of Financial Statements - Discontinued Operations, the results of operations and related assets and liabilities for the Timing Device Business and Speaker and Receiver Product Line have been reclassified as discontinued operations for all periods presented. See Note 2. Disposed and Discontinued Operations for additional information related to the transactions.
Financial Statement Presentation - The Consolidated Financial Statements included in this Annual Report on Form 10-K are presented in conformity with U.S. generally accepted accounting principles ("U.S. GAAP").
Use of Estimates - The preparation of financial statements in conformity with U.S. GAAP requires management to make estimates and assumptions that affect the amounts reported in the accompanying financial statements and disclosures. These estimates may be adjusted due to changes in future economic, industry, or customer financial conditions, as well as changes in technology or demand. Estimates are used in accounting for, among other items, allowances for doubtful accounts receivable, inventory reserves, restructuring reserves, warranty reserves, pension and post-retirement plans, stock-based compensation, corporate allocations, useful lives for depreciation and amortization of long-lived assets, future cash flows associated with impairment testing for goodwill, indefinite-lived intangible assets and other long-lived assets, deferred tax assets, uncertain income tax positions, changes in tax laws, and contingencies. Actual results may ultimately differ from estimates, although management does not believe such differences would materially affect the financial statements in any individual year. Estimates and assumptions are periodically reviewed and the effects of revisions are reflected in the Consolidated Financial Statements in the period that they are determined.
Cash and Cash Equivalents - Cash and cash equivalents include cash on hand, demand deposits, and temporary cash investments with original maturities less than three months.
57
NOTES TO CONSOLIDATED FINANCIAL STATEMENTS | ||
Allowance for Doubtful Accounts – The Company maintains allowances for estimated losses as a result of customers' inability to make required payments. Management evaluates the aging of the accounts receivable balances, the financial condition of its customers, historical trends, and the time outstanding of specific balances to estimate the amount of accounts receivable that may not be collected in the future and records the appropriate provision.
Inventories – Inventories are stated at the lower of cost or net realizable value, determined on the first-in, first-out ("FIFO") basis. The value of inventory may decline as a result of surplus inventory, price reductions, or technological obsolescence. It is the Company’s policy to carry reserves against the carrying value of inventory when items have no future demand (obsolete inventory) and additionally, where inventory items on hand have demand, yet have insufficient forecasted activity to consume the entire stock within a reasonable period. It is the Company’s policy to carry reserves against the carrying value of such at-risk inventory items after considering the nature of the risk and any mitigating factors.
Prepaid and Other Current Assets – Prepaid and other current assets at December 31, 2017 includes $10.0 million held in escrow that will be received nine months from the completion of the sale of the Timing Device Business. The remaining balance at December 31, 2017 and 2016 is made up of prepaid insurance, supplier prepayments, prepaid licensing fees, and other miscellaneous prepaid assets, none of which are individually significant.
Property, Plant, and Equipment - Property, plant, and equipment includes the historic cost of land, buildings, equipment, and significant improvements to existing plant and equipment or, in the case of acquisitions, a fair market value appraisal of such assets completed at the time of acquisition. Property, plant, and equipment also includes the cost of purchased software. Expenditures for maintenance, repairs, and minor renewals are expensed as incurred. When property or equipment is sold or otherwise disposed of, the related cost and accumulated depreciation is removed from the respective accounts, and the gain or loss realized on disposition is reflected in earnings. The Company historically depreciates its assets on a straight-line basis over their estimated useful lives as follows: buildings and improvements 5 to 31.5 years; machinery and equipment 1.5 to 7 years; furniture and fixtures 3 to 7 years; vehicles 3 years; and software 3 to 7 years.
Derivative Instruments - The Company uses derivative financial instruments to hedge its exposures to various risks, including interest rate and foreign currency exchange rate risk. The Company does not enter into derivative financial instruments for speculative purposes and does not have a material portfolio of derivative financial instruments. Derivative financial instruments used for hedging purposes must be designated and effective as a hedge of the identified risk exposure at inception of the contract. The Company recognizes all derivatives as either assets or liabilities on the Consolidated Balance Sheet and measures those instruments at fair value. For derivatives designated as hedges of the fair value of assets or liabilities, the changes in fair value of both the derivatives and of the hedged items are recorded in current earnings. For derivatives designated as cash flow hedges, the effective portion of changes in the fair value of the derivatives is recorded as a component of other comprehensive earnings and subsequently recognized in net earnings when the hedged items impact earnings.
Goodwill and Indefinite-Lived Intangible Assets - Goodwill represents the excess of purchase consideration over the fair value of the net assets of businesses acquired. Goodwill and certain other intangible assets deemed to have indefinite lives (primarily trademarks) are not amortized. Instead, goodwill and indefinite-lived intangible assets are tested for impairment at least annually, or more frequently if indicators of impairment exist. The Company conducts its annual impairment evaluation in the fourth quarter of each year on October 1. Recoverability of goodwill is measured at the reporting unit level. The Company identified four reporting units for its annual goodwill impairment test. Following the sale of the Timing Device Business on November 28, 2017, the Company has three reporting units. The test compares the fair value of each reporting unit using a discounted cash flow method to its carrying value. Impairment is measured as the amount by which the carrying value of a reporting unit exceeds its fair value. This method uses the Company’s market participant assumptions including projections of future cash flows, determinations of appropriate discount rates, and other assumptions which are considered reasonable and inherent in the discounted cash flow analysis. The projections are based on historical performance and future estimated results. These assumptions require significant judgment and actual results may differ from estimated amounts. The fair value of all of the Company’s reporting units exceeded the carrying values by at least 40%, resulting in no goodwill impairment charges. Potential circumstances that could have a negative effect on the fair value of our reporting units include, but are not limited to, lower than forecasted growth rates or profit margins and changes in the weighted average cost of capital. A reduction in the estimated fair value of the reporting units could trigger an impairment in the future. The Company cannot predict the occurrence of certain events or changes in circumstances that might adversely affect the carrying value of goodwill and intangible assets.
58
NOTES TO CONSOLIDATED FINANCIAL STATEMENTS | ||
In testing its other indefinite-lived intangible assets for impairment, the Company uses a relief from royalty method to calculate and compare the fair value of the intangible asset to its carrying value. This method estimates the fair value of trademarks by calculating the present value of royalty income that could hypothetically be earned by licensing the trademark to a third party over the remaining useful life. Any excess of carrying value over the estimated fair value is recognized as an impairment loss. No impairment of indefinite-lived intangibles was indicated for the years ended December 31, 2017, 2016, or 2015.
See Note 7. Goodwill and Other Intangible Assets for additional information on goodwill and indefinite-lived intangible assets.
Other Intangible and Long-Lived Assets - Other intangible assets with determinable lives consist primarily of customer relationships, unpatented technology, patents, and trademarks and are amortized over their estimated useful lives, historically ranging from 5 to 15 years. The Company relies on patents and proprietary technology, and seeks patent protection for products and production methods. The Company capitalizes external legal costs incurred in the defense of its patents when it believes that a significant, discernible increase in value will result from the defense and a successful outcome of the legal action is probable. These costs are amortized over the remaining estimated useful life of the patent, which is typically 7 to 10 years. The Company’s assessment of future economic benefit and/or the successful outcome of legal action related to patent defense, which involves considerable management judgment and a different outcome could result in material write-offs of the carrying value of these assets. During the years ended December 31, 2017 and 2016, the Company capitalized no legal costs related to the defense of its patents. For the year ending December 31, 2015, the Company capitalized $0.5 million in legal costs related to the defense of its patents.
Long-lived assets (including intangible assets with determinable lives) are reviewed for impairment whenever events or changes in circumstances indicate that the carrying amount of an asset may not be recoverable. If an indicator of impairment exists for any grouping of assets, an estimate of undiscounted future cash flows is produced and compared to its carrying value. If an asset is determined to be impaired, the loss is measured by the excess of the carrying amount of the asset over its fair value as determined by an estimate of discounted future cash flows.
During 2015, Knowles recorded a pre-tax impairment charge of $191.5 million resulting from the carrying value of the Speaker and Receiver Product Line’s net assets being greater than the fair market value. In addition, Knowles identified other asset impairments related to the Speaker and Receiver Product Line of $4.1 million during the year ended December 31, 2015. See Note 2. Disposed and Discontinued Operations for additional details.
During the years ended December 31, 2017, 2016, and 2015, the Company recorded impairments and other charges related to its continuing operations of $21.3 million, $0.5 million, and $5.6 million, respectively. See Note 4. Impairments for additional details.
Foreign Currency - Assets and liabilities of non-U.S. subsidiaries, where the functional currency is not the U.S. dollar, are translated into U.S. dollars at year-end exchange rates. Revenue and expense items are translated using weighted-average yearly exchange rates. Foreign currency translation gains and losses are included as a component of Accumulated other comprehensive loss. Assets and liabilities of an entity that are denominated in currencies other than an entity’s functional currency are re-measured into the functional currency using end of period exchange rates or historical rates where applicable to certain balances. Gains and losses related to these re-measurements are recorded within the Consolidated Statements of Earnings as a component of Other expense (income), net.
Revenue Recognition - Revenue is recognized when all of the following conditions are satisfied: a) persuasive evidence of an arrangement exists, b) price is fixed or determinable, c) collectability is reasonably assured, and d) delivery has occurred or services have been rendered. The majority of the Company’s revenue is generated through the manufacture and sale of a broad range of specialized products and components, with revenue recognized upon transfer of title and risk of loss. The Company recognizes third-party licensing or royalty income as revenue over the related contract term when collection is reasonably assured. The Company does not have significant service revenue or multiple deliverable arrangements. Revenue is recognized net of customer discounts, rebates, and returns. Rebates are recognized over the contract period based on expected revenue levels. Sales discounts and rebates totaled $9.1 million, $8.7 million, and $9.0 million for the years ended December 31, 2017, 2016, and 2015, respectively. Returns and allowances totaled $8.5 million, $5.1 million, and $6.7 million for the years ended December 31, 2017, 2016, and 2015, respectively.
59
NOTES TO CONSOLIDATED FINANCIAL STATEMENTS | ||
Stock-Based Compensation – The principal awards issued under the stock-based compensation plans include stock options, restricted stock units ("RSUs"), and performance share units ("PSUs"). The cost for such awards is measured at the grant date based on the fair value of the award. The value of the portion of the award that is expected to ultimately vest is generally recognized as expense on a straight-line basis, generally over the explicit service period and is included in Cost of goods sold, Research and development expenses, and Selling and administrative expenses in the Consolidated Statements of Earnings, depending on the functional area of the underlying employees.
The Company uses the Black-Scholes valuation model to estimate the fair value of stock options granted to employees. The fair value of each RSU granted is equal to the share price at the date of the grant. The fair value of each PSU is determined using a binomial model simulation. At the time of grant, the Company estimates forfeitures, based on historical experience, in order to estimate the portion of the award that will ultimately vest. See Note 13. Equity Incentive Program for additional information related to the Company’s stock-based compensation.
Income Taxes - The Company records a provision for income taxes for the anticipated tax consequences of the reported results of operations using the asset and liability method. Under this method, the Company recognizes deferred tax assets and liabilities for the expected future tax consequences of temporary differences between the financial reporting and tax bases of assets and liabilities, as well as for operating loss and tax credit carryforwards. Deferred tax assets and liabilities are measured using the tax rates that are expected to apply to taxable income for the years in which those tax assets and liabilities are expected to be realized or settled. The Company offsets and presents deferred tax liabilities and assets, as well as any related valuation allowance, as a single non-current amount on the Consolidated Balance Sheets on a jurisdictional basis.
The Company establishes valuation allowances for its deferred tax assets if, based on all available positive and negative evidence, it is more likely than not that some portion or all of the deferred tax assets will not be realized. In making such assessments, significant weight is given to evidence that can be objectively verified. The assessment of the need for a valuation allowance requires considerable judgment on the part of management with respect to the benefits that could be realized from future taxable income, as well as other positive and negative factors. Management considers the scheduled reversal of deferred tax liabilities, projected future taxable income, and tax-planning strategies in making this assessment.
The Company recognizes tax benefits from uncertain tax positions only if it believes that it is more likely than not that the tax position will be sustained on examination by the taxing authorities based on the technical merits of the position. Adjustments are made to these reserves when facts and circumstances change, such as the closing of a tax audit or the refinement of an estimate. To the extent that the final tax outcome of these matters is different than the amounts recorded, such differences will affect the provision for income taxes in the period in which such determination is made and could have a material impact on the Company's financial condition and operating results. The provision for income taxes includes the effects of any reserves that are believed to be appropriate, as well as the related net interest and penalties.
On December 22, 2017, the U.S. bill commonly referred to as the Tax Cuts and Jobs Act (“Tax Reform Act”) was enacted, which significantly changes U.S. tax law by, among other things, lowering corporate income tax rates, implementing a territorial tax system, and imposing a repatriation tax on deemed repatriated earnings of foreign subsidiaries. The Tax Reform Act permanently reduces the U.S. corporate income tax rate from a maximum of 35% to a flat 21% rate, effective January 1, 2018. The Tax Reform Act also provided for a one-time deemed repatriation of post-1986 undistributed foreign subsidiary earnings and profits (“E&P”) through the year ended December 31, 2017. The Global Intangible Low-Taxed Income ("GILTI") provisions of the Tax Reform Act require the Company to include in its U.S. income tax return foreign subsidiary earnings in excess of an allowable return on the foreign subsidiary’s tangible assets. The Company expects that it will be subject to incremental U.S. tax on GILTI income beginning in 2018, due to expense allocations required by the U.S. foreign tax credit rules. The Company has elected to account for GILTI tax in the period in which it is incurred, and therefore has not provided any deferred tax impacts of GILTI in its Consolidated Financial Statements for the year ended December 31, 2017.
On December 22, 2017, the Securities and Exchange Commission ("SEC") staff issued Staff Accounting Bulletin No. 118 (“SAB 118”) to address the application of U.S. GAAP in situations when a registrant does not have the necessary information available, prepared, or analyzed (including computations) in reasonable detail to complete the accounting for certain income tax effects of the Tax Reform Act. The Company has recognized the provisional tax impacts related to deemed repatriated earnings, the change in the beginning of year valuation allowance, and the benefit for the remeasurement of deferred tax assets and liabilities, and included these amounts in its Consolidated Financial Statements for the year ended December 31, 2017. The final impact may differ from these provisional amounts, possibly materially, due to, among other things, additional analysis, changes in interpretations and assumptions the Company has made, additional regulatory guidance that may be issued, and actions the Company may take
60
NOTES TO CONSOLIDATED FINANCIAL STATEMENTS | ||
as a result of the Tax Reform Act. In accordance with SAB 118 the financial reporting impact of the Tax Reform Act will be completed in the fourth quarter of 2018.
Research and Development Costs – Research and development costs, including qualifying engineering costs, are expensed when incurred.
Non-cash Investing Activities - Purchases of property, plant, and equipment included in accounts payable at December 31, 2017, 2016, and 2015 were $8.5 million, $1.5 million, and $2.1 million, respectively. The Company also entered into a capital lease for new equipment in 2015 with a corresponding capital lease obligation of $13.6 million at December 31, 2015. These non-cash amounts are not reflected as outflows to Additions to property, plant, and equipment within investing activities of the Consolidated Statements of Cash Flows for the respective periods.
Reclassifications - Certain amounts in prior years have been reclassified to conform to the current year presentation. Refer to the Recently Issued Accounting Standards section below.
Recently Issued Accounting Standards
In August 2017, the Financial Accounting Standards Board ("FASB") issued Accounting Standards Update ("ASU") 2017-12 with the objective of improving the financial reporting of hedging relationships to better portray the economic results of an entity’s risk management activities in its financial statements and simplify the application of hedge accounting guidance. The standard is effective for public business entities for fiscal years beginning after December 15, 2018, and interim periods within those fiscal years. The standard requires adoption on a modified retrospective basis for hedging relationships existing as of the adoption date and on a prospective basis for the amended presentation and disclosure requirements. Early adoption is permitted. The Company has not yet determined the effect of the standard on its ongoing financial reporting and plans to adopt this standard on January 1, 2019.
In May 2017, the FASB issued ASU 2017-09 that provides guidance about when a change to the terms or conditions of a share-based payment award must be accounted for as a modification. The new guidance requires modification accounting if the fair value, vesting condition, or the classification of the award is not the same immediately before and after a change to the terms and conditions of the award. This standard is effective for public business entities for fiscal years beginning after December 15, 2017, and interim periods within those fiscal years. The standard requires adoption on a prospective basis for awards modified on or after the adoption date. The standard will not have a significant impact upon adoption on January 1, 2018.
In March 2017, the FASB issued ASU 2017-07 primarily to improve the presentation of net periodic pension and post-retirement benefit cost. The new guidance requires that an employer report the service cost component in the same line item or items as other compensation costs arising from services rendered by the pertinent employees during the period. The other components of net benefit cost are required to be presented in the statement of earnings separately from the service cost component and outside of any subtotal of operating income. This standard is effective for public business entities for annual periods or any interim periods beginning after December 15, 2017. The standard requires adoption on a retrospective basis for the presentation of net benefit cost components. The standard will not have a significant impact upon adoption on January 1, 2018.
In January 2017, the FASB issued ASU 2017-01, which requires a reporting entity to clarify the definition of a business with the objective of adding guidance to assist entities with evaluating whether transactions should be accounted for as acquisitions (or disposals) of assets or liabilities. This standard is effective for public business entities for annual periods beginning after December 15, 2017, including interim periods within those periods. Early adoption is permitted under specific circumstances and prospective application of the guidance is required. The standard will not have a significant impact upon adoption on January 1, 2018.
In August 2016, the FASB issued ASU 2016-15 with the objective of reducing the existing diversity in practice in how certain cash receipts and cash payments are presented and classified in the statement of cash flows. The new guidance requires evaluation of cash receipts and payments on the basis of the nature of the underlying cash flows and provides clarity for categorization for specific transactions. This standard is effective for public business entities for fiscal years beginning after December 15, 2017, and interim periods within those fiscal years. The standard requires adoption on a retrospective basis. The standard will not have a significant impact upon adoption on January 1, 2018.
61
NOTES TO CONSOLIDATED FINANCIAL STATEMENTS | ||
In February 2016, the FASB issued ASU 2016-02, which requires a lessee to recognize a lease liability and asset for all leases, including operating leases, with a term greater than 12 months on its balance sheet. The standard requires a modified retrospective transition method for all entities. This ASU also provides clarification surrounding the presentation of the effects of the leases in the statement of earnings and statement of cash flows. This standard is effective for public business entities for fiscal years beginning after December 15, 2018, and interim periods within those fiscal years. Early adoption is permitted. The Company has not yet determined the effect of the standard on its ongoing financial reporting and plans to adopt this standard on January 1, 2019.
In January 2016, the FASB issued ASU 2016-01, which requires a company to present separately in other comprehensive income the portion of the total change in the fair value of a liability resulting from a change in the instrument-specific credit risk if the entity has elected to measure the liability at fair value in accordance with the fair value option for financial instruments. This standard is effective for public business entities for fiscal years beginning after December 15, 2017, and interim periods within those fiscal years. The standard requires adoption on a modified retrospective basis. The standard will not have a significant impact upon adoption on January 1, 2018.
In May 2014, the FASB issued ASU 2014-09 and issued subsequent amendments to the initial guidance in August 2015, March 2016, April 2016, May 2016, and December 2016 within ASU 2015-14, ASU 2016-08, ASU 2016-10, ASU 2016-12, and ASU 2016-20, respectively. The core principal of the guidance is to provide a comprehensive new revenue recognition model that requires a company to recognize revenue to depict the transfer of goods or services to a customer at an amount that reflects the consideration it expects to receive in exchange for those goods or services. The guidance also requires additional disclosure about the nature, amount, timing, and uncertainty of revenue and cash flows arising from customer contracts. The standard is effective for annual and interim periods beginning after December 15, 2017, which will require the Company to adopt these provisions in the first quarter of fiscal year 2018. This update permits the use of either the retrospective or modified retrospective (cumulative effect) transition method. ASU 2016-12, issued in May 2016, removes the requirement to disclose the effect of the accounting change in the period of adoption, but still requires the Company to disclose the effect of the changes on any prior periods retrospectively adjusted. The status of the Company’s implementation process is summarized below:
• | The Company employed a cross-functional approach in assessing the potential impacts of the standard. |
• | The Company determined the key factors from the five-step model for recognizing revenue under the new standard that |
may be applicable to the business units that comprise the Company’s reportable segments.
• | Review of the Company’s contract portfolio, which focused on contracts with significant customers, was completed prior |
to the filing date of this Annual Report on Form 10-K as of December 31, 2017.
• | Evaluations of contract provisions and a comparison of historical accounting policies to the requirements of the new standard are complete. The Company expects the impact of the adoption to be immaterial to net earnings on an ongoing basis as the analysis of contracts under the new standard supports the recognition of revenue at a point in time, resulting in revenue recognition timing that is materially consistent with our historical practice of recognizing revenue when title and risk of loss pass to the customer. |
• | Although the standard is expected to have an immaterial impact to net earnings on an ongoing basis, the Company is implementing changes to its business processes and controls to support recognition and disclosure under the new guidance, including ongoing contract review requirements. |
• | The Company will elect to account for shipping and handling activities that occur after control of the related good transfers as fulfillment activities rather than evaluating such activities as performance obligations. |
The Company will adopt this new guidance on January 1, 2018 using the modified retrospective method. The Company does not expect to recognize a cumulative effect adjustment to retained earnings as of the date of adoption based on the immaterial impact described above.
Recently Adopted Accounting Standards
In January 2017, the FASB issued ASU 2017-04, which simplifies an entity's measurement of goodwill for impairment testing purposes by eliminating the requirement to perform a hypothetical purchase price allocation. A goodwill impairment charge will now be recognized for the amount by which the carrying value of a reporting unit exceeds its fair value, not to exceed the carrying amount of goodwill. This standard is effective for public business entities for annual or any interim goodwill impairment tests in fiscal years beginning after December 15, 2019. Early adoption is permitted for interim or annual goodwill impairment tests performed on testing dates after January 1, 2017. The Company adopted this guidance prospectively on January 1, 2017. The Company's adoption of this standard did not have an impact on the Consolidated Financial Statements as no goodwill impairment charges were identified during the year ended December 31, 2017.
62
NOTES TO CONSOLIDATED FINANCIAL STATEMENTS | ||
In October 2016, the FASB issued ASU 2016-16, which requires the recognition of the income tax consequences of an intra-entity transfer of an asset, other than inventory, when the transfer occurs. This standard is effective for public business entities for annual periods beginning after December 15, 2018, and interim periods within annual periods beginning after December 15, 2019. Early adoption is permitted. The Company adopted this guidance on a modified retrospective basis effective January 1, 2017 and recognized the cumulative effect of the change, which resulted in the Company increasing the beginning balance of the Accumulated deficit line item by $0.1 million on the Consolidated Balance Sheet. In addition, Other assets and deferred charges decreased by $0.1 million as a result of this adoption.
In March 2016, the FASB issued ASU 2016-09. The updated guidance changes how companies account for certain aspects of share-based payment awards to employees, including the accounting for income taxes, forfeitures, and statutory tax withholding requirements, as well as the classification of related matters in the statement of cash flows. This standard is effective for public business entities for fiscal years beginning after December 15, 2016, and interim periods within those fiscal years. The Company adopted this guidance effective January 1, 2017. The Company's adoption of this standard did not have a significant impact on its Consolidated Financial Statements.
In July 2015, the FASB issued ASU 2015-11, a final standard that simplifies the subsequent measurement of inventory by replacing the lower of cost or market test under current U.S. GAAP. Under the previous guidance, the subsequent measurement of inventory was measured at the lower of cost or market, where “market” may have multiple possible outcomes. The new guidance requires subsequent measurement of inventory at the lower of cost or net realizable value. Net realizable value is the estimated selling price in the ordinary course of business, less reasonably predictable costs to sell (completion, disposal, and transportation). This standard is effective for public business entities for fiscal years beginning after December 15, 2016, and interim periods within those fiscal years. The Company adopted this guidance prospectively effective January 1, 2017. The Company's adoption of this standard did not have a significant impact on its Consolidated Financial Statements.
2. Disposed and Discontinued Operations
Management and the Board of Directors periodically conduct strategic reviews of the Company's businesses.
On November 28, 2017, the Company completed the sale of the Timing Device Business, part of the Precision Devices segment, to Microsemi Corporation for $130.0 million, plus purchase price adjustments for a net amount of $133.3 million. The Company recorded a gain of $62.3 million as a result of the sale, which included $0.4 million of gain amounts reclassified from Accumulated other comprehensive loss into earnings related to currency translation adjustments. The purchase price includes $10.0 million held in escrow that will be received nine months from the completion of the sale and is recorded in the Prepaid and other current assets line on the Consolidated Balance Sheet.
On July 7, 2016, the Company completed the sale of its Speaker and Receiver Product Line for $45.0 million in cash, less purchase price adjustments for a net amount received of $40.6 million. The Company recorded a loss of $25.6 million as a result of the sale, which included $26.9 million of loss amounts reclassified from Accumulated other comprehensive loss into earnings related to currency translation adjustments.
The results of operations and financial positions of the Timing Device Business and Speaker and Receiver Product Line have been reclassified to discontinued operations for all periods presented as these disposals represent strategic shifts that have a major effect on the Company's results of operations.
63
NOTES TO CONSOLIDATED FINANCIAL STATEMENTS | ||
Summarized results of the Company's discontinued operations are as follows:
Years Ended December 31, | |||||||||||
(in millions) | 2017 | 2016 | 2015 | ||||||||
Revenues | $ | 92.2 | $ | 156.4 | $ | 331.0 | |||||
Cost of goods sold | 61.5 | 136.1 | 319.3 | ||||||||
Impairment charges (1) | 0.4 | 0.4 | 50.1 | ||||||||
Restructuring charges - cost of goods sold | 0.1 | 8.9 | 0.9 | ||||||||
Gross profit (loss) | 30.2 | 11.0 | (39.3 | ) | |||||||
Research and development expenses (1) | 7.7 | 15.1 | 25.7 | ||||||||
Selling and administrative expenses | 18.5 | 26.9 | 58.3 | ||||||||
Impairment charges (1) | — | — | 143.3 | ||||||||
Restructuring charges | 0.2 | 3.4 | 3.5 | ||||||||
Operating expenses | 26.4 | 45.4 | 230.8 | ||||||||
Other expense (income), net | 1.3 | (0.9 | ) | (0.6 | ) | ||||||
(Gain) loss on sale of business | (62.3 | ) | 25.6 | — | |||||||
Earnings (loss) from discontinued operations before taxes (2) | 64.8 | (59.1 | ) | (269.5 | ) | ||||||
Provision for (benefit from) income taxes | 3.0 | 3.0 | (18.3 | ) | |||||||
Earnings (loss) from discontinued operations, net of tax | $ | 61.8 | $ | (62.1 | ) | $ | (251.2 | ) | |||
(1) The Company evaluates long-lived assets for recoverability whenever events or changes in circumstances indicate that the carrying amount may not be recoverable. During the fourth quarter of 2015, it was determined that the Speaker and Receiver Product Line lacked a future path to profitability, which included a thorough evaluation of key assumptions including selling prices, product margins, as well as future product demand and suggested that the carrying value of the product line’s assets may be impaired. Through the utilization of undiscounted future cash flows to determine the fair value of the assets, the Company concluded that the fair values of the intangible assets and fixed assets associated with the Speaker and Receiver Product Line were less than their respective carrying values at December 31, 2015. As a result, the Speaker and Receiver Product Line's intangible assets and fixed assets were written down to their fair values and Knowles incurred pre-tax impairment charges of $143.3 million and $48.2 million, respectively. In addition, during the year ended December 31, 2015, Knowles incurred other pre-tax impairment charges of $4.1 million. These impairments were recorded within the discontinued operations line items as follows: $50.1 million in Impairment charges within Gross profit (loss), $2.2 million in Research and development expenses, and $143.3 million in Impairment charges within Operating expenses.
(2) The Company's policy is to not allocate interest expense to discontinued operations unless it is directly attributable to the operations. The results of operations of the Timing Device Business and Speaker and Receiver Product Line did not have any such interest expense in the periods presented.
64
NOTES TO CONSOLIDATED FINANCIAL STATEMENTS | ||
Assets and liabilities of discontinued operations are summarized below:
(in millions) | December 31, 2017 | December 31, 2016 | |||||
Assets of discontinued operations: | |||||||
Cash and cash equivalents | $ | — | $ | 2.8 | |||
Receivables, net of allowances of nil and $0.4, respectively | 1.2 | 19.2 | |||||
Inventories, net | — | 17.4 | |||||
Prepaid and other current assets | 0.5 | 0.6 | |||||
Total current assets | 1.7 | 40.0 | |||||
Property, plant, and equipment, net | — | 13.3 | |||||
Goodwill | — | 23.0 | |||||
Intangible assets, net | — | 3.7 | |||||
Other assets and deferred charges | — | 0.1 | |||||
Total assets (1) | $ | 1.7 | $ | 80.1 | |||
Liabilities of discontinued operations: | |||||||
Accounts payable | $ | 0.1 | $ | 9.1 | |||
Other current liabilities | 5.5 | 13.6 | |||||
Total current liabilities | 5.6 | 22.7 | |||||
Deferred income taxes | — | 0.1 | |||||
Other liabilities | — | 0.9 | |||||
Total liabilities (1) | $ | 5.6 | $ | 23.7 | |||
(1) In connection with the sale of the Timing Device Business, the Company retained certain obligations related to employees of the Timing Device Business. This arrangement results in maintaining asset and liability balances, which are expected to be settled in the next 12 months.
The following table presents the depreciation, amortization, and capital expenditures related to discontinued operations:
Years Ended December 31, | |||||||||||
(in millions) | 2017 | 2016 | 2015 | ||||||||
Depreciation | $ | 2.3 | $ | 3.3 | $ | 39.4 | |||||
Amortization of intangible assets | $ | 1.2 | $ | 1.4 | $ | 23.9 | |||||
Capital expenditures | $ | 2.1 | $ | 6.5 | $ | 26.3 | |||||
There were no capital expenditures in accounts payable at December 31, 2017. Capital expenditures included in accounts payable at December 31, 2016 and 2015 were $0.1 million and $1.6 million, respectively.
65
NOTES TO CONSOLIDATED FINANCIAL STATEMENTS | ||
3. Acquisitions
On January 11, 2017, the Company completed an acquisition of certain assets of a capacitors manufacturer for cash consideration of $3.7 million, of which $2.5 million was paid during 2017, with the remaining $1.2 million to be paid in installments from 2018 through the first quarter of 2019. The acquisition's operations are included in the PD segment. The financial results of this acquisition were included in our Consolidated Financial Statements beginning January 11, 2017.
On July 1, 2015, the Company completed its acquisition of all of the outstanding shares of common stock of Audience, Inc. ("Audience") for a consideration per Share of $2.51 in cash and 0.13207 shares of Knowles common stock pursuant to the Agreement and Plan of Merger dated April 29, 2015. The financial results of Audience were included in our Consolidated Financial Statements beginning July 1, 2015.
As a result of the acquisition, the Company issued 3.2 million shares and paid $61.6 million in cash to former holders of Shares and for the conversion of vested in-the-money Audience stock options. The Company also converted unvested in-the-money Audience stock options and RSUs for an aggregate of 461,371 shares of its common stock. The fair value of unvested equity awards relating to future services, and not yet earned, are recorded as operating expenses over the remaining service periods. Total consideration was approximately $92.8 million, net of cash and short-term investments acquired of $30.5 million. The revenues and net losses from Audience operations in the six months ending December 31, 2015 were $19.0 million and $31.6 million, respectively.
The total purchase consideration of approximately $123.3 million consists of the following:
(in millions, except per share amounts) | |||
Cash consideration paid to Audience shareholders and equity award holders | $ | 61.6 | |
Fair value of shares of Knowles common stock issued to Audience shareholders and equity award holders | 60.2 | ||
Fair value of RSUs assumed | 1.5 | ||
Fair value of total consideration | $ | 123.3 | |
Impact of Audience Acquisition and Pro-forma Summary
The following unaudited pro-forma summary presents consolidated financial information as if Audience had been acquired on January 1, 2014. The unaudited pro-forma financial information is based on historical results of operations and financial position of the Company and Audience. The pro-forma results include:
• | estimated amortization of a definite-lived developed technology intangible asset, |
• | the estimated cost of the inventory step-up to fair value, |
• | the estimated depreciation expense of the fixed asset step-up to fair value, |
• | interest expense associated with debt that would have been incurred in connection with the acquisition, and |
• | the reclassification of Audience transaction costs from 2015 to the first quarter of 2014. |
66
NOTES TO CONSOLIDATED FINANCIAL STATEMENTS | ||
The unaudited pro-forma financial information does not necessarily represent the results that would have occurred had the acquisition occurred on January 1, 2014. In addition, the unaudited pro-forma information should not be deemed to be indicative of future results.
Year Ended December 31, | |||
(in millions, except share and per share amounts) | 2015 | ||
Revenues from continuing operations: | |||
As reported | $ | 753.6 | |
Pro-forma | 783.6 | ||
Earnings (loss) from continuing operations: | |||
As reported | $ | 17.4 | |
Pro-forma | (36.5 | ) | |
Basic earnings (loss) per share from continuing operations: | |||
As reported | $ | 0.20 | |
Pro-forma | (0.41 | ) | |
Diluted earnings (loss) per share from continuing operations: | |||
As reported | $ | 0.20 | |
Pro-forma | (0.41 | ) | |
4. Impairments
The Company evaluates long-lived assets for recoverability whenever events or changes in circumstances indicate that the carrying amount may not be recoverable. During the second quarter of 2017, an updated strategic plan was completed for Audio segment product lines. The updated strategic plan identified a decline of future demand for a specific product line, which indicated projected future cash flows may not be sufficient to recover the carrying value of the associated unpatented technologies and property, plant, and equipment assets. The utilization of undiscounted future cash flows was used to determine recoverability of the long-lived assets. The fair value of the intangibles was determined through the use of discounted cash flows, and the fair value of fixed assets was determined using their liquidation value. As a result of this analysis, the Company concluded that the fair values of these long-lived assets were less than their respective carrying values. The Company recorded total impairment charges of $21.3 million, of which $5.1 million was related to fixed assets and $16.2 million was related to intangible assets. The Company recorded $1.4 million of the charges within Impairment charges in Gross profit and recorded $19.9 million within the Impairment charges line item in Operating expenses within the Consolidated Statements of Earnings.
During the year ended December 31, 2016, the Company identified asset impairments within the Audio segment of $0.5 million, which are primarily related to restructuring actions to focus research and development efforts on the design of new products in our core business. The Company recorded $0.3 million within Impairment charges in Gross profit and $0.2 million within the Impairment charges line item in Operating expenses within the Consolidated Statements of Earnings.
During the year ended December 31, 2015, the Company identified asset impairments within the Audio and PD segments of $3.5 million and $2.1 million, respectively. These impairments are a result of restructuring actions to consolidate its manufacturing footprint and other measures to further optimize operations. The Company recorded impairments of fixed and other assets of $3.3 million within Impairment charges in Gross profit within the Consolidated Statements of Earnings. The Company recorded impairments of intangible assets of $1.4 million and fixed and other assets of $0.9 million within the Impairment charges line item in Operating expenses within the Consolidated Statements of Earnings.
67
NOTES TO CONSOLIDATED FINANCIAL STATEMENTS | ||
5. Inventories, net
The following table details the major components of inventories, net:
(in millions) | December 31, 2017 | December 31, 2016 | |||||
Raw materials | $ | 65.9 | $ | 51.1 | |||
Work in progress | 21.3 | 13.3 | |||||
Finished goods | 60.8 | 51.0 | |||||
Subtotal | 148.0 | 115.4 | |||||
Less reserves | (22.4 | ) | (24.6 | ) | |||
Total | $ | 125.6 | $ | 90.8 | |||
6. Property, Plant, and Equipment, net
The following table details the major components of property, plant, and equipment, net:
(in millions) | December 31, 2017 | December 31, 2016 | |||||
Land | $ | 7.7 | $ | 7.7 | |||
Buildings and improvements | 103.2 | 93.7 | |||||
Machinery, equipment, and other | 441.1 | 382.5 | |||||
Subtotal | 552.0 | 483.9 | |||||
Less accumulated depreciation | (369.0 | ) | (311.0 | ) | |||
Total | $ | 183.0 | $ | 172.9 | |||
Depreciation expense totaled $46.5 million, $50.8 million, and $54.2 million for the years ended December 31, 2017, 2016, and 2015, respectively. The Company recorded fixed and other asset impairments of $5.1 million, $0.5 million, and $4.2 million for the years ended December 31, 2017, 2016, and 2015, respectively.
7. Goodwill and Other Intangible Assets
The changes in the carrying value of goodwill by reportable segment for the years ended December 31, 2017 and 2016 are as follows:
(in millions) | Audio | Precision Devices | Total | ||||||||
Balance at January 1, 2016 | $ | 859.2 | $ | 25.0 | $ | 884.2 | |||||
Acquisition adjustment (1) | 0.2 | — | 0.2 | ||||||||
Foreign currency translation | (12.8 | ) | — | (12.8 | ) | ||||||
Balance at December 31, 2016 | 846.6 | 25.0 | 871.6 | ||||||||
Foreign currency translation | 13.3 | — | 13.3 | ||||||||
Balance at December 31, 2017 | $ | 859.9 | $ | 25.0 | $ | 884.9 | |||||
(1) | Represents goodwill related to the Audience acquisition. |
68
NOTES TO CONSOLIDATED FINANCIAL STATEMENTS | ||
The gross carrying value and accumulated amortization for each major class of intangible assets are as follows:
December 31, 2017 | December 31, 2016 | ||||||||||||||
(in millions) | Gross Carrying Amount | Accumulated Amortization | Gross Carrying Amount | Accumulated Amortization | |||||||||||
Amortized intangible assets: | |||||||||||||||
Trademarks | $ | 0.3 | $ | 0.2 | $ | 0.3 | $ | 0.2 | |||||||
Patents | 40.8 | 22.2 | 40.8 | 17.5 | |||||||||||
Customer relationships (1) | 3.3 | 0.7 | — | — | |||||||||||
Unpatented technologies (1) (2) | 2.4 | 2.2 | 28.2 | 9.8 | |||||||||||
Other (1) | — | — | — | — | |||||||||||
Total | 46.8 | 25.3 | 69.3 | 27.5 | |||||||||||
Unamortized intangible assets: | |||||||||||||||
Trademarks | 32.0 | 32.0 | |||||||||||||
Total intangible assets, net | $ | 53.5 | $ | 73.8 | |||||||||||
(1) During the year ended December 31, 2017, the Company identified an error in which $137.0 million, $53.1 million, and $3.1 million in fully amortized customer relationships, unpatented technologies, and other intangible assets, respectively, should have been written-off during the year ended December 31, 2016. The December 31, 2016 table has been revised to correct the presentation for this matter, which did not impact the Consolidated Balance Sheets or Consolidated Statements of Earnings as presented in the 2016 Form 10-K or any of the 2017 Form 10-Q's.
(2) During the year ended December 31, 2017, the Company recorded impairment charges of $16.2 million related to unpatented technologies.
As discussed in Note 3. Acquisitions, the Company completed an acquisition of certain assets of a capacitors manufacturer on January 11, 2017. As a result of this acquisition, the Company acquired a customer list for $3.3 million during the year ended December 31, 2017, which is included in "Customer relationships" in the table above. The Company is using a five year life to amortize the newly acquired customer list.
Total amortization expense for the years ended December 31, 2017, 2016, and 2015 was $7.3 million, $18.2 million, and $18.2 million, respectively. Amortization expense is primarily recorded in Selling and administrative expenses in the Consolidated Statements of Earnings. Amortization expense for the next five years, based on current intangible balances, is estimated to be as follows:
(in millions) | |||
2018 | $ | 5.5 | |
2019 | 5.4 | ||
2020 | 5.3 | ||
2021 | 5.3 | ||
2022 | — | ||
69
NOTES TO CONSOLIDATED FINANCIAL STATEMENTS | ||
8. Other Accrued Expenses and Other Liabilities
The following table details the major components of other accrued expenses:
(in millions) | December 31, 2017 | December 31, 2016 | |||||
Restructuring and exit costs | $ | 4.8 | $ | 2.6 | |||
Sales volume rebates | 4.7 | 3.2 | |||||
Accrued short-term capital leases | 2.5 | 2.4 | |||||
Accrued taxes other than income taxes | 2.4 | 2.1 | |||||
Warranty | 2.1 | 1.0 | |||||
Accrued insurance | 1.9 | 1.6 | |||||
Hedging liability | — | 3.6 | |||||
Other (1) | 9.8 | 5.9 | |||||
Total | $ | 28.2 | $ | 22.4 | |||
(1) Represents accrued commissions (non-employee) and other miscellaneous accruals, none of which are individually significant.
The following table details the major components of other liabilities:
(in millions) | December 31, 2017 | December 31, 2016 | |||||
Transition tax liability (1) | 25.9 | — | |||||
Deferred compensation, including defined benefit plans | 18.7 | 18.7 | |||||
Long-term capital leases | 12.3 | 13.2 | |||||
Unrecognized tax benefits | 6.5 | 4.9 | |||||
Restructuring and exit costs | 0.3 | 0.2 | |||||
Other | 4.2 | 3.6 | |||||
Total | $ | 67.9 | $ | 40.6 | |||
(1) See Note 12. Income Taxes for additional information on this liability.
Warranty Accruals
Estimated warranty program claims are provided for at the time of sale. Amounts provided for are based on historical costs and adjusted for new claims. The changes in the carrying amount of product warranties were as follows:
Years Ended December 31, | |||||||
(in millions) | 2017 | 2016 | |||||
Beginning balance, January 1 | $ | 1.0 | $ | 1.0 | |||
Provision for warranties | 2.8 | 2.5 | |||||
Settlements made | (1.3 | ) | (2.1 | ) | |||
Other adjustments, including currency translation | (0.4 | ) | (0.4 | ) | |||
Ending balance, December 31 | $ | 2.1 | $ | 1.0 | |||
9. Restructuring and Related Activities
Restructuring and related activities are designed to better align the Company's operations with current market conditions through targeted facility consolidations, headcount reductions, and other measures to further optimize operations.
During the year ended December 31, 2017, the Company recorded restructuring charges of $4.0 million within Gross profit for actions primarily associated with transferring certain operations of hearing health manufacturing to a lower-cost Asian manufacturing facility. These charges were recorded within the Audio segment. The Company also recorded restructuring charges of $6.2 million within Operating expenses, primarily for actions associated with rationalizing the research and development workforce.
70
NOTES TO CONSOLIDATED FINANCIAL STATEMENTS | ||
During the year ended December 31, 2016, the Company recorded restructuring charges of $10.1 million, primarily for actions associated with the integration of Audience, which is reported as part of the Audio segment, and actions associated with rationalizing the selling and administrative workforce. These actions were substantially complete as of December 31, 2016. In addition, the Company recorded residual charges related to the transfer of a portion of the capacitor business into lower-cost Asian manufacturing facilities, which is reported as part of the PD segment. These charges included severance pay and benefits of $7.5 million and contract termination costs of $2.6 million, of which $1.5 million were classified with Gross profit and $8.6 million were classified within Operating expenses.
During the year ended December 31, 2015, the Company recorded restructuring charges of $9.5 million resulting from its acquisition of Audience, which is reported as part of the Audio segment. These charges included severance pay and benefits of $9.0 million and contract termination costs of $0.5 million. All charges were classified as Operating expenses. The Company also recorded restructuring charges during 2015 related to other actions, which included expenses related to previously announced plans to consolidate its manufacturing footprint, reduce headcount, and other measures to further optimize operations. During the year ended December 31, 2015, the Company recorded restructuring charges of $4.8 million, which included $4.4 million related to severance pay and benefits and $0.4 million related to contract terminations and other costs, of which $2.7 million were classified within Gross profit and $2.1 million were classified as Operating expenses. Total restructuring charges of $2.7 million were classified within Gross profit and $11.6 million were classified as Operating expenses.
The following table details restructuring charges incurred by reportable segment for the periods presented:
Years Ended December 31, | |||||||||||
(in millions) | 2017 | 2016 | 2015 | ||||||||
Audio | $ | 8.1 | $ | 7.1 | $ | 13.4 | |||||
Precision Devices | 0.1 | 1.4 | 0.3 | ||||||||
Corporate | 2.0 | 1.6 | 0.6 | ||||||||
Total | $ | 10.2 | $ | 10.1 | $ | 14.3 | |||||
The following table details the Company’s severance and other restructuring accrual activity:
(in millions) | Severance Pay and Benefits | Contract Termination and Other Costs | Total | ||||||||
Balance at January 1, 2015 | $ | 6.4 | $ | 0.5 | $ | 6.9 | |||||
Restructuring charges | 13.4 | 0.9 | 14.3 | ||||||||
Payments | (11.7 | ) | (0.2 | ) | (11.9 | ) | |||||
Other, including foreign currency | (0.4 | ) | (0.1 | ) | (0.5 | ) | |||||
Balance at December 31, 2015 | $ | 7.7 | $ | 1.1 | $ | 8.8 | |||||
Restructuring charges | 7.5 | 2.6 | 10.1 | ||||||||
Payments | (12.8 | ) | (3.3 | ) | (16.1 | ) | |||||
Balance at December 31, 2016 | $ | 2.4 | $ | 0.4 | $ | 2.8 | |||||
Restructuring charges (1) | 8.4 | 1.8 | 10.2 | ||||||||
Payments | (6.5 | ) | (1.8 | ) | (8.3 | ) | |||||
Other, including foreign currency | 0.4 | — | 0.4 | ||||||||
Balance at December 31, 2017 | $ | 4.7 | $ | 0.4 | $ | 5.1 | |||||
(1) | During the year ended December 31, 2017, the Company reversed $1.2 million of previously recorded restructuring charges due to subsequent developments that impacted the previously estimated amounts. |
71
NOTES TO CONSOLIDATED FINANCIAL STATEMENTS | ||
The severance and restructuring accruals are recorded in the following line items on the Consolidated Balance Sheets:
(in millions) | December 31, 2017 | December 31, 2016 | ||||||
Other accrued expenses | $ | 4.8 | $ | 2.6 | ||||
Other liabilities (1) | 0.3 | 0.2 | ||||||
Total | $ | 5.1 | $ | 2.8 | ||||
(1) | This line represents the long-term portion of the charges associated with lease obligations, net of reasonably obtainable sublease income. |
10. Hedging Transactions and Derivative Instruments
The Company is affected by changes in certain market conditions. These changes in market conditions may adversely impact the Company’s financial performance and are referred to as "market risks." The Company uses derivatives as a risk management tool to mitigate the potential impact of certain market risks, which are primarily foreign currency risk and interest rate risk related to ongoing business operations.
Cash Flow Hedging
The Company uses cash flow hedges to minimize the variability in cash flows of assets, liabilities, or forecasted transactions caused by fluctuations in foreign currency exchange rates or market interest rates. These derivatives, which are designated cash flow hedges, are carried at fair value. The changes in their fair values are recorded to Accumulated Other Comprehensive Income (Loss) ("AOCI") and reclassified in current earnings when the hedge contract matures or becomes ineffective.
To manage its exposure to foreign currency exchange rates, the Company has entered into currency deliverable forward contracts. These derivative instruments allow the Company to hedge portions of its forecasted sales and purchases, which are expected to occur within the next twelve months and are denominated in non-functional currencies. The Company maintains a foreign currency cash flow hedging program to primarily reduce the risk that the net U.S. dollar cash inflows from non-U.S. dollar sales and non-U.S. dollar net cash outflows from procurement activities will be adversely affected by changes in foreign currency exchange rates. At December 31, 2017 and 2016, the notional value of the derivatives related to currency forward contracts, principally the Chinese yuan, Malaysian ringgit, and Philippine peso, was $17.9 million and $75.4 million, respectively.
To manage its exposure to market risk for changes in interest rates, the Company entered into an interest rate swap on November 12, 2014 to convert variable interest rate payments into a fixed rate on a notional amount of $100.0 million of debt for monthly interest payments that began in January 2016 and ends in July 2018. In December 2017, the Company entered into a partial termination of the interest rate swap and reduced the notional amount to $50.0 million. The Company designated the swap as a cash flow hedge with re-measurement gains and losses recorded through AOCI.
Economic (Non-Designated) Hedging
In addition to derivative instruments that are designated and qualify for hedge accounting, the Company also uses certain derivatives as economic hedges of foreign currency risk. Although these derivatives were not designated and/or did not qualify for hedge accounting, they are effectively economic hedges. The changes in fair value of these economic hedges are immediately recognized in earnings.
The Company uses foreign currency economic hedges to offset the earnings impact that fluctuations in foreign currency exchange rates have on certain monetary assets and liabilities denominated in non-functional currencies. The Company does not enter into these hedges for speculative reasons. These derivatives are carried at fair value with changes in the fair value recorded in Other expense (income), net. In addition, these derivative instruments minimize the impact of exchange rate movements on the Company’s balance sheet, as the gains or losses on these derivatives are intended to offset gains and losses from the reduction of the hedged assets and liabilities. At December 31, 2017, the notional value of the derivatives related to economic hedging was $6.4 million. The Company held no open positions related to economic hedges at December 31, 2016.
72
NOTES TO CONSOLIDATED FINANCIAL STATEMENTS | ||
The notional amounts of the derivative financial instruments do not necessarily represent amounts exchanged by the parties and, therefore, are not a direct measure of our exposure to the financial risks described above. The amounts exchanged are calculated by reference to the notional amounts and by other terms of the derivatives, such as interest rates, foreign currency exchange rates, or other financial indices. The Company does not view the fair values of its derivatives in isolation, but rather in relation to the fair values or cash flows of the underlying hedged transactions or other exposures. Virtually all of our derivatives are straightforward over-the-counter instruments with liquid markets.
Fair Value Measurements
All derivatives are carried at fair value on the Company’s Consolidated Balance Sheets. ASC 820, Fair Value Measurement, establishes a fair value hierarchy that requires the Company to maximize the use of observable inputs and minimize the use of unobservable inputs when measuring fair value. A financial instrument’s categorization within the hierarchy is based on the lowest level of input that is significant to the fair value measurement. ASC 820 establishes three levels of inputs that may be used to measure fair value as follows:
Level 1 - Quoted prices (unadjusted) in active markets for identical assets or liabilities.
Level 2 - Observable inputs other than quoted prices included in Level 1, such as quoted prices in active markets for similar assets and liabilities, quoted prices for identical or similar assets or liabilities in markets that are not active, or other inputs that are observable or can be corroborated by observable market data for substantially the full term of assets or liabilities.
Level 3 - Unobservable inputs for which little or no market data exists, therefore requiring an entity to develop its own assumptions.
The Company determines the fair values of its derivatives based on standard valuation models or observable market inputs such as quoted market prices, foreign currency exchange rates, or interest rates; therefore, the Company classifies the derivatives within Level 2 of the valuation hierarchy.
The following table sets forth the fair values of derivative instruments held by the Company as of December 31, 2017 and 2016 and the balance sheet lines to which they are recorded:
(in millions) | ||||||||
Hedge Type | Balance Sheet Line Item | December 31, 2017 | December 31, 2016 | |||||
Cash flow hedges | Prepaid and other current assets | $ | 0.6 | $ | — | |||
Cash flow hedges | Other accrued expenses | — | 3.6 | |||||
Cash flow hedges | Other liabilities | — | 0.2 | |||||
Accounting for derivatives requires that derivative instruments be recognized as either assets or liabilities at fair value. However, accounting for the gains and losses resulting from changes in fair value depends upon the use of the derivative and whether it is considered designated and qualified for hedge accounting.
For non-designated foreign currency economic hedge derivative contracts, for which the Company does not apply hedge accounting, the changes in fair value of the derivative instrument are immediately recognized in earnings within Other expense (income), net.
For currency forward contracts and interest rate swaps, which are designated as cash flow hedge derivatives and for which the Company applies hedge accounting guidance, the fair value of the effective portion of these hedges is recorded within AOCI and reclassified and recognized in current earnings when the hedge contract matures or is determined to be ineffective. As a result, the Company has recorded a $0.5 million gain and a $3.2 million loss to AOCI on the Company’s Consolidated Balance Sheets as of December 31, 2017 and 2016, respectively.
For economic hedges, for which the Company does not apply hedge accounting, the following (gains) losses were recorded for the years ended December 31, 2017, 2016, and 2015:
(in millions) | Years Ended December 31, | |||||||||||
Hedge Type | Statement of Earnings Line | 2017 | 2016 | 2015 | ||||||||
Economic Hedges | Other expense (income), net | $ | (0.3 | ) | $ | 2.0 | $ | 0.3 | ||||
73
NOTES TO CONSOLIDATED FINANCIAL STATEMENTS | ||
The following table presents the pre-tax impact of changes in the fair values of the designated derivatives, which qualify for hedge accounting during the years ended December 31, 2017, 2016, and 2015. Knowles reclassified these losses out of AOCI into Other expense (income), net as follows:
(in millions) | Years Ended December 31, | |||||||||||
Hedge Type | Statement of Earnings Line | 2017 | 2016 | 2015 | ||||||||
Cash flow hedges | Other expense (income), net | $ | 0.5 | $ | 1.0 | $ | — | |||||
11. Borrowings
Borrowings (net of debt issuance costs, debt discount, and amortization) consist of the following:
(in millions) | December 31, 2017 | December 31, 2016 | |||||
3.25% Convertible Senior Notes | $ | 141.9 | $ | 135.1 | |||
Term loan and revolving credit facility | 50.7 | 163.1 | |||||
Total | 192.6 | 298.2 | |||||
Less current maturities | — | 9.7 | |||||
Total long-term debt | $ | 192.6 | $ | 288.5 | |||
Total debt principal payments over the next five years are as follows:
(in millions) | 2018 | 2019 | 2020 | 2021 | 2022 | ||||||||||||||
Debt principal payments (1) | $ | — | $ | — | $ | — | $ | 172.5 | $ | 50.7 | |||||||||
(1) There are no required principal payments due under the 3.25% Convertible Senior Notes or the revolving credit facility until maturities in November 2021 and October 2022, respectively.
3.25% Convertible Senior Notes Due November 1, 2021
In May 2016, the Company issued $172.5 million aggregate principal amount of 3.25% convertible senior notes due November 1, 2021 ("the Notes"), unless earlier repurchased by the Company or converted pursuant to their terms. Interest is payable semiannually in arrears on May 1 and November 1 of each year and commenced on November 1, 2016.
The Notes are governed by an Indenture (the "Indenture") between the Company, as issuer, and U.S. Bank National Association as trustee. Upon conversion, the Company will pay or deliver cash, shares of the Company's common stock, or a combination of cash and shares of common stock, at the Company's election. The initial conversion rate is 54.2741 shares of common stock per $1,000 principal amount of Notes. The initial conversion price is $18.4250 per share of common stock. The conversion rate will be subject to adjustment upon the occurrence of certain specified events but will not be adjusted for accrued and unpaid interest. In addition, upon the occurrence of a make-whole fundamental change (as defined in the Indenture), the Company may be required, in certain circumstances, to increase the conversion rate by a number of additional shares for a holder that elects to convert its Notes in connection with such make-whole fundamental change.
Prior to the close of business on the business day immediately preceding August 1, 2021, the Notes will be convertible only under the following circumstances:
= | during any calendar quarter and only during such calendar quarters, if the last reported sale price of the Company’s common stock for at least 20 trading days (whether or not consecutive) during a period of 30 consecutive trading days ending on the last trading day of the immediately preceding calendar quarter is greater than or equal to 130% of the conversion price on each applicable trading day; |
= | during the five business day period after any 10 consecutive trading day period (the “measurement period”) in which the trading price per $1,000 principal amount of Notes was less than 98% of the product of the last reported sale price of the Company’s common stock and the conversion rate on each such trading day; or |
= | upon the occurrence of specified corporate events. |
74
NOTES TO CONSOLIDATED FINANCIAL STATEMENTS | ||
On or after August 1, 2021 until the close of business on the second scheduled trading day immediately preceding the maturity date, holders may convert all or any portion of their Notes, in multiples of $1,000 principal amount, at the option of the holder regardless of the foregoing circumstances. As of December 31, 2017, no event has occurred that would permit the conversion of the Notes. The Notes are the Company’s senior unsecured obligations.
In accounting for the issuance of the Notes, the Company separated the Notes into liability and equity components. The carrying amount of the liability component was calculated by measuring the fair value of a similar liability that does not have an associated convertible feature. The carrying amount of the equity component representing the conversion option was determined by deducting the fair value of the liability component from the face value of the Notes as a whole. The excess of the principal amount of the liability component over its carrying amount is amortized to interest expense over the term of the Notes. The equity component is not remeasured as long as it continues to meet the conditions for equity classification.
In accounting for the transaction costs related to the Notes issuance, the Company allocated the total amount incurred to the liability and equity components based on their relative values. Issuance costs attributable to the liability component, totaling $5.0 million, are being amortized to interest expense over the term of the Notes, and issuance costs attributable to the equity component, totaling $1.3 million, were netted with the equity component in stockholders' equity. Additionally, the Company recorded a deferred tax asset of $0.5 million on a portion of the equity component transaction costs which are deductible for tax purposes and immediately recorded a valuation allowance against this deferred tax asset.
The Notes consist of the following:
(in millions) | December 31, 2017 | December 31, 2016 | |||||
Liability component: | |||||||
Principal | $ | 172.5 | $ | 172.5 | |||
Less debt issuance costs and debt discount, net of amortization | (30.6 | ) | (37.4 | ) | |||
Total | 141.9 | 135.1 | |||||
Less current maturities | — | (0.9 | ) | ||||
Long-term portion | $ | 141.9 | $ | 136.0 | |||
Equity component (1) | $ | 29.9 | $ | 29.9 | |||
(1) Recorded in the Consolidated Balance Sheets within additional paid-in capital, inclusive of the $1.3 million of issuance costs in equity.
The total estimated fair value of the Notes at December 31, 2017 was $191.4 million. The fair value was determined based on the closing trading price of the Notes as of the last trading day of 2017.
The following table sets forth total interest expense recognized related to the Notes:
Years Ended December 31, | |||||||
(in millions) | 2017 | 2016 | |||||
3.25% coupon | $ | 5.6 | $ | 3.7 | |||
Amortization of debt issuance costs | 0.9 | 0.6 | |||||
Amortization of debt discount | 5.8 | 3.6 | |||||
Total | $ | 12.3 | $ | 7.9 | |||
75
NOTES TO CONSOLIDATED FINANCIAL STATEMENTS | ||
Note Hedges
To minimize the impact of potential economic dilution upon conversion of the Notes, the Company entered into convertible note hedge transactions (the “Note Hedges”) with respect to its common stock. In the second quarter of 2016, the Company paid an aggregate amount of $44.5 million for the Note Hedges. The Note Hedges will expire upon maturity of the Notes. The Note Hedges are intended to offset the potential dilution upon conversion of the Notes and/or offset any cash payments the Company is required to make in excess of the principal amount upon conversion of the Notes in the event that the market value per share of the Company's common stock, as measured under the Note Hedges, is greater than the strike price of the Note Hedges. which initially corresponds to the initial conversion price of the Notes and is subject to anti-dilution adjustments substantially similar to those applicable to the conversion rate of the Notes. The Note Hedges are separate transactions entered into by the Company, and are not part of the Notes or the Warrants, and have been accounted for as part of additional paid-in capital. Holders of the Notes do not have any rights with respect to the Note Hedges.
Warrants
In addition to the Note Hedges, in the second quarter of 2016, the Company entered into warrant transactions, whereby the Company sold warrants to acquire shares of the Company's common stock at a strike price of $21.1050 per share (the “Warrants”). The Company received aggregate proceeds of $39.1 million from the sale of the Warrants. If the market price per share of the Company's common stock for the reporting period, as measured under the Warrants, exceeds the strike price of the Warrants, the Warrants could have a dilutive effect on the Company's common stock, unless the Company elects, subject to certain conditions, to settle the Warrants in cash. The Warrants are separate transactions entered into by the Company, and are not part of the Notes or the Note Hedges, and have been accounted for as part of additional paid-in capital. Holders of the Notes and Note Hedges do not have any rights with respect to the Warrants.
Term Loan and Revolving Credit Facility
Term loan and revolving credit facility borrowings consist of the following:
(in millions) | December 31, 2017 | December 31, 2016 | |||||
Term loan due January 2019 | $ | — | $ | 118.5 | |||
$300.0 million revolving credit facility due January 2019 | — | 45.0 | |||||
$400.0 million revolving credit facility due October 2022 | 50.7 | — | |||||
Less debt issuance costs, net of amortization | — | (0.4 | ) | ||||
Total | 50.7 | 163.1 | |||||
Less current maturities | — | 10.6 | |||||
Long-term portion | $ | 50.7 | $ | 152.5 | |||
On October 11, 2017, Knowles entered into a Revolving Credit Facility Agreement (the "New Credit Facility"). The New Credit Facility contains a five-year senior secured revolving credit facility providing for borrowings in an aggregate principal amount at any time outstanding not to exceed $400.0 million. Up to $100.0 million of the New Credit Facility will be available in Euro, Sterling, and other currencies requested by the Company and agreed to by each Lender and up to $50.0 million of the New Credit Facility will be made available in the form of letters of credit denominated in any currencies agreed by the issuing bank.
The New Credit Facility serves as refinancing of indebtedness and terminates the Company's Amended and Restated Credit Agreement dated as of January 27, 2014, as amended and restated as of December 31, 2014 and supplemented from time to time (“Prior Credit Facilities”).
At any time during the term of the New Credit Facility, the Company will be permitted to increase the commitments under the New Credit Facility or to establish one or more incremental term loan facilities under the New Credit Facility in an aggregate principal amount not to exceed $200.0 million for all such incremental facilities.
Commitments under the New Credit Facility will terminate, and loans outstanding thereunder will mature, on October 11, 2022; provided, that if all the Company’s 3.25% Convertible Senior Notes Due November 1, 2021 have not been repaid, refinanced and/or converted to common stock of the Company by April 30, 2021, then the commitments under the New Credit Facility will terminate, and the loans outstanding thereunder will mature, on such earlier date.
76
NOTES TO CONSOLIDATED FINANCIAL STATEMENTS | ||
The interest rates under the New Credit Facility will be, at the Borrowers’ option (1) LIBOR (or, in the case of borrowings under the New Credit Facility denominated in Euro, EURIBOR) plus the rates per annum determined from time to time based on the total leverage ratio of the Company as of the end of and for the most recent period of four fiscal quarters for which financial statements have been delivered (the “Applicable Rate”); or (2) in the case of borrowings denominated in U.S. dollars, alternate base rate (“ABR”); provided, however, that any swingline borrowings shall bear interest at the rate applicable to ABR borrowings or, prior to the purchase of participations in such borrowings by the Lenders, at such other rate as shall be agreed between the Company and the swingline lender.
The interest rate under the New Credit Facility is variable based on LIBOR at the time of the borrowing and the Company’s leverage as measured by a total indebtedness to Consolidated EBITDA ratio. Based upon the Company’s total indebtedness to Consolidated EBITDA ratio, the Company’s borrowing rate could range from LIBOR + 1.25% to LIBOR + 2.25%. In addition, a commitment fee accrues on the average daily unused portion of the New Credit Facility at a rate of 0.20% to 0.35%.
The New Credit Facility includes requirements, to be tested quarterly, that the Company maintains (i) a minimum ratio of Consolidated EBITDA to consolidated interest expense of 3.25 to 1.0, (the "Interest Coverage Ratio"), (ii) a maximum ratio of Consolidated total indebtedness to Consolidated EBITDA of 3.75 to 1.0 ("the Leverage Ratio"), and (iii) a maximum ratio of senior secured indebtedness to Consolidated EBITDA of 3.25 to 1.0 (the "Senior Secured Leverage Ratio"). For these ratios, Consolidated EBITDA and consolidated interest expense are calculated using the most recent four consecutive fiscal quarters in a manner defined in the New Credit Facility. At December 31, 2017, the Company was in compliance with these covenants and it expects to remain in compliance with all of its debt covenants over the next twelve months.
On January 27, 2014, the Company entered into a $200.0 million five-year senior secured revolving credit facility as well as a $300.0 million five-year senior secured term loan facility pursuant to the Original Credit Agreement, which are referred to collectively as the "Prior Credit Facilities."
On December 31, 2014, the Company amended its Prior Credit Facilities to (i) increase the amount of the revolving credit facility in the Original Credit Agreement to $350.0 million from $200.0 million, (ii) increase the amount of the letter of credit subfacility in the Original Credit Agreement to $50.0 million from $25.0 million, (iii) eliminate the swing line subfacility in the amount of up to $35.0 million in the Original Credit Agreement and (iv) reduce to $100.0 million from $250.0 million the amount of additional incremental revolving or term loans in the Original Credit Agreement. All other terms and conditions of the Prior Credit Facilities remained essentially the same.
On February 9, 2016, the Company entered into a third amendment to its Prior Credit Facilities that includes a permanent reduction by the Company of the aggregate revolving commitment under the Prior Credit Facilities from $350.0 million to $300.0 million.
On April 27, 2016, the Company entered into a fourth amendment to its Prior Credit Facilities to permit the Company to execute the offering of the Notes and the related transactions.
The weighted-average interest rate on the Company's borrowings under the New Credit Facility and Prior Credit Facilities was 3.58% and 3.23% for the years ended December 31, 2017 and 2016, respectively. The weighted-average interest rate on the Company's borrowings under the New Credit Facility and Prior Credit Facilities for the years ended December 31, 2017 and 2016 includes interest expense related to the monthly interest rate swap settlements. The weighted-average commitment fee on the revolving lines of credit was 0.36% and 0.39% for the years ended December 31, 2017 and 2016, respectively.
77
NOTES TO CONSOLIDATED FINANCIAL STATEMENTS | ||
Interest expense and interest income for the years ended December 31, 2017, 2016, and 2015 were as follows:
Years Ended December 31, | |||||||||||
(in millions) | 2017 | 2016 | 2015 | ||||||||
Interest expense(1) | $ | 20.8 | $ | 20.5 | $ | 12.8 | |||||
Interest income | (0.2 | ) | (0.1 | ) | (0.1 | ) | |||||
Interest expense, net | $ | 20.6 | $ | 20.4 | $ | 12.7 | |||||
(1) During 2017, the Company wrote off $0.4 million of debt issuance costs related to the Prior Credit Facilities to interest expense upon entering into the New Credit Facility. During 2016, the Company wrote off $0.7 million of debt issuance costs to interest expense in connection with the third amendment to its Prior Credit Facilities.
See Note 10. Hedging Transactions and Derivative Instruments for information on derivatives used to manage interest rate risk.
12. Income Taxes
The components of earnings before income taxes and discontinued operations were:
Years Ended December 31, | |||||||||||
(in millions) | 2017 | 2016 | 2015 | ||||||||
Domestic | $ | 402.7 | $ | (51.1 | ) | $ | (57.9 | ) | |||
Foreign | (383.3 | ) | 79.2 | 78.5 | |||||||
Total earnings before income taxes and discontinued operations | $ | 19.4 | $ | 28.1 | $ | 20.6 | |||||
Income tax expense for the years ended December 31, 2017, 2016, and 2015 is comprised of the following:
Years Ended December 31, | |||||||||||
(in millions) | 2017 | 2016 | 2015 | ||||||||
Current: | |||||||||||
U.S. Federal | $ | 28.9 | $ | — | $ | 1.9 | |||||
State and local | 0.1 | 0.1 | — | ||||||||
Foreign | 11.7 | 6.8 | 9.9 | ||||||||
Total current tax expense | $ | 40.7 | $ | 6.9 | $ | 11.8 | |||||
Deferred: | |||||||||||
U.S. Federal | $ | (26.8 | ) | $ | 0.8 | $ | (3.5 | ) | |||
State and local | — | 0.2 | (0.1 | ) | |||||||
Foreign | (1.0 | ) | 0.4 | (5.0 | ) | ||||||
Total deferred tax (benefit) expense | (27.8 | ) | 1.4 | (8.6 | ) | ||||||
Total income tax expense | $ | 12.9 | $ | 8.3 | $ | 3.2 | |||||
78
NOTES TO CONSOLIDATED FINANCIAL STATEMENTS | ||
The reconciliation of the U.S. Federal income tax rate to the Company’s effective income tax rate was as follows:
Years Ended December 31, | ||||||||
2017 | 2016 | 2015 | ||||||
U.S. Federal income tax rate | 35.0 | % | 35.0 | % | 35.0 | % | ||
State and local taxes, net of Federal income tax benefit | (0.2 | )% | 1.1 | % | (7.4 | )% | ||
Foreign operations tax effect | 27.0 | % | (22.5 | )% | (36.6 | )% | ||
Research & experimentation tax credits | (11.6 | )% | (6.6 | )% | (12.4 | )% | ||
Valuation allowance | 60.8 | % | 69.6 | % | 97.0 | % | ||
Tax contingencies | 6.6 | % | (0.6 | )% | (1.3 | )% | ||
Tax holiday | (78.0 | )% | (64.2 | )% | (87.9 | )% | ||
Foreign taxes | (5.0 | )% | 2.8 | % | 8.8 | % | ||
Non-deductible transaction costs | — | % | — | % | 5.9 | % | ||
Stock-based compensation | 9.3 | % | 9.6 | % | 4.7 | % | ||
Other, principally non-tax deductible items (1) | 12.7 | % | 5.1 | % | 9.5 | % | ||
Transition tax | 89.7 | % | — | % | — | % | ||
Tax reform | (85.3 | )% | — | % | — | % | ||
Prior period items | 5.5 | % | 0.2 | % | 0.2 | % | ||
Effective income tax rate | 66.5 | % | 29.5 | % | 15.5 | % | ||
(1) Includes income tax expense related to the Malaysian tax consequences of the intra-entity intellectual property sale between the U.S. and Malaysia that increases the effective income tax rate by 18.5% for the year ended December 31, 2017.
The Company’s effective tax rate is favorably impacted by two tax holidays granted to us by Malaysia effective through December 31, 2021. These tax holidays are subject to the Company’s satisfaction of certain conditions, including investment or sales thresholds, which the Company expects to maintain. During 2016, the Company applied for and received final approval to modify the terms of its main tax holiday in Malaysia, reducing the rate to 7.2% versus the statutory rate of 24.0%, effective January 1, 2017 through December 31, 2021. If the Company fails to satisfy such conditions, the Company’s effective tax rate may be significantly adversely impacted. The continuing operations benefit of these incentives for the years ending December 31, 2017, 2016, and 2015 is estimated to be $13.8 million, $16.3 million, and $17.7 million, respectively. The continuing operations benefit of the tax holidays on a per share basis for the years ending December 31, 2017, 2016, and 2015 was $0.15, $0.18, and $0.20, respectively.
79
NOTES TO CONSOLIDATED FINANCIAL STATEMENTS | ||
The components of the Company’s deferred tax assets and liabilities included the following:
(in millions) | December 31, 2017 | December 31, 2016 | |||||
Deferred tax assets: | |||||||
Accrued compensation, principally post-retirement, and other employee benefits | $ | 13.7 | $ | 19.0 | |||
Accrued expenses, principally for state income taxes, interest, and warranty | 5.9 | 6.5 | |||||
Net operating loss and other carryforwards | 115.6 | 148.2 | |||||
Inventories, principally due to reserves for financial reporting purposes and capitalization for tax purposes | 3.6 | 7.5 | |||||
Convertible Note Hedges | 7.3 | 14.6 | |||||
Plant and equipment, principally due to differences in depreciation | 9.6 | 4.5 | |||||
Total gross deferred tax assets | 155.7 | 200.3 | |||||
Valuation allowance | (99.7 | ) | (161.3 | ) | |||
Total deferred tax assets | $ | 56.0 | $ | 39.0 | |||
Deferred tax liabilities: | |||||||
Intangible assets, principally due to different tax and financial reporting bases and amortization lives | $ | (10.3 | ) | $ | (27.3 | ) | |
Debt discount on convertible notes | (5.7 | ) | (11.6 | ) | |||
Other liabilities | (17.6 | ) | (6.7 | ) | |||
Total gross deferred tax liabilities | (33.6 | ) | (45.6 | ) | |||
Net deferred tax asset (liability) | $ | 22.4 | $ | (6.6 | ) | ||
Classified as follows in the Consolidated Balance Sheets: | |||||||
Other assets and deferred charges (non-current deferred tax assets) | $ | 22.4 | $ | 15.0 | |||
Deferred income taxes (non-current deferred tax liabilities) | — | (21.6 | ) | ||||
Net deferred tax asset (liability) | $ | 22.4 | $ | (6.6 | ) | ||
The Company recorded valuation allowances of $99.7 million and $161.3 million at December 31, 2017 and 2016, respectively, against deferred tax assets from continuing operations as the Company believes it is more likely than not that these assets will not be realized. Of the $99.7 million allowance as of December 31, 2017, $11.7 million was related to a change in judgment regarding the realizability of the beginning of the year tax assets as a result of the Tax Reform Act enacted December 22, 2017. Management believes that it is more likely than not that the Company will realize the benefits of the remaining deferred tax assets. The amount of the deferred tax asset is considered realizable, however, it could be adjusted if estimates of future taxable income during the carryforward period are reduced or increased or if objective negative evidence in the form of cumulative losses is no longer present, requiring that additional weight be given to subjective evidence such as our projections for growth.
At December 31, 2017, the Company had $34.2 million of Federal net operating losses that are available, of which $12.2 million will expire in the next 5 to 10 years and $22.0 million will expire in the next 10 to 20 years. There are $96.9 million of State net operating losses that are available between 2018 and 2037. There are $314.2 million of non-U.S. net operating loss carryforwards, of which $3.1 million will expire within the next 5 years, $0.8 million will expire in the next 5 to 10 years, and $310.3 million can be carried forward indefinitely.
The Company has $7.7 million of U.S. federal research and development credits that begin to expire in 2020 and $3.3 million of foreign tax credits that begin to expire in 2027. In addition, the Company has $13.8 million of state credits, of which $1.4 million will expire between 2019 and 2033 if unused, and $12.4 million can be carried forward indefinitely.
The Company has not provided for deferred taxes on the undistributed earnings of its international subsidiaries totaling approximately $1.7 billion. Such earnings are reinvested in foreign jurisdictions and it is currently intended that they will continue to be reinvested indefinitely. Our Malaysian principal subsidiary is our primary source of foreign earnings and cash. Any future decision to distribute cash from this subsidiary to the U.S. should not result in a material amount of U.S. or foreign taxes.
80
NOTES TO CONSOLIDATED FINANCIAL STATEMENTS | ||
Unrecognized Tax Benefits
The Company records interest and penalties associated with unrecognized tax benefits as a component of income tax expense. During the years ended December 31, 2017 and 2016, the Company recorded a potential interest benefit of $1.1 million and potential interest expense of $0.3 million, respectively. The Company recorded no potential interest impact during the year ended December 31, 2015. Total accrued interest at December 31, 2017, 2016, and 2015 was $0.4 million, $1.4 million, and $1.3 million, respectively, and was included in other liabilities. During the year ended December 31, 2017, the Company recorded potential penalty expense of $0.2 million, which is also the cumulative penalty amount included in other liabilities. Total accrued penalties at December 31, 2017 was $0.2 million.
The Company's tax returns are routinely audited by the tax authorities in the relevant jurisdictions. For tax years before 2014, the Company is no longer subject to U.S. federal income tax examination. For tax years before 2012, the Company’s Malaysian subsidiaries are no longer subject to examination. It is reasonably possible that the gross amount of unrecognized tax benefits will decrease by $2.8 million during the next twelve months. Included in the balance of total unrecognized tax benefits at December 31, 2017 are potential benefits of $6.0 million, which if recognized, would affect the effective rate on earnings from continuing operations. Given the Company's current valuation allowance position, no benefit is expected to result from the reversal of any uncertain tax position associated with the acquired attributes.
Unrecognized tax benefits at January 1, 2015 | $ | 5.0 | |
Reductions for tax positions of prior years | (0.4 | ) | |
Additions for business combinations | 8.4 | ||
Foreign exchange fluctuations | (0.2 | ) | |
Unrecognized tax benefits at December 31, 2015 | $ | 12.8 | |
Reductions for tax positions due to lapsed statutes of limitations | (0.5 | ) | |
Foreign exchange fluctuations | (0.5 | ) | |
Unrecognized tax benefits at December 31, 2016 | $ | 11.8 | |
Additions based on tax positions related to the current year | 2.6 | ||
Additions for tax positions of prior years | 0.6 | ||
Reductions for tax positions due to lapsed statutes of limitations | (1.3 | ) | |
Tax reform | (1.5 | ) | |
Foreign exchange fluctuations | 0.3 | ||
Unrecognized tax benefits at December 31, 2017 | $ | 12.5 | |
On December 22, 2017, the Tax Reform Act was enacted which permanently reduces the U.S. corporate income tax rate from a maximum of 35% to a flat 21% rate, effective January 1, 2018. As a result of the reduction in the U.S. corporate income tax rate, the Company revalued its ending net deferred tax liabilities as of December 31, 2017 and recognized a provisional tax benefit of $5.6 million. Due to the change in the net operating loss carryforward period, taxable temporary differences associated with our indefinite-lived intangible assets allow the company to recognize $11.7 million of deferred tax assets that previously required a valuation allowance. The Tax Reform Act also provided for a one-time deemed repatriation of post-1986 undistributed foreign subsidiary E&P through the year ended December 31, 2017. The Company recorded provisional tax expense related to the deemed repatriation of $18.0 million payable over nine years. The expected gross payable due to the Tax Reform Act is $25.9 million, which will be reduced by the use of approximately $7.9 million of existing deferred tax assets resulting in an $18.0 million net expected liability as of December 31, 2017. The GILTI provisions of the Tax Reform Act require the Company to include in its U.S. income tax return foreign subsidiary earnings in excess of an allowable return on the foreign subsidiary’s tangible assets. The Company expects that it will be subject to incremental U.S. tax on GILTI income beginning in 2018. The Company has elected to account for GILTI tax in the period in which it is incurred, and therefore has not provided any deferred tax impacts of GILTI in its Consolidated Financial Statements for the year ended December 31, 2017.
81
NOTES TO CONSOLIDATED FINANCIAL STATEMENTS | ||
On December 22, 2017, the SEC staff issued SAB 118 to address the application of U.S. GAAP in situations when a registrant does not have the necessary information available, prepared, or analyzed (including computations) in reasonable detail to complete the accounting for certain income tax effects of the Tax Reform Act. In accordance with the SAB 118 guidance, the Company has recognized the provisional tax impacts related to deemed repatriated earnings, the change in beginning of year valuation allowance, and the benefit for the remeasurement of deferred tax assets and liabilities in its Consolidated Financial Statements for the year ended December 31, 2017. The final impact may differ from these provisional amounts, possibly materially, due to, among other things, issuance of additional regulatory guidance, changes in interpretations and assumptions the Company has made, and actions the Company may take as a result of the Tax Reform Act. In accordance with SAB 118 the financial reporting impact of the Tax Reform Act will be completed in the fourth quarter of 2018.
13. Equity Incentive Program
The following table summarizes the compensation expense recognized by the Company for the periods presented:
Years Ended December 31, | |||||||||||
(in millions) | 2017 | 2016 | 2015 | ||||||||
Pre-tax stock-based compensation expense | $ | 24.7 | $ | 20.9 | $ | 15.0 | |||||
Tax benefit | — | — | — | ||||||||
Total stock-based compensation expense, net of tax | $ | 24.7 | $ | 20.9 | $ | 15.0 | |||||
For 2017, stock-based compensation expense of $16.8 million was classified in Selling and administrative expenses, $6.1 million in Research and development expenses, and $1.8 million in Cost of goods sold. For 2016, stock-based compensation expense of $14.7 million was classified in Selling and administrative expenses, $4.7 million in Research and development expenses, and $1.5 million in Cost of goods sold. For 2015, stock-based compensation expense of $11.8 million was classified in Selling and administrative expenses, $1.2 million in Cost of goods sold, and $2.0 million in Research and development expenses.
Compensation expense for stock-based awards is measured based on the fair value of the awards as of the date the stock-based awards are granted and adjusted to the estimated number of awards that are expected to vest. Forfeitures are estimated based on historical experience at the time of grant and revised in subsequent periods if actual forfeitures differ from those estimates. Compensation costs for stock-based awards are amortized over their service period.
Prior to the Separation, Knowles employees participated in our Former Parent's incentive stock program. Stock-based compensation expense was allocated to Knowles based on the portion of our Former Parent's equity incentive program in which Knowles employees participated. Adopted in connection with the Separation, the Knowles' Corporation 2014 Equity and Cash Incentive Plan (the "Plan") provided for the assumption of certain awards granted under our Former Parent's equity incentive program and authorized the grant of several different forms of benefits, including stock options, RSUs, PSUs, and SSARs.
In connection with the Separation, equity awards previously granted by our Former Parent to employees of the Company were converted to Knowles equity awards under the Plan. In general, each award is subject to the same terms and conditions as were in effect prior to the Separation, except that our Former Parent's performance shares converted to time-based RSUs. In addition, the Company made a grant comprised of both stock options and time-based RSUs that vest 50% on the third and fourth anniversaries from the date of the grant. The Company also made grants of both stock options and time-based RSUs that vest evenly over each of the first three years following the date of the grant. Lastly, the independent directors received a grant of Company shares that vested immediately in March 2014 and an annual grant for their service during the year ended December 31, 2014, receipt of which was deferred by some of the recipients. The Company elected to use the straight-line method to attribute the expense over the service period of the awards.
In connection with the Audience acquisition, the Company converted unvested in-the-money Audience stock options and RSUs to Knowles equity awards for an aggregate of 461,371 shares of its common stock. The fair value of unvested equity awards relating to future services, and not yet earned, are recorded as operating expenses over the remaining service periods. The Company has elected to use the straight-line method to attribute the expense over the service period of the awards.
82
NOTES TO CONSOLIDATED FINANCIAL STATEMENTS | ||
Stock Options and SSAR's
The fair value of stock options granted by the Company was estimated on the date of grant using a Black-Scholes option-pricing model based on the assumptions shown in the table below.
2017 | 2016 | 2015 | |||||||||
Risk-free interest rate | 1.73% | to | 1.93% | 1.04% | to | 1.25% | 1.24% | to | 1.50% | ||
Dividend yield | —% | —% | —% | ||||||||
Expected life (years) | 4.5 | 4.5 | 4.5 | ||||||||
Volatility | 33.2% | to | 38.8% | 37.0% | to | 39.6% | 39.8% | to | 42.4% | ||
Fair value at date of grant | $5.02 | to | $6.73 | $3.76 | to | $4.83 | $5.94 | to | $6.88 | ||
The determination of expected volatility is based on a blended peer group volatility for companies in similar industries, stage of life, and with similar market capitalization since there is not sufficient historical volatility data for Knowles common stock over the period commensurate with the expected term of stock options, as well as other relevant factors. The risk-free interest rate is based on U.S. government issues with a remaining term equal to the expected life of the stock options. The expected term is the period over which our employees are expected to hold their options. It is based on the simplified method from the Securities and Exchange Commission’s safe harbor guidelines. The Company does not currently anticipate paying dividends over the expected term.
The exercise price per share for the stock options granted by the Company was equal to the closing price of Knowles' stock on the New York Stock Exchange on the date of the grant. The period during which options granted by the Company were exercisable was fixed by Knowles' Compensation Committee of the Board of Directors at the time of grant. Generally, the stock options expire at the end of seven years.
The following table summarizes the Company's SSAR and stock option activity for the year ended December 31, 2017.
SSARs | Stock Options | ||||||||||||||||||||||||
Number of Shares | Weighted-Average Exercise Price | Aggregate Intrinsic Value | Weighted-Average Remaining Contractual Term (Years) | Number of Shares | Weighted-Average Exercise Price | Aggregate Intrinsic Value | Weighted-Average Remaining Contractual Term (Years) | ||||||||||||||||||
(in millions, except share and per share amounts) | |||||||||||||||||||||||||
Outstanding at December 31, 2016 | 898,718 | $ | 21.25 | 4,684,117 | $ | 18.03 | |||||||||||||||||||
Granted | — | — | 832,826 | 19.02 | |||||||||||||||||||||
Exercised | (31,665 | ) | 12.33 | (229,028 | ) | 14.33 | |||||||||||||||||||
Forfeited | — | — | (286,907 | ) | 15.48 | ||||||||||||||||||||
Expired | (16,537 | ) | 23.20 | (99,269 | ) | 24.55 | |||||||||||||||||||
Outstanding at December 31, 2017 | 850,516 | $ | 21.54 | $ | 0.1 | 4.0 | 4,901,739 | $ | 18.36 | $ | 5.7 | 4.7 | |||||||||||||
Exercisable at December 31, 2017 | 850,516 | $ | 21.54 | $ | 0.1 | 4.0 | 2,224,961 | $ | 20.52 | $ | 1.7 | 4.2 | |||||||||||||
The aggregate intrinsic value in the table above represents the difference between the Company's closing stock price on December 31, 2017 and the exercise price of each SSAR and stock option, multiplied by the number of in-the-money awards.
Unrecognized compensation expense related to stock options not yet exercisable at December 31, 2017 was $7.3 million. This cost is expected to be recognized over a weighted-average period of 1.2 years. There was no unrecognized compensation expense related to SSARs at December 31, 2017.
83
NOTES TO CONSOLIDATED FINANCIAL STATEMENTS | ||
Other information regarding the exercise of SSARs and stock options is listed below:
Years Ended December 31, | |||||||||||
(in millions) | 2017 | 2016 | 2015 | ||||||||
SSARs | |||||||||||
Fair value of SSARs that are exercisable | $ | 1.9 | $ | 1.9 | $ | 0.6 | |||||
Aggregate intrinsic value of SSARs exercised | $ | 0.2 | $ | 0.1 | $ | 0.1 | |||||
Stock Options | |||||||||||
Cash received by Knowles for exercise of stock options | $ | 3.3 | $ | — | $ | — | |||||
Aggregate intrinsic value of options exercised | $ | 1.1 | $ | — | $ | — | |||||
RSUs
The following table summarizes the Company's RSU balances for the year ended December 31, 2017:
Share units | Weighted-average grant date fair value | |||||
Unvested at December 31, 2016 | 2,074,998 | $ | 14.94 | |||
Granted | 1,375,335 | 18.55 | ||||
Vested | (821,620 | ) | 16.11 | |||
Forfeited | (426,137 | ) | 15.77 | |||
Unvested at December 31, 2017 | 2,202,576 | $ | 16.54 | |||
At December 31, 2017, $23.1 million of unrecognized compensation expense related to RSUs is expected to be recognized over a weighted-average period of 1.4 years.
PSUs
In February 2017, the Company granted PSUs to senior management. The PSUs are awards that are subject to both performance and market conditions and provide the recipient with Knowles stock upon vesting. The awards vest three years subsequent to the initial grant date. The performance condition of the award is based on the Company's financial performance while the award's market condition relates to the Company's stock performance. Given the conditional nature of the PSU awards, the recipients can receive an award of the Company's common stock that can range from 0% to 225% of the initial grant value and is based on the level of achievement of the specified conditions. The Company will ratably recognize the expense over the requisite service period of the PSU and adjust the expense as appropriate. The fair value of the PSUs is determined by using a binomial model simulation.
The following table summarizes the Company's PSU balances for the year ended December 31, 2017:
Share units | Weighted-average grant date fair value | |||||
Unvested at December 31, 2016 | — | $ | — | |||
Granted | 176,000 | 15.32 | ||||
Vested | — | — | ||||
Forfeited | — | — | ||||
Unvested at December 31, 2017 | 176,000 | $ | 15.32 | |||
At December 31, 2017, $2.0 million of unrecognized compensation expense related to PSUs is expected to be recognized over a weighted-average period of 2.1 years.
84
NOTES TO CONSOLIDATED FINANCIAL STATEMENTS | ||
14. Commitments and Contingent Liabilities
From time to time, the Company is involved in various legal proceedings and claims arising in the ordinary course of its business, including those related to intellectual property, which may be owned by it or others. The Company owns many patents covering products, technology, and manufacturing processes. Some of these patents have been and may continue to be challenged by others. In appropriate cases, the Company has taken and will take steps to protect and defend its patents and other intellectual property, including through the use of legal proceedings in various jurisdictions around the world. Such steps have resulted in and may continue to result in retaliatory legal proceedings, including litigation or other legal proceedings in various jurisdictions and forums around the world alleging infringement by the Company of patents owned by others. The costs of investigations and legal proceedings, particularly multi-forum litigation, relating to the enforcement and defense of the Company’s intellectual property, may be substantial. Additionally, in multi-forum disputes, the Company may incur adverse judgments with regard to certain claims in certain jurisdictions and forums while still contesting other related claims against the same opposing party in other jurisdictions and forums. Although the ultimate outcome of any legal proceeding or claim cannot be predicted with certainty, based on present information, including management’s assessment of the merits of the particular claim, the Company does not expect that any asserted or unasserted legal proceedings or claims, individually or in the aggregate, will have a material adverse effect on its cash flow, results of operations, or financial condition.
Intellectual Property Infringement Claims
The Company may, on a limited customer specific basis, provide contractual indemnities for certain losses that arise out of claims that its products infringe on the intellectual property of others. Historically, the Company has not made significant payments under such indemnity arrangements. The Company’s legal accruals were not significant at December 31, 2017 and 2016.
Lease Commitments
The Company leases certain facilities and equipment under operating leases, many of which contain renewal options. Total rental expense for all operating leases, net of sublease rental income, was $6.8 million, $7.8 million, and $10.2 million for the years ended December 31, 2017, 2016, and 2015, respectively. Total sublease rental income was $2.2 million and $1.3 million for the years ended December 31, 2017 and 2016, respectively. There was no sublease rental income for the year ended December 31, 2015. Contingent rentals under the operating leases were not significant.
In September 2013, the Company entered into an agreement for two new facilities and related equipment in China. The lease for one of the facilities and related equipment began in the fourth quarter of 2014. The Company took possession of the second facility and remaining equipment in 2015. The facilities are reflected in the operating leases and the equipment is reflected in the capital leases in the table below.
The aggregate future minimum lease payments for capital leases, operating leases, and rental commitments as of December 31, 2017 are as follows:
(in millions) | Capital Leases | Operating Leases | |||||
2018 | $ | 2.4 | $ | 9.2 | |||
2019 | 2.4 | 8.8 | |||||
2020 | 2.4 | 8.2 | |||||
2021 | 2.4 | 8.0 | |||||
2022 | 2.4 | 7.2 | |||||
2023 and thereafter | 5.3 | 18.5 | |||||
Total minimum lease payments | 17.3 | 59.9 | |||||
Less sublease rental income | — | (10.5 | ) | ||||
Net minimum lease payments | 17.3 | $ | 49.4 | ||||
Less imputed interest | (2.5 | ) | |||||
Present value of capital lease obligations | $ | 14.8 | |||||
85
NOTES TO CONSOLIDATED FINANCIAL STATEMENTS | ||
15. Employee Benefit Plans
Knowles sponsors its own defined contribution plan. The Company's expense relating to the defined contribution plan was $6.4 million, $6.1 million, and $5.0 million for the years ended December 31, 2017, 2016, and 2015, respectively.
Knowles sponsors three defined benefit pension plans to certain non-U.S. employees (two in the United Kingdom and one in Taiwan). All three plans are closed to new participants; however, all active participants in these plans continue to accrue benefits. These plans are considered direct obligations of the Company and have been recorded within the accompanying Consolidated Financial Statements.
The Company does not have any other post-retirement employee benefit plans other than the plans mentioned above and the non-qualified supplemental retirement plan discussed below.
86
NOTES TO CONSOLIDATED FINANCIAL STATEMENTS | ||
Non-U.S. Defined Benefit Pension Plans
Obligations and Funded Status
The following tables summarize the balance sheet impact, including the benefit obligations, assets, and funded status associated with the Company's three defined benefit plans for non-U.S. participants at December 31, 2017 and 2016.
December 31, | |||||||
(in millions) | 2017 | 2016 | |||||
Change in benefit obligation: | |||||||
Benefit obligation at beginning of year | $ | 52.4 | $ | 51.0 | |||
Service cost | 0.3 | 0.2 | |||||
Interest cost | 1.5 | 1.6 | |||||
Benefits paid | (1.5 | ) | (1.7 | ) | |||
Actuarial loss | 0.5 | 10.1 | |||||
Plan amendments | 0.3 | — | |||||
Settlements and curtailments | — | (0.2 | ) | ||||
Currency translation and other | 4.4 | (8.6 | ) | ||||
Benefit obligation at end of year | 57.9 | 52.4 | |||||
Change in plan assets: | |||||||
Fair value of plan assets at beginning of year | 43.8 | 45.1 | |||||
Actual return on plan assets | 4.4 | 6.7 | |||||
Company contributions | 1.5 | 1.7 | |||||
Benefits paid | (1.5 | ) | (1.7 | ) | |||
Settlements and curtailments | — | (0.2 | ) | ||||
Currency translation and other | 3.6 | (7.8 | ) | ||||
Fair value of plan assets at end of year | 51.8 | 43.8 | |||||
Funded status | $ | (6.1 | ) | $ | (8.6 | ) | |
Amounts recognized in the Consolidated Balance Sheets consist of: | |||||||
Other assets and deferred charges | $ | 0.4 | $ | — | |||
Other liabilities | (6.5 | ) | (8.6 | ) | |||
Funded status | $ | (6.1 | ) | $ | (8.6 | ) | |
Accumulated Other Comprehensive Loss: | |||||||
Net actuarial losses | $ | 18.4 | $ | 20.1 | |||
Prior service cost | 0.3 | — | |||||
Deferred taxes | (3.6 | ) | (3.6 | ) | |||
Total Accumulated Other Comprehensive Loss, net of tax | 15.1 | 16.5 | |||||
Net amount recognized | $ | 9.0 | $ | 7.9 | |||
Accumulated benefit obligation | $ | 57.0 | $ | 51.3 | |||
87
NOTES TO CONSOLIDATED FINANCIAL STATEMENTS | ||
Pension plans with accumulated benefit obligations in excess of plan assets consisted of the following at December 31, 2017 and 2016:
December 31, | |||||||
(in millions) | 2017 | 2016 | |||||
Projected benefit obligation | $ | 35.3 | $ | 32.6 | |||
Accumulated benefit obligation | 34.8 | 31.9 | |||||
Fair value of plan assets | 28.8 | 24.2 | |||||
Net Periodic Benefit Cost (Income)
Components of the net periodic benefit cost (income) were as follows:
Years Ended December 31, | |||||||||||
(in millions) | 2017 | 2016 | 2015 | ||||||||
Service cost | $ | 0.3 | $ | 0.2 | $ | 0.2 | |||||
Interest cost | 1.5 | 1.6 | 2.0 | ||||||||
Expected return on plan assets | (2.7 | ) | (2.4 | ) | (2.9 | ) | |||||
Amortization of recognized actuarial loss | 0.5 | 0.3 | 0.4 | ||||||||
Settlement and curtailment loss | — | — | 0.1 | ||||||||
Total net periodic benefit income | $ | (0.4 | ) | $ | (0.3 | ) | $ | (0.2 | ) | ||
The Company expects to amortize an actuarial loss of $0.5 million from accumulated other comprehensive loss into net periodic benefit cost (income) during the year ended December 31, 2018.
Assumptions
The Company determines actuarial assumptions on an annual basis. The actuarial assumptions used for the Company’s three defined benefit plans for non-U.S. participants will vary depending on the applicable country and as such, the tables below include these assumptions by country, as well as in total.
The assumptions used in determining the benefit obligations were as follows:
December 31, | |||||
2017 | 2016 | ||||
Discount rate | |||||
Taiwan | 1.25 | % | 1.50 | % | |
United Kingdom | 2.44 | % | 2.65 | % | |
Weighted-average | 2.40 | % | 2.60 | % | |
Average wage increase | |||||
Taiwan | 4.00 | % | 4.00 | % | |
United Kingdom | 4.50 | % | 4.60 | % | |
Weighted-average | 4.46 | % | 4.55 | % | |
88
NOTES TO CONSOLIDATED FINANCIAL STATEMENTS | ||
The assumptions used in determining the net periodic benefit cost (income) were as follows:
Years Ended December 31, | ||||||||
2017 | 2016 | 2015 | ||||||
Discount rate | ||||||||
Taiwan | 1.50 | % | 1.10 | % | 2.00 | % | ||
United Kingdom | 2.64 | % | 3.90 | % | 3.75 | % | ||
Weighted-average | 2.60 | % | 3.72 | % | 3.66 | % | ||
Average wage increase | ||||||||
Taiwan | 4.00 | % | 4.00 | % | 4.00 | % | ||
United Kingdom | 4.60 | % | 4.25 | % | 4.25 | % | ||
Weighted-average | 4.55 | % | 4.16 | % | 4.23 | % | ||
Expected return on plan assets | ||||||||
Taiwan | 1.75 | % | 1.50 | % | 1.50 | % | ||
United Kingdom | 5.90 | % | 6.50 | % | 6.53 | % | ||
Weighted-average | 5.80 | % | 6.42 | % | 6.38 | % | ||
The Company’s discount rate assumption is determined by developing a yield curve based on high quality corporate bonds with maturities matching the plans’ expected benefit payment streams. The plans’ expected cash flows are then discounted by the resulting year-by-year spot rates.
Plan Assets
The primary financial objective of the plans is to secure participant retirement benefits. Accordingly, the key objective in the plans’ financial management is to promote stability and, to the extent appropriate, growth in the funded status. Related and supporting financial objectives are established in conjunction with a review of current and projected plan financial requirements.
As it relates to the funded defined benefit pension plans, the Company’s funding policy is consistent with the funding requirements of applicable local non-U.S. laws. The Company is responsible for overseeing the management of the investments of the plans’ assets and otherwise ensuring that the plans’ investment programs are in compliance with applicable local law, other relevant legislation, and related plan documents. Where relevant, the Company has retained professional investment managers to manage the plans’ assets and implement the investment process. The investment managers, in implementing their investment processes, have the authority and responsibility to select appropriate investments in the asset classes specified by the terms of their applicable prospectus or investment manager agreements with the plans.
The assets of the plans are invested to achieve an appropriate return for the plans consistent with a prudent level of risk. The asset return objective is to achieve, as a minimum over time, the passively managed return earned by market index funds, weighted in the proportions outlined by the asset class exposures identified in the plans’ strategic allocation. The expected return on assets assumption used for pension expense is developed through analysis of historical market returns, statistical analysis, current market conditions, and the past experience of plan asset investments.
Fair Value Measurements
ASC 820, Fair Value Measurement, establishes a fair value hierarchy that requires the Company to maximize the use of observable inputs and minimize the use of unobservable inputs when measuring fair value. A financial instrument’s categorization within the hierarchy is based on the lowest level of input that is significant to the fair value measurement. ASC 820 establishes three levels of inputs that may be used to measure fair value as follows:
Level 1 - Quoted prices (unadjusted) in active markets for identical assets or liabilities.
Level 2 - Observable inputs other than quoted prices included in Level 1, such as quoted prices in active markets for similar assets and liabilities, quoted prices for identical or similar assets or liabilities in markets that are not active, or other inputs that are observable or can be corroborated by observable market data for substantially the full term of assets or liabilities.
89
NOTES TO CONSOLIDATED FINANCIAL STATEMENTS | ||
Level 3 - Unobservable inputs for which little or no market data exists, therefore, requiring an entity to develop its own assumptions.
The fair values of plan assets by asset category within the ASC 820 hierarchy were as follows at December 31, 2017 and 2016:
December 31, 2017 | December 31, 2016 | ||||||||||||||||||||||||||||||
(in millions) | Level 1 | Level 2 | Level 3 | Total Fair Value | Level 1 | Level 2 | Level 3 | Total Fair Value | |||||||||||||||||||||||
Asset category: | |||||||||||||||||||||||||||||||
Fixed income investments | $ | 2.3 | $ | 12.7 | $ | — | $ | 15.0 | $ | 2.5 | $ | 10.5 | $ | — | $ | 13.0 | |||||||||||||||
Common stock funds | — | 21.9 | — | 21.9 | — | 18.7 | — | 18.7 | |||||||||||||||||||||||
Real estate funds | — | 3.5 | — | 3.5 | — | — | — | — | |||||||||||||||||||||||
Cash and equivalents | 0.1 | 0.9 | — | 1.0 | 0.2 | 3.3 | — | 3.5 | |||||||||||||||||||||||
Other | 6.8 | 3.6 | — | 10.4 | 5.1 | 3.5 | — | 8.6 | |||||||||||||||||||||||
Total | $ | 9.2 | $ | 42.6 | $ | — | $ | 51.8 | $ | 7.8 | $ | 36.0 | $ | — | $ | 43.8 | |||||||||||||||
There were no significant transfers between Level 1 and Level 2 assets during the years ended December 31, 2017 and 2016.
Fixed income investments include government and municipal securities and corporate bonds, which are valued based on yields currently available on comparable securities of issuers with similar credit ratings.
Common stock funds consist of mutual funds and collective trusts. Mutual funds are valued by obtaining quoted prices from nationally recognized securities exchanges. Collective trusts are valued using Net Asset Value (the "NAV") as of the last business day of the year. The NAV is based on the underlying value of the assets owned by the fund minus its liabilities and then divided by the number of shares outstanding. The value of the underlying assets is based on quoted prices in active markets.
The methods described above may produce a fair value calculation that may not be indicative of net realizable value or reflective of future fair values. Furthermore, while the Company believes its valuation methods are appropriate and consistent with other market participants, the use of different methodologies or assumptions to determine the fair value of certain financial instruments could result in a different fair value measurement at the reporting date.
Future Estimates
Benefit Payments
Estimated future benefit payments to retirees, which reflect expected future service, are as follows:
(in millions) | |||
2018 | $ | 1.7 | |
2019 | 1.6 | ||
2020 | 1.7 | ||
2021 | 1.7 | ||
2022 | 1.8 | ||
2023-2027 | 10.9 | ||
Contributions
Generally, annual contributions are made at such times and in such amounts as required by law and agreed with the trustees of the non-U.S. defined benefit plans. The Company estimates it will pay $1.8 million during the year ended December 31, 2018 related to contributions to these plans. This amount may vary based on updated funding agreements with the Trustees of these plans.
90
NOTES TO CONSOLIDATED FINANCIAL STATEMENTS | ||
Non-qualified Supplemental Retirement Plan
Knowles provides to certain management employees, through non-qualified plans, supplemental retirement benefits in excess of qualified plan limits imposed by federal tax law. Effective December 31, 2013, the Company's participants no longer accrue benefits. The net amount recognized on the balance sheet at December 31, 2017 is shown in the table below:
(in millions) | December 31, 2017 | ||
Accrued compensation and employee benefits | $ | (0.2 | ) |
Other liabilities | (1.6 | ) | |
Total Accumulated Other Comprehensive Loss, net of tax | 0.2 | ||
Net amount recognized | $ | (1.6 | ) |
The actuarial loss arising during the year ended December 31, 2017 was $0.1 million ($0.1 million net of tax). The amortization of prior service cost included in net periodic pension cost (income) during the year ended December 31, 2017 was $0.1 million ($0.1 million net of tax).
16. Other Comprehensive Earnings (Loss)
The amounts recognized in other comprehensive earnings (loss) were as follows:
Year Ended December 31, 2017 | |||||||||||
(in millions) | Pre-tax | Tax | Net of tax | ||||||||
Foreign currency translation | $ | 27.1 | $ | — | $ | 27.1 | |||||
Employee benefit plans | 1.3 | — | 1.3 | ||||||||
Changes in fair value of cash flow hedges | 4.4 | (0.7 | ) | 3.7 | |||||||
Total other comprehensive earnings | $ | 32.8 | $ | (0.7 | ) | $ | 32.1 | ||||
Year Ended December 31, 2016 | |||||||||||
(in millions) | Pre-tax | Tax | Net of tax | ||||||||
Foreign currency translation | $ | 0.8 | $ | — | $ | 0.8 | |||||
Employee benefit plans | (5.0 | ) | (0.1 | ) | (5.1 | ) | |||||
Changes in fair value of cash flow hedges | (2.2 | ) | 0.6 | (1.6 | ) | ||||||
Total other comprehensive loss | $ | (6.4 | ) | $ | 0.5 | $ | (5.9 | ) | |||
Year Ended December 31, 2015 | |||||||||||
(in millions) | Pre-tax | Tax | Net of tax | ||||||||
Foreign currency translation | $ | (71.7 | ) | $ | — | $ | (71.7 | ) | |||
Employee benefit plans | 0.2 | — | 0.2 | ||||||||
Changes in fair value of cash flow hedges | (1.4 | ) | — | (1.4 | ) | ||||||
Total other comprehensive loss | $ | (72.9 | ) | $ | — | $ | (72.9 | ) | |||
91
NOTES TO CONSOLIDATED FINANCIAL STATEMENTS | ||
The following table summarizes the changes in balances of each component of accumulated other comprehensive loss, net of tax during the years ended December 31, 2017 and 2016.
(in millions) | Cash flow hedges | Employee benefit plans | Cumulative foreign currency translation adjustments | Total | ||||||||||||
Balance at December 31, 2015 | $ | (1.6 | ) | $ | (11.5 | ) | $ | (113.1 | ) | $ | (126.2 | ) | ||||
Other comprehensive (loss) earnings, net of tax | (1.6 | ) | (5.1 | ) | 0.8 | (5.9 | ) | |||||||||
Balance at December 31, 2016 | (3.2 | ) | (16.6 | ) | (112.3 | ) | (132.1 | ) | ||||||||
Other comprehensive earnings, net of tax | 3.7 | 1.3 | 27.1 | 32.1 | ||||||||||||
Balance at December 31, 2017 | $ | 0.5 | $ | (15.3 | ) | $ | (85.2 | ) | $ | (100.0 | ) | |||||
The amounts amortized from accumulated other comprehensive loss to earnings during the years ended December 31, 2017, 2016, and 2015 were as follows:
Years Ended December 31, | |||||||||||
(in millions) | 2017 | 2016 | 2015 | ||||||||
Pension and post-retirement benefit plans: | |||||||||||
Amortization or settlement of actuarial losses and prior service costs | $ | 0.6 | $ | 0.5 | $ | 0.8 | |||||
Tax benefit | — | — | — | ||||||||
Net of tax | $ | 0.6 | $ | 0.5 | $ | 0.8 | |||||
Cash flow hedges: | |||||||||||
Net losses reclassified into earnings | $ | 0.5 | $ | 1.0 | $ | — | |||||
Tax benefit | (0.2 | ) | (0.1 | ) | — | ||||||
Net of tax | $ | 0.3 | $ | 0.9 | $ | — | |||||
The Company recognizes net periodic pension cost (income), which includes amortization of net actuarial losses and prior service costs, in both Selling and administrative expenses and Cost of goods sold, depending on the functional area of the underlying employees included in the plans.
17. Segment Information
In January 2017, the Company changed its allocation of resources and its internal reporting structure to facilitate delivering growth in its core business. The Company’s operating segments engage in business activities from which they earn revenues and incur expenses, have discrete financial information available, and whose financial results are regularly reviewed and used by the chief operating decision maker to evaluate segment performance, allocate resources, and determine management incentive compensation. The Audio segment aggregates two operating segments into one reportable segment based on similar product applications serving our key end markets. The PD segment has one operating segment, which equals its reportable segment. The realignment did not change the composition of the Company’s reporting units for goodwill impairment testing purposes. Given these changes, beginning in January 2017, the Company's two reportable segments are as follows:
• Audio Segment
Our Audio group designs and manufactures innovative audio products, including microphones and balanced armature speakers, signal processing technologies, and software and algorithms used in applications that serve the mobile, ear, and IoT markets. Locations include the sales, support, and engineering facilities in North America, Europe, and Asia, as well as the manufacturing facilities in Asia.
92
NOTES TO CONSOLIDATED FINANCIAL STATEMENTS | ||
• PD Segment
Our PD group specializes in the design and delivery of highly engineered capacitors and RF devices for technically demanding applications. Our devices are used in applications including power supplies, radar, medical implants, and satellites, serving the industrial, defense, aerospace, medical, and telecommunications markets. Locations include sales, support, engineering, and manufacturing facilities in North America, Europe, and Asia.
The Company organizes its reportable segments based on how management analyzes performance, allocates capital, and makes strategic and operational decisions. These segments were determined in accordance with ASC 280, Segment Reporting. The segments are aligned around similar product applications serving our key end markets, to enhance focus on end market growth strategies. Historical financial segment information has been recast to conform to the new segment presentation.
Information regarding the Company's reportable segments is as follows:
Years Ended December 31, | |||||||||||
(in millions) | 2017 | 2016 | 2015 | ||||||||
Revenues: | |||||||||||
Audio | $ | 637.4 | $ | 661.9 | $ | 654.3 | |||||
Precision Devices | 106.8 | 93.8 | 99.3 | ||||||||
Total consolidated revenues | $ | 744.2 | $ | 755.7 | $ | 753.6 | |||||
Earnings from continuing operations before interest and income taxes: | |||||||||||
Audio | $ | 76.1 | $ | 88.8 | $ | 84.7 | |||||
Precision Devices | 19.2 | 12.4 | 5.4 | ||||||||
Total segments | 95.3 | 101.2 | 90.1 | ||||||||
Corporate expense / other | 55.3 | 52.7 | 56.8 | ||||||||
Interest expense, net | 20.6 | 20.4 | 12.7 | ||||||||
Earnings before income taxes and discontinued operations | 19.4 | 28.1 | 20.6 | ||||||||
Provision for income taxes | 12.9 | 8.3 | 3.2 | ||||||||
Earnings from continuing operations | $ | 6.5 | $ | 19.8 | $ | 17.4 | |||||
Depreciation and amortization: | |||||||||||
Audio | $ | 45.2 | $ | 61.4 | $ | 65.1 | |||||
Precision Devices | 5.6 | 4.3 | 4.6 | ||||||||
Corporate | 3.0 | 3.3 | 2.7 | ||||||||
Total | $ | 53.8 | $ | 69.0 | $ | 72.4 | |||||
Capital expenditures: | |||||||||||
Audio | $ | 43.6 | $ | 27.8 | $ | 26.5 | |||||
Precision Devices | 5.4 | 3.1 | 4.0 | ||||||||
Corporate | 0.5 | 1.3 | 6.3 | ||||||||
Total | $ | 49.5 | $ | 32.2 | $ | 36.8 | |||||
Research and development: | |||||||||||
Audio | $ | 89.0 | $ | 89.2 | $ | 79.5 | |||||
Precision Devices | 4.2 | 2.7 | 3.7 | ||||||||
Corporate | 0.2 | 0.1 | — | ||||||||
Total | $ | 93.4 | $ | 92.0 | $ | 83.2 | |||||
93
NOTES TO CONSOLIDATED FINANCIAL STATEMENTS | ||
Information regarding assets of the Company's reportable segments:
Total Assets | |||||||
December 31, | |||||||
(in millions) | 2017 | 2016 | |||||
Audio | $ | 1,430.9 | $ | 1,348.5 | |||
Precision Devices | 103.4 | 84.1 | |||||
Corporate / eliminations | 13.8 | 2.3 | |||||
Discontinued operations | 1.7 | 80.1 | |||||
Total | $ | 1,549.8 | $ | 1,515.0 | |||
The following table details revenues by geographic location. Revenues are attributed to regions based on the location of the Company's direct customer, which in some instances is an intermediary and not necessarily the end user. Long-lived assets are comprised of net property, plant, and equipment. These assets have been classified based on the geographic location of where they reside. The Company's businesses are based primarily in Asia, North America, and Europe.
Revenues | Long-Lived Assets | ||||||||||||||||||
Years Ended December 31, | December 31, | ||||||||||||||||||
(in millions) | 2017 | 2016 | 2015 | 2017 | 2016 | ||||||||||||||
Asia | $ | 560.8 | $ | 578.7 | $ | 564.9 | $ | 144.9 | $ | 130.4 | |||||||||
United States | 101.3 | 93.3 | 103.1 | 37.2 | 41.4 | ||||||||||||||
Europe | 72.3 | 75.1 | 77.1 | 0.9 | 1.1 | ||||||||||||||
Other Americas | 4.4 | 3.1 | 3.6 | — | — | ||||||||||||||
Other | 5.4 | 5.5 | 4.9 | — | — | ||||||||||||||
Total | $ | 744.2 | $ | 755.7 | $ | 753.6 | $ | 183.0 | $ | 172.9 | |||||||||
For the year ended December 31, 2017, revenues from two customers of the Audio segment, Apple Inc. and Samsung Electronics Co., Ltd., represented approximately 22% and 12%, respectively, of total segment revenues. For the year ended December 31, 2016, revenues from two customers of the Audio segment, Apple Inc. and Samsung Electronics Co., Ltd., represented approximately 23% and 13%, respectively, of total segment revenues. For the year ended December 31, 2015, revenues from two customers of the Audio segment, Apple Inc. and Samsung Electronics Co., Ltd., represented approximately 25% and 12%, respectively, of total segment revenues.
For the year ended December 31, 2017, revenues from St. Jude Medical, Inc. of the PD segment represented approximately 10% of total segment revenues. For the years ended December 31, 2016 and 2015, no single customer represented 10% or more of PD segment revenues.
94
NOTES TO CONSOLIDATED FINANCIAL STATEMENTS | ||
18. Earnings per Share
Basic and diluted earnings per share was computed as follows:
Years Ended December 31, | |||||||||||
(in millions, except share and per share amounts) | 2017 (1) | 2016 (1) | 2015 (1)(2) | ||||||||
Earnings from continuing operations | $ | 6.5 | $ | 19.8 | $ | 17.4 | |||||
Earnings (loss) from discontinued operations, net | 61.8 | (62.1 | ) | (251.2 | ) | ||||||
Net earnings (loss) | $ | 68.3 | $ | (42.3 | ) | $ | (233.8 | ) | |||
Basic earnings (loss) per common share: | |||||||||||
Earnings from continuing operations | $ | 0.07 | $ | 0.22 | $ | 0.20 | |||||
Earnings (loss) from discontinued operations, net | $ | 0.69 | $ | (0.70 | ) | $ | (2.89 | ) | |||
Net earnings (loss) | $ | 0.76 | $ | (0.48 | ) | $ | (2.69 | ) | |||
Weighted-average shares outstanding | 89,329,794 | 88,667,098 | 86,802,828 | ||||||||
Diluted earnings (loss) per common share: | |||||||||||
Earnings from continuing operations | $ | 0.07 | $ | 0.22 | $ | 0.20 | |||||
Earnings (loss) from discontinued operations, net | $ | 0.68 | $ | (0.69 | ) | $ | (2.89 | ) | |||
Net earnings (loss) | $ | 0.75 | $ | (0.47 | ) | $ | (2.69 | ) | |||
Diluted weighted-average shares outstanding | 90,490,007 | 89,182,967 | 86,992,254 | ||||||||
(1) For the years ended December 31, 2017, 2016, and 2015, the weighted-average number of anti-dilutive potential common shares excluded from the calculation of diluted earnings per share above was 3,944,160, 5,080,023, and 3,357,320, respectively.
(2) On July 1, 2015, the Company issued 3.2 million shares to former holders of Audience shares and for the conversion of vested in-the-money Audience stock options. The Company also converted unvested in-the-money Audience stock options and restricted stock units for an aggregate of 461,371 shares of its common stock.
19. Quarterly Data (Unaudited)
(in millions, except per share amounts) | Continuing Operations | Net Earnings (Loss) | |||||||||||||||||||||||||||||
Quarter | Revenues | Gross Profit | Earnings (Loss) | Per Share - Basic | Per Share - Diluted | Earnings (Loss) | Per Share - Basic | Per Share - Diluted | |||||||||||||||||||||||
2017 | |||||||||||||||||||||||||||||||
First | $ | 168.3 | $ | 59.3 | $ | (5.0 | ) | $ | (0.06 | ) | $ | (0.06 | ) | $ | (3.2 | ) | $ | (0.04 | ) | $ | (0.04 | ) | |||||||||
Second | 164.4 | 63.2 | (30.9 | ) | (0.35 | ) | (0.35 | ) | (29.7 | ) | (0.33 | ) | (0.33 | ) | |||||||||||||||||
Third | 196.0 | 74.2 | 10.5 | 0.12 | 0.12 | 15.7 | 0.18 | 0.17 | |||||||||||||||||||||||
Fourth | 215.5 | 89.6 | 31.9 | 0.36 | 0.35 | 85.5 | 0.96 | 0.94 | |||||||||||||||||||||||
2016 | |||||||||||||||||||||||||||||||
First | $ | 161.1 | $ | 59.6 | $ | (10.8 | ) | $ | (0.12 | ) | $ | (0.12 | ) | $ | (29.4 | ) | $ | (0.33 | ) | $ | (0.33 | ) | |||||||||
Second | 165.2 | 64.9 | (6.8 | ) | (0.08 | ) | (0.08 | ) | (24.6 | ) | (0.28 | ) | (0.28 | ) | |||||||||||||||||
Third | 216.5 | 86.2 | 21.0 | 0.24 | 0.24 | (7.6 | ) | (0.08 | ) | (0.08 | ) | ||||||||||||||||||||
Fourth | 212.9 | 85.2 | 16.4 | 0.18 | 0.18 | 19.3 | 0.21 | 0.22 | |||||||||||||||||||||||
95
NOTES TO CONSOLIDATED FINANCIAL STATEMENTS | ||
20. Subsequent Events
On January 19, 2018, the Company acquired substantially all of the assets of Compex Corporation for $16.0 million, subject to purchase price adjustments for working capital. The acquired business provides single layer electronic components to the RF, microwave, telecommunication, fiber optics, defense, and aerospace markets. The acquisition’s operations will be included in the PD segment. The transaction will be accounted for under the acquisition method of accounting. Further disclosure regarding the acquisition has not been provided as the purchase price allocation was not complete prior to the issuance of these financial statements.
SCHEDULE II
VALUATION AND QUALIFYING ACCOUNTS
Years Ended December 31, 2017, 2016, and 2015
Allowance for Doubtful Accounts (in millions) | Balance at Beginning of Year | Charged to Cost and Expense (1) | Accounts Written Off | Balance at End of Year | ||||||||||
Year Ended December 31, 2017 | ||||||||||||||
Allowance for Doubtful Accounts | $ | 1.5 | 0.2 | (1.0 | ) | $ | 0.7 | |||||||
Year Ended December 31, 2016 | ||||||||||||||
Allowance for Doubtful Accounts | $ | 1.5 | 0.1 | (0.1 | ) | $ | 1.5 | |||||||
Year Ended December 31, 2015 | ||||||||||||||
Allowance for Doubtful Accounts | $ | 0.4 | 1.1 | — | $ | 1.5 | ||||||||
(1) Net of recoveries on previously reserved or written-off balances. | ||||||||||||||
Deferred Tax Valuation Allowance (in millions) | Balance at Beginning of Year | Additions | Reductions | Balance at End of Year | ||||||||||
Year Ended December 31, 2017 | ||||||||||||||
Deferred Tax Valuation Allowance | $ | 161.3 | — | (61.6 | ) | $ | 99.7 | |||||||
Year Ended December 31, 2016 | ||||||||||||||
Deferred Tax Valuation Allowance | $ | 127.4 | 33.9 | — | $ | 161.3 | ||||||||
Year Ended December 31, 2015 | ||||||||||||||
Deferred Tax Valuation Allowance | $ | 48.9 | 78.5 | — | $ | 127.4 | ||||||||
ITEM 9. CHANGES IN AND DISAGREEMENTS WITH ACCOUNTANTS ON ACCOUNTING AND FINANCIAL DISCLOSURE
None.
ITEM 9A. CONTROLS AND PROCEDURES
(a) Evaluation of Disclosure Controls and Procedures
We conducted an evaluation, under the supervision and with the participation of management, including the chief executive officer (“CEO”) and chief financial officer (“CFO”), of the effectiveness of the Company’s disclosure controls and procedures as of the end of the period covered by this annual report.
These disclosure controls and procedures are designed to ensure that information required to be disclosed in our reports that are filed or submitted under the Exchange Act is recorded, processed, summarized and reported within the time periods specified in the SEC’s rules and forms. Our disclosure controls and procedures include, without limitation, controls and procedures designed to ensure that this information is accumulated and communicated to management, including the principal executive and principal financial officers, or persons performing similar functions, as appropriate, to allow timely decisions regarding required disclosure.
96
Based on the evaluation, the CEO and CFO have concluded that these disclosure controls and procedures were effective as of December 31, 2017, the end of the period covered by this annual report.
(b) Management's Report on Internal Control Over Financial Reporting
Our management is responsible for establishing and maintaining adequate internal control over financial reporting (as defined in Rules 13a-15(f) and 15d-15(f) under the Exchange Act). Under management’s supervision, an evaluation of the effectiveness of the Company’s internal control over financial reporting was conducted based on the criteria set forth in Internal Control - Integrated Framework (2013) issued by the Committee of Sponsoring Organizations of the Treadway Commission (“COSO”). Based on our evaluation under the framework in Internal Control - Integrated Framework (2013) issued by the COSO, our management concluded that our internal control over financial reporting was effective as of December 31, 2017.
PricewaterhouseCoopers LLP, the Company’s independent registered public accounting firm, has audited the effectiveness of the Company’s internal control over financial reporting as of December 31, 2017, as stated in their report which appears herein.
(c) Changes in Internal Control Over Financial Reporting
There has been no change in our internal control over financial reporting that occurred during the fourth quarter of 2017 that has materially affected, or is reasonably likely to materially affect, our internal control over financial reporting.
(d) Inherent Limitations on Effectiveness of Controls
Our management, including the CEO and CFO, do not expect that our disclosure controls or our internal control over financial reporting will prevent or detect all errors and all fraud. A control system, no matter how well designed and operated, can provide only reasonable, not absolute, assurance that the control system’s objectives will be met. The design of a control system must reflect the fact that the benefits of controls must be considered relative to their costs. Further, because of the inherent limitations in all control systems, no evaluation of controls can provide absolute assurance that misstatements due to error or fraud will not occur or that all control issues and instances of fraud, if any, will be detected. These inherent limitations include the realities that judgments in decision making can be faulty and that breakdowns can occur because of simple error or mistake. Controls can also be circumvented by the individual acts of some persons, by intentionally falsified documentation, by collusion of two or more individuals within Knowles or third parties, or by management override of the controls. The design of any system of controls is based in part on certain assumptions about the likelihood of future events and there can be no assurance that any design will succeed in achieving its stated goals under all potential future conditions. Projections of any evaluation of controls effectiveness to future periods are subject to risks. Over time, controls may become inadequate because of changes in conditions or deterioration in the degree of compliance with policies or procedures.
ITEM 9B. OTHER INFORMATION
Not applicable.
PART III
ITEM 10. DIRECTORS, EXECUTIVE OFFICERS, AND CORPORATE GOVERNANCE
The information with respect to the directors and the board committees of the Company required to be included pursuant to this Item 10 will be included in the Proxy Statement for its 2018 Annual Meeting of Stockholders (the "2018 Proxy Statement") that will be filed with the SEC pursuant to Rule 14a-6 under the Exchange Act in accordance with applicable SEC deadlines and is incorporated in this Item 10 by reference.
The information with respect to the executive officers of the Company required to be included pursuant to this Item 10 is included under the caption “Executive Officers of the Registrant” in Part I of this Form 10-K and is incorporated in this Item 10 by reference.
The information with respect to Section 16(a) reporting compliance required to be included in this Item 10 will be included in our 2018 Proxy Statement and is incorporated in this Item 10 by reference.
97
The Company has adopted a code of ethics that applies to its chief executive officer and senior financial officers. A copy of this code of ethics can be found on our website at www.knowles.com. In the event of any amendment to, or waiver from, the code of ethics, we will publicly disclose the amendment or waiver by posting the information on our website or filing a Form 8-K with the SEC.
ITEM 11. EXECUTIVE COMPENSATION
The information with respect to executive compensation and the compensation committee required to be included pursuant to this Item 11 will be included in our 2018 Proxy Statement and is incorporated in this Item 11 by reference.
ITEM 12. SECURITY OWNERSHIP OF CERTAIN BENEFICIAL OWNERS AND MANAGEMENT AND RELATED STOCKHOLDER MATTERS
The information regarding security ownership of certain beneficial owners and management that is required to be included pursuant to this Item 12 will be included in our 2018 Proxy Statement and is incorporated into this Item 12 by reference.
Equity Compensation Plans
We currently maintain equity compensation plans that provide for the issuance of Knowles stock to directors, executive officers, and other employees. The following table sets forth information regarding outstanding restricted stock units, SSARs, performance share units, stock options, and shares available for future issuance under these plans as of December 31, 2017:
(a) | (b) | (c) | |||||||
Plan Category | Number of Securities to be Issued Upon Exercise of Outstanding Options, Warrants, and Rights (1) | Weighted-Average Exercise Price of Outstanding Options, Warrants, and Rights | Number of Securities Remaining Available for Future Issuance Under Equity Compensation Plans (Excluding Securities Reflected in Column (a)) (2) | ||||||
Equity compensation plans approved by stockholders | 8,192,254 | $ | 18.83 | 6,380,037 | |||||
Equity compensation plans not approved by stockholders | — | — | — | ||||||
Total | 8,192,254 | $ | 18.83 | 6,380,037 | |||||
(1) | Column (a) consists of shares issuable pursuant to outstanding restricted stock units, SSARs, performance share units, and stock option awards under the Company’s 2016 Equity and Cash Incentive Plan and 2014 Equity and Cash Incentive Plan. Restricted stock units and performance share units are not reflected in the weighted-average exercise price in column (b). |
(2) | Column (c) consists of shares available for future issuance under the 2016 Equity and Cash Incentive Plan. The 2016 Equity and Cash Incentive Plan provides for stock options and SSAR grants, restricted stock awards, restricted stock unit awards, unrestricted stock awards, performance share awards, cash performance awards, and deferred stock units. Shares subject to stock options and SSARs will reduce the shares available for awards under the 2016 Equity and Cash Incentive Plan by one share for every one share granted. Performance share awards, restricted stock, unrestricted stock, restricted stock units that are settled in shares of common stock, and deferred stock units will reduce the shares available for awards under the 2016 Equity and Cash Incentive Plan by 1.75 shares for every one share awarded. Cash performance awards do not count against the pool of available shares. The number of shares earned when an award is exercised, vested, or is paid out will count against the pool of available shares, including shares withheld to pay taxes or an option’s exercise price. Shares subject to an award under the 2016 Equity and Cash Incentive Plan and the 2014 Equity and Cash Incentive Plan that are canceled, terminated, forfeited, or that expire will be available for reissuance under the 2016 Equity and Cash Incentive Plan. |
98
ITEM 13. CERTAIN RELATIONSHIPS AND RELATED TRANSACTIONS, AND DIRECTOR INDEPENDENCE
The information with respect to director independence, related party transaction policies and any reportable transaction, business relationship, or indebtedness between the Company and the beneficial owners of more than 5% of Knowles common stock, the directors or nominees for director of the Company, the executive officers of the Company, or the members of the immediate families of such individuals that are required to be included pursuant to this Item 13, will be included in our 2018 Proxy Statement and is incorporated in this Item 13 by reference.
ITEM 14. PRINCIPAL ACCOUNTANT FEES AND SERVICES
The information with respect to the Company’s relationship with its independent registered public accounting firm and fees paid thereto required to be included pursuant to this Item 14 will be included in our 2018 Proxy Statement and is incorporated in this Item 14 by reference.
The information with respect to audit committee pre-approval policies and procedures required to be included pursuant to this Item 14 will be included in our 2018 Proxy Statement and is incorporated in this Item 14 by reference.
PART IV
ITEM 15. EXHIBITS AND FINANCIAL STATEMENT SCHEDULES
a) | The following documents are filed as part of this report: |
(1) | Financial Statements: |
• | The financial statements are set forth under “Item 8. Financial Statements and Supplementary Data” of this Form 10-K. |
(2) | Financial Statement Schedules: |
• | The following financial statement schedule is set forth under “Item 8. Financial Statements and Supplementary Data” of this Form 10-K. All other schedules have been omitted because they are not required, are not applicable or the required information is included in the financial statements or the notes thereto. |
• | Schedule II – Valuation and Qualifying Accounts |
(3) | Exhibits |
Exhibit Number | Description | |
99
100
101
101 | The following materials from the Knowles Corporation Annual Report on Form 10-K for the year ended December 31, 2017 formatted in eXtensible Business Reporting Language (XBRL): (i) Consolidated Statements of Earnings, (ii) Consolidated Statements of Comprehensive Earnings, (iii) Consolidated Balance Sheets, (iv) Consolidated Statements of Equity, (v) Consolidated Statements of Cash Flows and (vi) Notes to the Consolidated Financial Statements | |
† | Indicates the exhibit is a management contract or compensatory plan or arrangement | |
102
ITEM 16. FORM 10-K SUMMARY
None.
103
SIGNATURES
Pursuant to the requirements of Section 13 or 15(d) of the Securities Exchange Act of 1934, the registrant has duly caused this report to be signed on its behalf by the undersigned thereunto duly authorized.
KNOWLES CORPORATION | ||
/s/ JEFFREY S. NIEW | ||
Jeffrey S. Niew | ||
President and Chief Executive Officer | ||
Date: | February 20, 2018 | |
Pursuant to the requirements of the Securities Exchange Act of 1934, this report has been signed below by the following persons on behalf of the registrant and in the capacities and on the dates indicated.
Signature | Title | Date | ||
/s/ JEFFREY S. NIEW | Chief Executive Officer, President and Director (Principal Executive Officer) | February 20, 2018 | ||
Jeffrey S. Niew | ||||
/s/ JOHN S. ANDERSON | Senior Vice President and Chief Financial Officer (Principal Financial Officer) | February 20, 2018 | ||
John S. Anderson | ||||
/s/ BRYAN E. MITTELMAN | Vice President, Controller (Principal Accounting Officer) | February 20, 2018 | ||
Bryan E. Mittelman | ||||
/s/ JEAN-PIERRE M. ERGAS | Chairman, Board of Directors | February 20, 2018 | ||
Jean-Pierre M. Ergas | ||||
/s/ KEITH L. BARNES | Director | February 20, 2018 | ||
Keith L. Barnes | ||||
/s/ HERMANN EUL | Director | February 20, 2018 | ||
Hermann Eul | ||||
/s/ DIDIER HIRSCH | Director | February 20, 2018 | ||
Didier Hirsch | ||||
/s/ RONALD JANKOV | Director | February 20, 2018 | ||
Ronald Jankov | ||||
/s/ RICHARD K. LOCHRIDGE | Director | February 20, 2018 | ||
Richard K. Lochridge | ||||
/s/ DONALD MACLEOD | Director | February 20, 2018 | ||
Donald Macleod | ||||
/s/ CHERYL SHAVERS | Director | February 20, 2018 | ||
Cheryl Shavers | ||||
104