Attached files
| file | filename |
|---|---|
| EX-99.1 - EXHIBIT 99.1 - Hi-Crush Inc. | exhibit991-earningsrelease.htm |
| 8-K - 8-K - Hi-Crush Inc. | q42017-earningsrelease8xk.htm |

INVESTOR PRESENTATION – Q4 2017 EARNINGS
FEBRUARY 2018

Forward Looking Statements
Some of the information included herein may contain forward-looking statements within the meaning of the federal securities
laws. Forward-looking statements give our current expectations and may contain projections of results of operations or of
financial condition, or forecasts of future events. Words such as “may,” “assume,” “forecast,” “position,” “predict,” “strategy,”
“expect,” “intend,” “plan,” “estimate,” “anticipate,” “could,” “believe,” “project,” “budget,” “potential,” or “continue,” and similar
expressions are used to identify forward-looking statements. They can be affected by assumptions used or by known or
unknown risks or uncertainties. Consequently, no expected results of operations or financial condition or other forward-looking
statements can be guaranteed. When considering these forward-looking statements, you should keep in mind the risk factors
and other cautionary statements in Hi-Crush Partners LP’s (“Hi-Crush”) reports filed with the Securities and Exchange
Commission (“SEC”), including those described under Item 1A, “Risk Factors” of Hi-Crush’s Annual Report on Form 10-K for the
fiscal year ended December 31, 2017. Actual results may vary materially. You are cautioned not to place undue reliance on any
forward-looking statements. You should also understand that it is not possible to predict or identify all such factors and should
not consider the risk factors in our reports filed with the SEC or the following list to be a complete statement of all potential risks
and uncertainties. Factors that could cause our actual results to differ materially from the results contemplated by such forward-
looking statements include: the volume of frac sand we are able to sell; the price at which we are able to sell frac sand; the
outcome of any litigation, claims or assessments, including unasserted claims; changes in the price and availability of natural
gas or electricity; changes in prevailing economic conditions; and difficulty collecting receivables. All forward-looking statements
are expressly qualified in their entirety by the foregoing cautionary statements. Hi-Crush’s forward-looking statements speak
only as of the date made and Hi-Crush undertakes no obligation to update or revise its forward-looking statements, whether as a
result of new information, future events or otherwise.
2
Business Update
Investor Presentation | September, 2013 3

4
Creating a Stable and Diverse Platform for Growth
We provide our customers with the high-quality, cost-effective proppant and
logistics services they desire and require, when and where they are needed
• 13.4mm TPY annual
production capacity
• High quality Northern White
and in-basin Permian
reserves
• Diverse grade mix
• Industry-leading production
cost profile
• Largest owned and operated
terminal network in the U.S.
• Cost-effective service to all
major U.S. oil and gas basins
• Unit train origins and
destinations; efficient and
proactive railcar management
• Partnering with a national
trucking company for logistics to
mitigate trucking bottlenecks
• Most vertically-integrated
supplier of proppant and
logistics services
• PropStreamTM delivers sand
from the mine to the wellsite
• Industry’s highest quality
customer service
MOVE. MINE. MANAGE.

2017 Execution Builds Strong Platform for 2018
5
Execution results in stable and more diverse platform for accelerated
profitability and growth in 2018
March:
Completed purchase of
Permian Basin Sand
(Kermit)
JANUARY DECEMBER
March:
Completed dropdown
of Whitehall facility
July:
Kermit facility
start-up
2017
October:
Pecos terminal
start-up
October:
Kermit facility
reaches full
utilization
October:
Announced
resumption of quarterly
cash distribution
December:
Close of
debt refinancings
December:
Completion of $20mm
in unit repurchases
1 crew PropStream Crews 10 crews
February:
Completed equity
offering of 24mm units
90% of Kermit facility
capacity contracted
80% of Northern White
capacity contracted
October:
Announced $100mm
unit repurchase
program
Network Ownership Provides Logistics Advantage
6
Note: Map does not reflect all third party terminals utilized by Hi-Crush to deliver sand to customers
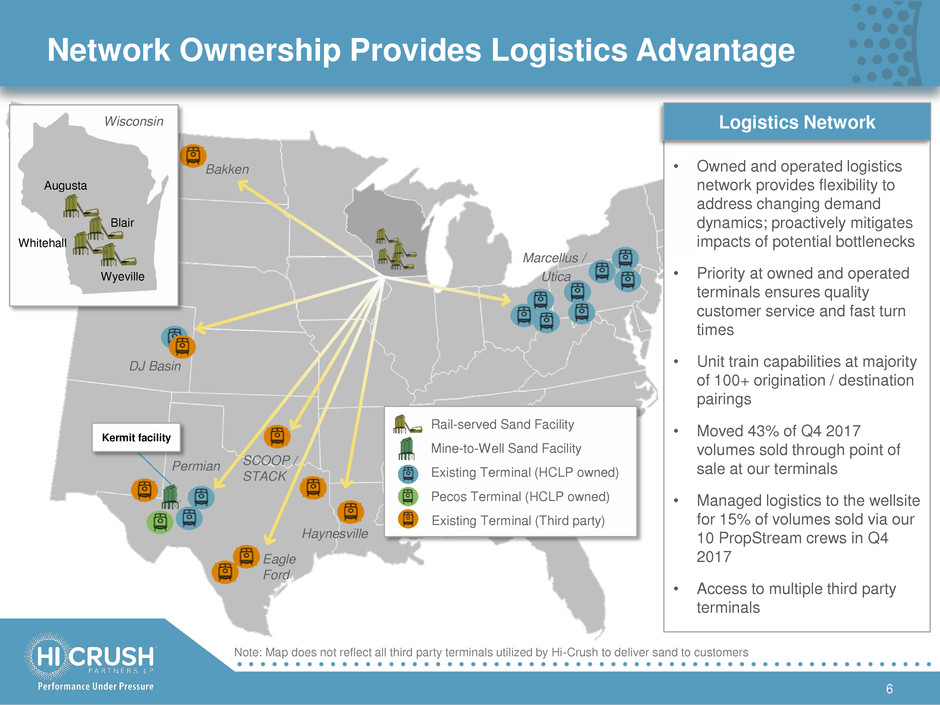
• Owned and operated logistics
network provides flexibility to
address changing demand
dynamics; proactively mitigates
impacts of potential bottlenecks
• Priority at owned and operated
terminals ensures quality
customer service and fast turn
times
• Unit train capabilities at majority
of 100+ origination / destination
pairings
• Moved 43% of Q4 2017
volumes sold through point of
sale at our terminals
• Managed logistics to the wellsite
for 15% of volumes sold via our
10 PropStream crews in Q4
2017
• Access to multiple third party
terminals
Bakken
DJ Basin
Permian SCOOP /
STACK
Eagle
Ford
Marcellus /
Utica
Logistics Network
Rail-served Sand Facility
Existing Terminal (HCLP owned)
Pecos Terminal (HCLP owned)
Mine-to-Well Sand Facility
Existing Terminal (Third party)
Wisconsin
Augusta
Wyeville
Whitehall
Blair
Haynesville
Kermit facility

Operational Track Record Our Operational Landscape
~80%
Northern White capacity
contracted; market price
~90%
Kermit capacity contracted;
fixed price
69%
Northern White volumes
delivered at the terminal or
the wellsite in Q4 2017
25%
Volumes sold direct to
operators in 2017;
no volumes sold to operators
in 2016
11%
Total volumes sold via
PropStream last mile service
in 2017
Destination and Sales Channel Optionality
7
Long-Term Contracted Volumes
• Both our Wisconsin and Kermit (TX)
facilities are contracted above 80%,
with average remaining contract life of
2.6 years
Terminal and Wellsite Delivery
• 69% of Northern White volumes were
delivered to terminals in-basin, or
directly to the wellsite via our
PropStream last mile service
Increase in Direct Sourcing
• The opening of our Kermit facility
provides greater opportunity to sell frac
sand direct to the end users, either at
the minegate or through PropStream
Accelerated PropStream Growth
• Growth in our last mile logistics service
exceeded expectations; expanded to
10 crews versus 9 forecasted
10
PropStream crews as of
year-end 2017

Development Track Record Our Logistics Platform Today
~250,000
Total tons of storage,
including 140k tons of silo
and 109k tons of rail storage
~80%
Permian and Northeast
proppant demand within 50
miles of our owned and
operated terminals
12
Owned and operated
terminals, including our new
Pecos terminal
7
Owned and operated unit
train capable terminals
68%
Railcars shipped via unit
trains in Q4 2017, up from
38% in Q4 2016
136
Unit trains shipped during
Q4 2017, or an average of
~1.5 per day
Best-in-Class Logistics Platform
8
Opportunistic Development
• Strategically invested in our owned
and operated terminal network during
2015-2016 downturn
• Added Permian locations in Odessa
and Big Spring, TX and DJ Basin
location in Evans, CO
Strategic Delaware Basin Development
• Pecos, TX terminal completed; placed
in service early-October 2017
• Supports continued strong demand for
Northern White sand to meet customer
quality, performance and mesh grade
preferences

Basin Diversity Drives Consistent Sales Volumes
9
Bakken
DJ Basin
Permian
SCOOP / STACK
Eagle Ford
Marcellus
/ Utica
Haynesville
25-35%
5-10%+
5-10%+
5-10%+
~27.5%
~27.5%
Minegate
(Kermit)
Northern
White
• >60% of Hi-Crush Northern
White volumes sold outside
the Permian
• Owned and operated
logistics network allows us
to address demand changes
• Core markets are in the
Permian and
Marcellus/Utica, logistics
assets in other basins
provide us flexibility
• Expect U.S. frac sand total
demand growth of ~25% in
2018
Diverse Hi-Crush Sand
Sales Destinations
Hi-Crush Northern
White Facilities
Source: Company estimates Note: Percentages are approximate and may not total to 100% due to ranges and rounding
Permian Footprint Provides Multiple Delivery Points
10
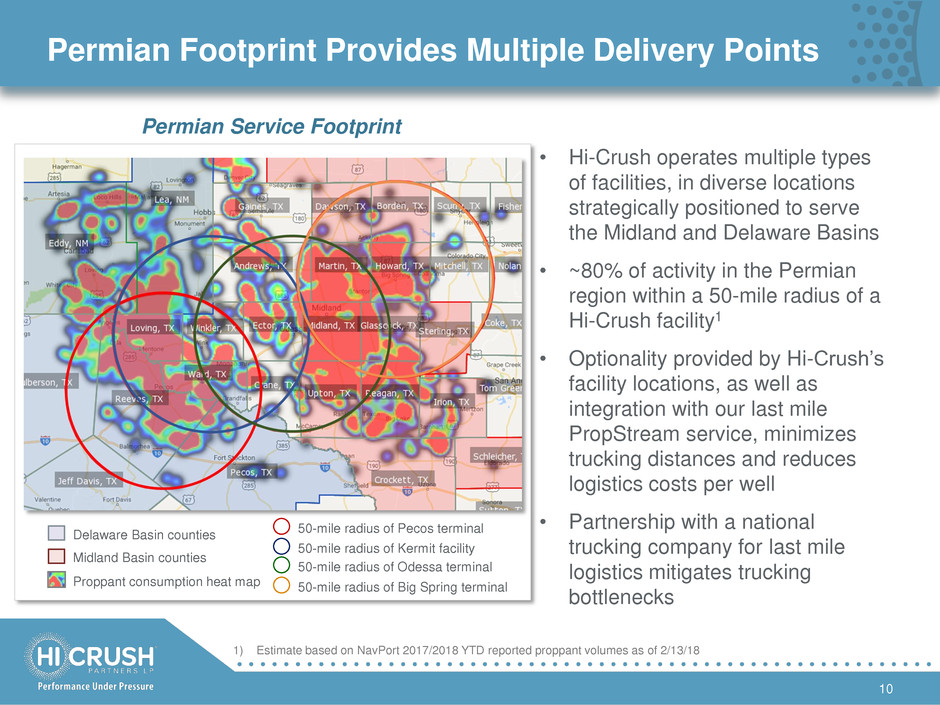
• Hi-Crush operates multiple types
of facilities, in diverse locations
strategically positioned to serve
the Midland and Delaware Basins
• ~80% of activity in the Permian
region within a 50-mile radius of a
Hi-Crush facility1
• Optionality provided by Hi-Crush’s
facility locations, as well as
integration with our last mile
PropStream service, minimizes
trucking distances and reduces
logistics costs per well
• Partnership with a national
trucking company for last mile
logistics mitigates trucking
bottlenecks
Permian Service Footprint
50-mile radius of Pecos terminal Delaware Basin counties
Midland Basin counties
Proppant consumption heat map
50-mile radius of Kermit facility
50-mile radius of Odessa terminal
50-mile radius of Big Spring terminal
1) Estimate based on NavPort 2017/2018 YTD reported proppant volumes as of 2/13/18

Permian Sand Complements Northern White Demand
11
Permian
(100 Mesh) Northern
White (All
Mesh)
Total U.S. Frac Sand
Demand by Basin
Permian Effective
Supply
Regional
Brown
2017 Future
Permian supply will likely erode regional sand share to a greater degree
due to lower cost and comparable mesh sizes
• Significant amount of Northern White supply with delivered cost advantage still needed to meet demand
• Regional brown sand likely to be displaced first in the Permian due to higher overall costs and comparable mesh
size to Permian alternative
• Northern White supply required to meet Permian demand for various mesh sizes, including coarse grade
Permian
Permian
Regional
Brown
Northern
White
Eagle
Ford
Marcellus /
Utica
SCOOP &
STACK
Bakken
Rockies
Other
Note: Charts not drawn to scale; for illustrative purposes only
Well-Positioned in Dynamic Demand Environment
12
1) Company estimates. Note: Charts not drawn to scale; for illustrative purposes only
0% 50% 100% 0% 50% 100%
Future Supply Sources Mesh Split (Demand)
15%
5%
10%
0% 25% 50%
Other
Rockies
Bakken
Marcellus / Utica
PermianPermian
Marcellus/Utica
Bakken
Rockies
Other
Demand (Future)
0% 50% 100% 0% 50% 100%
Total U.S.1 ~[VA
LUE]
0 40 80 120
Permian
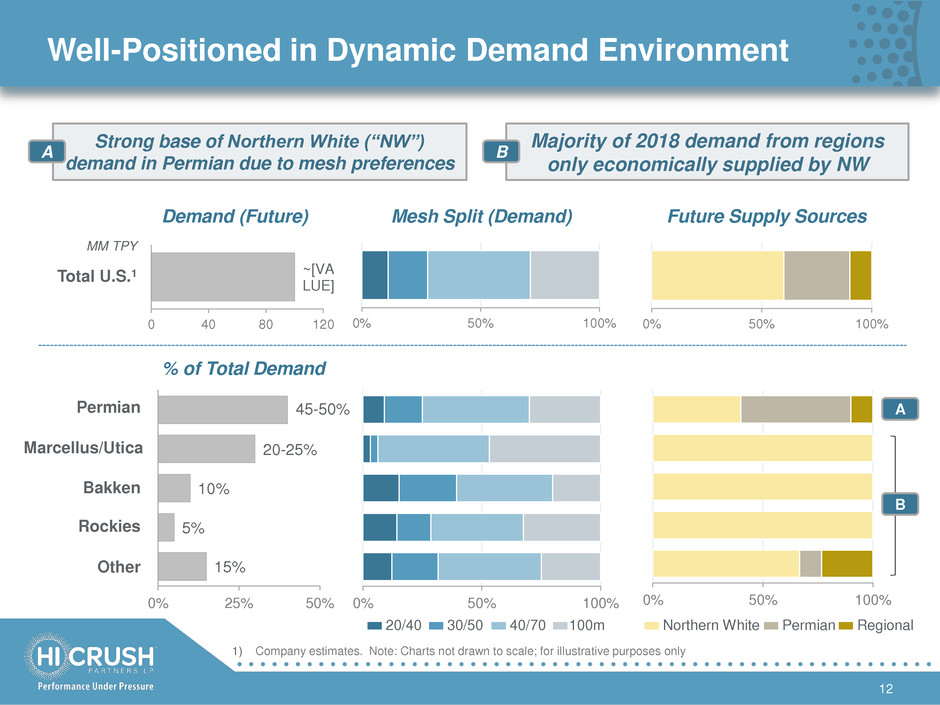
Strong base of Northern White (“NW”)
demand in Permian due to mesh preferences
Majority of 2018 demand from regions
only economically supplied by NW
A
B
A B
20/40 30/50 40/70 100m Northern White Permian Regional
MM TPY
% of Total Demand
45-50%
20-25%

Marcellus/Utica Footprint Provides Demand Resiliency
13
• Hi-Crush owns and operates
eight terminals in the
Marcellus/Utica region, with
direct access to our Northern
White mines via the Canadian
National railway
• ~80% of proppant usage is
within a 50-mile radius of a Hi-
Crush owned and operated
terminal1
• Expected start up of expanded
gas and liquids takeaway
capacity and stable natural gas
prices, along with increasing
overall proppant usage per well,
have led to forecasts of
increasing sand demand in the
Northeast in 2018
50-mile radius of Smithfield terminal
50-mile radius of Mingo Junction terminal
50-mile radius of Dennison terminal
50-mile radius of Minerva terminal
50-mile radius of Kittanning terminal
50-mile radius of Driftwood terminal
50-mile radius of Wellsboro terminal
50-mile radius of Binghamton terminal
Proppant consumption heat map Marcellus Utica
1) Estimate based on NavPort 2017/2018 YTD reported proppant volumes as of 2/13/18
Northeast Service Footprint

PropStream Integrated Logistics Service
14
Safe. Efficient. Effective.
• Unique last mile proppant logistics solution reduces
costs and environmental impact by simplifying the
proppant delivery process through a fully flexible
service
• PropStream has to-date scored a perfect 100% on five
separate on-site safety audits conducted by a major
operator customer in the Permian Basin
• Reduces operator’s respirable silica exposures by more
than 96% vs. pneumatic alternative and complies with June
2018 OSHA standards
• Greater operating efficiency reduces non-productive time
and demurrage costs, improves truck cycle times and
enhances inventory management
• Superior accuracy and reliability through highly precise
sand delivery and greater than 99% uptime efficiency
• Gravity fed loading/unloading accelerates load times and
provides more consistent fills
• Container size and mobility enhances operational flexibility
Strategy & Outlook

Volumes and Utilization Increasing to Meet Demand
16
898
1,024
1,181
1,482
1,195 1,190
1,409
1,209
963
849
1,083
1,359 1,385
2,113
2,456
2,985
0
500
1,000
1,500
2,000
2,500
3,000
3,500
1Q14 2Q14 3Q14 4Q14 1Q15 2Q15 3Q15 4Q15 1Q16 2Q16 3Q16 4Q16 1Q17 2Q17 3Q17 4Q17 1Q18E
000s tons
Quarterly Volumes Sold
Quarterly Nameplate Capacity
Q1 2018 volumes expected to be
2.7-2.9mm tons
Q4 2017 volumes of 2.985mm tons
represents 22% sequential growth
HCLP Quarterly Volumes Sold
Organic investment and execution to meet significant demand

Our Outlook – 2018 and Beyond
17
Advantage
to Integrated
Frac Sand
Companies
Direct
Sourcing by
End Users
Importance of
Controlling
Logistics
Range of Last
Mile Needs
We see the evolution of the frac sand industry
in 2018 and beyond building on three themes:
self sourcing, logistics excellence, and site-
specific last mile solutions
Direct Sourcing by End Users
• Direct sourcing creates a reliance on vendors
who can provide a reliable mine-to-wellsite
solution
Importance of Controlling Logistics
• We believe that this will advantage companies,
like Hi-Crush, with scale of operations,
geographic diversity, owned and operated
transportation networks, and trucking efficiency
• Increased activity will lead to logistics
bottlenecks that will advantage companies like
Hi-Crush that control access to a range of
logistics solutions
Range of Last Mile Needs
• Not all last mile needs will be met by one
system; vendors will target customer base that
will see the most value from their particular
solution
Sand Market Forces of Change

Expected In-Basin Industry Capacity Additions
18
Announced Nameplate
Capacity
Expected Available
Capacity at 12/31/18
100 Mesh 40/70
~60mm TPY
25-30mm TPY
Permit filings and company
announcements suggest ~60mm TPY
of Permian in-basin nameplate
capacity additions
We believe significantly less effective
capacity in the Permian will enter the
market in 2018, and have already seen
significant delays due to:
• Demand conditions
• Construction delays
• Access to financing
• Logistics constraints
• Environmental considerations
• Labor market tightness
2018 Permian In-Basin Capacity
Filed or approved permits do not equate to effective operating capacity
Source: Company filings, internal estimates
PropStream
Kermit
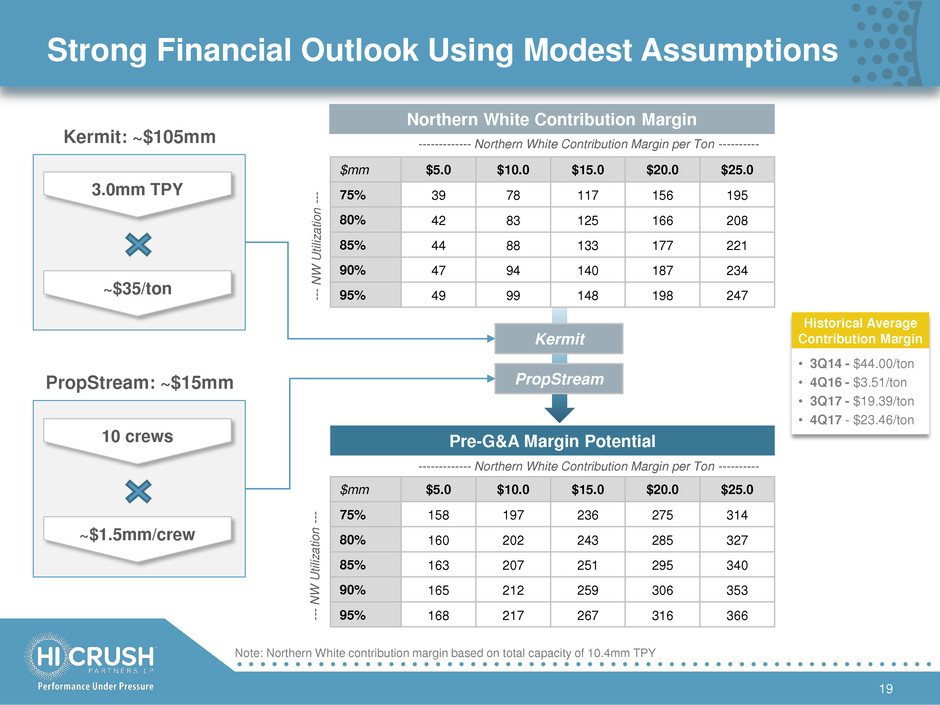
Strong Financial Outlook Using Modest Assumptions
19
$mm $5.0 $10.0 $15.0 $20.0 $25.0
75% 39 78 117 156 195
80% 42 83 125 166 208
85% 44 88 133 177 221
90% 47 94 140 187 234
95% 49 99 148 198 247
3.0mm TPY
~$35/ton
Kermit: ~$105mm
10 crews
~$1.5mm/crew
PropStream: ~$15mm
Northern White Contribution Margin Matrix
$mm $5.0 $10.0 $15.0 $20.0 $25.0
75% 158 197 236 275 314
80% 160 202 243 285 327
85% 163 207 251 295 340
90% 165 212 259 306 353
95% 168 217 267 316 366 --
-
N
W
Ut
ili
zat
ion
-
--
------------- Northern White Contribution Margin per Ton ----------
--
-
N
W
Ut
ili
zat
ion
-
--
Pre-G&A Margin Potential
Northern White Contribution Margin
Note: Northern White contribution margin based on total capacity of 10.4mm TPY
------------- Northern White Contribution Margin per Ton ----------
Historical Average
Contribution Margin
• 3Q14 - $44.00/ton
• 4Q16 - $3.51/ton
• 3Q17 - $19.39/ton
• 4Q17 - $23.46/ton

Leveraging Our Competitive Advantages
20
Factor Our Position The Hi-Crush Advantage
Size and
Scale
Five facilities, 13.4mm tons
of annual capacity
Premier supplier with operational flexibility and ability
to meet dynamic customer needs
Supply
Diversity
Leading supplier of Northern
White and Permian Basin
frac sand
13.4mm TPY of low-cost, high-quality frac sand
production with diversity of grades, geography and
mesh sizes
Best-in-Class
Assets
Market-leading cost structure
Best-in-class cost structure provides competitive,
financial and operational advantages from mine to
wellsite
Distribution
Network
Class-1 rail origins; strategic
owned terminal network;
Permian Basin production
Direct access to UP and CN railroads combined with
Kermit facility and PropStream last mile solution
extends competitive advantages to the wellsite
Customer
Relationships
Strong, long-term
relationships
Increasing profitable market share through extending
relationships with key customers and expanding direct
sourcing; benefiting from supply source consolidation
Balance
Sheet
Ample liquidity and
significant capital flexibility
Maintain and improve conservative position; strong
ability to pursue potential attractive growth
opportunities
Capital
Return
Balanced approach to
returning value to unitholders
Flexibility to return capital to unitholders through
meaningful and sustainable distribution growth and
disciplined buyback program

21
2018 Forecasts & Guidance
Metric Guidance Value Period
Quarterly sales volumes 2.7-2.9 million tons Q1 2018
% of capacity contracted ~90% Kermit, ~80% Northern White mines 2018
PropStream crews 18-20 crews 2018 exit
Total capital expenditures $35-$45 million FY 2018
Maintenance capex $1.85 per ton produced and delivered 2018
G&A expenses $11 million per quarter 2018
Quarterly distribution growth ~10% per quarter for foreseeable future1 --
Unit repurchases Repurchases up to $80 million2 --
1) Subject to periodic review and market conditions
2) $20mm (2,030,163 units) repurchased during Q4 2017
Financial Results

Resuming and Increasing Capital Return to Unitholders
• Reinstituted quarterly distribution at $0.15 per unit for Q3 2017
• Increased distribution to $0.20 per unit for Q4 2017; ~$71mm annualized based on
units outstanding as of February 1, 2018
• Expect increases of ~10% per quarter for the foreseeable future, subject to periodic
review and market conditions
• Board authorized for up to $100mm of HCLP unit repurchases in October 2017
• Completed $20mm of repurchases in Q4 2017 (2,030,163 common units)
• Received approvals in December 2017 to execute remaining authorized repurchases
up to $80mm1
• Ongoing repurchases in 2018; committed to opportunistically executing up to full
authorized amount
23
Unit
Repurchase
Program
Free Cash
Flow
Cash
Distributions
1) Concurrent with Term Loan Credit Facility and Revolving Credit Agreement refinancing transactions in December 2017
o Thoughtful balance of capital return to maximize value to unitholders
o Foundation for sustainable & meaningful growth over near & long term

24
Extended Maturity Profile and Enhanced Flexibility
Revolver Refinancing Term Loan Refinancing
• In December 2017, entered into new 7-year
$200mm Term Loan Credit Facility
• Extends maturity by 3+ years to December 2024
• Bears interest at (a) base rate + 2.75%, or (b)
Eurodollar + 3.75%, subject to a 1.00% LIBOR
floor1
• Term Loan rated B3 by Moody’s and B- by S&P
• No limitation on unit repurchases or cash
distributions
• In December 2017, entered into new 5-year
$125mm Revolving Credit Agreement
• Upsized from previous capacity of $75mm
• Extends maturity by 3+ years to December 2022
• No outstanding borrowings on revolver as of
December 31, 2017
• No limitation on unit repurchases or cash
distributions
• Maximum leverage ratio of 3.25x2
1) Subject to a 0.25% rate increase during any period the Partnership does not have a public corporate family rating of
B2 or higher from Moody’s.
2) Financial covenants also include minimum asset coverage ratio of 1.5x and minimum interest coverage ratio of 2.5x.
75
200
125
200
0
50
100
150
200
250
2017 2018 2019 2020 2021 2022 2023 2024 2025 2026
$
M
M
Old
Revolver
New
Revolver
Old Term
Loan
New Term
Loan

Key Financial Metrics
25
$ in 000s, except per ton Q4 2016 Q1 2017 Q2 2017 Q3 2017 Q4 2017
Revenues $ 67,297 $ 83,364 $ 135,220 $ 167,583 $ 216,456
Adjusted EBITDA1 ($ 334) $ 1,911 $ 26,544 $ 41,706 $ 59,025
Average selling price ($/ton) $ 49 $ 60 $ 64 $ 68 $ 71
Sales volumes (tons) 1,358,511 1,384,887 2,112,516 2,456,195 2,985,115
Contribution margin ($/ton)2 $ 3.51 $ 8.15 $ 16.73 $ 19.39 $ 23.46
Note: Amounts have been recast to include the financial position and results attributable to Hi-Crush Blair LLC, Hi-Crush Whitehall LLC and
Other Assets
1) Adjusted EBITDA is defined as net income (loss) plus depreciation, depletion and amortization and interest expense, net of interest
income adjusted for earnings (loss) from equity method investments, loss on extinguishment of debt and any non-cash impairments of
long-lived assets and goodwill
2) Contribution margin is defined as total revenues less costs of goods sold excluding depreciation, depletion and amortization.
Contribution margin excludes other operating expenses and income, including costs not directly associated with the operations of our
business such as accounting, human resources, information technology, legal, sales and other administrative activities
• Strong sequential volume growth of 22% driven by continued strength in frac sand demand
• Revenues higher by 29% sequentially, driven by customer mix, volume expansion and pricing increases
• Contribution margin improved to $23.46 per ton; driven by higher pricing, and contribution from Kermit
• Adjusted EBITDA increased 42% sequentially, driven by higher volumes, pricing and margins

Strong Liquidity and Financial Flexibility
26
1) Senior secured term loan: $200mm original face value at L+3.75%; rated B3 and B- by Moody’s and Standard &
Poor’s, respectively; includes accordion feature to increase capacity to $300mm. Presented net of discounts and
issuance costs.
2) Revolving credit agreement at 12/31/17: $104.3mm available at L+2.75% ($125mm capacity less $20.7mm of LCs).
Revolver facility capacity increased to $125mm in December 2017.
$ in 000s December 31, 2016 September 30, 2017 December 31, 2017
Cash $ 4,521 $ 23,906 $ 5,662
Revolver $ - $ - $ -
Term loan1 189,715 189,039 194,365
Other notes payable 6,705 4,191 3,054
Total debt $ 196,420 $ 193,230 $ 197,419
Net debt $ 191,899 $ 169,324 $ 191,757
Revolver availability2 $ 66,368 $ 58,234 $ 104,334
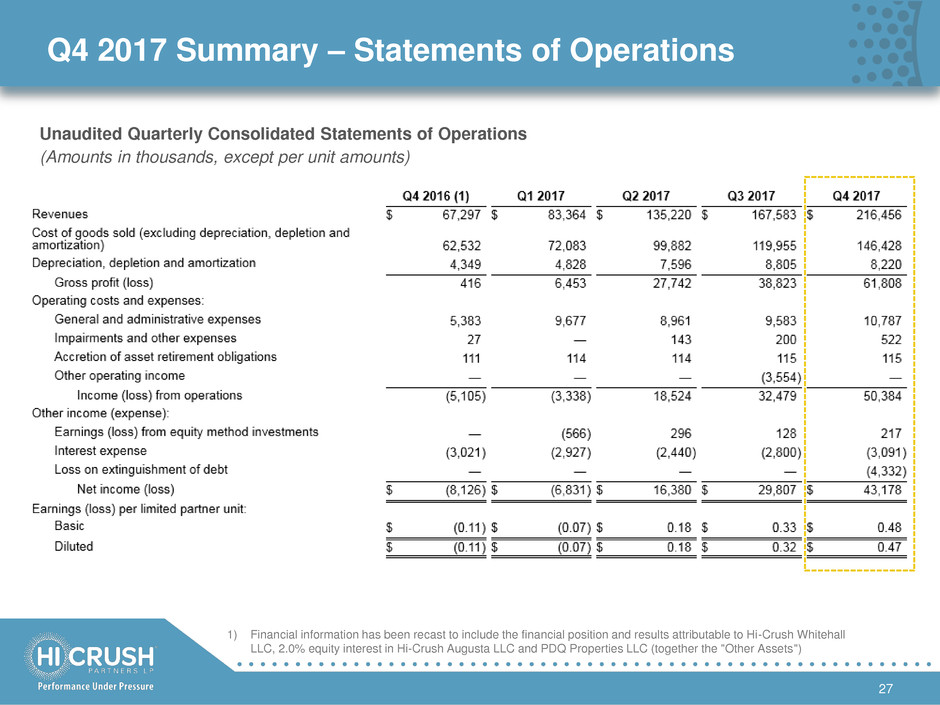
Q4 2017 Summary – Statements of Operations
27
1) Financial information has been recast to include the financial position and results attributable to Hi-Crush Whitehall
LLC, 2.0% equity interest in Hi-Crush Augusta LLC and PDQ Properties LLC (together the "Other Assets")
Unaudited Quarterly Consolidated Statements of Operations
(Amounts in thousands, except per unit amounts)

28
Q4 2017 Summary – EBITDA, Adjusted EBITDA, DCF
Unaudited EBITDA, Adjusted EBITDA and Distributable Cash Flow
(Amounts in thousands)
1) Maintenance and replacement capital expenditures, including accrual for reserve replacement, were determined based on an estimated reserve
replacement cost of $1.35 per ton produced and delivered through September 30, 2017. Effective October 1, 2017, we increased the estimated
reserve replacement cost to $1.85 per ton produced and delivered, due to the addition of our Kermit facility. Such expenditures include those
associated with the replacement of equipment and sand reserves, to the extent that such expenditures are made to maintain our long-term
operating capacity. The amount presented does not represent an actual reserve account or requirement to spend the capital.
2) The Partnership's historical financial information has been recast to consolidate Hi-Crush Whitehall LLC and Other Assets for the periods leading
up to their contribution into the Partnership. For purposes of calculating distributable cash flow attributable to Hi-Crush Partners LP, the
Partnership excludes the incremental amount of recast distributable cash flow earned during the periods prior to the contributions.

Appendix
Investor Presentation | September, 2013 29

Hi-Crush’s Production Portfolio
30
Wyeville Blair Augusta Whitehall Kermit
Capacity 1.85mm TPY 2.86mm TPY 2.86mm TPY 2.86mm TPY 3.00mm TPY
Type
Northern
White
Northern
White
Northern
White
Northern
White
Permian
Pearl
Reserve Life1 40 years 40 years 13 years 27 years 35 years
Takeaway
Union
Pacific
Canadian
National
Union
Pacific
Canadian
National
Direct to
Truck
Location Wisconsin Wisconsin Wisconsin Wisconsin West Texas
Site
1) Reserve life estimates based on reserve reports prepared by JT Boyd
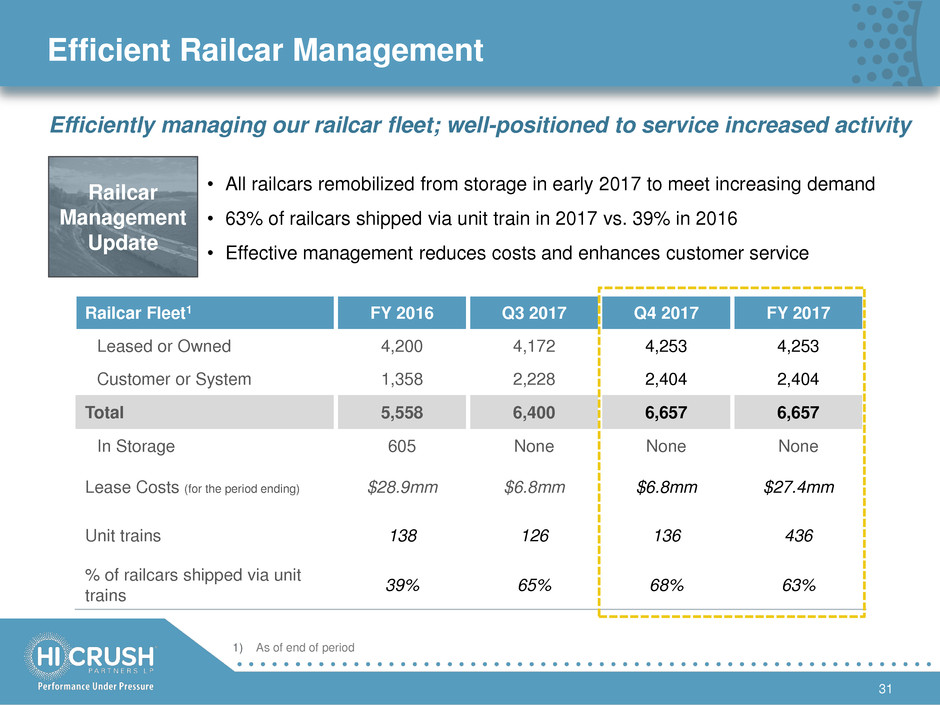
Efficient Railcar Management
31
Railcar Fleet1 FY 2016 Q3 2017 Q4 2017 FY 2017
Leased or Owned 4,200 4,172 4,253 4,253
Customer or System 1,358 2,228 2,404 2,404
Total 5,558 6,400 6,657 6,657
In Storage 605 None None None
Lease Costs (for the period ending) $28.9mm $6.8mm $6.8mm $27.4mm
Unit trains 138 126 136 436
% of railcars shipped via unit
trains
39% 65% 68% 63%
• All railcars remobilized from storage in early 2017 to meet increasing demand
• 63% of railcars shipped via unit train in 2017 vs. 39% in 2016
• Effective management reduces costs and enhances customer service
Railcar
Management
Update
Efficiently managing our railcar fleet; well-positioned to service increased activity
1) As of end of period
