Attached files
| file | filename |
|---|---|
| EX-12.1 - RATIO OF EARNINGS TO FIXED CHARGES - WELLCARE HEALTH PLANS, INC. | wcg-ex121_20171231.htm |
| EX-32.2 - 906 CERTIFICATION OF CFO - WELLCARE HEALTH PLANS, INC. | wcg-ex322_20171231.htm |
| EX-32.1 - 906 CERTIFICATION OF CEO - WELLCARE HEALTH PLANS, INC. | wcg-ex321_20171231.htm |
| EX-31.2 - 302 CERTIFICATION OF CFO - WELLCARE HEALTH PLANS, INC. | wcg-ex312_20171231.htm |
| EX-31.1 - 302 CERTIFICATION OF CEO - WELLCARE HEALTH PLANS, INC. | wcg-ex311_20171231.htm |
| EX-23.1 - CONSENT OF DELOITTE & TOUCHE LLP - WELLCARE HEALTH PLANS, INC. | ex231consent.htm |
| EX-21.1 - LIST OF SUBSIDIARIES - WELLCARE HEALTH PLANS, INC. | ex211sublist13118.htm |
| EX-10.4.B - NON-EMPLOYEE DIRECTOR COMPENSATION POLICY - WELLCARE HEALTH PLANS, INC. | ex106bdircomp.htm |
UNITED STATES
SECURITIES AND EXCHANGE COMMISSION
WASHINGTON, D.C. 20549
FORM 10-K
ý ANNUAL REPORT PURSUANT TO SECTION 13 OR 15(d) OF THE SECURITIES EXCHANGE ACT OF 1934 |
For the Fiscal Year Ended December 31, 2017 |
OR |
o TRANSITION REPORT PURSUANT TO SECTION 13 OR 15(d) OF THE SECURITIES EXCHANGE ACT OF 1934 |
For the Transition Period From to |
Commission File Number 001-32209
WellCare Health Plans, Inc.
(Exact Name of Registrant as Specified in Its Charter)
Delaware | 47-0937650 |
(State or Other Jurisdiction | (I.R.S. Employer |
of Incorporation or Organization) | Identification No.) |
8735 Henderson Road, Renaissance One | |
Tampa, Florida | 33634 |
(Address of Principal Executive Offices) | (Zip Code) |
(813) 290-6200
Registrant's telephone number, including area code
Securities registered pursuant to Section 12(b) of the Exchange Act:
Common Stock, par value $0.01 per share | New York Stock Exchange |
(Title of Class) | (Name of Each Exchange on which Registered) |
Securities registered pursuant to Section 12(g) of the Exchange Act:
NONE
Indicate by check mark if the registrant is a well-known seasoned issuer, as defined in Rule 405 of the Securities Act. Yes ý Noo
Indicate by check mark if the registrant is not required to file reports pursuant to Section 13 of Section 15(d) of the Act. Yes o Noý
Indicate by check mark whether the registrant (1) has filed all reports required to be filed by Section 13 or 15(d) of the Securities Exchange Act of 1934 during the preceding 12 months (or for such shorter period that the registrant was required to file such reports), and (2) has been subject to such filing requirements for the past 90 days. Yes ý No o
Indicate by check mark whether the registrant has submitted electronically and posted on its corporate Website, if any, every Interactive Data File required to be submitted and posted pursuant to Rule 405 of Regulation S-T (§ 232.405 of this chapter) during the preceding 12 months (or for such shorter period that the registrant was required to submit and post such files). Yes ý No o
Indicate by check mark if disclosure of delinquent filers pursuant to Item 405 of Regulation S-K (§ 229.405) is not contained herein, and will not be contained, to the best of registrant's knowledge, in definitive proxy or information statements incorporated by reference in Part III of this Form 10-K or any amendment to this Form 10-K. ý
Indicate by check mark whether the registrant is a large accelerated filer, an accelerated filer, a non-accelerated filer, smaller reporting company, or an emerging growth company. See the definitions of “large accelerated filer,” “accelerated filer,” “smaller reporting company,” and “emerging growth company” in Rule 12b-2 of the Exchange Act. (Check one):
Large accelerated filer x Accelerated filer o Non-accelerated filer o (do not check if a smaller reporting company)
Smaller reporting company o Emerging growth company o
If an emerging growth company, indicate by check mark if the registrant has elected not to use the extended transition period for complying with any new or revised financial accounting standards provided pursuant to Section 13(a) of the Exchange Act. o
Indicate by check mark whether the registrant is a shell company (as defined in Rule 12b-2 of the Exchange Act). Yes o No ý
The aggregate market value of Common Stock held by non-affiliates of the registrant (assuming solely for the purposes of this calculation that all directors and executive officers of the registrant are "affiliates") as of June 30, 2017 was approximately $8.0 billion (based on the closing sale price of the registrant's Common Stock on that date as reported on the New York Stock Exchange).
As of February 13, 2018, there were 44,529,151 outstanding shares of the registrant's Common Stock, par value $0.01 per share.
Documents Incorporated by Reference: Portions of the registrant's definitive Proxy Statement for the 2018 Annual Meeting of Stockholders are incorporated by reference into Part III of this Form 10-K.
TABLE OF CONTENTS
Page | |
PART I | |
Item 1: Business | |
Item 1A: Risk Factors | |
Item 1B: Unresolved Staff Comments | |
Item 2: Properties | |
Item 3: Legal Proceedings | |
Item 4: Mine Safety Disclosures | |
PART II | |
Item 5: Market for Registrant's Common Equity, Related Stockholder Matters and Issuer Purchases of Equity Securities | |
Item 6: Selected Financial Data | |
Item 7: Management's Discussion and Analysis of Financial Condition and Results of Operations | |
Item 7A: Qualitative and Quantitative Disclosures About Market Risk | |
Item 8: Financial Statements and Supplementary Data | |
Item 9: Changes In and Disagreements With Accountants on Accounting and Financial Disclosure | |
Item 9A: Controls and Procedures | |
Item 9B: Other Information | |
PART III | |
Item 10: Directors, Executive Officers and Corporate Governance | |
Item 11: Executive Compensation | |
Item 12: Security Ownership of Certain Beneficial Owners and Management and Related Stockholder Matters | |
Item 13: Certain Relationships and Related Transactions, and Director Independence | |
Item 14: Principal Accounting Fees and Services | |
PART IV | |
Item 15: Exhibits, Financial Statement Schedules | |
References to the "Company," "WellCare," "we," "our," and "us" in this Annual Report on Form 10-K for the fiscal year ended December 31, 2017 (the "2017 Form 10-K") refer to WellCare Health Plans, Inc., together, in each case, with our subsidiaries and any predecessor entities unless the context suggests otherwise.
2
FORWARD-LOOKING STATEMENTS
Statements contained in this Form 10-K for the year ended December 31, 2017 ("2017 Form 10-K"), which are not historical fact may be forward-looking statements within the meaning of the Private Securities Litigation Reform Act of 1995 and Section 21E of the Securities Exchange Act of 1934, as amended, (the "Exchange Act"), and we intend such statements to be covered by the safe harbor provisions for forward-looking statements contained therein. Such statements, which may address, among other things, our financial outlook, the timing of the launch of new programs, pending new Medicaid contracts, the appropriation and payment to us by state governments of Medicaid premiums receivable, the financial effect of recent acquisitions, including integration costs, rate changes, market acceptance of our products and services, our ability to finance growth opportunities, our ability to respond to changes in laws and government regulations, including any repeal, replacement or modification of the Patient Protection and Affordable Care Act, as amended by the Health Care and Education Reconciliation Act of 2010 (collectively, the "ACA"), implementation of our growth strategies, projected capital expenditures, liquidity and the availability of additional funding sources may be found in the sections of this 2017 Form 10-K entitled "Business," "Risk Factors," "Management's Discussion and Analysis of Financial Condition and Results of Operations" and elsewhere in this report generally. In some cases, you can identify forward-looking statements by terminology such as "may," "will," "should," "expects," "plans," "anticipates," "believes," "estimates," "targets," "predicts," "potential," "continues" or the negative of such terms or other comparable terminology. Forward-looking statements involve risks and uncertainties, including economic, regulatory, competitive and other factors that may affect our business. These forward-looking statements are inherently susceptible to uncertainty and changes in circumstances, as they are based on management's expectations and beliefs about future events and circumstances. Given the risks and uncertainties inherent in forward-looking statements, any of our forward-looking statements could be incorrect and investors are cautioned not to place undue reliance on any of our forward-looking statements. Subsequent events and developments may cause actual results to differ, perhaps materially, from our forward-looking statements. We undertake no duty and expressly disclaim any obligation to update publicly any forward-looking statements for any reason, even if new information becomes available or other events occur in the future.
Our actual results may differ materially from those indicated by forward-looking statements as a result of various important factors, including the expiration, cancellation, delay, suspension or amendment of our state and federal contracts. In addition, our results of operations and estimates of future earnings depend, in large part, on accurately estimating and effectively managing health care benefits and other operating expenses. A variety of factors may affect our premium revenue, medical expenses, profitability, cash flows, and liquidity including the outcome of any protests and litigation related to Medicaid awards, competition, changes in health care practices, changes in the demographics of our members, higher than expected utilization of health care services by our members, changes in federal or state laws and regulations or their interpretations, inflation, provider contract changes, changes in or suspensions or terminations of our contracts with government agencies, new technologies, such as new, expensive medications, potential reductions in Medicaid and Medicare revenue, the appropriation and payment to us by state governments of Medicaid premiums receivable, our ability to negotiate actuarially sound rates, especially in new programs with limited experience, government-imposed surcharges, taxes or assessments, changes to how provider payments are made by governmental payors, the ability of state customers to launch new programs on their announced timelines, or at all, the timing of the approval by the Centers for Medicare & Medicaid Services ("CMS") of Medicaid contracts, or changes to the contracts or rates required to obtain CMS approval, major epidemics, disasters and numerous other factors affecting the delivery and cost of health care, such as major health care providers' inability to maintain their operations, and our ability to implement health care value-added programs and our ability to control our medical costs and other operating expenses, including through our vendors. Governmental action or inaction could result in premium revenues not increasing to offset any increase in medical costs, the annual premium-based health insurance industry assessment (the "ACA industry fee") or other operating expenses. Once set, premiums are generally fixed for one-year periods and, accordingly, costs that exceed our estimates or our regulators' actuarial pricing assumptions during such periods generally may not be able to be recovered through higher premiums or rate adjustments. Furthermore, if we are unable to estimate accurately incurred but not reported medical costs in the current period, our future profitability may be adversely affected. Due to these factors and risks, we cannot provide any assurance regarding our future premium levels or our ability to control our future medical costs.
In addition, the risks and uncertainties include, but are not limited to, our progress on top priorities such as integrating care management, advocating for our members, building advanced relationships with providers and government partners, delivering prudent, profitable growth, our ability to effectively estimate and manage growth, our ability to address operational challenges relating to new business, including, but not limited to, the outcome of any protests and litigation related to Medicaid awards, our ability to meet the requirements of readiness reviews, the timing and ability to satisfy closing conditions for pending acquisitions, including receipt of regulatory approvals, adjustments to the purchase price of pending acquisitions and its manner of payment, our ability to effectively identify, execute and integrate acquisitions, and the performance of our acquisitions once acquired. Due to these factors and risks, we may be required to write down or take impairment charges of assets associated with acquisitions. Furthermore, at both the federal and state government levels, legislative and regulatory proposals have been
3
made related to, or potentially affecting, the health care industry, including but not limited to, repeal, replacement or modification of the ACA, reform of the Medicaid and Medicare programs, limitations on managed care organizations, changes to membership eligibility, and benefit mandates. Any such legislative or regulatory action could have the effect of reducing the premiums paid to us by governmental programs, increasing our medical and administrative costs or requiring us to materially alter the manner in which we operate. We are unable to predict the specific content of any future legislation, action or regulation that may be enacted or when any such future legislation or regulation will be adopted. Therefore, we cannot predict accurately the effect or ramifications of such future legislation, action or regulation on our business, financial condition, results of operations, and/or cash flows.
4
PART I
Item 1. Business.
OVERVIEW
We are a leading managed care company, headquartered in Tampa, Florida, focusing exclusively on providing government-sponsored managed care services, primarily through Medicaid, Medicare Advantage ("MA") and Medicare Prescription Drug Plans ("PDPs") to families, children, seniors and individuals with complex medical needs. As of December 31, 2017, we served approximately 4.4 million members in 50 states and the District of Columbia. We estimate that we are among the largest managed care organizations providing Medicaid managed care services plans, MA plans and PDPs, as measured by membership. Our broad range of experience and government focus allows us to effectively serve our members, partner with our providers, government clients and communities we serve, and efficiently manage our ongoing operations.
We were formed as a Delaware limited liability company in May 2002 and began our operations in Florida, New York, and Connecticut through two concurrent health plan acquisitions completed in July 2002. In July 2004, immediately prior to the closing of our initial public offering, we merged the limited liability company into a Delaware corporation and changed our name to WellCare Health Plans, Inc.
As of December 31, 2017, we operated Medicaid health plans in Arizona, Florida, Georgia, Hawaii, Illinois, Kentucky, Missouri, Nebraska, New Jersey, New York, South Carolina and Texas. We began serving Medicaid and Medicare members in Arizona, effective December 31, 2016, in connection with the acquisition of Care1st Health Plan Arizona, Inc. and One Care by Care1st Health Plan of Arizona, Inc. (together, "Care1st Arizona"). Effective January 1, 2017, we began serving Medicaid members statewide in Nebraska.
In addition, as of December 31, 2017, we offered MA coordinated care plans ("CCPs") in certain counties in Arizona, Arkansas, California, Connecticut, Florida, Georgia, Hawaii, Illinois, Kentucky, Louisiana, Maine, Mississippi, New Jersey, New York, South Carolina, Tennessee and Texas. We also offered stand-alone Medicare PDPs in 50 states and the District of Columbia. Effective January 1, 2018, we expanded our MA service area into the state of North Carolina.
We manage our business in three reportable segments: Medicaid Health Plans, Medicare Health Plans and Medicare PDPs. See Our Product Segments below for further discussion.
Membership Concentration
In the following table, we have summarized membership for our business segments in each state that exceeded 5% of our total membership, as well as all other states in the aggregate, as of December 31, 2017.
Medicaid | Medicare | Medicare | Total Membership | Percent of Total Membership | ||||||||||
State | Health Plans (2) | Health Plans (2) | PDPs | |||||||||||
Florida | 751,000 | 101,000 | 30,000 | 882,000 | 20.2 | % | ||||||||
Georgia | 513,000 | 47,000 | 19,000 | 579,000 | 13.2 | % | ||||||||
Kentucky | 448,000 | 9,000 | 24,000 | 481,000 | 11.0 | % | ||||||||
Missouri | 286,000 | — | 17,000 | 303,000 | 6.9 | % | ||||||||
New York | 146,000 | 89,000 | 57,000 | 292,000 | 6.7 | % | ||||||||
Texas | 14,000 | 105,000 | 105,000 | 224,000 | 5.1 | % | ||||||||
All other states (1) | 565,000 | 145,000 | 900,000 | 1,610,000 | 36.9 | % | ||||||||
Total | 2,723,000 | 496,000 | 1,152,000 | 4,371,000 | 100.0 | % | ||||||||
(1) | Represents the aggregate of all states that individually have less than 5% of total membership. |
(2) | Medicaid Health Plans and Medicare Health Plans membership includes members who are dually-eligible and participate in both our Medicaid and Medicare programs. The dually-eligible membership was 52,000 at December 31, 2017. |
5
Acquisitions
On May 1, 2017, we completed our acquisition of certain assets from Phoenix Health Plan ("PHP"), including Arizona Medicaid membership and certain provider contracts. The transaction included the transfer of approximately 42,000 Medicaid members to Care1st Arizona, a wholly owned subsidiary of the Company. The transaction was funded with available cash on hand.
On April 28, 2017, we acquired all of the outstanding shares of Universal American Corp. ("Universal American"). The transaction was valued at approximately $770.0 million, and, as of December 31, 2017, served approximately 119,000 MA members in Texas, New York and Maine, strengthens our business by increasing our MA membership by one-third, deepening our presence in two key markets, Texas and New York, and diversifying our business portfolio. In addition, Universal American has joined with provider groups to operate Accountable Care Organizations (“ACOs”) under the Medicare Shared Saving Program ("MSSP") and Next Generation ACO models. As of December 31, 2017, we operate 16 MSSP ACOs and two Next Generation ACOs.
On December 31, 2016, we completed the acquisition of Care1st Arizona. The purchase price was approximately $163.8 million, inclusive of statutory capital and subject to certain adjustments. As of December 31, 2017, Care1st Arizona served approximately 153,000 Medicaid members in Arizona, including the previously noted membership acquired from PHP. Given that the transaction was completed on December 31, 2016, Care1st Arizona's 2016 results of operations were not significant to our consolidated statement of comprehensive income for the year ended December 31, 2016.
OUR VISION, MISSION AND STRATEGY
We focus exclusively on government-sponsored managed care services primarily through Medicaid, MA and PDPs that serve families, children, seniors and individuals with complex medical needs, with a focus on lower-income beneficiaries. We are committed to operating our business in a manner that serves our key constituents - members, providers, government partners, and associates - while delivering competitive returns for our investors.
Vision
Our vision is to be a leader in government-sponsored health care programs in collaboration with our members, providers, and government partners. We foster a rewarding and enriching culture to inspire our associates to do well for others.
Mission
At WellCare, our members are our reason for being. We help those eligible for government-sponsored health care programs live better, healthier lives.
Strategy
Overview
We focus on serving Medicaid and Medicare members, by understanding their special needs, challenges, and the communities in which they live. We have developed expertise in three major areas of government-sponsored managed care: Medicaid, MA and PDPs.
Our strategy is to diversify our sources of revenue and earnings, and, consequently, to provide a strong and stable capital position so we can serve our government partners and members. Our vision and mission are achieved by focusing on integrated care management, local markets and community advocacy, regulatory and provider partnerships and delivering prudent, profitable long-term growth.
6
Integrated Care Management
The members that we serve include lower income individuals, members with medically-complex conditions, and those who are dually eligible for Medicaid and Medicare. We are committed to continually improving the quality of care and service that we provide to our members, and to help them access the right care at the right time in the appropriate setting. We are focused on preventive health, wellness and an integrated care management model bringing together medical, behavioral, social and pharmacy programs that assist our government partners to provide quality care within their fiscal constraints. We have invested in a flexible model of care that adapts to the needs of our members through appropriate degrees of intensity, which we anticipate will improve our member care, quality, accreditations, Star Ratings and, ultimately, our financial results. Providing a more comprehensive and integrated set of services provides a better care experience for our members.
Local Markets and Community Advocacy
WellCare’s “mission to serve” starts with our members, but it does not end there. We achieve greater presence and support through our local market structure. In each of the states in which we operate, we have a market leader who manages customer-facing functions such as member outreach, provider engagement and quality management, and state regulatory and government relations. We are committed to closing the social care gaps with our care model through collaboration with local community and social groups that are targeted at serving members who may be economically disadvantaged. Our commitment includes breaking down barriers preventing our members from attaining the health care they need by connecting them not only to medical professionals, but also to community-based resources such as food banks, housing assistance, transportation, and child care and education programs.
Regulatory and Provider Partnerships
We build advanced government and provider partnerships to further enhance health care delivery and improve the quality of and access to health care services for our members via high-performing, cost-effective health care solutions. Our provider networks, community support relationships, service infrastructure, and other elements of our business model all are targeted to serving Medicaid and Medicare eligible members who may be economically disadvantaged. In each community that WellCare serves, we focus on developing a comprehensive and collaborative provider network, which is essential to delivering quality health care to our members and value to our government partners. Our experience, exclusive commitment to government-sponsored managed care programs and regulatory relationships, provides improved budget predictability and innovative health care solutions that emphasize collaborative and holistic care coordination, supportive disease management and preventative care.
Delivering prudent, profitable long-term growth
We pursue opportunities for prudent, profitable growth through bidding on Medicaid procurements of new and existing programs. These markets can have a substantial concentration of dual-eligible and medically-complex members, such as long-term services and supports and the aged, blind and disabled. Long-term growth also includes our intent to enter new service areas for Medicare Advantage. We grow organically by creating provider networks, community advocacy, marketing and other capabilities required to expand progressively into new service areas and offer new products. We also seek to acquire and integrate attractive Medicare or Medicaid related businesses that strengthen our market position or capabilities.
We align our expense structure with our revenue base and continually assess opportunities to maintain appropriate medical benefit ratios, obtain actuarially-sound rates, and manage administrative costs to generate earnings that enable us to reinvest in our business and members. With respect to medical benefits expense, our initiatives are focused on quality improvement, reductions in unit costs, optimizing utilization of services, and eliminating waste and abuse. We also continue to invest in technology, regulatory compliance and other infrastructure with the objectives, among others, of improving efficiency and service quality to our members. For more information regarding our SG&A ratio, please see Item 6 - Selected Financial Data as well as Item 7 - Management's Discussion and Analysis of Financial Condition and Results of Operations.
For a list of key developments and accomplishments relating to progress on our business strategy that occurred or affected our results of operations, financial condition or cash flows during 2017, and in the 2018 period prior to issuance of this 2017 Form 10-K, please see Item 7 – Management's Discussion and Analysis of Financial Condition and Results of Operations, Key Developments and Accomplishments.
7
OUR BUSINESS - MEDICAID AND MEDICARE HEALTH PROGRAMS
Government-sponsored coverage in the United States is an important element of the health care system. According to CMS, federal and state spending on Medicaid, Children's Health Insurance Programs ("CHIPs"), and Medicare is estimated to have exceeded $1.3 trillion and aided over 130 million people in 2017. By 2025, CMS anticipates spending on these three programs will increase by 68%. In 2017, the Congressional Budget Office ("CBO") estimated, based on average monthly enrollment, that approximately 77 million people were covered by the joint state and federally funded Medicaid program (including CHIPs) and approximately 58 million people were covered by the federally funded Medicare program.
Managed care solutions have a well-established track record of helping governments improve health care quality and access for beneficiaries while strengthening the fiscal sustainability of these programs. Given economic conditions, demographics, budget challenges, and the proven success of managed care programs, we believe federal and state governments will continue to turn to managed care solutions to help achieve program objectives.
A “managed care” plan is an integrated health care delivery system that manages health care services for an enrolled population rather than simply providing or paying for these services. Services within managed care plans are usually delivered by providers who are under contract to, or employed by, the plan. Managed care plans use a variety of approaches to “manage” care, including, but not limited to, care and disease management, capitation, risk-sharing or value-based arrangements with providers, the use of primary care physicians to act as health care "gatekeepers" and the use of preferred provider networks.
As of December 31, 2017, our Medicare plans are offered under the WellCare name, for which we hold a federal trademark registration, with the exception of our Hawaii CCP and California CCP, which we offer under the names 'Ohana and Easy Choice, respectively. Additionally, certain of our Texas and northeast plans are offered under the Texan Plus and Today's Options names, respectively. For our Medicaid plans, we offered a number of brand names depending on the state, consisting of Care1st Arizona, Staywell in Florida, 'Ohana in Hawaii, Harmony in Illinois, Missouri Care in Missouri and the WellCare brand name in Georgia, Kentucky, Nebraska, New Jersey, New York and South Carolina.
Medicaid
Medicaid provides medical assistance to low-income and disabled persons and is implemented and operated by each state. Medicaid is funded and regulated by both the state and federal governments. Within federal guidelines, each state establishes its own eligibility standards; determines the type, amount, duration and scope of services; sets the rate of payment for services; and administers its own program. This results in considerable variation in the types of services covered and the amount of care provided across states. Many states offer a variety of public programs, including Temporary Assistance for Needy Families ("TANF"), Supplemental Security Income ("SSI"), Aged, Blind and Disabled ("ABD") as well as other state-based programs that are not part of the Medicaid program, such as CHIPs and Long-Term Services and Supports ("LTSS"). TANF generally provides assistance to low-income families with children. ABD and SSI generally provide assistance to low-income aged, blind or disabled individuals. CHIPs provide assistance to qualifying families who are not eligible for Medicaid because their income exceeds the applicable income thresholds. See further discussion below under "Children's Health Insurance Program (CHIP)". LTSS programs are designed to help people with chronic illnesses or who have disabilities and need health and long-term care services, such as home care or adult day care, to enable them to stay in their homes and communities as long as possible.
8
We have entered into contracts with Medicaid agencies in each state in which we operate Medicaid plans. Some of the states in which we operate award contracts to applicants that can demonstrate that they meet the state's minimum requirements. Other states engage in a competitive bidding process for all or certain programs. In either case, we must demonstrate to the satisfaction of the respective agency that we are able to meet certain operational and financial requirements. For example, depending on the state:
• | we must coordinate care that encompasses the full breadth of a member's needs including their physical health, behavioral health, pharmacy, LTSS and, increasingly, their need for social services; |
• | we must measure provider access and availability in terms of the time needed for a member to reach the doctor's office; |
• | our quality improvement programs must emphasize member education, member outreach and include measures designed to promote utilization of preventive services; |
• | we must have linkages with schools, city or county health departments and other community-based providers of health care in order to demonstrate our ability to coordinate all of the sources from which our members may receive care; |
• | we must have the capability to meet the needs of members with complex conditions including those with co-occurring conditions and those who are disabled; |
• | our providers and member service representatives must be able to communicate with members who do not speak English or who are hearing impaired; |
• | our member handbook, newsletters and other communications must be written at the prescribed reading level and must be available in certain languages other than English; |
• | we must have the capabilities to meet any specialized waiver requirements, such as member premium payments or work eligibility requirements; and |
• | we must demonstrate our readiness to meet contract requirements prior to the commencement date of services. |
Once awarded, our Medicaid program contracts generally have terms of one to three years. Most of these contracts provide for renewal upon mutual agreement of the parties, or at the option of the government agency, and both parties have certain early termination rights. Generally, under state regulation, these contracts are only renewable for a limited amount of time prior to reprocurement in the states that require procurements. In addition to the operating requirements listed above, state contract requirements and regulatory provisions applicable to us generally set forth detailed provisions relating to subcontractors, marketing, safeguarding of member information, fraud, waste and abuse reporting, grievance procedures, and timely submission of encounter data and other cost reporting.
Our compliance with the provisions of our contracts is subject to monitoring or examination by state regulators and their agents. Certain contracts require us to be subject to quality assurance evaluations and accreditation by a third-party organization.
Children's Health Insurance Program (CHIP)
We provide services under CHIPs in ten states, including our Nebraska program, which commenced on January 1, 2017. In some states, like Hawaii, those beneficiaries are served as a part of the state’s Medicaid program. These CHIPs are referred to as expansion programs. In other states, including New York and Florida, the state’s CHIP is operated separately. CHIP was established in 1997 to serve low-income, uninsured children. In some states, the program was extended to the parents of those children. As a result of the Patient Protection and Affordable Care Act, as amended by the Health Care and Education Reconciliation Act of 2010 (collectively, the "ACA"), parents previously covered under CHIP may now instead be covered through the state’s Medicaid expansion or may be eligible for premium assistance and other subsidies through the state or federal exchange, as applicable. The ACA maintained CHIP eligibility standards for children in place as of enactment through 2019. On January 22, 2018, CHIP funding was extended for six years as part of a broader continuing resolution to fund the federal government and further extended to 2027 by the Bipartisan Budget Act of 2018, on February 9, 2018. In addition, the resolution continued the enhanced federal match rate for CHIP established by the ACA initially, but reduced the rate over time. The resolution also extended the requirement for states to maintain coverage for children from 2019 through 2023, but after October 1, 2019, the requirement is limited to children in families with incomes at or below 300% of the federal poverty level.
Medicare
The Medicare program provides health care coverage primarily to individuals age 65 or older as well as to individuals with certain disabilities and consists of four parts, labeled A through D. Part A provides hospitalization benefits financed largely through Social Security taxes and requires beneficiaries to pay out-of-pocket deductibles and coinsurance. Part B provides benefits for medically necessary services and supplies including outpatient care, physician services, and home health care. Beneficiaries enrolled in Part B are required to pay monthly premiums and are subject to annual deductibles. Parts A and B are referred to as “Original Medicare.”
9
Medicare beneficiaries may elect to receive their Medicare benefits through MA plans as an alternative to Original Medicare. Under MA, private health plans, including health maintenance organizations ("HMO") and preferred provider organizations ("PPO"), contract with CMS to provide benefits that are comparable to, or that may be more attractive (such as including prescription drug coverage and supplemental benefits) to Medicare beneficiaries than Original Medicare in exchange for a fixed monthly per member payment that varies based on the county in which a member resides, the demographics of the member and the member's health condition. MA plans may also charge beneficiaries monthly premiums and other copayments for Medicare-covered services or for certain extra benefits.
Our 2017 acquisition of Universal American added a PPO product to our Medicare portfolio. PPO products offer seniors the ability to obtain services from out-of-network providers with additional out-of-pocket expenses. For the year ended December 31, 2017, there are approximately 22,000 members enrolled in the Universal American PPO product. Effective January 1, 2018, we offer PPO products in two additional Medicare markets. As more seniors opt for plan flexibility, our ability to offer a choice of products will be important to attracting more customers.
Additionally, through our acquisition of Universal American in 2017, we added a Medicare private-fee-for-service (“PFFS”) product to our Medicare portfolio. PFFS plans are open-access plans that allow members to be seen by any physician or facility that participates in the Original Medicare program and are subject to our network terms and conditions. PFFS beneficiaries can join a PFFS plan that has Part D drug coverage or join a plan without such coverage. Our PFFS plans are offered under contracts with CMS and provide enhanced health care benefits compared to Original Medicare, subject to cost sharing and other limitations. We actively coordinate care for these members in a similar manner to our PPO and HMO plans. In addition to a fixed monthly payment per member from CMS, individuals in these plans may be required to pay a monthly premium in selected counties or for selected enhanced products.
Also effective January 1, 2018, we offer a Chronic Special Needs Plan ("C-SNP"), which limits enrollment to individuals with specific severe or disabling chronic conditions. C-SNP plans focus on monitoring health status, managing chronic diseases, avoiding inappropriate hospitalizations and helping beneficiaries move from high risk to lower risk on the care continuum. CMS has approved 15 C-SNPs specific to certain chronic conditions. Our C-SNP program targets cardiovascular disorders and is limited to certain counties in Florida.
Beneficiaries enrolled in Original Medicare can either join a stand-alone PDP plan or forgo Part D prescription drug coverage. Beneficiaries enrolled in Medicare Advantage plans can join a plan with Part D coverage (a "MA-PD" plan), select a stand-alone PDP plan or forgo Part D prescription drug coverage. Beneficiaries who are dually eligible for Medicare and Medicaid, and certain beneficiaries who qualify for a low-income subsidy ("LIS"), but who do not enroll in a MA plan with drug benefits or a PDP, are automatically assigned to a plan by CMS. These assignments are made among those PDPs that submitted bids below the applicable regional benchmarks for standard Part D plans established annually by CMS.
All managed care plans offering Part D (PDP and MA-PD) bid on providing Part D benefits in June of each year. Based on the bids submitted, CMS establishes a benchmark for each of the 34 regions. CMS pays the Part D plans a percentage of the benchmark on a per member per month ("PMPM") basis with the remaining portion of the premium being paid by the Medicare member. Members whose income falls below 150% of the federal poverty level qualify for the federal LIS, through which the federal government helps pay the member's Part D premium and certain other cost sharing expenses.
Our MA and PDP plan contracts with CMS are on a calendar-year basis. CMS requires that each plan meet certain regulatory requirements including, as applicable: provisions related to enrollment and disenrollment; restrictions on marketing activities; benefits or formulary requirements; quality assessment; encounter data reports; fraud, waste and abuse monitoring; maintaining relationships with health care providers; and responding to appeals and grievances.
Dual-eligibles
Individuals qualifying for both Medicare and Medicaid are referred to as "dual-eligibles." For dual-eligibles, if a service is covered by Medicare and Medicaid, Medicare is the primary payer. Medicaid pays for services available under the state's Medicaid program, which exceed or supplement what Medicare covers, often referred to as wrap-around coverage. Medicaid may also cover some beneficiary cost-sharing associated with Medicare services. For Medicaid benefits that are not covered by Medicare, such as certain long-term care services, Medicaid covers the cost of these benefits unless there is another liable third-party payer. Medicaid is generally the payer of last resort.
Improved care coordination is imperative to enhance care options for dual-eligibles as an aging population and increased life expectancy among Americans with disabilities increase the dual-eligible population. As such, dual-eligible programs have become an immediate target for both spending reductions and attempts to improve the quality of care beneficiaries receive. The
10
ACA created a federal Medicare-Medicaid Coordination Office to serve dual-eligibles. This Medicare-Medicaid Coordination Office has initiated a series of state Duals Demonstration Programs intended to provide better coordination and integration of care between Medicare and Medicaid on a capitated or fee-for-service basis, which is required to produce cost savings. As of January 1, 2018, we operate dual special needs plans ("D-SNPs") in 16 states.
General Economic and Political Environment Affecting our Business
We expect overall spending on health care in the U.S. to continue to rise due to inflation, evolving medical technology, pharmaceutical advancement, regulatory requirements, demographic trends in the U.S. population and national interest in health and well-being. The rate of market growth may be affected by a variety of factors, including macro-economic conditions and enacted health care reforms, which could also affect our results of operations. We expect that the state and federal governments will continue to look for budgetary cost control savings through reductions in health care expenses.
Congress has proposed several plans to cut or restructure Medicare including raising the Medicare eligibility age, moving Medicare to a defined contribution model, converting Medicare to a voucher system and various other modifications including cuts to provider reimbursement. Medicaid is similarly situated, consuming ever greater portions of the federal budget. As a result, several proposals have been suggested to modify the Medicaid program including moving from a match program to block grants, moving to a per-capita capitation system, limiting the use of provider taxes to fund the state’s portion of the Medicaid program, as well as modifying the ACA Medicaid expansions. We do not know whether any of these proposals will pass or the effect any ultimate reform will have on our business.
In addition, states are looking for more flexibility to design their Medicaid programs to manage their state health care budgets, including by imposing premium and work requirements to maintain Medicaid eligibility. For example, the State of Kentucky expects to implement new premium and work requirements for certain members to maintain their eligibility for the Medicaid program beginning on July 1, 2018, which may reduce our Medicaid membership in Kentucky.
On May 6, 2016, CMS published regulations that overhauled Medicaid managed care requirements. These regulations include requirements that state Medicaid programs evaluate network adequacy standards; impose a requirement of managed care organizations ("MCO") to report medical loss ratios ("MLRs") annually to states; and a requirement that states set MCO rates to reasonably achieve an MLR of greater than 85% as long as the capitation rates are actuarially sound. Additionally, these regulations expand federal financial participation reimbursement opportunities related to members with behavioral health issues who receive short term services in an alternative mental health institution and outline requirements for value-based provider contracting. Under the regulations, the states may also be tasked with developing and publicizing plan quality rating results. These changes may be phased in over the course of three years with some regulations being effective immediately on May 6, 2016; however, the degree of federal oversight in implementing these regulations is uncertain, and the states may retain substantial flexibility in designing their Medicaid programs.
In addition, on December 21, 2017, the Tax Cuts and Jobs Act of 2017 was enacted, which reformed tax rates beginning January 1, 2018. For additional discussion, refer to Note 14 - Income Taxes to the consolidated financial statements included in this 2017 Form 10-K.
Health Care Reform
In March 2010, the ACA became law and significantly reformed various aspects of the U.S. health insurance industry. Financing for these reforms comes in part from substantial additional fees and taxes on us and other health insurers, health plans and individuals, as well as reductions in certain levels of payments to us and other health plans under Medicare. The majority of regulations and interpretive guidance on provisions of the ACA have been issued by the Department of Health and Human Services ("HHS"), the Department of Labor, the Treasury Department, and the National Association of Insurance Commissioners ("NAIC"). There may be provisions of the legislation that receive additional guidance and clarification in the form of regulations and interpretations. The funding of the ACA is uncertain under the current presidential administration.
On February 9, 2018, the Bipartisan Budget Act of 2018 was enacted, which among other things, extended CHIP for an additional four years, until 2027, added additional flexibility to how ACOs can operate and accelerated the timing of the closure of the Part D “coverage gap” (i.e., the dollar threshold at which an individual has to pay full price for his or her medications). As a result, Part D beneficiaries' co-pays will be reduced to 25% of prescription costs in 2019, instead of that reduction occurring in 2020 under prior law. In addition, MA special needs plans were permanently reauthorized, but additional requirements for care coordination and integration of long-term services and supports were imposed. We are still assessing the affect these changes may have on our business.
11
The ACA included a number of changes that affected the way plans operate, such as reduced Medicare premium rates, CMS Star Ratings, minimum MLRs and other provisions.
Reduced Medicare Premium Rates
In April 2017, the CMS final call letter revised the proposed 2018 MA and Part D rates. We estimate the 2018 rates, compared to 2017, will decrease slightly, excluding Medicare coding trends and the return of the ACA industry fee.
CMS Star Ratings
Certain provisions in the ACA provide additional Medicare revenue related to the achievement of higher Star Ratings that can be used to offer more attractive benefit packages to members and/or achieve higher profit margins. In addition, plans with Star Ratings of 4.0 or higher are eligible for year-round open enrollment, whereas plans with lower Star Ratings have more restrictions on enrollment criteria and timing. Part C or Part D Medicare plans with Star Ratings of less than three stars for three consecutive years are denoted as "low performing" plans on the CMS website and in the CMS "Medicare and You" handbook. In addition, CMS could exercise its authority to terminate the MA and PDP contracts for plans rated below three stars for three consecutive years for the plan year 2020. As a result, plans that achieve higher Star Ratings may have a competitive advantage over plans with lower Star Ratings.
CMS's current quality measurement methodology does not fully account for socio-economic determinants of health. Because we have a greater percentage of low-income members, we may be unable to achieve or maintain a 4.0 Star Rating for some or all of our plans without a legislative or regulatory adjustment to the quality measurement methodology. Though various regulatory and legislative solutions have been proposed, we continue to work with our legislative and regulatory partners to ensure this issue is adequately addressed.
In October 2017, CMS announced 2018 MA and PDP Star Ratings. Three of our 16 active MA contracts received an overall rating of 4.0 stars or higher and served approximately 38.7% of our December 31, 2017 MA membership, including contracts serving certain of our members in Florida, Maine, New York and Texas. Four of our MA contracts received an overall rating of 3.5 stars and served approximately 11.7% of our December 31, 2017 MA membership, including contracts serving certain of our members in Arizona, California, New Jersey, and New York. Eight of our MA contracts received an overall rating of 3.0 stars, while we have one MA plan that received an overall score of 2.5 stars serving our members in Hawaii and Louisiana.
Our MA plan serving Arkansas, Illinois, Mississippi, South Carolina and Tennessee received a score of 2.5 stars for its Part C operations for 2017 and 2018 and could be subject to termination by CMS if the score does not improve for 2019. Additionally, our PDP plan received a score of 2.5 stars for 2017 and 2018 and could subject the contract to termination by CMS if the score does not improve for 2019.
Minimum Medical Loss Ratio
Beginning in 2014, the ACA established a minimum MLR for MA and Part D plans, requiring plans to spend not less than 85% of premiums on medical and pharmacy benefits. The rules implementing the minimum MLR impose financial and other penalties for failing to achieve the minimum MLR, including requirements to refund to CMS shortfalls in amounts spent on medical benefits and termination of a plan’s MA contract for prolonged failure to achieve the minimum MLR. The MLR prescribed by HHS differs from the MLR calculation under generally accepted accounting principles in the United States of America ("GAAP") and is determined by adding a plan’s spending for clinical services, prescription drugs and other direct member benefits, plus the plan's total spending on quality improvement activities and dividing the total by earned premiums (after subtracting specific identified taxes and other fees). This provision has not had a material effect on our results of operations.
12
Other Provisions
The ACA imposed certain new taxes and fees, including limitations on the amount of compensation that is tax deductible, as well as an annual premium-based health insurance industry assessment (the "ACA industry fee") on health insurers, which began in 2014. The total ACA industry fee levied on the health insurance industry was $11.3 billion in both 2015 and 2016, increasing to $14.3 billion in 2018. After 2018, the ACA industry fee increases according to an index based on net premium growth. The assessment is being levied on certain health insurers that provide insurance in the assessment year, and is allocated to health insurers based on each health insurer's share of net premiums for all U.S health insurers in the year preceding the assessment. The ACA industry fee is not deductible for income tax purposes, which has significantly increased our effective income tax rate. In December 2015, President Obama signed the Consolidated Appropriations Act, 2016 which, among other provisions, included a one-year moratorium on the ACA industry fee for 2017. While the ACA industry fee will be assessed in 2018, the continuing resolution approved in January 2018 provides for an additional one-year moratorium for 2019 for the ACA industry fee.
We received amendments, written agreements or other documentation from all our Medicaid customers that commit them to reimburse us for the portion of the ACA industry fee on our Medicaid plans, including its non-deductibility for income tax purposes. CMS does not directly reimburse us for the effect of the ACA industry fee related to MA and PDP premiums.
In addition, the Medicare Access and CHIP Reauthorization Act of 2015 is gradually increasing rates on the provider fee schedule from June 30, 2015 to 2019. After 2019, the provider fee schedules will also adjust rates based on quality performance. This Act also provided for incentive payments for those providers that participate in an alternative payment model, such as a demonstration program.
The ACA also established Medicare Shared Savings ACOs as a tool to improve quality and lower costs through increased care coordination in the Medicare fee-for-service (“FFS”) program, which covers the majority of the Medicare-eligible population. CMS established the Medicare Shared Service Program (“MSSP”) to facilitate coordination and cooperation among providers to improve the quality of care for FFS beneficiaries and reduce unnecessary costs. The MSSP shares savings with the ACOs when they generate savings above a minimum savings rate and meet quality of care performance standards. The future of the ACOs is uncertain given the uncertain funding status of the ACA, or its modification.
The reforms in the ACA present both challenges and opportunities for Medicaid plans. The reforms provide states the option to expand eligibility for Medicaid programs. However, some states have decided not to participate in the Medicaid expansion. In addition, state budgets continue to be strained due to economic conditions and uncertain levels of federal financing for current and expansion populations. As a result, the effects of any potential future expansions are uncertain, including whether states that have expanded will maintain their expansion, making it difficult to determine whether the net effect of the ACA, or any modification, will be positive or negative for Medicaid plans.
We currently serve the ACA Medicaid expansion population in Arizona, Hawaii, Illinois, Kentucky, New Jersey and New York. Our other Medicaid states, Florida, Georgia, Missouri, Nebraska and South Carolina, have not expanded their Medicaid eligibility.
13
OUR PRODUCT SEGMENTS
Our operations are conducted in three reportable segments: Medicaid Health Plans, Medicare Health Plans and Medicare PDPs, which correspond with the Medicaid and Medicare products that we offer.
Membership by segment, and as a percentage of consolidated totals, is as follows.
For the Years Ended December 31, | |||||||||||||||||
2017 | 2016 | 2015 | |||||||||||||||
Segment | Membership | Percentage of Total | Membership | Percentage of Total | Membership | Percentage of Total | |||||||||||
Medicaid Health Plans | 2,723,000 | 62.3 | % | 2,544,000 | 65.3 | % | 2,388,000 | 63.4 | % | ||||||||
Medicare Health Plans | 496,000 | 11.3 | % | 345,000 | 8.9 | % | 354,000 | 9.4 | % | ||||||||
Medicare PDPs | 1,152,000 | 26.4 | % | 1,009,000 | 25.8 | % | 1,025,000 | 27.2 | % | ||||||||
Total | 4,371,000 | 100.0 | % | 3,898,000 | 100.0 | % | 3,767,000 | 100.0 | % | ||||||||
Premium revenue by segment, and as a percentage of consolidated totals, is as follows (in millions, except percentages).
For the Years Ended December 31, | ||||||||||||||||||||
2017 | 2016 | 2015 | ||||||||||||||||||
Segment | Premium Revenue | Percentage of Total | Premium Revenue | Percentage of Total | Premium Revenue | Percentage of Total | ||||||||||||||
Medicaid Health Plans | $ | 10,726.3 | 63.2 | % | $ | 9,499.3 | 66.8 | % | $ | 9,074.3 | 65.4 | % | ||||||||
Medicare Health Plans | 5,320.2 | 31.4 | % | 3,876.6 | 27.3 | % | 3,898.8 | 28.1 | % | |||||||||||
Medicare PDPs | 913.8 | 5.4 | % | 845.0 | 5.9 | % | 901.7 | 6.5 | % | |||||||||||
Total | $ | 16,960.3 | 100.0 | % | $ | 14,220.9 | 100.0 | % | $ | 13,874.8 | 100.0 | % | ||||||||
Medicaid Health Plans
Our Medicaid Health Plans segment includes plans for beneficiaries of TANF, SSI and ABD programs and other state-based programs that are not part of the Medicaid program, such as CHIP and LTSS. For purposes of our Medicaid Health Plans segment, we define our customer as the state and related governmental agencies that have common control over the contracts under which we operate in that particular state. As of January 1, 2018, we are the largest Medicaid health plan by membership in Florida, Georgia, Kentucky and Missouri.
The Medicaid programs and services we offer to our members vary by state and county and are designed to effectively serve our constituencies in the communities in which we operate. Although our Medicaid contracts determine, to a large extent, the type and scope of health care services that we arrange for our members, in certain markets we customize our benefits in ways that we believe make our products more attractive. Our Medicaid plans provide our members with access to a broad spectrum of medical benefits from primary care and preventive programs to full hospitalization and long-term care.
In general, members are required to use our network to receive care, except in cases of emergencies, transition of care or when network providers are unavailable to meet their medical needs. In addition, members generally must receive referrals from their primary care providers ("PCPs") in order to receive health care from a specialist, such as an orthopedic surgeon or neurologist. Members generally do not pay any premiums, deductibles or co-payments for most of our Medicaid plans; however, the Kentucky Medicaid program is expected to have certain member premiums and work requirements for eligibility purposes starting on July 1, 2018.
14
Medicaid Health Plans Membership
The following table summarizes our Medicaid Health Plans segment membership by the programs we offer.
As of December 31, | ||||||||
2017 | 2016 | 2015 | ||||||
Medicaid Health Plans | ||||||||
TANF | 2,278,000 | 2,119,000 | 1,988,000 | |||||
SSI, ABD, duals, and LTSS | 301,000 | 290,000 | 274,000 | |||||
CHIP and other | 144,000 | 135,000 | 126,000 | |||||
Total | 2,723,000 | 2,544,000 | 2,388,000 | |||||
We received over 10% of our consolidated premium revenue in 2017, 2016 and 2015, individually, from the states of Florida and Kentucky, and in 2016 and 2015, Georgia. Due to the addition of a competing fourth managed care organization to the Georgia program during 2017, Georgia Medicaid premium revenue declined to less than 10% of our consolidated premium revenue for the year ended December 31, 2017. The membership for these states is summarized in the following table.
As of December 31, | ||||||||
2017 | 2016 | 2015 | ||||||
Medicaid Health Plans | ||||||||
Florida | 751,000 | 780,000 | 781,000 | |||||
Georgia | 513,000 | 571,000 | 585,000 | |||||
Kentucky | 448,000 | 440,000 | 440,000 | |||||
All other states (1) | 1,011,000 | 753,000 | 582,000 | |||||
Total | 2,723,000 | 2,544,000 | 2,388,000 | |||||
(1) | "All other states" consists of Hawaii, Illinois, Missouri, New Jersey, New York, South Carolina and Texas during all years presented. In 2016 and 2017, it also includes Arizona, as well as Nebraska in 2017. |
As of January 1, 2018, we served approximately 2,715,000 Medicaid members, a decrease of approximately 8,000 compared with December 31, 2017. Refer to Item 7 – Management's Discussion and Analysis of Financial Condition and Results of Operations for membership discussion by segment for 2017, 2016 and 2015.
Medicaid Health Plans Segment Revenues
Our Medicaid Health Plans segment generates revenues primarily from premiums received from the states in which we operate health plans. We receive a fixed premium PMPM pursuant to our state contracts. Our Medicaid contracts with state governments are generally multi-year contracts subject to annual renewal provisions. We generally receive premium payments during the month in which we provide services, although from time to time, we have experienced delays in receiving payments from certain states. In some instances, our base premiums are subject to risk score adjustments based on our members' acuity. Generally, the risk score is determined by the state by analyzing encounter submissions of processed claims data to determine the acuity of our membership relative to the entire state's Medicaid membership. Additionally, in some states we are subject to meeting certain quality measures, operational measures or both in order to earn a contractual withhold of a percentage of our revenue or receive an incentive payment over and above our base premiums. We are also eligible to receive supplemental payments for obstetric deliveries and newborns in Arizona, Florida, Georgia, Illinois (through December 31, 2017), Missouri, Nebraska, New Jersey, New York and South Carolina.
Each contract is specific as to how and when these supplemental payments are earned and paid. Revenues are recorded based on membership and eligibility data provided by the states, which may be adjusted by the states for any subsequent updates to this data.
15
The following table sets forth information relating to Medicaid premium revenues from the states of Kentucky, Florida and Georgia, as well as all other states on an aggregate basis (in millions, except percentages).
For the Years Ended December 31, | ||||||||||||||||||||
2017 | 2016 | 2015 | ||||||||||||||||||
State | Revenue | Percentage of Total Segment | Revenue | Percentage of Total Segment | Revenue | Percentage of Total Segment | ||||||||||||||
Kentucky | $ | 2,612.7 | 24.4 | % | $ | 2,590.2 | 27.3 | % | $ | 2,610.9 | 28.8 | % | ||||||||
Florida | 2,541.4 | 23.7 | % | 2,506.6 | 26.4 | % | 2,305.9 | 25.4 | % | |||||||||||
Georgia | 1,590.4 | 14.8 | % | 1,615.9 | 17.0 | % | 1,636.2 | 18.0 | % | |||||||||||
All other states(1) | 3,981.8 | 37.1 | % | 2,786.6 | 29.3 | % | 2,521.3 | 27.8 | % | |||||||||||
Total | $ | 10,726.3 | 100.0 | % | $ | 9,499.3 | 100.0 | % | $ | 9,074.3 | 100.0 | % | ||||||||
(1) | “All other states” consists of Hawaii, Illinois, Missouri, New Jersey, New York, South Carolina and Texas during all years presented. In 2017, it also includes Arizona and Nebraska. Given that the Care1st transaction was completed on December 31, 2016, Care1st Arizona's 2016 results of operations were not significant to our consolidated statement of comprehensive income for the year ended December 31, 2016. |
Certain of our Medicaid contracts require us to expend a minimum percentage of premiums on eligible medical benefits expense. To the extent that we expend less than the minimum percentage of the premiums on eligible medical benefits and quality-related expenses, we are required to refund to the state all or some portion of the difference between the minimum and our actual allowable medical benefits expense. We estimate the amounts due to the state agencies as a return of premium based on the terms of our contracts with the applicable state agency. Additionally, certain of our Medicaid contracts provide profit sharing arrangements as a result of medical cost reduction. We estimate the amounts due from the state agencies as profit sharing based on the terms of our contracts with the applicable state agency.
We recognized $244.9 million and $219.2 million of reimbursement for the ACA industry fee, including its non-deductibility for income tax purposes, as premium revenue for the years ended December 31, 2016 and 2015, respectively.
Certain contracts expired in 2015 and 2016; however, we are still serving members as if these contracts were still effective and expect the contracts to be renewed. Our other current Medicaid contracts are set to expire or renew between June 2018 and December 2021. The following table sets forth the terms and expiration dates of our Medicaid contracts with the State of Florida and the Commonwealth of Kentucky, the two states that each accounted for greater than 10% of our consolidated premium revenues during 2017.
State | Line of Business | Term of Contract | Expiration Date of Current Term | Expiration Date if All Renewal Options Exercised | ||||
Florida | Medicaid (MMA) | February 4, 2014 - December 31, 2018 | December 31, 2018 | December 31, 2018 | ||||
Kentucky | Medicaid and CHIP | One potential one-year renewal(1) | June 30, 2018 | June 30, 2019(1) | ||||
(1) | In December 2017, we entered into a contract amendment with the Kentucky Department of Medicaid Services that renewed our participation in the Kentucky Medicaid program through June 30, 2018, and included one additional one-year renewal period upon mutual agreement. |
16
Medicare Health Plans
We contract with CMS under the Medicare program to provide a comprehensive array of Part C and Part D benefits to Medicare eligible persons, through our MA plans. Our MA plans are comprised of CCPs which are administered through HMOs and generally require members to seek health care services and select a PCP from a network of health care providers. In addition, we offer Medicare Part D coverage, which provides prescription drug benefits, as a component of our MA plans.
As of December 31, 2017, we offered MA plans in a total of 485 counties across 17 states to 496,000 members. As of January 1, 2018, we are offering MA plans in a total of 494 counties across 18 states to 504,000 members. We offer D-SNPs in 83.8% of the MA counties that we serve, and approximately 31% of our MA members are "dually-eligible" for Medicare and Medicaid and are enrolled in one of our D-SNPs. We cover a wide spectrum of medical services through our MA plans. For many of our plans, we provide additional benefits not covered by Original Medicare, such as vision, dental and hearing services. Through these enhanced benefits, out-of-pocket expenses incurred by our members are generally reduced, which allows our members to better manage their health care costs. We believe that our D-SNPs are attractive to these beneficiaries due to the enhanced benefit offerings and clinical support programs.
Some of our MA plans require members to pay a co-payment, which varies depending on the services and level of benefits provided. Typically, members of our MA CCPs are required to use our network of providers, except in specific cases such as emergencies, transition of care or when specialty providers in our network are unavailable to meet their medical needs. MA CCP members may see out-of-network specialists if they receive referrals from their PCPs and may be required to pay incremental cost-sharing.
We continue to focus on three main areas in MA, including:
• | Execution on medical expense and quality initiatives led by our clinical services group; |
• | Continued application of a more disciplined portfolio approach to our MA bids, including a focus on net income; and |
• | Improving Star Ratings, both in terms of execution on quality initiatives and our advocacy position to properly match the ratings, rules and economics with the prevalent data that demonstrates the connection between socio-economic status and lower quality ratings. |
Medicare Health Plans Membership
As of December 31, 2017, 2016 and 2015, our Medicare Health Plans segment had approximately 496,000, 345,000 and 354,000 members, respectively. Refer to Item 7 – Management's Discussion and Analysis of Financial Condition and Results of Operations for membership discussion by segment for 2017, 2016 and 2015.
As of January 1, 2018, our Medicare Health Plans segment had approximately 504,000 members, an increase of 5,000 compared with December 31, 2017.
Medicare Health Plans Segment Revenues
The amount of premiums we receive for each MA member is established by contract, although the rates vary according to a combination of factors, including the plan's quality score, upper payment limits established by CMS, the member's geographic location, age, gender, medical history or condition, or the services rendered to the member. MA premiums are due monthly and are recognized as revenue during the period in which we are obligated to provide services to members. We record adjustments to revenues based on member retroactivity. These adjustments reflect changes in the number and eligibility status of enrollees subsequent to when revenue was billed. We estimate the amount of outstanding retroactivity adjustments each period and adjust premium revenue accordingly. The estimates of retroactivity adjustments are based on historical trends, premiums billed, the volume of member and contract renewal activity and other information. Changes in member retroactivity adjustment estimates have not had a material effect on premiums recorded during the periods presented.
CMS provides risk-adjusted payments for MA plans and PDPs based on the demographics and health severity of enrollees. The risk-adjusted premiums we receive are based on claims and encounter data that we submit to CMS within prescribed deadlines. We develop our estimates for risk-adjusted premiums utilizing historical experience, or other data, and predictive models as sufficient member risk score data becomes available over the course of each CMS plan year. We recognize periodic changes to risk-adjusted premiums as revenue when the amounts are determinable and collection is reasonably assured, which are possible as additional diagnosis code information is reported to CMS, when the ultimate adjustment settlements are received from CMS, or we receive notification of such settlement amounts. CMS adjusts premiums on two separate occasions on a retrospective basis. The first retrospective adjustment for a given plan year generally occurs during the third quarter of that year. This initial settlement represents the update of risk scores for the current plan year based on the severity of claims incurred in
17
the prior plan year. CMS then issues a final retrospective risk adjusted premium settlement for that plan year in the following year.
The data provided to CMS to determine the risk score is subject to audit by CMS even after the annual settlements occur. Our Florida and Arizona MA plans have been selected by CMS for audits of the 2011 contract year and it is possible that CMS may conduct audits of other contracts and contract years on an ongoing basis. An audit may result in the refund of premiums to CMS. While our experience to date has not resulted in a material refund, future refunds could be significant, which would reduce our premium revenue in the year that CMS determines repayment is required.
Medicare Health Plans premium revenue for the year ended December 31, 2017, 2016 and 2015 was approximately $5.3 billion, $3.9 billion and $3.9 billion, respectively. Our MA contracts with CMS all have one year terms that expire at the end of each calendar year and are renewable for successive one-year terms unless CMS does not authorize a renewal or we notify CMS of our decision not to renew. Our current MA contracts expire on December 31, 2018.
Medicare PDPs
We have contracted with CMS to serve as a plan sponsor offering stand-alone Medicare Part D PDP plans to Medicare-eligible beneficiaries through our Medicare PDPs segment. As of January 1, 2018, we offer PDPs in 50 states and the District of Columbia. Our PDPs offer national in-network prescription drug coverage, including a preferred pharmacy network, subject to limitations in certain circumstances.
The PDP benefit design generally results in our incurring a greater portion of the responsibility for total prescription drug costs in the early stages of a plan year, and less in the latter stages of a plan year, due to the members' share of cumulative out-of-pocket costs increasing throughout the plan year. As a result, the PDP medical benefits ratio ("MBR") generally decreases throughout the year.
Our PDP contracts with CMS are renewable for successive one-year terms unless CMS notifies us of its decision not to renew by May 1 of the current contract year or we notify CMS of our decision not to renew by the first Monday in June of the contract year.
Medicare PDPs Membership
As of December 31, 2017, 2016 and 2015, we served approximately 1,152,000, 1,009,000 and 1,025,000 PDP members, respectively. Refer to Item 7 – Management's Discussion and Analysis of Financial Condition and Results of Operations for membership discussion by segment for 2017, 2016 and 2015.
Our 2018 PDP bids resulted in one of our basic plans being below the benchmarks in 25 of the 34 CMS regions, and within the de minimis range in five other regions, compared with our 2017 bids, in which we were below the benchmarks in 30 of the 34 CMS regions, and within the de minimis range in three other regions. As of January 1, 2018, we served approximately 1,078,000 PDP members, a decrease of approximately 74,000 from December 31, 2017 resulting from our 2018 bid positioning.
Medicare PDPs Segment Revenues
Annually, we provide written bids to CMS for our PDPs, which reflect the estimated costs of providing prescription drug benefits over the plan year. Substantially all of the entire premium for this insurance is paid by the federal government, and the balance is due from the enrolled beneficiaries and, in some cases, state pharmacy assistance programs. The premium and subsidy components under Part D are described below.
Member Premium—We receive a monthly premium from members based on the plan year bid we submitted to CMS. The member premium, which is fixed for the entire plan year, is recognized over the contract period and reported as premium revenue.
CMS Direct Premium Subsidy—Represents monthly premiums from CMS based on the plan year bid submitted by us as a plan sponsor. The monthly payment is a risk-adjusted amount per member and is based upon the member's health status as determined by CMS. Refer to the "Medicare Risk-Adjusted Premiums" section under the "Medicare Advantage (MA)" segment discussion above for a more detailed description of risk-adjusted premiums.
18
Low-Income Premium Subsidy—For qualifying low-income subsidy ("LIS") members, CMS pays for some or all of the LIS member's monthly premium. The CMS payment is dependent upon the member's income level, which is determined by the Social Security Administration.
Low-Income Cost Sharing Subsidy ("LICS")—For qualifying LIS members, CMS reimburses us for all or a portion of the LIS member's deductible, coinsurance and co-payment amounts above the out-of-pocket threshold. LICS subsidies are paid by CMS prospectively as a fixed PMPM amount, as determined based upon the plan year bids submitted by us as a plan sponsor to CMS. Approximately nine to ten months subsequent to the end of the plan year, a settlement payment is made between CMS and our plans based on actual claims experience.
Catastrophic Reinsurance Subsidy—CMS reimburses plans for 80% of the drug costs after a member reaches his or her out-of-pocket catastrophic threshold through a catastrophic reinsurance subsidy. Catastrophic reinsurance subsidies are paid by CMS prospectively as a fixed PMPM amount, and are determined based upon the plan year bids submitted by us as a plan sponsor to CMS. Approximately nine to ten months subsequent to the end of the plan year, a settlement payment is made between CMS and our plans based on actual claims experience.
Coverage Gap Discount Subsidy—CMS provides monthly prospective payments for pharmaceutical manufacturer discounts made available to members. The prospective discount payments are determined based upon the plan year bid submitted by plan sponsors to CMS and current plan enrollment. Following the plan year, CMS performs an annual reconciliation of the prospective discount payments received by our plan to the amount of actual manufacturer discounts made available to each plan's enrollees under the program.
Catastrophic reinsurance subsidies and the low-income member cost sharing subsidies represent cost reimbursements under the Medicare Part D program. We are fully reimbursed by CMS for costs incurred for these contract elements and, accordingly, there is no insurance risk to us. Therefore, amounts received for these subsidies are not considered premium revenue, and are reported, net of the subsidy benefits paid, as Funds receivable/held for the benefit of members in the consolidated balance sheets. The receipts and payments between us and CMS are presented on a net basis as financing activity in our consolidated statements of cash flows because we are essentially administering and paying the benefit subsidies on behalf of CMS. Historically, the settlement payments between us and CMS have not been materially different from our recorded estimates.
Coverage gap discount subsidies ("CGD") advance payments are recorded as funds receivable/held for the benefit of members in the consolidated balance sheets. Receivables are set up for manufacturer-invoiced amounts. Manufacturer payments reduce the receivable as payments are received. After the end of the contract year, during the Medicare Part D Payment reconciliation process for the CGD, CMS will perform a cost-based reconciliation to ensure the Medicare Part D sponsor is paid for gap discounts advanced at the point of sale, based on accepted claims data.
CMS Risk Corridor—Premiums from CMS are subject to risk sharing through the Medicare Part D risk corridor provisions. The CMS risk corridor calculation compares the target amount of prescription drug costs (limited to costs under the standard coverage as defined by CMS) less rebates in the plan year bid to actual experience. Variances of more than 5% above the target amount will result in CMS making additional payments to plan sponsors and variances of more than 5% below the target amount will require plan sponsors to refund to CMS a portion of the premiums received. Historically, we have not experienced material adjustments related to the CMS settlement of the prior plan year risk corridor estimate.
PDP premium revenue for the year ended December 31, 2017, 2016 and 2015 was approximately $913.8 million, $845.0 million and $901.7 million, respectively.
19
OUR OPERATIONS
Provider Networks and Provider Reimbursement Methods
As of December 31, 2017, we contracted with approximately 427,000 health care providers and 42,000 pharmacies to provide our members with access to medically necessary services. Our contracted providers deliver a variety of services to our members including: primary and specialty physician care; laboratory and imaging services; inpatient, outpatient, home health and skilled facility care; medication and injectable drug therapy; ancillary services; durable medical equipment and related services; mental health and chemical dependency counseling and treatment; transportation; and dental, hearing and vision care.
The following are the types of providers in our Medicaid and MA CCP contracted networks:
• | Professionals such as PCPs, provider groups, specialty care physicians, psychologists and licensed social workers; |
• | Facilities such as hospitals with inpatient, outpatient and emergency services, skilled nursing facilities, outpatient surgical facilities and diagnostic imaging centers; |
• | Ancillary providers such as laboratory providers, radiology, home health, physical therapy, speech therapy, occupational therapy, ambulance providers and transportation providers; and |
• | Pharmacies, including retail pharmacies, mail order pharmacies and specialty pharmacies. |
These providers are contracted through a variety of mechanisms, including agreements with individual providers, groups of providers, independent provider associations, integrated delivery systems and local and national provider chains such as hospitals, surgical centers and ancillary providers. We also contract with other companies who provide access to contracted providers, such as pharmacy, dental, hearing, vision, transportation and mental health benefit managers.
Facility, pharmacy, dental, vision and behavioral health contracts cover medically necessary services and, under some of our plans, enhanced benefits. These contracts typically have terms of one to four years with some of the agreements automatically renewing at the end of the contract period, unless otherwise specified in writing by either party. During the contract period, these agreements typically can be terminated without cause upon written notice by either party, but the notification period may range from 90 to 180 days and early termination may subject the terminating party to financial penalties.
The contract terms require providers to participate in our quality improvement and utilization review programs, which we may modify from time to time. Providers must also adhere to applicable state and federal regulations.
We periodically review payments made to providers and make adjustments, as necessary. Generally, our contracts with providers do not allow for automatic annual increases in reimbursement levels; however, we review these contracts periodically to ensure competitiveness. Among the factors generally considered in routine adjustments are changes to state Medicaid or Medicare fee schedules, competitive environment, current market conditions, anticipated utilization patterns and projected medical expenses. Some provider contracts are directly tied to state Medicaid or Medicare fee schedules, in which case, reimbursement levels will be adjusted up or down, generally on a prospective basis, based on adjustments made by the state or CMS to the appropriate fee schedule.
Physicians and Provider Groups
PCPs play an important role in coordinating and managing the care of our Medicaid and MA CCP members. This coordination includes delivering preventive services as well as referring members to other providers for medically necessary services. PCPs are typically trained in internal medicine, pediatrics, family practice, general practice or, in some markets, obstetrics and gynecology. In rare instances, a physician trained in sub-specialty care will perform primary care services for a member with a chronic condition.
Additionally, mental health and substance abuse are increasing areas of focus in our overall population’s health, providing a growing priority for our behavioral health providers. In response, we are forging new partnerships to support more comprehensive and integrated care including behavioral health homes and integrated health homes.
PCPs and specialty care providers are typically reimbursed a specified fee for the service performed, which is known as fee-for-service. The specified fee is set as a percentage of the amount Medicaid or Medicare would pay under the applicable fee-for-service program.
20
We reimburse some of our PCPs and specialty care provider groups on a fixed-fee PMPM basis. This type of reimbursement methodology is commonly referred to as capitation. The reimbursement covers care provided directly by the provider as well as coordination of care from other providers, as described above. In certain markets, we may also reimburse certain services such as vaccinations and laboratory or screening services delivered by the PCP in addition to the capitation payment.
Consistent with our long-term business priorities and emerging regulatory guidance, we have increased emphasis on aligning provider incentives with our objective of improving health care quality by employing a continuum of performance-based arrangements to incentivize providers to improve the quality of care they provide to our members. Beginning in 2017, substantially all of our contracted PCPs are eligible to participate in our quality incentive programs and/or other value-based arrangements. These arrangements consisted of additional payments for achieving specified quality of care targets. In 2017, 72% of Medicare and 45% of Medicaid payments were made through these value-based arrangements.
We also maintain shared-surplus, shared-risk and full-risk arrangements related to credentialing, utilization management and care coordination by establishing an operating fund for provider groups participating in these types of arrangements. We monitor the performance of this fund to determine whether these providers are eligible for shared savings payments or whether they should reimburse us if the contracts include shared or full risk provisions. Payments due to us are normally carried forward and offset against future potential surplus payments. PCPs participating in these specialized risk arrangements cover 74% and 32% of our MA and Medicaid membership, respectively, as of December 31, 2017.
In all instances, we require providers to submit data reporting all direct encounters with members. This data helps us to monitor the amount and levels of medical treatment provided to our members to help improve the quality of care provided and comply with regulatory reporting requirements. Our regulators use the encounter data that we submit, as well as data submitted by other health plans, to set reimbursement rates, assign membership, assess the quality of care being provided to members and evaluate contractual and regulatory compliance.
To help ensure quality of care, we credential and recredential all professional providers with whom we contract, including physicians, psychologists, licensed social workers, certified nurse midwives, advanced registered nurse practitioners and physician assistants who provide care under the supervision of a physician directly or through delegated arrangements. This credentialing and recredentialing is performed in accordance with standards required by CMS and consistent with the standards of the NCQA.
Facilities
Our health plans arrange for hospital care primarily through contracts with selected hospitals in their service areas for coverage of medically necessary care. These hospital contracts generally have multi-year terms or annual terms with automatic renewals and provide for payments on a variety of bases, including capitation, per diem rates, case rates and discounted fee-for-service schedules. These contracts typically can be canceled by either party, without cause, usually upon 90 days written notice. In some cases, a longer notice period may be required, such as where a longer period is required by regulation or the applicable government contract.
Inpatient services are sometimes reimbursed as a fixed global payment for an admission based on the associated diagnosis related group, or DRG, as defined by CMS. In many instances, certain services, such as implantable devices or particularly expensive admissions, are reimbursed as a percentage of hospital charges either in addition to, or in lieu of, the DRG payment. Certain facilities in our networks are reimbursed on a negotiated rate paid for each day of the member's admission, known as a per diem. This payment varies based upon the intensity of services provided to the member during admission, such as intensive care, which is reimbursed at a higher rate than general medical services.
Facility outpatient services are reimbursed either as a percentage of charges or based on a fixed-fee schedule for the services rendered, in accordance with ambulatory payment groups or ambulatory payment categories, both as defined by CMS. Outpatient services for diagnostic imaging are reimbursed on a fixed-fee schedule as a percentage of the applicable Medicare or Medicaid fee-for-service schedule or a capitation payment.
21
Ancillary Providers
Our typical ancillary agreements provide for coverage of medically necessary care and, in general, have terms of one year. These contracts automatically renew for successive one-year periods unless otherwise specified in writing by either party. These contracts typically can be canceled by either party, without cause, usually upon 90 days written notice. In some cases, a longer notice period may be required, such as where a longer period is required by regulation or the applicable government contract.
Ancillary providers, who provide services such as laboratory services, home health, physical, speech and occupational therapy, and ambulance and transportation services, are reimbursed on a capitation or fee-for-service basis.
Pharmacies
Pharmacy services are reimbursed based on a fixed fee for dispensing medication and a separate payment for the ingredients. Ingredients produced by multiple manufacturers are reimbursed based on a maximum allowable cost for the ingredient. Ingredients produced by a single manufacturer are reimbursed as a percentage of the average wholesale price. In certain instances, we may contract directly with the sole-source manufacturer of an ingredient to receive a rebate, which may vary based upon volumes dispensed during the year. Effective April 1, 2015, we outsourced pharmacy rebate management to a third party. As of January 1, 2016, we expanded the vendor relationship to include all pharmacy benefit management services, including rebates processing, claims processing, pre-authorization, utilization management and other related services.
Out-of-Network Providers
When our traditional HMO members receive services for which we are responsible from a provider outside our network, such as in the case of emergency room services from non-contracted hospitals, we generally attempt to negotiate a rate with that provider. In most cases, when a member is treated by a non-contracted provider, we are typically obligated to pay only the amount that the provider would have received from traditional Medicaid or Medicare.
Member Recruitment
Our member recruitment and marketing efforts for both Medicaid and Medicare members are heavily regulated by state agencies and CMS. For many products, we rely on the auto-assignment of members into our plans, including our PDP plan. The auto-assignment of a beneficiary into a health or prescription drug plan generally occurs when that beneficiary does not choose a plan. The agency with responsibility for the program determines the approach by which a beneficiary becomes a member of a plan serving the program. Some programs assign members to a plan automatically based on predetermined criteria. These criteria frequently include a plan's rates, the outcome of a bidding process, quality scores or similar factors. For example, CMS auto-assigns PDP members based on whether a plan's rate bids during the annual renewal process are above or below the CMS benchmark for that region. In most states, our Medicaid health plans benefit from auto-assignment of individuals who do not choose a plan, but for whom participation in managed care programs is mandatory. Each state differs in its approach to auto-assignment, but one or more of the following criteria is typical in auto-assignment algorithms: a Medicaid beneficiary's previous enrollment with a health plan or experience with a particular provider contracted with a health plan, enrolling family members in the same plan, a plan's quality or performance status, a plan's network and enrollment size, awarding all auto-assignments to a plan with the lowest bid in a county or region, and equal assignment of individuals who do not choose a plan in a specified county or region.
Our Medicaid marketing efforts are regulated by the states in which we operate, each of which imposes different requirements for, or restrictions on, Medicaid sales and marketing. These requirements and restrictions can be revised from time to time. Several states, including our three largest Medicaid states, Florida, Georgia and Kentucky, do not permit direct sales by Medicaid health plans. We rely on member selection and auto-assignment of Medicaid members into our plans in those states.
Our Medicare marketing and sales activities are regulated by CMS and the states in which we operate. CMS has oversight over all marketing materials used by MA plans, and in some cases has imposed advance approval requirements. Also, our sales activities are limited to those such as conveying information regarding benefits, describing the operations of our managed care plans and providing information about eligibility requirements.
We employ our own insurance agents and contract with independent, licensed insurance agents to market our MA and PDP products. We have continued to expand our use of independent agents whose cost is largely variable in nature and whose engagement is more conducive to the shortened Medicare selling season and the open enrollment period. The activities of our
22
independently licensed insurance agents are also regulated by CMS. We also use direct mail, mass media and the Internet to market our products.
A significant portion of our PDP membership is obtained from the auto-assignment of beneficiaries, which is dependent on the outcome of a bid process whereby plans submit bids to CMS based on their estimated cost to provide services in designated regions. Plans that submit bids below the benchmark of other plans’ bids in their bidding region are eligible for auto-assignment of LIS beneficiaries.
Quality Improvement
We are focused on improving quality across all of our lines of business, which is critical to the continued growth and success of our business. We continually seek to improve the quality of care delivered by our network providers to our members and our ability to measure the quality of care provided. Our quality improvement program provides the basis for our quality and utilization management functions. It outlines ongoing processes designed to improve the delivery of quality health care services to our members, as well as to enhance compliance with regulatory and accreditation standards. This program consists of a multi-year improvement plan with a more rigorous quality governance structure focused on driving better quality results.
Our quality improvement activities will continue to focus on:
• | Access; |
• | Preventive health and wellness; |
• | Care and disease management; |
• | Health plan accreditation; |
• | Provider credentialing; |
• | Provider education and incentives for closing care gaps; |
• | Member education and outreach; |
• | Information technology initiatives related to the above activities; |
• | Advocacy and community-based programs; and |
• | Oversight and audits. |
Access
We are focused on improving our members' access to a high-performing network of providers, including PCPs, specialists and ancillary providers, and ensuring that members see the appropriate providers, based on clinical condition. We help members access the right care at the right time in the appropriate setting through coordinated care teams and community partnerships. We recently added additional clinical resources in our markets to implement new care models.
Preventive health and wellness
We sponsor a number of initiatives aimed at the promotion of healthy lifestyles and the prevention of disease. These include programs focusing on preventive screenings, health education programs to inform members about health care issues and healthy behaviors, health assessment and counseling to inform members how to use the resources and services available to them to help reduce preventable diseases.
Care and disease management
We have enhanced our care management model to more effectively serve our most medically complex members. The model leverages both field-based and telephonic resources using state-specific, multi-disciplinary care teams. Our D-SNP care management helps reduce the fragmentation that exists in the current health care system, improving member access to quality care. We also employ intervention programs that include: a prenatal care management program to help women with high-risk pregnancies; a program to reduce the number of inappropriate emergency room visits; and disease management programs to decrease the need for emergency room visits and hospitalizations.
23
Health plan accreditation
All current WellCare health plans are either accredited or actively seeking accreditation by the National Committee for Quality Assurance ("NCQA"). NCQA Accreditation is the most comprehensive evaluation in the industry, and the only assessment that includes results of clinical performance (i.e., HEDIS measures) and consumer experience (i.e., Consumer Assessment of Healthcare Provider and Systems measures). We have achieved accreditation for our Medicaid health plans in Florida, Georgia, Hawaii, Illinois, Kentucky, Missouri, Nebraska, New Jersey, New York and South Carolina. Our Florida, Georgia, Hawaii, Illinois, Kentucky, New Jersey, New York, Tennessee, Arkansas, Mississippi, Texas, South Carolina, Connecticut, and Louisiana Medicare Health Plans are also NCQA accredited.
Provider credentialing
We credential physicians, hospitals and other health care professionals in our participating provider networks using quality criteria, which meet or exceed the standards of external accreditation or state regulatory agencies, or both. Typically, most health care professionals are re-credentialed every three years, depending on applicable state laws.
Provider education and incentives for closing care gaps
We expanded our Quality Practice Advisory program, which pairs a WellCare nurse clinician with a provider to assist our providers in identifying and closing gaps in member care. We believe that this program has been effective in closing care gaps and improving our quality scores in future years. As part of our quality improvement program, we implemented changes to our reimbursement methods to reward certain providers who encourage preventive care, such as well-child check-ups, prenatal care and/or who adopts evidence based guidelines for members with chronic conditions. Additionally, all of our markets offer provider incentives for closing care gaps inherent to the health care system. This initiative has resulted in increased member encounters to drive improvement in the quality of care.
Member education and outreach
We are focused on improving our members' access to a high-performing network of providers, including PCPs, specialists and ancillary providers. This will ensure that members see the appropriate providers, based on clinical condition. We have strengthened our resources focused exclusively on outreach to Medicaid and Medicare members to educate them on care gaps and assist with care gap closure. Intervention and support activities include arranging transportation assistance, three-way calls with a member and his/her primary care physician to schedule appointments, and arranging for home visits to assess and close care gaps. In addition, our medication therapy management initiatives empower patients to take an active role in managing their medications. We are focused on enhancing our members' experience by improving service and reducing complaint levels through improved grievance and appeals processes which we believe will result in improved member satisfaction survey results.
Information technology initiatives
We understand the importance of information technology in improving the level of service that we can provide to our members. Accordingly, we continue to invest in our information technology infrastructure and capabilities including tools that support our focus on improving our ability to ensure our members receive quality health care. We have specialized systems to support our quality improvement activities and to gather information from our systems to identify opportunities to improve care and track the outcomes of the services provided to achieve those improvements, such as evaluating the effects of particular preventive measures and improving member experience by addressing member specific needs.
Advocacy and community-based programs
WellCare connects community resources to help improve health outcomes and lower the overall cost of health care. We work to link people to social services such as food banks or meal delivery, housing assistance, financial assistance, transportation, education support, legal assistance and employment services.
Oversight and audits
Internally, our quality improvement programs benefit from executive oversight and project management processes. Additionally, each of our health plans has a Quality Improvement Committee comprised of senior members of management, medical directors and other key associates. Each of these committees reports directly to the applicable health plan board of directors, which has ultimate oversight responsibility for the quality of care rendered to our members. The Quality
24
Improvement Committees also have a number of subcommittees that are charged with monitoring certain aspects of care and service, such as health care utilization, pharmacy services and provider credentialing and re-credentialing. Several of these subcommittees include physicians as committee members.
Our board of directors recognizes the importance of delivering quality care and providing access to that care for our members and has established the Health Care Quality and Access Committee of the board. The primary purpose of this committee is to assist the board by reviewing, and providing general oversight of, our health care quality and access strategy, including our policies and procedures governing health care quality and access for our members. This input helps provide overall direction and guidance to our Quality Improvement Committees.
We conduct routine site audits of select providers and medical record audits to ensure the effectiveness of our quality improvement programs.
Information Technology
The accurate and timely capture, processing and analysis of critical data are cornerstones for providing managed care services. Focusing on data is also essential to operating our business in a cost effective manner. Data processing and data-driven decision making are key components of both administrative efficiency and medical cost management. We use our information systems for premium billing, claims processing, utilization management, reporting, medical cost trending, planning and analysis. The systems also support member and provider service functions, including enrollment, member eligibility verification, primary care and specialist physician roster access, claims status inquiries, and referrals and authorizations.
On an ongoing basis, we evaluate the ability of our existing operations to support our current and future business needs and to maintain our compliance requirements. As a result, we periodically consolidate, integrate, upgrade and expand our information systems capabilities as a result of technology initiatives, industry trends and recently enacted regulations, changes in our system platforms and integration of new business acquisitions. Our information systems require an ongoing commitment of significant resources to maintain, protect and enhance existing systems and develop new systems to keep pace with continuing changes in information processing technology, evolving systems and regulatory standards and changing customer preferences.
Secure maintenance of personal information and information technology systems is critical to our business operations. As a result, cybersecurity, physical security and the continued development and enhancement of our controls, processes and practices designed to protect our facilities, information systems and data from attack, damage or unauthorized access remain a priority for us. To ensure information security, we have implemented multiple layers of controls to protect the confidentiality, integrity and availability of this data and the systems that store and transmit such data. We utilize current security technologies, and our defenses are monitored and routinely tested internally and by external parties.
We have a disaster recovery plan that addresses how we recover business functionality within stated timelines. We have an agreement with a nationally-recognized, third-party vendor to provide for the restoration of our general support systems at a remote processing center. We perform disaster recovery testing at least annually for those business applications that we consider critical.
Our board of directors believes that information security is a critical component of the enterprise-wide risk management program. Our information security risk management practices are a core component of our enterprise-wide risk management program. The board’s information security oversight responsibilities include providing oversight of information security strategies and risk management; and assuring financial and other resources, including insurance related to information security events, are in place to support risk management. The board’s information security oversight includes regular reporting from members of senior management who are responsible for information security risk management practices. Reports cover areas such as process improvements, relevant risks and strategic initiatives. Pursuant to its charter, the Audit, Finance and Regulatory Compliance Committee (the “AFRC Committee”) of the board assists the board in the oversight of the enterprise risk management function, including information security.
Additionally, the Information Technology Oversight Committee of the board assists with oversight of major information technology initiatives and programs, consults with senior management regarding information strategy, assists the board in its oversight of information technology security programs and assists the AFRC Committee in its oversight of information technology internal controls and disaster recovery capabilities and strategies.
25
Outsourcing Arrangements
We determined, based on an evaluation of factors including cost, compliance, quality and procurement success, that it is more efficient to use third parties instead of our personnel for certain functions. As a result, we contract with a number of vendors to provide significant operational support including, but not limited to, pharmacy benefit management for our members as well as certain enrollment, billing, call center, benefit administration, claims processing, mail order pharmacy, reinsurance, sales and marketing and certain aspects of utilization management. Where a vendor provides services that we are required to provide under a contract with a government customer, we are responsible for such performance and will be held accountable by our government customers for any failure of performance by our vendors. We evaluate the competency and solvency of our third-party vendors prior to execution of contracts and endeavor to include service level guarantees and information security safeguards in our contracts, where appropriate. When we need to share PHI with a vendor, we ensure that a compliant HIPAA Business Associate Agreement is put in place. Additionally, we perform ongoing vendor oversight activities to identify any performance or other issues related to our vendors.
We maintain insurance that includes coverage for certain costs related to information security events.
Centralized Management Services
We provide centralized management services to each of our health plans from our Tampa, Florida headquarters and call centers. These services are provided by an affiliated administrator and include, among others, information technology, product development and administration, finance, human resources, accounting, legal, public relations, marketing, insurance, purchasing, risk management, internal audit, actuarial, underwriting, claims processing, customer service and certain aspects of clinical service.
Employees
As of December 31, 2017, we had approximately 8,900 full-time employees. Our employees are not represented by any collective bargaining agreement, and we have never experienced a work stoppage.
OUR COMPETITION
Competitive Environment
We operate in a highly competitive environment to obtain government health care program beneficiaries and manage the cost and quality of services that are delivered to these beneficiaries. We currently compete in this environment by offering Medicare and Medicaid health plans in which we accept all or nearly all of the financial risk for management of beneficiary care under these programs.
New entrants into the marketplace have contributed to the competitive environment. In addition, the increased use of technology to interact with members, providers and customers, increase the risks we currently face from new entrants and disruptive actions by existing competitors compared with prior periods.
We typically must be awarded a contract by the government agency with responsibility for a program in order to offer our services in a particular location. Some government programs choose to limit the number of plans that may offer services to beneficiaries, while other agencies allow an unlimited number of plans to serve a program, subject to each plan meeting certain contract requirements. When the number of plans participating in a program is limited, an agency generally employs a bidding process to select the participating plans.
As a result, the number of companies with which we compete varies significantly depending on the geographic market, business segment and line of business.
We believe that the significant factors that distinguish competing health plans include the perceived overall quality (including accreditation status), level of service, comprehensiveness of coverage, cost (including premium rates, provider arrangements and member out-of-pocket costs), financial stability and ratings, breadth and quality of provider networks, and quality of member support and care management programs. We believe that we are competitive on each of these factors. Some of our competitors may be more established with larger market share, greater financial resources or better quality scores than we have in some markets. Our ability to increase the number of persons covered by our plans or to increase our revenues is
26
affected by our ability to differentiate ourselves from our competitors on these factors. Competition may also affect the availability of services from health care providers, including primary care physicians, specialists and hospitals.
Competitive Factors—Program Participation
Regardless of whether the number of health plans serving a program is limited, we believe government agencies determine program participation based on several criteria. We compete for government program participation, renewals of those government contracts and members who have the ability to change health plans on the basis of the terms set in the bids as well as the breadth and depth of a plan's provider network; quality and utilization management processes; responsiveness to member complaints and grievances; timeliness and accuracy of claims payment; financial resources; historical contractual and regulatory compliance; quality scores, references and accreditation; and other factors. If not auto-assigned, potential members typically choose a health plan based on a specific provider being a part of the network, the quality of care and services available, accessibility of services, and reputation or name recognition of the health plan. As discussed in Our Operations-Member Recruitment above, a significant portion of our PDP membership is obtained from the auto-assignment of beneficiaries, which is dependent on the outcome of a bid process.
If we fail to compete effectively to maintain or increase our program participation, including by maintaining or increasing enrollments in existing government programs, our results of operations, financial position and cash flows could be materially and adversely affected.
Competitive Factors—Network Providers
We compete with other health plans to contract with hospitals, physicians, pharmacies and other providers for inclusion in our networks that serve government program beneficiaries. We believe providers select plans in which they participate based on several criteria. These criteria generally include reimbursement rates, timeliness and accuracy of claims payment, potential to deliver new patient volume and/or retain existing patients, effectiveness of resolution of calls and complaints, and other factors.
Medicaid Competitors
In the Medicaid managed care market, our principal competitors for state contracts, members and providers include the following types of organizations:
• | MCOs—Managed care organizations ("MCOs") that, like us, receive state funding to provide Medicaid benefits to members. Many of these competitors operate in a single or small number of geographic locations. There are a few multi-state Medicaid organizations that are able to leverage their infrastructure over a larger membership base. Competitors include private and public companies, which can be either for-profit or non-profit organizations, with varying degrees of focus on serving Medicaid populations. |
• | Medicaid Fee-For-Service—Traditional Medicaid offered directly by the states or a modified version whereby the state administers a primary care case management model. |
• | PSNs—A Provider Service Network ("PSN") is a network of providers that is established and operated by a health care provider or group of affiliated health care providers. A PSN operates as either a fee-for-service ("FFS") health plan or as a prepaid health plan that, like us, receives a capitated premium to provide Medicaid benefits to members. A PSN that operates as a FFS health plan is not at risk for medical benefit costs. FFS PSNs are at risk for 50% of their administrative cost allocation if their total costs exceed the estimated at-risk capitation amount. |
Medicare Competitors
In the Medicare market, which includes Medicare Advantage and Prescription Drug Plans, our primary competitors for contracts, members and providers include the following types of competitors:
• | Original Fee-For-Service Medicare—Original Medicare is available nationally and is a fee-for-service plan managed by the federal government. Beneficiaries enrolled in Original Medicare can go to any doctor, supplier, hospital or other facility that accepts Medicare and is accepting new Medicare patients. |
• | Medicare Advantage and Prescription Drug Plans—MA and stand-alone Part D plans are offered by national, regional and local MCOs and insurance companies that serve Medicare beneficiaries. In addition, prescription drug plans are |
27
being offered by or co-branded with retail drug store chains or other retail store chains, which may be able to offer lower priced plans and achieve benefits from integration with their pharmacy benefit management operations.
• | Employer-Sponsored Coverage—Employers and unions may subsidize Medicare benefits for their retirees in their commercial group. The group sponsor solicits proposals from MA plans and may select an HMO, preferred provider organization ("PPO") and/or PDP to provide these benefits. |
• | Accountable Care Organizations - Accountable Care Organizations (“ACOs”) are groups of doctors, hospitals, and other health care providers who come together voluntarily to provide coordinated high quality care to their patients. The goal of coordinated care is to ensure that patients, especially the chronically ill, get the right care at the right time, while avoiding unnecessary duplication of services and preventing medical errors. |
REGULATION AFFECTING OUR BUSINESS
Our health care operations are highly regulated by both state and federal government agencies. Regulation of managed care products and health care services is an ever-evolving area of law that varies from jurisdiction to jurisdiction. Regulatory agencies generally have discretion to issue regulations and interpret and enforce laws and rules. Changes in applicable laws, statutes, regulations and interpretive guidance occur frequently. These changes may include a requirement to provide health care services not contemplated in our current contracted premium rate or to pay providers at a state-mandated fee schedule without a commensurate adjustment to the premium rate. For further information, see the discussion above under Our Operations- Provider Networks and Provider Reimbursement Methods. In addition, government agencies may impose taxes, fees or other assessments upon us and other managed care companies at any time.
Our contracts with various state government agencies and CMS to provide managed health care services include provisions regarding provider network adequacy, maintenance of quality measures, accurate submission of encounter and health care cost information, maintaining standards of call center performance, prompt payment of claims, accuracy of provider directories and other requirements specific to government and program regulations. We must also have adequate financial resources to protect the state, our providers and our members against the risk of our insolvency. Our failure to comply with these requirements may result in the assessment of penalties, fines and liquidated damages. For further information on data provided to CMS that is subject to audit, refer to the discussion above under Product Segments-Medicare Health Plans- Medicare Health Plans Segment Revenues.
Our Medicaid plans are subject to periodic financial and informational reporting and comprehensive quality assurance evaluations. We regularly submit periodic financial, encounters, utilization and operations reports and other information to the appropriate Medicaid program regulatory agencies.
Our MA and PDP plans perform ongoing monitoring of our compliance with the CMS requirements, including functions performed by vendors. From time to time, CMS conducts examinations of our compliance with the provisions of our MA and PDP contracts.
Government enforcement authorities have become increasingly active in recent years in their review and scrutiny of various sectors of the health care industry, including health insurers and managed care organizations. We routinely respond to subpoenas and requests for information from these entities and, more generally, we endeavor to cooperate fully with all government agencies that regulate our business.
Licensing and Solvency Regulation
Our operations are conducted primarily through HMO and insurance subsidiaries. These subsidiaries are licensed by the insurance departments in the states in which they operate, except our New York HMO subsidiary, which is licensed as a prepaid health services plan by the New York State Department of Health, and our California HMO, which is licensed by the California Department of Managed Health Care. The subsidiaries are subject to the rules, regulations and oversight of the applicable state agencies in the areas of licensing and solvency. State insurance laws and regulations prescribe accounting practices for determining statutory net income, capital and surplus. Each of our regulated subsidiaries is required to report regularly on its operational and financial performance to the appropriate regulatory agency in the state in which it is licensed. These reports describe each of our regulated subsidiaries' capital structure, ownership, financial condition, certain intercompany transactions and business operations. From time to time, any of our regulated subsidiaries may be selected to undergo periodic audits, examinations or reviews by the applicable state agency of our operational and financial assertions.
28
Our regulated subsidiaries generally must obtain approval from, or provide notice to, the state in which it is domiciled before entering into certain transactions such as declaring dividends in excess of certain thresholds, entering into other arrangements with related parties, acquisitions or similar transactions involving an HMO or insurance company, or any change in control. For purposes of these laws, in general, control commonly is presumed to exist over an entity when a person, group of persons or entity, directly or indirectly, owns, controls or holds the power to vote 10% or more of the voting securities of that entity.
Each of our HMO and insurance subsidiaries must maintain a minimum amount of statutory capital determined by statute or regulation. For additional information on regulatory requirements, see Item 7 – Management's Discussion and Analysis of Financial Condition and Results of Operations – Regulatory Capital and Dividend Restrictions and Note 17 – Regulatory Capital and Dividend Restrictions to the consolidated financial statements.
HIPAA, HITECH, State Privacy Laws and Breach Notification Laws
The Health Insurance Portability and Accountability Act of 1996 ("HIPAA") and the regulations adopted under HIPAA are intended to improve the portability and continuity of health insurance coverage and simplify the administration of health insurance claims and related transactions.
The Health Information Technology for Economic and Clinical Health Act of 2009 (the "HITECH Act") modified certain provisions of HIPAA by, among other things, extending the privacy and security provisions to business associates, mandating new regulations around electronic health records, expanding enforcement mechanisms, and increasing penalties for violations.
On January 25, 2013, the U.S. Department of Health and Human Services ("HHS"), as required by the HITECH Act, issued the Final Omnibus Rules that provide final modifications to HIPAA rules to implement the HITECH Act.
The HITECH Act also contains a number of provisions that provide incentives for states to initiate certain programs related to health care and health care technology, such as electronic health records. While provisions such as these do not apply to us directly, states wishing to apply for grants under the HITECH Act, or otherwise participating in such programs, may impose new health care technology requirements on us through our contracts with state Medicaid agencies.
All health plans, including ours, are considered covered entities subject to HIPAA. HIPAA generally requires health plans, as well as their providers and vendors, to:
• | protect patient privacy and safeguard individually identifiable health information; and |
• | establish the capability to receive and transmit electronically certain administrative health care transactions, such as claims payments, in a standardized format. |
Specifically, the HIPAA Privacy Rule regulates use and disclosure of individually identifiable health information, known as “protected health information” (“PHI”). The HIPAA Security Rule requires covered entities to implement administrative, physical and technical safeguards to protect the security of electronic PHI. Certain provisions of the security and privacy regulations apply to business associates (entities that handle PHI on behalf of covered entities), and business associates are subject to direct liability for violation of these provisions. Furthermore, a covered entity may be subject to penalties as a result of a business associate violating HIPAA, if the business associate is found to be an agent of the covered entity.
Covered entities must report breaches of unsecured PHI to affected individuals without unreasonable delay, but not to exceed 60 days of discovery of the breach by a covered entity or its agents. Notification must also be made to HHS and, in certain situations involving large breaches, to the media. HHS is required to publish on its website a list of all covered entities that report a breach involving more than 500 individuals. All non-permitted uses or disclosures of unsecured PHI are presumed to be breaches unless the covered entity or business associate establishes that there is a low probability the information has been compromised. Various state laws and regulations may also require us to notify affected individuals in the event of a data breach involving individually identifiable information.
29
HIPAA violations by covered entities may result in civil and criminal penalties. Covered entities could face civil monetary penalties up to an annual maximum of $1.5 million for uncorrected violations based on willful neglect. HHS enforces the regulations and performs audits to confirm compliance. Investigations of violations that indicate willful neglect, for which penalties are mandatory, are statutorily required. HHS may also resolve HIPAA violations through informal means, such as allowing a covered entity to implement a corrective action plan, but HHS has the discretion to move directly to impose monetary penalties and is required to impose penalties for violations resulting from willful neglect. In addition, state attorneys general are authorized to bring civil actions seeking either injunctions or damages in response to violations of HIPAA privacy and security regulations that threaten the privacy of state residents.
We enforce a HIPAA compliance plan, which we believe complies with the HIPAA privacy and security regulations. We have dedicated resources to monitor compliance with our HIPAA compliance program.
We, our providers, and certain of our vendors are also subject to numerous other privacy and security laws and regulations at the federal and state levels. We remain subject to any federal or state privacy-related laws that are more restrictive than the privacy regulations issued under HIPAA. These laws vary and violations may result in additional penalties.
Fraud and Abuse Laws
Federal and state enforcement authorities have prioritized the investigation and prosecution of health care fraud, waste and abuse. Fraud, waste and abuse prohibitions encompass a wide range of operating activities, including kickbacks or other inducements for referral of members or for the coverage of products (such as prescription drugs) by a plan, billing for unnecessary medical services by a provider, improper marketing and violation of patient privacy rights. Companies involved in public health care programs such as Medicaid and Medicare are required to maintain compliance programs to detect and deter fraud, waste and abuse, and are often the subject of fraud, waste and abuse investigations and audits. The regulations and contractual requirements applicable to participants in these public-sector programs are complex and subject to change. Although we have structured our compliance program with care in an effort to meet all statutory and regulatory requirements, our policies and procedures are continuously under review and subject to updates and our training and education programs are always evolving. We have invested significant resources to enhance our compliance efforts and we expect to continue to do so.
Federal and state laws and regulations governing submission of information and claims to agencies
We are subject to federal and state laws and regulations that apply to the submission of information and claims to various agencies. For example, the federal False Claims Act provides, in part, that the federal government may bring a lawsuit against any person or entity who it believes has knowingly presented, or caused to be presented, a false or fraudulent request for payment from the federal government, or who has made a false statement or used a false record to get a claim approved. The federal government has taken the position that claims presented in violation of the federal anti-kickback statute may be considered a violation of the federal False Claims Act. Violations of the False Claims Act are punishable by treble damages and penalties of up to a specified dollar amount per false claim. In addition, a special provision under the False Claims Act allows a private person (for example, a "whistleblower" such as a disgruntled former associate, competitor or member) to bring an action under the False Claims Act on behalf of the government alleging that an entity has defrauded the federal government and permits the private person to share in any settlement of, or judgment entered in, the lawsuit. A number of states, including states in which we operate, have adopted false claims acts that are similar to the federal False Claims Act.
PRINCIPAL EXECUTIVE OFFICES
Our principal executive offices are located at 8735 Henderson Road, Renaissance One, Tampa, Florida 33634, and our telephone number is (813) 290-6200.
AVAILABILITY OF REPORTS AND OTHER INFORMATION
Our corporate website is http://www.wellcare.com. We make available on this website or in print, free of charge, our Annual Report on Form 10-K, Quarterly Reports on Form 10-Q, Current Reports on Form 8-K, Proxy Statement and amendments to those materials filed or furnished pursuant to Section 13(a) or 15(d) of the Securities and Exchange Act of 1934, as amended, as soon as reasonably practicable after we electronically file such materials with, or furnish such materials to, the Securities and Exchange Commission ("SEC").
30
Also available on our website, or in print to any stockholder upon request, are WellCare's Corporate Governance Guidelines and Code of Conduct and Business Ethics, as well as charters of the following committees of the board of directors: the Audit, Finance and Regulatory Compliance Committee, Compensation Committee, Health Care Quality and Access Committee, Information Technology Oversight Committee and Nominating and Corporate Governance Committee. In addition, we intend to disclose any amendments to, or waivers of, our Code of Conduct and Business Ethics on our website. To obtain printed materials contact Investor Relations at WellCare Health Plans, Inc., 8735 Henderson Road, Tampa, Florida 33634. In addition, the SEC's website is http://www.sec.gov. The SEC makes available on its website, free of charge, reports, proxy and information statements, and other information regarding issuers, such as us, that file electronically with the SEC. Information provided on our website or on the SEC's website is not part of this Annual Report on Form 10-K.
31
Item 1A. Risk Factors
You should carefully consider the following factors, together with all of the other information included in this report, in evaluating our company and our business. If any of the following risks actually occur, our business, results of operations, financial condition and cash flows could be materially and adversely affected, and the value of our stock could decline. The risks and uncertainties described below are those that we currently believe may materially affect our company. Additional risks and uncertainties not presently known to us or that we currently deem immaterial also may impair our business operations. As such, you should not consider this list to be a complete statement of all potential risks or uncertainties.
Risks Related to Our Business
The requirements of the Patient Protection and Affordable Care Act, as amended by the Health Care and Education Reconciliation Act of 2010 (collectively, the "ACA"), or its modification, may have a material adverse effect on our results of operations, financial condition and cash flows.
We believe the ACA, or its modification, will continue to bring about significant changes to the American health care system. The costs of funding the ACA, or its modification, may continue to be financed, in part, from substantial additional fees and taxes on us and other health insurers, health plans and individuals, as well as reductions in certain levels of payments to us and other health plans under Medicare.
The Medicaid expansion provisions remain optional for states. Some states have decided not to participate in the Medicaid expansion, and states currently participating may choose not to participate in the future. Congress may also withhold the funding necessary to operate the ACA, or its modification. Given the breadth of possible changes and the uncertainties of interpretation, implementation and timing of these changes, which we expect to occur over the next several years, the ACA, or any modification, could change the way we do business, potentially affecting our pricing, benefit design, product mix, geographic mix and distribution channels.
New or amended regulations and policies, as well as future legislative changes, may have a material adverse effect on our results of operations, financial condition, and cash flows by:
• | reducing the federal matching payments to state Medicaid programs; |
• | restricting revenue, enrollment and premium growth in certain products and market segments; |
• | restricting our ability to expand into new markets; |
• | increasing our medical and administrative costs; |
• | lowering our Medicare payment rates and/or increasing our expenses associated with the non-deductible federal premium tax and other assessments; |
• | encouraging states to contract with organizations that are not subject to the annual premium-based health insurance industry assessment imposed by the ACA (the "ACA industry fee") for their Medicaid programs; and |
• | encouraging states to integrate Medicare and Medicaid using a limited number of health plans or a fee for service model. |
In addition, the response of other companies to these policy, regulatory and legislative changes and adjustments to their offerings, if any, could have a meaningful effect in the health care markets.
The ACA included a number of changes that have affected the way plans operate, such as reduced Medicare premium rates, minimum MLR and other provisions.
Reduced Medicare Premium Rates
In April 2017, the CMS final call letter revised the proposed 2018 MA and Part D rates. We estimate the 2018 rates, as compared with 2017, will decrease slightly, excluding Medicare coding trends and the return of the ACA industry fee.
32
Minimum Medical Loss Ratio
Beginning in 2014, the ACA established a minimum MLR for MA and Part D plans, requiring plans to spend not less than 85% of premiums on medical and pharmacy benefits. The rules implementing the minimum MLR impose financial and other penalties for failing to achieve the minimum MLR, including requirements to refund to CMS shortfalls in amounts spent on medical benefits and termination of a plan’s MA contract for prolonged failure to achieve the minimum MLR. The MLR prescribed by HHS differs from the MLR calculation under generally accepted accounting principles in the United States of America ("GAAP") and is determined by adding a plan’s spending for clinical services, prescription drugs and other direct patient benefits, plus its total spending on quality improvement activities and dividing the total by earned premiums (after subtracting specific identified taxes and other fees). These provisions have not had a material effect on our results of operations in 2015, 2016 or 2017.
Other Provisions
The ACA imposed certain new taxes and fees, including limitations on the amount of compensation that is tax deductible, as well as the ACA industry fee on health insurers, which began in 2014. The ACA imposed certain new taxes and fees, including limitations on the amount of compensation that is tax deductible, as well as an annual premium-based health insurance industry assessment (the "ACA industry fee") on health insurers, which began in 2014. The total ACA industry fee levied on the health insurance industry was $11.3 billion in both 2015 and 2016, increasing to $14.3 billion in 2018. After 2018, the ACA industry fee increases according to an index based on net premium growth. The assessment is being levied on certain health insurers that provide insurance in the assessment year, and is allocated to health insurers based on each health insurer's share of net premiums for all U.S health insurers in the year preceding the assessment. The ACA industry fee is not deductible for income tax purposes, which has significantly increased our effective income tax rate. In December 2015, President Obama signed the Consolidated Appropriations Act, 2016 which, among other provisions, included a one-year moratorium on the ACA industry fee for 2017. While the ACA industry fee will be assessed in 2018, the continuing resolution approved in January 2018 provides for an additional one-year moratorium for 2019 for the ACA industry fee. The re-imposition of the ACA industry fee in 2018 and any future increases to the ACA industry fee could increase our tax rates and could adversely affect our results of operations, financial condition and cash flows.
The health reforms in the ACA allow, but do not require, states to expand eligibility for Medicaid programs. In addition, the uncertainty of federal matching funds for the state Medicaid programs, including the Medicaid expansion populations, may make states more likely to further delay expanding Medicaid eligibility. As a result, the effects of any potential future expansions and future federal financing are uncertain, making it difficult to determine whether the net effect of the ACA, or any modification, will be positive or negative for our Medicaid business.
Any failure by us to manage acquisitions, expansions, divestitures or other significant transactions successfully may have a material adverse effect on our quality scores, results of operations, financial condition and cash flows.
Our membership has grown substantially due to acquisitions, such as that of Universal American Corp. ("Universal American") in 2017, geographic expansions and organic growth, such as the statewide expansion of Medicaid in Missouri. We may not be successful in enhancing our infrastructure to support this continued growth, and delays in infrastructure improvements may have a material adverse effect on our quality scores, results of operations, financial condition and cash flows. In addition, due to the substantial initial costs related to acquisitions and expansions, such growth could adversely affect our short-term profitability and liquidity.
As part of our growth strategy, we identify potential acquisition targets, bid and negotiate acquisition terms, work with regulators to receive regulatory approval for the acquisition and once the transaction is closed, we must integrate the acquisition into our operations.
Once an attractive acquisition target is identified, we may not be successful in bidding against competitors. Even if we are successful in bidding against competitors, we may not be able to obtain the regulatory approval from federal and state agencies required to complete the acquisition. Depending on the transaction size, we may not be able to obtain appropriate financing. We may not be able to comply with the regulatory requirements necessary for approval of the acquisition or state regulators may give preference to competing offers made by locally-owned entities, competitors with higher quality scores or not-for-profit entities.
Once acquired, we may have difficulties integrating the businesses within our existing operations, due to factors such as:
• | new associates who must become familiar with our operations and company culture; |
33
• | acquired provider networks that operate on different terms than our existing networks and whose contracts may need to be renegotiated; |
• | existing members who decide to switch to another health care plan; |
• | disparate administrative and information technology systems; and |
• | difficulties implementing our operations strategy to operate the acquired businesses profitably. |
As a result, our acquired businesses may not perform as we anticipated, or in line with our existing businesses. In addition, if the expected future profitability of the acquired business declines, we may need to write down or incur impairment charges of the acquired assets. In the future, we may incur material expenses in connection with the integration and execution of acquisitions, expansions, and other significant transactions.
Furthermore, we may incur significant transaction expenses in connection with a potential acquisition or expansion opportunity that is not successful. If we are unable to effectively execute our acquisition strategy or integrate acquired businesses, our future growth may suffer and our profitability may decrease.
Our rate of expansion into other geographic areas may also be inhibited by factors such as:
• | the time and costs associated with obtaining the necessary licenses and approvals to operate; |
• | lower quality scores compared to our competitors; |
• | participation in fewer lines of business compared to our competitors; |
• | our inability to develop a network of physicians, hospitals and other health care providers that meets our requirements and those of government regulators; |
• | delays in the procurement, renewal or implementation of Medicaid or similar programs in new or existing states; |
• | CMS or state contract provisions regarding quality measures, such as CMS Star Ratings; |
• | competition, which increases the cost of recruiting members; |
• | the cost of providing health care services in those areas; |
• | demographics and population density; and |
• | applicable state regulations that, among other things, require the maintenance of minimum levels of capital and surplus. |
In any program start-up, acquisition, expansion or re-bid, the implementation of the contract, as designed, may be affected by factors beyond our control. These include political considerations, network development, contract appeals, incumbent Medicaid contractors, participation in other lines of business, membership assignment (allocation of members who do not self-select), errors in the bidding process, changes to the program design or implementation timing, difficulties experienced by other private vendors involved in the implementation, such as enrollment brokers, and noncompliance with contractual requirements with which we do not yet have experience and similar risks. As a result, our business, particularly plans for expansion or increased membership levels, could be negatively affected.
In addition, when making award determinations and evaluating proposed acquisitions and expansions, regulators frequently consider the plan’s historical regulatory compliance, litigation and reputation and we are required to disclose material investigations and litigation, including in some cases investigations and litigation that occurred in the past. As a result of our previous federal and state investigations, stockholder and derivative litigation, the restatement during 2009 of our previously issued financial statements and related matters, and the criminal trial of certain of our former executives and employees that concluded in the second quarter of 2013, we have been, and may continue to be, the subject of negative publicity. In addition, the Iowa Medicaid bid protest, and the subsequent ruling to exclude the Company from the program has resulted in negative publicity. Continuing negative publicity and other negative perceptions regarding these matters may adversely affect our ability to grow.
If we are unable to estimate and manage medical benefits expense effectively, our profitability likely will be reduced or we could become unprofitable.
Our profitability depends, to a significant degree, on our ability to estimate and effectively manage our costs related to the provision of health care services. Relatively small changes in the ratio of our expenses related to health care services to the premiums we receive (the “medical benefits ratio” or “MBR”) can create significant changes in our financial results. Many aspects of the managed care business are not predictable, and estimating medical benefits expense is a continuous process, which depends on the information available to us and our ability to utilize such information. Factors that may cause medical benefits expense to exceed our estimates include, but are not limited to:
34
• | the addition of new members, whether by acquisition, new enrollment, program startup or expansion (including geographic expansion), whose risk profiles are uncertain or unknown and for whom initiatives to manage their care take longer than expected; |
• | an increase in the cost of health care services and supplies, including pharmaceuticals, whether as a result of the introduction of new products or technologies, inflation or otherwise; |
• | the performance of our pharmaceutical benefit manager in managing our pharmaceutical costs; |
• | higher-than-expected utilization of health care services; |
• | contractual provisions related to continuity of care for new members; |
• | contractual provisions or regulatory requirements restricting the use and design of medical expense initiatives, including the ability to control the pharmaceutical formulary in Medicaid programs; |
• | periodic renegotiation of hospital, physician and/or other provider contracts; |
• | the occurrence of catastrophes, natural disasters, epidemics, pandemics, terrorism or bio-terrorism; |
• | changes in the demographics of our members and medical trends affecting them; |
• | challenges in implementing medical expense cost control initiatives, especially during the first year of a new Medicaid program; |
• | new mandated benefits, increased mandated provider reimbursement rates or other changes in health care laws, regulations, public policy and/or practices; |
• | emerging changes in the economy; |
• | changes in members' behavior and health care utilization patterns; |
• | provider billing practices; and |
• | changes in the fee schedules, rate design, and reimbursement structure for health care services. |
The factors and assumptions that are used to develop our estimates of costs, including medical benefits expense, inherently are subject to greater variability when there is more limited experience or information available to us, or the state or federal client, such as when we commence operations in a new state or region or commence participation in a new program. In many cases, the degree of our ability to accurately estimate medical benefits expense may not be known until we have sufficient experience and more complete information. For example, levels of plan utilization and members’ use of medical services, provider claims submissions, our payment processes and other factors can result in identifiable patterns emerging only following the passage of a significant period of time after the occurrence of the underlying causes of deviations from our assumptions. If our medical benefits expense increases and we are unable to manage these medical costs effectively in the future, our profits would likely be reduced or we may not remain profitable, which would also affect our liquidity, cash flows and our ability to comply with statutory requirements.
Our medical benefits expense may exceed our estimates or our regulators’ actuarial pricing assumptions, and we may be unable to adjust the premiums we receive under our current contracts, which could have a material adverse effect on our results of operations, financial condition and cash flows.
Assumptions and estimates are utilized in establishing premium deficiency reserves. For example, we have established a premium deficiency reserve of $45.6 million in connection with the expanded Illinois Medicaid program. If our assumptions in establishing reserves are inconsistent with actual experience, our reserves may be inadequate to pay medical costs. We may be required to increase our premium deficiency reserve, or establish new premium deficiency reserves in connection with other contracts, which could have a material adverse effect on our results of operations and financial condition.
Our MA and PDP plans, as well as certain of our Medicaid plans, are subject to a minimum MLR, which requires health plans to spend not less than a certain percentage of premiums on medical benefits. If a minimum MLR is not met, then we could be required to refund a portion of our premiums back to the state or CMS, as applicable.
In addition, there are sometimes wide variations in the established rates per member in both our Medicaid and Medicare lines of business. For instance, the rates we receive for a Supplemental Security Income (“SSI”) member are generally significantly higher than for a non-SSI member who is otherwise similarly situated. As the composition of our membership base changes as the result of programmatic, competitive, regulatory, benefit design, economic or other changes; there is a corresponding change to our premium revenue, costs and margins, which may have a material adverse effect on our results of operations, financial condition and cash flows.
Some provider contracts are directly tied to state Medicaid or Medicare fee schedules, which the state or CMS, respectively, may increase without granting a corresponding increase in premiums to us. We have experienced similar types of adjustments in states in which we operate. Unless such adjustments are mitigated by an increase in premiums, or if this were to occur in any more of the states in which we operate, our profitability will be negatively affected.
35
Also, in some rural areas, it is difficult to maintain a provider network sufficient to meet regulatory requirements. In situations where we have a deficiency in our provider network, regulators require us to allow members to obtain care from out-of-network providers at no additional cost, which could have a material adverse effect on our ability to manage medical benefits expenses. In some states, with respect to certain services, the amount that the health plan must pay to out-of-network providers for services provided to our members is defined by law or regulation, but in certain instances it is either not defined or it is established by a standard that is not clearly translatable into dollar terms. Out-of-network providers may believe they are underpaid for their services and may either litigate or arbitrate their dispute with the health plan. The uncertainty of the amount to pay and the possibility of subsequent adjustments of the payment could adversely affect our results of operations, financial condition and cash flows.
Although we maintain reinsurance to protect us against certain severe or catastrophic medical claims, we cannot assure that such reinsurance coverage currently is or will be adequate or available to us in the future or that the cost of such reinsurance will not limit our ability to obtain it.
Failure to maintain satisfactory quality and service measures could negatively affect our premium rates, subject us to penalties, limit or reduce our membership, impede our ability to compete for new business in existing or new markets or result in the termination of our contracts, which would have a material adverse effect on our business, rate of growth and results of operations, financial condition and cash flows.
Quality scores are used by certain agencies to establish premium rates or, in the case of CMS, to pay bonuses to MA plans that enable high scoring plans to offer enhanced health benefits, which are attractive to members.
Certain provisions in the ACA provide additional Medicare revenue related to the achievement of higher Star Ratings that can be used to offer more attractive benefit packages to members and/or achieve higher profit margins. In addition, plans with Star Ratings of 4.0 or higher are eligible for year-round open enrollment, whereas plans with lower Star Ratings have more restrictions on enrollment criteria and timing. Part C or Part D Medicare plans with Star Ratings of less than three stars for three consecutive years are denoted as "low performing" plans on the CMS website and in the CMS "Medicare and You" handbook. In addition, CMS could exercise its authority to terminate the MA and PDP contracts for plans rated below three stars for three consecutive years for the plan year 2020. As a result, plans that achieve higher Star Ratings may have a competitive advantage over plans with lower Star Ratings.
CMS’s current quality measurement methodology does not appropriately account for socio-economic determinants of health. Because we have a greater percentage of lower-income members than average, we may be unable to achieve or maintain a 4.0 Star Rating for some or all of our plans without a legislative or regulatory adjustment to the quality measurement methodology. Though various regulatory and legislative solutions have been proposed, we continue to work with our legislative and regulatory partners to ensure this issue is adequately addressed. However, our efforts may not be successful, and we could continue to have plans with Star Ratings lower than our competitors, which could have a material adverse effect on our membership and profitability of our MA and PDP lines of business.
In October 2017, CMS announced 2018 MA and PDP Star Ratings. Three of our 16 active MA contracts received an overall rating of 4.0 stars or higher and served approximately 38.7% of our December 31, 2017 MA membership, including contracts serving certain of our members in Florida, Maine, New York and Texas. Four of our MA contracts received an overall rating of 3.5 stars and served approximately 11.7% of our December 31, 2017 MA membership, including contracts serving certain of our members in Arizona, California, New Jersey, and New York. Eight of our MA contracts received an overall rating of 3.0 stars, while we have one MA plan that received an overall score of 2.5 stars serving our members in Hawaii and Louisiana.
Our MA plan serving Arkansas, Illinois, Mississippi, South Carolina and Tennessee received a score of 2.5 stars for its Part C operations for 2017 and 2018 and could be subject to termination by CMS if the score does not improve for 2019. Additionally, our PDP plan received a score of 2.5 stars for 2017 and 2018 and could subject the contract to termination by CMS if the score does not improve for 2019.
In certain state Medicaid programs, plans that do not meet applicable quality and service measures can be required to refund premiums previously received, may not receive premiums withheld, may not be able to earn quality bonuses, may be required to pay penalties or may be subject to enrollment limitations, including suspension of auto assignment of members, or termination of the contract. In addition, if the state determines that a health plan has failed to meet the contractual requirements for quality measures, these contracts may be subject to termination or other remedies, such as liquidated damages, at the discretion of the state. We are unable to predict what actions a state may take, if any, when assessing our contractual performance.
36
In addition, lower quality scores compared to our competitors may adversely affect our ability to attract members and obtain regulatory approval for acquisitions or expansions or succeed in competitive bidding situations. As a result, lower quality scores compared to our competitors could have a material adverse effect on our business, rate of growth, results of operations, financial condition and cash flows.
Our encounter data may be inaccurate or incomplete, which could have a material adverse effect on our results of operations, financial condition, cash flows and ability to bid for, and continue to participate in, certain programs.
Our contracts require the submission of complete and correct encounter data. The accurate and timely reporting of encounter data is increasingly important to the success of our programs because more states are using encounter data to determine compliance with performance standards and to set premium rates. We have expended and may continue to expend additional effort and incur significant additional costs to collect or correct inaccurate or incomplete encounter data and have been, and continue to be exposed to, operating sanctions and financial fines and penalties for noncompliance. In some instances, our government clients have established retroactive requirements for the encounter data we must submit. There also may be periods of time in which we are unable to meet existing requirements. In either case, it may be prohibitively expensive or impossible for us to collect or reconstruct this historical data.
We have experienced challenges in obtaining complete and accurate encounter data, due to difficulties with providers and third-party vendors submitting claims in a timely fashion in the proper format, and with state agencies in coordinating such submissions. As states increase their reliance on encounter data, these difficulties could adversely affect the premium rates we receive and how membership is assigned to us and subject us to financial penalties, which could have a material adverse effect on our results of operations, financial condition, cash flows and our ability to bid for, and continue to participate in, certain programs.
We rely on a number of third parties, and failure of any one of the third parties to perform in accordance with our contracts or applicable law could have a material adverse effect on our business and results of operations.
We have determined, based on an evaluation of factors, including cost, compliance, quality and procurement success, that it is more efficient to use third parties for certain functions and services. As a result, we have contracted with a number of third parties to provide significant operational support including, but not limited to, pharmacy benefit management for our members as well as certain enrollment, billing, call center, benefit administration and claims processing functions, sales and marketing, reinsurance, quality improvement efforts and certain aspects of utilization management. We have limited ability to control the performance of these third parties. If a third party provides services that we are required to provide under a contract with a government client, we are responsible for such performance and will be held accountable by the government client for any failure of performance by our vendors. Significant failure by a third party to perform in accordance with the terms of our contracts or applicable law could subject us to fines or other sanctions or otherwise have a material adverse effect on our business and results of operations. In addition, upon termination of a third party contract, we may encounter difficulties in replacing the third party on favorable terms, transitioning services to another vendor, or in assuming those responsibilities ourselves, which may have a material adverse effect on our business, quality scores and results of operations. Further, we rely on state-operated systems and sub-contractors to qualify and assign eligible members into our health plan. Ineffectiveness of these state operations and sub-contractors can have a material adverse effect on our enrollment.
Our Medicaid operations are concentrated in a limited number of states. Loss of a material contract, insufficient premium rates, delayed payment of earned premiums, refund of overpayments or decreased membership and other factors may adversely affect our business, results of operations, financial condition and cash flows.
Our concentration of Medicaid operations in a limited number of states could cause our revenue, profitability or cash flow to change suddenly and unexpectedly as a result of insufficient premium rates, payment delays, refund of overpayments, loss of a material contract, legislative actions, changes in Medicaid eligibility methodologies, including recertification requirements for eligibility, increased competition, catastrophic claims, epidemics, pandemics, unexpected increases in utilization, advances in medical technology and pharmaceutical therapies, difficulties in managing provider costs, general economic conditions and similar factors in those states. Our inability to continue to operate in any of these states or a significant change in the nature of our existing operations, could adversely affect our business, results of operations, financial condition and cash flows. Unfavorable changes in health care or other benefit costs or reimbursement rates or increased competition in these states could have a disproportionately adverse effect on our operating results.
37
For the year ended December 31, 2017, our Medicaid operations in Florida and Kentucky each accounted for greater than 10% of our consolidated premium revenue, net of premium taxes. These customers accounted for contracts that have terms of between one and three years with varying expiration dates.
Our Medicaid contracts are generally intended to run for one to three years and in some cases may be extended for additional years if the state or other sponsoring agency elects to do so. When our state contracts expire, they may be opened for bidding by competing health care plans. For example, the State of Florida is in the process of re-procuring Medicaid services for a five-year term commencing January 1, 2019. There is no guarantee that our contracts will be renewed or extended or, if renewed or extended, on what terms. Further, our contracts with the states are subject to cancellation by the state after a short notice period in the event of unavailability of state funds. Our contracts could also be terminated if we fail to perform in accordance with the standards set by state regulatory agencies. If any of our contracts are terminated, not renewed or extended, renewed or extended on less favorable terms or not renewed or extended on a timely basis or if an increased number of competitors were awarded contracts in these states, our business will suffer, and our results of operations, financial condition and cash flows may be materially affected.
Most of our Medicaid revenues under these contracts are generated by premiums consisting of fixed monthly payments per member and supplemental payments for other services such as maternity deliveries, depending on the type of member in our plans. The payments are generally set based on an estimation of the medical costs using actuarially sound methods based on historical data, factors and assumptions. When we commence operations in a new state or region or commence participation in a new program, the factors and assumptions used to develop premiums and premium rates are subject to greater variability as there is limited experience or information available to us and the state. Actual experience could differ from the assumptions used in the premium-setting process, which could result in premiums being insufficient to cover our medical benefits expense.
In addition, our premium revenues remain subject to reconciliation and recoupment for many years. The refund of premium overpayment to the government customer could be significant and would reduce our premium revenue in the year that the repayment obligation is identified.
State governments generally are experiencing tight budgetary conditions within their Medicaid programs. As a result, government agencies with which we contract may seek funding alternatives, which may result in reductions in funding, or changes to program design, including member eligibility and benefits for their Medicaid programs. For example, the State of Kentucky expects to implement new premium and work requirements for certain members to maintain their eligibility for the Medicaid program beginning on July 1, 2018, which may reduce our Medicaid membership in Kentucky. If any state in which we operate were to decrease premiums paid to us for these reasons or any other reason, decrease members eligible to participate in the programs, reduce the benefits offered by the programs, or pay us less than the amount necessary to keep pace with our cost trends, or delay increases in premiums, these could have a material adverse effect on our revenues and results of operations. We have experienced rate decreases and rate increase delays in the past and may do so in the future. Economic conditions affecting state governments and agencies could also result in delays in receiving premium payments. If there is a significant delay in our receipt of premiums to pay health benefit costs, it could have a material adverse effect on our results of operations, financial condition, cash flows and liquidity.
A significant percentage of our Medicaid plan enrollment results from mandatory enrollment in Medicaid managed care plans. States may mandate that certain types of Medicaid beneficiaries enroll in Medicaid managed care through CMS-approved state plan amendments or, for certain groups, through federal waivers or demonstrations. Waivers and programs under demonstrations are generally approved for two- to five-year periods and can be renewed on an ongoing basis if the state applies and the waiver request is approved or renewed by CMS. We have no control over this renewal process. If a state in which we operate does not mandate managed care enrollment in its state plan or does not renew an existing managed care waiver, our membership would likely decrease, which could have a material adverse effect on our results of operations.
We derive a significant portion of our cash flow and gross margin from our PDP operations, for which we submit annual bids for participation. The results of our bids could materially affect our results of operations, financial condition and cash flows.
A significant portion of our PDP membership is obtained from the auto-assignment of beneficiaries in CMS-designated regions where our PDP premium bids are below benchmarks of other plans’ bids. In general, our premium bids are based on assumptions regarding PDP membership, utilization, drug costs, drug rebates and other factors for each region. Our 2018 PDP bids resulted in one of our basic plans being below the benchmarks in 25 of the 34 CMS regions, and within the de minimis range in five other regions, compared with our 2017 bids, in which we were below the benchmarks in 30 of the 34 CMS regions, and within the de minimis range in three other regions. For those regions in which we are within the de minimis range, we will not be eligible to have new members auto-assigned to us, but we will not lose our existing auto-assigned membership.
38
If our future Part D premium bids are not below the CMS benchmarks, we risk losing PDP members who were previously assigned to us and we may not have additional PDP members auto-assigned to us, which could materially reduce our revenue and profits.
If our actual costs of providing prescription drugs are higher than our estimated costs of providing prescription drugs when we provided our bids to CMS, our funds receivable from CMS could be higher than we anticipated, which could have a material adverse effect on our cash flow and liquidity.
We may not be able to generate or access sufficient cash to service all of our indebtedness or successfully secure alternatives to satisfy our obligations under our indebtedness.
As of December 31, 2017, we had approximately $1.2 billion in aggregate principal amount of total indebtedness outstanding primarily consisting of $1.2 billion senior notes due 2025 (the "Senior Notes"). Additionally, we had $1.0 billion available for borrowing under our 2016 Revolving Credit Facility (the "Credit Agreement"). Our ability to make scheduled payments on or to refinance our debt obligations depends on our and our subsidiaries’ financial condition and operating performance, which is subject to prevailing economic and competitive conditions and to certain financial, business, competitive, legislative, regulatory and other factors beyond our control. As a result, we may not be able to maintain a level of cash flows from operating activities or to access the cash flows of our subsidiaries in an amount sufficient to permit us to pay the principal and interest on our indebtedness, including the Senior Notes and the Credit Agreement. We cannot assure that our business will generate sufficient cash flow from operations or that financing sources will be available to us in amounts sufficient to enable us to pay our indebtedness, including the Senior Notes and the Credit Agreement, or to fund our other liquidity needs.
If our cash flows and capital resources are insufficient to fund our debt service obligations, we may be forced to reduce or delay investments and capital expenditures, or to sell assets, seek additional capital or restructure or refinance our indebtedness, including the Senior Notes. These alternative measures may not be successful and may not permit us to meet our scheduled debt service obligations. Our ability to restructure or refinance our debt will depend on the condition of the capital markets and our financial condition at such time. Any refinancing of our debt could be at higher interest rates and may require us to comply with more onerous covenants, which could further restrict our business operations. The terms of existing or future debt instruments and the indenture that governs the Senior Notes may restrict us from adopting some or all of these alternatives. If we are unable to pay our indebtedness on time, it could result in the acceleration of our indebtedness and materially adversely affect us.
Future changes in health care laws present challenges for our business that could have a material adverse effect on our results of operations, financial condition and cash flows.
Future changes in, or interpretations to, existing health care laws or regulations, or the enactment of new laws or the issuance of new regulations could materially reduce our revenue and/or profitability by, among other things:
• | imposing additional license, registration and/or capital requirements; |
• | increasing our administrative and other costs; |
• | requiring us to change our operating structure; |
• | requiring significant additional reporting and technological capabilities; |
• | imposing additional fees and taxes, which cannot be offset by increased premium revenue; |
• | increasing mandated benefits, such as the proposed mental health parity regulation; |
• | further limiting our ability to engage in intra-company transactions with our affiliates and subsidiaries; |
• | restricting our revenue and enrollment growth; |
• | requiring us to restructure our relationships with providers; and |
• | requiring us to implement additional or different programs and systems. |
On May 6, 2016, CMS published regulations that overhauled Medicaid managed care requirements. These regulations include requirements that state Medicaid programs evaluate network adequacy standards and impose a requirement of managed care organizations ("MCO") to report MLRs annually to states, as well as a requirement that states set MCO rates to reasonably achieve an MLR of greater than 85% as long as the capitation rates are actuarially sound. Additionally, these regulations expand federal financial participation reimbursement opportunities related to members with behavioral (mental) health issues who receive short term services in an alternative mental disease institution and outline requirements for value-based provider contracting. Under the regulations, the states may also be tasked with developing and publicizing plan quality rating results. The degree of federal oversight in implementing these regulations is uncertain, and the states may retain substantial flexibility
39
in designing their Medicaid programs. Implementation or lack of implementation by CMS and the state Medicaid agencies of these regulations may materially adversely affect our results of operations, financial condition and cash flows.
Requirements relating to increased plan information disclosure, expedited appeals and grievance procedures, third party review of certain medical decisions, health plan liability, access to specialists, “clean claim” (a claim for which no additional information is needed), payment methodologies and timing, utilization of mail order pharmacy, administrative simplification, mandatory network inclusion of certain providers, mandated increases in provider reimbursement rates, physician collective bargaining rights, centralized credentialing and confidentiality of medical records either have been enacted or are under consideration. Changes in state law, regulations and rules also may have a material adverse effect on our results of operations, financial condition and cash flows.
The Medicare Access and CHIP Reauthorization Act of 2015 was enacted in April 2015, which, among other things, extended the Special Needs Program through 2018. On January 22, 2018, CHIP funding was extended for six years as part of a broader continuing resolution to fund the federal government. In addition, the resolution continued the enhanced federal match rate for CHIP established by the ACA initially, but reduced the rate over time. The resolution also extended the requirement for states to maintain coverage for children from 2019 through 2023, but after October 1, 2019, the requirement is limited to children in families with incomes at or below 300% of the federal poverty level. On February 9, 2018, the Bipartisan Budget Act of 2018 was enacted, which extended CHIP for an additional four years, until 2027, and permanently reauthorized MA special needs plans but imposed additional requirements for care coordination and integration of long-term services and supports. The funding of the CHIPs and Special Needs Programs by the federal government may be limited further, and eligibility for those programs may also be further restricted. If these programs are further modified or the funding further restricted, states could cease operating these programs, or limit their eligibility or benefits, or impose new requirements, which could have a material adverse effect on our revenues, cash flow, membership and profitability.
The Bipartisan Budget Act of 2018 also added additional flexibility to how ACOs can operate and accelerated the timing of the closure of the Part D “coverage gap” (i.e., the dollar threshold at which an individual has to pay full price for his or her medications). As a result, Part D beneficiaries' co-pays will be reduced to 25% of prescription costs in 2019, instead of that reduction occurring in 2020 under prior law. These changes, and other future changes to federal and state health care laws and regulations could have a material adverse effect on our results of operations, financial condition and cash flows.
We encounter significant competition for program participation, members, network providers, key personnel and sales personnel and our failure to compete successfully may limit our ability to increase or maintain membership in the markets we serve, or have a material adverse effect on our business, growth prospects and results of operations.
We operate in a highly competitive industry. The criteria and scoring of the criteria used to award participation in certain government programs, such as Medicaid and CHIP, are subject to substantial discretion and vary greatly among them. Some of our competitors are more established in the insurance and health care industries, with larger market share, greater financial resources and better quality scores than we have in some markets. We also operate in, and may attempt to acquire business in, programs or markets in which premiums are determined on the basis of a competitive premium bidding process. In these programs or markets, funding levels established by bidders with significantly different cost structures, target profitability margins or aggressive bidding strategies could negatively affect our ability to maintain or acquire profitable businesses, which could have a material adverse effect on our results of operations.
Regulatory reform or other initiatives may bring additional competitors into our markets. Regulators may prefer companies that operate in lines of business in which we do not operate when we bid on new business or renewals of existing business, which may cause our bid or renewal to be unsuccessful.
We compete for members principally on the basis of size and quality of provider network, benefits provided and quality of service. We may not be able to develop innovative products and services that are attractive to members. We cannot be sure that we will continue to remain competitive, nor can we be sure that we will be able to successfully retain or acquire members for our products and services at current levels of profitability.
In addition, we compete with other health plans to contract with hospitals, physicians, pharmacies and other providers for inclusion in our networks that serve government program beneficiaries. We believe providers select plans in which they participate based on several criteria including reimbursement rates, timeliness and accuracy of claims payment, potential to deliver new patient volume and/or retain existing patients, effectiveness of resolution of calls and complaints and other factors. We cannot be sure that we will be able to successfully attract or retain providers under acceptable contract terms to maintain a competitive network in the geographic areas we serve.
40
We are dependent on our senior management and we may not be able retain our senior management or attract and retain other qualified management, clinical and commercial personnel in the future due to the intense competition for qualified personnel in the managed care and health care industry. In addition, we have in the past and may in the future modify our senior management structure, which could affect our retention of employees and management. If we are not able to attract and retain necessary personnel to accomplish our business objectives, we may experience constraints that will significantly impede the achievement of our objectives, our ability to raise additional capital and our ability to implement our business strategy. In particular, if we lose any members of our senior management team, we may not be able to find suitable replacements, and our business may be harmed as a result.
Our MA plans are sold primarily through our sales personnel, who frequently work with independent brokers, consultants and agents who assist in the production and servicing of business. The independent brokers, consultants and agents generally are not dedicated to us exclusively and may also recommend and/or market health care benefit products of our competitors, and we must compete intensely for their services and allegiance. Our sales could be adversely affected if we are unable to attract or retain sales personnel and third-party brokers, consultants and agents or if we do not adequately provide support, training and education to this sales network regarding our product portfolio, which is complex, or if our sales strategy is not appropriately aligned across distribution channels.
To the extent that competition intensifies in any market that we serve, our ability to retain or increase members and providers, maintain or increase our revenue growth and control medical cost trends and/or our pricing flexibility may be adversely affected. Failure to compete successfully in the markets we serve may have a material adverse effect on our business, growth prospects and results of operations.
Risk-adjustment payment systems make our revenue and results of operations more difficult to estimate and could result in retroactive adjustments that have a material adverse effect on our results of operations, financial condition and cash flows.
Most of our government customers employ risk-adjustment models to determine the premium amount they pay for each member. This model pays more for members with predictably higher costs according to the health status of each beneficiary enrolled. Premium payments are generally established at fixed intervals according to the contract terms and then adjusted on a retroactive basis. We reassess the estimates of the risk adjustment settlements each reporting period and any resulting adjustments are made to premium revenue. In addition, revisions by our government customers to the risk-adjustment models have reduced, and may continue to reduce, our premium revenue.
As a result of the variability of certain factors that determine estimates for risk-adjusted premiums, including plan risk scores, the actual amount of retroactive payments could be materially more or less than our estimates. Consequently, our estimate of our plans’ risk scores for any period, and any resulting change in our accrual of premium revenues related thereto, could have a material adverse effect on our results of operations, financial condition and cash flows. The data provided to our government customers to determine the risk score are subject to audit by them even after the annual settlements occur. These audits may result in the refund of premiums to the government customer previously received by us, which could be significant and would reduce our premium revenue in the year that repayment is required.
Government customers have performed and continue to perform audits of selected plans to validate the provider coding practices under the risk adjustment model used to calculate the premium paid for each member. We anticipate that CMS will continue to conduct audits of our Medicare contracts and contract years on an on-going basis. An audit may result in the refund of premiums to CMS. It is likely that a payment adjustment could occur as a result of these audits; and any such adjustment could have a material adverse effect on our results of operations, financial condition and cash flows.
We are subject to extensive government regulation and risk of litigation, and any actual or alleged violation by us of the terms of our contracts, applicable laws or regulations could have a material adverse effect on our results of operations, financial condition and cash flows.
Our business is extensively regulated by the federal government and the states in which we operate. The laws and regulations governing our operations are generally intended to benefit and protect health plan members and providers rather than stockholders and creditors. The government agencies administering these laws and regulations have broad latitude to enforce them. These laws and regulations, along with the terms of our government contracts, regulate how we do business, what services we offer, and how we interact with our members, providers and the public. Any actual or alleged violation by us of applicable laws or regulations could damage our reputation and reduce our revenues and profitability, thereby having a material adverse effect on our results of operations.
41
We face a significant risk of class action lawsuits and other litigation and regulatory investigations and actions in the ordinary course of operating our businesses. The following are examples of types of potential litigation and regulatory investigations we face:
• | claims by government agencies relating to compliance with laws and regulations; |
• | claims relating to sales practices; |
• | claims relating to the methodologies for calculating premiums; |
• | claims relating to the denial or delay of health care benefit payments; |
• | claims relating to claims payments and procedures; |
• | claims relating to provider marketing; |
• | claims by providers for network termination or exclusion; |
• | anti-kickback claims; |
• | medical malpractice or negligence actions based on our medical necessity decisions or brought against us on the theory that we are liable for our providers’ malpractice or negligence; |
• | allegations of anti-competitive and unfair business activities; |
• | provider disputes over compensation and termination of provider contracts or defamation claims; |
• | allegations of discrimination; |
• | allegations of breaches of duties; |
• | claims relating to inadequate or incorrect disclosure or accounting in our public filings and other statements; |
• | allegations of agent misconduct; |
• | claims related to deceptive trade practices; |
• | claims relating to audits and contract performance; |
• | protests related to Medicaid awards; and |
• | violations of state procurement laws and policies. |
As we contract with various governmental agencies to provide managed health care services, we are subject to various reviews, audits and investigations to verify our compliance with the contracts and applicable laws and regulations. Any adverse review, audit, investigation or result from litigation could result in:
• | loss of our right to participate in government-sponsored programs, including Medicaid and Medicare; |
• | forfeiture or recoupment of amounts we have been paid pursuant to our government contracts; |
• | imposition of significant civil or criminal penalties, fines or other sanctions on us and/or our key associates; |
• | reduction or limitation of our membership; |
• | damage to our reputation in various markets; |
• | increased difficulty in marketing our products and services; |
• | inability to obtain approval for future acquisitions or service or geographic expansion; |
• | suspension or loss of one or more of our licenses to act as an insurer, HMO or third party administrator or to otherwise provide a service; and |
• | an event of default under our debt agreements. |
In particular, because we receive payments from federal and state governmental agencies, we are subject to various laws commonly referred to as “fraud and abuse” laws, including the federal False Claims Act, which permit agencies and enforcement authorities to institute suit against us for violations and, in some cases, to seek treble damages, penalties and assessments. Many states, including states where we currently operate, have enacted parallel legislation. Liability under such federal and state statutes and regulations may arise if we know, or it is found that we should have known, that information we provide to form the basis for a claim for government payment is false or fraudulent.
Some courts have permitted False Claims Act suits to proceed if the claimant was out of compliance with program requirements. Liability for such matters could have a material adverse effect on our financial condition, results of operations and cash flows. Qui tam, or "whistleblower" actions under federal and state law can be brought by any individual on behalf of the government. These actions have increased significantly in recent years, causing greater numbers of health care companies to defend false claim actions, pay fines or be excluded from Medicare, Medicaid or other state or federal health care programs as a result of investigations arising out of such actions.
For example, in October 2008, the Civil Division of the United States Department of Justice (the “Civil Division”) informed us that as part of its civil inquiry, it was investigating four complaints filed by relators against us under the whistleblower provisions of the False Claims Act. We also learned from a docket search that a former employee filed an action in state court for Leon County, Florida against several defendants, including us and one of our subsidiaries. With respect to these actions, we reached a settlement with the Civil Division, the Civil Division of the United States Attorney’s Office for the
42
Middle District of Florida, and the Civil Division of the United States Attorney’s Office for the District of Connecticut. However, other such actions may have been filed against us of which we are presently unaware, or other similar actions may be filed against us in the future.
We are currently undergoing standard periodic audits by several state agencies and CMS to verify compliance with our contracts and applicable laws and regulations. For additional risks associated with these audits, see “Risk-adjustment payment systems make our revenue and results of operations more difficult to estimate and could result in material retroactive adjustments that have a material adverse effect on our results of operations, financial condition and cash flows” above.
In addition, there have been a number of investigations regarding the marketing practices of brokers and agents selling health care and other insurance products and the payments they receive. These have resulted in enforcement actions against companies in our industry and brokers and agents marketing and selling those companies’ products. For example, CMS and state departments of insurance have increased their scrutiny of the marketing practices of brokers and agents who market Medicare products. These investigations and enforcement actions could result in penalties and the imposition of corrective action plans and/or changes to industry practices, which could adversely affect our ability to market our products.
We rely on the accuracy of eligibility systems provided by our government clients to have members assigned to us, collect premiums, and any inaccuracies or other problems in those systems may cause states to recoup premium payments from us, or our membership to decline, which could materially reduce our revenues and results of operations.
Members are assigned to us and premium payments that we receive are based upon eligibility systems provided by our government clients. If those eligibility systems do not function properly, fewer members may be assigned to us, which could materially reduce our revenues and could have a material adverse effect on our results of operations. In addition, a state will require us to reimburse it for premiums that we received from the state based on an eligibility list that it later discovers contains individuals who were not eligible for any government-sponsored program, have been enrolled twice in the same program, have secondary insurance, are eligible for a different premium category, are eligible for a different program or did not meet additional eligibility criteria such as premium payments or work requirements. Our review of remittance files may not identify all member eligibility errors and could result in repayment of premiums in years subsequent to the year in which the revenue was recorded. We have established a reserve in anticipation of recoupment by the states of previous overpayments, but ultimately our reserve may not be sufficient to cover the amount, if any, of recoupments. If the amount of any recoupment exceeds our reserves, our revenues could be materially reduced and it could have a material adverse effect on our results of operations.
In addition to recoupment of premiums previously paid, we also face the risk that a state could fail to pay us for members for whom we are entitled to payment, based on any inaccuracies or other errors in the states’ eligibility systems. Our results of operations would be reduced as a result of the state’s failure to pay us for related payments we made to providers and were unable to recoup.
If we are unable to access sufficient capital, whether as a result of difficulties finding acceptable public or private financing, restrictions under our credit agreement, restrictions under our Senior Notes, restrictions on dividend payments from our subsidiaries or higher levels of required statutory capital, we may be unable to grow or maintain our business, which could have a material adverse effect on our results of operations, financial condition and cash flows.
Our business strategy includes entering new markets by pursuing attractive growth opportunities for our existing product lines and pursuing acquisition opportunities. We may need to access the debt or equity markets and receive dividends from our subsidiaries to fund these growth activities.
Our ability to enter new markets and purchase existing businesses may be hindered in situations where financing may not be available on terms that are favorable to us, or at all. Financing may only be available to us with unfavorable terms such as high rates of interest, restrictive covenants and other restrictions that could impede our ability to profitably operate our business and increase the expected rate of return we require, making such efforts unfeasible.
Our Credit Agreement and Senior Notes have restrictions on our ability to secure additional capital. Our substantial indebtedness and restrictive covenants:
• | limit our ability to borrow additional funds for working capital, capital expenditures, acquisitions and general corporate or other purposes; and |
• | expose us to greater interest rate risk since the interest rate on borrowings under our Credit Agreement is variable. |
43
Our debt service obligations require us to use a portion of our operating cash flow to pay interest and principal on indebtedness instead of for other corporate purposes, including funding future expansion of our business and ongoing capital expenditures, which could impede our growth. If our operating cash flow and capital resources are insufficient to comply with the financial covenants in the credit agreement or to service our debt obligations, we may be forced to sell assets, seek additional equity or debt financing or restructure our debt, which could harm our long-term business prospects.
Our Credit Agreement and Senior Notes also contain various restrictions and covenants that restrict our financial and operating flexibility, including our ability to grow our business or declare dividends without lender approval. If we fail to pay any of our indebtedness when due, or if we breach any of the other covenants in the instruments governing our indebtedness, one or more events of default may be triggered. If we are unable to obtain a waiver, these events of default could permit our creditors to declare all amounts owed to be immediately due and payable.
In addition, in most states, we are required to seek the prior approval of state regulatory authorities to transfer money or pay dividends from our regulated subsidiaries in excess of specified amounts or, in some states, any amount. If our state regulators do not approve payments of dividends and/or distributions by certain of our regulated subsidiaries to us or our non-regulated subsidiaries, our liquidity, unregulated cash flows, business and financial condition may be materially adversely affected.
Our licensed HMO and insurance subsidiaries are subject to state regulations that, among other things, require the maintenance of minimum levels of statutory capital and maintenance of certain financial ratios, as defined by each state. States may raise the statutory capital level from time to time, which could have a material adverse effect on our cash flows and liquidity.
Our subsidiaries also may be required to maintain higher levels of statutory capital and are subject to their state regulators' general oversight powers. Regardless of whether a state adopts the risk-based capital requirements, the state's regulators can require our subsidiaries to maintain minimum levels of statutory net worth in excess of amounts required under the applicable state laws if they determine that maintaining such additional statutory net worth is in the best interests of our members and other constituents. For example, if premium rates are inadequate, reduced profits or losses in our regulated subsidiaries may cause regulators to increase the amount of capital required. Any additional capital contribution made to one or more of the affected subsidiaries could have a material adverse effect on our liquidity, cash flows and growth potential. In addition, increases of statutory capital requirements could cause us to withdraw from certain programs or markets where it becomes economically difficult to continue operating profitably.
Our indemnification obligations and the limitations of our director and officer liability insurance may have a material adverse effect on our results of operations, financial condition and cash flows.
Under Delaware law, our charter and bylaws and certain indemnification agreements to which we are a party, we have an obligation to indemnify, or we have otherwise agreed to indemnify, certain of our current and former directors, officers and associates with respect to current and future investigations and litigation. In connection with some pending matters, including the criminal trial of certain of our former executives and associates, we are required to, or we have otherwise agreed to, advance, and have advanced, significant legal fees and related expenses and expect to continue to do so while these matters are pending, subject to the caps provided in our settlement agreements with certain individuals. We have exhausted our insurance for the expenses associated with the criminal trial of our former executive officers and associates, and the related government investigations that commenced in 2007, and further expenses incurred by us for these matters will not be reimbursed.
We currently maintain insurance which provides coverage for our independent directors and officers hired after January 24, 2008 for certain potential matters to the extent they occur after October 2007. We cannot provide any assurances that pending claims, or claims yet to arise, will not exceed the limits of our insurance policies, that such claims are covered by the terms of our insurance policies or that our insurance carrier will be able to cover our claims.
We are exposed to fluctuations in the securities and debt markets, which could affect our investment portfolio and our results of operations, financial condition, cash flows and liquidity.
Our investment portfolio represents a significant portion of our assets and is subject to general credit, liquidity, and market and interest rate risks. Market fluctuations in the securities and credit markets could affect the value or liquidity of our investment portfolio and adversely affect interest income. As a result, we may experience a reduction in value or loss of liquidity which may materially affect our results of operations, financial condition, cash flows and liquidity.
44
Risks Related to Ownership of Our Stock
We are subject to laws and government regulations that may delay, deter or prevent a change in control of our Company, which could have a material adverse effect on our ability to enter into transactions favorable to stockholders.
Our operating subsidiaries are subject to state laws that require prior regulatory approval for any change of control of an HMO or insurance company. For purposes of these laws, in most states "control" of an entity is presumed to exist when a person, group of persons or entity acquires the power to vote 10% or more of the voting securities of that entity, subject to certain exceptions. These laws may discourage acquisition proposals and may delay, deter or prevent a change of control of our company, including through transactions, and in particular through unsolicited transactions, which could have a material adverse effect on our ability to enter into transactions that some or all of our stockholders find favorable.
Our stock price and trading volume may be volatile and future sales of our common stock could adversely affect the trading price of our common stock.
From time to time, the price and trading volume of our common stock, as well as the stock of other companies in the health care industry, may experience periods of significant volatility. Company-specific issues and developments generally in the health care industry (including the regulatory environment) and the capital markets and the economy in general may cause this volatility. Our stock price and trading volume may fluctuate in response to a number of events and factors, including:
• | variations in our operating results; |
• | changes in our or the market's expectations about our future operating results; |
• | changes in financial estimates and recommendations by securities analysts concerning our Company or the health care industry generally; |
• | operating and stock price performance of other companies that investors may deem comparable; |
• | news reports relating to trends in our markets; |
• | changes or proposed changes in the laws, regulations and policies affecting our business; |
• | acquisitions and financings by us or others in our industry; |
• | changes in our senior management; |
• | sales of substantial amounts of our common stock by our directors and executive officers or principal stockholders, or the perception that such sales could occur; and |
• | the risks described in “Risks Related to Our Business” above. |
We may issue equity securities in the future, including securities that are convertible into or exchangeable for, or that represent the right to receive, common stock. We have an effective shelf registration statement on Form S-3 filed with the SEC under which we may offer from time to time an indeterminate amount of any combination of debt securities, common and preferred stock and warrants. The registration statement allows us to seek additional financing, subject to the SEC's rules and regulations relating to eligibility to use Form S-3. Debt financing, if available, may involve restrictive covenants.
The issuance of additional shares of our common stock or other equity securities, including sales of shares in connection with any future acquisitions, could be substantially dilutive to our stockholders. These sales may have a harmful effect on prevailing market prices for our common stock and our ability to raise additional capital in the financial markets at a time and price favorable to us. Holders of shares of our common stock have no preemptive rights that entitle them to purchase a pro rata share of any offering of shares of any class or series and, therefore, such sales or offerings could result in increased dilution to our stockholders. Our certificate of incorporation provides that we have authority to issue 100,000,000 shares of common stock and 20,000,000 shares of preferred stock.
Risks Related to Information Technology
If we or our vendors are unable to maintain effective and secure management information systems and applications, successfully update or expand processing capability or develop new capabilities to meet our business needs and regulatory requirements, we could experience operational disruptions and other materially adverse consequences to our business and results of operations.
Our business depends on effective and secure information systems, applications and operations. The information gathered, processed and stored by our management information systems and our vendors' management information systems assists us in, among other things, marketing and sales, membership tracking, billing, claims processing, medical management, medical care cost and utilization trending, reinsurance, financial and management accounting, reporting, and planning and analysis. These
45
systems also support our customer service functions, provider and member administrative functions and support tracking and extensive analysis of medical expenses and outcome data. These systems remain subject to unexpected interruptions resulting from occurrences such as hardware failures or increased demand. There can be no assurance that such interruptions will not occur in the future, and any such interruptions could have a material adverse effect on our business and results of operations. Moreover, operating and other issues can lead to data problems that affect the performance of important functions, including, but not limited to, claims payment, customer service and financial reporting.
There can also be no assurance that our or our vendors' process of maintaining and improving existing systems, developing new systems to support our operations, complying with contractual and regulatory requirements and improving service levels will not be delayed or that system issues will not arise in the future. Our and our vendors' information systems and applications require continual maintenance, upgrading and enhancement to meet our operational needs and regulatory requirements. If we or our vendors are unable to maintain or expand our systems, we could suffer from, among other things, operational disruptions, such as the inability to pay claims or to make claims payments on a timely basis, loss of members, difficulty in attracting new members, regulatory problems, difficulty in improving quality, increases in administrative expenses and write-offs of our expenditures in unsuccessful capital investments.
Additionally, events outside our control, including terrorism or acts of nature such as hurricanes, earthquakes, or fires, could significantly impair our or our vendors' information systems, applications and critical business functions. To help ensure continued operations in the event that our primary operations are rendered inoperable, we have a disaster recovery plan to recover critical business functionality within stated timelines. Our plan may not operate effectively during or following an actual attack or natural disaster and our operations and critical business functions could be disrupted or compromised, which could have a material adverse effect on our business and our results of operations.
Cybersecurity attacks also could significantly impair our or our vendors’ information systems, or compromise our or our vendors’ data security. Despite our and our vendors efforts to secure information systems, we could be subject to cybersecurity incidents that bypass our security measures, impact the integrity, availability or privacy of personal health information or other data subject to privacy laws or disrupt our information systems, devices or business, including our ability to provide various health care services. As cyber threats continue to evolve from malicious persons and groups, new vulnerabilities and advanced new attacks against information systems, we may be required to expend significant additional resources to continue to modify or enhance our protective measures or to investigate and remediate any cybersecurity vulnerabilities. Cybersecurity attacks could result in (i) harm to our members, associates and providers; (ii) business interruptions and delays; (iii) the loss, misappropriation, corruption or unauthorized access of data; (iv) litigation and potential liability under privacy, security and consumer protection laws or other applicable laws; (v) reputational damage and (vi) federal and state governmental inquiries, any of which could have a material, adverse effect on our financial position and results of operations and harm our business reputation.
In addition, we and our vendors are subject to the Health Insurance Portability and Accountability Act of 1996 ("HIPAA") as amended by the Health Information Technology for Economic and Clinical Health Act (the “HITECH Act”), as well as numerous other privacy and security laws and regulations at the federal and state levels. Given the complexity and the evolving regulations related to data security and privacy, our or our vendors' ongoing ability to comply with such requirements is uncertain, which may expose us to the criminal and increased civil penalties provided under such laws and may require us to incur significant costs in order to seek to comply with such requirements, as well as subject us to significant penalties and reputational damage if we are unable to comply, which could have a material adverse effect on our business and our results of operations.
Item 1B. Unresolved Staff Comments.
None.
Item 2. Properties.
Our principal administrative, sales and marketing facilities are located at our leased corporate headquarters in Tampa, Florida. Our corporate headquarters is used in all of our lines of business. As of December 31, 2017, we also leased office space for the administration of our health plans in Arizona, Arkansas, California, Connecticut, Florida, Georgia, Hawaii, Illinois, Kentucky, Louisiana, Missouri, Mississippi, Nebraska, New Jersey, New York, North Carolina, South Carolina, Tennessee, Texas, Washington D.C. and Wisconsin. These properties are all in good condition and are well maintained. We believe these facilities are suitable and provide the appropriate level of capacity for our current operations. Upon expiration of the terms of the leases, we believe we could renew these leases on acceptable terms, or find suitable space elsewhere.
46
Item 3. Legal Proceedings.
We are involved in legal actions in the normal course of our business, including, without limitation, protests and appeals related to Medicaid procurements, wage and hour claims and other employment claims, claims for indemnification under purchase agreements, vendor disputes and provider disputes regarding payment of claims. Some of these actions seek monetary damages, including claims for liquidated or punitive damages, which are not covered by insurance. We accrue for contingent liabilities related to these matters if a loss is deemed probable and is estimable. The actual outcome of these matters may differ materially from our current estimates and therefore could have a material adverse effect on our results of operations, financial position, and cash flows.
Item 4. Mine Safety Disclosures.
Not Applicable.
47
PART II
Item 5. Market for Registrant's Common Equity, Related Stockholder Matters and Issuer Purchases of Equity Securities.
Market for Common Stock
Our common stock is listed on the New York Stock Exchange under the symbol "WCG." The following table sets forth the high and low closing sales prices of our common stock, as reported on the New York Stock Exchange, for each of the periods indicated:
High | Low | ||||||
2017 | |||||||
First Quarter ended March 31, 2017 | $ | 146.04 | $ | 136.63 | |||
Second Quarter ended June 30, 2017 | $ | 183.60 | $ | 140.32 | |||
Third Quarter ended September 30, 2017 | $ | 183.87 | $ | 164.15 | |||
Fourth Quarter ended December 31, 2017 | $ | 212.99 | $ | 167.68 | |||
2016 | |||||||
First Quarter ended March 31, 2016 | $ | 94.47 | $ | 70.06 | |||
Second Quarter ended June 30, 2016 | $ | 108.99 | $ | 88.00 | |||
Third Quarter ended September 30, 2016 | $ | 117.42 | $ | 104.23 | |||
Fourth Quarter ended December 31, 2016 | $ | 141.40 | $ | 113.51 | |||
The last reported sale price of our common stock on the New York Stock Exchange on February 13, 2018 was $194.33. As of February 13, 2018, we had approximately 15 holders of record of our common stock.
Dividends
We have never paid cash dividends on our common stock. We currently intend to retain any future earnings to fund our business, and we do not anticipate paying any cash dividends in the foreseeable future.
Our ability to pay dividends is partially dependent on, among other things, our receipt of cash dividends from our regulated subsidiaries. The ability of our regulated subsidiaries to pay dividends to us is limited by the state departments of insurance in the states in which we operate or may operate, as well as requirements of the government-sponsored health programs in which we participate. In addition, our current credit agreement and indenture have certain restrictions on our ability to pay dividends. Any future determination to pay dividends will be at the discretion of our board and will depend upon, among other factors, our results of operations, financial condition, capital requirements and contractual restrictions. For more information regarding restrictions on the ability of our regulated subsidiaries to pay dividends to us, please see Item 7 – Management's Discussion and Analysis of Financial Condition and Results of Operations – Regulatory Capital and Dividend Restrictions.
Unregistered Issuances of Equity Securities
None.
Issuer Purchases of Equity Securities
We do not have a stock repurchase program. Additionally, for the majority of restricted stock units granted, the number of shares issued on the date the units vest is net of shares withheld to meet applicable tax withholding requirements. Although these withheld shares are not issued or considered common stock repurchases under a stock repurchase program, they are treated as common stock repurchases in our financial statements as they reduce the number of shares that would have been issued upon vesting.
48
Performance Graph
The following graph compares the cumulative total stockholder return on our common stock for the period from December 31, 2012 to December 31, 2017 with the cumulative total return on the stocks included in the Standard & Poor's 500 Stock Index ("S&P 500") and the custom composite index over the same period. The Custom Composite Index includes the stock of Aetna Inc., Anthem Inc., Centene Corp., Cigna Corp., Humana Inc., Molina Healthcare, Inc., and UnitedHealth Group Inc. The graph assumes an investment of $100 made in our common stock, the S&P 500 and the custom composite index on December 31, 2012. The graph also assumes the reinvestment of dividends and is weighted according to the respective company's stock market capitalization at the beginning of each of the periods indicated. We did not pay any dividends on our common stock during the period reflected in the graph. Further, our common stock price performance shown below should not be viewed as being indicative of future performance.
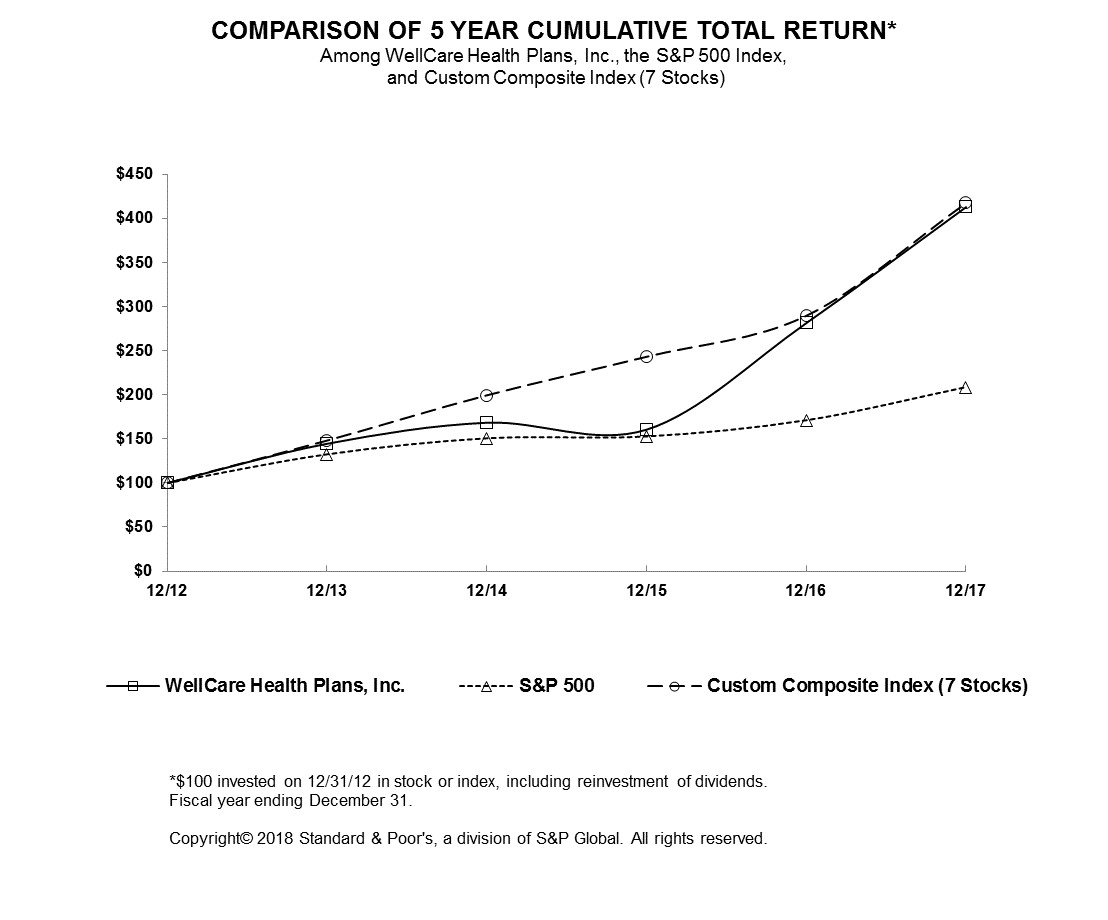
12/31/2012 | 12/31/2013 | 12/31/2014 | 12/31/2015 | 12/31/2016 | 12/31/2017 | ||||||||||||||||||
WellCare Health Plans, Inc. | $ | 100 | $ | 145 | $ | 169 | $ | 161 | $ | 282 | $ | 413 | |||||||||||
S&P 500 Index | $ | 100 | $ | 132 | $ | 151 | $ | 153 | $ | 171 | $ | 208 | |||||||||||
Custom Composite Index (7 stocks) | $ | 100 | $ | 148 | $ | 200 | $ | 243 | $ | 290 | $ | 417 | |||||||||||
49
Item 6. Selected Financial Data.
The following table sets forth our summary financial data. This information should be read in conjunction with our consolidated financial statements and the related notes and "Management's Discussion and Analysis of Financial Condition and Results of Operations" included in this 2017 Form 10-K.
For the Years Ended December 31, | ||||||||||||||||||||
2017 | 2016 | 2015 | 2014 | 2013 | ||||||||||||||||
(In millions, except per share data) | ||||||||||||||||||||
Consolidated operating results: | ||||||||||||||||||||
Total revenues | $ | 17,007.2 | $ | 14,237.1 | $ | 13,890.2 | $ | 12,959.9 | $ | 9,527.9 | ||||||||||
Income from operations | 469.0 | 529.5 | 336.1 | 148.3 | 281.1 | |||||||||||||||
Income before income taxes | 442.9 | 529.5 | 336.1 | 177.8 | 278.3 | |||||||||||||||
Net income | $ | 373.7 | $ | 242.1 | $ | 118.6 | $ | 63.7 | $ | 175.3 | ||||||||||
Net income per share: | ||||||||||||||||||||
Basic | $ | 8.40 | $ | 5.47 | $ | 2.69 | $ | 1.45 | $ | 4.03 | ||||||||||
Diluted | $ | 8.31 | $ | 5.43 | $ | 2.67 | $ | 1.44 | $ | 3.98 | ||||||||||
Operating Statistics: | ||||||||||||||||||||
Medical benefits ratio: | ||||||||||||||||||||
Medicaid Health Plans (GAAP) | 87.8 | % | 86.2 | % | 86.7 | % | 88.2 | % | 87.0 | % | ||||||||||
Medicaid Health Plans (adjusted) (1) | 88.8 | % | 89.5 | % | 89.8 | % | 90.5 | % | 88.2 | % | ||||||||||
Medicare Health Plans | 86.0 | % | 84.6 | % | 87.2 | % | 88.5 | % | 86.6 | % | ||||||||||
Medicare PDPs | 82.4 | % | 73.7 | % | 78.7 | % | 92.9 | % | 86.5 | % | ||||||||||
SG&A ratio (GAAP) | 8.8 | % | 8.0 | % | 8.2 | % | 7.9 | % | 9.1 | % | ||||||||||
Adjusted SG&A ratio (2) | 8.5 | % | 8.0 | % | 7.9 | % | 7.7 | % | 8.5 | % | ||||||||||
Membership: | ||||||||||||||||||||
Medicaid Health Plans | 2,723,000 | 2,544,000 | 2,388,000 | 2,310,000 | 1,759,000 | |||||||||||||||
Medicare Health Plans | 496,000 | 345,000 | 354,000 | 417,000 | 290,000 | |||||||||||||||
Medicare PDPs | 1,152,000 | 1,009,000 | 1,025,000 | 1,392,000 | 797,000 | |||||||||||||||
Total Membership | 4,371,000 | 3,898,000 | 3,767,000 | 4,119,000 | 2,846,000 | |||||||||||||||
Consolidated cash flows: | ||||||||||||||||||||
Operating activities | $ | 1,050.0 | $ | 748.3 | $ | 712.6 | $ | 299.3 | $ | 178.9 | ||||||||||
Investing activities | (1,641.0 | ) | (27.0 | ) | (124.2 | ) | (75.6 | ) | (290.5 | ) | ||||||||||
Financing activities | 828.2 | 833.1 | 505.1 | (392.7 | ) | 493.6 | ||||||||||||||
Balance Sheet Data (in millions, as of December 31): | ||||||||||||||||||||
Cash and cash equivalents | $ | 4,198.6 | $ | 3,961.4 | $ | 2,407.0 | $ | 1,313.5 | $ | 1,482.5 | ||||||||||
Total assets | 8,364.6 | 6,152.8 | 5,145.8 | 4,446.5 | 3,415.1 | |||||||||||||||
Long-term debt, including current maturities | 1,182.4 | 997.6 | 1,199.1 | 888.6 | 588.1 | |||||||||||||||
Total liabilities | 5,947.9 | 4,152.7 | 3,417.5 | 2,850.6 | 1,897.2 | |||||||||||||||
Total stockholders' equity | 2,416.7 | 2,000.1 | 1,728.3 | 1,595.9 | 1,517.9 | |||||||||||||||
(1) | For GAAP reporting purposes, Medicaid premium taxes and Medicaid ACA industry fee reimbursements are included in premium revenue to measure our MBR. Our Medicaid Health Plans Adjusted MBR measures the ratio of our medical benefits expense to premium revenue, excluding Medicaid premium taxes and Medicaid ACA industry fee reimbursement revenue. Because reimbursements for Medicaid premium tax and ACA industry fee are both included in the premium rates or reimbursement established in certain of our Medicaid contracts and also recognized separately as a component of expense, we exclude these reimbursements from premium revenue when calculating key ratios as we believe that these components are not indicative of operating performance. |
(2) | Our Adjusted SG&A expense ratio measures selling, general and administrative expense as a percentage of total premium revenue, excluding premium taxes for all years presented and the Medicaid ACA industry fee reimbursements for the years ended December 31, 2016, 2015 and 2014. The ratio also excludes the effect of investigation costs for all years presented, Sterling divestiture, Iowa SG&A and pharmacy benefit manager ("PBM") transitory costs for the years ended December 31, 2016 and 2015; and certain costs associated with our acquisition of Universal American for the year ended December 31, 2017. |
50
Item 7. Management's Discussion and Analysis of Financial Condition and Results of Operations.
The following discussion and analysis of our financial condition and results of operations should be read in conjunction with Item 6 – Selected Financial Data and our consolidated financial statements and related notes appearing elsewhere in this 2017 Form 10-K. The following discussion contains forward-looking statements that involve risks, uncertainties and assumptions that could cause our actual results to differ materially from management's expectations. Factors that could cause such differences include those set forth under Part I, Item 1 – Business and Part I, Item 1A – Risk Factors, as well as Forward-Looking Statements discussed earlier in this 2017 Form 10-K.
OVERVIEW
Introduction
WellCare Health Plans, Inc. (the "Company," "we," "us," "our") focuses exclusively on government-sponsored managed care services, primarily through Medicaid, Medicare Advantage ("MA") and Medicare Prescription Drug Plans ("PDP") to families, children, seniors and individuals with complex medical needs. As of December 31, 2017, we served approximately 4.4 million members. During the twelve months ended December 31, 2017, we operated Medicaid health plans in Arizona, Florida, Georgia, Hawaii, Illinois, Kentucky, Missouri, Nebraska, New Jersey, New York, South Carolina and Texas. We began serving Medicaid and Medicare members in Arizona, effective December 31, 2016, in connection with the acquisition of Care1st Health Plan Arizona, Inc. and One Care by Care1st Health Plan of Arizona, Inc. (together "Care1st Arizona"). Effective January 1, 2017, we began serving Medicaid members statewide in Nebraska.
As of December 31, 2017, we operated MA coordinated care plans ("CCPs") in Arizona, Arkansas, California, Connecticut, Florida, Georgia, Hawaii, Illinois, Kentucky, Louisiana, Maine, Mississippi, New Jersey, New York, South Carolina, Tennessee and Texas, as well as stand-alone Medicare prescription drug plans ("PDP") nationwide. Effective January 1, 2018, we expanded our MA service area into the state of North Carolina.
Summary of Consolidated Financial Results
Summarized below are the key financial highlights for the year ended December 31, 2017. For additional information, refer to the "Results of Operations" section, which discusses both consolidated and segment results.
▪ | Membership increased by 473,000 members or 12.1% in 2017 compared with 2016, as discussed below in "Results of Operations." The growth was primarily driven by an increase in Medicaid Health Plans organic membership in our Missouri and Nebraska markets; increased Medicare Health Plans membership reflecting the addition of approximately 119,000 MA members from the Universal American Corp. ("Universal American") acquisition discussed in Note 3- Acquisitions to the consolidated financial statements of this 2017 Form 10-K; and increased Medicare Health Plans and Medicare PDP organic membership due to our 2017 bid positioning. These increases were partially offset by the decline in Georgia Medicaid membership. |
▪ | Premiums increased $2.7 billion, or 19.3%, in 2017 compared with 2016, primarily reflecting our acquisitions of Universal American and Care1st Arizona. The increase is also attributed to organic growth across all three lines of business. These increases were partially offset by the effect of the ACA industry fee moratorium for 2017 (discussed in Key Developments and Accomplishments below), which resulted in the elimination of any associated Medicaid ACA industry fee reimbursements from our state government partners. |
▪ | Net Income increased $131.6 million, or 54.4%, in 2017 compared with 2016 driven by continued improvement in operational execution, primarily in the Medicaid Health Plans and Medicare Health Plans segments, as well as the acquisitions of Universal American and Care1st Arizona. The increase is also attributed to the effect of the ACA industry fee moratorium for 2017, and the effect of the Tax Cuts and Jobs Act of 2017 (discussed in Note 14- Income Taxes to the consolidated financial statements of this 2017 Form 10-K). These increases were partially offset by $37.5 million in one-time transaction and integration costs related to the acquisition of Universal American, and a $26.1 million loss on extinguishment of debt, primarily related to the early redemption, on April 7, 2017, of our $900.0 million of 5.75% senior notes otherwise due 2020 (the "2020 Notes"). |
51
Key Developments and Accomplishments
Our current business strategy is achieved by focusing on integrated care management, local markets and community advocacy, regulatory and provider partnerships and delivering prudent, profitable long-term growth. See Part I, Item 1 – Business for further discussion of our business strategy.
Presented below are key developments and accomplishments relating to progress on our business strategy that have affected, or are expected to affect, our results:
• | As previously announced on October 19, 2017, the company signed a contract with the Illinois Department of Health Care and Family Services ("HFS") to administer the Health Choice Illinois Medicaid managed care program statewide. Services under the new contract began on January 1, 2018. The contract is for four years and may be renewed up to four additional years at the discretion of HFS. Considering the initial premium rate structure, estimated medical benefits and other costs to be incurred during the initial four-year contractual term of the Illinois Medicaid managed care program, we recorded a $45.6 million premium deficiency reserve ("PDR") in the fourth quarter of 2017. |
• | Effective July 1, 2017, we commenced services under a new Medicaid contract with the State of Georgia serving Temporary Assistance for Needy Families ("TANF") and Children's Health Insurance Program ("CHIP") beneficiaries. As of December 31, 2017, we served approximately 513,000 Medicaid members in Georgia. Due to the addition of a fourth managed care organization to the program, our membership declined approximately 58,000 members as compared to December 31, 2016. |
• | On April 28, 2017 (the "Effective Date"), we completed the acquisition of Universal American. The acquisition of Universal American contributed approximately 119,000 MA members in Texas, New York and Maine, strengthening our business by increasing our MA membership by a third, deepening our presence in two key markets, Texas and New York, and diversifying our business portfolio. The transaction was valued at approximately $770.0 million. |
• | On May 1, 2017, we completed the acquisition of certain assets, including Arizona Medicaid membership and certain provider contracts, from Phoenix Health Plan ("PHP"). The transaction included the transfer of approximately 42,000 Medicaid members to Care1st Arizona, a wholly owned subsidiary of the Company. The transaction was funded with available cash on hand. As of December 31, 2017, we served approximately 153,000 Medicaid members in Arizona. |
• | On March 22, 2017, we completed the offering and sale of our 5.25% senior notes due 2025 in the aggregate principal amount of $1,200.0 million (the “2025 Notes”) and increased the amount available under our credit agreement dated January 8, 2016 (the "Credit Agreement") from $850.0 million to $1.0 billion. A portion of the aggregate net proceeds were used to repay the $100.0 million outstanding under the Credit Agreement and to redeem the full $900.0 million aggregate principal amount of our 2020 Notes on April 7, 2017. In connection with the redemption and repurchase of the 2020 Notes, we incurred a one-time loss on extinguishment of debt related to the redemption premium, the write-off of associated deferred financing costs and the write-off of the unamortized portion of associated premiums paid on the 2020 Notes. |
• | On January 1, 2017, we began serving Medicaid beneficiaries under Nebraska's Medicaid Managed Care program, Heritage Health. Our Nebraska contract has an initial five-year term and two additional one-year renewal options at the discretion of the Nebraska Department of Administrative Services. As of December 31, 2017, we served approximately 80,000 Medicaid members in Nebraska. |
• | Effective January 1, 2017, the Consolidated Appropriations Act, 2016 provided for a one-year moratorium on the ACA industry fee, and, as a result, eliminated the associated Medicaid ACA industry fee reimbursements from our state government partners. Accordingly, we did not incur ACA industry fee expense for 2017, compared with $228.4 million for 2016. Additionally, we did not receive any Medicaid ACA industry fee reimbursement revenue during 2017, compared with $244.9 million for 2016. |
General Economic Environment, Political Environment and Health Care Reform
Please refer to Part I, Item 1 – Business, General Economic and Political Environment Affecting our Business and Health Care Reform for a further discussion of the current economic and political environment that is affecting our business.
Refer to the risks and uncertainties related to health care reform as discussed in Part I, Item 1A – Risk Factors.
52
RESULTS OF OPERATIONS
Consolidated Financial Results
The following table sets forth condensed data from our consolidated statements of operations data, as well as other key data used in our results of operations discussions for the years ended December 31, 2017, 2016 and 2015.
For the Years Ended December 31, | |||||||||||
2017 | 2016 | 2015 | |||||||||
Revenues: | (Dollars in millions) | ||||||||||
Premium | $ | 16,960.3 | $ | 14,220.9 | $ | 13,874.8 | |||||
Investment and other income | 46.9 | 16.2 | 15.4 | ||||||||
Total revenues | 17,007.2 | 14,237.1 | 13,890.2 | ||||||||
Expenses and other: | |||||||||||
Medical benefits | 14,744.8 | 12,089.4 | 11,978.5 | ||||||||
Selling, general and administrative | 1,484.7 | 1,133.1 | 1,132.9 | ||||||||
ACA industry fee | — | 228.4 | 227.3 | ||||||||
Medicaid premium taxes | 119.8 | 110.0 | 94.7 | ||||||||
Depreciation and amortization | 120.4 | 87.6 | 72.6 | ||||||||
Interest | 68.5 | 59.1 | 54.2 | ||||||||
Gain on divestiture of business | — | — | (6.1 | ) | |||||||
Total expenses, net | 16,538.2 | 13,707.6 | 13,554.1 | ||||||||
Income from operations | 469.0 | 529.5 | 336.1 | ||||||||
Loss on extinguishment of debt | 26.1 | — | — | ||||||||
Income before income taxes and equity in earnings of unconsolidated subsidiaries | 442.9 | 529.5 | 336.1 | ||||||||
Equity in earnings of unconsolidated subsidiaries | 18.7 | — | — | ||||||||
Income before income taxes | 461.6 | 529.5 | 336.1 | ||||||||
Income tax expense | 87.9 | 287.4 | 217.5 | ||||||||
Net income | $ | 373.7 | $ | 242.1 | $ | 118.6 | |||||
Effective tax rate | 19.0 | % | 54.3 | % | 64.7 | % | |||||
Membership by Segment | |||||||||||
Medicaid Health Plans | 2,723,000 | 2,544,000 | 2,388,000 | ||||||||
Medicare Health Plans | 496,000 | 345,000 | 354,000 | ||||||||
Medicare PDPs | 1,152,000 | 1,009,000 | 1,025,000 | ||||||||
Total | 4,371,000 | 3,898,000 | 3,767,000 | ||||||||
Membership
2017 vs. 2016
As of December 31, 2017, membership increased approximately 473,000, or 12.1%, compared with December 31, 2016. Membership discussion by segment follows:
• | Medicaid Health Plans. Membership increased by 179,000, or 7.0%, to 2.7 million members as of December 31, 2017. The increase was primarily driven by our participation in Missouri's Medicaid program statewide expansion, our new Nebraska Medicaid plan, and membership acquired from PHP in our Arizona market. The increase was partially offset by declines in our Georgia health plan membership because the State added a fourth managed care organization, effective July 1, 2017. |
53
• | Medicare Health Plans. Membership increased by 151,000, or 43.8%, to 496,000 members as of December 31, 2017. The increase primarily reflects our acquisition of Universal American, our 2017 bid positioning and continued execution on sales and retention initiatives, partially offset by planned service area reductions for the 2017 plan year. |
• | Medicare PDPs. Membership increased by 143,000, or 14.2%, to 1.2 million members as of December 31, 2017. The increase was primarily the result of our 2017 bid positioning. Our 2017 PDP bids resulted in one of our basic plans being below the benchmarks in 30 of the 34 CMS regions, and within the de minimis range in three other regions. Our 2016 PDP bids resulted in one of our basic plans being below the benchmarks in 17 of the 34 CMS regions, and within the de minimis range in nine other regions. |
2016 vs. 2015
As of December 31, 2016, membership increased approximately 131,000, or 3.5%, compared with December 31, 2015. Membership discussion by segment follows:
• | Medicaid Health Plans. Membership increased by 156,000, or 6.5%, compared with December 31, 2015, primarily due to the membership acquired from Care1st Arizona and Advicare during 2016, as well as organic membership growth in New York and Missouri. These increases were partially offset by a membership decline in Georgia. |
• | Medicare Health Plans. Membership decreased by 9,000, or 2.5%, compared with December 31, 2015, primarily as a result of our 2016 bid positioning, including planned service area reductions for the 2016 plan year. |
• | Medicare PDPs. Membership decreased by 16,000 or 1.6%, compared with December 31, 2015. The decrease was primarily the result of our 2016 bid positioning. Our 2016 PDP bids resulted in one of our basic plans being below the benchmarks in 17 of the 34 CMS regions, and within the de minimis range in nine other regions, compared with our 2015 bids, in which our plans were below the benchmarks in 13 of the 33 CMS regions for which we submitted bids and in the de minimis range in nine regions. |
Net income
2017 vs. 2016
For the year ended December 31, 2017, our net income increased by $131.6 million, or 54.4%, compared with the same period in 2016 driven by continued improvement in operational execution, primarily in the Medicaid Health Plans and Medicare Health Plans segments, as well as the acquisitions of Universal American and Care1st Arizona. The increase is also attributed to the effect of the ACA industry fee moratorium for 2017, the effect of the Tax Cuts and Jobs Act of 2017 (discussed in Note 14- Income Taxes of this 2017 Form 10-K), and the recognition of certain earnings related to unconsolidated subsidiaries. These increases are partially offset by $37.5 million in one-time transaction and integration costs related to the acquisition of Universal American, and a $26.1 million loss on extinguishment of debt, primarily related to the early redemption, on April 7, 2017, of our 2020 Notes. Refer to Segment Reporting below for a discussion of current developments, operating results and other key performance measures by reportable segment.
2016 vs. 2015
For the year ended December 31, 2016, our net income increased by $123.5 million, or 104.1%, compared with the same period in 2015, primarily attributable to continued improvement, across all of our segments, in operational execution and pharmacy benefits management.
Premium revenue
2017 vs. 2016
Premium revenue for the year ended December 31, 2017 increased approximately $2.7 billion, or 19.3%, compared with the same period in 2016, reflecting our acquisitions of Universal American and Care1st Arizona, our participation in the Missouri Medicaid program expansion, net rate increases in certain of our Medicaid markets, and organic growth across all three lines of business. These increases were partially offset by the effect of the ACA industry fee moratorium for 2017, which resulted in the elimination of any associated Medicaid ACA industry fee reimbursements from our state government partners as discussed in "Key Developments and Accomplishments".
54
2016 vs. 2015
Premium revenue for the year ended December 31, 2016 increased approximately $346.1 million, or 2.5%, compared with the same period in 2015, reflecting organic membership growth in our Medicaid Health Plans segment, the 2016 Advicare acquisition and net rate increases in certain Medicaid markets. These increases were partially offset by the effect of lower membership in our Medicare PDPs segment and the divestiture of Sterling Life Insurance Company ("Sterling"), our former Medicare Supplement business in 2015.
Medical benefits expense
2017 vs. 2016
Medical benefits expense for the year ended December 31, 2017 increased $2.7 billion, or 22.0%, from 2016 primarily driven by the previously noted 2017 and 2016 acquisitions, our participation in the Missouri Medicaid program expansion, and additional organic membership growth across all lines of business. The increase also includes the previously noted $45.6 million PDR recognized related to the Illinois Medicaid managed care program. The increase was partially offset by the favorable result of continued performance in clinical and pharmacy execution.
2016 vs. 2015
Medical benefits expense for the year ended December 31, 2016 increased $110.9 million, or 0.9%, compared with the same period in 2015, primarily driven by organic Medicaid membership growth and the Advicare acquisition, partially offset by the favorable result of actions taken relating to our 2016 MA and PDP bids and the divestiture of our Medicare Supplement business in 2015.
55
Selling, general and administrative expense ("SG&A")
SG&A expense, under generally accepted accounting principles in the United States of America ("GAAP"), includes aggregate costs related to previously disclosed government investigations and related litigation and resolution costs ("Investigation costs"). Refer to Note 13–Commitments and Contingencies within the consolidated financial statements included in this 2017 Form 10-K for additional discussion of these Investigation costs. SG&A expense also included certain costs associated with our acquisition of Universal American ("Transaction and integration costs"). These costs include severance payments to former executives, advisory, legal and other professional fees that are reflected in SG&A expense in our consolidated statements of comprehensive income. SG&A expense also included certain activities relating to the divestiture of Sterling Life Insurance Company ("Sterling divestiture costs"), our prior Medicare Supplement business; transitory costs related to our decision to change our pharmacy benefit manager ("PBM") as of January 1, 2016 ("PBM transitory costs"); and certain non-recurring Iowa related SG&A expenses relating to readiness costs, certain wind-down costs of WellCare's Iowa operations and certain legal costs ("Iowa SG&A costs"). Although the excluded items may recur, we believe that by providing non-GAAP measurements exclusive of these items, we facilitate period-over-period comparisons and provide additional clarity about events and trends affecting our core operating performance, as well as providing comparability to competitor results. The Investigation costs are related to a discrete incident, which we do not expect to re-occur. The other costs mentioned above are related to specific events, which do not reflect the underlying ongoing performance of our business. The non-GAAP financial measures should be considered in addition to, but not as a substitute for, or superior to, financial measures prepared in accordance with GAAP. Below is a reconciliation of these non-GAAP measures with the most directly comparable financial measure calculated in accordance with GAAP.
The reconciliation of SG&A expense, including and excluding such costs, is as follows:
For the Years Ended December 31, | |||||||||||
2017 | 2016 | 2015 | |||||||||
(In millions) | |||||||||||
SG&A expense | $ | 1,484.7 | $ | 1,133.1 | $ | 1,132.9 | |||||
Adjustments: | |||||||||||
Investigation costs | (7.9 | ) | (16.0 | ) | (30.4 | ) | |||||
Transaction and integration costs | (37.5 | ) | — | — | |||||||
Sterling divestiture costs | — | (1.7 | ) | (2.0 | ) | ||||||
PBM transitory costs | — | (4.9 | ) | (18.1 | ) | ||||||
Iowa SG&A costs | — | (5.2 | ) | (11.9 | ) | ||||||
Adjusted SG&A Expense | $ | 1,439.3 | $ | 1,105.3 | $ | 1,070.5 | |||||
SG&A ratio (1) | 8.8 | % | 8.0 | % | 8.2 | % | |||||
Adjusted SG&A ratio (2) | 8.5 | % | 8.0 | % | 7.9 | % | |||||
(1) SG&A expense, as a percentage of total premium revenue. | |||||||||||
(2) Adjusted SG&A expense, as a percentage of total premium revenue, excluding Medicaid premium taxes and Medicaid ACA industry fee reimbursements. Because reimbursements for Medicaid premium tax and ACA industry fee are both included in the premium rates or reimbursement established in certain of our Medicaid contracts and also recognized separately as a component of expense, we exclude these reimbursements from premium revenue when calculating key ratios as we believe that these components are not indicative of operating performance. | |||||||||||
56
2017 vs. 2016
Our SG&A expense for the year ended December 31, 2017, increased approximately $351.6 million or 31.0%, compared with the same period in 2016. Additionally, our SG&A ratio increased by 80 basis points for the year ended December 31, 2017, compared with the same period in 2016. These increases were primarily the result of our acquisitions of Universal American, including one-time transaction and integration costs, and Care1st Arizona, staffing and infrastructure costs to support organic growth, and variable short-term and long-term management incentive compensation due to improved company performance. The increase in the SG&A ratio is also due to the effect of the ACA industry fee moratorium for 2017, which resulted in the elimination of any associated Medicaid ACA industry fee reimbursements from our state government partners as discussed in "Key Developments and Accomplishments."
Our Adjusted SG&A expense for year ended December 31, 2017 increased approximately $334.0 million, or 30.2%, compared with the same period in 2016. Additionally, our Adjusted SG&A ratio increased by 50 basis points for the year ended December 31, 2017, compared with the same period in 2016. These increases were primarily the result of our acquisitions of Universal American and Care1st Arizona as well as variable short-term and long-term management incentive compensation due to improved company performance.
2016 vs. 2015
Our SG&A expense for the year ended December 31, 2016 remained consistent compared with the same period in 2015. Our Adjusted SG&A expense for year ended December 31, 2016 increased approximately $34.8 million, or 3.3%, compared with the same period in 2015. The increase is primarily due to normal operating and ramp-up costs associated with growth in Medicaid membership and higher short-term and long-term management incentive compensation due to improved Company performance, partially offset by lower members in our Medicare Health Plans and Medicare PDP segments and continued improvements in operational efficiency.
Our SG&A ratio for the year ended December 31, 2016 decreased 20 basis points compared with the same period in 2015, primarily driven by continued improvements in operating efficiency and lower investigation and PBM transitory costs, partially offset by the higher short-term and long-term management incentive compensation due to improved Company performance. Our Adjusted SG&A ratio for the year ended December 31, 2016 was consistent with the same period in 2015.
ACA Industry Fee
2017 vs. 2016
As discussed under "Key Developments and Accomplishments," in December 2015, President Obama signed the Consolidated Appropriations Act, 2016 which, among other provisions, included a one-year moratorium on the ACA industry fee for 2017, and, as a result, eliminated the associated ACA industry fee. Accordingly, we did not incur ACA industry fee expense for the year ended December 31, 2017, compared with $228.4 million for the same period in 2016.
2016 vs. 2015
We were assessed $228.4 million for the ACA industry fee for the year ended December 31, 2016, compared with $227.3 million for the same period in 2015, consistent year-over-year as the total fee levied on the industry remained at $11.3 billion in 2016. During both 2016 and 2015, we received amendments, written agreements or other documentation from all of our state Medicaid customers that commit them to reimburse us for the portion of the ACA industry fee attributable to our Medicaid programs, including its non-deductibility for income tax purposes.
Interest expense
2017 vs. 2016
Interest expense for the year ended December 31, 2017 increased approximately $9.4 million compared with the same period in 2016. The increase is primarily driven by the offering and sale of our 5.25% senior notes due 2025 (the "2025 Notes") on March 22, 2017, in the aggregate principal amount of $1,200.0 million, resulting in aggregate net proceeds of $1,182.2 million. A portion of the net proceeds from the offering were used to repay the $100.0 million outstanding under our Credit Agreement, and to redeem the full $900.0 million aggregate principal amount of our 5.75% senior notes due 2020 Notes (the "2020 Notes") on April 7, 2017.
57
2016 vs. 2015
Interest expense for the year ended December 31, 2016 increased approximately $4.9 million compared with the same period in 2015, primarily driven by the additional $300.0 million issuance of our 2020 Notes in June 2015.
Loss on extinguishment of debt
The loss on extinguishment of debt of $26.1 million primarily related to the early redemption on April 7, 2017 of our 2020 Notes. As discussed in Note 10 - Debt to the consolidated financial statements in this 2017 Form 10-K, we redeemed the full $900.0 million in aggregate principal amount outstanding of our 2020 Notes. In connection with the redemption we incurred a one-time loss on extinguishment of debt related to the redemption premium, the write-off of associated deferred financing costs and the write-off of the unamortized portion of associated premiums paid on the 2020 Notes.
Equity in Earnings (Losses) of Unconsolidated Subsidiaries
As discussed in Note 1 - Organization and Basis Of Presentation to the consolidated financial statements in this 2017 Form 10-K, we work with physicians and other health care professionals to operate Accountable Care Organizations (“ACOs”) under the Medicare Shared Saving Program ("MSSP") and Next Generation ACO Models. We account for our participation in the ACOs using the equity method. Gains and losses are reported as equity in earnings (losses) of unconsolidated subsidiaries in our consolidated statements of comprehensive income. For the year ended December 31, 2017, we recorded net gains of $18.7 million primarily associated with shared savings for the 2016 MSSP contract year.
Income Tax Expense
2017 vs. 2016
Income tax expense for the year ended December 31, 2017 decreased $199.5 million, or 69.4%, compared with the same period in 2016, while the effective tax rate for the year ended December 31, 2017 decreased to 19.0% compared with 54.3% for the same period in 2016. The decrease in income tax expense was primarily driven by the one-year moratorium on the non-deductible ACA industry fee for 2017, higher excess tax benefits resulting from the settlement of stock-compensation awards in 2017 and the favorable effect of the recognition of certain previously unrecognized tax benefits during 2017. The decrease is also related to the effect of revaluing the Company's deferred tax assets and liabilities as a result of the Tax Cuts and Jobs Act of 2017. Refer to Note 14 - Income Taxes to the consolidated financial statements in this 2017 Form 10-K for further discussion regarding the recognition of previously unrecognized tax benefits in 2017 and the current year tax effect of the Tax Cuts and Jobs Act of 2017.
2016 vs. 2015
Income tax expense for the year ended December 31, 2016 increased $69.9 million, or 32.1%, compared with the same period in 2015, while the effective tax rate for the year ended December 31, 2016 decreased to 54.3% compared with 64.7% for the same period in 2015. The increase in income tax expense and decrease in the effective tax rate were both attributable to higher income before income taxes, as well as the adoption of Accounting Standards Update ("ASU") 2016-09 "Compensation—Stock Compensation (Topic 718)" during 2016. Our effective tax rate for the year ended December 31, 2016 also includes the favorable effect of the recognition of certain previously unrecognized tax benefits.
58
Segment Reporting
Reportable operating segments are defined as components of an enterprise for which discrete financial information is available and evaluated on a regular basis by the enterprise's decision makers to determine how resources should be allocated to an individual segment and to assess performance of those segments. Accordingly, we have three reportable segments: Medicaid Health Plans, Medicare Health Plans and Medicare PDPs.
Segment Financial Performance Measures
Our primary measurements of profitability for our reportable segments are premium revenue, gross margin and MBR. Gross margin is defined as premium revenue less medical benefits expense and the ACA industry fee expense. MBR measures the ratio of medical benefits expense to premium revenue. Our Adjusted MBR (non-GAAP) measures the ratio of medical benefits expense to premium revenue, excluding Medicaid premium taxes reimbursement and Medicaid ACA industry fee reimbursement.
We use gross margin, MBR and, where applicable, Adjusted MBR, to monitor our management of medical benefits and medical benefits expense. These metrics are utilized to make various business decisions, including which health care plans to offer, which geographic areas to enter or exit and which health care providers to include in our networks.
For further information regarding premium revenues and medical benefits expense, please refer below to "Premium Revenue Recognition and Premiums Receivable" and "Medical Benefits Expense and Medical Benefits Payable" under "Critical Accounting Estimates."
Reconciling Segment Results
The following table reconciles our reportable segment results with our income from operations (before income taxes), as reported in accordance with generally accepted accounting principles in the United States of America ("GAAP").
For the Years Ended December 31, | |||||||||||
2017 | 2016 | 2015 | |||||||||
Gross Margin: | (In millions) | ||||||||||
Medicaid Health Plans | $ | 1,312.2 | $ | 1,162.8 | $ | 1,072.4 | |||||
Medicare Health Plans | 742.9 | 533.9 | 428.4 | ||||||||
Medicare PDPs | 160.4 | 206.4 | 168.2 | ||||||||
Total gross margin | 2,215.5 | 1,903.1 | 1,669.0 | ||||||||
Investment and other income | 46.9 | 16.2 | 15.4 | ||||||||
Other expenses, net (1) | (1,793.4 | ) | (1,389.8 | ) | (1,348.3 | ) | |||||
Income from operations | $ | 469.0 | $ | 529.5 | $ | 336.1 | |||||
(1) | Other expenses, net include SG&A expenses, Medicaid premium taxes, depreciation and amortization, and interest. Other expenses, net for 2015 also include the gain on the Sterling divestiture. |
Medicaid Health Plans
Our Medicaid Health Plans segment includes plans for beneficiaries of TANF, Supplemental Security Income ("SSI"), Aged Blind and Disabled ("ABD") and other state-based programs that are not part of the Medicaid program, such as CHIP and the Long-Term Services and Supports ("LTSS") program. As of December 31, 2017, we operated Medicaid health plans in Arizona, Florida, Georgia, Hawaii, Illinois, Kentucky, Missouri, Nebraska, New Jersey, New York, South Carolina and Texas.
59
Medicaid Health Plans Results of Operations
The following table sets forth the summarized results of operations and other relevant performance measures for our Medicaid Health Plans segment for the years ended December 31, 2017, 2016 and 2015:
For the Years Ended December 31, | |||||||||||
2017 | 2016 | 2015 | |||||||||
(In millions) | |||||||||||
Premium revenue (1) | $ | 10,606.5 | $ | 9,144.4 | $ | 8,760.4 | |||||
Medicaid premium taxes (1) | 119.8 | 110.0 | 94.7 | ||||||||
Medicaid ACA industry fee reimbursement (1) | — | 244.9 | 219.2 | ||||||||
Total premiums | 10,726.3 | 9,499.3 | 9,074.3 | ||||||||
Medical benefits expense | 9,414.1 | 8,188.5 | 7,866.8 | ||||||||
ACA industry fee | — | 148.0 | 135.1 | ||||||||
Gross margin | $ | 1,312.2 | $ | 1,162.8 | $ | 1,072.4 | |||||
Medicaid Health Plans MBR (1) | 87.8 | % | 86.2 | % | 86.7 | % | |||||
Effect of: | |||||||||||
Medicaid premium taxes | 1.1 | % | 1.0 | % | 1.0 | % | |||||
Medicaid ACA industry fee reimbursement | — | % | 2.3 | % | 2.1 | % | |||||
Medicaid Health Plans Adjusted MBR (1) | 88.8 | % | 89.5 | % | 89.8 | % | |||||
Medicaid Health Plans Membership: | |||||||||||
Florida | 751,000 | 780,000 | 781,000 | ||||||||
Georgia | 513,000 | 571,000 | 585,000 | ||||||||
Kentucky | 448,000 | 440,000 | 440,000 | ||||||||
Other states (2) | 1,011,000 | 753,000 | 582,000 | ||||||||
2,723,000 | 2,544,000 | 2,388,000 | |||||||||
(1) | For GAAP reporting purposes, Medicaid premium taxes and Medicaid ACA industry fee reimbursements are included in premium revenue to measure our MBR. Our Medicaid Health Plans Adjusted MBR measures the ratio of our medical benefits expense to premium revenue, excluding Medicaid premium taxes and Medicaid ACA industry fee reimbursement revenue. Because reimbursements for Medicaid premium tax and ACA industry fee are both included in the premium rates or reimbursement established in certain of our Medicaid contracts and also recognized separately as a component of expense, we exclude these reimbursements from premium revenue when calculating key ratios as we believe that these components are not indicative of operating performance. |
(2) | "All other states" consists of Arizona, Hawaii, Illinois, Missouri, Nebraska, New Jersey, New York, South Carolina. and Texas. |
2017 vs. 2016
Medicaid total premiums increased $1.2 billion, or 12.9%, for the year ended December 31, 2017 compared with the same period in 2016, primarily driven by membership acquired from our Arizona acquisitions, our new Nebraska Medicaid plan and our participation in Missouri's Medicaid program statewide expansion. The increase is also attributable to net rate increases in certain of our existing Medicaid markets. These increases were partially offset by the effect of the previously noted ACA industry fee moratorium for 2017, which resulted in the elimination of any associated Medicaid ACA industry fee reimbursements from our state government partners.
Excluding Medicaid premium taxes and Medicaid ACA industry fee reimbursements, Medicaid premium revenue increased $1.5 billion, or 16.0%, for the year ended December 31, 2017 compared with the same period in 2016. The increase is a result of our previously discussed 2017 and 2016 Medicaid acquisitions, our new Nebraska Medicaid program and our participation in the Missouri Medicaid program statewide expansion. The increase is also attributable to net increases in certain of our existing Medicaid markets.
60
Medical benefits expense increased by approximately $1.2 billion, or 15.0%, for the year ended December 31, 2017 compared with the same period in 2016, primarily resulting from the previously discussed net increase in membership, including growth from acquisitions and organic growth resulting from our new Nebraska market and Missouri's statewide expansion. The increase also includes the previously noted $45.6 million PDR recognized related to the Illinois Medicaid managed care program.
Our Medicaid Health Plans segment MBR increased by 160 basis points for the year ended December 31, 2017 compared with the same period in 2016. The increase is primarily a result of the effect of the ACA industry fee moratorium, and, as a result the elimination of associated Medicaid reimbursement revenue, the recognition of the previously noted PDR related to our Illinois Medicaid program, the addition of our new Medicaid businesses in Arizona and Nebraska, and new members from the statewide expansion of the Missouri Medicaid program. This increase was partially offset by continued operational execution and net rate increases in certain Medicaid markets.
Excluding the effect of Medicaid premium taxes and Medicaid ACA industry fee reimbursements, our Medicaid Health Plans Adjusted MBR decreased by 70 basis points for the year ended December 31, 2017 compared with the same period in 2016. The decrease is primarily the result of continued operational execution and net rate increases in certain Medicaid markets, partially offset by the addition of our new Medicaid businesses in Arizona and Nebraska, the recognition of the previously noted PDR related to our Illinois Medicaid program and new members from the statewide expansion of the Missouri Medicaid program.
2016 vs. 2015
Medicaid total premiums increased $425.0 million, or 4.7%, for the year ended December 31, 2016 compared with the same period in 2015. Excluding Medicaid premium taxes and Medicaid ACA industry fee reimbursements, Medicaid premium revenue increased $384.0 million, or 4.4%, for the year ended December 31, 2016 compared with the same period in 2015. The increases were primarily driven by organic membership growth, net rate increases for the Florida MMA program, and the acquisition of Advicare, effective June 1, 2016.
Medical benefits expense increased by approximately $321.7 million, or 4.1%, for the year ended December 31, 2016 compared with the same period in 2015, primarily driven by the organic membership growth, the acquisition of Advicare and other factors including net medical trend and mix of membership.
Our Medicaid Health Plans MBR decreased by 50 basis points for the year ended December 31, 2016 compared with the same period in 2015. Our Medicaid Health Plans Adjusted MBR decreased by 30 basis points for the year ended December 31, 2016 compared with the same period in 2015. The decreases in both MBRs were primarily driven by improved operational execution and pharmacy cost structure, as well as higher ACA industry fee reimbursement (affecting the Medicaid Health Plans MBR).
Medicare Health Plans
We contract with CMS under the Medicare program to provide a comprehensive array of Part C and Part D benefits to Medicare eligible persons provided through our MA plans. Our MA plans are comprised of coordinated care plans ("CCPs"), which are primarily administered through HMOs and generally require members to seek health care services and select a primary care physician from a network of health care providers. Certain MA CCPs are administered through PPOs and PFFS. In addition, we offer Medicare Part D coverage, which provides prescription drug benefits, as a component of most of our MA plans.
In 2017, we operated our MA CCPs in 485 counties across 17 states, including Arizona, Arkansas, California, Connecticut, Florida, Georgia, Hawaii, Illinois, Kentucky, Louisiana, Maine, Mississippi, New Jersey, New York, South Carolina, Tennessee and Texas. Effective January 1, 2018, we expanded our MA service area into the state of North Carolina. We cover a wide spectrum of medical services through our MA plans. For many of our plans, we provide additional benefits not covered by Original Medicare, such as vision, dental and hearing services. Through these enhanced benefits, out-of-pocket expenses incurred by our members are generally reduced, which better allows our members to manage their health care costs.
61
We continue to focus on three main areas in MA, including:
• | Execution on healthcare value-added initiatives led by our clinical services group; |
• | Continued application of a more disciplined portfolio approach to our MA bids, including a focus on net income; and |
• | Improving Star Ratings, both in terms of execution on quality initiatives and our advocacy position to properly match the ratings, rules and economics with the prevalent data that demonstrates the connection between socio-economic status and lower quality ratings. |
As a result of the Windsor acquisition completed on January 1, 2014, we began offering Medicare Supplement products. Accordingly, we included results for Medicare Supplement operations together with our MA plans within the Medicare Health Plans segment through June 30, 2015. On July 1, 2015, we completed the sale of our Medicare Supplement business through the Sterling divestiture. The operations of our Medicare Supplement business were not material to overall segment results.
Medicare Health Plans Results of Operations
The following table sets forth the summarized results of operations and other relevant performance measures for our Medicare Health Plans segment for the years ended December 31, 2017, 2016 and 2015:
For the Years Ended December 31, | |||||||||||
2017 | 2016 | 2015 | |||||||||
(In millions) | |||||||||||
Premium revenue | $ | 5,320.2 | $ | 3,876.6 | $ | 3,898.8 | |||||
Medical benefits expense | 4,577.3 | 3,278.5 | 3,401.7 | ||||||||
ACA industry fee | — | 64.2 | 68.7 | ||||||||
Gross margin | $ | 742.9 | $ | 533.9 | $ | 428.4 | |||||
Medicare Health Plans Membership | 496,000 | 345,000 | 354,000 | ||||||||
Medicare Health Plans MBR | 86.0 | % | 84.6 | % | 87.2 | % | |||||
2017 vs. 2016
Medicare Health Plans premium revenue increased by $1.4 billion, or 37.2%, for the year ended December 31, 2017 compared with the same period in 2016, primarily driven by our acquisition of Universal American, our 2017 bid strategy and organic growth.
Medicare Health Plans medical benefits expense increased $1.3 billion, or 39.6%, for the year ended December 31, 2017 compared with the same period in 2016, primarily due to increased membership acquired from the acquisition of Universal American and increased membership as a result of our 2017 bid positioning. The Medicare Health Plans MBR increased by 140 basis points for the year ended December 31, 2017 compared with the same period in 2016, primarily resulting from the acquisition of Universal American, bid considerations due to the ACA industry fee moratorium in 2017 and increased investments in quality program initiatives.
2016 vs. 2015
Medicare Health Plans premium revenue decreased marginally by $22.2 million, or 0.6%, for the year ended December 31, 2016 compared with the same period in 2015, primarily due to the Sterling divestiture partially offset by our Medicare Advantage 2016 bid positioning.
Medicare Health Plans medical benefits expense decreased $123.2 million, or 3.6%, for the year ended December 31, 2016 compared with the same period in 2015, primarily due to the lower membership and the Sterling divestiture. The Medicare Health Plans MBR decreased by 260 basis points for the year ended December 31, 2016 compared with the same period in 2015, resulting from our 2016 bid strategy and continued clinical and operational improvement.
62
Medicare PDPs
We have contracted with CMS to serve as a plan sponsor offering stand-alone Medicare Part D PDPs to Medicare eligible beneficiaries through our Medicare PDPs segment. As of December 31, 2017, we offered PDPs in 50 states and the District of Columbia. The PDP benefit design generally results in our incurring a greater portion of the responsibility for total prescription drug costs in the early stages of a plan year and less in the latter stages of a plan year due to the members' share of cumulative out-of-pocket costs increasing throughout the plan year. As a result, the Medicare PDPs MBR is generally lower in the second half of the year as compared with the first half. In addition, the level and mix of members who are auto-assigned to us and those who actively choose our PDPs will affect the segment MBR pattern across periods.
Medicare PDPs Results of Operations
The following table sets forth the summarized results of operations and other relevant performance measures for our Medicare PDPs segment for the years ended December 31, 2017, 2016 and 2015:
For the Years Ended December 31, | |||||||||||
2017 | 2016 | 2015 | |||||||||
(In millions) | |||||||||||
Premium revenue | $ | 913.8 | $ | 845.0 | $ | 901.7 | |||||
Medical benefits expense | 753.4 | 622.4 | 710.0 | ||||||||
ACA industry fee | — | 16.2 | 23.5 | ||||||||
Gross margin | $ | 160.4 | $ | 206.4 | $ | 168.2 | |||||
Medicare PDPs membership | 1,152,000 | 1,009,000 | 1,025,000 | ||||||||
Medicare PDPs MBR | 82.4 | % | 73.7 | % | 78.7 | % | |||||
2017 vs. 2016
The Medicare PDPs premium revenue increased $68.8 million, or 8.1%, for the year ended December 31, 2017 compared with the same period in 2016. Medical benefits expense increased $131.0 million, or 21.0%, for the year ended December 31, 2017 compared with the same period in 2016. The increases were primarily due to the increase in membership resulting from our 2017 bid strategy. The Medicare PDPs MBR increased by 870 basis points for the year ended December 31, 2017 compared with the same period in 2016 reflecting the effect of our 2017 bid strategy.
2016 vs. 2015
The Medicare PDPs premium revenue decreased $56.7 million, or 6.3%, in 2016 compared with 2015, primarily due to the decrease in membership resulting from our 2016 bid strategy. The Medicare PDPs MBR for the year ended December 31, 2016 decreased 500 basis points over the same period in 2015, reflecting improvement in our pharmacy cost structure, including rebate management, and continued improved operational execution.
Business Trends and Inflation
Health care expenditures have grown consistently for many years, and we expect overall health care costs to continue to grow in the future due to inflation, evolving medical technology, pharmaceutical advancement, regulatory requirements, demographic trends in the U.S. population, and national interest in health and well being. We use various strategies to mitigate the negative effects of health care cost inflation. Specifically, our health plans try to control medical costs through our healthcare quality and affordability initiatives and contracts with independent providers of health care services. Through these contracted care providers, our health plans emphasize preventive health care and appropriate use of specialty and hospital services. Additionally, federal regulation requires that our state Medicaid contracts maintain actuarially sound premiums that include health care cost trend. While we currently believe our strategies to mitigate health care cost inflation will continue to be successful, competitive pressures, new health care and pharmaceutical product introductions, demands from health care
63
providers and customers, applicable health care reform regulations, an increase in the expected rate of inflation for health care costs, or other factors may adversely affect our ability to control health care costs.
2018 Outlook
Medicaid Health Plans - We expect premium revenue (GAAP) for our Medicaid Health Plans segment to be in the range of $11.3 billion to $11.6 billion for 2018, compared with $10.7 billion for 2017. We expect premium revenue for our Medicaid Health Plans, excluding $120.0 million to $125.0 million in Medicaid premium taxes and $250.0 million to $260.0 million in Medicaid ACA industry fee reimbursements, to be in the range of $10.9 billion to $11.2 billion for 2018, compared with $10.6 billion reported for 2017, excluding $119.8 million in Medicaid premium taxes.
The Medicaid Health Plans MBR (GAAP) is expected to be in the range of 85.5% to 86.2% for 2018, compared with 87.8% for 2017. The Medicaid Health Plans Adjusted MBR is expected to be in the range of 88.4% to 89.2%, consistent with 88.8% reported in 2017.
Medicare Health Plans - We expect premium revenue for our Medicare Health Plans segment to be in the range of $6.15 billion to $6.3 billion for 2018, compared with $5.3 billion reported for 2017. Medicare Health Plans MBR is expected to be in the range of 84.6% to 85.6% for 2018, compared with 86.0% in 2017, reflecting our 2018 bid strategy and associated considerations due to the ACA industry fee return in 2018.
Medicare PDPs - We expect premium revenue for our Medicare PDPs segment to be in the range of $875.0 million to $925.0 million for 2018, consistent with $913.8 million for 2017. Medicare PDPs MBR is expected to be in the range of 80.0% to 82.0% for 2018, compared with 82.4% for 2017 due to our bid positioning for the 2018 plan year.
Consolidated SG&A - Our consolidated SG&A ratio (GAAP) is not estimable as we currently are not able to project future amounts associated with Investigation costs as well as the Transaction and Integration costs associated with the Universal American acquisition, as defined earlier. We expect that our consolidated Adjusted SG&A ratio, which excludes the effect of investigation costs, for 2018 will be approximately 8.1% to 8.3%, compared with 8.5% for 2017, resulting from improved operating leverage associated with premium revenue growth and continued synergies from our 2016 and 2017 acquisitions.
Income Taxes - Our consolidated effective income tax rate (GAAP) is not estimable as we currently are not able to project future amounts associated with Investigation costs as well as the Transaction and Integration costs associated with the Universal American acquisition, as defined earlier. However, we expect our effective income tax rate to increase in 2018 compared with 2017 due to the reinstatement in 2018 of the ACA industry fee that was subject to a one-year moratorium in 2017, which had the effect of lowering our income tax rate in 2017. The reduction in the federal income tax rate for corporations from 35% to 21% effective on January 1, 2018 as part of the Tax Cuts and Jobs Act of 2017 will partially offset the effect of the non-deductibility of the ACA industry fee.
LIQUIDITY AND CAPITAL RESOURCES
Each of our existing and anticipated sources of cash is affected by operational and financial risks that influence the overall amount of cash generated and the capital available to us. Additionally, we operate as a holding company in a highly regulated industry. The parent and other non-regulated companies ("non-regulated subsidiaries") are dependent upon dividends and management fees from our regulated subsidiaries, most of which are subject to regulatory restrictions. For a further discussion of risks that can affect our liquidity, see Part I – Item 1A – Risk Factors included in this 2017 Form 10-K.
Liquidity
The Company maintains liquidity at two levels: the regulated subsidiary level and the non-regulated subsidiary level.
Regulated subsidiaries
Our regulated subsidiaries' primary liquidity requirements include:
• | payment of medical claims and other health care services; |
• | payment of certain Part D benefits paid for members on behalf of CMS; |
• | SG&A costs directly incurred or paid through a management services agreement to one of our non-regulated |
64
administrative and management services subsidiaries; and
• | federal tax payments to the parent company under an intercompany tax sharing agreement. |
Our regulated subsidiaries meet their liquidity needs by:
• | generating cash flows from operating activities, primarily from premium revenue; |
• | receipts of prospective subsidy payments and related final settlements from CMS to reimburse us for certain Part D benefits paid for members on behalf of CMS; |
• | cash flows from investing activities, including investment income and sales of investments; and |
• | capital contributions received from our non-regulated subsidiaries. |
We refer collectively to the cash, cash equivalents and investment balances maintained by our regulated subsidiaries as "regulated cash and investments." Our regulated subsidiaries generally receive premiums in advance of payments of claims for medical and other health care services; however, regulated cash, cash equivalents and investments can fluctuate significantly in a particular period depending on the timing of receipts for premiums from our government partners. Our unrestricted regulated cash, cash equivalents and investments was $4.8 billion at December 31, 2017, compared with $3.2 billion at December 31, 2016, primarily due to cash, cash equivalents and investments acquired with the Universal American acquisition, earnings from operations and contributions received from the parent and non-regulated subsidiaries. These increases were partially offset by dividends paid to the parent and non-regulated subsidiaries.
Our regulated subsidiaries are each subject to applicable state regulations that, among other things, require the maintenance of minimum levels of capital and surplus. We continue to maintain significant levels of aggregate excess statutory capital and surplus in our regulated subsidiaries. See further discussion under Regulatory Capital and Dividend Restrictions below.
Parent and Non-regulated Subsidiaries
Liquidity requirements at the non-regulated parent and subsidiary level generally consist of:
• | payment of administrative costs not directly incurred by our regulated operations, including, but not limited to, staffing costs, business development, rent, branding and certain information technology services; |
• | capital contributions paid to our regulated subsidiaries; |
• | capital expenditures; |
• | acquisition-related funding and transaction expenses; |
• | debt service; and |
• | federal tax payments. |
Our non-regulated parent and subsidiaries normally meet their liquidity requirements by:
• | management fees earned by our non-regulated administrator subsidiary under management services agreements; |
• | dividends received from our regulated subsidiaries; |
• | collecting federal tax payments from the regulated subsidiaries; |
• | proceeds from issuance of debt and equity securities; and |
• | cash flows from investing activities, including investment income and sales of investments. |
Unregulated cash, cash equivalents and investments totaled approximately $617.0 million at December 31, 2017, a decrease of approximately $298.3 million from $915.3 million at December 31, 2016. This decrease is primarily the result of the early redemption in full of our 2020 notes, including the redemption premium, funding for the acquisition of Universal American and a $100.0 million cash payment to repay borrowings under our Revolving Credit Facility in March 2017. These decreases were partially offset by the receipt of $1.2 billion net proceeds from the 2025 Notes issuance in March 2017 (see Capital Resources – Debt below for further discussion), as well as dividends received from our regulated subsidiaries.
We funded the acquisition of Universal American with unrestricted cash available on hand from both WellCare and Universal American. The transaction is valued at approximately $770.0 million, including the cash purchase price of $10.00 per outstanding share ("Per Share Merger Consideration") of Universal American's common stock, the assumption of $145.3 million fair value of Universal American's convertible debt, the cash settlement of Universal American's $40.0 million par value of Series A Mandatorily Redeemable Preferred Shares (the "Preferred Shares") and the cash settlement of outstanding vested and unvested stock-based compensation awards.
65
Universal American Convertible Notes
In 2016, Universal American completed the offering of $115.0 million of their 4.00% Convertible Notes due 2021. During the three months ended June 30, 2017, all of the holders of the Convertible Notes elected to convert their notes into the right to receive cash equal to the par value of the notes plus a make whole premium. We paid the noteholders the amounts due and all of the notes were cancelled prior to June 30, 2017. The fair value of the Convertible Notes was $145.3 million on the Effective Date and was included in the purchase consideration for the Universal American acquisition.
Universal American Mandatorily Redeemable Preferred Shares
In April 2011, Universal American issued an aggregate of $40.0 million of their Preferred Shares, representing 1,600,000 shares with a par value of $0.01 per share and a liquidation preference of $25.00 per share. During the three months ended June 30, 2017, the Preferred Shares were redeemed for $41.0 million, which includes the $40.0 million par value of the Preferred Shares and $1.0 million of accrued dividends. The $41.0 million redemption amount was included in purchase consideration for the Universal American acquisition.
Refer to Note 3- Acquisitions to the consolidated financial statements in this 2017 Form 10-K for further discussion of the Universal American acquisition.
Medicare Part D Funding and Settlements
Funding may be provided to certain regulated subsidiaries from our unregulated subsidiaries to cover any shortfall resulting from the amount of Part D benefits paid for members on behalf of CMS that exceeds the prospective subsidy payments that these regulated subsidiaries receive from CMS. We receive certain Part D prospective subsidy payments from CMS for our MA and PDP members as a fixed monthly per member amount, based on the estimated costs of providing prescription drug benefits over the plan year, as reflected in our bids. A discussion of the subsidy components under Part D is included in Note 2- Significant Accounting Policies to the consolidated financial statements included in this 2017 Form 10-K. The benefits include the catastrophic reinsurance, premium and cost sharing for low income Part D members ("LICS"), for which CMS will fully reimburse these subsidies, or recoup overpaid subsidies made during the plan year, as part of its annual settlement process that typically occurs in the fourth quarter of the subsequent year.
Government Investigation and Litigation
Under the terms of the settlement agreements entered into by us on April 26, 2011, and finalized on March 23, 2012, to resolve matters under investigation by the Civil Division of the U.S. Department of Justice (the "Civil Division") and certain other federal and state enforcement agencies (the "Settlement"), WellCare agreed to pay the Civil Division a total of $137.5 million in four equal annual principal payments, plus interest accrued at 3.125%. The final payment of $35.4 million, which included accrued interest, was remitted to the Civil Division during March 2015.
We currently maintain directors' and officers' liability insurance for matters not addressed above.
66
Cash Flow Activities
Our cash flows are summarized as follows:
For the Years Ended December 31, | |||||||||||
2017 | 2016 | 2015 | |||||||||
(In millions) | |||||||||||
Net cash provided by operating activities | $ | 1,050.0 | $ | 748.3 | $ | 712.6 | |||||
Net cash used in investing activities | (1,641.0 | ) | (27.0 | ) | (124.2 | ) | |||||
Net cash provided by financing activities | 828.2 | 833.1 | 505.1 | ||||||||
Increase in cash and cash equivalents | $ | 237.2 | $ | 1,554.4 | $ | 1,093.5 | |||||
Cash Flows from Operating Activities
We generally receive premiums in advance of payments of claims for health care services; however, cash flows related to our operations can fluctuate significantly in a particular period depending on the timing of premium receipts from our government partners.
2017 vs. 2016
Net cash provided by operating activities for 2017 was $1.1 billion, compared with $748.3 million for 2016. The increase is primarily due to improved operating earnings and the timing of claim payments.
2016 vs. 2015
Cash provided by operating activities for 2016 was $748.3 million compared with $712.6 million for 2015, primarily due to improved year-over-year operating performance across all segments and the timing of certain pharmacy rebate receipts and claims payments. Cash flows from operating activities for the year ended December 31, 2016 included a $228.4 million ACA industry fee payment remitted to the IRS in September 2016, compared with $227.3 million remitted for such fee in September 2015.
Net cash provided by operating activities for the year ended December 31, 2015 was reduced by the $35.4 million final payment remitted to the Civil Division in March 2015. See further discussion in Government Investigation and Litigation above.
Cash Flows from Investing Activities
2017 vs. 2016
Net cash used in investing activities for 2017 was $1.6 billion compared with $27.0 million for the same period in 2016. The increase primarily resulted from higher purchases of investments in 2017 to improve investment income, as well as the acquisitions of Universal American and PHP during the second quarter of 2017. Net cash used in investing activities for 2016 included the acquisition of Care1st Arizona.
2016 vs. 2015
Net cash used in investing activities for 2016 was $27.0 million compared with $124.2 million for the same period in 2015, primarily resulting from higher net proceeds from the sales of investments in 2016, partially offset by the acquisitions of Care1st Arizona and Advicare and the effect of higher additions to capitalized software during 2015 resulting from investments in our information technology infrastructure.
Cash flows from financing activities
2017 vs. 2016
67
Cash flows from financing activities are primarily affected by debt-related activity, as well as net funds received or paid for the benefit of members of our MA and PDP plans. Cash provided by financing activities for 2017 was $828.2 million, compared with $833.1 million for the same period in 2016, primarily driven by the following:
• | Net funds received for the benefit of members was approximately $671.6 million for 2017, compared with $1.0 billion during 2016. These funds represent the net amounts of subsidies we received from CMS in connection with the low-income cost sharing, catastrophic reinsurance and coverage gap discount components of the Medicare Part D program related to the government's portion of financial responsibility, net of the amounts we paid for related prescription drug benefits, described above in "Medicare Part D Funding and Settlements." The decrease in funds received in 2017 compared with the same period in 2016 is due to the effect of our 2017 bids, as well as the timing of pharmacy claims payments in 2016. |
• | Aggregate net proceeds of $156.1 million resulting from debt transactions executed during 2017 reflecting net proceeds of $1.2 billion received from the issuance of our 2025 Notes in March 2017, partially offset by the early redemption in full of our $900.0 million principal amount of 2020 notes in April 2017, including the $25.9 million redemption premium, and a $100.0 million repayment of outstanding borrowings under our Revolving Credit Facility. Refer to "Capital Resources" below for further discussion of our 2017 debt transactions. Debt-related activity for 2016 reflects $200.0 million drawn from our Revolving Credit Facility, which, along with $100.0 million in cash, was used to repay in full the $300.0 million term loan under our prior credit facility. |
2016 vs. 2015
Cash flows from financing activities are primarily affected by net funds received or paid for the benefit of members of our MA and PDP plans as well as debt-related activity.
Net funds received for the benefit of members was approximately $1.0 billion in 2016, compared with $201.1 million during the same period in 2015. These funds represent the net amount of prescription drug benefits we paid in connection with the low-income cost sharing, catastrophic reinsurance and coverage gap discount components of the Medicare Part D program related to the government's portion of financial responsibility, net of the related subsidies received from CMS, as described above in "Medicare Part D Funding and Settlements."
Additionally, in January 2016, $200.0 million of the Revolving Credit Facility (described below) was drawn upon and, along with $100.0 million in cash, used to repay our $300.0 million Term Loan. In September 2016, we repaid $100.0 million of the $200.0 million borrowed under the 2016 Revolving Credit Facility. Debt-related activity for the year ended December 31, 2015 includes net proceeds of $308.9 million resulting from the issuance of $300.0 million aggregate principal amount of our Senior Notes.
Capital Resources
Debt
5.25% Senior Notes due 2025
On March 22, 2017, we completed the offering and sale of our 2025 Notes in the aggregate principal amount of $1,200.0 million, resulting in aggregate net proceeds of $1,182.2 million. A portion of the net proceeds from the offering was used to redeem the full $900.0 million aggregate principal amount of our 2020 Notes and to repay the $100.0 million outstanding under our Revolving Credit Facility. The remaining net proceeds from the offering of the 2025 Notes were used for general corporate purposes, including organic growth and working capital.
The 2025 Notes were issued under an indenture, dated as of March 22, 2017 (the "Base Indenture"), as supplemented by the First Supplemental Indenture, dated as of March 22, 2017 (the "First Supplemental Indenture" and, together with the Base Indenture, the "Indenture"), each between the Company and The Bank of New York Mellon Trust Company, N.A. (“BNY Mellon”), as trustee. The Indenture under which the notes were issued contains covenants that, among other things, limit our ability and the ability of our subsidiaries under certain circumstances to:
• | incur additional indebtedness and issue preferred stock; |
• | pay dividends or make other distributions; |
68
• | make other restricted payments and investments; |
• | sell assets, including capital stock of restricted subsidiaries; |
• | create certain liens; |
• | incur restrictions on the ability of restricted subsidiaries to pay dividends, or make other payments, and in the case of our subsidiaries, guarantee indebtedness; |
• | engage in transactions with affiliates; and |
• | create unrestricted subsidiaries. |
In addition, the Indenture requires that for the company to merge, consolidate or sell all or substantially all of its assets, (i) either the company must be the surviving entity, or the surviving entity or purchaser must be a U.S. entity; (ii) the surviving entity or purchaser must assume all the obligations of the company under the notes and the indenture; (iii) no default or event of default (as defined under the Indenture) exists and (iv) the surviving entity, after giving pro forma effect to the transaction, (x) may incur at least $1.00 of additional indebtedness pursuant to the fixed charge coverage ratio or (y) have a fixed charge coverage ratio that is no worse than the fixed charge coverage ratio of the Company without giving pro forma effect to the transactions.
5.75% Senior Notes due 2020
In November 2013, we issued $600.0 million in aggregate principal amount of our 2020 Notes. In June 2015, we issued an additional $300.0 million of 2020 Notes, pursuant to a reopening of such notes. Refer to Note 10 - Debt to the consolidated financial statements included in this 2017 Form 10-K for additional information regarding these 2020 Notes.
In April 2017, we redeemed the full $900.0 million in aggregate principal amount outstanding of our 2020 Notes at a redemption price of 102.875% of the principal amount, plus accrued and unpaid interest. Our obligations under the related base indenture, each dated as of November 14, 2013, by and among us and BNY Mellon, as trustee, were satisfied and discharged on April 7, 2017. In connection with the redemption of the 2020 Notes, we incurred a one-time loss on extinguishment of debt of approximately $25.9 million related to the redemption premium, the write-off of associated deferred financing costs and the write-off of the unamortized portion of associated premiums paid on the 2020 Notes. The loss on extinguishment of debt is reflected in our results of operations for 2017.
Credit Agreement
In January 2016, we entered into the Credit Agreement, which provides for a senior unsecured revolving loan facility (the "Revolving Credit Facility"), which had an initial aggregate principal amount at any time outstanding not to exceed $850.0 million. On March 22, 2017, we increased the amount available under our Credit Agreement from $850.0 million to $1.0 billion. In March 2017, we also repaid the $100.0 million outstanding under our Revolving Credit Facility, and as a result, there were no borrowings outstanding under the Revolving Credit Facility as of December 31, 2017.
Revolving Credit Loans designated by us at the time of borrowing as “ABR Loans” that are outstanding under the Credit Agreement bear interest at a rate per annum equal to (i) the greatest of (a) the Prime Rate (as defined in the Credit Agreement) in effect on such day; (b) the Federal Reserve Bank of New York Rate (as defined in the Credit Agreement) in effect on such day plus 1/2 of 1%; and (c) the Adjusted LIBO Rate (as defined in the Credit Agreement) for a one month interest period on such day plus 1%; plus (ii) the Applicable Rate. Revolving Credit Loans designated by us at the time of borrowing as “Eurodollar Loans” that are outstanding under the Credit Agreement bear interest at a rate per annum equal to the Adjusted LIBO Rate (as defined in the Credit Agreement) for the interest period in effect for such borrowing plus the Applicable Rate. The “Applicable Rate” means a percentage ranging from 0.50% to 1.00% per annum for ABR Loans and a percentage ranging from 1.50% to 2.00% per annum for Eurodollar Loans, depending upon our ratio of total debt to cash flow, as calculated in accordance with the Credit Agreement.
The Credit Agreement includes negative and financial covenants that limit certain activities of us and our subsidiaries, including (i) restrictions on our ability and the ability of our subsidiaries to incur additional indebtedness; and (ii) financial covenants that require (a) the ratio of total net debt to cash flow not to exceed a maximum; and (b) a minimum interest expense and principal payment coverage ratio. The Credit Agreement also contains customary representations and warranties that must be accurate in order for us to borrow under the 2016 Revolving Credit Facility. In addition, the Credit Agreement contains customary events of default. If an event of default occurs and is continuing, we may be required immediately to repay all amounts outstanding under the Credit Agreement. Lenders holding at least 50% of the loans and commitments under the Credit Agreement may elect to accelerate the maturity of the loans and/or terminate the commitments under the Credit Agreement upon the occurrence and during the continuation of an event of default.
69
As of December 31, 2017, we were in compliance with all covenants under both the 2025 Notes and the Credit Agreement. For additional information on our long-term debt, see Note 10 - Debt to the consolidated financial statements included in this 2017 Form 10-K.
Shelf Registration Statement
In November 2015, we filed a shelf registration statement on Form S-3 with the SEC that became automatically effective covering the registration, issuance and sale of an indeterminate amount of our securities, including common stock, preferred stock, senior or subordinated debt securities, depository shares, securities purchase contracts, units or warrants. We may publicly offer securities in the future at prices and terms to be determined at the time of the offering.
Initiatives to Increase Our Unregulated Cash
We may pursue alternatives to raise additional unregulated cash. Some of these initiatives may include, but are not limited to, obtaining dividends from certain of our regulated subsidiaries, provided sufficient capital in excess of regulatory requirements exists in these subsidiaries and/or accessing the debt and equity capital markets. However, we cannot provide any assurances that we will obtain applicable state regulatory approvals for additional dividends to our non-regulated subsidiaries by our regulated subsidiaries or be successful in accessing the capital markets if we determine to do so. We believe that we have sufficient capital, or sufficient access to capital, including through the Revolving Credit Facility, to meet our capital needs for at least the next twelve months.
Regulatory Capital and Dividend Restrictions
Each of our HMO and insurance subsidiaries must maintain a minimum amount of statutory capital determined by statute or regulation. The minimum statutory capital requirements differ by state and are generally based on a percentage of annualized premium revenue, a percentage of annualized health care costs, a percentage of certain liabilities, a statutory minimum, risk-based capital ("RBC") requirements or other financial ratios. The RBC requirements are based on guidelines established by the National Association of Insurance Commissioners ("NAIC") and have been adopted by most states. The statutory framework for our regulated subsidiaries' minimum capital requirements could change over time. For instance, RBC requirements may be adopted by more of the states in which we operate. In addition, regulators could require our subsidiaries to maintain minimum levels of statutory net worth in excess of the amount required under the applicable state laws if the regulators determine that maintaining such additional statutory net worth is in the best interest of our members and other constituencies. Failure to maintain these requirements would trigger regulatory action by the state. To the extent our HMO and insurance subsidiaries must comply with these regulations, they may not have the financial flexibility to transfer funds to us. Based upon current statutes and regulations, the minimum capital and surplus requirement, or net assets, for these subsidiaries that may not be transferable to us in the form of loans, advances, or cash dividends was approximately $1.2 billion at December 31, 2017, and $871.8 million at December 31, 2016. The combined statutory capital and surplus of our HMO and insurance subsidiaries was $2.0 billion and $1.7 billion at December 31, 2017 and 2016. These increases were primarily the result of the Universal American acquisition, as well as organic growth in all of our lines of business. Our HMO and insurance subsidiaries were in compliance with and in excess of the minimum capital requirements as of both December 31, 2017 and 2016.
Such statues, regulations and capital requirements also restrict the timing, payment, and amount of dividends and other distributions that may be paid to us as the sole stockholder. Dividend restrictions vary by state, but the maximum amount of dividends which can be paid without prior approval from the applicable state is subject to restrictions relating to statutory capital, surplus and net income for the previous year. Some states require prior approval of all dividends, regardless of amount. States may disapprove any dividend that, together with other dividends paid by a subsidiary in the prior 12 months, exceeds the regulatory maximum as computed for the subsidiary based on its statutory surplus and net income. We received $335.0 million, $241.0 million and $152.0 million in dividends from our regulated subsidiaries during the years ended December 31, 2017, 2016, and 2015, respectively. The 2017 amount included $150.0 million not requiring prior regulatory approval, and $185.0 million paid after obtaining prior regulatory approval. Under applicable regulatory requirements at December 31, 2017, the amount of dividends that may be paid through the end of 2018 by our HMO and insurance subsidiaries without prior approval by regulatory authorities is approximately $201.7 million in the aggregate. Actual dividends paid may vary due to consideration of excess statutory capital and surplus and expected future surplus requirements related to, for example, premium volume and product mix.
For additional information on regulatory requirements, see Note 17 – Regulatory Capital and Dividend Restrictions to the consolidated financial statements in this 2017 Form 10-K.
70
Commitments and Contingencies
The following table sets forth information regarding our contractual obligations as of December 31, 2017.
Payments due to period | |||||||||||||||||||
Total | Less Than 1 Year | 1 - 3 Years | 3 - 5 Years | More than 5 Years | |||||||||||||||
(In millions) | |||||||||||||||||||
Operating leases | $ | 170.5 | $ | 31.1 | $ | 50.3 | $ | 39.0 | $ | 50.1 | |||||||||
Purchase obligations (1) | 105.1 | 52.4 | 50.6 | 2.1 | — | ||||||||||||||
Long-term debt (2) | 1,200.0 | — | — | — | 1,200.0 | ||||||||||||||
Interest on debt (3) | 456.8 | 63.0 | 126.0 | 126.0 | 141.8 | ||||||||||||||
Total | $ | 1,932.4 | $ | 146.5 | $ | 226.9 | $ | 167.1 | $ | 1,391.9 | |||||||||
(1) | Our purchase obligations include commitments under contracts for equipment leases and software maintenance. |
(2) | Represents the principal amount of our outstanding 5.25% Senior Notes due 2025 as of December 31, 2017. This amount excludes $17.6 million of unamortized debt issuance costs, which is reflected as a reduction to our long-term debt in our consolidated balance sheet. |
(3) | Represents projected interest on the $1.2 billion principal amount of our 5.25% Senior Notes due 2025. There were no amounts outstanding under our Credit Facility as of December 31, 2017. |
We are not an obligor under or guarantor of any indebtedness of any other party; however, we may have to pay referral claims of health care providers under contract with us who are not able to pay costs of medical services provided by other providers.
OFF BALANCE SHEET ARRANGEMENTS
At December 31, 2017, we did not have any off-balance sheet financing arrangements except for operating leases as described in the table above.
CRITICAL ACCOUNTING ESTIMATES
In the ordinary course of business, we make a number of estimates and assumptions relating to the reporting of our results of operations and financial condition in conformity with GAAP. We base our estimates on historical experience and on various other assumptions that we believe to be reasonable under the circumstances. Actual results could differ significantly from those estimates under different assumptions and conditions. We believe that our accounting estimates relating to premium revenue recognition and premiums receivable, medical benefits expense and medical benefits payable, and goodwill and intangible assets, are those that are most important to the portrayal of our financial condition and results and require management's most difficult, subjective and complex judgments, often as a result of the need to make estimates about the effect of matters that are inherently uncertain.
Premium Revenue Recognition and Premiums Receivable
We earn premium revenue through our participation in Medicaid, Medicaid-related and Medicare programs. Our Medicaid contracts with state agencies generally are multi-year contracts subject to annual renewal provisions, while our Medicare contracts with CMS renew annually. Our Medicare and Medicaid contracts establish fixed, monthly premium rates per member ("PMPM"), which are generally determined at the beginning of each new contract renewal period; however, premiums may be adjusted by CMS and state agencies throughout the terms of the contracts in certain cases. Premium rate changes are recognized in the period the change becomes effective, when the effect of the change in the rate is reasonably estimable and collection is assured. Our contracts also have additional provisions as described in the sections below.
71
We recognize premium revenue in the period in which we are obligated to provide services to our members. We are generally paid by CMS and state agencies in the month in which we provide services. On a monthly basis, we bill members for any premiums for which they are responsible according to their respective plan. We record premiums earned but not received as premiums receivable and record premiums received in advance of the period of service as unearned premiums in the consolidated balance sheets. Unearned premiums are recognized as revenue when we provide the related services. Member premiums are recognized as revenue in the period of service. We estimate, on an on-going basis, the amount of members' billings that may not be collectible, based on our evaluation of historical trends. An allowance is established for the estimated amount that may not be collectible. In addition, we routinely monitor the collectability of specific premiums receivable from CMS and state agencies, including Medicaid receivables for obstetric deliveries and newborns and net receivables for member retroactivity and reduce revenue and premiums receivable by the amount we estimate may not be collectible.
Premium payments are based upon eligibility lists produced by CMS and state agencies. We verify these lists to determine whether we have been paid for the correct premium category and program. From time to time, CMS and state agencies require us to reimburse them for premiums that we received for individuals who were subsequently determined to be ineligible for any government-sponsored program or to belong to a plan other than ours. Additionally, the verification of membership may result in additional premiums due to us from CMS and state agencies for individuals who were subsequently determined to belong to our plan for periods in which we received no premium for those members. We estimate the amount of outstanding retroactivity adjustments and adjust premium revenue based on historical trends, premiums billed, the volume of member and contract renewal activity and other information. We record amounts receivable in premiums receivable, net and amounts payable in other accrued expenses and liabilities in the consolidated balance sheets.
Supplemental Medicaid Premiums
We earn supplemental premium payments for eligible obstetric deliveries and newborns for our Medicaid members in Arizona, Florida, Georgia, Illinois (through December 31, 2017), Missouri, Nebraska, New Jersey, New York and South Carolina. Each state Medicaid contract specifies how and when these supplemental payments are earned and paid. We also earn supplemental Medicaid premium payments in some states for high cost drugs and other eligible services. We recognize supplemental premium revenue in the period we provide related services to our members.
Medicaid ACA Industry Fee Reimbursement
The ACA industry fee began in 2014. For 2015 and 2016, we received amendments, written agreements or other documentation from all of our state Medicaid customers that commit them to reimburse us for the portion of the ACA industry fee attributable to our Medicaid plans, including its non-deductibility for income tax purposes. Effective January 1, 2017, the Consolidated Appropriations Act, 2016 provided for a one-year moratorium on the ACA industry fee, and, as a result, eliminated the associated Medicaid ACA industry fee reimbursements from our state government partners for 2017. Accordingly, we did not recognize any Medicaid ACA industry fee reimbursement revenue for the year ended December 31, 2017. We recognized $244.9 million and $219.2 million of reimbursement for the ACA industry fee as premium revenue for the years ended December 31, 2016 and 2015, respectively.
Medicaid Risk-Adjusted Premiums and Retroactive Rate Changes
As previously discussed, Medicaid premium rate changes are recognized in the period the change becomes effective, when the effect of the change in the rate is reasonably estimable and collection is assured. In some instances, our Medicaid premiums are subject to risk score adjustments based on the health profile of our membership. Generally, the risk score is determined by the state agency's analysis of encounter submissions of processed claims data to determine the acuity of our membership relative to the entire state's Medicaid membership. The frequency of when states adjust premiums varies, but is usually done quarterly or semi-annually on a retrospective basis. We recognize periodic changes to risk-adjusted premiums as revenue when the amounts are determinable and collection is reasonably assured. Historically, we have not experienced significant differences between our estimates and amounts ultimately paid or received.
72
Medicare Risk-Adjusted Premiums
CMS provides risk-adjusted payments for MA Plans and PDPs based on the demographics and health severity of enrollees. The risk-adjusted premiums we receive are based on claims and encounter data that we submit to CMS within prescribed deadlines. We develop our estimates for risk-adjusted premiums utilizing historical experience, or other data, and predictive models as sufficient member risk score data becomes available over the course of each CMS plan year. We recognize periodic changes to risk-adjusted premiums as revenue when the amounts are determinable and collection is reasonably assured, which is possible as additional diagnosis code information is reported to CMS, when the ultimate adjustment settlements are received from CMS or we receive notification of such settlement amounts. CMS adjusts premiums on two separate occasions on a retrospective basis. The first retrospective adjustment for a given plan year generally occurs during the third quarter of that year. This initial settlement represents the update of risk scores for the current plan year based on the severity of claims incurred in the prior plan year. CMS then issues a final retrospective risk adjusted premium settlement for that plan year in the following year. We develop our estimates for risk-adjusted premiums utilizing historical experience and predictive models as sufficient member risk score data becomes available over the course of each CMS plan year. We populate our models with available risk score data on our members and base risk-adjusted premiums on risk score data from the previous year. We are not privy to risk score data for members new to our plans in the current plan year; therefore, we include assumptions regarding these members' risk scores. We periodically revise our estimates of risk-adjusted premiums as additional diagnosis code information is reported to CMS and adjust our estimates to actual amounts when the ultimate adjustment settlements are either received from CMS or we receive notification from CMS of such settlement amounts. As a result of the variability of factors that determine our estimates for risk-adjusted premiums, the actual amount of the CMS retroactive payment could be materially more or less than our estimates and could have a material effect on our results of operations, financial position and cash flows. We record any changes in estimates in current operations as adjustments to premium revenue. Historically, we have not experienced significant differences between our estimates and amounts ultimately received. The data provided to CMS to determine members' risk scores is subject to audit by CMS even after the annual settlements occur. An audit may result in the refund of premiums to CMS. While our experience to date has not resulted in a material refund, future refunds could materially reduce premium revenue in the year in which CMS determines a refund is required and could be material to our results of operations, financial position and cash flows.
Minimum Medical Expense and Risk Corridor Provisions
We may be required to refund certain premium revenue to state agencies and CMS under various contractual and plan arrangements. We estimate the effect of the following arrangements on a monthly basis and reflect any adjustments to premium revenues in current operations. We report the estimated net amounts due to state agencies and CMS in other payables to government partners in the consolidated balance sheets.
Certain of our Medicaid contracts require us to expend a minimum percentage of premiums on eligible medical benefits expense. To the extent that we expend less than the minimum percentage of the premiums on eligible medical benefits, we are required to refund to the state all or some portion of the difference between the minimum and our actual allowable medical benefits expense. Additionally, certain of our Medicaid contracts include other types of risk sharing arrangements (e.g., profit sharing arrangements) that require return of revenue to the state or receipt of revenue from the state, based on certain pre-tax earnings, net earnings or other results of operations-based calculations. In all arrangements, we estimate the amounts due from or to the state agencies based on the terms of our contracts with the applicable state agency and record the amounts as a change in premium. Historically, we have not experienced material differences between our recorded estimates and the subsequent state agencies settlement amounts.
Our MA and PDP premiums are subject to risk sharing through the CMS Medicare Part D risk corridor provisions. The risk corridor calculation compares our actual experience to the target amount of prescription drug costs, limited to costs under the standard coverage as defined by CMS, less rebates included in our submitted plan year bid. We receive additional premium from CMS if our actual experience is more than 5% above the target amount. We refund premiums to CMS if our actual experience is more than 5% below the target amount. Based on the risk corridor provision and PDP activity-to-date, an estimated risk-sharing receivable or payable is recorded as an adjustment to premium revenue. After the close of the annual plan year, CMS performs the risk corridor calculation and any differences are settled between CMS and our plans. Historically, we have not experienced material differences between the subsequent CMS settlement amount and our recorded estimates.
Beginning in 2014, the ACA required the establishment of a minimum medical loss ratio (“MLR”) for MA plans and Part D plans, requiring them to spend not less than 85% of premiums on medical benefits. The rules implementing the minimum MLR impose financial and other penalties for failing to achieve the minimum MLR, including requirements to refund to CMS shortfalls in amounts spent on medical benefits and termination of a plan’s MA contract for prolonged failure to achieve the minimum MLR. MLR is determined by adding a plan’s spending for clinical services, prescription drugs and other direct
73
patient benefits, plus its total spending on quality improvement activities and dividing the total by earned premiums (after subtracting specific identified taxes and other fees). These provisions did not have a material effect on our results of operations in 2017, 2016 or 2015.
A summary of other net payables to government partners is as follows (in millions):
As of December 31, | |||||||
2017 | 2016 | ||||||
Liability to states under Medicaid risk sharing provisions | $ | (142.5 | ) | $ | (105.9 | ) | |
Liability to CMS under risk corridor provision | (179.1 | ) | (190.5 | ) | |||
Liability to CMS under MA/PDP minimum MLR provisions of the ACA | (1.2 | ) | (0.3 | ) | |||
Net payables to government partners(1) | $ | (322.8 | ) | $ | (296.7 | ) | |
(1) The components of net payables to government partners are classified in the consolidated balance sheets as $44.2 million and $367.0 million in current assets and current liabilities, respectively, as of December 31, 2017, and $6.5 million and $303.2 million in current assets and current liabilities, respectively, as of December 31, 2016.
Medicare Part D Subsidies
For qualifying low income PDP members, CMS pays for some, or all, of the member's monthly premium. We receive certain Part D prospective subsidy payments from CMS for our MA and PDP members as a fixed monthly per member amount, based on the estimated costs of providing prescription drug benefits over the plan year, as reflected in our bids. Approximately nine to ten months subsequent to the end of the plan year, or later in the case of the coverage gap discount subsidy, a settlement payment is made between CMS and our plans based on the difference between the prospective payments and actual claims experience. The subsidy components under Part D are described below.
Low-Income Cost Sharing Subsidy ("LICS")- For qualifying low income members, CMS reimburses us for all or a portion of the low income member's deductible, coinsurance and co-payment amounts above the out-of-pocket threshold.
Catastrophic Reinsurance Subsidy- CMS reimburses plans for 80% of the drug costs after a member reaches his or her out-of-pocket catastrophic threshold through a catastrophic reinsurance subsidy.
Coverage Gap Discount Subsidy ("CGDS")- CMS provides monthly prospective payments for pharmaceutical manufacturer discounts made available to members.
Catastrophic reinsurance subsidies and the LICS represent cost reimbursements under the Medicare Part D program. We are fully reimbursed by CMS for costs incurred for these contract elements and, accordingly, there is no insurance risk to us. Therefore, amounts received for these subsidies are not considered premium revenue, and are reported, net of the subsidy benefits paid, as Funds receivable/held for the benefit of members in the consolidated balance sheets. The receipts and payments between us and CMS are presented on a net basis as financing activity in our consolidated statements of cash flows because we are essentially administering and paying the benefit subsidies on behalf of CMS. Historically, the settlement payments between us and CMS have not been materially different from our estimates.
CGDS advance payments are recorded within Funds receivable/held for the benefit of members in the consolidated balance sheets. Receivables are set up for manufacturer-invoiced amounts. Manufacturer payments reduce the receivable as payments are received. After the end of the contract year, during the Medicare Part D Payment reconciliation process for the CGD, CMS will perform a cost-based reconciliation to ensure the Medicare Part D sponsor is paid for gap discounts advanced at the point of sale, based on accepted prescription drug event data.
74
Funds payable for the benefit of members, net consisted of the following (in millions):
As of December 31, | |||||||
2017 | 2016 | ||||||
Low-income cost sharing subsidy | $ | (47.7 | ) | $ | 47.8 | ||
Catastrophic reinsurance subsidy | (987.1 | ) | (418.1 | ) | |||
Coverage gap discount subsidy | (13.6 | ) | 12.6 | ||||
Funds payable for the benefit of members, net(1) | $ | (1,048.4 | ) | $ | (357.7 | ) | |
(1) The components of net funds payable for the benefit of members, net are classified in the consolidated balance sheets as $27.5 million and $1,075.9 million in current assets and current liabilities, respectively, as of December 31, 2017, and as $32.6 million and $390.3 million in current assets and current liabilities, respectively, as of December 31, 2016.
Estimating Medical Benefits Expense and Medical Benefits Payable
We recognize the cost of medical benefits in the period in which services are provided, including an estimate of the cost of medical benefits incurred but not reported ("IBNR"). Medical benefits expense includes direct medical expenses and certain medically-related administrative costs. Direct medical expenses include amounts paid or payable to hospitals, physicians, pharmacy benefit managers and providers of ancillary services. Recorded direct medical expenses are reduced by the amount of pharmacy rebates earned, which are estimated based on historical utilization of specific pharmaceuticals, current utilization and contract terms. Pharmacy rebates earned but not yet received from pharmaceutical manufacturers are included in pharmacy rebates receivable in the accompanying consolidated balance sheets. Direct medical expenses may also include reserves for estimated referral claims related to health care providers under contract with us who are financially troubled or insolvent and who may not be able to honor their obligations for the costs of medical services provided by other providers. In these instances, we may be required to honor these obligations for legal or business reasons. Based on our current assessment of providers under contract with us, such losses have not been and are not expected to be significant. Also included in direct medical expense are our estimates for provider settlements due to clarification of contract terms, out-of-network reimbursement, claims payment differences and amounts due to contracted providers under risk-sharing and/or value-based arrangements.
Consistent with the criteria specified and defined in guidance issued by the Department of Health and Human Services ("HHS") for costs that qualify to be reported as medical benefits under the minimum MLR provision of the ACA, we record certain medically-related administrative costs such as preventive health and wellness, care management, and other quality improvement costs, as medical benefits expense. All other medically-related administrative costs, such as utilization review services, network and provider credentialing and claims handling costs, are recorded in selling, general, and administrative expense.
Medical benefits payable represents amounts for claims fully adjudicated but not yet paid and estimates for IBNR. Our estimate of IBNR is the most significant estimate included in our consolidated financial statements. We determine our best estimate of the base liability for IBNR utilizing consistent standard actuarial methodologies based upon key assumptions, which vary by business segment. Our assumptions include current payment experience, trend factors and completion factors. Trend factors in our standard actuarial methodologies include contractual requirements, historic utilization trends, the interval between the date services are rendered and the date claims are paid, denied claims activity, disputed claims activity, benefit changes, expected health care cost inflation, seasonality patterns, maturity of lines of business, changes in membership and other factors.
The following table provides a detail of the components of medical benefits payable:
December 31, 2017 | % of Total | December 31, 2016 | % of Total | ||||||||
(In millions) | |||||||||||
IBNR | $ | 1,412.3 | 66% | $ | 1,141.9 | 68% | |||||
Other medical benefits payable | 734.0 | 34% | 548.6 | 32% | |||||||
Total medical benefits payable | $ | 2,146.3 | 100% | $ | 1,690.5 | 100% | |||||
75
The factors and assumptions that are used to develop our estimate of medical benefits expense and medical benefits payable inherently are subject to greater variability when there is more limited experience or information available to us. The ultimate claims payment amounts, patterns and trends for new products and geographic areas cannot be precisely predicted at their onset since we, the providers and the members do not have experience in these products or geographic areas. Standard accepted actuarial methodologies, discussed above, would allow for this inherent variability. This can result in larger differences between the originally estimated medical benefits payable and the actual claims amounts paid. Conversely, during periods where our products and geographies are more stable and mature, we have more reliable claims payment patterns and trend experience. With more reliable data, we should be able to more closely estimate the ultimate claims payment amounts; therefore, we may experience smaller differences between our original estimate of medical benefits payable and the actual claim amounts paid.
In developing our estimates, we apply different estimation methods depending on the month for which incurred claims are being estimated. For the more recent months, which constitute the majority of the amount of the medical benefits payable, we estimate claims incurred by applying observed trend factors to the fixed fee PMPM costs for prior months, which costs have been estimated using completion factors in order to estimate the PMPM costs for the most recent months. We validate our estimates of the most recent PMPM costs by comparing the most recent months' utilization levels to the utilization levels in prior months and actuarial techniques that incorporate a historical analysis of claim payments, including trends in cost of care provided and timeliness of submission and processing of claims.
Many aspects of the managed care business are not predictable. Medical cost trends potentially are more volatile than other segments of the economy. Therefore, we must continually monitor our historical experience in determining our trend assumptions to reflect the ever-changing mix, needs and size of our membership. External factors such as government-mandated benefits or other regulatory changes, catastrophes and epidemics may affect medical cost trends. Other internal factors such as system conversions and claims processing changes may affect our ability to accurately predict estimates of historical completion factors or medical cost trends. We believe that the amount of medical benefits payable as of December 31, 2017 is adequate to cover our ultimate liability for unpaid claims as of that date; however, actual payments may differ from established estimates. If the completion factors we used in estimating our IBNR for the year ended December 31, 2017 were decreased by 1%, our medical benefits expense would increase by approximately $192.5 million. If the completion factors were increased by 1%, our medical benefits expense would decrease by approximately $188.1 million.
After determining an estimate of the base liability for IBNR, we make an additional estimate, also using standard actuarial techniques, to account for adverse conditions that may cause actual claims to be higher than the estimated base reserve. We refer to this additional liability as the provision for moderately adverse conditions. Our estimate of the provision for moderately adverse conditions captures the potential adverse development from factors such as:
•our entry into new geographical markets;
•our provision of services to new populations such as the aged, blind and disabled;
•variations in utilization of benefits and increasing medical costs, including higher drug costs;
•changes in provider reimbursement arrangements;
•variations in claims processing speed and patterns, claims payment and the severity of claims; and
•health epidemics or outbreaks of disease such as the flu or enterovirus.
We evaluate our estimates of medical benefits payable as we obtain more complete claims information and medical expense trend data over time. We record differences between actual experience and estimates used to establish the liability, which we refer to as favorable and unfavorable prior year reserve developments, as increases or decreases to medical benefits expense in the period we identify the differences.
76
The following table provides a reconciliation of the beginning and ending balance of our consolidated medical benefits payable:
Years Ended December 31, | |||||||||||
2017 | 2016 | 2015 | |||||||||
(In millions) | |||||||||||
Balances as of beginning of period | $ | 1,690.5 | $ | 1,536.0 | $ | 1,483.8 | |||||
Acquisitions (divestitures) | 128.1 | 37.3 | (9.5 | ) | |||||||
Medical benefits incurred related to: | |||||||||||
Current year (1) | 15,112.4 | 12,374.1 | 12,189.5 | ||||||||
Prior year | (367.6 | ) | (284.7 | ) | (211.0 | ) | |||||
Total | 14,744.8 | 12,089.4 | 11,978.5 | ||||||||
Medical benefits paid related to: | |||||||||||
Current year | (13,355.9 | ) | (10,925.0 | ) | (10,763.0 | ) | |||||
Prior year | (1,061.2 | ) | (1,047.2 | ) | (1,153.8 | ) | |||||
Total | (14,417.1 | ) | (11,972.2 | ) | (11,916.8 | ) | |||||
Balances as of end of year | $ | 2,146.3 | $ | 1,690.5 | $ | 1,536.0 | |||||
(1)-Incurred amounts for 2017 include the $45.6 million Illinois PDR discussed further in Note 2 - Summary of Significant Accounting Policies to the consolidated financial statements included in this 2017 Form 10-K.
Medical benefits payable recorded developed favorably by approximately $367.6 million, $284.7 million and $211.0 million in 2017, 2016 and 2015, respectively. The release of the provision for moderately adverse conditions included in our prior year estimates was substantially offset by the provision for moderately adverse conditions established for claims incurred in the current year. Accordingly, the favorable development in our estimate of medical benefits payable related to claims incurred in prior years does not directly correspond to a decrease in medical benefits expense recognized during the period in which the favorable development is recognized.
Excluding the prior year development related to the release of the provision for moderately adverse conditions, our estimates of consolidated medical benefits expense recorded developed favorably by approximately $224.6 million, $154.3 million, and $78.1 million in 2017, 2016, and 2015, respectively. Such amounts are net of the development relating to refunds due to government customers in connection with minimum loss ratio provisions. The net favorable development recognized in both 2017 and 2016 was primarily in our Medicaid Health Plans segment and, to a lesser extent, in our Medicare Health Plans segment. The net favorable development resulted primarily from a number of operational and clinical initiatives planned and executed, throughout both 2015 and 2016, that contributed to lower than expected pharmacy and medical trends, and actual claim submission time being faster than we originally assumed (i.e. our completion factors were higher than we originally assumed) in establishing our medical benefits payable in the prior years. This development does not directly correspond to an increase in our current year operating results as these reductions were offset by estimated current period medical benefits expense when we established our estimate of the current year medical benefits payable. Both completion factor and medical trend assumptions are influenced by utilization levels, unit costs, mix of business, provider reimbursement levels, processing system conversions and changes, claim inventory levels, claim processing patterns, our ability and practices to manage medical and pharmaceutical costs, claim submission patterns and operational changes resulting from business combinations, among others. Our actual costs were ultimately less than expected. The favorable development recognized in 2015 was primarily due to lower than expected utilization in our Medicaid Health Plans segment.
Premium Deficiency Reserves
We evaluate our contracts to determine if it is probable that a loss will be incurred. We establish a premium deficiency reserve ("PDR") when it is probable that expected future medical benefits and administrative expenses will exceed future premiums and reinsurance recoveries for the remainder of a contract period. For purposes of determining a PDR, we do not consider investment income and contracts are grouped in a manner consistent with our method of acquiring, servicing and measuring the profitability of such contracts. A PDR is recorded as medical benefits expense and in medical benefits payable. Once established, a PDR is reduced over the contract period as an offset to actual losses. We re-evaluate our PDR estimates each reporting period and, if estimated future losses differ from those in the current PDR estimate, we adjust the liability through medical benefits expense, as necessary.
77
During the fourth quarter of 2017, we recorded a $45.6 million PDR in connection with our new Illinois Medicaid managed care contract that was effective on January 1, 2018 (the "Illinois PDR"). In December 2017, we received our initial rate structure and membership roster from the State of Illinois, which were used as the basis for our initial assessment of the contract. The Illinois PDR reflects the initial premium rate structure, estimated medical benefits and other costs expected to be incurred during the initial four-year contractual term of the contract. We had no PDR liabilities recorded in our consolidated balance sheets as of December 31, 2016.
Goodwill and Other Intangible Assets
Our acquisitions typically result in goodwill, which represents the excess of the acquisition cost over the fair value of net assets acquired. Goodwill is assigned to reporting units, which we determined to be the same as our operating segments. Goodwill recorded at December 31, 2017 was $660.7 million compared with $392.5 million at December 31, 2016. Goodwill attributable to our Medicaid reporting unit was $274.7 million and $282.1 million at December 31, 2017 and 2016, respectively. Goodwill attributable to our MA reporting unit was $386.0 million and $110.4 million at December 31, 2017 and 2016, respectively. The increase in goodwill for the MA reporting unit from December 31, 2016 resulted from our acquisition Universal American during 2017. Refer to Note 3 - Acquisitions, included in the consolidated financial statements in this 2017 Form 10-K for additional discussion.
We test goodwill for impairment at the reporting unit level at least annually, or more frequently if events or circumstances indicate that it would be more likely than not that the fair value of a reporting unit is below its carrying value. Such events or circumstances could include a significant adverse change in business climate, an adverse action or assessment by a regulator, unanticipated competition and the testing for recoverability of a significant asset group within a reporting unit, among others. To determine whether goodwill is impaired, we compare an estimate of the fair value of the applicable reporting unit to its carrying value, including goodwill. If the carrying value exceeds the estimated fair value, we compare the implied fair value of the applicable goodwill to its carrying value to measure the amount of goodwill impairment, if any. We perform our annual goodwill impairment test based on our financial position and results of operations as of June 30 of each year, which generally coincides with the finalization of federal and state contract negotiations and our initial budgeting and planning process. The annual impairment tests are based on an evaluation of estimated future discounted cash flows. The estimated discounted cash flows are based on the best information available to us at the time, including supportable assumptions and projections we believe are reasonable. Our discounted cash flow estimates use discount rates that correspond to a weighted-average cost of capital consistent with a market-participant view. The discount rates are consistent with those used for investment decisions and take into account the operating plans and strategies of our operating segments. Certain other key assumptions utilized, including changes in membership, premium, health care costs, operating expenses, fees, assessments and taxes and effective tax rates, are based on estimates consistent with those utilized in our annual budgeting and planning process that we believe are reasonable. However, if we do not achieve the results reflected in the assumptions and estimates, our goodwill impairment evaluations could be adversely affected, and we may impair a portion of our goodwill, which would adversely affect our operating results in the period of impairment. Impairments, if any, would be classified as an operating expense. Based on the results of our annual impairment testing in 2017, we determined that the fair value of each reporting unit substantially exceeded its carrying value and no further goodwill impairment assessment was necessary.
Other intangible assets resulting from our acquisitions include provider networks, broker networks, trademarks, state contracts, non-compete agreements, licenses and permits. We amortize other intangible assets over their estimated useful lives ranging from approximately one to 15 years. These assets are allocated to reporting units for impairment testing purposes. We review our other intangible assets for impairment when events or changes in circumstances occur, which may potentially affect the estimated useful life or recoverability of the remaining balances of our intangible assets. Such events and changes in circumstances would include significant changes in membership, state funding, federal and state government contracts and provider networks. Upon such an occurrence, recoverability of assets to be held and used is measured by comparing the carrying amount of an asset to current forecasts of undiscounted future net cash flows expected to be generated by the assets. Identifiable cash flows are measured at the lowest level for which they are largely independent of the cash flows of other groups of assets and liabilities. If these assets are determined to be impaired, the amount of impairment recognized is measured by the amount by which the carrying amount of the assets exceeds their fair value. During 2017, 2016 and 2015, no events or circumstances have occurred, which may potentially affect the estimated useful life or recoverability of the remaining balances of our other intangible assets. Accordingly, there were no impairment losses recognized during these periods.
78
RECENTLY ADOPTED ACCOUNTING STANDARDS
Refer to Note 2 – Summary of Significant Accounting Policies, included in the consolidated financial statements for information and disclosures related to new accounting standards which are incorporated herein by reference.
Item 7A. Qualitative and Quantitative Disclosures about Market Risk.
Investment Return Market Risk
As of December 31, 2017, we had cash and cash equivalents of $4.2 billion, investments classified as current assets of $469.5 million, long-term investments of $766.2 million and restricted investments on deposit for licensure of $211.0 million. The short-term investments classified as current assets consist of highly liquid securities with maturities between three and twelve months that are considered available for sale. Restricted assets consist of cash and cash equivalents and U.S. Treasury instruments deposited or pledged to state agencies in accordance with state rules and regulations. These restricted assets are classified as long-term regardless of the contractual maturity date due to the nature of the states' requirements. The investments classified as long term are subject to interest rate risk and will decrease in value if market rates increase. Because of their contractual maturity dates, however, we would not expect the value of these investments to decline significantly as a result of a sudden change in market interest rates. Assuming a hypothetical and immediate 1% increase in market interest rates at December 31, 2017, the fair value of our fixed income investments would decrease by approximately $28.6 million. Similarly, a 1% decrease in market interest rates at December 31, 2017 would increase the fair value of our investments by approximately $28.6 million.
Item 8. Financial Statements and Supplementary Data.
Our consolidated financial statements and related notes required by this item are set forth in the WellCare Health Plans, Inc. financial statements included in Part IV, Item 15 of this filing.
Item 9. Changes In and Disagreements with Accountants on Accounting and Financial Disclosure.
None.
Item 9A. Controls and Procedures.
(a) | Evaluation of Disclosure Controls and Procedures |
Management, under the leadership of our Chief Executive Officer ("CEO") and our Chief Financial Officer ("CFO"), is responsible for maintaining disclosure controls and procedures (as defined in Rules 13a-15(e) and 15d-15(e) under the Exchange Act) that are designed to ensure that information required to be disclosed in reports filed or submitted under the Exchange Act is recorded, processed, summarized and reported within the time periods specified in the SEC rules and forms and that such information is accumulated and communicated to management, including our CEO and CFO, to allow timely decisions regarding required disclosures.
In connection with the preparation of this 2017 Form 10-K, our management, under the leadership of our CEO and CFO, evaluated the effectiveness of our disclosure controls and procedures ("Disclosure Controls"). Based on that evaluation, our CEO and CFO concluded that, as of December 31, 2017, our Disclosure Controls were effective in timely alerting them to material information required to be included in our reports filed with the SEC.
(b) | Management's Report on Internal Control Over Financing Reporting |
Our management is responsible for establishing and maintaining adequate internal control over financial reporting (as such term is defined in Rule 13a-15(f) under the Exchange Act). An evaluation was performed under the supervision and with the participation of our management, including our CEO and CFO, of the effectiveness of our internal control over financial reporting based on the framework Internal Control — Integrated Framework issued by the Committee of Sponsoring Organizations of the Treadway Commission and updated in 2013 (the "COSO Framework"). Based on our evaluation under the COSO Framework, our management concluded that our internal control over financial reporting was effective as of December 31, 2017. Our independent registered public accounting firm, Deloitte & Touche, LLP, has issued an attestation report on the effectiveness of our internal control over financial reporting as of December 31, 2017, that is included herein.
79
(c) | Changes in Internal Controls |
There has not been any change in our internal control over financial reporting (as defined in Rule 13a-15(f) of the Exchange Act) identified in connection with the evaluation required by Rule 13a-15(d) under the Exchange Act during the quarter ended December 31, 2017, that has materially affected, or is reasonably likely to materially affect, those controls.
80
REPORT OF INDEPENDENT REGISTERED PUBLIC ACCOUNTING FIRM
To the Board of Directors and Stockholders of
WellCare Health Plans, Inc. and subsidiaries
Tampa, Florida
Opinion on Internal Control over Financial Reporting
We have audited the internal control over financial reporting of WellCare Health Plans, Inc. and subsidiaries (the "Company") as of December 31, 2017, based on criteria established in Internal Control — Integrated Framework (2013) issued by the Committee of Sponsoring Organizations of the Treadway Commission (COSO). In our opinion, the Company maintained, in all material respects, effective internal control over financial reporting as of December 31, 2017, based on criteria established in Internal Control - Integrated Framework (2013) issued by COSO.
We have also audited, in accordance with the standards of the Public Company Accounting Oversight Board (United States) (PCAOB), consolidated balance sheets as of December 31, 2017 and 2016, and the related consolidated statements of comprehensive income, changes in stockholders' equity, and cash flows for each of the three years in the period ended December 31, 2017, of the Company and our report dated February 16, 2018, expressed an unqualified opinion on those financial statements.
Basis for Opinion
The Company's management is responsible for maintaining effective internal control over financial reporting and for its assessment of the effectiveness of internal control over financial reporting, included in the accompanying Management's Report on Internal Control over Financial Reporting. Our responsibility is to express an opinion on the Company's internal control over financial reporting based on our audit. We are a public accounting firm registered with the PCAOB and are required to be independent with respect to the Company in accordance with the U.S. federal securities laws and the applicable rules and regulations of the Securities and Exchange Commission and the PCAOB.
We conducted our audit in accordance with the standards of the PCAOB. Those standards require that we plan and perform the audit to obtain reasonable assurance about whether effective internal control over financial reporting was maintained in all material respects. Our audit included obtaining an understanding of internal control over financial reporting, assessing the risk that a material weakness exists, testing and evaluating the design and operating effectiveness of internal control based on the assessed risk, and performing such other procedures as we considered necessary in the circumstances. We believe that our audit provides a reasonable basis for our opinion.
Definition and Limitations of Internal Control over Financial Reporting
A company's internal control over financial reporting is a process designed to provide reasonable assurance regarding the reliability of financial reporting and the preparation of financial statements for external purposes in accordance with generally accepted accounting principles. A company's internal control over financial reporting includes those policies and procedures that (1) pertain to the maintenance of records that, in reasonable detail, accurately and fairly reflect the transactions and dispositions of the assets of the company; (2) provide reasonable assurance that transactions are recorded as necessary to permit preparation of financial statements in accordance with generally accepted accounting principles, and that receipts and expenditures of the company are being made only in accordance with authorizations of management and directors of the company; and (3) provide reasonable assurance regarding prevention or timely detection of unauthorized acquisition, use, or disposition of the company's assets that could have a material effect on the financial statements.
Because of its inherent limitations, internal control over financial reporting, may not prevent or detect misstatements. Also, projections of any evaluation of effectiveness to future periods are subject to the risk that controls may become inadequate because of changes in conditions, or that the degree of compliance with the policies or procedures may deteriorate.
/s/ Deloitte & Touche LLP
Certified Public Accountants
Tampa, Florida
February 16, 2018
81
Item 9B. Other Information.
None
PART III
Items 10, 11, 12, 13 and 14.
The information required by Items 10, 11, 12, 13 and 14 is omitted because, no later than 120 days after December 31, 2017, we will file and distribute our definitive proxy statement for our annual meeting of stockholders containing the information required by such Items. Such omitted information is incorporated herein by reference.
PART IV
Item 15. Exhibits, Financial Statement Schedules.
(a) Financial Statements and Financial Statement Schedules
(1) | Financial Statements are listed in the Index to Consolidated Financial Statements on page F-1 of this report. |
(2) | Financial Statement Schedules are listed in the Index to Consolidated Financial Statements on Page F-1 of this report. |
(b) Exhibits
For a list of exhibits to this 2017 Form 10-K, see the Exhibit Index which is incorporated herein by reference.
(c) Financial Statements
We file as part of this report the financial schedules listed on the index immediately preceding the financial statements at the end of this report.
82
Index to Consolidated Financial Statements and Schedules
WellCare Health Plans, Inc.
Page | |
Report of Independent Registered Public Accounting Firm | |
Consolidated Statements of Comprehensive Income for the years ended December 31, 2017, 2016 and 2015 | |
Consolidated Balance Sheets as of December 31, 2017 and 2016 | |
Consolidated Statements of Changes in Stockholders' Equity for the years ended December 31, 2017, 2016 and 2015 | |
Consolidated Statements of Cash Flows for the years ended December 31, 2017, 2016 and 2015 | |
Notes to Consolidated Financial Statements | |
Financial Statement Schedules
F-1
REPORT OF INDEPENDENT REGISTERED PUBLIC ACCOUNTING FIRM
To the Board of Directors and Stockholders of
WellCare Health Plans, Inc. and subsidiaries
Tampa, Florida
Opinion on the Financial Statements
We have audited the accompanying consolidated balance sheets of WellCare Health Plans, Inc. and subsidiaries (the "Company") as of December 31, 2017 and 2016, and the related consolidated statements of comprehensive income, changes in stockholders' equity, and cash flows for each of the three years in the period ended December 31, 2017, and the related notes and the schedules listed in the Index at Item 15 (collectively referred to as the “financial statements”). In our opinion, the financial statements present fairly, in all material respects, the financial position of the Company as of December 31, 2017 and 2016, and the results of its operations and its cash flows for each of the three years in the period ended December 31, 2017, in conformity with accounting principles generally accepted in the United States of America.
We have also audited, in accordance with the standards of the Public Company Accounting Oversight Board (United States) (PCAOB), the Company's internal control over financial reporting as of December 31, 2017, based on criteria established in Internal Control - Integrated Framework (2013) issued by the Committee of Sponsoring Organizations of the Treadway Commission and our report dated February 16, 2018, expressed an unqualified opinion on the Company's internal control over financial reporting.
Basis for Opinion
These financial statements are the responsibility of the Company’s management. Our responsibility is to express an opinion on the Company’s financial statements based on our audits. We are a public accounting firm registered with the PCAOB and are required to be independent with respect to the Company in accordance with the U.S. federal securities laws and the applicable rules and regulations of the Securities and Exchange Commission and the PCAOB.
We conducted our audits in accordance with the standards of the PCAOB. Those standards require that we plan and perform the audit to obtain reasonable assurance about whether the financial statements are free of material misstatement, whether due to error or fraud. Our audits included performing procedures to assess the risks of material misstatement of the financial statements, whether due to error or fraud, and performing procedures that respond to those risks. Such procedures included examining, on a test basis, evidence regarding the amounts and disclosures in the financial statements. Our audits also included evaluating the accounting principles used and significant estimates made by management, as well as evaluating the overall presentation of the financial statements. We believe that our audits provide a reasonable basis for our opinion.
/s/ Deloitte & Touche LLP
Certified Public Accountants
Tampa, Florida
February 16, 2018
We have served as the Company’s auditor since 2003.
F-2
WELLCARE HEALTH PLANS, INC.
CONSOLIDATED STATEMENTS OF COMPREHENSIVE INCOME
(In millions, except per share and share data)
For the Years Ended December 31, | |||||||||||
2017 | 2016 | 2015 | |||||||||
Revenues: | |||||||||||
Premium | $ | 16,960.3 | $ | 14,220.9 | $ | 13,874.8 | |||||
Investment and other income | 46.9 | 16.2 | 15.4 | ||||||||
Total revenues | 17,007.2 | 14,237.1 | 13,890.2 | ||||||||
Expenses and other: | |||||||||||
Medical benefits | 14,744.8 | 12,089.4 | 11,978.5 | ||||||||
Selling, general and administrative | 1,484.7 | 1,133.1 | 1,132.9 | ||||||||
ACA industry fee | — | 228.4 | 227.3 | ||||||||
Medicaid premium taxes | 119.8 | 110.0 | 94.7 | ||||||||
Depreciation and amortization | 120.4 | 87.6 | 72.6 | ||||||||
Interest | 68.5 | 59.1 | 54.2 | ||||||||
Gain on divestiture of business | — | — | (6.1 | ) | |||||||
Total expenses, net | 16,538.2 | 13,707.6 | 13,554.1 | ||||||||
Income from operations | 469.0 | 529.5 | 336.1 | ||||||||
Loss on extinguishment of debt | 26.1 | — | — | ||||||||
Income before income taxes and equity in earnings of unconsolidated subsidiaries | 442.9 | 529.5 | 336.1 | ||||||||
Equity in earnings of unconsolidated subsidiaries | 18.7 | — | — | ||||||||
Income before income taxes | 461.6 | 529.5 | 336.1 | ||||||||
Income tax expense | 87.9 | 287.4 | 217.5 | ||||||||
Net income | $ | 373.7 | $ | 242.1 | $ | 118.6 | |||||
Other comprehensive income, before tax: | |||||||||||
Change in net unrealized gains and losses on available-for-sale securities | (2.2 | ) | 1.8 | (1.9 | ) | ||||||
Income tax benefit related to other comprehensive income (loss) | (0.5 | ) | 0.6 | (0.3 | ) | ||||||
Other comprehensive income (loss), net of tax | (1.7 | ) | 1.2 | (1.6 | ) | ||||||
Comprehensive income | $ | 372.0 | $ | 243.3 | $ | 117.0 | |||||
Earnings per common share (see Note 5): | |||||||||||
Basic | $ | 8.40 | $ | 5.47 | $ | 2.69 | |||||
Diluted | $ | 8.31 | $ | 5.43 | $ | 2.67 | |||||
Weighted average common shares outstanding: | |||||||||||
Basic | 44,474,016 | 44,248,778 | 44,057,579 | ||||||||
Diluted | 44,967,061 | 44,619,589 | 44,391,032 | ||||||||
See notes to consolidated financial statements.
F-3
WELLCARE HEALTH PLANS, INC.
CONSOLIDATED BALANCE SHEETS
(In millions, except share data)
December 31, | |||||||
Assets | 2017 | 2016 | |||||
Current Assets: | |||||||
Cash and cash equivalents | $ | 4,198.6 | $ | 3,961.4 | |||
Short-term investments | 469.5 | 124.2 | |||||
Premiums receivable, net | 453.4 | 498.6 | |||||
Pharmacy rebates receivable, net | 335.0 | 278.0 | |||||
Receivables from government partners | 44.2 | 6.5 | |||||
Funds receivable for the benefit of members | 27.5 | 32.6 | |||||
Prepaid expenses and other current assets, net | 291.0 | 218.3 | |||||
Total current assets | 5,819.2 | 5,119.6 | |||||
Property, equipment and capitalized software, net | 319.5 | 274.5 | |||||
Goodwill | 660.7 | 392.5 | |||||
Other intangible assets, net | 367.9 | 74.1 | |||||
Long-term investments | 766.2 | 57.3 | |||||
Restricted investments | 211.0 | 234.3 | |||||
Other assets | 4.9 | 0.5 | |||||
Assets of discontinued operations | 215.2 | — | |||||
Total Assets | $ | 8,364.6 | $ | 6,152.8 | |||
Liabilities and Stockholders' Equity | |||||||
Current Liabilities: | |||||||
Medical benefits payable | $ | 2,146.3 | $ | 1,690.5 | |||
Unearned premiums | 65.9 | 3.3 | |||||
Accounts payable and accrued expenses | 788.1 | 668.5 | |||||
Funds payable for the benefit of members | 1,075.9 | 390.3 | |||||
Other payables to government partners | 367.0 | 303.2 | |||||
Total current liabilities | 4,443.2 | 3,055.8 | |||||
Deferred income tax liability | 93.4 | 63.4 | |||||
Long-term debt, net | 1,182.4 | 997.6 | |||||
Other liabilities | 13.7 | 35.9 | |||||
Liabilities of discontinued operations | 215.2 | — | |||||
Total Liabilities | 5,947.9 | 4,152.7 | |||||
Commitments and contingencies (see Note 13) | — | — | |||||
Stockholders' Equity: | |||||||
Preferred stock, $0.01 par value (20,000,000 authorized, no shares issued or outstanding) | — | — | |||||
Common stock, $0.01 par value (100,000,000 authorized, 44,522,988 and 44,293,881 shares issued and outstanding at December 31, 2017 and December 31, 2016, respectively) | 0.4 | 0.4 | |||||
Paid-in capital | 591.5 | 546.9 | |||||
Retained earnings | 1,827.5 | 1,453.8 | |||||
Accumulated other comprehensive loss | (2.7 | ) | (1.0 | ) | |||
Total Stockholders' Equity | 2,416.7 | 2,000.1 | |||||
Total Liabilities and Stockholders' Equity | $ | 8,364.6 | $ | 6,152.8 | |||
See notes to consolidated financial statements.
F-4
WELLCARE HEALTH PLANS, INC.
CONSOLIDATED STATEMENTS OF CHANGES IN STOCKHOLDERS' EQUITY
(In millions, except share data)
Common Stock | Paid in Capital | Retained Earnings | Accumulated Other Comprehensive Loss | Total Stockholders' Equity | ||||||||||||||||||
Shares | Amount | |||||||||||||||||||||
Balance at January 1, 2015 | 43,914,106 | $ | 0.4 | $ | 503.0 | $ | 1,093.1 | $ | (0.6 | ) | $ | 1,595.9 | ||||||||||
Common stock issued for exercised stock options | 8,020 | — | 0.3 | — | — | 0.3 | ||||||||||||||||
Common stock issued for vested stock-based compensation awards | 270,723 | — | — | — | — | — | ||||||||||||||||
Repurchase and retirement of shares to satisfy tax withholding requirements | (79,521 | ) | — | (7.0 | ) | — | — | (7.0 | ) | |||||||||||||
Stock-based compensation expense, net of forfeitures | — | — | 20.2 | — | — | 20.2 | ||||||||||||||||
Incremental tax benefit from stock-based compensation | — | — | 1.9 | — | — | 1.9 | ||||||||||||||||
Comprehensive income (loss) | — | — | — | 118.6 | (1.6 | ) | 117.0 | |||||||||||||||
Balance at December 31, 2015 | 44,113,328 | 0.4 | 518.4 | 1,211.7 | (2.2 | ) | 1,728.3 | |||||||||||||||
Common stock issued for vested stock-based compensation awards | 255,143 | — | — | — | — | — | ||||||||||||||||
Repurchase and retirement of shares to satisfy tax withholding requirements | (74,590 | ) | — | (7.0 | ) | — | — | (7.0 | ) | |||||||||||||
Stock-based compensation expense, net of forfeitures | — | — | 35.5 | — | — | 35.5 | ||||||||||||||||
Comprehensive income | — | — | — | 242.1 | 1.2 | 243.3 | ||||||||||||||||
Balance at December 31, 2016 | 44,293,881 | 0.4 | 546.9 | 1,453.8 | (1.0 | ) | 2,000.1 | |||||||||||||||
Common stock issued for vested equity-compensation awards | 332,508 | — | — | — | — | — | ||||||||||||||||
Repurchase and retirement of shares to satisfy tax withholding requirements | (103,401 | ) | — | (15.2 | ) | — | — | (15.2 | ) | |||||||||||||
Stock-based compensation expense, net of forfeitures | — | — | 59.8 | — | — | 59.8 | ||||||||||||||||
Comprehensive income (loss) | — | — | — | 373.7 | (1.7 | ) | 372.0 | |||||||||||||||
Balance at December 31, 2017 | 44,522,988 | $ | 0.4 | $ | 591.5 | $ | 1,827.5 | $ | (2.7 | ) | $ | 2,416.7 | ||||||||||
See notes to consolidated financial statements.
F-5
WELLCARE HEALTH PLANS, INC.
CONSOLIDATED STATEMENTS OF CASH FLOWS
(In millions)
For the Years Ended December 31, | |||||||||||
2017 | 2016 | 2015 | |||||||||
Cash flows from operating activities: | |||||||||||
Net income | $ | 373.7 | $ | 242.1 | $ | 118.6 | |||||
Adjustments to reconcile net income to cash flows from operating activities: | |||||||||||
Depreciation and amortization | 120.4 | 87.6 | 72.6 | ||||||||
Loss on extinguishment of debt | 26.1 | — | — | ||||||||
Stock-based compensation expense | 59.8 | 35.5 | 20.2 | ||||||||
Deferred taxes, net | (47.1 | ) | 11.6 | 44.6 | |||||||
Other, net | 18.2 | 16.8 | 26.1 | ||||||||
Changes in operating accounts, net of effects from acquisitions and divestitures: | |||||||||||
Premiums receivable, net | 136.4 | 95.2 | (8.5 | ) | |||||||
Pharmacy rebates receivable, net | (44.1 | ) | (25.5 | ) | 106.4 | ||||||
Medical benefits payable | 328.3 | 117.2 | 68.6 | ||||||||
Unearned premiums | 63.9 | (26.6 | ) | (55.6 | ) | ||||||
Other receivables/payables to government partners | 8.0 | 69.8 | 241.7 | ||||||||
Amount payable related to investigation resolution | — | — | (35.2 | ) | |||||||
Accrued liabilities and other, net | 6.4 | 124.6 | 113.1 | ||||||||
Net cash provided by operating activities | $ | 1,050.0 | $ | 748.3 | $ | 712.6 | |||||
Cash flows from investing activities: | |||||||||||
Acquisitions and acquisition-related settlements, net of cash acquired | $ | (728.3 | ) | $ | (68.9 | ) | $ | (17.2 | ) | ||
Purchases of investments | (1,463.7 | ) | (346.5 | ) | (165.7 | ) | |||||
Proceeds from sales and maturities of investments | 679.4 | 493.7 | 195.7 | ||||||||
Additions to property, equipment and capitalized software, net | (128.4 | ) | (105.3 | ) | (137.0 | ) | |||||
Net cash used in investing activities | $ | (1,641.0 | ) | $ | (27.0 | ) | $ | (124.2 | ) | ||
Cash flows from financing activities: | |||||||||||
Proceeds from debt, net of financing costs paid | $ | 1,182.2 | $ | 196.9 | $ | 308.9 | |||||
Payments on debt | (1,026.1 | ) | (400.0 | ) | — | ||||||
Repurchase and retirement of shares to satisfy tax withholding requirements | (15.2 | ) | (7.0 | ) | (7.0 | ) | |||||
Funds received for the benefit of members, net | 671.6 | 1,031.1 | 201.1 | ||||||||
Other, net | 15.7 | 12.1 | 2.1 | ||||||||
Net cash provided by financing activities | $ | 828.2 | $ | 833.1 | $ | 505.1 | |||||
Increase in cash and cash equivalents | 237.2 | 1,554.4 | 1,093.5 | ||||||||
Balance at beginning of period | 3,961.4 | 2,407.0 | 1,313.5 | ||||||||
Balance at end of period | $ | 4,198.6 | $ | 3,961.4 | $ | 2,407.0 | |||||
SUPPLEMENTAL DISCLOSURES OF CASH FLOW INFORMATION: | |||||||||||
Cash paid for taxes | $ | 167.2 | $ | 222.3 | $ | 217.9 | |||||
Cash paid for interest | $ | 57.0 | $ | 57.3 | $ | 51.9 | |||||
SUPPLEMENTAL DISCLOSURES OF NON-CASH TRANSACTIONS: | |||||||||||
Non-cash additions to property, equipment, and capitalized software | $ | 3.5 | $ | 6.2 | $ | 6.1 | |||||
See notes to consolidated financial statements.
F-6
NOTES TO CONSOLIDATED FINANCIAL STATEMENTS
Years Ended December 31, 2017, 2016, and 2015
(In millions, except member, per share and share data)
1. ORGANIZATION AND BASIS OF PRESENTATION
We are a leading managed care company, headquartered in Tampa, Florida, focusing exclusively on providing government-sponsored managed care services, primarily through Medicaid, Medicare Advantage ("MA") and Medicare Prescription Drug Plans ("PDPs") to families, children, seniors and individuals with complex medical needs. As of December 31, 2017, we served approximately 4.4 million members in 50 states and the District of Columbia. We estimate that we are among the largest managed care organizations providing Medicaid managed care services plans, MA plans and PDPs, as measured by membership. Our broad range of experience and government focus allows us to effectively serve our members, partner with our providers, government clients and communities we serve, and efficiently manage our ongoing operations.
We were formed as a Delaware limited liability company in May 2002 and began our operations in Florida, New York, and Connecticut through two concurrent health plan acquisitions completed in July 2002. In July 2004, immediately prior to the closing of our initial public offering, we merged the limited liability company into a Delaware corporation and changed our name to WellCare Health Plans, Inc.
As of December 31, 2017, we operated Medicaid health plans in Arizona, Florida, Georgia, Hawaii, Illinois, Kentucky, Missouri, Nebraska, New Jersey, New York, South Carolina and Texas. We began serving Medicaid and Medicare members in Arizona, effective December 31, 2016, in connection with the acquisition of Care1st Health Plan Arizona, Inc. and One Care by Care1st Health Plan of Arizona, Inc. (together, "Care1st Arizona"). Effective January 1, 2017, we began serving Medicaid members statewide in Nebraska.
In addition, as of December 31, 2017, we offered MA coordinated care plans ("CCPs") in certain counties in Arizona, Arkansas, California, Connecticut, Florida, Georgia, Hawaii, Illinois, Kentucky, Louisiana, Maine, Mississippi, New Jersey, New York, South Carolina, Tennessee and Texas. We also offered stand-alone Medicare PDPs in 50 states and the District of Columbia. Effective January 1, 2018, we expanded our MA service area into the state of North Carolina.
Basis of Presentation and Use of Estimates
The consolidated balance sheets and statements of comprehensive income, changes in stockholders' equity, and cash flows include our accounts and the accounts of our subsidiaries over which we have control or are the primary beneficiary. We eliminated all intercompany accounts and transactions.
The accompanying consolidated financial statements have been prepared in accordance with generally accepted accounting principles in the United States ("GAAP"), which requires us to make estimates and assumptions that affect the amounts reported in the consolidated financial statements and accompanying notes. We base these estimates on our knowledge of current events and anticipated future events and evaluate and update our assumptions and estimates on an ongoing basis; however, actual results may differ from our estimates. We evaluated all material events subsequent to the date of these consolidated financial statements. Certain reclassifications were made to 2015 and 2016 financial information to conform with 2017 presentation.
Unconsolidated Subsidiaries
As discussed in Note 3- Acquisitions, in connection with the acquisition of Universal American Corp. (“Universal American”), we acquired a wholly-owned subsidiary which works with physicians and other health care professionals to operate Accountable Care Organizations (“ACOs”) under the Medicare Shared Saving Program ("MSSP") and Next Generation ACO Models. ACOs were established by the Patient Protection and Affordable Care Act, as amended by the Health Care and Education Reconciliation Act of 2010 (the "ACA") to reward integrated, efficient care and allow providers to share in any savings they achieve as a result of improved quality and operational efficiency.
F-7
These ACOs were generally formed as limited liability companies. The ACOs are considered variable interest entities ("VIEs"), under GAAP, as these entities do not have sufficient equity to finance their own operations without additional financial support. We own a majority interest in our ACOs; however, we share the power to direct the activities that most significantly affect the ACOs with health care providers as minority owners in the ACOs. This power is shared pursuant to the structure of the management committee of each of the ACOs. Accordingly, we have determined that we are not the primary beneficiary of the ACOs, and therefore we cannot consolidate their results. We perform an ongoing qualitative assessment of our variable interests in VIEs to determine whether we have a controlling financial interest and would therefore be considered the primary beneficiary of the VIE.
We account for our participation in the ACOs using the equity method. Gains and losses are reported as equity in earnings of unconsolidated subsidiaries in our consolidated statements of comprehensive income. We recognized equity in earnings of our unconsolidated ACOs of $18.7 million in 2017, primarily the result of net gains associated with the 2016 MSSP program year.
2. SUMMARY OF SIGNIFICANT ACCOUNTING POLICIES
Recently Adopted Accounting Standards
In May 2017, the FASB issued ASU 2017-09, "Compensation-Stock Compensation (Topic 718) - Scope of Modification Accounting". This guidance addresses which changes to the terms or conditions of a share-based payment award require an entity to apply modification accounting pursuant to Topic 718. An entity should account for the effects of a modification unless (a) the fair value of the modified award is the same as the fair value of the original award, (b) the vesting conditions of the modified award are the same as the vesting conditions of the original award and (c) the classification of the modified award as an equity instrument or a liability instrument is the same as the classification of the original award immediately before the original award is modified. The amendments in this guidance should be applied prospectively for public business entities effective for annual periods beginning after December 15, 2017, including interim periods within those annual periods. We adopted this guidance prospectively on January 1, 2018. We do not anticipate the adoption of this guidance to have a material effect on our consolidated results of operations, financial condition or cash flows.
In January 2017, the Financial Accounting Standards Board issued Accounting Standards Update ("ASU") 2017-04, "Intangibles—Goodwill and Other (Topic 350): Simplifying the Test for Goodwill Impairment". This update eliminates the requirement to calculate the implied fair value of goodwill to measure a goodwill impairment charge. As a result, an entity should perform its annual goodwill impairment test by comparing the fair value of a reporting unit with its carrying amount and should recognize an impairment charge for the amount by which the carrying amount exceeds the reporting unit's fair value; however, the loss recognized should not exceed the total amount of goodwill allocated to that reporting unit. We adopted this guidance prospectively on January 1, 2018. We do not anticipate the adoption of this guidance to have a material effect on our consolidated results of operations, financial condition or cash flows.
In January 2017, the FASB issued ASU 2017-01, “Business Combinations (Topic 805): Clarifying the Definition of a Business.” The amendments in this update provide guidance to assist entities with evaluating when a group of transferred assets and activities (collectively referred to as a "set") is a business. This new guidance provides for a "screen", which requires a determination that when substantially all of the fair value of the gross assets acquired (or disposed of) is concentrated in a single identifiable asset or a group of similar identifiable assets, the set is not a business. If the screen's threshold is not met, a set cannot be considered a business unless it includes an input and a substantive process that together significantly contribute to the ability to create output, eliminating the evaluation of whether a market participant could replace missing elements. This guidance is effective for prospective business combinations for public entities for interim and annual periods beginning after December 15, 2017. We adopted this guidance prospectively on January 1, 2018. We do not anticipate the adoption of this guidance to have a material effect on our consolidated results of operations, financial condition or cash flows.
In November 2016, the FASB issued ASU 2016-18, “Statement of Cash Flows (Topic 230) Restricted Cash; a consensus of the FASB Emerging Issues Task Force.” This update requires entities to reconcile, on the statement of cash flows, changes in the total of cash, cash equivalents, and amounts generally described as restricted cash or restricted cash equivalents. This guidance is effective for public entities for interim and annual periods beginning after December 15, 2017, and will be applied retrospectively. We adopted this guidance on January 1, 2018. We do not anticipate the adoption of this guidance to have a material effect on our consolidated results of operations, financial condition or cash flows.
F-8
In October 2016, the Financial Accounting Standards Board ("FASB") issued Accounting Standards Update ("ASU") 2016-17, “Consolidation (Topic 810).” This update changes how a reporting entity evaluates consolidation, including whether an entity is considered a variable interest entity, determination of the primary beneficiary and how related parties are considered in the analysis. We adopted this guidance effective January 1, 2017. We do not anticipate the adoption of this guidance to have a material effect on our consolidated results of operations, financial condition or cash flows.
In August 2016, the FASB issued ASU 2016-15, "Statement of Cash Flows Classification of Certain Cash Receipts and Cash Payments (Topic 230)." This update targets eight specific areas to clarify how these cash receipts and cash payments are presented and classified in the statement of cash flows. This guidance is effective for public entities for interim and annual periods beginning after December 15, 2017, with early adoption permitted. We adopted this guidance on January 1, 2018. We do not anticipate the adoption of this guidance to have a material effect on our consolidated results of operations, financial condition or cash flows.
In March 2016, the FASB issued ASU 2016-07, "Simplifying the Transition to the Equity Method of Accounting," which eliminates the requirement to apply the equity method of accounting retrospectively when a reporting entity obtains significant influence over a previously held investment. Instead, the equity method of accounting should be applied prospectively from the date significant influence is obtained. Investors should add the cost of acquiring the additional interest in the investee (if any) to the current basis of their previously held interest. The new standard should be applied prospectively for investments that qualify for the equity method of accounting after the effective date. We adopted this guidance effective January 1, 2017. We do not anticipate the adoption of this guidance to have a material effect on our consolidated results of operations, financial condition or cash flows.
In January 2016, the FASB issued ASU 2016-01, "Financial Instrument - Overall (Subtopic 825-10): Recognition and Measurement of Financial Assets and Financial Liabilities," which requires entities to measure equity securities that are not consolidated or accounted for under the equity method at fair value through net income. This amendment also simplifies the impairment test of equity investments without readily determinable fair values. This guidance is effective for public companies for fiscal years beginning after December 15, 2017, including interim periods within those fiscal years. We adopted this guidance prospectively on January 1, 2018. We do not anticipate the adoption of this guidance to have a material effect on our consolidated results of operations, financial condition or cash flows.
In May 2014, the FASB issued ASU 2014-09, "Revenue from Contracts with Customers (Topic 606)." ASU 2014-09 will supersede existing revenue recognition standards with a single model unless those contracts are within the scope of other standards (e.g., an insurance entity’s insurance contracts). The revenue recognition principle in ASU 2014-09 is that an entity should recognize revenue to depict the transfer of goods or services to customers in an amount that reflects the consideration to which the entity expects to be entitled in exchange for those goods or services. In addition, new and enhanced disclosures will be required. Companies can adopt the new standard either using the full retrospective approach, a modified retrospective approach with practical expedients, or a cumulative effect upon adoption approach. In August 2015, the FASB issued ASU 2015-14, "Revenue from Contracts with Customers (Topic 606): Deferral of the Effective Date", which deferred the effective dates of ASU 2014-09 by one year. As such, the standard becomes effective for annual and interim reporting periods beginning after December 15, 2017. Given that substantially all of our revenues are derived from insurance contracts accounted for in accordance with ASC 944, Financial Services-Insurance, which are specifically excluded from the scope of ASU 2014-09, we do not anticipate the adoption of this guidance to have a material effect on our consolidated results of operations, financial condition or cash flows.
Recently Issued Accounting Standards
In March 2017, the FASB issued ASU No. 2017-08, "Receivables—Nonrefundable Fees and Other Costs (Subtopic 310-20): Premium Amortization on Purchased Callable Debt Securities". This update shortens the amortization period for the premium on certain purchased callable debt securities to the earliest call date. Currently, entities generally amortize the premium as a yield adjustment over the contractual life of the security. The new guidance does not change the accounting for purchased callable debt securities held at a discount. This guidance is effective for interim and annual periods beginning after December 15, 2018. Early adoption is permitted. We are currently assessing the effect this guidance will have on our consolidated financial statements.
F-9
In June 2016, the FASB issued ASU 2016-13, "Financial Instruments – Credit Losses (Topic 326)," which requires entities to use a current expected credit loss model, which is a new impairment model based on expected losses rather than incurred losses. Under this model, an entity would recognize an impairment allowance equal to its current estimate of all contractual cash flows that the entity does not expect to collect from financial assets measured at amortized cost. The entity's estimate would consider relevant information about past events, current conditions, and reasonable and supportable forecasts, which will result in recognition of lifetime expected credit losses upon loan origination. ASU 2016-13 is effective for interim and annual reporting periods beginning after December 15, 2019, with early adoption permitted for annual reporting periods beginning after December 15, 2018. We are currently assessing the effect this guidance will have on our consolidated financial statements.
In February 2016, the FASB issued ASU 2016-02, "Leases (Topic 842)," which for operating leases, requires a lessee to recognize a right-of-use asset and a lease liability, initially measured at the present value of the lease payments in its balance sheet. This standard also requires a lessee to recognize a single lease cost, calculated so that the cost of the lease is allocated over the lease term, on a generally straight-line basis. This guidance is effective for public companies for fiscal years beginning after December 15, 2018, including interim periods within those fiscal years. Early adoption is permitted. We do not expect the adoption of this guidance to have a material effect on our results of operations or cash flows. The effect of ASU 2016-02 on our consolidated financial position will be based on leases outstanding at the time of adoption.
Premium Revenue Recognition and Premiums Receivable
We earn premium revenue through our participation in Medicaid, Medicaid-related and Medicare programs. Our Medicaid contracts with state agencies generally are multi-year contracts subject to annual renewal provisions, while our Medicare contracts with CMS renew annually. Our Medicare and Medicaid contracts establish fixed, monthly premium rates per member ("PMPM"), which are generally determined at the beginning of each new contract renewal period; however, premiums may be adjusted by CMS and state agencies throughout the term of the contracts in certain cases. Premium rate changes are recognized in the period the change becomes effective, when the effect of the change in the rate is reasonably estimable and collection is assured.
We recognize premium revenue in the period in which we are obligated to provide services to our members. We are generally paid by CMS and state agencies in the month in which we provide services. On a monthly basis, we bill members for any premiums for which they are responsible according to their respective plan. We record premiums earned but not received as premiums receivable and record premiums received in advance of the period of service as unearned premiums in the consolidated balance sheets. Unearned premiums are recognized as revenue when we provide the related services. Member premiums are recognized as revenue in the period of service. We estimate, on an on-going basis, the amount of members' billings that may not be collectible based on our evaluation of historical trends. An allowance is established for the estimated amount that may not be collectible. In addition, we routinely monitor the collectability of specific premiums receivable from CMS and state agencies, including Medicaid receivables for obstetric deliveries and newborns, and net receivables for member retroactivity. We reduce revenue and premiums receivable by the amount we estimate may not be collectible. We reported premiums receivable net of an allowance for uncollectible premiums receivable of $16.3 million and $22.7 million at December 31, 2017 and 2016, respectively. Historically, the provision for uncollectible premiums for member premiums receivable has not been material relative to consolidated premium revenue.
Premium payments are based upon eligibility lists produced by CMS and state agencies. We verify these lists to determine whether we have been paid for the correct premium category and program. From time to time, CMS and state agencies require us to reimburse them for premiums that we received for individuals who were subsequently determined to be ineligible for any government-sponsored program or belong to a plan other than ours. Additionally, the verification of membership may result in additional premiums due to us from CMS and state agencies for individuals who were subsequently determined to belong to our plan for periods in which we received no premium for those members. We estimate the amount of outstanding retroactivity adjustments and adjust premium revenue based on historical trends, premiums billed, the volume of member and contract renewal activity and other information. We record amounts receivable in premiums receivable, net and amounts payable in accounts payable and accrued expenses in the consolidated balance sheets.
F-10
Supplemental Medicaid Premiums
We earn supplemental premium payments for eligible obstetric deliveries and newborns for our Medicaid members in Arizona, Florida, Georgia, Illinois (through December 31, 2017), Missouri, Nebraska, New Jersey, New York and South Carolina. Each state Medicaid contract specifies how and when these supplemental payments are earned and paid. We also earn supplemental Medicaid premium payments in some states for high cost drugs and other eligible services. We recognize supplemental premium revenue in the period we provide related services to our members. For the years ended December 31, 2017, 2016, and 2015 we recognized approximately $478.9 million, $238.7 million and $269.1 million, respectively, of supplemental Medicaid premium revenue. The increase in 2017 resulted from our new Nebraska Medicaid plan and our acquisition of Care1st Arizona on December 31, 2016.
Medicaid ACA Industry Fee Reimbursement
The ACA imposed certain new taxes and fees, including an annual premium-based health insurance industry assessment (the "ACA industry fee") on health insurers, which began in 2014. For 2015 and 2016, we received amendments, written agreements or other documentation from all of our state Medicaid customers, that commit them to reimburse us for the portion of the ACA industry fee attributable to our Medicaid plans, including its non-deductibility for income tax purposes. In December 2016, President Obama signed the Consolidated Appropriations Act, 2016 which, among other provisions, included a one-year moratorium on the ACA industry fee for 2017. As a result, the associated Medicaid ACA industry fee reimbursements from our state government partners were eliminated for 2017. Accordingly, we did not recognize any Medicaid ACA industry fee reimbursement revenue for the year ended December 31, 2017, compared with $244.9 million and $219.2 million recognized for the years ended December 31, 2016 and 2015, respectively.
Medicaid Risk-Adjusted Premiums and Retroactive Rate Changes
As previously discussed, Medicaid premium rate changes are recognized in the period the change becomes effective, when the effect of the change in the rate is reasonably estimable and collection is assured. In some instances, our Medicaid premiums are subject to risk score adjustments based on the health profile of our membership. Generally, the risk score is determined by the state agency's analysis of encounter submissions of processed claims data to determine the acuity of our membership relative to the entire state's Medicaid membership. The frequency of when states adjust premiums varies, but is usually done quarterly or semi-annually on a retrospective basis. We recognize periodic changes to risk-adjusted premiums as revenue when the amounts are determinable and collection is reasonably assured. Historically, we have not experienced significant differences between our estimates and amounts ultimately paid or received.
Medicare Risk-Adjusted Premiums
CMS provides risk-adjusted payments for MA Plans and PDPs based on the demographics and health severity of enrollees. The risk-adjusted premiums we receive are based on claims and encounter data that we submit to CMS within prescribed deadlines. We develop our estimates for risk-adjusted premiums utilizing historical experience, or other data, and predictive models as sufficient member risk score data becomes available over the course of each CMS plan year. We recognize periodic changes to risk-adjusted premiums as revenue when the amounts are determinable and collection is reasonably assured, which is possible as additional diagnosis code information is reported to CMS, when the ultimate adjustment settlements are received from CMS, or we receive notification of such settlement amounts. CMS adjusts premiums on two separate occasions on a retrospective basis. The first retrospective adjustment for a given plan year generally occurs during the third quarter of that year. This initial settlement represents the update of risk scores for the current plan year based on the severity of claims incurred in the prior plan year. CMS then issues a final retrospective risk adjusted premium settlement for that plan year in the following year. Historically, we have not experienced significant differences between our estimates and amounts ultimately received. The data provided to CMS to determine members' risk scores is subject to audit by CMS even after the annual settlements occur. An audit may result in the refund of premiums to CMS. While our experience to date has not resulted in a material refund, future refunds could materially reduce premium revenue in the year in which CMS determines a refund is required and could be material to our results of operations, financial position and cash flows. Premiums receivable in the accompanying consolidated balance sheets include risk-adjusted premiums receivable of $190.3 million and $99.0 million as of December 31, 2017 and 2016, respectively.
F-11
Minimum Medical Expense and Risk Corridor Provisions
We may be required to refund certain premium revenue to state agencies and CMS under various contractual and plan arrangements. We estimate the effect of the following arrangements on a monthly basis and reflect any adjustments to premium revenues in current operations. We report the estimated net amounts due to state agencies and CMS in other payables to government partners in the consolidated balance sheets.
Certain of our Medicaid contracts require us to expend a minimum percentage of premiums on eligible medical benefits expense. To the extent that we expend less than the minimum percentage of the premiums on eligible medical benefits, we are required to refund to the state all or some portion of the difference between the minimum and our actual allowable medical benefits expense. Additionally, certain of our Medicaid contracts include other types of risk sharing arrangements (e.g., profit sharing arrangements) that require return of revenue to the state or receipt of revenue from the state, based on certain pre-tax earnings, net earnings or other results of operations -based calculations. In all arrangements, we estimate the amounts due from or to the state agencies based on the terms of our contracts with the applicable state agency and record the amounts as a change in premium. Historically, we have not experienced material differences between our recorded estimates and the subsequent state agencies settlement amounts.
Our MA and PDP premiums are subject to risk sharing through the CMS Medicare Part D risk corridor provisions. The risk corridor calculation compares our actual experience to the target amount of prescription drug costs, limited to costs under the standard coverage as defined by CMS, less rebates included in our submitted plan year bid. We receive additional premium from CMS if our actual experience is more than 5% above the target amount. We refund premiums to CMS if our actual experience is more than 5% below the target amount. Based on the risk corridor provision and PDP activity-to-date, an estimated risk-sharing receivable or payable is recorded as an adjustment to premium revenue. After the close of the annual plan year, CMS performs the risk corridor calculation and any differences are settled between CMS and our plans. Historically, we have not experienced material differences between the subsequent CMS settlement amount and our recorded estimates.
Beginning in 2014, the ACA required the establishment of a minimum medical loss ratio (“MLR”) for MA plans and Part D plans, requiring them to spend not less than 85% of premiums on medical benefits. The rules implementing the minimum MLR impose financial and other penalties for failing to achieve the minimum MLR, including requirements to refund to CMS shortfalls in amounts spent on medical benefits and termination of a plan’s MA contract for prolonged failure to achieve the minimum MLR. MLR is determined by adding a plan’s spending for clinical services, prescription drugs and other direct patient benefits, plus its total spending on quality improvement activities and dividing the total by earned premiums (after subtracting specific identified taxes and other fees). These provisions did not have a material effect on our results of operations in 2017, 2016 or 2015.
A summary of other net payables to government partners is as follows (in millions):
As of December 31, | |||||||
2017 | 2016 | ||||||
Liability to states under Medicaid risk sharing provisions | $ | (142.5 | ) | $ | (105.9 | ) | |
Liability to CMS under risk corridor provision | (179.1 | ) | (190.5 | ) | |||
Liability to CMS under MA/PDP minimum MLR provisions of the ACA | (1.2 | ) | (0.3 | ) | |||
Net payables to government partners(1) | $ | (322.8 | ) | $ | (296.7 | ) | |
(1) The components of net payables to government partners are classified in the consolidated balance sheets as $44.2 million and $367.0 million in current assets and current liabilities, respectively, as of December 31, 2017, and $6.5 million and $303.2 million in current assets and current liabilities, respectively, as of December 31, 2016.
Medicare Part D Subsidies
For qualifying low income PDP members, CMS pays for some, or all, of the member's monthly premium. We receive certain Part D prospective subsidy payments from CMS for our MA and PDP members as a fixed monthly per member amount, based on the estimated costs of providing prescription drug benefits over the plan year, as reflected in our bids. Approximately nine to ten months subsequent to the end of the plan year, or later in the case of the coverage gap discount subsidy, a settlement payment is made between CMS and our plans based on the difference between the prospective payments and actual claims experience. The subsidy components under Part D are described below.
F-12
Low-Income Cost Sharing Subsidy ("LICS")-For qualifying low income members, CMS reimburses us for all or a portion of the low income member's deductible, coinsurance and co-payment amounts above the out-of-pocket threshold.
Catastrophic Reinsurance Subsidy-CMS reimburses plans for 80% of the drug costs after a member reaches his or her out-of-pocket catastrophic threshold through a catastrophic reinsurance subsidy.
Coverage Gap Discount Subsidy ("CGDS")-CMS provides monthly prospective payments for pharmaceutical manufacturer discounts made available to members.
Catastrophic reinsurance subsidies and the LICS represent cost reimbursements under the Medicare Part D program. We are fully reimbursed by CMS for costs incurred for these contract elements and, accordingly, there is no insurance risk to us. Therefore, amounts received for these subsidies are not considered premium revenue, and are reported, net of the subsidy benefits paid, as Funds receivable/held for the benefit of members in the consolidated balance sheets. The receipts and payments between us and CMS are presented on a net basis as financing activity in our consolidated statements of cash flows because we are essentially administering and paying the benefit subsidies on behalf of CMS. Historically, the settlement payments between us and CMS have not been materially different from our estimates.
CGDS advance payments are recorded within Funds receivable/held for the benefit of members in the consolidated balance sheets. Receivables are set up for manufacturer-invoiced amounts. Manufacturer payments reduce the receivable as payments are received. After the end of the contract year, during the Medicare Part D Payment reconciliation process for the CGD, CMS will perform a cost-based reconciliation to ensure the Medicare Part D sponsor is paid for gap discounts advanced at the point of sale, based on accepted prescription drug event data.
Funds payable for the benefit of members, net consisted of the following (in millions):
As of December 31, | |||||||
2017 | 2016 | ||||||
Low-income cost sharing subsidy | $ | (47.7 | ) | $ | 47.8 | ||
Catastrophic reinsurance subsidy | (987.1 | ) | (418.1 | ) | |||
Coverage gap discount subsidy | (13.6 | ) | 12.6 | ||||
Funds payable for the benefit of members, net(1) | $ | (1,048.4 | ) | $ | (357.7 | ) | |
(1) The components of net funds payable for the benefit of members, net are classified in the consolidated balance sheets as $27.5 million and $1,075.9 million in current assets and current liabilities, respectively, as of December 31, 2017, and as $32.6 million and $390.3 million in current assets and current liabilities, respectively, as of December 31, 2016.
Based on our historical experience and trends, our 2017 PDP and MA bids reflected higher estimates for cash outflows for the government's responsibility of the Part D benefit plan design as compared with our 2016 bids, particularly for the catastrophic reinsurance subsidy; however, the level of subsidy payments we made on behalf of CMS compared with the level of subsidies we received in 2017 were significantly lower than our 2017 bids due to the composition of the 2017 PDP membership. As a result, the net funds payable for the benefit of members increased from $357.7 million as of December 31, 2016 to $1,048.4 million as of December 31, 2017. Additionally, as of December 31, 2017, our consolidated balance sheet included a $284.1 million net payable for the 2016 Part D plan year, primarily relating to certain contracts terminated effective January 1, 2017. This net payable is expected to be settled within the next 18 to 24 months.
Medical Benefits Expense and Medical Benefits Payable
We recognize the cost of medical benefits in the period in which services are provided, including an estimate of the cost of medical benefits incurred but not reported ("IBNR"). Medical benefits expense includes direct medical expenses and certain medically-related administrative costs.
Direct medical expenses include amounts paid or payable to hospitals, physicians, pharmacy benefit managers and providers of ancillary services. Recorded direct medical expenses are reduced by the amount of pharmacy rebates earned, which are estimated based on historical utilization of specific pharmaceuticals, current utilization and contract terms. Pharmacy rebates earned but not yet received from pharmaceutical manufacturers are included in pharmacy rebates receivable in the accompanying consolidated balance sheets. Direct medical expenses may also include reserves for estimated referral claims related to health care providers under contract with us who are financially troubled or insolvent and who may not be able to
F-13
honor their obligations for the costs of medical services provided by other providers. In these instances, we may be required to honor these obligations for legal or business reasons. Based on our current assessment of providers under contract with us, such losses have not been and are not expected to be significant. Also included in direct medical expense are our estimates for provider settlements due to clarification of contract terms, out-of-network reimbursement, claims payment differences and amounts due to contracted providers under risk-sharing and/or value-based arrangements.
Consistent with the criteria specified and defined in guidance issued by the Department of Health and Human Services ("HHS") for costs that qualify to be reported as medical benefits under the minimum MLR provision of the ACA, we record certain medically related administrative costs such as preventive health and wellness, care management, and other quality improvement costs, as medical benefits expense. All other medically related administrative costs, such as utilization review services, network and provider credentialing and claims handling costs, are recorded in selling, general, and administrative expense.
Medical benefits payable represents amounts for claims fully adjudicated but not yet paid and estimates for IBNR. Our estimate of IBNR is the most significant estimate included in our consolidated financial statements. We determine our best estimate of the base liability for IBNR utilizing consistent standard actuarial methodologies based upon key assumptions, which vary by business segment. Our assumptions include current payment experience, trend factors, and completion factors. Trend factors in our standard actuarial methodologies include contractual requirements, historic utilization trends, the interval between the date services are rendered and the date claims are paid, denied claims activity, disputed claims activity, benefit changes, expected health care cost inflation, seasonality patterns, maturity of lines of business, changes in membership and other factors.
After determining an estimate of the base liability for IBNR, we make an additional estimate, also using standard actuarial techniques, to account for adverse conditions that may cause actual claims to be higher than the estimated base reserve. We refer to this additional liability as the provision for moderately adverse conditions. Our estimate of the provision for moderately adverse conditions captures the potential adverse development from factors such as:
•our entry into new geographical markets;
•our provision of services to new populations such as the aged, blind and disabled;
•variations in utilization of benefits and increasing medical costs, including higher drug costs;
•changes in provider reimbursement arrangements;
•variations in claims processing speed and patterns, claims payment and the severity of claims; and
•health epidemics or outbreaks of disease such as the flu or enterovirus.
We evaluate our estimates of medical benefits payable as we obtain more complete claims information and medical expense trend data over time. We record differences between actual experience and estimates used to establish the liability, which we refer to as favorable and unfavorable prior year reserve developments, as increases or decreases to medical benefits expense in the period we identify the differences.
Premium Deficiency Reserves
We evaluate our contracts to determine if it is probable that a loss will be incurred. We establish a premium deficiency reserve ("PDR") when it is probable that expected future medical benefits and administrative expenses will exceed future premiums and reinsurance recoveries for the remainder of a contract period. For purposes of determining a PDR, we do not consider investment income and contracts are grouped in a manner consistent with our method of acquiring, servicing and measuring the profitability of such contracts. A PDR is recorded as medical benefits expense and in medical benefits payable. Once established, a PDR is reduced over the contract period as an offset to actual losses. We re-evaluate our PDR estimates each reporting period and, if estimated future losses differ from those in the current PDR estimate, we adjust the liability through medical benefits expense, as necessary.
During the fourth quarter of 2017, we recorded a $45.6 million PDR in connection with our new Medicaid managed care contract with the Illinois Department of Health Care and Family Services ("HFS") that was effective on January 1, 2018 (the "Illinois PDR"). In December 2017, we received our initial rate structure and membership roster from the State of Illinois, which were used as the basis for our initial assessment of the contract. The Illinois PDR reflects the initial premium rate structure, estimated medical benefits and other costs expected to be incurred during the initial four-year contractual term of the contract. We had no PDR liabilities recorded in our consolidated balance sheets as of December 31, 2016.
F-14
ACA Industry Fee
The total ACA industry fee levied on the health insurance industry was $11.3 billion in both 2015 and 2016, increasing to $14.3 billion in 2018. After 2018, the industry fee increases according to an index based on net premium growth. The assessment is being levied on certain health insurers that provide insurance in the assessment year and is allocated to health insurers based on each health insurer's share of net premiums for all U.S health insurers in the year preceding the assessment. The initial estimated liability for each year is accrued as of January 1, with a corresponding deferred expense asset that is amortized over 12 months to expense on a straight line basis. The fee is payable by September 30 of each year. The ACA industry fee is not deductible for income tax purposes, which significantly increased our effective income tax rate during 2014, 2015 and 2016 compared to prior periods.
As previously discussed, the Consolidated Appropriations Act, 2016, included a one-year moratorium on the ACA industry fee for 2017, among other provisions. Accordingly, we did not incur ACA industry fee expense for the year ended December 31, 2017, compared with $228.4 million and $227.3 million incurred in 2016 and 2015, respectively.
Equity-Based Employee Compensation
During the second quarter of 2013, our stockholders approved the WellCare Health Plans, Inc. 2013 Incentive Compensation Plan (the "2013 Plan"). Upon approval of the 2013 Plan, a total of 2,500,000 shares of our common stock were available for issuance pursuant to the 2013 Plan, minus any shares subject to outstanding awards granted on or after January 1, 2013, under our 2004 Equity Incentive Plan (the "Prior Plan"). In addition, shares subject to awards forfeited under the Prior Plan will become available for issuance under the 2013 Plan. No further awards are permitted to be granted under our Prior Plan.
Certain of our employees, including executive officers, are eligible for long-term incentive awards ("LTI Program"), consisting of equity awards granted pursuant to the 2013 Plan. We designed the LTI Program to motivate and promote the achievement of our long-term financial and operating goals and improve retention. Under the LTI Program, we grant multi-year performance period awards that are not realized by employees and officers until subsequent years. We base award amounts on each participant's pre-established long-term incentive target and allocate the awards to various types of equity and performance-based cash awards, depending on job level. The Compensation Committee of our board of directors (the "Compensation Committee") has sole discretion of the ultimate funding and payout of certain performance awards under the LTI program.
The Compensation Committee awards certain equity-based compensation under our stock plans, including stock options, restricted stock units ("RSUs"), performance stock units ("PSUs") and market stock units ("MSUs"), each of which is described below:
RSUs - For each RSU granted, employees receive one share of common stock, net of taxes withheld at the statutory minimum, at the end of the vesting period. RSUs typically vest one to three years from the date of grant. We estimate compensation cost for RSUs based on the grant date fair value, which is based on the closing price of our common stock on the date of grant, and recognize the expense ratably over the vesting period of the award.
PSUs - The actual number of common stock shares earned upon vesting will range from zero shares up to 200% of the target award, depending on the award date, the target award amounts for the PSU awards and our achievement of certain financial, market-based and quality-based performance goals set by the Compensation Committee at its sole discretion. PSUs generally cliff-vest 3 years from the grant date based on the achievement of the performance goals and conditioned on the employee's continued service through the vesting date. The number of shares earned by the participant are generally paid net of taxes withheld at the statutory minimum.
The Compensation Committee has awarded two variations of PSUs, including:
• | Financial and Quality Performance Goals: Certain of our PSUs are subject to variable accounting as they do not have a grant date fair value for accounting purposes due to the subjective nature of the terms of the PSUs, which precludes a mutual understanding of the key terms and conditions. We recognize expense for PSUs ultimately expected to vest over the requisite service period based on our estimates of progress made towards the achievement of the predetermined performance measures and changes in the market price of our common stock. In March 2016, we issued certain PSUs whereby a mutual understanding of key terms and conditions exist; therefore, for these awards we estimate compensation cost based on the grant date fair value, as well as our estimate of the performance outcome, and recognize the expense ratably over the vesting period of the award with |
F-15
cumulative changes in expense recognized in periods in which performance conditions change or are ultimately met.
• | Market Based Goals: Beginning in 2016, we issued certain PSUs, which are subject to a market condition (total shareholder return relative to industry peer companies or prescribed stock price growth) and we estimate compensation cost based on the grant date fair value and recognize the expense ratably over the vesting period of the award. For these PSUs, the grant date fair value is measured using a Monte Carlo simulation approach, which estimates the fair value of awards based on randomly generated simulated stock-price paths through a lattice-type structure. PSUs expected to vest are recognized as expense either on a straight-line or accelerated basis, depending on the award structure, over the vesting period. |
MSUs - The number of shares of common stock earned upon vesting is determined based on the ratio of our average common stock price during the last 30 days market trading days of the calendar year immediately preceding the vesting date to the comparable average common stock price in the year immediately preceding the grant date, applied to the base units granted. The performance ratio is capped at 200%. If our common stock price declines by more than 50% over the performance period, no shares are earned by the recipient. The number of shares earned by the participant are generally paid net of taxes withheld at the statutory minimum. For MSUs, the grant date fair value is measured using a Monte Carlo simulation approach, which estimates the fair value of awards based on randomly generated simulated stock-price paths through a lattice-type structure. MSUs expected to vest are recognized as expense on a straight-line basis over the vesting period, which is generally three years. The last of our MSU awards are expected to vest in March 2018.
We estimate equity-based compensation expense based on awards ultimately expected to vest. We make assumptions of forfeiture rates at the time of grant and continuously reassess our assumptions based on actual forfeiture experience.
Medicaid Premium Taxes
Premiums related to our Medicaid contracts with Arizona, Georgia, Hawaii, Kentucky, New Jersey and New York are subject to an assessment or tax on Medicaid premiums. The premium revenues we receive from these states include a reimbursement for this premium assessment. We have reported premium taxes on a gross basis, as premium revenue and as premium tax expense in the consolidated statements of income. We recognize the premium tax assessment as expense in the period we earn the related premium revenue and remit the taxes back to the state agencies on a periodic basis. We incurred Medicaid premium taxes of $119.8 million, $110.0 million and $94.7 million for the years ended December 31, 2017, 2016 and 2015, respectively.
Income Tax Expense
We record income tax expense as incurred based on enacted tax rates, estimates of book-to-tax differences in income, and projections of income that will be earned in each taxing jurisdiction. We recognize deferred tax assets and liabilities for the estimated future tax consequences of differences between the carrying amounts of existing assets and liabilities and their respective tax basis. We measure deferred tax assets and liabilities using tax rates, as enacted by law and applicable to taxable income in the years in which we expect to recover or settle those temporary differences. We record a valuation allowance on deferred taxes if we determine it is more likely than not that we will not fully realize the future benefit of deferred tax assets. We file tax returns after the close of our fiscal year end and adjust our estimated tax receivable or liability to the actual tax receivable or due per the filed state and federal tax returns. Historically, we have not experienced significant differences between our estimates of income tax expense and actual amounts incurred.
State and federal taxing authorities may challenge the positions we take on our filed tax returns. We evaluate our tax positions and only recognize a tax benefit if it is more likely than not that a tax audit will sustain our conclusion. Based on our evaluation of tax positions, we believe that potential tax exposures have been recorded appropriately. State and federal taxing authorities may propose additional tax assessments based on periodic audits of our tax returns. We believe our tax positions comply with applicable tax law in all material aspects and we will vigorously defend our positions on audit. The ultimate resolution of these audits may materially affect our financial position, results of operations or cash flows. We have not experienced material adjustments to our consolidated financial statements as a result of these audits.
Cash and Cash Equivalents
We classify unrestricted cash and short-term investments with original maturities of three months or less as cash and cash equivalents in the consolidated balance sheets. We record cash and cash equivalents at cost, which approximates fair value.
F-16
Investments
We classify our fixed maturity securities, including short-term, long-term, and restricted investments, as available-for-sale and report them at fair value. We record unrealized gains and losses on securities, net of deferred income taxes, as a separate component of accumulated other comprehensive loss in the consolidated balance sheets. We record investment income when earned and classify investment income earned but not received in prepaid expenses and other current assets in the consolidated balance sheets. We may purchase fixed maturity securities at a premium or discount. We amortize these premiums and discounts as adjustments to investment income over the estimated remaining term of the securities. We determine realized gains and losses on sales of securities on a specific identification basis.
We determine the fair value of fixed maturity securities based on quoted prices in active markets or market prices provided by a third-party pricing service. The third-party pricing service determines market prices using inputs such as reported trades, benchmark yields, issuer spreads, bids, offers, estimated cash flows and prepayment spreads. Based on the typical trading volumes and the lack of quoted market prices for fixed maturities, third party pricing services will normally derive the security prices through recent reported trades for identical or similar securities making adjustments through the reporting date based upon available market observable information. If there are no recent reported trades, the pricing services may use matrix or model processes to develop a security price using future cash flow expectations based upon collateral performance and discount this at an estimated market rate.
We regularly compare the fair value of our investments to the amortized cost of those investments. The evaluation of impairment is a quantitative and qualitative process, which is subject to risk and uncertainties. Our fixed maturity investments are exposed to four primary sources of investment risk: credit, interest rate, liquidity and market valuation. The financial statement risks are those associated with the recognition of impairments and income, as well as the determination of fair values.
We perform a case-by-case evaluation of the underlying reasons for the decline in fair value and consider a wide range of factors about the security issuer, including assumptions and estimates about the operations of the issuer and its future earnings potential. We use our best judgment in evaluating the cause of the decline in the estimated fair value of the security and in assessing the prospects for near-term recovery. Our evaluation of impairment includes, but is not limited to:
• | the length of time and the extent to which the market value has been below cost; |
• | the potential for impairments of securities when the issuer is experiencing significant financial difficulties; |
• | the potential for impairments in an entire industry sector or sub-sector; |
• | the potential for impairments in certain economically depressed geographic locations; |
• | the potential for impairments of securities where the issuer, series of issuers or industry has suffered a catastrophic type of loss or has exhausted natural resources; |
• | unfavorable changes in forecasted cash flows on asset-backed securities; and |
• | other subjective factors, including concentrations and information obtained from regulators and rating agencies. |
We recognize impairments of securities when we consider a decline in fair value below the amortized cost basis to be other-than-temporary. If we intend to sell a security, or it is more likely than not that we will be required to sell the security before recovery of its amortized cost basis, we recognize an other-than-temporary impairment ("OTTI") in earnings equal to the entire difference between the security's amortized cost basis and its fair value. If we do not intend to sell the security and it is more likely than not that we will not be required to sell the security before recovery of its amortized cost basis, but the present value of the cash flows expected to be collected is less than the amortized cost basis of the security (referred to as the credit loss), we conclude an OTTI has occurred. In this instance, we bifurcate the total OTTI into the amount related to the credit loss, which we recognize in earnings as investment income, net, with the remaining amount of the total OTTI attributed to other factors (referred to as the noncredit portion) recognized as a separate component in other comprehensive income. After the recognition of an OTTI, we account for the security as if it had been purchased on the measurement date of the OTTI, with an amortized cost basis equal to the previous amortized cost basis less than the OTTI recognized in earnings. We did not realize any OTTI for the years ended December 31, 2017, 2016 or 2015.
Restricted Investments
As a condition for licensure, we are required to maintain certain funds on deposit or pledged to various state agencies. Certain of our state contracts require the issuance of surety bonds. We record our restricted investments, which include cash, cash equivalents, and other short-term investments, at fair value. We classify restricted investments as long-term regardless of the contractual maturity date of the securities held, due to the nature of the states' requirements.
F-17
Prepaid Expenses and Other Current Assets
Prepaid expenses and other current assets, net, are comprised of receivables relating to advances to providers, prepaid premium taxes, pharmaceutical coverage gap discounts receivable and other prepaid expenses and current assets. Beginning in 2016, the balance also includes utilization performance guarantee program receivables from our new pharmacy benefit manager.
Property, Equipment and Capitalized Software, net
Property, equipment and capitalized software are stated at historical cost, net of accumulated depreciation. We capitalize certain costs incurred in the development of internal-use software, including external direct costs of materials and services and payroll costs of employees devoted to specific software development. We expense other software development costs, such as training and data conversion costs, as incurred. We capitalize the costs of improvements that extend the useful lives of the related assets.
We record depreciation expense using the straight-line method over the estimated useful lives of the related assets, which ranges from three to ten years for leasehold improvements, five years for furniture and equipment, and three to seven years for computer equipment and software. We record maintenance and repair costs as selling, general and administrative expense when incurred.
On an ongoing basis, we review events or changes in circumstances that may indicate that the carrying value of an asset may not be recoverable. If the carrying value of an asset exceeds the sum of estimated undiscounted future cash flows, we recognize an impairment loss in the current period for the difference between estimated fair value and carrying value. If assets are determined to be recoverable but the useful lives are shorter than we originally estimated, we depreciate the remaining net book value of the asset over the newly determined remaining useful lives.
Goodwill and Other Intangible Assets
Our acquisitions typically result in goodwill, which represents the excess of the acquisition cost over the fair value of net assets acquired. Goodwill is assigned to reporting units, which we determined to be the same as our operating segments. Goodwill recorded at December 31, 2017 was $660.7 million compared with $392.5 million at December 31, 2016. Goodwill attributable to our Medicaid reporting unit was $274.7 million and $282.1 million at December 31, 2017 and 2016, respectively. Goodwill attributable to our MA reporting unit was $386.0 million and $110.4 million at December 31, 2017 and 2016, respectively. The increase in goodwill for the MA reporting unit from December 31, 2016 resulted from our acquisition of Universal American during 2017. Refer to Note 3 – Acquisitions, included in the Consolidated Financial Statements for additional discussion.
We test goodwill for impairment at the reporting unit level at least annually, or more frequently if events or circumstances indicate that it would be more likely than not that the fair value of a reporting unit is below its carrying value. Such events or circumstances could include a significant adverse change in business climate, an adverse action or assessment by a regulator, unanticipated competition and the testing for recoverability of a significant asset group within a reporting unit, among others. To determine whether goodwill is impaired, we compare an estimate of the fair value of the applicable reporting unit to its carrying value, including goodwill. If the carrying value exceeds the estimated fair value, we compare the implied fair value of the applicable goodwill to its carrying value to measure the amount of goodwill impairment, if any. We perform our annual goodwill impairment test based on our financial position and results of operations as of June 30 of each year, which generally coincides with the finalization of federal and state contract negotiations and our initial budgeting and planning process. The annual impairment tests are based on an evaluation of estimated future discounted cash flows. The estimated discounted cash flows are based on the best information available to us at the time, including supportable assumptions and projections we believe are reasonable. Our discounted cash flow estimates use discount rates that correspond to a weighted-average cost of capital consistent with a market-participant view. The discount rates are consistent with those used for investment decisions and take into account the operating plans and strategies of our operating segments. Certain other key assumptions utilized, including changes in membership, premium, health care costs, operating expenses, fees, assessments and taxes and effective tax rates, are based on estimates consistent with those utilized in our annual budgeting and planning process that we believe are reasonable. However, if we do not achieve the results reflected in the assumptions and estimates, our goodwill impairment evaluations could be adversely affected, and we may impair a portion of our goodwill, which would adversely affect our operating results in the period of impairment. Impairments, if any, would be classified as an operating expense. Based on the results of our annual impairment testing in 2017, we determined that the fair value of each reporting unit substantially exceeded its carrying value and no further goodwill impairment assessment was necessary.
F-18
Other intangible assets resulting from our acquisitions include provider networks, broker networks, trademarks, state contracts, non-compete agreements, licenses and permits. We amortize other intangible assets over their estimated useful lives ranging from approximately one to 15 years. These assets are allocated to reporting units for impairment testing purposes. We review our other intangible assets for impairment when events or changes in circumstances occur, which may potentially affect the estimated useful life or recoverability of the remaining balances of our intangible assets. Such events and changes in circumstances would include significant changes in membership, state funding, federal and state government contracts and provider networks. Upon such an occurrence, recoverability of assets to be held and used is measured by comparing the carrying amount of an asset to current forecasts of undiscounted future net cash flows expected to be generated by the assets. Identifiable cash flows are measured at the lowest level for which they are largely independent of the cash flows of other groups of assets and liabilities. If these assets are determined to be impaired, the amount of impairment recognized is measured by the amount by which the carrying amount of the assets exceeds their fair value. During 2017, 2016, and 2015, no events or circumstances have occurred, which may potentially affect the estimated useful life or recoverability of the remaining balances of our other intangible assets. Accordingly, there were no impairment losses recognized during these periods.
Accounts Payable and Accrued Expenses
Accounts payable and accrued expenses are primarily comprised of liabilities relating to pharmacy benefit administration, accrued salaries and incentive compensation, consulting contract obligations, and other miscellaneous current liabilities.
3. ACQUISITIONS
Phoenix Health Plan Assets Acquisition
On May 1, 2017, we completed our acquisition of certain assets from Phoenix Health Plan ("PHP"), including Arizona Medicaid membership and certain provider contracts. The transaction included the transfer of approximately 42,000 Medicaid members to Care1st Arizona Health Plan, Inc. ("Care1st Arizona"), a wholly owned subsidiary of the Company. The transaction was funded with available cash on hand.
Universal American Acquisition
On April 28, 2017 (the "Effective Date"), we acquired all of the issued and outstanding shares of Universal American. The transaction was valued at approximately $770.0 million, including the cash purchase price of $10.00 per outstanding share ("Per Share Merger Consideration") of Universal American's common stock, the assumption of $145.3 million fair value of Universal American's convertible debt, the cash settlement of Universal American's $40.0 million par value of Series A Mandatorily Redeemable Preferred Shares (the "Preferred Shares") and the cash settlement of outstanding vested and unvested stock-based compensation awards. The acquisition of Universal American, with approximately 119,000 MA members in Texas, New York and Maine, strengthens our business by increasing our MA membership by one-third, deepening our presence in two key markets, Texas and New York, and diversifying our business portfolio. In addition, Universal American has joined with provider groups to operate ACOs, under the MSSP and Next Generation ACO models. As a result of the acquisition, we operated 16 MSSP ACOs and two Next Generation ACOs as of December 31, 2017.
F-19
The fair value at the Effective Date of the consideration transferred in the Universal American acquisition consisted of the following:
(in millions) | |||
Number of shares of Universal American common stock outstanding on April 28, 2017 (57.1 million) multiplied by the Per Share Merger Consideration | $ | 570.8 | |
Assumed debt(a) | 145.3 | ||
Repurchase of Preferred Shares (b) | 41.0 | ||
Stock-based award cash consideration(c) | 12.9 | ||
Total consideration transferred | $ | 770.0 | |
(a) Following the consummation of the Universal American transaction, all of the holders of Universal American's 4.00% convertible senior notes (the "Convertible Notes") elected to convert their notes into the right to receive cash equal to the par value of the notes plus a make whole premium. We paid the noteholders the amounts due and all of the Convertible Notes were redeemed in the second quarter of 2017. The fair value of the Convertible Notes was determined based on quoted market prices; therefore, have been classified within Level 1 of the fair value hierarchy. See Universal American Convertible Notes below for further discussion of the repurchase of the Convertible Notes. | |||
(b) On the Effective Date, we redeemed an aggregate of $40.0 million of Universal American's Preferred Shares, which became redeemable by the holders on April 28, 2017 due to certain change in control provisions for the Preferred Shares. We redeemed the Preferred Shares for $41.0 million, which includes the $40.0 million par value of the Preferred Shares and $1.0 million of accrued dividends. See Universal American Mandatorily Redeemable Preferred Shares below for further discussion of the redemption of the Preferred Shares. | |||
(c) Pursuant to the terms of the Universal American acquisition, outstanding vested and unvested stock-based compensation awards as of the Effective Date converted to the right to receive cash. We estimated the fair value of these awards at the Effective Date and attributed that fair value to pre-acquisition and post-acquisition services in accordance with GAAP. Accordingly, $12.9 million of the fair value of these awards was attributed to pre-acquisition services and is included in the estimated consideration transferred, and approximately $20.0 million has been, or will be, included in our post-acquisition financial statements as compensation costs and reflected as a selling, general and administrative expense in our consolidated statements of comprehensive income. | |||
The following table summarizes the estimated fair values of major classes of assets acquired and liabilities assumed at the Effective Date, based on our preliminary valuation assumptions, reconciled to the total consideration transferred.
Assets | (in millions) | ||
Cash and cash equivalents | $ | 66.4 | |
Investments, including restricted investments | 254.4 | ||
Premiums receivable, net | 90.7 | ||
Pharmacy rebates receivable, net, and other current assets | 56.2 | ||
Property, equipment and capitalized software, net | 7.5 | ||
Goodwill | 275.6 | ||
Other intangible assets, net | 298.2 | ||
Assets of discontinued operations | 219.6 | ||
Estimated fair value of total assets acquired | $ | 1,268.6 | |
Liabilities | |||
Medical benefits payable | $ | 128.1 | |
Deferred tax liabilities, net | 68.0 | ||
Other liabilities | 83.8 | ||
Liabilities of discontinued operations | 218.7 | ||
Estimated fair value of liabilities assumed | 498.6 | ||
Estimated fair value of net assets acquired | $ | 770.0 | |
F-20
The estimate of fair value results from judgments about future events, which reflect certain uncertainties and relies on estimates and assumptions. The judgments used to determine the estimated fair value assigned to each class of assets acquired and liabilities assumed, as well as intangible asset lives, can materially affect our operating results. We will finalize the Universal American purchase accounting for the various preliminary items as soon as reasonably possible during the measurement period. Measurement period adjustments will be recorded in the period in which they are determined, as if they had been completed at the acquisition date. The finalization of our purchase accounting assessment could result in changes in the valuation of assets acquired and liabilities assumed, which could be material.
As of the Effective Date, the expected fair value of all current assets and liabilities, as well as assets and liabilities of discontinued operations (refer to Note 19- Discontinued Operations for further discussion), approximated their historical cost. For certain noncurrent assets and liabilities, we have made preliminary fair value adjustments based on information reviewed through December 31, 2017. Significant fair value adjustments are noted as follows.
Identifiable intangible assets acquired
The following table summarizes the preliminary fair values and weighted average useful lives for identifiable intangible assets acquired in the Universal American acquisition which are subject to change as we finalize our purchase accounting.
Gross Fair Value (in millions) | Weighted Average Useful Life (in years) | |||||
Membership | $ | 240.0 | 10.0 | |||
Tradenames | 36.0 | 13.9 | ||||
Provider network | 9.5 | 15.0 | ||||
Other | 12.7 | 6.2 | ||||
Total | $ | 298.2 | 10.5 | |||
We valued the acquired membership and tradename intangible assets using an income approach (discounted future cash flow analysis) based on our consideration of historical financial results and expected industry and market trends. We discounted the future cash flows by a weighted-average cost of capital based on an analysis of the cost of capital for comparable companies within our industry. We valued the acquired provider network using a cost approach, which utilizes cost assumptions applicable at the valuation date to determine the cost of constructing a similar asset. Our other intangible assets include acquired operating licenses, certain non-compete agreements and acquired technology, which were valued using a combination of income and cost approaches. We amortize the intangible assets over the period we expect these assets to contribute directly or indirectly to our future cash flows on a straight-line basis, which approximates the pattern of economic consumption over their estimated useful lives.
Deferred taxes
The purchase price allocation includes net deferred tax liabilities of $68.0 million, primarily relating to deferred tax liabilities established on the identifiable acquired intangible assets, partially offset by deferred tax assets acquired in the Universal American transaction.
Goodwill
We recorded $275.6 million for the preliminary valuation of goodwill, assigned to our Medicare Health Plans reportable segment, for the excess of the purchase price over the estimated fair value of the net assets acquired. The recorded goodwill and other intangible assets related to the acquisition are not deductible for tax purposes.
F-21
Universal American Convertible Notes
In 2016, Universal American completed the offering of $115.0 million of their 4.00% Convertible Notes due 2021. The acquisition by WellCare constituted a “Make-Whole Fundamental Change” under the indenture for the convertible notes. During the three months ended June 30, 2017, all of the holders of the Convertible Notes elected to convert their notes into the right to receive cash equal to the par value of the notes plus a make whole premium. We paid the noteholders the amounts due and all of the notes were redeemed during the second quarter of 2017. The fair value of the Convertible Notes was $145.3 million on the Effective Date and was included in the purchase consideration for the Universal American acquisition.
Universal American Mandatorily Redeemable Preferred Shares
In April 2011, Universal American issued an aggregate of $40.0 million of its Preferred Shares, representing 1,600,000 shares with a par value of $0.01 per share and a liquidation preference of $25.00 per share. During the three months ended June 30, 2017, the Preferred Shares were redeemed for $41.0 million, which includes the $40.0 million par value of the Preferred Shares and $1.0 million of accrued dividends. The $41.0 million redemption amount was included in purchase consideration for the Universal American acquisition.
Consolidated Statement of Comprehensive Income
We included the results of Universal American's operations after the Effective Date in our consolidated financial statements. The amount of premium revenue attributable to Universal American included in our consolidated statement of comprehensive income for the year ended December 31, 2017 was $936.5 million. Additionally, our consolidated statement of comprehensive income for the year ended December 31, 2017 included a pretax net loss of $24.6 million attributable to Universal American's operations, which includes transaction and integration-related costs of $37.5 million related to the transaction. These costs include severance payments to former executives, advisory, legal and other professional fees that are reflected in selling, general and administrative ("SG&A") expense in our consolidated statement of comprehensive income.
Care1st Arizona Acquisition
On December 31, 2016, we completed the acquisition of Care1st Arizona. The purchase price was approximately $163.8 million, inclusive of statutory capital and subject to certain adjustments. We included the results of Care1st Arizona's operations from the date of acquisition in our consolidated financial statements. As of December 31, 2017, Care1st Arizona served approximately 153,000 Medicaid members in Arizona, including the previously noted membership acquired from PHP.
Based on the final purchase price allocation, we allocated $169.9 million of the purchase price to identified tangible assets, primarily comprised of cash and cash equivalents, and total liabilities of $116.9 million.
In addition, we recorded $24.0 million for the valuation of identified intangible assets, including acquired membership, provider networks and the Care1st tradename. We valued the acquired membership and tradename intangible assets using an income approach (discounted future cash flow analysis) based on our consideration of historical financial results and expected industry and market trends. We discounted the future cash flows by a weighted-average cost of capital based on an analysis of the cost of capital for comparable companies within our industry. We valued the acquired provider network using a cost approach, which utilizes cost assumptions applicable at the valuation date to determine the cost of constructing a similar asset. We amortize the intangible assets on a straight-line basis over the period we expect these assets to contribute directly or indirectly to our future cash flows. The weighted average amortization period for these intangible assets is 11.2 years.
We recorded $86.9 million of goodwill for the excess of the purchase price over the estimated fair value of the net assets and identifiable intangible assets acquired and assigned the goodwill to our Medicaid segment. The recorded goodwill and other intangible assets related to the Care1st Arizona acquisition are not deductible for tax purposes.
F-22
Unaudited Pro Forma Financial Information
The results of operations and financial condition for our 2017 and 2016 acquisitions have been included in our consolidated financial statements since the respective acquisition dates. The unaudited pro forma financial information presented below reflects all of our 2017 and 2016 acquisitions, including PHP, Universal American, Care1st Arizona and our June 2016 acquisition of certain assets of Advicare Corp; assuming in each case the acquisitions occurred as of January 1, 2016.
These pro forma results are based on estimates and assumptions, and do not reflect any anticipated synergies, efficiencies or other cost savings that we expect to realize from the acquisitions. The following unaudited pro forma results have been prepared for comparative purposes only and do not purport to be indicative of the results of operations that would have occurred had the acquisitions actually consummated at January 1, 2016, or project the future results of the combined company.
For the years ended December 31, | ||||||||
(in millions, except per share data) | 2017 | 2016 | ||||||
Total revenues | $ | 17,163.1 | $ | 16,211.4 | ||||
Net income | $ | 384.1 | $ | 239.0 | ||||
Earnings per common share: | ||||||||
Basic | $ | 8.64 | $ | 5.40 | ||||
Diluted | $ | 8.54 | $ | 5.36 | ||||
The pro forma results presented in the schedule above include adjustments related to the following purchase accounting and other acquisition-related costs:
• | Elimination of historical intangible asset amortization expense and addition of amortization expense based on the current preliminary values of identified intangible assets; |
• | Elimination of interest expense associated with retired Universal American obligations; |
• | Elimination of transaction and integration-related costs; |
• | Elimination of Universal American discontinued operations; |
• | Adjustments to align the acquisitions to our accounting policies; and |
• | Tax effects of the adjustments noted above. |
4. SEGMENT REPORTING
On a regular basis, we evaluate discrete financial information and assess the performance of our three reportable segments, Medicaid Health Plans, Medicare Health Plans and Medicare PDPs, to determine the most appropriate use and allocation of Company resources.
We allocate premium revenue, medical benefits expense, the ACA industry fee incurred in 2016 and 2015, and goodwill to our reportable segments. We do not allocate to our reportable segments any other assets and liabilities, investment and other income, selling, general and administrative expenses, depreciation and amortization, or interest expense. The Company's decision makers primarily use premium revenue, medical benefits expense and gross margin to evaluate the performance of our reportable segments.
F-23
Medicaid Health Plans
Our Medicaid Health Plans segment includes plans for beneficiaries of Temporary Assistance for Needy Families ("TANF"), Supplemental Security Income ("SSI"), Aged Blind and Disabled ("ABD") and other state-based programs that are not part of the Medicaid program, such as Children's Health Insurance Program ("CHIP") and Long-Term Services and Supports ("LTSS"). TANF generally provides assistance to low-income families with children. ABD and SSI generally provide assistance to low-income aged, blind or disabled individuals. CHIP provides assistance to qualifying families who are not eligible for Medicaid because their income exceeds the applicable income thresholds. The LTSS program is designed to help people with chronic illnesses or who have disabilities and need health and long-term care services, such as home care or adult day care, to enable them to stay in their homes and communities as long as possible.
Our Medicaid operations in certain states individually account for 10% or more of our consolidated premium revenue. These states and the respective Medicaid premium revenue as a percentage of total consolidated premium revenue are as follows:
For the Years Ended December 31, | ||||||
2017 | 2016 | 2015 | ||||
Kentucky | 15% | 18% | 19% | |||
Florida | 15% | 18% | 17% | |||
Georgia | * | 11% | 12% | |||
* Effective July 1, 2017, we commenced services under a new Medicaid contract with the State of Georgia serving TANF and CHIP beneficiaries. Due to the addition of a fourth managed care organization to the Georgia state program, our membership declined approximately 58,000 members as of December 31, 2017 compared with December 31, 2016. As a result of the decline in membership and overall growth in the Medicaid Health Plans segment, premium revenue attributable to our Georgia Medicaid health plan accounted for less than 10% of our consolidated premium revenue for the year ended December 31, 2017.
In December 2017, we entered into a contract amendment with the Kentucky Department of Medicaid Services that renewed our participation in the Kentucky Medicaid program through June 30, 2018, and included one additional one-year renewal period upon mutual agreement.
In February 2014, we executed a contract with the Florida Agency for Health Care Administration ("AHCA") pursuant to which our Staywell Health Plan participates in eight out of the state's 11 regions under the Managed Medical Assistance Program ("MMA"), which was fully implemented as of August 2014. The contract expires on December 31, 2018.
Medicare Health Plans
Medicare is a federal program that provides eligible persons age 65 and over and some disabled persons with a variety of hospital, medical and prescription drug benefits. MA is Medicare's managed care alternative to the original Medicare program, which provides individuals standard Medicare benefits directly through CMS. Our MA CCPs generally require members to seek health care services and select a primary care physician from a network of health care providers. In addition, we offer coverage of prescription drug benefits under the Medicare Part D program as a component of most of our MA plans.
Medicare PDPs
We offer stand-alone Medicare Part D coverage to Medicare-eligible beneficiaries in our Medicare PDPs segment. The Medicare Part D prescription drug benefit is supported by risk sharing with the federal government through risk corridors designed to limit the losses and gains of the participating drug plans and by reinsurance for catastrophic drug costs. The government subsidy is based on the national weighted average monthly bid for this coverage, adjusted for risk factor payments. Additional subsidies are provided for dually-eligible beneficiaries and specified low-income beneficiaries. The Part D program offers national in-network prescription drug coverage that is subject to limitations in certain circumstances.
F-24
Summary of Financial Information
An operating segment engages in business activities from which it may earn revenue and incur expenses, has discrete financial information and whose results are regularly reviewed by the chief operating decision makers for performance assessment and resource allocation decisions. Factors used to determine our reportable segments include the nature of operating activities, economic characteristics, existence of separate senior management teams and the type of information used by our chief operating decision makers. Reportable segments with similar economic characteristics, products and services, customers, distribution methods and operational processes that operate in a similar regulatory environment are combined. Accordingly, we have three reportable segments: Medicaid Health Plans, Medicare Health Plans and Medicare PDPs. A summary of financial information for our reportable segments through the gross margin level and a reconciliation to income from operations is presented in the tables below.
For the Years Ended December 31, | ||||||||||
2017 | 2016 | 2015 | ||||||||
Premium revenue: | ||||||||||
Medicaid Health Plans | $ | 10,726.3 | 9,499.3 | $ | 9,074.3 | |||||
Medicare Health Plans | 5,320.2 | 3,876.6 | 3,898.8 | |||||||
Medicare PDPs | 913.8 | 845.0 | 901.7 | |||||||
Total premium revenue | 16,960.3 | 14,220.9 | 13,874.8 | |||||||
Medical benefits expense: | ||||||||||
Medicaid Health Plans | 9,414.1 | 8,188.5 | 7,866.8 | |||||||
Medicare Health Plans | 4,577.3 | 3,278.5 | 3,401.7 | |||||||
Medicare PDPs | 753.4 | 622.4 | 710.0 | |||||||
Total medical benefits expense | 14,744.8 | 12,089.4 | 11,978.5 | |||||||
ACA industry fee expense: | ||||||||||
Medicaid Health Plans | — | 148.0 | 135.1 | |||||||
Medicare Health Plans | — | 64.2 | 68.7 | |||||||
Medicare PDPs | — | 16.2 | 23.5 | |||||||
Total ACA industry fee expense | — | 228.4 | 227.3 | |||||||
Gross margin: | ||||||||||
Medicaid Health Plans | 1,312.2 | 1,162.8 | 1,072.4 | |||||||
Medicare Health Plans | 742.9 | 533.9 | 428.4 | |||||||
Medicare PDPs | 160.4 | 206.4 | 168.2 | |||||||
Total gross margin | 2,215.5 | 1,903.1 | 1,669.0 | |||||||
Investment and other income | 46.9 | 16.2 | 15.4 | |||||||
Other expenses (1) | (1,793.4 | ) | (1,389.8 | ) | (1,348.3 | ) | ||||
Income from operations | $ | 469.0 | 529.5 | $ | 336.1 | |||||
(1) | Other expenses includes selling, general and administrative expenses, Medicaid Premium taxes, depreciation and amortization, interest and impairment and other charges. Other expenses, net for 2015 also includes the immaterial gain on a business divestiture. |
F-25
5. EARNINGS PER COMMON SHARE
We compute basic earnings per common share on the basis of the weighted-average number of unrestricted common shares outstanding. We compute diluted earnings per common share on the basis of the weighted-average number of unrestricted common shares outstanding plus the dilutive effect of our stock-based compensation awards using the treasury stock method.
We calculated weighted-average common shares outstanding — diluted as follows:
For the Years Ended December 31, | ||||||||
2017 | 2016 | 2015 | ||||||
Weighted-average common shares outstanding — basic | 44,474,016 | 44,248,778 | 44,057,579 | |||||
Dilutive effect of outstanding stock-based compensation awards | 493,045 | 370,811 | 333,453 | |||||
Weighted-average common shares outstanding — diluted | 44,967,061 | 44,619,589 | 44,391,032 | |||||
Anti-dilutive stock-based compensation awards excluded from computation | 76,446 | 14,867 | 65,839 | |||||
6. INVESTMENTS
As of December 31, 2017 and 2016, all of our investments were classified as available-for-sale securities. The amortized cost, gross unrealized gains or losses and estimated fair value of short-term and long-term investments by security type are summarized in the following tables.
Amortized Cost | Gross Unrealized Gains | Gross Unrealized Losses | Estimated Fair Value | ||||||||||||
December 31, 2017 | |||||||||||||||
Asset-backed securities | $ | 88.9 | $ | — | $ | (0.2 | ) | $ | 88.7 | ||||||
Corporate debt securities | 400.6 | 0.7 | (1.2 | ) | 400.1 | ||||||||||
Municipal securities | 223.7 | 1.0 | (1.9 | ) | 222.8 | ||||||||||
Residential mortgage-backed securities | 11.2 | — | — | 11.2 | |||||||||||
Short-term time deposits | 300.4 | — | — | 300.4 | |||||||||||
Government and agency obligations | 148.7 | — | (1.2 | ) | 147.5 | ||||||||||
Other securities | 65.2 | — | (0.2 | ) | 65.0 | ||||||||||
Total | $ | 1,238.7 | $ | 1.7 | $ | (4.7 | ) | $ | 1,235.7 | ||||||
December 31, 2016 | |||||||||||||||
Asset backed securities | $ | 3.3 | $ | — | $ | — | $ | 3.3 | |||||||
Corporate debt securities | 67.2 | — | — | 67.2 | |||||||||||
Municipal securities | 53.7 | 0.1 | (1.5 | ) | 52.3 | ||||||||||
Government and agency obligations | 1.0 | — | — | 1.0 | |||||||||||
Other securities | 57.8 | — | (0.1 | ) | 57.7 | ||||||||||
Total | $ | 183.0 | $ | 0.1 | $ | (1.6 | ) | $ | 181.5 | ||||||
F-26
Contractual maturities of our available-for-sale investments at December 31, 2017 are as follows:
Total | Within 1 Year | 1 Through 5 Years | 5 Through 10 Years | Thereafter | |||||||||||||||
Asset backed securities | $ | 88.7 | $ | 12.6 | $ | 71.7 | $ | 2.4 | $ | 2.0 | |||||||||
Corporate debt securities | 400.1 | 81.0 | 206.2 | 102.2 | 10.7 | ||||||||||||||
Municipal securities | 222.8 | 17.6 | 112.6 | 75.1 | 17.5 | ||||||||||||||
Residential mortgage-backed securities | 11.2 | — | — | — | 11.2 | ||||||||||||||
Short term time deposits | 300.4 | 300.4 | — | — | — | ||||||||||||||
Government and agency obligations | 147.5 | 5.1 | 135.4 | 6.8 | 0.2 | ||||||||||||||
Other securities | 65.0 | 52.8 | 2.2 | 3.0 | 7.0 | ||||||||||||||
Total | $ | 1,235.7 | $ | 469.5 | $ | 528.1 | $ | 189.5 | $ | 48.6 | |||||||||
Actual maturities may differ from contractual maturities due to the exercise of pre-payment options.
During the years ended December 31, 2017, 2016, and 2015, we sold available-for-sale investments totaling $348.2 million, $142.2 million and $64.6 million, respectively. Realized gains and losses resulting from these sales were not material for any of these years. Additionally, we did not realize any other-than-temporary impairment for any of these years.
7. RESTRICTED INVESTMENTS
The amortized cost, gross unrealized gains, gross unrealized losses and fair value of our restricted cash and investment securities are as follows:
Amortized Cost | Gross Unrealized Gains | Gross Unrealized Losses | Estimated Fair Value | ||||||||||||
December 31, 2017 | |||||||||||||||
Cash | $ | 5.7 | $ | — | $ | — | $ | 5.7 | |||||||
Money market funds | 58.7 | — | — | 58.7 | |||||||||||
U.S. government securities and other | 147.4 | — | (0.8 | ) | 146.6 | ||||||||||
Total | $ | 211.8 | $ | — | $ | (0.8 | ) | $ | 211.0 | ||||||
December 31, 2016 | |||||||||||||||
Cash | $ | 92.1 | $ | — | $ | — | $ | 92.1 | |||||||
Money market funds | 67.8 | — | — | 67.8 | |||||||||||
U.S. government securities and other | 74.5 | — | (0.1 | ) | 74.4 | ||||||||||
Total | $ | 234.4 | $ | — | $ | (0.1 | ) | $ | 234.3 | ||||||
Realized gains or losses related to sales and redemptions of restricted investments were not material for the years ended December 31, 2017, 2016, or 2015.
F-27
8. PROPERTY, EQUIPMENT AND CAPITALIZED SOFTWARE
Property, equipment and capitalized software and related accumulated depreciation are as follows:
December 31, | |||||||
2017 | 2016 | ||||||
Leasehold improvements | $ | 36.9 | $ | 30.1 | |||
Computer equipment | 128.3 | 110.6 | |||||
Capitalized software | 526.2 | 425.2 | |||||
Furniture and equipment | 39.2 | 32.7 | |||||
730.6 | 598.6 | ||||||
Less accumulated depreciation | (411.1 | ) | (324.1 | ) | |||
Total property and equipment, net | $ | 319.5 | $ | 274.5 | |||
We recognized depreciation expense on property, equipment and capitalized software of $87.7 million, $77.2 million, and $62.0 million for the years ended December 31, 2017, 2016, and 2015, respectively, including depreciation expense on capitalized software of $65.2 million, $57.6 million, and $43.7 million for the years ended December 31, 2017, 2016, and 2015, respectively. The increase in expense reflects continued additions to capitalized software and computer equipment resulting from investments in our information technology infrastructure.
9. GOODWILL AND OTHER INTANGIBLE ASSETS, NET
A summary of changes in our goodwill by reportable segment is as follows for 2017 and 2016:
Medicaid Health Plans | Medicare Health Plans | Total | |||||||||
Balance as of December 31, 2015 | $ | 152.8 | $ | 110.4 | $ | 263.2 | |||||
Acquired goodwill | 129.3 | — | 129.3 | ||||||||
Balance as of December 31, 2016 (1) (2) | 282.1 | 110.4 | 392.5 | ||||||||
Acquired goodwill (3) | 8.3 | 275.6 | 283.9 | ||||||||
Measurement period adjustments (2) | (15.7 | ) | — | (15.7 | ) | ||||||
Balance as of December 31, 2017 (1) (3) | $ | 274.7 | $ | 386.0 | $ | 660.7 | |||||
(1) Cumulative impairment charges relating to goodwill were $78.3 million as of December 31, 2017 and 2016, which related to goodwill assigned to our Medicare Health Plans reporting unit which we impaired during 2008.
(2) Medicaid Health Plans goodwill as of December 31, 2016, includes approximately $102.7 million of goodwill resulting from our acquisition of Care1st Arizona effective on December 31, 2016. During 2017, we reallocated $24.0 million of this goodwill to identifiable intangible assets, net of a $9.0 million corresponding deferred tax liability, based on our valuation of these assets. Refer to Note 3 – Acquisitions for additional discussion of the Care1st Arizona acquisition.
(3) Goodwill related to our 2017 acquisitions is considered preliminary, pending the final allocation of the applicable purchase price. Refer to Note 3 – Acquisitions for additional discussion of our 2017 acquisitions.
F-28
Other intangible assets as of December 31, 2017 and 2016, and the related weighted-average amortization periods as of December 31, 2017, are as follows:
As of December 31, | |||||||||||||||||||||||||
2017 | 2016 | ||||||||||||||||||||||||
Weighted Average Amortization Period (In Years) | Gross Carrying Amount | Accumulated Amortization | Other Intangibles, Net | Gross Carrying Amount | Accumulated Amortization | Other Intangibles, Net | |||||||||||||||||||
Membership and state contracts | 10.4 | $ | 344.4 | $ | (52.6 | ) | $ | 291.8 | $ | 94.3 | $ | (29.8 | ) | $ | 64.5 | ||||||||||
Trademarks and tradenames | 13.7 | 53.3 | (12.9 | ) | 40.4 | 11.4 | (9.8 | ) | 1.6 | ||||||||||||||||
Provider networks | 15.0 | 27.3 | (5.1 | ) | 22.2 | 8.4 | (3.7 | ) | 4.7 | ||||||||||||||||
Licenses and permits | 13.6 | 7.1 | $ | (4.1 | ) | 3.0 | 5.1 | (3.6 | ) | 1.5 | |||||||||||||||
Other | 5.7 | 14.9 | (4.4 | ) | 10.5 | 4.2 | (2.4 | ) | 1.8 | ||||||||||||||||
Total other intangible assets | 11.0 | $ | 447.0 | $ | (79.1 | ) | $ | 367.9 | $ | 123.4 | $ | (49.3 | ) | $ | 74.1 | ||||||||||
We recorded amortization expense of $32.7 million, $10.4 million, and $10.6 million for the years ended December 31, 2017, 2016 and 2015, respectively. The increase is primarily driven by the previously noted 2017 and 2016 acquisitions, discussed in Note 3 – Acquisitions.
Amortization expense expected to be recognized during fiscal years subsequent to December 31, 2017 is as follows:
Expected Amortization Expense | |||
2018 | $ | 41.9 | |
2019 | 41.7 | ||
2020 | 41.6 | ||
2021 | 41.5 | ||
2022 | 37.6 | ||
2023 and thereafter | 163.6 | ||
Total | $ | 367.9 | |
F-29
10. DEBT
The following table summarizes our outstanding debt obligations and their classification in the accompanying consolidated balance sheets (in millions):
December 31, 2017 | December 31, 2016 | ||||||
Long-term debt, net: | |||||||
5.25% Senior Notes, due April 1, 2025 | $ | 1,200.0 | $ | — | |||
5.75% Senior Notes, due November 15, 2020 (1) | — | 909.6 | |||||
Revolving Credit Facility | — | 100.0 | |||||
Debt issuance costs | (17.6 | ) | (12.0 | ) | |||
Total long-term debt, net | $ | 1,182.4 | $ | 997.6 | |||
(1) | Inclusive of $9.6 million of unamortized debt premium at December 31, 2016. |
5.25% Senior Notes due 2025
On March 22, 2017, we completed the offering and sale of 5.25% senior notes due 2025 in the aggregate principal amount of $1,200.0 million (the “2025 Notes”). The aggregate net proceeds from the issuance of the 2025 Notes were $1,182.2 million, with a portion of the net proceeds from the offering being used to repay the $100.0 million outstanding under our credit agreement dated January 8, 2016 (the "Credit Agreement", discussed further below) and to redeem the full $900.0 million aggregate principal amount of our 5.75% Senior Notes due 2020 (the "2020 Notes") on April 7, 2017, which is discussed further below. The remaining net proceeds from the offering of the 2025 Notes are being used for general corporate purposes, including organic growth and working capital.
The 2025 Notes will mature on April 1, 2025, and bear interest at a rate of 5.25% per annum, payable semi-annually on April 1 and October 1 of each year, commencing on October 1, 2017.
The 2025 Notes were issued under an indenture, dated as of March 22, 2017 (the "Base Indenture"), as supplemented by the First Supplemental Indenture, dated as of March 22, 2017 (the "First Supplemental Indenture" and, together with the Base Indenture, the "Indenture"), each between the Company and The Bank of New York Mellon Trust Company, N.A. (“BNY Mellon”), as trustee. The Indenture under which the notes were issued contains covenants that, among other things, limit our ability and the ability of our subsidiaries under certain circumstances to:
• | incur additional indebtedness and issue preferred stock; |
• | pay dividends or make distributions; |
• | make other restricted payments and investments; |
• | sell assets, including capital stock of restricted subsidiaries; |
• | create certain liens; |
• | incur restrictions on the ability of restricted subsidiaries to pay dividends or make other payments, and in the case of our subsidiaries, guarantee indebtedness; |
• | engage in transactions with affiliates; and |
• | create unrestricted subsidiaries. |
In addition, the Indenture requires that for the company to merge, consolidate or sell all or substantially all of its assets, (i) either the company must be the surviving entity, or the surviving entity or purchaser must be a U.S. entity; (ii) the surviving entity or purchaser must assume all the obligations of the company under the notes and the Indenture; (iii) no default or event of default (as defined under the Indenture) exists and (iv) the surviving entity, after giving pro forma effect to the transaction, (x) may incur at least $1.00 of additional indebtedness pursuant to the fixed charge coverage ratio or (y) have a fixed charge coverage ratio that is no worse than the fixed charge coverage ratio of the Company without giving pro forma effect to the transactions.
F-30
Ranking and Optional Redemption
The 2025 Notes are senior obligations of our company and rank equally in right of payment with all of our other existing and future unsecured and unsubordinated indebtedness. In addition, the 2025 Notes are structurally subordinated to all indebtedness and other liabilities of our subsidiaries (unless our subsidiaries become guarantors of the 2025 Notes).
At any time prior to April 1, 2020, we may, on any one or more occasions, redeem up to 40% of the aggregate principal amount of 2025 Notes at a redemption price equal to 105.250% of the principal amount of the 2025 Notes redeemed, plus accrued and unpaid interest, if any, with the net cash proceeds of an equity offering by the Company; provided that:
(1) at least 60% of the aggregate principal amount of 2025 Notes issued under the Indenture (including any additional Senior Notes, but excluding Senior Notes held by the Company or its subsidiaries) remains outstanding immediately after the occurrence of such redemption; and
(2) the redemption occurs within 90 days of the date of the closing of such equity offering.
At any time prior to April 1, 2020, we may on any one or more occasions redeem all or a part of the 2025 Notes, at a redemption price equal to 100% of the principal amount of the 2025 Notes redeemed, plus the Applicable Premium. The Applicable Premium means the greater of (i) 1.0% of the then outstanding principal amount of the note or (ii) the excess of the present value at such redemption date of the redemption price set forth in the optional redemption table below plus all required interest payments on the notes due through April 1, 2020 over the then outstanding principal amount of the notes, using the yield-to-maturity treasury rate most nearly equal to the period from the redemption date to April 1, 2020, as further set forth in the Indenture.
Except pursuant to the preceding two paragraphs, the 2025 Notes will not be redeemable at our option prior to April 1, 2020.
On or after April 1, 2020, we may on any one or more occasions redeem all or a part of the 2025 Notes, at the redemption prices (expressed as percentages of principal amount) set forth below, plus accrued and unpaid interest, if any, on the 2025 Notes redeemed, to, but not including, the applicable date of redemption, if redeemed during the twelve-month period beginning on November 15 of the years indicated below, subject to the rights of holders of 2025 Notes on the relevant record date to receive interest due on the relevant interest payment date:
Period | Redemption Price | |
2020 | 103.938 | % |
2021 | 102.625 | % |
2022 | 101.313 | % |
2023 and thereafter | 100.000 | % |
The 2025 Notes are classified as long-term debt in our consolidated balance sheet at December 31, 2017, based on their April 2025 maturity date.
5.75% Senior Notes due 2020
In November 2013, we issued $600.0 million in aggregate principal amount of our 5.75% unsecured Senior Notes due 2020. In June 2015, we completed the offering and sale of an additional $300.0 million aggregate principal amount of our 2020 Notes pursuant to a reopening of our existing series of such notes. The offering was completed at an issue price of 104.50%, plus accrued interest, and resulted in a debt premium of $13.5 million to be amortized over the remaining term.
On April 7, 2017, we redeemed the full $900.0 million in aggregate principal amount outstanding of our 2020 Notes at a redemption price of 102.875% of the principal amount, plus accrued and unpaid interest. Our obligations under the related base indenture, each dated as of November 14, 2013, by and among us and BNY Mellon, as trustee, were satisfied and discharged on April 7, 2017. In connection with the redemption of the 2020 Notes, we incurred a one-time loss on extinguishment of debt related to the redemption premium, the write-off of associated deferred financing costs and the write-off of the unamortized portion of associated premiums paid on the 2020 Notes. The loss on extinguishment of debt is reflected in our results of operations for 2017.
F-31
Credit Agreement
In January 2016, we entered into the Credit Agreement, which provides for a senior unsecured revolving loan facility (the "Revolving Credit Facility"), which had an initial aggregate principal amount at any time outstanding not to exceed $850.0 million. On March 22, 2017, we increased the aggregate principal amount available under our Credit Agreement from $850.0 million to $1.0 billion. Additionally, in March 2017, we repaid the $100.0 million outstanding under our Revolving Credit Facility, and as a result, there were no borrowings outstanding under the Revolving Credit Facility as of December 31, 2017.
The Credit Agreement provides for the Revolving Credit Facility of up to $1.0 billion (the loans thereunder, the “Revolving Credit Loans”), of which up to $150.0 million is available for letters of credit. The Credit Agreement also provides that we may, at our option, increase the aggregate amount of the Revolving Credit Facility and/or obtain incremental term loans in an amount up to $50.0 million without the consent of any lenders not participating in such increase, subject to certain customary conditions and lenders committing to provide the increase in funding. Unutilized commitments under the Credit Agreement are subject to a fee of 0.25% to 0.35% depending upon our ratio of total net debt to cash flow.
Revolving Credit Loans designated by us at the time of borrowing as “ABR Loans” that are outstanding under the Credit Agreement bear interest at a rate per annum equal to (i) the greatest of (a) the Prime Rate (as defined in the Credit Agreement) in effect on such day; (b) the Federal Reserve Bank of New York Rate (as defined in the Credit Agreement) in effect on such day plus 1/2 of 1%; and (c) the Adjusted LIBO Rate (as defined in the Credit Agreement) for a one month interest period on such day plus 1%; plus (ii) the Applicable Rate. Revolving Credit Loans designated by us at the time of borrowing as “Eurodollar Loans” that are outstanding under the Credit Agreement bear interest at a rate per annum equal to the Adjusted LIBO Rate (as defined in the Credit Agreement) for the interest period in effect for such borrowing plus the Applicable Rate. The “Applicable Rate” means a percentage ranging from 0.50% to 1.00% per annum for ABR Loans and a percentage ranging from 1.50% to 2.00% per annum for Eurodollar Loans, depending upon our ratio of total debt to cash flow, as calculated in accordance with the Credit Agreement.
The Credit Agreement includes negative and financial covenants that limit certain activities of us and our subsidiaries, including (i) restrictions on our ability and the ability of our subsidiaries to incur additional indebtedness; and (ii) financial covenants that require (a) the ratio of total net debt to cash flow not to exceed a maximum; and (b) a minimum interest expense and principal payment coverage ratio. The Credit Agreement also contains customary representations and warranties that must be accurate in order for us to borrow under the Revolving Credit Facility. In addition, the Credit Agreement contains customary events of default. If an event of default occurs and is continuing, we may be required immediately to repay all amounts outstanding under the Credit Agreement. Lenders holding at least 50% of the loans and commitments under the Credit Agreement may elect to accelerate the maturity of the loans and/or terminate the commitments under the Credit Agreement upon the occurrence and during the continuation of an event of default.
As of December 31, 2017, and as of the date of this filing, we were in compliance with all covenants under both the 2025 Notes and the Credit Agreement.
11. FAIR VALUE MEASUREMENTS
Our consolidated balance sheets include the following financial instruments: cash and cash equivalents, investments, receivables, accounts payable, medical benefits payable, long-term debt and other liabilities. We consider the carrying amounts of cash and cash equivalents, receivables, other current assets and current liabilities to approximate their fair value due to the short period of time between the origination of these instruments and the expected realization or payment.
For other financial instruments, including short- and long-term investments, restricted investments, and long-term debt, fair value is defined as the price that would be received to sell an asset or paid to transfer a liability in an orderly transaction between market participants at the measurement date. Assets and liabilities measured at fair value are classified using the following hierarchy, which is based upon the transparency of inputs to the valuation as of the measurement date.
Level 1—Quoted (unadjusted) prices for identical assets or liabilities in active markets: We include investments in cash, money market funds, U.S. government securities and the variable rate bond fund in Level 1. The carrying amounts of money market funds and cash approximate fair value because of the short-term nature of these instruments. We base fair values of the other investments included in Level 1 on unadjusted quoted market prices for identical securities in active markets.
F-32
Level 2—Inputs other than quoted prices in active markets: We include in Level 2 investments in certain certificates of deposit, commercial paper, corporate debt, asset-backed and other municipal securities for which fair market valuations are based on quoted prices for identical securities in markets that are not active, quoted prices for similar securities in active markets, broker or dealer quotations, or alternative pricing sources or for which all significant inputs are observable, either directly or indirectly, including interest rates and yield curves observable at commonly quoted intervals, volatilities, prepayment speeds, loss severities, credit risks and default rates.
In addition to using market data, we make assumptions when valuing our assets and liabilities, including assumptions about risks inherent in the inputs to the valuation technique. When there is not an observable market price for an identical or similar asset or liability, we use an income approach reflecting our best assumptions regarding expected cash flows, discounted using a commensurate risk-adjusted discount rate. We estimated the fair value of the future payments related to investigation resolution using a discounted cash flow analysis and recorded these amounts at fair value in the short- and long-term portions of amounts accrued related to investigation resolution line items in our consolidated balance sheets.
Level 3—Unobservable inputs that cannot be corroborated by observable market data: We hold investments in auction rate securities designated as available for sale and reported at fair value. At both December 31, 2017 and 2016, the auction rate securities had combined par values of $13.8 million. As these securities are believed to be in an inactive market, we have estimated the fair value of these securities using a discounted cash flow model and update these estimates on a quarterly basis. Significant unobservable inputs used in the discounted cash flow model include the projected average market coupon rate based on the indenture for each security, as well as individual security credit risk. The fair values of auction rate securities are based on an approach that relies heavily on management assumptions and qualitative observations and therefore fall within Level 3 of the fair value hierarchy. We include our auction rate security investments in Municipal securities below.
We determine transfers between levels at the end of the reporting period. No transfers between levels occurred during the years ended December 31, 2017 and 2016.
Recurring Fair Value Measurements
Assets and liabilities measured at fair value on a recurring basis at December 31, 2017 are as follows:
Fair Value Measurements Using | |||||||||||||||
Carrying Value | Quoted Prices in Active Markets for Identical Assets (Level 1) | Significant Other Observable Inputs (Level 2) | Significant Unobservable Inputs (Level 3) | ||||||||||||
Investments: | |||||||||||||||
Asset-backed securities | $ | 88.7 | $ | — | $ | 88.7 | $ | — | |||||||
Corporate debt securities | 400.1 | — | 400.1 | — | |||||||||||
Municipal securities | 222.8 | — | 210.5 | 12.3 | |||||||||||
Residential mortgage-backed securities | 11.2 | — | 11.2 | — | |||||||||||
Short-term time deposits | 300.4 | — | 300.4 | — | |||||||||||
Government and agency obligations | 147.5 | 147.5 | — | — | |||||||||||
Other securities | 65.0 | 52.8 | 12.2 | — | |||||||||||
Total investments | $ | 1,235.7 | $ | 200.3 | $ | 1,023.1 | $ | 12.3 | |||||||
Restricted investments: | |||||||||||||||
Cash | $ | 58.7 | $ | 58.7 | $ | — | $ | — | |||||||
Money market funds | 5.7 | 5.7 | — | — | |||||||||||
U.S. government securities and other | 146.6 | 146.4 | 0.2 | — | |||||||||||
Total restricted investments | $ | 211.0 | $ | 210.8 | $ | 0.2 | $ | — | |||||||
F-33
Assets and liabilities measured at fair value on a recurring basis at December 31, 2016 are as follows:
Fair Value Measurements Using | |||||||||||||||
Carrying Value | Quoted Prices in Active Markets for Identical Assets (Level 1) | Significant Other Observable Inputs (Level 2) | Significant Unobservable Inputs (Level 3) | ||||||||||||
Investments: | |||||||||||||||
Asset-backed securities | $ | 3.3 | $ | — | $ | 3.3 | $ | — | |||||||
Corporate debt securities | 67.2 | — | 67.2 | — | |||||||||||
Municipal securities | 52.3 | — | 39.9 | 12.4 | |||||||||||
Government and agency obligations | 1.0 | 1.0 | — | — | |||||||||||
Other securities | 57.7 | 57.7 | — | — | |||||||||||
Total investments | $ | 181.5 | $ | 58.7 | $ | 110.4 | $ | 12.4 | |||||||
Restricted investments: | |||||||||||||||
Money market funds | $ | 67.8 | $ | 67.8 | $ | — | $ | — | |||||||
Cash | 92.1 | 92.1 | — | — | |||||||||||
U.S. government securities and other | 74.4 | 74.2 | 0.2 | — | |||||||||||
Total restricted investments | $ | 234.3 | $ | 234.1 | $ | 0.2 | $ | — | |||||||
The following table presents the changes in the fair value of our Level 3 auction rate securities for the years ended December 31, 2017, 2016 and 2015:
Fair Value Measurements Using Significant Unobservable Inputs (Level 3) | |||||||||||
December 31, 2017 | December 31, 2016 | December 31, 2015 | |||||||||
Balance as of January 1 | $ | 12.4 | $ | 31.7 | $ | 32.3 | |||||
Realized gains (losses) in earnings | — | — | — | ||||||||
Changes in net unrealized gains and losses in other comprehensive income | — | 0.9 | (0.5 | ) | |||||||
Purchases, sales and redemptions | (0.1 | ) | (20.2 | ) | (0.1 | ) | |||||
Net transfers in or (out) of Level 3 | — | — | — | ||||||||
Balance as of December 31 | $ | 12.3 | $ | 12.4 | $ | 31.7 | |||||
Debt
The following table presents the carrying value and fair value of our long-term debt outstanding as of December 31, 2017 and December 31, 2016:
Fair Value Measurements Using | |||||||||||||||
Carrying Value | Quoted Prices in Active Markets for Identical Assets (Level 1) | Significant Other Observable Inputs (Level 2) | Significant Unobservable Inputs (Level 3) | ||||||||||||
Long-term debt - December 31, 2017 | $ | 1,182.4 | $ | 1,274.3 | $ | — | $ | — | |||||||
Long-term debt - December 31, 2016 | 997.6 | 927.0 | 96.2 | — | |||||||||||
F-34
The fair value of both our 2025 Notes and 2020 Notes was determined based on quoted market prices; therefore, would be classified within Level 1 of the fair value hierarchy. The fair value of obligations outstanding under our Revolving Credit Facility was determined based on a discounted cash flow analysis, utilizing current rates estimated to be available to us for debt of similar terms and remaining maturities; therefore, these would be classified within Level 2 of the fair value hierarchy. There were no borrowings outstanding under our Revolving Credit Facility as of December 31, 2017.
12. MEDICAL BENEFITS PAYABLE
Medical benefits payable consists of:
(in millions) | As of December 31, 2017 | % of Total | As of December 31, 2016 | % of Total | |||||||
IBNR | $ | 1,412.3 | 66% | $ | 1,141.9 | 68% | |||||
Other medical benefits payable | 734.0 | 34% | 548.6 | 32% | |||||||
Total medical benefits payable | $ | 2,146.3 | 100% | $ | 1,690.5 | 100% | |||||
A reconciliation of the beginning and ending balances of our consolidated medical benefits payable is as follows:
For the years ended December 31, | |||||||||||
2017 | 2016 | 2015 | |||||||||
(in millions) | |||||||||||
Beginning balance | $ | 1,690.5 | $ | 1,536.0 | $ | 1,483.8 | |||||
Acquisitions (divestitures) | 128.1 | 37.3 | (9.5 | ) | |||||||
Medical benefits incurred related to: | |||||||||||
Current year (1) | 15,112.4 | 12,374.1 | 12,189.5 | ||||||||
Prior years | (367.6 | ) | (284.7 | ) | (211.0 | ) | |||||
Total | 14,744.8 | 12,089.4 | 11,978.5 | ||||||||
Medical benefits paid related to: | |||||||||||
Current year | (13,355.9 | ) | (10,925.0 | ) | (10,763.0 | ) | |||||
Prior years | (1,061.2 | ) | (1,047.2 | ) | (1,153.8 | ) | |||||
Total | (14,417.1 | ) | (11,972.2 | ) | (11,916.8 | ) | |||||
Ending balance | $ | 2,146.3 | $ | 1,690.5 | $ | 1,536.0 | |||||
(1)-Incurred amounts for 2017 include the $45.6 million Illinois PDR discussed further in Note 2 - Summary of Significant Accounting Policies.
Medical benefits payable recorded developed favorably by approximately $367.6 million, $284.7 million, and $211.0 million in 2017, 2016 and 2015, respectively. The release of the provision for moderately adverse conditions included in our prior year estimates was substantially offset by the provision for moderately adverse conditions established for claims incurred in the current year. Accordingly, the favorable development in our estimate of medical benefits payable related to claims incurred in prior years does not directly correspond to a decrease in medical benefits expense recognized during the period in which the favorable development is recognized.
F-35
Excluding the prior year development related to the release of the provision for moderately adverse conditions, our estimates of consolidated medical benefits expense recorded developed favorably by approximately $224.6 million, $154.3 million, and $78.1 million in 2017, 2016, and 2015, respectively. Such amounts are net of the development relating to refunds due to government customers in connection with minimum loss ratio provisions. The net favorable development recognized in both 2017 and 2016 was primarily in our Medicaid Health Plans segment and, to a lesser extent, in our Medicare Health Plans segment. The net favorable development resulted primarily due to a number of operational and clinical initiatives planned and executed, throughout both 2015 and 2016, that contributed to lower than expected pharmacy and medical trends, and actual claim submission time being faster than we originally assumed (i.e. our completion factors were higher than we originally assumed) in establishing our medical benefits payable in the prior years. This development does not directly correspond to an increase in our current year operating results as these reductions were offset by estimated current period medical benefits expense when we established our estimate of the current year medical benefits payable. Both completion factor and medical trend assumptions are influenced by utilization levels, unit costs, mix of business, provider reimbursement levels, processing system conversions and changes, claim inventory levels, claim processing patterns, our ability and practices to manage medical and pharmaceutical costs, claim submission patterns and operational changes resulting from business combinations, among others. Our actual costs were ultimately less than expected. The favorable development recognized in 2015 was primarily due to lower than expected utilization in our Medicaid Health Plans segment.
Our Universal American acquisition, in 2017, and our Care1st Arizona acquisition, in 2016, resulted in increases to medical benefits payable as of the effective date of each acquisition. A business divestiture in 2015 resulted in an immaterial decrease to medical benefits expense as of the effective date of the divestiture. See Note 3 - Acquisitions, for additional discussion of our 2016 and 2017 acquisitions.
Incurred and paid claims development
The following is information about incurred and paid claims development, by segment and consolidated, as of December 31, 2017, 2016 and 2015, net of reinsurance, as well as cumulative claim frequency and the total of incurred-but-not-reported liabilities plus expected development on reported claims included within the net incurred claims amounts. The reported cumulative claims below represent billed services rendered to health plan members that are submitted for payment according to industry standards.
Medicaid Health Plans
A reconciliation of the beginning and ending balances of our Medicaid Health Plans medical benefits payable is as follows:
For the years ended December 31, | |||||||||||
2017 | 2016 | 2015 | |||||||||
(in millions) | |||||||||||
Beginning balance | $ | 1,135.8 | $ | 1,040.2 | $ | 957.8 | |||||
Acquisitions | — | 37.3 | — | ||||||||
Medical benefits incurred related to: | |||||||||||
Current year (1) | 9,612.2 | 8,404.2 | 8,012.4 | ||||||||
Prior years | (198.1 | ) | (215.7 | ) | (145.6 | ) | |||||
Total | 9,414.1 | 8,188.5 | 7,866.8 | ||||||||
Medical benefits paid related to: | |||||||||||
Current year | (8,417.4 | ) | (7,431.4 | ) | (7,042.0 | ) | |||||
Prior years | (759.3 | ) | (698.8 | ) | (742.4 | ) | |||||
Total | (9,176.7 | ) | (8,130.2 | ) | (7,784.4 | ) | |||||
Ending balance | $ | 1,373.2 | $ | 1,135.8 | $ | 1,040.2 | |||||
(1)-Incurred amounts for 2017 include the $45.6 million Illinois PDR discussed further in Note 2 - Summary of Significant Accounting Policies.
F-36
The following tables provide information about incurred and paid claims development for our Medicaid Health Plans segment as of December 31, 2017, net of reinsurance.
Incurred Claims and Allocated Claim Adjustment Expenses, Net of Reinsurance | As of December 31, 2017 | |||||||||||||
Incurred amount | Total of IBNR Liabilities Plus Expected Development on Reported Claims | Cumulative Number of Reported Claims | ||||||||||||
Incurred Year | 2016 | 2017 | ||||||||||||
2016(1) | $ | 8,437.4 | $ | 8,258.2 | $ | 93.2 | 61.6 | |||||||
2017(2) | 9,607.8 | 1,190.4 | 67.5 | |||||||||||
Total | $ | 17,866.0 | ||||||||||||
(1) - Incurred amounts for 2016 include $37.3 million of medical benefits payable liabilities, net of a $4.1 million reinsurance receivable, acquired from Care1st Arizona. Refer to Note 3 – Acquisitions for additional discussion of the Care1st Arizona acquisition.
(2) - Incurred amounts for 2017 are net of a $4.6 million reinsurance receivable.
Cumulative Paid Claims and Allocated Claim Adjustment Expenses, Net of Reinsurance | ||||||||
Incurred Year | 2016 | 2017 | ||||||
2016 | $ | (7,431.4 | ) | $ | (8,165.0 | ) | ||
2017 | (8,417.4 | ) | ||||||
Total | $ | (16,582.4 | ) | |||||
All outstanding liabilities before 2016, net of reinsurance | 85.0 | |||||||
Liabilities for claims and claim adjustment expenses, net of reinsurance | $ | 1,368.6 | ||||||
Medicare Health Plans
A reconciliation of the beginning and ending balances of our Medicare Health Plans medical benefits payable is as follows:
For the years ended December 31, | |||||||||||
2017 | 2016 | 2015 | |||||||||
(in millions) | |||||||||||
Beginning balance | $ | 510.0 | $ | 473.9 | $ | 461.3 | |||||
Acquisitions (divestitures) | 128.1 | — | (9.5 | ) | |||||||
Medical benefits incurred related to: | |||||||||||
Current year | 4,676.8 | 3,332.9 | 3,445.2 | ||||||||
Prior years | (99.5 | ) | (54.4 | ) | (43.5 | ) | |||||
Total | 4,577.3 | 3,278.5 | 3,401.7 | ||||||||
Medical benefits paid related to: | |||||||||||
Current year | (4,164.6 | ) | (2,901.3 | ) | (3,011.0 | ) | |||||
Prior years | (328.3 | ) | (341.1 | ) | (368.6 | ) | |||||
Total | (4,492.9 | ) | (3,242.4 | ) | (3,379.6 | ) | |||||
Ending balance | $ | 722.5 | $ | 510.0 | $ | 473.9 | |||||
F-37
The following tables provide information about incurred and paid claims development for our Medicare Health Plans segment as of December 31, 2017, net of reinsurance. Incurred and paid claims development for the years ended December 31, 2017 and 2016 have been retrospectively adjusted for the 2017 acquisition of Universal American.
Incurred Claims and Allocated Claim Adjustment Expenses, Net of Reinsurance | As of December 31, 2017 | |||||||||||||
Incurred amount | Total of IBNR Liabilities Plus Expected Development on Reported Claims | Cumulative Number of Reported Claims | ||||||||||||
Incurred Year | 2016 | 2017 | ||||||||||||
2016 | $ | 4,487.4 | $ | 4,402.2 | $ | 19.4 | 25.1 | |||||||
2017 (1) | 5,405.5 | 639.8 | 30.4 | |||||||||||
Total | $ | 9,807.7 | ||||||||||||
(1) Incurred amounts for 2017 are net of a $0.9 million reinsurance receivable acquired from Universal American. Refer to Note 3 – Acquisitions for additional discussion of the Universal American acquisition.
Cumulative Paid Claims and Allocated Claim Adjustment Expenses, Net of Reinsurance | ||||||||
Incurred Year | 2016 | 2017 | ||||||
2016 | $ | (3,998.6 | ) | $ | (4,382.8 | ) | ||
2017 | (4,765.7 | ) | ||||||
Total | $ | (9,148.5 | ) | |||||
All outstanding liabilities before 2016, net of reinsurance | 62.4 | |||||||
Liabilities for claims and claim adjustment expenses, net of reinsurance | $ | 721.6 | ||||||
Medicare PDPs
A reconciliation of the beginning and ending balances of our Medicare PDPs medical benefits payable is as follows:
For the years ended December 31, | |||||||||||
2017 | 2016 | 2015 | |||||||||
(in millions) | |||||||||||
Beginning balance | $ | 44.7 | $ | 21.9 | $ | 64.7 | |||||
Acquisitions (divestitures) | — | — | — | ||||||||
Medical benefits incurred related to: | |||||||||||
Current year | 823.4 | 637.0 | 731.9 | ||||||||
Prior years | (70.0 | ) | (14.6 | ) | (21.9 | ) | |||||
Total | 753.4 | 622.4 | 710.0 | ||||||||
Medical benefits paid related to: | |||||||||||
Current year | (773.9 | ) | (592.3 | ) | (710.0 | ) | |||||
Prior years | 26.4 | (7.3 | ) | (42.8 | ) | ||||||
Total | (747.5 | ) | (599.6 | ) | (752.8 | ) | |||||
Ending balance | $ | 50.6 | $ | 44.7 | $ | 21.9 | |||||
F-38
The following tables provide information about incurred and paid claims development for our Medicare PDPs segment as of December 31, 2017, net of reinsurance.
Incurred Claims and Allocated Claim Adjustment Expenses, Net of Reinsurance | As of December 31, 2017 | |||||||||||||
Incurred amount | Total of IBNR Liabilities Plus Expected Development on Reported Claims | Cumulative Number of Reported Claims | ||||||||||||
Incurred Year | 2016 | 2017 | ||||||||||||
2016 | $ | 637.0 | $ | 566.7 | $ | — | 47.8 | |||||||
2017 | 823.4 | 49.5 | 51.3 | |||||||||||
Total | $ | 1,390.1 | ||||||||||||
Cumulative Paid Claims and Allocated Claim Adjustment Expenses, Net of Reinsurance | |||||||||
Incurred Year | 2016 | 2017 | |||||||
2016 | $ | (592.3 | ) | $ | (566.7 | ) | |||
2017 | (773.9 | ) | |||||||
Total | $ | (1,340.6 | ) | ||||||
All outstanding liabilities before 2016, net of reinsurance | 1.1 | ||||||||
Liabilities for claims and claim adjustment expenses, net of reinsurance | $ | 50.6 | |||||||
Consolidated
The following tables provide information about the consolidated company incurred and paid claims development as of December 31, 2017, net of reinsurance. The information for 2017 and 2016 has been retrospectively adjusted for our Universal American acquisition.
Incurred Claims and Allocated Claim Adjustment Expenses, Net of Reinsurance | As of December 31, 2017 | ||||||||||||||
Incurred amount | Total of IBNR Liabilities Plus Expected Development on Reported Claims | Cumulative Number of Reported Claims | |||||||||||||
Incurred Year | 2016 | 2017 | |||||||||||||
2016(1) | $ | 13,561.8 | $ | 13,227.1 | $ | 112.6 | 134.5 | ||||||||
2017(2) | 15,836.7 | 1,879.7 | 149.2 | ||||||||||||
Total | $ | 29,063.8 | |||||||||||||
(1) - Incurred amounts for 2016 include $37.3 million of medical benefits payable liabilities, net of a $4.1 million reinsurance receivable, acquired from Care1st Arizona. Refer to Note 3 – Acquisitions for additional discussion of the Care1st Arizona acquisition.
(2) - Incurred amounts for 2017 include the $45.6 million Illinois PDR discussed further in Note 2 - Summary of Significant Accounting Policies. Additionally, incurred amounts for 2017 are net of a $5.5 million reinsurance recoverable.
Cumulative Paid Claims and Allocated Claim Adjustment Expenses, Net of Reinsurance | ||||||||
Incurred Year | 2016 | 2017 | ||||||
2016 | $ | (12,022.3 | ) | $ | (13,114.5 | ) | ||
2017 | (13,957.0 | ) | ||||||
Total | $ | (27,071.5 | ) | |||||
All outstanding liabilities before 2016, net of reinsurance | 148.5 | |||||||
Liabilities for claims and claim adjustment expenses, net of reinsurance | $ | 2,140.8 | ||||||
F-39
The reconciliation of the net incurred and paid claims development tables, by segment, to the liability for claims and claim adjustment expenses in the consolidated balance sheets is as follows.
Reconciliation of the Disclosure of Incurred and Paid Claims Development to the Liability for Unpaid Claims and Claim Adjustment Expenses | ||||
December 31, 2017 | ||||
Net Outstanding Liabilities | ||||
Medicaid Health Plans | $ | 1,368.6 | ||
Medicare Health Plans | 721.6 | |||
Medicare PDPs | 50.6 | |||
Liabilities for unpaid claims and claim adjustment expenses, net of reinsurance | $ | 2,140.8 | ||
Reinsurance Recoverable | 5.5 | |||
Total gross liability for unpaid claims and claim adjustment expense | $ | 2,146.3 | ||
13. COMMITMENTS AND CONTINGENCIES
Indemnification Obligations
Under Delaware law, our charter and bylaws and certain indemnification agreements to which we are a party, we are obligated to indemnify, or we have otherwise agreed to indemnify, certain of our current and former directors, officers and associates with respect to current and future investigations and litigation, including the matters discussed in this note. The indemnification agreements for our directors and executive officers with respect to events occurring prior to May 2009 require us to indemnify an indemnitee to the fullest extent permitted by law if the indemnitee was or is or becomes a party to or a witness or other participant in any proceeding by reason of any event or occurrence related to the indemnitee's status as a director, officer, associate, agent or fiduciary of the Company or any of our subsidiaries. The indemnification agreements require us to indemnify an indemnitee against all expenses, including attorney's fees, judgments, fines, settlement amounts and interest and other charges, and any taxes as a result of the receipt of payments under the indemnification agreement. We will not indemnify the indemnitee if not permitted under applicable law. We are required to advance all expenses incurred by the indemnitee. We are entitled to reimbursement by an indemnitee of expenses advanced if the indemnitee is not permitted to be reimbursed under applicable law after a final judicial determination is made and all rights of appeal have been exhausted or lapsed.
We amended and restated our indemnification agreements in May 2009. The revised agreements apply to our officers and directors with respect to events occurring after that time. Pursuant to the 2009 indemnification agreements, we will indemnify the indemnitee against all expenses, including attorney's fees, judgments, penalties, fines, settlement amounts and any taxes imposed as a result of payments made under the indemnification agreement incurred in connection with any proceedings that relate to the indemnitee's status as a director, officer or associate of the Company or any of our subsidiaries or any other enterprise that the indemnitee was serving at our request. We will also indemnify for expenses incurred by an indemnitee if the indemnitee, by reason of his or her corporate status, is a witness in any proceeding. Further, we are required to indemnify for expenses incurred by an indemnitee in defense of a proceeding to the extent the indemnitee has been successful on the merits or otherwise. Finally, if the indemnitee is involved in certain proceedings as a result of the indemnitee's corporate status, we are required to advance the indemnitee's reasonable expenses incurred in connection with such proceeding, subject to the requirement that the indemnitee repay the expenses if it is ultimately determined that the indemnitee is not entitled to be indemnified. We are not obligated to indemnify an indemnitee for losses incurred in connection with any proceeding if a determination has not been made by the Board of Directors, a committee of disinterested directors or independent legal counsel in the specific case that the indemnitee has satisfied any standards of conduct required as a condition to indemnification under Section 145 of the Delaware General Corporation Law.
F-40
Pursuant to our obligations, we have advanced legal fees and related expenses to three former officers and two additional associates who were criminally indicted in connection with the government investigations of the Company that commenced in 2007 related to federal criminal health care fraud charges including conspiracy to defraud the United States, false statements relating to health care matters, and health care fraud in connection with their defense of criminal charges. In June 2013, the jury in the federal criminal trial reached guilty verdicts on multiple charges for the four individuals that were tried in 2013. In May 2014, the individuals were sentenced and our request for restitution was denied. All four individuals filed notices of appeal and the government filed notices of cross appeal on three of the four individuals, which the government has subsequently voluntarily dismissed. The appellate court affirmed the convictions in August 2016. Mr. Farha filed a petition for a writ of certiorari to the United States Supreme Court in January 2017. In April 2017, the United States Supreme Court declined to hear the appeal by Mr. Farha. The fifth individual, Mr. Bereday, entered a guilty plea in June 2017 in connection with the federal criminal charges, which was accepted by the court in July 2017. Mr. Bereday was sentenced in November 2017.
We have also previously advanced legal fees and related expenses to these five individuals regarding a dispute in Delaware Chancery Court related to whether we were legally obligated to advance fees or indemnify certain of these individuals; the class actions titled Eastwood Enterprises, L.L.C. v. Farha, et al. and Hutton v. WellCare Health Plans, Inc. et al. filed in federal court; six stockholder derivative actions filed in federal and state courts between October 2007 and January 2008; an investigation by the United States Securities & Exchange Commission (the "Commission"); and an action by the Commission filed in January 2012 against three of the five individuals, Messrs. Farha, Behrens and Bereday and a qui tam action against Messrs. Farha, Behrens and Bereday in federal court. We settled the class actions in May 2011. In 2010, we settled the stockholder derivative actions and we were realigned as the plaintiff to pursue our claims against Messrs. Farha, Behrens and Bereday. Pursuant to the settlement agreements described below, Messrs. Farha, Behrens and Bereday were dismissed from the federal court and state derivative actions. Pursuant to the settlement agreement with Mr. Bereday described below, Mr. Bereday was dismissed from the fee advancement case in Delaware Chancery Court. The Commission action and the qui tam action are currently stayed. The terms of the stay in the qui tam action provide that it will be lifted on February 20, 2018.
In April 2017, the Commission and Mr. Farha entered into a consent judgment to pay $12.5 million to the Commission and $7.5 million to us. In April 2017, the Commission and Mr. Behrens also entered into a consent judgment to pay $4.5 million to the Commission and $1.5 million to us. In December 2017, the Commission and Mr. Bereday filed a proposed consent judgment for Mr. Bereday to pay $4.5 million to the Commission. The Court has not yet ruled on the proposed judgment.
In addition, we have advanced a portion of the legal fees and related expenses to Mr. Farha in connection with lawsuits he filed in Delaware and Florida state court to have certain restrictions lifted on WellCare stock purportedly awarded to him during his employment with us. The Delaware and Florida state court matters have been dismissed.
In September 2016, we entered into a settlement agreement with Mr. Farha pursuant to which he paid us $7.5 million as referenced in the April 2017 consent judgment with the Commission, and we agreed that we would not seek to recover additional legal fees previously advanced related to these matters, and that our obligation to continue advancing fees would be limited to no more than an additional $7.5 million.
We also have advanced a portion of the legal fees and related expenses to Mr. Behrens in connection with his lawsuit in Delaware state court to have certain restrictions lifted on WellCare stock purportedly awarded to him during his employment with WellCare, which the court dismissed. In October 2016, we also entered into a settlement agreement with Mr. Behrens pursuant to which he paid us $1.5 million as referenced in the April 2017 consent judgment with the Commission, and we agreed that we would not seek to recover additional legal fees previously advanced in connection with these matters, and that our obligation to continue advancing fees would be limited to no more than an additional $1.5 million.
In June 2017, we entered into a settlement agreement with Mr. Bereday that became effective in July 2017, pursuant to which we agreed that we would not seek to recover legal fees previously advanced in connection with these matters, and that our obligation to continue advancing fees would be limited to no more than an additional $2.5 million.
In connection with these matters, we have advanced to the five individuals, cumulative legal fees and related expenses of approximately $236.2 million from the inception of the investigations through December 31, 2017. We incurred $6.4 million, $18.7 million and $25.2 million of these legal fees and related expenses during the years ended December 31, 2017, 2016 and 2015, respectively. These fees are not inclusive of the amounts recovered from Mr. Farha and Mr. Behrens discussed above. We expense these costs as incurred and classify the costs as selling, general and administrative expense incurred in connection with the investigations and related matters.
F-41
We have exhausted our insurance policies related to reimbursement of our advancement of fees related to these matters. We are unable to estimate the total amount of these costs or a range of possible loss. Accordingly, we continue to expense these costs as incurred.
Other Lawsuits and Claims
Based on the nature of our business, we are subject to regulatory reviews or other investigations by various state insurance and health care regulatory authorities and other state and federal regulatory authorities. These authorities regularly scrutinize the business practices of health insurance and benefits companies and their reviews focus on numerous facets of our business, including claims payment practices, provider contracting, competitive practices, commission payments, privacy issues and utilization management practices, among others. Some of these reviews have historically resulted in fines imposed on us and some have required changes to our business practices. We continue to be subject to such reviews, which may result in additional fines and/or sanctions being imposed, premium refunds or additional changes in our business practices.
Separate and apart from the legal matters described above, we are also involved in other legal actions in the normal course of our business, including, without limitation, protests and appeals related to Medicaid procurement awards, wage and hour claims and other employment claims, claims for indemnification under purchase agreements, vendor disputes and provider disputes regarding payment of claims. Some of these actions seek monetary damages including claims for liquidated or punitive damages, which are not covered by insurance. We review relevant information with respect to these litigation matters and we update our estimates of reasonably possible losses and related disclosures. We accrue an estimate for contingent liabilities, including attorney's fees related to these matters, if a loss is probable and estimable. Currently, we do not expect that the resolution of any of these currently pending actions, either individually or in the aggregate, will differ materially from our current estimates or have a material adverse effect on our results of operations, financial condition and cash flows. However, the outcome of any legal actions cannot be predicted, and therefore, actual results may differ from those estimates.
Operating Leases
We recorded rental expense of $35.1 million, $30.7 million, and $30.0 million for the years ended December 31, 2017, 2016 and 2015, respectively, related to our operating leases for office space. Future minimum lease payments under non-cancelable operating leases with initial or remaining lease terms in excess of one year at December 31, 2017 are as follows:
Minimum Lease Payments | |||
2018 | $ | 31.1 | |
2019 | 26.2 | ||
2020 | 24.1 | ||
2021 | 21.3 | ||
2022 | 17.7 | ||
2023 and thereafter | 50.1 | ||
Total | $ | 170.5 | |
F-42
14. INCOME TAXES
The Company and subsidiaries file a consolidated federal income tax return, combined state income tax returns, and separate state franchise, income and premium tax returns, as applicable. The following table provides components of income tax expense (benefit):
For the Years Ended December 31, | |||||||||||
2017 | 2016 | 2015 | |||||||||
Current: | |||||||||||
Federal | $ | 120.8 | $ | 251.6 | $ | 161.2 | |||||
State | 14.2 | 24.2 | 11.3 | ||||||||
135.0 | 275.8 | 172.5 | |||||||||
Deferred: | |||||||||||
Federal | (48.3 | ) | 12.8 | 42.9 | |||||||
State | 1.2 | (1.2 | ) | 2.1 | |||||||
(47.1 | ) | 11.6 | 45.0 | ||||||||
Total income tax expense | $ | 87.9 | $ | 287.4 | $ | 217.5 | |||||
A reconciliation of income tax at the statutory federal rate (currently 35% for the tax years presented) to income tax at the effective rate is as follows:
For the Years Ended December 31, | |||||||||||
2017 | 2016 | 2015 | |||||||||
Income tax expense at statutory federal rate | $ | 161.6 | $ | 185.3 | $ | 117.6 | |||||
Adjustments resulting from: | |||||||||||
State income tax, net of federal benefit | 11.7 | 14.4 | 9.5 | ||||||||
Unrecognized tax benefits | (23.5 | ) | 9.5 | 3.5 | |||||||
Tax rate change | (56.1 | ) | — | — | |||||||
Non-deductible ACA industry fees | — | 79.9 | 79.6 | ||||||||
Other, net | (5.8 | ) | (1.7 | ) | 7.3 | ||||||
Total income tax expense | $ | 87.9 | $ | 287.4 | $ | 217.5 | |||||
Our effective income tax rate on pre-tax income was 19.0% for the year ended December 31, 2017, compared with 54.3% and 64.7% for the years ended December 31, 2016 and 2015, respectively. The rate decline during 2017 was primarily driven by the tax rate change resulting from the enactment of the Tax Cuts and Jobs Act of 2017 (the "TCJA”) during 2017, discussed below; the one-year moratorium on the non-deductible ACA industry fee for 2017; higher excess tax benefits resulting from the settlement of stock-compensation awards in 2017; and the favorable effect of the recognition of certain previously unrecognized tax benefits during 2017.
On December 22, 2017, President Trump signed the TCJA into legislation which, among other things, reduced the federal income tax rate for corporations from 35% to 21% effective on January 1, 2018. We are required to recognize the effect on deferred tax assets and liabilities of a change in tax rates in the period the tax rate change was enacted. We currently expect the enacted reduction in the U.S. corporate income tax rate, as well as other aspects of the new law, to result in a one-time, non-cash decrease to income tax expense of $56.1 million for the year ended December 31, 2017.
The SEC staff issued Staff Accounting Bulletin No. 118 (“SAB 118”), which provides guidance on accounting for the tax effects of the TCJA. SAB 118 provides a measurement period that should not extend beyond one year from the TCJA enactment date for companies to complete the accounting relating to the TCJA under ASC 740. In accordance with SAB 118, a company must reflect the income tax effects of those aspects of the TCJA for which the accounting under ASC 740 is complete. To the extent that a company’s accounting for certain income tax effects of the TCJA is incomplete but it is able to determine a
F-43
reasonable estimate, it must record a provisional estimate in its financial statements. If a company cannot determine a provisional estimate to be included in its financial statements, it should continue to apply ASC 740 on the basis of the provisions of the tax laws that were in effect immediately before the enactment of the TCJA.
In connection with our initial analysis of the impact of the TCJA, we have recorded a provisional amount of net tax benefit of $56.1 million in the year ended December 31, 2017, related to the remeasurement of our deferred tax assets and liabilities and other effects. For various reasons including those discussed below, we have not fully completed our accounting for the income tax effects of the TCJA. As we were able to make reasonable estimates of the effects of the TCJA, we recorded provisional amounts. In connection with the adoption of the TCJA, we:
• | Remeasured certain deferred tax assets and liabilities based on the rates at which they are expected to reverse in the future, which is generally at a federal rate of 21%. However, we are still analyzing certain aspects of the TCJA and refining our calculations, which could potentially affect the measurement of these balances or potentially give rise to new deferred tax amounts. Our financial statements include provisional amounts for the effects of deferred tax revaluation. |
• | Evaluated the future deductibility of executive compensation due to the elimination of the performance-based exception as well as the modification of who is treated as a covered person in connection with limiting the deduction. As part of the TCJA, there is a transition rule for written, binding contracts in place prior to November 2, 2017 related to executive compensation, that have not been modified in any material respect. Further guidance is needed to determine the entire effect of these provisions. Our financial statements include provisional amounts for the effects of the changes to the deductibility of executive compensation. |
Once we finalize certain tax positions, we will be able to conclude whether any further adjustments are required to the net deferred tax liability balance. Any adjustments to these provisional amounts will be reported as a component of tax expense (benefit) in the reporting period in which any such adjustments are determined, which should be no later than the fourth quarter of 2018.
Significant components of our deferred tax assets and liabilities are:
As of December 31, | |||||||
Deferred tax assets: | 2017 | 2016 | |||||
Net operating losses | $ | 24.7 | $ | 11.2 | |||
Foreign tax credits | 22.0 | — | |||||
Medical and other benefits discounting | 18.7 | 15.2 | |||||
Allowance for doubtful accounts | 14.8 | 19.2 | |||||
Stock-based compensation | 14.1 | 15.5 | |||||
Unearned premium discounting | 3.1 | 0.2 | |||||
Capital losses | 9.9 | — | |||||
Premium deficiency reserve | 10.7 | — | |||||
Accrued expenses and other | 5.6 | 11.3 | |||||
Total deferred tax assets | 123.6 | 72.6 | |||||
Valuation allowance | (48.5 | ) | (8.8 | ) | |||
Net deferred tax assets | 75.1 | 63.8 | |||||
Deferred tax liabilities: | |||||||
Goodwill and other intangible assets | (101.1 | ) | (47.3 | ) | |||
Software development costs and property and equipment | (56.7 | ) | (68.0 | ) | |||
Prepaid assets | (10.7 | ) | (11.9 | ) | |||
Total deferred tax liabilities | (168.5 | ) | (127.2 | ) | |||
Net deferred tax liability | $ | (93.4 | ) | $ | (63.4 | ) | |
The net deferred tax liability is calculated at 23.4% and 37% at December 31, 2017 and 2016, respectively, as the result of the TCJA.
F-44
Valuation allowances are provided when it is considered more-likely-than-not that deferred tax assets will not be realized. The valuation allowances relate to future benefits on certain state net operating loss carryforwards, capital loss carryforwards, and foreign tax credits which expire beginning with the 2018 tax year through 2037. As we were within the initial measurement period for the acquisition of Universal American, approximately $39.3 million of the valuation allowances recorded in 2017 were recorded as an adjustment to the opening balance sheet. These valuation allowances were subsequently revalued as a result of the TCJA to approximately $34.9 million.
A reconciliation of the beginning and ending amount of unrecognized tax benefits is as follows:
Years Ended December 31, | |||||||
2017 | 2016 | ||||||
Unrecognized tax benefits, beginning of period | $ | 23.5 | $ | 14.0 | |||
Increases: | |||||||
Prior year tax positions | — | 0.7 | |||||
Current year tax positions | 3.5 | 11.4 | |||||
Decreases: | |||||||
Prior year tax positions | (23.5 | ) | (2.6 | ) | |||
Unrecognized tax benefits, end of period | $ | 3.5 | $ | 23.5 | |||
During April 2017, the IRS completed its audit of our 2015 consolidated income tax return, which effectively settled the 2015 tax year resulting in reversals of prior liabilities for unrecognized tax benefits in the amount of $4.9 million. In August 2017, the IRS approved our prior year refund claim with respect to this Internal Revenue Code section 162(m)(6) uncertain tax position. Based on our ongoing assessments of more-likely-than-not outcomes, this position was effectively settled for all years. The effect of the settlement regarding the current and prior year positions was recognized as a further reduction of income tax expense in the amount of $18.6 million.
We do not believe it is reasonably possible that our liability for unrecognized tax benefits will decrease in the next 12 months as a result of audit settlements.
We file our income tax returns in the U.S. federal jurisdiction and various states. We currently participate in the Compliance Assurance Program ("CAP") with the IRS, excluding the 2017 tax year. Under CAP, the IRS undertakes audit procedures during the tax year and as the return is prepared for filing. The IRS has concluded its CAP review of our 2015 tax return as well as all the prior years. We are no longer subject to state and local tax examinations prior to 2012. As of December 31, 2017, we are not aware of any material proposed adjustments.
15. STOCK-BASED COMPENSATION
We recorded stock-based compensation expense of $59.8 million, $35.5 million and $20.2 million for the years ended December 31, 2017, 2016, and 2015, respectively. The increase in 2017 was primarily driven by the increase in our closing stock price from $137.08 as of December 31, 2016 to $201.11 as of December 31, 2017, which had the effect of increasing cumulative compensation expense recognized for our PSUs subject to variable accounting.
As of December 31, 2017, we expect $63.1 million of unrecognized compensation cost related to non-vested stock-based compensation arrangements, net of estimated forfeitures, to be recognized over a weighted-average period of 1.8 years. The unrecognized compensation cost for our PSUs subject to variable accounting was determined based on the closing common stock price as of December 31, 2017 and amounted to approximately $19.9 million of the total unrecognized compensation cost. Due to the nature of the accounting for these awards, future compensation cost will fluctuate based on changes in our common stock price.
F-45
The weighted-average grant-date fair values of shares granted during the years ended December 31, 2017, 2016 and 2015 were $139.49, $100.07 and $97.69, respectively. The total fair value of all shares vested during the year ended December 31, 2017 was $49.0 million. We generally repurchase vested shares from our employees to satisfy our tax withholding requirements at the statutory minimum, and then retire the repurchased shares.
Restricted Stock Units
A summary of the activity for our RSU awards for the year ended December 31, 2017 is presented in the table below.
RSUs | Weighted Average Grant-Date Fair Value | |||||
Outstanding as of January 1, 2017 | 275,926 | $ | 90.08 | |||
Granted | 147,884 | 144.25 | ||||
Vested | (134,641 | ) | 85.14 | |||
Forfeited | (14,526 | ) | 107.16 | |||
Outstanding as of December 31, 2017 | 274,643 | $ | 120.73 | |||
Performance Stock Units
A summary of the activity for our PSU awards for the year ended December 31, 2017 is presented in the table below.
PSUs | Weighted Average Award-Issuance Fair Value | |||||
Outstanding as of January 1, 2017 | 471,852 | $ | 89.68 | |||
Granted | 234,609 | 146.98 | ||||
Vested | (126,505 | ) | 63.93 | |||
Forfeited and expired | (27,338 | ) | 109.84 | |||
Outstanding as of December 31, 2017 | 552,618 | $ | 118.64 | |||
Market Stock Units
A summary of the activity for our MSU awards for the year ended December 31, 2017 is presented in the table below.
MSUs | Weighted Average Grant-Date Fair Value | |||||
Outstanding as of January 1, 2017 | 85,910 | $ | 103.83 | |||
Granted | 36,009 | 71.50 | ||||
Vested | (74,471 | ) | 71.90 | |||
Forfeited and expired | (2,218 | ) | 130.74 | |||
Outstanding as of December 31, 2017 | 45,230 | $ | 130.01 | |||
F-46
16. RELATED-PARTY TRANSACTIONS
The Graham Companies
Until February 2016, we leased office space from The Graham Companies, in which a former member of the board of directors and his immediate family have an ownership interest. We paid $0.2 million in rental expense to The Graham Companies in the year ended December 31, 2015. This director's term on our board of directors expired in May 2016 and payments made in 2016 to the affiliated company prior to his departure were immaterial.
17. REGULATORY CAPITAL AND DIVIDEND RESTRICTIONS
Each of our health maintenance organizations ("HMO") and insurance subsidiaries must maintain a minimum amount of statutory capital determined by statute or regulation. The minimum statutory capital requirements differ by state and are generally based on a percentage of annualized premium revenue, a percentage of annualized health care costs, a percentage of certain liabilities, a statutory minimum, risk-based capital ("RBC") requirements or other financial ratios. Failure to maintain these requirements would trigger regulatory action by the state. Such statues, regulations and capital requirements also restrict the timing, payment and amount of dividends and other distributions that may be paid to us as the sole stockholder. Based upon current statutes and regulations, the minimum capital and surplus requirement, or net assets, for these subsidiaries that may not be transferable to us in the form of loans, advances or cash dividends was approximately $1.2 billion at December 31, 2017 and $871.8 million at December 31, 2016. The combined statutory capital and surplus of our HMO and insurance subsidiaries was $2.0 billion and $1.7 billion at December 31, 2017 and 2016, respectively, which was in compliance with the minimum capital requirements as of those dates. These increases resulted from the Universal American acquisition in 2017. Our HMO and insurance subsidiaries were in compliance with and in excess of the minimum capital requirements as of both December 31, 2017 and 2016.
Dividend restrictions vary by state, but the maximum amount of dividends which can be paid without prior approval from the applicable state is subject to restrictions relating to statutory capital, surplus and net income for the previous year. Some states require prior approval of all dividends, regardless of amount. States may disapprove any dividend that, together with other dividends paid by a subsidiary in the prior 12 months, exceeds the regulatory maximum as computed for the subsidiary based on its statutory surplus and net income. We received $335.0 million, $241.0 million and $152.0 million in dividends from our regulated subsidiaries during the years ended December 31, 2017, 2016 and 2015, respectively. The 2017 amount included $150.0 million not requiring prior regulatory approval, and $185.0 million paid after obtaining prior regulatory approval. Under applicable regulatory requirements at December 31, 2017, the amount of dividends that may be paid through the end of 2018 by our HMO and insurance subsidiaries without prior approval by regulatory authorities is approximately $201.7 million in the aggregate.
18. EMPLOYEE BENEFIT PLANS
401(k) Plan
We offer a defined contribution retirement savings plan ("401(k) plan"). Eligible employees of the Company and its subsidiaries may elect to participate in this plan. Participants may contribute a certain percentage of their compensation, subject to maximum Federal and plan limits. We incurred matching contribution expense of $13.9 million, $10.8 million and $9.6 million during the years ended December 31, 2017, 2016 and 2015, respectively. The matching contributions are made in cash and invested according to the plan participant's investment elections, and there are no shares of our common stock reserved for issuance under the 401(k) plan.
F-47
19. DISCONTINUED OPERATIONS
On August 3, 2016, our subsidiary, Universal American, completed the sale of its Traditional Insurance business prior to our acquisition of Universal American. This was accomplished by selling two life insurance subsidiaries, while retaining ownership of a third life insurance subsidiary, American Progressive Life & Health Insurance Company of New York ("Progressive"). The sale of the Traditional Insurance business underwritten by Progressive was accomplished through a 100% quota-share reinsurance treaty with a wholly-owned subsidiary of Nassau Re, that, when considered in combination with other reinsurance transactions previously entered into, resulted in the reinsurance of all of the Traditional Insurance policies that were underwritten by Progressive. Accordingly, the discontinued Traditional Insurance business did not materially affect our consolidated statements of comprehensive income for the year ended December 31, 2017.
In accordance with ASC 360-10, Property, Plant and Equipment and ASC 205-20, Presentation of Financial Statements—Discontinued Operations, the Traditional Insurance business has been reported in discontinued operations in this 2017 Form 10-K.
The following table summarizes the total assets and liabilities of our discontinued operations:
December 31, 2017 | April 28, 2017 | |||||||
(in millions) | ||||||||
Assets | ||||||||
Cash and cash equivalents | $ | 1.3 | $ | 0.8 | ||||
Investments | 46.5 | 47.7 | ||||||
Reinsurance recoverables | 166.9 | 170.4 | ||||||
Other assets | 0.5 | 0.7 | ||||||
Total Assets | $ | 215.2 | $ | 219.6 | ||||
Liabilities | ||||||||
Reserves and other policy liabilities | $ | 148.6 | $ | 153.3 | ||||
Other liabilities | 66.6 | 65.4 | ||||||
Total liabilities | $ | 215.2 | $ | 218.7 | ||||
Progressive's traditional insurance products are reinsured under quota share coinsurance treaties with unaffiliated insurers, while the life insurance risks are reinsured under either quota share coinsurance or yearly-renewable term treaties with unaffiliated insurers. Under quota share coinsurance treaties, we pay the reinsurer an agreed upon percentage of all premiums and the reinsurer reimburses us that same percentage of any losses. In addition, the reinsurer pays us certain allowances to cover commissions, the cost of administering the policies and premium taxes. Under yearly-renewable term treaties, the reinsurer receives premiums at an agreed upon rate for its share of the risk on a yearly-renewable term basis. We also use excess of loss reinsurance agreements for certain policies whereby we limit our loss in excess of specified thresholds.
We evaluate the financial condition of our Traditional Insurance reinsurers and monitor concentrations of credit risk to minimize our exposure to significant losses from reinsurer insolvencies. We are obligated to pay claims in the event that a reinsurer to whom we have ceded an insured claim fails to meet its obligations under the reinsurance agreement. We are not aware of any instances where any of our reinsurers have been unable to pay any policy claims on any reinsured business.
F-48
20. QUARTERLY FINANCIAL INFORMATION
Selected unaudited quarterly financial data is as follows (in millions, except membership and per share data):
For the Three Month Periods Ended | |||||||||||||||
March 31, 2017 | June 30, 2017 | September 30, 2017 | December 31, 2017 | ||||||||||||
Total revenues | $ | 3,954.2 | $ | 4,305.0 | $ | 4,402.9 | $ | 4,345.1 | |||||||
Gross margin | 468.4 | 574.6 | 650.2 | 522.3 | |||||||||||
Income from operations | 103.2 | 141.9 | 211.9 | 12.0 | |||||||||||
Income before income taxes | 103.2 | 114.7 | 235.1 | 8.6 | |||||||||||
Net income | 67.3 | 74.1 | 171.6 | 60.7 | |||||||||||
Net income per share - basic (1) | $ | 1.52 | $ | 1.67 | $ | 3.86 | $ | 1.36 | |||||||
Net income per share - diluted (1) | 1.50 | 1.65 | 3.82 | 1.34 | |||||||||||
Period end membership | 4,078,000 | 4,428,000 | 4,349,000 | 4,371,000 | |||||||||||
For the Three Month Periods Ended | |||||||||||||||
March 31, 2016(2) | June 30, 2016 | September 30, 2016 | December 31, 2016 | ||||||||||||
Total revenues | $ | 3,540.5 | $ | 3,594.4 | $ | 3,584.0 | $ | 3,518.2 | |||||||
Gross margin | 417.1 | 544.8 | 481.5 | 459.7 | |||||||||||
Income before income taxes | 88.9 | 206.7 | 152.9 | 81.0 | |||||||||||
Net income | 37.8 | 90.8 | 68.6 | 44.9 | |||||||||||
Net income per share - basic (1) | $ | 0.86 | $ | 2.05 | $ | 1.55 | $ | 1.01 | |||||||
Net income per share - diluted (1) | 0.85 | 2.04 | 1.54 | 1.00 | |||||||||||
Period end membership | 3,730,000 | 3,769,000 | 3,776,000 | 3,898,000 | |||||||||||
(1) The calculation of net income per share is based on weighted average shares outstanding during each quarter and, accordingly, the sum may not equal the total for the year.
(2) During the six months ended June 30, 2016, net income and per share amounts for the three months ended March 31, 2016 were recasted to reflect the early adoption of ASU 2016-09 "Compensation-Stock Compensation (Topic 718)."
F-49
Schedule I
CONDENSED FINANCIAL INFORMATION OF REGISTRANT
WELLCARE HEALTH PLANS, INC. (Parent Company Only)
STATEMENTS OF COMPREHENSIVE INCOME
(In millions)
For the Years Ended December 31, | |||||||||||
2017 | 2016 | 2015 | |||||||||
Revenues: | |||||||||||
Investment and other income | $ | 0.3 | $ | 0.1 | $ | 0.5 | |||||
Total revenues | 0.3 | 0.1 | 0.5 | ||||||||
Expenses: | |||||||||||
Selling, general and administrative | 63.4 | 37.5 | 22.1 | ||||||||
Interest expense | 68.5 | 59.1 | 54.2 | ||||||||
Total expenses | 131.9 | 96.6 | 76.3 | ||||||||
Loss from operations | (131.6 | ) | (96.5 | ) | (75.8 | ) | |||||
Loss on extinguishment of debt | 26.1 | — | — | ||||||||
Loss before income taxes | (157.7 | ) | (96.5 | ) | (75.8 | ) | |||||
Income tax benefit | 69.7 | 30.8 | 23.9 | ||||||||
Loss before equity in subsidiaries | (88.0 | ) | (65.7 | ) | (51.9 | ) | |||||
Equity in earnings of subsidiaries | 461.7 | 307.8 | 170.5 | ||||||||
Net income | 373.7 | 242.1 | 118.6 | ||||||||
Other comprehensive (loss) income, before tax: | |||||||||||
Change in net unrealized gains and losses on available-for-sale securities | (2.2 | ) | 1.8 | (1.9 | ) | ||||||
Income tax (benefit) expense related to other comprehensive income | (0.5 | ) | 0.6 | (0.3 | ) | ||||||
Other comprehensive (loss) income, net of tax | (1.7 | ) | 1.2 | (1.6 | ) | ||||||
Comprehensive income | $ | 372.0 | $ | 243.3 | $ | 117.0 | |||||
See notes to consolidated financial statements.
F-50
CONDENSED FINANCIAL INFORMATION OF REGISTRANT
WELLCARE HEALTH PLANS, INC. (Parent Company Only)
BALANCE SHEETS
(In millions, except share data)
As of December 31, | |||||||
2017 | 2016 | ||||||
Assets | |||||||
Current assets: | |||||||
Cash and cash equivalents | $ | 31.8 | $ | 1.8 | |||
Short-term investments | 2.1 | 2.2 | |||||
Taxes receivable | 16.4 | 2.5 | |||||
Affiliate receivables and other current assets | 1,050.3 | 950.1 | |||||
Total current assets | 1,100.6 | 956.6 | |||||
Deferred tax asset | 5.4 | 15.5 | |||||
Investment in subsidiaries | 2,509.6 | 2,048.4 | |||||
Total Assets | $ | 3,615.6 | $ | 3,020.5 | |||
Liabilities and Stockholders' Equity | |||||||
Current liabilities: | |||||||
Accrued expenses and other current liabilities | $ | 16.5 | $ | 6.7 | |||
Total current liabilities | 16.5 | 6.7 | |||||
Long-term debt | 1,182.4 | 997.6 | |||||
Other liabilities | — | 16.1 | |||||
Total liabilities | 1,198.9 | 1,020.4 | |||||
Commitments and contingencies (see Note 13) | — | — | |||||
Stockholders' Equity: | |||||||
Preferred stock, $0.01 par value (20,000,000 authorized, no shares issued or outstanding) | — | — | |||||
Common stock, $0.01 par value (100,000,000 authorized, 44,522,988 and 44,293,881 shares issued and outstanding at December 31, 2017 and December 31, 2016, respectively) | 0.4 | 0.4 | |||||
Paid-in capital | 591.5 | 546.9 | |||||
Retained earnings | 1,827.5 | 1,453.8 | |||||
Accumulated other comprehensive loss | (2.7 | ) | (1.0 | ) | |||
Total stockholders' equity | 2,416.7 | 2,000.1 | |||||
Total Liabilities and Stockholders' Equity | $ | 3,615.6 | $ | 3,020.5 | |||
See notes to consolidated financial statements.
F-51
CONDENSED FINANCIAL INFORMATION OF REGISTRANT
WELLCARE HEALTH PLANS, INC. (Parent Company Only)
STATEMENTS OF CASH FLOWS
(In millions)
For the Years Ended December 31, | |||||||||||
2017 | 2016 | 2015 | |||||||||
Net cash (used in) provided by operating activities | $ | (9.6 | ) | $ | 155.8 | $ | 146.5 | ||||
Cash used in investing activities: | |||||||||||
Net proceeds (payments) from purchases and sales and maturities of investments | (1.6 | ) | 1.2 | 33.1 | |||||||
Payments to subsidiaries, net | (99.7 | ) | (53.7 | ) | (376.5 | ) | |||||
Net cash used in investing activities | (101.3 | ) | (52.5 | ) | (343.4 | ) | |||||
Cash provided by financing activities: | |||||||||||
Proceeds from debt, net of financing costs paid | 1,182.2 | 196.9 | 308.9 | ||||||||
Repurchase and retirement of shares to satisfy tax withholding requirements | (15.2 | ) | (7.0 | ) | (7.0 | ) | |||||
Payments on debt | (1,026.1 | ) | (400.0 | ) | — | ||||||
Other, net | — | — | 2.2 | ||||||||
Net cash provided by (used in) financing activities | 140.9 | (210.1 | ) | 304.1 | |||||||
Cash and cash equivalents: | |||||||||||
Increase (decrease) in cash and cash equivalents | 30.0 | (106.8 | ) | 107.2 | |||||||
Balance at beginning of period | 1.8 | 108.6 | 1.4 | ||||||||
Balance at end of period | $ | 31.8 | $ | 1.8 | $ | 108.6 | |||||
See notes to consolidated financial statements.
F-52
Schedule II — Valuation and Qualifying Accounts
(In millions)
Balance at Beginning of Period | Charged to Costs and Expenses | Write Offs | Balance at End of Period | ||||||||||||
Year Ended December 31, 2017 | |||||||||||||||
Deducted from assets: | |||||||||||||||
Allowance for uncollectible accounts: | |||||||||||||||
Premiums receivable | $ | 22.7 | $ | 8.5 | $ | 14.9 | $ | 16.3 | |||||||
Medical advances | 3.5 | — | — | 3.5 | |||||||||||
Total | $ | 26.2 | $ | 8.5 | $ | 14.9 | $ | 19.8 | |||||||
Year Ended December 31, 2016 | |||||||||||||||
Deducted from assets: | |||||||||||||||
Allowance for uncollectible accounts: | |||||||||||||||
Premiums receivable | $ | 19.9 | $ | 10.0 | $ | 7.2 | $ | 22.7 | |||||||
Medical advances | 3.4 | 0.1 | — | 3.5 | |||||||||||
Total | $ | 23.3 | $ | 10.1 | $ | 7.2 | $ | 26.2 | |||||||
Year Ended December 31, 2015 | |||||||||||||||
Deducted from assets: | |||||||||||||||
Allowance for uncollectible accounts: | |||||||||||||||
Premiums receivable | $ | 21.1 | $ | 12.6 | $ | 13.8 | $ | 19.9 | |||||||
Medical advances | 1.4 | 2.0 | — | 3.4 | |||||||||||
Total | $ | 22.5 | $ | 14.6 | $ | 13.8 | $ | 23.3 | |||||||
F-53
Exhibit Index
INCORPORATED BY REFERENCE | ||||||||||
Exhibit Number | Description | Form | Filing Date with SEC | Exhibit Number | ||||||
3.1 | 10-K | February 12, 2016 | 3.1 | |||||||
3.2 | 8-K | November 2, 2010 | 3.2 | |||||||
4.1 | 10-Q | November 4, 2010 | 4.1 | |||||||
4.2 | 8-K | November 18, 2013 | 4.1 | |||||||
8-K | November 18, 2013 | 4.2 | ||||||||
4.3 | 8-K | March 23, 2017 | 4.1 | |||||||
8-K | March 23, 2017 | 4.2 | ||||||||
MATERIAL AGREEMENTS RELATING TO COMPENSATION AND INDEMNIFICATION | ||||||||||
2013 Incentive Compensation Plan and Forms Adopted Thereunder | ||||||||||
10.1 | DEF 14A | April 10, 2013 | A | |||||||
10.2 | Forms of Agreement under Registrant’s 2013 Incentive Compensation Plan | |||||||||
8-K | May 22, 2013 | 10.1 | ||||||||
8-K | May 22, 2013 | 10.2 | ||||||||
8-K | September 4, 2014 | 10.1 | ||||||||
8-K | March 31, 2016 | 10.1 | ||||||||
10-Q | November 1, 2016 | 10.1 | ||||||||
8-K | May 22, 2013 | 10.5 | ||||||||
8-K | May 22, 2013 | 10.6 | ||||||||
8-K | May 22, 2013 | 10.9 | ||||||||
8-K | May 22, 2013 | 10.10 | ||||||||
8-K | March 28, 2016 | 10.2 | ||||||||
8-K | March 28, 2016 | 10.3 | ||||||||
8-K | May 22, 2013 | 10.13 | ||||||||
8-K | May 22, 2013 | 10.14 | ||||||||
8-K | May 22, 2013 | 10.15 | ||||||||
8-K | May 22, 2013 | 10.16 | ||||||||
Other Compensation and Indemnification Plans and Forms of Agreement | ||||||||||
10.3 | WellCare Health Plans, Inc. Executive Severance Plan | |||||||||
10-Q | November 1, 2016 | 10.2 | ||||||||
8-K | October 2, 2017 | 10.1 | ||||||||
10.4 | Non-Employee Director Compensation Policy | |||||||||
10-Q | May 7, 2015 | 10.5 | ||||||||
10.5 | Forms of Indemnification Agreement | |||||||||
S-1/A | June 8, 2004 | 10.24 | ||||||||
8-K | May 14, 2009 | 10.1 | ||||||||
10-Q | August 9, 2010 | 10.8 | ||||||||
Agreements with Individual Officers and Directors | ||||||||||
10.6 | 8-K | January 27, 2014 | 10.1 | |||||||
10.7 | 8-K | November 5, 2014 | 10.1 | |||||||
MATERIAL OPERATIONAL AGREEMENTS | ||||||||||
10.8 | 8-K | January 12, 2016 | 10.1 | |||||||
8-K | March 23, 2017 | 10.1 | ||||||||
12.1 | ||||||||||
21.1 | ||||||||||
23.1 | ||||||||||
31.1 | ||||||||||
31.2 | ||||||||||
32.1 | ||||||||||
32.2 | ||||||||||
101.INS | XBRL Instance Document †† | |||||||||
101.SCH | XBRL Taxonomy Extension Schema Document †† | |||||||||
101.CAL | XBRL Taxonomy Calculation Linkbase Document †† | |||||||||
101.DEF | XBRL Taxonomy Definition Linkbase Document †† | |||||||||
101.LAB | XBRL Taxonomy Labels Linkbase Document †† | |||||||||
101.PRE | XBRL Taxonomy Presentation Linkbase Document †† | |||||||||
_______________
* | Denotes a management contract or compensatory plan, contract or arrangement |
† | Filed herewith |
†† | Furnished herewith and not filed for purposes of Section 11 and Section 12 of the Securities Act of 1933 and Section 18 of the Securities Exchange Act of 1934 |
SIGNATURES
Pursuant to the requirements of Section 13 or 15(d) of the Securities Exchange Act of 1934, the Registrant has duly caused this report to be signed on its behalf by the undersigned, thereunto duly authorized.
WellCare Health Plans, Inc. | |
By: | /s/ Kenneth A. Burdick |
Kenneth A. Burdick | |
Chief Executive Officer | |
Date: February 16, 2018
Pursuant to the requirements of the Securities Exchange Act of 1934, this report has been signed below by the following persons in the capacities and on the dates indicated:
Signatures | Title | Date | ||
/s/Kenneth A. Burdick | Chief Executive Officer (Principal Executive Officer and Director) | February 16, 2018 | ||
Kenneth A. Burdick | ||||
/s/Andrew L. Asher | Executive Vice President and Chief Financial Officer (Principal Financial Officer) | February 16, 2018 | ||
Andrew L. Asher | ||||
/s/Michael Troy Meyer | Vice President and Corporate Controller (Principal Accounting Officer) | February 16, 2018 | ||
Michael Troy Meyer | ||||
/s/Christian P. Michalik | Chairman of the Board | February 16, 2018 | ||
Christian P. Michalik | ||||
/s/ Richard C. Breon | Director | February 16, 2018 | ||
Richard C. Breon | ||||
/s/Carol J. Burt | Director | February 16, 2018 | ||
Carol J. Burt | ||||
/s/H. James Dallas | Director | February 16, 2018 | ||
H. James Dallas | ||||
/s/Kevin F. Hickey | Director | February 16, 2018 | ||
Kevin F. Hickey | ||||
/s/Glenn D. Steele, Jr. | Director | February 16, 2018 | ||
Glenn D. Steele, Jr. | ||||
/s/William L. Trubeck | Director | February 16, 2018 | ||
William L. Trubeck | ||||
/s/ Paul E. Weaver | Director | February 16, 2018 | ||
Paul E. Weaver | ||||
F-57