Attached files
| file | filename |
|---|---|
| EX-32.1 - EX-32.1 - Pendrell Corp | pco-ex321_170.htm |
| EX-31.2 - EX-31.2 - Pendrell Corp | pco-ex312_169.htm |
| EX-31.1 - EX-31.1 - Pendrell Corp | pco-ex311_171.htm |
UNITED STATES
SECURITIES AND EXCHANGE COMMISSION
Washington, D.C. 20549
FORM 10-K
(Mark One)
|
☒ |
ANNUAL REPORT PURSUANT TO SECTION 13 OR 15(d) OF THE SECURITIES EXCHANGE ACT OF 1934 |
For the fiscal year ended December 31, 2017
Or
|
☐ |
TRANSITION REPORT PURSUANT TO SECTION 13 OR 15(d) OF THE SECURITIES EXCHANGE ACT OF 1934 |
For the transition period from to
Commission File Number 001-33008
PENDRELL CORPORATION
(Exact name of registrant as specified in its charter)
|
Washington |
98-0221142 |
|
(State or other jurisdiction of incorporation or organization) |
(IRS Employer Identification No.) |
2300 Carillon Point, Kirkland, Washington 98033
(Address of principal executive offices including zip code)
(425) 278-7100
(Registrant’s telephone number, including area code)
Securities registered pursuant to Section 12(b) of the Act:
|
Title of each class |
Name of each exchange on which registered |
|
Class A common stock, par value $0.01 per share |
Not applicable |
Securities registered pursuant to Section 12(g) of the Act:
None
Indicate by check mark if the registrant is a well-known seasoned issuer, as defined in Rule 405 of the Securities Act. Yes ☐ No ☒.
Indicate by check mark if the registrant is not required to file reports pursuant to Section 13 or 15(d) of the Act. Yes ☐ No ☒.
Indicate by check mark whether the registrant: (1) has filed all reports required to be filed by Section 13 or 15(d) of the Securities Exchange Act of 1934 during the preceding 12 months (or for such shorter period that the registrant was required to file such reports), and (2) has been subject to such filing requirements for the past 90 days. Yes ☒ No ☐.
Indicate by check mark whether the registrant has submitted electronically and posted on its corporate Web site, if any, every Interactive Data File required to be submitted and posted pursuant to Rule 405 of Regulation S-T (§232.405 of this chapter) during the preceding 12 months (or for such shorter period that the registrant was required to submit and post such files). Yes ☒ No ☐.
Indicate by check mark if disclosure of delinquent filers pursuant to Item 405 of Regulation S-K is not contained herein, and will not be contained, to the best of registrant’s knowledge, in definitive proxy or information statements incorporated by reference in Part III of this Form 10-K or any amendment to this Form 10-K. ☐
Indicate by check mark whether the registrant is a large accelerated filer, an accelerated filer, a non-accelerated filer, a smaller reporting company, or an emerging growth company. See the definitions of “large accelerated filer,” “accelerated filer,” “smaller reporting company,” and “emerging growth company” in Rule 12b-2 of the Exchange Act.
|
Large accelerated filer |
☐ |
Accelerated filer |
☒ |
|
|
|
|
|
|
Non-accelerated filer |
☐ (Do not check if a smaller reporting company) |
Smaller reporting company |
☐ |
|
|
|
|
|
|
Emerging growth company |
☐ |
|
|
If an emerging growth company, indicate by check mark if the registrant has elected not to use the extended transition period for complying with any new or revised financial accounting standards provided pursuant to Section 13(a) of the Exchange Act.
Indicate by check mark whether the registrant is a shell company (as defined in Rule 12b-2 of the Exchange Act). Yes ☐ No ☒.
As of June 30, 2017, the aggregate market value of common stock held by non-affiliates of the registrant was approximately $109,412,306
As of February 16, 2018, the registrant had 189,109 shares of Class A common stock and 53,660 shares of Class B common stock outstanding.
DOCUMENTS INCORPORATED BY REFERENCE
None.
2017 ANNUAL REPORT ON FORM 10-K
INDEX
|
|
|
|
Page |
|
|
|
||
|
Item 1. |
|
2 |
|
|
Item 1A. |
|
4 |
|
|
Item 1B. |
|
12 |
|
|
Item 2. |
|
12 |
|
|
Item 3. |
|
12 |
|
|
Item 4. |
|
12 |
|
|
|
|
|
|
|
|
|
|
|
|
Item 5. |
|
13 |
|
|
Item 6. |
|
16 |
|
|
Item 7. |
Management’s Discussion and Analysis of Financial Condition and Results of Operations |
|
18 |
|
Item 7A. |
|
26 |
|
|
Item 8. |
|
27 |
|
|
Item 9. |
Changes in and Disagreements with Accountants on Accounting and Financial Disclosure |
|
51 |
|
Item 9A. |
|
51 |
|
|
Item 9B. |
|
53 |
|
|
|
|
|
|
|
|
|
|
|
|
Item 10. |
|
53 |
|
|
Item 11. |
|
58 |
|
|
Item 12. |
Security Ownership of Certain Beneficial Owners and Management and Related Stockholder Matters |
|
75 |
|
Item 13. |
Certain Relationships and Related Transactions, and Director Independence |
|
77 |
|
Item 14. |
|
78 |
|
|
|
|
|
|
|
|
|
|
|
|
Item 15. |
|
79 |
|
|
Item 16. |
|
79 |
|
|
|
83 |
||
1
This Annual Report on Form 10-K (“Form 10-K”) contains certain forward-looking statements regarding future events and our future operating results that are subject to the safe harbors created under the Securities Act of 1933, as amended (“Securities Act”), and the Securities Exchange Act of 1934, as amended (“Exchange Act”). These statements may include words such as “anticipate,” “estimate,” “expect,” “project,” “plan,” “intend,” “believe,” “may,” “will,” “should,” “likely” and other words and terms of similar meaning in connection with any discussion of the timing or nature of future operating or financial performance or other events. All of these forward-looking statements are subject to risks and uncertainties that could cause our actual results to differ materially from those contemplated by the relevant forward-looking statements. Factors that might cause or contribute to such a difference include, but are not limited to, those discussed under “Item 1A of Part I – Risk Factors” and elsewhere in this Form 10-K. The forward-looking statements included in this document are made only as of the date of this report, and we undertake no obligation to publicly update these forward-looking statements to reflect subsequent events or circumstances.
Overview
Pendrell Corporation (“Pendrell”), with its consolidated subsidiaries, is referred to as “us,” “we,” or the “Company.” Pendrell has, for the past six years, invested in, acquired and monetized intellectual property (“IP”) rights. In 2017, we divested the majority of our largest IP portfolio, known as our “Pendragon” portfolio, but continued to license the digital rights management (“DRM”) patents owned by our subsidiary ContentGuard Holdings, Inc. (“ContentGuard”), and the memory and storage patents owned by our subsidiary Memory Technologies LLC (“MTL”). We will continue efforts to license those DRM and memory patents in the future.
Pendrell was originally incorporated in 2000 as New ICO Global Communications (Holdings) Limited, a Delaware corporation. In July 2011, we changed our name to Pendrell Corporation. On November 14, 2012, we reincorporated from Delaware to Washington. Our principal executive office is located at 2300 Carillon Point, Kirkland, Washington 98033, and our telephone number is (425) 278-7100. Our website address is www.pendrell.com. The information contained in or that can be accessed through our website is not part of this Form 10-K.
Our Business
Revenue Generating Activities
We generate revenues by licensing and selling our IP rights to others. Our subsidiaries hold patents that support three IP licensing programs that we own and manage: (i) memory and storage technologies, (ii) digital media, and (iii) digital cinema.
We acquired most of our memory and storage patents (our “Memory Patents”) and patent applications from Nokia Inc. in March 2013, many of which have been declared essential to standards that are applicable to memory and storage technologies used in electronic devices. These patents cover embedded memory components and storage subsystems. Potential licensees include flash memory component suppliers, solid state disk manufacturers and device vendors. Since 2014, we have entered into license agreements with five leading memory device makers and a number of smaller companies in the memory space. We are in active license discussions with other memory component manufacturers and, early in 2018, filed litigation against Kingston Technology Corporation (“Kingston”) in federal district court alleging infringement of certain of our memory and storage patents (“Kingston Litigation”).
2
Our digital media program is supported by patents (our “DRM Patents”) and patent applications designed to protect against unauthorized duplication and use of digital content during the transfer of the digital content. The majority of our digital media patents and patent applications came to us through our October 2011 purchase of a 90.1% interest in ContentGuard, where we partnered with Time Warner to expand the development and licensing of ContentGuard’s portfolio of DRM technologies. We have granted digital media licenses to manufacturers, distributors and providers of consumer products, including Amazon, DirecTV, Fujitsu, LG Electronics, Microsoft Corporation, Nokia, Panasonic, Pantech, Sharp, Sony, Toshiba, Time Warner and Xerox Corporation.
Our digital cinema program is supported by DRM Patents and patent applications designed to protect against unauthorized creation, duplication and use of digital cinema content that is distributed to movie theaters globally, many of which also came to us through our acquisition of ContentGuard. Potential digital cinema licensees include distributors and exhibitors of digital content, including motion picture producers, motion picture distributors and equipment vendors. We launched our digital cinema program in June 2013, and signed a significant license with The Walt Disney Company in 2017. We are actively engaged in licensing discussions with other leading feature film studios.
In late 2017, we divested the majority of our “Pendragon portfolio,” which contained patents related to cellular and digital wireless devices and infrastructure. We are actively working to divest the remainder of the portfolio.
We typically license our patents via agreements that cover entire patent portfolios or large segments of portfolios. We expect licensing negotiations with prospective licensees to take approximately 12 to 24 months, and perhaps longer, measured from inception of technical discussions regarding the scope of our patents. If we are unable to secure reasonable, negotiated licenses, we may resort to litigation to enforce our IP rights, as evidenced by the claims we filed in 2016 against SanDisk at the ITC and in federal district court, and the claims we recently filed against Kingston in federal district court.
Our IP revenue generation activities are not limited to licensing and litigation. Patents that we believe may generate greater value through a sales transaction, such as the Pendragon portfolio, may be sold. Although some may characterize patent sale revenue differently than patent license revenue, we regard our IP monetization activities as integrated and not separate revenue streams, and therefore treat sale and license revenue the same for GAAP reporting purposes.
Our IP portfolio currently consists of patents that have already expired and others that expire between 2018 and 2035. See “Revenue opportunities from our IP monetization efforts are limited” under “Item 1A of Part I—Risk Factors.”
Business Outlook
From 2011 through 2015, we focused on acquiring and growing companies that developed or possessed unique, innovative technologies that could be licensed to third parties or could provide a competitive advantage to products we were developing. During the past three years, we moderated those efforts and reduced our costs by eliminating certain positions, reducing certain overhead costs and abandoning patent assets that do not support our existing licensing programs. In December 2017, we delisted from Nasdaq and filed for de-registration of our Class A common stock.
We have explored and continue to explore investment opportunities that are not premised on the value of IP, with the goal of investing our capital in operating companies that can generate solid, stable income streams. Due to high valuations that we attribute to inexpensive and widely available capital, we did not acquire any such operating companies in 2015, 2016 or 2017. We may encounter more suitable opportunities if the cost of capital increases over time. We intend to continue to explore new business opportunities that are better suited for non-listed private companies while keeping our costs contained.
Although our focus has evolved away from companies that develop or possess unique, innovative technologies, we will continue to dedicate effort and resources to generate revenue from our existing IP assets.
3
Competition
Due to the unique nature of our IP rights, we do not compete directly with other patent holders or patent applicants. However, to the extent that multiple parties seek royalties on the same product or service, we might as a practical matter compete for a share of reasonable royalties from manufacturers and distributors.
As we pursue opportunities that are not premised on the value of IP, we may compete with well-capitalized companies pursuing those same opportunities.
Divestiture of Satellite Assets
When we were formed in 2000, our intent was to develop and operate a next generation global mobile satellite communications system. In 2011, we started selling assets associated with the satellite business and, during 2012, we divested the remaining vestiges of our satellite business, including the sale of our remaining medium earth orbit (“MEO”) satellites and related equipment and our real property in Brazil, the transfer to a liquidating trust (the “Liquidating Trust”) of certain former subsidiaries associated with the satellite business (the “International Subsidiaries”) to address the winding down of the International Subsidiaries, and the settlement of our litigation with The Boeing Company (“Boeing”).
The 2012 divestiture and the corresponding transfer to the Liquidating Trust of the International Subsidiaries triggered tax losses of approximately $2.4 billion, which we believe can be carried forward for up to twenty years. Under the sales agreement for the MEO assets, the Company is entitled to a substantial portion of any proceeds generated from the resale of the MEO assets. In January 2015, the party that acquired the MEO assets from the Company resold the MEO assets and as a result, the Company received $3.9 million during 2015, which has been recorded in gain on contingencies in the statement of operations for the year ended December 31, 2015. On February 23, 2016, that party received the final scheduled payment for the MEO assets, which resulted in the Company’s recognition of an additional $2.0 million gain on contingency in 2016.
Employees
As of December 31, 2017, on a consolidated basis, we had the equivalent of 12 full-time employees located in Washington, California, Finland and Texas.
Available Information
The address of our website is www.pendrell.com. You can find additional information about us and our business on our website. We make available on this website, free of charge, our annual reports on Form 10-K, quarterly reports on Form 10-Q, current reports on Form 8-K, and amendments to those reports, as soon as reasonably practicable after we electronically file or furnish such materials to the Securities and Exchange Commission (“SEC”). You may read and copy this Form 10-K at the SEC’s public reference room at 100 F Street, NE, Washington, DC 20549-0102. Information on the operation of the public reference room can be obtained by calling the SEC at 1-800-SEC-0330. These filings are also accessible on the SEC’s website at www.sec.gov.
We also make available on our website in a printable format the charters for certain of our various Board of Director committees, including the Audit Committee, the Compensation Committee and the Nominating and Governance Committee, and our Code of Conduct and Ethics in addition to our Articles of Incorporation, Bylaws and Tax Benefits Preservation Plan. This information is available in print without charge to any shareholder who requests it by sending a request to Pendrell Corporation, 2300 Carillon Point, Kirkland, Washington 98033, Attn: Corporate Secretary. The material on our website is not incorporated into or part of this Form 10-K.
The risks below address some of the factors that may affect our future operating results and financial performance. If any of the following risks develop into actual events, then our business, financial condition, results of operations or prospects could be materially adversely affected.
4
Risks Related to our Patents and Monetization Activities
Success of our licensing efforts depends on our ability to sign new license agreements or otherwise enforce our intellectual property rights.
IP licensing revenues are dependent on our ability to sign new license agreements with, or otherwise enforce our intellectual property rights against, users of our patented inventions. If users refuse to sign license agreements, we may need to resort to litigation or other measures to compel the payment of fair consideration, which to date has not been effective, and may not be effective in the future. This risk applies not only to new license agreements, but to existing license agreements with fixed expiration dates. If we fail to sign or renew license agreements on terms that are favorable to us or obtain favorable outcomes through litigation or other enforcement actions, the value of our IP could be further impaired.
We may have a limited number of prospective licensees.
We are actively pursuing licenses for our DRM and memory portfolios. However, our portfolios are applicable to only a limited number of prospective licensees. Moreover, many device makers who would have been prospective DRM licensees are shielded by adverse jury verdicts in the patent infringement cases that we filed in the Eastern District of Texas. In the memory and storage space, we believe we have licensed substantially more products than remain unlicensed. As such, we have a limited number of prospective licensees, and if we are unable to sign licenses with this limited group, licensing revenue will be adversely impacted. Moreover, if our portfolios are not demonstrably applicable to prospective licensees’ products or services, whether due to poor quality, lack of breadth or otherwise, parties may refuse to sign license agreements.
Revenue opportunities from our IP monetization efforts are limited.
Patents have finite lives. Our IP portfolio currently consists of numerous patents that have already expired, and others that expire between 2018 and 2035. Therefore, our IP revenue opportunities are limited.
Our licensing cycle is lengthy, costly and our licensing efforts may be unsuccessful.
Licensing our patents takes time, with some license negotiations spanning many years. We have incurred and expect to incur significant legal and sales expenses in our efforts to sign license agreements and generate license revenues. We also expect to spend considerable resources educating prospective licensees on the benefits of a license arrangement with us. As such, we may incur significant costs and losses before any associated revenue is generated.
Enforcement proceedings may be costly and ineffective.
We may choose to pursue litigation or other enforcement action to protect our intellectual property rights, such as the ITC and district court actions against SanDisk, and the recently-filed Kingston Litigation. Enforcement proceedings are typically protracted and complex, and might require cooperation of inventors and others who are unwilling or unable to assist with enforcement. Litigation also involves several stages, including the potential for a prolonged appeals process. The costs are typically substantial, and the outcomes are unpredictable. Enforcement actions will likely divert our managerial, technical, legal and financial resources from business operations. In certain cases, we may conclude that these costs and risks outweigh the potential benefits that would arise from successful enforcement, in which event we may opt not to pursue enforcement.
Our business could be negatively impacted by product composition and future innovation.
Our licensing revenues have been generated from manufacturers and distributors of products that use our patented inventions. Our business prospects could be negatively impacted if prospective licensees do not use our inventions in their products, or if they later modify their products to eliminate use of our inventions. Moreover, changes in technology or customer requirements could alter product composition and render our patented inventions obsolete or unmarketable.
5
Our patent management activities could impact the value of our IP.
We assess our IP portfolio to identify patents and patent applications that are worth preserving and patents and patent applications that are not worth preserving. Our assessment is driven by numerous factors, many of which are not scientific. Our assessment drives decisions to maintain or abandon patents and patent applications. If we make decisions that prompt abandonment of patents and patent applications with value, we could materially impact the value of our IP portfolio and our ability to generate revenue from our IP portfolio.
Challenges to the validity or enforceability of our key patents could significantly harm our business.
Any third party may challenge the validity, scope, enforceability and ownership of our patents. Challenges may include review requests to patent authorities, such as inter partes review and covered business method proceedings that have been initiated by ZTE, Apple, Google and SanDisk. Review proceedings are costly and time-consuming, and we cannot predict their outcome or consequences. Such proceedings may narrow the scope of our claims or may cancel some or all claims. If patent claims are canceled, we could be prevented from enforcing or earning future revenues from the canceled claims. Even if our claims are not canceled, our enforcement actions against alleged infringers may be stayed pending resolution of reviews, or courts or tribunals reviewing our patent claims could make findings adverse to our interests. Irrespective of outcome, review challenges may result in substantial legal expenses and diversion of management’s time and attention away from our other business operations, including our ability to evaluate and acquire other businesses. Adverse decisions could impair the value of our inventions or result in a loss of our proprietary rights and may adversely affect our results of operations and our financial position.
Changes in patent law could adversely impact our business.
Patent laws may continue to change, and may alter protections afforded to owners of patent rights, impose additional enforcement risks, increase the costs of enforcement, or increase our licensing cycles. For instance, the 2012 passage of the America Invents Act provided alleged infringers with new procedures to combat patent infringement claims, including inter partes review and covered business method proceedings to challenge patent validity. In 2013 and 2015, legislative initiatives were introduced to address perceived patent abuses by non-practicing entities, and some legislators continue to express their intention to sponsor or support similar legislation in the future. Even if legislative initiatives do not directly impact our business, such initiatives might encourage manufacturers to infringe our IP rights, lengthen our licensing cycles, increase the likelihood that we will litigate to enforce our IP rights, or make it more difficult and expensive to license our patents or enforce our patents against parties using our inventions without a license. Moreover, increased focus on the growing number of patent-related lawsuits may result in legislative changes which increase our costs and related risks of asserting patent enforcement actions.
Changes of interpretations of patent law could adversely impact our business.
Our success in review and enforcement proceedings relies in part on the historically consistent application of patent laws and regulations. Interpretations of patent laws and regulations by the courts and applicable regulatory bodies have evolved, and may continue to evolve, particularly with the introduction of new laws and regulations. Changes or potential changes in judicial interpretation could have a negative impact on our ability to monetize our patent rights.
Risks Related to our Acquisition Activities
We may over-estimate the value of assets or businesses we acquire.
We make investments from which we intend to generate a return. We estimate the value of these investments prior to acquisition, using both objective and subjective methodologies. If we over-estimate such value, we may not generate desired returns on our investment, or we may need to adjust the value of the investments to fair value and record a corresponding impairment charge, either of which could adversely affect our results of operations and our financial position.
6
We may not generate a return on acquired assets.
Even if we accurately value the investments we make, we must succeed in generating a return on the investments. Our success in generating a return depends on effective efforts of our employees and outside professionals. If we do not generate desired returns on our investments or if we are compelled to adjust the value of the investments to fair value and record a corresponding impairment charge, it could adversely affect our results of operations and our financial position.
We may pursue acquisition or investment opportunities that do not yield desired results.
We intend to continue investigating potential acquisitions that support our business objectives and strategy. Acquisitions are time-consuming, complex and costly. The terms of acquisition agreements tend to be heavily negotiated. We may incur significant transactional expenses, regardless of whether acquisitions are consummated. Moreover, the integration of acquired companies may create significant challenges, and we can provide no assurances that the integration of acquired businesses with our business will result in the realization of the full benefits we anticipate from such acquisitions. Investigating businesses and assets and integrating newly acquired businesses or assets may be costly and time-consuming, and such activities could divert our attention from other business concerns. In addition, we might lose key employees while integrating new organizations. Acquisitions could also result in potentially dilutive issuances of equity securities or the incurrence of debt, the assumption or incurrence of contingent liabilities, possible impairment charges related to goodwill or other intangible assets or other unanticipated events or circumstances, any of which could negatively impact our financial position. We might not be successful in integrating acquired businesses and might not achieve desired revenues and cost benefits.
The financing of our acquisition activities could threaten our ability to use NOLs to offset future taxable income.
We have substantial historical net operating losses (“NOLs”) for United States federal income tax purposes. As explained in greater detail below, our use of our NOLs will be significantly limited if we undergo a “Tax Ownership Change,” as defined in Section 382 of the Internal Revenue Code. If and to the extent we finance acquisitions through the sale or issuance of stock, we will likely cause an ownership shift that increases the possibility that a future Tax Ownership Change might occur. If a Tax Ownership Change occurs, we will be permanently unable to use most of our NOLs.
Avoiding a Tax Ownership Change may limit our ability to use our shares in an acquisition which could limit our ability to execute a transaction.
The use of our NOLs will be significantly limited if we undergo a Tax Ownership Change. Given the potential economic benefit of our NOLs, we have taken steps to reduce the risk of a Tax Ownership Change including our Tax Benefit Preservation Plan. Issuing new shares in an acquisition transaction could cause or would increase the risk of a Tax Ownership Change. As a result, if a potential seller or partner requires a large number of shares as part of an acquisition transaction, we may choose not to execute that transaction.
We rely on representations, warranties and opinions from third parties that might not be accurate.
When we acquire assets or businesses or establish relationships with inventors or strategic partners, we may rely on representations and warranties made by third parties. We also may rely on opinions of lawyers and other professionals. We may not have the opportunity to independently investigate and verify the facts upon which such representations, warranties and opinions are made. By relying on these representations, warranties and opinions, we may be exposed to unforeseen liabilities that could have a material adverse effect on our operating results and financial condition.
7
Risks Related to our Operations
Our financial and operating results have been and may continue to be uneven.
Our operating results may fluctuate and, as such, our operating results are difficult to predict. Quarterly or annual comparisons of our results of operations should not be relied upon as an indication of our future performance. Factors that could cause our operating results to fluctuate during any period or that could adversely affect our operating results include the timing of license and sales agreements, compliance with such agreements, the terms and conditions for payment under those agreements, our ability to protect and enforce our intellectual property rights, costs of enforcement, changes in demand for products that incorporate our inventions, the time period between commencement and completion of license negotiations or enforcement proceedings, revenue recognition principles, and changes in accounting policies.
Our revenues may not offset our operating expenses.
We reported operating income in 2016 and 2017, in part because we signed significant licenses in those years and in part because we significantly reduced our year-over-year operating expenses. Moving forward, it is not feasible to reduce operating expenses as dramatically as we did in 2016 and 2017. Moreover, revenue from our IP licensing business continues to be inconsistent. If we are unable to generate revenue sufficient to cover operating costs, we will report a net operating loss in future years.
Failure to effectively manage the composition of our employee base could strain our business.
Our success depends, in large part, on continued contributions of our small group of key managers and employees, many of whom are highly skilled and would be difficult to replace. Our success also depends on the ability of our personnel to function effectively, both individually and as a group. At the end of 2015, we terminated the employment of numerous IP professionals whose roles we believe were unnecessary to advance our current and anticipated business strategies. In 2016, we parted ways with our vice president of licensing. If we misjudged our ongoing personnel needs or lose any of our remaining senior managers or key personnel, it could lead to dissatisfaction among our clients or licensees, which could slow our growth or result in a loss of business. Moreover, if we fail to manage the composition of our employee base effectively or otherwise strain our relationships with our personnel, our business and financial results may be materially harmed.
If we need financing and cannot obtain financing on favorable terms, our business may suffer.
If we deploy a significant portion of our capital or encounter unforeseen difficulties in the future that deplete our capital resources more rapidly than anticipated, we may need to obtain additional financing. Financing might not be available on favorable terms, if at all, may dilute our existing shareholders, and may prompt us to pursue structural changes that could impact shareholder concentration and liquidity. If we fail to obtain additional capital as and when needed, such failure could have a material adverse impact on our business, results of operations and financial condition.
Our financial reporting will no longer be subject to an audit.
Historically, our consolidated financial statements were audited by external audit firms registered with the Public Company Accountancy Oversight Board. Having delisted our Class A common stock from Nasdaq and filed for de-registration, we will no longer be required to have our financial statements audited. Moreover, we do not intend to engage external auditors to audit our financial statements. The absence of an external audit could increase the risk that our financial statements are not accurate or reliable.
Unauthorized use or disclosure of our confidential information could adversely affect our business.
We rely primarily on a combination of license agreements, nondisclosure agreements, other contractual relationships and patent, trademark, trade secret and copyright laws to protect our confidential and proprietary information, our technology and our intellectual property. We cannot be certain that these protections have not been and will not be breached, that we will be able to timely detect unauthorized use or transfer of our trade secrets or
8
intellectual property, that we will have adequate remedies for any breach, or that our trade secrets will not otherwise become known or be independently discovered by competitors. If we are unable to detect in a timely manner the unauthorized use or disclosure of our proprietary or other confidential information or if we are unable to enforce our rights under our agreements or applicable laws, the misappropriation of such information could harm our business.
Our company has an evolving business model, which raises doubt about our ability to increase our revenues and grow our business.
We have shifted our principal focus for growth away from the IP business and are evaluating opportunities that generate solid, stable income streams with greater growth potential. Those opportunities must be considered in light of the risks, expenses, and difficulties frequently encountered by companies in an early stage of development. We may not be successful in addressing such risks, and the failure to do so could have a material adverse effect on our business, operating results and financial condition. There can be no assurance that we will be able to increase our revenues and otherwise grow our business as we execute on new business opportunities in the future.
Risks Related to our Tax Losses
We cannot be certain that our tax losses will be available to offset any future taxable income.
A significant portion of our NOLs were triggered when we disposed of our satellite assets. We believe these NOLs can be carried forward to offset certain future taxable income. However, the NOLs have not been audited or otherwise validated by the Internal Revenue Service (“IRS”). We can make no assurance that we would prevail if the IRS were to challenge the amount or our use of the NOLs. If the IRS were successful in challenging our NOLs, all or some amount of our NOLs would not be available to offset future taxable income which would result in an increase to our future income tax liability. The NOL carryforward period begins to expire in 2025 with the bulk of our NOLs expiring in 2032.
An Ownership Change under Section 382 of the Internal Revenue Code may significantly limit our ability to use NOLs to offset future taxable income.
Our use of our NOLs will be significantly limited if we undergo a Tax Ownership Change. Broadly, a Tax Ownership Change will occur if, over a three-year testing period, the percentage of our stock, by value, owned by one or more 5% shareholder increases by more than 50 percentage points. For purposes of this test, shareholders that own less than 5% of our stock are aggregated into one or more separate “public groups,” each of which is treated as a 5% shareholder. Despite our adoption of certain protections against a Tax Ownership Change (such as our Tax Benefits Preservation Plan), we cannot control the trading activity of our significant shareholders. If shareholders acquire or divest their shares in a manner or at times that do not account for the loss-limiting provisions of the Internal Revenue Code or regulations adopted thereunder, a Tax Ownership Change could occur. If a Tax Ownership Change occurs, we will be permanently unable to use most of our NOLs.
Our ability to utilize our NOLs is dependent on the generation of future taxable income.
Our ability to utilize our NOLs is dependent upon the generation of future taxable income before the expiration of the carry forward period attributable to the NOLs, which begin to expire in 2025. We generated taxable income in 2016 and 2017, but we may not generate sufficient taxable income in future years to use the NOLs before they begin expiring.
The value of our NOLs may be reduced by changes in the federal tax laws.
The Tax Cuts and Jobs Act (“TCJA”) was signed into law in 2017. TCJA resulted in several changes to federal tax law, including a reduction of the federal tax rate for corporations to 21%. The TCJA did not change our ability to use our NOLs, including potential limitation under Section 382 described above. We believe our NOLs have value to the extent they can be used to offset future taxable income. A lower overall corporate tax rate reduces that value and any further reduction to the federal corporate rate may further reduce that value.
9
Our NOLs cannot be used to offset the Personal Holding Company tax.
The Internal Revenue Code imposes an additional tax on the undistributed income of a Personal Holding Company (“PHC”). In general, a corporation is classified as a PHC if 50% or more of its outstanding shares, measured by value, are owned directly or indirectly by five or fewer individual shareholders at any time during the second half of a calendar year (“Concentrated Ownership”) and at least 60% of its adjusted ordinary gross income is Personal Holding Company Income (“PHCI”). Broadly, PHCI includes items such as dividends, interest, rents and royalties, among others. Pendrell met the Concentrated Ownership test in 2016 and 2017 and more than 60% of Pendrell’s adjusted ordinary gross income was PHCI. Pendrell avoided payment of PHC tax on its PHCI by distributing the PHCI to its shareholders as a dividend in December 2017. ContentGuard did not meet the Concentrated Ownership test in 2016 or 2017 due to the interest held by minority shareholders, but it is possible that ContentGuard could meet the Concentrated Ownership test in 2018. If Pendrell or ContentGuard meets the Concentrated Ownership test, generates positive net PHCI and does not distribute the PHCI as a dividend, Pendrell or ContentGuard will be subject to the PHC tax. The PHC tax, which is in addition to the income tax and cannot be offset by our NOLs, is currently levied at 20% of the net PHCI not distributed to the corporation’s shareholders.
Risks Related to Our Class A Common Stock
Continued redemptions of stock will deplete our cash.
During 2017, we selectively purchased some of our Class A common stock from a small number of sophisticated shareholders in private transactions. In total, we redeemed more than 30,000 shares in the aggregate from eight shareholders. We may, within legal constraints, continue to repurchase stock, which will reduce our cash balance, cement our status as a personal holding company, and exacerbate our challenges under Section 382.
Purchases or sales of shares could significantly impact the price of our Class A common stock.
A small number of our shareholders hold a majority of our Class A common stock. Moreover, since we de-listed our Class A common stock from Nasdaq in mid-December 2017, trading in our stock has diminished and the price of our shares has fallen. Because of our concentrated holdings and limited trading volume, future purchases and sales of shares could have a significant impact on the price of our shares.
The interests of our controlling shareholder may conflict with the interests of other Class A holders.
Eagle River Satellite Holdings, LLC (“ERSH”), together with its affiliates Eagle River Investments, LLC (“ERI”), Eagle River, Inc. and Eagle River Partners, LLC (“ERP”) (collectively, “Eagle River”) controls approximately 68% of the voting power of our outstanding capital stock. Craig O. McCaw, our Executive Chairman, is the sole manager and beneficial member of ERI, which is the sole member of ERSH. Mr. McCaw is the sole shareholder of Eagle River, Inc. and the beneficial member of ERP. Accordingly, Eagle River has control over the outcome of matters requiring shareholder approval, including the election of directors, amendments to our governing documents, the adoption or prevention of mergers, consolidations or sales of all or substantially all of our assets, or control changes. Eagle River is not restricted or prohibited from competing with us.
We have delisted our shares from Nasdaq and are therefore not subject to Nasdaq corporate governance requirements.
Having delisted our Class A common stock from Nasdaq, we need not comply with Nasdaq corporate governance requirements, including (i) the requirement that a majority of the board of directors consist of independent directors, (ii) the requirement that the compensation of officers be determined, or recommended to the board of directors for determination, by a majority of the independent directors or a compensation committee comprised solely of independent directors, and (iii) the requirement that director nominees be selected, or recommended for the board of directors’ selection, by a majority of the independent directors or a nominating committee comprised solely of independent directors with a written charter or board resolution addressing the nomination process.
10
Our Tax Benefits Preservation Plan (“Tax Benefits Plan”), as well as certain provisions in our restated articles of incorporation, may discourage takeovers, which could affect the rights of holders of our Class A common stock.
Our Tax Benefits Plan is intended to act as a deterrent against any person or group acquiring or otherwise obtaining beneficial ownership of more than 4.9% of our securities without the approval of our board of directors. In addition, our articles of incorporation require us to take all necessary and appropriate action to protect certain rights of our common shareholders, including voting, dividend and conversion rights and rights in the event of a liquidation, merger, consolidation or sale of substantially all of our assets. Our articles of incorporation also provide that we will not avoid or seek to avoid the observance or performance of those rights by charter amendment, entry into an inconsistent agreement or reorganization, recapitalization, transfer of assets, consolidation, merger, dissolution or the issuance or sale of securities. The rights protected by these provisions of the articles of incorporation include our Class B common shareholders’ right to ten votes per share on matters submitted to a vote of our shareholders and option to convert each share of Class B common stock into one share of Class A common stock. The provisions of the Tax Benefits Plan and our articles of incorporation could discourage takeovers of our company, which could adversely affect the rights of our shareholders.
Having delisted, and in light of our pending de-registration, our ability to access the capital markets could be negatively impacted.
In December 2017, we delisted our common stock from Nasdaq, and filed a de-registration notice with the SEC to de-register our Class A common stock. Elimination of our SEC reporting obligations and delisting could harm our ability to raise capital through financing sources on terms acceptable to us, or at all, and result in the potential loss of confidence by investors, increased employee turnover, and fewer business development opportunities.
Having delisted, our trading volume and common stock price may remain depressed.
Our trading volume is relatively low, and since we delisted our shares from Nasdaq in December 2017, the price of our stock has fallen. In the absence of SEC reporting obligations and the absence of a listing on Nasdaq, trading volume may further decrease, in which case the market price of our Class A common stock could decline. More specifically, our stock (i) may be more thinly traded, making it more difficult for our shareholders to sell shares, (ii) may experience greater price volatility, and (iii) may not attract analyst coverage, all of which may result in a lower stock price. For these reasons and others, shareholders may not receive what they view as a fair price for their shares.
Once we have de-registered, it may be more difficult to trade our stock in compliance with laws.
Once we are no longer required to fulfill SEC reporting obligations, we may choose not to file current or periodic reports. Even if we choose to file reports, they likely will not be audited. The absence of those reports or the absence of an audit may mean that material information regarding the Company is not in the public domain, which may make it more difficult to buy or sell shares in compliance with applicable securities laws. For these reasons and others, shareholders may not receive what they view as a fair price for their shares.
If our number of record holders increases, we may be subject to SEC reporting obligations.
We have limited ability to control our shareholders’ acquisition or disposition of shares. If our number of record holders reaches 300 or higher, we would be required to re-register our Class A common stock with the SEC, in which case we would lose the corresponding cost-saving benefits that we anticipate achieving by delisting and de-registering.
11
None.
Our corporate headquarters are located in Kirkland, Washington, where we lease 8,050 square feet in Kirkland under a lease which expires on July 31, 2019. We currently sublease 2,882 square feet of that space and occupy the remaining 5,168 square feet.
We believe our facilities are adequate for our current business and operations.
See Note 7 – “Commitments and Contingencies” of the Notes to the Consolidated Financial Statements included in Item 8 of this report.
Not Applicable.
12
|
Item 5. |
Market for Registrant’s Common Equity, Related Stockholder Matters and Issuer Purchases of Equity Securities. |
Market for Our Class A Common Stock
Prior to December 15, 2017, our Class A common stock traded on the Nasdaq Capital Market under the symbol “PCO.” On December 15, 2017, we filed a Notification of Removal from Listing and/or Registration on Form 25, which prompted the Nasdaq Capital Market to suspend trading as of close of trading on December 15, 2017. We then filed a Form 15 with the SEC on December 26, 2017 to terminate the registration of our Class A common stock.
Our Class A common stock trades on OTC Pink® under the symbol “PCOA.”
At our annual meeting of shareholders in June 2017, our shareholders approved a 1-for-100 reverse stock split of our Class A common stock and Class B common stock that was implemented on November 30, 2017 (the "2017 Reverse Split"). The 2017 Reverse Split reduced our number of record shareholders to less than 300, which allowed us to (i) terminate our Nasdaq listing, effective December 15, 2017, (ii) file to de-register our Class A Stock under the Securities Exchange Act of 1934, as amended (the “Exchange Act”), which we filed on December 26, 2017; and (iii) cease to be a reporting company under the Exchange Act after our notice of de-registration is effective, which will be no later than March 26, 2018.
On September 20, 2017, our Board of Directors (the “Board”) announced that we do not currently plan to publish financial information following the expiration of our reporting obligations under the Exchange Act. As a result, we believe this Form 10-K for fiscal year ended December 31, 2017 will be our final financial statement filed with the SEC.
In September 2016, we consummated a 1-for-10 reverse stock split (the “2016 Reverse Split”) to remediate a stock price deficiency as required by Nasdaq’s continued listing requirements.
As a result of the 2017 and 2016 Reverse Splits, our share count, per share data and price per share reported in this annual report on Form 10-K have been adjusted retrospectively as if both reverse stock splits had been in effect for all periods presented.
The table below sets forth the high and low sales prices of our Class A common stock in U.S. dollars for each of the periods presented. Stock prices represent amounts published by Nasdaq and by OTC Markets®, as applicable. For prices on and after December 15, 2017, the quotations reflect inter-dealer prices, without retail mark-up, mark-down or commissions, and may not represent actual transactions. As of February 6, 2018, the last sales price of our Class A common stock reported by OTC Pink® was $551.61 per share.
|
|
|
2017 |
|
|
2016 |
|
||||||||||
|
Period |
|
High |
|
|
Low |
|
|
High |
|
|
Low |
|
||||
|
First Quarter |
|
$ |
739.00 |
|
|
$ |
609.00 |
|
|
$ |
654.80 |
|
|
$ |
461.00 |
|
|
Second Quarter |
|
$ |
723.00 |
|
|
$ |
597.00 |
|
|
$ |
692.70 |
|
|
$ |
485.00 |
|
|
Third Quarter |
|
$ |
747.00 |
|
|
$ |
621.00 |
|
|
$ |
733.00 |
|
|
$ |
500.00 |
|
|
Fourth Quarter |
|
$ |
739.03 |
|
|
$ |
575.00 |
|
|
$ |
723.00 |
|
|
$ |
605.00 |
|
As of February 6, 2018, there were approximately 166 record holders of our Class A common stock.
Market for Our Class B Common Stock
There is no established trading market for our Class B common stock, of which we have 53,660 shares outstanding with two holders of record. Each share of Class B common stock is convertible at any time at the option of its holder into one share of Class A common stock.
13
Dividends
On November 30, 2017, the Board declared a dividend of $12.32 per share, payable on shares outstanding after the 2017 Reverse Split. The dividend was paid on December 27, 2017 to shareholders of record on December 15, 2017. The Company elected to pay the dividend to shareholders, rather than incur personal holding company tax. See Note 11 – “Income Taxes” for further details.
Prior to 2017, the Company had never paid cash dividends on shares of its Class A or Class B common stock.
Unregistered Sales of Equity Securities and Use of Proceeds
The Class A Stock securities purchases described in the table below represent private stock purchase transactions from a small number of sophisticated shareholders (seven) in private transactions during the fourth quarter of 2017, as well as the fractionalization of shares pursuant to our 2017 Reverse Split:
|
|
|
Total Number of Shares Purchased |
|
|
Average Price Paid Per Share |
|
|
Total Number of Shares Purchased as Part of Publicly Announced Plans or Programs |
|
|
Approximate Dollar Value of Shares That May Yet Be Purchased Under the Publicly Announced Plans or Programs |
|
||||
|
October 1 – October 31, 2017 |
|
|
2,000 |
|
|
$ |
673.00 |
|
|
|
— |
|
|
|
— |
|
|
November 1 – November 30, 2017 |
|
|
1,945 |
|
|
|
526.44 |
|
|
|
— |
|
|
|
— |
|
|
December 1 – December 31, 2017 |
|
|
2,205 |
|
|
|
616.85 |
|
|
|
— |
|
|
|
— |
|
|
|
|
|
6,150 |
|
|
$ |
606.52 |
|
|
|
— |
|
|
|
— |
|
Securities Authorized for Issuance Under Equity Compensation Plans
The following table summarizes information, as of December 31, 2017, relating to Pendrell’s equity compensation plans pursuant to which grants of stock options, restricted stock, or other rights to acquire shares may be granted from time to time:
|
Plan Category |
|
Number of |
|
|
Weighted-average |
|
|
Number of |
|
|||
|
Equity compensation plans approved by security holders |
|
|
18,589 |
|
|
$ |
1,489.80 |
|
|
|
24,743 |
|
|
Equity compensation plans not approved by security holders |
|
|
— |
|
|
|
— |
|
|
|
— |
|
|
Total |
|
|
18,589 |
|
|
$ |
1,489.80 |
|
|
|
24,743 |
|
|
(1) |
Excludes 562 shares of restricted stock awards that remain subject to forfeiture. |
|
(2) |
Excludes the impact of 562 shares of restricted stock awards and 6,089 shares of restricted stock unit awards that have no exercise price. |
14
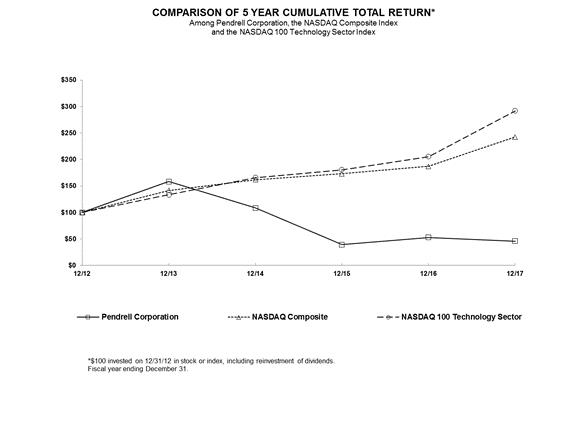
Performance Measurement Comparison
The following graph shows the total shareholder return as of the dates indicated of an investment of $100 in cash on December 31, 2012 for: (i) our Class A common stock; (ii) the Nasdaq Composite Index; and (iii) the Nasdaq 100 Technology Sector Index.
The stock price performance graph below is not necessarily indicative of future performance.
|
|
|
2012 |
|
|
2013 |
|
2014 |
|
2015 |
|
2016 |
|
2017 |
|
|
Pendrell Corporation |
|
|
100.00 |
|
|
158.27 |
|
108.66 |
|
39.46 |
|
53.15 |
|
46.05 |
|
NASDAQ Composite |
|
|
100.00 |
|
|
141.63 |
|
162.09 |
|
173.33 |
|
187.19 |
|
242.29 |
|
NASDAQ 100 Technology Sector |
|
|
100.00 |
|
|
133.55 |
|
165.92 |
|
180.58 |
|
205.54 |
|
291.88 |
15
The following selected consolidated financial data should be read in conjunction with “Item 7— Management’s Discussion and Analysis of Financial Condition and Results of Operations” and our consolidated financial statements and accompanying notes included in this Form 10-K.
|
|
|
Year Ended December 31, |
|
|||||||||||||||||
|
|
|
2017 |
|
|
2016 |
|
|
2015 |
|
|
2014 |
|
|
2013 |
|
|||||
|
|
|
(in thousands, except per share data) |
|
|||||||||||||||||
|
Revenue |
|
$ |
42,774 |
|
|
$ |
59,018 |
|
|
$ |
43,519 |
|
|
$ |
42,534 |
|
|
$ |
13,128 |
|
|
Operating expenses: |
|
|
|
|
|
|
|
|
|
|
|
|
|
|
|
|
|
|
|
|
|
Cost of revenues(1) |
|
|
409 |
|
|
|
18,156 |
|
|
|
10,215 |
|
|
|
14,170 |
|
|
|
7,872 |
|
|
Patent administration and related costs(1) |
|
|
916 |
|
|
|
1,046 |
|
|
|
2,668 |
|
|
|
6,386 |
|
|
|
4,405 |
|
|
Patent litigation(1) |
|
|
8,695 |
|
|
|
4,169 |
|
|
|
13,076 |
|
|
|
9,880 |
|
|
|
4,564 |
|
|
General and administrative(1) |
|
|
7,675 |
|
|
|
7,508 |
|
|
|
16,750 |
|
|
|
27,467 |
|
|
|
25,939 |
|
|
Stock-based compensation |
|
|
3,422 |
|
|
|
3,424 |
|
|
|
4,507 |
|
|
|
9,405 |
|
|
|
12,345 |
|
|
Amortization of intangible assets |
|
|
2,345 |
|
|
|
9,498 |
|
|
|
13,939 |
|
|
|
15,929 |
|
|
|
15,864 |
|
|
Contract termination costs(2) |
|
|
3,161 |
|
|
|
— |
|
|
|
— |
|
|
|
— |
|
|
|
— |
|
|
Impairment of intangible assets and goodwill(3) |
|
|
— |
|
|
|
— |
|
|
|
103,499 |
|
|
|
11,013 |
|
|
|
— |
|
|
Total operating expenses |
|
|
26,623 |
|
|
|
43,801 |
|
|
|
164,654 |
|
|
|
94,250 |
|
|
|
70,989 |
|
|
Operating income (loss) |
|
|
16,151 |
|
|
|
15,217 |
|
|
|
(121,135 |
) |
|
|
(51,716 |
) |
|
|
(57,861 |
) |
|
Net interest income (expense) |
|
|
1,603 |
|
|
|
696 |
|
|
|
103 |
|
|
|
(99 |
) |
|
|
(64 |
) |
|
Gain on contingencies (4) |
|
|
— |
|
|
|
2,047 |
|
|
|
6,095 |
|
|
|
— |
|
|
|
— |
|
|
Other expense |
|
|
(8 |
) |
|
|
(11 |
) |
|
|
(14 |
) |
|
|
(16 |
) |
|
|
(55 |
) |
|
Income (loss) before income taxes |
|
|
17,746 |
|
|
|
17,949 |
|
|
|
(114,951 |
) |
|
|
(51,831 |
) |
|
|
(57,980 |
) |
|
Income tax benefit (expense)(5) |
|
|
2,110 |
|
|
|
— |
|
|
|
(2,631 |
) |
|
|
(6,303 |
) |
|
|
— |
|
|
Net income (loss) |
|
|
19,856 |
|
|
|
17,949 |
|
|
|
(117,582 |
) |
|
|
(58,134 |
) |
|
|
(57,980 |
) |
|
Net income (loss) attributable to noncontrolling interest |
|
|
796 |
|
|
|
186 |
|
|
|
(7,902 |
) |
|
|
(7,132 |
) |
|
|
(2,918 |
) |
|
Net income (loss) attributable to Pendrell |
|
$ |
19,060 |
|
|
$ |
17,763 |
|
|
$ |
(109,680 |
) |
|
$ |
(51,002 |
) |
|
$ |
(55,062 |
) |
|
Basic income (loss) per share attributable to Pendrell |
|
$ |
76.28 |
|
|
$ |
66.38 |
|
|
$ |
(412.79 |
) |
|
$ |
(192.89 |
) |
|
$ |
(210.06 |
) |
|
Diluted income (loss) per share attributable to Pendrell |
|
$ |
74.22 |
|
|
$ |
64.15 |
|
|
$ |
(412.79 |
) |
|
$ |
(192.89 |
) |
|
$ |
(210.06 |
) |
|
Total assets |
|
$ |
208,184 |
|
|
$ |
212,393 |
|
|
$ |
180,892 |
|
|
$ |
304,104 |
|
|
$ |
351,994 |
|
|
Long-term obligations, including current portion of capital lease obligations(6) |
|
$ |
— |
|
|
|
7,796 |
|
|
$ |
— |
|
|
$ |
1,521 |
|
|
$ |
6,695 |
|
|
(1) |
Amounts in 2013 have been reclassified to conform to the current year presentation of expenses in our consolidated statements of operations, including the presentation of “cost of revenues” and “patent litigation” as separate captions; as such costs were previously included in “patent administration, litigation and related costs” and “general and administrative.” |
|
(2) |
Contract termination costs during the year ended December 31, 2017 represent the cost associated with the buy-out of the revenue share agreement from the company that sold us the bulk of our memory patents in 2013. |
|
(3) |
During the fourth quarter of the year ended December 31, 2015, we recorded a non-cash impairment charge of $103.5 million related to our patents, other intangible assets and goodwill. During the fourth quarter of the year ended December 31, 2014, we recorded a non-cash impairment charge of $11.0 million related to the goodwill and proprietary micro-propagation technology of Provitro Biosciences LLC (“Provitro”). In early 2015, we suspended further development of the Provitro™ proprietary micro-propagation technology and related laboratory processes that were designed to facilitate production on a commercial scale of certain plants, particularly timber bamboo. |
16
|
(4) |
During the years ended December 31, 2016 and 2015, we recorded gain on contingencies of $2.0 million and $3.9 million, respectively, due to the receipt of contingent payments associated with the disposition of MEO satellites and related launch vehicles of our prior satellite business. During the year ended December 31, 2015, we also recorded a gain on contingency associated with a $1.6 million settlement received from the J&J Group. See Note 10 - “Gain on Contingencies” for further discussion. |
|
(6) |
Prior to 2015, long-term obligations consisted primarily of deferred tax liabilities. Long-term obligations at December 31, 2013 also included an installment payment obligation arising from the 2013 acquisition of our memory and storage technologies portfolio and expense related to restricted stock awards that is required to be treated as a liability. Long-term obligations at December 31, 2016 consist primarily of revenue share obligations. |
17
The following discussion and analysis should be read in conjunction with our consolidated financial statements and accompanying notes included elsewhere in this Form 10-K.
Special Note Regarding Forward-Looking Statements
With the exception of historical facts, the statements contained in this management’s discussion and analysis are “forward-looking” statements. All of these forward-looking statements are subject to risks and uncertainties that could cause our actual results to differ materially from those contemplated by the relevant forward-looking statements. Factors that might cause or contribute to such a difference include, but are not limited to, those discussed under “Item 1A of Part I—Risk Factors” and elsewhere in this Form 10-K. The forward-looking statements included in this document are made only as of the date of this report, and we undertake no obligation to publicly update these forward-looking statements to reflect subsequent events or circumstances.
Overview
After more than a decade as a public company, we made the decision in 2017 to “go private” by delisting our Class A common stock from Nasdaq and filing for de-registration. We anticipate the delisting and de-registration will yield annual cost savings of more than one million dollars. As a non-reporting issuer, we also anticipate increased strategic and operational flexibility, with visibility to potential business partnerships that are not available as a reporting company.
As we worked through the delisting and de-registration process in 2017, the market price of our stock dropped to historically low levels: lower than our net book value per share and lower than our cash value per share. We responded by purchasing shares of our Class A common stock from a select number of sophisticated shareholders in private, exempt transactions. Federal and state securities laws limited our ability to aggressively repurchase stock, and those laws continue to impact ongoing stock repurchase efforts. However, within those legal constraints, we intend to repurchase additional shares in 2018 if those repurchases are accretive to our remaining shareholders.
While we work to capitalize on anticipated cost savings and operational flexibility from “going private," we continue our efforts to monetize our DRM Patents and our Memory Patents.
During the third quarter of 2017 we licensed our DRM Patents to The Walt Disney Company for Disney’s digital entertainment offerings. Disney joins Warner Bros and Sony Entertainment as licensees of the DRM Patents. Meanwhile, ContentGuard continues its dialogue with other movie studios and distributors of digital entertainment
Earlier in 2017, we settled our litigation against SanDisk Corporation and its affiliates, including Western Digital, by licensing our Memory Patents to SanDisk and its affiliates. The SanDisk license was the fifth significant Memory Patent license signed since we acquired the Memory Patents in 2013. Prior to 2017, pursuant to the agreement under which we acquired the Memory Patents, we shared a significant portion of license fees from our Memory Patents with the seller. In early 2017, the seller agreed to relinquish its future revenue share rights in exchange for an up-front payment and future installment payments. This resulted in a one-time charge of $3.2 million to expense in our first quarter of 2017, but significantly reduced our cost of revenues on future revenue from our Memory Patents. Our buyout of the seller’s future revenue share rights reflects our confidence in the value of our Memory Patents and our belief that standard compliant unlicensed flash memory component suppliers, solid state disk manufacturers and device vendors will ultimately need to obtain a license from us to continue their commercial activities.
In that regard, our licensing discussions with Kingston reached impasse in 2017, leading to our filing of a patent infringement suit in the federal district court for the Central District of California in early 2018, in which we seek monetary damages for Kingston’s infringement. Kingston has not yet answered our complaint, so we have no indication of whether Kingston will aggressively defend our lawsuit or be willing to negotiate a license to resolve our claims.
18
Management of our IP portfolio is not detracting us from our primary mission, which is identification of business opportunities that generate solid, stable income streams and greater growth potential. We have evaluated several opportunities. Although we have not reached agreement with any potential owners or partners, we continue to identify and evaluate new business opportunities.
Critical Accounting Policies
Critical accounting policies require difficult, subjective or complex judgments, often as a result of the need to make estimates about the effect of matters that are inherently uncertain. Our estimates and judgments are based on information available at the time the estimates and judgments are made. Actual results could differ materially from those estimates. We make estimates and judgments when accounting for, among other matters, intangible assets, revenue recognition, stock-based compensation, income taxes and contingencies, as more fully described below.
Intangible Assets. We amortize finite-lived intangible assets, including patents, acquired in purchase transactions over their expected useful lives. We evaluate finite-lived intangible assets when events or circumstances indicate that the carrying amount of an asset or asset group may not be recoverable. These events or circumstances could include: a significant change in the business climate, legal factors, operating performance indicators, or changes in technology or customer requirements. Recoverability of an asset or asset group is measured by a comparison of the carrying amount to the future undiscounted net cash flows expected to be generated by the asset or asset group over its life. This comparison requires management to make judgments regarding estimated future cash flows. Our ability to realize the estimated future cash flows may be affected by factors such as changes in operating performance, changes in business strategy, invalidation of patents, unfavorable judgments in legal proceedings and changes in economic conditions. If our estimates of the undiscounted cash flows do not equal or exceed the carrying value of the asset or asset group, we recognize an impairment charge equal to the amount by which the recorded value of the asset or asset group exceeds its fair value.
Revenue Recognition. We derive our operating revenue from IP monetization activities, including patent licensing and patent sales. Additionally, prior to our sale of the Ovidian Group LLC in December 2015, we also derived revenue from IP consulting services. Although our revenue may occur in different forms, we regard our IP monetization activities as integrated and not separate revenue streams. For example, a third party relationship could involve consulting and licensing activities, or the acquisition of a patent portfolio can lead to licensing, consulting and patent sales revenue.
Our patent licensing agreements often provide for the payment of contractually determined upfront license fees representing all or a majority of the revenues that will be generated from such agreements for nonexclusive, nontransferable, limited duration licenses. These agreements typically grant (i) a nonexclusive license to make, sell, distribute, and use certain specified products that read on our patents, (ii) a covenant not to enforce patent rights against the licensee based on such activities, and (iii) the release of the licensee from certain claims. Generally, the agreements provide no further obligation for the Company upon receipt of the minimum upfront license fee. As such, the earnings process is complete and revenue is recognized upon the execution of the agreement, when collectability is reasonably assured, or upon receipt of the minimum upfront license fee, and when all other revenue recognition criteria have been met.
Certain of our patent licensing agreements provide for future royalties or future payment obligations triggered upon satisfaction of conditions. Future royalties and future payments are recognized in revenue upon satisfaction of any related conditions, provided that all revenue recognition criteria, as described below, have been met.
We sell patents from our portfolios from time to time. These sales are part of our ongoing operations. Consequently, the related proceeds are recorded as revenue. We recognize the revenue when (i) persuasive evidence of an arrangement exists, (ii) delivery has occurred, (iii) amounts are fixed or determinable, and (iv) collectability is reasonably assured.
Fees earned from IP consulting services were generally recognized as the services were performed.
19
The timing and amount of revenue recognized from IP monetization activities depend on the specific terms of each agreement and the nature of the deliverables and obligations. For agreements that are deemed to contain multiple elements, consideration is allocated to each element of an agreement that has stand-alone value using the relative fair value method. We recognize revenue when (i) persuasive evidence of an arrangement exists, (ii) all material obligations have been substantially performed pursuant to agreement terms or services have been rendered to the customer, (iii) amounts are fixed or determinable, and (iv) collectability is reasonably assured. As a result of the contractual terms of our patent monetization agreements and the unpredictable nature, form and frequency of monetizing transactions, our revenue may fluctuate substantially from period to period.
Stock-Based Compensation. We record stock-based compensation on stock options, performance stock awards, restricted stock awards, restricted stock units and other stock awards issued to employees, directors, consultants and/or advisors based on the estimated fair value on the date of grant and recognize compensation cost over the requisite service period for awards expected to vest. The fair value of stock options are estimated on the date of grant using the Black-Scholes option pricing model (“Black-Scholes Model”) based on the single option award approach. The fair value of restricted stock awards and restricted stock units is determined based on the number of shares granted and either the quoted market price of our Class A common stock on the date of grant for time-based and performance-based awards, or the fair value on the date of grant using the Monte Carlo Simulation model (“Monte Carlo Simulation”) for market-based awards. The fair value of stock options, restricted stock awards and restricted stock units with service conditions are typically amortized to expense on a straight-line basis over the requisite service periods of the awards, which is generally the vesting period. The fair value of stock options, restricted stock awards and restricted stock units with performance conditions deemed probable of being achieved and cliff vesting are amortized to expense over the requisite service period using the straight-line method of expense recognition. The fair value of restricted stock awards and restricted stock units with performance and market conditions are amortized to expense over the requisite service period using the straight-line method of expense recognition. The fair value of stock-based payment awards as determined by the Black-Scholes Model and the Monte Carlo Simulation are affected by our stock price as well as other assumptions. These assumptions include, but are not limited to, the expected stock price volatility over the term of the awards and actual and projected employee stock option exercise behaviors. On January 1, 2017, we elected to change our accounting policy for calculating stock-based compensation based on forfeiture estimates to one that recognizes forfeitures when they occur (see “New Accounting Pronouncements” below). Previously, forfeitures were estimated at the date of grant and revised, if necessary, in subsequent periods if actual forfeitures differed from those estimates.
Income Taxes. We must make certain estimates and judgments in determining income tax expense for financial statement purposes. These estimates and judgments occur in the calculation of tax credits, tax benefits and deductions. Significant changes to these estimates may result in an increase or decrease to our tax provision in a subsequent period.
We must assess the likelihood that we will be able to recover our deferred tax assets. If recovery is not likely, we must record a valuation allowance against the deferred tax assets that we estimate will not ultimately be recoverable. Since our utilization of our deferred tax assets is dependent upon future taxable income that is not assured, we have recorded a valuation allowance sufficient to reduce the deferred tax assets to an amount that is more likely than not to be realized. However, should there be a change in our ability to recover our deferred tax assets, our tax provision would decrease or may result in a tax benefit in the period in which we determined that the recovery was more likely than not to occur.
The application of income tax law is inherently complex. As such, we are required to make many assumptions and judgments regarding our income tax positions and the likelihood whether such tax positions would be sustained if challenged. Interpretations and guidance surrounding income tax laws and regulations change over time, and changes in our assumptions and judgments can materially affect amounts recognized in our consolidated financial statements.
Contingencies. The outcomes of legal proceedings and claims brought by and against us are subject to significant uncertainty. We accrue an estimated loss from a loss contingency, such as a legal claim against us, by a charge to income if it is probable that an asset has been impaired or a liability has been incurred and the amount of the loss can be reasonably estimated. We disclose a contingency if there is at least a reasonable possibility that a loss has been incurred. In determining whether a contingent loss should be accrued or disclosed, we evaluate, among
20
other factors, the degree of probability of an unfavorable outcome and the ability to make a reasonable estimate of the amount of loss. Changes in these factors could materially impact our financial position, results of operations or cash flows. For contingencies that might result in a gain, we do not record the gain until realized.
New Accounting Pronouncements
See Note 2 – “Summary of Significant Accounting Policies” of the Notes to Consolidated Financial Statements (Part II, Item 8 of this Form 10-K) for further discussion.
Key Components of Results of Operations
Revenue—We derive our operating revenue from IP monetization activities, including patent licensing, patent sales and, prior to 2016, from IP consulting services, or a combination thereof. Although our revenue may occur in different forms, we regard our IP monetization activities as integrated and not separate revenue streams. Our revenues from IP monetization activities continue to depend in large part on our ability to enter into new license agreements with third parties. Because our licensing agreements often provide for the payment of upfront license fees rather than a royalty stream and as a result of the unpredictable nature, form and frequency of our transactions, our revenue may fluctuate substantially from period to period.
Cost of revenue—Cost of revenue consists of certain costs that are variable in nature and are directly attributable to our revenue generating activities including (i) payments to third parties to whom we have an obligation to share revenue, (ii) commissions, and (iii) success fees. Additionally, in periods when patent sales occur, cost of revenue includes the net book value and other related costs associated with the sold patents. Depending on the patents being monetized, revenue share payments as a percentage of revenues may vary significantly.
Patent administration and related costs—Patent administration and related costs are comprised of (i) patent-related maintenance and prosecution costs incurred to maintain our patents, (ii) other costs that support our patent monetization efforts, and (iii) costs associated with the abandonment of patents, including the write-off of any remaining net book value.
Patent litigation—Patent litigation costs consist of costs and expenses incurred in connection with our patent-related enforcement and litigation activities. These may include non-contingent or contingent fee obligations to external counsel.
General and administrative—General and administrative expenses are primarily comprised of (i) personnel costs, (ii) general legal fees, (iii) professional fees, (iv) acquisition investigation costs, and (v) general office related costs.
Stock-based compensation—Stock-based compensation expense includes expense associated with the granting of stock options, restricted stock awards, restricted stock units and other stock awards issued to employees, directors, consultants and/or advisors based on the estimated fair value on the date of grant and expensed over the requisite service period for awards expected to vest.
Amortization of intangible assets—Amortization of intangible assets reflects the expensing of the cost to acquire intangible assets which are capitalized and amortized ratably over their estimated useful lives. Estimating the economic useful lives of our intangible assets depends on various factors including the remaining statutory life of the underlying assets as well as their expected period of benefit.
21
Results of Operations
The following table is provided to facilitate the discussion of our results of operations for the years ended December 31, 2017, 2016 and 2015 (in thousands):
|
|
|
Year ended December 31, |
|
|||||||||
|
|
|
2017 |
|
|
2016 |
|
|
2015 |
|
|||
|
Revenue |
|
$ |
42,774 |
|
|
$ |
59,018 |
|
|
$ |
43,519 |
|
|
Cost of revenues |
|
|
409 |
|
|
|
18,156 |
|
|
|
10,215 |
|
|
Patent administration and related costs |
|
|
916 |
|
|
|
1,046 |
|
|
|
2,668 |
|
|
Patent litigation |
|
|
8,695 |
|
|
|
4,169 |
|
|
|
13,076 |
|
|
General and administrative |
|
|
7,675 |
|
|
|
7,508 |
|
|
|
16,750 |
|
|
Stock-based compensation |
|
|
3,422 |
|
|
|
3,424 |
|
|
|
4,507 |
|
|
Amortization of intangible assets |
|
|
2,345 |
|
|
|
9,498 |
|
|
|
13,939 |
|
|
Contract termination costs |
|
|
3,161 |
|
|
|
— |
|
|
|
— |
|
|
Impairment of intangible assets and goodwill |
|
|
— |
|
|
|
— |
|
|
|
103,499 |
|
|
Interest income |
|
|
1,603 |
|
|
|
696 |
|
|
|
156 |
|
|
Interest expense |
|
|
— |
|
|
|
— |
|
|
|
53 |
|
|
Gain on contingencies |
|
|
— |
|
|
|
2,047 |
|
|
|
6,095 |
|
|
Other expense |
|
|
8 |
|
|
|
11 |
|
|
|
14 |
|
|
Income tax benefit (expense) |
|
|
2,110 |
|
|
|
— |
|
|
|
(2,631) |
|
Revenue. Our revenue of $42.8 million for the year ended December 31, 2017 decreased by $16.2 million, or 28%, as compared to $59.0 million for the year ended December 31, 2016. The year over year decrease was primarily due to a decrease in licensing revenue, despite entering into licenses with SanDisk and Disney during the year.
Revenue of $59.0 million for the year ended December 31, 2016 increased by $15.5 million, or 36%, as compared to $43.5 million for the year ended December 31, 2015. The year over year increase was due to an increase in licensing revenue, primarily licenses of our Memory Patents including our May 2016 license agreement with Toshiba.
Cost of Revenues. Cost of revenues of $0.4 million for the year ended December 31, 2017 decreased by $17.8 million, or 98%, as compared to $18.2 million for the year ended December 31, 2016. This decrease was primarily due to lower revenue share obligations. Prior to 2017, we shared revenue with the party from whom we acquired the bulk of our memory patents. In early 2017, that party relinquished its future revenue share rights in exchange for an up-front payment and future installment payments. This resulted in a one-time charge of $3.2 million to expense in 2017 (see “Contract termination costs” below), but significantly reduced our “cost of revenues” from our memory patents.
Cost of revenues of $18.2 million for the year ended December 31, 2016 increased by $8.0 million, or 78%, as compared to $10.2 million for the year ended December 31, 2015. This increase was primarily due to costs associated with our May 2016 license agreement with Toshiba, including payments to third parties to whom we had an obligation to share revenue.
Patent Administration and Related Costs. Patent administration and related costs of $0.9 million for the year ended December 31, 2017 decreased by $0.1 million, or 12%, as compared to $1.0 million for the year ended December 31, 2016. Patent administration and related costs of $1.0 million for the year ended December 31, 2016 decreased by $1.7 million, or 61%, as compared to $2.7 million for the year ended December 31, 2015. The year over year decrease in all instances was primarily due to a decline in the cost of patents abandoned each year as compared to the prior year; as well as a reduction in patent maintenance and prosecution costs resulting from the sale and abandonment of certain patents and applications during current and prior years that were not part of existing licensing programs.
22
Patent Litigation. Patent litigation expenses of $8.7 million for the year ended December 31, 2017 increased by $4.5 million, or 109%, as compared to $4.2 million for the year ended December 31, 2016. The increase was primarily due to the contingent fees associated with our settlement and license agreement with SanDisk, partially offset by contingent fees incurred in 2016 associated with our settlement and license agreement with DirecTV.
Patent litigation expenses of $4.2 million for the year ended December 31, 2016 decreased by $8.9 million, or 68%, as compared to $13.1 million for the year ended December 31, 2015. The higher patent litigation expenses in 2015 included costs incurred by our subsidiary, ContentGuard, as it prepared for its March 2015 claim construction hearing and jury trials in September 2015 and November 2015 in the Google Litigation and Apple Litigation, as well as trial cost reimbursements, and contingent fees associated with our settlement and license agreement with Amazon. Patent litigation expenses for 2016 included costs and fees associated with our settlement and license agreement with DirecTV and costs incurred to pursue enforcement actions against certain companies with whom we have been unable to secure negotiated licenses.
General and Administrative. General and administrative expenses of $7.7 million for the year ended December 31, 2017 increased by $0.2 million, or 2%, as compared to $7.5 million for the year ended December 31, 2016. The increase was primarily due to a $0.4 million contingent fee incurred in obtaining the 2017 tax refund (discussed below) and a $0.2 million discretionary bonus payment to the Company’s CEO in the first quarter of 2017 partially offset by a $0.1 million reduction in employment expenses resulting from a lower headcount in 2017 and a $0.3 million decrease in professional fees and other expenses.
General and administrative expenses of $7.5 million for the year ended December 31, 2016 decreased by $9.3 million, or 55%, as compared to $16.8 million for the year ended December 31, 2015. The decrease was primarily due to (i) $5.5 million reduction in employment expenses resulting from a lower headcount, (ii) $1.0 million loss on the sale of Provitro’s assets and the disposal of corporate office assets incurred in 2015, (iii) $0.7 million reduction in expenses associated with Provitro, (iv) $0.9 million reduction in facilities costs and $0.3 million decrease in depreciation expense due to the closure of office locations, and (v) $0.9 million reduction in professional fees and other expenses.
Stock-based Compensation. Stock-based compensation of $3.4 million for the year ended December 31, 2017 remained flat as compared to $3.4 million for the year ended December 31, 2016, as higher valued CEO performance awards offset a reduction in expense for awards that became fully vested in 2016.
Stock-based compensation of $3.4 million for the year ended December 31, 2016 decreased by $1.1 million, or 24%, as compared to $4.5 million for the year ended December 31, 2015. The decrease was primarily due to a lower headcount in 2016 versus 2015, partially offset by expense associated with awards issued in June 2015 to our CEO.
Amortization of Intangible Assets. Amortization of intangible assets of $2.3 million for the year ended December 31, 2017 decreased by $7.2 million, or 75%, as compared to $9.5 million for the year ended December 31, 2016 primarily due to patents being abandoned or becoming fully amortized as they reached their estimated useful life with no additional patents added to our portfolio.
Amortization of intangible assets of $9.5 million for the year ended December 31, 2016 decreased by $4.4 million, or 32%, as compared to $13.9 million for the year ended December 31, 2015 due to a reduction in value of our intangible assets as a result of their impairment during the fourth quarter of 2015, partially offset by a change in their estimated useful lives.
Contract Termination Costs. Contract termination costs of $3.2 million for the year ended December 31, 2017 represent the cost associated with the buy-out of the revenue share agreement from the company that sold us the bulk of our memory patents in 2013.
Impairment of Intangible Assets and Goodwill. During the fourth quarter of the year ended December 31, 2015, we recorded an impairment charge of $103.5 million due to a reduction in the carrying value of our IP and goodwill as a result of the non-infringement verdicts in the Google Litigation and Apple Litigation.
23
The Company recorded no such impairment charges during the years ended December 31, 2017 and 2016.
Interest Income. Interest income for the years ended December 31, 2017, 2016 and 2015 primarily related to interest earned on money market funds.
Interest Expense. Interest expense of $0.1 million for the year ended December 31, 2015 consisted primarily of interest expense resulting from the installment payment obligations associated with intangible assets acquired during 2013. The payment obligation was satisfied in March 2015 and no further interest expense is being incurred.
Gain on Contingencies. Gain on contingencies of $2.0 million for the year ended December 31, 2016 was due to the receipt of contingent payments associated with the disposition of assets of our prior satellite business. Gain on contingencies of $6.1 million for the year ended December 31, 2015 was due to (i) $3.9 million from the disposition of assets associated with our former satellite business, (ii) $1.6 million, net of collection costs, upon the full and final settlement of all claims against the J&J Group, and (iii) $0.5 million from the release of a tax indemnification liability associated with our acquisition of Ovidian in June 2011.
Other Expense. Other expense for the year ended December 31, 2017, 2016 and 2015 was due to losses on foreign currency transactions.
Income Tax Benefit (Expense). We did not have a U.S. federal income tax liability for the years ended December 31, 2017, 2016 or 2015. However, the Company recorded an income tax benefit of $2.1 million in 2017 primarily related to a state income tax refund. During the fourth quarter of 2017, our ContentGuard subsidiary settled an ongoing dispute with the State of California related to income tax paid to the state prior to our acquisition of ContentGuard. We expect to receive the proceeds from this settlement in the first quarter of 2018.
We recorded a tax provision of $4.1 million for the year end December 31, 2015 related to foreign taxes withheld on revenue generated from a license agreement executed with a licensee domiciled in a foreign jurisdiction. In general, foreign taxes withheld may be claimed as a deduction on future U.S. corporate income tax returns, or as a credit against future US federal income tax liabilities, subject to certain limitations. However, due to our uncertainty regarding our ability to utilize the deduction or credit resulting from the foreign withholding, we established a full valuation allowance against this deferred tax asset. Additionally, during the year ended December 31, 2015, as a result of the impairment of certain indefinite-lived intangible assets, the deferred tax liability associated with these intangibles was decreased, resulting in a tax benefit of $1.5 million, resulting in a net provision for the year ended December 31, 2015 of $2.6 million.
Liquidity and Capital Resources
Overview. As of December 31, 2017, we had cash and cash equivalents of $184.5 million. Our primary expected cash needs for the next twelve months include repurchases of shares from our shareholders, ongoing operating costs associated with commercialization of our IP assets, expenses in connection with legal proceedings, expenses associated with researching new business opportunities and other general corporate purposes. We may also use our cash, and may incur debt or issue equity, to acquire or invest in other businesses or assets.
We believe our current balances of cash and cash equivalents and cash flows from operations will be adequate to meet our liquidity needs for the foreseeable future. Cash and cash equivalents in excess of our immediate needs are held in interest bearing accounts with financial institutions.
24
Cash and Cash Equivalents. Cash and cash equivalents were $184.5 million at December 31, 2017, compared to $174.6 million at December 31, 2016. The following table is provided to facilitate the discussion of our liquidity and capital resources for the years ended December 31, 2017 and 2016 (in thousands):
|
|
|
Year ended December 31, |
|
|||||
|
|
|
2017 |
|
|
2016 |
|
||
|
Net cash provided by (used in): |
|
|
|
|
|
|
|
|
|
Operating activities |
|
$ |
31,875 |
|
|
$ |
10,926 |
|
|
Investing activities |
|
|
642 |
|
|
|
1,288 |
|
|
Financing activities |
|
|
(22,666 |
) |
|
|
(40 |
) |
|
Net increase in cash and cash equivalents |
|
|
9,851 |
|
|
|
12,174 |
|
|
Cash and cash equivalents—beginning of period |
|
|
174,631 |
|
|
|
162,457 |
|
|
Cash and cash equivalents—end of period |
|
$ |
184,482 |
|
|
$ |
174,631 |
|
The increase in cash and cash equivalents for the year ended December 31, 2017 of $9.9 million was primarily due to $56.1 million of collected revenue and the receipt of a $0.6 million installment payment on a note receivable, partially offset by (i) $18.0 million of general corporate expenditures, (ii) $19.7 million paid to repurchase shares and (iii) $9.1 million paid on revenue share obligations.
The increase in cash and cash equivalents for the year ended December 31, 2016 of $12.2 million was primarily due to $28.6 million of collected revenue, $2.0 million received from the disposition of assets associated with our former satellite business and the receipt of $1.3 million in installment payments on a note receivable, partially offset by $13.7 million of general corporate expenditures and $6.0 million paid on revenue share obligations.
Cash Flows from Operating Activities. Cash provided by operating activities of $31.9 million for the year ended December 31, 2017 consisted primarily of revenue generated by operations of $56.1 million and $1.6 million of interest income, partially offset by $26.6 million of operating expenses adjusted for various non-cash items including (a) $3.4 million of stock-based compensation expense, (b) $2.4 million of amortization expense associated with intangible assets and (c) $0.1 million of depreciation and costs associated with abandonment of patents, as well as a $4.9 million decrease in accrued expenses and other current liabilities primarily related to revenue share obligations accrued at December 31, 2016.
For the year ended December 31, 2016, the $10.9 million of cash provided by operating activities consisted primarily of (i) revenue generated by operations of $59.0 million, (ii) $2.0 million received from the disposition of assets associated with our former satellite business, and (iii) $0.7 million of interest income, partially offset by a $30.4 million increase in accounts receivable and operating expenses of $43.8 million adjusted for various non-cash items including (a) $9.5 million of amortization expense associated with intangible assets, (b) $3.4 million of stock-based compensation expense, and (c) $0.3 million of depreciation and costs associated with abandonment of patents, as well as a $10.2 million increase in accounts payable, accrued expenses and other current/non-current liabilities.
Cash Flows from Investing Activities. Cash provided by investing activities of $0.6 million for the year ended December 31, 2017 and $1.3 million for the year ended December 31, 2016 was primarily due to the receipt of installment payments associated with the sale of the Provitro assets in 2015.
Cash Flows from Financing Activities. Cash used in financing activities of $22.7 million for the year ended December 31, 2017 was primarily due to $19.7 million utilized to repurchase shares of our Class A common stock and $3.0 million utilized to pay a cash dividend of $12.32 per share to our shareholders in December 2017.
For the year ended December 31, 2016, the $40,000 of cash used in financing activities related to statutory taxes paid as a result of the vesting of restricted stock awards.
25
Contractual Obligations. Our primary contractual obligations relate to an operating lease agreement for our main office location in Kirkland, Washington. Our contractual obligations as of December 31, 2017, were as follows (in thousands):
|
|
|
Years ending December 31, |
||||||||||||||||
|
|
|
Total |
|
|
2018 |
|
|
2019 |
|
|
2020 and Thereafter |
|
|
|
||||
|
Operating lease obligations |
|
$ |
553 |
|
|
$ |
348 |
|
|
$ |
205 |
|
|
$ |
— |
|
|
|
Inflation
The impact of inflation on our consolidated financial condition and results of operations was not significant during any of the years presented.
Off-Balance Sheet Arrangements
We do not have any off-balance sheet arrangements.
We have assessed our vulnerability to certain market risks, including interest rate risk associated with our accounts receivable, accounts payable, other liabilities, and cash and cash equivalents and foreign currency risk associated with our cash held in foreign currencies.
As of December 31, 2017, our cash and investment portfolio consisted of both cash and money market funds with a fair value of $184.5 million. The primary objective of our investments in money market funds is to preserve principal while optimizing returns and minimizing risk, and our policies require, at the time of purchase, that we make these investments in short-term, high rated securities which currently yield between zero to 150 basis points.
|
|
|
December 31, 2017 |
|
|
|
Cash |
|
$ |
15,200 |
|
|
Money market funds |
|
|
169,282 |
|
|
|
|
$ |
184,482 |
|
Our primary foreign currency exposure relates to cash balances in foreign currencies. Due to the small balances we hold, we have determined that the risk associated with foreign currency fluctuations is not material to us.
26
REPORT OF INDEPENDENT REGISTERED PUBLIC ACCOUNTING FIRM
Board of Directors and Shareholders
Pendrell Corporation
Opinion on the financial statements:
We have audited the accompanying consolidated balance sheets of Pendrell Corporation Inc. (a Washington corporation) and subsidiaries (the “Company”) as of December 31, 2017 and 2016, the related consolidated statements of operations, changes in shareholders’ equity, and cash flows for each of the three years in the period ended December 31, 2017, and the related notes (collectively referred to as the “financial statements”). In our opinion, the financial statements present fairly, in all material respects, the financial position of the Company as of December 31, 2017 and 2016, and the results of its operations and its cash flows for each of the three years in the period ended December 31, 2017, in conformity with accounting principles generally accepted in the United States of America.
We also have audited, in accordance with the standards of the Public Company Accounting Oversight Board (United States) (“PCAOB”), the Company’s internal control over financial reporting as of December 31, 2017, based on criteria established in the 2013 Internal Control—Integrated Framework issued by the Committee of Sponsoring Organizations of the Treadway Commission (“COSO”), and our report dated February 16, 2018 expressed an unqualified opinion.
Basis for opinion:
These financial statements are the responsibility of the Company’s management. Our responsibility is to express an opinion on the Company’s financial statements based on our audits. We are a public accounting firm registered with the PCAOB and are required to be independent with respect to the Company in accordance with the U.S. federal securities laws and the applicable rules and regulations of the Securities and Exchange Commission and the PCAOB.
We conducted our audits in accordance with the standards of the PCAOB. Those standards require that we plan and perform the audit to obtain reasonable assurance about whether the financial statements are free of material misstatement, whether due to error or fraud. Our audits included performing procedures to assess the risks of material misstatement of the financial statements, whether due to error or fraud, and performing procedures that respond to those risks. Such procedures included examining, on a test basis, evidence supporting the amounts and disclosures in the financial statements. Our audits also included evaluating the accounting principles used and significant estimates made by management, as well as evaluating the overall presentation of the financial statements. We believe that our audits provide a reasonable basis for our opinion.
/s/ GRANT THORNTON LLP
We have served as the Company’s auditor since 2014.
Seattle, Washington
February 16, 2018
27
Pendrell Corporation
Consolidated Balance Sheets
(In thousands, except share data)
|
|
|
December 31, 2017 |
|
|
December 31, 2016 |
|
||
|
ASSETS |
|
|
|
|
|
|
|
|
|
Current assets: |
|
|
|
|
|
|
|
|
|
Cash and cash equivalents |
|
$ |
184,482 |
|
|
$ |
174,631 |
|
|
Accounts receivable |
|
|
17,361 |
|
|
|
15,457 |
|
|
Income tax receivable, net |
|
|
2,161 |
|
|
|
— |
|
|
Other receivables |
|
|
118 |
|
|
|
669 |
|
|
Prepaid expenses and other current assets |
|
|
351 |
|
|
|
262 |
|
|
Total current assets |
|
|
204,473 |
|
|
|
191,019 |
|
|
Property in service – net of accumulated depreciation of $548 and $531, respectively |
|
|
44 |
|
|
|
74 |
|
|
Non-current accounts receivable |
|
|
1,309 |
|
|
|
16,555 |
|
|
Other assets |
|
|
29 |
|
|
|
29 |
|
|
Intangible assets – net of accumulated amortization of $56,224 and $61,080, respectively |
|
|
2,329 |
|
|
|
4,716 |
|
|
Total |
|
$ |
208,184 |
|
|
$ |
212,393 |
|
|
LIABILITIES, SHAREHOLDERS’ EQUITY AND NONCONTROLLING INTEREST |
|
|
|
|
|
|
|
|
|
Current liabilities: |
|
|
|
|
|
|
|
|
|
Accounts payable |
|
$ |
136 |
|
|
$ |
125 |
|
|
Accrued expenses |
|
|
8,797 |
|
|
|
6,278 |
|
|
Other liabilities |
|
|
64 |
|
|
|
95 |
|
|
Total current liabilities |
|
|
8,997 |
|
|
|
6,498 |
|
|
Other non-current liabilities |
|
|
— |
|
|
|
7,796 |
|
|
Total liabilities |
|
|
8,997 |
|
|
|
14,294 |
|
|
Commitments and contingencies (Note 7) |
|
|
|
|
|
|
|
|
|
Shareholders’ equity and noncontrolling interest: |
|
|
|
|
|
|
|
|
|
Preferred stock, $0.01 par value, 75,000,000 shares authorized, no shares issued or outstanding |
|
|
— |
|
|
|
— |
|
|
Class A common stock, $0.01 par value, 900,000,000 shares authorized, 186,927 and 272,682 shares issued, and 186,927 and 214,913 shares outstanding |
|
|
2,124 |
|
|
|
2,151 |
|
|
Class B convertible common stock, $0.01 par value, 150,000,000 shares authorized, 84,663 shares issued and 53,660 shares outstanding |
|
|
537 |
|
|
|
537 |
|
|
Additional paid-in capital |
|
|
1,948,472 |
|
|
|
1,962,178 |
|
|
Accumulated deficit |
|
|
(1,747,160 |
) |
|
|
(1,763,060 |
) |
|
Total Pendrell shareholders’ equity |
|
|
203,973 |
|
|
|
201,806 |
|
|
Noncontrolling interest |
|
|
(4,786 |
) |
|
|
(3,707 |
) |
|
Total shareholders’ equity and noncontrolling interest |
|
|
199,187 |
|
|
|
198,099 |
|
|
Total |
|
$ |
208,184 |
|
|
$ |
212,393 |
|
The accompanying notes are an integral part of these consolidated financial statements.
28
Pendrell Corporation
Consolidated Statements of Operations
(In thousands, except share and per share data)
|
|
|
Year ended December 31, |
|
|||||||||
|
|
|
2017 |
|
|
2016 |
|
|
2015 |
|
|||
|
Revenue |
|
$ |
42,774 |
|
|
$ |
59,018 |
|
|
$ |
43,519 |
|
|
Operating expenses: |
|
|
|
|
|
|
|
|
|
|
|
|
|
Cost of revenues |
|
|
409 |
|
|
|
18,156 |
|
|
|
10,215 |
|
|
Patent administration and related costs |
|
|
916 |
|
|
|
1,046 |
|
|
|
2,668 |
|
|
Patent litigation |
|
|
8,695 |
|
|
|
4,169 |
|
|
|
13,076 |
|
|
General and administrative |
|
|
7,675 |
|
|
|
7,508 |
|
|
|
16,750 |
|
|
Stock-based compensation |
|
|
3,422 |
|
|
|
3,424 |
|
|
|
4,507 |
|
|
Amortization of intangible assets |
|
|
2,345 |
|
|
|
9,498 |
|
|
|
13,939 |
|
|
Contract termination costs |
|
|
3,161 |
|
|
|
— |
|
|
|
— |
|
|
Impairment of intangible assets and goodwill |
|
|
— |
|
|
|
— |
|
|
|
103,499 |
|
|
Total operating expenses |
|
|
26,623 |
|
|
|
43,801 |
|
|
|
164,654 |
|
|
Operating income (loss) |
|
|
16,151 |
|
|
|
15,217 |
|
|
|
(121,135 |
) |
|
Interest income |
|
|
1,603 |
|
|
|
696 |
|
|
|
156 |
|
|
Interest expense |
|
|
— |
|
|
|
— |
|
|
|
(53 |
) |
|
Gain on contingencies |
|
|
— |
|
|
|
2,047 |
|
|
|
6,095 |
|
|
Other expense |
|
|
(8 |
) |
|
|
(11 |
) |
|
|
(14 |
) |
|
Income (loss) before income taxes |
|
|
17,746 |
|
|
|
17,949 |
|
|
|
(114,951 |
) |
|
Income tax benefit (expense) |
|
|
2,110 |
|
|
|
— |
|
|
|
(2,631 |
) |
|
Net income (loss) |
|
|
19,856 |
|
|
|
17,949 |
|
|
|
(117,582 |
) |
|
Net income (loss) attributable to noncontrolling interests |
|
|
796 |
|
|
|
186 |
|
|
|
(7,902 |
) |
|
Net income (loss) attributable to Pendrell |
|
$ |
19,060 |
|
|
$ |
17,763 |
|
|
$ |
(109,680 |
) |
|
Basic income (loss) per share attributable to Pendrell |
|
$ |
76.28 |
|
|
$ |
66.38 |
|
|
$ |
(412.79 |
) |
|
Diluted income (loss) per share attributable to Pendrell |
|
$ |
74.22 |
|
|
$ |
64.15 |
|
|
$ |
(412.79 |
) |
|
Weighted average shares outstanding: |
|
|
|
|
|
|
|
|
|
|
|
|
|
Basic |
|
|
249,866 |
|
|
|
267,589 |
|
|
|
265,707 |
|
|
Diluted |
|
|
256,814 |
|
|
|
276,918 |
|
|
|
265,707 |
|
The accompanying notes are an integral part of these consolidated financial statements.
29
Pendrell Corporation
Consolidated Statements of Changes in Shareholders’ Equity
(In thousands, except share data)
|
|
|
Common stock |
|
|
Additional |
|
|
|
|
|
|
|
|
|
|
|
|
|
||||||||||||||
|
|
|
Class A |
|
|
Class B |
|
|
|
|
|
paid-in |
|
|
Accumulated |
|
|
Shareholder’s |
|
|
Noncontrolling |
|
|
|
|
||||||||
|
|
|
shares |
|
|
shares |
|
|
Amount |
|
|
capital |
|
|
deficit |
|
|
equity |
|
|
interests |
|
|
Total |
|
||||||||
|
Balance, January 1, 2015 |
|
|
212,975 |
|
|
|
53,660 |
|
|
$ |
2,669 |
|
|
$ |
1,952,880 |
|
|
$ |
(1,671,135 |
) |
|
$ |
284,414 |
|
|
$ |
5,173 |
|
|
$ |
289,587 |
|
|
Issuance of Class A common stock from exercise of stock options |
|
|
358 |
|
|
|
— |
|
|
|
4 |
|
|
|
215 |
|
|
|
— |
|
|
|
219 |
|
|
|
— |
|
|
|
219 |
|
|
Class A common stock withheld at vesting to cover statutory tax obligations |
|
|
(39 |
) |
|
|
— |
|
|
|
(1 |
) |
|
|
(131 |
) |
|
|
(8 |
) |
|
|
(140 |
) |
|
|
— |
|
|
|
(140 |
) |
|
Stock-based compensation and issuance of restricted stock, net of forfeitures |
|
|
1,156 |
|
|
|
— |
|
|
|
12 |
|
|
|
4,693 |
|
|
|
— |
|
|
|
4,705 |
|
|
|
— |
|
|
|
4,705 |
|
|
Repurchase of restricted stock |
|
|
(250 |
) |
|
|
— |
|
|
|
(2 |
) |
|
|
— |
|
|
|
— |
|
|
|
(2 |
) |
|
|
— |
|
|
|
(2 |
) |
|
Shares received through divesture of Ovidian |
|
|
(92 |
) |
|
|
— |
|
|
|
(1 |
) |
|
|
(45 |
) |
|
|
— |
|
|
|
(46 |
) |
|
|
— |
|
|
|
(46 |
) |
|
Purchase of noncontrolling interest in Provitro Biosciences LLC |
|
|
— |
|
|
|
— |
|
|
|
— |
|
|
|
764 |
|
|
|
— |
|
|
|
764 |
|
|
|
(1,164 |
) |
|
|
(400 |
) |
|
Net loss |
|
|
— |
|
|
|
— |
|
|
|
— |
|
|
|
— |
|
|
|
(109,680 |
) |
|
|
(109,680 |
) |
|
|
(7,902 |
) |
|
|
(117,582 |
) |
|
Balance, December 31, 2015 |
|
|
214,108 |
|
|
|
53,660 |
|
|
$ |
2,681 |
|
|
$ |
1,958,376 |
|
|
$ |
(1,780,823 |
) |
|
$ |
180,234 |
|
|
$ |
(3,893 |
) |
|
$ |
176,341 |
|
|
Class A common stock withheld at vesting to cover statutory tax obligations |
|
|
(63 |
) |
|
|
— |
|
|
|
— |
|
|
|
(40 |
) |
|
|
— |
|
|
|
(40 |
) |
|
|
— |
|
|
|
(40 |
) |
|
Stock-based compensation and issuance of restricted stock, net of forfeitures |
|
|
868 |
|
|
|
— |
|
|
|
7 |
|
|
|
3,842 |
|
|
|
— |
|
|
|
3,849 |
|
|
|
— |
|
|
|
3,849 |
|
|
Net income |
|
|
— |
|
|
|
— |
|
|
|
— |
|
|
|
— |
|
|
|
17,763 |
|
|
|
17,763 |
|
|
|
186 |
|
|
|
17,949 |
|
|
Balance, December 31, 2016 |
|
|
214,913 |
|
|
|
53,660 |
|
|
$ |
2,688 |
|
|
$ |
1,962,178 |
|
|
$ |
(1,763,060 |
) |
|
$ |
201,806 |
|
|
$ |
(3,707 |
) |
|
$ |
198,099 |
|
|
Repurchase of Class A common stock |
|
|
(30,478 |
) |
|
|
— |
|
|
|
(28 |
) |
|
|
(19,638 |
) |
|
|
— |
|
|
|
(19,666 |
) |
|
|
— |
|
|
|
(19,666 |
) |
|
Shares relinquished by the Liquidating Trust |
|
|
(200 |
) |
|
|
— |
|
|
|
— |
|
|
|
— |
|
|
|
— |
|
|
|
— |
|
|
|
— |
|
|
|
— |
|
|
Stock-based compensation and issuance of restricted stock, net of forfeitures |
|
|
2,692 |
|
|
|
— |
|
|
|
1 |
|
|
|
3,830 |
|
|
|
— |
|
|
|
3,831 |
|
|
|
— |
|
|
|
3,831 |
|
|
Effect of accounting change to zero forfeitures for stock-based compensation |
|
|
— |
|
|
|
— |
|
|
|
— |
|
|
|
177 |
|
|
|
(177 |
) |
|
|
— |
|
|
|
— |
|
|
|
— |
|
|
Sale of noncontrolling interest in subsidiary |
|
|
— |
|
|
|
— |
|
|
|
— |
|
|
|
1,925 |
|
|
|
— |
|
|
|
1,925 |
|
|
|
(1,875 |
) |
|
|
50 |
|
|
Dividend ($12.32 per share) |
|
|
— |
|
|
|
— |
|
|
|
— |
|
|
|
— |
|
|
|
(2,983 |
) |
|
|
(2,983 |
) |
|
|
— |
|
|
|
(2,983 |
) |
|
Net income |
|
|
— |
|
|
|
— |
|
|
|
— |
|
|
|
— |
|
|
|
19,060 |
|
|
|
19,060 |
|
|
|
796 |
|
|
|
19,856 |
|
|
Balance, December 31, 2017 |
|
|
186,927 |
|
|
|
53,660 |
|
|
$ |
2,661 |
|
|
$ |
1,948,472 |
|
|
$ |
(1,747,160 |
) |
|
$ |
203,973 |
|
|
$ |
(4,786 |
) |
|
$ |
199,187 |
|
The accompanying notes are an integral part of these consolidated financial statements.
30
Pendrell Corporation
Consolidated Statements of Cash Flows
(In thousands, except share data)
|
|
|
Year ended December 31, |
|
|||||||||
|
|
|
2017 |
|
|
2016 |
|
|
2015 |
|
|||
|
Operating activities: |
|
|
|
|
|
|
|
|
|
|
|
|
|
Net income (loss) including noncontrolling interest |
|
$ |
19,856 |
|
|
$ |
17,949 |
|
|
$ |
(117,582 |
) |
|
Adjustments to reconcile net income (loss) to net cash provided by (used in) operating activities: |
|
|
|
|
|
|
|
|
|
|
|
|
|
Stock-based compensation |
|
|
3,422 |
|
|
|
3,424 |
|
|
|
4,507 |
|
|
Amortization of intangible assets |
|
|
2,345 |
|
|
|
9,498 |
|
|
|
13,939 |
|
|
Impairment of intangible assets and goodwill |
|
|
— |
|
|
|
— |
|
|
|
103,499 |
|
|
Depreciation |
|
|
37 |
|
|
|
51 |
|
|
|
351 |
|
|
Non-cash cost of patents monetized |
|
|
— |
|
|
|
— |
|
|
|
138 |
|
|
Loss associated with the abandonment and/or disposition of patents |
|
|
41 |
|
|
|
163 |
|
|
|
958 |
|
|
Loss on the disposition of property |
|
|
— |
|
|
|
— |
|
|
|
1,015 |
|
|
Other |
|
|
— |
|
|
|
4 |
|
|
|
3 |
|
|
Other changes in certain assets and liabilities: |
|
|
|
|
|
|
|
|
|
|
|
|
|
Accounts receivable, current and non-current |
|
|
13,342 |
|
|
|
(30,423 |
) |
|
|
44 |
|
|
Income tax receivable, net |
|
|
(2,161 |
) |
|
|
— |
|
|
|
— |
|
|
Prepaid expenses and other current/non-current assets |
|
|
(138 |
) |
|
|
91 |
|
|
|
(1,108 |
) |
|
Accounts payable |
|
|
11 |
|
|
|
(15 |
) |
|
|
(141 |
) |
|
Accrued expenses and other current liabilities |
|
|
(4,880 |
) |
|
|
2,388 |
|
|
|
(5,670 |
) |
|
Other non-current liabilities |
|
|
— |
|
|
|
7,796 |
|
|
|
— |
|
|
Net cash provided by (used in) operating activities |
|
|
31,875 |
|
|
|
10,926 |
|
|
|
(47 |
) |
|
Investing activities: |
|
|
|
|
|
|
|
|
|
|
|
|
|
Payment received on note receivable |
|
|
600 |
|
|
|
1,300 |
|
|
|
— |
|
|
Sale of noncontrolling interest in subsidiary |
|
|
50 |
|
|
|
— |
|
|
|
— |
|
|
Purchases of property in service and intangible assets |
|
|
(8 |
) |
|
|
(12 |
) |
|
|
(2,077 |
) |
|
Proceeds associated with disposition of property |
|
|
— |
|
|
|
— |
|
|
|
109 |
|
|
Net cash provided by (used in) investing activities |
|
|
642 |
|
|
|
1,288 |
|
|
|
(1,968 |
) |
|
Financing activities: |
|
|
|
|
|
|
|
|
|
|
|
|
|
Repurchase of Class A common stock |
|
|
(19,666 |
) |
|
|
— |
|
|
|
— |
|
|
Cash dividend paid |
|
|
(2,983 |
) |
|
|
— |
|
|
|
— |
|
|
Payment of statutory taxes for stock awards |
|
|
(17 |
) |
|
|
(40 |
) |
|
|
(140 |
) |
|
Proceeds from exercise of stock options |
|
|
— |
|
|
|
— |
|
|
|
219 |
|
|
Payment of accrued obligations for purchased intangible assets |
|
|
— |
|
|
|
— |
|
|
|
(4,000 |
) |
|
Purchase of noncontrolling interest in Provitro Bioscience LLC |
|
|
— |
|
|
|
— |
|
|
|
(400 |
) |
|
Net cash used in financing activities |
|
|
(22,666 |
) |
|
|
(40 |
) |
|
|
(4,321 |
) |
|
Net increase (decrease) in cash and cash equivalents |
|
|
9,851 |
|
|
|
12,174 |
|
|
|
(6,336 |
) |
|
Cash and cash equivalents—beginning of period |
|
|
174,631 |
|
|
|
162,457 |
|
|
|
168,793 |
|
|
Cash and cash equivalents—end of period |
|
$ |
184,482 |
|
|
$ |
174,631 |
|
|
$ |
162,457 |
|
|
Supplemental disclosures: |
|
|
|
|
|
|
|
|
|
|
|
|
|
Income taxes paid |
|
$ |
48 |
|
|
$ |
— |
|
|
$ |
4,125 |
|
|
Supplemental disclosure of non-cash investing and financing activities: |
|
|
|
|
|
|
|
|
|
|
|
|
|
Note receivable for disposition of property |
|
|
— |
|
|
|
— |
|
|
|
1,900 |
|
The accompanying notes are an integral part of these consolidated financial statements.
31
Pendrell Corporation
Notes to Consolidated Financial Statements
1. Organization and Business
Overview—These consolidated financial statements include the accounts of Pendrell Corporation (“Pendrell”) and its consolidated subsidiaries (collectively referred to as the “Company”). Since 2011, the Company’s strategy, through its consolidated subsidiaries, has been to invest in, acquire and develop businesses with unique technologies that are often protected by intellectual property (“IP”) rights, and that present the opportunity to address large, global markets. The Company’s subsidiaries focus on licensing the IP rights they hold to third parties. The Company regularly evaluates its existing investments to determine whether retention or disposition is appropriate, and investigates new investment and business acquisition opportunities. From 2011 through 2015, the Company also advised clients on various IP strategies and transactions through its consulting subsidiary Ovidian Group LLC (“Ovidian”). The Company sold Ovidian for nominal consideration in 2015.
The Company was formed in 2000 to operate a next generation global mobile satellite communications system. The Company began its exit from the satellite business in 2011 and completed its exit in 2012 with (i) the sale of its medium earth orbit (“MEO”) satellite assets (“MEO Assets”) that had been in storage for nominal consideration, (ii) the transfer of its in-orbit MEO satellite to a new operator who assumed responsibility for all related operating costs effective April 1, 2012, and (iii) the deconsolidation of its MEO-related international subsidiaries.
2. Summary of Significant Accounting Policies
Principles of Consolidation and Basis of Presentation— The consolidated financial statements of the Company include the assets and liabilities of its wholly-owned subsidiaries and subsidiaries it controls or in which it has a controlling financial interest. Noncontrolling interests on the consolidated balance sheets include third-party investments in entities that the Company consolidates, but does not wholly own. Noncontrolling interests are classified as part of equity and the Company allocates net income (loss), other comprehensive income (loss) and other equity transactions to its noncontrolling interests in accordance with their applicable ownership percentages.
All intercompany transactions and balances have been eliminated in consolidation, including a $31.8 million loan from Pendrell to ContentGuard Holdings, Inc. (“ContentGuard”). In June 2017, the Company sold a 9% interest in ContentGuard. ContentGuard now has two minority shareholders, while Pendrell maintains an 81.1% ownership stake. In February 2015, the Company acquired the minority partner’s interest in Provitro Biosciences LLC (“Provitro”) for nominal consideration resulting in 100% ownership of Provitro.
All information in these financial statements is in U.S. dollars. These financial statements have been prepared in accordance with accounting principles generally accepted in the United States of America (“GAAP”).
Capital Structure Change— At the Company’s annual meeting of shareholders in June 2017, the Company’s shareholders approved a 1-for-100 reverse stock split of the Company’s Class A Stock and Class B common stock that was implemented on November 30, 2017 (the "2017 Reverse Split"). The 2017 Reverse Split reduced the Company’s number of record shareholders to less than 300, which allowed it to (i) terminate the Company’s Nasdaq listing, effective December 15, 2017, (ii) file to de-register the Company’s Class A Stock under the Securities Exchange Act of 1934, as amended (the “Exchange Act”), which was filed on December 26, 2017; and (iii) cease to be a reporting company under the Exchange Act after the Company’s notice of de-registration is effective, which will be no later than March 26, 2018.
On September 20, 2017, the Company’s Board of Directors (the “Board”) announced that the Company does not currently plan to publish financial information following the expiration of its reporting obligations under the Exchange Act. As a result, the Company believes this Form 10-K for fiscal year ended December 31, 2017 will be its final financial statement filed with the Securities and Exchange Commission.
32
In September 2016, the Company consummated a 1-for-10 reverse stock split (the “2016 Reverse Split”) to remediate a stock price deficiency as required by Nasdaq’s continued listing requirements.
As a result of the 2017 and 2016 Reverse Splits, the share counts and per share data reported in the historical financial statements have been adjusted retrospectively as if the 2017 and 2016 Reverse Splits had been in effect for all periods presented. Additionally, the exercise prices and the number of shares issuable under the Company’s stock-based compensation plans have been adjusted retrospectively to reflect the 2017 and 2016 Reverse Splits.
Segment Information—The Company operates in and reports on one segment (IP management). Operating segments are based upon the Company’s internal organization structure, how its operations are managed, and the criteria used by its Chief Operating Decision Maker. Substantially all of the Company’s revenue is generated by operations located within the United States, and the Company does not have any long-lived assets located in foreign countries.
Use of Estimates—The preparation of financial statements in conformity with GAAP requires management to make estimates and assumptions that affect the reported amounts of assets and liabilities and disclosure of contingent assets and liabilities at the date of the financial statements and the reported amounts of revenues and expenses during the reporting period. Actual results could differ materially from these estimates.
On an ongoing basis, the Company evaluates its estimates, including among others, those related to the fair value of acquired intangible assets, the useful lives and potential impairment of intangible assets and property and equipment, the value of stock awards for the purpose of determining stock-based compensation expense, accrued liabilities (including bonus accruals), valuation allowances related to the ability to realize deferred tax assets, allowances for doubtful receivables, and certain tax liabilities. Estimates are based on historical experience and other factors, including the current economic environment as deemed appropriate under the circumstances. Estimates and assumptions are adjusted when facts and circumstances dictate. As future events and their effects cannot be determined with precision, actual results could differ significantly from these estimates. Any changes in estimates used to prepare these financial statements will be reflected in future periods.
Cash and Cash Equivalents—Cash and cash equivalents are defined as short-term, highly liquid investments with original maturities from the date of purchase of 90 days or less. Cash and cash equivalents are comprised of the following (in thousands):
|
|
|
December 31, |
|
|||||
|
|
|
2017 |
|
|
2016 |
|
||
|
Cash |
|
$ |
15,200 |
|
|
$ |
13,485 |
|
|
Money market funds |
|
|
169,282 |
|
|
|
161,146 |
|
|
|
|
$ |
184,482 |
|
|
$ |
174,631 |
|
The fair value of money market funds at December 31, 2017 and 2016 was classified as Level 1 in the hierarchy established by the Financial Accounting Standards Board (“FASB”) as amounts were based on quoted prices available in active markets for identical investments as of the reporting date.
Accounts Receivable—Accounts receivable consist primarily of amounts billed to customers under licensing arrangements. For the years ended December 31, 2017, 2016 and 2015, the Company did not incur any losses on its accounts receivable. Based upon historical collections experience and currently available information, the Company has determined that no allowance for doubtful accounts was required at either December 31, 2017 or December 31, 2016. Carrying amounts of such receivables approximate their fair value due to their short-term nature.
Prepaid Expenses and Other Current Assets—As of December 31, 2017 and 2016, prepaid expenses and other current assets consisted primarily of insurance prepayments, prepayments of patent maintenance fees and prepayments of rent for leased facilities.
33
Property in Service—Property in service consists primarily of computer equipment, software, furniture and fixtures and leasehold improvements. Property in service is recorded at cost, net of accumulated depreciation, and is depreciated using the straight-line method. Computer equipment and furniture and fixtures are depreciated over their estimated useful lives ranging from three to five years. Software is depreciated over the shorter of its contractual license period or three years. Leasehold improvements are amortized over the shorter of their estimated useful lives or the term of the respective lease. Significant additions and improvements to property in service are capitalized. Repair and maintenance costs are expensed as incurred.
Intangible Assets and Goodwill— The Company amortizes finite-lived intangible assets, including patents, acquired in purchase transactions over their expected useful lives. The Company assigns goodwill and indefinite-lived intangible assets to its reporting units based on the expected benefit from the synergies arising from each business combination.
The Company evaluates finite-lived intangible assets when events or circumstances indicate that the carrying amount of an asset or asset group may not be recoverable. These events or circumstances could include: a significant change in the business climate, legal factors, operating performance indicators, or changes in technology or customer requirements. Recoverability of an asset or asset group is measured by a comparison of the carrying amount to the future undiscounted net cash flows expected to be generated by the asset or asset group over its life. This comparison requires management to make judgments regarding estimated future cash flows. The Company’s ability to realize the estimated future cash flows may be affected by factors such as changes in operating performance, changes in business strategy, invalidation of patents, unfavorable judgments in legal proceedings and changes in economic conditions. If the Company’s estimates of the undiscounted cash flows do not equal or exceed the carrying value of the asset or asset group, an impairment charge equal to the amount by which the recorded value of the asset or asset group exceeds its fair value is recognized.
The Company previously evaluated goodwill for impairment on an annual basis during the fourth quarter, or more frequently if circumstances indicated that the carrying value of a Company reporting unit may exceed its fair value. When evaluating goodwill and indefinite-lived intangible assets for impairment, the Company first performed a qualitative assessment to determine if fair value of the reporting unit was more likely than not greater than the carrying amount. If the assessment indicated that it was more likely than not that the fair value of a reporting unit was less than its carrying amount, then the Company further evaluated the estimated fair value of the reporting unit through the use of discounted cash flow models, which required management to make significant judgments as to the estimated future cash flows utilized. The Company’s ability to realize the future cash flows utilized in its fair value calculations could be affected by factors such as changes in its operating performance, changes in its business strategy, invalidation of its patents, unfavorable judgments in legal proceedings and changes in economic conditions. The results of the models were compared to the carrying amount of the reporting unit. If such comparison indicated that the fair value of the reporting unit was lower than the carrying amount, impairment would exist and the impairment charge would be measured by comparing the implied fair value of the reporting unit’s goodwill to its carrying value.
During 2015, the Company determined that a portion of its intellectual property assets and the balance of its goodwill were impaired and recognized an impairment charge of $103.5 million for the year ended December 31, 2015. As a result of the impairment in 2015, the Company no longer maintains balances for goodwill or indefinite-lived intangible assets in its financial statements.
Fair Value of Financial Instruments—The Company determines the fair value of its financial instruments based on the fair value hierarchy established by the FASB. The three levels of inputs used to measure fair value are as follows:
Level 1—Quoted prices in active markets for identical assets and liabilities.
Level 2—Quoted prices in active markets for similar assets and liabilities or other inputs that are observable for the asset or liability, either directly or indirectly, for substantially the full term of the financial instrument.
Level 3—Unobservable inputs that are supported by little or no market activity and are significant to the fair value of the assets and liabilities. This includes certain pricing models, discounted cash flow methodologies and similar techniques that use significant unobservable inputs.
34
As of December 31, 2017 and 2016, the Company’s financial instruments included its cash and cash equivalents, accounts receivable, other receivables, accounts payable and certain other assets and liabilities. The Company has determined that the carrying value of its financial instruments, based on the hierarchy established by the FASB, approximates the fair value of the financial instruments as they are equivalent to cash or due to their short-term nature.
Revenue Recognition— The Company derives its operating revenue from IP monetization activities, including patent licensing and patent sales; and, in years prior to 2016, from IP consulting services. Although the Company’s revenue may occur in different forms, it regards its IP monetization activities as integrated and not separate revenue streams. For example, a third party relationship could involve consulting and licensing activities, or the acquisition of a patent portfolio can lead to licensing, consulting and patent sales revenue.
The Company’s patent licensing agreements often provide for the payment of contractually determined upfront license fees representing all or a majority of the revenue that will be generated from such agreements for nonexclusive, nontransferable, limited duration licenses. These agreements typically grant (i) a nonexclusive license to make, sell, distribute, and use certain specified products that read on the Company’s patents, (ii) a covenant not to enforce patent rights against the licensee based on such activities, and (iii) the release of the licensee from certain claims. Generally, the agreements provide no further obligation for the Company upon receipt of the minimum upfront license fee. As such, the earnings process is complete and revenue is recognized upon the execution of the agreement, when collectability is reasonably assured, or upon receipt of the minimum upfront license fee, and when all other revenue recognition criteria have been met.
Certain of the Company’s patent licensing agreements provide for future royalties or future payment obligations triggered upon satisfaction of conditions. Future royalties and future payments are recognized in revenue upon satisfaction of any related conditions, provided that all revenue recognition criteria, as described below, have been met.
The Company sells patents from its portfolios from time to time. These sales are part of the Company’s ongoing operations. Consequently, the related proceeds are recorded as revenue.
The timing and amount of revenue recognized from IP monetization activities depend on the specific terms of each agreement and the nature of the deliverables and obligations. Fees earned from IP consulting services are generally recognized as the services are performed. For agreements that are deemed to contain multiple elements, consideration is allocated to each element of an agreement that has stand-alone value using the relative fair value method. The Company recognizes revenue when (i) persuasive evidence of an arrangement exists, (ii) all material obligations have been substantially performed pursuant to agreement terms, services have been rendered to the customer or delivery has occurred, (iii) amounts are fixed or determinable, and (iv) collectability is reasonably assured. As a result of the contractual terms of our patent monetization agreements and the unpredictable nature, form and frequency of monetizing transactions, our revenue may fluctuate substantially from period to period.
Research and Development—The Company incurs costs associated with research and development activities and expenses the costs in the period incurred. Research and development expenses during the period were not material for separate disclosure and are included in general and administrative expenses.
Stock-Based Compensation—The Company records stock-based compensation on stock options, stock appreciation rights, restricted stock awards, restricted stock units and other stock awards issued to employees, directors, consultants and/or advisors based on the estimated fair value on the date of grant and recognizes compensation cost over the requisite service period for awards expected to vest. The fair value of stock options and stock appreciation rights is estimated on the date of grant using the Black-Scholes option pricing model (“Black-Scholes Model”) based on the single option award approach. The fair value of restricted stock awards and restricted stock units is determined based on the number of shares granted and either the quoted market price of the Company’s Class A common stock on the date of grant for time-based and performance-based awards, or the fair value on the date of grant using the Monte Carlo Simulation model (“Monte Carlo Simulation”) for market-based awards. The fair value of stock options, restricted stock awards and restricted stock units with service conditions are amortized to expense on a straight-line basis over the requisite service periods of the awards, which is generally the vesting period. The fair value of stock options, stock appreciation rights, restricted stock awards and restricted stock units with performance conditions deemed probable of being achieved and cliff vesting is amortized to expense over
35
the requisite service period using the straight-line method of expense recognition. The fair value of restricted stock awards and restricted stock units with performance and market conditions are amortized to expense over the requisite service period using the straight-line method of expense recognition. The fair value of stock-based payment awards as determined by the Black-Scholes Model and the Monte Carlo Simulation are affected by the Company’s stock price as well as other assumptions. These assumptions include, but are not limited to, the expected stock price volatility over the term of the awards and actual and projected employee stock option exercise behaviors. On January 1, 2017, the Company elected to change its accounting policy for calculating stock-based compensation based on forfeiture estimates to one that recognizes forfeitures when they occur (see “New Accounting Pronouncements” below). Previously, forfeitures were estimated at the date of grant and revised, if necessary, in subsequent periods if actual forfeitures differed from those estimates.
In certain situations, the Company accounts for changes in the terms or conditions of a stock-based payment award as an exchange of the original award for a new award pursuant to the rules governing modification accounting. Compensation expense for modified stock-based payment awards is generally equal to the fair value of the original award plus the incremental cost conveyed as a result of the modification expensed over the remaining life of the award.
Income Taxes—The Company accounts for income taxes using the asset and liability method under which deferred tax assets and liabilities are recognized for the future tax consequences attributable to differences between the financial statement carrying amounts of existing assets and liabilities and their respective tax bases. Deferred tax assets and liabilities are measured using enacted tax rates expected to apply to taxable income in the years in which those temporary differences are expected to reverse. The effect on deferred tax assets and liabilities of a change in tax rates is recognized in the period that includes the enactment date. A valuation allowance against deferred tax assets is recorded when it is more likely than not that the assets will not be realized.
The Company records an unrecognized tax benefit from an uncertain tax position only if it is more likely than not that the tax position will be sustained upon examination by the tax authorities. The Company’s policy is to recognize interest and/or penalties related to unrecognized tax benefits as income tax expense.
Contingencies—Outcomes of legal proceedings and claims brought by and against the Company are subject to significant uncertainty. The Company accrues an estimated loss from a loss contingency, such as a legal claim, by a charge to income if it is probable that an asset has been impaired or a liability has been incurred and the amount of the loss can be reasonably estimated. The Company discloses a contingency if there is at least a reasonable possibility that a loss has been incurred. In determining whether a contingent loss should be accrued or disclosed, the Company evaluates, among other factors, the degree of probability of an unfavorable outcome and the ability to make a reasonable estimate of the amount of loss. Changes in these factors could materially impact the Company’s financial position, results of operations or cash flows. For contingencies that might result in a gain, the Company does not record the gain until realized.
Income (Loss) Per Share—Basic income (loss) per share is calculated based on the weighted average number of Class A common stock and Class B common stock (the “Common Shares”) outstanding during the period. Diluted income (loss) per share is calculated by dividing the income (loss) allocable to common shareholders by the weighted average Common Shares outstanding plus potential dilutive Common Shares. Prior to the satisfaction of vesting conditions, unvested restricted stock awards are considered contingently issuable and are excluded from weighted average Common Shares outstanding used for computation of basic income (loss) per share.
Potential dilutive Common Shares consist of the incremental Class A common stock issuable upon the exercise of outstanding stock options (both vested and non-vested) and unvested restricted stock awards and units, calculated using the treasury stock method. The calculation of dilutive loss per share for the year ended December 31, 2015 excludes all potential dilutive Common Shares as their inclusion would have been antidilutive.
36
The following table sets forth the computation of basic and diluted income (loss) per share (in thousands, except share and per share data):
|
|
|
Year ended December 31, |
|
|||||||||
|
|
|
2017 |
|
|
2016 |
|
|
2015 |
|
|||
|
Net income (loss) attributable to Pendrell |
|
$ |
19,060 |
|
|
$ |
17,763 |
|
|
$ |
(109,680 |
) |
|
Weighted average common shares outstanding |
|
|
250,428 |
|
|
|
268,276 |
|
|
|
267,136 |
|
|
Less: weighted average unvested restricted stock awards |
|
|
(562 |
) |
|
|
(687 |
) |
|
|
(1,429 |
) |
|
Shares used for computation of basic income (loss) per share |
|
|
249,866 |
|
|
|
267,589 |
|
|
|
265,707 |
|
|
Add back: weighted average unvested restricted stock awards and units |
|
|
6,948 |
|
|
|
9,329 |
|
|
|
— |
|
|
Shares used for computation of diluted income (loss) per share (1) |
|
|
256,814 |
|
|
|
276,918 |
|
|
|
265,707 |
|
|
Basic income (loss) per share attributable to Pendrell |
|
$ |
76.28 |
|
|
$ |
66.38 |
|
|
$ |
(412.79 |
) |
|
Diluted income (loss) per share attributable to Pendrell |
|
$ |
74.22 |
|
|
$ |
64.15 |
|
|
$ |
(412.79 |
) |
|
(1) |
Stock options, restricted stock awards and units totaling 12,500, 13,053 and 27,847 for the years ended December 31, 2017, 2016 and 2015, respectively, were excluded from the calculation of diluted income (loss) per share as their inclusion was anti-dilutive. |
New Accounting Pronouncements— In February 2016, the Financial Accounting Standards Board (“FASB”) issued Accounting Standard Update (“ASU”) No. 2016-02, Leases (Topic 842), which requires companies that are lessees to recognize a right-of-use asset and lease liability for most leases that do not meet the definition of a short-term lease. For income statement purposes, leases will continue to be classified as either operating or financing. Classification will be based on criteria that are similar to those applied in current lease accounting. Compliance with this ASU is required for annual periods beginning after December 15, 2018, and interim periods therein. Early adoption is permitted. As the Company’s future minimum lease commitments as of December 31, 2017 are approximately $0.6 million, the Company believes the future adoption of this ASU will not have a material impact on its financial position, results of operations or cash flows.
In March 2016, the FASB issued ASU No. 2016-09, Compensation—Stock Compensation (Topic 718): Improvements to Employee Share-Based Payment Accounting, to simplify certain provisions in stock compensation accounting, including provisions applicable to: (1) accounting for income taxes, (2) classification of excess tax benefits on the statement of cash flow, (3) forfeitures, (4) minimum statutory tax withholding requirements, (5) classification of employee taxes paid on the statement of cash flows when an employer withholds shares for tax withholding purposes, (6) the practical expedient for estimating the expected term and (7) intrinsic value. Compliance with this ASU is required for annual periods beginning after December 15, 2016, and interim periods therein. The adoption of this ASU on January 1, 2017 resulted in an adjustment to retained earnings and additional paid in capital of approximately $0.2 million due to a change in accounting for forfeitures.
Throughout the year ended December 31, 2016, the FASB issued a number of ASUs which provide further clarification to ASU No. 2014-09, Revenue (Topic 606): Revenue from Contracts with Customers, issued in May 2014, which supersedes existing revenue recognition guidance under GAAP. The core principle of ASU No. 2014-09 is to recognize as revenue the amount that an entity expects to be entitled for goods or services at the time the goods or services are transferred to customers. In August 2015, the FASB issued ASU No. 2015-14, which deferred the effective date of the amendments in ASU No. 2014-09 to the annual reporting period beginning after December 15, 2017, with early adoption permitted beginning January 1, 2017. The ASUs issued in 2016 related to ASU No. 2014-09 will become effective when the guidance in ASU No. 2014-09 becomes effective. The Company plans to adopt this ASU on January 1, 2018 under the modified retrospective method where the cumulative effect is recognized at the date of initial application. As the Company’s patent licensing agreements generally provide no further obligation for the Company upon receipt of the applicable license fees, the fiscal 2018 adoption of ASU 2014-09 will have no impact to revenues previously reported but may require additional footnote disclosures.
37
In May 2017, the FASB issued ASU No. 2017-09, Compensation—Stock Compensation (Topic 718)-Scope of Modification Accounting, which provides guidance about which changes to the terms or conditions of a share-based payment award require an entity to apply modification accounting. Unless the changes in terms or conditions meet all three criteria outlined in the guidance, modification accounting should be applied. The three criteria relate to changes in the terms and conditions that affect the fair value, vesting conditions, or classification of a share-based payment award. Compliance with this ASU is required for annual periods beginning after December 15, 2017. Early adoption is permitted. The adoption of this ASU in 2017 did not have an impact on the Company’s financial position, results of operations or cash flows.
3. Provitro
In February 2013, the Company acquired a 68.75% interest in Provitro, the developer of the Provitro™ proprietary micro-propagation technology designed to facilitate the production on a commercial scale of certain plants, particularly timber bamboo. In February 2015, the Company acquired the minority partner’s interest in Provitro for nominal consideration resulting in 100% ownership of Provitro.
From acquisition through the year ended December 31, 2014, the Company attempted to develop a strategy to commercialize Provitro’s proprietary micro-propagation technology (designed to facilitate the production on a commercial scale of certain plants, particularly timber bamboo), but did not generate revenue from the technology.
In January 2015, the Company discontinued its efforts to commercialize the Provitro™ technology and in September 2015, the Company sold Provitro’s facility and related tangible assets for $2.0 million. The purchase price was paid in installments of which $0.1 million was paid immediately, $0.4 million was received in January 2016, $0.9 million was received in August 2016 and $0.6 million was received in January 2017.
4. Accounts Receivable (Current and Non-current)
A significant portion of the Company’s current accounts receivable balance is due from Toshiba Memory Corporation (“TMC”), which prior to 2017 was a division of Toshiba Corporation (“Toshiba”). Based on the Company’s assessment of various reports, including Toshiba’s unaudited financial results, as well as the ongoing activities of TMC, the Company believes that no allowance for doubtful accounts is required for its receivable from TMC. The Company will continue to evaluate its position as new information becomes available.
The Company expects to receive the $1.3 million of non-current accounts receivable at December 31, 2017, in 2019.
5. Intangible Assets and Goodwill
2015 Impairment of Intangible Assets and Goodwill
In November 2015, as a result of non-infringement verdicts in the Company’s lawsuits against various manufacturers of mobile communication and computing devices (see Note 7 – “Commitments and Contingencies”), the Company revised its projected cash flows for its intangible assets, triggering an impairment analysis of its intangible assets and goodwill. The Company records an impairment charge on its intangible assets if it determines that their carrying value may not be recoverable. The carrying value is not recoverable if it exceeds the undiscounted cash flows resulting from the use of the asset and its eventual disposition. When the Company determines that the carrying value of its intangible assets may not be recoverable, the Company measures the potential impairment based on a projected discounted cash flow method using a discount rate determined by its management to be commensurate with the risk inherent in its current business model. An impairment loss is recognized only if the carrying amount of the intangible assets exceeds its estimated fair value. An impairment charge is recorded to reduce the pre-impairment carrying amount of the intangible assets to their estimated fair value.
Determining the fair value is highly judgmental in nature and requires the use of significant estimates and assumptions considered to be Level 3 fair value inputs, including anticipated future revenue opportunities, operating margins, and discount rates, among others. The estimated fair value of the intangible assets was determined based on the income approach, as it was deemed to be most indicative of the Company's fair value in an orderly transaction
38
between market participants. Under the income approach the Company determined fair value based on estimated future cash flows resulting from licensing its intangible assets. The estimated cash flows were discounted by an estimated weighted-average cost of capital which reflects the overall level of inherent risk of the Company and the rate of return an outside investor would expect to earn. Upon completion of the analysis, the Company concluded that the estimated fair value of its intangible assets was less than their carrying amount and recorded an impairment charge of $82.3 million, which is included in "impairment of intangible assets and goodwill" in the accompanying consolidated statements of operations.
The Company then evaluated the carrying value of its goodwill by estimating the fair value of the reporting unit through the use of discounted cash flow models, which required management to make significant judgments as to the estimated future cash flows resulting from licensing its intangible assets. Upon completion of the analysis, the Company concluded that the estimated fair value of its reporting unit was less than its carrying amount and recorded an additional $21.2 million impairment charge related to goodwill in the fourth quarter of 2015. As a result of the impairment in 2015, the Company no longer maintains balances for goodwill or indefinite-lived intangible assets in its financial statements.
Intangible Assets
The following table presents details of the Company’s intangible assets and related amortization (in thousands):
|
|
|
December 31, 2017 |
|
|
December 31, 2016 |
|
||
|
Patent cost |
|
$ |
58,553 |
|
|
$ |
65,796 |
|
|
Patent accumulated amortization |
|
|
(56,224 |
) |
|
|
(61,080 |
) |
|
Intangible assets, net |
|
$ |
2,329 |
|
|
$ |
4,716 |
|
Amortization expense related to purchased intangible assets, reported as amortization of intangible assets in the consolidated statements of operations, for the years ended December 31, 2017, 2016 and 2015 were as follows (in thousands):
|
|
|
Year ended December 31, |
|
|||||||||
|
|
|
2017 |
|
|
2016 |
|
|
2015 |
|
|||
|
Amortization of intangible assets |
|
$ |
2,345 |
|
|
$ |
9,498 |
|
|
$ |
13,939 |
|
The intangible assets at December 31, 2017 will be fully amortized as of December 31, 2018.
The Company has used, and may continue to use, different structures and forms of consideration for its acquisitions of intangible assets. Acquisitions may be consummated through the use of cash, equity, seller financing, third party debt, earn-out obligations, revenue sharing, profit sharing, or some combination of these types of consideration. Consequently, the acquisition values reflected in the Company’s investing activities may represent lower amounts than would be reflected, for example, in a situation where cash alone was utilized to complete the acquisition.
During the year ended December 31, 2015, the Company enhanced its existing memory and storage technologies patent portfolio for an additional $2.0 million. No patents were purchased during the years ended December 31, 2017 and 2016.
During the years ended December 31, 2017 and 2015, the Company sold certain patents in several transactions and has included the gross proceeds in revenue. No patents were sold during the year ended December 31, 2016. Cost associated with the patents sold, including any remaining net book value, are included in cost of revenues in the Company’s consolidated statements of operations. The patents sold in 2017 had previously been fully impaired, therefore, there was no related book value to charge to cost of revenues. Certain of the patents sold, as well as certain of those licensed, were subject to an obligation to pay a substantial portion of the net proceeds to a third party. These costs are also included in cost of revenues. In future periods, these third party payments as a percentage
39
of revenues may vary significantly based on the structure utilized for any given acquisition. Costs associated with patents sold during the years ended December 31, 2017, 2016 and 2015 were as follows (in thousands):
|
|
|
Year ended December 31, |
|
|||||||||
|
|
|
2017 |
|
|
2016 |
|
|
2015 |
|
|||
|
Cost of patents sold |
|
$ |
— |
|
|
$ |
— |
|
|
$ |
138 |
|
The Company periodically abandons patents that are not part of existing licensing programs or for which the Company has determined that it would no longer allocate resources to their maintenance and enforcement. Costs associated with the abandonment of patents, including any remaining net book value, are included in “patent administration and related costs” in the Company’s consolidated statements of operations and were as follows for the years ended December 31, 2017, 2016 and 2015 (in thousands):
|
|
|
Year ended December 31, |
|
|||||||||
|
|
|
2017 |
|
|
2016 |
|
|
2015 |
|
|||
|
Cost associated with the abandonment and/or disposition of patents |
|
$ |
41 |
|
|
$ |
163 |
|
|
$ |
958 |
|
6. Accrued Expenses
The following table summarizes accrued expenses (in thousands):
|
|
|
December 31, 2017 |
|
|
December 31, 2016 |
|
||
|
Accrued payroll and related expenses |
|
$ |
1,915 |
|
|
$ |
1,134 |
|
|
Accrued legal, professional and other expenses |
|
|
782 |
|
|
|
538 |
|
|
Accrued revenue share obligations |
|
|
6,100 |
|
|
|
4,606 |
|
|
|
|
$ |
8,797 |
|
|
$ |
6,278 |
|
7. Commitments and Contingencies
Lease and Commitments— The Company has operating lease agreements for its main office in Kirkland, Washington, and its office in Finland. The Company terminated its lease for office space in Plano, Texas effective June 30, 2016. Total rental expense included in general and administrative expenses in the Company’s consolidated statements of operations for the years ended December 31, 2017, 2016 and 2015 was as follows (in thousands):
|
|
|
Year ended December 31, |
|
|||||||||
|
|
|
2017 |
|
|
2016 |
|
|
2015 |
|
|||
|
Rent expense |
|
$ |
282 |
|
|
$ |
245 |
|
|
$ |
793 |
|
As of December 31, 2017, future minimum payments under the Company’s lease agreements were as follows (in thousands):
|
|
|
Operating leases |
|
|
|
2018 |
|
$ |
348 |
|
|
2019 |
|
|
205 |
|
|
Total minimum payments |
|
$ |
553 |
|
Litigation—In the opinion of management, except for those matters described below and elsewhere in this report, to the extent so described, litigation, contingent liabilities and claims against the Company in the normal course of business are not expected to involve any judgments or settlements that would be material to the Company’s financial condition, results of operations or cash flows.
40
ContentGuard Enforcement Actions—In July 2017, the Federal District Court rejected our appeal of unfavorable jury awards in two infringement lawsuits that ContentGuard filed in the Eastern District of Texas against various manufacturers of mobile communication and computing devices. Early in 2018, ContentGuard licensed its patents to ZTE Corporation and dismissed proceedings that ContentGuard’s German subsidiary had filed against ZTE in Germany. These events brought to a close ContentGuard’s various litigation initiatives against manufacturers of mobile communication and computing devices.
MTL Enforcement Actions Against SanDisk—In December 2016, the Company’s wholly-owned subsidiary, Memory Technologies LLC (“MTL”) filed patent infringement claims against SanDisk Corporation and certain affiliated companies, including Western Digital Corporation (collectively, “SanDisk”) at the International Trade Commission and in the Federal District Court for the Central District of California, through which MTL sought monetary damages for SanDisk’s alleged infringement of MTL’s patents. In June 2017, MTL licensed its patents to SanDisk and dismissed its actions against SanDisk.
MTL Enforcement Actions Against Kingston—On January 31, 2018, MTL filed patent infringement claims against Kingston Technology Corporation and certain affiliated companies (collectively, “Kingston”) in the Federal District Court for the Central District of California (the “Kingston Litigation”), through which MTL seeks monetary damages for Kingston’s alleged infringement of MTL’s patents.
The Company is unable to anticipate the timing or outcome of the Kingston Litigation.
8. Shareholders’ Equity
Common Stock—The Company’s Articles of Incorporation authorizes two classes of common stock, Class A and Class B. The rights of the holders of shares of Class A common stock and Class B common stock are identical, except with respect to voting and conversion. Holders of shares of Class A common stock are entitled to one vote per share. Holders of shares of Class B common stock are entitled to ten votes per share. The Class B common stock is convertible at any time at the option of its holder into shares of Class A common stock. Each share of Class B common stock is convertible into one share of Class A common stock. Additionally, subject to certain exceptions, shares of Class B common stock will automatically convert into shares of Class A common stock if the shares of Class B common stock are sold or transferred. Class A common stock is not convertible. Eagle River Satellite Holdings, LLC, the Company’s controlling shareholder, together with its affiliates Eagle River Investments, LLC, Eagle River, Inc. and Eagle River Partners, LLC held an economic interest of approximately 37.4% and a voting interest of approximately 67.6% in the Company as of December 31, 2017.
On March 9, 2017, the Company redeemed 24,328 shares of the Company’s Class A Stock from Highland Crusader Offshore Partners, L.P. in a private transaction at a price of $655 per share. In the fourth quarter of 2017, the Company redeemed an additional 6,150 shares from various investors in private transactions and as fractionalized shares at an average price of $606 per share.
Dividend—On November 30, 2017, the Board declared a dividend of $12.32 per share, payable on shares outstanding after the 2017 Reverse Split. The dividend was paid on December 27, 2017 to shareholders of record on December 15, 2017. The Company elected to pay the dividend to shareholders, rather than incur personal holding company tax. See Note 11 – “Income Taxes” for further details.
Prior to 2017, the Company had never paid cash dividends on shares of its Class A or Class B common stock.
Stock Incentive Plan—On November 14, 2012, the Company’s shareholders approved the Pendrell Corporation 2012 Equity Incentive Plan (the “2012 Plan”). Effective upon the approval of the 2012 Plan, the Company’s 2000 Stock Incentive Plan, as amended and restated (the “2000 Plan”) was terminated. No additional awards will be granted under the 2000 Plan.
41
The purpose of the 2012 Plan is to assist the Company in securing and retaining the services of skilled employees, directors, consultants and/or advisors of the Company and to provide incentives for such individuals to exert maximum efforts toward the Company’s success. The 2012 Plan allows for the grant of stock options, stock appreciation rights, performance stock awards, performance cash awards, restricted stock awards, restricted stock unit awards and other stock awards (collectively, “Awards”) to employees, directors, consultants and/or advisors who provide services to the Company or its subsidiaries.
Under the 2012 Plan, the aggregate number of shares of Class A common stock that may be issued pursuant to Awards from and after the effective date of the 2012 Plan will not exceed, in the aggregate, the sum of 37,952 shares, plus any shares subject to outstanding stock awards granted under the 2000 Plan that (i) expire or terminate for any reason prior to exercise or settlement; (ii) are forfeited, canceled or otherwise returned due to the failure to meet a condition required to vest such shares; or (iii) are reacquired, withheld or not issued to satisfy a tax withholding obligation in connection with an award. As of December 31, 2017, 24,743 shares were reserved and remain available for grant under the 2012 Plan.
Stock-Based Compensation—The Company records stock-based compensation based on the estimated fair value on the date of grant and recognizes compensation cost over the requisite service period for awards expected to vest. On January 1, 2017, the Company elected to change its accounting policy for calculating stock-based compensation based on forfeiture estimates to one that recognizes forfeitures when they occur. ASU 2016-09 permits this one-time policy change, but requires the change to be adopted utilizing the modified retrospective approach, with a cumulative effect adjustment recorded to retained earnings. The adoption of this change in accounting for forfeitures on January 1, 2017 resulted in an adjustment to retained earnings and additional paid in capital of approximately $0.2 million. The Company’s estimated forfeiture rate was 5% for the years ended December 31, 2016 and 2015.
Stock-based compensation expense included in the Company’s consolidated statements of operations for the years ended December 31, 2017, 2016 and 2015 was as follows (in thousands):
|
|
|
Year ended December 31, |
|
|||||||||
|
|
|
2017 |
|
|
2016 |
|
|
2015 |
|
|||
|
Stock options |
|
$ |
884 |
|
|
$ |
1,193 |
|
|
$ |
2,236 |
|
|
Restricted stock awards (1) |
|
|
2,538 |
|
|
|
2,231 |
|
|
|
2,271 |
|
|
Total stock-based compensation expense |
|
$ |
3,422 |
|
|
$ |
3,424 |
|
|
$ |
4,507 |
|
|
(1) |
Stock-based compensation expense for the year ended December 31, 2015 includes $0.2 million of expense related to 250 Class A common stock restricted stock awards that were required to be treated as a liability. The Company settled the related liability with a $2.5 million payment in April 2015 and no further expense has been incurred. |
At December 31, 2017, the balance of stock-based compensation cost to be expensed in future years related to unvested stock-based awards is $2.1 million, all of which will be expensed in 2018. The $2.1 million of future expense does not include expense related to 500 performance-based stock options and 1,000 performance-based restricted stock awards granted in 2015, as these awards vest upon the achievement of certain performance milestones for which the related performance targets have yet to be established. The fair value of these awards will not be known until the date the performance targets are established at which point expensing will commence.
Additionally, the $2.1 million of future expense does not include additional stock-based compensation resulting from the modification of options and restricted stock outstanding at December 31, 2017 during the first quarter of 2018. See Note 15 – “Subsequent Events.”
42
Stock Options and Stock Appreciation Rights—The Company has granted stock options and stock appreciation rights to employees, directors, consultants and advisors in connection with their service to the Company. Stock options to purchase the Company’s Class A common stock are granted at the fair market value of the stock on the date of grant. The Company has both service-based stock options and performance-based stock options. The majority of service-based stock options granted to employees become exercisable over a four year period, while stock options granted to non-employee directors generally vest over one year. Performance-based stock options become exercisable if the Company achieves specified performance goals during the performance period and the grantee remains employed during the subsequent vesting period. Stock options generally expire 10 years after the date of grant or up to three months after termination of employment, whichever occurs earlier. There are no stock appreciation rights currently outstanding.
The weighted average fair value of stock options granted during the years ended December 31, 2017, 2016 and 2015 was estimated using the Black-Scholes Model with the following assumptions:
|
|
|
Year ended December 31, |
|
|||||||||
|
|
|
2017 |
|
|
2016 |
|
|
2015 |
|
|||
|
Weighted average expected volatility |
|
|
49 |
% |
|
|
53 |
% |
|
|
48 |
% |
|
Weighted average risk-free interest rate |
|
|
2.0 |
% |
|
|
1.2 |
% |
|
|
1.9 |
% |
|
Expected dividend yield |
|
|
0 |
% |
|
|
0 |
% |
|
|
0 |
% |
|
Weighted average expected term in years |
|
|
5.5 |
|
|
|
5.5 |
|
|
|
6.0 |
|
|
Weighted average estimated fair value per option granted |
|
$ |
319.70 |
|
|
$ |
332.00 |
|
|
$ |
470.00 |
|
The assumptions used to calculate the fair value are evaluated and revised, as necessary, to reflect market conditions and the Company’s experience.
The Company’s expected stock price volatility rate is based on a peer group, which the Company believes is a reasonable representation of the Company’s business direction and expected future volatility as an IP investment and asset management business.
The risk-free interest rate is based upon U.S. Treasury bond interest rates appropriate for the term of the Company’s employee stock options. The expected dividend yield is based on the Company’s history and expectation of dividend payments. The expected term has been estimated using the simplified method which permit entities, under certain circumstances, to continue to use the simplified method in developing estimates of the expected term of “plain-vanilla” share options.
43
The Company’s stock option activity for the year ended December 31, 2017 is summarized as follows:
|
|
|
Number of options |
|
|
Weighted average exercise price |
|
|
Weighted average remaining life (in years) |
|
|||
|
Outstanding at December 31, 2016 |
|
|
13,045 |
|
|
$ |
1,569.84 |
|
|
|
|
|
|
Granted (1) |
|
|
240 |
|
|
|
687.00 |
|
|
|
|
|
|
Forfeited |
|
|
(785 |
) |
|
|
2574.43 |
|
|
|
|
|
|
Outstanding at December 31, 2017 (2) |
|
|
12,500 |
|
|
$ |
1,489.80 |
|
|
|
6.04 |
|
|
Exercisable at December 31, 2017 (2) |
|
|
9,552 |
|
|
$ |
1,547.53 |
|
|
|
5.60 |
|
|
Vested and expected to vest at December 31, 2017 (2) |
|
|
12,500 |
|
|
$ |
1,489.80 |
|
|
|
6.04 |
|
|
(1) |
All options granted were to members of the Company’s board of directors. |
|
(2) |
Aggregate intrinsic value represents the amount by which the market value of the underlying stock exceeded the exercise price of outstanding options, before applicable income taxes and represents the amount optionees would have realized if all in-the-money options had been exercised on December 31, 2017. As of December 31, 2017, the aggregate intrinsic values of stock options outstanding, exercisable, and vested and expected to vest were all zero as the closing stock price of the Company’s stock was lower than the exercise prices of its outstanding options. |
The total fair value of options which vested during the years ended December 31, 2017, 2016 and 2015 was approximately $1.0 million, $2.0 million and $2.5 million, respectively.
The following table summarizes significant ranges of outstanding and exercisable stock options as of December 31, 2017:
|
|
|
Outstanding stock options |
|
|
Exercisable stock options |
|
||||||||||||||
|
Range of exercise prices |
|
Number of options |
|
|
Weighted average exercise price |
|
|
Weighted average remaining life (in years) |
|
|
Number of options |
|
|
Weighted average exercise price |
|
|||||
|
$ 687—$1,255 |
|
|
2,570 |
|
|
$ |
1,039 |
|
|
|
5.57 |
|
|
|
2,330 |
|
|
$ |
1,076 |
|
|
$1,256—$1,325 |
|
|
1,925 |
|
|
|
1,304 |
|
|
|
7.21 |
|
|
|
1,522 |
|
|
|
1,302 |
|
|
$1,326—$1,405 |
|
|
4,000 |
|
|
|
1,340 |
|
|
|
7.46 |
|
|
|
2,000 |
|
|
|
1,340 |
|
|
$1,406—$1,845 |
|
|
1,872 |
|
|
|
1,562 |
|
|
|
4.96 |
|
|
|
1,567 |
|
|
|
1,568 |
|
|
$1,846—$2,780 |
|
|
2,133 |
|
|
|
2,418 |
|
|
|
3.87 |
|
|
|
2,133 |
|
|
|
2,418 |
|
|
|
|
|
12,500 |
|
|
$ |
1,490 |
|
|
|
6.04 |
|
|
|
9,552 |
|
|
$ |
1,548 |
|
See Note 15 – “Subsequent Events” for discussion regarding 2018 modification, including cancellation, of options outstanding at December 31, 2017.
Restricted Stock Awards—The Company has granted restricted stock awards to employees, directors and consultants in connection with their service to the Company. The Company’s stock grants can be categorized as either service-based awards, performance-based awards, and/or market-based awards.
44
The Company’s restricted stock award activity for the year ended December 31, 2017 is summarized as follows:
|
|
|
Number of restricted stock awards |
|
|
Weighted average grant date fair value |
|
||
|
Unvested—December 31, 2016 |
|
|
8,907 |
|
|
$ |
822.67 |
|
|
Granted (1) |
|
|
625 |
|
|
|
681.67 |
|
|
Vested |
|
|
(2,719 |
) |
|
|
817.39 |
|
|
Forfeited |
|
|
(162 |
) |
|
|
522.93 |
|
|
Unvested—December 31, 2017 (2) |
|
|
6,651 |
|
|
$ |
904.00 |
|
|
(1) |
Represents shares issued to the Company’s Board of Directors as compensation for service. These awards have a grant date fair value of $0.4 million and vest upon issuance. |
|
(2) |
2,089 of the awards outstanding at December 31, 2017 will either vest or expire in 2018, with the balance either vesting or expiring in 2019. |
During the year ended December 31, 2017, 2,094 restricted stock awards vested as a result of the Company’s employees achieving service and performance targets. Certain holders of the vested RSAs and RSUs exercised their right to have their awards net-share settled to cover statutory employee taxes related to the vesting of the RSAs and RSUs. The settlement of these awards resulted in the Company repurchasing and/or cancelling 24 shares for approximately $17,000.
See Note 15 – “Subsequent Events” for discussion regarding the 2018 modification, including cancellation, of restricted stock outstanding at December 31, 2017.
9. Contract Termination Costs
Pursuant to the 2013 agreement under which the Company acquired the bulk of its memory and storage technologies portfolio, the Company shared a significant portion of the revenue generated from memory patents with the seller. On February 23, 2017, the seller agreed to relinquish its future revenue share in exchange for an up-front payment and future installment payments. This agreement resulted in a one-time charge of $3.2 million to expense in the first quarter of 2017 and significantly reduced the Company’s “cost of revenues” on future memory patent revenue. The final installment payment associated with the termination comes due in 2018 and is reflected in “accrued expenses.”
10. Gain on Contingencies
During 2012, as part of the Company’s exit from the satellite business, the Company sold its MEO Assets that had been in storage for nominal consideration. Under the sales agreement, the Company was entitled to a substantial portion of any proceeds that the buyer generated from the resale of the MEO Assets. In January 2015, the buyer resold the MEO Assets and the Company received two of three scheduled payments for these assets in 2015, resulting in the recognition of $3.9 million gain on contingency in the year ended December 31, 2015. The Company received the final scheduled payment in April 2016, resulting in the recognition of a $2.0 million gain on contingency in the year ended December 31, 2016.
In March 2012, the Company asserted claims in arbitration in London against the J&J Group to recover costs that the J&J Group was required to reimburse the Company pursuant to a MEO satellite asset purchase agreement that was signed in April 2011. In November 2015, the Company entered into a settlement agreement with the J&J Group whereby it received approximately $1.6 million, net of collection costs, in full and final settlement of all claims against the J&J Group which is included in gain on contingencies in the statements of operations for the year ended December 31, 2015.
Additionally, the Company recorded a gain of $0.5 million during 2015 as a result of the release of a tax indemnification liability associated with the acquisition of Ovidian in June 2011.
45
11. Income Taxes
The Company’s income tax benefit (expense) for the years ended December 31, 2017, 2016 and 2015 consists of the following (in thousands):
|
|
|
Year ended December 31, |
|
|||||||||
|
|
|
2017 |
|
|
2016 |
|
|
2015 |
|
|||
|
United States—current |
|
$ |
2,182 |
|
|
$ |
— |
|
|
$ |
— |
|
|
United States—deferred |
|
|
— |
|
|
|
— |
|
|
|
1,497 |
|
|
Foreign—current |
|
|
(72 |
) |
|
|
— |
|
|
|
(4,128 |
) |
|
Income tax benefit (expense) |
|
$ |
2,110 |
|
|
$ |
— |
|
|
$ |
(2,631 |
) |
For the year ended December 31, 2017, the Company recorded an income tax benefit of $2.1 million primarily related to a state income tax refund of prior year taxes approved by tax authorities in late 2017. For the year ended December 31, 2016, the Company did not record a provision for U.S. federal income tax due to available tax loss carryforwards. During the year ended December 31, 2015, as a result of the impairment of certain indefinite-lived intangible assets, the deferred tax liability associated with these intangible assets decreased, resulting in a federal tax benefit of $1.5 million.
For the years ended December 31, 2017 and 2015, the Company recorded tax provisions of $0.1 million and $4.1 million, respectively, related to foreign taxes withheld on revenue generated from license agreements executed with third party licensees domiciled in foreign jurisdictions. The Company had no foreign taxes withheld during the year ended December 31, 2016. In general, foreign taxes withheld may be claimed as a deduction on future U.S. corporate income tax returns, or as a credit against future U.S. federal income tax liabilities, subject to certain limitations. However, due to uncertainty regarding the Company’s ability to utilize the deduction or credit resulting from the foreign withholding, the Company established a full valuation allowance against the related deferred tax asset.
The Company’s accounting for the various elements of the Tax Cuts and Jobs Act (“TCJA”), enacted on December 22, 2017, is complete and the impact is reflected in the 2017 financial statements, including the reduction in the maximum U.S. federal corporate tax rate from 35% to 21% beginning in 2018. As a result of the TCJA, the Company recorded a $323.2 million reduction in its net deferred tax assets to reflect the new statutory tax rate. This adjustment to deferred tax assets was fully offset by a corresponding decrease in the Company’s valuation allowance, resulting in no impact to the Company’s effective tax rate.
A reconciliation of the 2017, 2016 and 2015 federal statutory income tax rate of 34% to the Company’s effective income tax rate is as follows:
|
|
|
Year ended December 31, |
|
|||||||||
|
|
|
2017 |
|
|
2016 |
|
|
2015 |
|
|||
|
Statutory tax rate |
|
|
34.00 |
% |
|
|
34.00 |
% |
|
|
34.00 |
% |
|
Change in valuation allowance |
|
|
(1,862.16 |
) |
|
|
(59.30 |
) |
|
|
(22.59 |
) |
|
Impact of change in tax law |
|
|
1,821.35 |
|
|
|
— |
|
|
|
— |
|
|
State income taxes |
|
|
(8.01 |
) |
|
|
— |
|
|
|
— |
|
|
Foreign withholding taxes |
|
|
0.26 |
|
|
|
— |
|
|
|
(2.37 |
) |
|
Goodwill impairment |
|
|
— |
|
|
|
— |
|
|
|
(6.07 |
) |
|
Stock-based compensation |
|
|
1.42 |
|
|
|
10.24 |
|
|
|
(3.23 |
) |
|
Loss on sale of subsidiary |
|
|
— |
|
|
|
13.70 |
|
|
|
— |
|
|
Other |
|
|
1.24 |
|
|
|
1.36 |
|
|
|
(2.03 |
) |
|
Effective tax rate |
|
|
(11.90 |
)% |
|
|
0 |
% |
|
|
(2.29 |
)% |
46
The significant components of the Company’s net deferred tax assets are as follows (in thousands):
|
|
|
December 31, 2017 |
|
|
December 31, 2016 |
|
|||
|
Net deferred tax assets: |
|
|
|
|
|
|
|
|
|
|
Net operating losses |
|
$ |
624,984 |
|
|
$ |
941,163 |
|
|
|
Basis difference in Liquidating Trust |
|
|
10,380 |
|
|
|
16,955 |
|
|
|
Accrued expenses and other |
|
|
5,083 |
|
|
|
12,336 |
|
|
|
Total deferred tax assets |
|
|
640,447 |
|
|
|
970,454 |
|
|
|
Valuation allowance |
|
|
(640,447 |
) |
|
|
(970,454 |
) |
|
|
Net deferred tax assets |
|
$ |
— |
|
|
$ |
— |
|
|
|
|
|||||||||
As of December 31, 2017, the Company had federal tax net operating loss carryforwards in the United States (“NOLs”) of approximately $2.5 billion. A significant portion of the NOLs were generated when the Company disposed of its satellite business and transferred the MEO-related international subsidiaries to a liquidating trust. In 2017, the Company adopted ASU No. 2016-09, Compensation—Stock Compensation (Topic 718): Improvements to Employee Share-Based Payment Accounting. As a result, the deferred tax asset related to the Company’s NOLs increased by $0.3 million due to the inclusion of additional NOLs related to excess tax benefits. The increase in the deferred tax asset was fully offset by a valuation allowance, resulting in no change to the Company’s recognized net deferred tax assets.
The Company believes the NOLs can be carried forward to offset certain future taxable income that may be generated during the carryforward period, which begins to expire in 2025 with a significant portion expiring in 2032. The use of the NOLs will be significantly limited if the Company undergoes a Tax Ownership Change under Section 382 of the Internal Revenue Code (“Tax Ownership Change”). Broadly, the Company will have a Tax Ownership Change if, over a three-year testing period, the portion of all stock of the Company, by value, owned by one or more 5% shareholder increases by more than 50 percentage points. For purposes of this test, shareholders that own less than 5% of the stock of the Company are aggregated into one or more separate “public groups”, each of which is treated as a 5% shareholder. In general, shares traded within a public group are not included in the Tax Ownership Change test. As discussed below, the Board of Directors adopted a Tax Benefits Preservation Plan designed to preserve shareholder value and the value of certain tax assets primarily associated with NOLs. As of December 31, 2017, the Company also had tax loss carryforwards in the state of California of approximately $1.3 billion, which will begin to expire in 2028. A significant portion of the California loss carryforward was generated when the Company disposed of its satellite business and will expire in 2032. The impacts of a Tax Ownership Change, discussed above, apply to the California tax losses as well.
For all years presented, the Company has considered all available evidence, including the history of tax losses and the uncertainty around future taxable income. Based on the weight of the evidence available at December 31, 2017, a valuation allowance has been recorded to reduce the value of the Company’s deferred tax assets, including the deferred tax assets associated with the NOLs, to an amount that is more likely than not to be realized.
At the beginning of the year ended December 31, 2017, the Company had unrecognized tax benefits of $15.3 million related to income tax refund claims filed in various jurisdictions. In late 2017, the Company settled a claim for the partial refund of state income taxes previously paid, resulting in a refund of $2.2 million, which is expected to be received in early 2018, and a reduction to the Company’s unrecognized tax benefits of $3.0 million. Due to the uncertain nature of the Company’s remaining refund claims, the remaining uncertain tax positions have not yet been recorded as an income tax benefit.
47
A reconciliation of the beginning and ending amount of unrecognized tax benefits is as follows (in thousands):
|
|
|
December 31, |
|
|||||||||
|
|
|
2017 |
|
|
2016 |
|
|
2015 |
|
|||
|
Beginning of period |
|
$ |
15,323 |
|
|
$ |
15,594 |
|
|
$ |
5,132 |
|
|
Additions for tax positions taken during the current period |
|
|
— |
|
|
|
— |
|
|
|
10,462 |
|
|
Reductions for tax positions taken during prior periods |
|
|
(2,950 |
) |
|
|
— |
|
|
|
— |
|
|
Settlements with tax authorities |
|
|
(2,182 |
) |
|
|
— |
|
|
|
— |
|
|
Exchange rate fluctuations |
|
|
1,352 |
|
|
|
(271 |
) |
|
|
— |
|
|
End of period |
|
$ |
11,543 |
|
|
$ |
15,323 |
|
|
$ |
15,594 |
|
All of the unrecognized tax benefits at December 31, 2017, if fully recognized, would affect the Company’s effective tax rate. The Company estimates that a reduction in its unrecognized tax benefits of approximately $11.5 million may occur within the next twelve months upon resolution of determinations by taxing authorities.
The Company and its subsidiaries file U.S. federal income tax returns and tax returns in various state and foreign jurisdictions. The Company is open to examination for the years ended 2005 and forward with respect to NOLs generated and carried forward from those years. The Company is open to examination by foreign jurisdictions for tax years 2013 forward.
Certain Taxes Payable Irrespective of NOLs—Under the Internal Revenue Code and related Treasury Regulations, the Company may “carry forward” its NOLs in certain circumstances to offset current and future income and thus reduce its federal income tax liability, subject to certain restrictions. To the extent that the NOLs do not otherwise become limited, the Company believes that it will be able to carry forward a significant amount of NOLs. However, these NOLs will not impact all taxes to which the Company may be subject. For instance, state or foreign income taxes and/or revenue based taxes may be payable if the Company’s income or revenue is attributed to jurisdictions that impose such taxes, and the NOLs will not offset any federal personal holding company tax liability that Pendrell or one or more of its corporate subsidiaries may incur. This is not an exhaustive list, but merely illustrative of the types of taxes to which the Company’s NOLs are not applicable.
Personal Holding Company Determination—The Internal Revenue Code imposes an additional tax on the undistributed income of a Personal Holding Company (“PHC”). In general, a corporation will be classified as a PHC if 50% or more of its outstanding shares, measured by value, are owned directly or indirectly by five or fewer individual shareholders at any time during the second half of the year (“Concentrated Ownership”) and at least 60% of its adjusted ordinary gross income is Personal Holding Company Income (“PHCI”). Broadly, PHCI includes items such as dividends, interest, rents and royalties, among others. For a corporate subsidiary, Concentrated Ownership is determined by reference to ownership of the parent corporation, and the subsidiary’s income is subject to additional tests to determine whether its income renders the subsidiary a PHC. If a corporation is a PHC, generates positive net PHCI and does not distribute to its shareholders a proportionate dividend in the full amount of the net PHCI, then the undistributed net PHCI is taxed (at 20% under current law).
Due to the significant number of shares held by the Company’s largest shareholders and the type of income that the Company generates, the Company must continually assess share ownership of Pendrell and its consolidated subsidiary ContentGuard to determine whether or not there is Concentrated Ownership of either corporation. For 2017, the Company determined that Pendrell, the parent company, met the Concentrated Ownership test, but that ContentGuard has not yet met the Concentrated Ownership test due to the interest held by its minority shareholders. The Company does not expect to have a PHC liability for 2017 because Pendrell did not have undistributed net PHCI as a result of the $3.0 million dividend payment made to shareholders on December 27, 2017. If either Pendrell or ContentGuard is a PHC in a future tax year, generates net PHCI, and does not distribute to its shareholders a proportionate dividend in the full amount of the net PHCI, then the undistributed net PHCI will be taxed.
48
Tax Benefits Preservation Plan—Effective January 29, 2010, the Board of Directors adopted the Tax Benefits Preservation Plan (“Tax Benefits Plan”) to help the Company preserve its ability to utilize fully its NOLs and to help preserve potential future NOLs. As discussed above, if the Company experiences a “Tax Ownership Change,” as defined in Section 382 of the Internal Revenue Code, the Company’s ability to use the NOLs could be significantly limited.
The Tax Benefits Plan is intended to act as a deterrent to any person or group acquiring, without the approval of the Company’s Board of Directors, beneficial ownership of 4.9% or more of the Company’s securities, defined to include: (i) shares of its Class A common stock and Class B common stock, (ii) shares of its preferred stock, (iii) warrants, rights, or options to purchase its securities, and (iv) any interest that would be treated as “stock” of the Company for purposes of Section 382 or pursuant to Treasury Regulation § 1.382-2T(f)(18).
Holders of 4.9% or more of the Company’s securities outstanding as of the close of business on January 29, 2010 will not trigger the Tax Benefits Plan so long as they do not (i) acquire additional securities constituting one-half of one percent (0.5%) or more of the Company’s securities outstanding as of the date of the Tax Benefits Plan (as adjusted to reflect any stock splits, subdivisions and the like), or (ii) fall under 4.9% ownership of the Company’s securities and then re-acquire securities that increase their ownership to 4.9% or more of the Company’s securities. The Board of Directors may exempt certain persons whose acquisition of securities is determined by the Board of Directors not to jeopardize the Company’s tax benefits or to otherwise be in the best interest of the Company and its shareholders. The Board of Directors may also exempt certain transactions.
12. Employee Benefits
The Company provides its eligible employees with medical and dental benefits, insurance arrangements to cover death in service, long-term disability and personal accident, as well as a defined contribution retirement plan. Expense related to contributions by the Company under the defined contribution retirement plan included in general and administrative expenses in the Company’s consolidated statements of operations for the years ended December 31, 2017, 2016 and 2015 was as follows (in thousands):
|
|
|
Year ended December 31, |
|
|||||||||
|
|
|
2017 |
|
|
2016 |
|
|
2015 |
|
|||
|
Defined contribution expenses |
|
$ |
65 |
|
|
$ |
80 |
|
|
$ |
201 |
|
13. Related Parties
The Company considers its related parties to be its principal shareholder and its affiliates.
Eagle River Satellite Holdings, LLC (“ERSH”), Eagle River Investments, LLC (“ERI”), Eagle River, Inc. and Eagle River Partners, LLC (“ERP”)—ERSH is the Company’s controlling shareholder. ERSH, together with its affiliates ERI, Eagle River, Inc. and ERP (collectively, “Eagle River”) holds an economic interest of approximately 37.4% of the Company’s outstanding common stock and a voting interest of approximately 67.6% in the Company as of December 31, 2017. Craig O. McCaw, our Executive Chairman, is the sole manager and beneficial member of ERI, which is the sole member of ERSH. Mr. McCaw is the sole shareholder of Eagle River, Inc. and the beneficial member of ERP. Mr. McCaw disclaims beneficial ownership of the securities owned by ERSH, ERI and ERP, except to the extent of any pecuniary interest.
49
14. Quarterly Financial Data (Unaudited)
The following table contains selected unaudited statement of operations information for each quarter of the years ended December 31, 2017 and 2016. The quarterly financial data reflects all normal recurring adjustments necessary for a fair presentation of the information for the periods presented. The operating results for any quarter are not necessarily indicative of results for any future period. During the quarter ended December 31, 2017, the Company reversed its prior tax accrual of $0.6 million related to PHC tax as it chose, instead, to pay a $3.0 million dividend. See Note 11 – “Income Taxes” for further details.
Additionally, in the same quarter, the Company recognized a $2.1 million tax benefit associated with the recognition of previously recorded uncertain tax positions.
There were no changes in accounting estimates that materially affected the fourth quarter of the year ended December 31, 2016.
Unaudited quarterly results were as follows (in thousands, except per share data):
|
|
|
Three months ended |
|
||||||||||||||||||||||||||||
|
|
|
March 31, |
|
|
June 30, |
|
|
September 30, |
|
|
December 31, |
|
|||||||||||||||||||
|
|
|
2017 |
|
|
2016 |
|
|
2017 |
|
|
2016 |
|
|
2017 |
|
|
2016 |
|
|
2017 |
|
2016 |
|
||||||||
|
Revenue |
|
$ |
— |
|
|
$ |
13,500 |
|
|
$ |
35,122 |
|
|
$ |
45,003 |
|
|
$ |
5,443 |
|
|
$ |
— |
|
|
$ |
2,209 |
|
$ |
515 |
|
|
Operating income (loss) |
|
|
(8,064 |
) |
|
|
4,928 |
|
|
|
24,462 |
|
|
|
21,103 |
|
|
|
1,918 |
|
|
|
(5,501 |
) |
|
|
(2,165 |
) |
|
(5,313 |
) |
|
Net income (loss) |
|
|
(7,783 |
) |
|
|
7,110 |
|
|
|
24,203 |
|
|
|
21,257 |
|
|
|
2,343 |
|
|
|
(5,341 |
) |
|
|
1,093 |
|
|
(5,077 |
) |
|
Net income (loss) attributable to Pendrell |
|
|
(7,759 |
) |
|
|
6,565 |
|
|
|
24,228 |
|
|
|
21,420 |
|
|
|
1,713 |
|
|
|
(5,254 |
) |
|
|
878 |
|
|
(4,968 |
) |
|
Basic income (loss) per share attributable to Pendrell |
|
$ |
(29.33 |
) |
|
$ |
24.58 |
|
|
$ |
98.49 |
|
|
$ |
80.07 |
|
|
$ |
6.96 |
|
|
$ |
(19.62 |
) |
|
$ |
3.61 |
|
$ |
(18.54 |
) |
|
Diluted income (loss) per share attributable to Pendrell |
|
$ |
(29.33 |
) |
|
$ |
23.72 |
|
|
$ |
95.80 |
|
|
$ |
77.33 |
|
|
$ |
6.78 |
|
|
$ |
(19.62 |
) |
|
$ |
3.51 |
|
$ |
(18.54 |
) |
15. Subsequent Events
On January 23, 2018, the Board authorized management to make an offer to certain Company employees to exchange their stock options and restricted stock for future cash payments to be paid out as follows: (i) twenty-five percent (25%) on August 15, 2018, so long as the employee continues as an employee of the Company through that date; (ii) twenty-five percent (25%) on August 15, 2019, so long as the employee continues as an employee of the Company through that date; and (iii) the remaining fifty percent (50%) on August 15, 2020, so long as the employee continues as an employee of the Company through that date.
The Company intends to make the offer sometime in the first quarter of 2018. If all employees who receive the offer accept: (i) 3,184 options and 86 restricted stock awards outstanding at December 31, 2017 will be canceled; and (ii) the Company estimates that it may incur an additional $0.7 million of stock-based compensation expense in the year ended December 31, 2018, which represents the incremental fair value of the right to receive cash over the estimated fair value of the canceled stock options and restricted stock, as of the acceptance date.
50
None.
Evaluation of Disclosure Controls and Procedures
Our chief executive officer and chief financial officer have evaluated our disclosure controls and procedures as of December 31, 2017, as such terms are defined under Rule 13a-15(e) promulgated under the Securities Exchange Act of 1934, as amended (the “Exchange Act”), and have concluded that these disclosure controls and procedures are effective to ensure that the information required to be disclosed by us in the reports that we file or submit under the Exchange Act (as defined in Rules 13a-15(e) and 15d-15(e)) is recorded, processed, summarized and reported within the time periods specified in the SEC’s rules and forms and is accumulated and communicated to our management, including our chief executive officer and chief financial officer, as appropriate to allow timely decisions regarding required disclosure.
Management’s Report on Internal Control over Financial Reporting
Our management is responsible for establishing and maintaining adequate internal control over financial reporting, as defined in Rule 13a-15f of the Exchange Act. These internal controls are designed to provide reasonable assurance that the reported financial information is presented fairly, that disclosures are adequate and that the judgments inherent in the preparation of financial statements are reasonable. There are inherent limitations in the effectiveness of any system of internal control, including the possibility of human error and overriding of controls. Consequently, an effective internal control system can only provide reasonable, not absolute, assurance with respect to reporting financial information.
Management conducted an evaluation of the effectiveness of our internal control over financial reporting based on the framework and criteria established in Internal Control—Integrated Framework (2013), issued by the Committee of Sponsoring Organizations of the Treadway Commission. Based on this evaluation, management concluded that our internal control over financial reporting was effective as of December 31, 2017.
Our internal control over financial reporting as of December 31, 2017 has been audited by Grant Thornton, an independent registered public accounting firm, as stated in their report which appears in “Item 9A—Controls and Procedures” within this Form 10-K.
Changes in Internal Control Over Financial Reporting
There have been no changes in our internal control over financial reporting during the fourth quarter of 2017 that have materially affected, or are reasonably likely to materially affect, our internal control over financial reporting.
51
REPORT OF INDEPENDENT REGISTERED PUBLIC ACCOUNTING FIRM
Board of Directors and Shareholders
Pendrell Corporation
Opinion on internal control over financial reporting:
We have audited the internal control over financial reporting of Pendrell Corporation (a Washington corporation) and subsidiaries (the “Company”) as of December 31, 2017, based on criteria established in the 2013 Internal Control—Integrated Framework issued by the Committee of Sponsoring Organizations of the Treadway Commission (COSO). In our opinion, the Company maintained, in all material respects, effective internal control over financial reporting as of December 31, 2017, based on criteria established in the 2013 Internal Control—Integrated Framework issued by COSO.
We also have audited, in accordance with the standards of the Public Company Accounting Oversight Board (United States) (“PCAOB”), the consolidated financial statements of the Company as of and for the year ended December 31, 2017, and our report dated February 16, 2018 expressed unqualified opinion on those financial statements.
Basis for opinion:
The Company’s management is responsible for maintaining effective internal control over financial reporting and for its assessment of the effectiveness of internal control over financial reporting, included in the accompanying Management’s Report on Internal Control over Financial Reporting. Our responsibility is to express an opinion on the Company’s internal control over financial reporting based on our audit. We are a public accounting firm registered with the PCAOB and are required to be independent with respect to the Company in accordance with the U.S. federal securities laws and the applicable rules and regulations of the Securities and Exchange Commission and the PCAOB.
We conducted our audit in accordance with the standards of the PCAOB. Those standards require that we plan and perform the audit to obtain reasonable assurance about whether effective internal control over financial reporting was maintained in all material respects. Our audit included obtaining an understanding of internal control over financial reporting, assessing the risk that a material weakness exists, testing and evaluating the design and operating effectiveness of internal control based on the assessed risk, and performing such other procedures as we considered necessary in the circumstances. We believe that our audit provides a reasonable basis for our opinion.
Definition and limitations of internal control over financial reporting:
A company’s internal control over financial reporting is a process designed to provide reasonable assurance regarding the reliability of financial reporting and the preparation of financial statements for external purposes in accordance with generally accepted accounting principles. A company’s internal control over financial reporting includes those policies and procedures that (1) pertain to the maintenance of records that, in reasonable detail, accurately and fairly reflect the transactions and dispositions of the assets of the company; (2) provide reasonable assurance that transactions are recorded as necessary to permit preparation of financial statements in accordance with generally accepted accounting principles, and that receipts and expenditures of the company are being made only in accordance with authorizations of management and directors of the company; and (3) provide reasonable assurance regarding prevention or timely detection of unauthorized acquisition, use, or disposition of the company’s assets that could have a material effect on the financial statements.
Because of its inherent limitations, internal control over financial reporting may not prevent or detect misstatements. Also, projections of any evaluation of effectiveness to future periods are subject to the risk that controls may become inadequate because of changes in conditions, or that the degree of compliance with the policies or procedures may deteriorate.
/s/ GRANT THORNTON LLP
Seattle, Washington
February 16, 2018
52
None.
Information Concerning our Directors
The name and certain background information regarding each of our directors are set forth below. There are no family relationships among directors or executive officers of the Company. In addition to the information presented below regarding each director’s specific experience, qualifications, attributes and skills, each of our directors has demonstrated business acumen and an ability to exercise sound judgment, as well as a commitment to the Company and our Board as demonstrated by his past service.
|
|
|
Age |
|
Position Held with the Company |
|
Richard P. Emerson |
|
55 |
|
Director |
|
Nicolas Kauser |
|
77 |
|
Director |
|
Craig O. McCaw |
|
68 |
|
Executive Chairman of the Board of Directors |
|
Lee E. Mikles |
|
62 |
|
Chief Executive Officer, President and Director |
|
R. Gerard Salemme |
|
63 |
|
Consultant and Director |
|
Stuart M. Sloan |
|
74 |
|
Director |
|
H. Brian Thompson |
|
78 |
|
Director |
Richard P. Emerson
Became Director: October 2010
Mr. Emerson has spent his entire career in investment banking and corporate finance. Since 2008, Mr. Emerson has been a private investor and pursued personal interests. From 2009 to 2012, Mr. Emerson attended Stanford University Law School from which he earned a juris doctor degree. From 2004 through 2008, he was Senior Managing Director of Evercore Partners Inc., a public investment banking advisory firm. From 2000 through 2003, Mr. Emerson served as Senior Vice President for Microsoft Corporation, a leading provider of software and technology solutions, reporting directly to the Chief Executive Officer and serving on the executive leadership team, with responsibility for all acquisitions, investments and corporate strategy. Mr. Emerson joined Microsoft from investment bank Lazard Ltd., where as a Senior Managing Director, he advised telecom and technology clients on significant mergers, acquisitions and related financial transactions from 1994 to 2000. Prior to Lazard, Mr. Emerson held senior roles with The Blackstone Group and Morgan Stanley & Co., both of which are financial services companies. Mr. Emerson previously served on the board of directors of Clearwire Corporation, a leading provider of wireless broadband services (“Clearwire”), from 2003 through 2008, where he also served on the Audit Committee.
Qualifications and Skills: With a career dedicated to corporate finance and mergers and acquisitions, Mr. Emerson is well suited to assist the Company with future financing and investment opportunities. His extensive background in corporate finance and prior experience as a member of the Audit Committees of two public companies and a non-profit entity and his experience with the evaluation of financial statements qualifies him as an ‘audit committee financial expert’ as defined in the applicable rules of the SEC. As such, the Board of Directors has appointed Mr. Emerson to serve as Chair of the Audit Committee.
Nicolas Kauser
Became Director: December 2008 (also served from May 2000 through May 2004)
Mr. Kauser has spent over 40 years in the communications industry, including as President of Clearwire International LLC, Chief Technology Officer of Clearwire, Executive Vice President and Chief Technology Officer for AT&T Wireless Services, Inc. (formerly McCaw Cellular Communications, Inc.) and Senior Vice President of Operations and Vice President of Engineering of Cantel, Inc. He also spent 20 years in Venezuela where he first worked for the National Telephone Co. and subsequently co-founded two companies in the communications industry. Mr. Kauser served on the board of directors of TriQuint Semiconductor, Inc., a provider of radio
53
frequency solutions and technology, from 1999 to January 2015. In 1998, Mr. Kauser received the prestigious Gold Prize awarded by The Carnegie Mellon Institute and American Management Systems for excellence in the application of information technology. In recognition of his contributions to the communications industry, Mr. Kauser was inducted to the Wireless Hall of Fame in October 2011.
Qualifications and Skills: Mr. Kauser was a director with Pendrell from 2000 to 2004 and is familiar with our operations and history. He has been involved in the technology industry for many years and has experience with communications companies. In addition, Mr. Kauser’s experience as a senior officer at Clearwire and AT&T provides him with the management experience to assist in the oversight of our operations and strategic objectives. He has served on boards of numerous companies, including TriQuint Semiconductor, Inc. and various private companies. The Board of Directors has appointed Mr. Kauser to serve as Chair of the Nominating and Governance Committee and as a member of the Audit Committee.
Craig O. McCaw
Became Director: May 2000; Chairman of the Board since June 2011 (also served as Chairman from 2000 until 2009); Executive Chairman since November 2014.
Since 1993, Mr. McCaw has been Chairman, Chief Executive Officer, and the beneficial member of the Eagle River group of investment companies which focus on strategic investments in the telecommunications industry. Mr. McCaw served as a director and Chairman of DBSD North America, Inc., a satellite communications company, from 2005 to 2008. Mr. McCaw founded Clearwire in 2003 and served as its chairman of the board of directors from 2003 to December 2010. Mr. McCaw was a director of Nextel Communications, Inc., a wireless service provider that was acquired by Sprint Corporation in 2005, from 1995 until 2003, and a director of XO Communications, Inc., a communications network services provider formerly known as NEXTLINK Communications, Inc. (“XO”), from 1997 until 2002. From 1994 to 1997, he was also XO’s Chief Executive Officer. From 1974 to 1994, Mr. McCaw served as Chairman and Chief Executive Officer of McCaw Cellular Communications, Inc., which he built into the nation’s leading provider of cellular services in more than 100 U.S. cities, until the company was sold to AT&T in 1994.
Qualifications and Skills: Mr. McCaw brings to our Board of Directors demonstrated leadership skills and operating experience, including those acquired during more than 30 years of serving as a senior executive and director of Clearwire, XO, Nextel and McCaw Cellular Communications. As a former director of public and private companies in the telecommunications industry, Mr. McCaw also brings to the Company broad-based business experience and financial acumen.
Lee E. Mikles
Became Director: April 2014
Mr. Mikles was appointed President and Chief Executive Officer of Pendrell in June 2015 following his service as Interim Chief Executive Officer and President from November 2014 to June 2015. He served as chief executive officer of FutureFuel Corp., a manufacturer of custom and performance chemicals and biofuels, from 2005 to January 2013, its president from 2005 to January 2015, its principal financial officer from 2005 to 2008, and served as a director between 2005 and 2016. He served as chairman of Mikles/Miller Management, Inc., a registered investment adviser and home to the Kodiak family of funds, between 1992 and 2005 and was chairman of Mikles/Miller Securities, LLC, a registered broker-dealer, between 1999 and 2005. Mr. Mikles has served on the boards of directors of Pacific Capital Bankcorp., Official Payments Corporation, Coastcast Corporation, Nelnet, Inc., Imperial Bank and Imperial Bancorp.
Qualifications and Skills: Mr. Mikles brings to our Board of Directors extensive business, finance and investment experience. In addition, his experience as a senior executive and director of private and public companies, his active involvement in strategic planning and his significant financial and investment experience make him well suited to assist the Company in the oversight of our future strategic business and investment opportunities.
54
R. Gerard Salemme
Became Director: June 2010 (also served from May 2002 through December 2008)
Mr. Salemme has served as a consultant to the Company since February 2015. Mr. Salemme was our Executive Vice President and Chief Strategy Officer from March 2011 to February 2015. He is a Partner in Eagle River Partners, LLC, a private investment firm. Mr. Salemme has over 30 years of experience in business and government, having served as Executive Vice President-Strategy, Policy and External Affairs of Clearwire from 2004 to 2010, and as Senior Vice President, External Affairs of XO. Prior to joining XO, Mr. Salemme held senior executive positions with AT&T Corporation and McCaw Cellular Communications Inc. He also held the position of Senior Telecommunications Policy Analyst for the U.S. House of Representatives Subcommittee on Telecommunications and Finance from 1987 to 1991 and served as Chief of Staff to Congressman Ed Markey of Massachusetts from 1976 to 1984.
Qualifications and Skills: Mr. Salemme brings to our Board of Directors significant experience in business and government, including experience gained as a senior executive officer with Clearwire, XO and AT&T, which provides him with the management experience to assist in the oversight of our operations and strategic objectives. He is familiar with our operations and history, having served on our Board of Directors from 2002 to 2008. He has also served as a board member for numerous private companies.
Stuart M. Sloan
Became Director: October 2010
Since 1984, Mr. Sloan has been a principal of Sloan Capital Companies LLC, a private investment company that serves as general partner in the redevelopment of University Village, a nationally recognized regional center for upscale shopping in Seattle, Washington. From 1986 through 1999, Mr. Sloan was an owner and executive officer of Quality Food Centers, Inc., a grocery retailer (“QFC”), which was acquired by The Fred Meyer Co. in 1997. Prior to QFC, from 1967 until 1984, Mr. Sloan owned in part and operated Schuck’s Auto Supply, Inc., a retail provider of automotive maintenance and repair products that was sold to Pay ‘n Save Corp in 1984. Mr. Sloan currently serves as a director of Anixter International, Inc., a global distributor of communications and security products, electrical and electronic wire and cable, fasteners and other small parts. From 2003 until March 2011, Mr. Sloan served as a director of J. Crew Group, Inc., an apparel retailer. He is active, both personally and through his private foundation, in numerous civic, cultural, educational and other philanthropic activities.
Qualifications and Skills: Mr. Sloan’s extensive management experience, along with his service on numerous boards of directors, provides him with the experience to assist in the oversight of our operations and strategic objectives. For this reason, the Board of Directors has appointed Mr. Sloan to serve as a member of the Nominating and Governance Committee. His direct involvement, over the span of decades, with management, personnel management and employee incentives makes him particularly well suited to assist with compensation issues and other human resource matters. As such, the Board of Directors has appointed Mr. Sloan to serve as a member of the Compensation Committee.
H. Brian Thompson
Became Director: May 2007
Since 2006, Mr. Thompson has been Executive Chairman of GTT Communications, Inc., a leading global cloud network provider to multinational clients. Mr. Thompson continues to head his own private equity investment and advisory firm, Universal Telecommunications, Inc. From 2002 to 2007, Mr. Thompson was Chairman of Comsat International, one of the largest independent telecommunications operators serving Latin America. He also served as Chairman and Chief Executive Officer of Global TeleSystems Group, Inc. from 1999 to 2000. Mr. Thompson was Chairman and Chief Executive Officer of LCI International, Inc. a telecommunications company, from 1991 until its merger with Qwest Communications International Inc. in 1998. Mr. Thompson became Vice Chairman of the board of directors for Qwest until his resignation in December 1998. Mr. Thompson previously served as Executive Vice President of MCI Communications Corporation, a telecommunications company, from 1981 to 1990, and prior to MCI was a management consultant with McKinsey & Company, a global management consulting firm, where he specialized in the management of telecommunications. He currently serves
55
as a member of the board of directors of Penske Automotive Group, an international automotive retailer. He serves as a member of the Irish Prime Minister’s Ireland-America Economic Advisory Board, and from January 1999 to March 1999, he served as Non-Executive Chairman of Telecom Eireann, Ireland’s incumbent telephone company. Mr. Thompson received his M.B.A. from Harvard’s Graduate School of Business and holds an undergraduate degree in chemical engineering from the University of Massachusetts.
Qualifications and Skills: Mr. Thompson brings to our Board of Directors significant experience in the telecommunications industry, including experience as an Executive Chairman at Global Telecom & Technology and Chairman at Comsat International. His executive officer experience at LCI International and MCI Communications Corporation provides him with the management experience to assist in the oversight of our operations and strategic objectives. He has served on the boards of numerous companies, including Axcelis Technologies, Inc. and Sonus Networks, Inc. The Board of Directors has appointed Mr. Thompson to serve as chair of the Compensation Committee and as a member of its Audit Committee.
Information Concerning our Executive Officers
The following is a list of the names and ages of our current executive officers, indicating all positions and offices held by each such person and each such person’s business experience during at least the past five years. All such persons have been elected to serve until their successors are elected and qualified or until their earlier resignation or removal.
|
Name |
|
Age |
|
Position Held with the Company |
|
Lee E. Mikles |
|
62 |
|
Director; Chief Executive Officer and President |
|
Steven A. Ednie |
|
49 |
|
Vice President and Chief Financial Officer |
|
Timothy M. Dozois |
|
55 |
|
Corporate Counsel and Corporate Secretary |
Set forth below is certain additional information concerning Messrs. Ednie and Dozois. Information concerning Mr. Mikles has been provided above in “Information Concerning our Directors.”
Steven A. Ednie
Mr. Ednie has served as our Vice President and Chief Financial Officer since September 2014. Mr. Ednie is an experienced financial executive with an extensive background in domestic and international accounting and tax matters, serving most recently as Chief Accounting Officer of Clearwire from October 2010 to April 2014, and as Vice President-Tax and Chief Tax Officer from 2004 to April 2014. Before joining Clearwire, Mr. Ednie served as the Director of Tax of Expedia, Inc., an Internet-based travel website company, from 2002 to 2004, as Executive Director–Tax and Chief Tax Officer of XO Communications Inc., a telecommunications company, from 1997 to 2002, and as Tax Manager of MIDCOM Communications, Inc., a telecommunications company, from 1996 to 1997. Mr. Ednie began his professional career at Coopers & Lybrand, LLP, an accounting firm, where he was a Senior Associate. Mr. Ednie holds a B.A. in Business Administration from the University of Washington.
Timothy M. Dozois
Mr. Dozois has served as our Corporate Counsel since May 2010 and as our Corporate Secretary since April 2014. From 1996 to 2010, Mr. Dozois engaged in the private practice of law as an equity partner of Davis Wright Tremaine LLP, with a focus on securities law compliance, mergers, acquisitions, divestitures, and technology licensing matters. Mr. Dozois has been an outside director of MacKenzie Realty Capital, Inc., a publicly listed real estate business development company, since January 2012, and an outside director of Pinnacle Healthcare, Inc., a privately held operator of skilled nursing facilities, since July 2011. Mr. Dozois is a member of the Oregon State Bar Association. He received his B.S. in Financial Management from Oregon State University and his J.D from the University of Oregon School of Law, where he was Order of the Coif.
56
Section 16(a) Beneficial Ownership Reporting Compliance
Section 16(a) of the Exchange Act requires our executive officers, directors and ten percent shareholders to file reports of ownership and changes in ownership with the SEC. The same persons are required to furnish us with copies of all Section 16(a) forms they file. Based solely on our review of forms furnished to us during the most recent fiscal year, we believe that all reports required by Section 16(a) for transactions in the year ended December 31, 2017 were filed timely, except Form 4s reflecting equity grants to directors in October 2017 that were reported on Form 4s filed on January 3, 2018.
Code of Conduct and Ethics
We have adopted a Code of Conduct and Ethics that applies to all officers, directors and employees. The Code of Conduct and Ethics is publicly available on our website located at www.pendrell.com, by clicking on “Investors” and then “Corporate Governance,” or can be obtained without charge by written request to Pendrell’s Corporate Secretary at the address of Pendrell’s principal executive office. If the Company makes any substantive amendments to the Code of Conduct and Ethics or grants any waiver from a provision of the Code of Conduct and Ethics to any executive officer or director, we will promptly disclose the nature of the amendment or waiver on our website.
Shareholder Nominations and Recommendations for Director Candidates
We have not made any material changes to the procedures by which our shareholders may recommend nominees to our board of directors since we last disclosed the procedures under the caption “Shareholder Nominations and Recommendations for Director Candidates” in our proxy statement for the 2017 annual meeting of shareholders filed with the SEC on April 27, 2017.
Audit Committee
Messrs. Emerson, Kauser, and Thompson are the members of our Audit Committee. The Audit Committee: (i) evaluates the performance of and assesses the qualifications and independence of the independent auditor; (ii) determines and approves the engagement of the independent auditor, including the reasonable fees and other terms applicable to such engagement; (iii) determines whether to retain or terminate the existing independent auditor or to appoint and engage a new independent auditor; (iv) reviews and approves the retention of the independent auditor to perform any proposed permissible non-audit services; (v) reviews and evaluates the qualifications, performance and independence of the lead audit partner of the independent auditor and assures the regular rotation of the lead audit partner, reviewing partner and other audit engagement team partners of the independent auditor as required by law; (vi) reviews and approves or rejects transactions between the company and any related persons; (vii) confers with management and the independent auditor regarding the effectiveness of internal controls over financial reporting; (viii) establishes procedures, as required under applicable law, for the receipt, retention and treatment of complaints received by the Company regarding accounting, internal accounting controls or auditing matters and the confidential and anonymous submissions by employees of concerns regarding questionable accounting or auditing matters; (ix) meets to review the Company’s annual audited financial statements and quarterly financial statements with management and the independent auditor, including reviewing the company’s disclosures under “Management’s Discussion and Analysis of Financial Condition and Results of Operations” and discusses, as appropriate, any major issues as to the adequacy of the company’s internal controls and the adequacy of disclosures about changes in internal control over financial reporting; (x) annually reviews the terms of the directors and executive officers insurance coverage and approves the terms prior to the renewal of the policy; (xi) reviews and assesses the adequacy of the Company’s investment policy and recommends any proposed changes to the Board; (xii) ensures the company maintains an internal audit capability, at least annually evaluates the performance of the company’s internal audit capability, and discusses with the independent auditor and management the internal audit capabilities responsibilities, budget and staffing and any recommended changes in the planned scope of the internal audit; and (xiii) has such other authority, duties and responsibilities as the Board delegates to the Audit Committee. The Board has determined that Richard Emerson qualifies as an Audit Committee “financial expert” as defined by the SEC rules.
57
Compensation Discussion and Analysis
Overview
This compensation discussion and analysis describes the principles underlying our executive compensation program and the factors that impacted the 2017 compensation of our named executive officers. Our named executive officers for 2017 are listed in the Summary Compensation Table and include the following individuals:
|
|
• |
Mr. Mikles, our Chief Executive Officer and President; |
|
|
• |
Mr. Ednie, our Chief Financial Officer; and |
|
|
• |
Mr. Dozois, our Corporate Counsel and Corporate Secretary |
This compensation discussion and analysis is limited to a discussion of compensation and other benefits earned by the named executive officers for their performance in 2017.
Executive Summary
Our executive compensation program is designed to balance achievement of near-term results with positioning for long-term success by encouraging executives to expand capacity, increase productivity, create efficiencies and implement tangible process improvements.
Pay for Performance
Consistent with our pay-for-performance philosophy, a substantial part of our executive compensation program consists of performance-based compensation. During 2017, our named executive officers who participated in our annual performance-based cash incentive plan, which we also refer to as the 2017 Incentive Plan (the “2017 Incentive Plan”), were eligible to receive cash bonuses upon achieving pre-established performance objectives, with relatively equal weighting between Company financial objectives and individual objectives. Performance-based equity awards also constitute the principal component of our Chief Executive Officer’s compensation package.
Financial Results
In 2017, we exceeded our targets for revenue and non-variable cash expense. We also achieved profit and loss objectives for individual cost centers within the Company.
2017 Compensation Highlights
Summarized below are 2017 executive compensation highlights, described more fully in later sections of this Compensation Discussion and Analysis.
|
|
• |
Mr. Mikles vested into 2,000 shares of Class A common stock and 1,000 options to purchase shares of Class A common stock. |
|
|
• |
We awarded 2017 cash incentive awards under the 2017 Incentive Plan to Messrs. Ednie and Dozois at 124% and 114% of target, respectively. |
|
|
• |
The advisory vote on executive compensation at our 2017 annual meeting of shareholders received approval from over 99% of the votes cast. |
Executive Compensation Philosophy and Objectives
Our executive compensation program is designed to balance achievement of near-term results with positioning for long-term success by encouraging executives to expand capacity, increase productivity, create efficiencies and implement tangible process improvements. The Company believes that the skill, talent, judgment, and dedication of its executive officers are critical factors affecting the long-term value of our company. In furtherance of this belief,
58
the primary goals of our executive compensation program in 2017 were to (i) provide compensation at competitive levels in order to attract and retain qualified executives who can manage the evolution of our business and contribute to our long-term success, (ii) motivate performance consistent with clearly defined corporate and individual performance goals, and (iii) provide incentives to help align the long-term interests of our executives with those of our shareholders. We believe our executive compensation program provides a solid framework for implementing and maintaining a balanced approach to compensation, has been instrumental in helping us accomplish our business objectives, and is strongly aligned with the long-term interests of our shareholders. In detail, our compensation program is designed to:
|
|
• |
provide a balance between fixed and variable compensation elements that encourage performance while discouraging excessive risk-taking; |
|
|
• |
provide incentives that encourage our executives to appropriately balance short-term and long-term strategic goals; |
|
|
• |
attract and retain individuals with the leadership abilities and skills to successfully execute our business strategy and build long-term shareholder value; |
|
|
• |
encourage and reward outstanding initiative, achievement, and teamwork, and motivate individuals to perform at their highest level; |
|
|
• |
reflect varying degrees of executive responsibility, accountability and impact on our business; |
|
|
• |
provide compensation and incentive packages to our executives that are competitive with our peer companies; |
|
|
• |
emphasize performance-based pay that aligns incentives with our strategic objectives; and |
|
|
• |
provide a meaningful ownership stake to appropriately align executive interests with shareholder interests. |
Role of the Compensation Committee
The Compensation Committee of the Board of Directors is responsible for the administration and oversight of our executive compensation program. Each director who served on the Compensation Committee in 2017 is a non-employee director within the meaning of SEC Rule 16b-3 and is an outside director within the meaning of Section 162(m) of the Code. The Compensation Committee has overall responsibility for approving and evaluating our executive officer compensation plans, policies, and programs, including:
|
|
• |
periodically reviewing and establishing the agreements with, and compensation of, our executive officers; |
|
|
• |
establishing and periodically reviewing the operation and administration of our executive compensation programs; |
|
|
• |
carrying out duties assigned to the Compensation Committee under any equity compensation plan or other incentive compensation plan, including granting equity awards to our executive officers; and |
|
|
• |
performing other duties as assigned by the Board of Directors. |
The Compensation Committee may delegate authority to subcommittees, retain or terminate compensation consultants, and obtain advice and assistance from internal or external legal, accounting or other advisers. The Compensation Committee may also consider recommendations of the Chief Executive Officer.
Say on Pay Feedback from Shareholders
Shareholders holding more than 99% of the votes cast at our 2017 annual meeting of shareholders approved, on an advisory basis, the compensation of our named executive officers. The Compensation Committee considered the results of the 2017 vote and, based in part on the significant shareholder support, made no changes to our executive compensation policies or decisions.
59
Role of Compensation Committee Consultants in Compensation Decisions
The Compensation Committee periodically engages independent compensation consultants to assist with the discharge of its responsibilities. Compensation consultants may review our compensation programs to confirm consistency with our executive compensation philosophy and objectives, may advise the Compensation Committee on emerging trends and issues related to the compensation of executive officers, and may recommend peer group and market data as reference points for executive compensation decisions. The Compensation Committee did not engage any compensation consultants in 2017.
Role of Management in Compensation Decisions
Our Chief Executive Officer and President periodically assesses the performance of our executive officers (other than himself) and makes recommendations to the Compensation Committee regarding the compensation of these executive officers. In early 2017, Mr. Mikles made recommendations regarding 2017 performance goals for Messrs. Ednie and Dozois. In January 2018, Mr. Mikles assessed the individual performance of Messrs. Ednie and Dozois for 2017 and the contributions of these executives to our 2017 business and strategic objectives, and thereafter recommended to the Compensation Committee that they receive cash incentive awards pursuant to the 2017 Incentive Plan. Mr. Mikles did not make recommendations regarding his own compensation, nor was he present for any executive sessions or discussions regarding his own compensation.
Peer Companies and Benchmarking
The Compensation Committee considers multiple data sources when assessing and constructing compensation programs, including competitive market data. However, the Committee does not set or maintain compensation at certain target percentiles within a peer group, nor does the Committee rely solely on market data. Instead, the Committee exercises discretion when making decisions regarding our compensation programs and the performance assessment process, with the goal of rapidly responding to and adjusting for an evolving business environment and the value delivered by our executive officers.
In addition to competitive market data, the Compensation Committee considers a variety of other factors when establishing compensation programs, including general market conditions, internal equity, individual responsibilities, and individuals’ recent or expected future contributions. The Compensation Committee also looks to our human resources staff to periodically assess executive compensation data from compensation consultants or salary surveys.
Mr. Mikles. Effective June 1, 2015, the Board of Directors appointed Mr. Mikles as our Chief Executive Officer and President following his service as Interim Chief Executive Officer and President from November 19, 2014 to June 1, 2015. In establishing compensation for Mr. Mikles upon his transition from interim status, our Compensation Committee considered the total direct compensation of chief executive officers in a group of 11 companies in the technology and intellectual property sector (the “Compensation Peer Group”). Our human resources staff and the Compensation Committee selected these companies based on a variety of factors, including revenue, industry, stage of development, and market capitalization. The companies in that Compensation Peer Group were:
|
Acacia Research Corporation |
|
Dolby Laboratories, Inc. |
|
DTS, Inc. |
|
Immersion Corporation |
|
InterDigital, Inc. |
|
Rambus Inc. |
|
Rovi Corporation |
|
RPX Corporation |
|
Tessera Technologies, Inc. |
|
TiVO Inc. |
|
VirnetX Holding Corporation |
|
|
Chief Financial Officer and Corporate Counsel. The Compensation Committee compared target base salary and target cash compensation for chief financial officers and chief legal officers in the Radford Global Technology Survey for companies with comparable annual revenue (the “Target Peer Group”) to the 2017 cash compensation of Messrs. Ednie and Dozois. The Compensation Committee also considered each executive’s experience, skills, role, and responsibilities when determining the compensation for these executives. Mr. Ednie’s base salary for 2017 was
60
marginally above the 50th percentile of the annual base salaries of chief financial officers in the Target Peer Group. His total target cash compensation for 2017 was above the 50th percentile of the total target cash compensation for chief financial officers in the Target Peer Group. Mr. Dozois’ base salary and total target cash compensation for 2017 was slightly below the 50th percentile of the annual base salaries of individuals serving as general counsel for the companies in the Target Peer Group. His total target cash compensation for 2017 was also below the 50th percentile.
Our Compensation Committee does not formulaically apply competitive compensation data. Cash compensation paid to an executive may be above or below the targeted range due to numerous factors, including but not limited to Company and individual performance, differences in responsibilities between executives at peer companies, an executive’s prior experience and experience and tenure with the Company, and contributions relative to other executives at the Company.
Elements of Compensation
As in 2015 and 2016, the 2017 compensation for Mr. Mikles consisted primarily of the vesting of long-term equity incentive awards. The 2017 compensation for Messrs. Ednie and Dozois consisted of base salary and short-term performance-based cash incentive compensation.
Each element of our executive compensation program is designed to achieve one or more of our performance, retention, and alignment goals as described below. These elements provide incentives to encourage our executives to appropriately balance their focus between our short-term and long-term strategic goals.
|
Compensation Element |
|
Designed to Reward |
|
Relationship to Compensation Philosophy |
|
Annual Base Salary |
|
Executive officer’s experience, responsibilities, and contributions to the Company |
|
Attract and retain talented executives through competitive pay programs that ensure a fixed level of annual cash compensation for our executives |
|
|
|
|
||
|
Short-term Performance-based Cash Incentives |
|
Achievement of corporate and individual performance goals |
|
Motivate executives to achieve and exceed annual business and individual objectives that we believe are important to our long-term success |
|
|
|
|
||
|
Long-term Equity Incentives (options and stock awards) |
|
Increased shareholder value through the achievement of long-term strategic goals such as revenue growth, return on invested capital, and stock price appreciation |
|
Align executive and shareholder interests to optimize shareholder return; motivate executives to achieve and exceed business objectives; encourage retention through multi-year vesting |
Each executive’s compensation, including the mix of cash compensation, equity awards, and compensation that is performance-based, ultimately reflects the Compensation Committee’s business judgment.
Except for nominal monthly stipends to assist with commuting expenses incurred by Mr. Dozois, who resided outside the state of Washington during 2017, the Company has not established programs under which executive perquisites are offered. The Company does not offer guaranteed payouts under its cash incentive program or other benefit programs to its executives that are not provided to the general employee population.
2017 Executive Compensation
Chief Executive Officer. Mr. Mikles was appointed our Chief Executive Officer and President in June 2015, following his service as our Interim Chief Executive Officer and President from November 2014 to June 2015. In May 2015, the Compensation Committee developed a compensation package for Mr. Mikles that was almost exclusively comprised of long-term equity incentive compensation. Other than an increase in Mr. Mikles nominal annual cash salary from $6,000 to $7,500 in early 2017 to allow for his contributions to employee benefits, the Compensation Committee made no changes to Mr. Mikles’ compensation package.
61
From time to time, Mr. Mikles utilizes private chartered aircraft for business travel to avoid travel delays, work productively and efficiently while in transit, minimize time away from the office, and maximize time for business purposes while traveling. In 2017, the Compensation Committee reaffirmed the reimbursement of private chartered aircraft expenses incurred by Mr. Mikles for Company business travel subject to limits set forth in the Company’s Travel and Reimbursement Policy. Reimbursement is conditioned upon proper substantiation and documentation of business-related travel, including all documentation required (by the Internal Revenue Service or otherwise) to allow the Company to deduct the corresponding travel expense, and compliance with such other requirements that the Compensation Committee may impose. Personal travel (that is, travel without a substantiated business-related purpose) is not eligible for reimbursement.
Named Executive Officers Other than the Chief Executive Officer.
In 2017, we provided our other executive officers (Messrs. Ednie and Dozois) with base salary and performance-based cash incentives.
The base salaries for Messrs. Ednie and Dozois were increased in early 2017 to $400,000 for Mr. Ednie and $300,000 for Mr. Dozois, as determined appropriate by our Compensation Committee based on position, responsibility, experience, individual performance, overall company budgets, competitive market data, and internal equity issues.
The annualized base salaries of our named executive officers at the end of 2017 are set forth below. Actual base salaries earned for our named executive officers in 2017 are reflected in the “Summary Compensation Table.”
|
Named Executive Officer and Principal Position |
|
2017 Annual |
|
|
|
Lee E. Mikles, Chief Executive Officer and President |
|
$ |
7,500 |
|
|
Steven A. Ednie, Vice President and Chief Financial Officer |
|
$ |
400,000 |
|
|
Timothy M. Dozois, Corporate Counsel and Corporate Secretary |
|
$ |
300,000 |
|
Performance-based Cash Incentive Compensation
In April 2017, the Compensation Committee adopted the 2017 Incentive Plan for employees and executive officers other than the Chief Executive Officer and President. The 2017 Incentive Plan was designed to reward participants for achievement against 2017 revenue and expense control targets, promote a strong connection between employee contributions and the Company’s financial performance at all levels of the organization, encourage and support achievement of the business objectives of the Company, and promote retention of Company employees. The 2017 Incentive Plan provided for cash and/or stock incentive awards calculated as a percentage of annual base salary. Awards under the 2017 Incentive Plan were not automatic and were dependent on the achievement of identified goals and objectives, with the Compensation Committee retaining discretion to increase or decrease payments under the 2017 Incentive Plan if overall company performance, individual performance or subjective factors warranted variation from the bonus formula established under the 2017 Incentive Plan. Messrs. Ednie and Dozois were required to be employed by the Company on the date payments were made under the 2017 Incentive Plan to be eligible to receive awards under the 2017 Incentive Plan. Pursuant to their employment agreements with the Company, the target annual cash incentive compensation for Messrs. Ednie and Dozois, expressed as a percentage of annual base salary, was as follows:
|
Name |
|
Target Cash Incentive Award |
|
|
Steven A. Ednie |
|
53.5% |
|
|
Timothy M. Dozois |
|
36.5% |
|
62
Performance Criteria. The performance criteria for Messrs. Ednie and Dozois pursuant to the 2017 Incentive Plan consisted of both Company and individual performance objectives, with the achievement of Company objectives weighted at 60% and the achievement of individual objectives weighted at 40%.
|
|
• |
Company financial objectives included: |
|
|
• |
Achievement of overall Company revenue and expense budget projections which drives 48% of the incentive award calculation; and |
|
|
• |
Achievement or profit and loss objectives for the officer’s cost center(s) which drives 12% of the incentive award calculation. |
The Compensation Committee established expense control goals to reward our executives for maintaining fiscal responsibility and implementing our cost reduction initiatives. The Compensation Committee established a revenue goal because we consider revenue to be a key driver of our growth and success. The Compensation Committee established cost center profit and loss objectives to render each executive accountable for the corporate function for which he or she is responsible. The Compensation Committee established individual performance objectives to motivate each executive to accomplish specific goals that are consistent with the Company’s objectives of growth and strong financial performance.
The following table shows the performance objectives established under the 2017 Incentive Plan for eligible named executive officers.
Company Performance Objectives – 60% of Target Payout
|
Objective |
|
Weighting |
|
Expense Control |
|
40% |
|
Revenue |
|
40% |
|
P&L Objectives |
|
20% |
Individual Performance Objectives – 40% of Target Payout
Objective
Expanding capacity, increasing productivity, creating efficiencies, implementing tangible process improvements, and capitalizing on new opportunities, and fulfillment of the executive’s responsibilities within his specific function; the executive’s contributions in support of Company objectives; demonstrated leadership; management experience; achievement of core objectives
The Compensation Committee measured individual performance of our eligible named executive officers for 2017 using a rating scale consisting of four tiers, each of which translates to an achievement range as set forth in the following table. An employee performing below expectations was not eligible for an incentive award regardless of the achievement of Company performance objectives.
|
Rating |
|
Achievement Percentage Range |
|
Exceeds Expectations - (consistently exceeds expectations in essential areas of responsibility) |
|
75% – 125% |
|
Meets Expectations - (consistently meets expectations in essential areas of responsibility) |
|
50% – 75% |
|
Needs Improvement/New in Role - (in position less than 90 days) |
|
0% – 50% |
|
Below Expectations - (does not consistently meet expectations; failed in one or more areas of responsibility) |
|
0% |
63
Performance Objectives and Actual Performance. The Company performance objectives were determined by the Compensation Committee. The following table shows the Company’s 2017 achievement against performance objectives:
|
|
|
Favorable |
|
|
Achievement |
|
|
|
|
|
||
|
Company Objective |
|
Variance to Budget |
|
|
Percentage |
|
|
Plan Weighting |
|
|||
|
Revenue |
|
|
111.1 |
% |
|
|
75 |
% |
|
|
40 |
% |
|
Expense |
|
|
15 |
% |
|
|
100 |
% |
|
|
40 |
% |
|
P&L |
|
|
— |
|
|
|
100 |
% |
|
|
20 |
% |
|
Calculated Company Performance Payout: |
|
|
|
|
|
|
|
|
|
|
100.00 |
% |
Due to the Company’s generation of extraordinary revenue that was not included in the calculation of Company performance, the Compensation Committee exercised its discretion to increase the Company’s 2017 achievement percentage from 100% to 140%.
In January 2018, the Compensation Committee and our Chief Executive Officer and President assessed the individual performance of Messrs. Ednie and Dozois for 2017 as part of our company-wide performance evaluation process. As a result, the Compensation Committee and our Chief Executive Officer and President determined that Mr. Ednie’s and Mr. Dozois’ bonus payments should be 124% and 114% of their respective targets.
The payments earned for performance under the 2017 Incentive Plan by Messrs. Ednie and Dozois were therefore as follows:
|
|
|
Target Payout |
|
|
Actual Payout |
|
|
Actual Payout |
|
|
|
|
|
|||
|
|
|
under 2017 |
|
|
under 2017 |
|
|
under 2017 |
|
|
|
|
|
|||
|
|
|
Incentive Plan |
|
|
Incentive Plan |
|
|
Incentive Plan |
|
|
Actual Payout |
|
||||
|
|
|
(as a % of annual |
|
|
(as a % of annual |
|
|
(as a % of |
|
|
under 2017 |
|
||||
|
Name |
|
base salary) |
|
|
base salary) |
|
|
target payout) |
|
|
Incentive Plan ($) |
|
||||
|
Steven A. Ednie |
|
|
53.5 |
% |
|
|
66.3 |
% |
|
|
124 |
% |
|
$ |
265,360 |
|
|
Timothy M. Dozois |
|
|
36.5 |
% |
|
|
41.6 |
% |
|
|
114 |
% |
|
$ |
124,830 |
|
Long-Term Equity Incentive Compensation
Long-term incentives are designed to attract a highly skilled and talented executive team, encourage long-term retention of executive officers, motivate our executive officers to focus on long-term company performance, and recognize efforts of executives who contribute to the achievement of our business objectives. We believe the periodic vesting of long-term incentive compensation, which is contingent upon continued employment or the achievement of specific performance criteria, directly aligns executive officer interests with our shareholders’ interests. While no long-term incentives were granted to our executive officers in 2017, we believe that the existing awards continue to have adequate retention value.
Compensation Mix
For 2017, the mix of the total compensation elements for each of our named executive officers was as follows:
Percent of Total 2017 Compensation
|
|
|
|
|
|
|
|
|
|
|
Equity and |
|
|
|
|
|
Base Salary |
|
|
Annual Cash |
|
|
Long Term |
|
|||
|
|
|
and Other |
|
|
Incentive |
|
|
Incentive |
|
|||
|
Named Executive Officer |
|
Compensation |
|
|
Compensation |
|
|
Awards(1) |
|
|||
|
Mr. Mikles |
|
|
1 |
% |
|
|
— |
|
|
|
99 |
% |
|
Mr. Ednie |
|
|
61 |
% |
|
|
39 |
% |
|
|
— |
|
|
Mr. Dozois |
|
|
73 |
% |
|
|
27 |
% |
|
|
— |
|
|
(1) |
Mr. Mikles’ Equity and Long-Term Incentive Awards reflect the value of inducement awards granted in 2015 which vested based on attainment of 2017 performance conditions applicable to the individual awards. |
64
Other Compensation
Employment, Severance and Change in Control Arrangements
Each of our executive officers is employed on an “at will” basis, which means that his employment may be terminated at any time, at the election of either the executive officer or the Company, for any reason or no reason, with or without notice. We issued employment letters to each of our named executive officers at the time of hire that contain general employment terms. The employment letter for Mr. Mikles includes additional severance and change in control benefits applicable to his long-term equity incentive awards. The employment letters for Messrs. Ednie and Dozois describe certain benefits payable upon termination of employment under certain circumstances, such as termination without “cause” or for “good reason.” These severance benefits are intended to provide competitive compensation and to ensure that our executive officers remain focused on our goals and objectives, as well as the interests of our shareholders, by removing uncertainties related to unexpected termination of employment. The named executive officers are also subject to the confidentiality, noncompetition and non-solicitation obligations set forth in our standard employee inventions agreement, some of which survive termination of employment.
All equity awards granted to our executive officers and non-executive employees under our 2000 Stock Incentive Plan, as amended and restated (the “2000 Plan”), provide for 100% vesting acceleration upon a change in control if the equity obligation is not assumed, continued, or substituted by the acquiring company. Conversely, under our 2012 Equity Incentive Plan (the “2012 Plan”), the vesting of an equity award accelerates upon a change of control only if such acceleration is contemplated by the agreement evidencing the award. The vesting of an equity award granted pursuant to the 2012 Plan may also be accelerated in the event of certain sales or dispositions of assets or securities, mergers, consolidations or similar transactions, unless otherwise provided in the agreement evidencing an equity award or any other written agreement between us and the holder of such equity award, or unless otherwise expressly provided by the plan administrator of the 2012 Plan at the time an equity award is granted.
Benefits
Our executive officers are eligible to participate in the same benefit programs offered to other eligible employees. These programs include medical, dental, vision, group life, accidental death and dismemberment, and disability insurance; an elective health care savings account; a transportation subsidy or paid parking, as applicable; paid time off; and holiday pay. The same contribution amounts, percentages and plan design provisions are generally applicable to all employees.
Our employees, including our named executive officers, are also eligible to participate in our 401(k) savings plan, a tax-qualified retirement savings plan pursuant to which all U.S.-based employees may contribute a portion of their cash compensation (including base salary and overtime pay) on a before-tax basis, up to the limit prescribed each year by the Internal Revenue Service. We match 100% of the first 3% of pay and 50% of the next 2% of pay that is contributed to the 401(k) savings plan. All employee contributions and matching contributions made by us to the 401(k) savings plan are fully vested upon contribution. Our executive officers are eligible to participate in the benefit programs described above on the same basis as our other employees.
We have no defined benefit pension plans or supplemental retirement plans for executives.
Perquisites and Personal Benefits
We may offer other benefits to our employees and executive officers from time to time, which benefits are typically offered to help us compete more effectively to attract or retain an executive officer.
In April 2013, the Compensation Committee adopted a Pre-Approval Policy for Nominal Payments pursuant to which the Compensation Committee delegated authority to each of the Chief Executive Officer and the Chairman of the Compensation Committee to approve certain nominal payments to our executive officers from time to time. Our Chief Executive Officer is authorized to approve nominal payments to our executive officers (not including the Chief Executive Officer) up to an aggregate amount of $10,000 per year, per executive officer. The Chairman of the Compensation Committee is authorized to approve nominal payments to our executive officers up to an aggregate amount of $25,000 per year, per executive officer (when aggregated with any nominal payments approved by the Chief Executive Officer). These payments may include, without limitation, relocation assistance, transportation benefits, length of service awards, achievement awards and certain other payments.
65
As negotiated at the time of hire and reflected in his employment offer letter, we provided compensation to Mr. Dozois, who was based outside the state of Washington, to assist with commuting expenses incurred for travel to our headquarters in Kirkland, Washington. Effective January 2013, this compensation is paid in the form of a monthly stipend of $1,920. These amounts have been reported as taxable income to Mr. Dozois. There were no other perquisites provided to any named executive officer in 2017.
Taxation of “Parachute” Payments and Deferred Compensation
In 2017, Sections 280G and 4999 of the Code provide that executive officers and directors who hold significant equity interests and certain other service providers may be subject to an excise tax if they receive payments or benefits upon a change in control that exceeds certain prescribed limits, and that we, or a successor, may forfeit a deduction on the amounts subject to this additional tax. Section 409A of the Code (“Section 409A”) also imposes additional significant taxes on the individual if an executive officer, director or other service provider receives “deferred compensation” that does not meet the requirements of Section 409A. We do not provide any executive officer, including any named executive officer, with a “gross-up” or other reimbursement payment for any liability that he or she might owe upon application of Sections 280G or 4999 of the Code. The employment letters with our current named executive officers allow us to accelerate severance payments to the extent necessary to comply with Section 409A.
CEO Pay Ratio
To calculate the pay ratio between our CEO and our median employee, we identified the median employee on December 31, 2017 based on total annual cash compensation for the 2017 fiscal year of all employees (excluding our CEO) who were employed by us on such date. We determined total annual cash compensation by adding annual salary and annual bonus. We did not employ any hourly employees as of December 31, 2017.
|
|
|
|
|
|
|
|
|
|
|
|
|
|
|
|
|
|
|
Non-Equity |
|
|
|
|
|
|
|
|
|
|
|
|
|
|
|
|
|
|
|
|
|
|
Stock |
|
|
Option |
|
|
Incentive Plan |
|
|
All Other |
|
|
|
|
|
|
||||
|
|
|
Salary |
|
|
Bonus |
|
|
Awards |
|
|
Awards |
|
|
Compensation |
|
|
Compensation |
|
|
|
|
|
|||||||
|
Position |
|
($) |
|
|
($) |
|
|
($)(1) |
|
|
($)(1) |
|
|
($) |
|
|
($) |
|
|
Total ($) |
|
CEO Pay Ratio |
|||||||
|
CEO |
|
|
7,375 |
|
|
|
— |
|
|
|
626,000 |
|
|
|
63,678 |
|
|
|
— |
|
|
|
37 |
|
|
|
697,090 |
|
3:1 |
|
Median Employee |
|
|
173,139 |
|
|
|
— |
|
|
|
— |
|
|
|
— |
|
|
|
42,311 |
|
|
|
10,798 |
|
|
|
226,248 |
|
|
|
(1) |
See Footnote 2 in “Executive Compensation/Summary Compensation Table” for a description of how CEO Stock Awards and Option Awards are valued. |
Other Policies and Considerations
Assessment of Risk in our Compensation Program
The Compensation Committee periodically assesses our compensation program to monitor and mitigate risk. The committee considers the primary design features of the compensation plans, monitoring compliance with our code of ethics, structuring executives’ pay to include both fixed and variable compensation, and retaining broad discretion over the award of annual performance-based cash incentive compensation. The Compensation Committee believes that the annual and long-term equity incentive compensation programs for our executive officers appropriately focus these individuals on our current and future business needs without encouraging undue risk-taking, and that our compensation policies and practices for all employees, including named executive officers, do not create risks that are reasonably likely to have a material adverse effect on us.
Policies Regarding Granting of Equity Awards
We do not have any program, plan or obligation that requires the granting of stock options or other equity awards to any executive officer on specified dates, or that requires the named executive officers to hold stock options, restricted stock or RSUs beyond their vesting dates. The Compensation Committee may authorize the future grant of an equity award to an executive officer in advance of the commencement of such officer’s employment by us, in which case the Compensation Committee’s approval of the award is subject to and effective on the date of hire or on the 15th day of the month that falls on or follows an executive officer’s employment start date.
66
Our Board of Directors has authorized our Chief Executive Officer, who is also a member of our Board of Directors, to grant equity awards to certain newly hired employees and consultants, subject to certain limitations, as follows:
|
|
• |
the awards will be granted on the 15th day of the month that falls on or follows an individual’s employment start date; |
|
|
• |
the individual cannot report directly to the Chief Executive Officer or be subject to the reporting requirements of Section 16(a) of the Exchange Act; |
|
|
• |
the total number of shares granted under all awards to an individual during a single period may not exceed certain levels, as approved in advance by the Compensation Committee; |
|
|
• |
the total number of shares granted under all awards by the Chief Executive Officer during a calendar year may not exceed 1,000 shares; and |
|
|
• |
each stock option must have an exercise price equal to the closing share price on the date of grant. |
Tax and Accounting Implications
Tax Deductibility of Executive Compensation. Section 162(m) of the Code (“Section 162(m)”) generally disallows an income tax deduction to publicly traded companies for compensation over $1.0 million paid to the chief executive officer or any of the other named executive officers. The Compensation Committee believes that in certain circumstances factors other than tax deductibility take precedence when determining the forms and levels of executive compensation most appropriate and in the best interests of us and our shareholders. Given the competitive market for outstanding executives, the Compensation Committee believes that it is important for it to retain the flexibility to design compensation programs consistent with our overall executive compensation program, even if some executive compensation is not fully deductible by us. Accordingly, the Compensation Committee may from time to time approve elements of compensation for certain officers that are not fully deductible, and reserves the right to do so in the future when appropriate.
Accounting for Stock-Based Compensation. We account for stock-based compensation in accordance with the requirements of “Accounting Standards Codification Topic 718, Compensation – Stock Compensation.” Under the fair value provisions of this statement, stock-based compensation cost is measured at the grant date based on the fair value of the award.
Policies on Hedging Economic Risk
No director or officer designated by our Board of Directors as a “reporting person or insider” may engage in any transaction involving our securities or securities of certain companies with whom we transact business (including a stock plan transaction such as an option exercise, a gift, a loan or pledge or hedge, a contribution to a trust, or any other transfer), without first obtaining pre-clearance of the transaction from our legal department.
Compensation Committee Report
The Compensation Committee has reviewed and discussed with management the Compensation Discussion and Analysis for fiscal 2017. Based on this review and discussion, the Compensation Committee recommended to our Board of Directors that the Compensation Discussion and Analysis be included in this Form 10-K.
|
|
|
COMPENSATION COMMITTEE |
|
|
|
Mr. H. Brian Thompson, Chair |
|
|
|
Mr. Stuart M. Sloan |
67
EXECUTIVE COMPENSATION
Summary Compensation Table
The following table sets forth information regarding compensation earned by our named executive officers during 2017, 2016, and 2015.
|
|
|
|
|
|
|
|
|
|
|
|
|
|
|
|
|
|
|
|
|
Non-Equity |
|
|
|
|
|
|
|
|
|
|
|
|
|
|
|
|
|
|
|
|
|
|
|
Stock |
|
|
Option |
|
|
Incentive Plan |
|
|
All Other |
|
|
|
|
|
||||
|
|
|
|
|
Salary |
|
|
|
Bonus |
|
|
Awards |
|
|
Awards |
|
|
Compensation |
|
|
Compensation |
|
|
|
|
|
|||||
|
Name and Principal Position |
|
Year |
|
($) |
|
|
($)(1) |
|
|
($)(2) |
|
|
($)(2) |
|
|
($) |
|
|
($)(3) |
|
|
Total ($) |
|
|||||||
|
Lee E. Mikles |
|
2017 |
|
|
7,375 |
|
|
— |
|
|
|
626,000 |
|
|
|
63,678 |
|
|
|
— |
|
|
|
37 |
|
|
|
697,090 |
|
|
|
Chief Executive Officer and |
|
2016 |
|
|
6,000 |
|
|
|
250,000 |
|
|
|
560,400 |
|
|
|
68,150 |
|
|
|
— |
|
|
|
30 |
|
|
|
884,580 |
|
|
President |
|
2015 |
|
|
3,500 |
|
|
|
— |
|
|
|
6,860,000 |
|
|
|
1,591,325 |
|
|
|
— |
|
|
|
30 |
|
|
|
8,454,855 |
|
|
Steven E. Ednie |
|
2017 |
|
|
395,833 |
|
|
|
— |
|
|
|
— |
|
|
|
— |
|
|
|
265,360 |
|
|
|
11,640 |
|
|
|
672,833 |
|
|
Vice President and Chief |
|
2016 |
|
|
350,000 |
|
|
|
— |
|
|
|
— |
|
|
|
— |
|
|
|
220,955 |
|
|
|
11,440 |
|
|
|
582,395 |
|
|
Financial Officer |
|
2015 |
|
|
350,000 |
|
|
|
— |
|
|
|
4,585 |
|
|
|
19,062 |
|
|
|
175,000 |
|
|
|
11,440 |
|
|
|
560,087 |
|
|
Timothy M. Dozois |
|
2017 |
|
|
298,389 |
|
|
|
— |
|
|
|
— |
|
|
|
— |
|
|
|
124,830 |
|
|
|
34,848 |
|
|
|
458,067 |
|
|
Corporate Counsel and |
|
2016 |
|
|
280,675 |
|
|
|
— |
|
|
|
— |
|
|
|
— |
|
|
|
105,519 |
|
|
|
34,648 |
|
|
|
420,842 |
|
|
Corporate Secretary |
|
2015 |
|
|
280,675 |
|
|
|
— |
|
|
|
26,200 |
|
|
|
108,924 |
|
|
|
100,000 |
|
|
|
34,648 |
|
|
|
550,447 |
|
|
(1) |
Cash payment of $250,000 awarded to Mr. Mikles for his performance in 2016. |
|
(2) |
Reflects the aggregate grant date fair value, excluding the effect of estimated forfeitures, of awards granted in the year shown, computed in accordance with applicable accounting guidance for stock and option awards granted during each year, rather than an amount paid to or realized by an executive officer. These equity grants are described in the Compensation Discussion and Analysis under the caption “Outstanding Equity Awards at December 31, 2017” table below. We have disclosed the assumptions made in the valuation of the restricted stock and option awards under Note 2 and Note 8 of the Notes to the Consolidated Financial Statements included in Item 8 of this Form 10-K. Although no equity awards were granted in 2017, certain of Mr. Mikles performance conditioned awards granted in 2015 were not valued until 2017. The amounts reported do not reflect the compensation actually received by our named executive officers. There can be no assurance that stock options will be exercised (in which case no value will be realized by the individual) or that the value on vesting of exercise will approximate the compensation expense recognized by the Company. |
|
(3) |
Amounts reported for 2017, 2016, and 2015 that represent “All Other Compensation” for each of the named executive officers are described in the table below captioned “Detail of ‘All Other Compensation’ in the Summary Compensation Table.” |
Detail of “All Other Compensation” in the Summary Compensation Table
|
|
|
|
|
|
|
|
|
|
|
|
|
|
|
|
|
|
|
|
|
|
|
|
|
Taxable |
|
|
|
|
|
|
|
|
|
|
|
Company |
|
|
Term Life |
|
|
|
|
|
|
|
|
|
|
|
|
|
|
Commuting |
|
|
|
|
|
|||
|
|
|
|
|
Contribution |
|
|
Insurance |
|
|
Director |
|
|
Consulting |
|
|
Retention |
|
|
and Housing |
|
|
|
|
|
||||||
|
|
|
|
|
401(k) Plan |
|
|
Premium |
|
|
Service Fees |
|
|
Fees |
|
|
Payment |
|
|
Benefits |
|
|
Total |
|
|||||||
|
Name |
|
Year |
|
($)(1) |
|
|
($) |
|
|
($) |
|
|
($) |
|
|
($) |
|
|
($) |
|
|
($) |
|
|||||||
|
Mr. Mikles |
|
2017 |
|
|
— |
|
|
|
37 |
|
|
|
— |
|
|
|
— |
|
|
|
— |
|
|
|
— |
|
|
|
37 |
|
|
|
|
2016 |
|
|
— |
|
|
|
30 |
|
|
|
— |
|
|
|
— |
|
|
|
— |
|
|
|
— |
|
|
|
30 |
|
|
|
|
2015 |
|
|
— |
|
|
|
30 |
|
|
|
— |
|
|
|
— |
|
|
|
— |
|
|
|
— |
|
|
|
30 |
|
|
Mr. Ednie |
|
2017 |
|
|
10,800 |
|
|
|
840 |
|
|
|
— |
|
|
|
— |
|
|
|
— |
|
|
|
— |
|
|
|
11,640 |
|
|
|
|
2016 |
|
|
10,600 |
|
|
|
840 |
|
|
|
— |
|
|
|
— |
|
|
|
— |
|
|
|
— |
|
|
|
11,440 |
|
|
|
|
2015 |
|
|
10,600 |
|
|
|
840 |
|
|
|
— |
|
|
|
— |
|
|
|
— |
|
|
|
— |
|
|
|
11,440 |
|
|
Mr. Dozois |
|
2017 |
|
|
10,800 |
|
|
|
1,008 |
|
|
|
— |
|
|
|
— |
|
|
|
— |
|
|
|
23,040 |
|
|
|
34,848 |
|
|
|
|
2016 |
|
|
10,600 |
|
|
|
1,008 |
|
|
|
— |
|
|
|
— |
|
|
|
— |
|
|
|
23,040 |
|
|
|
34,648 |
|
|
|
|
2015 |
|
|
10,600 |
|
|
|
1,008 |
|
|
|
— |
|
|
|
— |
|
|
|
— |
|
|
|
23,040 |
|
|
|
34,648 |
|
68
|
(1) |
Under the Company’s 401(k) plan, the Company matches 100% of the first 3% and 50% of the next 2% of pay that is contributed to the plan. Matching contributions by the Company are immediately vested. |
2017 Grants of Plan-Based Awards
The following table provides information concerning the cash incentive compensation earned by each of our named executive officers in 2017. Our executive officers did not receive any equity awards in 2017.
|
|
|
|
|
|
|
Estimated Possible Payouts Under Non- Equity Incentive Plan Awards(1) |
|
|||||||||
|
|
|
Grant |
|
Approval |
|
Threshold |
|
|
Target |
|
|
Maximum |
|
|||
|
Name |
|
Date |
|
Date |
|
($) |
|
|
($) |
|
|
($) |
|
|||
|
Mr. Ednie |
|
— |
|
04/11/17 |
|
|
32,100 |
|
|
|
214,000 |
|
|
|
286,760 |
|
|
Mr. Dozois |
|
— |
|
04/11/17 |
|
|
16,425 |
|
|
|
109,500 |
|
|
|
146,730 |
|
|
(1) |
The amounts reported in these columns represent the threshold, target and maximum amounts of performance-based cash incentive compensation that might have been paid to each named executive officer under the 2017 Incentive Plan. The actual amounts paid for 2017 are shown in the “Non-Equity Incentive Compensation column of the “Summary Compensation Table.” These awards are described in further detail in the Compensation Discussion and Analysis in the section entitled “Performance-based Cash Incentive Compensation.” |
Outstanding Equity Awards at December 31, 2017
The following table shows certain information regarding outstanding equity awards at December 31, 2017, for the named executive officers.
|
|
|
Option Awards |
|
Stock Awards |
|
|||||||||||||||||||||
|
|
|
|
|
|
|
|
Equity |
|
|
|
|
|
|
|
|
|
|
|
|
|
Equity |
|
||||
|
|
|
|
|
|
|
|
Incentive |
|
|
|
|
|
|
|
|
|
|
|
Equity |
|
Incentive |
|
||||
|
|
|
|
|
|
|
|
Plan |
|
|
|
|
|
|
|
|
|
|
|
Incentive |
|
Plan |
|
||||
|
|
|
|
|
|
|
|
Awards: |
|
|
|
|
|
|
|
|
|
|
|
Plan |
|
Awards: |
|
||||
|
|
|
Number of |
|
Number of |
|
Number of |
|
|
|
|
|
|
|
|
Market |
|
Awards: |
|
Market |
|
||||||
|
|
|
Securities |
|
Securities |
|
Securities |
|
|
|
|
|
|
|
|
Value of |
|
Number of |
|
Value of |
|
||||||
|
|
|
Underlying |
|
Underlying |
|
Underlying |
|
|
|
|
|
|
Number of |
|
Shares of |
|
Unearned |
|
Unearned |
|
||||||
|
|
|
Unexercised |
|
Unexercised |
|
Unexercised |
|
Option |
|
|
|
Shares of |
|
Stock That |
|
Shares |
|
Shares That |
|
|||||||
|
|
|
Options |
|
Options |
|
Unearned |
|
Exercise |
|
Option |
|
Stock That |
|
Have Not |
|
That |
|
Have Not |
|
|||||||
|
|
|
(#) |
|
(#) |
|
Options |
|
Price |
|
Expiration |
|
Have Not |
|
Vested |
|
Have Not |
|
Vested |
|
|||||||
|
Name |
|
Exercisable |
|
Unexercisable |
|
(#) |
|
($) |
|
Date |
|
Vested (#) |
|
($)(1) |
|
Vested (#) |
|
($)(1) |
|
|||||||
|
Mr. Mikles |
|
57 (2) |
|
18 |
|
|
|
|
$ |
1,760.00 |
|
04/10/24 |
|
|
|
|
|
|
|
|
|
|
|
|||
|
|
|
60 (3) |
|
— |
|
|
|
|
$ |
1,270.00 |
|
10/01/24 |
|
|
|
|
|
|
|
|
|
|
|
|||
|
|
|
1,000 (4) |
|
|
1,000 |
|
|
|
|
$ |
1,340.00 |
|
06/15/25 |
|
|
|
|
|
|
|
|
|
|
|
||
|
|
|
1,000 (5) |
|
— |
|
|
1,000 |
|
$ |
1,340.00 |
|
06/15/25 |
|
|
|
|
|
|
|
|
|
|
|
|||
|
|
|
|
|
|
|
|
|
|
|
|
|
|
|
|
2,000(6) |
|
|
1,150,000 |
|
|
|
|
|
|
||
|
|
|
|
|
|
|
|
|
|
|
|
|
|
|
|
|
|
|
|
|
2,000(7) |
|
|
1,150,000 |
|
||
|
|
|
|
|
|
|
|
|
|
|
|
|
|
|
|
|
|
|
|
|
2,000(8) |
|
|
1,150,000 |
|
||
|
Mr. Ednie |
|
375 (9) |
|
125 |
|
|
|
|
$ |
1,310.00 |
|
09/15/24 |
|
|
|
|
|
|
|
|
|
|
|
|||
|
|
|
24(10) |
|
7 |
|
|
|
|
$ |
1,310.00 |
|
07/24/25 |
|
|
|
|
|
|
|
|
|
|
|
|||
|
|
|
|
|
|
|
|
|
|
|
|
|
|
|
|
62(9) |
|
|
35,650 |
|
|
|
|
|
|
||
|
Mr. Dozois |
|
150(11) |
|
— |
|
|
|
|
$ |
2,780.00 |
|
07/15/21 |
|
|
|
|
|
|
|
|
|
|
|
|||
|
|
|
10(12) |
|
— |
|
|
|
|
$ |
2,640.00 |
|
02/15/22 |
|
|
|
|
|
|
|
|
|
|
|
|||
|
|
|
150(13) |
|
— |
|
|
|
|
$ |
1,210.00 |
|
08/24/22 |
|
|
|
|
|
|
|
|
|
|
|
|||
|
|
|
150(14) |
|
50 |
|
|
|
|
$ |
1,520.00 |
|
02/28/24 |
|
|
|
|
|
|
|
|
|
|
|
|||
|
|
|
135(10) |
|
45 |
|
|
|
|
$ |
1,310.00 |
|
07/24/25 |
|
|
|
|
|
|
|
|
|
|
|
|||
|
|
|
|
|
|
|
|
|
|
|
|
|
|
|
|
5(10) |
|
|
2,875 |
|
|
|
|
|
|
||
|
|
|
|
|
|
|
|
|
|
|
|
|
|
|
|
|
|
|
|
|
75(15) |
|
|
43,125 |
|
||
|
(1) |
Represents the closing price of a share of our Class A common stock on December 31, 2017 ($575) multiplied by the number of shares or units that have not vested. |
69
|
(2) |
Reflects stock options granted pursuant to the Company’s Board Compensation Policy for services provided as a director prior to appointment as an executive officer. The stock options vest in four equal annual installments beginning April 10, 2015. |
|
(3) |
Reflects stock options granted pursuant to the Company’s Board Compensation Policy for services provided as a director prior to appointment as an executive officer. The stock options fully vested on October 1, 2015. |
|
(4) |
The stock options vest in four equal annual installments beginning January 1, 2016. |
|
(5) |
The stock options vest in four equal annual installments beginning February 15, 2016, but only to the extent the Company achieves its performance objectives for the preceding calendar year under its then-applicable incentive plan. If the Company’s performance achievement is less than 100%, then the annual vesting will be limited to the extent to which the Company achieves its performance objectives. Any stock options that do not vest on an annual vesting date due to the Company’s performance achievement below 100% will expire. |
|
(6) |
The restricted stock units vest in three equal annual installments beginning January 1, 2017. |
|
(7) |
The performance-based restricted stock units vest in three equal annual installments beginning February 15, 2017, but only to the extent the Company achieves its performance objectives for the preceding calendar under its then-applicable incentive plan. If the Company’s performance achievement is less than 100%, then the annual vesting will be limited to the extent to which the Company achieves its performance objectives. Any restricted stock units that do not vest on an annual vesting date due to the Company achievement below 100% will be forfeited. |
|
(8) |
The restricted stock units will fully vest when the average closing share price of the Company’s Class A common stock for any 60 consecutive calendar days is $3,000.00 or higher (the “Mikles Price Trigger”). If the Mikles Price Trigger is not achieved by December 31, 2019, then none of the restricted stock units will vest. |
|
(9) |
The stock options and restricted stock units vest in four equal annual installments beginning September 15, 2015. |
|
(10) |
The stock options and restricted stock units vest as to 50% of the shares on July 24, 2016, 25% of the shares on July 24, 2017, and 25% on July 24, 2018. |
|
(11) |
The stock options vested in four equal annual installments beginning June 17, 2012 and were fully vested at December 31, 2015. |
|
(12) |
The stock options vest in four equal annual installments beginning February 15, 2013 and were fully vested at February 15, 2016. |
|
(13) |
The stock options vest in four equal annual installments beginning August 24, 2013 and were fully vested at August 24, 2016. |
|
(14) |
The stock options vest in four equal annual installments beginning February 28, 2015. |
|
(15) |
The performance-based restricted stock awards will vest on the earlier of (i) when the Company’s trailing 12-month net income reaches $100 million, and (ii) when the average closing share price of the Company’s Class A common stock for any 60 consecutive calendar days is $3,000.00 or higher. If any performance target is not met by July 15, 2018, the unvested awards will be forfeited. |
2017 Option Exercises and Stock Vested
|
|
|
Option Awards |
|
|
Stock Awards |
|
||||||||||
|
|
|
Number |
|
|
|
|
|
Number |
|
|
|
|
||||
|
|
|
of Shares |
|
|
Value |
|
|
of Shares |
|
|
Value |
|
||||
|
|
|
Acquired |
|
|
Realized |
|
|
Acquired |
|
|
Realized |
|
||||
|
|
|
on |
|
|
on |
|
|
on |
|
|
on |
|
||||
|
|
|
Exercise |
|
|
Exercise |
|
|
Vesting |
|
|
Vesting |
|
||||
|
Name |
|
(#) |
|
|
|
($) |
|
|
(#)(1) |
|
|
|
($)(2) |
|
||
|
Mr. Mikles |
|
|
— |
|
|
|
— |
|
|
|
2,000 |
|
|
|
1,333,000 |
|
|
Mr. Ednie |
|
|
— |
|
|
|
— |
|
|
|
62 |
|
|
|
43,045 |
|
|
Mr. Dozois |
|
|
— |
|
|
|
— |
|
|
|
5 |
|
|
|
3,490 |
|
|
(1) |
Represents the aggregate number of shares vesting, prior to any withholding of shares to satisfy tax withholding obligations. |
|
(2) |
Equal to number of shares vesting multiplied by the fair market value of Pendrell Class A common stock on the vesting date. |
Pension Benefits
During 2017, we did not provide pension benefits for any named executive officer.
Non-Qualified Deferred Compensation
During 2017, we did not provide non-qualified deferred compensation benefits for any named executive officer.
70
2017 Potential Payments Upon Termination or Change in Control
The following table reflects the amount of compensation that would have been payable to each of the named executive officers in the event of the termination of such executive’s employment under certain circumstances, assuming that (i) the triggering event took place on December 30, 2017, the last business day of the 2017 fiscal year, (ii) the price per share of our Class A common stock was $575, which was the closing price on OTC Pink® on December 31, 2017, and (iii) all cash payments are made in a lump sum.
|
|
|
Change in Control |
|
|
Employment Termination Events(1) |
|
||||||
|
|
|
Accelerated |
|
|
|
|
|
Accelerated |
|
|||
|
|
|
Vesting of |
|
|
|
|
|
Vesting of |
|
|||
|
|
|
Equity |
|
|
Severance |
|
|
Equity |
|
|||
|
|
|
Awards |
|
|
Payment |
|
|
Awards |
|
|||
|
Mr. Mikles(2) |
|
$ |
1,150,000 |
|
|
— |
|
|
$ |
1,150,000 |
|
|
|
Mr. Ednie(3) |
|
— |
|
|
$ |
200,000 |
|
|
— |
|
||
|
Mr. Dozois(4) |
|
$ |
43,125 |
|
|
$ |
300,000 |
|
|
— |
|
|
|
(1) |
Messrs. Mikles, Ednie and Dozois are or were entitled to certain payments in the event their employment relationship is or was terminated under certain circumstances as described below. |
|
(2) |
If the Company terminates Mr. Mikles without Cause, or if he is terminated or resigns from the Company for Good Reason (as such terms are described below), upon a release of claims provided by Mr. Mikles, any time-based or performance-based options, restricted shares or RSUs that would have vested within twelve months after such employment termination shall vest, with the time-based options, restricted shares, and RSUs vesting immediately. The performance-based options, restricted shares, and RSUs that cannot be measured as of the date of employment termination (i.e., because the Company’s performance has not yet been measured) will vest on the date that performance is measured, which shall be no later than the next succeeding February 15. In addition, if the Company had terminated Mr. Mikles without Cause, or if he was terminated or resigned from the Company for Good Reason before January 1, 2018 and the performance criteria applicable to 2,000 RSUs granted to Mr. Mikles on June 15, 2015 were achieved prior to Mr. Mikles’ termination date, then these RSUs would have vested. |
|
(3) |
Mr. Ednie’s severance payment is equal to 50% of his annual base salary ($400,000 at December 31, 2017) and will be paid in the event of Mr. Ednie’s involuntary termination without Cause (as described below). |
|
(4) |
Mr. Dozois’ severance payment is equal to his annual base salary ($300,000 at December 31, 2017) and will be paid in the event of the involuntary termination of his employment other than for Cause or his resignation for Good Reason (as such terms are described below). |
Change in Control
All equity awards granted to our named executive officers and non-executive employees under the 2000 Plan provide for 100% vesting acceleration in the event the Company is subject to a change in control and the equity obligation is not assumed, continued or substituted by the acquiring company. Under the 2012 Plan, the vesting of an equity award may accelerate upon a change of control only if acceleration is contemplated by the agreement evidencing an award. The vesting of an equity award granted pursuant to the 2012 Plan may also be accelerated in the event of certain corporate transactions, including certain sales or dispositions of assets or securities, mergers, consolidations or similar transactions unless otherwise provided in the agreement evidencing an equity award or any other written agreement between the Company and the holder of such equity award, or unless otherwise expressly provided by the plan administrator of the 2012 Plan at the time an equity award is granted.
Termination
Messrs. Mikles, Ednie, and Dozois each have certain severance provisions in their employment or retention letter agreements that may be triggered upon termination of their respective employment or consulting relationship with the Company, as described below.
71
Lee E. Mikles. Mr. Mikles’ employment is at-will, and he is subject to termination with or without Cause (as described below). However, if we terminate Mr. Mikles without Cause, or if he is terminated or resigns from the Company for Good Reason (as such terms are described below), upon a release of claims provided by Mr. Mikles, any time-based or performance-based options, restricted shares, or RSUs that would have vested within twelve months after such employment termination shall vest, with the time-based options, restricted shares, and RSUs vesting immediately. The performance-based options, restricted shares, and RSUs that cannot be measured as of the date of employment termination (i.e., because the Company’s performance has not yet been measured) will vest on the date that performance is measured, which shall be no later than the next succeeding February 15. In addition, if the Company terminates Mr. Mikles without Cause, or if he is terminated or resigns from the Company for Good Reason before January 1, 2018 and the performance criteria applicable to 2,000 RSUs granted to Mr. Mikles on June 15, 2015 have been achieved prior to Mr. Mikles’ termination date, then these RSUs will immediately vest.
Steven A. Ednie. Mr. Ednie’s employment is at will, and he is subject to termination with or without Cause (as described below). However, if we terminate Mr. Ednie’s employment without Cause, upon a release of claims provided by Mr. Ednie, he is entitled to payment of an amount equal to 50% of his annual base salary then in effect (which was $400,000 at December 31, 2017).
Timothy M. Dozois. Mr. Dozois’ employment is at will, and he is subject to termination with or without Cause (as described below). However, if we terminate Mr. Dozois’ employment without Cause, or if he resigns from the Company for Good Reason (as such terms are described below), upon a release of claims provided by Mr. Dozois, he is entitled to payment of an amount equal to his annual base salary then in effect (which was $300,000 at December 31, 2017).
Certain Defined Terms
Cause. For purposes of the arrangements described above, “Cause” means dismissal due to willful material misconduct or failure to effectively discharge duties, conviction or confession of a crime punishable by law (except minor violations), the performance of an illegal act while purporting to act in the Company’s behalf, or engaging in activities directly in competition or antithetical to the best interests of the Company.
Good Reason. For purposes of the arrangements with Messrs. Mikles and Dozois, “Good Reason” has the meanings set forth below.
•Mr. Mikles. Resignation by Mr. Mikles for “Good Reason” means, without Mr. Mikles’ consent, (i) a relocation of Mr. Mikles’ principal office to a location more than 30 miles away from his current office that increases the distance from his principal office to his residence, not undertaken at his direction or with his agreement, (ii) a change in reporting relationship to someone other than the current Executive Chairman of the Company’s Board of Directors, or (iii) a change in voting control of the Company such that Eagle River and its affiliates no longer own or control at least 51% of the Company’s voting power. Termination for “Good Reason” means termination of employment by death or disability that renders Mr. Mikles incapable of performing the duties described in his employment agreement with the Company for a period that is reasonably expected to exceed eight weeks.
•Mr. Dozois. “Good Reason” means, without Mr. Dozois’ consent, a reduction of salary not agreed to by Mr. Dozois, or a material diminution of other employee benefits, other than any employee benefits approved by the Board of Directors and implemented in a non-discriminatory fashion with respect to all participating employees, and subject to the terms and provisions set forth in the employment letter agreement between the Company and Mr. Dozois.
72
Compensation Committee Interlocks and Insider Participation
In 2017, the Compensation Committee of our Board of Directors was composed of Messrs. Sloan and Thompson. No member of the Compensation Committee is, or was during 2017, an officer or employee of the Company, and none of the Company’s executive officers serve, or during 2017 served, as a member of a compensation committee (or other board committee performing equivalent functions) of any entity that has one or more executive officers serving as a member of the Company’s Compensation Committee. No member of the Compensation Committee is a former officer of the Company, nor does any executive officer of the Company serve as a director of any entity that is in any manner affiliated with a member of the Compensation Committee.
Overview of Director Compensation Program
Our Board of Directors Compensation Policy (the “Policy”) provides for (i) an annual retainer, paid quarterly, to the Chairman of our Board of Directors and each of our independent directors, and (ii) an additional retainer for committee service, paid quarterly, to each of our independent directors serving on a committee (other than the Chairman of the Board), as follows:
|
Board of Directors and Committee Service |
|
Annual Retainer |
|
|
|
Chairman of the Board of Directors |
|
$ |
250,000 |
|
|
Independent Director |
|
$ |
50,000 |
|
|
Audit Committee Chair |
|
$ |
20,000 |
|
|
Compensation Committee Chair |
|
$ |
20,000 |
|
|
Nominating and Governance Committee Chair |
|
$ |
15,000 |
|
|
Audit Committee Member (non-Chair) |
|
$ |
8,000 |
|
|
Compensation Committee Member (non-Chair) |
|
$ |
8,000 |
|
|
Nominating and Governance Committee Member (non-Chair) |
|
$ |
8,000 |
|
The annual retainers are paid in four equal quarterly installments on or about the first day of July, October, January, and April to those directors who served on our Board of Directors through the end of the preceding quarter. Non-employee directors are also reimbursed for reasonable travel and accommodation expenses incurred for Company business.
The Policy also provides for the grant of stock options to our independent directors. At the time of their election to the Board of Directors, all independent directors receive an initial option to purchase 75 shares of Class A common stock that vests in four equal annual installments. In addition, all independent directors receive an annual option to purchase 60 shares of Class A common stock that fully vests on the one-year anniversary of the grant date. All options granted to the independent directors have an exercise price equal to the fair market value of our Class A common stock on the grant date and have a term of ten years.
To further align the interests of our directors with the interests of our shareholders, our non-employee directors may elect to receive all or part of their cash retainer in the form of Class A common stock. The number of shares issued is equal to the amount of the retainer that the director elects to receive in stock divided by the fair market value of a share of Class A common stock on the final business day of the quarter for which payment is earned. Only whole numbers of shares of Class A common stock are issued; fractional shares are paid in cash.
73
2017 Director Compensation
The table below sets forth certain information regarding the compensation earned by, or awarded to, each director who served on our Board of Directors in 2017. In 2017, Mr. Mikles was an employee of the Company and Mr. Salemme was a paid consultant of the Company, and therefore did not receive compensation for their service as directors of the Company. We also reimburse directors for reasonable travel and accommodation expenses incurred on Company business, the values of which are not included in the table below.
|
Name |
|
|
Fees Earned(1) |
|
|
|
Option Awards (2)(3) |
|
|
|
Total |
|
|
Richard P. Emerson |
|
$ |
70,000 |
|
|
$ |
19,181 |
|
|
$ |
89,181 |
|
|
Nicolas Kauser |
|
$ |
73,000 |
|
|
$ |
19,181 |
|
|
$ |
92,181 |
|
|
Craig O. McCaw |
|
$ |
250,000 |
|
|
$ |
— |
|
|
$ |
250,000 |
|
|
Stuart M. Sloan |
|
$ |
66,000 |
|
|
$ |
19,181 |
|
|
$ |
85,181 |
|
|
H. Brian Thompson |
|
$ |
78,000 |
|
|
$ |
19,181 |
|
|
$ |
97,181 |
|
|
(1) |
Directors may elect to receive all, or a portion of, their cash compensation in the form of Class A common stock. The portions of “Fees Earned” in cash and stock were as follows: |
|
|
|
Fees Earned |
|
|||||||||||||
|
|
|
|
|
|
Stock Issued in Lieu |
|
|
|
|
|
|
|
|
|||
|
|
|
Fees Paid |
|
|
of Cash |
|
Value of Stock |
|
|
|
|
|
||||
|
Name |
|
in Cash |
|
|
(#) |
|
(4) |
|
|
Total |
|
|||||
|
Richard P. Emerson |
|
$ |
35,128 |
|
|
49 |
|
$ |
34,872 |
|
|
$ |
70,000 |
|
||
|
Nicolas Kauser |
|
$ |
37,006 |
|
|
52 |
|
$ |
35,994 |
|
|
$ |
73,000 |
|
||
|
Craig O. McCaw |
|
$ |
— |
|
|
365 |
|
$ |
250,000 |
|
|
$ |
250,000 |
|
||
|
Stuart M. Sloan |
|
$ |
— |
|
|
95 |
|
$ |
66,000 |
|
|
$ |
66,000 |
|
||
|
H. Brian Thompson |
|
$ |
39,558 |
|
|
56 |
|
$ |
38,442 |
|
|
$ |
78,000 |
|
||
|
(2) |
Amounts reported reflect the grant date fair value of each stock option granted during 2017 computed in accordance with ASC 718. See Note 2 and Note 8 to our consolidated financial statements in our Annual Report on Form 10-K for the fiscal year ended December 31, 2017 for the assumptions underlying the grant date fair value. |
|
(3) |
The aggregate number of outstanding stock options held by each director (representing unexercised stock options, both vested and unvested) at December 31, 2017, is as follows: |
|
|
|
Number of Shares Subject |
|
|
|
to Outstanding |
|
Name |
|
Option Awards |
|
Richard P. Emerson |
|
570 |
|
Nicolas Kauser |
|
580 |
|
Craig O. McCaw |
|
90 |
|
Stuart M. Sloan |
|
545 |
|
H. Brian Thompson |
|
510 |
|
(4) |
The “Value of Stock” column reflects the value of the stock issued in lieu of cash based on the closing price of our Class A common stock on the last trading day of the quarter in which the fees were earned. |
74
|
Item 12. |
Security Ownership of Certain Beneficial Owners and Management and Related Stockholder Matters. |
Security Ownership of Certain Beneficial Owners and Management
The following table sets forth certain information, as of February 16, 2018, regarding shares of common stock beneficially owned by: (i) each person who is known by us to own beneficially more than five percent of either our Class A common stock or Class B common stock, (ii) each of our directors, (iii) each of our named executive officers and (iv) our directors and executive officers as a group. The information provided in the table is based on our records, information filed with the SEC, and information furnished by our shareholders.
Percentage ownership is based on 189,109 shares of Class A common stock and 53,660 shares of Class B common stock outstanding.
In computing the number of shares of common stock beneficially owned by a person and the percentage ownership of that person, we deemed outstanding shares of common stock that a person has the right to acquire within 60 days of the filing of this Form 10-K. See footnote 3 for a description of these rights. We did not, however, deem these shares outstanding to compute the percentage ownership of any other person.
|
|
|
Shares Beneficially Owned(1) |
|
|
|
|
|||||||||||||
|
|
|
Class A Common Stock |
|
|
Class B Common Stock |
|
|
|
|
||||||||||
|
|
|
Number of |
|
|
|
|
|
Number of |
|
|
|
|
|
|
|
||||
|
|
|
Shares |
|
|
Percent |
|
|
Shares |
|
|
Percent |
|
|
% Total |
|
||||
|
|
|
Beneficially |
|
|
of |
|
|
Beneficially |
|
|
of |
|
|
Voting Power |
|
||||
|
Name and Address of Beneficial Owner (2) |
|
Owned(3) |
|
|
Class |
|
|
Owned |
|
|
Class |
|
|
(4) |
|
||||
|
5% Shareholders |
|
|
|
|
|
|
|
|
|
|
|
|
|
|
|
|
|
|
|
|
Eagle River Satellite Holdings, LLC and affiliates(5) |
|
|
43,967 |
|
|
|
23.2 |
% |
|
|
44,360 |
|
|
|
82.7 |
% |
|
67.2 |
% |
|
James D. Dondero, Highland Capital Management, L.P., and affiliates(6) |
|
|
22,398 |
|
|
|
11.8 |
% |
|
— |
|
|
— |
|
|
3.1 |
% |
||
|
Mente, L.L.C.(7) |
|
|
1,912 |
|
|
|
1.0 |
% |
|
|
9,300 |
|
|
|
17.3 |
% |
|
13.1 |
% |
|
Named Executive Officers |
|
|
|
|
|
|
|
|
|
|
|
|
|
|
|
|
|
|
|
|
Lee E. Mikles(8) |
|
|
7,918 |
|
|
|
4.2 |
% |
|
— |
|
|
— |
|
|
|
* |
||
|
Steven A. Ednie |
|
492 |
|
|
|
* |
|
— |
|
|
— |
|
|
|
** |
||||
|
Timothy M. Dozois |
|
977 |
|
|
|
* |
|
— |
|
|
— |
|
|
|
* |
||||
|
Directors (other than Mr. Mikles) |
|
|
|
|
|
|
|
|
|
|
|
|
|
|
|
|
|
|
|
|
Richard P. Emerson |
|
768 |
|
|
|
* |
|
— |
|
|
— |
|
|
|
* |
||||
|
Nicolas Kauser |
|
732 |
|
|
|
* |
|
— |
|
|
— |
|
|
|
* |
||||
|
Craig O. McCaw(9) |
|
|
45,645 |
|
|
|
24.1 |
% |
|
|
44,360 |
|
|
|
82.7 |
% |
|
67.4 |
% |
|
R. Gerard Salemme |
|
|
3,048 |
|
|
|
1.6 |
% |
|
— |
|
|
— |
|
|
|
* |
||
|
Stuart M. Sloan |
|
913 |
|
|
|
* |
|
— |
|
|
— |
|
|
|
* |
||||
|
H. Brian Thompson |
|
704 |
|
|
|
* |
|
— |
|
|
— |
|
|
|
* |
||||
|
All current directors and executive officers as a group (9 persons) |
|
|
61,197 |
|
|
|
31.1 |
% |
|
|
44,360 |
|
|
|
82.7 |
% |
|
68.8 |
% |
|
* |
Less than one percent of the outstanding Class A or Class B common stock, respectively. |
|
(1) |
We have determined beneficial ownership in accordance with the rules of the SEC. Except as indicated by the footnotes below, we believe, based on the information furnished to us, that the persons and entities named have sole voting and investment power over all shares of common stock that they beneficially own. Holders of restricted shares have sole voting power, irrespective of whether the restricted shares have vested. See the “Outstanding Equity Awards at 2017 Fiscal Year-End” table for information on outstanding restricted stock awards that remain subject to vesting and forfeiture restrictions. |
|
(2) |
Unless otherwise indicated, the address of each beneficial owner indicated is c/o Pendrell Corporation, 2300 Carillon Point, Kirkland, Washington 98033. |
75
|
(3) |
The number of shares of Class A common stock beneficially owned by our named executive officers and directors includes shares issuable upon the exercise of outstanding options held by such individuals that are exercisable within 60 days of the filing of this Form 10-K, as set forth in the table below. |
|
Name |
|
Options Exercisable |
|
|
|
Mr. Mikles |
|
|
2,635 |
|
|
Mr. Ednie |
|
|
399 |
|
|
Mr. Dozois |
|
|
645 |
|
|
Mr. Emerson |
|
|
510 |
|
|
Mr. Kauser |
|
|
520 |
|
|
Mr. McCaw |
|
|
90 |
|
|
Mr. Salemme |
|
|
2,060 |
|
|
Mr. Sloan |
|
|
485 |
|
|
Mr. Thompson |
|
|
450 |
|
|
All current directors and executive officers as a group (9 persons) |
|
|
7,794 |
|
|
(4) |
Each holder of Class B common stock is entitled to ten votes per share of Class B common stock and each holder of Class A common stock is entitled to one vote per share of Class A common stock and vote together as a single class on all matters submitted to a vote of our shareholders, except as may otherwise be required by law. The Class B common stock is convertible at any time by the holders into shares of Class A common stock on a share-for-share basis. |
|
(5) |
Includes 20,696 shares of Class A common stock beneficially owned by Eagle River Satellite Holdings, LLC (“ERSH”); 2,339 shares of Class A common stock held by Eagle River, Inc.; 17,932 shares of Class A common stock held by Eagle River Partners, LLC (“ERP”); 3,000 shares of Class A common stock held by Eagle River Investments, LLC (“ERI”); and 44,360 shares of Class B common stock held by ERSH. Mr. McCaw is the sole manager and beneficial member of ERI, which is the sole member of ERSH. Mr. McCaw is the sole shareholder of Eagle River, Inc. and the beneficial member of ERP. |
|
(6) |
Based on information provided by Highland Capital Management, L.P. (“Highland Capital”). Includes shares of Class A common stock beneficially owned and/or held by or for the account of James D. Dondero (including through family trusts), Highland Capital, and Strand Advisors, Inc. Highland Capital serves as an investment adviser to, and manages investment and trading accounts of, other persons and may be deemed, through investment advisory contracts or otherwise, to beneficially own securities owned by other persons. Strand Advisors is the general partner of Highland Capital and may be deemed to beneficially own securities owned by Highland Capital. Mr. Dondero is the President and a director of Strand Advisors and may be deemed to beneficially own securities owned by Strand Advisors. The address of Mr. Dondero and Highland Capital is Two Galleria Tower, 13455 Noel Road, Suite 800, Dallas, Texas 75240. |
|
(7) |
Based on a Schedule 13G/A filed with the SEC on February 14, 2017, wherein Mente, L.L.C. reported all common stock held may be deemed to be beneficially owned by William H. Gates, III as the sole member of Mente, L.L.C. The address of Mente, L.L.C. is 2365 Carillon Point, Kirkland, Washington 98033. |
|
(8) |
Includes 5,112 shares of Class A Common Stock held directly by Mr. Mikles; 97 shares of Class A common stock held in trusts and/or custodial accounts for the benefit of Mr. Mikles’ children; and 74 shares of Class A common stock held by Mr. Mikles’ spouse. |
|
(9) |
Includes (i) 1,588 shares of Class A common stock held directly by Mr. McCaw and (ii) 43,967 shares of Class A common stock and 44,360 shares of Class B common stock beneficially owned by ERSH and its affiliates. See footnote 5 above. Mr. McCaw is the sole manager and beneficial member of ERI, which is the sole member of ERSH. Mr. McCaw is the sole shareholder of Eagle River, Inc. and the beneficial member of ERP. |
76
Related-Person Transactions Policy and Procedures
All related-party transactions are subject to review and approval by the Audit Committee. In determining whether to approve or ratify a related-party transaction, the Audit Committee considers, among other factors, whether the related-party transaction is on terms no more favorable to the counterparty than terms generally available to an unaffiliated third party under the same or similar circumstances and the extent of the related party’s interest in the transaction. To assist with the identification of potential related-party transactions, we solicit information through questionnaires from new directors and executive officers and from existing directors and executive officers on an annual basis.
Related Party Transactions
Eagle River Satellite Holdings, LLC (“ERSH”), Eagle River Investments, LLC, Eagle River, Inc. and Eagle River Partners, LLC (“ERP”)
ERSH is the Company’s controlling shareholder. ERSH, together with its affiliates Eagle River Investments, LLC, Eagle River, Inc. and ERP, held an economic interest of approximately 37.4% of the Company’s outstanding common stock and a voting interest of approximately 67.6% in the Company as of December 31, 2017. Mr. McCaw, our Chairman of the Board of Directors, is the sole shareholder of Eagle River, Inc., the sole manager and beneficial member of Eagle River Investments, LLC, which is the sole member of ERSH, and the beneficial member of ERP.
Director Independence
Each year, our directors are obligated to complete a questionnaire which requires them to disclose any transactions with us in which the director or any member of his immediate family might have a direct or potential conflict of interest. Based on its analysis of the responses, the Board determined that all directors, except for Mr. Mikles due to his position as an executive officer of the Company, Mr. Salemme due to his recent employment history and consulting agreement with the Company, and Mr. McCaw due to his ownership of Eagle River, are independent under its guidelines and free from any relationship that would interfere with the exercise of their independent judgment.
Indemnification Agreements
Under indemnification agreements between the Company and each of our executive officers and directors, we have agreed to indemnify our executive officers and directors for expenses, damages, judgments, fines and settlements that he may be required to pay in actions or proceedings to which they may be made parties as directors, officers or agents of the Company, and otherwise to the extent permitted under Washington law and the Company’s Bylaws.
Under an indemnification agreement between the Company and Eagle River Investments, LLC, we are required to indemnify, defend, and hold harmless Eagle River Investments, its affiliates, and their respective members, directors, officers, agents, employees and controlling persons against claims, liabilities, losses, damages and fees and expenses incurred resulting from, or in connection with, the fact that such entity or person is or was a shareholder, director, officer, or employee of the Company or any of its subsidiaries, or based on an alleged breach of his or her fiduciary duty as a director or officer of the Company or any of its subsidiaries. The indemnification obligation is subject to certain exceptions, including losses and damages incurred through certain violations of the U.S. securities laws and damages caused by acts that a court determines to be a breach of fiduciary duties, gross negligence, or willful misconduct. We agreed to advance reasonable costs and expenses incurred for defending any claim upon receipt of an undertaking to repay the advanced amounts if it is ultimately determined the indemnitee was not entitled to indemnification under the agreement.
Under an indemnification agreement with Cascade Investment, we are similarly required to indemnify Cascade Investment, its affiliates (including Mente L.L.C.), and their respective members, directors, officers, agents, employees and controlling persons.
77
Principal Accountant Fees and Services
The following table represents aggregate fees billed to us for the fiscal year ended December 31, 2017 and December 31, 2016 by Grant Thornton LLP.
|
|
|
Fiscal Year Ended |
|
|||||
|
|
|
December 31, |
|
|||||
|
|
|
2017 |
|
|
2016 |
|
||
|
Audit Fees(1) |
|
$ |
265,650 |
|
|
$ |
347,550 |
|
|
Audit-related Fees |
|
|
— |
|
|
|
— |
|
|
Tax Fees |
|
|
— |
|
|
|
— |
|
|
All Other Fees |
|
|
— |
|
|
|
— |
|
|
Total Fees |
|
$ |
265,650 |
|
|
$ |
347,550 |
|
|
(1) |
Audit Fees consist of fees and expenses for professional services rendered by Grant Thornton LLP in connection with: (i) the audit of our annual financial statements included in this Form 10-K for the fiscal years ended December 31, 2017 and December 31, 2016, and the review of the interim financial statements included in the quarterly reports on Form 10-Q; (ii) the audit of our internal controls over financial reporting; and (iii) services that are normally provided in connection with statutory and regulatory filings or engagements. |
Pre-Approval Policies and Procedures
The Audit Committee charter permits the Audit Committee to delegate pre-approval authority to subcommittees consisting of one or more individuals, as well as to pre-approve defined categories of services. However, the Audit Committee has not done so, but has instead pre-approved all audit and non-audit services rendered by Grant Thornton LLP as part of the scope of the independent auditor engagement or on a case-by-case basis prior to engagement for service. All services provided by Grant Thornton LLP in 2017 and 2016, as described under Audit Fees above, were pre-approved by the Audit Committee.
78
|
(a) |
Documents filed as part of this report |
|
|
(1) |
Consolidated financial statements |
The following consolidated financial statements are included in Part II, Item 8 of this report:
|
|
• |
Report of Independent Registered Public Accounting Firm |
|
|
• |
Consolidated Balance Sheets as of December 31, 2017 and 2016 |
|
|
• |
Consolidated Statements of Operations for the years ended December 31, 2017, 2016 and 2015 |
|
|
• |
Consolidated Statements of Changes in Shareholders’ Equity for the years ended December 31, 2017, 2016 and 2015 |
|
|
• |
Consolidated Statements of Cash Flows for the years ended December 31, 2017, 2016 and 2015 |
|
|
• |
Notes to Consolidated Financial Statements |
|
|
(2) |
Financial statement schedules |
All other consolidated financial statements schedules not listed above have been omitted because they are not applicable or are not required or the information required to be set forth in the schedules is included in the consolidated financial statements or the accompanying notes.
|
|
(3) |
Exhibits |
The Exhibits listed in the Index to Exhibits, which appears immediately following the signature page and is incorporated herein by reference, are filed as part of this Form 10-K.
The Company has elected not to include summary information.
79
|
|
|
|
|
Incorporated By Reference |
||||||||
|
Exhibit No. |
|
Exhibit Description |
|
Form |
|
SEC File No. |
|
Original Exhibit No. |
|
Filing Date |
|
Filed Herewith |
|
|
|
|
|
|
|
|
|
|
|
|
|
|
|
2.1 |
|
|
8-K12B |
|
001-33008 |
|
2.1 |
|
11/15/12 |
|
|
|
|
|
|
|
|
|
|
|
|
|
|
|
|
|
|
3.1 |
|
Articles of Incorporation of Pendrell Corporation, a Washington corporation |
|
8-K12B |
|
001-33008 |
|
3.1 |
|
11/15/12 |
|
|
|
|
|
|
|
|
|
|
|
|
|
|
|
|
|
3.2 |
|
Articles of Amendment to Articles of Incorporation of Pendrell Corporation |
|
8-K |
|
001-33008 |
|
3.1 |
|
06/19/15 |
|
|
|
|
|
|
|
|
|
|
|
|
|
|
|
|
|
3.3 |
|
Articles of Amendment to Articles of Incorporation of Pendrell Corporation |
|
8-K |
|
001-33008 |
|
3.1 |
|
09/30/16 |
|
|
|
|
|
|
|
|
|
|
|
|
|
|
|
|
|
3.4 |
|
Articles of Amendment to Articles of Incorporation of Pendrell Corporation |
|
8-K |
|
001-33008 |
|
3.1 |
|
12/04/17 |
|
|
|
|
|
|
|
|
|
|
|
|
|
|
|
|
|
3.5 |
|
|
8-K12B |
|
001-33008 |
|
3.2 |
|
11/15/12 |
|
|
|
|
|
|
|
|
|
|
|
|
|
|
|
|
|
|
3.6 |
|
|
8-K |
|
001-33008 |
|
3.2 |
|
06/19/15 |
|
|
|
|
|
|
|
|
|
|
|
|
|
|
|
|
|
|
4.1 |
|
|
8-K |
|
001-33008 |
|
4.1 |
|
02/01/10 |
|
|
|
|
|
|
|
|
|
|
|
|
|
|
|
|
|
|
10.1 |
|
|
8-K |
|
001-33008 |
|
10.1 |
|
11/15/12 |
|
|
|
|
|
|
|
|
|
|
|
|
|
|
|
|
|
|
10.2 |
|
|
10-12G |
|
000-52006 |
|
10.14 |
|
05/15/06 |
|
|
|
|
|
|
|
|
|
|
|
|
|
|
|
|
|
|
10.3 |
|
|
10-12G |
|
000-52006 |
|
10.16 |
|
05/15/06 |
|
|
|
|
|
|
|
|
|
|
|
|
|
|
|
|
|
|
10.4* |
|
|
10-Q |
|
001-33008 |
|
10.20.1 |
|
08/14/07 |
|
|
|
|
|
|
|
|
|
|
|
|
|
|
|
|
|
|
10.5* |
|
Form of Class A Common Stock Option Agreement under 2000 Stock Incentive Plan |
|
10-12G |
|
000-52006 |
|
10.21 |
|
05/15/06 |
|
|
|
|
|
|
|
|
|
|
|
|
|
|
|
|
|
10.6* |
|
Form of Restricted Stock Award Agreement under 2000 Stock Incentive Plan |
|
10-12G |
|
000-52006 |
|
10.23 |
|
05/15/06 |
|
|
80
|
|
|
|
|
Incorporated By Reference |
||||||||
|
Exhibit No. |
|
Exhibit Description |
|
Form |
|
SEC File No. |
|
Original Exhibit No. |
|
Filing Date |
|
Filed Herewith |
|
|
|
|
|
|
|
|
|
|
|
|
|
|
|
10.7* |
|
|
10-K |
|
001-33008 |
|
10.16 |
|
03/15/17 |
|
|
|
|
|
|
|
|
|
|
|
|
|
|
|
|
|
|
10.8* |
|
Form of Stock Option Agreement under 2012 Equity Incentive Plan, as amended |
|
10-K |
|
001-33008 |
|
10.9 |
|
03/08/13 |
|
|
|
|
|
|
|
|
|
|
|
|
|
|
|
|
|
10.9* |
|
Form of Restricted Stock Unit Agreement under 2012 Equity Incentive Plan |
|
10-Q |
|
001-33008 |
|
10.1 |
|
10/30/15 |
|
|
|
|
|
|
|
|
|
|
|
|
|
|
|
|
|
10.10* |
|
Form of Restricted Stock Award Agreement under 2012 Equity Incentive Plan |
|
10-Q |
|
001-33008 |
|
10.2 |
|
10/30/15 |
|
|
|
|
|
|
|
|
|
|
|
|
|
|
|
|
|
10.11* |
|
|
8-K |
|
001-33008 |
|
10.1 |
|
04/14/17 |
|
|
|
|
|
|
|
|
|
|
|
|
|
|
|
|
|
|
10.12* |
|
Board Compensation Policy, effective January 1, 2013, as amended on September 30, 2016 |
|
10-K |
|
001-33008 |
|
10.16 |
|
03/15/17 |
|
|
|
|
|
|
|
|
|
|
|
|
|
|
|
|
|
10.13 |
|
|
8-K |
|
001-33008 |
|
10.1 |
|
06/06/08 |
|
|
|
|
|
|
|
|
|
|
|
|
|
|
|
|
|
|
10.14* |
|
|
8-K |
|
001-33008 |
|
10.1 |
|
06/10/15 |
|
|
|
|
|
|
|
|
|
|
|
|
|
|
|
|
|
|
10.15* |
|
Retention Agreement effective February 16, 2015 between Pendrell Corporation and R. Gerard Salemme |
|
10-K |
|
001-33008 |
|
10.16 |
|
03/06/15 |
|
|
|
|
|
|
|
|
|
|
|
|
|
|
|
|
|
10.16* |
|
|
10-K |
|
001-33008 |
|
10.16 |
|
03/15/17 |
|
|
|
|
|
|
|
|
|
|
|
|
|
|
|
|
|
|
10.17* |
|
|
10-K |
|
001-33008 |
|
10.17 |
|
03/15/17 |
|
|
|
|
|
|
|
|
|
|
|
|
|
|
|
|
|
|
10.18 |
|
|
8-K |
|
001-33008 |
|
10.1 |
|
03/14/17 |
|
|
|
|
|
|
|
|
|
|
|
|
|
|
|
|
|
|
21.1 |
|
|
10-K |
|
001-33008 |
|
21.1 |
|
03/15/17 |
|
|
|
|
|
|
|
|
|
|
|
|
|
|
|
|
|
|
31.1 |
|
Certification of the principal executive officer required by Rule 13a-14(a) or Rule 15d-14(a) |
|
|
|
|
|
|
|
|
|
X |
81
|
|
|
|
|
Incorporated By Reference |
||||||||
|
Exhibit No. |
|
Exhibit Description |
|
Form |
|
SEC File No. |
|
Original Exhibit No. |
|
Filing Date |
|
Filed Herewith |
|
|
|
|
|
|
|
|
|
|
|
|
|
|
|
31.2 |
|
|
|
|
|
|
|
|
|
|
X |
|
|
|
|
|
|
|
|
|
|
|
|
|
|
|
|
32.1 |
|
|
|
|
|
|
|
|
|
|
X |
|
|
|
|
|
|
|
|
|
|
|
|
|
|
|
|
101 |
|
The following financial statements from Pendrell Corporation’s 10-K for the fiscal year ended December 31, 2017 formatted in XBRL: (i) the Consolidated Balance Sheets, (ii) the Consolidated Statements of Operations, (iii) the Consolidated Statements of Changes in Shareholders’ Equity, (iv) the Consolidated Statements of Cash Flows and (v) the Notes to Consolidated Financial Statements |
|
|
|
|
|
|
|
|
|
X |
|
* |
Management contract or compensatory plan or arrangement. |
82
Pursuant to the requirements of Section 13 or 15(d) of the Securities Exchange Act of 1934, the registrant has duly caused this report to be signed on its behalf by the undersigned, thereunto duly authorized.
|
|
PENDRELL CORPORATION |
|
|
|
(Registrant) |
|
|
|
|
|
|
Date: February 16, 2018 |
By: |
/s/ LEE E. MIKLES |
|
|
|
Lee E. Mikles Chief Executive Officer and President (Principal Executive Officer) |
POWER OF ATTORNEY
KNOW ALL PERSONS BY THESE PRESENTS, that each person whose signature appears below constitutes and appoints Lee E. Mikles, Steven A. Ednie and Timothy M. Dozois, and each of them, as his true and lawful attorneys-in-fact and agents, with full power of substitution for him, and in his name in any and all capacities, to sign any and all amendments to this Annual Report on Form 10-K, and to file the same, with exhibits thereto and other documents in connection therewith, with the Securities and Exchange Commission, granting unto said attorneys-in-fact and agents, and each of them, full power and authority to do and perform each and every act and thing requisite and necessary to be done therewith, as fully to all intents and purposes as he might or could do in person, hereby ratifying and confirming all that said attorneys-in-fact and agents, and any of them or his or her substitute or substitutes, may lawfully do or cause to be done by virtue hereof.
Pursuant to the requirements of the Securities Act of 1934, this report has been signed by the following persons on behalf of the Registrant in the capacities indicated on February 16, 2018:
|
Signature |
|
Title |
|
Date |
|
|
|
|
|
|
|
/s/ LEE E. MIKLES
Lee E. Mikles |
|
Chief Executive Officer and President (Principal Executive Officer), Director |
|
February 16, 2018 |
|
|
|
|
|
|
|
/s/ STEVEN A. EDNIE
Steven A. Ednie |
|
Vice President, Chief Financial Officer (Principal Financial and Accounting Officer) |
|
February 16, 2018 |
|
|
|
|
|
|
|
/s/ RICHARD P. EMERSON
Richard P. Emerson |
|
Director |
|
February 16, 2018 |
|
|
|
|
|
|
|
/s/ NICOLAS KAUSER
Nicolas Kauser |
|
Director |
|
February 16, 2018 |
|
|
|
|
|
|
|
/s/ CRAIG O. MCCAW
Craig O. McCaw |
|
Executive Chairman and Chairman of the Board of Directors |
|
February 16, 2018 |
|
|
|
|
|
|
|
/s/ R. GERARD SALEMME
R. Gerard Salemme |
|
Director |
|
February 16, 2018 |
|
|
|
|
|
|
|
/s/ STUART M. SLOAN
Stuart M. Sloan |
|
Director |
|
February 16, 2018 |
|
|
|
|
|
|
|
/s/ H. BRIAN THOMPSON
H. Brian Thompson |
|
Director |
|
February 16, 2018 |
83