Attached files
| file | filename |
|---|---|
| EX-32.2 - EX-32.2 - OLD NATIONAL BANCORP /IN/ | d503702dex322.htm |
| EX-32.1 - EX-32.1 - OLD NATIONAL BANCORP /IN/ | d503702dex321.htm |
| EX-31.2 - EX-31.2 - OLD NATIONAL BANCORP /IN/ | d503702dex312.htm |
| EX-31.1 - EX-31.1 - OLD NATIONAL BANCORP /IN/ | d503702dex311.htm |
| EX-23.1 - EX-23.1 - OLD NATIONAL BANCORP /IN/ | d503702dex231.htm |
| EX-21 - EX-21 - OLD NATIONAL BANCORP /IN/ | d503702dex21.htm |
| EX-12 - EX-12 - OLD NATIONAL BANCORP /IN/ | d503702dex12.htm |
| EX-10.(T) - EX-10.(T) - OLD NATIONAL BANCORP /IN/ | d503702dex10t.htm |
| EX-10.(S) - EX-10.(S) - OLD NATIONAL BANCORP /IN/ | d503702dex10s.htm |
Table of Contents
UNITED STATES
SECURITIES AND EXCHANGE COMMISSION
Washington, D.C. 20549
FORM 10-K
Annual Report Pursuant to Section 13 or 15(d) of the Securities Exchange Act of 1934
For the fiscal year ended December 31, 2017
Commission File Number 1-15817
OLD NATIONAL BANCORP
(Exact name of the Registrant as specified in its charter)
| INDIANA | 35-1539838 | |
| (State or other jurisdiction of incorporation or organization) |
(I.R.S. Employer Identification No.) | |
| One Main Street Evansville, Indiana |
47708 | |
| (Address of principal executive offices) |
(Zip Code) | |
(812) 464-1294
(Registrant’s telephone number, including area code)
Securities registered pursuant to Section 12(b) of the Act
| Title of Each Class |
Name of each exchange on which registered | |
| Common Stock, No Par Value |
The NASDAQ Stock Market LLC |
Securities registered pursuant to Section 12(g) of the Act:
None
Indicate by check mark if the registrant is a well-known seasoned issuer, as defined in Rule 405 of the Securities Act. Yes ☑ No ☐
Indicate by check mark if the registrant is not required to file reports pursuant to Section 13 or Section 15(d) of the Act. Yes ☐ No ☑
Indicate by check mark whether the registrant (1) has filed all reports required to be filed by Section 13 or 15(d) of the Securities Exchange Act of 1934 during the preceding 12 months (or for such shorter period that the registrant was required to file such reports), and (2) has been subject to such filing requirements for the past 90 days. Yes ☑ No ☐
Indicate by check mark whether the registrant has submitted electronically and posted on its corporate Web site, if any, every Interactive Data File required to be submitted and posted pursuant to Rule 405 of Regulation S-T (s232.405 of this chapter) during the preceding 12 months (or for such shorter period that the registrant was required to submit and post such files). Yes ☑ No ☐
Indicate by check mark if disclosure of delinquent filers pursuant to Item 405 of Regulation S-K (s229.405 of this chapter) is not contained herein, and will not be contained, to the best of the Registrant’s knowledge, in definitive proxy or information statements incorporated by reference in Part III of this Form 10-K or any amendment to this Form 10-K. ☐
Indicate by check mark whether the registrant is a large accelerated filer, an accelerated filer, a non-accelerated filer, smaller reporting company, or an emerging growth company. See the definitions of “large accelerated filer,” “accelerated filer,” “smaller reporting company,” and “emerging growth company” in Rule 12b-2 of the Exchange Act.
| Large accelerated filer | ☑ | Accelerated filer | ☐ | |||
| Non-accelerated filer | ☐ (Do not check if a smaller reporting company) | Smaller reporting company | ☐ | |||
| Emerging growth company | ☐ | |||||
If an emerging growth company, indicate by check mark if the registrant has elected not to use the extended transition period for complying with any new or revised financial accounting standards provided pursuant to Section 13(a) of the Exchange Act. ☐
Indicate by check mark whether the registrant is a shell company (as defined in Rule 12b-2 of the Act). Yes ☐ No ☑
The aggregate market value of the registrant’s voting common stock held by non-affiliates on June 30, 2017, was $2,295,172,245 (based on the closing price on that date of $17.25). In calculating the market value of securities held by non-affiliates of the registrant, the registrant has treated as securities held by affiliates as of June 30, 2017, voting stock owned of record by its directors and principal executive officers, and voting stock held by the registrant’s trust department in a fiduciary capacity for benefit of its directors and principal executive officers. This calculation does not reflect a determination that persons are affiliates for any other purposes.
The number of shares outstanding of the registrant’s common stock, as of January 31, 2018, was 152,061,000.
DOCUMENTS INCORPORATED BY REFERENCE
Portions of the Proxy Statement for the Annual Meeting of Shareholders to be held April 26, 2018 are incorporated by reference into Part III of this Form 10-K.
Table of Contents
OLD NATIONAL BANCORP
2017 ANNUAL REPORT ON FORM 10-K
2
Table of Contents
GLOSSARY OF ABBREVIATIONS AND ACRONYMS
As used in this report, references to “Old National,” “we,” “our,” “us,” and similar terms refer to the consolidated entity consisting of Old National Bancorp and its wholly-owned affiliates. Old National Bancorp refers solely to the parent holding company, and Old National Bank refers to Old National’s bank subsidiary.
The acronyms and abbreviations identified below are used throughout this report, including the Notes to Consolidated Financial Statements. You may find it helpful to refer to this page as you read this report.
ACH: Automated Clearing House
Anchor (MN): Anchor Bancorp, Inc.
Anchor Bank (MN): Anchor Bank, N.A.
Anchor (WI): Anchor BanCorp Wisconsin Inc.
AnchorBank (WI): AnchorBank, fsb
AOCI: accumulated other comprehensive income (loss)
AQR: asset quality rating
ASC: Accounting Standards Codification
ASU: Accounting Standards Update
ATM: automated teller machine
CDO: collateralized debt obligation
Common Stock: Old National Bancorp common stock, without par value
CReED: Indiana Community Revitalization Enhancement District Tax Credit
DTI: debt-to-income
EITF: Emerging Issues Task Force
FASB: Financial Accounting Standards Board
FDIC: Federal Deposit Insurance Corporation
FHLB: Federal Home Loan Bank
FHLBI: Federal Home Loan Bank of Indianapolis
FHTC: Federal Historic Tax Credit
FICO: Fair Isaac Corporation
Founders: Founders Financial Corporation
GAAP: generally accepted accounting principles
Integra: Integra Bank N.A.
LGD: loss given default
LIBOR: London Interbank Offered Rate
LIHTC: Low Income Housing Tax Credit
LTV: loan-to-value
N/A: not applicable
N/M: not meaningful
NASDAQ: The NASDAQ Stock Market LLC
NMTC: Federal New Market Tax Credits
NOW: negotiable order of withdrawal
OCC: Office of the Comptroller of the Currency
ONI: ONB Insurance Group, Inc.
OTTI: other-than-temporary impairment
PCI: purchased credit impaired
PD: probability of default
Renewable Energy: investment tax credits for solar projects
SEC: Securities and Exchange Commission
TBA: to be announced
TDR: troubled debt restructuring
3
Table of Contents
OLD NATIONAL BANCORP
2017 ANNUAL REPORT ON FORM 10-K
FORWARD-LOOKING STATEMENTS
In this report, we have made various statements regarding current expectations or forecasts of future events, which speak only as of the date the statements are made. These statements are “forward-looking statements” within the meaning of the Private Securities Litigation Reform Act of 1995. Forward-looking statements are also made from time-to-time in press releases and in oral statements made by the officers of Old National Bancorp (“Old National” or the “Company”). Forward-looking statements can be identified by the use of the words “expect,” “may,” “could,” “intend,” “project,” “estimate,” “believe,” “anticipate,” and other words of similar meaning. Forward-looking statements also include, but are not limited to, statements regarding estimated cost savings, plans and objectives for future operations, the Company’s business and growth strategies, including future acquisitions of banks, regulatory developments, and expectations about performance as well as economic and market conditions and trends.
Such forward-looking statements are based on assumptions and estimates, which although believed to be reasonable, may turn out to be incorrect. Therefore, undue reliance should not be placed upon these estimates and statements. We cannot assure that any of these statements, estimates, or beliefs will be realized and actual results may differ from those contemplated in these “forward-looking statements.” We undertake no obligation to publicly update any forward-looking statements, whether as a result of new information, future events, or otherwise. You are advised to consult further disclosures we may make on related subjects in our filings with the SEC. In addition to other factors discussed in this report, some of the important factors that could cause actual results to differ materially from those discussed in the forward-looking statements include the following:
| • | economic, market, operational, liquidity, credit, and interest rate risks associated with our business; |
| • | economic conditions generally and in the financial services industry; |
| • | expected cost savings in connection with the consolidation of recent acquisitions may not be fully realized or realized within the expected time frames, and deposit attrition, customer loss, and revenue loss following completed acquisitions may be greater than expected; |
| • | failure to properly understand risk characteristics of newly entered markets; |
| • | increased competition in the financial services industry either nationally or regionally, resulting in, among other things, credit quality deterioration; |
| • | our ability to achieve loan and deposit growth; |
| • | volatility and direction of market interest rates; |
| • | governmental legislation and regulation, including changes in accounting regulation or standards; |
| • | our ability to execute our business plan; |
| • | a weakening of the economy which could materially impact credit quality trends and the ability to generate loans; |
| • | changes in the securities markets; and |
| • | changes in fiscal, monetary, and tax policies. |
Investors should consider these risks, uncertainties, and other factors in addition to risk factors included in our other filings with the SEC.
4
Table of Contents
PART I
| ITEM 1. | BUSINESS |
GENERAL
Old National is a financial holding company incorporated in the state of Indiana and maintains its principal executive office in Evansville, Indiana. We, through our wholly-owned banking subsidiary, provide a wide range of services, including commercial and consumer loan and depository services, private banking, brokerage, trust, investment advisory, and other traditional banking services. At December 31, 2017, we employed 2,801 full-time equivalent associates.
COMPANY PROFILE
Old National Bank, our wholly-owned banking subsidiary (“Old National Bank”), was founded in 1834 and is the oldest company in Evansville, Indiana. In 1982, Old National Bancorp was formed; in 2001 we became a financial holding company and we are currently the largest financial holding company headquartered in the state of Indiana with consolidated assets of $17.5 billion at December 31, 2017. At December 31, 2017, Old National Bank operated 191 banking centers located primarily in Indiana, Kentucky, Michigan, Wisconsin, and Minnesota.
OPERATING SEGMENTS
Operating segments are components of an enterprise about which separate financial information is available that is evaluated regularly by the chief operating decision maker in deciding how to allocate resources and in assessing performance. Old National Bank is the only significant subsidiary for which management makes decisions regarding how to allocate resources and assess performance. Each of the branches of Old National Bank provide a group of similar community banking services, including such products and services as commercial, real estate and consumer loans, time deposits, checking and savings accounts, cash management, brokerage, trust, and investment advisory services. The individual bank branches located throughout our Midwest footprint have similar operating and economic characteristics. While the chief decision maker monitors the revenue streams of the various products, services, and regional locations, operations are managed and financial performance is evaluated on a Company-wide basis. Accordingly, all of the community banking services and branch locations are considered by management to be aggregated into one reportable operating segment, community banking.
Lending Activities
We earn interest income on loans as well as fee income from the origination of loans. Lending activities include loans to individuals, which primarily consist of home equity lines of credit, residential real estate loans and consumer loans, and loans to commercial clients, which include commercial loans, commercial real estate loans, letters of credit, and lease financing. Residential real estate loans are either kept in our loan portfolio or sold to secondary investors, with gains or losses from the sales being recognized.
Depository Activities
We strive to serve individuals and commercial clients by providing depository services that fit their needs at competitive rates. We pay interest on the interest-bearing deposits and receive service fee revenue on various accounts. Deposit accounts include products such as noninterest-bearing demand, NOW, savings and money market, and time deposits. Debit and ATM cards provide clients with access to their accounts 24 hours a day at any ATM location. We also provide 24-hour telephone access and online banking as well as other electronic and mobile banking services.
MARKET AREA
We own the largest Indiana-based bank headquartered in Indiana. Operating from a home base in Evansville, Indiana, we have continued to grow our footprint in Indiana, Kentucky, Michigan, Wisconsin, and Minnesota. Since the beginning of 2011, Old National has transformed its franchise by reducing low-return businesses and low-growth markets and investing in higher-growth markets.
5
Table of Contents
The following table reflects information on the top markets we currently serve, demonstrating that our largest metropolitan statistical areas compare favorably to the national average.
| Metropolitan Statistical Area |
Percent of Old National Bank Franchise (%) |
Deposits Per Branch ($M) |
2010-2018 Population Change (%) |
2018-2023 Projected Population Change (%) |
2018 Median Household Income ($) |
2018-2023 Projected Household Income Change (%) |
||||||||||||||||||
| Evansville, IN-KY |
15.7 | 131.3 | 1.6 | 1.4 | 49,987 | 4.2 | ||||||||||||||||||
| Minneapolis-St. Paul-Bloomington, MN-WI (1) |
13.4 | 98.7 | 7.5 | 4.2 | 76,791 | 9.7 | ||||||||||||||||||
| Indianapolis-Carmel-Anderson, IN |
8.2 | 42.7 | 7.6 | 3.7 | 58,682 | 7.6 | ||||||||||||||||||
| Madison, WI (1) |
7.4 | 42.1 | 9.0 | 4.2 | 70,042 | 11.0 | ||||||||||||||||||
| Bloomington, IN (1) |
5.3 | 132.1 | 5.2 | 3.0 | 48,147 | 8.4 | ||||||||||||||||||
| Fort Wayne, IN (1) |
3.9 | 97.9 | 4.6 | 2.8 | 54,542 | 9.1 | ||||||||||||||||||
| Jasper, IN |
3.2 | 79.0 | 0.6 | 1.1 | 57,432 | 5.9 | ||||||||||||||||||
| Terre Haute, IN |
3.0 | 75.0 | (1.3 | ) | 0.1 | 43,017 | 0.3 | |||||||||||||||||
| Adrian, MI (1) |
2.5 | 63.4 | (1.5 | ) | (0.3 | ) | 52,388 | 9.6 | ||||||||||||||||
| Ann Arbor, MI (1) |
2.1 | 53.1 | 7.2 | 3.3 | 69,221 | 8.9 | ||||||||||||||||||
| National average |
5.8 | 3.5 | 61,045 | 8.9 | ||||||||||||||||||||
| Weighted average or sum total Old National |
||||||||||||||||||||||||
| Bank top 5 |
50.0 | 75.4 | 7.3 | 3.9 | 60,730 | 8.5 | ||||||||||||||||||
| Weighted average or sum total Old National |
||||||||||||||||||||||||
| Bank top 10 |
64.7 | 75.0 | 6.8 | 3.6 | 58,025 | 7.8 | ||||||||||||||||||
| (1) Expansion markets weighted average |
34.6 | 73.5 | 7.2 | 3.9 | 61,855 | 9.5 | ||||||||||||||||||
| Weighted average total Old National Bank |
3.5 | 2.1 | 57,541 | 7.7 | ||||||||||||||||||||
| Source: SNL |
||||||||||||||||||||||||
ACQUISITION AND DIVESTITURE STRATEGY
Since the formation of Old National in 1982, we have acquired over 50 financial institutions and other financial services businesses. Future acquisitions and divestitures will be driven by a disciplined financial process and will be consistent with the existing focus on community banking, client relationships and consistent quality earnings. Targeted geographic markets for acquisitions include mid-size markets with average to above average growth rates.
We anticipate that, as with previous acquisitions, the consideration paid by us in future acquisitions may be in the form of cash, debt, or Old National stock, or a combination thereof. The amount and structure of such consideration is based on reasonable growth and cost savings assumptions and a thorough analysis of the impact on both long- and short-term financial results.
Effective November 1, 2017, Old National acquired St. Paul, Minnesota-based Anchor (MN) through a stock and cash merger. Anchor (MN) was a bank holding company with Anchor Bank (MN) as its wholly-owned subsidiary. Founded in 1967 and with 17 total branches, Anchor Bank (MN) was one of the largest community banks headquartered in the Twin Cities, and also served Mankato, Minnesota. Anchor Bank (MN) has no affiliation with the former AnchorBank (WI) in Madison, Wisconsin, which Old National acquired in 2016. Pursuant to the merger agreement, each holder of Anchor (MN) common stock received $2.625 in cash and 1.350 shares of Old National Common Stock per share of Anchor (MN) common stock such holder owned. The total fair value of consideration for Anchor (MN) was $332.8 million, consisting of $31.9 million of cash and the issuance of 16.5 million shares of Old National Common Stock valued at $300.8 million. See Note 2 to the consolidated financial statements for further details on the Anchor (MN) acquisition.
6
Table of Contents
Prior to 2017, our most recent acquisitions included the following:
| • | 24 bank branches from Bank of America in a cash transaction on July 12, 2013 that doubled Old National’s presence in the South Bend/Elkhart, Indiana area and provided an entry into southwest Michigan; |
| • | Indiana bank holding company Tower Financial Corporation through a stock and cash merger on April 25, 2014 that added seven full-service branches in the Fort Wayne, Indiana market and strengthened Old National’s position as one of the largest deposit holders in Indiana; |
| • | Michigan bank holding company United Bancorp, Inc. through a stock and cash merger on July 31, 2014 that added 18 branches in Ann Arbor, Michigan and the surrounding area, doubling our presence in Michigan; |
| • | LSB Financial Corp. through a stock and cash merger on November 1, 2014 that added five branches in Lafayette, Indiana; |
| • | Michigan-based Founders Financial Corporation through a stock and cash merger on January 1, 2015 that added four branches in the Grand Rapids, Michigan market; and |
| • | Anchor BanCorp Wisconsin Inc. through a stock and cash merger on May 1, 2016 that added 46 branches in the Madison, Milwaukee, and Fox Valley triangle markets. |
Over the past decade, we have transitioned our footprint into higher growth markets and opportunistically will continue to do so. We believe we have the right people and the right products in the right markets, with strong leadership in place.
Divestitures
On August 14, 2015, Old National divested its southern Illinois region (twelve branches) along with four branches in eastern Indiana and one in Ohio. At closing, the purchasers assumed loans of $193.6 million and deposits of $555.8 million. Old National recorded a net pre-tax gain of $15.6 million in connection with the divestitures, which included a deposit premium of $19.3 million, goodwill allocation of $3.8 million, and $0.9 million of other transaction expenses.
On May 31, 2016, the Company sold its insurance operations, ONI. The Company received approximately $91.8 million in cash resulting in a pre-tax gain of $41.9 million and an after-tax gain of $17.6 million. See Note 16 to the consolidated financial statements for further details on the income tax impact of this sale. Goodwill and intangible assets of approximately $47.5 million were eliminated as part of this transaction. ONI was an ancillary business and did not meet the criteria to be treated as a discontinued operation as defined in Accounting Standards Update 2014-08, “Presentation of Financial Statements (Topic 205) and Property, Plant, and Equipment (Topic 360): Reporting Discontinued Operations and Disclosures of Disposals of Components of an Entity.”
We continue to focus our efforts to optimize our branch network. Since the beginning of 2011, we have consolidated 148 banking centers (including 29 banking centers in 2017). Over the same period, we have more than doubled our assets and have increased our average total deposits per branch from $34 million to approximately $66 million, while only increasing our number of branches by 30. We will continue to review our branch system as we adapt to client behavior changes, continue to make technology improvements, and delivery model changes. Accordingly, as a result of our ongoing branch analysis, we expect a continued reduction in our branch network in 2018.
COMPETITION
The banking industry and related financial service providers operate in a highly competitive market. Old National competes with financial service providers such as other commercial banks, savings and loan associations, credit unions, mortgage banking firms, consumer finance companies, securities brokerage firms, insurance companies, money market mutual funds, and other financial intermediaries. In addition, Financial Technology, or FinTech, start-ups are emerging in key areas of banking.
Many of our nonfinancial institution competitors have fewer regulatory constraints, broader geographic service areas, greater capital, and, in some cases, lower cost structures. In addition, competition for quality customers has intensified as a result of changes in regulation, mergers and acquisitions, advances in technology and product delivery systems, consolidation among financial service providers, bank failures, and the conversion of certain former investment banks to bank holding companies.
7
Table of Contents
SUPERVISION AND REGULATION
Old National is subject to extensive regulation under federal and state laws. The regulatory framework is intended primarily for the protection of depositors, federal deposit insurance funds, and the banking system as a whole and not for the protection of shareholders and creditors.
Significant elements of the laws and regulations applicable to Old National and its subsidiaries are described below. The description is qualified in its entirety by reference to the full text of the statutes, regulations and policies that are described. Also, such statutes, regulations and policies are continually under review by Congress and state legislatures and federal and state regulatory agencies. A change in statutes, regulations, or regulatory policies applicable to Old National and its subsidiaries, for which Old National cannot predict, could have a material effect on the business of the Company.
The Dodd-Frank Act. On July 21, 2010, financial regulatory reform legislation entitled the “Dodd-Frank Wall Street Reform and Consumer Protection Act” (the “Dodd-Frank Act”) was signed into law. The Dodd-Frank Act significantly restructured the financial regulatory environment in the United States. The Dodd-Frank Act contains numerous provisions that affect all bank holding companies and banks, including Old National and Old National Bank, some of which are described in more detail below. The scope and impact of many of the Dodd-Frank Act provisions were determined and issued over time. The impact of the Dodd-Frank Act on Old National has been substantial. Provisions in the legislation that affect the payment of interest on demand deposits and collection of interchange fees increased the costs associated with certain deposits and placed limitations on certain revenues those deposits generate.
The Volcker Rule. Section 619 of the Dodd-Frank Act contains provisions prohibiting proprietary trading and restricting the activities involving private equity and hedge funds (the “Volcker Rule”). Rules implementing the Volcker Rule were adopted in December 2013. Proprietary trading is defined as the trading of securities, derivatives, or futures (or options on any of the foregoing) as principal, where such trading is principally for the purpose of short-term resale, benefiting from actual or expected short-term price movements and realizing short-term arbitrage profits. The rule’s definition of proprietary trading specifically excludes market-making-related activity, certain government issued securities trading and certain risk management activities. Old National and Old National Bank do not engage in any prohibited proprietary trading activities.
The final text of the Volcker Rule contained provisions to the effect that CDOs, including pooled trust preferred securities, would have to be sold prior to July 15, 2015. The practical implication of this rule provision, which was not expected by the industry, was that those instruments could no longer be accorded “held-to-maturity” accounting treatment but would have to be switched to “available-for-sale” accounting, and that all covered CDOs, regardless of the accounting classification, would need to be adjusted to fair value through an other-than-temporary impairment non-cash charge to earnings. On January 14, 2014, federal banking agencies released an interim final rule regarding the Volcker Rule’s impact on trust preferred CDOs, which included a nonexclusive list of CDOs backed by trust preferred securities that depository institutions will be permitted to continue to hold. All of the trust preferred securities owned by Old National are on this list and held as “available-for-sale”. Any unrealized losses associated with these instruments have already impacted our capital. As of December 31, 2017, Old National does not have any securities that will have to be divested as a result of the Volcker Rule.
The Durbin Amendment. The Dodd-Frank Act included provisions (the “Durbin Amendment”) which capped interchange fees for debit card transactions at $0.21 plus five basis points for safe harbor eligibility, provided they were determined to be reasonable and proportionate. The Durbin Amendment began to negatively impact debit card and ATM fees beginning in the second half of 2015.
Bank Holding Company Regulation. Old National is registered as a bank holding company and has elected to be a financial holding company. It is subject to the supervision of, and regulation by, the Board of Governors of the Federal Reserve System (the “Federal Reserve”) under the Bank Holding Company Act of 1956, as amended (the “BHC Act”). The Federal Reserve has issued regulations under the BHC Act requiring a bank holding company to serve as a source of financial and managerial strength to its subsidiary banks. It is the policy of the Federal Reserve that, pursuant to this requirement, a bank holding company should stand ready to use its resources to provide adequate capital funds to its subsidiary banks during periods of financial stress or adversity. Under this requirement, Old National is expected to commit resources to support Old National Bank, including at times when Old National may not be in a financial position to provide such resources. Any capital loans by a bank holding company to any of its subsidiary banks are subordinate in right of payment to depositors and to certain other indebtedness of such
8
Table of Contents
subsidiary banks. In the event of a bank holding company’s bankruptcy, any commitment by the bank holding company to a federal bank regulatory agency to maintain the capital of a subsidiary bank will be assumed by the bankruptcy trustee and entitled to priority of payment.
The BHC Act requires the prior approval of the Federal Reserve to acquire more than a 5% voting interest of any bank or bank holding company. Additionally, the BHC Act restricts Old National’s non-banking activities to those which are determined by the Federal Reserve to be closely related to banking and a proper incident thereto.
Under the Federal Deposit Insurance Corporation Improvement Act of 1991 (“FDICIA”), a bank holding company is required to guarantee the compliance of any insured depository institution subsidiary that may become “undercapitalized” (as defined in FDICIA) with the terms of any capital restoration plan filed by such subsidiary with its appropriate federal bank regulatory agency.
Capital and Liquidity Requirements. Bank holding companies are required to comply with the Federal Reserve’s risk-based capital guidelines. The FDIC and the OCC have adopted risk-based capital ratio guidelines to which depository institutions under their respective supervision, including Old National Bank, are subject. The guidelines establish a systematic analytical framework that makes regulatory capital requirements more sensitive to differences in risk profiles among banking organizations. Risk-based capital ratios are determined by allocating assets and specified off-balance sheet commitments to four risk-weighted categories, with higher levels of capital being required for the categories perceived as representing greater risk. Old National Bank exceeded all risk-based minimum capital requirements of the FDIC and OCC as of December 31, 2017 and 2016. For Old National’s regulatory capital ratios and regulatory requirements as of December 31, 2017 and 2016, see Note 24 to the consolidated financial statements.
The federal regulatory authorities’ current risk-based capital guidelines are based upon the Basel Committee on Banking Supervision (the “Basel Committee”). The Basel Committee is a committee of international central banks and bank regulators responsible for establishing international supervisory guidelines for use in member jurisdictions to enhance and align bank regulation on a global scale and promote financial stability. In December 2010 and January 2011, the Basel Committee published the final revisions to the international regulatory capital framework generally referred to as “Basel III,” as a response to deficiencies in the international regulatory standards identified during the global financial crisis.
Effective July 2, 2013, the Federal Reserve and the OCC approved final rules known as the “Basel III Capital Rules” substantially revising the risk-based capital and leverage capital requirements applicable to bank holding companies and depository institutions, including Old National and Old National Bank. The Basel III Capital Rules address the components of capital and other issues affecting the numerator in banking institutions’ regulatory capital ratios. The Basel III Capital Rules also implement the requirements of Section 939A of the Dodd-Frank Act to remove references to credit ratings from the federal banking agencies’ rules. Certain of the Basel III Capital Rules came into effect for Old National and Old National Bank on January 1, 2015; subject to a phase-in period ending on December 31, 2018.
The Basel III Capital Rules introduced a new capital measure “Common Equity Tier 1” (“CET1”). The rules specify that Tier 1 capital consists of CET1 and “Additional Tier 1 capital” instruments meeting specified requirements. CET1 capital consists of common stock instruments that meet the eligibility criteria in the final rules, retained earnings, accumulated other comprehensive income, and common equity Tier 1 minority interest. The rules also define CET1 narrowly by requiring that most adjustments to regulatory capital measures be made to CET1, and not to the other components of capital. They also expand the scope of the adjustments as compared to existing regulations.
9
Table of Contents
When fully phased-in on January 1, 2019, the Basel III Capital Rules will require banking organizations to maintain:
| • | a minimum ratio of CET1 to risk-weighted assets of at least 4.5%, plus a 2.5% “capital conservation buffer” (which is added to the 4.5% CET1 ratio as that buffer is phased-in, effectively resulting in a minimum ratio of CET1 to risk-weighted assets of at least 7.0% upon full implementation); |
| • | a minimum ratio of Tier 1 capital to risk-weighted assets of at least 6.0%, plus the 2.5% capital conservation buffer (which is added to the 6.0% Tier 1 capital ratio as that buffer is phased-in, effectively resulting in a minimum Tier 1 capital ratio of 8.5% upon full implementation); |
| • | a minimum ratio of total capital (that is, Tier 1 plus Tier 2 capital) to risk-weighted assets of at least 8.0%, plus the 2.5% capital conservation buffer (which is added to the 8.0% total capital ratio as that buffer is phased-in, effectively resulting in a minimum total capital ratio of 10.5% upon full implementation); and |
| • | a minimum leverage ratio of 4.0%, calculated as the ratio of Tier 1 capital to adjusted average consolidated assets. |
The capital conservation buffer is designed to absorb losses during periods of economic stress. Banking institutions with a ratio of CET1 to risk-weighted assets above the minimum but below the conservation buffer will face limitations on the payment of dividends, common stock repurchases and discretionary cash payments to executive officers based on the amount of the shortfall.
The Basel III Capital Rules provide for a number of deductions from and adjustments to CET1. These include, for example, the requirement that mortgage servicing rights, deferred tax assets dependent upon future taxable income and significant investments in non-consolidated financial entities be deducted from CET1 to the extent that any one such category exceeds 10% of CET1 or all such categories in the aggregate exceed 15% of CET1. Under current capital standards, the effects of accumulated other comprehensive income items included in capital are excluded for the purposes of determining regulatory capital ratios. Under the Basel III Capital Rules, Old National and Old National Bank are given a one-time election (the “Opt-out Election”) to filter certain AOCI components, comparable to the treatment under the current general risk-based capital rule. The Company chose the Opt-out Election on the March 31, 2015 Call Report and FR Y-9C for Old National Bank and Old National, respectively.
Implementation of the deductions and other adjustments to CET1 began on January 1, 2015 and will be phased-in over a five-year period (20% per year). The implementation of the capital conservation buffer began on January 1, 2016 at the 0.625% level and will be phased-in over a four-year period (increasing by that amount on each subsequent January 1, until it reaches 2.5% on January 1, 2019).
The Basel III Capital Rules also provide for a “countercyclical capital buffer” that is applicable to only certain covered institutions and is not expected to have any current applicability to Old National or Old National Bank.
In addition, the Basel III Capital Rules revise the rules for calculating risk-weighted assets to enhance their risk sensitivity. They establish a new framework under which mortgage-backed securities and other securitization exposures will be subject to risk-weights ranging from 20% to 1,250%. The rules also establish adjusted risk-weights for credit exposures, including multi-family and commercial real estate exposures that are 90 days or more past due or on non-accrual, which will be subject to a 150% risk-weight, except in situations where qualifying collateral and/or guarantees are in place. The existing treatment of residential mortgage exposures will remain subject to either a 50% risk-weight (for prudently underwritten owner-occupied first liens that are current or less than 90 days past due) or a 100% risk-weight (for all other residential mortgage exposures including 90 days or more past due exposures).
Management believes that, as of December 31, 2017, Old National and Old National Bank would meet all capital adequacy requirements under the Basel III Capital Rules on a fully phased-in basis if such requirements were currently effective. Requirements to maintain higher levels of capital or to maintain higher levels of liquid assets could adversely impact the Company’s net income.
The Basel III Capital Rules permit banks with less than $15 billion in assets to continue to treat trust preferred securities as Tier 1 capital. This treatment is permanently grandfathered as Tier 1 capital for organic growth but not as a result of a merger or acquisition. On November 1, 2017, Old National acquired Anchor (MN) and exceeded $15 billion in assets. As the result of this acquisition, Tier 1 treatment of trust preferred securities is prohibited and those securities can only be treated as Tier 2 capital. The Basel III Capital Rules also permit banks with less than $250 billion in assets to choose to continue excluding unrealized gains and losses on certain securities holdings for purposes of calculating regulatory capital. As previously reported, the Old National chose the Opt-out Election in its
10
Table of Contents
March 31, 2015 Call Report. Additionally, the Basel III Capital Rules limit a banking organization’s capital distributions and certain discretionary bonus payments if the banking organization does not hold a “capital conservation buffer” consisting of a specified amount of CET1 capital in addition to the amount necessary to meet its minimum risk-based capital requirements.
The Basel III liquidity framework applies a balance sheet perspective to establish quantitative standards designed to ensure that a banking organization is appropriately positioned to satisfy its short- and long-term funding needs. One test to address short-term liquidity risk is referred to as the liquidity coverage ratio (“LCR”), designed to calculate the ratio of a banking entities’ ratio of high-quality liquid assets to its total net cashflows over a 30-day time horizon. The other test, referred to as the net stable funding ratio (“NSFR”), is designed to promote more medium- and long-term asset funding by incenting banking entities to increase their holdings of U.S. Treasury securities and other sovereign debt, as well as increase the use of long-term debt as a funding source. The Basel III liquidity framework was implemented as a minimum standard on January 1, 2015, with a phase-in period ending January 1, 2019. However, the federal banking agencies have not proposed rules implementing the Basel III liquidity framework and have not determined to what extent they will apply to U.S. banks that are not large, internationally active banks.
Management believes that, as of December 31, 2017, Old National Bank would meet the LCR requirement under the Basel III liquidity framework on a fully phased-in basis if such requirements were currently effective. Management’s evaluation of the impact of the NSFR requirement is ongoing as of December 31, 2017. Requirements to maintain higher levels of liquid assets could adversely impact the Company’s net income.
Stress Tests. The Dodd-Frank Act mandates company-run stress test requirements for U.S. bank holding companies with total consolidated assets of $10 billion to $50 billion. The objective of the stress test is to ensure that the financial institution has capital planning processes that account for its unique risks, and to help ensure that the institution has sufficient capital to continue operations throughout times of economic and financial stress. The stress tests are conducted with baseline, adverse and severely adverse economic scenarios. The final stress test rule defines total consolidated assets as the average of the institution’s total consolidated assets over the four most recent consecutive quarters as reported in the institution’s Call Report. Old National completed its annual stress test that covered a nine-quarter planning horizon beginning January 1, 2017 and ending on March 31, 2019 and publicly disclosed a summary of the stress test results on October 24, 2017. The stress test showed that Old National would maintain capital levels well above the regulatory guideline minimum levels for all periods and under all stress test scenarios.
Prompt Corrective Action Regulations. The Federal Deposit Insurance Act (the “FDIA”) requires, among other things, federal bank regulatory authorities to take “prompt corrective action” with respect to banks which do not meet minimum capital requirements. Under current prompt corrective action regulations, a bank will be (i) “well capitalized” if the institution has a total risk-based capital ratio of 10.0% or greater, a Tier 1 risk-based capital ratio of 8.0% or greater, and a leverage ratio of 5.0% or greater, and is not subject to any order or written directive by any such regulatory authority to meet and maintain a specific capital level for any capital measure; (ii) “adequately capitalized” if the institution has a total risk-based capital ratio of 8.0% or greater, a Tier 1 risk-based capital ratio of 4.0% or greater, and a leverage ratio of 4.0% or greater and is not “well capitalized”; (iii) “undercapitalized” if the institution has a total risk-based capital ratio that is less than 8.0%, a Tier 1 risk-based capital ratio of less than 4.0% or a leverage ratio of less than 4.0%; (iv) “significantly undercapitalized” if the institution has a total risk-based capital ratio of less than 6.0%, a Tier 1 risk-based capital ratio of less than 3.0% or a leverage ratio of less than 3.0%; and (v) “critically undercapitalized” if the institution’s tangible equity is equal to or less than 2.0% of average quarterly tangible assets. An institution may be downgraded to, or deemed to be in, a capital category that is lower than indicated by its capital ratios if it is determined to be in an unsafe or unsound condition or if it receives an unsatisfactory examination rating with respect to certain matters. A bank’s capital category is determined solely for the purpose of applying prompt corrective action regulations, and the capital category may not constitute an accurate representation of the bank’s overall financial condition or prospects for other purposes.
11
Table of Contents
The Basel III Capital Rules revised the “prompt corrective action” regulations pursuant to Section 38 of the FDIA, by:
| • | introducing a CET1 ratio requirement at each level (other than critically undercapitalized), with the required CET1 ratio being 6.5% for well-capitalized status; |
| • | increasing the minimum Tier 1 capital ratio requirement for each category, with the minimum Tier 1 risk-based capital ratio for well-capitalized status being 8.0% (as compared to the previous 6.0%); and |
| • | eliminating the provision that provides that a bank with a composite supervisory rating of 1 may have a 3.0% leverage ratio and still be well-capitalized. |
The FDIA generally prohibits a depository institution from making any capital distributions (including payment of a dividend) or paying any management fee to its parent holding company if the depository institution would thereafter be “undercapitalized.” “Undercapitalized” institutions are subject to growth limitations and are required to submit a capital restoration plan. The agencies may not accept such a plan without determining, among other things, that the plan is based on realistic assumptions and is likely to succeed in restoring the depository institution’s capital. In addition, for a capital restoration plan to be acceptable, the depository institution’s parent holding company must guarantee that the institution will comply with such capital restoration plan. The bank holding company must also provide appropriate assurances of performance. The aggregate liability of the parent holding company is limited to the lesser of (i) an amount equal to 5.0% of the depository institution’s total assets at the time it became undercapitalized and (ii) the amount which is necessary (or would have been necessary) to bring the institution into compliance with all capital standards applicable with respect to such institution as of the time it fails to comply with the plan. If a depository institution fails to submit an acceptable plan, it is treated as if it is “significantly undercapitalized.”
“Significantly undercapitalized” depository institutions may be subject to a number of requirements and restrictions, including orders to sell sufficient voting stock to become “adequately capitalized,” requirements to reduce total assets, and cessation of receipt of deposits from correspondent banks. “Critically undercapitalized” institutions are subject to the appointment of a receiver or conservator.
Management believes that, as of December 31, 2017, Old National Bank was “well capitalized” based on the existing ratios and the ratios as modified by the Basel III Capital Rules.
Deposit Insurance. Substantially all of the deposits of Old National Bank are insured up to applicable limits by the Deposit Insurance Fund (“DIF”) of the FDIC and Old National Bank is subject to deposit insurance assessments to maintain the DIF. Deposit insurance assessments are based on average consolidated total assets minus average tangible equity. Under the FDIC’s risk-based assessment system, insured institutions with at least $10 billion in assets, such as Old National Bank, are assessed on the basis of a scoring system that combines the institution’s regulatory ratings and certain financial measures. The scoring system assesses risk measures to produce two scores, a performance score and a loss severity score, that will be combined and converted to an initial assessment rate.
The performance score measures an institution’s financial performance and its ability to withstand stress. The loss severity score quantifies the relative magnitude of potential losses to the FDIC in the event of an institution’s failure. Once the performance and loss severity scores are calculated, these scores will be converted to a total score. An institution with a total score of 30 or less will pay the minimum base assessment rate, and an institution with a total score of 90 or more will pay the maximum initial base assessment rate. For total scores between 30 and 90, initial base assessment rates will rise at an increasing rate as the total score increases. The FDIC has the authority to raise or lower assessment rates, subject to limits, and to impose special additional assessments.
In October 2010, the FDIC adopted a new DIF restoration plan to ensure that the DIF reserve ratio reaches 1.35%, as required by the Dodd-Frank Act. The FDIC approved a final rule in March 2016 to meet this requirement by 2018. To meet the 1.35% DIF reserve ratio by 2018, the FDIC will assess banks with consolidated assets of more than $10 billion a surcharge assessment of 0.045% once the DIF reserve ratio reaches 1.15%. The reserve ratio reached 1.15% in the second half of 2016.
Under the FDIA, the FDIC may terminate deposit insurance upon a finding that the institution has engaged in unsafe and unsound practices, is in an unsafe or unsound condition to continue operations, or has violated any applicable law, regulation, rule, order or condition imposed by the FDIC.
12
Table of Contents
Safety and Soundness Regulations. In accordance with the FDIA, the federal banking agencies adopted guidelines establishing general standards relating to internal controls, information systems, internal audit systems, loan documentation, credit underwriting, interest rate risk exposure, asset growth, asset quality, earnings, compensation, fees and benefits. In general, the guidelines require, among other things, appropriate systems and practices to identify and manage the risks and exposures specified in the guidelines. The guidelines prohibit excessive compensation as an unsafe and unsound practice and describe compensation as excessive when the amounts paid are unreasonable or disproportionate to the services performed by an executive officer, employee, director or principal shareholder. In addition, regulations adopted by the federal banking agencies authorize the agencies to require that an institution that has been given notice that it is not satisfying any of such safety and soundness standards to submit a compliance plan. If, after being so notified, the institution fails to submit an acceptable compliance plan or fails in any material respect to implement an accepted compliance plan, the agency must issue an order directing corrective actions and may issue an order directing other actions of the types to which an undercapitalized institution is subject under the “prompt corrective action” provisions of FDIA. If the institution fails to comply with such an order, the agency may seek to enforce such order in judicial proceedings and to impose civil money penalties.
Incentive Compensation. The Dodd-Frank Act requires the federal bank regulatory agencies and the SEC to establish joint regulations or guidelines prohibiting incentive-based payment arrangements at specified regulated entities having at least $1 billion in total assets, such as Old National and Old National Bank, that encourage inappropriate risks by providing an executive officer, employee, director or principal shareholder with excessive compensation, fees, or benefits or that could lead to material financial loss to the entity. In addition, these regulators must establish regulations or guidelines requiring enhanced disclosure to regulators of incentive-based compensation arrangements. The agencies proposed such regulations in April 2011, but the regulations have not been finalized. If the regulations are adopted in the form initially proposed, they will impose limitations on the manner in which Old National may structure compensation for its executives.
In June 2010, the Federal Reserve, OCC, and FDIC issued comprehensive final guidance on incentive compensation policies intended to ensure that the incentive compensation policies of banking organizations do not undermine the safety and soundness of such organizations by encouraging excessive risk-taking. The guidance, which covers all employees who have the ability to materially affect the risk profile of an organization, either individually or as part of a group, is based upon the key principles that a banking organization’s incentive compensation arrangements should (i) provide incentives that do not encourage risk-taking beyond the organization’s ability to effectively identify and manage risks, (ii) be compatible with effective internal controls and risk management, and (iii) be supported by strong corporate governance, including active and effective oversight by the organization’s board of directors. These three principles are incorporated into the proposed joint compensation regulations under the Dodd-Frank Act, discussed above.
The Federal Reserve will review, as part of the regular, risk-focused examination process, the incentive compensation arrangements of banking organizations, such as Old National, that are not “large, complex banking organizations.” These reviews will be tailored to each organization based on the scope and complexity of the organization’s activities and the prevalence of incentive compensation arrangements. The findings of the supervisory initiatives will be included in reports of examination. Deficiencies will be incorporated into the organization’s supervisory ratings, which can affect the organization’s ability to make acquisitions and take other actions.
Enforcement actions may be taken against a banking organization if its incentive compensation arrangements, or related risk-management control or governance processes, pose a risk to the organization’s safety and soundness and the organization is not taking prompt and effective measures to correct the deficiencies.
Loans to One Borrower. Old National Bank generally may not make loans or extend credit to a single or related group of borrowers in excess of 15% of unimpaired capital and surplus. An additional amount may be loaned, up to 10% of unimpaired capital and surplus, if the loan is secured by readily marketable collateral, which generally does not include real estate. As of December 31, 2017, Old National Bank was in compliance with the loans-to-one-borrower limitations.
Depositor Preference. The FDIA provides that, in the event of the “liquidation or other resolution” of an insured depository institution, the claims of depositors of the institution, including the claims of the FDIC as subrogee of insured depositors, and certain claims for administrative expenses of the FDIC as a receiver, will have priority over other general unsecured claims against the institution. If an insured depository institution fails, insured and uninsured depositors, along with the FDIC, will have priority in payment ahead of unsecured, non-deposit creditors, including depositors whose deposits are payable only outside of the United States and the parent bank holding company, with respect to any extensions of credit they have made to such insured depository institution.
13
Table of Contents
Community Reinvestment Act. The Community Reinvestment Act of 1977 (“CRA”) requires depository institutions to assist in meeting the credit needs of their market areas consistent with safe and sound banking practice. Under the CRA, each depository institution is required to help meet the credit needs of its market areas by, among other things, providing credit to low- and moderate-income individuals and communities. Depository institutions are periodically examined for compliance with the CRA and are assigned ratings that must be publicly disclosed. In order for a financial holding company to commence any new activity permitted by the BHC Act, or to acquire any company engaged in any new activity permitted by the BHC Act, each insured depository institution subsidiary of the financial holding company must have received a rating of at least “satisfactory” in its most recent examination under the CRA. Furthermore, banking regulators take into account CRA ratings when considering approval of certain applications. Old National Bank received a rating of “outstanding” in its latest CRA examination for the period ended December 31, 2012.
Financial Privacy. The federal banking regulators adopted rules that limit the ability of banks and other financial institutions to disclose non-public information about consumers to nonaffiliated third parties. These limitations require disclosure of privacy policies to consumers and, in some circumstances, allow consumers to prevent disclosure of certain personal information to a nonaffiliated third party. These regulations affect how consumer information is transmitted through diversified financial companies and conveyed to outside vendors.
Old National Bank is also subject to regulatory guidelines establishing standards for safeguarding customer information. These guidelines describe the federal banking agencies’ expectations for the creation, implementation and maintenance of an information security program, which would include administrative, technical and physical safeguards appropriate to the size and complexity of the institution and the nature and scope of its activities. The standards set forth in the guidelines are intended to ensure the security and confidentiality of customer records and information, protect against any anticipated threats or hazards to the security or integrity of such records and protect against unauthorized access to or use of such records or information that could result in substantial harm or inconvenience to any customer.
Anti-Money Laundering and the USA Patriot Act. A major focus of governmental policy on financial institutions in recent years has been aimed at combating money laundering and terrorist financing. The USA Patriot Act of 2001 (the “USA Patriot Act”) substantially broadened the scope of United States anti-money laundering laws and regulations by imposing significant new compliance and due diligence obligations on financial institutions, creating new crimes and penalties and expanding the extra-territorial jurisdiction of the United States.
On May 11, 2016, the Financial Crimes Enforcement Network (the “FinCEN”) issued new anti-money laundering (“AML”) rules governing corporate entities doing business with banks and other financial institutions that are subject to the requirements of the USA Patriot Act. The AML rules impose significant due diligence obligations on financial institutions with respect to opening of new accounts and the monitoring of existing accounts. Under the AML rules, a financial institution must identify persons owning or controlling 25% or more of a “legal entity,” whenever the legal entity opens a new account at the bank. The financial institution must also identify an individual who has substantial management authority at the legal entity, such as a CEO, CFO, or managing partner.
The AML rules codify within the FinCEN regulations the “pillars” that must be included in a financial institutions AML compliance program. Regulators previously communicated their expectations with respect to four of these pillars: (1) the development of internal policies, procedures, and control; (2) the designation of a compliance officer; (3) the establishment of an ongoing employee training program; and (4) the implementation of an independent audit function to test programs. The new beneficial ownership requirement establishes a fifth pillar. Among other things, this new pillar includes the necessity to monitor and update the beneficial ownership of a legal entity, including the need to subject corporate borrowers to due diligence requests from financial institutions for certifications with respect to their beneficial owners. Failure of a financial institution to maintain and implement adequate programs to combat money laundering and terrorist financing, or to comply with all of the relevant laws or regulations, could have serious legal and reputational consequences for the institution, including causing applicable bank regulatory authorities not to approve merger or acquisition transactions when regulatory approval is required or to prohibit such transactions even if approval is not required.
14
Table of Contents
Office of Foreign Assets Control Regulation. The United States has imposed economic sanctions that affect transactions with designated foreign countries, nationals and others which are administered by the U.S. Treasury Department Office of Foreign Assets Control. Failure to comply with these sanctions could have serious legal and reputational consequences, including causing applicable bank regulatory authorities not to approve merger or acquisition transactions when regulatory approval is required or to prohibit such transactions even if approval is not required.
Transactions with Affiliates. Transactions between Old National Bank and its affiliates are regulated by the Federal Reserve under sections 23A and 23B of the Federal Reserve Act and related regulations. These regulations limit the types and amounts of covered transactions engaged in by Old National Bank and generally require those transactions to be on an arm’s-length basis. The term “affiliate” is defined to mean any company that controls or is under common control with Old National Bank and includes Old National and its non-bank subsidiaries. “Covered transactions” include a loan or extension of credit, as well as a purchase of securities issued by an affiliate, a purchase of assets (unless otherwise exempted by the Federal Reserve) from the affiliate, certain derivative transactions that create a credit exposure to an affiliate, the acceptance of securities issued by the affiliate as collateral for a loan, and the issuance of a guarantee, acceptance or letter of credit on behalf of an affiliate. In general, these regulations require that any such transaction by Old National Bank (or its subsidiaries) with an affiliate must be secured by designated amounts of specified collateral and must be limited to certain thresholds on an individual and aggregate basis.
Federal law also limits Old National Bank’s authority to extend credit to its directors, executive officers and 10% shareholders, as well as to entities controlled by such persons. Among other things, extensions of credit to insiders are required to be made on terms that are substantially the same as, and follow credit underwriting procedures that are not less stringent than, those prevailing for comparable transactions with unaffiliated persons. Also, the terms of such extensions of credit may not involve more than the normal risk of repayment or present other unfavorable features and may not exceed certain limitations on the amount of credit extended to such persons, individually and in the aggregate, which limits are based, in part, on the amount of Old National Bank’s capital.
Federal Home Loan Bank System. Old National Bank is a member of the Federal Home Loan Bank System, which consists of 12 regional Federal Home Loan Banks. The Federal Home Loan Bank System provides a central credit facility primarily for member institutions. As a member of the FHLBI, Old National Bank is required to acquire and hold shares of capital stock of the FHLBI in an amount at least equal to the sum of the membership stock purchase requirement, determined on an annual basis at the end of each calendar year, and the activity-based stock purchase requirement, determined on a daily basis. For Old National Bank, the membership stock purchase requirement is 1.0% of the Mortgage-Related Assets, as defined by the FHLBI, which consists principally of residential mortgage loans and mortgage-backed securities, held by Old National Bank. The activity-based stock purchase requirement is equal to the sum of: (1) a specified percentage ranging from 2.0% to 5.0%, which for Old National Bank is 5.0%, of outstanding borrowings from the FHLBI; (2) a specified percentage ranging from 0.0% to 5.0%, which for Old National Bank is 3.0%, of the outstanding principal balance of Acquired Member Assets, as defined by the FHLBI, and delivery commitments for Acquired Member Assets; (3) a specified dollar amount related to certain off-balance sheet items, which for Old National Bank is inapplicable; and (4) a specified percentage ranging from 0.0% to 5.0% of the carrying value on the FHLBI’s balance sheet of derivative contracts between the FHLBI and Old National Bank, which for Old National Bank is inapplicable. The FHLBI can adjust the specified percentages and dollar amount from time to time within the ranges established by the FHLBI capital plan. As of December 31, 2017, Old National Bank was in compliance with the minimum stock ownership requirement.
Federal Reserve System. Federal Reserve regulations require depository institutions to maintain cash reserves against their transaction accounts (primarily NOW and demand deposit accounts). A reserve of 3% is to be maintained against aggregate transaction accounts between $12.4 million and $79.5 million (subject to adjustment by the Federal Reserve) plus a reserve of 10% (subject to adjustment by the Federal Reserve between 8% and 14%) against that portion of total transaction accounts in excess of $79.5 million. The first $12.4 million of otherwise reservable balances (subject to adjustment by the Federal Reserve) is exempt from the reserve requirements. Old National Bank is in compliance with the foregoing requirements.
15
Table of Contents
Other Regulations. Old National Bank is subject to federal consumer protection statutes and regulations promulgated under those laws, including, but not limited to, the:
| • | Truth-In-Lending Act and Regulation Z, governing disclosures of credit terms to consumer borrowers; |
| • | Home Mortgage Disclosure Act and Regulation C, requiring financial institutions to provide certain information about home mortgage and refinanced loans; |
| • | Fair Credit Reporting Act and Regulation V, governing the provision of consumer information to credit reporting agencies and the use of consumer information; |
| • | Equal Credit Opportunity Act and Regulation B, prohibiting discrimination on the basis of race, religion or other prohibited factors in the extension of credit; |
| • | Fair Debt Collection Act, governing the manner in which consumer debts may be collected by collection agencies; |
| • | Truth in Savings Act and Regulation DD, which requires disclosure of deposit terms to consumers; |
| • | Regulation CC, which relates to the availability of deposit funds to consumers; |
| • | Right to Financial Privacy Act, which imposes a duty to maintain the confidentiality of consumer financial records and prescribes procedures for complying with administrative subpoenas of financial records; and |
| • | Electronic Funds Transfer Act, governing automatic deposits to and withdrawals from deposit accounts and customers’ rights and liabilities arising from the use of automated teller machines and other electronic banking services. |
The Dodd-Frank Act also significantly impacts the various consumer protection laws, rules and regulations applicable to financial institutions. The statute rolls back the federal preemption of state consumer protection laws that was enjoyed by national banks by (1) requiring that a state consumer financial law prevent or significantly interfere with the exercise of a national bank’s powers before it can be preempted, (2) mandating that any preemption decision be made on a case by case basis rather than a blanket rule, and (3) ending the applicability of preemption to subsidiaries and affiliates of national banks. As a result, we may now be subject to state consumer protection laws in each state where we do business, and those laws may be interpreted and enforced differently in each state.
The Dodd-Frank Act also created the Consumer Financial Protection Bureau (the “CFPB”), a consumer financial services regulator with supervisory authority over banks and their affiliates with assets of more than $10 billion, like Old National, to carry out federal consumer protection laws. The CFPB also regulates financial products and services sold to consumers and has rulemaking authority with respect to federal consumer financial laws. Any new regulatory requirements promulgated by the CFPB or modifications in the interpretations of existing regulations could require changes to Old National’s consumer-facing businesses. The Dodd-Frank Act also gives the CFPB broad data collecting powers for fair lending for both small business and mortgage loans, as well as extensive authority to prevent unfair, deceptive, and abusive practices.
The rules issued by the CFPB have impacted our mortgage loan origination and servicing activities. Compliance with these rules will likely continue to increase our overall regulatory compliance costs.
Dividend Limitation. Old National Bank is subject to the provisions of the National Bank Act, is supervised, regulated and examined by the OCC, and is subject to the rules and regulations of the OCC, Federal Reserve and the FDIC. A substantial portion of Old National’s cash revenue is derived from dividends paid to it by Old National Bank. These dividends are subject to various legal and regulatory restrictions as summarized in Note 24 to the consolidated financial statements.
Legislative and Regulatory Initiatives. From time to time, various legislative and regulatory initiatives are introduced in Congress and state legislatures, as well as by regulatory agencies. Such initiatives may include proposals to expand or contract the powers of bank holding companies and depository institutions or proposals to substantially change the financial institution regulatory system. Such legislation could change banking statutes and the operating environment of Old National in substantial and unpredictable ways. If enacted, such legislation could increase or decrease the cost of doing business, limit or expand permissible activities or affect the competitive balance among banks, savings associations, credit unions, and other financial institutions. Old National cannot predict whether any such legislation will be enacted, and, if enacted, the effect that it, or any implementing regulations, would have on the financial condition or results of operations of Old National. A change in statutes, regulations or regulatory policies applicable to Old National or any of its subsidiaries could have a material effect on Old National’s business, financial condition and results of operations.
16
Table of Contents
AVAILABLE INFORMATION
All reports filed electronically by Old National with the SEC, including the annual reports on Form 10-K, quarterly reports on Form 10-Q, current reports on Form 8-K, proxy and information statements, other information and amendments to those reports filed or furnished (if applicable), are accessible at no cost on Old National’s web site at www.oldnational.com as soon as reasonably practicable after electronically submitting such materials to the SEC. The SEC maintains an Internet site that contains reports, proxy and information statements, and other information regarding issuers that file electronically with the SEC, and Old National’s filings are accessible on the SEC’s web site at www.sec.gov. The public may read and copy any materials filed by Old National with the SEC at the SEC’s Public Reference Room at 100 F Street, N.E., Washington, DC 20549. The public may obtain information on the operation of the Public Reference Room by calling the SEC at 1-800-SEC-0330.
Old National’s business could be harmed by any of the risks noted below. In analyzing whether to make or to continue an investment in Old National, investors should consider, among other factors, the following:
Risks Related to the Banking Industry
Old National operates in a highly regulated environment, and changes in laws and regulations to which Old National is subject may adversely affect Old National’s results of operations.
Old National operates in a highly regulated environment and is subject to extensive regulation, supervision, and examination by, among others, the OCC, the FDIC, the CFPB, the Federal Reserve, and the State of Indiana. Such regulation and supervision of the activities in which an institution may engage is primarily intended for the protection of the depositors and federal deposit insurance funds. In addition, the Treasury has certain supervisory and oversight duties and responsibilities under EESA and the CPP. See “Business – Supervision and Regulation” herein. Applicable laws and regulations may change, and such changes may adversely affect Old National’s business. The Dodd-Frank Act, enacted in July 2010, mandated the most wide-ranging overhaul of financial industry regulation in decades. This legislation, among other things, weakened federal preemption of state consumer protection laws and established the CFPB with broad authority to administer and enforce a new federal regulatory framework of consumer financial regulation, including consumer mortgage banking. The scope and impact of many of the Dodd-Frank Act provisions were determined and issued over time. The impact of the Dodd-Frank Act on Old National has been substantial. Provisions in the legislation that affect the payment of interest on demand deposits and collection of interchange fees increased the costs associated with certain deposits and placed limitations on certain revenues those deposits generate. In addition, the Dodd-Frank Act required Old National to change certain of its business practices, intensified the regulatory supervision of Old National and the financial services industry, increased Old National’s capital requirements, and imposed additional assessments and costs on Old National. In addition, certain provisions in the legislation that had not previously applied to Old National became effective as Old National and its consolidated assets increased to over $10 billion in June 2014. This includes oversight by the CFPB and a requirement to submit our first stress test report in 2016. Requirements to maintain higher levels of capital or liquidity to address potential adverse stress scenarios could adversely impact the Company’s net income.
Regulatory authorities also have extensive discretion in connection with their supervisory and enforcement activities, including but not limited to the imposition of restrictions on the operation of an institution, the classification of assets by the institution, the adequacy of an institution’s Bank Secrecy Act/Anti Money Laundering program management, and the adequacy of an institution’s allowance for loan losses. Any change in such regulation and oversight, whether in the form of restrictions on activities, regulatory policy, regulations, or legislation, including but not limited to changes in the regulations governing institutions, could have a material impact on Old National and its operations.
If Old National fails to meet regulatory capital requirements which may require heightened capital, we may be forced to raise capital or sell assets.
Old National is subject to regulations that require us to satisfy certain capital ratios, such as the ratio of our Tier 1 capital to our risk-based assets. Both the Dodd-Frank Act, which reformed the regulation of financial institutions in a comprehensive manner, and the Basel III regulatory capital reforms, which increase both the amount and quality of capital that financial institutions must hold, will impact our capital requirements. Specifically, in July 2013, the U.S.
17
Table of Contents
federal banking authorities approved the implementation of the Basel III Capital Rules. The Basel III Capital Rules are applicable to all U.S. banks that are subject to minimum capital requirements as well as to bank and saving and loan holding companies, other than “small bank holding companies” (generally bank holding companies with consolidated assets of less than $500 million). The Basel III Capital Rules not only increase most of the required minimum regulatory capital ratios, they introduce a new Common Equity Tier 1 Capital ratio and the concept of a capital conservation buffer. The Basel III Capital Rules also expand the current definition of capital by establishing additional criteria that capital instruments must meet to be considered Additional Tier 1 Capital (i.e., Tier 1 Capital in addition to Common Equity) and Tier 2 Capital. A number of instruments that now generally qualify as Tier 1 Capital will not qualify or their qualifications will change when the Basel III Capital Rules are fully implemented. The Basel III Capital Rules have maintained the general structure of the current prompt corrective action thresholds while incorporating the increased requirements, including the Common Equity Tier 1 Capital ratio. In order to be a “well-capitalized” depository institution under the new regime, an institution must maintain a Common Equity Tier 1 Capital ratio of 6.5% or more, a Tier 1 Capital ratio of 8% or more, a Total Capital ratio of 10% or more, and a leverage ratio of 5% or more. Institutions must also maintain a capital conservation buffer consisting of Common Equity Tier 1 Capital. Financial institutions became subject to the Basel III Capital Rules on January 1, 2015 with a phase-in period through 2019 for many of the changes. If we are unable to satisfy these heightened regulatory capital requirements, due to a decline in the value of our loan portfolio or otherwise, we will be required to improve such capital ratios by either raising additional capital or by disposing of assets. If we choose to dispose of assets, we cannot be certain that we will be able to do so at prices that we believe to be appropriate, and our future operating results could be negatively affected. If we choose to raise additional capital, we may accomplish this by selling additional shares of Common Stock, or securities convertible into or exchangeable for Common Stock, which could significantly dilute the ownership percentage of holders of our Common Stock and cause the market price of our Common Stock to decline. Additionally, events or circumstances in the capital markets generally may increase our capital costs and impair our ability to raise capital at any given time.
A reduction in our credit rating could adversely affect our business and/or the holders of our securities.
The credit rating agencies rating our indebtedness regularly evaluate Old National and Old National Bank, and credit ratings are based on a number of factors, including our financial strength and ability to generate earnings, as well as factors not entirely within our control, including conditions affecting the financial services industry and the economy and changes in rating methodologies. There can be no assurance that we will maintain our current credit ratings. A downgrade of the credit ratings of Old National or Old National Bank could adversely affect our access to liquidity and capital, and could significantly increase our cost of funds, and decrease the number of investors and counterparties willing to lend to us or purchase our securities. This could affect our growth, profitability, and financial condition, including liquidity.
Changes in interest rates could adversely affect Old National’s results of operations and financial condition.
Old National’s earnings depend substantially on Old National’s interest rate spread, which is the difference between (i) the rates Old National earns on loans, securities and other earning assets and (ii) the interest rates Old National pays on deposits and other borrowings. These rates are highly sensitive to many factors beyond Old National’s control, including general economic conditions and the policies of various governmental and regulatory authorities. If market interest rates rise, Old National will have competitive pressures to increase the rates that Old National pays on deposits, which could result in a decrease of Old National’s net interest income. If market interest rates decline, Old National could experience fixed-rate loan prepayments and higher investment portfolio cash flows, resulting in a lower yield on earnings assets.
A failure or breach, including cyber-attacks, of our operational or security systems, could disrupt our business, result in the disclosure of confidential information, damage our reputation, and create significant financial and legal exposure.
Although we devote significant resources to maintain and regularly upgrade our systems and processes that are designed to protect the security of our computer systems, software, networks, and other technology assets and the confidentiality, integrity, and availability of information belonging to us and our customers, there is no assurance that our security measures will provide absolute security. Further, to access our products and services our customers may use computers and mobile devices that are beyond our security control systems. In fact, many other financial services institutions and companies engaged in data processing have reported breaches in the security of their websites or other systems, some of which have involved sophisticated and targeted attacks intended to obtain unauthorized access to confidential information, destroy data, disable or degrade service, or sabotage systems, often
18
Table of Contents
through the introduction of computer viruses or malware, cyberattacks, and other means. Certain financial institutions in the United States have also experienced attacks from technically sophisticated and well-resourced third parties that were intended to disrupt normal business activities by making internet banking systems inaccessible to customers for extended periods. These “denial-of-service” attacks have not breached our data security systems, but require substantial resources to defend, and may affect customer satisfaction and behavior.
Despite our efforts to ensure the integrity of our systems, it is possible that we may not be able to anticipate or to implement effective preventive measures against all security breaches of these types, especially because the techniques used change frequently or are not recognized until launched, and because security attacks can originate from a wide variety of sources, including persons who are involved with organized crime or associated with external service providers or who may be linked to terrorist organizations or hostile foreign governments. Those parties may also attempt to fraudulently induce employees, customers or other users of our systems to disclose sensitive information in order to gain access to our data or that of our customers or clients. We have implemented employee and customer awareness training around phishing, malware, and other cyber risks. These risks may increase in the future as we continue to increase our mobile payments and other internet-based product offerings and expand our internal usage of web-based products and applications.
If our security systems were penetrated or circumvented, it could cause serious negative consequences for us, including significant disruption of our operations, misappropriation of our confidential information or that of our customers, or damage our computers or systems and those of our customers and counterparties, and could result in violations of applicable privacy and other laws, financial loss to us or to our customers, loss of confidence in our security measures, customer dissatisfaction, significant litigation exposure, and harm to our reputation, all of which could have a material adverse effect on us.
We rely on third party vendors, which could expose Old National to additional cybersecurity risks.
Third party vendors provide key components of our business infrastructure, including certain data processing and information services. On our behalf, third parties may transmit confidential, propriety information. Although we require third party providers to maintain certain levels of information security, such providers may remain vulnerable to breaches, unauthorized access, misuse, computer viruses, or other malicious attacks that could ultimately compromise sensitive information. While we may contractually limit our liability in connection with attacks against third party providers, Old National remains exposed to the risk of loss associated with such vendors. In addition, a number of our vendors are large national entities with dominant market presence in their respective fields. Their services could prove difficult to replace in a timely manner if a failure or other service interruption were to occur. Failures of certain vendors to provide contracted services could adversely affect our ability to deliver products and services to our customers and cause us to incur significant expense.
Changes in economic or political conditions could adversely affect Old National’s earnings, as the ability of Old National’s borrowers to repay loans, and the value of the collateral securing such loans, decline.
Old National’s success depends, to a certain extent, upon economic or political conditions, local and national, as well as governmental monetary policies. Conditions such as recession, unemployment, changes in interest rates, inflation, money supply, and other factors beyond Old National’s control may adversely affect its asset quality, deposit levels, and loan demand and, therefore, Old National’s earnings. Because Old National has a significant amount of commercial real estate loans, decreases in real estate values could adversely affect the value of property used as collateral. Adverse changes in the economy may also have a negative effect on the ability of Old National’s borrowers to make timely repayments of their loans, which would have an adverse impact on Old National’s earnings. In addition, substantially all of Old National’s loans are to individuals and businesses in Old National’s market area. Consequently, any economic decline in Old National’s primary market areas, which include Indiana, Kentucky, Michigan, Wisconsin, and Minnesota could have an adverse impact on Old National’s earnings.
Failure to keep pace with technological change could adversely affect Old National’s results of operations and financial condition.
The financial services industry is continually undergoing rapid technological change with frequent introductions of new technology-driven products and services. The effective use of technology increases efficiency and enables financial institutions to better serve customers and to reduce costs. Old National’s future success depends, in part, upon its ability to address customer needs by using technology to provide products and services that will satisfy customer demands, as well as to create additional efficiencies in Old National’s operations. Old National may not
19
Table of Contents
be able to effectively implement new technology-driven products and services or be successful in marketing these products and services to its customers. Failure to successfully keep pace with technological change affecting the financial services industry could negatively affect Old National’s growth, revenue, and profit.
Changes in consumer use of banks and changes in consumer spending and savings habits could adversely affect Old National’s financial results.
Technology and other changes now allow many customers to complete financial transactions without using banks. For example, consumers can pay bills and transfer funds directly without going through a bank. This process of eliminating banks as intermediaries could result in the loss of fee income, as well as the loss of customer deposits and income generated from those deposits. In addition, changes in consumer spending and savings habits could adversely affect Old National’s operations, and Old National may be unable to timely develop competitive new products and services in response to these changes.
Our earnings could be adversely impacted by incidences of fraud and compliance failure.
Financial institutions are inherently exposed to fraud risk. A fraud can be perpetrated by a customer of Old National, an employee, a vendor, or members of the general public. We are most subject to fraud and compliance risk in connection with the origination of loans, ACH transactions, wire transactions, ATM transactions, and checking transactions. Our largest fraud risk, associated with the origination of loans, includes the intentional misstatement of information in property appraisals or other underwriting documentation provided to us by third parties. Compliance risk is the risk that loans are not originated in compliance with applicable laws and regulations and our standards. There can be no assurance that we can prevent or detect acts of fraud or violation of law or our compliance standards by the third parties that we deal with. Repeated incidences of fraud or compliance failures would adversely impact the performance of our loan portfolio.
Risks Related to Old National’s Business
Acquisitions may not produce revenue enhancements or cost savings at levels or within timeframes originally anticipated and may result in unforeseen integration difficulties and dilution to existing shareholder value.
We have acquired, and expect to continue to acquire, other financial institutions or parts of those institutions in the future, and we may engage in de novo branch expansion. We may also consider and enter into new lines of business or offer new products or services.
We may incur substantial costs to expand, and we can give no assurance such expansion will result in the levels of profits we seek. There can be no assurance that integration efforts for any mergers or acquisitions will be successful. Also, we may issue equity securities in connection with acquisitions, which could cause ownership and economic dilution to our current shareholders. There is no assurance that, following any mergers or acquisitions, our integration efforts will be successful or that, after giving effect to the acquisition, we will achieve profits comparable to, or better than, our historical experience.
20
Table of Contents
Acquisitions and mergers involve a number of expenses and risks, including:
| • | the time and costs associated with identifying potential new markets, as well as acquisition and merger targets; |
| • | the accuracy of the estimates and judgments used to evaluate credit, operations, management and market risks with respect to the target institution; |
| • | the time and costs of evaluating new markets, hiring experienced local management and opening new offices, and the time lags between these activities and the generation of sufficient assets and deposits to support the costs of the expansion; |
| • | our ability to finance an acquisition and possible dilution to our existing shareholders; |
| • | the diversion of our management’s attention to the negotiation of a transaction, and the integration of the operations and personnel of the combined businesses; |
| • | entry into new markets where we lack experience; |
| • | the introduction of new products and services into our business; |
| • | the incurrence and possible impairment of goodwill associated with an acquisition and possible adverse short-term effects on our results of operations; |
| • | closing delays and increased expenses related to the resolution of lawsuits filed by shareholders of targets; and |
| • | the risk of loss of key employees and customers. |
Old National must generally receive federal regulatory approval before it can acquire a bank or bank holding company. Old National cannot be certain when or if, or on what terms and conditions, any required regulatory approvals will be granted. Old National may be required to sell banks or branches as a condition to receiving regulatory approval.
Future acquisitions could be material to Old National and it may issue additional shares of stock to pay for those acquisitions, which would dilute current shareholder’s ownership interests.
Economic conditions have affected and could continue to adversely affect our revenues and profits.
Old National’s financial performance generally, and in particular the ability of borrowers to pay interest on and repay principal of outstanding loans and the value of collateral securing those loans, as well as demand for loans and other products and services that Old National offers, is highly dependent upon the business environment in the markets where Old National operates and in the United States as a whole. A favorable business environment is generally characterized by, among other factors, economic growth, efficient capital markets, low inflation, low unemployment, high business and investor confidence, and strong business earnings. Unfavorable or uncertain economic and market conditions can be caused by declines in economic growth, business activity or investor or business confidence; limitations on the availability or increases in the cost of credit and capital; increases in inflation or interest rates; high unemployment, natural disasters, terrorist acts, or a combination of these or other factors.
The U.S. economy experienced growth during 2017, with increasing exports, jobs, and manufacturing production. Real GDP has increased, and unemployment is in line with a full-employment economy. However, if tighter financial conditions emerge, along with additional rate hikes by the Federal Reserve, there can be no assurance that the economy will not enter into another recession, whether in the near term or long term. An economic downturn or sustained, high unemployment levels, and stock market volatility may negatively impact our operating results and have a negative effect on the ability of our borrowers to make timely repayments of their loans increasing the risk of loan defaults and losses.
If Old National’s actual loan losses exceed Old National’s allowance for loan losses, Old National’s net income will decrease.
Old National makes various assumptions and judgments about the collectibility of Old National’s loan portfolio, including the creditworthiness of Old National’s borrowers and the value of the real estate and other assets serving as collateral for the repayment of Old National’s loans. Despite Old National’s underwriting and monitoring practices, the effect of a declining economy could negatively impact the ability of Old National’s borrowers to repay loans in a timely manner and could also negatively impact collateral values. As a result, Old National may experience significant loan losses that could have a material adverse effect on Old National’s operating results. Since Old National must use assumptions regarding individual loans and the economy, Old National’s current
21
Table of Contents
allowance for loan losses may not be sufficient to cover actual loan losses. Old National’s assumptions may not anticipate the severity or duration of the current credit cycle; and Old National may need to significantly increase Old National’s provision for losses on loans if one or more of Old National’s larger loans or credit relationships becomes delinquent or if Old National expands its commercial real estate and commercial lending. In addition, federal and state regulators periodically review Old National’s allowance for loan losses and may require Old National to increase the provision for loan losses or recognize loan charge-offs. Material additions to Old National’s allowance would materially decrease Old National’s net income. There can be no assurance that Old National’s monitoring procedures and policies will reduce certain lending risks or that Old National’s allowance for loan losses will be adequate to cover actual losses.
Old National’s loan portfolio includes loans with a higher risk of loss.
Old National Bank originates commercial real estate loans, commercial loans, agricultural real estate loans, agricultural loans, consumer loans, and residential real estate loans primarily within Old National’s market areas. Commercial real estate, commercial, consumer, and agricultural real estate and operating loans may expose a lender to greater credit risk than loans secured by residential real estate because the collateral securing these loans may not be sold as easily as residential real estate. These loans also have greater credit risk than residential real estate for the following reasons:
| • | Commercial Real Estate Loans. Repayment is dependent upon income being generated in amounts sufficient to cover operating expenses and debt service. |
| • | Commercial Loans. Repayment is dependent upon the successful operation of the borrower’s business. |
| • | Consumer Loans. Consumer loans (such as personal lines of credit) are collateralized, if at all, with assets that may not provide an adequate source of payment of the loan due to depreciation, damage, or loss. |
| • | Agricultural Loans. Repayment is dependent upon the successful operation of the business, which is greatly dependent on many things outside the control of either Old National Bank or the borrowers. These factors include weather, input costs, commodity and land prices, and interest rates. |
Our wholesale funding sources may prove insufficient to replace deposits or support our future growth.
As a part of our liquidity management, we use a number of funding sources in addition to core deposit growth and repayments and maturities of loans and investments. These sources include brokered certificates of deposit, repurchase agreements, and federal funds purchased. Negative operating results or changes in industry conditions could lead to an inability to replace these additional funding sources at maturity. Our financial flexibility could be constrained if we are unable to maintain our access to funding or if adequate financing is not available to accommodate future growth at acceptable interest rates. Finally, if we are required to rely more heavily on more expensive funding sources to support future growth, our revenues may not increase proportionately to cover our costs. In this case, our results of operations and financial condition would be negatively affected.
Our accounting estimates and risk management processes rely on analytical and forecasting models.
The processes that we use to estimate probable loan losses and to measure the fair value of financial instruments, as well as the processes used to estimate the effects of changing interest rates and other market measures on our financial condition and results of operations, depend upon the use of analytical and forecasting models. These models reflect assumptions that may not be accurate, particularly in times of market stress or other unforeseen circumstances. Even if these assumptions are adequate, the models may prove to be inadequate or inaccurate because of other flaws in their design or their implementation. If our models for determining interest rate risk and asset-liability management are inadequate, we may incur increased or unexpected losses upon changes in market interest rates or other market measures. If our models for determining probable loan losses are inadequate, the allowance for loan losses may not be sufficient to support future charge-offs. If our models to measure the fair value of financial instruments are inadequate, the fair value of such financial instruments may fluctuate unexpectedly or may not accurately reflect what we could realize upon sale or settlement of such financial instruments. Any such failure in our analytical or forecasting models could have a material adverse effect on our business, financial condition, and results of operations.
22
Table of Contents
If Old National forecloses on collateral property, Old National may be subject to the increased costs associated with the ownership of real property, resulting in reduced revenues.
Old National may have to foreclose on collateral property to protect Old National’s investment and may thereafter own and operate such property, in which case Old National will be exposed to the risks inherent in the ownership of real estate. The amount that Old National, as a mortgagee, may realize after a default is dependent upon factors outside of Old National’s control, including, but not limited to: (i) general or local economic conditions; (ii) neighborhood values; (iii) interest rates; (iv) real estate tax rates; (v) operating expenses of the mortgaged properties; (vi) environmental remediation liabilities; (vii) ability to obtain and maintain adequate occupancy of the properties; (viii) zoning laws; (ix) governmental rules, regulations and fiscal policies; and (x) acts of God. Certain expenditures associated with the ownership of real estate, principally real estate taxes, insurance, and maintenance costs, may adversely affect the income from the real estate. Therefore, the cost of operating real property may exceed the income earned from such property, and Old National may have to advance funds in order to protect Old National’s investment, or Old National may be required to dispose of the real property at a loss. The foregoing expenditures and costs could adversely affect Old National’s ability to generate revenues, resulting in reduced levels of profitability.
Old National operates in an extremely competitive market, and Old National’s business will suffer if Old National is unable to compete effectively.
In our market area, Old National encounters significant competition from other commercial banks, savings and loan associations, credit unions, mortgage banking firms, consumer finance companies, securities brokerage firms, insurance companies, money market mutual funds, and other financial intermediaries. In addition, FinTech start-ups are emerging in key areas of banking. Our competitors may have substantially greater resources and lending limits than Old National does and may offer services that Old National does not or cannot provide. Many of our nonfinancial institution competitors have fewer regulatory constraints, broader geographic service areas, and, in some cases, lower cost structures. Old National’s profitability depends upon Old National’s continued ability to compete successfully in Old National’s market area.
Our business could suffer if we fail to attract and retain skilled people.
Our success depends, in large part, on its ability to attract and retain key people. Competition for the best people in most activities we engage in can be intense. We may not be able to hire the best people or to keep them. The loss of any of our key personnel or an inability to continue to attract, retain, and motivate key personnel could adversely affect our business.
We have risk related to legal proceedings.
We are involved in judicial, regulatory, and arbitration proceedings concerning matters arising from our business activities and fiduciary responsibilities. We establish reserves for legal claims when payments associated with the claims become probable and the costs can be reasonably estimated. We may still incur legal costs for a matter even if we have not established a reserve. In addition, the actual cost of resolving a legal claim may be substantially higher than any amounts reserved for that matter. The ultimate resolution of a pending or future legal proceeding, depending on the remedy sought and granted, could materially adversely affect our results of operations and financial condition.
Risks Related to Old National’s Stock
We may not be able to pay dividends in the future in accordance with past practice.
Old National has traditionally paid a quarterly dividend to common stockholders. The payment of dividends is subject to legal and regulatory restrictions. Any payment of dividends in the future will depend, in large part, on Old National’s earnings, capital requirements, financial condition, and other factors considered relevant by Old National’s Board of Directors.
Old National is an entity separate and distinct from Old National Bank. Old National Bank conducts most of our operations and Old National depends upon dividends from Old National Bank to service its debt and to pay dividends to Old National’s shareholders. The availability of dividends from Old National Bank is limited by various statutes and regulations. It is possible, depending upon the financial condition including liquidity and
23
Table of Contents
capital adequacy of Old National Bank and other factors, that the OCC could assert that the payment of dividends or other payments is an unsafe or unsound practice. In addition, the payment of dividends by our other subsidiaries is also subject to the laws of the subsidiary’s state of incorporation, and regulatory capital and liquidity requirements applicable to such subsidiaries. At December 31, 2017, Old National Bank could pay dividends of $47.1 million without prior regulatory approval. In the event that Old National Bank was unable to pay dividends to us, we in turn would likely have to reduce or stop paying dividends on our Common Stock. Our failure to pay dividends on our Common Stock could have a material adverse effect on the market price of our Common Stock. See “Business – Supervision and Regulation – Dividend Limitations” and Note 24 to the consolidated financial statements.
The price of Old National’s Common Stock may be volatile, which may result in losses for investors.
General market price declines or market volatility in the future could adversely affect the price of Old National’s Common Stock. In addition, the following factors may cause the market price for shares of Old National’s Common Stock to fluctuate:
| • | announcements of developments related to Old National’s business; |
| • | fluctuations in Old National’s results of operations; |
| • | sales or purchases of substantial amounts of Old National’s securities in the marketplace; |
| • | general conditions in Old National’s banking niche or the worldwide economy; |
| • | a shortfall or excess in revenues or earnings compared to securities analysts’ expectations; |
| • | changes in analysts’ recommendations or projections; and |
| • | Old National’s announcement of new acquisitions or other projects. |
As previously noted, the Dodd-Frank Act and its implementing regulations impose various additional requirements on bank holding companies with $10 billion or more in total assets, including compliance with portions of the Federal Reserve’s enhanced prudential oversight requirements and annual stress testing requirements. Compliance with the annual stress testing requirements, part of which must be publicly disclosed, may also be negatively interpreted by the market generally or our customers and, as a result, may adversely affect our stock price or our ability to retain our customers or effectively compete for new business opportunities.
| ITEM 1B. | UNRESOLVED STAFF COMMENTS |
None.
| ITEM 2. | PROPERTIES |
As of December 31, 2017, Old National and its affiliates operated a total of 191 banking centers, primarily in the states of Indiana, Kentucky, Michigan, Wisconsin, and Minnesota. Of these facilities, 120 were owned. We lease 71 banking centers from unaffiliated third parties. The terms of these leases range from two years and six months to twenty-five years. See Note 7 to the consolidated financial statements.
Impacting the number of Old National’s banking centers in 2017 was the acquisition of Anchor (MN) (17 banking centers) and the consolidation of 29 banking centers throughout the franchise.
Old National also has several administrative offices located throughout its footprint, including the executive offices of Old National which are located at 1 Main Street, Evansville, Indiana. This building, which was previously leased, was purchased in 2016.
| ITEM 3. | LEGAL PROCEEDINGS |
In the normal course of business, Old National and its subsidiaries have been named, from time to time, as defendants in various legal actions. Certain of the actual or threatened legal actions may include claims for substantial compensatory and/or punitive damages or claims for indeterminate amounts of damages.
Old National contests liability and/or the amount of damages as appropriate in each pending matter. In view of the inherent difficulty of predicting the outcome of such matters, particularly in cases where claimants seek substantial or indeterminate damages or where investigations and proceedings are in the early stages, Old National cannot predict with certainty the loss or range of loss, if any, related to such matters, how or if such matters will be resolved, when they will ultimately be resolved, or what the eventual settlement, or other relief, if any, might be.
24
Table of Contents
Subject to the foregoing, Old National believes, based on current knowledge and after consultation with counsel, that the outcome of such pending matters will not have a material adverse effect on the consolidated financial condition of Old National, although the outcome of such matters could be material to Old National’s operating results and cash flows for a particular future period, depending on, among other things, the level of Old National’s revenues or income for such period. Old National will accrue for a loss contingency if (1) it is probable that a future event will occur and confirm the loss and (2) the amount of the loss can be reasonably estimated.
Old National is not currently involved in any material litigation.
| ITEM 4. | MINE SAFETY DISCLOSURES |
Not applicable.
25
Table of Contents
PART II
| ITEM 5. | MARKET FOR REGISTRANT’S COMMON EQUITY, RELATED STOCKHOLDER MATTERS AND ISSUER PURCHASES OF EQUITY SECURITIES |
Old National’s Common Stock is traded on the NASDAQ under the ticker symbol ONB. The following table lists the high and low closing sales prices as reported by the NASDAQ, share volume, and dividend data for 2017 and 2016:
| Price Per Share | Share Volume |
Dividend Declared |
||||||||||||||
| High | Low | |||||||||||||||
| 2017 |
||||||||||||||||
| First Quarter |
$ | 18.90 | $ | 16.60 | 44,867,619 | $ | 0.13 | |||||||||
| Second Quarter |
17.60 | 15.80 | 59,583,275 | 0.13 | ||||||||||||
| Third Quarter |
18.30 | 15.55 | 45,933,639 | 0.13 | ||||||||||||
| Fourth Quarter |
18.75 | 16.90 | 48,719,404 | 0.13 | ||||||||||||
| 2016 |
||||||||||||||||
| First Quarter |
$ | 13.18 | $ | 10.85 | 72,116,846 | $ | 0.13 | |||||||||
| Second Quarter |
13.40 | 11.64 | 72,798,438 | 0.13 | ||||||||||||
| Third Quarter |
14.16 | 12.08 | 48,908,322 | 0.13 | ||||||||||||
| Fourth Quarter |
18.35 | 13.80 | 51,422,870 | 0.13 | ||||||||||||
There were 43,684 shareholders of record as of December 31, 2017. Old National declared cash dividends of $0.52 per share during the years ended December 31, 2017 and 2016. Old National’s ability to pay cash dividends depends primarily on cash dividends received from Old National Bank. Dividend payments from Old National Bank are subject to various regulatory restrictions. See Note 24 to the consolidated financial statements for additional information.
The following table summarizes the purchases of equity securities made by Old National during the fourth quarter of 2017:
| Period |
Total Number of Shares Purchased |
Average Price Paid Per Share |
Total Number of Shares Purchased as Part of Publicly Announced Plans or Programs |
Maximum Number of Shares that May Yet Be Purchased Under the Plans or Programs |
||||||||||||
| 10/01/17 - 10/31/17 |
2,095 | $ | 18.55 | — | — | |||||||||||
| 11/01/17 - 11/30/17 |
236 | 18.05 | — | — | ||||||||||||
| 12/01/17 - 12/31/17 |
53 | 18.25 | — | — | ||||||||||||
|
|
|
|
|
|
|
|
|
|||||||||
| Total |
2,384 | $ | 18.49 | — | — | |||||||||||
|
|
|
|
|
|
|
|
|
|||||||||
The Board of Directors did not authorize a stock repurchase plan for 2017. During the twelve months ended December 31, 2017, Old National repurchased a limited number of shares associated with employee share-based incentive programs.
On January 25, 2018, the Board of Directors declared a quarterly cash dividend of $0.13 per common share. The Board of Directors did not authorize a stock repurchase plan for 2018.
26
Table of Contents
EQUITY COMPENSATION PLAN INFORMATION
The following table contains information concerning the 2008 Equity Incentive Plan approved by security holders, as of December 31, 2017.
| Number of securities to be issued upon exercise of outstanding options, warrants, and rights |
Weighted-average exercise price of outstanding options, warrants, and rights |
Number of securities remaining available for future issuance under equity compensation plans (excluding securities reflected in column (a)) |
||||||||||
| Plan Category |
(a) | (b) | (c) | |||||||||
| Equity compensation plans approved by security holders |
1,480,548 | $ | 13.67 | 4,766,750 | ||||||||
| Equity compensation plans not approved by security holders |
— | — | — | |||||||||
|
|
|
|
|
|
|
|||||||
| Total |
1,480,548 | $ | 13.67 | 4,766,750 | ||||||||
|
|
|
|
|
|
|
|||||||
At December 31, 2017, 4.8 million shares remain available for issuance under the 2008 Equity Incentive Plan.
27
Table of Contents
The following table compares cumulative five-year total shareholder returns, assuming reinvestment of dividends, for our common stock to cumulative total returns of a broad-based equity market index and two published industry indices. The comparison of shareholder returns (change in December year end stock price plus reinvested dividends) for each of the periods assumes that $100 was invested on December 31, 2012, in common stock of each of the Company, the S&P Small Cap 600 Index, the NYSE Financial Index and the SNL Bank and Thrift Index with investment weighted on the basis of market capitalization.
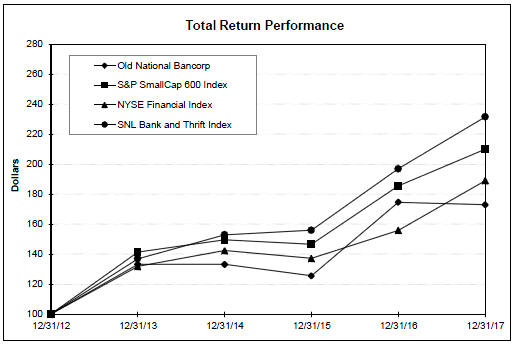
28
Table of Contents
| ITEM 6. | SELECTED FINANCIAL DATA |
| (dollars in thousands, except per share data) |
2017 | 2016 | 2015 | 2014 | 2013 | |||||||||||||||
| Operating Results |
||||||||||||||||||||
| Net interest income |
$ | 437,168 | $ | 402,703 | $ | 366,116 | $ | 366,370 | $ | 317,424 | ||||||||||
| Conversion to fully taxable equivalent (1) |
23,091 | 21,293 | 19,543 | 16,999 | 16,876 | |||||||||||||||
|
|
|
|
|
|
|
|
|
|
|
|||||||||||
| Net interest income—tax equivalent basis |
460,259 | 423,996 | 385,659 | 383,369 | 334,300 | |||||||||||||||
| Provision for loan losses |
3,050 | 960 | 2,923 | 3,097 | (2,319 | ) | ||||||||||||||
| Noninterest income |
183,382 | 252,830 | 230,632 | 165,129 | 184,758 | |||||||||||||||
| Noninterest expense |
448,836 | 454,147 | 430,932 | 386,438 | 361,984 | |||||||||||||||
| Net income |
95,725 | 134,264 | 116,716 | 103,667 | 100,920 | |||||||||||||||
| Common Share Data (2) |
||||||||||||||||||||
| Weighted average diluted shares |
138,513 | 128,301 | 116,255 | 108,365 | 101,198 | |||||||||||||||
| Net income (diluted) |
$ | 0.69 | $ | 1.05 | $ | 1.00 | $ | 0.95 | $ | 1.00 | ||||||||||
| Cash dividends |
0.52 | 0.52 | 0.48 | 0.44 | 0.40 | |||||||||||||||
| Common dividend payout ratio (3) |
75 | % | 50 | % | 48 | % | 46 | % | 40 | % | ||||||||||
| Book value at year-end |
14.17 | $ | 13.42 | $ | 13.05 | $ | 12.54 | $ | 11.64 | |||||||||||
| Stock price at year-end |
17.45 | 18.15 | 13.56 | 14.88 | 15.37 | |||||||||||||||
| Balance Sheet Data (at December 31) |
||||||||||||||||||||
| Loans (4) |
$ | 11,136,051 | $ | 9,101,194 | $ | 6,962,215 | $ | 6,531,691 | $ | 5,090,669 | ||||||||||
| Total assets |
17,518,292 | 14,860,237 | 11,991,527 | 11,646,051 | 9,581,744 | |||||||||||||||
| Deposits |
12,605,764 | 10,743,253 | 8,400,860 | 8,490,664 | 7,210,903 | |||||||||||||||
| Borrowings |
2,578,204 | 2,152,086 | 1,920,246 | 1,469,911 | 1,018,720 | |||||||||||||||
| Shareholders’ equity |
2,154,397 | 1,814,417 | 1,491,170 | 1,465,764 | 1,162,640 | |||||||||||||||
| Performance Ratios |
||||||||||||||||||||
| Return on average assets |
0.63 | % | 0.98 | % | 0.98 | % | 0.99 | % | 1.05 | % | ||||||||||
| Return on average common shareholders’ equity |
4.98 | 7.84 | 7.88 | 7.91 | 8.54 | |||||||||||||||
| Net interest margin (5) |
3.48 | 3.58 | 3.72 | 4.22 | 4.02 | |||||||||||||||
| Efficiency ratio (5) |
68.87 | 65.82 | 68.65 | 70.03 | 68.61 | |||||||||||||||
| Asset Quality (6) |
||||||||||||||||||||
| Net charge-offs (recoveries) to average loans |
0.03 | % | 0.04 | % | (0.02 | )% | 0.04 | % | 0.10 | % | ||||||||||
| Allowance for loan losses to ending loans |
0.45 | 0.55 | 0.75 | 0.76 | 0.93 | |||||||||||||||
| Allowance for loan losses |
$ | 50,381 | $ | 49,808 | $ | 52,233 | $ | 47,849 | $ | 47,145 | ||||||||||
| Underperforming assets (7) |
154,220 | 164,657 | 160,072 | 170,535 | 165,656 | |||||||||||||||
| Allowance for loan losses to nonaccrual loans (8) |
40.33 | % | 37.90 | % | 39.46 | % | 33.97 | % | 36.71 | % | ||||||||||
| Other Data |
||||||||||||||||||||
| Full-time equivalent employees |
2,801 | 2,733 | 2,652 | 2,938 | 2,608 | |||||||||||||||
| Banking centers |
191 | 203 | 160 | 195 | 169 | |||||||||||||||
| (1) | Calculated using the federal statutory tax rate in effect of 35% for all periods. |
| (2) | Diluted data assumes the exercise of stock options and the vesting of restricted stock. |
| (3) | Cash dividends per share divided by net income per share (basic). |
| (4) | Includes loans held for sale. |
| (5) | Represents a non-GAAP financial measure. Refer to the “Non-GAAP Financial Measures” section of Item 7, “Management’s Discussion and Analysis of Financial Condition and Results of Operations” for reconciliations to GAAP financial measures. |
| (6) | Excludes loans held for sale. |
| (7) | Includes nonaccrual loans, renegotiated loans, loans 90 days past due still accruing and other real estate owned. Includes $12.4 million, $24.4 million, and $45.5 million of covered assets in 2015, 2014, and 2013, respectively, acquired in an FDIC assisted transaction, which were covered by loss sharing agreements with the FDIC providing for specified loss protection. On June 22, 2016, Old National entered into an early termination agreement with the FDIC that terminated all loss share agreements. |
| (8) | Includes approximately $12.6 million, $16.7 million, $15.9 million, $41.2 million, and $38.3 million for 2017, 2016, 2015, 2014, and 2013, respectively, of purchased credit impaired loans that are categorized as nonaccrual because the collection of principal or interest is doubtful. These loans are accounted for under FASB ASC 310-30 and accordingly treated as performing assets. |
29
Table of Contents
ITEM 7. MANAGEMENT’S DISCUSSION AND ANALYSIS OF FINANCIAL CONDITION AND RESULTS OF OPERATIONS
| Page | ||||
| 31 | ||||
| 31 | ||||
| 31 | ||||
| 33 | ||||
| 34 | ||||
| 35 | ||||
| 43 | ||||
| 48 | ||||
| 58 | ||||
| Contractual Obligations, Commitments, and Contingent Liabilities |
59 | |||
| 60 | ||||
30
Table of Contents
The following discussion is an analysis of our results of operations for the fiscal years ended December 31, 2017, 2016, and 2015, and financial condition as of December 31, 2017 and 2016. This discussion and analysis should be read in conjunction with our consolidated financial statements and related notes. This discussion contains forward-looking statements concerning our business. Readers are cautioned that, by their nature, forward-looking statements are based on estimates and assumptions and are subject to risks, uncertainties, and other factors. Actual results may differ materially from our expectations that are expressed or implied by any forward-looking statement. The discussion in Item 1A, “Risk Factors,” lists some of the factors that could cause our actual results to vary materially from those expressed or implied by any forward-looking statements, and such discussion is incorporated into this discussion by reference.
Old National is the largest financial holding company incorporated in the state of Indiana and maintains its principal executive offices in Evansville, Indiana. Old National, through Old National Bank, provides a wide range of services, including commercial and consumer loan and depository services, and other traditional banking services. Old National also provides services to supplement the traditional banking business including fiduciary and wealth management services, investment and brokerage services, investment consulting, and other financial services.
Our basic mission is to be THE community bank in the cities and towns we serve. We focus on establishing and maintaining long-term relationships with customers, and are committed to serving the financial needs of the communities in our market area. Old National provides financial services primarily in Indiana, Kentucky, Michigan, Wisconsin, and Minnesota.
CORPORATE DEVELOPMENTS IN FISCAL 2017
In 2017, we expanded our footprint into the state of Minnesota through our acquisition of Anchor (MN). In addition to our entry into this new market, management remained keenly focused on organic growth and efficiency efforts. This is evidenced by the following 2017 highlights:
| • | organic loan growth of almost 5% (including loans held for sale), organic commercial and commercial real estate loan growth of 10%; |
| • | cost of total deposits increased just two basis points to 0.19%; |
| • | credit quality metrics remain strong, with net charge-offs to average loans of 0.03%; |
| • | noninterest expenses remained well controlled, decreasing to $448.8 million; and |
| • | the on-going assessment of our service and delivery network, resulting in the consolidation of 29 banking centers in 2017. |
Net interest income increased to $437.2 million, or 9%, from $402.7 million in 2016 and noninterest expenses remained well controlled, decreasing to $448.8 million from $454.1 million in 2016. Noninterest income decreased to $183.4 million in 2017 from $252.8 million in 2016 primarily due to a $41.9 million gain and lower insurance premiums and commissions in 2016 resulting from the sale of ONI in May 2016, partially offset by higher wealth management fees, investment product fees, and capital markets income in 2017. Net income for 2017 was $95.7 million, compared to 2016 net income of $134.3 million. Diluted earnings per share were $0.69 per share in 2017, compared to $1.05 per share in 2016. Net income in 2017 included $39.3 million of additional tax expense recorded in December 2017 to estimate the revaluation of Old National’s deferred tax assets due to the lowering of the federal corporate tax rate to 21%.
The U.S. economy experienced growth during 2017, with increasing exports, jobs, and manufacturing production. Real GDP has increased, and unemployment is in line with a full-employment economy. Short-term interest rates increased 75 basis points in 2017 as the Federal Reserve increased the discount rate 25 basis points at their March, June, and December meetings. The rate increases were driven by the Federal Reserve’s inflation and wage pressure expectations in conjunction with a moderately expanding economy. Additional rate increases in 2018 will benefit Old National as our assets tend to re-price faster and with more margin than our liabilities. In addition, Old National’s dominant market share in many of the communities in which we serve will become more valuable as deposits typically cost less than other types of funding. Of note, while many short-term rates (i.e., Federal Funds, LIBOR, and Prime) are now hovering near decade highs, while the yield curve itself remains stubbornly flat (e.g. key yield curve spreads are near decade lows) – a dichotomy that we continue to monitor for its implications to both the U.S. economy and our balance sheet positioning.
31
Table of Contents
In the regulatory environment, we note several key appointments were either confirmed or announced in 2017 and early 2018, including new heads of the Federal Reserve, OCC, FDIC, CFPB, and SEC. The impact of these changes is expected to have the most direct impact on our larger bank competitors. However, we believe there will be a shift in regulatory approach that is a compromise between a size-based and a principles-based approach.
Our focus for 2018 remains basic banking – loan growth, fee-based income, and expense management.
The impact of the tax reform bill will have a positive two-fold impact for Old National. First for our clients as an expected uptick in technology investments, inventory expansion, and other capital expenditures resulting in loan growth and second, for our shareholders, in the way of increased earnings as a result of reduced corporate taxes that management will evaluate using a longer time horizon. This anticipated loan growth will be supported by the strength of our low-cost core deposit franchise. While we do not see any major adverse cyclical shifts in our loan portfolios, we will remain diligent to our risk profile and underwriting standards.
Our fee-based business continues to take advantage of the rising market and strong sales production. We expect this trend to continue and further build out these fee-based product sets in our Minnesota market.
We will continue to invest and focus on improving the client experience and reducing our operating cost at the same time by enhancing technology and processes. As we adapt to changing customer behaviors, we will continue to evaluate our franchise for additional consolidation opportunities in 2018.
Our appetite for future partnerships is such that we remain an active looker and a selective, disciplined buyer. We believe our ability to bring a larger balance sheet with better capital and an enhanced product set allows a potential new market partner to better serve their clients. However, given the quality Old National franchise that exists today, we do not feel compelled to enter into a partnership.
We remain optimistic as we look ahead to 2018 given the strength of our franchise and remain diligent on growing our pretax pre-provisioned income as well as continuing our expense discipline. We are reaffirming our commitment to driving and sustaining positive operating leverage.
32
Table of Contents
The following table sets forth certain financial highlights of Old National:
| Three Months Ended | Years Ended | |||||||||||||||||||
| (dollars and shares in thousands, except per share data) |
December 31, | September 30, | December 31, | December 31, | ||||||||||||||||
| 2017 | 2017 | 2016 | 2017 | 2016 | ||||||||||||||||
| Income Statement: |
||||||||||||||||||||
| Net interest income |
$ | 118,556 | $ | 108,478 | $ | 109,917 | $ | 437,168 | $ | 402,703 | ||||||||||
| Taxable equivalent adjustment (1) |
6,139 | 5,621 | 5,506 | 23,091 | 21,293 | |||||||||||||||
| Provision for loan losses |
1,037 | 311 | (1,756 | ) | 3,050 | 960 | ||||||||||||||
| Noninterest income |
44,825 | 46,366 | 62,751 | 183,382 | 252,830 | |||||||||||||||
| Noninterest expense |
140,432 | 103,702 | 126,258 | 448,836 | 454,147 | |||||||||||||||
| Net income (loss) |
(18,493 | ) | 39,372 | 33,456 | 95,725 | 134,264 | ||||||||||||||
| Common Share Data: |
||||||||||||||||||||
| Weighted average diluted shares |
146,875 | 135,796 | 135,383 | 138,513 | 128,301 | |||||||||||||||
| Net income (loss) (diluted) |
$ | (0.13 | ) | $ | 0.29 | $ | 0.25 | $ | 0.69 | $ | 1.05 | |||||||||
| Cash dividends |
0.13 | 0.13 | 0.13 | $ | 0.52 | $ | 0.52 | |||||||||||||
| Common dividend payout ratio (2) |
N/M | 43 | % | 52 | % | 75 | % | 50 | % | |||||||||||
| Book value |
$ | 14.17 | $ | 14.07 | $ | 13.42 | $ | 14.17 | $ | 13.42 | ||||||||||
| Stock price |
17.45 | 18.30 | 18.15 | 17.45 | 18.15 | |||||||||||||||
| Tangible common book value (3) |
8.37 | 9.02 | 8.30 | 8.37 | 8.30 | |||||||||||||||
| Performance Ratios: |
||||||||||||||||||||
| Return on average assets |
(0.45 | )% | 1.05 | % | 0.91 | % | 0.63 | % | 0.98 | % | ||||||||||
| Return on average common equity |
(3.51 | ) | 8.31 | 7.33 | 4.98 | 7.84 | ||||||||||||||
| Return on tangible common equity (3) |
(5.12 | ) | 13.44 | 12.68 | 8.12 | 12.69 | ||||||||||||||
| Return on average tangible common equity (3) |
(5.05 | ) | 13.58 | 12.57 | 8.59 | 13.73 | ||||||||||||||
| Net interest margin (3) |
3.47 | 3.52 | 3.63 | 3.48 | 3.58 | |||||||||||||||
| Efficiency ratio (3) |
81.60 | 64.17 | 69.53 | 68.87 | 65.82 | |||||||||||||||
| Net charge-offs (recoveries) to average loans |
0.03 | 0.05 | — | 0.03 | 0.04 | |||||||||||||||
| Allowance for loan losses to ending loans |
0.45 | 0.53 | 0.55 | 0.45 | 0.55 | |||||||||||||||
| Non-performing loans to ending loans |
1.30 | 1.46 | 1.62 | 1.30 | 1.62 | |||||||||||||||
| Balance Sheet: |
||||||||||||||||||||
| Total loans |
$ | 11,118,121 | $ | 9,398,124 | $ | 9,010,512 | $ | 11,118,121 | $ | 9,010,512 | ||||||||||
| Total assets |
17,518,292 | 15,065,800 | $ | 14,860,237 | 17,518,292 | 14,860,237 | ||||||||||||||
| Total deposits |
12,605,764 | 10,606,784 | 10,743,253 | 12,605,764 | 10,743,253 | |||||||||||||||
| Total borrowed funds |
2,578,204 | 2,411,111 | 2,152,086 | 2,578,204 | 2,152,086 | |||||||||||||||
| Total shareholders’ equity |
2,154,397 | 1,906,823 | 1,814,417 | 2,154,397 | 1,814,417 | |||||||||||||||
| Nonfinancial Data: |
||||||||||||||||||||
| Full-time equivalent employees |
2,801 | 2,592 | 2,733 | 2,801 | 2,733 | |||||||||||||||
| Banking centers |
191 | 188 | 203 | 191 | 203 | |||||||||||||||
N/M = Not meaningful
| (1) | Calculated using the federal statutory tax rate in effect of 35% for all periods. |
| (2) | Cash dividends per share divided by net income per share (basic). |
| (3) | Represents a non-GAAP financial measure. Refer to the “Non-GAAP Financial Measures” section for reconciliations to GAAP financial measures. |
33
Table of Contents
Non-GAAP financial measures exclude certain items that are included in the financial results presented in accordance with GAAP. Management believes these non-GAAP financial measures enhance an investor’s understanding of the financial results of Old National by providing a meaningful basis for period-to-period comparisons, assisting in operating results analysis, and predicting future performance.
The following table presents GAAP to non-GAAP reconciliations.
| (dollars and shares in thousands, | Three Months Ended December 31, |
Years Ended December 31, |
||||||||||||||
| except per share data) |
2017 | 2016 | 2017 | 2016 | ||||||||||||
| Tangible common book value: |
||||||||||||||||
| Shareholders’ equity (GAAP) |
$ | 2,154,397 | $ | 1,814,417 | $ | 2,154,397 | $ | 1,814,417 | ||||||||
| Deduct: Goodwill |
828,051 | 655,018 | 828,051 | 655,018 | ||||||||||||
| Intangible assets |
53,096 | 37,677 | 53,096 | 37,677 | ||||||||||||
|
|
|
|
|
|
|
|
|
|||||||||
| Tangible shareholders’ equity (non-GAAP) |
$ | 1,273,250 | $ | 1,121,722 | $ | 1,273,250 | $ | 1,121,722 | ||||||||
|
|
|
|
|
|
|
|
|
|||||||||
| Period end common shares |
152,040 | 135,159 | 152,040 | 135,159 | ||||||||||||
| Tangible common book value |
8.37 | 8.30 | 8.37 | 8.30 | ||||||||||||
| Return on tangible common equity: |
||||||||||||||||
| Net income (GAAP) |
$ | (18,493 | ) | $ | 33,456 | $ | 95,725 | $ | 134,264 | |||||||
| Add: Intangible amortization (net of tax) |
2,210 | 2,107 | 7,697 | 8,116 | ||||||||||||
|
|
|
|
|
|
|
|
|
|||||||||
| Tangible net income (non-GAAP) |
$ | (16,283 | ) | $ | 35,563 | $ | 103,422 | $ | 142,380 | |||||||
|
|
|
|
|
|
|
|
|
|||||||||
| Tangible shareholders’ equity (non-GAAP) (see above) |
$ | 1,273,250 | $ | 1,121,722 | $ | 1,273,250 | $ | 1,121,722 | ||||||||
| Return on tangible common equity |
(5.12 | )% | 12.68 | % | 8.12 | % | 12.69 | % | ||||||||
| Return on average tangible common equity: |
||||||||||||||||
| Tangible net income (non-GAAP) (see above) |
$ | (16,283 | ) | $ | 35,563 | $ | 103,422 | $ | 142,380 | |||||||
| Average shareholders’ equity (GAAP) |
$ | 2,104,646 | $ | 1,825,993 | $ | 1,923,645 | $ | 1,712,574 | ||||||||
| Deduct: Average goodwill |
776,862 | 655,041 | 685,729 | 635,440 | ||||||||||||
| Average intangible assets |
37,802 | 39,239 | 34,392 | 40,317 | ||||||||||||
|
|
|
|
|
|
|
|
|
|||||||||
| Average tangible shareholders’ equity (non-GAAP) |
$ | 1,289,982 | $ | 1,131,713 | $ | 1,203,524 | $ | 1,036,817 | ||||||||
|
|
|
|
|
|
|
|
|
|||||||||
| Return on average tangible common equity |
(5.05 | )% | 12.57 | % | 8.59 | % | 13.73 | % | ||||||||
| Net interest margin: |
||||||||||||||||
| Net interest income (GAAP) |
$ | 118,556 | $ | 109,917 | $ | 437,168 | $ | 402,703 | ||||||||
| Taxable equivalent adjustment |
6,139 | 5,506 | 23,091 | 21,293 | ||||||||||||
|
|
|
|
|
|
|
|
|
|||||||||
| Net interest income - taxable equivalent basis (non-GAAP) |
$ | 124,695 | $ | 115,423 | $ | 460,259 | $ | 423,996 | ||||||||
|
|
|
|
|
|
|
|
|
|||||||||
| Average earning assets |
$ | 14,389,502 | $ | 12,713,345 | $ | 13,237,906 | $ | 11,840,967 | ||||||||
| Net interest margin |
3.47 | % | 3.63 | % | 3.48 | % | 3.58 | % | ||||||||
| Efficiency ratio: |
||||||||||||||||
| Noninterest expense (GAAP) |
$ | 140,432 | $ | 126,258 | $ | 448,836 | $ | 454,147 | ||||||||
| Deduct: Intangible amortization expense |
3,399 | 3,241 | 11,841 | 12,486 | ||||||||||||
|
|
|
|
|
|
|
|
|
|||||||||
| Adjusted noninterest expense (non-GAAP) |
$ | 137,033 | $ | 123,017 | $ | 436,995 | $ | 441,661 | ||||||||
|
|
|
|
|
|
|
|
|
|||||||||
| Net interest income - taxable equivalent basis (non-GAAP) (see above) |
$ | 124,695 | $ | 115,423 | $ | 460,259 | $ | 423,996 | ||||||||
| Noninterest income |
44,825 | 62,751 | 183,382 | 252,830 | ||||||||||||
| Deduct: Net securities gains (losses) |
1,588 | 1,239 | 9,135 | 5,848 | ||||||||||||
|
|
|
|
|
|
|
|
|
|||||||||
| Adjusted total revenue (non-GAAP) |
$ | 167,932 | $ | 176,935 | $ | 634,506 | $ | 670,978 | ||||||||
|
|
|
|
|
|
|
|
|
|||||||||
| Efficiency ratio |
81.60 | % | 69.53 | % | 68.87 | % | 65.82 | % | ||||||||
34
Table of Contents
Non-GAAP financial measures have inherent limitations, are not required to be uniformly applied, and are not audited. Although these non-GAAP financial measures are frequently used by investors to evaluate a company, they have limitations as analytical tools, and should not be considered in isolation, or as a substitute for analyses of results as reported under GAAP. These non-GAAP measures are not necessarily comparable to similar measures that may be represented by other companies.
The following table sets forth certain income statement information of Old National for the years ended December 31, 2017, 2016, and 2015:
| Years Ended December 31, | ||||||||||||
| (dollars in thousands) |
2017 | 2016 | 2015 | |||||||||
| Income Statement Summary: |
||||||||||||
| Net interest income |
$ | 437,168 | $ | 402,703 | $ | 366,116 | ||||||
| Provision for loan losses |
3,050 | 960 | 2,923 | |||||||||
| Noninterest income |
183,382 | 252,830 | 230,632 | |||||||||
| Noninterest expense |
448,836 | 454,147 | 430,932 | |||||||||
| Other Data: |
||||||||||||
| Return on average common equity |
4.98 | % | 7.84 | % | 7.88 | % | ||||||
| Return on tangible common equity (1) |
8.12 | % | 12.69 | % | 14.27 | % | ||||||
| Return on average tangible common equity (1) |
8.59 | % | 13.73 | % | 14.57 | % | ||||||
| Efficiency ratio (1) |
68.87 | % | 65.82 | % | 68.65 | % | ||||||
| Tier 1 leverage ratio |
8.27 | % | 8.43 | % | 8.54 | % | ||||||
| Net charge-offs (recoveries) to average loans |
0.03 | % | 0.04 | % | (0.02 | )% | ||||||
| (1) | Represents a non-GAAP financial measure. Refer to “Non-GAAP Financial Measures” section for reconciliations to GAAP financial measures. |
Comparison of Fiscal Years 2017 and 2016
Net Interest Income
Net interest income is the most significant component of our earnings, comprising 70% of 2017 revenues. Net interest income and margin are influenced by many factors, primarily the volume and mix of earning assets, funding sources, and interest rate fluctuations. Other factors include the level of accretion income on purchased loans, prepayment risk on mortgage and investment-related assets, and the composition and maturity of earning assets and interest-bearing liabilities.
Short-term interest rates increased 75 basis points in 2017 as the Federal Reserve increased the discount rate 25 basis points at their March, June, and December meetings. The rate increases were driven by the Federal Reserve’s inflation and wage pressure expectations in conjunction with a moderately expanding economy. The Treasury yield curve flattened as short-term rates rose while long-term interest rates remained flat. Collectively, these factors marginally improved the outlook for our net interest income and margin.
Loans typically generate more interest income than investment securities with similar maturities. Funding from client deposits generally costs less than wholesale funding sources. Factors such as general economic activity, Federal Reserve monetary policy, and price volatility of competing alternative investments, can also exert significant influence on our ability to optimize the mix of assets and funding and the net interest income and margin.
Net interest income is the excess of interest received from earning assets over interest paid on interest-bearing liabilities. For analytical purposes, net interest income is also presented in the table that follows, adjusted to a taxable equivalent basis to reflect what our tax-exempt assets would need to yield in order to achieve the same after-tax yield as a taxable asset. We used the federal statutory tax rate in effect of 35% for all periods. This analysis portrays the income tax benefits associated in tax-exempt assets and helps to facilitate a comparison between taxable and tax-exempt assets. Management believes that it is a standard practice in the banking industry to present net interest margin and net interest income on a fully taxable equivalent basis. Therefore, management believes these measures provide useful information for both management and investors by allowing them to make peer comparisons.
35
Table of Contents
| Years Ended December 31, | ||||||||||||
| (dollars in thousands) |
2017 | 2016 | 2015 | |||||||||
| Net interest income |
$ | 437,168 | $ | 402,703 | $ | 366,116 | ||||||
| Conversion to fully taxable equivalent |
23,091 | 21,293 | 19,543 | |||||||||
|
|
|
|
|
|
|
|||||||
| Net interest income - taxable equivalent basis |
$ | 460,259 | $ | 423,996 | $ | 385,659 | ||||||
|
|
|
|
|
|
|
|||||||
| Average earning assets |
$ | 13,237,906 | $ | 11,840,967 | $ | 10,363,098 | ||||||
| Net interest margin |
3.30 | % | 3.40 | % | 3.53 | % | ||||||
| Net interest margin - taxable equivalent basis |
3.48 | % | 3.58 | % | 3.72 | % | ||||||
Net interest income was $437.2 million in 2017, a $34.5 million increase from $402.7 million in 2016. Taxable equivalent net interest income was $460.3 million in 2017, a 9% increase from $424.0 million in 2016. The net interest margin on a fully taxable equivalent basis was 3.48% in 2017, a 10 basis point decrease compared to 3.58% in 2016. The increase in net interest income in 2017 when compared to 2016 was primarily due to higher average earning assets of $1.397 billion in 2017. Partially offsetting higher average earning assets were higher average interest bearing liabilities of $1.160 billion and a decrease in accretion income of $17.3 million. Net interest income in both 2017 and 2016 included accretion income (interest income in excess of contractual interest income) associated with acquired loans. Accretion income totaled $40.8 million in 2017, compared to $58.1 million in 2016. We expect accretion income on our PCI loans to decrease over time, but this may be offset by future acquisitions.
With the new 21% statutory federal tax rate, the conversion factor to a fully taxable equivalent basis will decrease in 2018. The decline will have no impact on net income, but will cause the net interest margin on a fully taxable equivalent basis to decrease approximately 9 basis points in 2018.
The following table presents a three-year average balance sheet and for each major asset and liability category, its related interest income and yield, or its expense and rate for the years ended December 31.
36
Table of Contents
| 2017 | 2016 | 2015 | ||||||||||||||||||||||||||||||||||
| (tax equivalent basis, dollars in thousands) |
Average Balance |
Income/ Expense |
Yield/ Rate |
Average Balance |
Income/ Expense |
Yield/ Rate |
Average Balance |
Income/ Expense |
Yield/ Rate |
|||||||||||||||||||||||||||
| Earning Assets |
||||||||||||||||||||||||||||||||||||
| Money market and other interest-earning investments (1) |
$ | 35,584 | $ | 258 | 0.72 | % | $ | 32,697 | $ | 130 | 0.40 | % | $ | 43,383 | $ | 47 | 0.11 | % | ||||||||||||||||||
| Investment securities: (2) U.S. Treasury & government- sponsored agencies (3) |
2,085,317 | 42,235 | 2.03 | 1,968,408 | 37,381 | 1.90 | 1,967,293 | 36,725 | 1.87 | |||||||||||||||||||||||||||
| States and political subdivisions (4) |
1,134,532 | 53,359 | 4.70 | 1,125,713 | 53,003 | 4.71 | 1,023,983 | 49,162 | 4.80 | |||||||||||||||||||||||||||
| Other securities |
450,127 | 11,863 | 2.64 | 438,832 | 10,391 | 2.37 | 444,520 | 10,903 | 2.45 | |||||||||||||||||||||||||||
|
|
|
|
|
|
|
|
|
|
|
|
|
|
|
|
|
|
|
|||||||||||||||||||
| Total investment securities |
3,669,976 | 107,457 | 2.93 | 3,532,953 | 100,775 | 2.85 | 3,435,796 | 96,790 | 2.82 | |||||||||||||||||||||||||||
|
|
|
|
|
|
|
|
|
|
|
|
|
|
|
|
|
|
|
|||||||||||||||||||
| Loans (including loans held for sale): (5) |
|
|||||||||||||||||||||||||||||||||||
| Commercial (4) |
2,083,779 | 85,747 | 4.11 | 1,835,317 | 70,591 | 3.85 | 1,754,141 | 75,900 | 4.33 | |||||||||||||||||||||||||||
| Commercial real estate |
3,426,757 | 171,483 | 5.00 | 2,648,911 | 150,592 | 5.69 | 1,862,055 | 118,237 | 6.35 | |||||||||||||||||||||||||||
| Residential real estate |
2,146,279 | 85,340 | 3.98 | 1,995,060 | 80,963 | 4.06 | 1,712,636 | 70,908 | 4.14 | |||||||||||||||||||||||||||
| Consumer |
1,875,531 | 68,142 | 3.63 | 1,796,029 | 65,376 | 3.64 | 1,555,087 | 56,850 | 3.66 | |||||||||||||||||||||||||||
|
|
|
|
|
|
|
|
|
|
|
|
|
|
|
|
|
|
|
|||||||||||||||||||
| Total loans |
9,532,346 | 410,712 | 4.31 | 8,275,317 | 367,522 | 4.44 | 6,883,919 | 321,895 | 4.68 | |||||||||||||||||||||||||||
|
|
|
|
|
|
|
|
|
|
|
|
|
|
|
|
|
|
|
|||||||||||||||||||
| Total earning assets |
13,237,906 | $ | 518,427 | 3.92 | % | 11,840,967 | $ | 468,427 | 3.96 | % | 10,363,098 | $ | 418,732 | 4.04 | % | |||||||||||||||||||||
|
|
|
|
|
|
|
|
|
|
|
|
|
|
|
|
|
|
|
|||||||||||||||||||
| Less: Allowance for loan losses |
(50,845 | ) | (52,215 | ) | (50,538 | ) | ||||||||||||||||||||||||||||||
| Non-Earning Assets |
||||||||||||||||||||||||||||||||||||
| Cash and due from banks |
207,677 | 192,401 | 163,275 | |||||||||||||||||||||||||||||||||
| Other assets |
1,907,963 | 1,661,200 | 1,451,125 | |||||||||||||||||||||||||||||||||
|
|
|
|
|
|
|
|||||||||||||||||||||||||||||||
| Total assets |
$ | 15,302,701 | $ | 13,642,353 | $ | 11,926,960 | ||||||||||||||||||||||||||||||
|
|
|
|
|
|
|
|||||||||||||||||||||||||||||||
| Interest-Bearing Liabilities |
||||||||||||||||||||||||||||||||||||
| NOW deposits |
2,676,760 | $ | 2,224 | 0.08 | % | $ | 2,389,143 | $ | 1,529 | 0.06 | % | $ | 2,160,019 | $ | 758 | 0.04 | % | |||||||||||||||||||
| Savings deposits |
2,964,875 | 4,980 | 0.17 | 2,595,622 | 3,723 | 0.14 | 2,299,357 | 3,199 | 0.14 | |||||||||||||||||||||||||||
| Money market deposits |
762,540 | 831 | 0.11 | 763,909 | 840 | 0.11 | 677,414 | 577 | 0.09 | |||||||||||||||||||||||||||
| Time deposits |
1,487,077 | 12,321 | 0.83 | 1,361,647 | 11,191 | 0.82 | 1,063,782 | 9,634 | 0.91 | |||||||||||||||||||||||||||
|
|
|
|
|
|
|
|
|
|
|
|
|
|
|
|
|
|
|
|||||||||||||||||||
| Total interest-bearing deposits |
7,891,252 | 20,356 | 0.26 | 7,110,321 | 17,283 | 0.24 | 6,200,572 | 14,168 | 0.23 | |||||||||||||||||||||||||||
|
|
|
|
|
|
|
|
|
|
|
|
|
|
|
|
|
|
|
|||||||||||||||||||
| Federal funds purchased and interbank borrowings |
187,426 | 1,966 | 1.05 | 137,997 | 673 | 0.49 | 126,124 | 265 | 0.21 | |||||||||||||||||||||||||||
| Securities sold under agreements to repurchase |
336,539 | 1,270 | 0.38 | 368,757 | 1,509 | 0.41 | 406,117 | 1,488 | 0.37 | |||||||||||||||||||||||||||
| Federal Home Loan Bank advances |
1,481,314 | 24,818 | 1.68 | 1,121,413 | 15,547 | 1.39 | 793,703 | 8,122 | 1.02 | |||||||||||||||||||||||||||
| Other borrowings |
224,793 | 9,758 | 4.34 | 222,708 | 9,419 | 4.23 | 217,978 | 9,030 | 4.14 | |||||||||||||||||||||||||||
|
|
|
|
|
|
|
|
|
|
|
|
|
|
|
|
|
|
|
|||||||||||||||||||
| Total interest-bearing liabilities |
$ | 10,121,324 | $ | 58,168 | 0.57 | % | $ | 8,961,196 | $ | 44,431 | 0.50 | % | $ | 7,744,494 | $ | 33,073 | 0.43 | % | ||||||||||||||||||
|
|
|
|
|
|
|
|
|
|
|
|
|
|
|
|
|
|
|
|||||||||||||||||||
| Noninterest-Bearing Liabilities |
||||||||||||||||||||||||||||||||||||
| Demand deposits |
3,111,672 | 2,776,140 | 2,500,571 | |||||||||||||||||||||||||||||||||
| Other liabilities |
146,060 | 192,443 | 200,994 | |||||||||||||||||||||||||||||||||
| Shareholders’ equity |
1,923,645 | 1,712,574 | 1,480,901 | |||||||||||||||||||||||||||||||||
|
|
|
|
|
|
|
|||||||||||||||||||||||||||||||
| Total liabilities and shareholders’ equity |
$ | 15,302,701 | $ | 13,642,353 | $ | 11,926,960 | ||||||||||||||||||||||||||||||
|
|
|
|
|
|
|
|||||||||||||||||||||||||||||||
| Interest Margin Recap |
||||||||||||||||||||||||||||||||||||
| Interest income/average earning assets |
$ | 518,427 | 3.92 | % | $ | 468,427 | 3.96 | % | $ | 418,732 | 4.04 | % | ||||||||||||||||||||||||
| Interest expense/average earning assets |
58,168 | 0.44 | 44,431 | 0.38 | 33,073 | 0.32 | ||||||||||||||||||||||||||||||
|
|
|
|
|
|
|
|
|
|
|
|
|
|||||||||||||||||||||||||
| Net interest income and margin |
$ | 460,259 | 3.48 | % | $ | 423,996 | 3.58 | % | $ | 385,659 | 3.72 | % | ||||||||||||||||||||||||
|
|
|
|
|
|
|
|
|
|
|
|
|
|||||||||||||||||||||||||
| (1) | The 2017, 2016, and 2015 average balances include $21.2 million, $24.8 million, and $35.2 million, respectively, of required and excess balances held at the Federal Reserve. |
| (2) | Changes in fair value are reflected in the average balance; however, yield information does not give effect to changes in fair value that are reflected as a component of shareholders’ equity. |
| (3) | Includes U.S. government-sponsored entities and agency mortgage-backed securities at December 31, 2017. |
| (4) | Interest on state and political subdivision investment securities and commercial loans includes the effect of taxable equivalent adjustments of $15.6 million and $7.5 million, respectively, in 2017; $15.2 million and $6.1 million, respectively, in 2016; and $13.7 million and $5.9 million, respectively, in 2015; using the federal statutory tax rate in effect of 35% for all periods. |
| (5) | Includes principal balances of nonaccrual loans. Interest income relating to nonaccrual loans is included only if received. |
37
Table of Contents
The yield on average earning assets decreased 4 basis points from 3.96% in 2016 to 3.92% in 2017 and the cost of interest-bearing liabilities increased 7 basis points from 0.50% in 2016 to 0.57% in 2017. Average earning assets increased by $1.397 billion, or 12%. The increase in average earning assets consisted of a $1.257 billion increase in loans, a $137.0 million increase in lower yielding investment securities, and a $2.9 million increase in money market and other interest-earning investments. Average interest-bearing liabilities increased $1.160 billion, or 13%. The increase in average interest-bearing liabilities consisted of a $780.9 million increase in interest-bearing deposits, a $49.4 million increase in federal funds purchased and interbank borrowings, a $359.9 million increase in FHLB advances, and a $2.1 million increase in other borrowings, partially offset by a $32.2 million decrease in securities sold under agreements to repurchase. Average noninterest-bearing deposits increased by $335.5 million.
The increase in average earning assets in 2017 compared to 2016 was primarily due to our acquisitions of Anchor (WI) in May 2016 and Anchor (MN) in November 2017. Including loans held for sale, the loan portfolio, which generally has an average yield higher than the investment portfolio, was approximately 72% of average interest earning assets in 2017 compared to 70% in 2016.
Average loans including loans held for sale increased $1.257 billion in 2017 compared to 2016 reflecting loans acquired from Anchor (WI) in May 2016 and Anchor (MN) in November 2017, along with $377.3 million of average organic loan growth. Loans including loans held for sale attributable to the Anchor (WI) acquisition totaled $1.647 billion as of the closing date of the acquisition, which was May 1, 2016. Loans including loans held for sale attributable to the Anchor (MN) acquisition totaled $1.595 billion as of the closing date of the acquisition, which was November 1, 2017.
The increases in average investments and average deposits also reflected the Anchor (WI) and Anchor (MN) acquisitions.
Average non-interest bearing deposits increased $335.5 million in 2017 compared to 2016 reflecting the Anchor (WI) and Anchor (MN) acquisitions. Average interest bearing deposits increased $780.9 million in 2017 compared to 2016 reflecting the Anchor (WI) and Anchor (MN) acquisitions.
Average borrowed funds increased $379.2 million in 2017 compared to 2016 primarily due to increased funding needed as a result of growth in our loan portfolio that outpaced deposit growth.
38
Table of Contents
The following table shows fluctuations in taxable equivalent net interest income attributable to changes in the average balances of assets and liabilities and the yields earned or rates paid for the years ended December 31.
| From 2016 to 2017 | From 2015 to 2016 | |||||||||||||||||||||||
| Total | Attributed to | Total | Attributed to | |||||||||||||||||||||
| (dollars in thousands) |
Change | Volume | Rate | Change | Volume | Rate | ||||||||||||||||||
| Interest Income |
||||||||||||||||||||||||
| Money market and other interest-earning investments |
$ | 128 | $ | 16 | $ | 112 | $ | 83 | $ | (27 | ) | $ | 110 | |||||||||||
| Investment securities (1) |
6,682 | 3,960 | 2,722 | 3,985 | 2,754 | 1,231 | ||||||||||||||||||
| Loans (1) |
43,190 | 54,994 | (11,804 | ) | 45,627 | 63,428 | (17,801 | ) | ||||||||||||||||
|
|
|
|
|
|
|
|
|
|
|
|
|
|||||||||||||
| Total interest income |
50,000 | 58,970 | (8,970 | ) | 49,695 | 66,155 | (16,460 | ) | ||||||||||||||||
|
|
|
|
|
|
|
|
|
|
|
|
|
|||||||||||||
| Interest Expense |
||||||||||||||||||||||||
| NOW deposits |
695 | 212 | 483 | 771 | 114 | 657 | ||||||||||||||||||
| Savings deposits |
1,257 | 575 | 682 | 524 | 419 | 105 | ||||||||||||||||||
| Money market deposits |
(9 | ) | (1 | ) | (8 | ) | 263 | 84 | 179 | |||||||||||||||
| Time deposits |
1,130 | 1,035 | 95 | 1,557 | 2,572 | (1,015 | ) | |||||||||||||||||
| Federal funds purchased and interbank borrowings |
1,293 | 380 | 913 | 408 | 41 | 367 | ||||||||||||||||||
| Securities sold under agreements to repurchase |
(239 | ) | (127 | ) | (112 | ) | 21 | (145 | ) | 166 | ||||||||||||||
| Federal Home Loan Bank advances |
9,271 | 5,510 | 3,761 | 7,425 | 3,948 | 3,477 | ||||||||||||||||||
| Other borrowings |
339 | 89 | 250 | 389 | 198 | 191 | ||||||||||||||||||
|
|
|
|
|
|
|
|
|
|
|
|
|
|||||||||||||
| Total interest expense |
13,737 | 7,673 | 6,064 | 11,358 | 7,231 | 4,127 | ||||||||||||||||||
|
|
|
|
|
|
|
|
|
|
|
|
|
|||||||||||||
| Net interest income |
$ | 36,263 | $ | 51,297 | $ | (15,034 | ) | $ | 38,337 | $ | 58,924 | $ | (20,587 | ) | ||||||||||
|
|
|
|
|
|
|
|
|
|
|
|
|
|||||||||||||
The variance not solely due to rate or volume is allocated equally between the rate and volume variances.
| (1) | Interest on investment securities and loans includes the effect of taxable equivalent adjustments of $15.6 million and $7.5 million, respectively, in 2017; $15.2 million and $6.2 million, respectively, in 2016; and $13.7 million and $5.9 million, respectively, in 2015; using the federal statutory rate in effect of 35% for all periods. |
Provision for Loan Losses
The provision for loan losses was an expense of $3.1 million in 2017, compared to an expense of $1.0 million in 2016. Net charge-offs totaled $2.5 million in 2017, compared to net charge-offs of $3.4 million in 2016. The higher provision for loan losses is the result of a change in specific allocations on impaired loans. Continued loan growth in future periods, a decline in our current level of recoveries, or an increase in charge-offs could result in an increase in provision expense. For additional information about non-performing loans, charge-offs, and additional items impacting the provision, refer to the “Risk Management – Credit Risk” section of Item 7, “Management’s Discussion and Analysis of Financial Condition and Results of Operations.”
Noninterest Income
We generate revenues in the form of noninterest income through client fees, sales commissions, and other gains and losses from our core banking franchise and other related businesses, such as wealth management, investment consulting, and investment products. This source of revenue as a percentage of total revenue was 30% in 2017 compared to 39% in 2016.
39
Table of Contents
The following table details the components of noninterest income for the years ended December 31.
| Years Ended December 31, | % Change From Prior Year |
|||||||||||||||||||
| (dollars in thousands) |
2017 | 2016 | 2015 | 2017 | 2016 | |||||||||||||||
| Wealth management fees |
$ | 37,316 | $ | 34,641 | $ | 34,395 | 7.7 | % | 0.7 | % | ||||||||||
| Service charges on deposit accounts |
41,331 | 41,578 | 43,372 | (0.6 | ) | (4.1 | ) | |||||||||||||
| Debit card and ATM fees |
17,676 | 16,769 | 21,340 | 5.4 | (21.4 | ) | ||||||||||||||
| Mortgage banking revenue |
18,449 | 20,240 | 12,540 | (8.8 | ) | 61.4 | ||||||||||||||
| Insurance premiums and commissions |
617 | 20,527 | 42,714 | (97.0 | ) | (51.9 | ) | |||||||||||||
| Investment product fees |
20,977 | 18,822 | 17,924 | 11.4 | 5.0 | |||||||||||||||
| Capital markets income |
6,544 | 3,227 | 1,082 | 102.8 | 198.2 | |||||||||||||||
| Company-owned life insurance |
8,654 | 8,479 | 8,604 | 2.1 | (1.5 | ) | ||||||||||||||
| Net securities gains (losses) |
9,135 | 5,848 | 5,718 | 56.2 | 2.3 | |||||||||||||||
| Recognition of deferred gain on sale leaseback transactions |
2,080 | 16,057 | 16,444 | (87.0 | ) | (2.4 | ) | |||||||||||||
| Gain on sale of ONB Insurance Group, Inc. |
— | 41,864 | — | (100.0 | ) | N/M | ||||||||||||||
| Net gain on branch divestitures |
— | — | 15,627 | N/M | (100.0 | ) | ||||||||||||||
| Change in FDIC indemnification asset |
— | 233 | (9,034 | ) | (100.0 | ) | (102.6 | ) | ||||||||||||
| Other income |
20,603 | 24,545 | 19,906 | (16.1 | ) | 23.3 | ||||||||||||||
|
|
|
|
|
|
|
|
|
|
|
|||||||||||
| Total noninterest income |
$ | 183,382 | $ | 252,830 | $ | 230,632 | (27.5 | )% | 9.6 | % | ||||||||||
|
|
|
|
|
|
|
|
|
|
|
|||||||||||
| Noninterest income to total revenue (1) |
28.5 | % | 37.4 | % | 37.4 | % | ||||||||||||||
| (1) | Total revenue includes the effect of a taxable equivalent adjustment of $23.1 million in 2017, $21.3 million in 2016, and $19.5 million in 2015. |
N/M = Not meaningful
The decrease in noninterest income in 2017 when compared to 2016 was primarily due to a pre-tax gain of $41.9 million resulting from the sale of ONI in May 2016, lower insurance premiums and commissions, and lower recognition of deferred gain on sale leaseback transactions.
Wealth management fees increased $2.7 million in 2017 compared to 2016 reflecting market appreciation and strong sales production.
Service charges and overdraft fees decreased $0.2 million in 2017 compared to 2016 primarily due to lower overdraft charges, partially offset by higher service charges and overdraft fees attributable to the Anchor (WI) and Anchor (MN) acquisitions.
Mortgage banking revenue decreased $1.8 million in 2017 compared to 2016 primarily due to the industry-wide reduction in refinance activity and higher interest rates in 2017.
Insurance premiums and commissions decreased $19.9 million in 2017 reflecting the sale of ONI in May 2016.
Investment product fees increased $2.2 million in 2017 compared to 2016 primarily due to higher investment product fees attributable to the Anchor (WI) and Anchor (MN) acquisitions.
Capital markets income is comprised of customer interest rate swap fees, foreign currency exchange fees, and net gains (losses) on foreign currency adjustments. Capital markets income increased $3.3 million in 2017 compared to 2016 primarily due to higher customer interest rate swap fees resulting from strong commercial loan production during 2017.
Net securities gains increased $3.3 million in 2017 compared to 2016 primarily due to higher realized gains on sales of available-for-sale securities in 2017.
Recognition of deferred gain on sale leaseback transactions decreased $14.0 million in 2017 compared to 2016. Old National purchased 23 properties during 2016 that it had previously leased, resulting in the recognition of approximately $12.0 million of pre-tax deferred gains.
40
Table of Contents
In 2016, we recorded a $41.9 million pre-tax gain resulting from the sale of ONI in May 2016. The after-tax gain related to the sale totaled $17.6 million.
Other income decreased $3.9 million in 2017 when compared to 2016 reflecting lower recoveries on loans originated by AnchorBank (WI) that had been fully charged off prior to the acquisition. Recoveries on loans originated by AnchorBank (WI) totaled $4.0 million in 2017, compared to $7.6 million in 2016.
Noninterest Expense
The following table details the components of noninterest expense for the years ended December 31.
| Years Ended December 31, | % Change From Prior Year |
|||||||||||||||||||
| (dollars in thousands) |
2017 | 2016 | 2015 | 2017 | 2016 | |||||||||||||||
| Salaries and employee benefits |
$ | 246,738 | $ | 252,892 | $ | 243,875 | (2.4 | )% | 3.7 | % | ||||||||||
| Occupancy |
46,511 | 50,947 | 53,239 | (8.7 | ) | (4.3 | ) | |||||||||||||
| Equipment |
13,560 | 13,448 | 13,183 | 0.8 | 2.0 | |||||||||||||||
| Marketing |
13,172 | 14,620 | 10,410 | (9.9 | ) | 40.4 | ||||||||||||||
| Data processing |
32,306 | 32,002 | 27,309 | 0.9 | 17.2 | |||||||||||||||
| Communication |
9,284 | 9,959 | 9,586 | (6.8 | ) | 3.9 | ||||||||||||||
| Professional fees |
16,840 | 15,705 | 11,756 | 7.2 | 33.6 | |||||||||||||||
| Loan expense |
6,596 | 7,632 | 6,373 | (13.6 | ) | 19.8 | ||||||||||||||
| Supplies |
2,406 | 2,865 | 2,275 | (16.0 | ) | 25.9 | ||||||||||||||
| FDIC assessment |
9,480 | 8,681 | 7,503 | 9.2 | 15.7 | |||||||||||||||
| Other real estate owned expense |
3,376 | 4,195 | 2,703 | (19.5 | ) | 55.2 | ||||||||||||||
| Amortization of intangibles |
11,841 | 12,486 | 11,746 | (5.2 | ) | 6.3 | ||||||||||||||
| Amortization of tax credit investments |
11,733 | — | — | N/M | N/M | |||||||||||||||
| Other expense |
24,993 | 28,715 | 30,974 | (13.0 | ) | (7.3 | ) | |||||||||||||
|
|
|
|
|
|
|
|
|
|
|
|||||||||||
| Total noninterest expense |
$ | 448,836 | $ | 454,147 | $ | 430,932 | (1.2 | )% | 5.4 | % | ||||||||||
|
|
|
|
|
|
|
|
|
|
|
|||||||||||
N/M = Not meaningful
Noninterest expense decreased $5.3 million in 2017 when compared to 2016 primarily due to the reduction of costs associated with the divestiture of ONI in May 2016. Offsetting these decreases was $11.7 million of amortization of tax credit investments in 2017. In addition, noninterest expense in 2017 included $12.3 million of acquisition and integration costs associated with Anchor (MN), compared to $15.9 million in 2016 of acquisition and integration costs associated with Anchor (WI).
Salaries and benefits is the largest component of noninterest expense. Salaries and benefits decreased $6.2 million in 2017 compared to 2016. Impacting salaries and benefits expense were the acquisitions of Anchor (WI) and Anchor (MN), and the divestiture of ONI described above. Also contributing to the decrease in salaries and benefits were lower pension expenses of $11.9 million in 2017 reflecting the termination of Old National’s Retirement Plan effective May 15, 2016. The decreases were partially offset by higher incentive compensation in 2017.
Occupancy expenses decreased $4.4 million in 2017 compared to 2016 primarily due to 29 banking center consolidations in 2017. The decrease was partially offset by higher occupancy expenses attributable to the Anchor (WI) and Anchor (MN) acquisitions.
Marketing expense decreased $1.4 million in 2017 compared to 2016 primarily due to lower public relations expense.
Professional fees increased $1.1 million in 2017 compared to 2016 primarily due to $3.5 million in pre-tax expenses recorded in 2017 related to a client-experience improvement initiative currently in process at Old National. Upon completion of this initiative, Old National expects the costs incurred to considerably improve how we serve our clients and increase efficiency in 2018. The increase was partially offset by lower professional fees related to acquisition and integration costs associated with Anchor (WI).
Amortization of tax credit investments was $11.7 million in 2017 reflecting the completion of several investment tax credit projects during the fourth quarter of 2017. There was no amortization related to tax credit investments recorded in noninterest expense in 2016. See Note 16 to the consolidated financial statements for additional information on our tax credit investments.
41
Table of Contents
Other expense decreased $3.7 million in 2017 compared to 2016 primarily due to lower charitable contributions of $2.7 million and lower impairments of long-lived assets of $1.6 million.
Provision for Income Taxes
We record a provision for income taxes currently payable and for income taxes payable or benefits to be received in the future, which arise due to timing differences in the recognition of certain items for financial statement and income tax purposes. The major difference between the effective tax rate applied to our financial statement income and the federal statutory tax rate is caused by interest on tax-exempt securities and loans. The effective tax rate was 43.3% in 2017 compared to 33.0% in 2016. The higher effective tax rate in 2017 when compared to 2016 is the result of $39.3 million of additional tax expense to estimate the revaluation of deferred tax assets due to the lowering of the federal corporate tax rate to 21%, partially offset by an increase in federal tax credits available. See Note 16 to the consolidated financial statements for additional details on Old National’s income tax provision.
Comparison of Fiscal Years 2016 and 2015
In 2016, we generated net income of $134.3 million and diluted net income per share of $1.05 compared to $116.7 million and diluted net income per share of $1.00, respectively, in 2015. The 2016 earnings included a $36.6 million increase in net interest income, a $1.9 million decrease in provision for loan losses, and a $22.2 million increase in noninterest income. These increases to net income were partially offset by a $23.2 million increase in noninterest expense and a $20.0 million increase in income tax expense. The successful conversion and integration of our acquisition of Anchor (WI) in 2016, strong loan growth, and consistently low credit metrics all contributed to positive 2016 performance when compared to 2015.
Net interest income was $402.7 million in 2016, a $36.6 million increase from $366.1 million in 2015. Taxable equivalent net interest income was $424.0 million in 2016, a 10% increase from $385.7 million in 2015. The net interest margin on a fully taxable equivalent basis was 3.58% in 2016, a 14 basis point decrease compared to 3.72% in 2015. Average earning assets increased by $1.478 billion during 2016 and the yield on average earning assets decreased 8 basis points from 4.04% in 2015 to 3.96% in 2016. Average interest-bearing liabilities increased $1.217 billion and the cost of interest-bearing liabilities increased from 0.43% in 2015 to 0.50% in 2016.
The provision for loan losses was an expense of $1.0 million in 2016, compared to an expense of $2.9 million in 2015. Charge-offs remained low during 2016 and we continued to see positive trends in credit quality.
Noninterest income was $252.8 million in 2016, an increase of $22.2 million, or 10%, compared to $230.6 million in 2015. The increase in noninterest income in 2016 was primarily due to a pre-tax gain of $41.9 million resulting from the sale of ONI in May 2016 and noninterest income attributable to the Anchor (WI) acquisition. The increase in noninterest income was partially offset by a $15.6 million gain on branch divestitures in the third quarter of 2015 and lower insurance premiums and commissions resulting from the sale on ONI.
Noninterest expense totaled $454.1 million in 2016, an increase of $23.2 million, or 5%, from $430.9 million in 2015. Noninterest expense during 2016 was impacted by our transition into the higher growth markets in Wisconsin, the divestitures of our Illinois franchise and our insurance business, and other branch restructuring during 2015. Also contributing to the increase in noninterest expense was a pension plan settlement loss of $9.8 million resulting from the termination of the Employee Retirement Plan in 2016.
The provision for income taxes was $66.2 million in 2016 compared to $46.2 million in 2015. Old National’s effective tax rate was 33.0% in 2016 compared to 28.3% in 2015. The higher effective tax rate in 2016 when compared to 2015 was primarily the result of the sale of ONI in May 2016 and the associated tax expense of $8.3 million to record a deferred tax liability relating to ONI’s nondeductible goodwill.
42
Table of Contents
Overview
At December 31, 2017, our assets were $17.518 billion, an 18% increase compared to $14.860 billion at December 31, 2016. The increase was primarily due to the acquisition of Anchor (MN) in November 2017, which had $2.222 billion in assets as of the closing date of the acquisition.
Earning Assets
Our earning assets are comprised of investment securities, portfolio loans, loans held for sale, money market investments, interest earning accounts with the Federal Reserve, and trading securities. Earning assets were $15.209 billion at December 31, 2017, an increase of 19% compared to $12.796 billion at December 31, 2016.
Investment Securities
We classify the majority of our investment securities as available-for-sale to give management the flexibility to sell the securities prior to maturity if needed, based on fluctuating interest rates or changes in our funding requirements. However, we also have $6.9 million of fixed-rate mortgage-backed securities and $677.2 million of state and political subdivision securities in our held-to-maturity investment portfolio at December 31, 2017.
Trading securities, which consist of mutual funds held in trusts associated with deferred compensation plans for former directors and executives, are recorded at fair value and totaled $5.6 million at December 31, 2017, compared to $5.0 million at December 31, 2016.
At December 31, 2017, the investment securities portfolio, including trading securities, was $4.006 billion compared to $3.649 billion at December 31, 2016, an increase of $356.6 million, or 10%. Investment securities attributable to the Anchor (MN) acquisition totaled $308.8 million as of the closing date of the acquisition. Investment securities represented 26% of earning assets at December 31, 2017, compared to 29% at December 31, 2016. Investment securities decreased as a percentage of total earning assets due to a proportionately larger increase in loan balances. Stronger commercial loan demand in the future and management’s decision to deleverage the balance sheet could result in a reduction in the securities portfolio. As of December 31, 2017, management does not intend to sell any securities in an unrealized loss position and does not believe we will be required to sell such securities.
The investment securities available-for-sale portfolio had net unrealized losses of $56.4 million at December 31, 2017, compared to net unrealized losses of $61.5 million at December 31, 2016. Net unrealized losses decreased from December 31, 2016 to December 31, 2017 primarily due to the effect of a decrease in long-term interest rates on municipal bonds.
The investment portfolio had an effective duration of 4.15 at December 31, 2017, compared 4.61 at December 31, 2016. Effective duration measures the percentage change in value of the portfolio in response to a change in interest rates. Generally, there is more uncertainty in interest rates over a longer average maturity, resulting in a higher duration percentage. The weighted average yields on available-for-sale investment securities were 2.43% in 2017 and 2.44% in 2016. The average yields on the held-to-maturity portfolio were 5.44% in 2017 and 5.35% in 2016.
At December 31, 2017, Old National had a concentration of investment securities issued by certain states and their political subdivisions with the following aggregate market values: $375.1 million by Indiana, which represented 17.4% of shareholders’ equity, and $182.7 million by Texas, which represented 8.5% of shareholders’ equity. Of the Indiana municipal bonds, 98% are rated “A” or better, and the remaining 2% generally represent non-rated local interest bonds where Old National has a market presence. All of the Texas municipal bonds are rated “AA” or better, and the majority of issues are backed by the “AAA” rated State of Texas Permanent School Fund Guarantee Program.
Loan Portfolio
We lend primarily to consumers and small to medium-sized commercial and commercial real estate clients in various industries including manufacturing, agribusiness, transportation, mining, wholesaling, and retailing. Our policy is to concentrate our lending activity in the geographic market areas we serve, primarily Indiana, Kentucky, Michigan, Wisconsin, and Minnesota.
43
Table of Contents
The following table presents the composition of the loan portfolio at December 31.
| (dollars in thousands) |
2017 | 2016 | 2015 | 2014 | 2013 | Four-Year Growth Rate |
||||||||||||||||||
| Commercial |
$ | 2,717,269 | $ | 1,917,099 | $ | 1,814,940 | $ | 1,646,767 | $ | 1,402,750 | 18.0 | % | ||||||||||||
| Commercial real estate |
4,354,552 | 3,130,853 | 1,868,972 | 1,751,907 | 1,242,818 | 36.8 | ||||||||||||||||||
| Consumer |
1,879,247 | 1,875,030 | 1,603,158 | 1,379,117 | 1,049,974 | 15.7 | ||||||||||||||||||
|
|
|
|
|
|
|
|
|
|
|
|
|
|||||||||||||
| Total loans excluding residential real estate |
8,951,068 | 6,922,982 | 5,287,070 | 4,777,791 | 3,695,542 | 24.8 | ||||||||||||||||||
| Residential real estate |
2,167,053 | 2,087,530 | 1,661,335 | 1,540,410 | 1,387,422 | 11.8 | ||||||||||||||||||
|
|
|
|
|
|
|
|
|
|
|
|
|
|||||||||||||
| Total loans |
11,118,121 | 9,010,512 | 6,948,405 | 6,318,201 | 5,082,964 | 21.6 | % | |||||||||||||||||
|
|
|
|||||||||||||||||||||||
| Less: Allowance for loan losses |
50,381 | 49,808 | 52,233 | 47,849 | 47,145 | |||||||||||||||||||
|
|
|
|
|
|
|
|
|
|
|
|||||||||||||||
| Net loans |
$ | 11,067,740 | $ | 8,960,704 | $ | 6,896,172 | $ | 6,270,352 | $ | 5,035,819 | ||||||||||||||
|
|
|
|
|
|
|
|
|
|
|
|||||||||||||||
Commercial and Commercial Real Estate Loans
At December 31, 2017, commercial and commercial real estate loans were $7.072 billion, an increase of $2.024 billion, or 40%, compared to December 31, 2016. Commercial and commercial real estate loans attributable to the Anchor (MN) acquisition totaled $1.516 billion as of the closing date of the acquisition. Excluding these acquired loans, commercial and commercial real estate loans grew 10% in 2017.
The following table presents the maturity distribution and rate sensitivity of commercial loans at December 31, 2017 and an analysis of these loans that have predetermined and floating interest rates.
| (dollars in thousands) | Within 1 Year |
1 - 5 Years | Beyond 5 Years |
Total | % of Total |
|||||||||||||||
| Interest rates: |
||||||||||||||||||||
| Predetermined |
$ | 154,147 | $ | 649,772 | $ | 606,103 | $ | 1,410,022 | 52 | % | ||||||||||
| Floating |
688,557 | 408,632 | 210,058 | 1,307,247 | 48 | |||||||||||||||
|
|
|
|
|
|
|
|
|
|
|
|||||||||||
| Total |
$ | 842,704 | $ | 1,058,404 | $ | 816,161 | $ | 2,717,269 | 100 | % | ||||||||||
|
|
|
|
|
|
|
|
|
|
|
|||||||||||
Residential Real Estate Loans
Residential real estate loans, primarily 1-4 family properties, increased $79.5 million, or 4%, at December 31, 2017 compared to December 31, 2016. Residential real estate loans attributable to the Anchor (MN) acquisition totaled $34.0 million as of the closing date of the acquisition. Future increases in interest rates could result in a decline in the level of refinancings and new originations of residential real estate loans.
Consumer Loans
Consumer loans, including automobile loans, personal and home equity loans and lines of credit, and student loans, increased $4.2 million at December 31, 2017 compared to December 31, 2016. Consumer loans attributable to the Anchor (MN) acquisition totaled $43.9 million as of the closing date of the acquisition. We continue to see runoff in our less profitable indirect consumer loan portfolio.
Allowance for Loan Losses
To provide for the risk of loss inherent in extending credit, we maintain an allowance for loan losses. The allowance for loan losses is maintained at a level believed adequate by management to absorb probable losses incurred in the consolidated loan portfolio. Management’s evaluation of the adequacy of the allowance is an estimate based on reviews of individual loans, pools of homogeneous loans, assessments of the impact of current and anticipated economic conditions on the portfolio, and historical loss experience. Additional information about our Allowance for Loan Losses is included in the “Risk Management – Credit Risk” section of Item 7, “Management’s Discussion and Analysis of Financial Condition and Results of Operations” and Notes 1 and 5 to the consolidated financial statements.
44
Table of Contents
At December 31, 2017, the allowance for loan losses was $50.4 million, an increase of $0.6 million compared to $49.8 million at December 31, 2016. Continued loan growth in future periods, a decline in our current level of recoveries, or an increase in charge-offs could result in an increase in provision expense. As a percentage of total loans excluding loans held for sale, the allowance was 0.45% at December 31, 2017, compared to 0.55% at December 31, 2016. The decrease in the percentage from December 31, 2016 is primarily a result of the addition of the Anchor (MN) $1.594 billion loan portfolio. In accordance with ASC 805, no allowance for loan losses is recorded at the date of acquisition and a reserve is only established to absorb any subsequent credit deterioration or adverse changes in expected cash flows. The provision for loan losses was an expense of $3.1 million in 2017 compared to an expense of $1.0 million in 2016.
For commercial loans, the allowance for loan losses decreased by $2.2 million at December 31, 2017 compared to December 31, 2016. The allowance for loan losses as a percentage of the commercial loan portfolio decreased to 0.71% at December 31, 2017, from 1.12% at December 31, 2016. The lower allowance for loan losses as a percentage of the commercial loan portfolio is primarily the result of a change in the mix between acquired and originated loans and lower loss ratios.
For commercial real estate loans, the allowance for loan losses increased by $3.3 million at December 31, 2017 compared to December 31, 2016. The allowance for loan losses as a percentage of the commercial real estate loan portfolio decreased to 0.49% at December 31, 2017, from 0.58% at December 31, 2016. The lower allowance for loan losses as a percentage of the commercial real estate loan portfolio is the result of the increase in purchased loans that were recorded at fair value and improved asset quality. The fair value adjustment considers credit impairment resulting in no need for an allowance for loan losses at the date of acquisition. An allowance may be recorded in future periods if the loan experiences subsequent deterioration. See the discussion in the section “Asset Quality” for additional details.
The allowance for loan losses for residential real estate loans as a percentage of that portfolio was 0.08% at December 31, 2017 and 2016. The allowance for loan losses for consumer loans as a percentage of that portfolio decreased to 0.42% at December 31, 2017, from 0.45% at December 31, 2016.
Allowance for Losses on Unfunded Commitments
We maintain an allowance for losses on unfunded commercial lending commitments and letters of credit to provide for the risk of loss inherent in these arrangements. The allowance is computed using a methodology similar to that used to determine the allowance for loan losses, modified to take into account the probability of a drawdown on the commitment. This allowance is classified as a liability on the balance sheet within accrued expenses and other liabilities, while the corresponding provision for these loan losses is recorded as a component of other expense. The allowance for losses on unfunded commitments was $3.1 million at December 31, 2017, compared to $3.2 million at December 31, 2016.
Loans Held for Sale
Mortgage loans held for immediate sale in the secondary market were $17.9 million at December 31, 2017, compared to $90.7 million at December 31, 2016. The decrease is primarily due to a decline in mortgage production resulting from higher rates and the timing of sales. Certain mortgage loans are committed for sale at or prior to origination at a contracted price to an outside investor. Other mortgage loans held for immediate sale are hedged with TBA forward agreements and committed for sale when they are ready for delivery and remain on the Company’s balance sheet for a short period of time (typically 30 to 60 days). These loans are sold without recourse, beyond customary representations and warranties, and Old National has not experienced material losses arising from these sales. Mortgage originations are subject to volatility due to interest rates and home sales, among other factors.
We have elected the fair value option under FASB ASC 825-10 prospectively for residential loans held for sale. The aggregate fair value exceeded the unpaid principal balance by $0.5 million as of December 31, 2017, compared to $0.1 million as of December 31, 2016.
Goodwill and Other Intangible Assets
Goodwill and other intangible assets at December 31, 2017 totaled $881.1 million, an increase of $188.4 million compared to $692.7 million at December 31, 2016. During 2017, we recorded $200.3 million of goodwill and other intangible assets associated with the acquisition of Anchor (MN).
45
Table of Contents
Net Deferred Tax Assets
Net deferred tax assets decreased $71.0 million since December 31, 2016 primarily due to an estimated revaluation of our deferred tax assets due to the enactment of the Tax Cuts and Jobs Act (“H.R. 1”), which lowered the federal corporate tax rate to 21%. Under ASC 740, the effects of changes in tax rates and laws are recognized in the period in which the new legislation is enacted. Accordingly, Old National has recorded an estimated $39.3 million for the revaluation of Old National’s deferred tax assets. Shortly after the enactment date, the SEC issued Staff Accounting Bulletin (“SAB”) 118, which addresses the situations where the accounting for changes in tax laws is complete, incomplete but can be reasonably estimated, and incomplete and cannot be reasonably estimated. SAB 118 also permits a measurement period of up to one year from the date of enactment to refine the provisional accounting. Old National continues to analyze H.R. 1, including the impact on alternative minimum tax credits, as well as the acquisition accounting of Anchor (MN), and expects any refinements to the provisional accounting to be complete in 2018. Future decreases in the corporate tax rate could result in a loss in value of Old National’s deferred tax assets, but would reduce future income tax expense. See Note 16 to the consolidated financial statements for additional information.
Other Assets
Other assets increased $39.3 million, or 34%, since December 31, 2016 primarily due to an increase in various tax credit investments and higher accrued income taxes.
Funding
Total funding, comprised of deposits and wholesale borrowings, was $15.184 billion at December 31, 2017, an increase of $2.289 billion from $12.895 billion at December 31, 2016. Total deposits were $12.606 billion, including $10.971 billion in transaction accounts and $1.634 billion in time deposits at December 31, 2017. Total deposits increased $1.863 billion, or 17%, compared to December 31, 2016. Deposits attributable to the Anchor (MN) acquisition totaled $1.777 billion as of the closing date of the acquisition. Noninterest-bearing demand deposits increased $664.7 million from December 31, 2016 to December 31, 2017. NOW deposits increased $519.2 million from December 31, 2016 to December 31, 2017, while savings deposits increased $80.9 million. Money market deposits increased $431.3 million from December 31, 2016 to December 31, 2017, while time deposits increased $166.3 million.
We use wholesale funding to augment deposit funding and to help maintain our desired interest rate risk position. At December 31, 2017, wholesale borrowings, including federal funds purchased and interbank borrowings, securities sold under agreements to repurchase, FHLB advances, and other borrowings, totaled $2.578 billion, an increase of $426.1 million, or 20%, from December 31, 2016. The increase in wholesale funding from December 31, 2016 to December 31, 2017 was primarily due to an increase in FHLB advances and federal funds purchased and interbank borrowings. Wholesale funding as a percentage of total funding was 17% at December 31, 2017 and 2016. See Notes 12, 13, and 14 to the consolidated financial statements for additional details on our financing activities.
46
Table of Contents
The following table details the average balances of all funding sources for the years ended December 31.
| % Change From Prior Year |
||||||||||||||||||||
| (dollars in thousands) |
2017 | 2016 | 2015 | 2017 | 2016 | |||||||||||||||
| Demand deposits |
$ | 3,111,672 | $ | 2,776,140 | $ | 2,500,571 | 12.1 | % | 11.0 | % | ||||||||||
| NOW deposits |
2,676,760 | 2,389,143 | 2,160,019 | 12.0 | 10.6 | |||||||||||||||
| Savings deposits |
2,964,875 | 2,595,622 | 2,299,357 | 14.2 | 12.9 | |||||||||||||||
| Money market deposits |
762,540 | 763,909 | 677,414 | (0.2 | ) | 12.8 | ||||||||||||||
| Time deposits |
1,487,077 | 1,361,647 | 1,063,782 | 9.2 | 28.0 | |||||||||||||||
|
|
|
|
|
|
|
|
|
|
|
|||||||||||
| Total deposits |
11,002,924 | 9,886,461 | 8,701,143 | 11.3 | 13.6 | |||||||||||||||
| Federal funds purchased and interbank borrowings |
187,426 | 137,997 | 126,124 | 35.8 | 9.4 | |||||||||||||||
| Securities sold under agreements to repurchase |
336,539 | 368,757 | 406,117 | (8.7 | ) | (9.2 | ) | |||||||||||||
| Federal Home Loan Bank advances |
1,481,314 | 1,121,413 | 793,703 | 32.1 | 41.3 | |||||||||||||||
| Other borrowings |
224,793 | 222,708 | 217,978 | 0.9 | 2.2 | |||||||||||||||
|
|
|
|
|
|
|
|
|
|
|
|||||||||||
| Total funding sources |
$ | 13,232,996 | $ | 11,737,336 | $ | 10,245,065 | 12.7 | % | 14.6 | % | ||||||||||
|
|
|
|
|
|
|
|
|
|
|
|||||||||||
The following table presents a maturity distribution for certificates of deposit with denominations of $100,000 or more at December 31.
| Maturity Distribution | ||||||||||||||||||||
| Year-End | 1-90 | 91-180 | 181-365 | Beyond | ||||||||||||||||
| (dollars in thousands) |
Balance | Days | Days | Days | 1 Year | |||||||||||||||
| 2017 |
$ | 727,496 | $ | 265,872 | $ | 109,584 | $ | 171,877 | $ | 180,163 | ||||||||||
| 2016 |
544,803 | 142,806 | 91,704 | 115,151 | 195,142 | |||||||||||||||
| 2015 |
303,759 | 56,273 | 28,657 | 86,625 | 132,204 | |||||||||||||||
Accrued Expenses and Other Liabilities
Accrued expenses and other liabilities increased $29.4 million, or 20%, from December 31, 2016 primarily due an increase in unfunded commitments on various tax credit investments.
Capital
Shareholders’ equity totaled $2.154 billion, or 12% of total assets, at December 31, 2017 and $1.814 billion, or 12% of total assets, at December 31, 2016. Shareholders’ equity at December 31, 2017 included $300.8 million from the 16.5 million shares of Common Stock that were issued in conjunction with the acquisition of Anchor (MN). We paid cash dividends of $0.52 per share in 2017, which reduced equity by $72.6 million. Shares issued for reinvested dividends, stock options, restricted stock, and stock compensation plans increased shareholders’ equity by $6.9 million in 2017. Old National’s Common Stock is traded on the NASDAQ under the symbol “ONB” with 43,684 shareholders of record at December 31, 2017.
Capital Adequacy
Old National and the banking industry are subject to various regulatory capital requirements administered by the federal banking agencies. Management routinely analyzes Old National’s capital to ensure an optimized capital structure. Accordingly, such evaluations may result in Old National taking a capital action. For additional information on capital adequacy see Note 24 to the consolidated financial statements.
The Dodd-Frank Act requires bank holding companies and any subsidiary banks with consolidated assets of more than $10 billion and less than $50 billion, including Old National, to complete and publicly disclose annual stress tests. The objective of the stress test is to ensure that the financial institution has capital planning processes that account for its unique risks, and to help ensure that the institution has sufficient capital to continue operations throughout times of economic and financial stress. The stress tests are conducted with baseline, adverse, and severely adverse economic scenarios. Old National completed its annual stress test that covered a nine-quarter
47
Table of Contents
planning horizon beginning January 1, 2017 and ending on March 31, 2019 and publicly disclosed a summary of the stress test results on October 24, 2017. The stress test showed that Old National would maintain capital levels well above the regulatory guideline minimum levels for all periods and under all stress test scenarios.
Overview
Old National has adopted a Risk Appetite Statement to enable the Board of Directors, Executive Leadership Group, and Senior Management to better assess, understand, and mitigate the risks of Old National. The Risk Appetite Statement addresses the following major risks: strategic, market, liquidity, credit, operational/technology, regulatory/compliance/legal, reputational, and human resources. Our Chief Risk Officer is independent of management and reports directly to the Chair of the Board’s Enterprise Risk Management Committee. The following discussion addresses three of these major risks: credit, market, and liquidity.
Credit Risk
Credit risk represents the risk of loss arising from an obligor’s inability or failure to meet contractual payment or performance terms. Our primary credit risks result from our investment and lending activities.
Investment Activities
We carry a higher exposure to loss in our pooled trust preferred securities, which are collateralized debt obligations, due to illiquidity in that market and the performance of the underlying collateral. At December 31, 2017, we had pooled trust preferred securities with a fair value of $8.4 million, or less than 1% of the available-for-sale securities portfolio. These securities remained classified as available-for-sale and at December 31, 2017, the unrealized loss on our pooled trust preferred securities was approximately $8.2 million. The fair value of these securities should improve as we get closer to maturity. There was no OTTI recorded in 2017 or 2016.
All of our mortgage-backed securities are backed by U.S. government-sponsored or federal agencies. Municipal bonds, corporate bonds, and other debt securities are evaluated by reviewing the credit-worthiness of the issuer and general market conditions. See Note 3 to the consolidated financial statements for additional details about our investment security portfolio.
Counterparty Exposure
Counterparty exposure is the risk that the other party in a financial transaction will not fulfill its obligation. We define counterparty exposure as nonperformance risk in transactions involving federal funds sold and purchased, repurchase agreements, correspondent bank relationships, and derivative contracts with companies in the financial services industry. Old National manages exposure to counterparty risk in connection with its derivatives transactions by generally engaging in transactions with counterparties having ratings of at least A by Standard & Poor’s Rating Service or A2 by Moody’s Investors Service. Total credit exposure is monitored by counterparty, and managed within limits that management believes to be prudent. Old National’s net counterparty exposure was an asset of $182.3 million at December 31, 2017.
Lending Activities
Commercial
Commercial and industrial loans are made primarily for the purpose of financing equipment acquisition, expansion, working capital, and other general business purposes. Lease financing consists of direct financing leases and are used by commercial customers to finance capital purchases ranging from computer equipment to transportation equipment. The credit decisions for these transactions are based upon an assessment of the overall financial capacity of the applicant. A determination is made as to the applicant’s ability to repay in accordance with the proposed terms as well as an overall assessment of the risks involved. In addition to an evaluation of the applicant’s financial condition, a determination is made of the probable adequacy of the primary and secondary sources of repayment, such as additional collateral or personal guarantees, to be relied upon in the transaction. Credit agency reports of the applicant’s credit history supplement the analysis of the applicant’s creditworthiness.
48
Table of Contents
Commercial mortgages and construction loans are offered to real estate investors, developers, and builders primarily domiciled in the geographic market areas we serve: Indiana, Kentucky, Michigan, Wisconsin, and Minnesota. These loans are secured by first mortgages on real estate at LTV margins deemed appropriate for the property type, quality, location, and sponsorship. Generally, these LTV ratios do not exceed 80%. The commercial properties are predominantly non-residential properties such as retail centers, apartments, industrial properties and, to a lesser extent, more specialized properties. Substantially all of our commercial real estate loans are secured by properties located in our primary market area.
In the underwriting of our commercial real estate loans, we obtain appraisals for the underlying properties. Decisions to lend are based on the economic viability of the property and the creditworthiness of the borrower. In evaluating a proposed commercial real estate loan, we primarily emphasize the ratio of the property’s projected net cash flows to the loan’s debt service requirement. The debt service coverage ratio normally is not less than 120% and it is computed after deduction for a vacancy factor and property expenses as appropriate. In addition, a personal guarantee of the loan or a portion thereof is often required from the principal(s) of the borrower. In most cases, we require title insurance insuring the priority of our lien, fire, and extended coverage casualty insurance, and flood insurance, if appropriate, in order to protect our security interest in the underlying property. In addition, business interruption insurance or other insurance may be required.
Construction loans are underwritten against projected cash flows derived from rental income, business income from an owner-occupant, or the sale of the property to an end-user. We may mitigate the risks associated with these types of loans by requiring fixed-price construction contracts, performance and payment bonding, controlled disbursements, and pre-sale contracts or pre-lease agreements.
Consumer
We offer a variety of first mortgage and junior lien loans to consumers within our markets, with residential home mortgages comprising our largest consumer loan category. These loans are secured by a primary residence and are underwritten using traditional underwriting systems to assess the credit risks of the consumer. Decisions are primarily based on LTV ratios, DTI ratios, liquidity, and credit scores. A maximum LTV ratio of 80% is generally required, although higher levels are permitted with mortgage insurance or other mitigating factors. We offer fixed rate mortgages and variable rate mortgages with interest rates that are subject to change every year after the first, third, fifth, or seventh year, depending on the product and are based on fully-indexed rates such as LIBOR. We do not offer payment-option facilities, sub-prime loans, or any product with negative amortization.
Home equity loans are secured primarily by second mortgages on residential property of the borrower. The underwriting terms for the home equity product generally permits borrowing availability, in the aggregate, up to 90% of the appraised value of the collateral property at the time of origination. We offer fixed and variable rate home equity loans, with variable rate loans underwritten at fully-indexed rates. Decisions are primarily based on LTV ratios, DTI ratios, and credit scores. We do not offer home equity loan products with reduced documentation.
Automobile loans include loans and leases secured by new or used automobiles. We originate automobile loans and leases primarily on an indirect basis through selected dealerships. We require borrowers to maintain collision insurance on automobiles securing consumer loans, with us listed as loss payee. Our procedures for underwriting automobile loans include an assessment of an applicant’s overall financial capacity, including credit history and the ability to meet existing obligations and payments on the proposed loan. Although an applicant’s creditworthiness is the primary consideration, the underwriting process also includes a comparison of the value of the collateral security to the proposed loan amount.
We assumed student loans in the acquisition of Anchor (WI) in May 2016. Student loans are guaranteed by the government from 97% to 100% and totaled $68.2 million at December 31, 2017, compared to $77.1 million at December 31, 2016.
Asset Quality
Community-based lending personnel, along with region-based independent underwriting and analytic support staff, extend credit under guidelines established and administered by our Enterprise Risk Committee. This committee, which meets quarterly, is made up of outside directors. The committee monitors credit quality through its review of information such as delinquencies, credit exposures, peer comparisons, problem loans, and charge-offs. In addition, the committee reviews and approves recommended loan policy changes to assure it remains appropriate for the current lending environment.
49
Table of Contents
We lend primarily to small- and medium-sized commercial and commercial real estate clients in various industries including manufacturing, agribusiness, transportation, mining, wholesaling, and retailing. Old National manages concentrations of credit exposure by industry, product, geography, customer relationship, and loan size, with no concentration of loans exceeding 10% of its portfolio. At December 31, 2017, we had minimal exposure to foreign borrowers and no sovereign debt. Our policy is to concentrate our lending activity in the geographic market areas we serve, primarily Indiana, Kentucky, Michigan, Wisconsin, and Minnesota. We are experiencing a slow and gradual improvement in the economy of our principal markets. Management expects that trends in under-performing, criticized, and classified loans will be influenced by the degree to which the economy strengthens or weakens.
On November 1, 2017, Old National closed on its acquisition of Anchor (MN). As of the closing date of the acquisition, loans totaled $1.594 billion and other real estate owned totaled $1.1 million. In accordance with accounting for business combinations, there was no allowance brought forward on any of the acquired loans, as the credit losses evident in the loans were included in the determination of the fair value of the loans at the acquisition date. Old National reviewed the acquired loans and determined that as of December 31, 2017, $47.0 million met the definition of criticized and $26.3 million were considered classified (of which $15.4 million are reported with nonaccrual loans). Our current preference would be to work these loans and avoid foreclosure actions unless additional credit deterioration becomes apparent. These acquired impaired loans, along with $1.1 million of other real estate owned, are included in our summary of under-performing, criticized, and classified assets found below.
50
Table of Contents
Summary of under-performing, criticized, and classified assets at December 31:
| (dollars in thousands) |
2017 | 2016 | 2015 | 2014 | 2013 | |||||||||||||||
| Nonaccrual loans: |
||||||||||||||||||||
| Commercial |
$ | 27,202 | $ | 56,585 | $ | 57,536 | $ | 38,460 | $ | 28,635 | ||||||||||
| Commercial real estate |
62,425 | 44,026 | 47,350 | 67,402 | 52,363 | |||||||||||||||
| Residential real estate |
22,171 | 17,674 | 14,953 | 13,968 | 10,333 | |||||||||||||||
| Consumer |
13,129 | 13,122 | 5,198 | 5,903 | 5,318 | |||||||||||||||
| Covered loans (1) |
— | — | 7,336 | 15,124 | 31,793 | |||||||||||||||
|
|
|
|
|
|
|
|
|
|
|
|||||||||||
| Total nonaccrual loans (2) |
124,927 | 131,407 | 132,373 | 140,857 | 128,442 | |||||||||||||||
| Renegotiated loans not on nonaccrual: |
||||||||||||||||||||
| Noncovered loans |
19,589 | 14,376 | 14,147 | 12,710 | 15,596 | |||||||||||||||
| Covered loans (1) |
— | — | 138 | 148 | 148 | |||||||||||||||
| Past due loans (90 days or more and still accruing): |
||||||||||||||||||||
| Commercial |
144 | 23 | 565 | 33 | — | |||||||||||||||
| Commercial real estate |
— | — | — | 138 | — | |||||||||||||||
| Residential real estate |
— | 2 | 114 | 1 | 35 | |||||||||||||||
| Consumer |
750 | 303 | 227 | 286 | 189 | |||||||||||||||
| Covered loans (1) |
— | — | 10 | — | 14 | |||||||||||||||
|
|
|
|
|
|
|
|
|
|
|
|||||||||||
| Total past due loans |
894 | 328 | 916 | 458 | 238 | |||||||||||||||
| Other real estate owned |
8,810 | 18,546 | 7,594 | 7,241 | 7,562 | |||||||||||||||
| Other real estate owned, covered (1) |
— | — | 4,904 | 9,121 | 13,670 | |||||||||||||||
|
|
|
|
|
|
|
|
|
|
|
|||||||||||
| Total under-performing assets |
$ | 154,220 | $ | 164,657 | $ | 160,072 | $ | 170,535 | $ | 165,656 | ||||||||||
|
|
|
|
|
|
|
|
|
|
|
|||||||||||
| Classified loans (includes nonaccrual, renegotiated, past due 90 days, and other problem loans) |
$ | 226,583 | $ | 220,429 | $ | 204,710 | $ | 233,486 | $ | 159,783 | ||||||||||
| Classified loans, covered (1) |
— | — | 8,584 | 17,413 | 35,500 | |||||||||||||||
| Other classified assets (3) |
4,556 | 7,063 | 6,857 | 14,752 | 32,650 | |||||||||||||||
| Criticized loans |
188,085 | 95,462 | 132,898 | 194,809 | 135,401 | |||||||||||||||
| Criticized loans, covered (1) |
— | — | 1,449 | 4,525 | 8,421 | |||||||||||||||
|
|
|
|
|
|
|
|
|
|
|
|||||||||||
| Total criticized and classified assets |
$ | 419,224 | $ | 322,954 | $ | 354,498 | $ | 464,985 | $ | 371,755 | ||||||||||
|
|
|
|
|
|
|
|
|
|
|
|||||||||||
| Asset Quality Ratios including covered assets: |
||||||||||||||||||||
| Non-performing loans/total loans (4) (5) |
1.30 | % | 1.62 | % | 2.11 | % | 2.43 | % | 2.84 | % | ||||||||||
| Under-performing assets/total loans and other real estate owned (4) |
1.39 | 1.82 | 2.30 | 2.69 | 3.25 | |||||||||||||||
| Under-performing assets/total assets |
0.88 | 1.11 | 1.33 | 1.46 | 1.73 | |||||||||||||||
| Allowance for loan losses/ under-performing assets (6) |
32.67 | 30.25 | 32.63 | 28.06 | 28.46 | |||||||||||||||
| Allowance for loan losses/nonaccrual loans (2) |
40.33 | 37.90 | 39.46 | 33.97 | 36.71 | |||||||||||||||
| (1) | Old National entered into separate loss sharing agreements with the FDIC providing for specified credit loss protection for substantially all acquired single family residential loans, commercial loans, and other real estate owned. On June 22, 2016, Old National entered into an early termination agreement with the FDIC that terminated all loss share agreements. Old National reclassified all covered assets to noncovered assets effective June 22, 2016. |
| (2) | Includes approximately $12.6 million, $16.7 million, $15.9 million, $41.2 million, and $38.3 million for 2017, 2016, 2015, 2014, and 2013, respectively, of purchased credit impaired loans that are categorized as nonaccrual because the collection of principal or interest is doubtful. These loans are accounted for under FASB ASC 310-30 and accordingly treated as performing assets. |
| (3) | Includes 2 pooled trust preferred securities, 1 municipal security, and 1 insurance policy at December 31, 2017. |
| (4) | Loans exclude loans held for sale. |
| (5) | Non-performing loans include nonaccrual and renegotiated loans. |
| (6) | Because the acquired loans were recorded at fair value in accordance with ASC 805 at the date of acquisition, the credit risk is incorporated in the fair value recorded. No allowance for loan losses is recorded on the acquisition date. |
Under-performing assets totaled $154.2 million at December 31, 2017, compared to $164.7 million at December 31, 2016. Under-performing assets as a percentage of total loans and other real estate owned at December 31, 2017 were 1.39%, a 43 basis point improvement from 1.82% at December 31, 2016.
Nonaccrual loans decreased $6.5 million from December 31, 2016 to December 31, 2017 primarily due to a decrease in nonaccrual commercial loans. Substantially offsetting this decrease were increases in nonaccrual commercial real estate and residential real estate loans. Nonaccrual loans at December 31, 2017 include $15.4 million of loans related to the Anchor (MN) acquisition. As a percentage of nonaccrual loans, the allowance for
51
Table of Contents
loan losses was 40.33% at December 31, 2017, compared to 37.90% at December 31, 2016. PCI loans that were included in the nonaccrual category because the collection of principal or interest is doubtful totaled $12.6 million at December 31, 2017, compared to $16.7 million at December 31, 2016. However, they are accounted for under FASB ASC 310-30 and accordingly treated as performing assets.
Interest income of approximately $6.7 million and $6.4 million would have been recorded on nonaccrual and renegotiated loans outstanding at December 31, 2017 and 2016, respectively, if such loans had been accruing interest throughout the year in accordance with their original terms. Excluding PCI loans accounted for under ASC 310-30, the amount of interest income actually recorded on nonaccrual and renegotiated loans was $1.6 million in 2017 and $1.4 million in 2016. We had $34.0 million of renegotiated loans which are included in nonaccrual loans at December 31, 2017, compared to $26.3 million at December 31, 2016.
Total criticized and classified assets were $419.2 million at December 31, 2017, an increase of $96.3 million from December 31, 2016. Other classified assets include investment securities that fell below investment grade rating totaling $4.6 million at December 31, 2017, compared to $7.1 million at December 31, 2016.
Old National may choose to restructure the contractual terms of certain loans. The decision to restructure a loan, versus aggressively enforcing the collection of the loan, may benefit Old National by increasing the ultimate probability of collection.
Any loans that are modified are reviewed by Old National to identify if a TDR has occurred, which is when, for economic or legal reasons related to a borrower’s financial difficulties, Old National Bank grants a concession to the borrower that it would not otherwise consider. Terms may be modified to fit the ability of the borrower to repay in line with its current financial status. The modification of the terms of such loans include one or a combination of the following: a reduction of the stated interest rate of the loan, an extension of the maturity date at a stated rate of interest lower than the current market rate of new debt with similar risk, or a permanent reduction of the recorded investment of the loan.
Loans modified in a TDR are typically placed on nonaccrual status until we determine the future collection of principal and interest is reasonably assured, which generally requires that the borrower demonstrate a period of performance according to the restructured terms for six months.
If we are unable to resolve a nonperforming loan issue, the credit will be charged off when it is apparent there will be a loss. For large commercial type loans, each relationship is individually analyzed for evidence of apparent loss based on quantitative benchmarks or subjectively based upon certain events or particular circumstances. Generally, Old National charges off small commercial loans scored through our small business credit center with contractual balances under $250,000 that are 90 days or more delinquent and do not have adequate collateral support. For residential and consumer loans, a charge off is recorded at the time foreclosure is initiated or when the loan becomes 120 to 180 days past due, whichever is earlier.
For commercial TDRs, an allocated reserve is established within the allowance for loan losses for the difference between the carrying value of the loan and its computed value. To determine the value of the loan, one of the following methods is selected: (1) the present value of expected cash flows discounted at the loan’s original effective interest rate, (2) the loan’s observable market price, or (3) the fair value of the collateral value, if the loan is collateral dependent. The allocated reserve is established as the difference between the carrying value of the loan and the collectable value. If there are significant changes in the amount or timing of the loan’s expected future cash flows, impairment is recalculated and the valuation allowance is adjusted accordingly.
When a residential or consumer loan is identified as a TDR, the loan is typically written down to its collateral value less selling costs.
At December 31, 2017, our TDRs consisted of $12.1 million of commercial loans, $34.7 million of commercial real estate loans, $3.3 million of residential loans, and $3.9 million of consumer loans totaling $54.0 million. Approximately $34.0 million of the TDRs at December 31, 2017 were included with nonaccrual loans. At December 31, 2016, our TDRs consisted of $16.8 million of commercial loans, $18.3 million of commercial real estate loans, $3.0 million of residential loans, and $2.6 million of consumer loans totaling $40.7 million. Approximately $26.3 million of the TDRs at December 31, 2016 were included with nonaccrual loans.
52
Table of Contents
Old National has allocated specific reserves to customers whose loan terms have been modified in TDRs totaling $5.7 million at December 31, 2017 and $4.0 million at December 31, 2016. As of December 31, 2017, Old National had committed to lend an additional $4.1 million to customers with outstanding loans that are classified as TDRs.
The terms of certain other loans were modified during 2017 that did not meet the definition of a TDR. It is our process to review all classified and criticized loans that, during the period, have been renewed, have entered into a forbearance agreement, have gone from principal and interest to interest only, or have extended the maturity date. In order to determine whether a borrower is experiencing financial difficulty, an evaluation is performed of the probability that the borrower will be in payment default on its debt in the foreseeable future without the modification. The evaluation is performed under our internal underwriting policy. We also evaluate whether a concession has been granted or if we were adequately compensated through a market interest rate, additional collateral, or a bona fide guarantee. We also consider whether the modification was insignificant relative to the other terms of the agreement or the delay in a payment.
PCI loans are not considered impaired until after the point at which there has been a degradation of cash flows below our expected cash flows at acquisition. If a PCI loan is subsequently modified, and meets the definition of a TDR, it will be removed from PCI accounting and accounted for as a TDR only if the PCI loan was being accounted for individually. If the PCI loan is being accounted for as part of a pool, it will not be removed from the pool. At December 31, 2017, it has not been necessary to remove any loans from PCI accounting.
In general, once a modified loan is considered a TDR, the loan will always be considered a TDR, and therefore impaired, until it is paid in full, otherwise settled, sold, or charged off. However, guidance also permits for loans to be removed from TDR status when subsequently restructured under these circumstances: (1) at the time of the subsequent restructuring, the borrower is not experiencing financial difficulties, and this is documented by a current credit evaluation at the time of the restructuring, (2) under the terms of the subsequent restructuring agreement, the institution has granted no concession to the borrower; and (3) the subsequent restructuring agreement includes market terms that are no less favorable than those that would be offered for a comparable new loan. For loans subsequently restructured that have cumulative principal forgiveness, the loan should continue to be measured in accordance with ASC 310-10, Receivables – Overall. However, consistent with ASC 310-40-50-2, Troubled Debt Restructurings by Creditors, Creditor Disclosure of Troubled Debt Restructurings, the loan would not be required to be reported in the years following the restructuring if the subsequent restructuring meets both of these criteria: (1) has an interest rate at the time of the subsequent restructuring that is not less than a market interest rate; and (2) is performing in compliance with its modified terms after the subsequent restructuring.
To provide for the risk of loss inherent in extending credit, we maintain an allowance for loan losses. The allowance for loan losses is maintained at a level believed adequate by management to absorb probable losses incurred in the consolidated loan portfolio. Management’s evaluation of the adequacy of the allowance is an estimate based on reviews of individual loans, pools of homogeneous loans, assessments of the impact of current and anticipated economic conditions on the portfolio, and historical loss experience.
53
Table of Contents
The activity in our allowance for loan losses was as follows:
| (dollars in thousands) |
2017 | 2016 | 2015 | 2014 | 2013 | |||||||||||||||
| Balance at beginning of period |
$ | 49,808 | $ | 52,233 | $ | 47,849 | $ | 47,145 | $ | 54,763 | ||||||||||
| Loans charged-off: |
||||||||||||||||||||
| Commercial |
1,108 | 5,047 | 3,513 | 3,535 | 4,435 | |||||||||||||||
| Commercial real estate |
3,700 | 2,632 | 1,921 | 3,647 | 9,302 | |||||||||||||||
| Residential real estate |
985 | 800 | 1,039 | 793 | 1,487 | |||||||||||||||
| Consumer credit |
6,924 | 6,131 | 6,404 | 4,675 | 6,279 | |||||||||||||||
|
|
|
|
|
|
|
|
|
|
|
|||||||||||
| Total charge-offs |
12,717 | 14,610 | 12,877 | 12,650 | 21,503 | |||||||||||||||
|
|
|
|
|
|
|
|
|
|
|
|||||||||||
| Recoveries on charged-off loans: |
||||||||||||||||||||
| Commercial |
2,281 | 3,102 | 5,218 | 3,125 | 4,723 | |||||||||||||||
| Commercial real estate |
3,777 | 4,763 | 4,685 | 3,871 | 6,838 | |||||||||||||||
| Residential real estate |
255 | 174 | 354 | 205 | 310 | |||||||||||||||
| Consumer credit |
3,927 | 3,186 | 4,081 | 3,056 | 4,333 | |||||||||||||||
|
|
|
|
|
|
|
|
|
|
|
|||||||||||
| Total recoveries |
10,240 | 11,225 | 14,338 | 10,257 | 16,204 | |||||||||||||||
|
|
|
|
|
|
|
|
|
|
|
|||||||||||
| Net charge-offs (recoveries) |
2,477 | 3,385 | (1,461 | ) | 2,393 | 5,299 | ||||||||||||||
| Provision for loan losses |
3,050 | 960 | 2,923 | 3,097 | (2,319 | ) | ||||||||||||||
|
|
|
|
|
|
|
|
|
|
|
|||||||||||
| Balance at end of period |
$ | 50,381 | $ | 49,808 | $ | 52,233 | $ | 47,849 | $ | 47,145 | ||||||||||
|
|
|
|
|
|
|
|
|
|
|
|||||||||||
| Average loans for the year (1) |
$ | 9,525,888 | $ | 8,265,169 | $ | 6,756,135 | $ | 5,703,294 | $ | 5,135,139 | ||||||||||
| Asset Quality Ratios: |
||||||||||||||||||||
| Allowance/year-end loans (1) |
0.45 | % | 0.55 | % | 0.75 | % | 0.76 | % | 0.93 | % | ||||||||||
| Allowance/average loans (1) |
0.53 | 0.60 | 0.77 | 0.84 | 0.92 | |||||||||||||||
| Net charge-offs (recoveries)/average loans (2) |
0.03 | 0.04 | (0.02 | ) | 0.04 | 0.10 | ||||||||||||||
| (1) | Loans exclude loans held for sale. |
| (2) | Net charge-offs include write-downs on loans transferred to held for sale. |
The allowance for loan losses increased $0.6 million, or 1%, from December 31, 2016 to December 31, 2017. Net charge-offs totaled $2.5 million in 2017 compared to net charge-offs of $3.4 million in 2016. There were no industry segments representing a significant share of total net charge-offs. Net charge-offs (recoveries) to average loans was 0.03% in 2017 compared to 0.04% in 2016. Over the last twelve months, net charge-offs have remained low. Continued loan growth in future periods, a decline in our current level of recoveries, or an increase in charge-offs could result in an increase in provision expense.
As a percentage of total loans, the allowance ranged from 0.45% to 0.93% for the last five years, and was 0.45% at December 31, 2017. Our ratio of allowance for loan losses to total loans declined as of December 31, 2017 with the addition of Anchor (MN)’s $1.594 billion loan portfolio. In accordance with ASC 805, no allowance for loan losses is recorded at the date of acquisition and a reserve is only established to absorb any subsequent credit deterioration or adverse changes in expected cash flows.
54
Table of Contents
The following table provides additional details of the components of the allowance for loan losses, including ASC 450, Contingencies, for loans collectively evaluated for impairment, ASC 310-10, Receivables, for loans individually evaluated for impairment, and ASC 310-30, Loans and Debt Securities Acquired with Deteriorated Credit Quality, for loans acquired with deteriorated credit quality:
| (dollars in thousands) |
Collectively Evaluated for Impairment |
Individually Evaluated for Impairment |
Acquired with Deteriorated Credit Quality |
Total | ||||||||||||
| Loan balance |
$ | 11,087,585 | $ | 96,264 | $ | 70,810 | $ | 11,254,659 | ||||||||
| Remaining purchase discount |
(105,321 | ) | (3,933 | ) | (27,284 | ) | (136,538 | ) | ||||||||
|
|
|
|
|
|
|
|
|
|||||||||
| Loans, net of discount |
$ | 10,982,264 | $ | 92,331 | $ | 43,526 | $ | 11,118,121 | ||||||||
|
|
|
|
|
|
|
|
|
|||||||||
| Allowance, January 1, 2017 |
$ | 41,532 | $ | 7,998 | $ | 278 | $ | 49,808 | ||||||||
| Charge-offs |
(7,862 | ) | (4,490 | ) | (365 | ) | (12,717 | ) | ||||||||
| Recoveries |
3,951 | 5,423 | 866 | 10,240 | ||||||||||||
| Provision expense |
2,516 | 1,147 | (613 | ) | 3,050 | |||||||||||
|
|
|
|
|
|
|
|
|
|||||||||
| Allowance, December 31, 2017 |
$ | 40,137 | $ | 10,078 | $ | 166 | $ | 50,381 | ||||||||
|
|
|
|
|
|
|
|
|
|||||||||
We maintain an allowance for losses on unfunded commercial lending commitments and letters of credit to provide for the risk of loss inherent in these arrangements. The allowance is computed using a methodology similar to that used to determine the allowance for loan losses, modified to take into account the probability of a drawdown on the commitment. The reserve for unfunded loan commitments is classified as a liability account on the balance sheet and totaled $3.1 million at December 31, 2017, compared to $3.2 million at December 31, 2016.
The following table details the allowance for loan losses by loan category and the percent of loans in each category compared to total loans at December 31.
| 2017 | 2016 | 2015 | 2014 | 2013 | ||||||||||||||||||||||||||||||||||||
| % of | % of | % of | % of | % of | ||||||||||||||||||||||||||||||||||||
| Loans | Loans | Loans | Loans | Loans | ||||||||||||||||||||||||||||||||||||
| Allowance | to Total | Allowance | to Total |
Allowance | to Total |
Allowance | to Total | Allowance | to Total | |||||||||||||||||||||||||||||||
| (dollars in thousands) |
Amount | Loans | Amount | Loans | Amount | Loans | Amount | Loans | Amount | Loans | ||||||||||||||||||||||||||||||
| Commercial |
$ | 19,246 | 24.4 | % | $ | 21,481 | 21.3 | % | $ | 25,568 | 26.0 | % | $ | 17,401 | 25.8 | % | $ | 15,013 | 27.0 | % | ||||||||||||||||||||
| Commercial real estate |
21,436 | 39.2 | 18,173 | 34.7 | 15,993 | 26.6 | 17,348 | 27.1 | 19,031 | 22.8 | ||||||||||||||||||||||||||||||
| Residential real estate |
1,763 | 19.5 | 1,643 | 23.2 | 2,051 | 23.7 | 2,962 | 24.1 | 3,123 | 26.8 | ||||||||||||||||||||||||||||||
| Consumer credit |
7,936 | 16.9 | 8,511 | 20.8 | 7,684 | 22.2 | 6,586 | 20.7 | 4,574 | 19.1 | ||||||||||||||||||||||||||||||
| Covered loans |
— | — | — | — | 937 | 1.5 | 3,552 | 2.3 | 5,404 | 4.3 | ||||||||||||||||||||||||||||||
|
|
|
|
|
|
|
|
|
|
|
|
|
|
|
|
|
|
|
|
|
|||||||||||||||||||||
| Total |
$ | 50,381 | 100.0 | % | $ | 49,808 | 100.0 | % | $ | 52,233 | 100.0 | % | $ | 47,849 | 100.0 | % | $ | 47,145 | 100.0 | % | ||||||||||||||||||||
|
|
|
|
|
|
|
|
|
|
|
|
|
|
|
|
|
|
|
|
|
|||||||||||||||||||||
Market Risk
Market risk is the risk that the estimated fair value of our assets, liabilities, and derivative financial instruments will decline as a result of changes in interest rates or financial market volatility, or that our net income will be significantly reduced by interest rate changes.
The objective of our interest rate management process is to maximize net interest income while operating within acceptable limits established for interest rate risk and maintaining adequate levels of funding and liquidity.
Potential cash flows, sales, or replacement value of many of our assets and liabilities, especially those that earn or pay interest, are sensitive to changes in the general level of interest rates. This interest rate risk arises primarily from our normal business activities of gathering deposits and extending loans. Many factors affect our exposure to changes in interest rates, such as general economic and financial conditions, customer preferences, historical pricing relationships, and re-pricing characteristics of financial instruments. Our earnings can also be affected by the monetary and fiscal policies of the U.S. Government and its agencies, particularly the Federal Reserve.
55
Table of Contents
In managing interest rate risk, we, through the Funds Management Committee, a committee of the Board of Directors, establish guidelines, for asset and liability management, including measurement of short and long-term sensitivities to changes in interest rates. Based on the results of our analysis, we may use different techniques to manage changing trends in interest rates including:
| • | adjusting balance sheet mix or altering interest rate characteristics of assets and liabilities; |
| • | changing product pricing strategies; |
| • | modifying characteristics of the investment securities portfolio; or |
| • | using derivative financial instruments, to a limited degree. |
A key element in our ongoing process is to measure and monitor interest rate risk using a model to quantify the impact of changing interest rates on Old National. The model quantifies the effects of various possible interest rate scenarios on projected net interest income. The model measures the impact on net interest income relative to a base case scenario. The base case scenario assumes that the balance sheet and interest rates are held at current levels. The model shows our projected net interest income sensitivity based on interest rate changes only and does not consider other forecast assumptions.
The following table illustrates our projected net interest income sensitivity over a two year cumulative horizon based on the asset/liability model as of December 31, 2017 and 2016:
| Immediate Rate Decrease -50 Basis Points |
Immediate Rate Increase | |||||||||||||||||||
| +100 | +200 | +300 | ||||||||||||||||||
| (dollars in thousands) |
Base | Basis Points | Basis Points | Basis Points | ||||||||||||||||
| December 31, 2017 |
||||||||||||||||||||
| Projected interest income: |
||||||||||||||||||||
| Money market, other interest earning investments, and investment securities |
$ | 225,619 | $ | 234,618 | $ | 247,478 | $ | 259,531 | $ | 272,707 | ||||||||||
| Loans |
856,693 | 914,205 | 1,026,924 | 1,138,107 | 1,248,623 | |||||||||||||||
|
|
|
|
|
|
|
|
|
|
|
|||||||||||
| Total interest income |
1,082,312 | 1,148,823 | 1,274,402 | 1,397,638 | 1,521,330 | |||||||||||||||
|
|
|
|
|
|
|
|
|
|
|
|||||||||||
| Projected interest expense: |
||||||||||||||||||||
| Deposits |
33,625 | 60,527 | 135,504 | 210,475 | 285,441 | |||||||||||||||
| Borrowings |
84,359 | 101,521 | 135,861 | 170,210 | 204,542 | |||||||||||||||
|
|
|
|
|
|
|
|
|
|
|
|||||||||||
| Total interest expense |
117,984 | 162,048 | 271,365 | 380,685 | 489,983 | |||||||||||||||
|
|
|
|
|
|
|
|
|
|
|
|||||||||||
| Net interest income |
$ | 964,328 | $ | 986,775 | $ | 1,003,037 | $ | 1,016,953 | $ | 1,031,347 | ||||||||||
|
|
|
|
|
|
|
|
|
|
|
|||||||||||
| Change from base |
$ | (22,447 | ) | $ | 16,262 | $ | 30,178 | $ | 44,572 | |||||||||||
| % change from base |
-2.27 | % | 1.65 | % | 3.06 | % | 4.52 | % | ||||||||||||
| December 31, 2016 |
||||||||||||||||||||
| Projected interest income: |
||||||||||||||||||||
| Money market, other interest earning investments, and investment securities |
$ | 226,586 | $ | 234,297 | $ | 246,329 | $ | 255,974 | $ | 265,942 | ||||||||||
| Loans |
628,100 | 672,942 | 762,859 | 852,007 | 940,961 | |||||||||||||||
|
|
|
|
|
|
|
|
|
|
|
|||||||||||
| Total interest income |
854,686 | 907,239 | 1,009,188 | 1,107,981 | 1,206,903 | |||||||||||||||
|
|
|
|
|
|
|
|
|
|
|
|||||||||||
| Projected interest expense: |
||||||||||||||||||||
| Deposits |
21,039 | 40,795 | 103,290 | 165,778 | 228,259 | |||||||||||||||
| Borrowings |
48,624 | 61,043 | 89,063 | 117,004 | 144,902 | |||||||||||||||
|
|
|
|
|
|
|
|
|
|
|
|||||||||||
| Total interest expense |
69,663 | 101,838 | 192,353 | 282,782 | 373,161 | |||||||||||||||
|
|
|
|
|
|
|
|
|
|
|
|||||||||||
| Net interest income |
$ | 785,023 | $ | 805,401 | $ | 816,835 | $ | 825,199 | $ | 833,742 | ||||||||||
|
|
|
|
|
|
|
|
|
|
|
|||||||||||
| Change from base |
$ | (20,378 | ) | $ | 11,434 | $ | 19,798 | $ | 28,341 | |||||||||||
| % change from base |
-2.53 | % | 1.42 | % | 2.46 | % | 3.52 | % | ||||||||||||
Our asset sensitivity decreased slightly year over year primarily due to changes in our balance sheet mix, investment duration, and prepayment speed behavior.
56
Table of Contents
A key element in the measurement and modeling of interest rate risk is the re-pricing assumptions of our transaction deposit accounts, which have no contractual maturity dates. We assume this deposit base is comprised of both core and more volatile balances and consists of both non-interest bearing and interest bearing accounts. Core deposit balances are assumed to be less interest rate sensitive and provide longer term funding. Volatile balances are assumed to be more interest rate sensitive and shorter in term. As part of our semi-static balance sheet modeling, we assume interest rates paid on the volatile deposits move in conjunction with changes in interest rates, in order to retain these deposits. This may include current non-interest bearing accounts.
Because the models are driven by expected behavior in various interest rate scenarios and many factors besides market interest rates affect our net interest income, we recognize that model outputs are not guarantees of actual results. For this reason, we model many different combinations of interest rates and balance sheet assumptions to understand our overall sensitivity to market interest rate changes, including shocks, yield curve flattening, yield curve steepening, as well as forecasts of likely interest rate scenarios. At December 31, 2017, our projected net interest income sensitivity based on the asset/liability models we utilize was within the limits of our interest rate risk policy for the scenarios tested.
We use derivative instruments, primarily interest rate swaps, to mitigate interest rate risk, including certain cash flow hedges on variable-rate debt with a notional amount of $675 million at December 31, 2017. Our derivatives had an estimated fair value loss of $2.2 million at December 31, 2017, compared to an estimated fair value loss of $5.9 million at December 31, 2016. See Note 21 to the consolidated financial statements for further discussion of derivative financial instruments.
Liquidity Risk
Liquidity risk arises from the possibility that we may not be able to satisfy current or future financial commitments, or may become unduly reliant on alternative funding sources. The Funds Management Committee of the Board of Directors establishes liquidity risk guidelines and, along with the Balance Sheet Management Committee, monitors liquidity risk. The objective of liquidity management is to ensure we have the ability to fund balance sheet growth and meet deposit and debt obligations in a timely and cost-effective manner. Management monitors liquidity through a regular review of asset and liability maturities, funding sources, and loan and deposit forecasts. We maintain strategic and contingency liquidity plans to ensure sufficient available funding to satisfy requirements for balance sheet growth, properly manage capital markets’ funding sources and to address unexpected liquidity requirements.
Loan repayments and maturing investment securities are a relatively predictable source of funds. However, deposit flows, calls of investment securities and prepayments of loans and mortgage-related securities are strongly influenced by interest rates, the housing market, general and local economic conditions, and competition in the marketplace. We continually monitor marketplace trends to identify patterns that might improve the predictability of the timing of deposit flows or asset prepayments.
A time deposit maturity schedule for Old National Bank is shown in the following table at December 31, 2017.
| (dollars in thousands) | ||||||||
| Maturity Bucket |
Amount | Rate | ||||||
| 2018 |
$ | 1,111,266 | 0.30 | % | ||||
| 2019 |
229,944 | 0.97 | ||||||
| 2020 |
139,689 | 1.44 | ||||||
| 2021 |
62,777 | 1.40 | ||||||
| 2022 |
45,802 | 1.42 | ||||||
| 2023 and beyond |
44,958 | 1.78 | ||||||
|
|
|
|
|
|||||
| Total |
$ | 1,634,436 | 1.02 | % | ||||
|
|
|
|
|
|||||
57
Table of Contents
Our ability to acquire funding at competitive prices is influenced by rating agencies’ views of our credit quality, liquidity, capital, and earnings. Moody’s Investor Service places us in an investment grade that indicates a low risk of default. For both Old National and Old National Bank:
| • | Moody’s Investor Service affirmed the Long-Term Rating of A3 of Old National’s senior unsecured/issuer rating on August 9, 2017. |
| • | Moody’s Investor Service affirmed Old National Bank’s long-term deposit rating of Aa3 on August 9, 2017. The bank’s short-term deposit rating was affirmed at P-1 and the bank’s issuer rating was affirmed at A3. |
The rating outlook from Moody’s Investor Service is negative. Moody’s Investor Service concluded a rating review of Old National Bank on August 9, 2017.
The credit ratings of Old National and Old National Bank at December 31, 2017 are shown in the following table.
| Moody’s Investor Service | ||||
| Long-term | Short-term | |||
| Old National |
A3 | N/A | ||
| Old National Bank |
Aa3 | P-1 | ||
N/A = not applicable
Old National Bank maintains relationships in capital markets with brokers and dealers to issue certificates of deposit and short-term and medium-term bank notes as well. At December 31, 2017, Old National and its subsidiaries had the following availability of liquid funds and borrowings:
| (dollars in thousands) |
Parent Company |
Subsidiaries | ||||||
| Available liquid funds: |
||||||||
| Cash and due from banks |
$ | 46,886 | $ | 243,546 | ||||
| Unencumbered government-issued debt securities |
— | 1,252,299 | ||||||
| Unencumbered investment grade municipal securities |
— | 664,494 | ||||||
| Unencumbered corporate securities |
— | 142,413 | ||||||
| Availability of borrowings: |
||||||||
| Amount available from Federal Reserve discount window* |
— | 470,828 | ||||||
| Amount available from Federal Home Loan Bank Indianapolis* |
— | 471,207 | ||||||
|
|
|
|
|
|||||
| Total available funds |
$ | 46,886 | $ | 3,244,787 | ||||
|
|
|
|
|
|||||
| * | Based on collateral pledged |
The Parent Company (Old National Bancorp) has routine funding requirements consisting primarily of operating expenses, dividends to shareholders, debt service, net derivative cash flows, and funds used for acquisitions. The Parent Company can obtain funding to meet its obligations from dividends and management fees collected from its subsidiaries, operating line of credit, and through the issuance of debt securities. Additionally, the Parent Company has a shelf registration in place with the SEC permitting ready access to the public debt and equity markets. At December 31, 2017, the Parent Company’s other borrowings outstanding were $230.7 million.
Federal banking laws regulate the amount of dividends that may be paid by banking subsidiaries without prior approval. Prior regulatory approval is required if dividends to be declared in any year would exceed net earnings of the current year plus retained net profits for the preceding two years. Prior regulatory approval to pay dividends was not required in 2016 or 2017 and is not currently required.
OFF-BALANCE SHEET ARRANGEMENTS
Off-balance sheet arrangements include commitments to extend credit and financial guarantees. Commitments to extend credit and financial guarantees are used to meet the financial needs of our customers. Our banking affiliates have entered into various agreements to extend credit, including loan commitments of $3.144 billion and standby letters of credit of $68.7 million at December 31, 2017. At December 31, 2017, approximately $2.896 billion of the
58
Table of Contents
loan commitments had fixed rates and $248.1 million had floating rates, with the floating interest rates ranging from 0% to 18%. At December 31, 2016, loan commitments were $2.354 billion and standby letters of credit were $51.7 million. The term of these off-balance sheet arrangements is typically one year or less.
Old National is a party in three separate risk participation transactions of interest rate swaps, which had total notional amount of $18.0 million at December 31, 2017.
CONTRACTUAL OBLIGATIONS, COMMITMENTS, AND CONTINGENT LIABILITIES
The following table presents our significant fixed and determinable contractual obligations and significant commitments at December 31, 2017. Further discussion of each obligation or commitment is included in the referenced note to the consolidated financial statements.
| Payments Due In | ||||||||||||||||||||||||
| (dollars in thousands) |
Note Reference |
One Year or Less |
One to Three Years |
Three to Five Years |
Over Five Years |
Total | ||||||||||||||||||
| Deposits without stated maturity |
$ | 10,971,328 | $ | — | $ | — | $ | — | $ | 10,971,328 | ||||||||||||||
| IRAs, consumer, and brokered certificates of deposit |
11 | 1,111,266 | 369,633 | 108,579 | 44,958 | 1,634,436 | ||||||||||||||||||
| Federal funds purchased and interbank borrowings |
335,033 | — | — | — | 335,033 | |||||||||||||||||||
| Securities sold under agreements to repurchase |
12 | 384,810 | — | — | — | 384,810 | ||||||||||||||||||
| Federal Home Loan Bank advances |
13 | 999,896 | 251,962 | 58,500 | 299,221 | 1,609,579 | ||||||||||||||||||
| Other borrowings |
14 | 127 | 284 | 332 | 248,039 | 248,782 | ||||||||||||||||||
| Fixed interest payments (1) |
22,835 | 36,245 | 33,736 | 54,962 | 147,778 | |||||||||||||||||||
| Operating leases |
7 | 18,919 | 34,328 | 29,719 | 63,828 | 146,794 | ||||||||||||||||||
| Other long-term liabilities (2) |
46,033 | 2,737 | 33 | 63 | 48,866 | |||||||||||||||||||
| (1) | Our senior notes, subordinated notes, certain trust preferred securities, and certain FHLB advances have fixed rates ranging from 1.01% to 6.08%. All of our other long-term debt is at LIBOR based variable rates at December 31, 2017. The projected variable interest assumes no increase in LIBOR rates from December 31, 2017. |
| (2) | Includes unfunded commitments on qualified affordable housing projects and other tax credit investments. |
We rent certain premises and equipment under operating leases. See Note 7 to the consolidated financial statements for additional information on long-term lease arrangements.
We are party to various derivative contracts as a means to manage the balance sheet and our related exposure to changes in interest rates, to manage our residential real estate loan origination and sale activity, and to provide derivative contracts to our clients. Since the derivative liabilities recorded on the balance sheet change frequently and do not represent the amounts that may ultimately be paid under these contracts, these liabilities are not included in the table of contractual obligations presented above. Further discussion of derivative instruments is included in Note 21 to the consolidated financial statements.
In the normal course of business, various legal actions and proceedings are pending against us and our affiliates which are incidental to the business in which they are engaged. Further discussion of contingent liabilities is included in Note 22 to the consolidated financial statements.
In addition, liabilities recorded under FASB ASC 740-10 (FASB Interpretation No. 48, Accounting for Uncertainty in Income Taxes – an interpretation of FASB Statement No. 109) are not included in the table because the amount and timing of any cash payments cannot be reasonably estimated. Further discussion of income taxes and liabilities recorded under FASB ASC 740-10 is included in Note 16 to the consolidated financial statements.
59
Table of Contents
CRITICAL ACCOUNTING POLICIES AND ESTIMATES
Our accounting policies are described in Note 1 to the consolidated financial statements. Certain accounting policies require management to use significant judgment and estimates, which can have a material impact on the carrying value of certain assets and liabilities. We consider these policies to be critical accounting policies. The judgment and assumptions made are based upon historical experience or other factors that management believes to be reasonable under the circumstances. Because of the nature of the judgment and assumptions, actual results could differ from estimates, which could have a material effect on our financial condition and results of operations.
The following accounting policies materially affect our reported earnings and financial condition and require significant judgments and estimates. Management has reviewed these critical accounting estimates and related disclosures with our Audit Committee.
Goodwill and Intangibles
| • | Description. For acquisitions, we are required to record the assets acquired, including identified intangible assets, and the liabilities assumed at their fair value. These often involve estimates based on third party valuations, such as appraisals, or internal valuations based on discounted cash flow analyses or other valuation techniques that may include estimates of attrition, inflation, asset growth rates, or other relevant factors. In addition, the determination of the useful lives over which an intangible asset will be amortized is subjective. Under FASB ASC 350, Intangibles – Goodwill and Other, goodwill and indefinite-lived assets recorded must be reviewed for impairment on an annual basis, as well as on an interim basis if events or changes indicate that the asset might be impaired. An impairment loss must be recognized for any excess of carrying value over fair value of the goodwill or the indefinite-lived intangible asset. |
| • | Judgments and Uncertainties. The determination of fair values is based on valuations using management’s assumptions of future growth rates, future attrition, discount rates, multiples of earnings or other relevant factors. |
| • | Effect if Actual Results Differ From Assumptions. Changes in these factors, as well as downturns in economic or business conditions, could have a significant adverse impact on the carrying values of goodwill or intangible assets and could result in impairment losses affecting our financials as a whole and our banking subsidiary in which the goodwill or intangibles resides. |
Acquired Impaired Loans
| • | Description. Loans acquired with evidence of credit deterioration since inception and for which it is probable that all contractual payments will not be received are accounted for under ASC Topic 310-30, Loans and Debt Securities Acquired with Deteriorated Credit Quality (“ASC 310-30”). These loans are recorded at fair value at the time of acquisition, with no carryover of the related allowance for loan losses. Fair value of acquired loans is determined using a discounted cash flow methodology based on assumptions about the amount and timing of principal and interest payments, principal prepayments and principal defaults and losses, and current market rates. In recording the acquisition date fair values of acquired impaired loans, management calculates a non-accretable difference (the credit component of the purchased loans) and an accretable difference (the yield component of the purchased loans). |
Over the life of the acquired loans, we continue to estimate cash flows expected to be collected on pools of loans sharing common risk characteristics, which are treated in the aggregate when applying various valuation techniques. We evaluate at each balance sheet date whether the present value of our pools of loans determined using the effective interest rates has decreased significantly and if so, recognize a provision for loan loss in our consolidated statement of income. For any significant increases in cash flows expected to be collected, we adjust the amount of accretable yield recognized on a prospective basis over the pool’s remaining life.
| • | Judgments and Uncertainties. These cash flow evaluations are inherently subjective as they require management to make estimates about expected cash flows, market conditions and other future events that are highly subjective in nature and subject to change. |
| • | Effect if Actual Results Differ From Assumptions. Changes in these factors, as well as changing economic conditions will likely impact the carrying value of these acquired loans. |
60
Table of Contents
Allowance for Loan Losses
| • | Description. The allowance for loan losses is maintained at a level believed adequate by management to absorb probable incurred losses in the consolidated loan portfolio. Management’s evaluation of the adequacy of the allowance is an estimate based on reviews of individual loans, pools of homogeneous loans, assessments of the impact of current and anticipated economic conditions on the portfolio, and historical loss experience. The allowance represents management’s best estimate, but significant downturns in circumstances relating to loan quality and economic conditions could result in a requirement for additional allowance. Likewise, an upturn in loan quality and improved economic conditions may allow a reduction in the required allowance. In either instance, unanticipated changes could have a significant impact on results of operations. |
The allowance is increased through a provision charged to operating expense. Uncollectible loans are charged-off through the allowance. Recoveries of loans previously charged-off are added to the allowance. A loan is considered impaired when it is probable that contractual interest and principal payments will not be collected either for the amounts or by the dates as scheduled in the loan agreement. Our policy for recognizing income on impaired loans is to accrue interest unless a loan is placed on nonaccrual status. A loan is generally placed on nonaccrual status when principal or interest becomes 90 days past due unless it is well secured and in the process of collection, or earlier when concern exists as to the ultimate collectibility of principal or interest. We monitor the quality of our loan portfolio on an on-going basis and use a combination of detailed credit assessments by relationship managers and credit officers, historic loss trends, and economic and business environment factors in determining the allowance for loan losses. We record provisions for loan losses based on current loans outstanding, grade changes, mix of loans, and expected losses. A detailed loan loss evaluation on an individual loan basis for our highest risk loans is performed quarterly. Management follows the progress of the economy and how it might affect our borrowers in both the near and the intermediate term. We have a formalized and disciplined independent loan review program to evaluate loan administration, credit quality, and compliance with corporate loan standards. This program includes periodic, regular reviews of problem loan reports, delinquencies and charge-offs.
| • | Judgments and Uncertainties. We utilize a PD/LGD model as a tool to determine the adequacy of the allowance for loan losses for performing commercial and commercial real estate loans. The PD is forecast using a transition matrix to determine the likelihood of a customer’s AQR migrating from its current AQR to any other status within the time horizon. Transition rates are measured using Old National’s own historical experience. The model assumes that recent historical transition rates will continue into the future. The LGD is defined as credit loss incurred when an obligor of the bank defaults. The sum of all net charge-offs for a particular portfolio segment are divided by all loans that have defaulted over a given period of time. The expected loss derived from the model considers the PD, LGD, and exposure at default. Additionally, qualitative factors, such as changes in lending policies or procedures, and economic business conditions are also considered. |
We use historic loss ratios adjusted for economic conditions to determine the appropriate level of allowance for residential real estate and consumer loans.
| • | Effect if Actual Results Differ From Assumptions. The allowance represents management’s best estimate, but significant downturns in circumstances relating to loan quality and economic conditions could result in a requirement for additional allowance. Likewise, an upturn in loan quality and improved economic conditions may allow a reduction in the required allowance. In either instance, unanticipated changes could have a significant impact on results of operations. |
Management’s analysis of probable losses in the portfolio at December 31, 2017 resulted in a range for allowance for loan losses of $15.2 million. The range pertains to general (FASB ASC 450, Contingencies) reserves for both retail and performing commercial loans. Specific (FASB ASC 310, Receivables) reserves do not have a range of probable loss. Due to the risks and uncertainty associated with the economy and our projection of loss rates inherent in the portfolio, we establish a range of probable outcomes (a high-end estimate and a low-end estimate) and evaluate our position within this range. The potential effect to net income based on our position in the range relative to the high and low endpoints is a decrease of $1.4 million and an increase of $8.4 million, respectively, after taking into account the tax effects. These sensitivities are hypothetical and may not represent actual results.
61
Table of Contents
Derivative Financial Instruments
| • | Description. As part of our overall interest rate risk management, we use derivative instruments to reduce exposure to changes in interest rates and market prices for financial instruments. The application of the hedge accounting policy requires judgment in the assessment of hedge effectiveness, identification of similar hedged item groupings and measurement of changes in the fair value of derivative financial instruments and hedged items. To the extent hedging relationships are found to be effective, as determined by FASB ASC 815, Derivatives and Hedging (“ASC Topic 815”), changes in fair value of the derivatives are offset by changes in the fair value of the related hedged item or recorded to other comprehensive income. Management believes hedge effectiveness is evaluated properly in preparation of the financial statements. All of the derivative financial instruments we use have an active market and indications of fair value can be readily obtained. We are not using the “short-cut” method of accounting for any fair value derivatives. |
| • | Judgments and Uncertainties. The application of the hedge accounting policy requires judgment in the assessment of hedge effectiveness, identification of similar hedged item groupings and measurement of changes in the fair value of derivative financial instruments and hedged items. |
| • | Effect if Actual Results Differ From Assumptions. To the extent hedging relationships are found to be effective, as determined by ASC Topic 815, changes in fair value of the derivatives are offset by changes in the fair value of the related hedged item or recorded to other comprehensive income. However, if in the future the derivative financial instruments used by us no longer qualify for hedge accounting treatment, all changes in fair value of the derivative would flow through the consolidated statements of income in other noninterest income, resulting in greater volatility in our earnings. |
Income Taxes
| • | Description. We are subject to the income tax laws of the U.S., its states, and the municipalities in which we operate. These tax laws are complex and subject to different interpretations by the taxpayer and the relevant government taxing authorities. We review income tax expense and the carrying value of deferred tax assets quarterly; and as new information becomes available, the balances are adjusted as appropriate. FASB ASC 740-10 (FIN 48) prescribes a recognition threshold of more-likely-than-not, and a measurement attribute for all tax positions taken or expected to be taken on a tax return, in order for those tax positions to be recognized in the financial statements. See Note 16 to the consolidated financial statements for a further description of our provision and related income tax assets and liabilities. |
| • | Judgments and Uncertainties. In establishing a provision for income tax expense, we must make judgments and interpretations about the application of these inherently complex tax laws. We must also make estimates about when in the future certain items will affect taxable income in the various tax jurisdictions. Disputes over interpretations of the tax laws may be subject to review/adjudication by the court systems of the various tax jurisdictions or may be settled with the taxing authority upon examination or audit. |
| • | Effect if Actual Results Differ From Assumptions. Although management believes that the judgments and estimates used are reasonable, actual results could differ and we may be exposed to losses or gains that could be material. To the extent we prevail in matters for which reserves have been established, or are required to pay amounts in excess of our reserves, our effective income tax rate in a given financial statement period could be materially affected. An unfavorable tax settlement would result in an increase in our effective income tax rate in the period of resolution. A favorable tax settlement would result in a reduction in our effective income tax rate in the period of resolution. |
Management has discussed the development and selection of these critical accounting estimates with the Audit Committee and the Audit Committee has reviewed our disclosure relating to it in this “Management’s Discussion and Analysis of Financial Condition and Results of Operations.”
62
Table of Contents
| ITEM 7A. | QUANTITATIVE AND QUALITATIVE DISCLOSURES ABOUT MARKET RISK |
The information contained under the caption “Management’s Discussion and Analysis of Financial Condition and Results of Operations – Market Risk” of this Form 10-K is incorporated herein by reference in response to this item.
| ITEM 8. | FINANCIAL STATEMENTS AND SUPPLEMENTARY DATA |
| Page | ||||
| 64 | ||||
| 65 | ||||
| 67 | ||||
| 68 | ||||
| 69 | ||||
| 70 | ||||
| 71 | ||||
| 72 | ||||
| Note 1. Basis of Presentation and Significant Accounting Policies |
72 | |||
| 84 | ||||
| 87 | ||||
| 92 | ||||
| 92 | ||||
| 104 | ||||
| 105 | ||||
| 106 | ||||
| 107 | ||||
| Note 10. Qualified Affordable Housing Projects and Other Tax Credit Investments |
107 | |||
| 109 | ||||
| 109 | ||||
| 110 | ||||
| 110 | ||||
| 113 | ||||
| 114 | ||||
| 117 | ||||
| 118 | ||||
| 120 | ||||
| 120 | ||||
| 129 | ||||
| 131 | ||||
| 132 | ||||
| 132 | ||||
| 135 | ||||
| 136 | ||||
| 137 | ||||
63
Table of Contents
MANAGEMENT’S RESPONSIBILITY FOR FINANCIAL REPORTING
Management is responsible for the preparation of the financial statements and related financial information appearing in this annual report on Form 10-K. The financial statements and notes have been prepared in conformity with accounting principles generally accepted in the United States and include some amounts which are estimates based upon currently available information and management’s judgment of current conditions and circumstances. Financial information throughout this annual report on Form 10-K is consistent with that in the financial statements.
Management maintains a system of internal accounting controls which is believed to provide, in all material respects, reasonable assurance that assets are safeguarded against loss from unauthorized use or disposition, transactions are properly authorized and recorded, and the financial records are reliable for preparing financial statements and maintaining accountability for assets. In addition, Old National has a Code of Business Conduct and Ethics, a Senior Financial and Executive Officer Code of Ethics and Corporate Governance Guidelines that outline high levels of ethical business standards. Old National has also appointed a Chief Ethics Officer and had a third party perform an independent validation of our ethics program. All systems of internal accounting controls are based on management’s judgment that the cost of controls should not exceed the benefits to be achieved and that no system can provide absolute assurance that control objectives are achieved. Management believes Old National’s system provides the appropriate balance between cost of controls and the related benefits.
In order to monitor compliance with this system of controls, Old National maintains an extensive internal audit program. Internal audit reports are issued to appropriate officers and significant audit exceptions, if any, are reviewed with management and the Audit Committee.
The Board of Directors, through an Audit Committee comprised solely of independent outside directors, oversees management’s discharge of its financial reporting responsibilities. The Audit Committee meets regularly with Old National’s independent registered public accounting firm, Crowe Horwath LLP, and the managers of financial reporting, internal audit, and risk. During these meetings, the committee meets privately with the independent registered public accounting firm as well as with financial reporting and internal audit personnel to review accounting, auditing, and financial reporting matters. The appointment of the independent registered public accounting firm is made by the Audit Committee.
The consolidated financial statements in this annual report on Form 10-K have been audited by Crowe Horwath LLP, for the purpose of determining that the consolidated financial statements are presented fairly, in all material respects in conformity with accounting principles generally accepted in the United States. Crowe Horwath LLP’s report on the financial statements follows.
MANAGEMENT’S REPORT ON INTERNAL CONTROL OVER FINANCIAL REPORTING
The management of Old National is responsible for establishing and maintaining adequate internal control over financial reporting. A company’s internal control over financial reporting is a process designed to provide reasonable assurance regarding the reliability of financial reporting and the preparation of financial statements for external purposes in accordance with generally accepted accounting principles. Because of its inherent limitations, internal control over financial reporting may not prevent or detect misstatements. Also, projections of any evaluation of effectiveness to future periods are subject to the risk that controls may become inadequate because of changes in conditions, or that the degree of compliance with the policies or procedures may deteriorate. Old National’s management assessed the effectiveness of Old National’s internal control over financial reporting as of December 31, 2017. In making this assessment, management used the criteria established in 2013 by the Committee of Sponsoring Organizations of the Treadway Commission (“COSO”) in Internal Control - Integrated Framework. As permitted, Old National has excluded the operations of Anchor Bancorp, Inc. acquired November 1, 2017, which is described in Note 2 to the consolidated financial statements. The assets acquired in this acquisition and excluded from management’s assessment on internal control over financial reporting comprised approximately 9.8% of total consolidated assets at December 31, 2017. Based on that assessment Old National has concluded that, as of December 31, 2017, Old National’s internal control over financial reporting is effective. Old National’s independent registered public accounting firm has audited the effectiveness of Old National’s internal control over financial reporting as of December 31, 2017 as stated in their report which follows.
64
Table of Contents

|
Crowe Horwath LLP | |
| Independent Member Crowe Horwath International |
Report of Independent Registered Public Accounting Firm
Shareholders and Board of Directors of Old National Bancorp
Evansville, Indiana
Opinions on the Financial Statements and Internal Control over Financial Reporting
We have audited the accompanying consolidated balance sheets of Old National Bancorp (the “Company”) as of December 31, 2017 and 2016, the related consolidated statements of income, comprehensive income, changes in shareholders’ equity, and cash flows for each of the years in the three-year period ended December 31, 2017, and the related notes (collectively referred to as the “financial statements”). We also have audited the Company’s internal control over financial reporting as of December 31, 2017, based on criteria established in Internal Control – Integrated Framework: (2013) issued by the Committee of Sponsoring Organizations of the Treadway Commission (COSO).
In our opinion, the financial statements referred to above present fairly, in all material respects, the financial position of the Company as of December 31, 2017 and 2016, and the results of its operations and its cash flows for each of the years in the three-year period ended December 31, 2017 in conformity with accounting principles generally accepted in the United States of America. Also in our opinion, the Company maintained, in all material respects, effective internal control over financial reporting as of December 31, 2017, based on criteria established in Internal Control – Integrated Framework: (2013) issued by COSO.
Basis for Opinions
The Company’s management is responsible for these financial statements, for maintaining effective internal control over financial reporting, and for its assessment of the effectiveness of internal control over financial reporting, included in the accompanying Management’s Report on Internal Control over Financial Reporting. Our responsibility is to express an opinion on the Company’s financial statements and an opinion on the Company’s internal control over financial reporting based on our audits. We are a public accounting firm registered with the Public Company Accounting Oversight Board (United States) (“PCAOB”) and are required to be independent with respect to the Company in accordance with the U.S. federal securities laws and the applicable rules and regulations of the Securities and Exchange Commission and the PCAOB.
We conducted our audits in accordance with the standards of the PCAOB. Those standards require that we plan and perform the audits to obtain reasonable assurance about whether the financial statements are free of material misstatement, whether due to error or fraud, and whether effective internal control over financial reporting was maintained in all material respects.
65
Table of Contents
Our audits of the financial statements included performing procedures to assess the risks of material misstatement of the financial statements, whether due to error or fraud, and performing procedures that respond to those risks. Such procedures included examining, on a test basis, evidence regarding the amounts and disclosures in the financial statements. Our audits also included evaluating the accounting principles used and significant estimates made by management, as well as evaluating the overall presentation of the financial statements. Our audit of internal control over financial reporting included obtaining an understanding of internal control over financial reporting, assessing the risk that a material weakness exists, and testing and evaluating the design and operating effectiveness of internal control based on the assessed risk. As permitted, the Company has excluded the operations of Anchor Bancorp, Inc. acquired during 2017, which is described in Note 2 of the consolidated financial statements, from the scope of management’s report on internal control over financial reporting. As such, it has also been excluded from the scope of our audit of internal control over financial reporting. Our audits also included performing such other procedures as we considered necessary in the circumstances. We believe that our audits provide a reasonable basis for our opinions.
Definition and Limitations of Internal Control Over Financial Reporting
A company’s internal control over financial reporting is a process designed to provide reasonable assurance regarding the reliability of financial reporting and the preparation of financial statements for external purposes in accordance with generally accepted accounting principles. A company’s internal control over financial reporting includes those policies and procedures that (1) pertain to the maintenance of records that, in reasonable detail, accurately and fairly reflect the transactions and dispositions of the assets of the company; (2) provide reasonable assurance that transactions are recorded as necessary to permit preparation of financial statements in accordance with generally accepted accounting principles, and that receipts and expenditures of the company are being made only in accordance with authorizations of management and directors of the company; and (3) provide reasonable assurance regarding prevention or timely detection of unauthorized acquisition, use, or disposition of the company’s assets that could have a material effect on the financial statements.
Because of its inherent limitations, internal control over financial reporting may not prevent or detect misstatements. Also, projections of any evaluation of effectiveness to future periods are subject to the risk that controls may become inadequate because of changes in conditions, or that the degree of compliance with the policies or procedures may deteriorate.

Crowe Horwath LLP
We have served as the Company’s auditor since 2005, which is the year the engagement letter was signed for the audit of the 2006 financial statements.
Indianapolis, Indiana
February 15, 2018
66
Table of Contents
OLD NATIONAL BANCORP
| December 31, | ||||||||
| (dollars and shares in thousands, except per share data) |
2017 | 2016 | ||||||
| Assets |
||||||||
| Cash and due from banks |
$ | 222,753 | $ | 209,381 | ||||
| Money market and other interest-earning investments |
67,679 | 46,138 | ||||||
|
|
|
|
|
|||||
| Total cash and cash equivalents |
290,432 | 255,519 | ||||||
| Trading securities, at fair value |
5,584 | 4,982 | ||||||
| Investment securities - available-for-sale, at fair value |
3,196,207 | 2,797,174 | ||||||
| Investment securities - held-to-maturity, at amortized cost (fair value $727,703 and $784,172, respectively) |
684,063 | 745,090 | ||||||
| Federal Home Loan Bank/Federal Reserve Bank stock, at cost |
119,686 | 101,716 | ||||||
| Loans held for sale, at fair value |
17,930 | 90,682 | ||||||
| Loans, net of unearned income |
11,118,121 | 9,010,512 | ||||||
| Allowance for loan losses |
(50,381 | ) | (49,808 | ) | ||||
|
|
|
|
|
|||||
| Net loans |
11,067,740 | 8,960,704 | ||||||
|
|
|
|
|
|||||
| Premises and equipment, net |
458,074 | 429,622 | ||||||
| Accrued interest receivable |
87,102 | 81,381 | ||||||
| Goodwill |
828,051 | 655,018 | ||||||
| Other intangible assets |
53,096 | 37,677 | ||||||
| Company-owned life insurance |
403,753 | 352,956 | ||||||
| Net deferred tax assets |
110,857 | 181,863 | ||||||
| Loan servicing rights |
24,661 | 25,561 | ||||||
| Assets held for sale |
7,180 | 5,970 | ||||||
| Other real estate owned and repossessed personal property |
8,810 | 18,546 | ||||||
| Other assets |
155,066 | 115,776 | ||||||
|
|
|
|
|
|||||
| Total assets |
$ | 17,518,292 | $ | 14,860,237 | ||||
|
|
|
|
|
|||||
| Liabilities |
||||||||
| Deposits: |
||||||||
| Noninterest-bearing demand |
$ | 3,680,807 | $ | 3,016,093 | ||||
| Interest-bearing: |
||||||||
| NOW |
3,115,822 | 2,596,595 | ||||||
| Savings |
3,035,622 | 2,954,709 | ||||||
| Money market |
1,139,077 | 707,748 | ||||||
| Time |
1,634,436 | 1,468,108 | ||||||
|
|
|
|
|
|||||
| Total deposits |
12,605,764 | 10,743,253 | ||||||
|
|
|
|
|
|||||
| Federal funds purchased and interbank borrowings |
335,033 | 213,003 | ||||||
| Securities sold under agreements to repurchase |
384,810 | 367,052 | ||||||
| Federal Home Loan Bank advances |
1,609,579 | 1,353,092 | ||||||
| Other borrowings |
248,782 | 218,939 | ||||||
| Accrued expenses and other liabilities |
179,927 | 150,481 | ||||||
|
|
|
|
|
|||||
| Total liabilities |
15,363,895 | 13,045,820 | ||||||
|
|
|
|
|
|||||
| Commitments and contingencies (Note 22) |
||||||||
| Shareholders’ Equity |
||||||||
| Preferred stock, series A, 2,000 shares authorized, no shares issued or outstanding |
— | — | ||||||
| Common stock, $1.00 per share stated value, 300,000 shares authorized, 152,040 and 135,159 shares issued and outstanding, respectively |
152,040 | 135,159 | ||||||
| Capital surplus |
1,639,499 | 1,348,338 | ||||||
| Retained earnings |
413,130 | 390,292 | ||||||
| Accumulated other comprehensive income (loss), net of tax |
(50,272 | ) | (59,372 | ) | ||||
|
|
|
|
|
|||||
| Total shareholders’ equity |
2,154,397 | 1,814,417 | ||||||
|
|
|
|
|
|||||
| Total liabilities and shareholders’ equity |
$ | 17,518,292 | $ | 14,860,237 | ||||
|
|
|
|
|
|||||
The accompanying notes to consolidated financial statements are an integral part of these statements.
67
Table of Contents
OLD NATIONAL BANCORP
CONSOLIDATED STATEMENTS OF INCOME
| Years Ended December 31, | ||||||||||||
| (dollars and shares in thousands, except per share data) |
2017 | 2016 | 2015 | |||||||||
| Interest Income |
||||||||||||
| Loans including fees: |
||||||||||||
| Taxable |
$ | 389,219 | $ | 349,095 | $ | 304,452 | ||||||
| Nontaxable |
13,970 | 12,287 | 11,566 | |||||||||
| Investment securities: |
||||||||||||
| Taxable |
63,031 | 57,005 | 57,336 | |||||||||
| Nontaxable |
28,858 | 28,617 | 25,788 | |||||||||
| Money market and other interest-earning investments |
258 | 130 | 47 | |||||||||
|
|
|
|
|
|
|
|||||||
| Total interest income |
495,336 | 447,134 | 399,189 | |||||||||
|
|
|
|
|
|
|
|||||||
| Interest Expense |
||||||||||||
| Deposits |
20,356 | 17,283 | 14,168 | |||||||||
| Federal funds purchased and interbank borrowings |
1,966 | 673 | 265 | |||||||||
| Securities sold under agreements to repurchase |
1,270 | 1,509 | 1,488 | |||||||||
| Federal Home Loan Bank advances |
24,818 | 15,547 | 8,121 | |||||||||
| Other borrowings |
9,758 | 9,419 | 9,031 | |||||||||
|
|
|
|
|
|
|
|||||||
| Total interest expense |
58,168 | 44,431 | 33,073 | |||||||||
|
|
|
|
|
|
|
|||||||
| Net interest income |
437,168 | 402,703 | 366,116 | |||||||||
| Provision for loan losses |
3,050 | 960 | 2,923 | |||||||||
|
|
|
|
|
|
|
|||||||
| Net interest income after provision for loan losses |
434,118 | 401,743 | 363,193 | |||||||||
|
|
|
|
|
|
|
|||||||
| Noninterest Income |
||||||||||||
| Wealth management fees |
37,316 | 34,641 | 34,395 | |||||||||
| Service charges on deposit accounts |
41,331 | 41,578 | 43,372 | |||||||||
| Debit card and ATM fees |
17,676 | 16,769 | 21,340 | |||||||||
| Mortgage banking revenue |
18,449 | 20,240 | 12,540 | |||||||||
| Insurance premiums and commissions |
617 | 20,527 | 42,714 | |||||||||
| Investment product fees |
20,977 | 18,822 | 17,924 | |||||||||
| Capital markets income |
6,544 | 3,227 | 1,082 | |||||||||
| Company-owned life insurance |
8,654 | 8,479 | 8,604 | |||||||||
| Net securities gains (losses) |
9,135 | 5,848 | 5,718 | |||||||||
| Recognition of deferred gain on sale leaseback transactions |
2,080 | 16,057 | 16,444 | |||||||||
| Gain on sale of ONB Insurance Group, Inc. |
— | 41,864 | — | |||||||||
| Net gain on branch divestitures |
— | — | 15,627 | |||||||||
| Change in FDIC indemnification asset |
— | 233 | (9,034 | ) | ||||||||
| Other income |
20,603 | 24,545 | 19,906 | |||||||||
|
|
|
|
|
|
|
|||||||
| Total noninterest income |
183,382 | 252,830 | 230,632 | |||||||||
|
|
|
|
|
|
|
|||||||
| Noninterest Expense |
||||||||||||
| Salaries and employee benefits |
246,738 | 252,892 | 243,875 | |||||||||
| Occupancy |
46,511 | 50,947 | 53,239 | |||||||||
| Equipment |
13,560 | 13,448 | 13,183 | |||||||||
| Marketing |
13,172 | 14,620 | 10,410 | |||||||||
| Data processing |
32,306 | 32,002 | 27,309 | |||||||||
| Communication |
9,284 | 9,959 | 9,586 | |||||||||
| Professional fees |
16,840 | 15,705 | 11,756 | |||||||||
| Loan expense |
6,596 | 7,632 | 6,373 | |||||||||
| Supplies |
2,406 | 2,865 | 2,275 | |||||||||
| FDIC assessment |
9,480 | 8,681 | 7,503 | |||||||||
| Other real estate owned expense |
3,376 | 4,195 | 2,703 | |||||||||
| Amortization of intangibles |
11,841 | 12,486 | 11,746 | |||||||||
| Amortization of tax credit investments |
11,733 | — | — | |||||||||
| Other expense |
24,993 | 28,715 | 30,974 | |||||||||
|
|
|
|
|
|
|
|||||||
| Total noninterest expense |
448,836 | 454,147 | 430,932 | |||||||||
|
|
|
|
|
|
|
|||||||
| Income before income taxes |
168,664 | 200,426 | 162,893 | |||||||||
| Income tax expense |
72,939 | 66,162 | 46,177 | |||||||||
|
|
|
|
|
|
|
|||||||
| Net income |
$ | 95,725 | $ | 134,264 | $ | 116,716 | ||||||
|
|
|
|
|
|
|
|||||||
| Net income per common share - basic |
$ | 0.69 | $ | 1.05 | $ | 1.01 | ||||||
| Net income per common share - diluted |
0.69 | 1.05 | 1.00 | |||||||||
|
|
|
|
|
|
|
|||||||
| Weighted average number of common shares outstanding - basic |
137,821 | 127,705 | 115,726 | |||||||||
| Weighted average number of common shares outstanding - diluted |
138,513 | 128,301 | 116,255 | |||||||||
|
|
|
|
|
|
|
|||||||
| Dividends per common share |
$ | 0.52 | $ | 0.52 | $ | 0.48 | ||||||
The accompanying notes to consolidated financial statements are an integral part of these statements.
68
Table of Contents
OLD NATIONAL BANCORP
CONSOLIDATED STATEMENTS OF COMPREHENSIVE INCOME
| Years Ended December 31, | ||||||||||||
| (dollars in thousands) |
2017 | 2016 | 2015 | |||||||||
| Net income |
$ | 95,725 | $ | 134,264 | $ | 116,716 | ||||||
| Other comprehensive income (loss): |
||||||||||||
| Change in securities available-for-sale: |
||||||||||||
| Unrealized holding gains (losses) for the period |
14,259 | (49,813 | ) | 1,173 | ||||||||
| Reclassification adjustment for securities gains realized in income |
(9,135 | ) | (5,848 | ) | (5,718 | ) | ||||||
| Income tax effect |
(1,669 | ) | 20,455 | 1,487 | ||||||||
|
|
|
|
|
|
|
|||||||
| Unrealized gains (losses) on available-for-sale securities |
3,455 | (35,206 | ) | (3,058 | ) | |||||||
| Change in securities held-to-maturity: |
||||||||||||
| Amortization of fair value for securities held-to-maturity previously recognized into accumulated other comprehensive income |
1,830 | 1,776 | 1,692 | |||||||||
| Income tax effect |
(627 | ) | (606 | ) | (396 | ) | ||||||
|
|
|
|
|
|
|
|||||||
| Changes from securities held-to-maturity |
1,203 | 1,170 | 1,296 | |||||||||
| Cash flow hedges: |
||||||||||||
| Net unrealized derivative gains (losses) on cash flow hedges |
927 | (2,323 | ) | (8,107 | ) | |||||||
| Reclassification adjustment for losses realized in net income |
6,135 | 6,453 | 2,719 | |||||||||
| Income tax effect |
(2,684 | ) | (1,569 | ) | 2,047 | |||||||
|
|
|
|
|
|
|
|||||||
| Changes from cash flow hedges |
4,378 | 2,561 | (3,341 | ) | ||||||||
| Defined benefit pension plans: |
||||||||||||
| Amortization of net (gain) loss and settlement cost recognized in income |
159 | 11,203 | 3,002 | |||||||||
| Income tax effect |
(95 | ) | (4,303 | ) | (1,141 | ) | ||||||
|
|
|
|
|
|
|
|||||||
| Changes from defined benefit pension plans |
64 | 6,900 | 1,861 | |||||||||
|
|
|
|
|
|
|
|||||||
| Other comprehensive income (loss), net of tax |
9,100 | (24,575 | ) | (3,242 | ) | |||||||
|
|
|
|
|
|
|
|||||||
| Comprehensive income |
$ | 104,825 | $ | 109,689 | $ | 113,474 | ||||||
|
|
|
|
|
|
|
|||||||
The accompanying notes to consolidated financial statements are an integral part of these statements.
69
Table of Contents
OLD NATIONAL BANCORP
CONSOLIDATED STATEMENTS OF CHANGES IN SHAREHOLDERS’ EQUITY
| (dollars in thousands) |
Common Stock |
Capital Surplus |
Retained Earnings |
Accumulated Other Comprehensive Income (Loss) |
Total Shareholders’ Equity |
|||||||||||||||
| Balance, January 1, 2015 |
$ | 116,847 | $ | 1,118,292 | $ | 262,180 | $ | (31,555 | ) | $ | 1,465,764 | |||||||||
| Net income |
— | — | 116,716 | — | 116,716 | |||||||||||||||
| Other comprehensive loss |
— | — | — | (3,242 | ) | (3,242 | ) | |||||||||||||
| Acquisition of Founders Financial Corporation |
3,402 | 47,224 | — | — | 50,626 | |||||||||||||||
| Dividends - common stock ($0.48 per share) |
— | — | (55,552 | ) | — | (55,552 | ) | |||||||||||||
| Common stock issued |
29 | 362 | — | — | 391 | |||||||||||||||
| Common stock repurchased |
(6,399 | ) | (82,296 | ) | — | — | (88,695 | ) | ||||||||||||
| Stock based compensation expense |
— | 4,255 | — | — | 4,255 | |||||||||||||||
| Stock activity under incentive compensation plans |
418 | 74 | 415 | — | 907 | |||||||||||||||
|
|
|
|
|
|
|
|
|
|
|
|||||||||||
| Balance, December 31, 2015 |
114,297 | 1,087,911 | 323,759 | (34,797 | ) | 1,491,170 | ||||||||||||||
| Net income |
— | — | 134,264 | — | 134,264 | |||||||||||||||
| Other comprehensive loss |
— | — | — | (24,575 | ) | (24,575 | ) | |||||||||||||
| Acquisition of Anchor BanCorp Wisconsin Inc. |
20,415 | 253,150 | — | — | 273,565 | |||||||||||||||
| Dividends - common stock ($0.52 per share) |
— | — | (67,536 | ) | — | (67,536 | ) | |||||||||||||
| Common stock issued |
32 | 356 | — | — | 388 | |||||||||||||||
| Common stock repurchased |
(154 | ) | (1,890 | ) | — | — | (2,044 | ) | ||||||||||||
| Stock based compensation expense |
— | 7,318 | — | — | 7,318 | |||||||||||||||
| Stock activity under incentive compensation plans |
569 | 1,493 | (195 | ) | — | 1,867 | ||||||||||||||
|
|
|
|
|
|
|
|
|
|
|
|||||||||||
| Balance, December 31, 2016 |
135,159 | 1,348,338 | 390,292 | (59,372 | ) | 1,814,417 | ||||||||||||||
| Net income |
— | — | 95,725 | — | 95,725 | |||||||||||||||
| Other comprehensive income |
— | — | — | 9,100 | 9,100 | |||||||||||||||
| Acquisition of Anchor Bancorp, Inc. |
16,527 | 284,301 | — | — | 300,828 | |||||||||||||||
| Dividends - common stock ($0.52 per share) |
— | — | (72,604 | ) | — | (72,604 | ) | |||||||||||||
| Common stock issued |
24 | 380 | — | — | 404 | |||||||||||||||
| Common stock repurchased |
(153 | ) | (2,608 | ) | — | — | (2,761 | ) | ||||||||||||
| Stock based compensation expense |
— | 6,275 | — | — | 6,275 | |||||||||||||||
| Stock activity under incentive compensation plans |
483 | 2,813 | (283 | ) | — | 3,013 | ||||||||||||||
|
|
|
|
|
|
|
|
|
|
|
|||||||||||
| Balance, December 31, 2017 |
$ | 152,040 | $ | 1,639,499 | $ | 413,130 | $ | (50,272 | ) | $ | 2,154,397 | |||||||||
|
|
|
|
|
|
|
|
|
|
|
|||||||||||
The accompanying notes to consolidated financial statements are an integral part of these statements.
70
Table of Contents
OLD NATIONAL BANCORP
CONSOLIDATED STATEMENTS OF CASH FLOWS
| Years Ended December 31, | ||||||||||||
| (dollars in thousands) |
2017 | 2016 | 2015 | |||||||||
| Cash Flows From Operating Activities |
||||||||||||
| Net income |
$ | 95,725 | $ | 134,264 | $ | 116,716 | ||||||
|
|
|
|
|
|
|
|||||||
| Adjustments to reconcile net income to cash provided by operating activities: |
||||||||||||
| Depreciation |
22,183 | 16,558 | 14,101 | |||||||||
| Amortization of other intangible assets |
11,841 | 12,486 | 11,746 | |||||||||
| Amortization of tax credit investments |
11,733 | — | — | |||||||||
| Net premium amortization on investment securities |
15,302 | 18,633 | 18,609 | |||||||||
| Amortization of and net gains on termination of FDIC indemnification asset |
— | (458 | ) | 9,034 | ||||||||
| Stock-based compensation expense |
6,275 | 7,318 | 4,255 | |||||||||
| Excess tax (benefit) expense on stock-based compensation |
79 | — | — | |||||||||
| Provision for loan losses |
3,050 | 960 | 2,923 | |||||||||
| Net securities (gains) losses |
(9,135 | ) | (5,848 | ) | (5,718 | ) | ||||||
| Recognition of deferred gain on sale leaseback transactions |
(2,080 | ) | (16,057 | ) | (16,444 | ) | ||||||
| Gain on sale of ONB Insurance Group, Inc. |
— | (41,864 | ) | — | ||||||||
| Net gain on branch divestitures |
— | — | (15,627 | ) | ||||||||
| Net gains on sales of loans and other assets |
(6,421 | ) | (4,741 | ) | (5,232 | ) | ||||||
| Increase in cash surrender value of company-owned life insurance |
(8,654 | ) | (8,479 | ) | (8,604 | ) | ||||||
| Residential real estate loans originated for sale |
(452,604 | ) | (637,639 | ) | (350,846 | ) | ||||||
| Proceeds from sale of residential real estate loans |
535,271 | 578,653 | 362,157 | |||||||||
| (Increase) decrease in interest receivable |
151 | (4,974 | ) | (7,523 | ) | |||||||
| (Increase) decrease in other real estate owned |
10,794 | 11,301 | 4,538 | |||||||||
| (Increase) decrease in other assets |
45,008 | 46,462 | 16,079 | |||||||||
| Increase (decrease) in accrued expenses and other liabilities |
12,141 | (24,524 | ) | (26,408 | ) | |||||||
|
|
|
|
|
|
|
|||||||
| Total adjustments |
194,934 | (52,213 | ) | 7,040 | ||||||||
|
|
|
|
|
|
|
|||||||
| Net cash flows provided by (used in) operating activities |
290,659 | 82,051 | 123,756 | |||||||||
|
|
|
|
|
|
|
|||||||
| Cash Flows From Investing Activities |
||||||||||||
| Cash portion of bank purchase price, net of cash acquired |
2,564 | (62,532 | ) | (37,098 | ) | |||||||
| Proceeds from sale of ONB Insurance Group, Inc. |
— | 91,771 | — | |||||||||
| Payments related to branch divestitures |
— | — | (333,095 | ) | ||||||||
| Purchases of investment securities available-for-sale |
(874,555 | ) | (1,625,746 | ) | (832,419 | ) | ||||||
| Purchases of investment securities held-to-maturity |
— | — | (74,862 | ) | ||||||||
| Purchases of Federal Home Loan Bank/Federal Reserve Bank stock |
(17,979 | ) | (10,974 | ) | (21,872 | ) | ||||||
| Proceeds from maturities, prepayments, and calls of investment securities available-for-sale |
438,818 | 1,177,130 | 764,649 | |||||||||
| Proceeds from sales of investment securities available-for-sale |
342,233 | 243,312 | 343,486 | |||||||||
| Proceeds from maturities, prepayments, and calls of investment securities held-to-maturity |
57,682 | 120,954 | 39,799 | |||||||||
| Proceeds from sales of investment securities held-to-maturity |
— | — | 855 | |||||||||
| Proceeds from sales of Federal Home Loan Bank/Federal Reserve Bank stock |
6,594 | — | 8,711 | |||||||||
| Proceeds from sales of trading securities |
127 | — | — | |||||||||
| Reimbursements under FDIC loss share agreements |
— | 10,000 | 3,548 | |||||||||
| Net principal collected from (loans made to) loan customers |
(516,095 | ) | (427,686 | ) | (285,875 | ) | ||||||
| Proceeds from settlements on company-owned life insurance |
2,347 | 4,095 | 1,224 | |||||||||
| Proceeds from sale of premises and equipment and other assets |
18,592 | 6,332 | 7,714 | |||||||||
| Purchases of premises and equipment and other assets |
(37,303 | ) | (224,659 | ) | (85,661 | ) | ||||||
|
|
|
|
|
|
|
|||||||
| Net cash flows provided by (used in) investing activities |
(576,975 | ) | (698,003 | ) | (500,896 | ) | ||||||
|
|
|
|
|
|
|
|||||||
| Cash Flows From Financing Activities |
||||||||||||
| Net increase (decrease) in: |
||||||||||||
| Deposits |
85,062 | 489,680 | 89,328 | |||||||||
| Federal funds purchased and interbank borrowings |
76,430 | (78,087 | ) | 95,903 | ||||||||
| Securities sold under agreements to repurchase |
(5,207 | ) | (23,489 | ) | (31,205 | ) | ||||||
| Payments for maturities of Federal Home Loan Bank advances |
(947,694 | ) | (594,541 | ) | (229,109 | ) | ||||||
| Payments for maturities/redemptions of other borrowings |
(20,056 | ) | (67 | ) | (63 | ) | ||||||
| Proceeds from Federal Home Loan Bank advances |
1,205,000 | 925,000 | 575,000 | |||||||||
| Cash dividends paid on common stock |
(72,604 | ) | (67,536 | ) | (55,552 | ) | ||||||
| Common stock repurchased |
(2,761 | ) | (2,044 | ) | (88,695 | ) | ||||||
| Proceeds from exercise of stock options |
2,655 | 2,349 | 997 | |||||||||
| Common stock issued |
404 | 388 | 391 | |||||||||
|
|
|
|
|
|
|
|||||||
| Net cash flows provided by (used in) financing activities |
321,229 | 651,653 | 356,995 | |||||||||
|
|
|
|
|
|
|
|||||||
| Net increase (decrease) in cash and cash equivalents |
34,913 | 35,701 | (20,145 | ) | ||||||||
| Cash and cash equivalents at beginning of period |
255,519 | 219,818 | 239,963 | |||||||||
|
|
|
|
|
|
|
|||||||
| Cash and cash equivalents at end of period |
$ | 290,432 | $ | 255,519 | $ | 219,818 | ||||||
|
|
|
|
|
|
|
|||||||
The accompanying notes to consolidated financial statements are an integral part of these statements.
71
Table of Contents
OLD NATIONAL BANCORP
NOTES TO CONSOLIDATED FINANCIAL STATEMENTS
NATURE OF OPERATIONS
Old National Bancorp, a financial holding company headquartered in Evansville, Indiana, operates primarily in Indiana, Kentucky, Michigan, Wisconsin, and Minnesota. Its principal subsidiary is Old National Bank. Through its bank and non-bank affiliates, Old National Bancorp provides to its clients an array of financial services including loan, deposit, wealth management, investment consulting, and investment products.
NOTE 1 – BASIS OF PRESENTATION AND SIGNIFICANT ACCOUNTING POLICIES
Basis of Presentation
The accompanying consolidated financial statements include the accounts of Old National Bancorp and its wholly-owned affiliates (hereinafter collectively referred to as “Old National”) and have been prepared in conformity with accounting principles generally accepted in the United States of America and prevailing practices within the banking industry. Such principles require management to make estimates and assumptions that affect the reported amounts of assets, liabilities and the disclosures of contingent assets and liabilities at the date of the financial statements and amounts of revenues and expenses during the reporting period. Actual results could differ from those estimates.
All significant intercompany transactions and balances have been eliminated. Certain prior year amounts have been reclassified to conform to the 2017 presentation. Such reclassifications had no effect on net income or shareholders’ equity and were insignificant amounts.
Trading Securities
Trading securities consist of mutual funds held in trusts associated with deferred compensation plans for former directors and executives. These mutual funds are recorded as trading securities at fair value. Gains and losses are included in net securities gains.
Investment Securities
Old National classifies investment securities as available-for-sale or held-to-maturity on the date of purchase. Securities classified as available-for-sale are recorded at fair value with the unrealized gains and losses, net of tax effect, recorded in other comprehensive income. Realized gains and losses affect income and the prior fair value adjustments are reclassified within shareholders’ equity. Securities classified as held-to-maturity, which management has the intent and ability to hold to maturity, are reported at amortized cost. Premiums and discounts are amortized on the level-yield method. Anticipated prepayments are considered when amortizing premiums and discounts on mortgage backed securities. Gains and losses on the sale of available-for-sale securities are determined using the specific-identification method.
Other-Than-Temporary Impairment – Management evaluates securities for OTTI at least on a quarterly basis, and more frequently when economic or market conditions warrant such evaluation. Consideration is given to (1) the length of time and the extent to which the fair value has been less than cost, (2) the financial condition and near-term prospects of the issuer including an evaluation of credit ratings, (3) whether the market decline was affected by macroeconomic conditions, (4) the intent of Old National to sell a security, and (5) whether it is more likely than not Old National will have to sell the security before recovery of its cost basis. If Old National intends to sell an impaired security, Old National records an other-than-temporary loss in an amount equal to the entire difference between fair value and amortized cost. If a security is determined to be other-than-temporarily impaired, but Old National does not intend to sell the security and it is not more likely than not that it will be required to sell the security, only the credit portion of the estimated loss is recognized in earnings, with the other portion of the loss recognized in other comprehensive income. See Note 3 to the consolidated financial statements for a detailed description of the quarterly evaluation process.
72
Table of Contents
Federal Home Loan Bank Stock
Old National is a member of the FHLB system. Members are required to own a certain amount of stock based on the level of borrowings and other factors and may invest in additional amounts. FHLB stock is carried at cost, classified as a restricted security, and periodically evaluated for impairment based on ultimate recovery of par value. Both cash and stock dividends are reported as income.
Loans Held for Sale
Loans that Old National has originated with an intent to sell are classified as loans held for sale and are recorded in accordance with FASB ASC 825-10 at fair value, determined individually, as of the balance sheet date. The loan’s fair value includes the servicing value of the loans as well as any accrued interest.
Loans
Loans that Old National intends to hold for investment purposes are classified as portfolio loans. Portfolio loans are carried at the principal balance outstanding, net of earned interest, purchase premiums or discounts, deferred loan fees and costs, and an allowance for loan losses. Interest income is accrued on the principal balances of loans outstanding. For all loan classes, a loan is generally placed on nonaccrual status when principal or interest becomes 90 days past due unless it is well secured and in the process of collection, or earlier when concern exists as to the ultimate collectibility of principal or interest. Interest accrued during the current year on such loans is reversed against earnings. Interest accrued in the prior year, if any, is charged to the allowance for loan losses. Cash interest received on these loans is applied to the principal balance until the principal is recovered or until the loan returns to accrual status. Loans may be returned to accrual status when all the principal and interest amounts contractually due are brought current, remain current for a prescribed period, and future payments are reasonably assured.
Purchased loans acquired in a business combination are recorded at estimated fair value on their purchase date with no carryover of the related allowance for loan and lease losses. In determining the estimated fair value of purchased loans, management considers a number of factors including, among others, the remaining life of the acquired loans, estimated prepayments, estimated loss ratios, estimated value of the underlying collateral, and net present value of cash flows expected to be received. Purchased loans are accounted for in accordance with guidance for certain loans acquired in a transfer (ASC 310-30), when the loans have evidence of credit deterioration since origination and it is probable at the date of acquisition that the acquirer will not collect all contractually required principal and interest payments. The difference between contractually required payments and the cash flows expected to be collected at acquisition is referred to as the non-accretable difference. Subsequent decreases to the expected cash flows will generally result in a provision for loan and lease losses. Subsequent increases in expected cash flows will result in a reversal of the provision for loan losses to the extent of prior charges and then an adjustment to accretable yield, which would have a positive impact on interest income.
Allowance for Loan Losses
The allowance for loan losses is maintained at a level believed adequate by management to absorb probable losses incurred in the consolidated loan portfolio. Management’s evaluation of the adequacy of the allowance is an estimate based on reviews of individual loans, pools of homogeneous loans, assessments of the impact of current and anticipated economic conditions on the portfolio, and historical loss experience. The allowance is increased through a provision charged to operating expense. Loans deemed to be uncollectible are charged to the allowance. Recoveries of loans previously charged-off are added to the allowance.
For all loan classes, a loan is considered impaired when it is probable that contractual interest and principal payments will not be collected either for the amounts or by the dates as scheduled in the loan agreement. If a loan is impaired, a portion of the allowance is allocated so that the loan is reported net, at the present value of estimated cash flows using the loan’s existing rate or at the fair value of collateral if repayment is expected solely from the collateral. Old National’s policy, for all but PCI loans, is to recognize interest income on impaired loans unless the loan is placed on nonaccrual status.
Acquired loans accounted for under ASC Topic 310-30 accrue interest, even though they may be contractually past due, as any nonpayment of contractual principal or interest is considered in the periodic re-estimation of expected cash flows and is included in the resulting recognition of current period loan loss provision or prospective yield adjustments.
73
Table of Contents
Old National charges off small commercial loans scored through our small business credit center with contractual balances under $250,000 that are 90 days or more delinquent and do not have adequate collateral support. For all portfolio segments, the general component covers non-impaired loans and is based on historical loss experience adjusted for current factors. This actual loss experience is supplemented with other economic factors based on the risks present for each portfolio segment. These economic factors include consideration of the following: levels of and trends in delinquencies and impaired loans; levels of and trends in charge-offs and recoveries; trends in volume and terms of loans; effects of any changes in risk selection and underwriting standards; other changes in lending policies, procedures, and practices; experience, ability, and depth of lending management and other relevant staff; national and local economic trends and conditions; industry conditions; and effects of changes in credit concentrations.
Further information regarding Old National’s policies and methodology used to estimate the allowance for loan losses is presented in Note 5.
Premises and Equipment
Premises and equipment are stated at cost less accumulated depreciation. Land is stated at cost. Depreciation is charged to operating expense over the useful lives of the assets, principally on the straight-line method. Useful lives for premises and equipment are as follows: buildings and building improvements – 15 to 39 years; and furniture and equipment – 3 to 10 years. Leasehold improvements are depreciated over the lesser of their useful lives or the term of the lease. Maintenance and repairs are expensed as incurred while major additions and improvements are capitalized. Interest costs on construction of qualifying assets are capitalized.
Premises and equipment are reviewed for impairment when events indicate their carrying amount may not be recoverable from future undiscounted cash flows. If impaired, the assets are adjusted to fair value. Such impairments are included in other expense.
Goodwill and Other Intangible Assets
The excess of the cost of acquired entities over the fair value of identifiable assets acquired less liabilities assumed is recorded as goodwill. In accordance with FASB ASC 350, Intangibles – Goodwill and Other, amortization of goodwill and indefinite-lived assets is not recorded. However, the recoverability of goodwill and other intangible assets are annually tested for impairment. Other intangible assets, including core deposits and customer business relationships, are amortized primarily on an accelerated basis over their estimated useful lives, generally over a period of 5 to 15 years.
Company-Owned Life Insurance
Old National has purchased life insurance policies on certain key executives. Old National records company-owned life insurance at the amount that can be realized under the insurance contract at the balance sheet date, which is the cash surrender value adjusted for other charges or other amounts due that are probable at settlement.
Loan Servicing Rights
When loans are sold with servicing retained, servicing rights are initially recorded at fair value with the income statement effect recorded in gain on sales of loans. Fair value is based on market prices for comparable servicing contracts, when available or alternatively, is based on a valuation model that calculates the present value of estimated future net servicing income. All classes of servicing assets are subsequently measured using the amortization method which requires servicing rights to be amortized into noninterest income in proportion to, and over the period of, the estimated future net servicing income of the underlying loans.
Loan servicing rights are evaluated for impairment based upon the fair value of the rights as compared to carrying amount. Impairment is determined by stratifying rights into groupings based on predominant risk characteristics, such as interest rate, loan type, term, and investor type. Impairment is recognized through a valuation allowance for
74
Table of Contents
an individual grouping, to the extent that fair value is less than the carrying amount. If Old National later determines that all or a portion of the impairment no longer exists for a particular grouping, a reduction of the allowance may be recorded as an increase to income. Changes in valuation allowances are reported with mortgage banking revenue on the income statement. The fair values of servicing rights are subject to significant fluctuations as a result of changes in estimated and actual prepayment speeds and default rates and losses.
Servicing fee income, which is reported on the income statement as mortgage banking revenue, is recorded for fees earned for servicing loans. The fees are based on a contractual percentage of the outstanding principal, or a fixed amount per loan and are recorded as income when earned.
Derivative Financial Instruments
As part of Old National’s overall interest rate risk management, Old National uses derivative instruments, including TBA forward agreements and interest rate swaps, caps, and floors. All derivative instruments are recognized on the balance sheet at their fair value in accordance with ASC 815, as amended. At the inception of the derivative contract, Old National will designate the derivative as (1) a hedge of the fair value of a recognized asset or liability or of an unrecognized firm commitment (“fair value hedge”), (2) a hedge of a forecasted transaction or of the variability of cash flows to be received or paid related to a recognized asset or liability (“cash flow hedge”), or (3) an instrument with no hedging designation (“stand-alone derivative”). For derivatives that are designated and qualify as a fair value hedge, the change in value of the derivative, as well as the offsetting change in value of the hedged item attributable to the hedged risk, are recognized in current earnings during the period of the change in fair values. For derivatives that are designated and qualify as a cash flow hedge, the effective portion of the change in value on the derivative is reported as a component of other comprehensive income and reclassified into earnings in the same period or periods during which the hedged transaction affects earnings. For all hedging relationships, changes in fair value of derivatives that are not effective in hedging the changes in fair value or expected cash flows of the hedged item are recognized immediately in current earnings during the period of the change. Similarly, the changes in the fair value of derivatives that do not qualify for hedge accounting under ASC Topic 815 are also reported currently in earnings, in noninterest income.
The accrued net settlements on derivatives that qualify for hedge accounting are recorded in interest income or interest expense, consistent with the item being hedged.
Old National formally documents all relationships between hedging instruments and hedged items, as well as its risk-management objective and strategy for undertaking various hedge transactions. This process includes linking all derivative instruments that are designated as fair-value or cash-flow hedges to specific assets and liabilities on the balance sheet or to specific firm commitments or forecasted transactions. Old National also formally assesses, both at the hedge’s inception and on an ongoing basis, whether the derivative instruments that are used in hedging transactions are highly effective in offsetting changes in fair values or cash flows of hedged items. Old National discontinues hedge accounting prospectively when it is determined that (1) the derivative is no longer effective in offsetting changes in the fair value or cash flows of the hedged item; (2) the derivative expires, is sold, or terminated; (3) the derivative instrument is de-designated as a hedge because the forecasted transaction is no longer probable of occurring; (4) a hedged firm commitment no longer meets the definition of a firm commitment; (5) or management otherwise determines that designation of the derivative as a hedging instrument is no longer appropriate.
When hedge accounting is discontinued, the future changes in fair value of the derivative are recorded as noninterest income. When a fair value hedge is discontinued, the hedged asset or liability is no longer adjusted for changes in fair value and the existing basis adjustment is amortized or accreted over the remaining life of the asset or liability. When a cash flow hedge is discontinued but the hedged cash flows or forecasted transaction is still expected to occur, changes in value that were accumulated in other comprehensive income are amortized or accreted into earnings over the same periods which the hedged transactions will affect earnings.
Old National enters into various stand-alone mortgage-banking derivatives in order to hedge the risk associated with the fluctuation of interest rates. Changes in fair value are recorded as mortgage banking revenue. Old National also enters into various stand-alone derivative contracts to provide derivative products to customers which are carried at fair value with changes in fair value recorded as other noninterest income.
75
Table of Contents
Old National is exposed to losses if a counterparty fails to make its payments under a contract in which Old National is in the net receiving position. Old National anticipates that the counterparties will be able to fully satisfy their obligations under the agreements. In addition, Old National obtains collateral above certain thresholds of the fair value of its hedges for each counterparty based upon their credit standing. All of the contracts to which Old National is a party settle monthly, quarterly, or semiannually. Further, Old National has netting agreements with the dealers with which it does business.
Credit-Related Financial Instruments
In the ordinary course of business, Old National’s affiliate bank has entered into credit-related financial instruments consisting of commitments to extend credit, commercial letters of credit, and standby letters of credit. The notional amount of these commitments is not reflected in the consolidated financial statements until they are funded.
Foreclosed Assets
Other assets include real estate properties acquired as a result of foreclosure and repossessed personal property and are initially recorded at the fair value of the property less estimated cost to sell. Any excess recorded investment over the fair value of the property received is charged to the allowance for loan losses. Any subsequent write-downs are charged to expense, as are the costs of operating the properties.
Securities Purchased Under Agreements to Resell and Securities Sold Under Agreements to Repurchase
We purchase certain securities, generally U.S. government-sponsored entity and agency securities, under agreements to resell. The amounts advanced under these agreements represent short-term secured loans and are reflected as assets in the accompanying consolidated balance sheets. We also sell certain securities under agreements to repurchase. These agreements are treated as collateralized financing transactions. These secured borrowings are reflected as liabilities in the accompanying consolidated balance sheets and are recorded at the amount of cash received in connection with the transaction. Short-term securities sold under agreements to repurchase generally mature within one to four days from the transaction date. Securities, generally U.S. government and federal agency securities, pledged as collateral under these financing arrangements can be repledged by the secured party. Additional collateral may be required based on the fair value of the underlying securities.
Covered Assets, Loss Share Agreements, and Indemnification Asset
On July 29, 2011, Old National acquired the banking operations of Integra in an FDIC assisted transaction. As part of the purchase and assumption agreement, Old National and the FDIC entered into loss sharing agreements (each, a “loss sharing agreement” and collectively, the “loss sharing agreements”), whereby the FDIC would cover a substantial portion of any future losses on loans (and related unfunded commitments), OREO and up to 90 days of certain accrued interest on loans. The acquired loans and OREO subject to the loss sharing agreements are referred to collectively as “covered assets.” Old National entered into an agreement with the FDIC on June 22, 2016 to terminate its loss share agreements. As a result of the termination of the loss share agreements, the remaining covered assets that were covered by the loss share arrangements were reclassified to noncovered assets effective June 22, 2016. Prior to the termination of the loss share agreements, the FDIC would have reimbursed us for 80% of expenses and valuation write-downs related to covered assets up to $275.0 million, an amount which we never reached.
Net Income per Share
Basic net income per share is computed by dividing net income by the weighted-average number of common shares outstanding during each year. Diluted net income per share is computed as above and assumes the conversion of outstanding stock options and restricted stock.
76
Table of Contents
The following table reconciles basic and diluted net income per share for the years ended December 31.
| (dollars and shares in thousands, except per share data) |
Years Ended December 31, | |||||||||||
| 2017 | 2016 | 2015 | ||||||||||
| Basic Earnings Per Share |
||||||||||||
| Net income |
$ | 95,725 | $ | 134,264 | $ | 116,716 | ||||||
| Weighted average common shares outstanding |
137,821 | 127,705 | 115,726 | |||||||||
| Basic Net Income Per Share |
$ | 0.69 | $ | 1.05 | $ | 1.01 | ||||||
|
|
|
|
|
|
|
|||||||
| Diluted Earnings Per Share |
||||||||||||
| Net income |
$ | 95,725 | $ | 134,264 | $ | 116,716 | ||||||
| Weighted average common shares outstanding |
137,821 | 127,705 | 115,726 | |||||||||
| Effect of dilutive securities: |
||||||||||||
| Restricted stock (1) |
599 | 543 | 440 | |||||||||
| Stock options (2) |
93 | 53 | 89 | |||||||||
|
|
|
|
|
|
|
|||||||
| Weighted average shares outstanding |
138,513 | 128,301 | 116,255 | |||||||||
| Diluted Earnings Per Share |
$ | 0.69 | $ | 1.05 | $ | 1.00 | ||||||
|
|
|
|
|
|
|
|||||||
| (1) | 8 thousand shares and 3 thousand shares of restricted stock at December 31, 2017 and 2016, respectively, were not included in the computation of net income per diluted share because the effect would be antidilutive. There were no shares of restricted stock excluded at December 31, 2015 because the effect would be antidilutive. |
| (2) | Options to purchase 0.1 million shares, 0.5 million shares, and 0.7 million shares outstanding at December 31, 2017, 2016, and 2015, respectively, were not included in the computation of net income per diluted share because the exercise price of these options was greater than the average market price of the common shares and, therefore, the effect would be antidilutive. |
Stock-Based Compensation
Compensation cost is recognized for stock options and restricted stock awards and units issued to employees based on the fair value of these awards at the date of grant. A Black-Scholes model is utilized to estimate the fair value of stock options, while the market price of our Common Stock at the date of grant is used for restricted stock awards. A third party provider is used to value certain restricted stock units where the performance measure is based on total shareholder return. Compensation expense is recognized over the requisite service period.
Income Taxes
Income tax expense is the total of the current year income tax due or refundable and the change in deferred tax assets and liabilities. Deferred tax assets and liabilities are the expected future tax amounts for the temporary differences between carrying amounts and tax bases of assets and liabilities, computed using enacted tax rates. A valuation allowance, if needed, reduces deferred tax assets to the amount expected to be realized.
We recognize a tax position as a benefit only if it is “more likely than not” that the tax position would be sustained in a tax examination, with a tax examination being presumed to occur. The amount recognized is the largest amount of tax benefit that is greater than 50% likely of being realized on examination. For tax positions not meeting the “more likely than not” test, no tax benefit is recorded.
We recognize interest and/or penalties related to income tax matters in income tax expense.
Old National is a limited partner in several tax-advantaged limited partnerships whose purpose is to invest in approved qualified affordable housing, renewable energy, or other renovation or community revitalization projects. These investments are included in other assets on the balance sheet, with any unfunded commitments included with other liabilities. Certain of these assets qualify for the proportional amortization method and are amortized over the period that Old National expects to receive the tax credits, with the expense included within income tax expense on the consolidated statements of income. The other investments are accounted for under the equity method, with the expense included within pre-tax income on the consolidated statements of income. All of our tax credit investments are evaluated for impairment at the end of each reporting period.
77
Table of Contents
Loss Contingencies
Loss contingencies, including claims and legal actions arising in the normal course of business, are recorded as liabilities when the likelihood of loss is probable and an amount or range of loss can be reasonably estimated. See Note 22 to the consolidated financial statements for further disclosure.
Statement of Cash Flows Data
For the purpose of presentation in the accompanying consolidated statement of cash flows, cash and cash equivalents are defined as cash, due from banks, federal funds sold and resell agreements, and money market investments, which have maturities less than 90 days. The following table summarizes the supplemental cash flow information for the years ended December 31:
| Years Ended December 31, | ||||||||||||
| (dollars in thousands) |
2017 | 2016 | 2015 | |||||||||
| Cash payments: |
||||||||||||
| Interest |
$ | 56,682 | $ | 43,698 | $ | 32,712 | ||||||
| Income taxes (net of refunds) |
4,326 | 23,636 | 14,824 | |||||||||
| Noncash Investing and Financing Activities: |
||||||||||||
| Transfer of premises and equipment to assets held for sale |
16,617 | 4,620 | 9,070 | |||||||||
|
|
|
|
|
|
|
|||||||
The following table summarizes the common shares issued and resultant value of total shareholders’ equity associated with acquisitions for the years ended December 31:
| (dollars and shares in thousands) |
Shares of Common Stock |
Total Shareholders’ Equity |
||||||
| 2017 |
||||||||
| Acquisition of Anchor (MN) |
16,527 | $ | 300,828 | |||||
|
|
|
|
|
|||||
| 2016 |
||||||||
| Acquisition of Anchor (WI) |
20,415 | $ | 273,565 | |||||
|
|
|
|
|
|||||
| 2015 |
||||||||
| Acquisition of Founders |
3,402 | $ | 50,626 | |||||
|
|
|
|
|
|||||
Impact of Accounting Changes
FASB ASC 606 – In May 2014, the FASB issued an update (ASU No. 2014-09, Revenue from Contracts with Customers) creating FASB Topic 606, Revenue from Contracts with Customers. The guidance in this update affects any entity that either enters into contracts with customers to transfer goods or services or enters into contracts for the transfer of nonfinancial assets unless those contracts are within the scope of other standards (for example, insurance contracts or lease contracts). The core principle of the guidance is that an entity should recognize revenue to depict the transfer of promised goods or services to customers in an amount that reflects the consideration to which the entity expects to be entitled in exchange for those goods or services. The guidance provides steps to follow to achieve the core principle. An entity should disclose sufficient information to enable users of financial statements to understand the nature, amount, timing and uncertainty of revenue and cash flows arising from contracts with customers. The amendments in this update become effective for annual periods and interim periods within those
78
Table of Contents
annual periods beginning after December 15, 2017. We have finalized our in-depth assessment and identified the revenue line items within the scope of this new guidance. Neither the new standard, nor any of the amendments detailed below, resulted in a material change from our current accounting for revenue because the majority of Old National’s financial instruments are not within the scope of Topic 606, and those that are require no change in the accounting. We had elected to implement using the modified retrospective application, with the cumulative effect recorded as an adjustment to opening retained earnings at January 1, 2018. Due to immateriality, we will have no cumulative effect to record. We are still finalizing the changes to related disclosures.
In March 2016, the FASB issued ASU No. 2016-08, Revenue from Contracts with Customers (Topic 606): Principal versus Agent Considerations (Reporting Revenue Gross versus Net). The amendments relate to when another party, along with the entity, is involved in providing a good or service to a customer. Topic 606 requires an entity to determine whether the nature of its promise is to provide that good or service to the customer (that is, the entity is a principal) or to arrange for the good or service to be provided to the customer by the other party (that is, the entity is an agent). This determination is based upon whether the entity controls the good or the service before it is transferred to the customer. Topic 606 includes indicators to assist in this evaluation. The amendments in this update affect the guidance in ASU No. 2014-09 above, which is not yet effective. The effective date will be the same as the effective date of ASU No. 2014-09.
In April 2016, the FASB issued ASU No. 2016-10, Revenue from Contracts with Customers (Topic 606): Identifying Performance Obligations and Licensing. The amendments clarify the following two aspects of Topic 606: identifying performance obligations, and the licensing implementation guidance. Before an entity can identify its performance obligations in a contract with a customer, the entity first identifies the promised goods or services in the contract. The amendments in this update are expected to reduce the cost and complexity of applying the guidance on identifying promised goods or services. To identify performance obligations in a contract, an entity evaluates whether promised goods and services are distinct. Topic 606 includes two criteria for assessing whether promises to transfer goods or services are distinct. One of those criteria is that the promises are separately identifiable. This update will improve the guidance on assessing that criterion. Topic 606 also includes implementation guidance on determining whether as entity’s promise to grant a license provides a customer with either a right to use the entity’s intellectual property, which is satisfied at a point in time, or a right to access the entity’s intellectual property, which is satisfied over time. The amendments in this update are intended to improve the operability and understandability of the licensing implementation guidance. The amendments in this update affect the guidance in ASU No. 2014-09 above, which is not yet effective. The effective date will be the same as the effective date of ASU No. 2014-09.
In May 2016, the FASB issued ASU No. 2016-12, Revenue from Contracts with Customers (Topic 606): Narrow-Scope Improvements and Practical Expedients. The amendments do not change the core revenue recognition principle in Topic 606. The amendments provide clarifying guidance in certain narrow areas and add some practical expedients.
In December 2016, the FASB issued ASU No. 2016-20, Revenue from Contracts with Customers (Topic 606): Technical Corrections and Improvements. The FASB board decided to issue a separate update for technical corrections and improvements to Topic 606 and other Topics amended by ASU No. 2014-09 to increase awareness of the proposals and to expedite improvements to ASU No. 2014-09. The amendment affects narrow aspects of the guidance issued in ASU No. 2014-09.
FASB ASC 825 – In January 2016, the FASB issued an update (ASU No. 2016-01, Financial Instruments – Overall (Subtopic 825-10): Recognition and Measurement of Financial Assets and Financial Liabilities). The amendments in this update impact public business entities as follows: (1) Require equity investments (except those accounted for under the equity method of accounting or those that result in consolidation of the investee) to be measured at fair value with changes in fair value recognized in net income. (2) Simplify the impairment assessment of equity investments without readily determinable fair values by requiring a qualitative assessment to identify impairment. When a qualitative assessment indicates that impairment exists, an entity is required to measure the investment at fair value. (3) Eliminate the requirement to disclose the methods and significant assumptions used to estimate the fair value that is required to be disclosed for financial instruments measured at amortized cost on the balance sheet. (4) Require entities to use the exit price notion when measuring the fair value of financial instruments for disclosure purposes. (5) Require an entity to present separately in other comprehensive income the portion of the total change in fair value of a liability resulting from a change in the instrument-specific credit risk when the entity has elected to
79
Table of Contents
measure the liability at fair value in accordance with the fair value option for financial instruments. (6) Require separate presentation of financial assets and financial liabilities by measurement category and form of financial asset (that is, securities or loans and receivables) on the balance sheet or the accompanying notes to the financial statements. (7) Clarify that an entity should evaluate the need for a valuation allowance on a deferred tax asset related to available-for-sale securities in combination with the entity’s other deferred tax assets. The amendments in this update become effective for annual periods and interim periods within those annual periods beginning after December 15, 2017. We have completed our evaluation of adopting the new guidance on the consolidated financial statements and no impact will be recorded.
FASB ASC 842 – In February 2016, the FASB issued its new lease accounting guidance in ASU No. 2016-02, Leases (Topic 842). Under the new guidance, lessees will be required to recognize the following for all leases, with the exception of short-term leases, at the commencement date: (1) a lease liability, which is a lessee’s obligation to make lease payments arising from a lease, measured on a discounted basis; and (2) a right-of-use asset, which is an asset that represents the lessee’s right to use, or control the use of, a specified asset for the lease term. Under the new guidance, lessor accounting is largely unchanged. The amendments in this update become effective for annual periods and interim periods within those annual periods beginning after December 15, 2018. Based on leases outstanding at December 31, 2017, we do not expect the new standard to have a material impact on our income statement, but anticipate an $80 million to $100 million increase in our assets and liabilities. Decisions to repurchase, modify, or renew leases prior to the implementation date will impact this level of materiality.
FASB ASC 815 – In March 2016, the FASB issued ASU No. 2016-05, Derivatives and Hedging (Topic 815): Effect of Derivative Contract Novations on Existing Hedge Accounting Relationships. The amendments apply to all reporting entities for which there is a change in the counterparty to a derivative instrument that has been designated as a hedging instrument. The amendments clarify that a change in the counterparty to a derivative instrument that has been designated as the hedging instrument does not, in and of itself, require de-designation of that hedging relationship provided that all other hedge accounting criteria continue to be met. The amendments in this update became effective for annual periods and interim periods within those annual periods beginning after December 15, 2016, and did not have a material impact on the consolidated financial statements.
In March 2016, the FASB issued ASU No. 2016-06, Derivatives and Hedging (Topic 815): Contingent Put and Call Options in Debt Instruments. The amendments apply to all entities that are issuers of or investors in debt instruments (or hybrid financial instruments that are determined to have a debt host) with embedded call (put) options. Topic 815, Derivatives and Hedging, requires that embedded derivatives be separated from the host contract and accounted for separately as derivatives if certain criteria are met. One of those criteria is that the economic characteristics and risks of the embedded derivatives are not clearly and closely related to the economic characteristics and risks of the host contract. The amendments clarify what steps are required when assessing “clearly and closely related.” The amendments in this update became effective for annual periods and interim periods within those annual periods beginning after December 15, 2016, and did not have a material impact on the consolidated financial statements.
In August 2017, the FASB issued ASU No. 2017-12, Derivatives and Hedging (Topic 815): Targeted Improvements to Accounting for Hedging Activities. The amendments in the update make certain targeted improvements to simplify the application of the hedge accounting guidance in current GAAP. The amendments in this update better align an entity’s risk management activities and financial reporting for hedging relationships through changes to both the designation and measurement guidance for qualifying hedging relationships and the presentation of hedge results. To meet that objective, the amendments expand and refine hedge accounting for both nonfinancial and financial risk components and align the recognition and presentation of the effects of the hedging instrument and the hedged item in the financial statements. This update addresses several limitations that current GAAP places on the risk components, how an entity can designate the hedged item in a fair value hedge of interest rate risk, and how an entity can measure changes in fair value of the hedged item attributable to interest rate risk. In addition to the amendments to the designation and measurement guidance for qualifying hedging relationships, the amendments in this update also align the recognition and presentation of the effects of the hedging instrument and the hedged item in the financial statements to increase the understandability of the results of an entity’s intended hedging strategies. The amendments in this update require an entity to present the earnings effect of the hedging instrument in the same income statement line item in which the earnings effect of the hedged item is reported. Current GAAP provides special hedge accounting only for the portion of the hedge deemed to be “highly effective” and requires an entity to separately reflect the amount by which the hedging instrument does not offset the hedged item, which is referred to
80
Table of Contents
as the “ineffective” amount. However, the concept and reporting of hedge ineffectiveness were difficult for financial statement users to understand and, at times, for preparers to explain. The FASB board decided on an approach that no longer separately measures and reports hedge ineffectiveness. This update also includes certain targeted improvements to ease the application of current guidance related to the assessment of hedge effectiveness. Current GAAP contains specific requirements for initial and ongoing quantitative hedge effectiveness testing and strict requirements for specialized effectiveness testing methods that allow an entity to forgo quantitative hedge effectiveness assessments for qualifying relationships. The amendments in this update become effective for annual periods and interim periods within those annual periods beginning after December 15, 2018. Early adoption is permitted in any interim period. Management has elected to early adopt this update effective January 1, 2018 using the modified retrospective method. The impact of the adoption will result in a reduction to Old National’s opening retained earnings of approximately $0.5 million. In addition, as permitted by the amendments in the update, Old National is reclassifying $447.0 million in state and political subdivision securities with unrealized holding gains of $26.1 million from the held-to-maturity portfolio to the available-for-sale portfolio.
FASB ASC 323 – In March 2016, the FASB issued ASU No. 2016-07, Investments—Equity Method and Joint Ventures (Topic 323): Simplifying the Transition to the Equity Method of Accounting. The amendments affect all entities that have an investment that becomes qualified for the equity method of accounting as a result of an increase in the level of ownership interest or degree of influence. The amendments eliminate the requirement that when an investment qualifies for use of the equity method as a result of an increase in the level of ownership interest or degree of influence, an investor must adjust the investment, results of operations, and retained earnings retroactively on a step-by-step basis as if the equity method had been in effect during all previous periods that the investment had been held. The amendments require that the equity method investor add the cost of acquiring the additional interest in the investee to the current basis of the investor’s previously held interest and adopt the equity method of accounting as of the date the investment becomes qualified for equity method accounting. Therefore, upon qualifying for the equity method of accounting, no retroactive adjustment of the investment is required. The amendments also require that an entity that has an available-for-sale equity security that becomes qualified for the equity method of accounting recognize through earnings the unrealized holding gain or loss in accumulated other comprehensive income at the date the investment becomes qualified for use of the equity method. The amendments in this update became effective for annual periods and interim periods within those annual periods beginning after December 15, 2016, and did not have a material impact on the consolidated financial statements.
FASB ASC 718 – In March 2016, the FASB issued ASU No. 2016-09, Compensation – Stock Compensation (Topic 718): Improvements to Employee Shared-Based Payment Accounting. The amendments are intended to improve the accounting for employee shared-based payments and affects all organizations that issue share-based payment awards to their employees. Several aspects of the accounting for share-based payment award transactions are simplified, including the income tax consequences, the classification of awards as either equity or liabilities, and the classification on the statement of cash flows. The amendments in this update became effective on January 1, 2017 and resulted in a $0.1 million expense during 2017.
In May 2017, the FASB issued ASU No. 2017-09, Compensation – Stock Compensation (Topic 718): Scope of Modification Accounting. The amendments in this update provide guidance about which changes to the terms and conditions of a shared-based payment award require an entity to apply modification accounting. An entity should account for the effect of a modification unless all the following are met: (1) the fair value of the modified award is the same as the fair value of the original award immediately before the original award is modified. If the modification does not affect any of the inputs to the valuation technique that the entity uses to value the award, the entity is not required to estimate the value immediately before and after the modification; (2) the vesting conditions of the modified award are the same as the vesting conditions of the original award immediately before the original award is modified; (3) the classification of the modified award as an equity instrument or a liability instrument is the same as the classification of the original award immediately before the original award is modified. The amendments in this update become effective for annual periods and interim periods within those annual periods beginning after December 15, 2017. We have completed our evaluation of adopting the new guidance on the consolidated financial statements and there is no impact to record.
FASB ASC 326 – In June 2016, the FASB issued ASU No. 2016-13, Financial Instruments – Credit Losses (Topic 326): Measurement of Credit Losses on Financial Instruments. The main objective of this amendment is to provide financial statement users with more decision-useful information about the expected credit losses on financial instruments and other commitments to extend credit held by a reporting entity at each reporting date. The amendment requires
81
Table of Contents
the measurement of all expected credit losses for financial assets held at the reporting date based on historical experience, current conditions, and reasonable and supportable forecasts. Financial institutions and other organizations will now use forward-looking information to enhance their credit loss estimates. The amendment requires enhanced disclosures to help investors and other financial statement users better understand significant estimates and judgments used in estimating credit losses, as well as the credit quality and underwriting standards of an organization’s portfolio. In addition, the ASU amends the accounting for credit losses on available-for-sale debt securities and purchased financial assets with credit deterioration. The amendments in this update become effective for annual periods and interim periods within those annual periods beginning after December 15, 2019. Early adoption will be permitted beginning after December 15, 2018. We have formed a cross functional committee that has overseen the enhancement of existing technology required to source and model data for the purposes of meeting this standard. The committee has also selected a vendor to assist in generating loan level cash flows and disclosures. We expect to recognize a one-time cumulative effect adjustment to the allowance for loan losses as of the beginning of the first reporting period in which the new standard is effective, but cannot yet determine the magnitude of any such one-time adjustment or the overall impact of the new guidance on the consolidated financial statements.
FASB ASC 740 – In October 2016, the FASB issued ASU No. 2016-16, Income Taxes (Topic 740): Intra-Entity Transfers of Assets Other Than Inventory. Current guidance prohibits the recognition of current and deferred income taxes for an intra-entity asset transfer until the asset has been sold to an outside party. This prohibition on recognition is an exception to the principle of comprehensive recognition of current and deferred income taxes in generally accepted accounting principles. The exception has led to diversity in practice and is a source of complexity in financial reporting. FASB decided that an entity should recognize the income tax consequences of an intra-entity transfer of an asset other than inventory when the transfer occurs. Consequently, the amendments in this update eliminate the exception for an intra-entity transfer of an asset other than inventory. The amendments in this update do not include new disclosure requirements; however, existing disclosure requirements might be applicable when accounting for the current and deferred income taxes for an intra-entity transfer of an asset other than inventory. For public business entities, the amendments in this update are effective for annual reporting periods beginning after December 15, 2017, including interim reporting periods within those annual reporting periods. The amendments in this update should be applied on a modified retrospective basis through a cumulative-effect adjustment directly to retained earnings as of the beginning of the period of adoption. We have completed our evaluation of the impact of adopting the new guidance on the consolidated financial statements. An immaterial impact of approximately $1.4 million will be recorded in 2018.
FASB ASC 810 – In October 2016, the FASB issued ASU No. 2016-17, Consolidation (Topic 810): Interests Held through Related Parties that are under Common Control. This update amends the consolidation guidance on how a reporting entity that is the single decision maker of a variable interest entity (VIE) should treat indirect interests in the entity held through related parties that are under common control with the reporting entity when determining whether it is the primary beneficiary of that VIE. The primary beneficiary of a VIE is the reporting entity that has a controlling financial interest in a VIE and, therefore, consolidates the VIE. A reporting entity has an indirect interest in a VIE if it has a direct interest in a related party that, in turn, has a direct interest in the VIE. The amendments in this update became effective for annual periods and interim periods within those annual periods beginning after December 15, 2016, and did not have a material impact on the consolidated financial statements.
FASB ASC 805 – In January 2017, the FASB issued ASU No. 2017-01, Business Combinations (Topic 805): Clarifying the Definition of a Business. The amendments in this update provide a more robust framework to use in determining when a set of assets and activities is a business. Because the current definition of a business is interpreted broadly and can be difficult to apply, stakeholders indicated that analyzing transactions is inefficient and costly and that the definition does not permit the use of reasonable judgment. The amendments provide more consistency in applying the guidance, reduce the costs of application, and make the definition of a business more operable. The amendments in this update become effective for annual periods and interim periods within those annual periods beginning after December 15, 2017.
FASB ASC 350 – In January 2017, the FASB issued ASU No. 2017-04, Intangibles: Goodwill and Other: Simplifying the Test for Goodwill Impairment. To simplify the subsequent measurement of goodwill, the amendments eliminate Step 2 from the goodwill impairment test. The annual, or interim, goodwill impairment test is performed by comparing the fair value of a reporting unit with its carrying amount. An impairment charge should be recognized for the amount by which the carrying amount exceeds the reporting unit’s fair value; however, the
82
Table of Contents
loss recognized should not exceed the total amount of goodwill allocated to that reporting unit. In addition, the income tax effects of tax deductible goodwill on the carrying amount of the reporting unit should be considered when measuring the goodwill impairment loss, if applicable. The amendments also eliminate the requirements for any reporting unit with a zero or negative carrying amount to perform Step 2 of the goodwill impairment test. An entity still has the option to perform the qualitative assessment for a reporting unit to determine if the qualitative impairment test is necessary. The amendments should be applied on a prospective basis. The nature of and reason for the change in accounting principle should be disclosed upon transition. The amendments in this update should be adopted for annual or any interim goodwill impairment tests in fiscal years beginning after December 15, 2019. Early adoption is permitted on testing dates after January 1, 2017. We are currently evaluating the impact of adopting the new guidance on the consolidated financial statements, but it is not expected to have a material impact.
FASB ASC 610 – In February 2017, the FASB issued ASU No. 2017-05, Other Income – Gains and Losses from the Derecognition of Nonfinancial Assets (Topic 610): Clarifying the Scope of Asset Derecognition Guidance and Accounting for Partial Sales of Nonfinancial Assets. Subtopic 610-20 was originally issued as part of ASU No. 2014-09 to provide guidance for recognizing gains and losses from the transfer of nonfinancial assets in contracts with noncustomers. This update was issued to help clarify uncertainties and complexities of ASU 2014-09. The amendments in this update define the term in substance nonfinancial asset, in part, as a financial asset promised to a counterparty in a contract if substantially all of its fair value of the assets (recognized and unrecognized) that are promised to the counterparty in the contract is concentrated in nonfinancial assets. If substantially all of the fair value of the assets that are promised to the counterparty in a contract is concentrated in nonfinancial assets, then all of the financial assets promised to the counterparty are in substance nonfinancial assets. The amendments in this update also clarify that nonfinancial assets within the scope of Subtopic 610-20 may include nonfinancial assets transferred within a legal entity to a counterparty. The amendments in this update require an entity to derecognize a distinct nonfinancial asset or distinct in substance nonfinancial asset in a partial sale transaction when it (1) does not have (or ceases to have) a controlling financial interest in the legal entity that holds the asset in accordance with Topic 810 and (2) transfers control of the asset in accordance with Topic 606. Once an entity transfers control of a distinct nonfinancial asset or distinct in substance nonfinancial asset, it is required to measure any noncontrolling interest it receives (or retains) at fair value. The amendments are effective at the same time as the amendments in ASU 2014-09. Therefore, the amendments are effective for annual reporting periods beginning after December 15, 2017, including interim reporting periods within that reporting period. We are currently evaluating the impact of adopting the new guidance on the consolidated financial statements, but it is not expected to have a material impact.
FASB ASC 715 – In March 2017, the FASB issued ASU No. 2017-07, Compensation – Retirement Benefits (Topic 715): Improving the Presentation of Net Periodic Pension Cost and Net Periodic Postretirement Benefit Cost. The amendments in this update require that an employer disaggregate the service cost component from the other components of net benefit cost. The amendments also provide explicit guidance on how to present the service cost component and the other components of net benefit cost in the income statement and allow only the service cost component of net benefit cost to be eligible for capitalization. The amendments in this update improve the consistency, transparency, and usefulness of financial information to users that have communicated that the service cost component generally is analyzed differently from the other components of net benefit cost. The amendments in this update become effective for annual periods and interim periods within those annual periods beginning after December 15, 2017. We have completed our evaluation of adopting the new guidance on the consolidated financial statements and there is no impact to record.
FASB ASC 310 – In March 2017, the FASB issued ASU No. 2017-08, Receivables – Nonrefundable Fees and Other Costs (Subtopic 310-20): Premium Amortization on Purchased Callable Debt Securities. This update amends the amortization period for certain purchased callable debt securities held at a premium. FASB is shortening the amortization period for the premium to the earliest call date. Under current GAAP, entities generally amortize the premium as an adjustment of yield over the contractual life of the instrument. Concerns were raised that current GAAP excludes certain callable debt securities from consideration of early repayment of principal even if the holder is certain that the call will be exercised. As a result, upon the exercise of a call on a callable debt security held at a premium, the unamortized premium is recorded as a loss in earnings. There is diversity in practice (1) in the amortization period for premiums of callable debt securities and (2) in how the potential for exercise of a call is factored into current impairment assessments. The amendments in this update become effective for annual periods and interim periods within those annual periods beginning after December 15, 2018. We are currently evaluating the impact of adopting the new guidance on the consolidated financial statements, but it is not expected to have a material impact.
83
Table of Contents
NOTE 2 – ACQUISITION AND DIVESTITURE ACTIVITY
Acquisitions
Anchor BanCorp Wisconsin Inc.
Effective May 1, 2016, Old National completed the acquisition of Madison, Wisconsin-based Anchor (WI) through a stock and cash merger. Anchor (WI) was a savings and loan holding company with AnchorBank (WI) as its wholly-owned subsidiary. AnchorBank (WI) operated 46 banking centers, including 32 banking centers in the Madison, Milwaukee, and Fox Valley triangle. Old National achieved cost savings by integrating the two companies and combining accounting, data processing, retail and lending support, and other administrative functions after the merger, which enabled Old National to achieve economies of scale in these areas.
Pursuant to the merger agreement, shareholders of Anchor (WI) could elect to receive either 3.5505 shares of Old National Common Stock or $48.50 in cash for each share of Anchor (WI) they held, subject to a maximum of 40% of the purchase price in cash. The total fair value of consideration paid for Anchor (WI) was $459.8 million, consisting of $186.2 million of cash and the issuance of 20.4 million shares of Old National Common Stock valued at $273.6 million. This acquisition was accounted for under the acquisition method of accounting. Accordingly, Old National recognized amounts for identifiable assets acquired and liabilities assumed at their estimated acquisition date fair values, while $15.9 million of transaction and integration costs were expensed as incurred.
As of April 30, 2017, Old National finalized its valuation of all assets acquired and liabilities assumed, resulting in no material change to acquisition accounting adjustments. A summary of the fair values of the acquired assets, liabilities assumed, and resulting goodwill are as follows (in thousands):
| Cash and cash equivalents |
$ | 123,657 | ||
| Investment securities |
235,240 | |||
| FHLB stock |
4,596 | |||
| Loans held for sale |
9,334 | |||
| Loans |
1,637,806 | |||
| Premises and equipment |
35,721 | |||
| Accrued interest receivable |
7,308 | |||
| Other real estate owned |
17,349 | |||
| Company-owned life insurance |
7,278 | |||
| Other assets |
126,210 | |||
| Deposits |
(1,852,713 | ) | ||
| Securities sold under agreements to repurchase |
(3,132 | ) | ||
| Other borrowings |
(123 | ) | ||
| Accrued expenses and other liabilities |
(36,957 | ) | ||
|
|
|
|||
| Net tangible assets acquired |
311,574 | |||
| Definite-lived intangible assets acquired |
21,559 | |||
| Loan servicing rights |
15,274 | |||
| Goodwill |
111,347 | |||
|
|
|
|||
| Total consideration |
$ | 459,754 | ||
|
|
|
Goodwill related to this acquisition will not be deductible for tax purposes.
The estimated fair value of the core deposit intangible was $21.6 million and is being amortized over an estimated useful life of 7 years.
84
Table of Contents
Acquired loan data for Anchor (WI) can be found in the table below:
| (in thousands) |
Fair Value of Acquired Loans at Acquisition Date |
Gross Contractual Amounts Receivable at Acquisition Date |
Best Estimate at Acquisition Date of Contractual Cash Flows Not Expected to be Collected |
|||||||||
| Acquired receivables subject to ASC 310-30 |
$ | 20,174 | $ | 29,544 | $ | 6,153 | ||||||
| Acquired receivables not subject to ASC 310-30 |
$ | 1,617,632 | $ | 2,143,532 | $ | 274,155 | ||||||
Anchor Bancorp, Inc.
Effective November 1, 2017, Old National completed the acquisition of St. Paul, Minnesota-based Anchor (MN) through a stock and cash merger. Anchor (MN) was a bank holding company with Anchor Bank (MN) as its wholly-owned subsidiary. Founded in 1967 and with 17 total branches, Anchor Bank (MN) was one of the largest community banks headquartered in the Twin Cities, and also served Mankato, Minnesota. Anchor Bank (MN) has no affiliation with the former AnchorBank (WI) in Madison, Wisconsin, which Old National acquired in 2016. Old National believes that it will be able to achieve cost savings by integrating the two companies and combining accounting, data processing, retail and lending support, and other administrative functions, which will enable Old National to achieve economies of scale in these areas.
Pursuant to the merger agreement, each holder of Anchor (MN) common stock received $2.625 in cash and 1.350 shares of Old National Common Stock per share of Anchor (MN) common stock such holder owned. The total fair value of consideration for Anchor (MN) was $332.8 million, consisting of $31.9 million of cash and the issuance of 16.5 million shares of Old National Common Stock valued at $300.8 million. This acquisition was accounted for under the acquisition method of accounting. Accordingly, Old National recognized amounts for identifiable assets acquired and liabilities assumed at their estimated acquisition date fair values. Through December 31, 2017, transaction and integration costs of $12.3 million associated with this acquisition have been expensed and remaining integration costs will be expensed in future periods as incurred.
The following table reflects management’s preliminary valuation of the assets acquired and liabilities assumed (in thousands):
| Cash and cash equivalents |
$ | 34,501 | ||
| Investment securities |
302,195 | |||
| FHLB/Federal Reserve Bank stock |
6,585 | |||
| Loans held for sale |
1,407 | |||
| Loans |
1,593,991 | |||
| Premises and equipment |
33,556 | |||
| Accrued interest receivable |
5,872 | |||
| Other real estate owned |
1,058 | |||
| Company-owned life insurance |
44,490 | |||
| Other assets |
29,872 | |||
| Deposits |
(1,777,449 | ) | ||
| Federal funds purchased and interbank borrowings |
(45,600 | ) | ||
| Securities sold under agreements to repurchase |
(22,965 | ) | ||
| Other borrowings |
(49,257 | ) | ||
| Accrued expenses and other liabilities |
(25,784 | ) | ||
|
|
|
|||
| Net tangible assets acquired |
132,472 | |||
| Definite-lived intangible assets acquired |
27,260 | |||
| Goodwill |
173,033 | |||
|
|
|
|||
| Total consideration |
$ | 332,765 | ||
|
|
|
85
Table of Contents
Prior to the end of the one-year measurement period for finalizing acquisition-date fair values, if information becomes available which would indicate adjustments are required to the allocation, such adjustments will be included in the allocation in the reporting period in which the adjustment amounts are determined.
Goodwill related to this acquisition will not be deductible for tax purposes.
The estimated fair value of the core deposit intangible was $27.3 million and is being amortized over an estimated useful life of 10 years.
Acquired loan data for Anchor (MN) can be found in the table below:
| (in thousands) |
Fair Value of Acquired Loans at Acquisition Date |
Gross Contractual Amounts Receivable at Acquisition Date |
Best Estimate at Acquisition Date of Contractual Cash Flows Not Expected to be Collected |
|||||||||
| Acquired receivables subject to ASC 310-30 |
$ | 10,555 | $ | 16,898 | $ | 4,787 | ||||||
| Acquired receivables not subject to ASC 310-30 |
$ | 1,583,436 | $ | 1,879,449 | $ | 87,767 | ||||||
Summary of Unaudited Pro-Forma Information
The unaudited pro-forma information below for 2017 and 2016 gives effect to the Anchor (MN) acquisition as if it had occurred on January 1, 2016. The pro-forma financial information is not necessarily indicative of the results of operations if the acquisition had been effective as of this date.
| (dollars in thousands) |
2017 | 2016 | ||||||
| Revenue (1) |
$ | 700,944 | $ | 738,280 | ||||
| Income before income taxes |
$ | 213,932 | $ | 214,737 | ||||
| (1) | Net interest income plus noninterest income. |
Supplemental pro-forma earnings for 2017 were adjusted to exclude $12.3 million of acquisition-related costs incurred during 2017. Supplemental pro-forma earnings for 2016 were adjusted to include these charges.
Divestitures
On August 14, 2015, Old National divested its southern Illinois region (twelve branches) along with four branches in eastern Indiana and one in Ohio. At closing, the purchasers assumed loans of $193.6 million and deposits of $555.8 million. Old National recorded a net pre-tax gain of $15.6 million in connection with the divestitures, which included a deposit premium of $19.3 million, goodwill allocation of $3.8 million, and $0.9 million of other transaction expenses.
In addition, Old National consolidated 23 branches throughout the Old National franchise during 2015 based on an ongoing assessment of our service and delivery network and on our goal to continue to move our franchise into stronger growth markets.
On May 31, 2016, Old National sold its insurance operations, ONI. Old National received approximately $91.8 million in cash resulting in a pre-tax gain of $41.9 million and an after-tax gain of $17.6 million. Goodwill and intangible assets of approximately $47.5 million were eliminated as part of this transaction. ONI was an ancillary business and did not meet the criteria to be treated as a discontinued operation as defined in ASU 2014-08, Presentation of Financial Statements (Topic 205) and Property, Plant, and Equipment (Topic 360): Reporting Discontinued Operations and Disclosures of Disposals of Components of an Entity.
86
Table of Contents
Based on an ongoing assessment of our service and delivery network, Old National consolidated 5 branches during 2016 and an additional 29 in 2017.
NOTE 3 – INVESTMENT SECURITIES
The following table summarizes the amortized cost and fair value of the available-for-sale and held-to-maturity investment securities portfolio at December 31 and the corresponding amounts of unrealized gains and losses therein:
| (dollars in thousands) |
Amortized Cost |
Unrealized Gains |
Unrealized Losses |
Fair Value |
||||||||||||
| December 31, 2017 |
||||||||||||||||
|
Available-for-Sale |
||||||||||||||||
| U.S. Treasury |
$ | 5,473 | $ | 83 | $ | (5 | ) | $ | 5,551 | |||||||
| U.S. government-sponsored entities and agencies |
675,643 | 3 | (11,360 | ) | 664,286 | |||||||||||
| Mortgage-backed securities - Agency |
1,704,014 | 1,600 | (37,932 | ) | 1,667,682 | |||||||||||
| States and political subdivisions |
529,835 | 5,085 | (4,727 | ) | 530,193 | |||||||||||
| Pooled trust preferred securities |
16,605 | — | (8,157 | ) | 8,448 | |||||||||||
| Other securities |
321,016 | 1,172 | (2,141 | ) | 320,047 | |||||||||||
|
|
|
|
|
|
|
|
|
|||||||||
| Total available-for-sale securities |
$ | 3,252,586 | $ | 7,943 | $ | (64,322 | ) | $ | 3,196,207 | |||||||
|
|
|
|
|
|
|
|
|
|||||||||
|
Held-to-Maturity |
||||||||||||||||
| Mortgage-backed securities - Agency |
$ | 6,903 | 153 | $ | — | $ | 7,056 | |||||||||
| States and political subdivisions |
677,160 | 43,495 | (8 | ) | 720,647 | |||||||||||
|
|
|
|
|
|
|
|
|
|||||||||
| Total held-to-maturity securities |
$ | 684,063 | $ | 43,648 | $ | (8 | ) | $ | 727,703 | |||||||
|
|
|
|
|
|
|
|
|
|||||||||
| December 31, 2016 |
||||||||||||||||
|
Available-for-Sale |
||||||||||||||||
| U.S. Treasury |
$ | 6,963 | $ | 140 | $ | — | $ | 7,103 | ||||||||
| U.S. government-sponsored entities and agencies |
506,234 | 113 | (12,391 | ) | 493,956 | |||||||||||
| Mortgage-backed securities - Agency |
1,551,465 | 6,923 | (33,369 | ) | 1,525,019 | |||||||||||
| States and political subdivisions |
446,003 | 4,183 | (13,502 | ) | 436,684 | |||||||||||
| Pooled trust preferred securities |
17,011 | — | (8,892 | ) | 8,119 | |||||||||||
| Other securities |
331,001 | 1,074 | (5,782 | ) | 326,293 | |||||||||||
|
|
|
|
|
|
|
|
|
|||||||||
| Total available-for-sale securities |
$ | 2,858,677 | $ | 12,433 | $ | (73,936 | ) | $ | 2,797,174 | |||||||
|
|
|
|
|
|
|
|
|
|||||||||
|
Held-to-Maturity |
||||||||||||||||
| U.S. government-sponsored entities and agencies |
$ | 40,131 | $ | 427 | $ | — | $ | 40,558 | ||||||||
| Mortgage-backed securities - Agency |
10,640 | 300 | — | 10,940 | ||||||||||||
| States and political subdivisions |
694,319 | 38,915 | (560 | ) | 732,674 | |||||||||||
|
|
|
|
|
|
|
|
|
|||||||||
| Total held-to-maturity securities |
$ | 745,090 | $ | 39,642 | $ | (560 | ) | $ | 784,172 | |||||||
|
|
|
|
|
|
|
|
|
|||||||||
87
Table of Contents
Proceeds from sales or calls of available-for-sale investment securities, the resulting realized gains and realized losses, and other securities gains or losses were as follows for the years ended December 31:
| Years Ended December 31, | ||||||||||||
| (dollars in thousands) |
2017 | 2016 | 2015 | |||||||||
| Proceeds from sales of available-for-sale securities |
$ | 342,233 | $ | 243,312 | $ | 343,486 | ||||||
| Proceeds from calls of available-for-sale securities |
88,233 | 635,624 | 404,277 | |||||||||
|
|
|
|
|
|
|
|||||||
| Total |
$ | 430,466 | $ | 878,936 | $ | 747,763 | ||||||
|
|
|
|
|
|
|
|||||||
| Realized gains on sales of available-for-sale securities |
$ | 8,710 | $ | 5,423 | $ | 5,640 | ||||||
| Realized gains on calls of available-for-sale securities |
29 | 922 | 605 | |||||||||
| Realized losses on sales of available-for-sale securities |
(263 | ) | (450 | ) | (518 | ) | ||||||
| Realized losses on calls of available-for-sale securities |
(8 | ) | (147 | ) | (15 | ) | ||||||
| Other securities gains (losses) (1) |
667 | 100 | 6 | |||||||||
|
|
|
|
|
|
|
|||||||
| Net securities gains |
$ | 9,135 | $ | 5,848 | $ | 5,718 | ||||||
|
|
|
|
|
|
|
|||||||
| (1) | Other securities gains (losses) includes net realized and unrealized gains or losses associated with trading securities and mutual funds. |
During 2015, Old National sold a municipal bond that was classified as held-to-maturity due to credit deterioration. Proceeds from the sale were $0.8 million and resulted in a gain of $52 thousand.
Investment securities pledged to secure public and other funds had a carrying value of $1.8 billion at December 31, 2017 and $1.4 billion at December 31, 2016.
Trading securities, which consist of mutual funds held in trusts associated with deferred compensation plans for former directors and executives, are recorded at fair value and totaled $5.6 million at December 31, 2017 and $5.0 million at December 31, 2016.
At December 31, 2017, Old National had a concentration of investment securities issued by certain states and their political subdivisions with the following aggregate market values: $375.1 million by Indiana, which represented 17.4% of shareholders’ equity, and $182.7 million by Texas, which represented 8.5% of shareholders’ equity. Of the Indiana municipal bonds, 98% are rated “A” or better, and the remaining 2% generally represent non-rated local interest bonds where Old National has a market presence. All of the Texas municipal bonds are rated “AA” or better, and the majority of issues are backed by the “AAA” rated State of Texas Permanent School Fund Guarantee Program.
As previously disclosed in Note 1, upon the early adoption of ASU No. 2017-12 on January 1, 2018, Old National is reclassifying $447.0 million in state and political subdivision securities from the held-to-maturity portfolio to the available-for-sale portfolio. Separately, on January 1, 2018, U.S. government-sponsored entities and agencies, agency mortgage-backed securities, and state and political subdivision securities with a fair value of $324.0 million were transferred from the available-for-sale portfolio to the held-to-maturity portfolio. The $10.8 million unrealized holding loss at the date of transfer shall continue to be reported as a separate component of shareholders’ equity and will be amortized over the remaining life of the securities as an adjustment to yield. The corresponding discount on these securities will offset this adjustment to yield as it is amortized.
88
Table of Contents
All of the mortgage-backed securities in the investment portfolio are residential mortgage-backed securities. The amortized cost and fair value of the investment securities portfolio are shown by expected maturity. Expected maturities may differ from contractual maturities if borrowers have the right to call or prepay obligations with or without call or prepayment penalties. Weighted average yield is based on amortized cost.
| At December 31, 2017 | ||||||||||||
| (dollars in thousands) | Amortized | Fair | Weighted Average |
|||||||||
| Maturity |
Cost | Value | Yield | |||||||||
|
Available-for-Sale |
||||||||||||
| Within one year |
$ | 64,076 | $ | 64,084 | 2.13 | % | ||||||
| One to five years |
420,949 | 417,941 | 2.02 | |||||||||
| Five to ten years |
337,043 | 336,999 | 2.72 | |||||||||
| Beyond ten years |
2,430,518 | 2,377,183 | 2.48 | |||||||||
|
|
|
|
|
|
|
|||||||
| Total |
$ | 3,252,586 | $ | 3,196,207 | 2.43 | % | ||||||
|
|
|
|
|
|
|
|||||||
|
Held-to-Maturity |
||||||||||||
| Within one year |
$ | 22,566 | $ | 22,692 | 6.23 | % | ||||||
| One to five years |
115,596 | 120,904 | 5.08 | |||||||||
| Five to ten years |
159,452 | 167,547 | 4.87 | |||||||||
| Beyond ten years |
386,449 | 416,560 | 5.75 | |||||||||
|
|
|
|
|
|
|
|||||||
| Total |
$ | 684,063 | $ | 727,703 | 5.44 | % | ||||||
|
|
|
|
|
|
|
|||||||
89
Table of Contents
The following table summarizes the investment securities with unrealized losses at December 31 by aggregated major security type and length of time in a continuous unrealized loss position:
| Less than 12 months | 12 months or longer | Total | ||||||||||||||||||||||
| Fair | Unrealized | Fair | Unrealized | Fair | Unrealized | |||||||||||||||||||
| (dollars in thousands) |
Value | Losses | Value | Losses | Value | Losses | ||||||||||||||||||
| December 31, 2017 |
||||||||||||||||||||||||
|
Available-for-Sale |
||||||||||||||||||||||||
| U.S. Treasury |
$ | 1,480 | $ | (5 | ) | $ | — | $ | — | $ | 1,480 | $ | (5 | ) | ||||||||||
| U.S. government-sponsored entities and agencies |
201,773 | (1,333 | ) | 408,493 | (10,027 | ) | 610,266 | (11,360 | ) | |||||||||||||||
| Mortgage-backed securities—Agency |
789,804 | (8,692 | ) | 774,825 | (29,240 | ) | 1,564,629 | (37,932 | ) | |||||||||||||||
| States and political subdivisions |
196,024 | (1,899 | ) | 90,637 | (2,828 | ) | 286,661 | (4,727 | ) | |||||||||||||||
| Pooled trust preferred securities |
— | — | 8,448 | (8,157 | ) | 8,448 | (8,157 | ) | ||||||||||||||||
| Other securities |
61,260 | (429 | ) | 125,517 | (1,712 | ) | 186,777 | (2,141 | ) | |||||||||||||||
|
|
|
|
|
|
|
|
|
|
|
|
|
|||||||||||||
| Total available-for-sale |
$ | 1,250,341 | $ | (12,358 | ) | $ | 1,407,920 | $ | (51,964 | ) | $ | 2,658,261 | $ | (64,322 | ) | |||||||||
|
|
|
|
|
|
|
|
|
|
|
|
|
|||||||||||||
|
Held-to-Maturity |
||||||||||||||||||||||||
| States and political subdivisions |
$ | 2,309 | $ | (8 | ) | $ | — | $ | — | $ | 2,309 | $ | (8 | ) | ||||||||||
|
|
|
|
|
|
|
|
|
|
|
|
|
|||||||||||||
| Total held-to-maturity |
$ | 2,309 | $ | (8 | ) | $ | — | $ | — | $ | 2,309 | $ | (8 | ) | ||||||||||
|
|
|
|
|
|
|
|
|
|
|
|
|
|||||||||||||
| December 31, 2016 |
||||||||||||||||||||||||
|
Available-for-Sale |
||||||||||||||||||||||||
| U.S. government-sponsored entities and agencies |
$ | 432,192 | $ | (12,391 | ) | $ | — | $ | — | $ | 432,192 | $ | (12,391 | ) | ||||||||||
| Mortgage-backed securities—Agency |
1,177,093 | (30,295 | ) | 57,636 | (3,074 | ) | 1,234,729 | (33,369 | ) | |||||||||||||||
| States and political subdivisions |
286,351 | (13,247 | ) | 4,919 | (255 | ) | 291,270 | (13,502 | ) | |||||||||||||||
| Pooled trust preferred securities |
— | — | 8,119 | (8,892 | ) | 8,119 | (8,892 | ) | ||||||||||||||||
| Other securities |
121,498 | (2,734 | ) | 126,539 | (3,048 | ) | 248,037 | (5,782 | ) | |||||||||||||||
|
|
|
|
|
|
|
|
|
|
|
|
|
|||||||||||||
| Total available-for-sale |
$ | 2,017,134 | $ | (58,667 | ) | $ | 197,213 | $ | (15,269 | ) | $ | 2,214,347 | $ | (73,936 | ) | |||||||||
|
|
|
|
|
|
|
|
|
|
|
|
|
|||||||||||||
|
Held-to-Maturity |
||||||||||||||||||||||||
| States and political subdivisions |
$ | 59,481 | $ | (560 | ) | $ | — | $ | — | $ | 59,481 | $ | (560 | ) | ||||||||||
|
|
|
|
|
|
|
|
|
|
|
|
|
|||||||||||||
| Total held-to-maturity |
$ | 59,481 | $ | (560 | ) | $ | — | $ | — | $ | 59,481 | $ | (560 | ) | ||||||||||
|
|
|
|
|
|
|
|
|
|
|
|
|
|||||||||||||
Management evaluates securities for OTTI at least on a quarterly basis, and more frequently when economic or market conditions warrant such an evaluation. The investment securities portfolio is evaluated for OTTI by segregating the portfolio into two general segments and applying the appropriate OTTI model. Investment securities classified as available-for-sale or held-to-maturity are generally evaluated for OTTI under FASB ASC 320, Investments – Debt and Equity Securities. However, certain purchased beneficial interests, including non-agency mortgage-backed securities, asset-backed securities, and collateralized debt obligations, that had credit ratings at the time of purchase of below AA are evaluated using the model outlined in FASB ASC 325-10 (EITF Issue No. 99-20, Recognition of Interest Income and Impairment on Purchased Beneficial Interests and Beneficial Interests that Continue to be Held by a Transfer in Securitized Financial Assets).
In determining OTTI under the FASB ASC 320 model, management considers many factors, including: (1) the length of time and the extent to which the fair value has been less than cost, (2) the financial condition and near-term prospects of the issuer, (3) whether the market decline was affected by macroeconomic conditions, and (4) whether the entity has the intent to sell the debt security or more likely than not will be required to sell the debt security before its anticipated recovery. The assessment of whether an other-than-temporary decline exists involves a high degree of subjectivity and judgment and is based on the information available to management at a point in time. The second segment of the portfolio uses the OTTI guidance provided by FASB ASC 325-10 (EITF 99-20) that is specific to purchased beneficial interests that, on the purchase date, were rated below AA. Under the FASB ASC 325-10 model, we compare the present value of the remaining cash flows as estimated at the preceding evaluation date to the current expected remaining cash flows. An OTTI is deemed to have occurred if there has been an adverse change in the remaining expected future cash flows.
90
Table of Contents
When OTTI occurs under either model, the amount of the OTTI recognized in earnings depends on whether an entity intends to sell the security or more likely than not will be required to sell the security before recovery of its amortized cost basis less any current-period credit loss. If an entity intends to sell or more likely than not will be required to sell the security before recovery of its amortized cost basis less any current-period credit loss, the OTTI shall be recognized in earnings equal to the entire difference between the investment’s amortized cost basis and its fair value at the balance sheet date. Otherwise, the OTTI shall be separated into the amount representing the credit loss and the amount related to all other factors. The amount of the total OTTI related to the credit loss is determined based on the present value of cash flows expected to be collected and is recognized in earnings. The amount of the total OTTI related to other factors shall be recognized in other comprehensive income, net of applicable taxes. The previous amortized cost basis less the OTTI recognized in earnings shall become the new amortized cost basis of the investment.
We did not record OTTI in 2017, 2016, or 2015.
As of December 31, 2017, Old National’s securities portfolio consisted of 1,789 securities, 737 of which were in an unrealized loss position. The unrealized losses attributable to our U.S. Treasury, U.S. government-sponsored entities and agencies, agency mortgage-backed securities, states and political subdivisions, and other securities are the result of fluctuations in interest rates. Our pooled trust preferred securities are discussed below. At December 31, 2017, we had no intent to sell any securities that were in an unrealized loss position nor is it expected that we would be required to sell any securities.
Pooled Trust Preferred Securities
At December 31, 2017, our securities portfolio contained three pooled trust preferred securities with a fair value of $8.4 million and unrealized losses of $8.2 million. One of the pooled trust preferred securities in our portfolio falls within the scope of FASB ASC 325-10 (EITF 99-20) and has a fair value of $0.3 million with an unrealized loss of $2.4 million at December 31, 2017. This security was rated A3 at inception, but is rated D at December 31, 2017. The issuers in this security are banks. We use the OTTI evaluation model to compare the present value of expected cash flows to the previous estimate to determine whether an adverse change in cash flows has occurred during the quarter. The OTTI model considers the structure and term of the CDO and the financial condition of the underlying issuers. Specifically, the model details interest rates, principal balances of note classes and underlying issuers, the timing and amount of interest and principal payments of the underlying issuers, and the allocation of the payments to the note classes. The current estimate of expected cash flows is based on the most recent trustee reports and any other relevant market information including announcements of interest payment deferrals or defaults of underlying trust preferred securities. Assumptions used in the model include expected future default rates and prepayments. We assume no recoveries on defaults and a limited number of recoveries on current or projected interest payment deferrals. In addition, we use the model to “stress” this CDO, or make assumptions more severe than expected activity, to determine the degree to which assumptions could deteriorate before the CDO could no longer fully support repayment of Old National’s note class. For the years ended December 31, 2017 and 2016, our model indicated no OTTI on this security.
Two of our pooled trust preferred securities with a fair value of $8.1 million and unrealized losses of $5.8 million at December 31, 2017 are not subject to FASB ASC 325-10. These securities are evaluated using collateral-specific assumptions to estimate the expected future interest and principal cash flows. For the years ended December 31, 2017 and 2016, our analysis indicated no OTTI on these securities.
91
Table of Contents
The table below summarizes the relevant characteristics of our pooled trust preferred securities as well as our single issuer trust preferred securities that are included in the “other securities” category in this footnote. Each of the pooled trust preferred securities support a more senior tranche of security holders. All three pooled trust preferred securities have experienced credit defaults. However, two of these securities have excess subordination and are not other-than-temporarily impaired as a result of their class hierarchy, which provides more loss protection.
| Trust preferred securities | Actual | Expected | Excess | |||||||||||||||||||||||||||||||||||||
| December 31, 2017 | Deferrals | Defaults as | Subordination | |||||||||||||||||||||||||||||||||||||
| (dollars in thousands) | # of Issuers | and Defaults | a % of | as a % of | ||||||||||||||||||||||||||||||||||||
| Lowest | Unrealized | Realized | Currently | as a % of | Remaining | Current | ||||||||||||||||||||||||||||||||||
| Credit | Amortized | Fair | Gain/ | Losses | Performing/ | Original | Performing | Performing | ||||||||||||||||||||||||||||||||
| Class | Rating (1) | Cost | Value | (Loss) | 2017 | Remaining | Collateral | Collateral | Collateral | |||||||||||||||||||||||||||||||
| Pooled trust preferred securities: |
||||||||||||||||||||||||||||||||||||||||
| Reg Div Funding 2004 |
B-2 | D | $ | 2,696 | $ | 273 | $ | (2,423 | ) | $ | — | 21/36 | 32.1 | % | 7.7 | % | 0.0 | % | ||||||||||||||||||||||
| Pretsl XXVII LTD |
B | B | 4,414 | 2,478 | (1,936 | ) | — | 34/44 | 16.7 | % | 11.8 | % | 33.1 | % | ||||||||||||||||||||||||||
| Trapeza Ser 13A |
A2A | BBB | 9,495 | 5,697 | (3,798 | ) | — | 49/54 | 4.5 | % | 8.3 | % | 53.7 | % | ||||||||||||||||||||||||||
|
|
|
|
|
|
|
|
|
|||||||||||||||||||||||||||||||||
| 16,605 | 8,448 | (8,157 | ) | — | ||||||||||||||||||||||||||||||||||||
| Single Issuer trust preferred securities: |
||||||||||||||||||||||||||||||||||||||||
| Fleet Cap Tr V (BOA) |
BBB- | 3,406 | 3,290 | (116 | ) | — | ||||||||||||||||||||||||||||||||||
| JP Morgan Chase Cap XIII |
BBB- | 4,778 | 4,778 | — | — | |||||||||||||||||||||||||||||||||||
| NB-Global |
BBB- | 803 | 935 | 132 | — | |||||||||||||||||||||||||||||||||||
|
|
|
|
|
|
|
|
|
|||||||||||||||||||||||||||||||||
| 8,987 | 9,003 | 16 | — | |||||||||||||||||||||||||||||||||||||
| Total |
$ | 25,592 | $ | 17,451 | $ | (8,141 | ) | $ | — | |||||||||||||||||||||||||||||||
|
|
|
|
|
|
|
|
|
|||||||||||||||||||||||||||||||||
| (1) | Lowest rating for the security provided by any nationally recognized credit rating agency. |
Mortgage loans held for immediate sale in the secondary market were $17.9 million at December 31, 2017, compared to $90.7 million at December 31, 2016. Residential loans that Old National has originated with the intent to sell are recorded at fair value in accordance with FASB ASC 825-10, Financial Instruments. Conventional mortgage production is sold on a servicing retained basis. Certain loans, such as government guaranteed mortgage loans are sold on servicing released basis.
NOTE 5 – LOANS AND ALLOWANCE FOR LOAN LOSSES
Old National’s loans consist primarily of loans made to consumers and commercial clients in various industries including manufacturing, agribusiness, transportation, mining, wholesaling, and retailing. Most of Old National’s lending activity occurs within our principal geographic markets of Indiana, Kentucky, Michigan, Wisconsin, and Minnesota. Old National manages concentrations of credit exposure by industry, product, geography, customer relationship, and loan size, with no concentration of loans exceeding 10% of its portfolio.
92
Table of Contents
The composition of loans at December 31 by lending classification was as follows:
| December 31, | ||||||||
| (dollars in thousands) |
2017 | 2016 | ||||||
| Commercial (1) |
$ | 2,717,269 | $ | 1,917,099 | ||||
| Commercial real estate: |
||||||||
| Construction (2) |
374,306 | 357,802 | ||||||
| Other (2) |
3,980,246 | 2,773,051 | ||||||
| Residential real estate |
2,167,053 | 2,087,530 | ||||||
| Consumer credit: |
||||||||
| Home equity |
507,507 | 476,439 | ||||||
| Auto |
1,148,672 | 1,167,737 | ||||||
| Other |
223,068 | 230,854 | ||||||
|
|
|
|
|
|||||
| Total loans |
11,118,121 | 9,010,512 | ||||||
| Allowance for loan losses |
(50,381 | ) | (49,808 | ) | ||||
|
|
|
|
|
|||||
| Net loans |
$ | 11,067,740 | $ | 8,960,704 | ||||
|
|
|
|
|
|||||
| (1) | Includes direct finance leases of $29.5 million at December 31, 2017 and $10.8 million at December 31, 2016. |
| (2) | Certain commercial real estate construction loans were reclassified from commercial real estate - other due to a misclassification at December 31, 2016. |
The risk characteristics of each loan portfolio segment are as follows:
Commercial
Commercial loans are primarily based on the identified cash flows of the borrower and secondarily on the underlying collateral provided by the borrower. The cash flows of borrowers, however, may not be as expected and the collateral securing these loans may fluctuate in value. Most commercial loans are secured by the assets being financed or other business assets such as accounts receivable or inventory and may incorporate a personal guarantee; however, some loans may be made on an unsecured basis. In the case of loans secured by accounts receivable, the availability of funds for the repayment of these loans may be substantially dependent on the ability of the borrower to collect amounts due from its customers.
Commercial Real Estate
These loans are viewed primarily as cash flow loans and secondarily as loans secured by real estate. Commercial real estate lending typically involves higher loan principal amounts, and the repayment of these loans is generally dependent on the successful operation of the property securing the loan or the business conducted on the property securing the loan. Commercial real estate loans may be adversely affected by conditions in the real estate markets or in the general economy. The properties securing Old National’s commercial real estate portfolio are diverse in terms of type and geographic location. Management monitors and evaluates commercial real estate loans based on collateral, geography and risk grade criteria. In addition, management tracks the level of owner-occupied commercial real estate loans versus non-owner occupied loans.
Included with commercial real estate are construction loans, which are underwritten utilizing independent appraisal reviews, sensitivity analysis of absorption and lease rates, financial analysis of the developers and property owners, and feasibility studies, if available. Construction loans are generally based on estimates of costs and value associated with the complete project. These estimates may be inaccurate. Construction loans often involve the disbursement of substantial funds with repayment substantially dependent on the success of the ultimate project. Sources of repayment for these types of loans may be pre-committed permanent loans from approved long-term lenders (including Old National), sales of developed property, or an interim loan commitment from Old National until permanent financing is obtained. These loans are closely monitored by on-site inspections and are considered to have higher risks than other real estate loans due to their ultimate repayment being sensitive to interest rate changes, governmental regulation of real property, general economic conditions, and the availability of long-term financing.
93
Table of Contents
The acquisition of Anchor (MN) on November 1, 2017 added $864.4 million of commercial real estate loans to our portfolio. At 206%, Old National Bank’s commercial real estate loans as a percentage of its risk-based capital remained well below the regulatory guideline limit of 300% at December 31, 2017.
Residential
With respect to residential loans that are secured by 1-4 family residences and are generally owner occupied, Old National typically establishes a maximum loan-to-value ratio and generally requires private mortgage insurance if that ratio is exceeded. Repayment of these loans is primarily dependent on the personal income of the borrowers, which can be impacted by economic conditions in their market areas such as unemployment levels. Repayment can also be impacted by changes in residential property values. Risk is mitigated by the fact that the loans are of smaller individual amounts and spread over a large number of borrowers.
Consumer
Home equity loans are typically secured by a subordinate interest in 1-4 family residences, and consumer loans are secured by consumer assets such as automobiles or recreational vehicles. We assumed student loans in the acquisition of Anchor (WI) in May 2016. Student loans are guaranteed by the government from 97% to 100% and totaled $68.2 million at December 31, 2017, compared to $77.1 million at December 31, 2016. Some consumer loans are unsecured such as small installment loans and certain lines of credit. Repayment of these loans is primarily dependent on the personal income of the borrowers, which can be impacted by economic conditions in their market areas such as unemployment levels. Repayment can also be impacted by changes in residential property or other collateral values. Risk is mitigated by the fact that the loans are of smaller individual amounts and spread over a large number of borrowers.
Related Party Loans
In the ordinary course of business, Old National grants loans to certain executive officers, directors, and significant subsidiaries (collectively referred to as “related parties”).
Activity in related party loans during 2017 is presented in the following table:
| Year Ended | ||||
| (dollars in thousands) |
December 31, 2017 | |||
| Balance at beginning of period |
$ | 8,494 | ||
| New loans |
6,041 | |||
| Repayments |
(4,885 | ) | ||
| Officer and director changes |
(169 | ) | ||
|
|
|
|||
| Balance at end of period |
$ | 9,481 | ||
|
|
|
|||
Allowance for Loan Losses
The allowance for loan losses is maintained at a level believed adequate by management to absorb probable losses incurred in the consolidated loan portfolio. Management’s evaluation of the adequacy of the allowance is an estimate based on reviews of individual loans, pools of homogeneous loans, assessments of the impact of current and anticipated economic conditions on the portfolio, and historical loss experience. The allowance is increased through a provision charged to operating expense. Loans deemed to be uncollectible are charged to the allowance. Recoveries of loans previously charged-off are added to the allowance.
We utilize a PD and LGD model as a tool to determine the adequacy of the allowance for loan losses for performing commercial and commercial real estate loans. The PD is forecast using a transition matrix to determine the likelihood of a customer’s AQR migrating from its current AQR to any other status within the time horizon. Transition rates are measured using Old National’s own historical experience. The model assumes that recent historical transition rates will continue into the future. The LGD is defined as credit loss incurred when an obligor of the bank defaults. The sum of all net charge-offs for a particular portfolio segment are divided by all loans that have defaulted over a given period of time. The expected loss derived from the model considers the PD, LGD, and exposure at default. Additionally, qualitative factors, such as changes in lending policies or procedures, and economic business conditions are also considered.
94
Table of Contents
We use historic loss ratios adjusted for economic conditions to determine the appropriate level of allowance for residential real estate and consumer loans.
No allowance was brought forward on any of the acquired loans as any credit deterioration evident in the loans was included in the determination of the fair value of the loans at the acquisition date. An allowance for loan losses will be established for any subsequent credit deterioration or adverse changes in expected cash flows.
Old National’s activity in the allowance for loan losses for the years ended December 31, 2017, 2016, and 2015 was as follows:
| Commercial | ||||||||||||||||||||
| (dollars in thousands) |
Commercial | Real Estate | Residential | Consumer | Total | |||||||||||||||
| 2017 |
||||||||||||||||||||
| Allowance for loan losses: |
||||||||||||||||||||
| Balance at beginning of period |
$ | 21,481 | $ | 18,173 | $ | 1,643 | $ | 8,511 | $ | 49,808 | ||||||||||
| Charge-offs |
(1,108 | ) | (3,700 | ) | (985 | ) | (6,924 | ) | (12,717 | ) | ||||||||||
| Recoveries |
2,281 | 3,777 | 255 | 3,927 | 10,240 | |||||||||||||||
| Provision |
(3,408 | ) | 3,186 | 850 | 2,422 | 3,050 | ||||||||||||||
|
|
|
|
|
|
|
|
|
|
|
|||||||||||
| Balance at end of period |
$ | 19,246 | $ | 21,436 | $ | 1,763 | $ | 7,936 | $ | 50,381 | ||||||||||
|
|
|
|
|
|
|
|
|
|
|
|||||||||||
| 2016 |
||||||||||||||||||||
| Allowance for loan losses: |
||||||||||||||||||||
| Balance at beginning of period |
$ | 26,347 | $ | 15,993 | $ | 2,051 | $ | 7,842 | $ | 52,233 | ||||||||||
| Charge-offs |
(5,047 | ) | (2,632 | ) | (800 | ) | (6,131 | ) | (14,610 | ) | ||||||||||
| Recoveries |
3,102 | 4,763 | 174 | 3,186 | 11,225 | |||||||||||||||
| Provision |
(2,921 | ) | 49 | 218 | 3,614 | 960 | ||||||||||||||
|
|
|
|
|
|
|
|
|
|
|
|||||||||||
| Balance at end of period |
$ | 21,481 | $ | 18,173 | $ | 1,643 | $ | 8,511 | $ | 49,808 | ||||||||||
|
|
|
|
|
|
|
|
|
|
|
|||||||||||
| 2015 |
||||||||||||||||||||
| Allowance for loan losses: |
||||||||||||||||||||
| Balance at beginning of period |
$ | 20,670 | $ | 17,348 | $ | 2,962 | $ | 6,869 | $ | 47,849 | ||||||||||
| Charge-offs |
(3,513 | ) | (1,921 | ) | (1,039 | ) | (6,404 | ) | (12,877 | ) | ||||||||||
| Recoveries |
5,218 | 4,685 | 354 | 4,081 | 14,338 | |||||||||||||||
| Provision |
3,972 | (4,119 | ) | (226 | ) | 3,296 | 2,923 | |||||||||||||
|
|
|
|
|
|
|
|
|
|
|
|||||||||||
| Balance at end of period |
$ | 26,347 | $ | 15,993 | $ | 2,051 | $ | 7,842 | $ | 52,233 | ||||||||||
|
|
|
|
|
|
|
|
|
|
|
|||||||||||
95
Table of Contents
The following table provides Old National’s recorded investment in loans by portfolio segment at December 31, 2017 and 2016 and other information regarding the allowance:
| Commercial | ||||||||||||||||||||
| (dollars in thousands) |
Commercial | Real Estate | Residential | Consumer | Total | |||||||||||||||
| December 31, 2017 |
||||||||||||||||||||
| Allowance for loan losses: |
||||||||||||||||||||
| Individually evaluated for impairment |
$ | 3,424 | $ | 6,654 | $ | — | $ | — | $ | 10,078 | ||||||||||
| Collectively evaluated for impairment |
15,790 | 14,782 | 1,763 | 7,802 | 40,137 | |||||||||||||||
| Loans acquired with deteriorated credit quality |
32 | — | — | 134 | 166 | |||||||||||||||
|
|
|
|
|
|
|
|
|
|
|
|||||||||||
| Total allowance for loan losses |
$ | 19,246 | $ | 21,436 | $ | 1,763 | $ | 7,936 | $ | 50,381 | ||||||||||
|
|
|
|
|
|
|
|
|
|
|
|||||||||||
| Loans and leases outstanding: |
||||||||||||||||||||
| Individually evaluated for impairment |
$ | 26,270 | $ | 66,061 | $ | — | $ | — | $ | 92,331 | ||||||||||
| Collectively evaluated for impairment |
2,685,847 | 4,266,665 | 2,155,750 | 1,874,002 | 10,982,264 | |||||||||||||||
| Loans acquired with deteriorated credit quality |
5,152 | 21,826 | 11,303 | 5,245 | 43,526 | |||||||||||||||
|
|
|
|
|
|
|
|
|
|
|
|||||||||||
| Total loans and leases outstanding |
$ | 2,717,269 | $ | 4,354,552 | $ | 2,167,053 | $ | 1,879,247 | $ | 11,118,121 | ||||||||||
|
|
|
|
|
|
|
|
|
|
|
|||||||||||
| December 31, 2016 |
||||||||||||||||||||
| Allowance for loan losses: |
||||||||||||||||||||
| Individually evaluated for impairment |
$ | 4,561 | $ | 3,437 | $ | — | $ | — | $ | 7,998 | ||||||||||
| Collectively evaluated for impairment |
16,838 | 14,717 | 1,643 | 8,334 | 41,532 | |||||||||||||||
| Loans acquired with deteriorated credit quality |
82 | 19 | — | 177 | 278 | |||||||||||||||
|
|
|
|
|
|
|
|
|
|
|
|||||||||||
| Total allowance for loan losses |
$ | 21,481 | $ | 18,173 | $ | 1,643 | $ | 8,511 | $ | 49,808 | ||||||||||
|
|
|
|
|
|
|
|
|
|
|
|||||||||||
| Loans and leases outstanding: |
||||||||||||||||||||
| Individually evaluated for impairment |
$ | 45,960 | $ | 57,230 | $ | — | $ | — | $ | 103,190 | ||||||||||
| Collectively evaluated for impairment |
1,870,289 | 3,040,849 | 2,073,950 | 1,866,815 | 8,851,903 | |||||||||||||||
| Loans acquired with deteriorated credit quality |
850 | 32,774 | 13,580 | 8,215 | 55,419 | |||||||||||||||
|
|
|
|
|
|
|
|
|
|
|
|||||||||||
| Total loans and leases outstanding |
$ | 1,917,099 | $ | 3,130,853 | $ | 2,087,530 | $ | 1,875,030 | $ | 9,010,512 | ||||||||||
|
|
|
|
|
|
|
|
|
|
|
|||||||||||
Credit Quality
Old National’s management monitors the credit quality of its loans in an on-going manner. Internally, management assigns an AQR to each non-homogeneous commercial and commercial real estate loan in the portfolio, with the exception of certain FICO-scored small business loans. The primary determinants of the AQR are based upon the reliability of the primary source of repayment and the past, present, and projected financial condition of the borrower. The AQR will also consider current industry conditions. Major factors used in determining the AQR can vary based on the nature of the loan, but commonly include factors such as debt service coverage, internal cash flow, liquidity, leverage, operating performance, debt burden, FICO scores, occupancy, interest rate sensitivity, and expense burden. Old National uses the following definitions for risk ratings:
Criticized. Special mention loans that have a potential weakness that deserves management’s close attention. If left uncorrected, these potential weaknesses may result in deterioration of the repayment prospects for the loan or of the institution’s credit position at some future date.
Classified – Substandard. Loans classified as substandard are inadequately protected by the current net worth and paying capacity of the obligor or of the collateral pledged, if any. Loans so classified have a well-defined weakness or weaknesses that jeopardize the liquidation of the debt. They are characterized by the distinct possibility that the institution will sustain some loss if the deficiencies are not corrected.
Classified – Nonaccrual. Loans classified as nonaccrual have all the weaknesses inherent in those classified as substandard, with the added characteristic that the weaknesses make collection in full, on the basis of currently existing facts, conditions, and values, in doubt.
96
Table of Contents
Classified – Doubtful. Loans classified as doubtful have all the weaknesses inherent in those classified as nonaccrual, with the added characteristic that the weaknesses make collection in full, on the basis of currently existing facts, conditions, and values, highly questionable and improbable.
Pass rated loans are those loans that are other than criticized, classified – substandard, classified – nonaccrual, or classified – doubtful.
The risk category of commercial and commercial real estate loans by class of loans at December 31, 2017 and 2016 was as follows:
| (dollars in thousands) | Commercial | Commercial | ||||||||||||||||||||||
| Corporate Credit Exposure | Real Estate - | Real Estate - | ||||||||||||||||||||||
| Credit Risk Profile by | Commercial | Construction | Other | |||||||||||||||||||||
| Internally Assigned Grade | 2017 | 2016 | 2017 | 2016 | 2017 | 2016 | ||||||||||||||||||
| Grade: |
||||||||||||||||||||||||
| Pass |
$ | 2,577,824 | $ | 1,750,922 | $ | 357,438 | $ | 347,325 | $ | 3,762,896 | $ | 2,669,890 | ||||||||||||
| Criticized |
74,876 | 45,614 | 14,758 | 9,258 | 98,451 | 40,590 | ||||||||||||||||||
| Classified - substandard |
37,367 | 63,978 | — | 49 | 58,584 | 19,715 | ||||||||||||||||||
| Classified - nonaccrual |
24,798 | 53,063 | 2,110 | 1,170 | 30,108 | 33,833 | ||||||||||||||||||
| Classified - doubtful |
2,404 | 3,522 | — | — | 30,207 | 9,023 | ||||||||||||||||||
|
|
|
|
|
|
|
|
|
|
|
|
|
|||||||||||||
| Total |
$ | 2,717,269 | $ | 1,917,099 | $ | 374,306 | $ | 357,802 | $ | 3,980,246 | $ | 2,773,051 | ||||||||||||
|
|
|
|
|
|
|
|
|
|
|
|
|
|||||||||||||
Commercial loans as of December 31, 2017 in the table above include loans attributable to the acquisition of Anchor (MN) totaling $26.5 million in the criticized category, $7.3 million in the classified – substandard category, and $7.3 million in the classified – nonaccrual category. Construction commercial real estate loans as of December 31, 2017 in the table above include loans attributable to the acquisition of Anchor (MN) totaling $1.2 million in the classified – nonaccrual category. Other commercial real estate as of December 31, 2017 in the table above includes loans attributable to the acquisition of Anchor (MN) totaling $20.4 million in the criticized category, $3.6 million in the classified – substandard category, and $6.9 million in the classified – nonaccrual category.
Old National considers the performance of the loan portfolio and its impact on the allowance for loan losses. For residential and consumer loan classes, Old National also evaluates credit quality based on the aging status of the loan and by payment activity. The following table presents the recorded investment in residential and consumer loans based on payment activity as of December 31, 2017 and 2016:
| (dollars in thousands) | Consumer | |||||||||||||||
| Home | ||||||||||||||||
| Residential | Equity | Auto | Other | |||||||||||||
| December 31, 2017 |
||||||||||||||||
| Performing |
$ | 2,144,882 | $ | 502,322 | $ | 1,145,977 | $ | 217,819 | ||||||||
| Nonperforming |
22,171 | 5,185 | 2,695 | 5,249 | ||||||||||||
|
|
|
|
|
|
|
|
|
|||||||||
| Total |
$ | 2,167,053 | $ | 507,507 | $ | 1,148,672 | $ | 223,068 | ||||||||
|
|
|
|
|
|
|
|
|
|||||||||
| December 31, 2016 |
||||||||||||||||
| Performing |
$ | 2,069,856 | $ | 472,008 | $ | 1,166,114 | $ | 223,786 | ||||||||
| Nonperforming |
17,674 | 4,431 | 1,623 | 7,068 | ||||||||||||
|
|
|
|
|
|
|
|
|
|||||||||
| Total |
$ | 2,087,530 | $ | 476,439 | $ | 1,167,737 | $ | 230,854 | ||||||||
|
|
|
|
|
|
|
|
|
|||||||||
Impaired Loans
Large commercial credits are subject to individual evaluation for impairment. Retail credits and other small balance credits that are part of a homogeneous group are not tested for individual impairment unless they are modified as a TDR. A loan is considered impaired when it is probable that contractual interest and principal payments will not be collected either for the amounts or by the dates as scheduled in the loan agreement. If a loan is impaired, a portion of the allowance is allocated so that the loan is reported net, at the present value of estimated cash flows using the
97
Table of Contents
loan’s existing rate or at the fair value of collateral if repayment is expected solely from the collateral. Old National’s policy, for all but PCI loans, is to recognize interest income on impaired loans unless the loan is placed on nonaccrual status.
The following table shows Old National’s impaired loans as of December 31, 2017 and 2016, respectively. Only purchased loans that have experienced subsequent impairment since the date acquired are included in the table below.
| Unpaid | ||||||||||||
| Recorded | Principal | Related | ||||||||||
| (dollars in thousands) |
Investment | Balance | Allowance | |||||||||
| December 31, 2017 |
||||||||||||
| With no related allowance recorded: |
||||||||||||
| Commercial |
$ | 20,557 | $ | 21,483 | $ | — | ||||||
| Commercial Real Estate—Other |
38,678 | 44,564 | — | |||||||||
| Residential |
2,443 | 2,464 | — | |||||||||
| Consumer |
1,685 | 2,105 | — | |||||||||
| With an allowance recorded: |
||||||||||||
| Commercial |
5,713 | 5,713 | 3,424 | |||||||||
| Commercial Real Estate—Construction |
905 | 1,371 | 401 | |||||||||
| Commercial Real Estate—Other |
26,478 | 26,902 | 6,253 | |||||||||
| Residential |
870 | 870 | 44 | |||||||||
| Consumer |
2,211 | 2,228 | 110 | |||||||||
|
|
|
|
|
|
|
|||||||
| Total |
$ | 99,540 | $ | 107,700 | $ | 10,232 | ||||||
|
|
|
|
|
|
|
|||||||
| December 31, 2016 |
||||||||||||
| With no related allowance recorded: |
||||||||||||
| Commercial |
$ | 29,001 | $ | 29,634 | $ | — | ||||||
| Commercial Real Estate—Other |
30,585 | 32,413 | — | |||||||||
| Residential |
1,610 | 1,631 | — | |||||||||
| Consumer |
827 | 946 | — | |||||||||
| With an allowance recorded: |
||||||||||||
| Commercial |
16,959 | 17,283 | 4,561 | |||||||||
| Commercial Real Estate—Construction |
467 | 467 | 107 | |||||||||
| Commercial Real Estate—Other |
26,178 | 26,710 | 3,330 | |||||||||
| Residential |
1,081 | 1,081 | 54 | |||||||||
| Consumer |
1,924 | 1,924 | 96 | |||||||||
|
|
|
|
|
|
|
|||||||
| Total |
$ | 108,632 | $ | 112,089 | $ | 8,148 | ||||||
|
|
|
|
|
|
|
|||||||
98
Table of Contents
The average balance of impaired loans for the years ended December 31, 2017 and 2016 are included in the table below.
| Years Ended December 31, | ||||||||
| (dollars in thousands) |
2017 | 2016 | ||||||
| Average Recorded Investment |
||||||||
| With no related allowance recorded: |
||||||||
| Commercial |
$ | 24,780 | $ | 34,708 | ||||
| Commercial Real Estate—Other |
34,632 | 28,793 | ||||||
| Residential |
2,415 | 1,355 | ||||||
| Consumer |
1,761 | 855 | ||||||
| With an allowance recorded: |
||||||||
| Commercial |
7,002 | 16,669 | ||||||
| Commercial Real Estate—Construction |
453 | 352 | ||||||
| Commercial Real Estate—Other |
26,562 | 20,465 | ||||||
| Residential |
1,012 | 1,074 | ||||||
| Consumer |
2,155 | 2,367 | ||||||
|
|
|
|
|
|||||
| Total |
$ | 100,772 | $ | 106,638 | ||||
|
|
|
|
|
|||||
Old National does not record interest on nonaccrual loans until principal is recovered. Interest income recognized on impaired loans during 2017 and 2016 was immaterial.
For all loan classes, a loan is generally placed on nonaccrual status when principal or interest becomes 90 days past due unless it is well secured and in the process of collection, or earlier when concern exists as to the ultimate collectibility of principal or interest. Interest accrued during the current year on such loans is reversed against earnings. Interest accrued in the prior year, if any, is charged to the allowance for loan losses. Cash interest received on these loans is applied to the principal balance until the principal is recovered or until the loan returns to accrual status. Loans may be returned to accrual status when all the principal and interest amounts contractually due are brought current, remain current for a prescribed period, and future payments are reasonably assured.
Loans accounted for under FASB ASC Topic 310-30 accrue interest, even though they may be contractually past due, as any nonpayment of contractual principal or interest is considered in the periodic re-estimation of expected cash flows and is included in the resulting recognition of current period loan loss provision or prospective yield adjustments.
99
Table of Contents
Old National’s past due loans as of December 31 were as follows:
| Recorded | ||||||||||||||||||||||||
| Investment > | ||||||||||||||||||||||||
| 30-59 Days | 60-89 Days | 90 Days and | Total | |||||||||||||||||||||
| (dollars in thousands) |
Past Due | Past Due | Accruing | Nonaccrual | Past Due | Current | ||||||||||||||||||
| December 31, 2017 |
||||||||||||||||||||||||
| Commercial |
$ | 986 | $ | 360 | $ | 144 | $ | 27,202 | $ | 28,692 | $ | 2,688,577 | ||||||||||||
| Commercial Real Estate: |
||||||||||||||||||||||||
| Construction |
— | — | — | 2,110 | 2,110 | 372,196 | ||||||||||||||||||
| Other |
2,247 | 89 | — | 60,315 | 62,651 | 3,917,595 | ||||||||||||||||||
| Residential |
18,948 | 3,416 | — | 22,171 | 44,535 | 2,122,518 | ||||||||||||||||||
| Consumer: |
||||||||||||||||||||||||
| Home equity |
1,467 | 230 | 68 | 5,185 | 6,950 | 500,557 | ||||||||||||||||||
| Auto |
6,487 | 1,402 | 532 | 2,695 | 11,116 | 1,137,556 | ||||||||||||||||||
| Other |
3,967 | 1,514 | 150 | 5,249 | 10,880 | 212,188 | ||||||||||||||||||
|
|
|
|
|
|
|
|
|
|
|
|
|
|||||||||||||
| Total |
$ | 34,102 | $ | 7,011 | $ | 894 | $ | 124,927 | $ | 166,934 | $ | 10,951,187 | ||||||||||||
|
|
|
|
|
|
|
|
|
|
|
|
|
|||||||||||||
| December 31, 2016 |
||||||||||||||||||||||||
| Commercial |
$ | 847 | $ | 279 | $ | 23 | $ | 56,585 | $ | 57,734 | $ | 1,859,365 | ||||||||||||
| Commercial Real Estate: |
||||||||||||||||||||||||
| Construction |
— | — | — | 1,170 | 1,170 | 356,632 | ||||||||||||||||||
| Other |
1,652 | 150 | — | 42,856 | 44,658 | 2,728,393 | ||||||||||||||||||
| Residential |
17,786 | 3,770 | 2 | 17,674 | 39,232 | 2,048,298 | ||||||||||||||||||
| Consumer: |
||||||||||||||||||||||||
| Home equity |
1,511 | 423 | — | 4,431 | 6,365 | 470,074 | ||||||||||||||||||
| Auto |
5,903 | 1,037 | 242 | 1,623 | 8,805 | 1,158,932 | ||||||||||||||||||
| Other |
3,561 | 1,919 | 61 | 7,068 | 12,609 | 218,245 | ||||||||||||||||||
|
|
|
|
|
|
|
|
|
|
|
|
|
|||||||||||||
| Total |
$ | 31,260 | $ | 7,578 | $ | 328 | $ | 131,407 | $ | 170,573 | $ | 8,839,939 | ||||||||||||
|
|
|
|
|
|
|
|
|
|
|
|
|
|||||||||||||
Loan Participations
Old National has loan participations, which qualify as participating interests, with other financial institutions. At December 31, 2017, these loans totaled $581.0 million, of which $290.4 million had been sold to other financial institutions and $290.6 million was retained by Old National. The loan participations convey proportionate ownership rights with equal priority to each participating interest holder; involve no recourse (other than ordinary representations and warranties) to, or subordination by, any participating interest holder; all cash flows are divided among the participating interest holders in proportion to each holder’s share of ownership; and no holder has the right to pledge the entire financial asset unless all participating interest holders agree.
Troubled Debt Restructurings
Old National may choose to restructure the contractual terms of certain loans. The decision to restructure a loan, versus aggressively enforcing the collection of the loan, may benefit Old National by increasing the ultimate probability of collection.
Any loans that are modified are reviewed by Old National to identify if a TDR has occurred, which is when for economic or legal reasons related to a borrower’s financial difficulties, Old National Bank grants a concession to the borrower that it would not otherwise consider. Terms may be modified to fit the ability of the borrower to repay in line with its current financial status. The modification of the terms of such loans include one or a combination of the following: a reduction of the stated interest rate of the loan, an extension of the maturity date at a stated rate of interest lower than the current market rate of new debt with similar risk, or a permanent reduction of the recorded investment of the loan.
100
Table of Contents
Loans modified in a TDR are typically placed on nonaccrual status until we determine the future collection of principal and interest is reasonably assured, which generally requires that the borrower demonstrate a period of performance according to the restructured terms for six months.
If we are unable to resolve a nonperforming loan issue, the credit will be charged off when it is apparent there will be a loss. For large commercial type loans, each relationship is individually analyzed for evidence of apparent loss based on quantitative benchmarks or subjectively based upon certain events or particular circumstances. Generally, Old National charges off small commercial loans scored through our small business credit center with contractual balances under $250,000 that are 90 days or more delinquent and do not have adequate collateral support. For residential and consumer loans, a charge off is recorded at the time foreclosure is initiated or when the loan becomes 120 to 180 days past due, whichever is earlier.
For commercial TDRs, an allocated reserve is established within the allowance for loan losses for the difference between the carrying value of the loan and its computed value. To determine the value of the loan, one of the following methods is selected: (1) the present value of expected cash flows discounted at the loan’s original effective interest rate, (2) the loan’s observable market price, or (3) the fair value of the collateral value, if the loan is collateral dependent. The allocated reserve is established as the difference between the carrying value of the loan and the collectable value. If there are significant changes in the amount or timing of the loan’s expected future cash flows, impairment is recalculated and the valuation allowance is adjusted accordingly.
When a residential or consumer loan is identified as a TDR, the loan is typically written down to its collateral value less selling costs.
The following table presents activity in TDRs for the years ended December 31, 2017, 2016, and 2015:
| (dollars in thousands) |
Commercial | Commercial Real Estate |
Residential | Consumer | Total | |||||||||||||||
| 2017 |
||||||||||||||||||||
| Balance at beginning of period |
$ | 16,802 | $ | 18,327 | $ | 2,985 | $ | 2,602 | $ | 40,716 | ||||||||||
| (Charge-offs)/recoveries |
417 | 381 | — | (294 | ) | 504 | ||||||||||||||
| Payments |
(22,340 | ) | (12,183 | ) | (623 | ) | (1,038 | ) | (36,184 | ) | ||||||||||
| Additions |
13,388 | 27,749 | 938 | 2,568 | 44,643 | |||||||||||||||
| Interest collected on nonaccrual loans |
3,821 | 431 | 15 | 57 | 4,324 | |||||||||||||||
|
|
|
|
|
|
|
|
|
|
|
|||||||||||
| Balance at end of period |
$ | 12,088 | $ | 34,705 | $ | 3,315 | $ | 3,895 | $ | 54,003 | ||||||||||
|
|
|
|
|
|
|
|
|
|
|
|||||||||||
| 2016 |
||||||||||||||||||||
| Balance at beginning of period |
$ | 23,354 | $ | 14,602 | $ | 2,693 | $ | 3,602 | $ | 44,251 | ||||||||||
| (Charge-offs)/recoveries |
(1,982 | ) | 953 | 42 | (6 | ) | (993 | ) | ||||||||||||
| Payments |
(21,956 | ) | (10,157 | ) | (513 | ) | (1,381 | ) | (34,007 | ) | ||||||||||
| Additions |
14,996 | 11,130 | 761 | 385 | 27,272 | |||||||||||||||
| Interest collected on nonaccrual loans |
2,390 | 1,799 | 2 | 2 | 4,193 | |||||||||||||||
|
|
|
|
|
|
|
|
|
|
|
|||||||||||
| Balance at end of period |
$ | 16,802 | $ | 18,327 | $ | 2,985 | $ | 2,602 | $ | 40,716 | ||||||||||
|
|
|
|
|
|
|
|
|
|
|
|||||||||||
| 2015 |
||||||||||||||||||||
| Balance at beginning of period |
$ | 15,205 | $ | 15,226 | $ | 2,063 | $ | 2,459 | $ | 34,953 | ||||||||||
| (Charge-offs)/recoveries |
872 | 1,064 | (64 | ) | 3 | 1,875 | ||||||||||||||
| Payments |
(29,913 | ) | (6,273 | ) | (658 | ) | (1,168 | ) | (38,012 | ) | ||||||||||
| Additions |
37,190 | 4,585 | 1,352 | 2,308 | 45,435 | |||||||||||||||
|
|
|
|
|
|
|
|
|
|
|
|||||||||||
| Balance at end of period |
$ | 23,354 | $ | 14,602 | $ | 2,693 | $ | 3,602 | $ | 44,251 | ||||||||||
|
|
|
|
|
|
|
|
|
|
|
|||||||||||
Approximately $34.0 million of the TDRs at December 31, 2017 were included with nonaccrual loans, compared to $26.3 million at December 31, 2016. Old National has allocated specific reserves to customers whose loan terms have been modified in TDRs totaling $5.7 million at December 31, 2017 and $4.0 million at December 31, 2016. As of December 31, 2017, Old National had committed to lend an additional $4.1 million to customers with outstanding loans that are classified as TDRs.
101
Table of Contents
The pre-modification and post-modification outstanding recorded investments of loans modified as TDRs during the years ended December 31, 2017, 2016, and 2015 are the same except for when the loan modifications involve the forgiveness of principal. The following table presents loans by class modified as TDRs that occurred during the years ended December 31, 2017, 2016, and 2015:
| (dollars in thousands) |
Number of Loans |
Pre-modification Outstanding Recorded Investment |
Post-modification Outstanding Recorded Investment |
|||||||||
| 2017 |
||||||||||||
| Troubled Debt Restructuring: |
||||||||||||
| Commercial |
11 | $ | 13,388 | $ | 13,388 | |||||||
| Commercial Real Estate—Other |
12 | 27,749 | 27,749 | |||||||||
| Residential |
6 | 938 | 938 | |||||||||
| Consumer |
7 | 2,568 | 2,568 | |||||||||
|
|
|
|
|
|
|
|||||||
| Total |
36 | $ | 44,643 | $ | 44,643 | |||||||
|
|
|
|
|
|
|
|||||||
| 2016 |
||||||||||||
| Troubled Debt Restructuring: |
||||||||||||
| Commercial |
20 | $ | 14,996 | $ | 14,996 | |||||||
| Commercial Real Estate—Other |
10 | 11,130 | 11,130 | |||||||||
| Residential |
6 | 761 | 761 | |||||||||
| Consumer |
8 | 385 | 385 | |||||||||
|
|
|
|
|
|
|
|||||||
| Total |
44 | $ | 27,272 | $ | 27,272 | |||||||
|
|
|
|
|
|
|
|||||||
| 2015 |
||||||||||||
| Troubled Debt Restructuring: |
||||||||||||
| Commercial |
42 | $ | 37,190 | $ | 37,190 | |||||||
| Commercial Real Estate—Construction |
5 | 1,162 | 1,162 | |||||||||
| Commercial Real Estate—Other |
27 | 3,423 | 3,423 | |||||||||
| Residential |
13 | 1,352 | 1,352 | |||||||||
| Consumer |
32 | 2,308 | 2,308 | |||||||||
|
|
|
|
|
|
|
|||||||
| Total |
119 | $ | 45,435 | $ | 45,435 | |||||||
|
|
|
|
|
|
|
|||||||
The TDRs that occurred during 2017 increased the allowance for loan losses by $2.7 million and resulted in $0.2 million of charge-offs during 2017. The TDRs that occurred during 2016 decreased the allowance for loan losses by $2.3 million due to a change in collateral position on a large commercial loan and resulted in $0.8 million of charge-offs during 2016. The TDRs that occurred during 2015 decreased the allowance for loan losses by $0.8 million and resulted in charge-offs of $0.2 million during 2015.
A loan is considered to be in payment default once it is 90 days contractually past due under the modified terms.
TDRs for which there was a payment default within twelve months following the modification during the year were insignificant in 2017, 2016, and 2015.
The terms of certain other loans were modified during 2017 that did not meet the definition of a TDR. It is our process to review all classified and criticized loans that, during the period, have been renewed, have entered into a forbearance agreement, have gone from principal and interest to interest only, or have extended the maturity date. In order to determine whether a borrower is experiencing financial difficulty, an evaluation is performed of the probability that the borrower will be in payment default on its debt in the foreseeable future without the modification. The evaluation is performed under our internal underwriting policy. We also evaluate whether a concession has been granted or if we were adequately compensated through a market interest rate, additional collateral or a bona fide guarantee. We also consider whether the modification was insignificant relative to the other terms of the agreement or the delay in a payment.
102
Table of Contents
PCI loans are not considered impaired until after the point at which there has been a degradation of cash flows below our expected cash flows at acquisition. If a PCI loan is subsequently modified, and meets the definition of a TDR, it will be removed from PCI accounting and accounted for as a TDR only if the PCI loan was being accounted for individually. If the PCI loan is being accounted for as part of a pool, it will not be removed from the pool. As of December 31, 2017, it has not been necessary to remove any loans from PCI accounting.
In general, once a modified loan is considered a TDR, the loan will always be considered a TDR, and therefore impaired, until it is paid in full, otherwise settled, sold or charged off. However, guidance also permits for loans to be removed from TDR status when subsequently restructured under these circumstances: (1) at the time of the subsequent restructuring, the borrower is not experiencing financial difficulties, and this is documented by a current credit evaluation at the time of the restructuring, (2) under the terms of the subsequent restructuring agreement, the institution has granted no concession to the borrower; and (3) the subsequent restructuring agreement includes market terms that are no less favorable than those that would be offered for a comparable new loan. For loans subsequently restructured that have cumulative principal forgiveness, the loan should continue to be measured in accordance with ASC 310-10, Receivables – Overall. However, consistent with ASC 310-40-50-2, Troubled Debt Restructurings by Creditors, Creditor Disclosure of Troubled Debt Restructurings, the loan would not be required to be reported in the years following the restructuring if the subsequent restructuring meets both of these criteria: (1) has an interest rate at the time of the subsequent restructuring that is not less than a market interest rate; and (2) is performing in compliance with its modified terms after the subsequent restructuring.
Purchased Credit Impaired Loans
Purchased loans acquired in a business combination are recorded at estimated fair value on their purchase date with no carryover of the related allowance for loan and lease losses. In determining the estimated fair value of purchased loans, management considers a number of factors including, among others, the remaining life of the acquired loans, estimated prepayments, estimated loss ratios, estimated value of the underlying collateral, and net present value of cash flows expected to be received. Purchased loans are accounted for in accordance with guidance for certain loans acquired in a transfer (ASC 310-30), when the loans have evidence of credit deterioration since origination and it is probable at the date of acquisition that the acquirer will not collect all contractually required principal and interest payments. The difference between contractually required payments and the cash flows expected to be collected at acquisition is referred to as the non-accretable difference. Subsequent decreases to the expected cash flows will generally result in a provision for loan and lease losses. Subsequent increases in expected cash flows will result in a reversal of the provision for loan losses to the extent of prior charges and then an adjustment to accretable yield, which would have a positive impact on interest income.
Old National has purchased loans for which there was, at acquisition, evidence of deterioration of credit quality since origination and it was probable, at acquisition, that all contractually required payments would not be collected. For these loans that meet the criteria of ASC 310-30 treatment, the carrying amount was as follows:
| December 31, | ||||||||
| (dollars in thousands) |
2017 | 2016 | ||||||
| Commercial |
$ | 5,152 | $ | 850 | ||||
| Commercial real estate |
21,826 | 32,774 | ||||||
| Residential |
11,303 | 13,580 | ||||||
| Consumer |
5,245 | 8,215 | ||||||
|
|
|
|
|
|||||
| Carrying amount |
43,526 | 55,419 | ||||||
| Allowance for loan losses |
(166 | ) | (278 | ) | ||||
|
|
|
|
|
|||||
| Carrying amount, net of allowance |
$ | 43,360 | $ | 55,141 | ||||
|
|
|
|
|
|||||
The outstanding balance of loans accounted for under ASC 310-30, including contractual principal, interest, fees and penalties, was $235.9 million at December 31, 2017 and $268.0 million at December 31, 2016.
The accretable difference on PCI loans is the difference between the expected cash flows and the net present value of expected cash flows with such difference accreted into earnings using the effective yield method over the term of the loans. Accretion recorded as loan interest income totaled $15.2 million during 2017 and $23.4 million during 2016. Improvement in cash flow expectations has resulted in a reclassification from nonaccretable difference to accretable yield as shown in the table below.
103
Table of Contents
Accretable yield of PCI loans, or income expected to be collected, was as follows:
| Years Ended December 31, | ||||||||||||
| (dollars in thousands) |
2017 | 2016 | 2015 | |||||||||
| Balance at beginning of period |
$ | 33,603 | $ | 45,310 | $ | 62,533 | ||||||
| New loans purchased |
1,556 | 3,217 | 1,812 | |||||||||
| Accretion of income |
(15,217 | ) | (23,447 | ) | (35,526 | ) | ||||||
| Reclassifications from (to) nonaccretable difference |
7,614 | 10,589 | 14,189 | |||||||||
| Disposals/other adjustments |
279 | (2,066 | ) | 2,302 | ||||||||
|
|
|
|
|
|
|
|||||||
| Balance at end of period |
$ | 27,835 | $ | 33,603 | $ | 45,310 | ||||||
|
|
|
|
|
|
|
|||||||
Included in Old National’s allowance for loan losses is $0.2 million related to the purchased loans disclosed above at December 31, 2017, compared to $0.3 million at December 31, 2016.
PCI loans purchased during 2017 and 2016 for which it was probable at acquisition that all contractually required payments would not be collected were as follows:
| (dollars in thousands) |
Anchor (MN) (1) | Anchor (WI) (2) | ||||||
| Contractually required payments |
$ | 16,898 | $ | 29,544 | ||||
| Nonaccretable difference |
(4,787 | ) | (6,153 | ) | ||||
|
|
|
|
|
|||||
| Cash flows expected to be collected at acquisition |
12,111 | 23,391 | ||||||
| Accretable yield |
(1,556 | ) | (3,217 | ) | ||||
|
|
|
|
|
|||||
| Fair value of acquired loans at acquisition |
$ | 10,555 | $ | 20,174 | ||||
|
|
|
|
|
|||||
| (1) | Old National acquired Anchor (MN) effective November 1, 2017. |
| (2) | Old National acquired Anchor (WI) effective May 1, 2016. |
Income would not be recognized on certain purchased loans if Old National could not reasonably estimate cash flows to be collected. Old National had no purchased loans for which it could not reasonably estimate cash flows to be collected.
NOTE 6 – OTHER REAL ESTATE OWNED
The following table presents activity in other real estate owned for the years ended December 31, 2017 and 2016:
| Years Ended December 31, | ||||||||
| (dollars in thousands) |
2017 | 2016 | ||||||
| Balance at beginning of period |
$ | 18,546 | $ | 12,498 | ||||
| Additions (1) |
4,016 | 24,998 | ||||||
| Sales |
(11,160 | ) | (15,092 | ) | ||||
| Impairment |
(2,592 | ) | (3,858 | ) | ||||
|
|
|
|
|
|||||
| Balance at end of period (2) |
$ | 8,810 | $ | 18,546 | ||||
|
|
|
|
|
|||||
| (1) | Additions in 2017 include other real estate owned of $1.1 million acquired from Anchor (MN) in November 2017. Additions in 2016 include other real estate owned of $17.3 million acquired from Anchor (WI) in May 2016. |
| (2) | Includes repossessed personal property of $0.3 million at December 31, 2017 and $0.3 million at December 31, 2016. |
At December 31, 2017, foreclosed residential real estate property included in the table above totaled $1.6 million. At December 31, 2017, consumer mortgage loans collateralized by residential real property that were in the process of foreclosure totaled $5.2 million.
104
Table of Contents
NOTE 7 – PREMISES AND EQUIPMENT
The composition of premises and equipment was as follows at December 31:
| December 31, | ||||||||
| (dollars in thousands) |
2017 | 2016 | ||||||
| Land |
$ | 73,046 | $ | 71,769 | ||||
| Buildings |
343,833 | 322,165 | ||||||
| Furniture, fixtures, and equipment |
94,254 | 102,631 | ||||||
| Leasehold improvements |
38,918 | 28,555 | ||||||
|
|
|
|
|
|||||
| Total |
550,051 | 525,120 | ||||||
| Accumulated depreciation |
(91,977 | ) | (95,498 | ) | ||||
|
|
|
|
|
|||||
| Premises and equipment, net |
$ | 458,074 | $ | 429,622 | ||||
|
|
|
|
|
|||||
The increase in premises and equipment at December 31, 2017 was primarily due to $33.6 million of assets attributable to the Anchor (MN) acquisition.
Depreciation expense was $22.2 million in 2017, $16.6 million in 2016, and $14.1 million in 2015.
Operating Leases
Old National rents certain premises and equipment under operating leases, which expire at various dates. Many of these leases require the payment of property taxes, insurance premiums, maintenance, and other costs. In some cases, rentals are subject to increase in relation to a cost-of-living index. The leases have original terms ranging from two years and six months to twenty-five years, and Old National has the right, at its option, to extend the terms of certain leases for four additional successive terms of five years. Old National does not have any material sub-lease agreements.
Rent expense was $15.8 million in 2017, $25.4 million in 2016, and $29.1 million in 2015. The following is a summary of future minimum lease commitments as of December 31, 2017:
| (dollars in thousands) |
||||
| 2018 |
$ | 18,919 | ||
| 2019 |
17,463 | |||
| 2020 |
16,865 | |||
| 2021 |
15,960 | |||
| 2022 |
13,759 | |||
| Thereafter |
63,828 | |||
|
|
|
|||
| Total |
$ | 146,794 | ||
|
|
|
|||
Old National purchased 23 properties during 2016 that it had previously leased, 20 of which had deferred gains that were accelerated when the associated leases were terminated. These gains were partially offset by the recognition of deferred rent expense, cease-use liabilities, and other expense, resulting in a net gain of $12.0 million.
Old National purchased 14 properties during 2015 that it had previously leased, all of which had deferred gains that were accelerated when the associated leases were terminated. These gains were partially offset by the recognition of deferred rent expense and other expense, resulting in a net gain of $10.8 million.
Old National had deferred gains remaining associated with prior sale leaseback transactions totaling $8.2 million at December 31, 2017 and $10.3 million at December 31, 2016. The gains will be recognized over the remaining term of the leases. The leases had original terms ranging from five to twenty-four years.
105
Table of Contents
Capital Leases
Old National leases two branch buildings and certain equipment under capital leases. See Note 14 to the consolidated financial statements for detail regarding these leases.
NOTE 8 – GOODWILL AND OTHER INTANGIBLE ASSETS
The following table shows the changes in the carrying amount of goodwill for the years ended December 31, 2017 and 2016:
| Years Ended December 31, | ||||||||
| (dollars in thousands) |
2017 | 2016 | ||||||
| Balance at beginning of period |
$ | 655,018 | $ | 584,634 | ||||
| Acquisitions |
173,033 | 111,347 | ||||||
| Divestitures |
— | (40,963 | ) | |||||
|
|
|
|
|
|||||
| Balance at end of period |
$ | 828,051 | $ | 655,018 | ||||
|
|
|
|
|
|||||
Goodwill is reviewed annually for impairment. No events or circumstances since the August 31, 2017 annual impairment test were noted that would indicate it was more likely than not a goodwill impairment exists.
During 2017, Old National recorded $173.0 million of goodwill associated with the acquisition of Anchor (MN). See Note 2 to the consolidated financial statements for detail regarding changes in goodwill recorded in 2016 associated with acquisitions and divestitures.
The gross carrying amounts and accumulated amortization of other intangible assets at December 31, 2017 and 2016 was as follows:
| (dollars in thousands) |
Gross Carrying Amount |
Accumulated Amortization and Impairment |
Net Carrying Amount |
|||||||||
| December 31, 2017 |
||||||||||||
| Core deposit |
$ | 108,923 | $ | (62,874 | ) | $ | 46,049 | |||||
| Customer trust relationships |
16,547 | (9,533 | ) | 7,014 | ||||||||
| Customer loan relationships |
4,413 | (4,380 | ) | 33 | ||||||||
|
|
|
|
|
|
|
|||||||
| Total intangible assets |
$ | 129,883 | $ | (76,787 | ) | $ | 53,096 | |||||
|
|
|
|
|
|
|
|||||||
| December 31, 2016 |
||||||||||||
| Core deposit |
$ | 81,663 | $ | (53,214 | ) | $ | 28,449 | |||||
| Customer trust relationships |
16,547 | (7,753 | ) | 8,794 | ||||||||
| Customer loan relationships |
4,413 | (3,979 | ) | 434 | ||||||||
|
|
|
|
|
|
|
|||||||
| Total intangible assets |
$ | 102,623 | $ | (64,946 | ) | $ | 37,677 | |||||
|
|
|
|
|
|
|
|||||||
Other intangible assets consist of core deposit intangibles and customer relationship intangibles and are being amortized primarily on an accelerated basis over their estimated useful lives, generally over a period of 5 to 15 years. During 2017, Old National increased core deposit intangibles by $27.3 million related to the Anchor (MN) acquisition.
Old National reviews other intangible assets for possible impairment whenever events or changes in circumstances indicate that carrying amounts may not be recoverable. No impairment charges were recorded in 2017, 2016, or 2015. Total amortization expense associated with intangible assets was $11.8 million in 2017, $12.5 million in 2016, and $11.7 million in 2015.
106
Table of Contents
Estimated amortization expense for future years is as follows:
| (dollars in thousands) |
||||
| 2018 |
$ | 13,561 | ||
| 2019 |
11,115 | |||
| 2020 |
8,765 | |||
| 2021 |
6,498 | |||
| 2022 |
4,665 | |||
| Thereafter |
8,492 | |||
|
|
|
|||
| Total |
$ | 53,096 | ||
|
|
|
|||
NOTE 9 – LOAN SERVICING RIGHTS
At December 31, 2017, loan servicing rights derived from loans sold with servicing retained totaled $24.7 million, compared to $25.6 million at December 31, 2016. Loans serviced for others are not reported as assets. The principal balance of loans serviced for others was $3.321 billion at December 31, 2017, compared to $3.385 billion at December 31, 2016. Approximately 99.5% of the loans serviced for others at December 31, 2017 were residential mortgage loans. Custodial escrow balances maintained in connection with serviced loans were $8.9 million at December 31, 2017 and $5.3 million at December 31, 2016.
The following table summarizes the activity related to loan servicing rights and the related valuation allowance in 2017 and 2016:
| Years Ended December 31, | ||||||||
| (dollars in thousands) |
2017 | 2016 | ||||||
| Balance at beginning of period |
$ | 25,629 | $ | 10,502 | ||||
| Additions (1) |
4,206 | 20,280 | ||||||
| Amortization |
(5,145 | ) | (5,153 | ) | ||||
|
|
|
|
|
|||||
| Balance before valuation allowance at end of period |
24,690 | 25,629 | ||||||
|
|
|
|
|
|||||
| Valuation allowance: |
||||||||
| Balance at beginning of period |
(68 | ) | (34 | ) | ||||
| (Additions)/recoveries |
39 | (34 | ) | |||||
|
|
|
|
|
|||||
| Balance at end of period |
(29 | ) | (68 | ) | ||||
|
|
|
|
|
|||||
| Loan servicing rights, net |
$ | 24,661 | $ | 25,561 | ||||
|
|
|
|
|
|||||
| (1) | Additions in 2016 include loan servicing rights of $15.3 million acquired from Anchor (WI) in May 2016. |
At December 31, 2017, the fair value of servicing rights was $25.8 million, which was determined using a discount rate of 13% and a weighted average prepayment speed of 140% PSA. At December 31, 2016, the fair value of servicing rights was $26.8 million, which was determined using a discount rate of 13% and a weighted average prepayment speed of 136% PSA.
NOTE 10 – QUALIFIED AFFORDABLE HOUSING PROJECTS AND OTHER TAX CREDIT INVESTMENTS
Old National is a limited partner in several tax-advantaged limited partnerships whose purpose is to invest in approved qualified affordable housing or other renovation or community revitalization projects. As of December 31, 2017, Old National expects to recover its remaining investments through the use of the tax credits that are generated by the investments.
107
Table of Contents
The following table summarizes Old National’s investments in qualified affordable housing projects and other tax credit investments at December 31, 2017 and 2016:
| (dollars in thousands) | December 31, 2017 | December 31, 2016 | ||||||||||||||||
| Investment |
Accounting Method | Investment | Unfunded Commitment (1) |
Investment | Unfunded Commitment |
|||||||||||||
| LIHTC |
Proportional amortization | $ | 31,183 | $ | 15,553 | $ | 29,110 | $ | 16,210 | |||||||||
| FHTC |
Equity | 10,645 | 12,040 | 4,434 | 3,104 | |||||||||||||
| CReED |
Equity | 704 | 1,502 | 1,504 | 1,502 | |||||||||||||
| Renewable Energy |
Equity | 22,364 | 19,771 | — | — | |||||||||||||
|
|
|
|
|
|
|
|
|
|||||||||||
| Total |
$ | 64,896 | $ | 48,866 | $ | 35,048 | $ | 20,816 | ||||||||||
|
|
|
|
|
|
|
|
|
|||||||||||
| (1) | All commitments will be paid by Old National by 2027. |
The following table summarizes the amortization expense and tax benefit recognized for Old National’s qualified affordable housing projects and other tax credit investments during 2017, 2016, and 2015:
| (dollars in thousands) |
Amortization Expense (1) |
Tax Benefit Recognized (2) |
||||||
| Year ended December 31, 2017 |
||||||||
| LIHTC |
$ | 1,922 | $ | (2,666 | ) | |||
| FHTC |
10,441 | (11,348 | ) | |||||
| CReED (3) |
800 | (1,074 | ) | |||||
| Renewable Energy |
492 | (613 | ) | |||||
|
|
|
|
|
|||||
| Total |
$ | 13,655 | $ | (15,701 | ) | |||
|
|
|
|
|
|||||
| Year ended December 31, 2016 |
||||||||
| LIHTC |
$ | 804 | $ | (1,125 | ) | |||
| FHTC |
— | — | ||||||
| CReED (3) |
— | — | ||||||
|
|
|
|
|
|||||
| Total |
$ | 804 | $ | (1,125 | ) | |||
|
|
|
|
|
|||||
| Year ended December 31, 2015 |
||||||||
| LIHTC |
$ | 804 | $ | (1,125 | ) | |||
| FHTC |
— | — | ||||||
| CReED (3) |
— | — | ||||||
| NMTC |
143 | (233 | ) | |||||
|
|
|
|
|
|||||
| Total |
$ | 947 | $ | (1,358 | ) | |||
|
|
|
|
|
|||||
| (1) | The amortization expense for the LIHTC investments are included in our income tax expense. The amortization expense for the FHTC, CReED, and Renewable Energy tax credits are included in noninterest expense. |
| (2) | All of the tax benefits recognized are included in our income tax expense. The tax benefit recognized for the FHTC, CReED, and Renewable Energy investments primarily reflects the tax credits generated from the investments, and excludes the net tax expense/benefit of the investments’ income/loss. |
| (3) | The CReED tax credit investment qualifies for an Indiana state tax credit. |
108
Table of Contents
The aggregate amount of time deposits in denominations of $250,000 or more was $422.3 million at December 31, 2017 and $313.8 million at December 31, 2016. At December 31, 2017, the scheduled maturities of total time deposits were as follows:
| (dollars in thousands) |
||||
| Due in 2018 |
$ | 1,111,266 | ||
| Due in 2019 |
229,944 | |||
| Due in 2020 |
139,689 | |||
| Due in 2021 |
62,777 | |||
| Due in 2022 |
45,802 | |||
| Thereafter |
44,958 | |||
|
|
|
|||
| Total |
$ | 1,634,436 | ||
|
|
|
|||
NOTE 12 – SECURITES SOLD UNDER AGREEMENTS TO REPURCHASE
Securities sold under agreements to repurchase are secured borrowings. Old National pledges investment securities to secure these borrowings. The following table presents securities sold under agreements to repurchase and related weighted-average interest rates for each of the years ended December 31:
| At or For the Years Ended December 31, |
||||||||
| (dollars in thousands) |
2017 | 2016 | ||||||
| Outstanding at year-end |
$ | 384,810 | $ | 367,052 | ||||
| Average amount outstanding |
336,539 | 368,757 | ||||||
| Maximum amount outstanding at any month-end |
402,543 | 396,695 | ||||||
| Weighted average interest rate: |
||||||||
| During year |
0.38 | % | 0.41 | % | ||||
| End of year |
0.49 | 0.47 | ||||||
The following table presents the contractual maturity of our secured borrowings and class of collateral pledged:
| At December 31, 2017 | ||||||||||||||||||||
| Remaining Contractual Maturity of the Agreements | ||||||||||||||||||||
| (dollars in thousands) |
Overnight and Continuous |
Up to 30 Days |
30-90 Days | Greater Than 90 days |
Total | |||||||||||||||
| Repurchase Agreements: |
||||||||||||||||||||
| U.S. Treasury and agency securities |
$ | 359,810 | $ | 25,000 | $ | — | $ | — | $ | 384,810 | ||||||||||
|
|
|
|
|
|
|
|
|
|
|
|||||||||||
| Total |
$ | 359,810 | $ | 25,000 | $ | — | $ | — | $ | 384,810 | ||||||||||
|
|
|
|
|
|
|
|
|
|
|
|||||||||||
The fair value of securities pledged to secure repurchase agreements may decline. Old National has pledged securities valued at 114% of the gross outstanding balance of repurchase agreements at December 31, 2017 to manage this risk.
109
Table of Contents
NOTE 13 – FEDERAL HOME LOAN BANK ADVANCES
The following table summarizes Old National Bank’s FHLB advances at December 31:
| December 31, | ||||||||
| (dollars in thousands) |
2017 | 2016 | ||||||
| FHLB advances (fixed rates 1.01% to 6.08% and variable rates 1.35% to 1.57%) maturing January 2018 to August 2027 |
$ | 1,610,531 | $ | 1,353,225 | ||||
| ASC 815 fair value hedge and other basis adjustments |
(952 | ) | (133 | ) | ||||
|
|
|
|
|
|||||
| Total other borrowings |
$ | 1,609,579 | $ | 1,353,092 | ||||
|
|
|
|
|
|||||
FHLB advances had weighted-average rates of 1.55% at December 31, 2017 and 0.94% at December 31, 2016. These borrowings are collateralized by investment securities and residential real estate loans up to 143% of outstanding debt.
Contractual maturities of FHLB advances at December 31, 2017 were as follows:
| (dollars in thousands) |
||||
| Due in 2018 |
$ | 999,896 | ||
| Due in 2019 |
201,962 | |||
| Due in 2020 |
50,000 | |||
| Due in 2021 |
— | |||
| Due in 2022 |
58,500 | |||
| Thereafter |
300,173 | |||
| ASC 815 fair value hedge and other basis adjustments |
(952 | ) | ||
|
|
|
|||
| Total |
$ | 1,609,579 | ||
|
|
|
|||
The following table summarizes Old National’s other borrowings at December 31:
| December 31, | ||||||||
| (dollars in thousands) |
2017 | 2016 | ||||||
| Old National Bancorp: |
||||||||
| Senior unsecured bank notes (fixed rate 4.125%) maturing August 2024 |
$ | 175,000 | $ | 175,000 | ||||
| Unamortized debt issuance costs related to Senior unsecured bank notes |
(1,026 | ) | (1,182 | ) | ||||
| Junior subordinated debentures (variable rates of 2.89% to 5.06%) maturing April 2032 to September 2037 |
60,310 | 45,000 | ||||||
| Other basis adjustments |
(3,585 | ) | (3,971 | ) | ||||
| Old National Bank: |
||||||||
| Capital lease obligations |
5,389 | 4,092 | ||||||
| Subordinated debentures (fixed rate 5.75%) |
12,000 | — | ||||||
| Premium on subordinated debentures |
694 | — | ||||||
|
|
|
|
|
|||||
| Total other borrowings |
$ | 248,782 | $ | 218,939 | ||||
|
|
|
|
|
|||||
110
Table of Contents
Contractual maturities of other borrowings at December 31, 2017 were as follows:
| (dollars in thousands) |
||||
| Due in 2018 |
$ | 127 | ||
| Due in 2019 |
137 | |||
| Due in 2020 |
147 | |||
| Due in 2021 |
160 | |||
| Due in 2022 |
172 | |||
| Thereafter |
251,956 | |||
| Unamortized debt issuance costs and other basis adjustments |
(3,917 | ) | ||
|
|
|
|||
| Total |
$ | 248,782 | ||
|
|
|
|||
Senior Notes
In August 2014, Old National issued $175.0 million of senior unsecured notes with a 4.125% interest rate. These notes pay interest on February 15 and August 15. The notes mature on August 15, 2024.
Junior Subordinated Debentures
Junior subordinated debentures related to trust preferred securities are classified in “other borrowings.” With the addition of Anchor (MN) assets, these securities now qualify as Tier 2 capital for regulatory purposes, subject to certain limitations. Prior to the fourth quarter of 2017, these securities qualified as Tier 1 capital for regulatory purposes.
Through various acquisitions, Old National assumed junior subordinated debenture obligations related to various trusts that issued trust preferred securities. Old National guarantees the payment of distributions on the trust preferred securities issued by the trusts. Proceeds from the issuance of each of these securities were used to purchase junior subordinated debentures with the same financial terms as the securities issued by the trusts.
Old National, at any time, may redeem the junior subordinated debentures at par and, thereby cause a redemption of the trust preferred securities in whole or in part.
On November 1, 2017, Old National assumed junior subordinated debenture obligations in the amount of $25.0 million related to the acquisition of Anchor (MN). The debentures were related to six separate statutory trusts: Anchor Capital Trust II, Anchor Capital Trust III, Anchor Capital Trust IV, VFSC Capital Trust I, VFSC Capital Trust II, and VFSC Capital Trust III. Anchor Capital Trust II had an 8.25% fixed rate of interest. Anchor Capital Trust IV had an 8.00% fixed rate of interest. Subsequent to the acquisition, Old National redeemed these two fixed-rate issuances at par value of $9.7 million, thereby causing a redemption of the related trusts. The remaining four issuances have variable rates of interest and are outstanding as of December 31, 2017.
111
Table of Contents
The following table summarizes the terms of our outstanding junior subordinated debentures as of December 31, 2017:
| (dollars in thousands) | Rate at | |||||||||||||
| Issuance | December 31, | |||||||||||||
| Name of Trust |
Issuance Date |
Amount | Rate |
2017 | Maturity Date | |||||||||
| VFSC Capital Trust I |
April 2002 |
$ | 3,093 | 3-month LIBOR plus 3.70% |
5.06 | % | April 22, 2032 | |||||||
| VFSC Capital Trust II |
October 2002 |
4,124 | 3-month LIBOR plus 3.45% |
4.84 | % | November 7, 2032 | ||||||||
| VFSC Capital Trust III |
April 2004 |
3,093 | 3-month LIBOR plus 2.80% |
4.12 | % | September 8, 2034 | ||||||||
| St. Joseph Capital Trust II |
March 2005 |
5,000 | 3-month LIBOR plus 1.75% |
3.35 | % | March 20, 2035 | ||||||||
| Anchor Capital Trust III |
August 2005 |
5,000 | 3-month LIBOR plus 1.55% |
2.89 | % | August 23, 2035 | ||||||||
| Tower Capital Trust 2 |
December 2005 |
8,000 | 3-month LIBOR plus 1.34% |
3.03 | % | December 4, 2035 | ||||||||
| Home Federal Statutory Trust I |
September 2006 |
15,000 | 3-month LIBOR plus 1.65% | 3.24 | % | September 15, 2036 | ||||||||
| Monroe Bancorp Capital Trust I |
July 2006 |
3,000 | 3-month LIBOR plus 1.60% | 2.95 | % | October 7, 2036 | ||||||||
| Monroe Bancorp Statutory Trust II |
March 2007 |
5,000 | 3-month LIBOR plus 1.60% | 3.19 | % | June 15, 2037 | ||||||||
| Tower Capital Trust 3 |
December 2006 |
9,000 | 3-month LIBOR plus 1.69% |
3.17 | % | September 15, 2037 | ||||||||
|
|
|
|||||||||||||
| Total |
$ | 60,310 | ||||||||||||
|
|
|
|||||||||||||
Subordinated Debentures
On November 1, 2017, Old National assumed $12.0 million of subordinated fixed-to-floating notes related to the acquisition of Anchor (MN). The subordinated debentures have a 5.75% fixed rate of interest through October 29, 2020. From October 30, 2020 to the October 30, 2025 maturity date, the debentures have a floating rate of interest equal to the three-month LIBOR rate plus 435.6 basis points.
Capital Lease Obligations
On January 1, 2004, Old National entered into a long-term capital lease obligation for a branch office building in Owensboro, Kentucky, which extends for 25 years with one renewal option for 10 years. The economic substance of this lease is that Old National is financing the acquisition of the building through the lease and accordingly, the building is recorded as an asset and the lease is recorded as a liability. The fair value of the capital lease obligation was estimated using a discounted cash flow analysis based on Old National’s current incremental borrowing rate for similar types of borrowing arrangements.
On May 1, 2016, Old National acquired Anchor (WI), assuming a five year capital lease obligation for equipment.
On November 1, 2017, Old National assumed a capital lease obligation for a banking center in Arden Hills, Minnesota related to the acquisition of Anchor (MN). The remaining base term of the lease is five years with one renewal option of ten years. For purposes of measuring the lease obligation, we determined that we would be “reasonably assured” to exercise the renewal option. The fair value of the capital lease obligation was estimated using a discounted cash flow analysis based on a market rate for similar types of borrowing arrangements. Based on the above assumptions, Old National measured the capital lease obligation at $1.5 million as of the date of acquisition.
112
Table of Contents
At December 31, 2017, the future minimum lease payments under the capital lease arrangements were as follows:
| (dollars in thousands) |
|
|||
| 2018 |
$ | 568 | ||
| 2019 |
589 | |||
| 2020 |
589 | |||
| 2021 |
589 | |||
| 2022 |
590 | |||
| Thereafter |
9,274 | |||
|
|
|
|||
| Total minimum lease payments |
12,199 | |||
| Less amounts representing interest |
(6,810 | ) | ||
|
|
|
|||
| Present value of net minimum lease payments |
$ | 5,389 | ||
|
|
|
|||
NOTE 15 – ACCUMULATED OTHER COMPREHENSIVE INCOME (LOSS)
The following table summarizes the changes within each classification of AOCI, net of tax, for the years ended December 31, 2017, 2016, and 2015:
| (dollars in thousands) |
Unrealized Gains and Losses on Available-for-Sale Securities |
Unrealized Gains and Losses on Held-to-Maturity Securities |
Gains and Losses on Cash Flow Hedges |
Defined Benefit Pension Plans |
Total | |||||||||||||||
| 2017 |
||||||||||||||||||||
| Balance at beginning of period |
$ | (39,012 | ) | $ | (13,310 | ) | $ | (6,715 | ) | $ | (335 | ) | $ | (59,372 | ) | |||||
| Other comprehensive income |
||||||||||||||||||||
| (loss) before reclassifications |
9,615 | — | 575 | — | 10,190 | |||||||||||||||
| Amounts reclassified from AOCI (1) |
(6,160 | ) | 1,203 | 3,803 | 64 | (1,090 | ) | |||||||||||||
|
|
|
|
|
|
|
|
|
|
|
|||||||||||
| Net other comprehensive income (loss) |
3,455 | 1,203 | 4,378 | 64 | 9,100 | |||||||||||||||
|
|
|
|
|
|
|
|
|
|
|
|||||||||||
| Balance at end of period |
$ | (35,557 | ) | $ | (12,107 | ) | $ | (2,337 | ) | $ | (271 | ) | $ | (50,272 | ) | |||||
|
|
|
|
|
|
|
|
|
|
|
|||||||||||
| 2016 |
||||||||||||||||||||
| Balance at beginning of period |
$ | (3,806 | ) | $ | (14,480 | ) | $ | (9,276 | ) | $ | (7,235 | ) | $ | (34,797 | ) | |||||
| Other comprehensive income |
||||||||||||||||||||
| (loss) before reclassifications |
(31,513 | ) | — | (1,440 | ) | — | (32,953 | ) | ||||||||||||
| Amounts reclassified from AOCI (1) |
(3,693 | ) | 1,170 | 4,001 | 6,900 | 8,378 | ||||||||||||||
|
|
|
|
|
|
|
|
|
|
|
|||||||||||
| Net other comprehensive income (loss) |
(35,206 | ) | 1,170 | 2,561 | 6,900 | (24,575 | ) | |||||||||||||
|
|
|
|
|
|
|
|
|
|
|
|||||||||||
| Balance at end of period |
$ | (39,012 | ) | $ | (13,310 | ) | $ | (6,715 | ) | $ | (335 | ) | $ | (59,372 | ) | |||||
|
|
|
|
|
|
|
|
|
|
|
|||||||||||
| 2015 |
||||||||||||||||||||
| Balance at beginning of period |
$ | (748 | ) | $ | (15,776 | ) | $ | (5,935 | ) | $ | (9,096 | ) | $ | (31,555 | ) | |||||
| Other comprehensive income |
||||||||||||||||||||
| (loss) before reclassifications |
554 | — | (5,027 | ) | — | (4,473 | ) | |||||||||||||
| Amounts reclassified from AOCI (1) |
(3,612 | ) | 1,296 | 1,686 | 1,861 | 1,231 | ||||||||||||||
|
|
|
|
|
|
|
|
|
|
|
|||||||||||
| Net other comprehensive income (loss) |
(3,058 | ) | 1,296 | (3,341 | ) | 1,861 | (3,242 | ) | ||||||||||||
|
|
|
|
|
|
|
|
|
|
|
|||||||||||
| Balance at end of period |
$ | (3,806 | ) | $ | (14,480 | ) | $ | (9,276 | ) | $ | (7,235 | ) | $ | (34,797 | ) | |||||
|
|
|
|
|
|
|
|
|
|
|
|||||||||||
| (1) | See table below for details about reclassifications. |
113
Table of Contents
The following tables summarize the significant amounts reclassified out of each component of AOCI for the years ended December 31, 2017, 2016, and 2015:
| Details about AOCI Components |
Amount Reclassified from AOCI |
Affected Line Item in the Statement of Income | ||||||||||||
| Years Ended December 31, | ||||||||||||||
| (dollars in thousands) |
2017 | 2016 | 2015 | |||||||||||
| Unrealized gains and losses on available-for-sale securities |
$ | 9,135 | $ | 5,848 | $ | 5,718 | Net securities gains | |||||||
| (2,975 | ) | (2,155 | ) | (2,106 | ) | Income tax (expense) benefit | ||||||||
|
|
|
|
|
|
|
|||||||||
| $ | 6,160 | $ | 3,693 | $ | 3,612 | Net income | ||||||||
|
|
|
|
|
|
|
|||||||||
| Unrealized gains and losses on held-to-maturity securities |
$ | (1,830 | ) | $ | (1,776 | ) | $ | (1,692 | ) | Interest income (expense) | ||||
| 627 | 606 | 396 | Income tax (expense) benefit | |||||||||||
|
|
|
|
|
|
|
|||||||||
| $ | (1,203 | ) | $ | (1,170 | ) | $ | (1,296 | ) | Net income | |||||
|
|
|
|
|
|
|
|||||||||
| Gains and losses on cash flow hedges Interest rate contracts |
$ | (6,135 | ) | $ | (6,453 | ) | $ | (2,719 | ) | Interest income (expense) | ||||
| 2,332 | 2,452 | 1,033 | Income tax (expense) benefit | |||||||||||
|
|
|
|
|
|
|
|||||||||
| $ | (3,803 | ) | $ | (4,001 | ) | $ | (1,686 | ) | Net income | |||||
|
|
|
|
|
|
|
|||||||||
| Amortization of defined benefit pension items Actuarial gains (losses) and settlement cost |
$ | (159 | ) | $ | (11,203 | ) | $ | (3,002 | ) | Salaries and employee benefits | ||||
| 95 | 4,303 | 1,141 | Income tax (expense) benefit | |||||||||||
|
|
|
|
|
|
|
|||||||||
| $ | (64 | ) | $ | (6,900 | ) | $ | (1,861 | ) | Net income | |||||
|
|
|
|
|
|
|
|||||||||
| Total reclassifications for the period |
$ | 1,090 | $ | (8,378 | ) | $ | (1,231 | ) | Net income | |||||
|
|
|
|
|
|
|
|||||||||
Following is a summary of the major items comprising the differences in taxes from continuing operations computed at the federal statutory rate and as recorded in the consolidated statement of income:
| Years Ended December 31, | ||||||||||||
| (dollars in thousands) |
2017 | 2016 | 2015 | |||||||||
| Provision at statutory rate of 35% |
$ | 59,032 | $ | 70,149 | $ | 57,013 | ||||||
| Tax-exempt income: |
||||||||||||
| Tax-exempt interest |
(15,026 | ) | (14,356 | ) | (13,111 | ) | ||||||
| Section 291/265 interest disallowance |
289 | 191 | 142 | |||||||||
| Company-owned life insurance income |
(3,029 | ) | (2,968 | ) | (3,011 | ) | ||||||
|
|
|
|
|
|
|
|||||||
| Tax-exempt income |
(17,766 | ) | (17,133 | ) | (15,980 | ) | ||||||
|
|
|
|
|
|
|
|||||||
| Reserve for unrecognized tax benefits |
— | (1 | ) | (5 | ) | |||||||
| State income taxes |
998 | 3,461 | 4,173 | |||||||||
| Tax credit investments—federal |
(8,500 | ) | (321 | ) | (411 | ) | ||||||
| Estimated revaluation of deferred tax assets |
39,300 | — | — | |||||||||
| ONB Insurance Group, Inc. nondeductible goodwill |
— | 8,328 | — | |||||||||
| Effect of Illinois branch sale |
— | — | 1,835 | |||||||||
| Other, net |
(125 | ) | 1,679 | (448 | ) | |||||||
|
|
|
|
|
|
|
|||||||
| Income tax expense |
$ | 72,939 | $ | 66,162 | $ | 46,177 | ||||||
|
|
|
|
|
|
|
|||||||
| Effective tax rate |
43.3 | % | 33.0 | % | 28.3 | % | ||||||
|
|
|
|
|
|
|
|||||||
The higher effective tax rate in 2017 when compared to 2016 is the result of $39.3 million of additional tax expense to estimate the revaluation of deferred tax assets due to the lowering of the federal corporate tax rate to 21%,
114
Table of Contents
partially offset by an increase in federal tax credits available. On December 22, 2017, the Tax Cuts and Jobs Act (“H.R. 1”) was enacted into legislation. Under ASC 740, the effects of changes in tax rates and laws are recognized in the period in which the new legislation is enacted. Accordingly, Old National has recorded an estimated $39.3 million for the revaluation of Old National’s deferred tax assets.
Shortly after the enactment date, the SEC issued Staff Accounting Bulletin (“SAB”) 118, which addresses the situations where the accounting for changes in tax laws is complete, incomplete but can be reasonably estimated, and incomplete and cannot be reasonably estimated. SAB 118 also permits a measurement period of up to one year from the date of enactment to refine the provisional accounting. Old National continues to analyze H.R. 1, including the impact on alternative minimum tax credits disclosed further below, as well as the acquisition accounting of Anchor (MN), and expects any refinements to the provisional accounting to be complete in 2018.
The higher effective tax rate in 2016 when compared to 2015 is primarily the result of the sale of ONI in May 2016 and the associated tax expense of $8.3 million to record a deferred tax liability relating to ONI’s nondeductible goodwill.
The provision for income taxes consisted of the following components for the years ended December 31:
| Years Ended December 31, | ||||||||||||
| (dollars in thousands) |
2017 | 2016 | 2015 | |||||||||
| Income taxes currently payable: |
||||||||||||
| Federal |
$ | — | $ | 23,735 | $ | 17,385 | ||||||
| State |
— | 2,242 | 769 | |||||||||
| Deferred income taxes related to: |
||||||||||||
| Federal |
31,915 | 35,955 | 24,664 | |||||||||
| Estimated revaluation of deferred tax assets |
39,300 | — | — | |||||||||
| State |
1,724 | 4,230 | 3,359 | |||||||||
|
|
|
|
|
|
|
|||||||
| Deferred income tax expense |
72,939 | 40,185 | 28,023 | |||||||||
|
|
|
|
|
|
|
|||||||
| Income tax expense |
$ | 72,939 | $ | 66,162 | $ | 46,177 | ||||||
|
|
|
|
|
|
|
|||||||
115
Table of Contents
Net Deferred Tax Assets
Significant components of net deferred tax assets (liabilities) were as follows at December 31:
| (dollars in thousands) |
2017 | 2016 | ||||||
| Deferred Tax Assets |
||||||||
| Allowance for loan losses, net of recapture |
$ | 12,958 | $ | 19,773 | ||||
| Benefit plan accruals |
11,080 | 23,846 | ||||||
| Alternative minimum tax credit |
25,084 | 19,523 | ||||||
| Unrealized losses on benefit plans |
108 | 205 | ||||||
| Net operating loss carryforwards |
39,631 | 66,917 | ||||||
| Federal tax credits |
5,516 | 35 | ||||||
| Other-than-temporary impairment |
1,424 | 3,606 | ||||||
| Acquired loans |
29,669 | 40,522 | ||||||
| Lease exit obligation |
1,337 | 2,060 | ||||||
| Unrealized losses on available-for-sale investment securities |
14,011 | 23,365 | ||||||
| Unrealized losses on held-to-maturity investment securities |
3,630 | 7,118 | ||||||
| Unrealized losses on hedges |
923 | 4,116 | ||||||
| Other real estate owned |
369 | 3,310 | ||||||
| Other, net |
829 | 2,675 | ||||||
|
|
|
|
|
|||||
| Total deferred tax assets |
146,569 | 217,071 | ||||||
|
|
|
|
|
|||||
| Deferred Tax Liabilities |
||||||||
| Accretion on investment securities |
(493 | ) | (700 | ) | ||||
| Purchase accounting |
(16,718 | ) | (17,552 | ) | ||||
| Loan servicing rights |
(6,058 | ) | (9,627 | ) | ||||
| Premises and equipment |
(10,052 | ) | (4,800 | ) | ||||
| Prepaid expenses |
(1,277 | ) | — | |||||
| Tax credit investments |
(168 | ) | — | |||||
| Other, net |
(946 | ) | (2,529 | ) | ||||
|
|
|
|
|
|||||
| Total deferred tax liabilities |
(35,712 | ) | (35,208 | ) | ||||
|
|
|
|
|
|||||
| Net deferred tax assets |
$ | 110,857 | $ | 181,863 | ||||
|
|
|
|
|
|||||
Through the acquisition of Anchor (WI) in the second quarter of 2016 and Lafayette Savings Bank in the fourth quarter of 2014, both former thrifts, Old National Bank’s retained earnings at December 31, 2017 include base-year bad debt reserves, created for tax purposes prior to 1988, totaling $52.8 million. Of this total, $50.9 million was acquired from Anchor (WI), and $1.9 million was acquired from Lafayette Savings Bank. Base-year reserves are subject to recapture in the unlikely event that Old National Bank (1) makes distributions in excess of current and accumulated earnings and profits, as calculated for federal income tax purposes, (2) redeems its stock, or (3) liquidates. Old National Bank has no intention of making such a nondividend distribution. Accordingly, under current accounting principles, a related deferred income tax liability of $13.0 million has not been recognized.
No valuation allowance was recorded at December 31, 2017 or 2016 because, based on current expectations, Old National believes it will generate sufficient income in future years to realize deferred tax assets. Old National has federal net operating loss carryforwards totaling $130.7 million at December 31, 2017 and $162.9 million at December 31, 2016. This federal net operating loss was acquired from the acquisition of Anchor (WI) in 2016. If not used, the federal net operating loss carryforwards will expire from 2028 to 2033. Old National has alternative minimum tax credit carryforwards totaling $25.1 million at December 31, 2017 and $19.5 million at December 31, 2016. The enactment of H.R.1 eliminates the parallel tax system known as the alternative minimum tax and allows any existing alternative minimum tax credits to be used to reduce regular tax or be refunded from 2018 to 2021. ASC 740 may allow for the reclassification of the alternative minimum tax credit from a deferred tax asset to a current tax asset. Old National has not completed its analysis of its alternative minimum tax credit classification, and accordingly is maintaining its alternative minimum tax credit in the deferred asset classification at December 31, 2017. Old National has federal tax credit carryforwards of $5.5 million at December 31, 2017 and $35 thousand at December 31, 2016. The federal tax credits consist mainly of federal historic credits, low income housing credits, and research and development credits that, if not used, will expire from 2027 to 2037. Old National has recorded state net operating loss carryforwards totaling $203.6 million at December 31, 2017 and $206.3 million at December 31, 2016. If not used, the state net operating loss carryforwards will expire from 2024 to 2037. Old National has state tax credits totaling $1.3 million at December 31, 2017. The state tax credits will not expire.
116
Table of Contents
The federal and recorded state net operating loss carryforwards are subject to an annual limitation under Internal Revenue Code section 382. Old National believes that all of the recorded net operating loss carryforwards will be used prior to expiration.
Unrecognized Tax Benefits
Unrecognized state income tax benefits are reported net of their related deferred federal income tax benefit.
A reconciliation of the beginning and ending amount of unrecognized tax benefits was as follows:
| Years Ended December 31, | ||||||||||||
| (dollars in thousands) |
2017 | 2016 | 2015 | |||||||||
| Balance at beginning of period |
$ | 777 | $ | 124 | $ | 77 | ||||||
| Additions based on tax positions related to the current year |
162 | 118 | 51 | |||||||||
| Additions based on tax positions related to prior years |
— | 537 | — | |||||||||
| Reductions due to statute of limitations expiring |
(173 | ) | (2 | ) | (4 | ) | ||||||
| Revaluation due to Tax Reform |
108 | — | — | |||||||||
|
|
|
|
|
|
|
|||||||
| Balance at end of period |
$ | 874 | $ | 777 | $ | 124 | ||||||
|
|
|
|
|
|
|
|||||||
If recognized, approximately $0.9 million of unrecognized tax benefits, net of interest, would favorably affect the effective income tax rate in future periods. Old National expects the total amount of unrecognized tax benefits to decrease by approximately $0.2 million in the next twelve months.
It is our policy to recognize interest and penalties accrued relative to unrecognized tax benefits in their respective federal or state income tax accounts. We recorded interest and penalties in the income statement of $10 thousand in 2017, $0.1 million in 2016, and $0.4 thousand in 2015. The amount accrued for interest and penalties in the balance sheet was $0.1 million at December 31, 2017 and 2016.
Old National and its subsidiaries file a consolidated U.S. federal income tax return, as well as filing various state returns. The 2014 through 2017 tax years are open and subject to examination.
Old National reversed $0.2 million in 2017 related to uncertain tax positions accounted for under FASB ASC 740-10 (FASB Interpretation No. 48, Accounting for Uncertainty in Income Taxes) (“ASC Topic 740-10”). The $0.2 million income tax reversal related to the 2013 statute of limitations expiring in the third quarter of 2017. As a result, Old National reversed a total of $0.2 million from its unrecognized tax benefit liability.
NOTE 17 – EMPLOYEE BENEFIT PLANS
Retirement Plan
Old National had a funded noncontributory defined benefit plan (the “Retirement Plan”) that had been frozen since December 31, 2005. During the first quarter of 2016, we notified plan participants of our intent to terminate the Retirement Plan effective May 15, 2016. During October 2016, the Retirement Plan settled plan liabilities through either lump sum distributions to plan participants or annuity contracts purchased from a third-party insurance company that provided for the payment of vested benefits to those participants that did not elect the lump sum option. At December 31, 2017, there were no remaining plan assets. Old National made contributions to the Retirement Plan totaling $7.6 million during 2016 and $0.1 million during 2015.
As a result of the pension termination, unrecognized losses, which previously were recorded in accumulated other comprehensive loss on the consolidated balance sheets, were recognized as expense and the pension plan settlement loss of $9.8 million was recorded in the consolidated statements of income for the year ended December 31, 2016. Including this settlement charge, the total expense under the Retirement Plan was $11.6 million in 2016.
117
Table of Contents
Employee Stock Ownership Plan
The Employee Stock Ownership and Savings Plan (the “401(k) Plan”) permits employees to participate the first month following one month of service. Effective as of April 1, 2010, we suspended safe harbor matching contributions to the 401(k) Plan. However, we may make discretionary matching contributions to the 401(k) Plan. For 2017, 2016, and 2015, we matched 50% of employee compensation deferral contributions, up to 6% of compensation. In addition to matching contributions, Old National may contribute to the 401(k) Plan an amount designated as a profit sharing contribution in the form of Old National stock or cash. Our Board of Directors designated no discretionary profit sharing contributions in 2017, 2016, or 2015. All contributions vest immediately and plan participants may elect to redirect funds among any of the investment options provided under the 401(k) Plan. The number of Old National shares in the 401(k) Plan were 0.7 million at December 31, 2017 and 0.8 million at December 31, 2016. All shares owned through the 401(k) Plan are included in the calculation of weighted-average shares outstanding for purposes of calculating diluted and basic earnings per share. Contribution expense under the 401(k) Plan was $4.7 million in 2017, $5.0 million in 2016, and $4.6 million in 2015.
NOTE 18 – STOCK-BASED COMPENSATION
Our Amended and Restated 2008 Incentive Compensation Plan (the “ICP”), which was shareholder-approved, permits the grant of share-based awards to its employees. At December 31, 2017, 4.8 million shares were available for issuance. The granting of awards to key employees is typically in the form of restricted stock awards or units. We believe that such awards better align the interests of our employees with those of our shareholders. Total compensation cost that has been charged against income for the ICPs was $6.3 million in 2017, $7.3 million in 2016, and $4.3 million in 2015. The total income tax benefit was $2.4 million in 2017, $2.8 million in 2016, and $1.6 million in 2015.
Restricted Stock Awards
Restricted stock awards require certain service requirements and commonly have vesting periods of 3 years. Compensation expense is recognized on a straight-line basis over the vesting period. Shares are subject to certain restrictions and risk of forfeiture by the participants.
A summary of changes in our nonvested shares for the year follows:
| (shares in thousands) |
Shares | Weighted Average Grant-Date Fair Value |
||||||
| Year Ended December 31, 2017 |
||||||||
| Nonvested balance at beginning of period |
401 | $ | 13.31 | |||||
| Granted during the year |
211 | 17.61 | ||||||
| Vested during the year |
(194 | ) | 13.50 | |||||
| Forfeited during the year |
(11 | ) | 14.97 | |||||
|
|
|
|
|
|||||
| Nonvested balance at end of period |
407 | $ | 15.41 | |||||
|
|
|
|
|
|||||
As of December 31, 2017, there was $3.9 million of total unrecognized compensation cost related to nonvested shares granted under the ICP. The cost is expected to be recognized over a weighted-average period of 2.0 years. The total fair value of the shares vested was $3.4 million in 2017, $3.8 million in 2016, and $1.6 million in 2015.
Restricted Stock Units
Restricted stock units require certain performance requirements and have vesting periods of 3 years. Compensation expense is recognized on a straight-line basis over the vesting period. Shares are subject to certain restrictions and risk of forfeiture by the participants.
118
Table of Contents
A summary of changes in our nonvested shares for the year follows:
| (shares in thousands) |
Shares | Weighted Average Grant-Date Fair Value |
||||||
| Year Ended December 31, 2017 |
||||||||
| Nonvested balance at beginning of period |
821 | $ | 12.02 | |||||
| Granted during the year |
278 | 16.31 | ||||||
| Vested during the year |
(74 | ) | 13.47 | |||||
| Forfeited during the year |
(192 | ) | 12.09 | |||||
| Dividend equivalents adjustment |
16 | 13.19 | ||||||
|
|
|
|
|
|||||
| Nonvested balance at end of period |
849 | $ | 13.30 | |||||
|
|
|
|
|
|||||
As of December 31, 2017, there was $3.7 million of total unrecognized compensation cost related to nonvested shares granted under the ICP. The cost is expected to be recognized over a weighted-average period of 1.8 years.
Stock Options
Option awards are generally granted with an exercise price equal to the market price of our Common Stock at the date of grant; these option awards have vesting periods ranging from 3 to 5 years and have 10-year contractual terms.
Old National has not granted stock options since 2009. However, Old National did acquire stock options through prior year acquisitions. Old National recorded no incremental expense associated with the conversion of these options.
A summary of the activity in the stock option plan in 2017 follows:
| Weighted | ||||||||||||||||
| Weighted | Average | Aggregate | ||||||||||||||
| Average | Remaining | Intrinsic | ||||||||||||||
| Exercise | Contractual | Value | ||||||||||||||
| (shares in thousands) |
Shares | Price | Term in Years | (in thousands) | ||||||||||||
| Year Ended December 31, 2017 |
||||||||||||||||
| Outstanding at beginning of period |
694 | $ | 15.27 | |||||||||||||
| Exercised |
(193 | ) | 14.01 | |||||||||||||
| Forfeited/expired |
(276 | ) | 18.89 | |||||||||||||
|
|
|
|
|
|
|
|
|
|||||||||
| Outstanding at end of period |
225 | $ | 11.92 | 1.66 | $ | 1,436.0 | ||||||||||
|
|
|
|
|
|
|
|
|
|||||||||
| Options exercisable at end of year |
225 | $ | 11.92 | 1.66 | $ | 1,436.0 | ||||||||||
Information related to the stock option plan during each year follows:
| Years Ended December 31, | ||||||||||||
| (dollars in thousands) |
2017 | 2016 | 2015 | |||||||||
| Intrinsic value of options exercised |
$ | 806 | $ | 660 | $ | 458 | ||||||
| Cash received from option exercises |
2,655 | 2,349 | 997 | |||||||||
| Tax benefit realized from option exercises |
318 | 264 | 159 | |||||||||
As of December 31, 2017, all options were fully vested and all compensation costs had been expensed.
119
Table of Contents
Stock Appreciation Rights
Old National has never granted stock appreciation rights. However, Old National did acquire stock appreciation rights through a prior year acquisition. Old National recorded no incremental expense associated with the conversion of these stock appreciation rights. At December 31, 2017, 0.1 million stock appreciation rights remained outstanding.
Outside Director Stock Compensation Program
Old National maintains a director stock compensation program covering all outside directors. Compensation shares are earned semi-annually. Beginning in 2017, any shares awarded to directors are anticipated to be issued from the ICP. Approximately 20,000 shares were issued to directors in 2017.
NOTE 19 – SHAREHOLDERS’ EQUITY
Dividend Reinvestment and Stock Purchase Plan
Old National has a dividend reinvestment and stock purchase plan under which common shares issued may be either repurchased shares or authorized and previously unissued shares. A new plan became effective on August 13, 2015, with total authorized and unissued common shares reserved for issuance of 3.3 million. At December 31, 2017, 3.3 million authorized and unissued common shares were available for issuance under the plan.
Employee Stock Purchase Plan
Old National has an employee stock purchase plan under which eligible employees can purchase common shares at a price not less than 95% of the fair market value of the common shares on the purchase date. The amount of common shares purchased cannot exceed ten percent of the employee’s compensation. The maximum number of shares that may be purchased under this plan is 500,000 shares. In 2017, 24,000 shares were issued related to this plan with proceeds of approximately $404,000. In 2016, 32,000 shares were issued related to this plan with proceeds of approximately $388,000.
FASB ASC 820-10 defines fair value as the exchange price that would be received for an asset or paid to transfer a liability (exit price) in the principal or most advantageous market for the asset or liability in an orderly transaction between market participants on the measurement date. FASB ASC 820-10 also establishes a fair value hierarchy, which requires an entity to maximize the use of observable inputs and minimize the use of unobservable inputs when measuring fair value. The standard describes three levels of inputs that may be used to measure fair values:
| • | Level 1 – Quoted prices (unadjusted) for identical assets or liabilities in active markets that the entity has the ability to access as of the measurement date. |
| • | Level 2 – Significant other observable inputs other than Level 1 prices such as quoted prices for similar assets or liabilities; quoted prices in markets that are not active; or other inputs that are observable or can be corroborated by observable market data. |
| • | Level 3 – Significant unobservable inputs that reflect a company’s own assumptions about the assumptions that market participants would use in pricing an asset or liability. |
120
Table of Contents
Old National used the following methods and significant assumptions to estimate the fair value of each type of financial instrument:
Investment securities: The fair values for investment securities are determined by quoted market prices, if available (Level 1). For securities where quoted prices are not available, fair values are calculated based on market prices of similar securities (Level 2). For securities where quoted prices or market prices of similar securities are not available, fair values are calculated using discounted cash flows or other market indicators (Level 3). Discounted cash flows are calculated using swap and LIBOR curves plus spreads that adjust for loss severities, volatility, credit risk, and optionality. During times when trading is more liquid, broker quotes are used (if available) to validate the model. Rating agency and industry research reports as well as defaults and deferrals on individual securities are reviewed and incorporated into the calculations.
Residential loans held for sale: The fair value of loans held for sale is determined using quoted prices for a similar asset, adjusted for specific attributes of that loan (Level 2).
Derivative financial instruments: The fair values of derivative financial instruments are based on derivative valuation models using market data inputs as of the valuation date (Level 2).
121
Table of Contents
Assets and liabilities measured at fair value on a recurring basis, including financial assets and liabilities for which we have elected the fair value option, are summarized below:
| Fair Value Measurements at December 31, 2017 Using | ||||||||||||||||
| Significant | ||||||||||||||||
| Quoted Prices in | Other | Significant | ||||||||||||||
| Active Markets for | Observable | Unobservable | ||||||||||||||
| Carrying | Identical Assets | Inputs | Inputs | |||||||||||||
| (dollars in thousands) |
Value | (Level 1) | (Level 2) | (Level 3) | ||||||||||||
| Financial Assets |
||||||||||||||||
| Trading securities |
$ | 5,584 | $ | 5,584 | $ | — | $ | — | ||||||||
| Investment securities available-for-sale: |
||||||||||||||||
| U.S. Treasury |
5,551 | 5,551 | — | — | ||||||||||||
| U.S. government-sponsored entities and agencies |
664,286 | — | 664,286 | — | ||||||||||||
| Mortgage-backed securities - Agency |
1,667,682 | — | 1,667,682 | — | ||||||||||||
| States and political subdivisions |
530,193 | — | 530,193 | |||||||||||||
| Pooled trust preferred securities |
8,448 | — | — | 8,448 | ||||||||||||
| Other securities |
320,047 | 30,965 | 289,082 | — | ||||||||||||
| Residential loans held for sale |
17,930 | — | 17,930 | — | ||||||||||||
| Derivative assets |
14,118 | — | 14,118 | — | ||||||||||||
| Financial Liabilities |
||||||||||||||||
| Derivative liabilities |
16,292 | — | 16,292 | — | ||||||||||||
| Fair Value Measurements at December 31, 2016 Using | ||||||||||||||||
| Significant | ||||||||||||||||
| Quoted Prices in | Other | Significant | ||||||||||||||
| Active Markets for | Observable | Unobservable | ||||||||||||||
| Carrying | Identical Assets | Inputs | Inputs | |||||||||||||
| (dollars in thousands) |
Value | (Level 1) | (Level 2) | (Level 3) | ||||||||||||
| Financial Assets |
||||||||||||||||
| Trading securities |
$ | 4,982 | $ | 4,982 | $ | — | $ | — | ||||||||
| Investment securities available-for-sale: |
||||||||||||||||
| U.S. Treasury |
7,103 | 7,103 | — | — | ||||||||||||
| U.S. government-sponsored entities and agencies |
493,956 | — | 493,956 | — | ||||||||||||
| Mortgage-backed securities - Agency |
1,525,019 | — | 1,525,019 | — | ||||||||||||
| States and political subdivisions |
436,684 | — | 436,684 | |||||||||||||
| Pooled trust preferred securities |
8,119 | — | — | 8,119 | ||||||||||||
| Other securities |
326,293 | 30,905 | 295,388 | — | ||||||||||||
| Residential loans held for sale |
90,682 | — | 90,682 | — | ||||||||||||
| Derivative assets |
17,701 | — | 17,701 | — | ||||||||||||
| Financial Liabilities |
||||||||||||||||
| Derivative liabilities |
23,574 | — | 23,574 | — | ||||||||||||
The table below presents a reconciliation of all assets measured at fair value on a recurring basis using significant unobservable inputs (Level 3):
| Years Ended December 31, | ||||||||
| (dollars in thousands) |
2017 | 2016 | ||||||
| Balance at beginning of period |
$ | 8,119 | $ | 7,900 | ||||
| Accretion of discount |
17 | 18 | ||||||
| Sales/payments received |
(424 | ) | (327 | ) | ||||
| Increase in fair value of securities |
736 | 528 | ||||||
|
|
|
|
|
|||||
| Balance at end of period |
$ | 8,448 | $ | 8,119 | ||||
|
|
|
|
|
|||||
122
Table of Contents
The accretion of discounts on securities in the table above is included in interest income. An increase in fair value is reflected in the balance sheet as an increase in the fair value of investment securities available-for-sale, an increase in accumulated other comprehensive income, which is included in shareholders’ equity, and a decrease in other assets related to the tax impact.
The table below provides quantitative information about significant unobservable inputs used in fair value measurements within Level 3 of the fair value hierarchy:
| (dollars in thousands) |
Fair Value |
Valuation Techniques |
Unobservable Input |
Range (Weighted Average) | ||||||
| December 31, 2017 |
||||||||||
| Pooled trust preferred securities |
$ | 8,448 | Discounted cash flow | Constant prepayment rate (a) | 0.00% | |||||
| Additional asset defaults (b) | 4.2% - 9.6% (7.5%) | |||||||||
| Expected asset recoveries (c) | 0.0% - 4.1% (0.6%) | |||||||||
| December 31, 2016 |
||||||||||
| Pooled trust preferred securities |
$ | 8,119 | Discounted cash flow | Constant prepayment rate (a) | 0.00% | |||||
| Additional asset defaults (b) | 4.5% - 10.0% (7.9%) | |||||||||
| Expected asset recoveries (c) | 0.0% - 6.1% (0.9%) | |||||||||
| (a) | Assuming no prepayments. |
| (b) | Each currently performing pool asset is assigned a default probability based on the banking environment, which is adjusted for specific issuer evaluation, of 0%, 50%, or 100%. |
| (c) | Each currently defaulted pool asset is assigned a recovery probability based on specific issuer evaluation of 0%, 25%, or 100%. |
Significant changes in any of the unobservable inputs used in the fair value measurement in isolation would result in a significant change to the fair value measurement. The pooled trust preferred securities Old National owns are subordinate note classes that rely on an ongoing cash flow stream to support their values. The senior note classes receive the benefit of prepayments to the detriment of subordinate note classes since the ongoing interest cash flow stream is reduced by the early redemption. Generally, a change in prepayment rates or additional pool asset defaults has an impact that is directionally opposite from a change in the expected recovery of a defaulted pool asset.
Assets measured at fair value on a non-recurring basis at December 31, 2017 are summarized below:
| Fair Value Measurements at December 31, 2017 Using | ||||||||||||||||
| Significant | ||||||||||||||||
| Quoted Prices in | Other | Significant | ||||||||||||||
| Active Markets for | Observable | Unobservable | ||||||||||||||
| Carrying | Identical Assets | Inputs | Inputs | |||||||||||||
| (dollars in thousands) |
Value | (Level 1) | (Level 2) | (Level 3) | ||||||||||||
| Collateral Dependent Impaired Loans: |
||||||||||||||||
| Commercial loans |
$ | 2,217 | $ | — | $ | — | $ | 2,217 | ||||||||
| Commercial real estate loans |
26,319 | — | — | 26,319 | ||||||||||||
| Foreclosed Assets: |
||||||||||||||||
| Commercial real estate |
1,726 | — | — | 1,726 | ||||||||||||
| Residential |
55 | — | — | 55 | ||||||||||||
| Loan servicing rights |
2,964 | — | 2,964 | — | ||||||||||||
Impaired commercial and commercial real estate loans that are deemed collateral dependent are valued based on the fair value of the underlying collateral. These estimates are based on the most recently available appraisals with certain adjustments made based on the type of property, age of appraisal, current status of the property, and other related factors to estimate the current value of the collateral. These impaired commercial and commercial real estate loans had a principal amount of $38.6 million, with a valuation allowance of $10.1 million at December 31, 2017. Old National recorded provision expense associated with these loans totaling $5.2 million in 2017.
123
Table of Contents
Other real estate owned and other repossessed property is measured at fair value less costs to sell and had a net carrying amount of $1.8 million at December 31, 2017. The estimates of fair value are based on the most recently available appraisals with certain adjustments made based on the type of property, age of appraisal, current status of the property, and other related factors to estimate the current value of the collateral. There were write-downs of other real estate owned of $2.5 million in 2017.
Loan servicing rights are evaluated for impairment based upon the fair value of the rights as compared to the carrying amount. If the carrying amount of an individual tranche exceeds fair value, impairment is recorded on that tranche so that the servicing asset is carried at fair value. Fair value is determined at a tranche level, based on market prices for comparable mortgage servicing contracts when available, or alternatively based on a valuation model that calculates the present value of estimated future net servicing income. The valuation model utilizes a discount rate, weighted average prepayment speed, and other economic factors that market participants would use in estimating future net servicing income and that can be validated against available market data (Level 2). The valuation allowance for loan servicing rights with impairments at December 31, 2017 totaled $29 thousand. Old National recorded recoveries associated with these loan servicing rights totaling $39 thousand in 2017.
Assets measured at fair value on a non-recurring basis at December 31, 2016 are summarized below:
| Fair Value Measurements at December 31, 2016 Using | ||||||||||||||||
| Significant | ||||||||||||||||
| Quoted Prices in | Other | Significant | ||||||||||||||
| Active Markets for | Observable | Unobservable | ||||||||||||||
| Carrying | Identical Assets | Inputs | Inputs | |||||||||||||
| (dollars in thousands) |
Value | (Level 1) | (Level 2) | (Level 3) | ||||||||||||
| Collateral Dependent Impaired Loans: |
||||||||||||||||
| Commercial loans |
$ | 6,771 | $ | — | $ | — | $ | 6,771 | ||||||||
| Commercial real estate loans |
11,632 | — | — | 11,632 | ||||||||||||
| Foreclosed Assets: |
||||||||||||||||
| Commercial real estate |
1,352 | — | — | 1,352 | ||||||||||||
| Residential |
394 | — | — | 394 | ||||||||||||
| Loan servicing rights |
2,181 | — | 2,181 | — | ||||||||||||
At December 31, 2016, impaired commercial and commercial real estate loans had a principal amount of $26.4 million, with a valuation allowance of $8.0 million. Old National recorded provision recapture associated with these loans totaling $1.1 million in 2016.
Other real estate owned and other repossessed property had a net carrying amount of $1.7 million at December 31, 2016. There were write-downs of other real estate owned of $3.0 million in 2016.
The valuation allowance for loan servicing rights with impairments at December 31, 2016 totaled $68 thousand. There were impairments associated with these loan servicing rights totaling $34 thousand in 2016.
124
Table of Contents
The table below provides quantitative information about significant unobservable inputs used in fair value measurements within Level 3 of the fair value hierarchy:
| Valuation | Unobservable | Range (Weighted | ||||||||||
| (dollars in thousands) |
Fair Value | Techniques |
Input |
Average) | ||||||||
| December 31, 2017 Collateral Dependent Impaired Loans |
||||||||||||
| Commercial loans |
$ | 2,217 | Fair value of collateral | Discount for type of property, age of appraisal, and current status | 0% - 98% (49%) | |||||||
| Commercial real estate loans |
26,319 | Fair value of collateral | Discount for type of property, age of appraisal and current status | 10% -78% (32%) | ||||||||
| Foreclosed Assets |
||||||||||||
| Commercial real estate |
1,726 | Fair value of collateral | Discount for type of property, age of appraisal, and current status | 7% - 25% (18%) | ||||||||
| Residential (1) |
55 | Fair value of collateral | Discount for type of property, age of appraisal, and current status | 39% | ||||||||
| (1) | There was only one foreclosed residential asset at December 31, 2017, so no range or weighted average rate is reported. |
| December 31, 2016 |
||||||||||||
| Collateral Dependent Impaired Loans |
||||||||||||
| Commercial loans |
$ | 6,771 | Fair value of collateral | Discount for type of property, age of appraisal, and current status | 0% - 99% (53%) | |||||||
| Commercial real estate loans |
11,632 | Fair value of collateral | Discount for type of property, age of appraisal, and current status | 10% - 67% (36%) | ||||||||
| Foreclosed Assets |
||||||||||||
| Commercial real estate |
1,352 | Fair value of collateral | Discount for type of property, age of appraisal, and current status | 4% - 80% (39%) | ||||||||
| Residential |
394 | Fair value of collateral | Discount for type of property, age of appraisal, and current status | 7% - 60% (30%) |
Financial instruments recorded using fair value option
Under FASB ASC 825-10, we may elect to report most financial instruments and certain other items at fair value on an instrument-by instrument basis with changes in fair value reported in net income. After the initial adoption, the election is made at the acquisition of an eligible financial asset, financial liability or firm commitment or when certain specified reconsideration events occur. The fair value election may not be revoked once an election is made.
We have elected the fair value option for residential loans held for sale. For these loans, interest income is recorded in the consolidated statements of income based on the contractual amount of interest income earned on the financial assets (except any that are on nonaccrual status). None of these loans are 90 days or more past due, nor are any on nonaccrual status. Included in the income statement is interest income for loans held for sale totaling $0.2 million in 2017 and $0.1 million in 2016.
Residential loans held for sale
Old National has elected the fair value option for newly originated conforming fixed-rate and adjustable-rate first mortgage loans held for sale. These loans are intended for sale and are hedged with derivative instruments. Old National has elected the fair value option to mitigate accounting mismatches in cases where hedge accounting is complex and to achieve operational simplification. The fair value option was not elected for loans held for investment.
125
Table of Contents
The difference between the aggregate fair value and the aggregate remaining principal balance for loans for which the fair value option has been elected as of December 31, 2017 and 2016 was as follows:
| Aggregate | Contractual | |||||||||||
| (dollars in thousands) |
Fair Value | Difference | Principal | |||||||||
| December 31, 2017 |
||||||||||||
| Residential loans held for sale |
$ | 17,930 | $ | 546 | $ | 17,384 | ||||||
|
|
|
|
|
|
|
|||||||
| December 31, 2016 |
||||||||||||
| Residential loans held for sale |
$ | 90,682 | $ | 133 | $ | 90,549 | ||||||
|
|
|
|
|
|
|
|||||||
Accrued interest at period end is included in the fair value of the instruments.
The following table presents the amount of gains and losses from fair value changes included in income before income taxes for financial assets carried at fair value for the years ended December 31:
| Total Changes | ||||||||||||||||
| in Fair Values | ||||||||||||||||
| Other | Included in | |||||||||||||||
| Gains and | Interest | Interest | Current Period | |||||||||||||
| (dollars in thousands) |
(Losses) | Income | (Expense) | Earnings | ||||||||||||
| Year Ended December 31, 2017 |
||||||||||||||||
| Residential loans held for sale |
$ | 409 | $ | 4 | $ | — | $ | 413 | ||||||||
|
|
|
|
|
|
|
|
|
|||||||||
| Year Ended December 31, 2016 |
||||||||||||||||
| Residential loans held for sale |
$ | (103 | ) | $ | — | $ | — | $ | (103 | ) | ||||||
|
|
|
|
|
|
|
|
|
|||||||||
126
Table of Contents
The carrying amounts and estimated fair values of financial instruments, not previously presented in this note, at December 31, 2017 and 2016 were as follows:
| Fair Value Measurements at December 31, 2017 Using | ||||||||||||||||
| Significant | ||||||||||||||||
| Quoted Prices in | Other | Significant | ||||||||||||||
| Active Markets for | Observable | Unobservable | ||||||||||||||
| Carrying | Identical Assets | Inputs | Inputs | |||||||||||||
| (dollars in thousands) |
Value | (Level 1) | (Level 2) | (Level 3) | ||||||||||||
| Financial Assets |
||||||||||||||||
| Cash, due from banks, money market, and other interest-earning investments |
$ | 290,432 | $ | 290,432 | $ | — | $ | — | ||||||||
| Investment securities held-to-maturity: |
||||||||||||||||
| Mortgage-backed securities—Agency |
6,903 | — | 7,056 | — | ||||||||||||
| State and political subdivisions |
677,160 | — | 720,647 | — | ||||||||||||
| FHLB/Federal Reserve Bank stock |
119,686 | N/A | N/A | N/A | ||||||||||||
| Loans, net: |
||||||||||||||||
| Commercial |
2,698,023 | — | — | 2,707,385 | ||||||||||||
| Commercial real estate |
4,333,116 | — | — | 4,347,949 | ||||||||||||
| Residential real estate |
2,165,290 | — | — | 2,210,951 | ||||||||||||
| Consumer credit |
1,871,311 | — | — | 1,998,194 | ||||||||||||
| Accrued interest receivable |
87,102 | 16 | 24,001 | 63,085 | ||||||||||||
| Financial Liabilities |
||||||||||||||||
| Deposits: |
||||||||||||||||
| Noninterest-bearing demand deposits |
$ | 3,680,807 | $ | 3,680,807 | $ | — | $ | — | ||||||||
| NOW, savings, and money market deposits |
7,290,521 | 7,290,521 | — | — | ||||||||||||
| Time deposits |
1,634,436 | — | 1,620,685 | — | ||||||||||||
| Federal funds purchased and interbank borrowings |
335,033 | 335,033 | — | — | ||||||||||||
| Securities sold under agreements to repurchase |
384,810 | 359,810 | 25,133 | — | ||||||||||||
| FHLB advances |
1,609,579 | — | — | 1,607,189 | ||||||||||||
| Other borrowings |
248,782 | — | 250,443 | — | ||||||||||||
| Accrued interest payable |
7,029 | — | 7,029 | — | ||||||||||||
| Standby letters of credit |
351 | — | — | 351 | ||||||||||||
| Off-Balance Sheet Financial Instruments |
||||||||||||||||
| Commitments to extend credit |
$ | — | $ | — | $ | — | $ | 2,449 | ||||||||
| N/A = not applicable |
||||||||||||||||
127
Table of Contents
| Fair Value Measurements at December 31, 2016 Using | ||||||||||||||||
| (dollars in thousands) |
Carrying Value |
Quoted Prices in Active Markets for Identical Assets (Level 1) |
Significant Other Observable Inputs (Level 2) |
Significant Unobservable Inputs (Level 3) |
||||||||||||
| Financial Assets |
||||||||||||||||
| Cash, due from banks, money market, and other interest-earning investments |
$ | 255,519 | $ | 255,519 | $ | — | $ | — | ||||||||
| Investment securities held-to-maturity: |
||||||||||||||||
| U.S. government-sponsored entities and agencies |
40,131 | — | 40,558 | — | ||||||||||||
| Mortgage-backed securities - Agency |
10,640 | — | 10,940 | — | ||||||||||||
| State and political subdivisions |
694,319 | — | 732,674 | — | ||||||||||||
| FHLB/Federal Reserve Bank stock |
101,716 | N/A | N/A | N/A | ||||||||||||
| Loans, net: |
||||||||||||||||
| Commercial |
1,895,618 | — | — | 1,971,296 | ||||||||||||
| Commercial real estate |
3,112,680 | — | — | 3,400,365 | ||||||||||||
| Residential real estate |
2,085,887 | — | — | 2,228,542 | ||||||||||||
| Consumer credit |
1,866,519 | — | — | 1,974,180 | ||||||||||||
| Accrued interest receivable |
81,381 | 16 | 22,880 | 58,485 | ||||||||||||
| Financial Liabilities |
||||||||||||||||
| Deposits: |
||||||||||||||||
| Noninterest-bearing demand deposits |
$ | 3,016,093 | $ | 3,016,093 | $ | — | $ | — | ||||||||
| NOW, savings, and money market deposits |
6,259,052 | 6,259,052 | — | — | ||||||||||||
| Time deposits |
1,468,108 | — | 1,460,778 | — | ||||||||||||
| Federal funds purchased and interbank borrowings |
213,003 | 213,003 | — | — | ||||||||||||
| Securities sold under agreements to repurchase |
367,052 | 317,052 | 50,612 | — | ||||||||||||
| FHLB advances |
1,353,092 | — | — | 1,360,599 | ||||||||||||
| Other borrowings |
218,939 | — | 217,647 | — | ||||||||||||
| Accrued interest payable |
5,979 | — | 5,979 | — | ||||||||||||
| Standby letters of credit |
315 | — | — | 315 | ||||||||||||
| Off-Balance Sheet Financial Instruments |
||||||||||||||||
| Commitments to extend credit |
$ | — | $ | — | $ | — | $ | 2,527 | ||||||||
N/A = not applicable
The following methods and assumptions were used to estimate the fair value of each type of financial instrument.
Cash, due from banks, federal funds sold, and money market investments: For these instruments, the carrying amounts approximate fair value (Level 1).
Investment securities: Fair values for investment securities held-to-maturity are based on quoted market prices, if available. For securities where quoted prices are not available, fair values are estimated based on market prices of similar securities (Level 2).
FHLB and Federal Reserve Bank stock: Old National Bank is a member of the FHLB and the Federal Reserve System. The carrying value is our basis because it is not practical to determine the fair value due to restrictions placed on transferability.
Loans: The fair value of loans is estimated by discounting future cash flows using current rates at which similar loans would be made to borrowers with similar credit ratings and for the same remaining maturities (Level 3). The method utilized to estimate the fair value of loans does not necessarily represent an exit price.
128
Table of Contents
Accrued interest receivable and payable: The carrying amount approximates fair value and is aligned with the underlying assets or liabilities (Level 1, Level 2, or Level 3).
Deposits: The fair value of noninterest-bearing demand deposits and savings, NOW, and money market deposits is the amount payable as of the reporting date (Level 1). The fair value of fixed-maturity certificates of deposit is estimated using rates currently offered for deposits with similar remaining maturities (Level 2).
Federal funds purchased and interbank borrowings: Federal funds purchased and interbank borrowings generally have an original term to maturity of 30 days or less and, therefore, their carrying amount is a reasonable estimate of fair value (Level 1).
Securities sold under agreements to repurchase: The fair value of securities sold under agreements to repurchase is determined using end of day market prices (Level 1 or Level 2).
Federal Home Loan Bank advances: The fair value of FHLB advances is determined using calculated prices for new FHLB advances with similar risk characteristics (Level 3).
Other borrowings: The fair value of medium-term notes, subordinated debt, and senior bank notes is determined using market quotes (Level 2). The fair value of other debt is determined using comparable security market prices or dealer quotes (Level 2).
Standby letters of credit: Fair values for standby letters of credit are based on fees currently charged to enter into similar agreements. The fair value for standby letters of credit was recorded in “Accrued expenses and other liabilities” on the consolidated balance sheet in accordance with FASB ASC 460-10 (FIN 45) (Level 3).
Off-balance sheet financial instruments: Fair values for off-balance sheet credit-related financial instruments are based on fees currently charged to enter into similar agreements (Level 3). For further information regarding the amounts of these financial instruments, see Notes 22 and 23.
NOTE 21 – DERIVATIVE FINANCIAL INSTRUMENTS
As part of our overall interest rate risk management, Old National uses derivative instruments, including interest rate swaps, caps, and floors. The notional amount of these derivative instruments was $708.5 million at December 31, 2017 and $660.0 million at December 31, 2016. These derivative financial instruments at December 31, 2017 consisted of $33.5 million notional amount of receive-fixed, pay-variable interest rate swaps on certain of its FHLB advances and $675.0 million notional amount of pay-fixed, receive-variable interest rate swaps on certain of its FHLB advances. Derivative financial instruments at December 31, 2016 consisted of $35.0 million notional amount of receive-fixed, pay-variable interest rate swaps on certain of its FHLB advances and $625.0 million notional amount of pay-fixed, receive-variable interest rate swaps on certain of its FHLB advances. These hedges were entered into to manage interest rate risk. Derivative instruments are recognized on the balance sheet at their fair value and are not reported on a net basis.
In addition, commitments to fund certain mortgage loans (interest rate lock commitments) and forward commitments for the future delivery of mortgage loans to third party investors are considered derivatives. At December 31, 2017, the notional amount of the interest rate lock commitments was $29.9 million and forward commitments were $41.2 million. At December 31, 2016, the notional amount of the interest rate lock commitments was $40.3 million and forward commitments were $86.1 million. It is our practice to enter into forward commitments for the future delivery of residential mortgage loans to third party investors when interest rate lock commitments are entered into in order to economically hedge the effect of changes in interest rates resulting from our commitment to fund the loans.
Old National also enters into derivative instruments for the benefit of its customers. The notional amounts of these customer derivative instruments and the offsetting counterparty derivative instruments were $826.6 million at December 31, 2017. The notional amounts of these customer derivative instruments and the offsetting counterparty derivative instruments were $582.7 million at December 31, 2016. These derivative contracts do not qualify for hedge accounting. These instruments include interest rate swaps, caps, and collars. Commonly, Old National will economically hedge significant exposures related to these derivative contracts entered into for the benefit of customers by entering into offsetting contracts with approved, reputable, independent counterparties with substantially matching terms.
129
Table of Contents
Old National enters into derivative financial instruments as part of its foreign currency risk management strategies. These derivative instruments consist of foreign currency forward contracts to accommodate the business needs of its customers. Old National does not designate these foreign currency forward contracts for hedge accounting treatment. The notional amounts of these foreign currency forward contracts and the offsetting counterparty derivative instruments were $0.8 million at December 31, 2017. We did not have any foreign currency forward contracts at December 31, 2016.
Credit risk arises from the possible inability of counterparties to meet the terms of their contracts. Old National’s exposure is limited to the replacement value of the contracts rather than the notional, principal, or contract amounts. There are provisions in our agreements with the counterparties that allow for certain unsecured credit exposure up to an agreed threshold. Exposures in excess of the agreed thresholds are collateralized. In addition, we minimize credit risk through credit approvals, limits, and monitoring procedures.
Amounts reported in AOCI related to cash flow hedges will be reclassified to interest income or interest expense as interest payments are received or paid on Old National’s derivative instruments. During the next 12 months, we estimate that $0.7 million will be reclassified to interest income and $2.8 million will be reclassified to interest expense.
On the balance sheet, asset derivatives are included in other assets, and liability derivatives are included in other liabilities. The following table summarizes the fair value of derivative financial instruments utilized by Old National:
| December 31, 2017 | December 31, 2016 | |||||||||||||||
| (dollars in thousands) |
Asset Derivatives |
Liability Derivatives |
Asset Derivatives |
Liability Derivatives |
||||||||||||
| Derivatives designated as hedging instruments |
||||||||||||||||
| Interest rate contracts |
$ | 3,351 | $ | 5,351 | $ | 3,056 | $ | 11,582 | ||||||||
|
|
|
|
|
|
|
|
|
|||||||||
| Total derivatives designated as hedging instruments |
$ | 3,351 | $ | 5,351 | $ | 3,056 | $ | 11,582 | ||||||||
|
|
|
|
|
|
|
|
|
|||||||||
| Derivatives not designated as hedging instruments |
||||||||||||||||
| Interest rate contracts |
$ | 10,012 | $ | 10,933 | $ | 11,903 | $ | 11,992 | ||||||||
| Mortgage contracts |
747 | — | 2,742 | — | ||||||||||||
| Foreign currency contracts |
8 | 8 | — | — | ||||||||||||
|
|
|
|
|
|
|
|
|
|||||||||
| Total derivatives not designated as hedging instruments |
$ | 10,767 | $ | 10,941 | $ | 14,645 | $ | 11,992 | ||||||||
|
|
|
|
|
|
|
|
|
|||||||||
| Total |
$ | 14,118 | $ | 16,292 | $ | 17,701 | $ | 23,574 | ||||||||
|
|
|
|
|
|
|
|
|
|||||||||
Beginning in 2017, the relevant agreements that allow us to access the central clearing organizations to clear derivative transactions were amended to characterize variation margin payments as settlements of the derivative contract rather than collateral against the exposures. Netting cash collateral exchanged with all central clearing organizations and applying variation margin payments as settlement of derivative transactions resulted in a reduction of net derivative assets on our balance sheet of $3.6 million and a reduction of net derivative liabilities of $2.7 million at December 31, 2017.
130
Table of Contents
The effect of derivative instruments on the consolidated statements of income for the years ended December 31 were as follows:
| Years Ended December 31, | ||||||||||||||
| (dollars in thousands) |
2017 | 2016 | 2015 | |||||||||||
| Derivatives in Fair Value Hedging Relationships |
Location of Gain or (Loss) Recognized in |
Amount of Gain or (Loss) Recognized in Income on Derivative |
||||||||||||
| Interest rate contracts (1) |
Interest income / (expense) | $ | (5,695 | ) | $ | (5,446 | ) | $ | (1,729 | ) | ||||
| Interest rate contracts (2) |
Other income / (expense) | 161 | 126 | 189 | ||||||||||
|
|
|
|
|
|
|
|||||||||
| Total |
$ | (5,534 | ) | $ | (5,320 | ) | $ | (1,540 | ) | |||||
|
|
|
|
|
|
|
|||||||||
| Derivatives in Cash Flow Hedging Relationships |
Location of Gain or (Loss) Recognized in |
Amount of Gain or (Loss) Recognized in Income on Derivative |
||||||||||||
| Interest rate contracts (1) |
Interest income / (expense) | $ | 309 | $ | 329 | $ | 511 | |||||||
|
|
|
|
|
|
|
|||||||||
| Total |
$ | 309 | $ | 329 | $ | 511 | ||||||||
|
|
|
|
|
|
|
|||||||||
| Derivatives Not Designated as Hedging Instruments |
Location of Gain or (Loss) Recognized in |
Amount of Gain or (Loss) Recognized in Income on Derivative |
||||||||||||
| Interest rate contracts (3) |
Other income / (expense) | $ | 56 | $ | 28 | $ | 18 | |||||||
| Mortgage contracts |
Mortgage banking revenue | (1,995 | ) | 1,390 | 168 | |||||||||
| Foreign currency contracts |
Other income | — | — | — | ||||||||||
|
|
|
|
|
|
|
|||||||||
| Total |
$ | (1,939 | ) | $ | 1,418 | $ | 186 | |||||||
|
|
|
|
|
|
|
|||||||||
| (1) | Amounts represent the net interest payments as stated in the contractual agreements. |
| (2) | Amounts represent ineffectiveness on derivatives designated as fair value hedges. |
| (3) | Includes the valuation differences between the customer and offsetting counterparty swaps. |
NOTE 22 – COMMITMENTS AND CONTINGENCIES
Litigation
In the normal course of business, Old National Bancorp and its subsidiaries have been named, from time to time, as defendants in various legal actions. Certain of the actual or threatened legal actions may include claims for substantial compensatory and/or punitive damages or claims for indeterminate amounts of damages.
Old National contests liability and/or the amount of damages as appropriate in each pending matter. In view of the inherent difficulty of predicting the outcome of such matters, particularly in cases where claimants seek substantial or indeterminate damages or where investigations and proceedings are in the early stages, Old National cannot predict with certainty the loss or range of loss, if any, related to such matters, how or if such matters will be resolved, when they will ultimately be resolved, or what the eventual settlement, or other relief, if any, might be. Subject to the foregoing, Old National believes, based on current knowledge and after consultation with counsel, that the outcome of such pending matters will not have a material adverse effect on the consolidated financial condition of Old National, although the outcome of such matters could be material to Old National’s operating results and cash flows for a particular future period, depending on, among other things, the level of Old National’s revenues or income for such period. Old National will accrue for a loss contingency if (1) it is probable that a future event will occur and confirm the loss and (2) the amount of the loss can be reasonably estimated.
Old National is not currently involved in any material litigation.
Credit-Related Financial Instruments
In the normal course of business, Old National’s banking affiliates have entered into various agreements to extend credit, including loan commitments of $3.144 billion and standby letters of credit of $68.7 million at December 31, 2017. At December 31, 2017, approximately $2.896 billion of the loan commitments had fixed rates and $248.1
131
Table of Contents
million had floating rates, with the floating interest rates ranging from 0% to 18%. At December 31, 2016, loan commitments totaled $2.354 billion and standby letters of credit totaled $51.7 million. These commitments are not reflected in the consolidated financial statements. The allowance for unfunded loan commitments totaled $3.1 million at December 31, 2017 and $3.2 million at December 31, 2016.
Old National had credit extensions with various unaffiliated banks related to letter of credit commitments issued on behalf of Old National’s clients totaling $12.4 million at December 31, 2017 and $13.3 million at December 31, 2016. Old National provided collateral to the unaffiliated banks to secure credit extensions totaling $11.5 million at December 31, 2017 and $12.6 million December 31, 2016. Old National did not provide collateral for the remaining credit extensions.
NOTE 23 – FINANCIAL GUARANTEES
Old National holds instruments, in the normal course of business with clients, that are considered financial guarantees in accordance with FASB ASC 460-10 (FIN 45, Guarantor’s Accounting and Disclosure Requirements for Guarantees, Including Indirect Guarantees of Indebtedness of Others), which requires Old National to record the instruments at fair value. Standby letters of credit guarantees are issued in connection with agreements made by clients to counterparties. Standby letters of credit are contingent upon failure of the client to perform the terms of the underlying contract. Credit risk associated with standby letters of credit is essentially the same as that associated with extending loans to clients and is subject to normal credit policies. The term of these standby letters of credit is typically one year or less. At December 31, 2017, the notional amount of standby letters of credit was $68.7 million, which represented the maximum amount of future funding requirements, and the carrying value was $0.4 million. At December 31, 2016, the notional amount of standby letters of credit was $51.7 million, which represented the maximum amount of future funding requirements, and the carrying value was $0.3 million.
Old National is a party in three separate risk participation transactions of interest rate swaps, which had total notional amount of $18.0 million at December 31, 2017.
NOTE 24 – REGULATORY RESTRICTIONS
Restrictions on Cash and Due from Banks
Old National’s affiliate bank is required to maintain reserve balances on hand and with the Federal Reserve Bank that are interest bearing and unavailable for investment purposes. The reserve balances were $100.9 million at December 31, 2017 and $85.4 million at December 31, 2016. In addition, Old National had cash and due from banks which was held as collateral for collateralized swap positions of $5.7 million at December 31, 2017 and $3.5 million at December 31, 2016.
Restrictions on Transfers from Affiliate Bank
Regulations limit the amount of dividends an affiliate bank can declare in any year without obtaining prior regulatory approval. Prior regulatory approval is required if dividends to be declared in any year would exceed net earnings of the current year plus retained net profits for the preceding two years. Prior regulatory approval to pay dividends was not required in 2015, 2016, or 2017 and is not currently required.
Restrictions on the Payment of Dividends
Old National has traditionally paid a quarterly dividend to common stockholders. The payment of dividends is subject to legal and regulatory restrictions. Any payment of dividends in the future will depend, in large part, on Old National’s earnings, capital requirements, financial condition, and other factors considered relevant by our Board of Directors.
Capital Adequacy
Old National and Old National Bank are subject to various regulatory capital requirements administered by the federal banking agencies. Failure to meet minimum capital requirements can elicit certain mandatory actions by regulators that, if undertaken, could have a direct material effect on Old National’s financial statements. Under
132
Table of Contents
capital adequacy guidelines and the regulatory framework for prompt corrective action, Old National and Old National Bank must meet specific capital guidelines that involve quantitative measures of assets, liabilities, and certain off-balance sheet items as calculated under regulatory accounting practices. The capital amounts and classifications are also subject to qualitative judgments by the regulators about components, risk weightings, and other factors. Prompt corrective action provisions are not applicable to bank holding companies. Quantitative measures established by regulation to ensure capital adequacy require Old National and Old National Bank to maintain minimum amounts and ratios as set forth in the following tables.
At December 31, 2017, Old National and Old National Bank exceeded the regulatory minimums and Old National Bank met the regulatory definition of well-capitalized based on the most recent regulatory notification.
133
Table of Contents
The following table summarizes capital ratios for Old National and Old National Bank as of December 31:
| Actual | Fully Phased-In Regulatory Guidelines Minimum (1) |
Well Capitalized Guidelines |
||||||||||||||||||||||
| (dollars in thousands) |
Amount | Ratio | Amount | Ratio | Amount | Ratio | ||||||||||||||||||
| 2017 |
||||||||||||||||||||||||
| Total capital to risk-weighted assets |
||||||||||||||||||||||||
| Old National Bancorp |
$ | 1,424,123 | 11.40 | % | $ | 1,311,600 | 10.50 | % | $ | N/A | N/A | % | ||||||||||||
| Old National Bank |
1,458,546 | 11.73 | 1,305,076 | 10.50 | 1,242,929 | 10.00 | ||||||||||||||||||
| Common equity Tier 1 capital to risk-weighted assets |
||||||||||||||||||||||||
| Old National Bancorp |
1,298,326 | 10.39 | 874,400 | 7.00 | N/A | N/A | ||||||||||||||||||
| Old National Bank |
1,393,059 | 11.21 | 870,051 | 7.00 | 807,904 | 6.50 | ||||||||||||||||||
| Tier 1 capital to risk-weighted assets |
||||||||||||||||||||||||
| Old National Bancorp |
1,298,326 | 10.39 | 1,061,772 | 8.50 | N/A | N/A | ||||||||||||||||||
| Old National Bank |
1,393,059 | 11.21 | 1,056,490 | 8.50 | 994,344 | 8.00 | ||||||||||||||||||
| Tier 1 capital to average assets |
||||||||||||||||||||||||
| Old National Bancorp |
1,298,326 | 8.28 | 627,258 | 4.00 | N/A | N/A | ||||||||||||||||||
| Old National Bank |
1,393,059 | 8.93 | 623,758 | 4.00 | 779,697 | 5.00 | ||||||||||||||||||
| 2016 |
||||||||||||||||||||||||
| Total capital to risk-weighted assets |
||||||||||||||||||||||||
| Old National Bancorp |
$ | 1,229,878 | 12.18 | % | $ | 1,060,662 | 10.50 | % | $ | N/A | N/A | % | ||||||||||||
| Old National Bank |
1,240,180 | 12.35 | 1,054,305 | 10.50 | 1,004,100 | 10.00 | ||||||||||||||||||
| Common equity Tier 1 capital to risk-weighted assets |
||||||||||||||||||||||||
| Old National Bancorp |
1,162,817 | 11.51 | 707,108 | 7.00 | N/A | N/A | ||||||||||||||||||
| Old National Bank |
1,187,151 | 11.82 | 702,870 | 7.00 | 652,665 | 6.50 | ||||||||||||||||||
| Tier 1 capital to risk-weighted assets |
||||||||||||||||||||||||
| Old National Bancorp |
1,176,849 | 11.65 | 858,631 | 8.50 | N/A | N/A | ||||||||||||||||||
| Old National Bank |
1,187,151 | 11.82 | 853,485 | 8.50 | 803,280 | 8.00 | ||||||||||||||||||
| Tier 1 capital to average assets |
||||||||||||||||||||||||
| Old National Bancorp |
1,176,849 | 8.43 | 558,673 | 4.00 | N/A | N/A | ||||||||||||||||||
| Old National Bank |
1,187,151 | 8.55 | 555,161 | 4.00 | 693,951 | 5.00 | ||||||||||||||||||
N/A = not applicable
| (1) | When fully phased-in on January 1, 2019, Basel III Capital Rules will require banking organizations to maintain: a minimum ratio of common equity Tier 1 to risk-weighted assets of at least 4.5%, plus a 2.5% “capital conservation buffer”; a minimum ratio of Tier 1 capital to risk-weighted assets of at least 6.0%, plus the 2.5% capital conservation buffer; a minimum ratio of total capital to risk-weighted assets of at least 8.0%, plus the 2.5% capital conservation buffer; and a minimum ratio of Tier 1 capital to adjusted average consolidated assets of at least 4.0%. |
134
Table of Contents
NOTE 25 – PARENT COMPANY FINANCIAL STATEMENTS
The following are the condensed parent company only financial statements of Old National:
OLD NATIONAL BANCORP (PARENT COMPANY ONLY)
CONDENSED BALANCE SHEETS
| December 31, | ||||||||
| (dollars in thousands) |
2017 | 2016 | ||||||
| Assets |
||||||||
| Deposits in affiliate bank |
$ | 43,538 | $ | 91,650 | ||||
| Trading securities - at fair value |
5,584 | 4,982 | ||||||
| Investment securities - available-for-sale |
1,547 | 1,535 | ||||||
| Investment in affiliates: |
||||||||
| Banking subsidiaries |
2,248,700 | 1,862,244 | ||||||
| Non-banks |
5,142 | 11,388 | ||||||
| Other assets |
112,353 | 90,872 | ||||||
|
|
|
|
|
|||||
| Total assets |
$ | 2,416,864 | $ | 2,062,671 | ||||
|
|
|
|
|
|||||
| Liabilities and Shareholders’ Equity |
||||||||
| Other liabilities |
$ | 31,768 | $ | 33,407 | ||||
| Other borrowings |
230,699 | 214,847 | ||||||
| Shareholders’ equity |
2,154,397 | 1,814,417 | ||||||
|
|
|
|
|
|||||
| Total liabilities and shareholders’ equity |
$ | 2,416,864 | $ | 2,062,671 | ||||
|
|
|
|
|
|||||
OLD NATIONAL BANCORP (PARENT COMPANY ONLY)
CONDENSED STATEMENTS OF INCOME
| Years Ended December 31, | ||||||||||||
| (dollars in thousands) |
2017 | 2016 | 2015 | |||||||||
| Income |
||||||||||||
| Dividends from affiliates |
$ | 100,000 | $ | 160,007 | $ | 67,717 | ||||||
| Net securities gains |
667 | 100 | 6 | |||||||||
| Other income |
1,966 | 40,841 | 1,892 | |||||||||
| Other income from affiliates |
5 | 6 | 51 | |||||||||
|
|
|
|
|
|
|
|||||||
| Total income |
102,638 | 200,954 | 69,666 | |||||||||
|
|
|
|
|
|
|
|||||||
| Expense |
||||||||||||
| Interest on borrowings |
9,298 | 9,077 | 8,684 | |||||||||
| Other expenses |
16,335 | 18,460 | 13,957 | |||||||||
|
|
|
|
|
|
|
|||||||
| Total expense |
25,633 | 27,537 | 22,641 | |||||||||
|
|
|
|
|
|
|
|||||||
| Income before income taxes and equity in undistributed earnings of affiliates |
77,005 | 173,417 | 47,025 | |||||||||
| Income tax expense (benefit) |
(6,240 | ) | 11,952 | (5,473 | ) | |||||||
|
|
|
|
|
|
|
|||||||
| Income before equity in undistributed earnings of affiliates |
83,245 | 161,465 | 52,498 | |||||||||
| Equity in undistributed earnings of affiliates |
12,480 | (27,201 | ) | 64,218 | ||||||||
|
|
|
|
|
|
|
|||||||
| Net income |
$ | 95,725 | $ | 134,264 | $ | 116,716 | ||||||
|
|
|
|
|
|
|
|||||||
135
Table of Contents
OLD NATIONAL BANCORP (PARENT COMPANY ONLY)
CONDENSED STATEMENT OF CASH FLOWS
| Years Ended December 31, | ||||||||||||
| (dollars in thousands) |
2017 | 2016 | 2015 | |||||||||
| Cash Flows From Operating Activities |
||||||||||||
| Net income |
$ | 95,725 | $ | 134,264 | $ | 116,716 | ||||||
|
|
|
|
|
|
|
|||||||
| Adjustments to reconcile net income to cash provided by operating activities: |
||||||||||||
| Depreciation |
36 | 29 | 20 | |||||||||
| Net securities (gains) losses |
(667 | ) | (100 | ) | (6 | ) | ||||||
| Gain on sale of ONB Insurance Group, Inc. |
— | (41,864 | ) | — | ||||||||
| Stock-based compensation expense |
6,275 | 7,318 | 4,255 | |||||||||
| (Increase) decrease in other assets |
(24,004 | ) | (3,958 | ) | 6,307 | |||||||
| Increase (decrease) in other liabilities |
3,968 | (225 | ) | 1,441 | ||||||||
| Equity in undistributed earnings of affiliates |
(12,480 | ) | 27,201 | (64,218 | ) | |||||||
|
|
|
|
|
|
|
|||||||
| Total adjustments |
(26,872 | ) | (11,599 | ) | (52,201 | ) | ||||||
|
|
|
|
|
|
|
|||||||
| Net cash flows provided by (used in) operating activities |
68,853 | 122,665 | 64,515 | |||||||||
|
|
|
|
|
|
|
|||||||
| Cash Flows From Investing Activities |
||||||||||||
| Net cash and cash equivalents of acquisitions |
(24,005 | ) | (100,220 | ) | (41,070 | ) | ||||||
| Proceeds from sale of ONB Insurance Group, Inc. |
— | 91,771 | — | |||||||||
| Purchases of investment securities |
(62 | ) | (52 | ) | (1,053 | ) | ||||||
| Net advances to affiliates |
(250 | ) | (3,500 | ) | — | |||||||
| Purchases of premises and equipment |
(485 | ) | (13 | ) | — | |||||||
|
|
|
|
|
|
|
|||||||
| Net cash flows provided by (used in) investing activities |
(24,802 | ) | (12,014 | ) | (42,123 | ) | ||||||
|
|
|
|
|
|
|
|||||||
| Cash Flows From Financing Activities |
||||||||||||
| Payments for maturities/redemptions of other borrowings |
(19,856 | ) | — | — | ||||||||
| Cash dividends paid on common stock |
(72,604 | ) | (67,536 | ) | (55,552 | ) | ||||||
| Common stock repurchased |
(2,762 | ) | (2,202 | ) | (88,695 | ) | ||||||
| Proceeds from exercise of stock options |
2,655 | 2,349 | 997 | |||||||||
| Common stock issued |
404 | 388 | 391 | |||||||||
|
|
|
|
|
|
|
|||||||
| Net cash flows provided by (used in) financing activities |
(92,163 | ) | (67,001 | ) | (142,859 | ) | ||||||
|
|
|
|
|
|
|
|||||||
| Net increase (decrease) in cash and cash equivalents |
(48,112 | ) | 43,650 | (120,467 | ) | |||||||
| Cash and cash equivalents at beginning of period |
91,650 | 48,000 | 168,467 | |||||||||
|
|
|
|
|
|
|
|||||||
| Cash and cash equivalents at end of period |
$ | 43,538 | $ | 91,650 | $ | 48,000 | ||||||
|
|
|
|
|
|
|
|||||||
During the second quarter of 2016, Old National sold its insurance operations, ONI. During the year ended December 31, 2015, the insurance segment’s net income was $2.1 million and its assets totaled $61.8 million at December 31, 2015. In conjunction with the divestiture, Old National re-evaluated its business segments.
Operating segments are components of an enterprise about which separate financial information is available that is evaluated regularly by the chief operating decision maker in deciding how to allocate resources and in assessing performance. Old National Bank, Old National’s bank subsidiary, is the only significant subsidiary upon which management makes decisions regarding how to allocate resources and assess performance. Each of the branches of Old National Bank provide a group of similar community banking services, including such products and services as commercial, real estate and consumer loans, time deposits, checking and savings accounts, cash management, brokerage, trust, and investment advisory services. The individual bank branches located throughout our Midwest footprint have similar operating and economic characteristics. While the chief decision maker monitors the revenue streams of the various products, services, and regional locations, operations are managed and financial performance is evaluated on a Company-wide basis. Accordingly, all of the community banking services and branch locations are considered by management to be aggregated into one reportable operating segment, community banking.
136
Table of Contents
NOTE 27 – INTERIM FINANCIAL DATA (UNAUDITED)
The following table details the quarterly results of operations for the years ended December 31, 2017 and 2016.
| (unaudited, dollars and shares in thousands, except per share data) |
Three Months Ended | Three Months Ended | ||||||||||||||||||||||||||||||
| 12/31/2017 | 9/30/2017 | 6/30/2017 | 3/31/2017 | 12/31/2016 | 9/30/2016 | 6/30/2016 | 3/31/2016 | |||||||||||||||||||||||||
| Interest income |
$ | 135,134 | $ | 123,525 | $ | 118,209 | $ | 118,468 | $ | 121,849 | $ | 119,713 | $ | 110,243 | $ | 95,329 | ||||||||||||||||
| Interest expense |
16,578 | 15,047 | 13,876 | 12,667 | 11,932 | 11,910 | 10,903 | 9,686 | ||||||||||||||||||||||||
|
|
|
|
|
|
|
|
|
|
|
|
|
|
|
|
|
|||||||||||||||||
| Net interest income |
118,556 | 108,478 | 104,333 | 105,801 | 109,917 | 107,803 | 99,340 | 85,643 | ||||||||||||||||||||||||
| Provision for loan losses |
1,037 | 311 | 1,355 | 347 | (1,756 | ) | 1,306 | 1,319 | 91 | |||||||||||||||||||||||
| Noninterest income |
44,825 | 46,366 | 49,271 | 42,920 | 62,751 | 47,243 | 93,385 | 49,451 | ||||||||||||||||||||||||
| Noninterest expense |
140,432 | 103,702 | 102,811 | 101,891 | 126,258 | 108,062 | 121,472 | 98,355 | ||||||||||||||||||||||||
|
|
|
|
|
|
|
|
|
|
|
|
|
|
|
|
|
|||||||||||||||||
| Income before income taxes |
21,912 | 50,831 | 49,438 | 46,483 | 48,166 | 45,678 | 69,934 | 36,648 | ||||||||||||||||||||||||
| Income tax expense |
40,405 | 11,459 | 10,584 | 10,491 | 14,710 | 10,969 | 30,812 | 9,671 | ||||||||||||||||||||||||
|
|
|
|
|
|
|
|
|
|
|
|
|
|
|
|
|
|||||||||||||||||
| Net income (loss) |
$ | (18,493 | ) | $ | 39,372 | $ | 38,854 | $ | 35,992 | $ | 33,456 | $ | 34,709 | $ | 39,122 | $ | 26,977 | |||||||||||||||
|
|
|
|
|
|
|
|
|
|
|
|
|
|
|
|
|
|||||||||||||||||
| Net income (loss) per share: |
||||||||||||||||||||||||||||||||
| Basic |
$ | (0.13 | ) | $ | 0.30 | $ | 0.28 | $ | 0.27 | $ | 0.25 | $ | 0.25 | $ | 0.31 | $ | 0.24 | |||||||||||||||
| Diluted |
(0.13 | ) | 0.29 | 0.28 | 0.27 | 0.25 | 0.25 | 0.31 | 0.24 | |||||||||||||||||||||||
|
|
|
|
|
|
|
|
|
|
|
|
|
|
|
|
|
|||||||||||||||||
| Average shares: |
||||||||||||||||||||||||||||||||
| Basic |
146,073 | 135,120 | 135,085 | 134,912 | 134,670 | 134,492 | 127,508 | 113,998 | ||||||||||||||||||||||||
| Diluted |
146,875 | 135,796 | 135,697 | 135,431 | 135,383 | 135,011 | 127,973 | 114,563 | ||||||||||||||||||||||||
|
|
|
|
|
|
|
|
|
|
|
|
|
|
|
|
|
|||||||||||||||||
Quarterly results, most notably interest income, noninterest income, and noninterest expense, were impacted by the acquisitions of Anchor (MN) in November 2017 and Anchor (WI) May 2016. In addition, Old National sold its insurance operations, ONI, on May 31, 2016. Income tax expense in the three months ended December 31, 2017 included $39.3 million of additional tax expense to estimate the revaluation of Old National’s deferred tax assets due to the lowering of the federal corporate tax rate to 21%.
| ITEM 9. | CHANGES IN AND DISAGREEMENTS WITH ACCOUNTANTS ON ACCOUNTING AND FINANCIAL DISCLOSURE |
Not applicable.
| ITEM 9A. | CONTROLS AND PROCEDURES |
Conclusion Regarding the Effectiveness of Disclosure Controls and Procedures
Evaluation of disclosure controls and procedures. Old National’s principal executive officer and principal financial officer have concluded that Old National’s disclosure controls and procedures (as defined in Exchange Act Rule 13a-15(e) under the Securities Exchange Act of 1934, as amended), based on their evaluation of these controls and procedures as of the end of the period covered by this annual report on Form 10-K, are effective at the reasonable assurance level as discussed below to ensure that information required to be disclosed by Old National in the reports it files under the Securities Exchange Act of 1934, as amended, is recorded, processed, summarized and reported within the time periods specified in the rules and forms of the SEC and that such information is accumulated and communicated to Old National’s management, including its principal executive officer and principal financial officer, as appropriate to allow timely decisions regarding required disclosure.
Limitations on the Effectiveness of Controls. Management, including the principal executive officer and principal financial officer, does not expect that Old National’s disclosure controls and internal controls will prevent all error and all fraud. A control system, no matter how well conceived and operated, can provide only reasonable, not absolute, assurance that the objectives of the control system are met. Because of the inherent limitations in all control systems, no evaluation of controls can provide absolute assurance that all control issues and instances of fraud, if any, within the company have been detected. These inherent limitations include the realities that judgments in decision-making can be faulty, and that breakdowns can occur because of a simple error or mistake. Additionally, controls can be circumvented by the individual acts of some persons, by collusion of two or more people or by management override of the controls.
137
Table of Contents
The design of any system of controls also is based in part upon certain assumptions about the likelihood of future events, and there can be only reasonable assurance that any design will succeed in achieving its stated goals under all potential future conditions. Over time, control may become inadequate because of changes in conditions or the degree of compliance with the policies or procedures may deteriorate. Because of the inherent limitations in a cost-effective control system, misstatements due to error or fraud may occur and not be detected.
Changes in Internal Control over Financial Reporting. There were no changes in Old National’s internal control over financial reporting that occurred during the period covered by this report that have materially affected, or are reasonably likely to materially affect, Old National’s internal control over financial reporting.
| ITEM 9B. | OTHER INFORMATION |
None.
138
Table of Contents
PART III
ITEM 10. DIRECTORS, EXECUTIVE OFFICERS AND CORPORATE GOVERNANCE OF THE REGISTRANT
This information is omitted from this report pursuant to General Instruction G.(3) of Form 10-K as Old National will file with the SEC its definitive Proxy Statement pursuant to Regulation 14A of the Securities Exchange Act of 1934, as amended, not later than 120 days after December 31, 2017. The applicable information appearing in the Proxy Statement for the 2018 annual meeting is incorporated by reference.
Old National has adopted a code of ethics that applies to directors, officers, and all other employees including Old National’s principal executive officer, principal financial officer and principal accounting officer. The text of the code of ethics is available on Old National’s Internet website at www.oldnational.com or in print to any shareholder who requests it. Old National intends to post information regarding any amendments to, or waivers from, its code of ethics on its Internet website.
ITEM 11. EXECUTIVE COMPENSATION
This information is omitted from this report pursuant to General Instruction G.(3) of Form 10-K as Old National will file with the SEC its definitive Proxy Statement pursuant to Regulation 14A of the Securities Exchange Act of 1934, as amended, not later than 120 days after December 31, 2017. The applicable information appearing in our Proxy Statement for the 2018 annual meeting is incorporated by reference.
ITEM 12. SECURITY OWNERSHIP OF CERTAIN BENEFICIAL OWNERS AND MANAGEMENT AND RELATED STOCKHOLDER MATTERS
This information is omitted from this report, (with the exception of the “Equity Compensation Plan Information,” which is reported in Item 5 of this report and is incorporated herein by reference) pursuant to General Instruction G.(3) of Form 10-K as Old National will file with the SEC its definitive Proxy Statement pursuant to Regulation 14A of the Securities Exchange Act of 1934, as amended, not later than 120 days after December 31, 2017. The applicable information appearing in the Proxy Statement for the 2018 annual meeting is incorporated by reference.
ITEM 13. CERTAIN RELATIONSHIPS AND RELATED TRANSACTIONS, AND DIRECTOR INDEPENDENCE
This information is omitted from this report pursuant to General Instruction G.(3) of Form 10-K as Old National will file with the SEC its definitive Proxy Statement pursuant to Regulation 14A of the Securities Exchange Act of 1934, as amended, not later than 120 days after December 31, 2017. The applicable information appearing in the Proxy Statement for the 2018 annual meeting is incorporated by reference.
ITEM 14. PRINCIPAL ACCOUNTANT FEES AND SERVICES
This information is omitted from this report pursuant to General Instruction G.(3) of Form 10-K as Old National will file with the SEC its definitive Proxy Statement pursuant to Regulation 14A of the Securities Exchange Act of 1934, as amended, not later than 120 days after December 31, 2017. The applicable information appearing in the Proxy Statement for the 2018 annual meeting is incorporated by reference.
139
Table of Contents
PART IV
| ITEM 15. | EXHIBITS AND FINANCIAL STATEMENT SCHEDULES |
| 1. | Financial Statements: |
The following consolidated financial statements of the registrant and its subsidiaries are filed as part of this document under “Item 8. Financial Statements and Supplementary Data.”
Report of Independent Registered Public Accounting Firm
Consolidated Balance Sheets – December 31, 2017 and 2016
Consolidated Statements of Income – Years Ended December 31, 2017, 2016, and 2015
Consolidated Statements of Comprehensive Income – Years Ended December 31, 2017, 2016, and 2015
Consolidated Statements of Changes in Shareholders’ Equity – Years Ended December 31, 2017, 2016, and 2015
Consolidated Statements of Cash Flows – Years Ended December 31, 2017, 2016, and 2015
Notes to Consolidated Financial Statements
| 2. | Financial Statement Schedules |
The schedules for Old National and its subsidiaries are omitted because of the absence of conditions under which they are required, or because the information is set forth in the consolidated financial statements or the notes thereto.
| 3. | Exhibits |
The exhibits filed as part of this report and exhibits incorporated herein by reference to other documents are as follows:
140
Table of Contents
141
Table of Contents
| * | Management contract or compensatory plan or arrangement |
142
Table of Contents
Pursuant to the requirements of Section 13 or 15(d) of the Securities Exchange Act of 1934, Old National has duly caused this report to be signed on its behalf by the undersigned, thereunto duly authorized.
OLD NATIONAL BANCORP
| By: | /s/ Robert G. Jones | Date: | February 15, 2018 | |||||
| Robert G. Jones, | ||||||||
| Chairman and Chief Executive Officer (Principal Executive Officer) |
||||||||
Pursuant to the requirements of the Securities Exchange Act of 1934, this report has been signed below on February 15, 2018, by the following persons on behalf of Old National and in the capacities indicated.
| By: | /s/ Alan W. Braun | By: | /s/ James C. Ryan, III | |||||
| Alan W. Braun, Director | James C. Ryan, III, | |||||||
| Senior Executive Vice President and Chief | ||||||||
| Financial Officer (Principal Financial Officer) | ||||||||
| By: | /s/ Niel C. Ellerbrook | |||||||
| Niel C. Ellerbrook, Director | ||||||||
| By: | /s/ Randall T. Shepard | |||||||
| By: | /s/ Andrew E. Goebel | Randall T. Shepard, Director | ||||||
| Andrew E. Goebel, Director | ||||||||
| By: | /s/ Rebecca S. Skillman | |||||||
| By: | /s/ Jerome F. Henry Jr. | Rebecca S. Skillman, Lead Director | ||||||
| Jerome F. Henry Jr., Director | ||||||||
| By: | /s/ Kelly N. Stanley | |||||||
| By: | /s/ Robert G. Jones | Kelly N. Stanley, Director | ||||||
| Robert G. Jones, | ||||||||
| Chairman and Chief Executive Officer | By: | /s/ Derrick J. Stewart | ||||||
| (Principal Executive Officer) | Derrick J. Stewart, Director | |||||||
| By: | /s/ Phelps L. Lambert | By: | /s/ Katherine E. White | |||||
| Phelps L. Lambert, Director | Katherine E. White, Director | |||||||
| By: | /s/ Arthur H. McElwee Jr. | By: | /s/ Linda E. White | |||||
| Arthur H. McElwee Jr., Director | Linda E. White, Director | |||||||
| By: | /s/ James T. Morris | By: | /s/ Michael W. Woods | |||||
| James T. Morris, Director | Michael W. Woods, | |||||||
| Senior Vice President and Corporate Controller | ||||||||
| (Principal Accounting Officer) | ||||||||
143