Attached files
| file | filename |
|---|---|
| 8-K - 8-K - CF Industries Holdings, Inc. | a18-6196_18k.htm |
1 2017 Third Quarter Financial Results November 1, 2017 NYSE: CF 2017 Full Year and Fourth Quarter Financial Results February 14, 2018 NYSE: CF
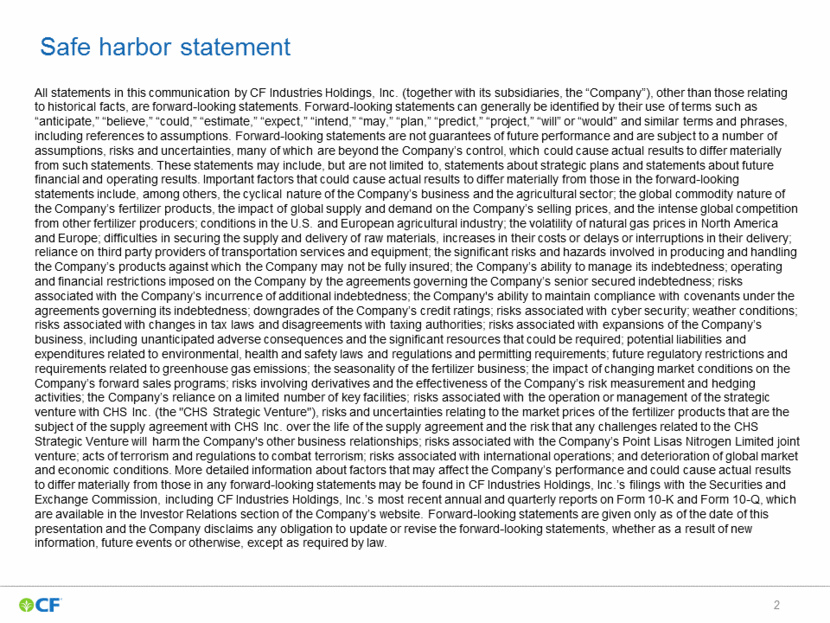
Safe harbor statement All statements in this communication by CF Industries Holdings, Inc. (together with its subsidiaries, the “Company”), other than those relating to historical facts, are forward-looking statements. Forward-looking statements can generally be identified by their use of terms such as “anticipate,” “believe,” “could,” “estimate,” “expect,” “intend,” “may,” “plan,” “predict,” “project,” “will” or “would” and similar terms and phrases, including references to assumptions. Forward-looking statements are not guarantees of future performance and are subject to a number of assumptions, risks and uncertainties, many of which are beyond the Company’s control, which could cause actual results to differ materially from such statements. These statements may include, but are not limited to, statements about strategic plans and statements about future financial and operating results. Important factors that could cause actual results to differ materially from those in the forward-looking statements include, among others, the cyclical nature of the Company’s business and the agricultural sector; the global commodity nature of the Company’s fertilizer products, the impact of global supply and demand on the Company’s selling prices, and the intense global competition from other fertilizer producers; conditions in the U.S. and European agricultural industry; the volatility of natural gas prices in North America and Europe; difficulties in securing the supply and delivery of raw materials, increases in their costs or delays or interruptions in their delivery; reliance on third party providers of transportation services and equipment; the significant risks and hazards involved in producing and handling the Company’s products against which the Company may not be fully insured; the Company’s ability to manage its indebtedness; operating and financial restrictions imposed on the Company by the agreements governing the Company’s senior secured indebtedness; risks associated with the Company’s incurrence of additional indebtedness; the Company's ability to maintain compliance with covenants under the agreements governing its indebtedness; downgrades of the Company’s credit ratings; risks associated with cyber security; weather conditions; risks associated with changes in tax laws and disagreements with taxing authorities; risks associated with expansions of the Company’s business, including unanticipated adverse consequences and the significant resources that could be required; potential liabilities and expenditures related to environmental, health and safety laws and regulations and permitting requirements; future regulatory restrictions and requirements related to greenhouse gas emissions; the seasonality of the fertilizer business; the impact of changing market conditions on the Company’s forward sales programs; risks involving derivatives and the effectiveness of the Company’s risk measurement and hedging activities; the Company’s reliance on a limited number of key facilities; risks associated with the operation or management of the strategic venture with CHS Inc. (the "CHS Strategic Venture"), risks and uncertainties relating to the market prices of the fertilizer products that are the subject of the supply agreement with CHS Inc. over the life of the supply agreement and the risk that any challenges related to the CHS Strategic Venture will harm the Company's other business relationships; risks associated with the Company’s Point Lisas Nitrogen Limited joint venture; acts of terrorism and regulations to combat terrorism; risks associated with international operations; and deterioration of global market and economic conditions. More detailed information about factors that may affect the Company’s performance and could cause actual results to differ materially from those in any forward-looking statements may be found in CF Industries Holdings, Inc.’s filings with the Securities and Exchange Commission, including CF Industries Holdings, Inc.’s most recent annual and quarterly reports on Form 10-K and Form 10-Q, which are available in the Investor Relations section of the Company’s website. Forward-looking statements are given only as of the date of this presentation and the Company disclaims any obligation to update or revise the forward-looking statements, whether as a result of new information, future events or otherwise, except as required by law.
Note regarding non-GAAP financial measures The company reports its financial results in accordance with U.S. generally accepted accounting principles (GAAP). Management believes that EBITDA, adjusted EBITDA, adjusted net (loss) earnings, adjusted net (loss) earnings per diluted share, controllable cost of sales, controllable cost of sales per ton, and, on a segment basis, adjusted gross margin and adjusted gross margin per nutrient ton, which are non-GAAP financial measures, provide additional meaningful information regarding the company's performance and financial strength. Non-GAAP financial measures should be viewed in addition to, and not as an alternative for, the company's reported results prepared in accordance with GAAP. In addition, because not all companies use identical calculations, EBITDA, adjusted EBITDA, adjusted net (loss) earnings, adjusted net (loss) earnings per diluted share, controllable cost of sales, controllable cost of sales per ton, adjusted gross margin, and adjusted gross margin per nutrient ton included in this presentation may not be comparable to similarly titled measures of other companies. Reconciliations of EBITDA, adjusted EBITDA, adjusted net (loss) earnings, adjusted net (loss) earnings per diluted share, controllable cost of sales, controllable cost of sales per ton, adjusted gross margin, and adjusted gross margin per nutrient ton to the most directly comparable GAAP measures are provided in the tables accompanying this presentation. EBITDA is defined as net earnings (loss) attributable to common stockholders plus interest expense - net, income taxes, and depreciation and amortization. Other adjustments include the elimination of loan fee amortization that is included in both interest and amortization, and the portion of depreciation that is included in noncontrolling interests. The company has presented EBITDA because management uses the measure to track performance and believes that it is frequently used by securities analysts, investors and other interested parties in the evaluation of companies in the industry. Adjusted EBITDA is defined as EBITDA adjusted with the selected items included in EBITDA as summarized in the tables accompanying this presentation. The company has presented adjusted EBITDA because management uses adjusted EBITDA, and believes it is useful to investors, as a supplemental financial measure in the comparison of year-over-year performance. Adjusted net (loss) earnings is defined as net earnings (loss) attributable to common stockholders adjusted with the impacts of the selected items included in net earnings (loss) as summarized in the tables accompanying this presentation. The company has presented adjusted net (loss) earnings and adjusted net (loss) earnings per diluted share because management uses these measures, and believes they are useful to investors, as supplemental financial measures in the comparison of year-over-year performance. Adjusted gross margin is defined as gross margin excluding depreciation and amortization and unrealized net mark-to-market (gain) loss on natural gas derivatives. The company has presented adjusted gross margin because management uses this measure, and believes it is useful to investors, as a supplemental financial measure in the comparison of year-over-year performance. Controllable cost of sales is defined as cost of sales adjusted for natural gas costs, realized and unrealized losses (gains) on natural gas derivatives, depreciation and amortization and start-up costs related to the company’s Donaldsonville and Port Neal plants. The company has presented controllable cost of sales and controllable cost of sales per ton because management uses these measures, and believes they are useful to investors, as supplemental financial measures in the comparison of year-over-year performance.
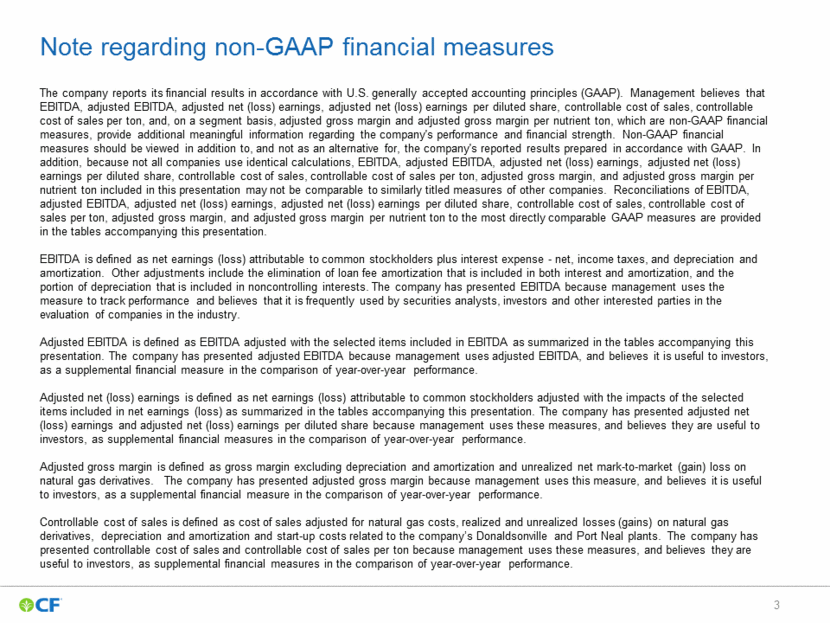
Table of contents Safe Harbor Statement/Note Regarding Non-GAAP Financial Measures 2-3 Overview of Financial Results 5-18 Emerging Global Tradeflows 19-29 Capital Allocation and Structure 30-32 Appendix 33-40 Cover Page: Donaldsonville urea complex
Port Neal truck load out Overview of Financial Results
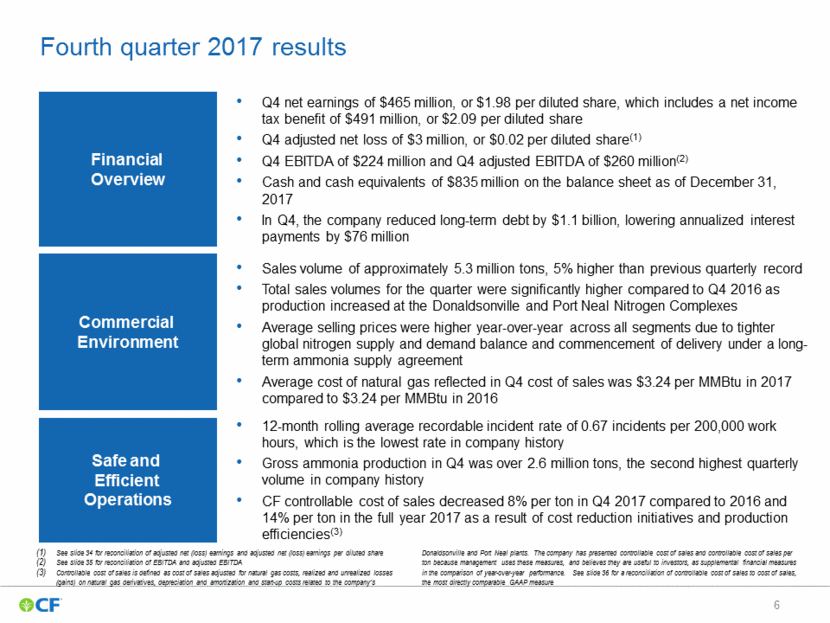
Fourth quarter 2017 results See slide 34 for reconciliation of adjusted net (loss) earnings and adjusted net (loss) earnings per diluted share See slide 35 for reconciliation of EBITDA and adjusted EBITDA Controllable cost of sales is defined as cost of sales adjusted for natural gas costs, realized and unrealized losses (gains) on natural gas derivatives, depreciation and amortization and start-up costs related to the company’s Donaldsonville and Port Neal plants. The company has presented controllable cost of sales and controllable cost of sales per ton because management uses these measures, and believes they are useful to investors, as supplemental financial measures in the comparison of year-over-year performance. See slide 36 for a reconciliation of controllable cost of sales to cost of sales, the most directly comparable GAAP measure Q4 net earnings of $465 million, or $1.98 per diluted share, which includes a net income tax benefit of $491 million, or $2.09 per diluted share Q4 adjusted net loss of $3 million, or $0.02 per diluted share(1) Q4 EBITDA of $224 million and Q4 adjusted EBITDA of $260 million(2) Cash and cash equivalents of $835 million on the balance sheet as of December 31, 2017 In Q4, the company reduced long-term debt by $1.1 billion, lowering annualized interest payments by $76 million Financial Overview Safe and Efficient Operations 12-month rolling average recordable incident rate of 0.67 incidents per 200,000 work hours, which is the lowest rate in company history Gross ammonia production in Q4 was over 2.6 million tons, the second highest quarterly volume in company history CF controllable cost of sales decreased 8% per ton in Q4 2017 compared to 2016 and 14% per ton in the full year 2017 as a result of cost reduction initiatives and production efficiencies(3) Commercial Environment Sales volume of approximately 5.3 million tons, 5% higher than previous quarterly record Total sales volumes for the quarter were significantly higher compared to Q4 2016 as production increased at the Donaldsonville and Port Neal Nitrogen Complexes Average selling prices were higher year-over-year across all segments due to tighter global nitrogen supply and demand balance and commencement of delivery under a long-term ammonia supply agreement Average cost of natural gas reflected in Q4 cost of sales was $3.24 per MMBtu in 2017 compared to $3.24 per MMBtu in 2016
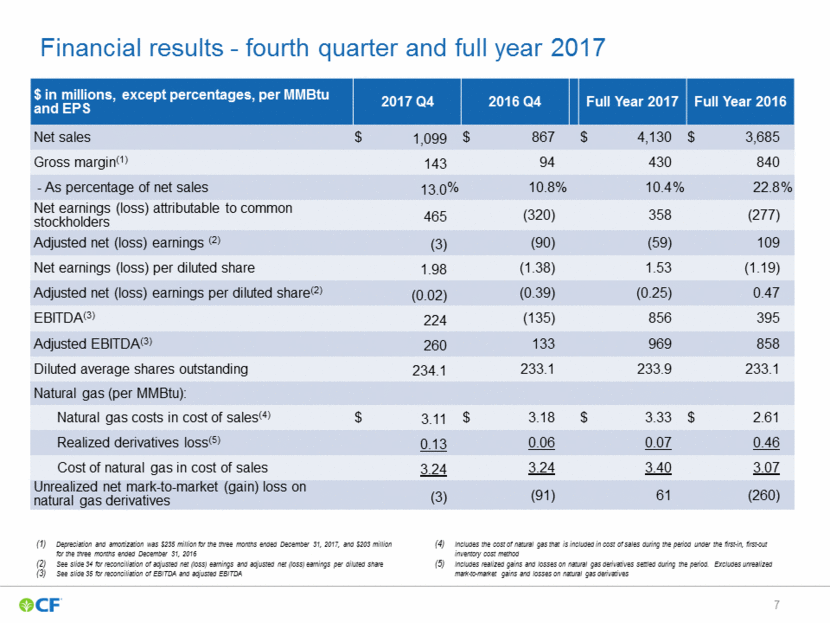
Financial results - fourth quarter and full year 2017 Depreciation and amortization was $235 million for the three months ended December 31, 2017, and $203 million for the three months ended December 31, 2016 See slide 34 for reconciliation of adjusted net (loss) earnings and adjusted net (loss) earnings per diluted share See slide 35 for reconciliation of EBITDA and adjusted EBITDA Includes the cost of natural gas that is included in cost of sales during the period under the first-in, first-out inventory cost method Includes realized gains and losses on natural gas derivatives settled during the period. Excludes unrealized mark-to-market gains and losses on natural gas derivatives $ in millions, except percentages, per MMBtu and EPS 2017 Q4 2016 Q3 2016 Q4 2015 Q3 Full Year 2017 2016 YTD Full Year 2016 2015 YTD Net sales $ 1,099 $ 867 $ 4,130 $ 3,685 Gross margin(1) 143 94 430 840 - As percentage of net sales 13.0 % 10.8 % 10.4 % 22.8 % Net earnings (loss) attributable to common stockholders 465 (320) 358 (277) Adjusted net (loss) earnings (2) (3) (90) (59) 109 Net earnings (loss) per diluted share 1.98 (1.38) 1.53 (1.19) Adjusted net (loss) earnings per diluted share(2) (0.02) (0.39) (0.25) 0.47 EBITDA(3) 224 (135) 856 395 Adjusted EBITDA(3) 260 133 969 858 Diluted average shares outstanding 234.1 233.1 233.9 233.1 Natural gas (per MMBtu): Natural gas costs in cost of sales(4) $ 3.11 $ 3.18 $ 3.33 $ 2.61 Realized derivatives loss(5) 0.13 0.06 0.07 0.46 Cost of natural gas in cost of sales 3.24 3.24 3.40 3.07 Unrealized net mark-to-market (gain) loss on natural gas derivatives (3) (91) 61 (260)
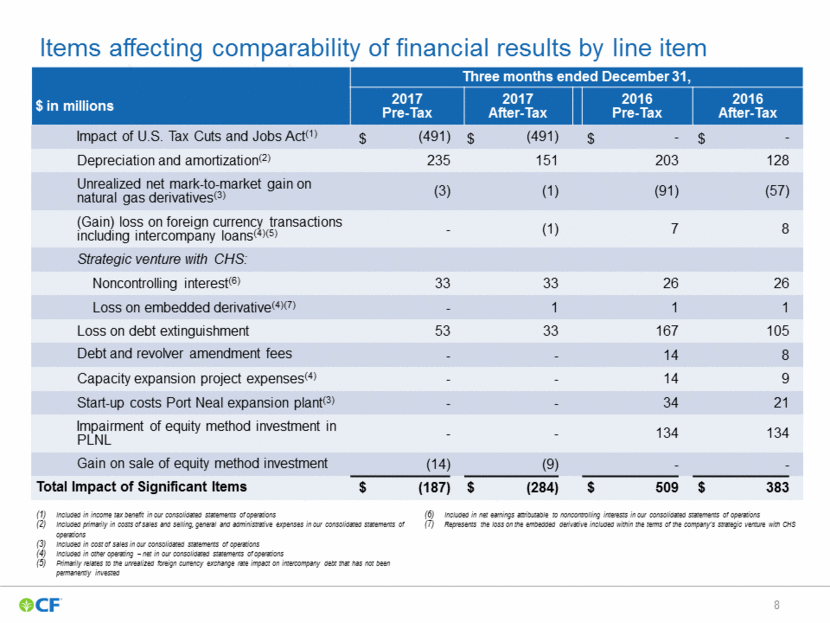
Items affecting comparability of financial results by line item Three months ended December 31, $ in millions 2017 Pre-Tax 2016 Q3 2017 After-Tax 2015 Q3 2016 Pre-Tax 2016 Q3 2016 After-Tax 2015 Q3 Impact of U.S. Tax Cuts and Jobs Act(1) $ (491) $ (491) $ - $ - Depreciation and amortization(2) 235 151 203 128 Unrealized net mark-to-market gain on natural gas derivatives(3) (3) (1) (91) (57) (Gain) loss on foreign currency transactions including intercompany loans(4)(5) - (1) 7 8 Strategic venture with CHS: Noncontrolling interest(6) 33 33 26 26 Loss on embedded derivative(4)(7) - 1 1 1 Loss on debt extinguishment 53 33 167 105 Debt and revolver amendment fees - - 14 8 Capacity expansion project expenses(4) - - 14 9 Start-up costs Port Neal expansion plant(3) - - 34 21 Impairment of equity method investment in PLNL - - 134 134 Gain on sale of equity method investment (14) (9) - - Total Impact of Significant Items $ (187) $ (284) $ 509 $ 383 Included in income tax benefit in our consolidated statements of operations Included primarily in costs of sales and selling, general and administrative expenses in our consolidated statements of operations Included in cost of sales in our consolidated statements of operations Included in other operating – net in our consolidated statements of operations Primarily relates to the unrealized foreign currency exchange rate impact on intercompany debt that has not been permanently invested Included in net earnings attributable to noncontrolling interests in our consolidated statements of operations Represents the loss on the embedded derivative included within the terms of the company’s strategic venture with CHS
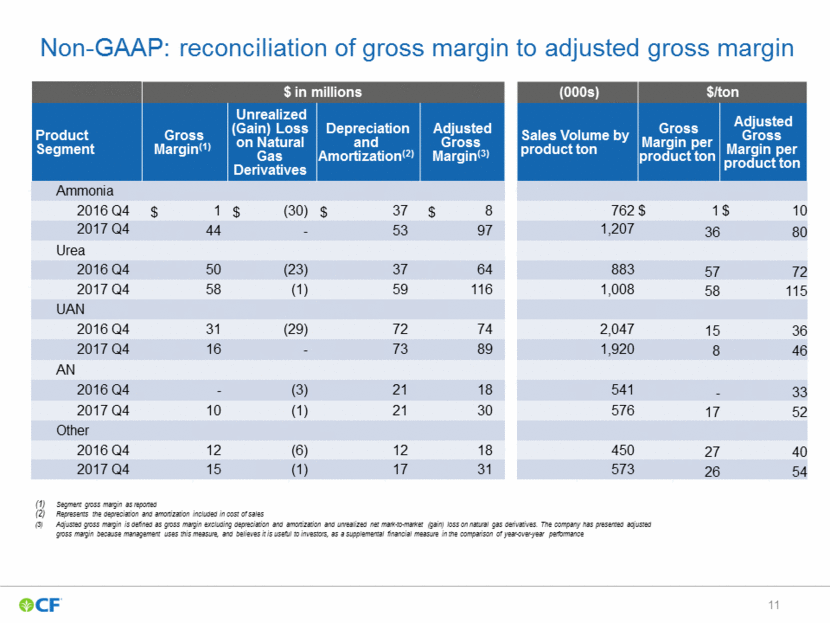
Items affecting comparability of financial results by line item Year ended December 31, $ in millions 2017 Pre-Tax 2016 Q3 2017 After-Tax 2015 Q3 2016 Pre-Tax 2016 Q3 2016 After-Tax 2015 Q3 Impact of U.S. Tax Cuts and Jobs Act(1) $ (491) $ (491) $ - $ - Depreciation and amortization(2) 883 558 678 426 Unrealized net mark-to-market loss (gain) on natural gas derivatives(3) 61 39 (260) (163) Loss on foreign currency transactions including intercompany loans(4)(5) 2 1 93 93 Equity method investment tax contingency accrual(6) 7 7 - - Strategic venture with CHS: Noncontrolling interest(7) 73 73 93 93 Loss on embedded derivative(4)(8) 4 3 23 14 Loss on debt extinguishment 53 33 167 105 Debt and revolver amendment fees - - 18 11 Capacity expansion project expenses(4) - - 73 46 Start-up costs Donaldsonville/Port Neal expansion plants(3) - - 52 32 Transaction costs and termination agreement with OCI: Transaction costs(9) - - 179 96 Financing costs related to bridge loan commitment fee(10) - - 28 18 Impairment of equity method investment in PLNL - - 134 134 Gain on sale of equity method investment (14) (9) - - Total Impact of Significant Items $ 578 $ 214 $ 1,278 $ 905 Included in income tax benefit in our consolidated statements of operations Included primarily in costs of sales and selling, general and administrative expenses in our consolidated statements of operations Included in cost of sales in our consolidated statements of operations Included in other operating – net in our consolidated statements of operations Primarily relates to the unrealized foreign currency exchange rate impact on intercompany debt that has not been permanently invested Represents an accrual on the books of Point Lisas Nitrogen Ltd.(PLNL), the company's Trinidad joint venture, for a disputed tax assessment. Amount reflects the company’s 50 percent equity interest in PLNL. This is included in equity in earnings (losses) of operating affiliates in our consolidated statements of operations Included in net earnings attributable to noncontrolling interests in our consolidated statements of operations Represents the loss on the embedded derivative included within the terms of the company’s strategic venture with CHS Transaction costs relate to costs of various consulting and legal services associated with the company’s proposed combination with certain businesses of OCI and the company’s strategic venture with CHS Included in interest expense in our consolidated statements of operations
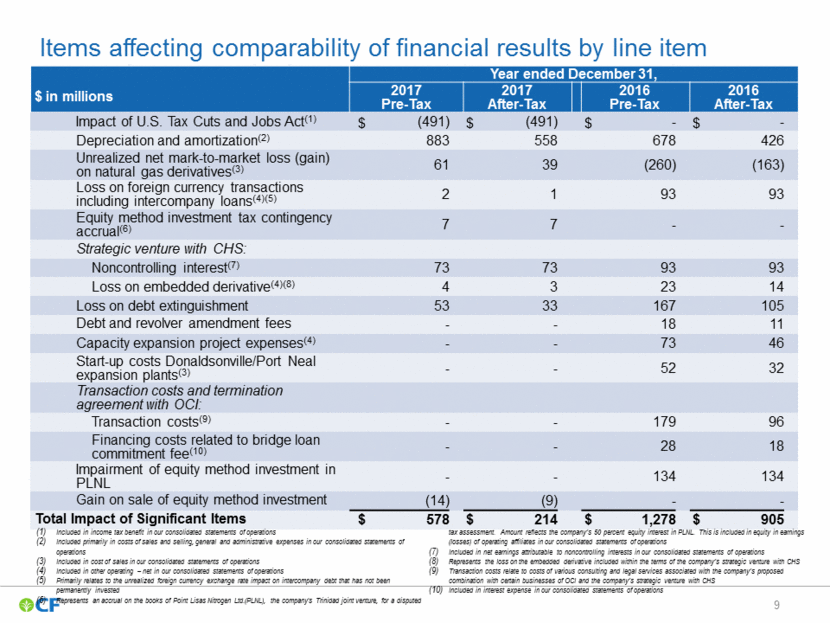
Segment adjusted gross margin Q4 Adjusted Gross Margin by Segment(1) $M See slide 11 for a reconciliation of adjusted gross margin to gross margin, the most directly comparable GAAP measure Represents depreciation and amortization included in cost of sales Unrealized gains are subtracted from gross margin in calculating adjusted gross margin, unrealized losses are added to gross margin in calculating adjusted gross margin Segment gross margin as reported Ammonia Urea UAN AN Other $M $M $M $M $74 $89 D&A(2) Unrealized gain on natural gas derivatives(3) Gross Margin(4) 2016 Q4 2017 Q4 2016 Q4 2017 Q4 2017 Q4 2016 Q4 2016 Q4 2017 Q4 2016 Q4 2017 Q4 Gross Margin 1 44 50 58 31 16 0 10 12 15 Adj. Gross Margin 8 97 64 116 74 89 18 30 18 31 Gross Margin per nutrient ton 2 44 123 125 48 26 - 52 138 134 Adj. Gross Margin per nutrient ton 13 98 158 251 114 147 99 155 207 277 -30 -20 -10 0 10 20 30 40 50 60 70 80 90 100 $ 8 $97 -30 -15 0 15 30 45 60 75 90 -25 0 25 50 75 100 125 $64 $116 -5 0 5 10 15 20 25 30 $18 $30 -6 0 6 12 18 24 30 36 $18 $31
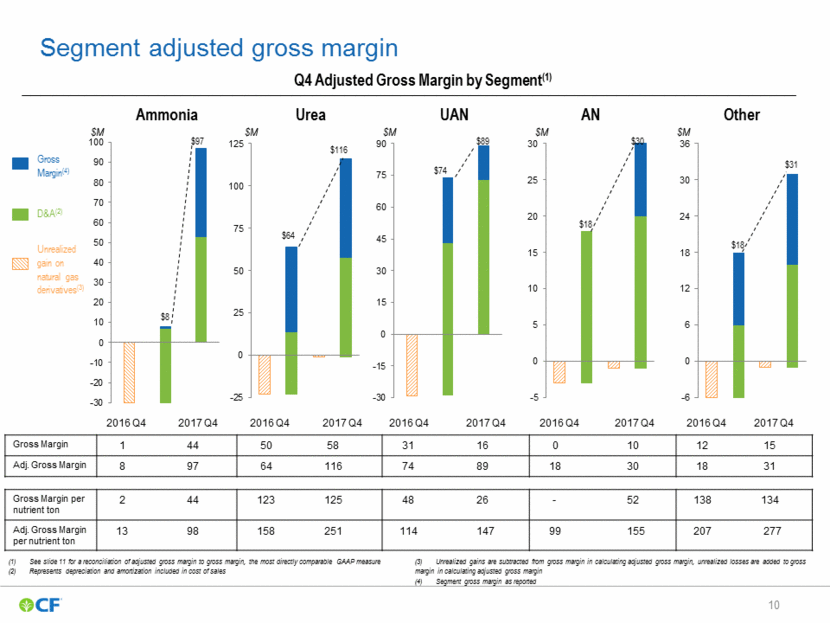
Non-GAAP: reconciliation of gross margin to adjusted gross margin $ in millions (000s) $/ton Product Segment Gross Margin(1) 2016 Q3 Unrealized (Gain) Loss on Natural Gas Derivatives Depreciation and Amortization(2) 2016 Q3 Adjusted Gross Margin(3) 2015 Q3 Sales Volume by product ton Gross Margin per product ton Adjusted Gross Margin per product ton Ammonia 2016 Q4 $ 1 $ (30) $ 37 $ 8 762 $ 1 $ 10 2017 Q4 44 - 53 97 1,207 36 80 Urea 2016 Q4 50 (23) 37 64 883 57 72 2017 Q4 58 (1) 59 116 1,008 58 115 UAN 2016 Q4 31 (29) 72 74 2,047 15 36 2017 Q4 16 - 73 89 1,920 8 46 AN 2016 Q4 - (3) 21 18 541 - 33 2017 Q4 10 (1) 21 30 576 17 52 Other 2016 Q4 12 (6) 12 18 450 27 40 2017 Q4 15 (1) 17 31 573 26 54 Segment gross margin as reported Represents the depreciation and amortization included in cost of sales Adjusted gross margin is defined as gross margin excluding depreciation and amortization and unrealized net mark-to-market (gain) loss on natural gas derivatives. The company has presented adjusted gross margin because management uses this measure, and believes it is useful to investors, as a supplemental financial measure in the comparison of year-over-year performance
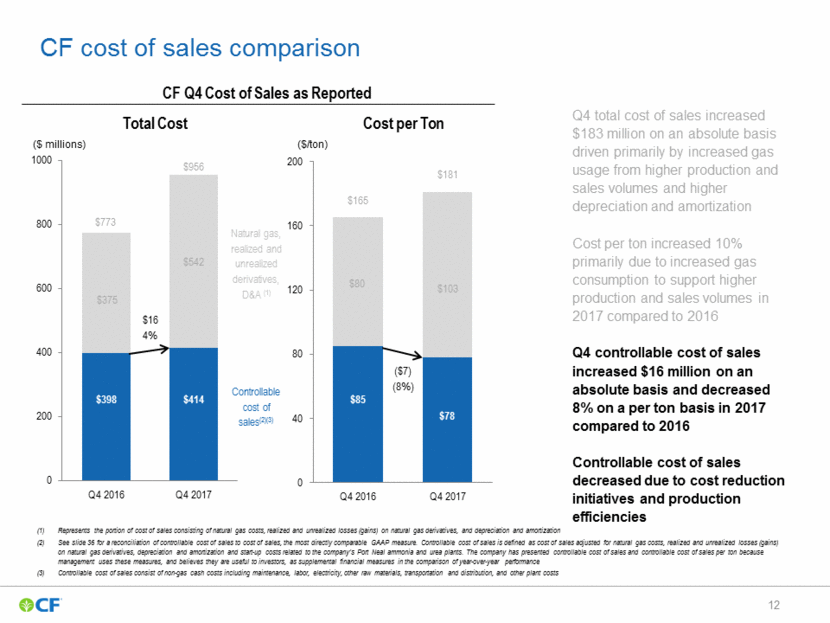
Total Cost Cost per Ton CF cost of sales comparison Represents the portion of cost of sales consisting of natural gas costs, realized and unrealized losses (gains) on natural gas derivatives, and depreciation and amortization See slide 36 for a reconciliation of controllable cost of sales to cost of sales, the most directly comparable GAAP measure. Controllable cost of sales is defined as cost of sales adjusted for natural gas costs, realized and unrealized losses (gains) on natural gas derivatives, depreciation and amortization and start-up costs related to the company’s Port Neal ammonia and urea plants. The company has presented controllable cost of sales and controllable cost of sales per ton because management uses these measures, and believes they are useful to investors, as supplemental financial measures in the comparison of year-over-year performance Controllable cost of sales consist of non-gas cash costs including maintenance, labor, electricity, other raw materials, transportation and distribution, and other plant costs $773 $956 $181 $165 Q4 total cost of sales increased $183 million on an absolute basis driven primarily by increased gas usage from higher production and sales volumes and higher depreciation and amortization Cost per ton increased 10% primarily due to increased gas consumption to support higher production and sales volumes in 2017 compared to 2016 Q4 controllable cost of sales increased $16 million on an absolute basis and decreased 8% on a per ton basis in 2017 compared to 2016 Controllable cost of sales decreased due to cost reduction initiatives and production efficiencies CF Q4 Cost of Sales as Reported Controllable cost of sales(2)(3) Natural gas, realized and unrealized derivatives, D&A (1) $398 $414 $85 $78 $375 $542 $80 $103 $16 4% ($7) (8%) ($ millions) ($/ton) 0 200 400 600 800 1000 Q4 2016 Q4 2017 0 40 80 120 160 200 Q4 2016 Q4 2017
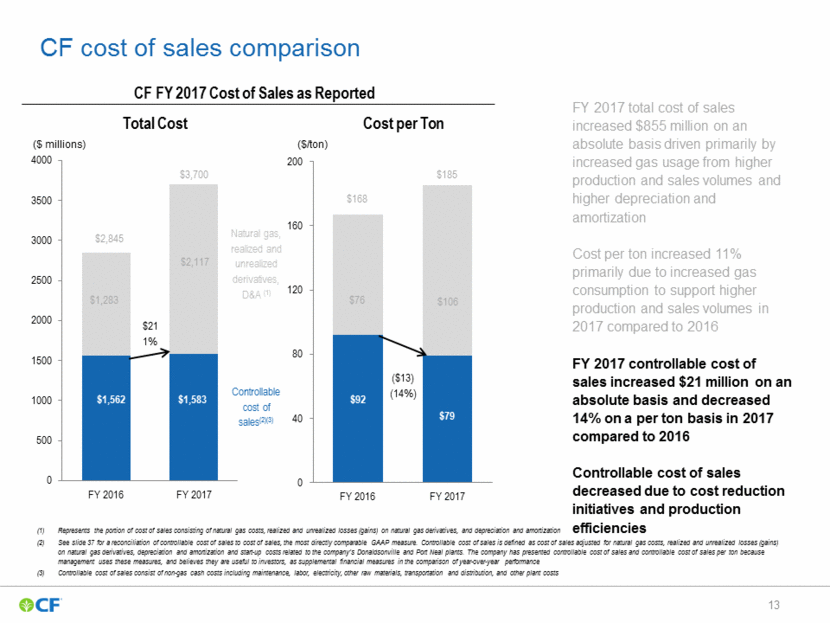
Total Cost Cost per Ton CF cost of sales comparison Represents the portion of cost of sales consisting of natural gas costs, realized and unrealized losses (gains) on natural gas derivatives, and depreciation and amortization See slide 37 for a reconciliation of controllable cost of sales to cost of sales, the most directly comparable GAAP measure. Controllable cost of sales is defined as cost of sales adjusted for natural gas costs, realized and unrealized losses (gains) on natural gas derivatives, depreciation and amortization and start-up costs related to the company’s Donaldsonville and Port Neal plants. The company has presented controllable cost of sales and controllable cost of sales per ton because management uses these measures, and believes they are useful to investors, as supplemental financial measures in the comparison of year-over-year performance Controllable cost of sales consist of non-gas cash costs including maintenance, labor, electricity, other raw materials, transportation and distribution, and other plant costs $2,845 $3,700 $185 $168 FY 2017 total cost of sales increased $855 million on an absolute basis driven primarily by increased gas usage from higher production and sales volumes and higher depreciation and amortization Cost per ton increased 11% primarily due to increased gas consumption to support higher production and sales volumes in 2017 compared to 2016 FY 2017 controllable cost of sales increased $21 million on an absolute basis and decreased 14% on a per ton basis in 2017 compared to 2016 Controllable cost of sales decreased due to cost reduction initiatives and production efficiencies CF FY 2017 Cost of Sales as Reported Controllable cost of sales(2)(3) Natural gas, realized and unrealized derivatives, D&A (1) $1,562 $1,583 $92 $79 $1,283 $2,117 $76 $106 $21 1% ($13) (14%) ($ millions) ($/ton) 0 500 1000 1500 2000 2500 3000 3500 4000 FY 2016 FY 2017 0 40 80 120 160 200 FY 2016 FY 2017
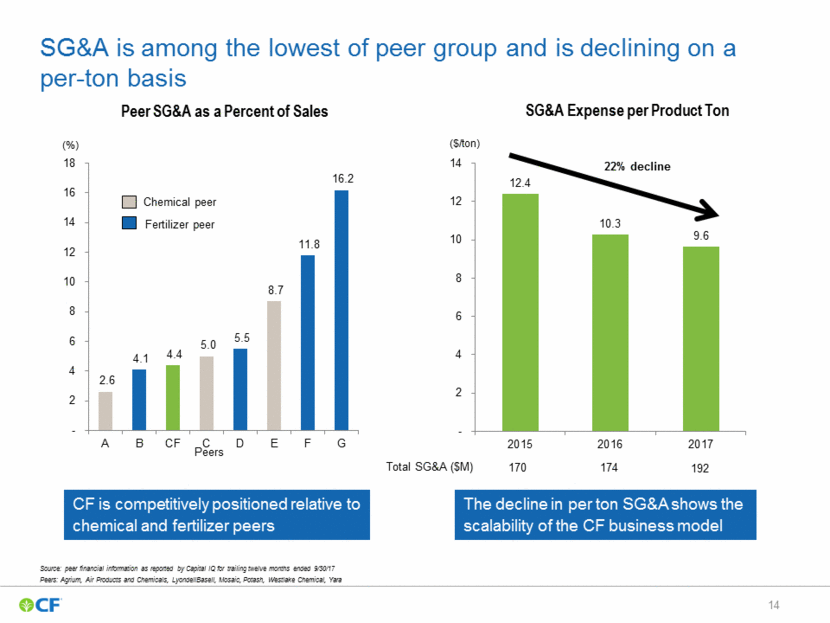
SG&A is among the lowest of peer group and is declining on a per-ton basis Total SG&A ($M) 170 174 192 Chemical peer Fertilizer peer Source: peer financial information as reported by Capital IQ for trailing twelve months ended 9/30/17 Peers: Agrium, Air Products and Chemicals, LyondellBasell, Mosaic, Potash, Westlake Chemical, Yara Peers SG&A Expense per Product Ton Peer SG&A as a Percent of Sales 22% decline The decline in per ton SG&A shows the scalability of the CF business model CF is competitively positioned relative to chemical and fertilizer peers (%) ($/ton) 12.4 10.3 9.6 - 2 4 6 8 10 12 14 2015 2016 2017 2.6 4.1 4.4 5.0 5.5 8.7 11.8 16.2 - 2 4 6 8 10 12 14 16 18 A B CF C D E F G
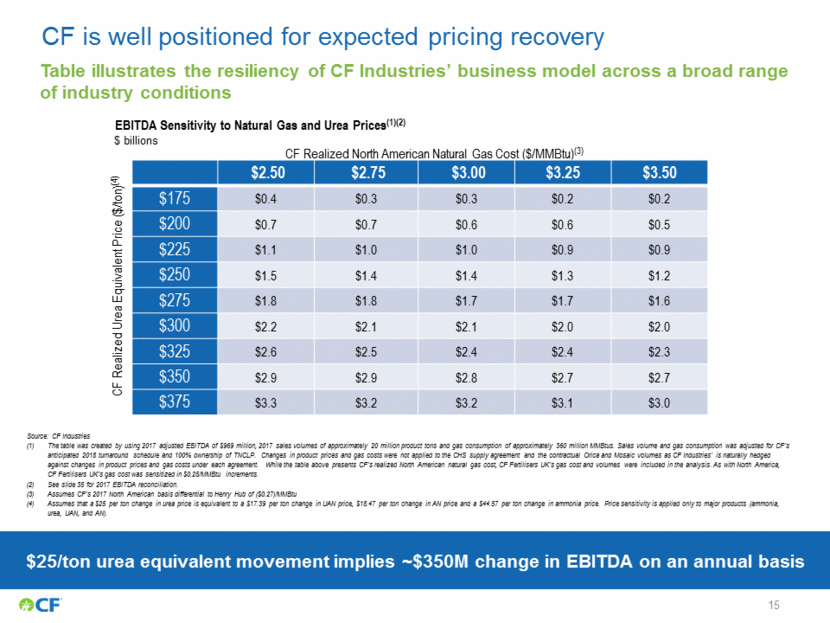
15 Source: CF Industries The table was created by using 2017 adjusted EBITDA of $969 million, 2017 sales volumes of approximately 20 million product tons and gas consumption of approximately 360 million MMBtus. Sales volume and gas consumption was adjusted for CF’s anticipated 2018 turnaround schedule and 100% ownership of TNCLP. Changes in product prices and gas costs were not applied to the CHS supply agreement and the contractual Orica and Mosaic volumes as CF Industries’ is naturally hedged against changes in product prices and gas costs under each agreement. While the table above presents CF’s realized North American natural gas cost, CF Fertilisers UK’s gas cost and volumes were included in the analysis. As with North America, CF Fertilisers UK’s gas cost was sensitized in $0.25/MMBtu increments. See slide 35 for 2017 EBITDA reconciliation. Assumes CF’s 2017 North American basis differential to Henry Hub of ($0.27)/MMBtu Assumes that a $25 per ton change in urea price is equivalent to a $17.39 per ton change in UAN price, $18.47 per ton change in AN price and a $44.57 per ton change in ammonia price. Price sensitivity is applied only to major products (ammonia, urea, UAN, and AN). CF is well positioned for expected pricing recovery $25/ton urea equivalent movement implies ~$350M change in EBITDA on an annual basis Table illustrates the resiliency of CF Industries’ business model across a broad range of industry conditions CF Realized North American Natural Gas Cost ($/MMBtu)(3) CF Realized Urea Equivalent Price ($/ton)(4) $ billions $2.50 $2.75 $3.00 $3.25 $3.50 $175 $0.4 $0.3 $0.3 $0.2 $0.2 $200 $0.7 $0.7 $0.6 $0.6 $0.5 $225 $1.1 $1.0 $1.0 $0.9 $0.9 $250 $1.5 $1.4 $1.4 $1.3 $1.2 $275 $1.8 $1.8 $1.7 $1.7 $1.6 $300 $2.2 $2.1 $2.1 $2.0 $2.0 $325 $2.6 $2.5 $2.4 $2.4 $2.3 $350 $2.9 $2.9 $2.8 $2.7 $2.7 $375 $3.3 $3.2 $3.2 $3.1 $3.0 EBITDA Sensitivity to Natural Gas and Urea Prices(1)(2)
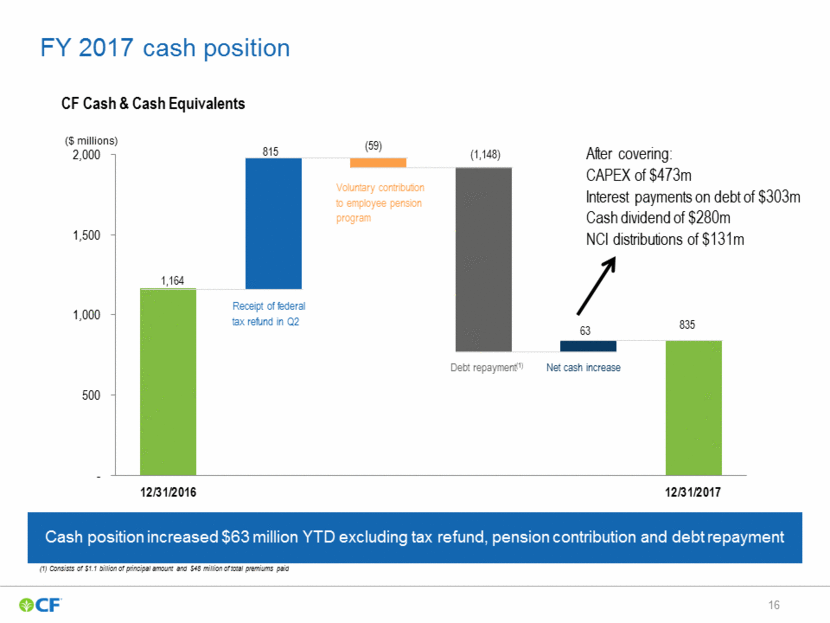
FY 2017 cash position CF Cash & Cash Equivalents Receipt of federal tax refund in Q2 Cash position increased $63 million YTD excluding tax refund, pension contribution and debt repayment After covering: CAPEX of $473m Interest payments on debt of $303m Cash dividend of $280m NCI distributions of $131m ($ millions) (1) Consists of $1.1 billion of principal amount and $48 million of total premiums paid - 500 1,000 1,500 2,000 12/31/2016 12/31/2017 1,164 815 (59) 63 835 Voluntary contribution to employee pension program Debt repayment (1) (1,148) Net cash increase
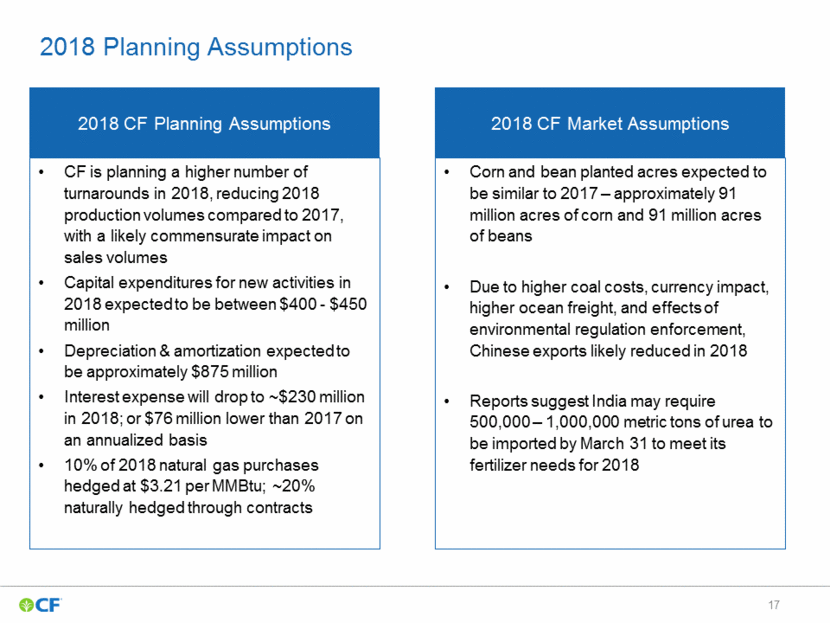
2018 Planning Assumptions 2018 CF Planning Assumptions CF is planning a higher number of turnarounds in 2018, reducing 2018 production volumes compared to 2017, with a likely commensurate impact on sales volumes Capital expenditures for new activities in 2018 expected to be between $400 - $450 million Depreciation & amortization expected to be approximately $875 million Interest expense will drop to ~$230 million in 2018; or $76 million lower than 2017 on an annualized basis 10% of 2018 natural gas purchases hedged at $3.21 per MMBtu; ~20% naturally hedged through contracts 2018 CF Market Assumptions Corn and bean planted acres expected to be similar to 2017 – approximately 91 million acres of corn and 91 million acres of beans Due to higher coal costs, currency impact, higher ocean freight, and effects of environmental regulation enforcement, Chinese exports likely reduced in 2018 Reports suggest India may require 500,000 – 1,000,000 metric tons of urea to be imported by March 31 to meet its fertilizer needs for 2018
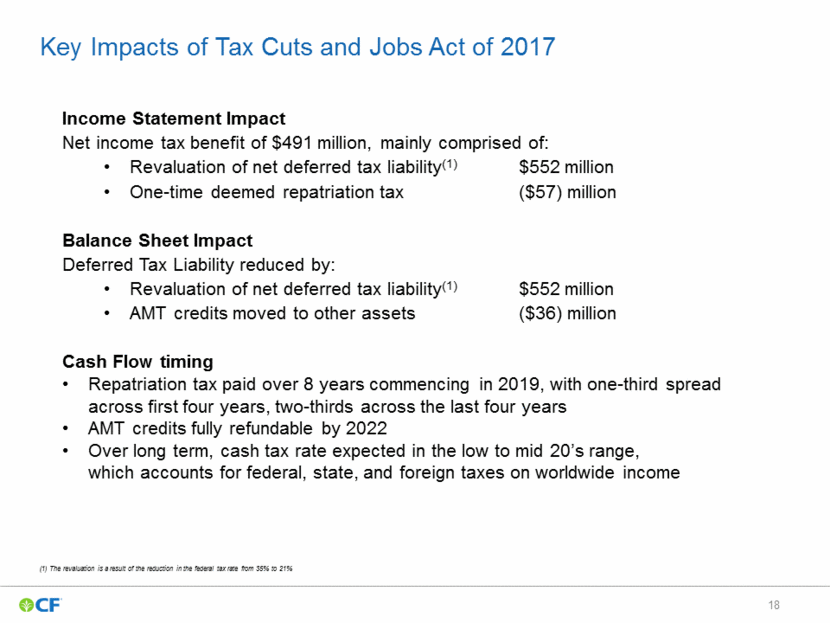
Key Impacts of Tax Cuts and Jobs Act of 2017 Income Statement Impact Net income tax benefit of $491 million, mainly comprised of: Revaluation of net deferred tax liability(1) $552 million One-time deemed repatriation tax ($57) million Balance Sheet Impact Deferred Tax Liability reduced by: Revaluation of net deferred tax liability(1) $552 million AMT credits moved to other assets ($36) million Cash Flow timing Repatriation tax paid over 8 years commencing in 2019, with one-third spread across first four years, two-thirds across the last four years AMT credits fully refundable by 2022 Over long term, cash tax rate expected in the low to mid 20’s range, which accounts for federal, state, and foreign taxes on worldwide income (1) The revaluation is a result of the reduction in the federal tax rate from 35% to 21%
Emerging Global Tradeflows Donaldsonville storage
Global Supply and Demand North American Outlook Global Pricing Dynamics Market overview CF expects higher nitrogen prices in 2018 than in 2017 The US dollar is expected to remain lower against currencies in key nitrogen producing regions through at least 1H 2018, pushing up cost of nitrogen exports in US dollar terms Energy prices for marginal producers in Eastern Europe and China increased ~25% and 29%, respectively, since mid-2017; Henry Hub prices have increased less than 3% Ocean freight from Arab Gulf to Gulf of Mexico is 15% higher per ton than prior year and nearly 30% higher per ton than the beginning of July 2017, further supporting the global price of nitrogen Imports will remain necessary to meet North American demand in 2018 with CF projecting ~91 million corn acres will be planted in the US For much of 2017, nitrogen prices in the region discouraged imports as urea barge prices at NOLA averaged ~$25 below international parity during Q4 Imports of urea and UAN from July through December declined 37% and 24% respectively, compared to the same period in 2016 Given steady demand and higher netbacks available in other regions, nitrogen prices in North America will likely have to rise to attract the imports necessary to meet expected demand CF expects a traditional mid-year price reset after completion of spring applications but does not expect prices to fall to the unsustainably low levels of summer 2017 China urea exports have declined ~65 percent in two years, from 13 million metric tons in 2015 to 4.7 million metric tons in 2017 Higher coal costs, currency impacts, and stepped up enforcement of environmental regulations likely to further reduce net Chinese urea exports in 2018 Published reports and CF analysis suggest India may require up to 500k-1 million metric tons of urea to be imported by March 31 to meet it’s 2018 fertilizer needs Brazil has emerged as the second largest importer of urea in the world, with imports of ~5.4 million metric tons in 2017, 15% higher than 2016 and 64% higher than 2012 Australia, Mexico and Turkey have significantly increased urea imports in recent years
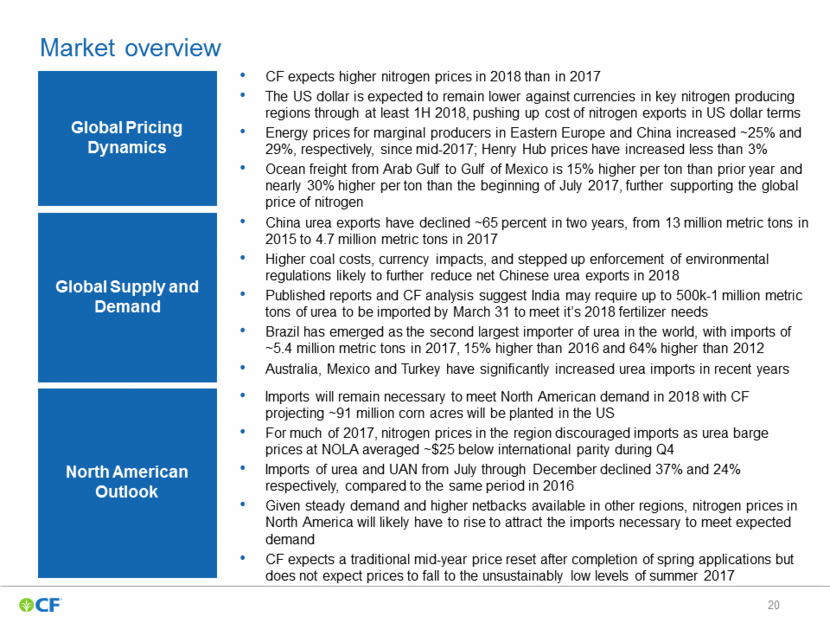
Expected net new capacity additions below projected global demand growth post 2017 CF Projected Global Net Urea Capacity Additions(1) Thousand Product Metric Tons See slides 38-40 for details of the 2017-2021 projected additions and assumed closures 2% Growth - 5,000 10,000 15,000 20,000 2015 2016 2017 2018 2019 2020 2021
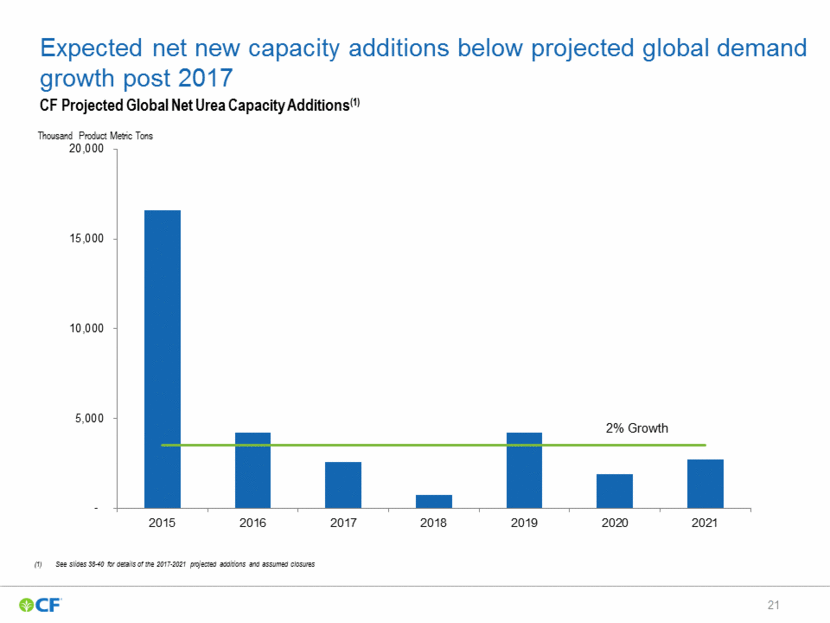
Nitrogen fertilizer imports into North America are beginning to decline as new production increases North America Offshore Urea Imports Million Tons North America Offshore UAN Imports Million Tons Five Year Range 2017 Fertilizer Year 2018 Fertilizer Year (1) 2018 dashed line shows estimated January import levels Note: Solid fill shows 2013-2017 fertilizer year import levels Source: TFI, USDOC, Genscape 2018 imports through December down 37% from 2017 2018 imports through December down 23% from 2017 4.2
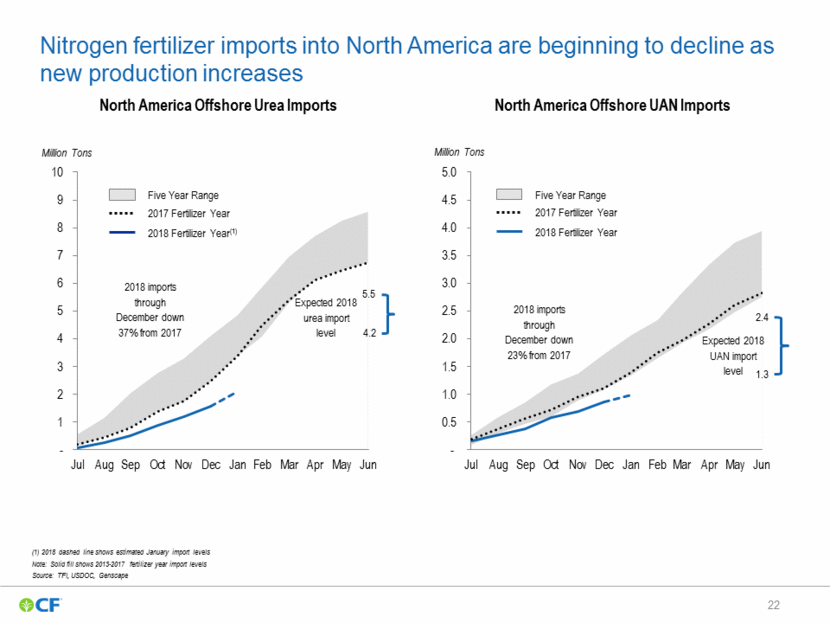
China India Other Asia North America Europe Latin America Rest of World Total Nitrogen Consumption 2002-2017(1) Industrial 15-yr CAGR =3.3% Overall 15-yr CAGR=2.2% Agricultural 15-yr CAGR =2.0% (1) 2002-2016 actuals, 2017F. CAGRs calculated as 2015-2017 average demand over 2000-2002 average demand Sources: Fertecon, IFA, AAPFCO, Fertilizers Europe, ANDA, IMF, World Bank, OECD, FAO, CF Industries Consistent global nitrogen demand growth Expected global demand growth driven by: Global population expected to increase 1% per annum Global GDP expected to increase 2-2.5% per annum, increasing personal income BRIC countries expected to increase meat consumption, driving demand for feed grains India and Africa expected to increase vegetable and grain demand Industrial growth driven by increased adoption of emission control, synthetic nitrogen products, and recovering mining sector Million Nutrient Metric Tons
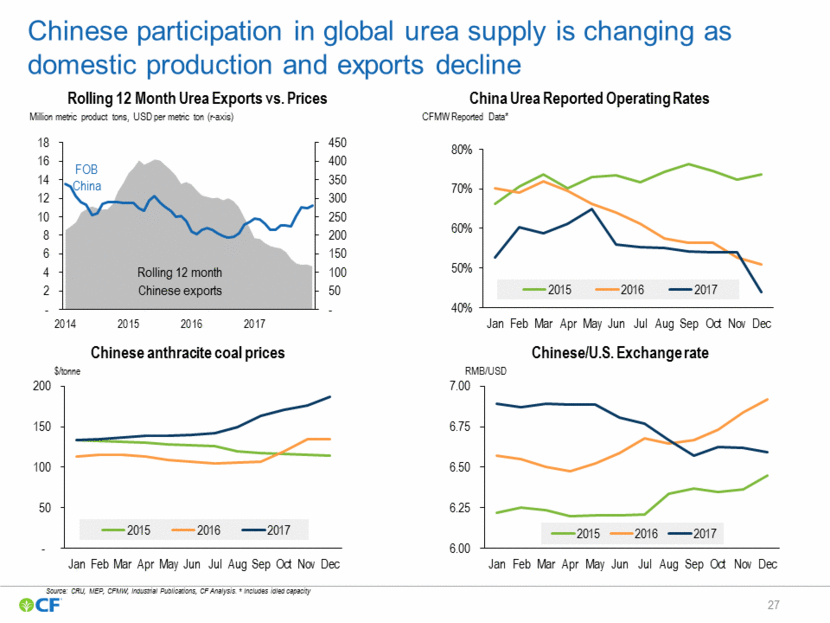
U.S. and Canada combined remain a significant importer of nitrogen products U.S. imports, including from Canada, average approximately 1.8 million tons more than the combined U.S. and Canada import total shown on the chart above Sources: USDOC, TFI, CF Total U.S. and Canada Import Volume(1) Million Nutrient Tons – Calendar Year 0 2 4 6 8 10 12 2000 2001 2002 2003 2004 2005 2006 2007 2008 2009 2010 2011 2012 2013 2014 2015 2016 2017 2018F
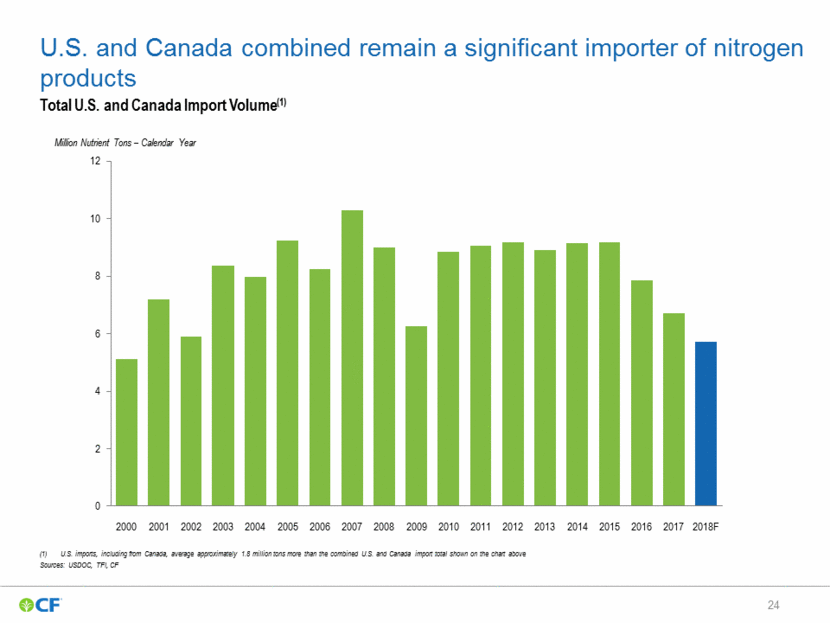
2018 Monthly Delivered U.S. Gulf Urea Cost Curve 2018 estimated cost curve 20 0 5 10 15 Appx. 2018 Price Range: $220-255 Source: Industry Publications, Fertecon, CRU, Integer, CF Does not include plants in temporary shutdown/mothball status Energy (N.G.) Other Cash Energy (Coal) Shipments: 17.1 MM ST Avg Appx. Monthly Range 2017 Cost Curve Range: $210-245 Y-axis: USD/short ton, X-axis: Monthly Production Capacity at 95% Operating Rate, million short tons 0 100 200 300 $400 North America MENA Latin America Other FSU Russia South Asia India China - Advanced Inland Low Ukraine Indonesia Southeast Asia Lithuania Western Europe China - Advanced Coastal China - Natural Gas Low Eastern Europe China - Advanced Inland High China - Anthracite Low China - Anthracite High China - Natural Gas High
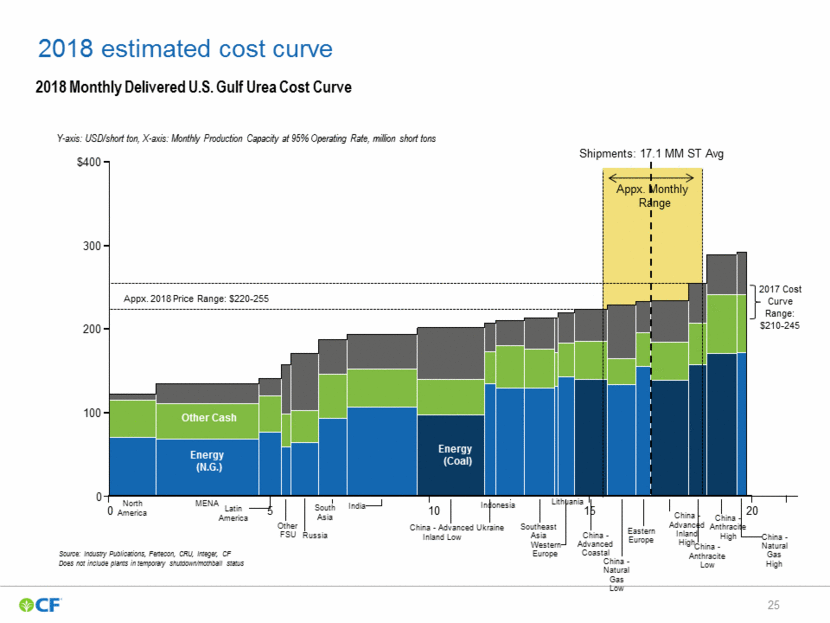
Location 2018F 2017E* Henry Hub 3.03 3.07 TTF 6.01 5.47 WEU-Russia 5.46 5.37 Brent Crude 56 55 Thermal 73 68 Anthracite Powder 116 86 Anthracite 135 113 RMB/USD 6.82 6.85 USD/EUR 1.21 1.10 USD/GBP Source NYMEX ICE Oil Index NYMEX SX Coal / Woodmac Bloomberg Composite Bloomberg Composite Bloomberg Composite 1.33 1.27 Annual Average Energy Cost Gas Prices ($/Mmbtu) Exchange Rates China Coal ($/tonne) Oil ($/Bbl) 2018 cost curve assumptions Notes: Market prices updated as of 10/3/17; Coal prices as of September 7, 2017 * 2017E represents assumptions from November 2016 forecasted cost curve
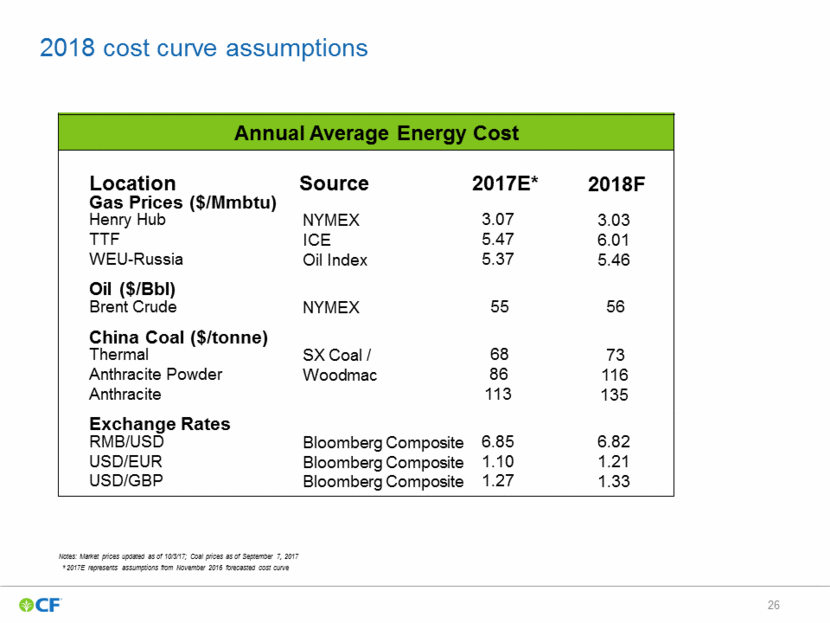
Chinese participation in global urea supply is changing as domestic production and exports decline Source: CRU, MEP, CFMW, Industrial Publications, CF Analysis. * Includes idled capacity China Urea Reported Operating Rates CFMW Reported Data* Rolling 12 Month Urea Exports vs. Prices Million metric product tons, USD per metric ton (r-axis) Rolling 12 month Chinese exports Chinese anthracite coal prices $/tonne Chinese/U.S. Exchange rate RMB/USD - 50 100 150 200 250 300 350 400 450 - 2 4 6 8 10 12 14 16 18 2014 2015 2016 2017 FOB China 40% 50% 60% 70% 80% Jan Feb Mar Apr May Jun Jul Aug Sep Oct Nov Dec 2015 2016 2017 - 50 100 150 200 Jan Feb Mar Apr May Jun Jul Aug Sep Oct Nov Dec 2015 2016 2017 6.00 6.25 6.50 6.75 7.00 Jan Feb Mar Apr May Jun Jul Aug Sep Oct Nov Dec 2015 2016 2017
CF serves a global market from strong North American base CF Industries is the largest nitrogen producer in the world with outstanding domestic and export logistical capabilities. Primarily a pure play nitrogen manufacturing company, focused on North America Largest production base and distribution network in North America with seven manufacturing facilities, 24 owned plus additional leased distribution facilities Largest production base in UK with 2 manufacturing facilities Product shipped via all modes: Deepwater vessel Barge (river and ocean) Unit train Pipeline Truck Each facility has access to more than one shipping mode Export destinations Chile France Argentina Morocco Belgium Colombia South Korea Australia Switzerland Uruguay World’s Largest Ammonia Producer (1) (Thousand metric tons, 2017) Aerial view of Donaldsonville docks Source: IFDC Excludes Chinese state owned enterprise JAMG and Indonesian consortium PT Pupuk 2,744 2,749 3,500 3,991 5,185 7,760 9,022 9,879 EuroChem Koch TogliattiAzot OCI Group DF (Ukraine) Nutrien Yara CF
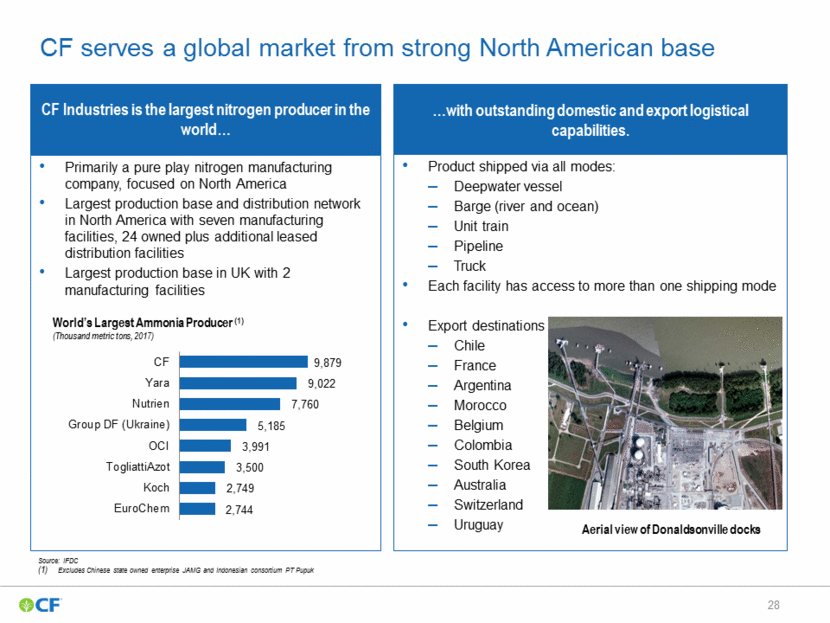
CF ammonia terminal CF ammonia and UAN terminal Donaldsonville Woodward Verdigris Port Neal Courtright Medicine Hat Yazoo City Terre Haute Mount Vernon Albany Kingston Mines Fremont Garner Pine Bend Peru Aurora Blair Brandon Cowden Frankfort Glenwood Grand Forks Huntington Palmyra Ritzville Rycroft Spencer Vanscoy Velva Seneca UK CF urea warehouse CF nitrogen complex Location Key(1) Best North American distribution capabilities with a global reach Vessel Exports to South America and Asia, transport to West Coast United States Barge UAN to Texas coast Barge UAN to East Coast United States Vessel Exports to Europe and Africa Ability to export to mainland Europe Billingham Ince North American Potential Output Million Product Tons, 2017 Maximize UAN Maximize Urea Total: 17.4 Total: 15.7 UAN: 8.7 Urea: 4.8 NH3: 3.0 AN: 0.9 UAN: 5.2 Urea: 5.8 NH3: 3.7 AN: 1.0 Pipeline Ship Ammonia by Magellan and NuStar pipelines to Corn Belt terminals Barge Ship products from Donaldsonville and Verdigris via inland waterways (1) Represents CF owned facilities
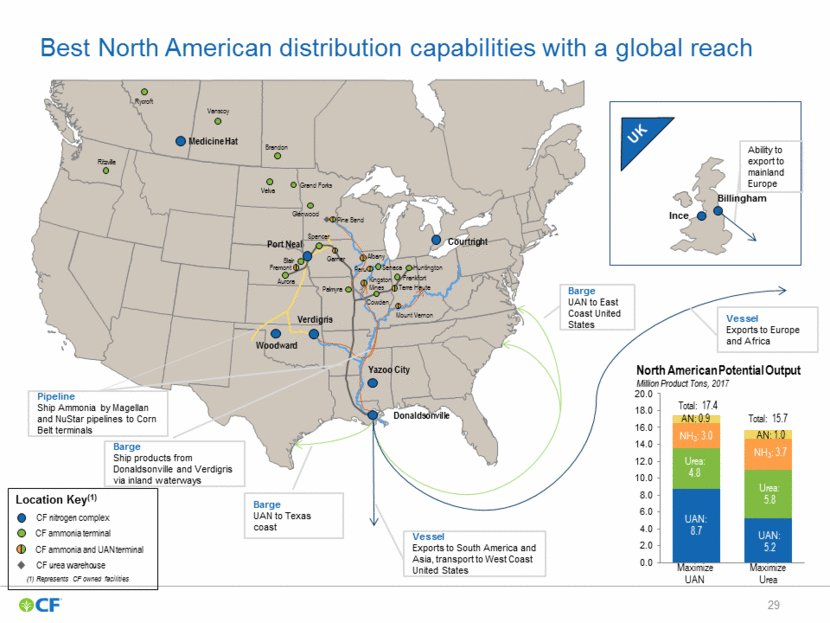
Capital Allocation and Structure Port Neal rail load out
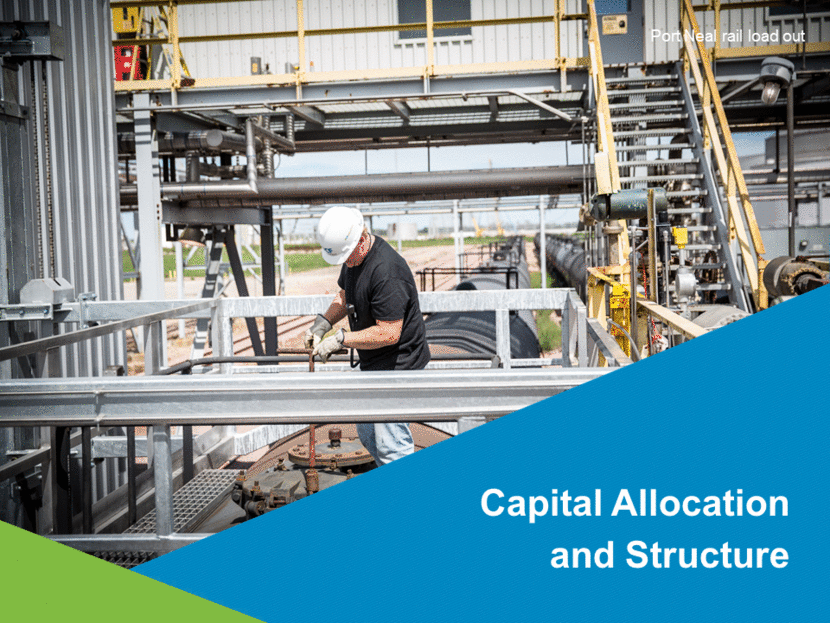
CF’s capital allocation philosophy Commitment to investment grade metrics over long term Pursue growth within strategic fairway, where returns exceed risk-adjusted cost of capital and investments are cash flow accretive on a per share basis Consistently return excess cash to shareholders in a timely fashion: historic bias towards share repurchases Philosophy remains unchanged Near-term priority: complete deleveraging & liquidity optimization $835 million in cash on balance sheet as of December 31, 2017 $750 million undrawn revolver as of December 31, 2017(1) Capital expenditures for new activities in 2018 expected to be $400-$450 million As of September 30, 2017, the company had approximately $158 million in costs accrued for work completed in 2016 related to capacity expansion projects. At December 31, 2017 these costs are no longer the subject of disputes and the company’s capital expenditures for 2017 reflect any payments associated with these formerly disputed costs Debt capital structure CF reduced long-term debt by $1.1 billion by redeeming in full the entire outstanding $800 million principal amount of its 6.875 percent Senior Notes due May 2018 and purchasing $300 million of its 7.125 percent Senior Notes due May 2020 As a result of debt redemption, the annualized interest payments is reduced by $76 million to ~$230 million As of December 31, 2017, company was in compliance with all applicable covenant requirements under its debt instruments $695 million availability as of December 31, 2017 (net of $55 million of outstanding letters of credit)
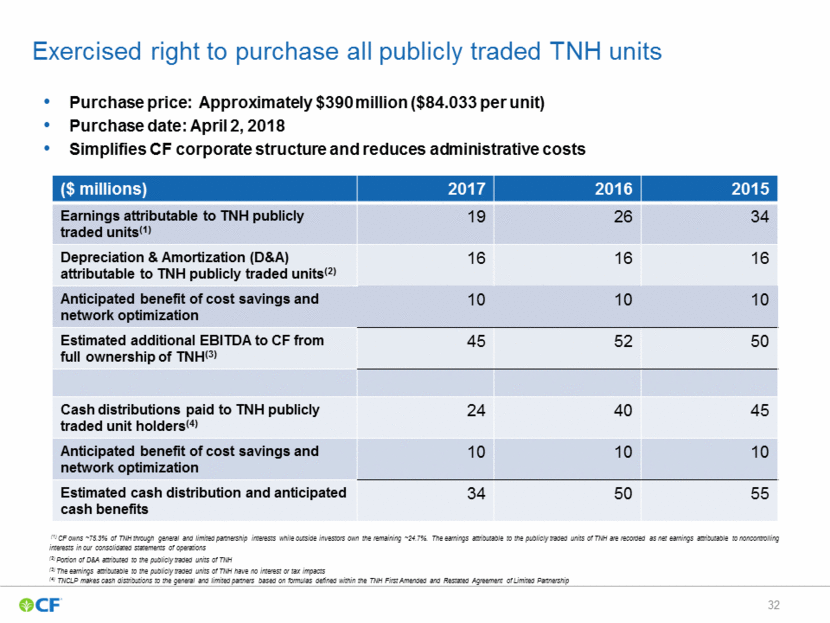
Exercised right to purchase all publicly traded TNH units Purchase price: Approximately $390 million ($84.033 per unit) Purchase date: April 2, 2018 Simplifies CF corporate structure and reduces administrative costs ($ millions) 2017 2016 2015 Earnings attributable to TNH publicly traded units(1) 19 26 34 Depreciation & Amortization (D&A) attributable to TNH publicly traded units(2) 16 16 16 Anticipated benefit of cost savings and network optimization 10 10 10 Estimated additional EBITDA to CF from full ownership of TNH(3) 45 52 50 Cash distributions paid to TNH publicly traded unit holders(4) 24 40 45 Anticipated benefit of cost savings and network optimization 10 10 10 Estimated cash distribution and anticipated cash benefits 34 50 55 (1) CF owns ~75.3% of TNH through general and limited partnership interests while outside investors own the remaining ~24.7%. The earnings attributable to the publicly traded units of TNH are recorded as net earnings attributable to noncontrolling interests in our consolidated statements of operations (2) Portion of D&A attributed to the publicly traded units of TNH (3) The earnings attributable to the publicly traded units of TNH have no interest or tax impacts (4) TNCLP makes cash distributions to the general and limited partners based on formulas defined within the TNH First Amended and Restated Agreement of Limited Partnership
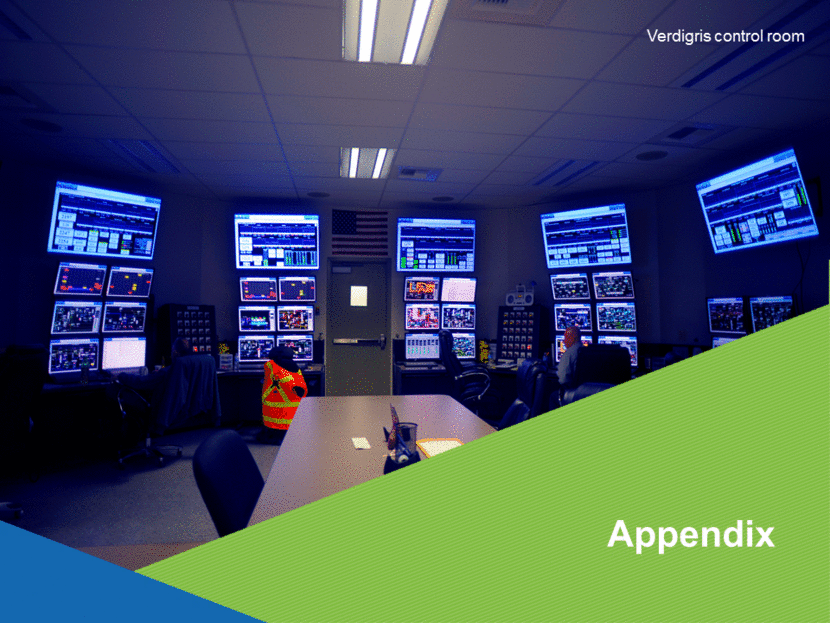
Appendix Verdigris control room
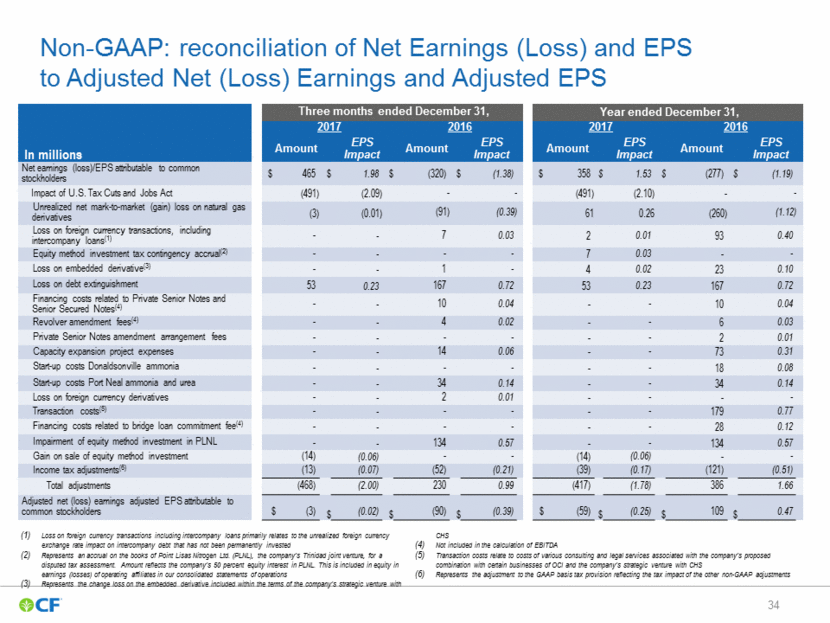
Non-GAAP: reconciliation of Net Earnings (Loss) and EPS to Adjusted Net (Loss) Earnings and Adjusted EPS Loss on foreign currency transactions including intercompany loans primarily relates to the unrealized foreign currency exchange rate impact on intercompany debt that has not been permanently invested Represents an accrual on the books of Point Lisas Nitrogen Ltd. (PLNL), the company’s Trinidad joint venture, for a disputed tax assessment. Amount reflects the company’s 50 percent equity interest in PLNL. This is included in equity in earnings (losses) of operating affiliates in our consolidated statements of operations Represents the change loss on the embedded derivative included within the terms of the company’s strategic venture with CHS Not included in the calculation of EBITDA Transaction costs relate to costs of various consulting and legal services associated with the company’s proposed combination with certain businesses of OCI and the company’s strategic venture with CHS Represents the adjustment to the GAAP basis tax provision reflecting the tax impact of the other non-GAAP adjustments In millions Three months ended December 31, Year ended December 31, 2017 2016 2017 2016 Amount EPS Impact Amount EPS Impact Amount EPS Impact Amount EPS Impact Net earnings (loss)/EPS attributable to common stockholders $ 465 $ 1.98 $ (320) $ (1.38) $ 358 $ 1.53 $ (277) $ (1.19) Impact of U.S. Tax Cuts and Jobs Act (491) (2.09) - - (491) (2.10) - - Unrealized net mark-to-market (gain) loss on natural gas derivatives (3) (0.01) (91) (0.39) 61 0.26 (260) (1.12) Loss on foreign currency transactions, including intercompany loans(1) - - 7 0.03 2 0.01 93 0.40 Equity method investment tax contingency accrual(2) - - - - 7 0.03 - - Loss on embedded derivative(3) - - 1 - 4 0.02 23 0.10 Loss on debt extinguishment 53 0.23 167 0.72 53 0.23 167 0.72 Financing costs related to Private Senior Notes and Senior Secured Notes(4) - - 10 0.04 - - 10 0.04 Revolver amendment fees(4) - - 4 0.02 - - 6 0.03 Private Senior Notes amendment arrangement fees - - - - - - 2 0.01 Capacity expansion project expenses - - 14 0.06 - - 73 0.31 Start-up costs Donaldsonville ammonia - - - - - - 18 0.08 Start-up costs Port Neal ammonia and urea - - 34 0.14 - - 34 0.14 Loss on foreign currency derivatives - - 2 0.01 - - - - Transaction costs(5) - - - - - - 179 0.77 Financing costs related to bridge loan commitment fee(4) - - - - - - 28 0.12 Impairment of equity method investment in PLNL - - 134 0.57 - - 134 0.57 Gain on sale of equity method investment (14) (0.06) - - (14) (0.06) - - Income tax adjustments(6) (13) (0.07) (52) (0.21) (39) (0.17) (121) (0.51) Total adjustments (468) (2.00) 230 0.99 (417) (1.78) 386 1.66 Adjusted net (loss) earnings adjusted EPS attributable to common stockholders $ (3) $ (0.02) $ (90) $ (0.39) $ (59) $ (0.25) $ 109 $ 0.47
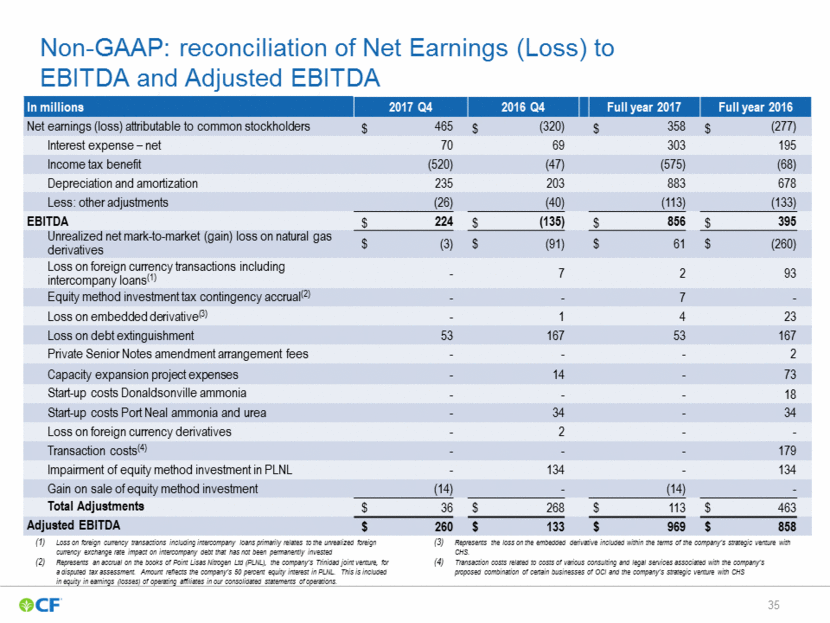
Non-GAAP: reconciliation of Net Earnings (Loss) to EBITDA and Adjusted EBITDA Loss on foreign currency transactions including intercompany loans primarily relates to the unrealized foreign currency exchange rate impact on intercompany debt that has not been permanently invested Represents an accrual on the books of Point Lisas Nitrogen Ltd (PLNL), the company’s Trinidad joint venture, for a disputed tax assessment. Amount reflects the company’s 50 percent equity interest in PLNL. This is included in equity in earnings (losses) of operating affiliates in our consolidated statements of operations. Represents the loss on the embedded derivative included within the terms of the company’s strategic venture with CHS. Transaction costs related to costs of various consulting and legal services associated with the company’s proposed combination of certain businesses of OCI and the company’s strategic venture with CHS In millions 2017 Q4 2016 Q3 2016 Q4 2015 Q3 Full year 2017 2016 Q3 Full year 2016 2015 Q3 Net earnings (loss) attributable to common stockholders $ 465 $ (320) $ 358 $ (277) Interest expense – net 70 69 303 195 Income tax benefit (520) (47) (575) (68) Depreciation and amortization 235 203 883 678 Less: other adjustments (26) (40) (113) (133) EBITDA $ 224 $ (135) $ 856 $ 395 Unrealized net mark-to-market (gain) loss on natural gas derivatives $ (3) $ (91) $ 61 $ (260) Loss on foreign currency transactions including intercompany loans(1) - 7 2 93 Equity method investment tax contingency accrual(2) - - 7 - Loss on embedded derivative(3) - 1 4 23 Loss on debt extinguishment 53 167 53 167 Private Senior Notes amendment arrangement fees - - - 2 Capacity expansion project expenses - 14 - 73 Start-up costs Donaldsonville ammonia - - - 18 Start-up costs Port Neal ammonia and urea - 34 - 34 Loss on foreign currency derivatives - 2 - - Transaction costs(4) - - - 179 Impairment of equity method investment in PLNL - 134 - 134 Gain on sale of equity method investment (14) - (14) - Total Adjustments $ 36 $ 268 $ 113 $ 463 Adjusted EBITDA $ 260 $ 133 $ 969 $ 858
Non-GAAP: reconciliation of cost of sales to controllable cost of sales(1) $ Per Product Sales Tons 2017 Q4 2016 Q3 2016 Q4 2015 Q3 Cost of Sales $ 181 $ 165 Natural gas costs 59 53 Realized net losses on natural gas derivatives 3 1 Unrealized net mark-to-market gain on natural gas derivatives (1) (19) Depreciation and amortization 42 38 Start-up costs Port Neal ammonia and urea - 7 Total Adjustments $ 103 $ 80 Controllable cost of sales $ 78 $ 85 Tons of product sold (000s) 5,284 4,683 Controllable cost of sales is defined as cost of sales adjusted for natural gas costs, realized and unrealized losses (gains) on natural gas derivatives, depreciation and amortization and start-up costs related to the company's Port Neal ammonia and urea plants. The company has presented controllable cost of sales and controllable cost of sales per ton because management uses these measures, and believes they are useful to investors, as supplemental financial measures in the comparison of year-over-year performance $ Millions 2017 Q4 2016 Q3 2016 Q4 2015 Q3 Cost of Sales as reported $ 956 $ 773 Natural gas costs 309 246 Realized net losses on natural gas derivatives 13 5 Unrealized net mark-to-market gain on natural gas derivatives (3) (91) Depreciation and amortization 223 181 Start-up costs Port Neal ammonia and urea - 34 Total Adjustments $ 542 $ 375 Controllable cost of sales $ 414 $ 398 Tons of product sold (000s) 5,284 4,683
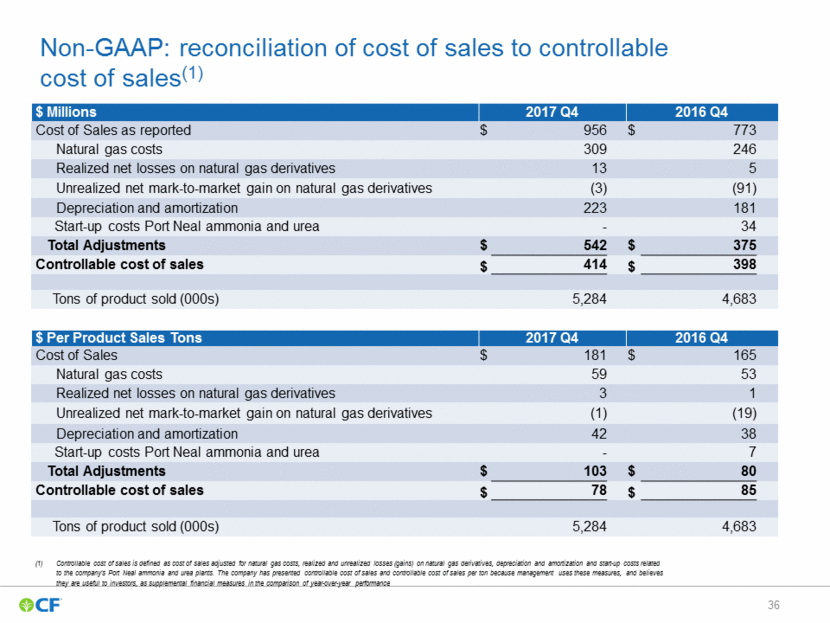
Non-GAAP: reconciliation of cost of sales to controllable cost of sales(1) $ Per Product Sales Tons Full year 2017 2016 Q3 Full year 2016 2015 Q3 Cost of Sales $ 185 $ 168 Natural gas costs 60 45 Realized net losses on natural gas derivatives 1 8 Unrealized net mark-to-market loss (gain) on natural gas derivatives 3 (15) Depreciation and amortization 42 35 Start-up costs Donaldsonville ammonia - 1 Start-up costs Port Neal ammonia and urea - 2 Total Adjustments $ 106 $ 76 Controllable cost of sales $ 79 $ 92 Tons of product sold (000s) 19,952 16,957 Controllable cost of sales is defined as cost of sales adjusted for natural gas costs, realized and unrealized losses (gains) on natural gas derivatives, depreciation and amortization and start-up costs related to the company's Donaldsonville and Port Neal plants. The company has presented controllable cost of sales and controllable cost of sales per ton because management uses these measures, and believes they are useful to investors, as supplemental financial measures in the comparison of year-over-year performance $ Millions Full year 2017 2016 Q3 Full Year 2016 2015 Q3 Cost of Sales as reported $ 3,700 $ 2,845 Natural gas costs 1,194 761 Realized net losses on natural gas derivatives 26 133 Unrealized net mark-to-market loss (gain) on natural gas derivatives 61 (260) Depreciation and amortization 836 597 Start-up costs Donaldsonville ammonia - 18 Start-up costs Port Neal ammonia and urea - 34 Total Adjustments $ 2,117 $ 1,283 Controllable cost of sales $ 1,583 $ 1,562 Tons of product sold (000s) 19,952 16,957
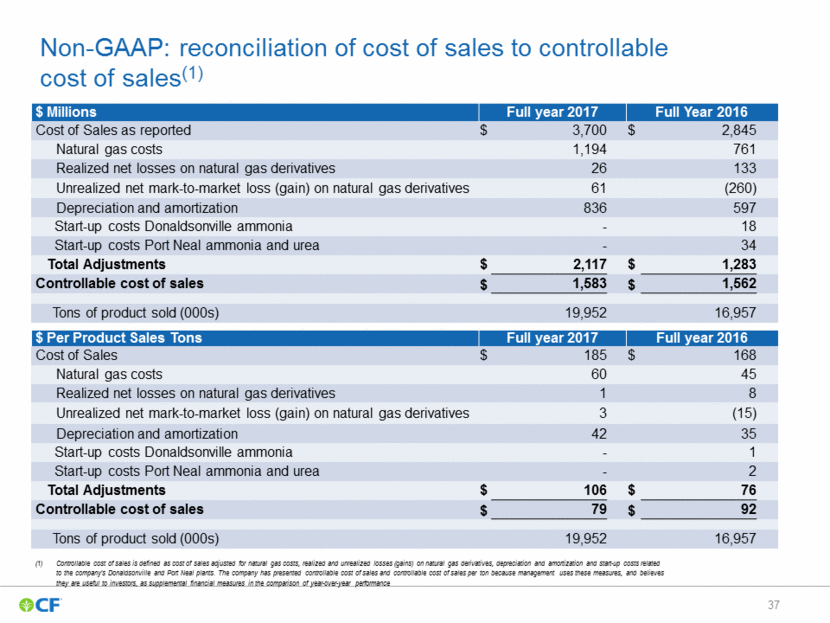
Expected net new capacity additions slightly below projected global demand growth post 2017 CF Projected Global Gross Urea Capacity Additions(1) Thousand Product Metric Tons See slide 39 for details of the 2017-2021 projected additions See slide 40 for details of the 2017-2021 assumed closures The Enid capacity addition includes approximately 200k metric tons of ammonia; the Borger and Beulah capacity additions are upgraded products only, representing no new nitrogen production Capacity additions and closures on a nameplate basis Sources: Fertecon, CRU, CFMW, Baiinfo, Fert.cn, Industry Publications, CF analysis 3% Growth: 5.3M 2% Growth: 3.5M Wever Enid(3) Borger(3) (5,100) (8,800) (3,040) (3,680) (500) - 16,600 4,200 2,560 720 4,200 1,900 Closures(2): Net Additions: Sub-Saharan Africa - 2,700 12,080 Grand Total Beulah(3) (7,220) 19,300 2017-2021 Total 54,000 32,880 (21,120) Latin America 0 5,000 10,000 15,000 20,000 25,000 2015 Other Asia D'Ville MENA 21,700 2016 Port Neal Iran 13,000 2017 5,600 2018 2019 FSU 4,700 2020 1,900 2021 China 4,400 2,700
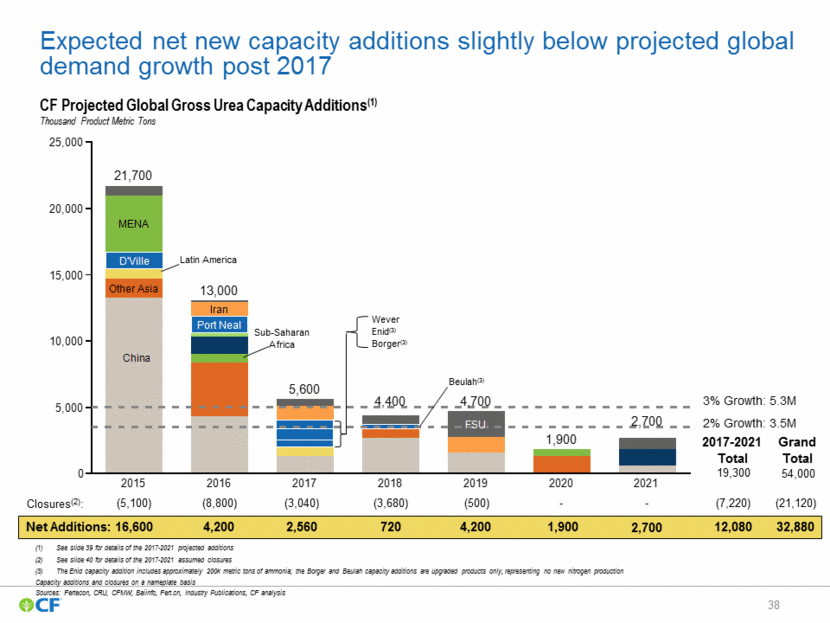
Country Company City/Province Feedstock Capacity – K Metric Product Tons(1) Year of Addition Bolivia Ebihara Carrasco Natural Gas 700 2017 China Shandong Ruixing Shandong Thermal 800 2017 China Luxi Chem Shandong Anthracite powder 500 2017 Iran Pardis Petrochemical Co Bandar Assaluyeh Natural Gas 1,000 2017 Russia PhosAgro-Cherepovets Cherepovets Natural Gas 500 2017 United States Agrium Borger, TX Natural Gas 580 2017 United States Koch Nitrogen Co. Enid, OK Natural Gas 810 2017 United States Iowa Fertilizer Co. Wever, IA Natural Gas 710 2017 5,600 Subtotal Azerbaijan Azerkimya (SOCAR) Sumgayit Natural Gas 660 2018 China Tonghua Chemical Co Jilin Anthracite powder 300 2018 China Yangmei Hebei Thermal 900 2018 China Haohua-Junhua Group Henan Thermal 520 2018 China Hualu-Hengsheng Shandong Thermal 1,000 2018 Indonesia PT Petrokimia Gresik II Gresik Natural Gas 660 2018 United States Dakota Gasification Beulah, ND Natural Gas 360 2018 4,400 Subtotal Iran Lordegan Petrochemical Lordegan Natural Gas 1,200 2019 China Yili Resource Inner Mongolia Anthracite powder 1,040 2019 China JAMG Jiangsu Thermal 520 2019 Russia Acron Veliky Novgorod Natural Gas 210 2019 Turkmenistan Turkmenhimiya Garabogaz Natural Gas 1,160 2019 Uzbekistan JSC Navoiazot Navoi Natural Gas 580 2019 4,700 Subtotal India Chambal Fertilizers Kota Natural Gas 1,340 2020 Egypt Egyptian Chemical Industries (KIMA) Aswan Natural Gas 520 2020 1,900 Subtotal China Henan Xin Lian Xin (XLX) Jiangxi Anthracite powder 600 2021 Kazakhstan Kazazot Kazazot Natural Gas 830 2021 Nigeria Dangote Group Edo State Natural Gas 1,270 2021 2,700 Subtotal 19,300 Grand Total Projected new global urea plants (2017-2021) Subtotals rounded to nearest 100k Sources: Fertecon, CRU, CFMW, Baiinfo, Fert.cn, Industry Publications, CF analysis
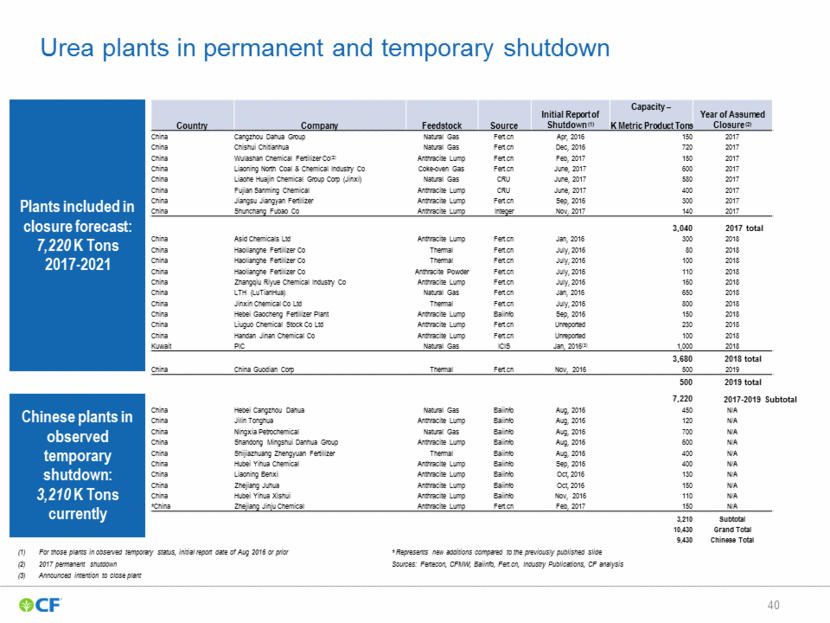
Urea plants in permanent and temporary shutdown Plants included in closure forecast: 7,220 K Tons 2017-2021 Chinese plants in observed temporary shutdown: 3,210 K Tons currently For those plants in observed temporary status, initial report date of Aug 2016 or prior 2017 permanent shutdown Announced intention to close plant * Represents new additions compared to the previously published slide Sources: Fertecon, CFMW, Baiinfo, Fert.cn, Industry Publications, CF analysis Country Company Feedstock Source Initial Report of Shutdown (1) Capacity – Year of Assumed Closure (2) K Metric Product Tons China Cangzhou Dahua Group Natural Gas Fert.cn Apr, 2016 150 2017 China Chishui Chitianhua Natural Gas Fert.cn Dec, 2016 720 2017 China Wulashan Chemical Fertilizer Co(2) Anthracite Lump Fert.cn Feb, 2017 150 2017 China Liaoning North Coal & Chemical Industry Co Coke-oven Gas Fert.cn June, 2017 600 2017 China Liaohe Huajin Chemical Group Corp (Jinxi) Natural Gas CRU June, 2017 580 2017 China Fujian Sanming Chemical Anthracite Lump CRU June, 2017 400 2017 China Jiangsu Jiangyan Fertilizer Anthracite Lump Fert.cn Sep, 2016 300 2017 China Shunchang Fubao Co Anthracite Lump Integer Nov, 2017 140 2017 3,040 2017 total China Asid Chemicals Ltd Anthracite Lump Fert.cn Jan, 2016 300 2018 China Haolianghe Fertilizer Co Thermal Fert.cn July, 2016 80 2018 China Haolianghe Fertilizer Co Thermal Fert.cn July, 2016 100 2018 China Haolianghe Fertilizer Co Anthracite Powder Fert.cn July, 2016 110 2018 China Zhangqiu Riyue Chemical Industry Co Anthracite Lump Fert.cn July, 2016 160 2018 China LTH (LuTianHua) Natural Gas Fert.cn Jan, 2016 650 2018 China Jinxin Chemical Co Ltd Thermal Fert.cn July, 2016 800 2018 China Hebei Gaocheng Fertilizer Plant Anthracite Lump Baiinfo Sep, 2016 150 2018 China Liuguo Chemical Stock Co Ltd Anthracite Lump Fert.cn Unreported 230 2018 China Handan Jinan Chemical Co Anthracite Lump Fert.cn Unreported 100 2018 Kuwait PIC Natural Gas ICIS Jan, 2016(3) 1,000 2018 3,680 2018 total China China Guodian Corp Thermal Fert.cn Nov, 2016 500 2019 500 2019 total 7,220 China Hebei Cangzhou Dahua Natural Gas Baiinfo Aug, 2016 450 N/A China Jilin Tonghua Anthracite Lump Baiinfo Aug, 2016 120 N/A China Ningxia Petrochemical Natural Gas Baiinfo Aug, 2016 700 N/A China Shandong Mingshui Danhua Group Anthracite Lump Baiinfo Aug, 2016 600 N/A China Shijiazhuang Zhengyuan Fertilizer Thermal Baiinfo Aug, 2016 400 N/A China Hubei Yihua Chemical Anthracite Lump Baiinfo Sep, 2016 400 N/A China Liaoning Benxi Anthracite Lump Baiinfo Oct, 2016 130 N/A China Zhejiang Juhua Anthracite Lump Baiinfo Oct, 2016 150 N/A China Hubei Yihua Xishui Anthracite Lump Baiinfo Nov, 2016 110 N/A *China Zhejiang Jinju Chemical Anthracite Lump Fert.cn Feb, 2017 150 N/A 3,210 Subtotal 10,430 Grand Total 9,430 Chinese Total 2017-2019 Subtotal
