Attached files
| file | filename |
|---|---|
| EX-10.29 - EX-10.29 - MEDNAX, INC. | d463027dex1029.htm |
| EX-10.30 - EX-10.30 - MEDNAX, INC. | d463027dex1030.htm |
| EX-23.1 - EX-23.1 - MEDNAX, INC. | d463027dex231.htm |
| EX-10.5 - EX-10.5 - MEDNAX, INC. | d463027dex105.htm |
| EX-21.1 - EX-21.1 - MEDNAX, INC. | d463027dex211.htm |
| EX-31.1 - EX-31.1 - MEDNAX, INC. | d463027dex311.htm |
| EX-10.28 - EX-10.28 - MEDNAX, INC. | d463027dex1028.htm |
| EX-32 - EX-32 - MEDNAX, INC. | d463027dex32.htm |
| EX-31.2 - EX-31.2 - MEDNAX, INC. | d463027dex312.htm |
| EX-10.4 - EX-10.4 - MEDNAX, INC. | d463027dex104.htm |
Table of Contents
UNITED STATES
SECURITIES AND EXCHANGE COMMISSION
Washington, D.C. 20549
Form 10-K
| ☒ | ANNUAL REPORT PURSUANT TO SECTION 13 OR 15(d) OF THE SECURITIES EXCHANGE ACT OF 1934 |
For the fiscal year ended December 31, 2017
| ☐ | TRANSITION REPORT PURSUANT TO SECTION 13 OR 15(d) OF THE SECURITIES EXCHANGE ACT OF 1934 |
For the transition period from to
Commission file number 001-12111
MEDNAX, INC.
(Exact name of registrant as specified in its charter)
| FLORIDA | 26-3667538 | |
| (State or other jurisdiction of incorporation or organization) |
(I.R.S. Employer Identification No.) | |
| 1301 Concord Terrace, Sunrise, Florida | 33323 | |
| (Address of principal executive offices) | (Zip Code) | |
Registrant’s telephone number, including area code (954) 384-0175
Securities registered pursuant to Section 12(b) of the Act:
| Title of Each Class |
Name of Each Exchange on Which Registered | |
| Common Stock, par value $.01 per share | New York Stock Exchange |
Securities registered pursuant to Section 12(g) of the Act: None
Indicate by check mark if the registrant is a well-known seasoned issuer, as defined in Rule 405 of the Securities Act. Yes ☒ No ☐
Indicate by check mark if the registrant is not required to file reports pursuant to Section 13 or Section 15 (d) of the Exchange Act. Yes ☐ No ☒
Indicate by check mark whether the registrant (1) has filed all reports required to be filed by Section 13 or 15(d) of the Securities Exchange Act of 1934 during the preceding 12 months (or for such shorter period that the registrant was required to file such reports), and (2) has been subject to such filing requirements for the past 90 days. Yes ☒ No ☐
Indicate by check mark whether the registrant has submitted electronically and posted on its Corporate Website, if any, every Interactive Data File required to be submitted and posted pursuant to Rule 405 of Regulation S-T (§232.405 of this chapter) during the preceding 12 months (or for such shorter period that the registrant was required to submit and post such files). Yes ☒ No ☐
Indicate by check mark if disclosure of delinquent filers pursuant to Item 405 of Regulation S-K (§229.405 of this chapter) is not contained herein, and will not be contained, to the best of registrant’s knowledge, in definitive proxy or information statements incorporated by reference in Part III of this Form 10-K or any amendment to this Form 10-K. ☐
Indicate by check mark whether the registrant is a large accelerated filer, an accelerated filer, a non-accelerated filer, a smaller reporting company, or an emerging growth company. See the definitions of “large accelerated filer,” “accelerated filer,” “smaller reporting company,” and “emerging growth company” in Rule 12b-2 of the Exchange Act.
| Large accelerated filer ☒ | Accelerated filer ☐ | Non-accelerated filer ☐ | Smaller reporting company ☐ | |||
| Emerging growth company ☐ |
If an emerging growth company, indicate by check mark if the registrant has elected not to use the extended transition period for complying with any new or revised financial accounting standards provided pursuant to Section 13(a) of the Exchange Act. ☐
Indicate by check mark whether the registrant is a shell company (as defined by Rule 12b-2 of the Exchange Act). Yes ☐ No ☒
The aggregate market value of shares of Common Stock of the registrant held by non-affiliates of the registrant on June 30, 2017, the last business day of the registrant’s most recently completed second fiscal quarter, was $4,785,069,881 based on a $60.37 closing price per share as reported on the New York Stock Exchange composite transactions list on such date.
The number of shares of Common Stock of the registrant outstanding on February 9, 2018 was 93,795,535.
DOCUMENTS INCORPORATED BY REFERENCE:
The registrant’s definitive proxy statement to be filed with the Securities and Exchange Commission pursuant to Regulation 14A, with respect to the 2018 Annual Meeting of Shareholders is incorporated by reference in Part III of this Form 10-K to the extent stated herein. Except with respect to information specifically incorporated by reference in the Form 10-K, each document incorporated by reference herein is deemed not to be filed as part hereof.
Table of Contents
MEDNAX, INC.
ANNUAL REPORT ON FORM 10-K
For the Year Ended December 31, 2017
| Item 1. | Business | 3 | ||||||||
| Item 1A. | Risk Factors | 28 | ||||||||
| Item 1B. | Unresolved Staff Comments | 43 | ||||||||
| Item 2. | Properties | 43 | ||||||||
| Item 3. | Legal Proceedings | 43 | ||||||||
| Item 4. | Mine Safety Disclosures | 43 | ||||||||
| Item 5. | 44 | |||||||||
| Item 6. | 47 | |||||||||
| Item 7. | Management’s Discussion and Analysis of Financial Condition and Results of Operations |
48 | ||||||||
| Item 7A. | 63 | |||||||||
| Item 8. | 64 | |||||||||
| Item 9. | Changes in and Disagreements with Accountants on Accounting and Financial Disclosure |
94 | ||||||||
| Item 9A. | 94 | |||||||||
| Item 9B. | 95 | |||||||||
| Item 10. | Directors, Executive Officers and Corporate Governance | 96 | ||||||||
| Item 11. | Executive Compensation | 96 | ||||||||
| Item 12. | Security Ownership of Certain Beneficial Owners and Management and Related Stockholder Matters |
96 | ||||||||
| Item 13. | Certain Relationships and Related Transactions, and Director Independence | 96 | ||||||||
| Item 14. | Principal Accounting Fees and Services | 97 | ||||||||
| Item 15. | Exhibits, Financial Statement Schedule | 98 | ||||||||
| Item 16. | Form 10-K Summary | 101 |
FORWARD-LOOKING STATEMENTS
Certain information included or incorporated by reference in this Form 10-K may be deemed to be “forward-looking statements” which may include, but are not limited to, statements relating to our objectives, plans and strategies, and all statements (other than statements of historical facts) that address activities, events or developments that we intend, expect, project, believe or anticipate will or may occur in the future. These statements are often characterized by terminology such as “believe,” “hope,” “may,” “anticipate,” “should,” “intend,” “plan,” “will,” “expect,” “estimate,” “project,” “positioned,” “strategy” and similar expressions, and are based on assumptions and assessments made by our management in light of their experience and their perception of historical trends, current conditions, expected future developments and other factors they believe to be appropriate. Any forward-looking statements in this Form 10-K are made as of the date hereof, and we undertake no duty to update or revise any such statements, whether as a result of new information, future events or otherwise. Forward-looking statements are not guarantees of future performance and are subject to risks and uncertainties. Important factors that could cause actual results, developments and business decisions to differ materially from forward-looking statements are described in this Form 10-K, including the risks set forth under “Risk Factors” in Item 1A.
2
Table of Contents
As used in this Form 10-K, unless the context otherwise requires, the terms “MEDNAX,” the “Company,” “we,” “us” and “our” refer to the parent company, MEDNAX, Inc., a Florida corporation, and the consolidated subsidiaries through which its businesses are actually conducted (collectively, “MDX”), together with MDX’s affiliated business corporations or professional associations, professional corporations, limited liability companies and partnerships (“affiliated professional contractors”). Certain subsidiaries of MDX have contracts with our affiliated professional contractors, which are separate legal entities that provide physician services in certain states and Puerto Rico. All share and per share data set forth herein give effect to the two-for-one split of our common stock that became effective on December 19, 2013.
| ITEM 1. | BUSINESS |
OVERVIEW
MEDNAX is a leading provider of physician services including newborn, anesthesia, maternal-fetal, radiology and teleradiology, pediatric cardiology and other pediatric subspecialty care. At December 31, 2017, our national network comprised over 4,075 affiliated physicians, including 1,175 physicians who provide neonatal clinical care, primarily within hospital-based neonatal intensive care units (“NICUs”), to babies born prematurely or with medical complications. We have 1,400 affiliated physicians who provide anesthesia care to patients in connection with surgical and other procedures, as well as pain management. In addition, we have 325 affiliated physicians who provide maternal-fetal and obstetrical medical care to expectant mothers experiencing complicated pregnancies primarily in areas where our affiliated neonatal physicians practice. Our network also includes other pediatric subspecialists, including 175 physicians providing pediatric intensive care, 110 physicians providing pediatric cardiology care, 130 physicians providing hospital-based pediatric care, 20 physicians providing pediatric surgical care, and eight physicians providing pediatric ear, nose and throat and pediatric ophthalmology services. MEDNAX also provides radiology services including diagnostic imaging, interventional radiology and nuclear medicine, through a network of 285 affiliated physicians, as well as teleradiology services through a network of 445 affiliated radiologists. In addition to our national physician network, we provide services to healthcare facilities and physicians, including ours, through complementary businesses, consisting of a management services organization focusing on full-service revenue cycle management and a consulting services company.
MEDNAX, Inc. was incorporated in Florida in 2007 and is the successor to Pediatrix Medical Group, Inc., which was incorporated in Florida in 1979. Our principal executive offices are located at 1301 Concord Terrace, Sunrise, Florida 33323 and our telephone number is (954) 384-0175.
OUR PHYSICIAN SPECIALTIES AND SERVICES
The following discussion describes our physician specialties and the care that we provide:
Neonatal Care
We provide clinical care to babies born prematurely or with complications within specific units at hospitals, primarily NICUs, through our network of 1,175 affiliated neonatal physician subspecialists (“neonatologists”), neonatal nurse practitioners and other pediatric clinicians who staff and manage clinical activities at more than 390 NICUs in 37 states and Puerto Rico. Neonatologists are board-certified, or eligible-to-apply-for-certification, physicians who have extensive education and training for the care of babies born prematurely or with complications that require complex medical treatment. Neonatal nurse practitioners are registered nurses who have advanced training and education in assessing and treating the healthcare needs of newborns and infants as well as managing the needs of their families.
We partner with our hospital clients in an effort to enhance the quality of care delivered to premature and sick babies. Some of the nation’s largest and most prestigious hospitals, including both not-for-profit and
3
Table of Contents
for-profit institutions, retain us to staff and manage their NICUs. Our affiliated neonatologists generally provide 24-hours-a-day, seven-days-a-week coverage in NICUs, support the local referring physician community and are available for consultation in other hospital departments. Our hospital partners benefit from our experience in managing complex intensive care units. Our neonatal physicians interact with colleagues across the country through an internal communications system to draw upon their collective expertise in managing challenging patient-care issues. Our neonatal physicians also work collaboratively with maternal-fetal medicine subspecialists to coordinate the care of mothers experiencing complicated pregnancies and their fetuses.
Anesthesia and Anesthesia Subspecialty Care
We provide anesthesia care at over 155 hospitals, 160 ambulatory surgery centers and office-based practices across 15 states with 1,400 affiliated anesthesiologists. Following the “care team” model, our anesthesiologists work with both practice and hospital-employed certified registered nurse anesthetists (“CRNAs”), anesthesiologist assistants (“AAs”) and other clinicians to provide high quality, cost efficient and service-oriented anesthesia care to our patients. Our anesthesiologists are board-certified, or eligible-to-apply-for-certification, physicians who are responsible for administering anesthesia to relieve pain and for managing vital life functions during surgery, including breathing, heart rhythm and blood pressure.
As an integral part of the surgical team, our affiliated anesthesiologists support the surgeons by providing medical care before, during and after surgery so that surgeons may concentrate on the surgical procedure. Our affiliated anesthesiologists provide this care by evaluating the patient and consulting with the surgical team before surgery, providing pain control and support of life functions during surgery, supervising care after surgery by maintaining the patient in a comfortable state during recovery and discharging the patient from the post-anesthesia care unit. They also support other departments within the hospital such as labor and delivery, imaging and the hospital’s emergency room. In addition to their board certification in anesthesiology, many of our affiliated anesthesiologists have completed fellowships in subspecialties such as obstetrical, critical care, cardiac and pediatric anesthesia.
Pain Management
We also provide acute and chronic pain management services in over 30 pain management centers through our network of physicians and physician assistants. Our physicians are board-certified in anesthesiology or neurology and board-certified, or eligible-to-apply-for-certification, in pain medicine. This advanced training and education expands treatment options available for both acute and chronic pain sufferers. The physicians develop treatment plans specific to the patients’ individual needs that include interventional techniques such as trigger point and facet injections, pain pumps, nerve stimulators, radiofrequency ablation and catheters, as well as medication management.
Maternal-Fetal Care
We provide inpatient and office-based clinical care to expectant mothers and their unborn babies through our 325 affiliated maternal-fetal medicine subspecialists as well as obstetricians and other clinicians, such as maternal-fetal nurse practitioners, certified nurse mid-wives, ultrasonographers and genetic counselors. Maternal-fetal medicine subspecialists are board-certified, or eligible-to-apply-for-certification, obstetricians who have extensive education and training for the treatment of high-risk expectant mothers and their fetuses. Our affiliated maternal-fetal medicine subspecialists practice primarily in metropolitan areas where we have affiliated neonatologists to provide coordinated care for women with complicated pregnancies whose babies are often admitted to a NICU upon delivery. We believe continuity of treatment from mother and developing fetus during the pregnancy to the newborn upon delivery has improved the clinical outcomes of our patients.
Pediatric Cardiology Care
We provide inpatient and office-based pediatric cardiology care of the fetus, infant, child and adolescent patient with congenital heart defects and acquired heart disease, as well as adults with congenital heart defects
4
Table of Contents
through our 110 affiliated pediatric cardiologist subspecialists and other related clinical professionals such as pediatric nurse practitioners, echocardiographers, other diagnostic technicians, and exercise physiologists. Pediatric cardiologists are board-certified, or eligible-to-apply for certification, pediatricians who have additional education and training in congenital heart defects and pediatric acquired heart disorders.
We provide specialized cardiac care to the fetus, neonatal and pediatric patients with congenital and acquired heart disorders, as well as adults with congenital heart defects, through scheduled office visits, hospital rounds and immediate consultation in emergency situations. Our affiliated pediatric cardiologists work collaboratively with neonatologists and maternal-fetal medicine subspecialists to provide a coordinated continuum of care.
Other Pediatric Subspecialty Care
Our network includes other pediatric subspecialists such as pediatric intensivists, pediatric hospitalists, pediatric surgeons and pediatric ear, nose and throat physicians. In addition, our affiliated physicians seek to provide support services in other areas of hospitals, particularly in the pediatric emergency room, labor and delivery area, and nursery and pediatric departments, where immediate accessibility to specialized care may be critical.
Pediatric Intensive Care. Pediatric intensivists are hospital-based pediatricians with additional education and training in caring for critically ill or injured children and adolescents. We have 175 affiliated physicians who provide this clinical care. They staff and manage pediatric intensive care units (“PICUs”) at approximately 55 hospitals.
Pediatric Hospitalists. Pediatric hospitalists are hospital-based pediatricians specializing in inpatient care and management of acutely ill children. We have 130 affiliated hospital-based physicians who provide inpatient pediatric and newborn care as well as provide care in PICUs, NICUs and pediatric emergency rooms at approximately 40 hospitals.
Pediatric Surgery. Pediatric surgeons provide specialized care for patients ranging from newborns to adolescents, for all problems or conditions that require surgical intervention, and often have particular expertise in the areas of neonatal, prenatal, trauma, and pediatric oncology. We have 20 affiliated physicians in this subspecialty including pediatric urologists, pediatric plastic and craniofacial surgeons and general and thoracic pediatric surgeons. Areas of particular expertise include management of neonatal and congenital anomalies, prenatal counseling, trauma management, pediatric oncology, gastrointestinal surgery, as well as common pediatric surgical conditions.
Other Newborn and Pediatric Care. Because our affiliated physicians and advanced nurse practitioners generally provide hospital-based coverage, they are situated to provide highly specialized care to address medical needs that may arise during a baby’s hospitalization. For example, as part of our ongoing efforts to support and partner with hospitals and the local referring physician community, our affiliated neonatologists, pediatric hospitalists and advanced nurse practitioners provide in-hospital nursery care to newborns through our newborn nursery program. This program is made available for babies during their hospital stay, which in the case of healthy babies typically consists of evaluation and observation, following which they are referred, and their hospital records are provided, to their pediatricians or family practitioners for follow-up care.
Newborn Hearing Screening Program. Our affiliated physicians also oversee our newborn hearing screening program. Since we launched this program in 1994, we believe that we have become the largest provider of newborn hearing screening services in the United States. In 2017, we screened over 855,000 babies for potential hearing loss at 435 hospitals across the nation. Over 40 states either require newborns to be screened for potential hearing loss before being discharged from the hospital or require that parents be offered the opportunity to submit their newborns to hearing screens. We contract or coordinate with hospitals to provide newborn hearing screening services.
5
Table of Contents
Radiology and Teleradiology
Radiology. We provide radiology services including diagnostic imaging, interventional radiology and nuclear medicine through a network of 285 physicians. We believe that we bring a unique value proposition to radiology physician groups, in that we can provide practice support, a technology platform enabling radiology to be practiced at a national level, as well as teleradiology capabilities that can enhance their efficiency, provide subspecialty access and help them grow and remain competitive. In addition, we believe that radiology physicians in a group practice can complement the staffing needs for our teleradiology services business during certain times, such as nights and weekends, when they are not providing services at their practices.
Teleradiology. Teleradiology represents a component of the broader radiology industry whereby radiographic images are transmitted from one location to another for interpretation. Through our vRad business, we provide teleradiology services to approximately 2,100 client hospitals, health systems and radiology groups across all 50 states, the District of Columbia and Puerto Rico. With 445 U.S. board-certified and eligible radiologists currently reading images in the network, the majority of whom are subspecialty trained, we are able to interpret over 6.3 million patient studies annually and process over 2.1 billion images on what we believe is the world’s largest and most advanced telemedicine platform. We believe that the teleradiology specialty is poised for growth and that there are numerous opportunities for cross-selling vRad’s services within MEDNAX’s existing customer base. We believe that teleradiology will play a significant role in the practice of radiology in the future. Our teleradiology business has begun to identify opportunities throughout the country for our radiology physician group practices to expand their presence, and we believe this will be a key differentiator as we continue down the path of building a broader radiology business in the future.
Management Services Organization and Consulting Services
In addition to our national physician network, we provide services nationwide to healthcare facilities and physicians, including ours, through complementary businesses, consisting of a management services organization that offers full-service revenue cycle management solutions and innovative technology used for patient/physician connectivity as well as a consulting services company. Our management services organization provides a suite of solutions including a range of patient access and communications, full-service revenue cycle management, consulting and analytics services, billing and coding, patient responsibility, eligibility and disability, complex accounts receivable services such as workers’ compensation, out-of-state Medicaid eligibility and more, and mobile-first engagement and communication software for patients and providers. Our solutions are designed to engage patients, empower physicians and hospitals and other healthcare providers and improve financial outcomes throughout the entire healthcare continuum. We provide these services at more than 2,400 hospitals and other healthcare providers nationwide.
Our perioperative consulting company is comprised of a collaborative team of anesthesiologists, operating room nurse executives and perioperative business strategists who develop and provide solutions to optimize the performance, resources and capacity within hospital operating rooms and across the care continuum. Our services include strategic assessments and transformations, central sterile redesign, physician engagement and governance, and staffing/workforce support. With our peer-to-peer consulting model, we partner with our clients to deliver sustainable and actionable results with the goal of streamlining patient throughput, enhancing anesthesia service levels, increasing surgeon and patient satisfaction, decreasing costs and implementing strategic perioperative growth plans to hospitals and health systems.
Clinical Research and Quality
As part of our ongoing commitment to improving patient care through evidence-based medicine, we also conduct clinical research, monitor clinical outcomes and implement clinical quality initiatives with a view to improving patient outcomes, shortening the length of hospital stays and reducing long-term health system costs. Our physician-centric approach to clinical research and continuous quality improvement has demonstrated
6
Table of Contents
improvements in clinical outcomes, while reducing the costs of care associated with complications as well as variability in protocols. We believe that referring and collaborating physicians, hospitals, third-party payors and patients all benefit from our clinical research, education and quality initiatives.
DEMAND FOR OUR SERVICES
Hospital-Based Care. Hospitals generally must provide cost-effective, quality care in order to enhance their reputations within their communities and desirability to patients, referring and collaborating physicians and third-party payors. In an effort to improve outcomes and manage costs, hospitals typically employ or contract with physician specialists to provide specialized care in many hospital-based units or settings. Hospitals traditionally staff these units or settings through affiliations with local physician groups or independent practitioners. However, management of these units and settings presents significant operational challenges, including variable admissions rates, increased operating costs, complex reimbursement systems and other administrative burdens. As a result, some hospitals choose to contract with physician organizations that have the clinical quality initiatives, information and reimbursement systems and management expertise required to effectively and efficiently operate these units and settings in the current healthcare environment. Demand for hospital-based physician services, including neonatology and anesthesiology, is determined by a national market in which qualified physicians with advanced training compete for hospital contracts.
Neonatal Medicine. Of the approximately 4 million births in the United States annually, we estimate that approximately 14% require NICU admission. Numerous institutions conduct research to identify potential causes of premature birth and medical complications that often require NICU admission. Some common contributing factors include the presence of hypertension or diabetes in the mother, lack of prenatal care, complications during pregnancy, drug and alcohol abuse and smoking or poor nutritional habits during pregnancy. Babies admitted to NICUs typically have an illness or condition that requires the care of a neonatologist. Babies who are born prematurely or have a low birth weight often require neonatal intensive care services because of an increased risk for medical complications. We believe obstetricians generally prefer to perform deliveries at hospitals that provide a full complement of labor and delivery services, including a NICU staffed by board-certified, or eligible-to-apply-for-certification, neonatologists. Because obstetrics is a significant source of hospital admissions, hospital administrators have responded to these demands by establishing NICUs and contracting with independent neonatology group practices, such as our affiliated professional contractors, to staff and manage these units. As a result, NICUs within the United States tend to be concentrated in hospitals with higher volumes of births. There are approximately 5,600 board-certified neonatologists in the United States.
Anesthesia Medicine. An estimated 50 million inpatient procedures and 35 million ambulatory procedures are performed annually in the United States. Anesthesiologists generally provide or participate in the administration of anesthetics in these procedures. According to the U.S. Census Bureau, the U.S. population continues to expand and the fastest-growing segment of the population consists of individuals over the age of 65. The growth in population and, in particular the age 65 or greater segment, has resulted in an increase in demand for surgical services and a correlating increase in demand for anesthesia services. The growth of ambulatory surgical centers and expansion of office-based procedures has also contributed to the demand for anesthesia providers. There are approximately 51,000 board certified/eligible anesthesiologists in the United States.
Pain Management. According to the American Academy of Pain Medicine, more than 75 million people suffer from pain and 15% of those who suffer from pain will consult with a pain specialist. As the population ages, we believe that the number of people suffering from acute or chronic pain will continue to increase. Lifestyle also plays an important part in the demand for pain management services. We believe that the combination of the growing population of people who suffer from pain, the lifestyle expectations of this population and the ability for patients to seek out a pain specialist without having to be referred by a physician will increase the demand for pain management services.
Maternal-Fetal Medicine. Expectant mothers with pregnancy complications often seek or are referred by their obstetricians to maternal-fetal medicine subspecialists. These subspecialists provide inpatient and office-
7
Table of Contents
based care to women with conditions such as diabetes, heart disease, hypertension, multiple gestation, recurrent miscarriage, family history of genetic diseases, suspected fetal birth defects and other complications during their pregnancies. We believe that improved maternal-fetal care has a positive impact on neonatal outcomes. Data on neonatal outcomes demonstrates that, in general, the likelihood of mortality or an adverse condition or outcome (referred to as “morbidity”) is reduced the longer a baby remains in the womb. There are approximately 2,200 board-certified maternal-fetal medicine subspecialists in the United States.
Pediatric Cardiology Medicine. Pediatric cardiologists provide inpatient and office-based cardiology care of the fetus, infant, child, and adolescent with congenital heart defects and acquired heart disease, as well as providing care to adults with congenital heart defects. We estimate that approximately one in every 125 babies is born with some form of heart defect. With advancements in care, there are approximately 1.4 million adults in the United States today living with congenital heart disease. There are approximately 2,500 board-certified pediatric cardiologists in the United States.
Other Pediatric Subspecialty Medicine. Other areas of pediatric subspecialty medicine are closely associated with maternal-fetal-newborn medical care. For example, pediatric intensivists are subspecialists who care for critically ill or injured children and adolescents in PICUs. There are approximately 1,950 board-certified pediatric intensivists in the United States. As another example, pediatric hospitalists are pediatricians who provide care in many hospital areas, including labor and delivery and the newborn nursery. In addition, pediatric surgeons provide specialized care for patients ranging from newborns to adolescents, for all problems or conditions affecting children that require surgical intervention, and often have particular expertise in the areas of neonatal, prenatal, trauma, and pediatric oncology. There are approximately 970 board-certified pediatric surgeons in the United States.
Radiology. Radiology is the science that uses a variety of medical imaging to diagnose injury and disease and sometimes treat diseases in the body. A variety of imaging techniques such as X-ray, radiography, ultrasound, computed tomography (CT), nuclear medicine, including positron emission tomography (PET), and magnetic resonance imaging (MRI) are used. Interventional radiology is the performance of typically minimally invasive medical procedures with the guidance of imaging technologies. According to the U.S. Census Bureau, the U.S. population continues to expand and the fastest-growing segment of the population consists of individuals over the age of 65. The growth in population and, in particular the age 65 or greater segment, is expected to result in an increase in demand for radiology services as the increased medical needs of this population require more imaging. There are approximately 30,000 board-certified radiologists in the United States.
Teleradiology and Telemedicine. Teleradiology is the transmission of radiographic images from one location to another for interpretation. Teleradiology represents a component of the broader radiology industry. Within this market, teleradiology is a fast growing segment of the physician services sector. We believe that there are several factors prompting growth of the teleradiology model. Around-the-clock subspecialty coverage is becoming a standard of care; the idea that a general radiologist practicing in a single hospital has the ability to read all types of images is no longer prevalent. On behalf of their patients, healthcare facilities increasingly seek to have diagnostic images evaluated by radiologists who have expertise in specific subspecialty areas such as neuroradiology, cardiac imaging and vascular surgery. In addition, facilities wish to have this subspecialty service available to them immediately because timing is critical for treatment and recovery. Advances in technology now make this around-the clock expert attention possible; using remote/onsite integration and data analytics, teleradiologists can read diagnostic images from anywhere at any time and seamlessly deliver results. This not only provides the ability to determine optimal treatment decisions for the patient, but also enhances a healthcare facility’s ability to efficiently and effectively meet its patients’ needs. Since most teleradiology work is completed remotely, the pool of qualified radiologists who are subspecialty trained is significantly greater than would be available in a single geographic area.
Another key driver, we believe, is how we support forward-thinking radiology groups that are attempting to become high-performance providers in their markets. Traditionally, radiology groups have had to staff to their
8
Table of Contents
peak volume creating periods where they are overstaffed as volume ramps up or down. With us as a partner, radiology groups can staff to meet typical demand, as opposed to overstaffing, and leverage our solutions for additional coverage at all times, not just the overnight hours. Likewise, radiology groups can more quickly expand their services to other geographies and locations with us as a partner reducing or eliminating the time it takes to recruit physicians for growth. Similarly, teleradiology coverage can be provided for other physician group staffing challenges such as physician retirement and attrition, or to provide expertise in specific subspecialty areas that may not be covered by the physicians in the practice.
Further, we believe there are broader applications across the larger telemedicine industry for the use of the proprietary technology and workflow platform utilized within our teleradiology business. Telemedicine services are well documented as high quality, safe and efficient means of expanding physician services into metropolitan and rural communities. We have begun to expand our services to provide these remote programs to our hospital partners and believe that this will become more relevant as more healthcare providers integrate remote healthcare solutions into their healthcare practices.
Physician Practice Administration. Administrative demands and cost containment pressures from a number of sources, principally commercial and government payors, make it increasingly difficult for physicians to effectively manage patient care, remain current on the latest procedures and efficiently administer non-clinical activities. As a result, we believe that physicians remain receptive to being affiliated with larger organizations that reduce administrative burdens, achieve economies of scale and provide value-added clinical research, education and quality initiatives. By relieving many of the burdens associated with the management of a subspecialty group practice, we believe that our practice administration services permit our affiliated physicians to focus on providing quality patient care and thereby contribute to improving patient outcomes, ensuring appropriate length of hospital stays and reducing long-term health system costs. In addition, our national network of affiliated physician practices, modeled around a traditional group practice structure, is managed by a non-clinical professional management team with proven abilities to achieve significant operating efficiencies in providing administrative support systems, interacting with physicians, hospitals and third-party payors, managing information systems and technologies, and complying with applicable laws, rules and regulations.
Management Services / Full-Service Revenue Cycle Management. Our management services organization is designed to help physicians and other healthcare providers better engage patients throughout the entire healthcare continuum by addressing the various challenges that they face from the complexity of reimbursement and practice coordination in today’s healthcare environment. We believe our suite of solutions sets our management services organization apart in the world of healthcare revenue cycle management. Our suite of solutions includes a range of patient access and communications, revenue cycle management, consulting and analytics services, billing and coding, patient responsibility, eligibility and disability, complex accounts receivable services such as workers’ compensation, out-of-state Medicaid eligibility and more, as well as offering advanced technology solutions through mobile-first engagement and communication software for patients and providers. By allowing our organization to step in and handle these areas, hospitals and other healthcare providers can focus on providing care to their patients without the administrative burdens.
The healthcare landscape is changing rapidly, particularly in various areas that hospitals and other healthcare providers typically have not invested in. Our solutions become even more relevant in these specific areas. For example, as patient responsibility balances continue to grow and become harder to collect, our management services organization’s unique process of patient outreach and communication, before the healthcare bills are even sent, is a proven solution to this problem that also enhances patient satisfaction. Our management services organization also helps hospitals and other healthcare providers streamline the eligibility process for Medicaid. Medicaid eligibility is not a simple process to establish, as it differs across states and must be reestablished monthly, and is a critical function as there are millions of individuals who are eligible for Medicaid. We believe that our solutions have been positively received by our hospital and other healthcare partners, and add to the value proposition that we can deliver to address the key areas where hospitals and other healthcare providers must adapt to the changes in the business of healthcare.
9
Table of Contents
OUR BUSINESS STRATEGY
Our business objective is to enhance our position as a leading provider of physician and other complementary healthcare services. The key elements of our strategy to achieve this objective are:
| • | Build upon core competencies. We have developed significant administrative expertise relating to our practice physician services. We have also facilitated the development of a clinical approach to the practice of medicine among our affiliated physicians through clinical data warehouses that include research, education and quality initiatives intended to advance the practice of medicine and care, improve the quality of care provided to our patients and reduce long-term health system costs. Analysis of the data within our clinical data warehouses across our neonatology, anesthesia and other pediatric subspecialty services allows us to provide feedback to our physicians and hospital partners and to develop and implement best practices, all with the goal of improving outcomes, creating efficiencies and ensuring patient satisfaction. As healthcare organizations are expected to increasingly be held accountable for the quality and cost of the care they provide, we believe that our ability to capture this data within our clinical data warehouses adds value to our patients and our hospital and physician partners. |
| • | Promote same-unit and organic growth. We seek opportunities for increasing revenue from our hospital- and office-based operations. For example, our affiliated hospital-based neonatal, maternal-fetal and other pediatric physicians are well situated to, and, in some cases, provide physician services in other departments, such as pediatric emergency rooms, newborn nurseries, or in situations where immediate accessibility to specialized obstetric and pediatric care may be critical. Our hospital-based and office-based physicians continue to pursue an organic growth strategy that involves working with our hospital partners to develop integrated service programs for which we become a provider of solutions across the maternal-fetal, newborn, pediatric continuum of care. An integrated program results in a broader offering of care across our specialties and permits the extension of our service lines in our markets. We have successfully executed this organic growth strategy and market partnership in many metropolitan areas and intend to continue this growth initiative in the future. In addition, we market our capabilities to obstetricians, pediatricians and family physicians to attract referrals to our hospital-based units and our office-based practices. We also market the services of our affiliated physicians to other hospitals to attract maternal, neonatal and pediatric transport admissions. In addition, we may pursue new contractual arrangements with hospitals, including possibly through joint ventures, either where we currently provide or do not currently provide physician services. |
We have had success developing other programs with our hospital partners. One of these programs relates to obstetric hospitalists (“OB hospitalists”) whereby we have collaborated with hospitals to design programs for which an OB hospitalist is on site at the hospital on a shift basis to provide care for laboring patients and managing obstetrical emergencies. We believe this program is valuable to our hospital partners as the program improves patient safety in part by preventing unattended deliveries and allowing for swifter emergency treatment. An additional benefit from such a program for our hospital partners is that local obstetricians unable to attend deliveries can be confident that there are dedicated in-house obstetricians available to attend such deliveries, and they may therefore choose to deliver at hospitals with such programs.
We also continue to expand our services in telemedicine, which is the use of telecommunication and information technology in order to provide clinical healthcare at a distance. Our acquisition of vRad was a significant milestone in this rapidly evolving area of healthcare and provided us with vRad’s proprietary technology and workflow platform. Similarly, we expect that many pediatric subspecialties as well as maternal-fetal medicine, will benefit in the future from having a robust platform in telemedicine. Telemedicine services are well documented as high quality, safe and efficient means of expanding physician services into metropolitan and rural communities. We have begun to expand our services to provide these remote programs to our hospital partners. These programs enhance the standing of our hospital partners while creating another portal of entry of pediatric patients to our inpatient service lines.
10
Table of Contents
Additionally, with the goal of further expanding our organic growth strategy, we are continuing the evolving process of developing our national sales team to pursue opportunities across our service lines by employing a targeting strategy with a specific focus and prioritization. This sales team will work with existing hospital and other healthcare partners and will also focus on building new relationships with hospitals and other service providers to which we do not currently provide services in order to offer clinical and other solutions and respond to requests for proposals. The ultimate goal is for MEDNAX to be viewed by hospitals and other partners as a multi-specialty health solutions partner and other complementary services solutions provider across all of our service lines. During 2017, the management of our organic growth initiatives was moved to our business development team in order to optimally align our growth efforts.
| • | Acquire physician practice groups. We continue to seek to expand our operations by acquiring established physician practices in our specialties which include radiology, neonatology, anesthesiology, maternal-fetal medicine and pediatric cardiology. We also pursue complementary pediatric subspecialty physician groups, such as pediatric intensivists, pediatric hospitalists, pediatric surgeons, pediatric ear, nose and throat physicians and pediatric ophthalmologists. In addition, both independently and in collaboration with our hospital partners, we are actively pursuing expansion into additional pediatric subspecialties in order to meet the needs of our hospital partners. These include groups with expertise in pediatric orthopedics and neurosurgery as well as newborn congenital heart disease. During 2017, we added ten physician group practices, including four radiology practices, two maternal-fetal medicine practices, one neonatology practice, one pediatric multi-specialty practice and two other pediatric subspecialty practices. |
We also believe that teleradiology will play a significant role in the practice of radiology in the future and that our teleradiology services business will be a valuable asset to us as we continue working toward our goal of building a national radiology physician group. We believe we bring a unique value proposition to radiology physician groups, in that we can provide not only practice support, but also teleradiology capabilities that can enhance their efficiency, provide increased subspecialty access and help them grow, remain competitive and meet the ever increasing needs of their hospital partners, payors and regulatory bodies.
| • | Acquire complementary service businesses. In addition to growing our national physician practice network, we have expanded the service offerings within our management services organization. Our management services organization is a technology-enabled services organization that improves financial outcomes for our hospital partners and other medical providers by enhancing the patient experience and expanding their access to healthcare. We provide a suite of solutions across the areas of healthcare eligibility, billing and coding, assistance with patient responsibility balances, complex accounts receivable services in the areas of third-party liability, out-of-state Medicaid eligibility and workers’ compensation, as well as innovative technology solutions for patient engagement, provider productivity and communication and engagement. Our service offerings function not only as support for our own physician practices but as a revenue-generating outsourced service capability. We believe our service offerings help to address the evolving needs of our hospital partners and other customers while creating expanded opportunities for cross-selling our services in order to supplement our future growth. We will continue to evaluate expansion of our service offerings in this area as our hospital partners’ and other healthcare providers’ needs evolve. |
| • | Strengthen and broaden relationships with our partners. By managing many of the operational challenges associated with physician practices, encouraging clinical research, education and quality initiatives, and promoting timely intervention by our physicians, we believe that our business model is focused on improving the quality of care delivered to patients, promoting the appropriate length of their hospital stays and optimizing efficient use of health system resources. We believe that referring and collaborating physicians, hospitals, third-party payors and patients all benefit to the extent that we are successful in implementing our business model. In addition, we will continue to concentrate efforts in becoming more responsive and proactive in broadening our existing hospital relationships to expand |
11
Table of Contents
| the scope of services that we provide across all specialties. We believe this will be critical as hospitals and health systems seek to expand their service offerings and as the broader healthcare market seeks new solutions to operate more efficiently. |
CLINICAL RESEARCH, EDUCATION AND QUALITY
As part of our patient focus and ongoing commitment to improving patient care through evidenced-based medicine, we engage in clinical research, continuous quality improvement, safety and education initiatives. We discover, understand and teach healthcare practices that enhance the abilities of clinicians to deliver quality care, thereby contributing to better patient outcomes and reduced long-term health system costs. Our investment in these initiatives benefits our patients, clinicians, referring and collaborating physicians, hospital partners and third-party payors. We believe that these initiatives help us, among other things, to enhance the value of our services, attract new and retain existing clinicians, improve clinical operations and enhance practice communication.
| • | Clinical Research. We conduct clinical research to discover ways to improve clinical care for our patients and share our discoveries throughout the medical community through submissions to peer-reviewed literature. During 2017 alone, our affiliated physicians published more than 60 articles in peer reviewed journals. |
| • | Neonatal medicine was the focus of 20 of the published articles. Truly understanding the outcome and the cost of achieving that outcome in a neonate requires years of follow up, but defining and measuring value is of great importance as it focuses efforts on improving the quality of healthcare. We have continued our collaboration with neonatal healthcare providers who want to solve important clinical questions using information from our clinical data warehouse. |
| • | In maternal-fetal medicine, our Obstetrix Collaborative Research Network along with our affiliated physicians completed and published two multicenter studies and a total of 12 studies in major peer review journals during 2017. Our pediatric cardiology research continues to rapidly develop. Our groups are currently evaluating the role of newborn screening for congenital cardiac disease in collaboration with many of our neonatology practices. This study completed enrollment of more than 6,000 infants and is under peer review. Many of our affiliated pediatric cardiology practices are involved in a variety of important collaborative research studies as part of both regional and national projects. Among these projects is our involvement in a decade long multicenter partnership with other children’s hospitals, funded by the American Heart Association, assessing health related quality of life outcomes in children with congenital and acquired heart disease. Our cardiology team is a member of the prestigious Pediatric Heart Network, a subsidiary of the National Heart Lung Blood Institute, an organization that evaluates the use of certain drugs following surgical procedures for children with complex congenital heart defects in order to improve exercise performance. In anesthesiology, we both conduct and support clinical research across a spectrum of clinical efficacy, quality, therapeutic and device investigations, all with the goal of bringing better care to our patients. Our findings are shared throughout the medical community through peer-reviewed literature, presentation at national medical meetings and through educational venues. |
| • | Our anesthesiology practices are currently engaged in more than 50 clinical trials in a variety of specialty areas across eight states. These range from anesthesia investigator initiated to quality/hospital database inquiry to industry-sponsored trials. We currently continue to report quality metrics via a Centers for Medicare & Medicaid Services (“CMS”) certified Qualified Clinical Data Registry (“QCDR”) and to perform advanced analytics for research purposes using our quality initiative tool, Quantum Clinical Navigation System (“Quantum.”) This database currently has over 1,000,000 audited patient encounters that enable us to illustrate and investigate best practices in anesthesia care in community based healthcare systems. Papers utilizing data from Quantum have been published while others are in submission, and clinical trial results are now |
12
Table of Contents
| being accepted for publication. In addition, multiple presentations, some using abstracts from published papers, were given at national, regional and local meetings. We are well positioned to attract clinical trial sponsors, given our rich patient base and our pool of physician investigators. |
| • | In radiology, we have developed data analytic capabilities utilizing the radiology studies within our extensive database to evaluate information and provide evidence-based insights to key decision makers at healthcare systems regarding imaging utilization and clinical outcomes. Our radiology data provides us the ability to analyze disparate data and synthesize this into actionable findings. Through the use of this data, we have the insight to measure and demonstrate clinical quality, value and performance to our customers and third-party payors. |
| • | Continuous Quality Improvement. Continuous quality improvement (“CQI”) initiatives are important for all of our physician specialties. As part of our dedication to improving quality across our affiliated practices, we provide our clinicians with the opportunity to collaborate and share best practices and facilitate access to valuable information, resources and professional development tools. From these collaborations, our affiliated physicians can identify areas for improvement, and then systematically monitor, study, learn, and implement change. There are several complex initiatives that are derived and based on our long-standing CQI efforts, such as our Regional Resource Teams, our National High Reliability Organization (“HRO”) program and our Performance Improvement Teams. For anesthesia care, we have launched a new Comprehensive Recovery After Surgery program and continue to offer a CMS certified QCDR. Our quality metrics are analyzed to include standard clinical outcome reporting, trend analysis and threshold performance, all of which are provided to our individual physicians. The quality committees and medical directors of the practices manage quality improvement programs and drive best practices that are adapted to the needs of the local care setting. |
| • | Patient Safety Organization. We have established a federally listed Patient Safety Organization (“PSO”), the mission of which is to improve the quality and safety of care rendered by our clinical providers through the collection and analysis of quality data. As a federally listed PSO, our mission to improve the safety of care rendered is supported by the dissemination of best practices information and implementation of patient safety programs. In 2017, we expanded the anesthesiology HRO program and launched the women’s and children’s HRO program, both aiming to provide “Just Culture” training to our clinicians. The complex curriculum has been customized to meet our affiliated physician practices’ needs and is based on principles outlined by the Agency for Healthcare Research and Quality (“AHRQ”), Institute for Healthcare Improvement, National Patient Safety Foundation and Team STEPPS, the teamwork system developed by the AHRQ and the Department of Defense. |
In addition to our HRO initiatives in 2017, we have also expanded our inter-professional simulation program to include additional subspecialties and have been granted a two year provisional accreditation by the Society for Healthcare Simulation. The effects of simulation are proven as a performance improvement method and are known to lead to enhanced communication and improved patient outcomes.
| • | Continuing Medical Education. We provide extensive continuing medical education and continuing nursing education to our affiliated clinicians in an effort to ensure that they have access to current treatment methodologies, national best practices and evidence-based guidelines. As an Accreditation Council for Continuing Medical Education accredited provider, we offer a variety of live and online educational credit opportunities that can be accessed on demand by our providers and are in synergy with latest research publications and healthcare industry standards. |
We believe that these initiatives have been enhanced by our integrated national presence together with our clinical and management information systems, which are an integral component of our clinical research and education activities. See “Our Information Systems.”
13
Table of Contents
PHYSICIAN PRACTICE GROUP ADMINISTRATION
We provide multiple administrative services to support the practice of medicine by our affiliated physicians and improve operating efficiencies of our affiliated practice groups.
| • | Unit Management. A senior physician practicing medicine in each neonatal, anesthesia, radiology, pediatric intensivist, maternal-fetal, pediatric cardiology and other subspecialty practice that we manage acts as the medical director for that practice. Each medical director is responsible for the overall management of his or her practice, including staffing and scheduling, quality of care, professional discipline, utilization review, coordinating physician recruitment and monitoring of the financial success within the practice. Medical directors also serve as a liaison with hospital administration, other physicians and the community. |
| • | Staffing and Scheduling. We assist with staffing and scheduling physicians and advanced practice nurses within the units and practices that we manage. For example, each NICU is staffed by at least one specialist on site or available on call. For our affiliated anesthesia physicians, CRNAs and AAs, we employ an operational system that assists with their staffing and scheduling. We are responsible for managing and coordinating the process for the salaries and benefits paid and provided to our affiliated physicians and practitioners. In addition, we employ, compensate and manage all non-medical personnel for our affiliated physician groups. |
| • | Recruiting and Credentialing. We have significant experience in locating, qualifying, recruiting and retaining experienced physicians. We maintain an extensive nationwide database of neonatologists, maternal-fetal medicine physicians, anesthesiologists and other pediatric subspecialty physicians and are working to develop such a database for radiologists. Our medical directors and physician leaders play a central role in the recruiting and interviewing process before candidates are introduced to other practice group physicians and hospital administrators. We verify the credentials, licenses and references of all prospective affiliated physician candidates. In addition to our database of physicians, we recruit nationally through trade advertising, referrals from our affiliated physicians and attendance at conferences. |
| • | Billing, Collection and Reimbursement. We assume responsibility for assisting our affiliated physicians with contracting with third-party payors. We are responsible for billing, collection and reimbursement for services rendered by our affiliated physicians. In all instances, however, we do not assume responsibility for charges relating to services provided by hospitals or other physicians with whom we collaborate. Such charges are separately billed and collected by the hospitals or other physicians. We provide our affiliated physicians and other clinicians with a training curriculum that emphasizes detailed documentation of and compliant coding protocols for all procedures performed and services provided, and we provide comprehensive internal auditing processes, all of which are designed to achieve compliant coding, billing and collection of revenue for physician services. Generally, our billing and collection operations are conducted from our business offices located across the United States and in Puerto Rico, as well as our corporate offices. |
| • | Risk Management. We maintain a risk management program focused on reducing risk, including the identification and communication of potential risk areas to our medical affairs staff. We maintain professional liability coverage for our national group of affiliated healthcare professionals. Through our risk management and medical affairs staff, we conduct risk management programs for loss prevention and early intervention in order to prevent or minimize professional liability claims. |
| • | Compliance. We provide a multi-faceted compliance program that is designed to assist our affiliated practice groups in understanding and complying with the increasingly complex laws, rules and regulations that govern the provision of healthcare services. |
| • | Other Services. We also provide management information systems, facilities management, legal support, marketing support and other services to our affiliated physicians and affiliated practice groups. |
14
Table of Contents
OUR INFORMATION SYSTEMS
We maintain several information systems that support our day-to-day operations, ongoing clinical research and business analysis.
| • | BabySteps®. BabySteps is a clinical electronic documentation system used by our affiliated neonatal physicians and other clinicians to record clinical progress notes and certain laboratory and radiology reports electronically and provides a decision tree to assist them in certain situations with the selection of appropriate billing codes. |
| • | Clinical Data Warehouse. BabySteps enables our affiliated practices to capture a consistent set of clinical information about the patients we treat. We de-identify and transfer information from our electronic health records that reside in BabySteps to our “clinical data warehouse” that since inception has accumulated clinical information from more than 24 million daily progress records relating to over 1.3 million neonatal health records. With comprehensive reporting tools, our physicians are able to use this information to benchmark outcomes, enhance clinical decision-making and advance best practices at the bedside. Using a variety of clinical performance markers, our de-identified data warehouse also helps us track medication and procedure interactions, link treatments to outcomes and identify opportunities to enhance patient outcomes. Our clinical data warehouse also helps us to identify prospective clinical trials and continuous quality improvement initiatives. |
| • | Quantum®. Quantum is a quality metric acquisition and database tool that has been implemented in our anesthesiology physician practices. Quantum collects patient level data in real time through the continuum of care and includes over 1 million audited patient encounters. Over 80 quantifiable metrics assess patient satisfaction, efficiency, physician performance, and quality indicators. The data is then stored, analyzed and reported to physicians and hospitals. Our clinicians use the data, along with evidence-based medicine, to develop and implement best practices and standard operating procedures, for educational programs and for providing quality metrics to our hospital partners, all with the goal of improving outcomes and efficiency and ensuring patient satisfaction. Since 2015, Quantum has been certified by CMS as a QCDR, a reporting mechanism available for the Physician Quality Reporting System, the former CMS program initiated to promote reporting of quality measures. In 2016, we significantly increased the acquisition, data-basing and use of quality data as all of our anesthesiology clinicians are currently reporting quality metrics for almost 2 million patient encounters that are managed within the Quantum QCDR. In 2017, as part of the annual CMS QCDR self-nomination process, MEDNAX expanded its QCDR inventory to also include measures relevant to radiology and interventional pain management in addressing the CMS requirements for the Merit-Based Incentive Payment System. With this expansion of specialties represented by our QCDR, CMS approved our self-nomination for 2018 as the MEDNAX QCDR. |
| • | Nextgen®. We have licensed the Nextgen Electronic Medical Record (“EMR”) and Electronic Patient Management (“EPM”) system for our affiliated office-based physicians and other clinicians to record clinical documentation related to their patients and to manage the revenue cycle for our office-based practices. This system has the ability to provide benefits to our office-based practices that are similar to what BabySteps provides to our neonatology practices, including decision trees to assist physicians with the selection of compliant billing codes, promotion of consistent documentation, and data for research and education. We are continuing the process of implementing EMR and EPM in all of our office-based practices. |
| • | eCCAP. Our electronic charge capture system is used to appropriately record and bill for pediatric intensive care clinicians, hospitalist clinicians and other clinical care providers. We also use administrative data derived from this system to drive quality assurance and quality improvement programs. |
| • | Radiology Clinical Data Warehouse. Our extensive database of aggregated and normalized radiology studies powers our sophisticated analytics capabilities. Our analytics technology provides evidence- |
15
Table of Contents
| based insights to our own practice and to key decision makers at hospitals and healthcare systems, as well as to onsite radiology groups regarding optimal staffing, imaging utilization and clinical outcomes, all to help them more efficiently manage their radiology service lines and practices. Our analytics tools are relevant for both hospitals trying to better manage costs and improve operating efficiencies, as well as to radiology groups trying to demonstrate value in an increasingly challenging and evolving healthcare reimbursement environment. Our analytics tools differentiate us as a strategic partner to both existing and new clients who rely on our insight to efficiently manage their radiology service lines and practices. |
| • | Pediatrix University® and American Anesthesiology University. In addition to providing continuing education, our web-based education platforms also function as important educational adjuncts to our affiliated physician groups, providing a rich source of ongoing medical education for our physicians and enabling physicians to discuss cases with one another through various clinical resources. In 2018, we will be transitioning our online universities to the MEDNAX® Learning Center and expanding to incorporate all our clinical specialties. |
Our management information systems are also an integral element of the billing and reimbursement process. We maintain systems that provide for electronic data interchange with payors that accept electronic submissions, including electronic claims submission, insurance benefits verification and claims processing and remittance advice, which enable us to track numerous and diverse third-party payor relationships and payment methods. Our information systems provide scalability and flexibility as payor groups upgrade their payment and reimbursement systems. We continually seek improvements to our systems to expedite the overall process, streamline information gathering from our clinical systems and improve efficiencies in the reimbursement process.
We maintain additional information systems designed to improve operating efficiencies of our affiliated practice groups, reduce physicians’ paperwork requirements and facilitate interaction among our affiliated physicians and their colleagues regarding patient care issues. Following the acquisition of a physician practice group, we implement systematic procedures to improve the acquired group’s operating and financial performance. One of our first steps is to convert a newly acquired group to our broad-based management information system. We also maintain a database management system to assist our business development and recruiting departments to identify potential practice group acquisitions and physician candidates.
RELATIONSHIPS WITH OUR PARTNERS
Our business model, which has been influenced by the direct contact and daily interaction that our affiliated physicians have with their patients, emphasizes a patient-focused clinical approach that addresses the needs of our various “partners,” including hospitals, third-party payors, referring and collaborating physicians, affiliated physicians and, most importantly, our patients.
Hospitals and Other Customers
Our relationships with our hospital partners and other customers are critical to our operations. Hospitals control access to their units and operating rooms through the awarding of contracts and hospital privileges. We have been retained by approximately 545 hospitals to staff and manage clinical activities within specific hospital-based units and other departments. Our affiliated physicians are important components of obstetric, pediatric and surgical services provided at hospitals. Our hospital-based focus enhances our relationships with hospitals and creates opportunities for our affiliated physicians to provide patient care in other areas of the hospital. For example, our physicians may provide care in emergency rooms, nurseries, intensive care units and other departments where access to specialized obstetric, pediatric and anesthesia care may be critical. Our hospital partners benefit from our expertise in managing critical care units and other settings staffed with physician specialists, including managing variable admission rates, operating costs, complex reimbursement systems and other administrative burdens. We work with our hospital partners to enhance their reputation and market our
16
Table of Contents
services to referring physicians within the communities served by those hospitals. We also provide radiology physician services to hospitals and other physician groups. In addition, our affiliated physicians work with our hospital partners to develop integrated services programs for solutions within the services we provide. Integrated programs provide our hospital partners and us with incremental growth and result in a broader spectrum of care across our specialties and permit us to extend our patient service lines into our existing markets. Our relationships with our hospital partners are continually evolving with the goal of being viewed by them as a solutions provider across all of our specialties.
Under our contracts with hospitals, we have the responsibility to manage, in many cases exclusively, the provision of physician services for hospital-based units, such as NICUs, and other hospital settings. We typically are responsible for billing patients and third-party payors for services rendered by our affiliated physicians separately from other related charges billed by the hospital or other physicians to the same payors. Some of our hospital contracts require hospitals to pay us administrative fees. Some contracts provide for fees if the hospital does not generate sufficient patient volume in order to guarantee that we receive a specified minimum revenue level. We also receive fees from hospitals for administrative services performed by our affiliated physicians providing medical director services at the hospital. Administrative fees accounted for 9% of our net revenue during 2017. Some of our contracts with hospitals require us to indemnify them and their affiliates for losses resulting from the negligence of our affiliated physicians. Our hospital contracts typically have terms of one to three years which can be terminated without cause by either party upon prior written notice, and renew automatically for additional terms of one to three years unless terminated early by any party. While we have in most cases been able to renew these arrangements, hospitals may cancel or not renew our arrangements, or reduce or eliminate our administrative fees in the future.
Third-Party Payors
Our relationships with government-sponsored or funded healthcare programs (“GHC Programs”), including Medicare and Medicaid, and with managed care organizations and commercial health insurance payors are vital to our business. We seek to maintain professional working relationships with our third-party payors, streamline the administrative process of billing and collection, and assist our patients and their families in understanding their health insurance coverage and any balances due for co-payments, co-insurance, deductibles or benefit limitations. In addition, through our quality initiatives and continuing research and education efforts, we have sought to enhance clinical care provided to patients, which we believe benefits third-party payors by contributing to improved patient outcomes and reduced long-term health system costs.
We receive compensation for professional services provided by our affiliated physicians to patients based upon rates for specific services provided, principally from third-party payors. Our billed charges are substantially the same for all parties in a particular geographic area, regardless of the party responsible for paying the bill for our services, but the payments we receive vary among payors. A significant portion of our net revenue is received from GHC Programs, principally state Medicaid and federal Medicare programs.
Medicaid programs, which are jointly funded by the federal government and state governments, pay for medical and health-related services for certain categories of individuals and families generally who have low incomes or disabilities. Medicaid programs can be either standard fee-for-service payment programs or managed care programs in which states have contracted with health insurance companies to run local or state-wide health plans with features similar to health maintenance organizations. Our compensation rates under standard fee-for-service Medicaid programs are established by state governments and are not negotiated. Although Medicaid rates vary across the states, these rates are generally much lower in comparison to private-sector health plan rates. Rates under Medicaid managed care programs typically are negotiated, but are also much lower in comparison to private-sector health plan rates.
The Affordable Care Act (“ACA”) allows states to expand their Medicaid programs to enroll more individuals through federal payments that fund most of the cost of increasing the Medicaid eligibility income
17
Table of Contents
limit from a state’s historical eligibility levels to 133% of the federal poverty level. To date, 32 states and the District of Columbia have expanded Medicaid eligibility to cover this additional low income patient population, but other states are considering expansion. All of the states in which we operate, however, already cover children in the first year of life and pregnant women if their household income is at or below 133% of the federal poverty level. In light of changes to the ACA, some of these states may eliminate, reduce or otherwise modify expanded enrollment eligibility. See Item 1A. Risk Factors — “State budgetary constraints and the uncertainty over the future Medicaid expansion could have an adverse effect on our reimbursement from Medicaid programs” and “The ACA and potential changes to it may have a significant effect on our business.”
Medicare is a health insurance program primarily for individuals 65 years of age and older, younger individuals with certain disabilities and individuals with end-stage renal disease. The program is available without regard to income or assets (with means-tested premiums for beneficiaries with relatively high incomes) and offers beneficiaries different ways to obtain their medical benefits. The most common option selected today by Medicare beneficiaries is the traditional fee-for-service payment system. The other options include managed care, preferred provider organizations, private fee-for-service and specialty plans. Medicare compensation rates are generally much lower in comparison to private-sector health plans. Because we provide services to a wide array of patients, including Medicare beneficiaries, a portion of our patients’ services are reimbursed by Medicare.
In order to participate in government programs, we and our affiliated practices must comply with stringent and often complex standards, including enrollment and reimbursement requirements. Different states also impose varying standards for their Medicaid programs. See “Government Regulation—Government Reimbursement Requirements.”
We also receive compensation pursuant to contracts with commercial payors that offer a wide variety of health insurance products, such as health maintenance organizations, preferred provider organizations and exclusive provider organizations that are subject to various state laws and regulations, as well as employer-sponsored coverage subject to federal Employee Retirement Income Security Act (“ERISA”) requirements. We seek to secure mutually agreeable contracts with payors that enable our affiliated physicians to be listed as in-network participants within the payors’ provider networks. We generally contract with commercial payors through our affiliated professional contractors. Subject to applicable laws, rules and regulations, the terms, conditions and compensation rates of our contracts with commercial third-party payors are negotiated and often vary across markets and among payors. In some cases, we contract with organizations that establish and maintain provider networks and then rent or lease such networks to the actual payor. Our contracts with commercial payors typically provide for discounted fee-for-service arrangements and grant each party the right to terminate the contracts without cause upon prior written notice. In addition, these contracts generally give commercial payors the right to audit our billings and related reimbursements for professional and other services provided by or through our affiliated physicians.
If we do not have a contractual relationship with a health insurance payor, we generally bill the payor our full billed charges. If payment is less than billed charges, we bill the balance to the patient, subject to federal and state laws regulating such billing. Although we maintain standard billing and collections procedures with appropriate discounts for prompt payment, we also provide discounts in certain hardship situations where patients and their families do not have financial resources necessary to pay the amount due for services rendered. Any amounts written-off are based on the specific facts and circumstances related to each individual patient account.
Referring and Collaborating Physicians
Our relationships with our referring and collaborating physicians are critical to our success. Our affiliated physicians seek to establish and maintain professional relationships with referring physicians in the communities where they practice. Because patient volumes in our NICUs are based in part on referrals from other physicians,
18
Table of Contents
particularly obstetricians, it is important that we are responsive to the needs of referring physicians in the communities in which we operate. We believe that our community presence, through our hospital coverage and outpatient clinics, assists referring obstetricians, office-based pediatricians and family physicians with their practices. Our affiliated physicians are able to provide comprehensive maternal-fetal, newborn and pediatric subspecialty care to patients using the latest advances in methodologies, supporting the local referring physician community with 24-hours-a-day, seven-days-a-week on-site or on-call coverage.
Our affiliated anesthesiologists seek to establish and maintain professional relationships with collaborating physicians, such as surgeons, and other healthcare providers. Our affiliated anesthesiologists play an important role for surgeons because they provide medical care to the patient throughout the surgical experience. This care includes evaluation of the patient prior to surgery, consultations with the surgical team, providing pain control and support of life functions during surgery and supervising care following surgery through the discharge of the patient from the recovery unit. Accordingly, our affiliated anesthesiologists are focused on delivering quality services to enhance the reputation and satisfaction of collaborating surgeons.
Affiliated Physicians and Practice Groups
Our relationships with our affiliated physicians are important. Our affiliated physicians are organized in traditional practice group structures. In accordance with applicable state laws, our affiliated practice groups are responsible for the provision of medical care to patients. Our affiliated practice groups are separate legal entities organized under state law as business corporations or professional associations, professional corporations, limited liability companies and partnerships, which we sometimes refer to as our “affiliated professional contractors”. Each of our affiliated professional contractors is owned by a licensed physician affiliated with the Company through employment or another contractual relationship. Our national infrastructure enables more effective and efficient sharing of new discoveries and clinical outcomes data, including best demonstrated processes, access to our sophisticated information systems, clinical research and education.
Our business corporations and affiliated professional contractors employ or contract with physicians to provide clinical services in certain states and Puerto Rico. In most of our affiliated practice groups, each physician has entered into an employment agreement with us or one of our affiliated professional contractors providing for a base salary and incentive bonus eligibility and typically having a term of three to seven years. We are typically responsible for billing patients and third-party payors for services rendered by our affiliated physicians and, with respect to services provided in a hospital, separately from other charges billed by hospitals to the same payors. Each physician must hold a valid license to practice medicine in the state in which he or she provides patient care and must become a member of the medical staff, with appropriate clinical privileges, at each hospital at which he or she practices. Substantially all the physicians employed by us or our affiliated professional contractors have agreed not to compete within a specified geographic area during employment and for a certain period after termination of employment. Although we believe that the non-competition covenants of our affiliated physicians are reasonable in scope and duration and therefore enforceable under applicable state laws, we cannot predict whether a court or arbitration panel would enforce these covenants in any particular case. Our hospital contracts also typically require that we and the physicians performing services maintain minimum levels of professional and general liability insurance. We negotiate those policies and contract and pay the premiums for such insurance on behalf of the physicians.
Each of our affiliated professional contractors has entered into a comprehensive management agreement with a subsidiary of MEDNAX as the manager. Under the terms of these management agreements, and subject to state laws and other regulations, the manager is typically paid for its services based on the performance of the applicable practice group. See “Government Regulation—Fee Splitting; Corporate Practice of Medicine.”
COMPETITION
The physician services industry is highly fragmented. Competition in our business is generally based upon a number of factors, including reputation, experience and level of care and our affiliated physicians’ ability to
19
Table of Contents
provide cost-effective, quality clinical care. The nature of competition for our hospital-based practices, such as neonatology, anesthesiology and radiology, differs significantly from competition for our office-based practices. Our hospital-based practices compete nationally with other health services companies and physician groups for hospital contracts and qualified physicians. In some instances, our hospital-based physicians also compete on a regional or local basis. For example, our neonatologists compete for referrals from local physicians and transports from surrounding hospitals. Our office-based practices, such as maternal-fetal medicine and pediatric cardiology, compete for patients with office-based practices in those subspecialties. In addition, we compete in our teleradiology service line with other teleradiology service providers where costs to provide services may be lower and turnaround times may be faster. We also compete directly with hospitals themselves as they may consider reading images with their own employed radiologists rather than outsource those reads to our affiliated radiologists.
Hospitals control access to their NICUs and operating rooms by awarding contracts and hospital clinical privileges, and our relationships with our hospital partners are critical to our operations. Because our operations consist primarily of physician services provided within hospital-based units, we compete with others for contracts with hospitals to provide services. We also compete with hospitals themselves to provide such services. Hospitals may employ neonatologists, anesthesiologists or radiologists directly or contract with other physician groups to provide services either on an exclusive or non-exclusive basis. A hospital not otherwise competing with us may begin to do so by opening a new NICU or operating facility, expanding the capacity of an existing NICU, adding operating room suites or, in the case of neonatal services, upgrading the level of its existing NICU. If the hospital chooses to do so, it may award the contract to operate the relevant facility to a competing group or company from within or outside the surrounding community. Our contracts with hospitals generally provide that they may be terminated without cause upon prior written notice.
The healthcare industry is highly competitive. Companies in other segments of the industry as well as healthcare-focused and other private equity firms, some of which have financial and other resources greater than ours, may become competitors in providing neonatal, anesthesia, radiology and teleradiology, maternal-fetal and other pediatric subspecialty care.
GOVERNMENT REGULATION
The healthcare industry is governed by a framework of federal and state laws, rules and regulations that are extensive and complex and for which, in many cases, the industry has the benefit of only limited judicial and regulatory interpretation. The resources and costs required to comply with these laws, rules and regulations are high. If we or one of our affiliated practice groups or service businesses is found to have violated these laws, rules or regulations, our business, financial condition and results of operations could be materially, adversely affected. The ACA made numerous changes that are having the effect of reshaping the United States healthcare delivery system. Further healthcare reform, including potential repeal of or changes to the ACA, continues to attract significant legislative and administrative interest, legal challenges, regulatory and compliance requirements, new approaches and public attention that create uncertainty and the potential for additional changes. Healthcare reform implementation, additional legislation or regulations, and other changes in government policy or regulation may affect our reimbursement, restrict our existing operations, limit the expansion of our business or impose additional compliance requirements and costs, any of which could have a material adverse effect on our business, financial condition, results of operations, cash flows and the trading price of our securities. See Item 1A. Risk Factors — “The ACA and potential changes to it may have a significant effect on our business.”
Licensing and Certification
Each state imposes licensing requirements on individual physicians and clinical professionals, and on facilities operated or utilized by healthcare companies like us. Many states require regulatory approval, including certificates of need, before establishing certain types of healthcare facilities, offering certain services or
20
Table of Contents
expending amounts in excess of statutory thresholds for healthcare equipment, facilities or programs. We and our affiliated physicians are also required to meet applicable Medicare provider requirements under federal laws, rules and regulations and Medicaid provider requirements under federal and state laws, rules and regulations.
Fee Splitting; Corporate Practice of Medicine
Many states have laws that prohibit business corporations, such as MEDNAX, from practicing medicine, employing physicians to practice medicine, exercising control over medical decisions by physicians, or engaging in certain arrangements, such as fee splitting, with physicians. In light of these restrictions, we operate by maintaining long-term management contracts through our subsidiaries with affiliated professional contractors, which employ or contract with physicians to provide physician professional services. Under these arrangements, our manager subsidiaries perform only non-medical administrative services, do not represent that they offer medical services and do not exercise influence or control over the practice of medicine by the physicians employed by the affiliated professional contractors. In states where fee splitting with a business corporation or manager is prohibited, the fees that are received from the affiliated professional contractors have been established on a basis that we believe complies with applicable laws. Although the relevant laws in these states have been subject to limited judicial and regulatory interpretation, we believe that we are in compliance with applicable state laws in relation to the corporate practice of medicine and fee splitting. However, regulatory authorities or other parties, including our affiliated physicians, may assert that, despite these arrangements, we or our manager subsidiaries are engaged in the corporate practice of medicine or that the contractual arrangements with the affiliated professional contractors constitute unlawful fee splitting, in which case we could be subject to administrative, civil or criminal remedies or penalties, the contracts could be found to be legally invalid and unenforceable, in whole or in part, or we could be required to restructure our contractual arrangements with our affiliated professional contractors.
Fraud and Abuse Provisions
Existing federal laws, as well as similar state laws, governing Medicare, Medicaid, other GHC Programs and other non-governmental arrangements and interactions, impose a variety of fraud and abuse prohibitions on healthcare companies like us. These laws are interpreted broadly and enforced aggressively by multiple government agencies, including the Office of Inspector General of the Department of Health and Human Services, the Department of Justice (“DOJ”) and various state agencies.
Federal and state fraud and abuse laws apply to and affect our financial relationships and other ordinary and common business interactions with hospitals, referring physicians and other healthcare entities. In particular, the federal anti-kickback statute makes it a crime to knowingly and willfully solicit, receive, offer, or pay any remuneration in return for either referring items or services for which payment may be made in whole or in part by a GHC Program or purchasing, leasing, ordering, or arranging for or recommending the purchase, lease, or ordering of any service or item for which payment may be made in whole or in part by a GHC Program. In addition, the federal physician self-referral law, commonly known as the “Stark Law,” is a strict liability statute that prohibits a physician from making a referral to an entity for certain “designated health services” if the physician has a financial relationship with that entity, unless an exception applies. The entity is prohibited from billing the Medicare program for designated health services furnished pursuant to a prohibited referral. These laws have been broadly interpreted by federal courts and agencies, and potentially subject many healthcare business arrangements to government investigation, enforcement and prosecution, which can be costly and time consuming. Many of the states in which we operate also have similar anti-kickback and self-referral laws that apply to our government and non-government business.
Violations of these laws are punishable by substantial penalties and other remedies, including monetary fines, civil penalties, administrative remedies, criminal sanctions (in the case of the anti-kickback statute), exclusion from participation in GHC Programs and forfeiture of amounts collected in violation of such laws.
21
Table of Contents
There are a variety of other types of federal and state fraud and abuse laws, including laws authorizing the imposition of criminal, civil and administrative penalties for submitting false or fraudulent claims for reimbursement to GHC Programs. These laws include the federal civil False Claims Act (“FCA”), which prohibits knowingly presenting, or causing to be presented, false claims to GHC Programs, including Medicare, Medicaid, TRICARE (the program for military dependents and retirees), the Federal Employees Health Benefits Program, and insurance plans purchased through the ACA insurance exchanges where payments include federal funds. Substantial civil fines and treble damages, along with other remedies, including exclusion from GHC Programs, can be imposed for violating the FCA. Furthermore, the FCA does not require that the individual or company that presented or caused to be presented an allegedly false claim have actual knowledge of its falsity. The statute applies where the individual or company acted in “reckless disregard” or in “deliberate ignorance” of the truth or falsity of the claim. The FCA also applies to the improper retention of identified overpayments and includes “whistleblower” provisions that permit private citizens to sue a claimant on behalf of the government and share in the amounts recovered under the law. In recent years, many cases have been brought against healthcare companies by the government and by “whistleblowers,” which have resulted in judgments and settlements involving substantial payments to the government by the companies involved. The cost to defend against allegations can also be substantial.
In addition, the Civil Monetary Penalties Law imposes substantial civil monetary penalties against a person or entity that engages in other prohibited activities, such as presenting or causing to be presented a claim to a GHC Program that the person knows or should know is for an item or service that was not provided as claimed or for a claim that is false or fraudulent, or providing remuneration to a GHC Program beneficiary that the person or entity knows or should know is likely to influence the beneficiary’s selection of a provider or supplier. Regulators also have the authority to exclude individuals and entities from participation in GHC Programs under the Civil Monetary Penalties Law.
The civil and administrative false claims statutes are being applied in a broad range of circumstances. For example, claims for services that are medically unnecessary or fail to meet applicable coverage standards may, under certain circumstances, violate these statutes. Claims for services that were induced by kickbacks and Stark Law violations may also form the basis for FCA liability. Many of the laws and regulations referenced above can be used in conjunction with each other.
If we or our affiliated professional contractors were excluded from participation in any GHC Programs, not only would we be prohibited from submitting claims for reimbursement under such programs, but we also would be unable to contract with other healthcare providers, such as hospitals, to provide services to them. It could also adversely affect our or our affiliated professional contractors’ ability to contract with, or obtain payment from, non-governmental payors.
Although we intend to conduct our business in compliance with all applicable federal and state fraud and abuse laws, many of the laws, rules and regulations applicable to us, including those relating to billing and those relating to financial relationships with physicians and hospitals, are broadly worded and may be interpreted or applied by prosecutorial, regulatory or judicial authorities in ways that we cannot predict. Accordingly, we cannot assure you that our arrangements or business practices will not be subject to government scrutiny or be alleged or found to violate applicable fraud and abuse laws. If there is a determination by government authorities that we have not complied with any of these laws, rules and regulations, our business, financial condition and results of operations could be materially, adversely affected. See “Government Investigations.”
Government Reimbursement Requirements
In order to participate in the Medicare program and in the various state Medicaid programs, we and our affiliated physician practices must comply with stringent and often complex enrollment and reimbursement requirements. Moreover, different states impose varying standards for their Medicaid programs. While our compliance program requires that we and our affiliated physician practices adhere to the laws, rules and
22
Table of Contents
regulations applicable to the government programs in which we participate, our failure to comply with these laws, rules and regulations could negatively affect our business, financial condition and results of operations. See “Government Regulation—Fraud and Abuse Provisions,” “Government Regulation—Compliance Program,” “Government Investigations” and “Other Legal Proceedings,” and Item 1A. Risk Factors — “Government-funded programs, private insurers or state laws and regulations may limit, reduce or make retroactive adjustments to reimbursement amounts or rates,” “We may become subject to billing investigations by federal and state government authorities” and “The healthcare industry is highly regulated, and government authorities may determine that we have failed to comply with applicable laws, rules or regulations.”
In addition, GHC Programs are subject to statutory and regulatory changes, administrative rulings, interpretations and determinations, requirements for utilization review and new governmental funding restrictions, all of which may materially increase or decrease program payments, as well as affect the cost of providing services and the timing of payments to providers. Moreover, because these programs generally provide for reimbursement on a fee-schedule basis rather than on a charge-related basis, we generally cannot increase our revenue through increases in the amount we charge for our services. To the extent our costs increase, we may not be able to recover our increased costs from these programs, and cost containment measures and market changes in non-governmental insurance plans have generally restricted our ability to recover, or shift to non-governmental payors, these increased costs. In attempts to limit federal and state spending, there have been, and we expect that there will continue to be, a number of proposals to limit or reduce Medicare and Medicaid reimbursement for various services. Our business may be significantly and adversely affected by any such changes in reimbursement policies and other legislative initiatives aimed at reducing healthcare costs associated with Medicare, Medicaid and other government healthcare programs.
Our business also could be adversely affected by reductions in or limitations of reimbursement amounts or rates under these government programs, reductions in funding of these programs or elimination of coverage for certain individuals or treatments under these programs.
Antitrust
The healthcare industry is subject to close antitrust scrutiny. The Federal Trade Commission (“FTC”), the Antitrust Division of the DOJ and state Attorneys General all actively review and, in some cases, take enforcement action against business conduct and acquisitions in the healthcare industry. Private parties harmed by alleged anticompetitive conduct can also bring antitrust suits. Violations of antitrust laws may be punishable by substantial penalties, including significant monetary fines, civil penalties, criminal sanctions, consent decrees and injunctions prohibiting certain activities or requiring divestiture or discontinuance of business operations. Any of these penalties could have a material adverse effect on our business, financial condition, results of operations, cash flows and the trading price of our securities.
HIPAA and Other Privacy, Security and Breach Notification Laws
Numerous federal and state laws, rules and regulations govern the collection, dissemination, use, privacy, security and confidentiality of personal information. For example, the federal Health Insurance Portability and Accountability Act of 1996, as amended (“HIPAA”), and its implementing regulations impose requirements to protect the privacy and security of protected health information (“PHI”) and to provide notification in the event of a breach of PHI. Violations of HIPAA are punishable by civil money penalties and, in some cases, criminal penalties and imprisonment. The U.S. Department of Health and Human Services (“HHS”) Office for Civil Rights (“OCR”), which is responsible for enforcing HIPAA, also may enter into resolution agreements or take other actions to obtain compliance and/or corrective actions to address violations of HIPAA. As part of our business operations, including in connection with medical record keeping, third-party billing, research and other services, we and our affiliated physician practices collect and maintain PHI regarding patients, which subjects us to compliance with HIPAA requirements.
23
Table of Contents
Pursuant to HIPAA, HHS has adopted privacy regulations, known as the privacy rule, to govern the use and disclosure of PHI (the “Privacy Rule”). The Privacy Rule applies to “Covered Entities,” which are health plans, health care clearinghouses, and health care providers that engage in standardized transactions under HIPAA, and, as discussed further below, “Business Associates,” which are entities that perform functions or services for or on behalf of Covered Entities that involve the use or disclosure of PHI. A “Business Associate” also includes any “Subcontractor,” which means any entity to whom a Business Associate delegates any function, activity or service, other than in the capacity of a member of the Business Associate’s workforce. PHI is broadly defined as any individually identifiable health information transmitted or maintained in any form, including electronic, paper or oral. As a general rule, a Covered Entity or Business Associate may not use or disclose PHI except as permitted under the Privacy Rule. We have implemented privacy policies and procedures, including training programs, designed to comply with the requirements set forth in the Privacy Rule, including as amended to reflect changes to HIPAA under HITECH, as discussed further below.
HHS has also adopted data security regulations (the “Security Rule”) that require Covered Entities (including health care providers) and Business Associates to implement administrative, physical and technical safeguards to protect the integrity, confidentiality and availability of individually identifiable health information that is electronically created, received, maintained or transmitted (such as between us and our affiliated practices). We have implemented security policies, procedures and systems, including training programs, designed to comply with the requirements set forth in the Security Rule.
In addition, Congress enacted the Health Information Technology for Economic and Clinical Health (“HITECH”) Act as part of the American Recovery and Reinvestment Act. Among other changes to the laws governing PHI, HITECH strengthened and expanded HIPAA requirements, increased penalties for violations, gave patients new rights to restrict uses and disclosures of their PHI, and imposed a number of privacy and security requirements directly on Business Associates, which are directly subject to civil and criminal penalties under HIPAA as a result of HITECH. Notably, as a result of HITECH, a Covered Entity is liable for violations of HIPAA resulting from the acts or omissions of any Business Associate acting as its agent, as determined by the federal common law of agency.
Under HITECH, Covered Entities are required to report any unauthorized use or disclosure of PHI that meets the definition of a breach to affected individuals, HHS and, depending on the number of affected individuals, the media for the affected market. In addition, HITECH requires that Business Associates report breaches to their Covered Entity customers. HITECH also authorizes state Attorneys General to bring civil actions in response to violations of HIPAA that threaten the privacy of state residents. We have adopted breach notification policies and procedures designed to comply with the applicable requirements set forth in HITECH.
HIPAA established a federal “floor” with respect to privacy, security, and breach notification requirements and does not supersede any state laws insofar as they are broader or more stringent than HIPAA. Numerous state and certain other federal laws protect the confidentiality of patient information and other personal information, including but not limited to state medical privacy laws, state laws protecting personally identifiable information, state data breach notification laws, state genetic privacy laws, human subjects research laws and federal and state consumer protection laws.
These requirements are also subject to change. Compliance with new privacy, security, and breach notification laws, regulations and requirements may result in increased operating costs, and may constrain or require us to alter our business model or operations. For example, HITECH further restricted our ability to collect, disclose and use PHI and imposed additional compliance requirements on us.
HIPAA Transaction Requirements
In addition to privacy, security, and breach notifications requirements, HIPAA and its implementing regulations establish uniform electronic data transmission standards that all healthcare providers must use for
24
Table of Contents
electronic healthcare transactions. For example, claims for reimbursement that are transmitted electronically to third-party payors must comply with specific formatting standards, and these standards apply whether the payor is a government or a private entity. We report medical diagnoses under International Classification of Diseases, 10th Edition (“ICD-10”). If claims are not reported properly under ICD-10 due to technical or coding errors or other implementation issues involving systems, including ours and those of our third-party payors, there can be a delay in the processing and payment of such claims, or a denial of such claims, which could have a material adverse effect on our business, financial condition, results of operations, cash flows and the trading price of our securities.
Environmental Regulations
Our healthcare operations generate medical waste that must be disposed of in compliance with federal, state and local environmental laws, rules and regulations. Our office-based operations are subject to compliance with various other environmental laws, rules and regulations. Such compliance does not, and we anticipate that such compliance will not, materially affect our capital expenditures, financial position or results of operations.
Compliance Program
We maintain a compliance program that includes the established elements of an effective program and reflects our commitment to complying with all laws, rules and regulations applicable to our business and that meets our ethical obligations in conducting our business (the “Compliance Program”). We believe our Compliance Program provides a solid framework to meet this commitment and our obligations as a provider of healthcare services, including:
| • | a Chief Compliance Officer who reports to the Board of Directors on a regular basis; |
| • | a Compliance Committee consisting of our senior executives; |
| • | a formal internal audit function, including a Senior Director of Internal Audit who reports to the Audit Committee on a regular basis; |
| • | our Code of Conduct, which is applicable to our employees, independent contractors, officers and directors; |
| • | our Code of Professional Conduct – Finance, which is applicable to our finance personnel, including our Chief Executive Officer, Chief Financial Officer and Treasurer and Chief Accounting Officer; |
| • | a disclosure program that includes a mechanism to enable individuals to disclose on a confidential or anonymous basis to the Chief Compliance Officer or any person who is not in the disclosing individual’s chain of command, issues or questions believed by the individual to be a potential violation of criminal, civil, or administrative laws or of company policies or procedures; |
| • | an organizational structure designed to integrate our compliance objectives into our corporate offices, divisions, regions and practices; and |
| • | education, monitoring and corrective action programs designed to establish methods to promote the understanding of our Compliance Program and adherence to its requirements. |
The foundation of our Compliance Program is our Code of Conduct, which is intended to be a comprehensive statement of the ethical and legal standards governing the daily activities of our employees, affiliated professionals, independent contractors, officers and directors. All of our personnel are required to abide by, and are given thorough education regarding, our Code of Conduct. In addition, all employees and affiliated professionals are expected to report incidents that they believe in good faith may be in violation of our Code of Conduct. We maintain a toll-free helpline to permit individuals to report compliance concerns on an anonymous basis and obtain answers to questions about our Code of Conduct. Our Compliance Program, including our Code of Conduct, is administered by our Chief Compliance Officer with oversight by our Chief Executive Officer,
25
Table of Contents
Compliance Committee and Board of Directors. Copies of our Code of Conduct and our Code of Professional Conduct – Finance are available on our website, www.mednax.com. Our internet website and the information contained therein or connected thereto are not incorporated into or deemed a part of this Form 10-K. Any amendments or waivers to our Code of Professional Conduct – Finance will be promptly disclosed on our website following the date of any such amendment or waiver.
GOVERNMENT INVESTIGATIONS
We expect that audits, inquiries and investigations from government authorities, agencies, contractors and payors will occur in the ordinary course of business. Such audits, inquiries and investigations and their ultimate resolutions, individually or in the aggregate, could have a material adverse effect on our business, financial condition, results of operations, cash flows and the trading price of our securities.
OTHER LEGAL PROCEEDINGS
In the ordinary course of our business, we become involved in pending and threatened legal actions and proceedings, most of which involve claims of medical malpractice related to medical services provided by our affiliated physicians. Our contracts with hospitals generally require us to indemnify them and their affiliates for losses resulting from the negligence of our affiliated physicians and other clinicians. We may also become subject to other lawsuits that could involve large claims and significant defense costs. We believe, based upon a review of pending actions and proceedings, that the outcome of such legal actions and proceedings will not have a material adverse effect on our business, financial condition, results of operations, cash flows and the trading price of our securities. The outcome of such actions and proceedings, however, cannot be predicted with certainty and an unfavorable resolution of one or more of them could have a material adverse effect on our business, financial condition, results of operations, cash flows and the trading price of our securities.
Although we currently maintain liability insurance coverage intended to cover professional liability and certain other claims, we cannot ensure that our insurance coverage will be adequate to cover liabilities arising out of claims asserted against us in the future where the outcomes of such claims are unfavorable to us. With respect to professional liability risk, we self-insure a significant portion of this risk through our wholly owned captive insurance subsidiary. Liabilities in excess of our insurance coverage, including coverage for professional liability and certain other claims, could have a material adverse effect on our business, financial condition, results of operations, cash flows and the trading price of our securities. See “Professional and General Liability Coverage.”
PROFESSIONAL AND GENERAL LIABILITY COVERAGE
We maintain professional and general liability insurance policies with third-party insurers generally on a claims-made basis, subject to deductibles, self-insured retention limits, policy aggregates, exclusions, and other restrictions, in accordance with standard industry practice. We believe that our insurance coverage is appropriate based upon our claims experience and the nature and risks of our business. However, we cannot predict whether any pending or future claim would be successful or, if successful, would not exceed the limits of available insurance coverage.
Our business entails an inherent risk of claims of medical malpractice against our affiliated physicians, clinicians and us. We contract and pay premiums for professional liability insurance that indemnifies us and our affiliated healthcare professionals generally on a claims-made basis for losses incurred related to medical malpractice litigation. Professional liability coverage is required in order for our affiliated physicians to maintain hospital privileges. Our self-insured retention under our professional liability insurance program is maintained primarily through a wholly owned captive insurance subsidiary. We record estimates in our Consolidated Financial Statements for our liabilities for self-insured retention amounts and claims incurred but not reported based on an actuarial valuation using historical loss information, claim emergence patterns and various actuarial assumptions. Liabilities for claims incurred but not reported are not discounted. Because many factors can affect
26
Table of Contents
historical and future loss patterns, the determination of an appropriate reserve involves complex, subjective judgment, and actual results may vary significantly from estimates. If the self-insured retention amounts and other amounts that we are actually required to pay materially exceed the estimates that have been reserved, our financial condition, results of operations and cash flows could be materially, adversely affected.
EMPLOYEES AND PROFESSIONALS UNDER CONTRACT
In addition to the 4,075 practicing physicians affiliated with us as of December 31, 2017, we employed or contracted with approximately 4,150 other clinical professionals and approximately 7,675 other full-time and part-time employees.
GEOGRAPHIC COVERAGE
We provide physician services across all 50 states, the District of Columbia and Puerto Rico. In addition, through our complementary service businesses, we provide full service revenue cycle management and consulting services to healthcare facilities and physicians nationwide. During 2017, approximately 51% of our net revenue was generated by operations in our five largest states. Our operations in Texas accounted for approximately 19% of our net revenue for the same period. Although we continue to seek to diversify the geographic scope of our operations, primarily through acquisitions of physician group practices, we may not be able to implement successfully or realize the expected benefits of any of these initiatives. Adverse changes or conditions affecting states in which our operations are concentrated, such as healthcare reforms, changes in laws, rules and regulations, reduced Medicare or Medicaid reimbursements, an increase in the income level required to qualify for government healthcare programs or government investigations, may have a material adverse effect on our business, financial condition, results of operations, cash flows and the trading price of our securities.
SERVICE MARKS
We have registered with the United States Patent and Trademark Office the service marks “MEDNAX National Medical Group and Design,” “Pediatrix Medical Group and Design,” “Obstetrix Medical Group and Design,” “American Anesthesiology and Design,” “BabySteps,” the “Baby Design,” “Quality Steps,” “Quantum Clinical Navigation System,” “iNewborn,” “NEO Conference and Design,” “MedData” and “vRad,” among others.
AVAILABLE INFORMATION
Our annual proxy statements, annual reports on Form 10-K, quarterly reports on Form 10-Q, current reports on Form 8-K and amendments to those statements and reports filed or furnished pursuant to Section 13(a) or 15(d) of the Securities Exchange Act of 1934 are available free of charge and may be printed out through our internet website, www.mednax.com, as soon as reasonably practicable after we electronically file such material with, or furnish it to, the SEC. Our proxy statements and reports may also be obtained directly from the SEC’s Internet website at www.sec.gov or from the SEC’s Public Reference Room at 100 F Street, N.E., Washington, D.C. 20549. Information on the operation of the Public Reference Room can be obtained by calling 1-800-SEC-0330. Our internet website and the information contained therein or connected thereto are not incorporated into or deemed a part of this Form 10-K.
27
Table of Contents
| ITEM 1A. | RISK FACTORS |
Our business is subject to a number of factors that could materially affect future developments and performance. In addition to factors affecting our business that have been described elsewhere in this Form 10-K, any of the following risks could have a material adverse effect on our business, financial condition, results of operations, cash flows and the trading price of our securities.
Economic conditions could have an adverse effect on our business.
Our operations and performance depend significantly on economic conditions. During the year ended December 31, 2017, the percentage of our patient service revenue being reimbursed under GHC Programs increased slightly as compared to the year ended December 31, 2016. Although economic conditions in the United States have improved since the economic downturn several years ago, we could experience additional shifts toward GHC Programs, and patient volumes could decline, if economic conditions deteriorate. Adverse economic conditions could also lead to additional increases in the number of unemployed and under-employed workers and a decline in the number of private employers that offer healthcare insurance coverage to their employees. Employers that do offer healthcare coverage may increase the required contributions from employees to pay for their coverage and increase patient responsibility amounts. In addition, certain private payors’ poor experience with the healthcare insurance exchanges and uncertainty around the future of the ACA and healthcare insurance exchanges may result in those payors exiting the healthcare insurance exchange marketplaces or the cessation of the healthcare insurance exchanges. As a consequence, the number of patients who participate in GHC Programs or who are uninsured or underinsured could increase. Payments received from GHC Programs are substantially less than payments received from private healthcare insurance programs (managed care and other third-party payors). Payments under policies issued through the healthcare insurance exchanges may be less than payments from private healthcare insurance programs and in some cases, patients’ responsibility for costs related to healthcare plans obtained through the healthcare insurance exchanges may be high and could increase in the future, and we may experience increased bad debt due to patients’ inability to pay for certain services. A payor mix shift from private healthcare insurance programs to GHC Programs or to healthcare insurance exchanges may result in an increase in our estimated provision for contractual adjustments and uncollectibles and a corresponding decrease in our net revenue, as well as a significant reduction in our average reimbursement rates.
State budgetary constraints and the uncertainty over the future of Medicaid could have an adverse effect on our reimbursement from Medicaid programs.
Congress and the current Administration have expressed interest in repealing, and have attempted to repeal, the ACA and substantially reform the Medicaid program. In doing so, Congress may repeal the provisions of the ACA that encouraged states to expand Medicaid eligibility to more adults, including additional federal matching funds that enabled states to do so. The ACA allowed states to expand their Medicaid programs through federal payments that fund most of the cost of increasing the Medicaid eligibility income limit from a state’s historic eligibility levels to 133% of the federal poverty level. As of December 31, 2017, 32 states and the District of Columbia implemented the expansion of Medicaid eligibility. All of the states in which we operate, however, already cover children in the first year of life and pregnant women if their household incomes are at or below 133% of the federal poverty level. If states that expanded Medicaid reduce or eliminate eligibility for certain individuals, the number of patients who are uninsured could increase. Some states may seek to maintain expanded eligibility and to do so could offset the cost by further reducing payments to providers of services. In some states, we could experience delayed or reduced Medicaid payment for services furnished to program enrollees.
Congress and the current Administration is also considering enacting substantial reforms to Medicaid law to grant states more autonomy and discretion to design Medicaid programs. These changes, if enacted, could reduce or eliminate eligibility for certain individuals, or allow states to reduce payments to providers of services. As a
28
Table of Contents
result, in some states, we could experience an increase in the number of uninsured patients and delayed or reduced Medicaid payment for services furnished to program enrollees.
In addition, many states are continuing to collect less tax revenue than they did historically and as a consequence continue to face budget shortfalls and underfunded pension and other obligations. Although shortfalls have been declining in more recent budgetary years, they are still significant by historical standards. The financial condition of the states in which we do business could lead to reduced or delayed funding for Medicaid programs and, in turn, reduced or delayed reimbursement for physician services, which could adversely affect our results of operations, cash flows and financial condition.
The birth rate in the United States may decline.
Provisional birth data for 2016 indicate that total births in the United States declined by less than 1% as compared to 2015. Although the provisional data for 2017 is not yet available, we expect that birth trends have not materially changed. However, future declines in births are possible and could have an adverse effect on our patient volumes, net revenue, results of operations, cash flows and financial condition.
The ACA and potential changes to it may have a significant effect on our business.
The ACA contains a number of provisions that have affected us and, absent amendment or repeal, may continue to affect us over the next several years. These provisions include the establishment of health insurance exchanges to facilitate the purchase of qualified health plans, expanded Medicaid eligibility, subsidized insurance premiums and additional requirements and incentives for businesses to provide healthcare benefits. Other provisions have expanded the scope and reach of FCA and other healthcare fraud and abuse laws. Moreover, we could be affected by potential changes to various aspects of the ACA, including subsidies, healthcare insurance marketplaces and Medicaid expansion.
The ACA remains subject to continuing legislative and administrative scrutiny, including efforts by the Republican-controlled Congress and the current Administration to amend or repeal a number of its provisions, as well as administrative actions delaying the effectiveness of key provisions. At the end of 2017, Congress repealed part of the ACA that required most individuals to purchase and maintain health insurance. If the ACA is repealed or further substantially modified, or if implementation of certain aspects of the ACA are diluted or delayed, such repeal, modification or delay may impact our business, financial condition, results of operations, cash flows and the trading price of our securities. We are unable to predict the impact of any repeal, modification or delay in the implementation of the ACA, including the repeal of the individual mandate, on us at this time.
In addition to the potential impacts to the ACA under the current Administration, there could be more sweeping changes to GHC Programs, such as a change in the structure of Medicaid by converting it into a block grant or instituting “per capita caps,” which could eliminate the guarantee that everyone who is eligible and applies for benefits would receive them and could potentially give states sweeping new authority to restrict eligibility, cut benefits and make it more difficult for people to enroll. Additionally, several states are considering and pursuing changes to their Medicaid programs, such as requiring recipients to engage in employment activities as a condition of eligibility for most adults, disenrolling recipients for failure to pay a premium, or adjusting premium amounts based on income.
The ACA and the Medicare Access and CHIP Reauthorization Act of 2015 (“MACRA”) also contain numerous other measures that could also affect us, including, for example, requirements that physicians participate in quality measurement programs that differentiate payments to physicians under Medicare based on quality and cost of care, among other things, or in alternative payment models that bundle payments for episodes of care and share savings based upon established quality of care standards. MACRA also remains subject to review and potential modification by Congress. CMS also has developed a number of voluntary and mandatory demonstration programs that shift payment risk to providers. We will continue to evaluate the impact of the voluntary and mandatory demonstration and shared savings programs on our business and operations.
29
Table of Contents
As a result, we ultimately cannot predict with any assurance the ultimate effect of these laws and resulting changes to payments under GHC Programs, nor can we provide any assurance that they will not have a material adverse effect on our business, financial condition, results of operations, cash flows and the trading price of our securities. Further, any fiscal tightening impacting GHC Programs or changes to the structure of any GHC Programs could have a material adverse effect on our financial condition, results of operations, cash flows and the trading price of our securities.
Expanding eligibility of government-sponsored programs could adversely affect our reimbursement.
In January 2018, Congress reauthorized the Children’s Health Insurance Program (“CHIP”) through 2023 and then in February 2018 lengthened this funding extension through 2027. Changes to CHIP or the ACA’s expansion of Medicaid coverage could cause patients who otherwise would have participated in private healthcare insurance programs to participate in GHC Programs, or vice versa, or cause patients who otherwise would have been covered by CHIP or Medicaid to lose insurance coverage altogether. Additional reform efforts, as well as amendment or repeal of the ACA, could change the eligibility requirements for Medicaid and for other GHC Programs, including CHIP, and could increase the number of patients who participate in such programs or the number of uninsured patients. Payments received from government-sponsored programs are substantially less than payments received from private healthcare insurance programs (managed care and other third-party payors). A shift in the mix of our payors from private healthcare insurance programs to government payors may result in an increase in our estimated provision for contractual adjustments and uncollectibles and a corresponding decrease in our net revenue, as well as a significant reduction in our average reimbursement rates. Additionally, if Congress does not act to extend CHIP beyond 2027, or if Congress extends CHIP but substantially alters the current program, we could be adversely affected if children in states where we do business lose Medicaid coverage or payments for services furnished to these children are delayed or reduced.
Government-funded programs, private insurers or state laws and regulations may limit, reduce or make retroactive adjustments to reimbursement amounts or rates.
A significant portion of our net revenue is derived from payments made by GHC Programs, principally Medicare and Medicaid. These government-funded programs, as well as private insurers, have taken and may continue to take steps, including a movement toward increased use of managed care organizations, value-based purchasing, and new patient care models to control the cost, eligibility for, use and delivery of healthcare services as a result of budgetary constraints and cost containment pressures due to unfavorable economic conditions, rising healthcare costs and for other reasons, including those described above under Item 1. Business—“Government Regulation—Government Reimbursement Requirements.” These government-funded programs and private insurers may attempt other measures to control costs, including bundling of services and denial of, or reduction in, reimbursement for certain services and treatments. In addition, increased consolidation among private insurers is resulting in fewer and larger third-party payors with increased negotiating power. As a result, payments from government programs or private payors may decrease significantly. Also, any adjustment in Medicare reimbursement rates may have a detrimental impact on our reimbursement rates not only for Medicare patients, but also for patients covered under Medicaid and other third-party payors, because a state’s Medicaid payments cannot exceed the payments it would have made had those patients been enrolled in traditional Medicare, and other third-party payors often base their reimbursement rates on a percentage of Medicare rates. Our business may also be materially affected by limitations on, or reductions in, reimbursement amounts or rates or elimination of coverage for certain individuals or treatments. Moreover, because government-funded programs generally provide for reimbursements on a fee-schedule basis rather than on a charge-related basis, we generally cannot increase our revenue from these programs through increases in the amount we charge for our services. To the extent our costs increase, we may not be able to recover our increased costs from these programs, and cost containment measures and market changes in non-government-funded insurance plans have generally restricted our ability to recover, or shift to non-governmental payors, these increased costs. In addition, funds we receive from third-party payors are subject to audit with respect to the proper billing for physician and ancillary services and, accordingly, our revenue from these programs may be adjusted retroactively. Any retroactive adjustments to
30
Table of Contents
our reimbursement amounts could have a material adverse effect on our business, financial condition, results of operations, cash flows and the trading price of our securities.
In addition, our agreements with certain third-party payors may be terminated for various reasons, requiring us to seek reimbursement as an out-of-network provider. In the event we attempt to balance-bill patients, we may be limited in our ability to do so by certain state laws and regulations. As these laws and regulations continue to develop in certain states, it could incentivize certain third-party payors to terminate agreements as a business strategy which could lower overall reimbursement to providers. Any reductions in reimbursement amounts could have a material adverse effect on our business, financial condition, results of operations, cash flows and the trading price of our securities.
Medicare pays for most physician services based upon a national service-specific fee schedule. In 2015, Congress enacted the MACRA legislation under which physicians must choose to participate in one of two payment formulas, Merit-Based Incentive Payment System (“MIPS”) or Alternative Payment Models (“APMs”). Beginning in 2019, MIPS will allow eligible physicians to receive incentive payments from Medicare based on the achievement of certain quality and cost metrics, among other measures, and be reduced for those who are underperforming against those same metrics and measures. As an alternative, physicians can choose to participate in an Advanced APM. Advanced APMs are exempt from the MIPS requirements, and physicians who are meaningful participants in APMs will receive bonus payments from Medicare pursuant to the law. We will continue to operationalize the provisions of MACRA and assess any further changes to the law or additional regulations enacted pursuant to the law. At this time we cannot predict the ultimate effect that these changes will have on us, nor can we provide any assurance that these changes will not have a material adverse effect on our business, financial condition, results of operations, cash flows and the trading price of our securities.
We may become subject to billing investigations by federal and state government authorities and private insurers.
Federal and state laws, rules and regulations impose substantial penalties, including criminal and civil fines, monetary penalties, exclusion from participation in government healthcare programs and imprisonment, on entities or individuals (including any individual corporate officers or physicians deemed responsible) that fraudulently or wrongfully bill government-funded programs or other third-party payors for healthcare services. CMS requires states to maintain a Medicaid Recovery Audit Contractor (“RAC”) program. States are required to contract with one or more eligible Medicaid RACs to review Medicaid claims for any overpayments or underpayments, and to recoup overpayments from providers on behalf of the state. In addition, federal laws, along with a growing number of state laws, allow a private person to bring a civil action in the name of the government for false billing violations. See Item 1. Business— “Government Regulation—Fraud and Abuse Provisions.” Moreover, the current Administration has expressed a desire to increase scrutiny of providers and payments for services to further minimize fraud and abuse of the program. In addition, our contracts with private insurers often provide such insurers with audit rights over payments made to us and the ability to seek recoupment for perceived overpayments. We believe that audits, inquiries and investigations from government agencies and private insurers will occur from time to time in the ordinary course of our business, which could result in substantial costs to us and a diversion of management’s time and attention. New regulations and heightened enforcement activity also could materially affect our cost of doing business and our risk of becoming the subject of an audit or investigation. We cannot predict whether any future audits, inquiries or investigations, or the public disclosure of such matters, likely would have a material adverse effect on our business, financial condition, results of operations, cash flows and the trading price of our securities. See Item 1. Business—“Government Investigations.”
The healthcare industry is highly regulated, and government authorities may determine that we have failed to comply with applicable laws, rules or regulations.
The healthcare industry and physicians’ medical practices, including the healthcare and other services that we and our affiliated physicians provide, are subject to extensive and complex federal, state and local laws, rules
31
Table of Contents
and regulations, compliance with which imposes substantial costs on us. Of particular importance are the provisions summarized as follows:
| • | federal laws (including the federal FCA) that prohibit entities and individuals from knowingly or recklessly making claims to Medicare, Medicaid and other government-funded programs that contain false or fraudulent information or from improperly retaining known overpayments; |
| • | a provision of the Social Security Act, commonly referred to as the “anti-kickback” statute, that prohibits the knowing and willful offer, payment, solicitation or receipt of any bribe, kickback, rebate or other remuneration, in cash or in kind, in return for the referral or recommendation of patients for items and services covered, in whole or in part, by federal healthcare programs, such as Medicare and Medicaid; |
| • | a provision of the Social Security Act, commonly referred to as the Stark Law, that, subject to certain exceptions, prohibits physicians from referring Medicare patients to an entity for the provision of certain “designated health services” if the physician or a member of such physician’s family has a direct or indirect financial relationship (including a compensation arrangement) with the entity; |
| • | similar state law provisions pertaining to anti-kickback, fee splitting, self-referral and false claims, which typically are not limited to relationships involving government-funded programs; |
| • | provisions of HIPAA that prohibit knowingly and willfully executing a scheme or artifice to defraud a healthcare benefit program or falsifying, concealing or covering up a material fact or making any material false, fictitious or fraudulent statement in connection with the delivery of or payment for healthcare benefits, items or services; |
| • | federal and state laws related to confidentiality, privacy and security of personal information, including medical information and records, that limit the manner in which we may use and disclose that information, impose obligations to safeguard that information and require that we notify third parties in the event of a breach; |
| • | state laws that prohibit general business corporations from practicing medicine, controlling physicians’ medical decisions or engaging in certain practices, such as splitting fees with physicians; |
| • | federal and state laws governing participation in GHC Programs could result in denial of our application to become a participating provider or revocation of our participation or billing privileges, which in turn, could cause us to not be able to treat patients covered by the applicable program or prohibit us from billing for the treatment services provided to such patients; |
| • | federal and state laws that prohibit providers from billing and receiving payment from Medicare and Medicaid for services unless the services are medically necessary, adequately and accurately documented and billed using codes that accurately reflect the type and level of services rendered; |
| • | federal and state laws pertaining to the provision of services by non-physician practitioners, such as advanced nurse practitioners, physician assistants and other clinical professionals, physician supervision of such services and reimbursement requirements that may be dependent on the manner in which the services are provided and documented; and |
| • | federal laws that impose civil administrative sanctions for, among other violations, inappropriate billing of services to federally funded healthcare programs, inappropriately reducing hospital inpatient lengths of stay for such patients, or employing individuals who are excluded from participation in federally funded healthcare programs. |
In addition, we believe that our business will continue to be subject to increasing regulation, the scope and effect of which we cannot predict. See Item 1. Business—“Government Regulation.”
We may in the future become the subject of regulatory or other investigations, audits or proceedings, and our interpretations of applicable laws, rules and regulations may be challenged. For example, regulatory
32
Table of Contents
authorities or other parties may assert that our arrangements with our affiliated professional contractors constitute fee splitting or the corporate practice of medicine and seek to invalidate these arrangements, which could have a material adverse effect on our business, financial condition, results of operations, cash flows and the trading price of our securities. See Item 1. Business—“Government Regulation—Fee Splitting; Corporate Practice of Medicine.” Regulatory authorities or other parties also could assert that our relationships, including fee arrangements, among our affiliated professional contractors, hospital clients or referring physicians violate the anti-kickback, fee splitting or self-referral laws and regulations or that we have submitted false claims or otherwise failed to comply with government program reimbursement requirements. See Item 1. Business—“Government Regulation—Fraud and Abuse Provisions” and “—Government Reimbursement Requirements.” Such investigations, proceedings and challenges could result in substantial defense costs to us and a diversion of management’s time and attention. In addition, violations of these laws are punishable by monetary fines, civil and criminal penalties, exclusion from participation in GHC Programs, and forfeiture of amounts collected in violation of such laws and regulations, any of which could have a material adverse effect on our business, financial condition, results of operations, cash flows and the trading price of our securities.
Federal and state laws that protect the privacy and security of personal information may increase our costs and limit our ability to collect and use that information and subject us to liability if we are unable to fully comply with such laws.
Numerous federal and state laws, rules and regulations govern the collection, dissemination, use, security and confidentiality of personal information, including individually identifiable health information. These laws include:
| • | Provisions of HIPAA that limit how covered entities and business associates may use and disclose PHI, provide certain rights to individuals with respect to that information and impose certain security requirements; |
| • | HITECH, which strengthens and expands the HIPAA Privacy Rule and Security Rule and imposes data breach notification obligations; |
| • | Other federal and state laws restricting the use and protecting the privacy and security of personal information, including health information, many of which are not preempted by HIPAA; |
| • | Federal and state consumer protection laws; and |
| • | Federal and state laws regulating the conduct of research with human subjects. |
As part of our business operations, including our medical record keeping, third-party billing, research and other services, we collect and maintain PHI in paper and electronic format. Standards related to health information, whether implemented pursuant to HIPAA, HITECH, state laws, federal or state action or otherwise, could have a significant effect on the manner in which we handle personal information, including healthcare-related data, and communicate with payors, providers, patients and others, and compliance with these standards could impose significant costs on us or limit our ability to offer services, thereby negatively impacting the business opportunities available to us.
If we are alleged to not comply with existing or new laws, rules and regulations related to PHI we could be subject to litigation and to sanctions that include monetary fines, civil or administrative penalties, civil damage awards or criminal penalties.
Government authorities or other parties may assert that our business practices violate antitrust laws.
The healthcare industry is subject to close antitrust scrutiny. The FTC, the Antitrust Division of the DOJ and state Attorneys General all actively review and, in some cases, take enforcement action against business conduct and acquisitions in the healthcare industry. Private parties harmed by alleged anticompetitive conduct can also
33
Table of Contents
bring antitrust suits. Violations of antitrust laws may be punishable by substantial penalties, including significant monetary fines, civil penalties, criminal sanctions, and consent decrees and injunctions prohibiting certain activities or requiring divestiture or discontinuance of business operations. Any of these penalties could have a material adverse effect on our business, financial condition, results of operations, cash flows and the trading price of our securities.
Our affiliated physicians and third-party contractors may not appropriately record or document services that they provide.
Our affiliated physicians are responsible for appropriately recording and documenting the services that they provide. We use this information to seek reimbursement for their services from third-party payors. In addition, we utilize third-party contractors to perform certain revenue cycle management functions for healthcare providers, including medical coding. If our physicians and third-party contractors do not appropriately document, or where applicable, code for their services or our customers’ services, we could be subjected to administrative, regulatory, civil, or criminal investigations or sanctions and our business, financial condition, results of operations and cash flows could be materially adversely affected.
Failure to manage third-party service providers may adversely affect our ability to maintain the quality of service that we provide.
We outsource a certain portion of our revenue cycle management functions to third-party service providers, but we may increase the amount of revenue cycle management functions we outsource in the future. These functions are performed both domestically and in offshore locations, with our oversight. If our outsourcing partners fail to perform their obligations in a timely manner or at satisfactory quality levels or if they are unable to attract or retain sufficient personnel with the necessary skill sets to meet our outsourcing needs, the efficiency, effectiveness and quality of our services could suffer. In addition, our reliance on a workforce in other countries exposes us to disruptions in the business, political and economic environment in those regions. Further, any changes to existing laws or the enactment of new legislation restricting offshore outsourcing in the United States may adversely affect our ability to outsource functions to third-party offshore service providers. Our ability to manage any difficulties encountered could be largely outside of our control. In addition, payors may have prohibitions or restrictions on the use of third-party service providers and/or require notice for the use of such third-party service providers. Diminished service quality from outsourcing, our inability to utilize offshore service providers or the failure to know about restrictions on the use of third-party service providers could have an adverse effect on our business, financial condition, results of operations, cash flows and the trading price of our securities.
We may not find suitable acquisition candidates or successfully integrate our acquisitions. Our acquisitions may expose us to greater business risks and could affect our payor mix.
We have expanded and continue to seek to expand our presence in new and existing metropolitan areas by acquiring established neonatal, radiology, anesthesia, maternal-fetal, pediatric cardiology and other complementary pediatric subspecialty physician group practices as well teleradiology services companies. Also, both independently and in collaboration with our hospital partners, we may seek to expand into other specialties and subspecialties. In addition, we have acquired physician and other healthcare services companies that are complementary to our physician practices.
Our acquisition strategy involves numerous risks and uncertainties, including:
| • | We may not be able to identify suitable acquisition candidates or strategic opportunities or implement successfully or realize the expected benefits of any suitable opportunities. In addition, we compete for acquisitions with other potential acquirers, some of which may have greater financial or operational resources than we do. This competition may intensify due to the ongoing consolidation in the healthcare industry, which may increase our acquisition costs. |
34
Table of Contents
| • | We may not be able to complete acquisitions of physician practices or services companies or we may complete acquisitions on less favorable terms as a result of changes in tax laws, financial market or other economic or market conditions. |
| • | We may not be able to successfully integrate completed acquisitions, including our recent acquisitions. Integrating completed acquisitions into our existing operations involves numerous short-term and long-term risks, including diversion of our management’s attention, failure to retain key personnel, long-term value of acquired intangible assets and acquisition expenses. In addition, we may be required to comply with laws, rules and regulations that may differ not only from those of the states in which our operations are currently conducted but from an expansion in the service offerings we provide in certain states for which the laws, rules and regulations may be different. |
| • | We cannot be certain that any acquired business will continue to maintain its pre-acquisition revenue and growth rates or be financially successful. In addition, we cannot be certain of the extent of any unknown or contingent liabilities of any acquired business, including liabilities for failure to comply with applicable laws, or liabilities relating to medical malpractice claims. Generally we obtain indemnification agreements from the sellers of businesses acquired with respect to pre-closing acts, omissions and other similar risks. It is possible that we may seek to enforce indemnification provisions in the future against sellers who may no longer have the financial wherewithal to satisfy their obligations to us. Accordingly, we may incur material liabilities for past activities of acquired businesses. |
| • | We could incur or assume indebtedness and issue equity in connection with acquisitions. The issuance of shares of our common stock for an acquisition may result in dilution to our existing shareholders and, depending on the number of shares that we issue, the resale of such shares could affect the trading price of our common stock. |
| • | We may acquire businesses that derive a greater portion of their revenue from GHC Programs than what we recognize on a consolidated basis or that have business models with lower operating margins than ours. These acquisitions could affect our overall payor mix or operating results in future periods. |
| • | Acquisitions of practices and services companies could entail financial and operating risks not fully anticipated. Such acquisitions could divert management’s attention and our resources. |
| • | An acquisition could be subject to a challenge under the antitrust laws either before or after it is consummated. Such a challenge could involve substantial legal costs and divert management’s attention and resources and could result in us having to abandon the transaction or make a divestiture. |
We may not be able to successfully execute our same-unit and organic growth strategies.
In addition to our acquisition growth strategy, we seek opportunities for increasing revenue from our existing operations through same-unit and organic growth strategies. We also seek opportunities to grow organically outside of our existing operations. We may not be able to successfully execute our same-unit and organic growth strategies for reasons including the following:
| • | We may not be able to expand the services that our affiliated physicians provide to our hospital partners or the services provided by our services companies to their customers. |
| • | We may not be able to attract referrals to our office-based practices or neonatology transports to our hospital-based units. |
| • | We may not be able to execute new contractual arrangements with hospitals, including through joint ventures, where we either currently provide or do not currently provide physician services. |
| • | We may not be able to work with our hospital partners to develop integrated services programs for which we become a multi-specialty provider of solutions within the maternal-fetal, newborn, pediatric continuum of care. |
35
Table of Contents
| • | We may not accurately project same-unit and organic growth performance, or we may experience a shift in the mix of services that certain of our customers request from us, potentially resulting in lower margins. |
In addition, certain of our organic growth strategies may involve risks and uncertainties similar to those for our acquisition strategy. See “We may not find suitable acquisition candidates or successfully integrate our acquisitions. Our acquisitions may expose us to greater business risks and could affect our payor mix.”
We may not be able to maintain effective and efficient information systems or properly safeguard our information systems.
Our operations are dependent on uninterrupted performance of our information systems. Failure to maintain reliable information systems, disruptions in our existing information systems or the implementation of new systems could cause disruptions in our business operations, including errors and delays in billings and collections, difficulty satisfying requirements under hospital contracts, disputes with patients and payors, violations of patient privacy and confidentiality requirements and other regulatory requirements, increased administrative expenses and other adverse consequences.
In addition, information security risks have generally increased in recent years because of new technologies and the increased activities of perpetrators of cyber-attacks resulting in the theft of protected health, business or financial information. Despite our layered security controls, experienced computer programmers and hackers may be able to penetrate our information systems and misappropriate or compromise sensitive patient or personnel information or proprietary or confidential information, create system disruptions or cause shutdowns. They also may be able to develop and deploy viruses, worms and other malicious software programs that disable our systems or otherwise exploit any security vulnerabilities. Outside parties may also attempt to fraudulently induce employees to take actions, including the release of confidential or sensitive information or to make fraudulent payments, through illegal electronic spamming, phishing or other tactics.
A failure in or breach of our information systems as a result of cyber-attacks or other tactics could disrupt our business, result in the release or misuse of PHI, confidential or proprietary business information or cause financial loss, damage our reputation, increase our administrative expenses, and expose us to additional risk of liability to federal or state governments or individuals. Although we believe that we have robust information security procedures and other safeguards in place, which are monitored and routinely tested internally and by external parties, as cyber threats continue to evolve, we may be required to expend additional resources to continue to enhance our information security measures or to investigate and remediate any information security vulnerabilities. Our remediation efforts may not be successful and could result in interruptions, delays or cessation of service and loss of existing or potential customers and disruption of our operations, including, without limitation, our billing processes. In addition, breaches of our security measures and the unauthorized dissemination of patient healthcare and other sensitive information, proprietary or confidential information about us, our patients, clients or customers, or other third-parties, could expose such persons’ private information to the risk of financial or medical identity theft or expose us or such persons to a risk of loss or misuse of this information, result in litigation and potential liability for us, damage our brand and reputation or otherwise harm our business. Additionally, under certain circumstances, we could be excluded temporarily or permanently from certain commercial or GHC Programs. Any of these disruptions or breaches of security could have a material adverse effect on our business, financial condition, results of operations, cash flows and the trading price of our securities.
Our employees and business partners may not appropriately secure and protect confidential information in their possession.
Each of our employees and business partners is responsible for the security of the information in our systems or under our control and to ensure that private and financial information is kept confidential. Should an
36
Table of Contents
employee or business partner not follow appropriate security measures, including those related to cyber threats or attacks or other tactics, as well as our privacy and security policies and procedures, the improper release of personal information, including PHI, or confidential business or financial information, or misappropriation of assets could result. The release of such information or misappropriation of assets could have a material adverse effect on our business, financial condition, results of operations, cash flows and the trading price of our securities.
We may not be able to successfully recruit, onboard and retain qualified physicians and other clinicians and our compensation expense for existing clinicians may increase.
We are dependent upon our ability to recruit and retain a sufficient number of qualified physicians and other clinicians to service existing units at hospitals and our affiliated practices, service our existing customers’ radiology read volumes and expand our business. We compete with many types of healthcare providers, including teaching, research and government institutions, hospitals and health systems and other practice and services groups, for the services of qualified clinicians. We may not be able to continue to recruit new clinicians or renew contracts with existing clinicians on acceptable terms. In addition, the recruiting and onboarding process for certain of our physicians and other clinicians can take several months, or longer, to complete due to various requirements, including state licensing and hospital credentialing. In addition, if the demand exceeds the supply for physicians and other clinicians either in general or in specific markets, we could experience an increase in compensation expense, including premium pay and agency labor costs. If we are unable to recruit new physicians, renew contracts on acceptable terms or onboard physicians and clinicians in a reasonable period of time, our ability to service existing or new hospital units, staff existing or new office-based practices and service our existing or new customer radiology read volumes could be adversely affected. In addition, if we experience a higher rate of growth in clinician compensation expense, our business, financial condition, results of operations, cash flows and the trading price of our securities could be materially, adversely affected.
A significant number of our affiliated physicians or other clinicians could leave our affiliated practices or our affiliated professional contractors may be unable to enforce the non-competition covenants of departed physicians.
Our affiliated professional contractors usually enter into employment agreements with our affiliated physicians. Certain of our employment agreements can be terminated without cause by any party upon prior written notice. In addition, substantially all of our affiliated physicians have agreed not to compete within a specified geographic area for a certain period after termination of employment. The law governing non-compete agreements and other forms of restrictive covenants varies from state to state. Although we believe that the non-competition and other restrictive covenants applicable to our affiliated physicians are reasonable in scope and duration and therefore enforceable under applicable state law, courts and arbitrators in some states may be reluctant to enforce non-compete agreements and restrictive covenants against physicians. In addition, we may incur significant legal fees to pursue enforcement of such agreements and restrictive covenants. Our affiliated physicians or other clinicians may leave our affiliated practices for a variety of reasons, including in order to provide services for other types of healthcare providers, such as teaching, research and government institutions, hospitals and health systems and other practice groups. If a substantial number of our affiliated physicians or other clinicians leave our affiliated practices, we could incur significant legal fees to pursue enforcement of certain covenants within employment agreements or if our affiliated professional contractors are unable to enforce the non-competition covenants in the employment agreements, our business, financial condition, results of operations and cash flows could be materially, adversely affected.
Our treatment of certain physicians and other clinicians as independent contractors may be challenged by taxing authorities or other governmental agencies.
Certain of our affiliated physicians and other clinicians are treated as independent contractors, as opposed to employees, and, accordingly, we do not withhold federal income, state income, FICA, or other employment
37
Table of Contents
related taxes from these individuals’ compensation, make federal income, state income, FICA, or unemployment tax or other related payments, provide workers’ compensation insurance or allow them to participate in the benefits and retirement programs available to our employees, or apply federal or state employee requirements. The classification of physicians and other clinicians as independent contractors depends on the facts and circumstances of the relationship. Additionally, under current federal tax law, a safe harbor from reclassification, and consequently retroactive taxes and penalties, is available if our current treatment is consistent with a long-standing practice of a significant segment of our industry and if we meet certain other requirements. In the past, there have been proposals to eliminate the safe harbor, and similar proposals may happen again in the future. If taxing authorities or other governmental agencies are successful in challenging our treatment of these physicians and other clinicians as independent contractors, and we do not prevail in demonstrating the applicability of the safe harbor to our operations or the safe harbor is eliminated, we may be required to pay retroactive employment taxes and penalties and reclassify such independent contractors to employees. In addition, such independent contractors could claim retroactive entitlements to various employee benefits. Any of these actions would increase our costs related to these physicians and our business, financial condition, results of operations and cash flows could be materially, adversely affected.
We may be subject to medical malpractice and other lawsuits not covered by insurance.
Our business entails an inherent risk of claims of medical malpractice against our affiliated physicians and us. We may also be subject to other lawsuits which may involve large claims and significant defense costs. Although we currently maintain liability insurance coverage intended to cover professional liability and other claims, there can be no assurance that our insurance coverage will be adequate to cover liabilities arising out of claims asserted against us where the outcomes of such claims are unfavorable to us. Generally, we self-insure our liabilities to pay retention amounts for professional liability matters through a wholly owned captive insurance subsidiary. Liabilities in excess of our insurance coverage, including coverage for professional liability and other claims, could have a material adverse effect on our business, financial condition, results of operations, cash flows and the trading price of our securities. See Item 1. Business—“Other Legal Proceedings” and— “Professional and General Liability Coverage.”
The reserves that we have established related to our professional liability losses are subject to inherent uncertainties and if a deficiency is determined this may lead to a reduction in our net earnings.
We have established reserves for losses and related expenses that represent estimates involving actuarial projections. These actuarial projections are developed at a given point in time and represent our expectations of the ultimate resolution and administration of costs of losses incurred with respect to professional liability risks for the amount of risk retained by us. Insurance reserves are inherently subject to uncertainty. Our reserve estimates are based on actuarial valuations using historical claims, demographic factors, industry trends, severity and exposure factors and other actuarial assumptions. The estimates of projected ultimate losses are developed at least annually. Our reserves could be significantly affected should current and future occurrences differ from historical claim trends and expectations. While claims are monitored closely when estimating reserves, the complexity of the claims and wide range of potential outcomes often hamper timely adjustments to the assumptions used in these estimates. Actual losses and related expenses may deviate, perhaps substantially, from the reserve estimates reflected in our financial statements. If our estimated reserves are determined to be inadequate, we will be required to increase reserves at the time the deficiency is determined. See Item 7. Management’s Discussion and Analysis of Financial Condition and Results of Operations—“Application of Critical Accounting Policies and Estimates—Professional Liability Coverage.”
We may write-off intangible assets, such as goodwill.
The carrying value of our intangible assets, which consists primarily of goodwill related to our acquisitions, is subject to testing at least annually, and more frequently if impairment indicators exist. Under current accounting standards, goodwill is tested for impairment on an annual basis and we may be subject to impairment
38
Table of Contents
losses as circumstances change after an acquisition. If we record an impairment loss related to our goodwill, it could have a material adverse effect on our business, financial condition, results of operations, cash flows and the trading price of our securities.
We may not effectively manage our growth.
We have experienced significant growth in our business, including growth outside of our core physician specialties of neonatology and anesthesiology. Growth in the number of our employees and affiliated physicians in recent years places significant demands on our financial, operational and management resources. Continued growth may impair our ability to provide our services efficiently and to manage our employees adequately. While we are taking steps to manage our growth, our future results of operations could be materially, adversely affected if we are unable to do so effectively.
Our quarterly results will likely fluctuate from period to period.
We have historically experienced and expect to continue to experience quarterly fluctuations in net revenue and net income. For example, we typically experience negative cash flow from operations in the first quarter of each year, principally as a result of bonus payments to affiliated physicians as well as discretionary matching contributions for participants in our qualified contributory savings plans. In addition, a significant number of our employees and associated professional contractors (primarily affiliated physicians) exceed the level of taxable wages for social security contributions during the first and second quarters. As a result, we incur a significantly higher payroll tax burden and our net income is lower during those quarters. Moreover, a lower number of calendar days are present in the first and second quarters of the year as compared to the remainder of the year. Because we provide services in the NICU on a 24-hours-a-day basis, 365 days a year, any reduction in service days will have a corresponding reduction in net revenue. In addition, any reduction in office days in our office-based practices or business days in our anesthesia practices will also have a corresponding reduction in net revenue. We also have significant fixed operating costs, including costs for our affiliated physicians, and as a result, are highly dependent on patient volume and capacity utilization of our affiliated physicians to sustain profitability. Quarterly results may also be impacted by the timing of acquisitions and any fluctuation in patient volume. As a result, our results of operations for any quarter are not indicative of results of operations for any future period or full fiscal year.
Our current indebtedness and any future indebtedness could adversely affect us by reducing our flexibility to respond to changing business and economic conditions and expose us to interest rate risk to the extent of any variable rate debt. In addition, a certain portion of our interest expense may not be deductible.
As of December 31, 2017, our total indebtedness was $1.9 billion, of which $1.1 billion was exposed to variable interest rates. We also had $889.3 million of additional borrowing capacity under our revolving line of credit which was subject to a variable interest rate. Other debt we incur also could be variable rate debt. In addition, the Tax Cuts and Jobs Act of 2017 places certain limitations on the deductibility of interest expense at a percentage of taxable income. If interest rates increase, our variable rate debt will create higher debt service requirements, and if interest expense increases beyond a specified percentage of taxable income, a portion of that interest expense may not be deductible for income tax purposes, which could adversely affect our results of operations and cash flows.
We have limited restrictions on incurring substantial additional indebtedness in the future. Our current indebtedness and any future increases in leverage could have adverse consequences on us, including:
| • | a substantial portion of our cash flow from operations will be required to service interest and principal payments on our debt and will not be available for operations, working capital, capital expenditures, expansion, acquisitions, dividends or general corporate or other purposes; |
| • | our ability to obtain additional financing in the future may be impaired; |
39
Table of Contents
| • | we may be more highly leveraged than our competitors, which may place us at a competitive disadvantage; |
| • | our flexibility in planning for, or reacting to, changes in our business and industry may be limited; and |
| • | we may be more vulnerable in the event of a downturn in our business, our industry or the economy in general. |
Our ability to make payments on and to refinance our debt will depend on our ability to generate cash in the future. This, to a certain extent, is subject to general economic, business, financial, competitive, legislative, regulatory, and other factors that are beyond our control. We cannot assure you that our business will generate sufficient cash flow from operations or that future borrowings will be available under our revolving line of credit in an amount sufficient to enable us to pay our debt or to fund our other liquidity needs. We may need to refinance all or a portion of our debt on or before maturity. We cannot assure you that we will be able to refinance any of our debt, including our revolving line of credit and senior notes, on commercially reasonable terms or at all.
Servicing our debt requires a significant amount of cash.
Our ability to make scheduled payments on or to refinance our debt obligations depends on our financial condition and operating performance, which is subject to prevailing economic and competitive conditions and to certain financial, business, and other factors. We may not be able to maintain a level of cash flows from operating activities sufficient to permit us to pay the principal and interest on our indebtedness.
If our cash flows and capital resources are insufficient to fund our debt service requirements, we may be forced to reduce or delay acquisitions or other investments, or to seek additional capital, or restructure or refinance our indebtedness. Our ability to restructure or refinance our debt will depend on the condition of the capital markets and our financial condition at such time. In addition, any failure to make payments of interest and principal on our outstanding indebtedness on a timely basis would likely result in other defaults, disrupt our operations and cause a reduction of our credit rating, which could further harm our ability to finance or refinance our obligations and business operations. These alternative measures may not be successful and may not permit us to meet our scheduled debt service obligations.
The value of our common stock may fluctuate.
There has been significant volatility in the market price of securities of healthcare companies generally that we believe in many cases has been unrelated to operating performance. In addition, we believe that certain factors, such as actual and potential legislative and regulatory developments, including announced regulatory investigations, quarterly fluctuations in our actual or anticipated results of operations, lower revenue or earnings than those anticipated by securities analysts, not meeting publicly announced expectations, and general economic and financial market conditions, could cause the price of our common stock to fluctuate substantially.
We may not be able to collect reimbursements for our services from third-party payors.
A significant portion of our net revenue is derived from reimbursements from various third-party payors, including GHC Programs, private insurance plans and managed care plans, for services provided by our affiliated professional contractors. We are responsible for submitting reimbursement requests to these payors and collecting the reimbursements, and we assume the financial risks relating to uncollectible and delayed reimbursements. In the current healthcare environment, payors continue their efforts to control expenditures for healthcare, including revisions to coverage and reimbursement policies. Due to the nature of our business and our participation in government-funded and private reimbursement programs, we are involved from time to time in inquiries, reviews, audits and investigations by governmental agencies and private payors of our business practices, including assessments of our compliance with coding, billing and documentation requirements. We
40
Table of Contents
may be required to repay these agencies or private payors if a finding is made that we were incorrectly reimbursed, or we may become involved in disputes with payors and could be subjected to pre-payment and post-payment reviews, which can be time-consuming and result in non-payment or delayed payment for the services we provide. We may also experience difficulties in collecting reimbursements because third-party payors may seek to reduce or delay reimbursements to which we are entitled for services that our affiliated physicians have provided or they experience administrative issues that result in a delay in reimbursements. In addition, GHC Programs may deny our application to become a participating provider that could cause us to not be able to provide services to patients or prohibit us from billing for such services. If we are not reimbursed fully and in a timely manner for such services or there is a finding that we were incorrectly reimbursed, our revenue, cash flows and financial condition could be materially, adversely affected.
In addition, adverse economic conditions could affect the timeliness and amounts received from our third-party and government payors which would impact our short-term liquidity needs.
Hospitals or other customers may terminate their agreements with us, our physicians may lose the ability to provide services in hospitals or administrative fees paid to us by hospitals may be reduced.
Our net revenue is derived primarily from fee-for-service billings for patient care and other services provided by our affiliated physicians and from administrative fees paid to us by hospitals. See Item 1. Business—“Relationships with Our Partners—Hospitals.” Our hospital partners or other customers may cancel or not renew their contracts with us, may reduce or eliminate our administrative fees in the future, or refuse to pay us our administrative fees if we fail to honor the terms of our agreement or fail to meet certain performance metrics under those agreements. Further, consolidation of hospitals, health care systems or other customers could adversely affect our ability to negotiate with these entities. Adverse economic conditions, including decreased federal and state funding to hospitals, could influence future actions of our hospital partners or other customers. To the extent that our arrangements with our hospital partners or other customers are canceled, or are not renewed or replaced with other arrangements having at least as favorable terms, our business, financial condition and results of operations could be adversely affected. In addition, to the extent our affiliated physicians lose their privileges in hospitals or hospitals enter into arrangements with or employ other physicians, including our existing affiliated physicians, our business, financial condition, results of operations and cash flows could be materially, adversely affected.
Hospitals could limit our ability to use our management information systems in our units by requiring us to use their own management information systems.
Our management information systems, including BabySteps® and the Quantum Clinical Navigation System® are used to support our day-to-day operations and ongoing clinical research and business analysis. If a hospital prohibits us from using our own management information systems, it may interrupt the efficient operation of our information systems which, in turn, may limit our ability to operate important aspects of our business, including billing and reimbursement as well as research and education initiatives. This inability to use our management information systems at hospital locations may have a material adverse effect on our business, financial condition, results of operations and cash flows.
Our industry is already competitive and could become more competitive.
The healthcare industry is highly competitive and subject to continual changes in the methods by which services are provided and the manner in which healthcare providers are selected and compensated. Because our operations consist primarily of physician services provided within hospital-based units, we compete with other healthcare services companies and physician groups for contracts with hospitals to provide our services to patients. We also face competition from hospitals themselves to provide our services. In addition, we face competition from other services companies in our teleradiology business and management services organization.
41
Table of Contents
Further, consolidation within the healthcare industry could strengthen certain competitors that provide services to hospitals and other customers. Companies in other healthcare industry segments, some of which have greater financial and other resources than ours, may become competitors in providing neonatal, anesthesia, maternal-fetal, radiology or other pediatric subspecialty care. Additionally, we face competition from healthcare-focused and other private equity firms. We may not be able to continue to compete effectively in this industry, additional competitors may enter metropolitan areas where we operate, and this increased competition may have a material adverse effect on our business, financial condition, results of operations, cash flows and the trading price of our securities.
Unfavorable changes or conditions could occur in the states where our operations are concentrated.
A majority of our net revenue in 2017 was generated by our operations in five states. In particular, Texas accounted for approximately 19% of our net revenue in 2017. See Item 1. Business—“Geographic Coverage.” Adverse changes or conditions affecting these particular states, such as healthcare reforms, changes in laws and regulations, reduced Medicaid eligibility or reimbursements and government investigations, economic conditions, weather conditions, and natural disasters may have a material adverse effect on our business, financial condition, results of operations, cash flows and the trading price of our securities.
We are dependent upon our key management personnel for our future success.
Our success depends to a significant extent on the continued contributions of our key management personnel, including our Chief Executive Officer, Roger J. Medel, M.D., for the management of our business and implementation of our business strategy. The loss of Dr. Medel or other key management personnel could have a material adverse effect on our business, financial condition, results of operations, cash flows and the trading price of our securities.
We are subject to litigation risks.
From time to time, we are involved in various litigation matters and claims, including regulatory proceedings, administrative proceedings, governmental investigations, and contract disputes, as they relate to our services and business. We may face potential claims or liability for, among other things, breach of contract, defamation, libel, fraud or negligence. Our contracts with hospitals generally require us to indemnify them and their affiliates for losses resulting from the negligence of our affiliated physicians and other clinicians. We may also face employment-related litigation, including claims of age discrimination, sexual harassment, gender discrimination, immigration violations, or other local, state, and federal labor law violations. Because of the uncertain nature of litigation and insurance coverage decisions, the outcome of such actions and proceedings cannot be predicted with certainty and an unfavorable resolution of one or more of them could have a material adverse effect on our business, financial condition, results of operations, cash flows and the trading price of our securities. In addition, legal fees and costs associated with prosecuting and defending litigation matters could have a material adverse effect on our business, financial condition, results of operation and the trading price of our securities.
Provisions of our articles and bylaws could deter takeover attempts, but our business could be negatively affected as a result of shareholder activism.
Our Amended and Restated Articles of Incorporation, as amended, authorize our board of directors to issue up to 1,000,000 shares of undesignated preferred stock and to determine the powers, preferences and rights of these shares without shareholder approval. This preferred stock could be issued with voting, liquidation, dividend and other rights superior to those of the holders of common stock. The issuance of preferred stock under some circumstances could have the effect of delaying, deferring or preventing a change in control. In addition, provisions in our Amended and Restated Articles of Incorporation, as amended, and Bylaws, including those relating to calling shareholder meetings, taking action by written consent and other matters, could render it more
42
Table of Contents
difficult or discourage an attempt to obtain control of MEDNAX through a proxy contest or consent solicitation, however, there is no assurance that these provisions would have such an effect. These provisions could limit the price that some investors might be willing to pay in the future for our shares of common stock. Notwithstanding these provisions, we could become the target of activist shareholders who acquire ownership positions in our common stock and seek to influence our company. Responding to actions by activist shareholders can be costly and time-consuming, disrupt our business and divert the attention of our board of directors, management and employees. Additionally, perceived uncertainties as to our future direction as a result of shareholder activism may lead to the perception of a change in the direction of our business or other instability, which may be exploited by our competitors, cause concern to our current or potential customers and acquisition candidates, and make it more difficult for us to attract and retain qualified personnel, which could have a material adverse effect on our business, financial condition, results of operations, and cash flows and the trading prices of our securities. In addition, the trading prices of our securities may experience periods of increased volatility as a result of shareholder activism.
| ITEM 1B. | UNRESOLVED STAFF COMMENTS |
None.
| ITEM 2. | PROPERTIES |
Our corporate office building, which we own, is located in Sunrise, Florida and contains 80,000 square feet of office space. We own an additional corporate office building covering an additional 180,000 square feet in Sunrise, Florida. We also own an office building used for our management services organization call center operations covering 175,000 square feet in Cascade Falls, Michigan. We also lease space in hospitals and other facilities for our business and medical offices, and other needs. See Note 16 to the Consolidated Financial Statements in this Form 10-K, which is incorporated herein by reference. We believe that our facilities and the equipment used in our business are in good condition, in all material respects, and sufficient for our present needs.
| ITEM 3. | LEGAL PROCEEDINGS |
The information required by this Item is included in and incorporated herein by reference to Item 1. Business of this Form 10-K under “Government Investigations” and “Other Legal Proceedings.”
| ITEM 4. | MINE SAFETY DISCLOSURES |
Not applicable
43
Table of Contents
| ITEM 5. | MARKET FOR REGISTRANT’S COMMON EQUITY, RELATED STOCKHOLDER MATTERS AND ISSUER PURCHASES OF EQUITY SECURITIES |
Price Range of Common Stock
Our common stock is traded on the New York Stock Exchange (the “NYSE”) under the symbol “MD.” The high and low sales prices for a share of our common stock for each quarter during our last two fiscal years are set forth below:
| High | Low | |||||||
| 2017 |
||||||||
| Fourth Quarter |
$ | 54.05 | $ | 40.56 | ||||
| Third Quarter |
60.80 | 40.78 | ||||||
| Second Quarter |
69.57 | 53.80 | ||||||
| First Quarter |
72.13 | 64.05 | ||||||
| 2016 |
||||||||
| Fourth Quarter |
$ | 69.68 | $ | 59.36 | ||||
| Third Quarter |
76.96 | 62.63 | ||||||
| Second Quarter |
73.68 | 61.87 | ||||||
| First Quarter |
71.26 | 61.40 | ||||||
As of February 9, 2018, we had 357 holders of record of our common stock, and the closing sales price on that date for our common stock was $53.94 per share. We believe that the number of beneficial owners of our common stock is greater than the number of record holders because a significant number of shares of our common stock is held through brokerage firms in “street name.”
Dividend Policy
We did not declare or pay any cash dividends on our common stock in 2017, 2016 or 2015, nor do we currently intend to declare or pay any cash dividends in the future. The payment of any future dividends will be at the discretion of our Board of Directors and will depend upon, among other things, future earnings, results of operations, capital requirements, our general financial condition, general business conditions and contractual restrictions on payment of dividends, if any, as well as such other factors as our Board of Directors may deem relevant. Our credit agreement imposes certain limitations on our ability to declare and pay cash dividends. See Item 7. Management’s Discussion and Analysis of Financial Condition and Results of Operations—“Liquidity and Capital Resources.”
44
Table of Contents
Performance Graph
The following graph compares the cumulative total shareholder return on $100 invested on December 31, 2012 in our common stock against the cumulative total return of the S&P 500 Index, S&P 600 Health Care Index, and the NYSE Composite Index. The returns are calculated assuming reinvestment of dividends. The graph covers the period from December 31, 2012 through December 31, 2017, and gives effect to a two-for-one stock split effective December 19, 2013. The stock price performance included in the graph is not necessarily indicative of future stock price performance.
The performance graph shall not be deemed incorporated by reference by any general statement incorporating by reference this annual report into any filing under the Securities Act of 1933 or the Securities Exchange Act of 1934, except to the extent that we specifically incorporate this information by reference, and shall not otherwise be deemed filed under such acts.
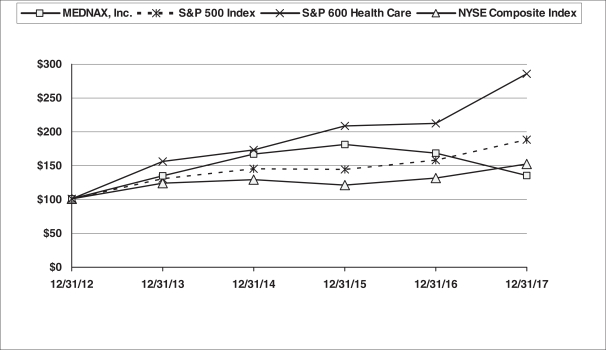
| Base Period | Years Ending | |||||||||||||||||||||||
| Company/Index |
2012 | 2013 | 2014 | 2015 | 2016 | 2017 | ||||||||||||||||||
| MEDNAX, Inc. |
$ | 100.00 | $ | 134.26 | $ | 166.27 | $ | 180.23 | $ | 167.66 | $ | 134.41 | ||||||||||||
| S&P 500 Index |
$ | 100.00 | $ | 129.60 | $ | 144.36 | $ | 143.31 | $ | 156.98 | $ | 187.47 | ||||||||||||
| S&P 600 Health Care |
$ | 100.00 | $ | 155.51 | $ | 172.49 | $ | 207.66 | $ | 211.70 | $ | 284.69 | ||||||||||||
| NYSE Composite Index |
$ | 100.00 | $ | 123.18 | $ | 128.37 | $ | 120.13 | $ | 130.95 | $ | 151.70 | ||||||||||||
Issuer Purchases of Equity Securities
During the three months ended December 31, 2017, we did not repurchase any shares of our equity securities.
45
Table of Contents
Recent Sales of Unregistered Equity Securities
During the three months ended December 31, 2017, we did not sell any unregistered shares of our equity securities.
Equity Compensation Plans
Information regarding equity compensation plans is set forth in Item 12 of this Form 10-K and is incorporated herein by reference.
46
Table of Contents
| ITEM 6. | SELECTED FINANCIAL DATA |
The following table includes selected consolidated financial data set forth as of and for each of the five years in the period ended December 31, 2017. All share and per share amounts give effect for our two-for-one stock split effective December 19, 2013. The balance sheet data at December 31, 2017 and 2016, and the income statement data for the years ended December 31, 2017, 2016 and 2015, have been derived from the Consolidated Financial Statements included in this Form 10-K. This selected financial data should be read in conjunction with “Management’s Discussion and Analysis of Financial Condition and Results of Operations,” and our Consolidated Financial Statements and the related notes included in Items 7 and 8, respectively, of this Form 10-K (in thousands, except per share and other operating data).
| Years Ended December 31, | ||||||||||||||||||||
| 2017 | 2016 | 2015 | 2014 | 2013 | ||||||||||||||||
| Consolidated Income Statement Data: |
||||||||||||||||||||
| Net revenue (1) |
$ | 3,458,312 | $ | 3,183,159 | $ | 2,779,996 | $ | 2,438,913 | $ | 2,154,012 | ||||||||||
|
|
|
|
|
|
|
|
|
|
|
|||||||||||
| Operating expenses: |
||||||||||||||||||||
| Practice salaries and benefits |
2,337,734 | 2,031,220 | 1,753,505 | 1,543,395 | 1,361,318 | |||||||||||||||
| Practice supplies and other operating expenses |
120,518 | 118,416 | 98,480 | 89,002 | 82,388 | |||||||||||||||
| General and administrative expenses |
417,105 | 372,572 | 305,915 | 247,527 | 218,209 | |||||||||||||||
| Depreciation and amortization |
102,879 | 89,264 | 64,228 | 45,990 | 39,966 | |||||||||||||||
|
|
|
|
|
|
|
|
|
|
|
|||||||||||
| Total operating expenses |
2,978,236 | 2,611,472 | 2,222,128 | 1,925,914 | 1,701,881 | |||||||||||||||
|
|
|
|
|
|
|
|
|
|
|
|||||||||||
| Income from operations |
480,076 | 571,687 | 557,868 | 512,999 | 452,131 | |||||||||||||||
| Investment and other income |
3,953 | 2,019 | 1,844 | 2,728 | 1,696 | |||||||||||||||
| Interest expense |
(74,559 | ) | (63,092 | ) | (23,110 | ) | (8,891 | ) | (5,415 | ) | ||||||||||
| Equity in earnings of unconsolidated affiliates |
952 | 3,185 | 3,127 | 1,780 | — | |||||||||||||||
|
|
|
|
|
|
|
|
|
|
|
|||||||||||
| Total non-operating expenses |
(69,654 | ) | (57,888 | ) | (18,139 | ) | (4,383 | ) | (3,719 | ) | ||||||||||
|
|
|
|
|
|
|
|
|
|
|
|||||||||||
| Income before income taxes |
410,422 | 513,799 | 539,729 | 508,616 | 448,412 | |||||||||||||||
| Income tax provision |
(90,050 | ) | (189,203 | ) | (204,038 | ) | (191,413 | ) | (167,895 | ) | ||||||||||
|
|
|
|
|
|
|
|
|
|
|
|||||||||||
| Net income |
320,372 | 324,596 | 335,691 | 317,203 | 280,517 | |||||||||||||||
| Net loss attributable to noncontrolling interests |
— | 318 | 629 | 78 | — | |||||||||||||||
|
|
|
|
|
|
|
|
|
|
|
|||||||||||
| Net income attributable to MEDNAX, Inc. |
$ | 320,372 | $ | 324,914 | $ | 336,320 | $ | 317,281 | $ | 280,517 | ||||||||||
|
|
|
|
|
|
|
|
|
|
|
|||||||||||
| Per Common and Common Equivalent Share Data: |
||||||||||||||||||||
| Net income attributable to MEDNAX, Inc.: |
||||||||||||||||||||
| Basic |
$ | 3.47 | $ | 3.52 | $ | 3.61 | $ | 3.22 | $ | 2.83 | ||||||||||
|
|
|
|
|
|
|
|
|
|
|
|||||||||||
| Diluted |
$ | 3.45 | $ | 3.49 | $ | 3.58 | $ | 3.18 | $ | 2.78 | ||||||||||
|
|
|
|
|
|
|
|
|
|
|
|||||||||||
| Weighted average common shares: |
||||||||||||||||||||
| Basic |
92,431 | 92,422 | 93,077 | 98,588 | 99,112 | |||||||||||||||
|
|
|
|
|
|
|
|
|
|
|
|||||||||||
| Diluted |
92,958 | 93,109 | 93,960 | 99,887 | 100,969 | |||||||||||||||
|
|
|
|
|
|
|
|
|
|
|
|||||||||||
| Other Operating Data: |
||||||||||||||||||||
| Number of physicians at end of year |
4,083 | 3,617 | 3,240 | 2,625 | 2,367 | |||||||||||||||
| Number of births |
808,465 | 807,285 | 803,311 | 799,868 | 790,597 | |||||||||||||||
| NICU admissions |
112,965 | 112,184 | 111,407 | 108,978 | 102,099 | |||||||||||||||
| NICU patient days |
1,990,521 | 1,977,204 | 1,960,768 | 1,919,579 | 1,847,577 | |||||||||||||||
| Number of anesthesia cases |
1,924,952 | 1,827,194 | 1,533,089 | 1,284,149 | 1,045,794 | |||||||||||||||
| Consolidated Balance Sheet Data: |
||||||||||||||||||||
| Cash and cash equivalents |
$ | 60,200 | $ | 55,698 | $ | 51,572 | $ | 47,928 | $ | 31,137 | ||||||||||
| Working capital |
95,810 | 138,179 | 98,998 | 50,779 | 41,333 | |||||||||||||||
| Total assets |
5,867,278 | 5,339,400 | 4,547,214 | 3,608,248 | 3,008,716 | |||||||||||||||
| Total liabilities |
2,800,824 | 2,578,633 | 2,109,368 | 1,342,682 | 665,728 | |||||||||||||||
| Borrowings under credit facility |
1,110,500 | 963,500 | 533,500 | 568,000 | 27,000 | |||||||||||||||
| 2023 Senior Notes outstanding |
750,000 | 750,000 | 750,000 | — | — | |||||||||||||||
| Total equity |
3,066,454 | 2,760,767 | 2,437,846 | 2,265,566 | 2,342,988 | |||||||||||||||
| (1) | The increase in net revenue related to acquisitions was $256.0 million, $356.4 million, $345.7 million, $205.4 million and $265.0 million for the years ended December 31, 2017, 2016, 2015, 2014 and 2013, respectively. |
47
Table of Contents
| ITEM 7. | MANAGEMENT’S DISCUSSION AND ANALYSIS OF FINANCIAL CONDITION AND RESULTS OF OPERATIONS |
The following discussion highlights the principal factors that have affected our financial condition and results of operations as well as our liquidity and capital resources for the periods described. This discussion should be read in conjunction with our Consolidated Financial Statements and the related notes included in Item 8 of this Form 10-K. This discussion contains forward-looking statements. Please see the explanatory note concerning “Forward-Looking Statements” preceding Part I of this Form 10-K and Item 1A. Risk Factors for a discussion of the uncertainties, risks and assumptions associated with these forward-looking statements. The operating results for the periods presented were not significantly affected by inflation.
OVERVIEW
MEDNAX is a leading provider of physician services including newborn, anesthesia, maternal-fetal, radiology and teleradiology, pediatric cardiology and other pediatric subspecialty care. At December 31, 2017, our national network comprised over 4,075 affiliated physicians, including 1,175 physicians who provide neonatal clinical care, in 37 states and Puerto Rico, primarily within hospital-based NICUs, to babies born prematurely or with medical complications. We have 1,400 affiliated physicians who provide anesthesia care to patients in connection with surgical and other procedures, as well as pain management. In addition, we have 325 affiliated physicians who provide maternal-fetal and obstetrical medical care to expectant mothers experiencing complicated pregnancies primarily in areas where our affiliated neonatal physicians practice. Our network also includes other pediatric subspecialists, including 175 physicians providing pediatric intensive care, 110 physicians providing pediatric cardiology care, 130 physicians providing hospital-based pediatric care, 20 physicians providing pediatric surgical care, and eight physicians providing pediatric ear, nose and throat and pediatric ophthalmology services. MEDNAX also provides radiology services including diagnostic imaging and interventional radiology, through a network of 285 affiliated physicians, as well as teleradiology services in all 50 states, the District of Columbia and Puerto Rico through a network of 445 affiliated radiologists. In addition to our national physician network, we provide services nationwide to healthcare facilities and physicians, including ours, through complementary businesses, consisting of a management services organization focusing on full-service revenue cycle management and a consulting services company.
2017 Acquisition Activity
During 2017, we completed 10 physician group practice acquisitions, including four radiology practices, two maternal-fetal medicine practices, one neonatology practice, one pediatric multi-specialty practice and two other pediatric subspecialty practices.
Based on our experience, we expect that we can improve the results of all of our acquired physician practices through improved managed care contracting, improved collections, identification of growth initiatives, as well as, operating and cost savings based upon the significant infrastructure that we have developed.
General Economic Conditions
Our operations and performance depend significantly on economic conditions. During the year ended December 31, 2017, the percentage of our patient service revenue being reimbursed under government-sponsored or funded healthcare programs (the “GHC Programs”), increased slightly as compared to the year ended December 31, 2016. We could experience additional shifts toward GHC Programs and patient volumes could decline if economic conditions deteriorate. Payments received from GHC Programs are substantially less for equivalent services than payments received from commercial insurance payors. In addition, due to the rising costs of managed care premiums and patient responsibility amounts, we may experience increased bad debt due to patients’ inability to pay for certain services. See Item 1A. Risk Factors, in this Form 10-K for additional discussion on the general economic conditions in the United States and recent developments in the healthcare industry that could affect our business.
48
Table of Contents
Healthcare Reform
The Patient Protection and Affordable Care Act (the “ACA”) contains a number of provisions that have affected us and, absent amendment or repeal, may continue to affect us over the next several years. These provisions include the establishment of health insurance exchanges to facilitate the purchase of qualified health plans, expanded Medicaid eligibility, subsidized insurance premiums and additional requirements and incentives for businesses to provide healthcare benefits. Other provisions have expanded the scope and reach of Federal civil False Claims Act (“FCA”) and other healthcare fraud and abuse laws. Moreover, we could be affected by potential changes to various aspects of the ACA, including subsidies, healthcare insurance marketplaces and Medicaid expansion.
The ACA remains subject to continuing legislative and administrative scrutiny, including efforts by the Republican-controlled Congress and the current Administration to amend or repeal a number of its provisions, as well as administrative actions delaying the effectiveness of key provisions. If the ACA is repealed or substantially modified, or if implementation of certain aspects of the ACA are diluted or delayed, such repeal, modification or delay may impact our business, financial condition, results of operations, cash flows and the trading price of our securities. We are unable to predict the impact of any repeal, modification or delay in the implementation of the ACA on us at this time.
In addition to the potential impacts to the ACA under the current Administration, there could be more sweeping changes to GHC Programs, such as a change in the structure of Medicaid by converting it into a block grant or instituting “per capita caps,” which could eliminate the guarantee that everyone who is eligible and applies for benefits would receive them and could potentially give states sweeping new authority to restrict eligibility, cut benefits and make it more difficult for people to enroll. Additionally, several states are considering and pursuing changes to their Medicaid programs, such as requiring recipients to engage in employment activities as a condition of eligibility for most adults, disenrolling recipients for failure to pay a premium, or adjusting premium amounts based on income.
As a result, we cannot predict with any assurance the ultimate effect of these laws and resulting changes to payments under GHC Programs, nor can we provide any assurance that they will not have a material adverse effect on our business, financial condition, results of operations, cash flows and the trading price of our securities. Further, any fiscal tightening impacting GHC Programs or changes to the structure of any GHC Programs could have a material adverse effect on our financial condition, results of operations, cash flows and the trading price of our securities.
The Medicare Access and CHIP Reauthorization Act
Medicare pays for most physician services based upon a national service-specific fee schedule. In 2015, Congress enacted the Medicare Access and CHIP Reauthorization Act (“MACRA,”) which provides physicians 0.5% annual increases in reimbursement through 2019 as Medicare transitions to a payment system designed to reward physicians for the quality of care provided, rather than the quantity of procedures performed. MACRA will require physicians to choose to participate in one of two payment formulas, Merit-Based Incentive Payment System (“MIPS”) or Alternative Payment Models (“APMs”). Beginning in 2019, MIPS will allow eligible physicians to receive incentive payments based on the achievement of certain quality and cost metrics, among other measures, and be reduced for those who are underperforming against those same metrics and measures. As an alternative, physicians can choose to participate in an Advanced APM. Advanced APMs are exempt from the MIPS requirements, and physicians who are meaningful participants in APMs will receive bonus payments from Medicare pursuant to the law. We will continue to operationalize the provisions of MACRA and assess any further changes to the law or additional regulations enacted pursuant to the law.
At this time we cannot predict the ultimate effect that these changes will have on us, nor can we provide any assurance that its provisions will not have a material adverse effect on our business, financial condition, results of operations, cash flows and the trading price of our securities.
49
Table of Contents
Medicaid to Medicare Payment Parity
In 2012, CMS adopted a rule under the ACA that generally allowed physicians who provided eligible primary care services to be paid at the Medicare reimbursement rates in effect in calendar years 2013 and 2014 instead of state-established Medicaid reimbursement rates that would have been applicable in those years (“parity revenue”). Federal funding for the enhanced Medicaid payments expired for dates of service beyond December 31, 2014. Advocacy efforts by various parties took place at both the federal and state legislative levels to continue this program, but only a limited number of states committed to either extend this program, at least in part, for a limited period of time or increase their pre-parity base Medicaid rates.
We did not recognize any parity revenue during the years ended December 31, 2017 and 2016. During the year ended December 31, 2015, we recognized $12.0 million in parity revenue that contributed $0.04 to our net income per diluted share, reflecting the impacts from incentive compensation and income taxes.
Medicaid Expansion
The ACA also allows states to expand their Medicaid programs through federal payments that fund most of the cost of increasing the Medicaid eligibility income limit from a state’s historic eligibility levels to 133% of the federal poverty level. As of December 31, 2017, 32 states and the District of Columbia had expanded Medicaid eligibility. All of the states in which we operate, however, already cover children in the first year of life and pregnant women if their household income is at or below 133% of the federal poverty level.
Medicare Sequestration
The Budget Control Act of 2011, as amended by the American Taxpayer Relief Act of 2012, required across-the-board cuts (“sequestrations”) to Medicare reimbursement rates. These annual reductions of 2%, on average, began in April 2013 and apply to mandatory and discretionary spending in the years 2013 to 2025. Unless Congress takes action in the future to modify these sequestrations, Medicare reimbursements will be reduced by 2%, on average, annually. However, this reduction in Medicare reimbursement rates is not expected to have a material adverse effect on our business, financial condition, results of operations, cash flows or the trading price of our securities.
Geographic Coverage
During 2017, 2016 and 2015, approximately 51%, 51% and 54%, respectively, of our net revenue was generated by operations in our five largest states. During 2017, 2016 and 2015, our five largest states consisted of Texas, North Carolina, Georgia, Tennessee and Florida. During 2017, 2016 and 2015, our operations in Texas accounted for approximately 19%, 19% and 20%, respectively, of our net revenue.
Payor Mix
We bill payors for professional services provided by our affiliated physicians to our patients based upon rates for specific services provided. Our billed charges are substantially the same for all parties in a particular geographic area regardless of the party responsible for paying the bill for our services. We determine our net revenue based upon the difference between our gross fees for services and our estimated ultimate collections from payors. Net revenue differs from gross fees due to (i) managed care payments at contracted rates, (ii) GHC Program reimbursements at government-established rates, (iii) various reimbursement plans and negotiated reimbursements from other third-parties, and (iv) discounted and uncollectible accounts of private-pay patients.
Our payor mix is composed of contracted managed care, government, principally Medicare and Medicaid, other third-parties and private-pay patients. We benefit from the fact that most of the medical services provided in the NICU are classified as emergency services, a category typically classified as a covered service by managed care payors.
50
Table of Contents
The following is a summary of our payor mix, expressed as a percentage of net revenue, exclusive of administrative fees and revenue related to our non-practice service offerings, for the periods indicated:
| Years Ended December 31, | ||||||||||||
| 2017 | 2016 | 2015 | ||||||||||
| Contracted managed care |
70 | % | 70 | % | 70 | % | ||||||
| Government |
25 | % | 23 | % | 23 | % | ||||||
| Other third-parties |
4 | % | 6 | % | 6 | % | ||||||
| Private-pay patients |
1 | % | 1 | % | 1 | % | ||||||
|
|
|
|
|
|
|
|||||||
| 100 | % | 100 | % | 100 | % | |||||||
|
|
|
|
|
|
|
|||||||
The payor mix shown in the table above is not necessarily representative of the amount of services provided to patients covered under these plans. For example, the gross amount billed to patients covered under GHC Programs for the years ended December 31, 2017, 2016 and 2015 represented approximately 55% of our total gross patient service revenue. These percentages of gross revenue and the percentages of net revenue provided in the table above include the payor mix impact of acquisitions completed through December 31, 2017.
Quarterly Results
We have historically experienced and expect to continue to experience quarterly fluctuations in net revenue and net income. These fluctuations are primarily due to the following factors:
| • | There are fewer calendar days in the first and second quarters of the year, as compared to the third and fourth quarters of the year. Because we provide services in NICUs on a 24-hours-a-day basis, 365 days a year, any reduction in service days will have a corresponding reduction in net revenue. |
| • | The majority of physician services provided by our office-based and anesthesia practices consist of office visits and scheduled procedures that occur during business hours. As a result, volumes at those practices fluctuate based on the number of business days in each calendar quarter. |
| • | A significant number of our employees and our associated professional contractors, primarily physicians, exceed the level of taxable wages for social security during the first and second quarters of the year. As a result, we incur a significantly higher payroll tax burden and our net income is lower during those quarters. |
We have significant fixed operating costs, including physician compensation, and, as a result, are highly dependent on patient volume and capacity utilization of our affiliated professional contractors to sustain profitability. Additionally, quarterly results may be affected by the timing of acquisitions and fluctuations in patient volume. As a result, the operating results for any quarter are not necessarily indicative of results for any future period or for the full year. Our unaudited quarterly results are presented in further detail in Note 17 to our Consolidated Financial Statements in this Form 10-K.
Application of Critical Accounting Policies and Estimates
The preparation of financial statements in conformity with accounting principles generally accepted in the United States (“GAAP”) requires estimates and assumptions that affect the reporting of assets, liabilities, revenue and expenses, and the disclosure of contingent assets and liabilities. Note 2 to our Consolidated Financial Statements provides a summary of our significant accounting policies, which are all in accordance with GAAP. Certain of our accounting policies are critical to understanding our Consolidated Financial Statements because their application requires management to make assumptions about future results and depends to a large extent on management’s judgment, because past results have fluctuated and are expected to continue to do so in the future.
We believe that the application of the accounting policies described in the following paragraphs is highly dependent on critical estimates and assumptions that are inherently uncertain and highly susceptible to change.
51
Table of Contents
For all of these policies, we caution that future events rarely develop exactly as estimated, and the best estimates routinely require adjustment. On an ongoing basis, we evaluate our estimates and assumptions, including those discussed below.
Revenue Recognition
We recognize patient service revenue at the time services are provided by our affiliated physicians. Almost all of our patient service revenue is reimbursed by GHC Programs and third-party insurance payors. Payments for services rendered to our patients are generally less than billed charges. We monitor our revenue and receivables from these sources and record an estimated contractual allowance to properly account for the anticipated differences between billed and reimbursed amounts. Accordingly, patient service revenue is presented net of an estimated provision for contractual adjustments and uncollectibles. Management estimates allowances for contractual adjustments and uncollectibles on accounts receivable based upon historical experience and other factors, including days sales outstanding (“DSO”) for accounts receivable, evaluation of expected adjustments and delinquency rates, past adjustments and collection experience in relation to amounts billed, an aging of accounts receivable, current contract and reimbursement terms, changes in payor mix and other relevant information. Contractual adjustments result from the difference between the physician rates for services performed and the reimbursements by GHC Programs and third-party insurance payors for such services. The evaluation of these historical and other factors involves complex, subjective judgments. On a routine basis, we compare our cash collections to recorded net patient service revenue and evaluate our historical allowance for contractual adjustments and uncollectibles based upon the ultimate resolution of the accounts receivable balance. These procedures are completed regularly in order to monitor our process of establishing appropriate reserves for contractual adjustments. We have not recorded any material adjustments to prior period contractual adjustments and uncollectibles in the years ended December 31, 2017, 2016, or 2015.
DSO is one of the key factors that we use to evaluate the condition of our accounts receivable and the related allowances for contractual adjustments and uncollectibles. DSO reflects the timeliness of cash collections on billed revenue and the level of reserves on outstanding accounts receivable. Any significant change in our DSO results in additional analyses of outstanding accounts receivable and the associated reserves. We calculate our DSO using a three-month rolling average of net revenue. Our net revenue, net income and operating cash flows may be materially and adversely affected if actual adjustments and uncollectibles exceed management’s estimated provisions as a result of changes in these factors. As of December 31, 2017, our DSO was 50.9 days. We had approximately $1.8 billion in gross accounts receivable outstanding at December 31, 2017, and considering this outstanding balance, based on our historical experience, a reasonably likely change of 0.5% to 1.50% in our estimated collection rate would result in an impact to net revenue of $9.0 million to $26.9 million. The impact of this change does not include adjustments that may be required as a result of audits, inquiries and investigations from government authorities and agencies and other third-party payors that may occur in the ordinary course of business. See Note 16 to our Consolidated Financial Statements in this Form 10-K.
Professional Liability Coverage
We maintain professional liability insurance policies with third-party insurers generally on a claims-made basis, subject to self-insured retention, exclusions and other restrictions. Our self-insured retention under our professional liability insurance program is maintained primarily through a wholly owned captive insurance subsidiary. We record liabilities for self-insured amounts and claims incurred but not reported based on an actuarial valuation using historical loss information, claim emergence patterns and various actuarial assumptions. Liabilities for claims incurred but not reported are not discounted. The average lag period from the date a claim is reported to the date it reaches final settlement is approximately four years, although the facts and circumstances of individual claims could result in lag periods that vary from this average. Our actuarial assumptions incorporate multiple complex methodologies to determine the best liability estimate for claims incurred but not reported and the future development of known claims, including methodologies that focus on industry trends, paid loss development, reported loss development and industry-based expected pure premiums. The most significant
52
Table of Contents
assumptions used in the estimation process include the use of loss development factors to determine the future emergence of claim liabilities, the use of frequency and trend factors to estimate the impact of economic, judicial and social changes affecting claim costs, and assumptions regarding legal and other costs associated with the ultimate settlement of claims. The key assumptions used in our actuarial valuations are subject to constant adjustments as a result of changes in our actual loss history and the movement of projected emergence patterns as claims develop. We evaluate the need for professional liability insurance reserves in excess of amounts estimated in our actuarial valuations on a routine basis, and as of December 31, 2017, based on our historical experience, a reasonably likely change of 4% to 6% in our estimates would result in an increase or decrease to net income of $2.7 million to $5.0 million. However, because many factors can affect historical and future loss patterns, the determination of an appropriate professional liability reserve involves complex, subjective judgment, and actual results may vary significantly from estimates.
Goodwill
We record acquired assets, including identifiable intangible assets and liabilities at their respective fair values, recording to goodwill the excess of purchase price over the fair value of the net assets acquired. We test goodwill for impairment at a reporting unit level on an annual basis, and more frequently if impairment indicators exist. The Company early adopted new accounting guidance in 2017 that requires only a single-step quantitative test with any goodwill impairment measured as the amount by which a reporting unit’s carrying value exceeds its fair value. We use income and market-based valuation approaches to determine the fair value of our reporting units. These approaches focus on discounted cash flows and market multiples based on our market capitalization to derive the fair value of a reporting unit. We also consider the economic outlook for the healthcare services industry and various other factors during the testing process, including hospital and physician contract changes, local market developments, changes in third-party payor payments, and other publicly available information.
Other Matters
Other significant accounting policies, not involving the same level of measurement uncertainties as those discussed above, are nevertheless important to an understanding of our Consolidated Financial Statements. For example, our Consolidated Financial Statements are presented on a consolidated basis with our affiliated professional contractors because we or one of our subsidiaries have entered into management agreements with our affiliated professional contractors meeting the “controlling financial interest” criteria set forth in accounting guidance for consolidations. Our management agreements are further described in Note 2 to our Consolidated Financial Statements in this Form 10-K. The policies described in Note 2 often require difficult judgments on complex matters that are often subject to multiple sources of authoritative guidance and are frequently reexamined by accounting standards setters and regulators. See “New Accounting Pronouncements” below for matters that may affect our accounting policies in the future.
Non-GAAP Measures
In our analysis of our results of operations, we use certain non-GAAP financial measures. Earnings before interest, taxes and depreciation and amortization (“EBITDA”) consists of net income attributable to MEDNAX, Inc. before interest expense, income tax provision and depreciation and amortization. The Company had historically included immaterial investment and other income and equity in earnings of unconsolidated affiliates as a component of the interest expense adjustment within EBITDA. Beginning in the fourth quarter of 2017, the Company has excluded these items such that the interest expense adjustment represents only interest expense and has conformed its previous EBITDA calculations with the current period presentation. Adjusted earnings per common share (“Adjusted EPS”) consists of diluted net income attributable to MEDNAX, Inc. per common and common equivalent share adjusted for amortization expense and stock-based compensation expense. Adjusted EPS for the year ended December 31, 2017 excludes the net income tax benefit related to the reduction in our net deferred tax liability resulting from the reduction in the corporate tax rate enacted in December 2017 under the
53
Table of Contents
Tax Cuts and Jobs Act of 2017. Additionally, Adjusted EPS for the year ended December 31, 2016 excludes the net income tax benefit resulting from the reversal of a liability for uncertain tax positions related to the favorable settlement of a tax matter during the third quarter of 2016.
We believe these measures, in addition to income from operations, net income attributable to MEDNAX, Inc. and diluted net income attributable to MEDNAX, Inc. per common and common equivalent share, provide investors with useful supplemental information to compare and understand our underlying business trends and performance across reporting periods on a consistent basis. These measures should be considered a supplement to, and not a substitute for, financial performance measures determined in accordance with GAAP. In addition, since these non-GAAP measures are not determined in accordance with GAAP, they are susceptible to varying calculations and may not be comparable to other similarly titled measures of other companies.
For a reconciliation of each of EBITDA and Adjusted EPS to the most directly comparable GAAP measures for the years ended December 31, 2017, 2016 and 2015, refer to the tables below (in thousands, except per share data). In addition, historical reconciliations of EBITDA and Adjusted EPS are available on our internet website at www.mednax.com under the Investors tab. Our internet website and the information contained therein or connected thereto are not incorporated into or deemed a part of this Form 10-K.
| Years Ended December 31, | ||||||||||||
| 2017 | 2016 | 2015 | ||||||||||
| Net income attributable to MEDNAX, Inc. |
$ | 320,372 | $ | 324,914 | $ | 336,320 | ||||||
| Interest expense |
74,559 | 63,092 | 23,110 | |||||||||
| Income tax provision |
90,050 | 189,203 | 204,038 | |||||||||
| Depreciation and amortization |
102,879 | 89,264 | 64,228 | |||||||||
|
|
|
|
|
|
|
|||||||
| EBITDA |
$ | 587,860 | $ | 666,473 | $ | 627,696 | ||||||
|
|
|
|
|
|
|
|||||||
| Years Ended December 31, | ||||||||||||||||||||||||
| 2017 | 2016 | 2015 | ||||||||||||||||||||||
| Weighted average diluted shares outstanding |
92,958 | 93,109 | 93,960 | |||||||||||||||||||||
| Net income and diluted net income per share attributable to MEDNAX, Inc. |
$ | 320,372 | $ | 3.45 | $ | 324,914 | $ | 3.49 | $ | 336,320 | $ | 3.58 | ||||||||||||
| Adjustments: |
||||||||||||||||||||||||
| Amortization (net of tax of $26,902, $23,443 and $15,876) |
42,079 | 0.45 | 36,873 | 0.39 | 26,170 | 0.28 | ||||||||||||||||||
| Stock-based compensation (net of tax of $11,534, $13,216 and $12,132) |
18,039 | 0.19 | 20,784 | 0.22 | 19,997 | 0.21 | ||||||||||||||||||
| Income tax benefits |
(70,014 | ) | (0.75 | ) | (10,646 | ) | (0.11 | ) | — | — | ||||||||||||||
|
|
|
|
|
|
|
|
|
|
|
|
|
|||||||||||||
| Adjusted net income and diluted EPS |
$ | 310,476 | $ | 3.34 | $ | 371,925 | $ | 3.99 | $ | 382,487 | $ | 4.07 | ||||||||||||
|
|
|
|
|
|
|
|
|
|
|
|
|
|||||||||||||
54
Table of Contents
RESULTS OF OPERATIONS
The following table sets forth, for the periods indicated, certain information related to our operations expressed as a percentage of our net revenue:
| Years Ended December 31, | ||||||||||||
| 2017 | 2016 | 2015 | ||||||||||
| Net revenue |
100.0 | % | 100.0 | % | 100.0 | % | ||||||
|
|
|
|
|
|
|
|||||||
| Operating expenses: |
||||||||||||
| Practice salaries and benefits |
67.6 | 63.8 | 63.1 | |||||||||
| Practice supplies and other operating expenses |
3.5 | 3.7 | 3.5 | |||||||||
| General and administrative expenses |
12.1 | 11.7 | 11.0 | |||||||||
| Depreciation and amortization |
2.9 | 2.8 | 2.3 | |||||||||
|
|
|
|
|
|
|
|||||||
| Total operating expenses |
86.1 | 82.0 | 79.9 | |||||||||
|
|
|
|
|
|
|
|||||||
| Income from operations |
13.9 | 18.0 | 20.1 | |||||||||
| Non-operating expense, net |
2.0 | 1.8 | 0.7 | |||||||||
|
|
|
|
|
|
|
|||||||
| Income before income taxes |
11.9 | 16.2 | 19.4 | |||||||||
| Income tax provision |
2.6 | 6.0 | 7.3 | |||||||||
|
|
|
|
|
|
|
|||||||
| Net income |
9.3 | % | 10.2 | % | 12.1 | % | ||||||
|
|
|
|
|
|
|
|||||||
Year Ended December 31, 2017 as Compared to Year Ended December 31, 2016
Our net revenue increased $275.2 million, or 8.6%, to $3.46 billion for the year ended December 31, 2017, as compared to $3.18 billion for 2016. Of this $275.2 million increase, $256.0 million, or 7.9%, was attributable to revenue generated from acquisitions completed after December 31, 2015. Same-unit net revenue increased $19.1 million, or 0.7%, for the year ended December 31, 2017. Same units are those units at which we provided services for the entire current period and the entire comparable period. The increase in same-unit net revenue was comprised of a net increase of $11.7 million, or 0.4%, related to net reimbursement-related factors and an increase in revenue of $7.4 million, or 0.3%, from patient service volumes. The net increase in revenue of $11.7 million related to net reimbursement-related factors was primarily due to modest improvements in managed care contracting and an increase in the administrative fees received from our hospital partners, partially offset by a decrease in revenue caused by an increase in the percentage of our patients enrolled in GHC Programs. The increase in revenue of $7.4 million from patient service volumes was primarily related to growth across our anesthesiology, neonatology and maternal-fetal medicine services, partially offset by a decrease in our other pediatric services, primarily hearing screen services.
Practice salaries and benefits increased $306.5 million, or 15.1%, to $2.34 billion for the year ended December 31, 2017, as compared to $2.03 billion for 2016. This $306.5 million increase was primarily attributable to increased costs associated with new physicians and other staff to support acquisition-related growth and growth at existing units, of which $230.6 million was related to salaries and $75.9 million was related to benefits and incentive compensation. Included within the increase in salaries expense at our existing units were costs related to clinician compensation that increased at a faster rate than in previous periods. We anticipate that we will continue to experience a higher rate of growth in clinician compensation expense, which could adversely affect our business, financial condition, results of operations, cash flows and the trading price of our securities. Included within the increase in benefits expense were increased costs related to malpractice expense driven by unfavorable claims experience.
Practice supplies and other operating expenses increased $2.1 million, or 1.8%, to $120.5 million for the year ended December 31, 2017, as compared to $118.4 million for 2016. The increase was attributable to practice
55
Table of Contents
supply, rent and other costs related to our acquisitions, partially offset by a decrease at our existing units. The decrease at our existing units was primarily attributable to the reclassification of certain temporary staffing costs from practice operating expenses to practice salaries in 2017.
General and administrative expenses include all billing and collection functions and all other salaries, benefits, supplies and operating expenses not specifically related to the day-to-day operations of our physician practices and services, as well as those attributable to our non-physician service businesses. General and administrative expenses increased $44.5 million, or 12.0%, to $417.1 million for the year ended December 31, 2017, as compared to $372.6 million for 2016. The increase of $44.5 million is attributable to the overall growth of the Company. General and administrative expenses as a percentage of net revenue was 12.1% for the year ended December 31, 2017, as compared to 11.7% for the same period in 2016.
Depreciation and amortization expense increased $13.6 million, or 15.3%, to $102.9 million for the year ended December 31, 2017, as compared to $89.3 million for 2016. The increase was primarily attributable to the amortization of intangible assets related to acquisitions.
Income from operations decreased $91.6 million, or 16.0%, to $480.1 million for the year ended December 31, 2017, as compared to $571.7 million for 2016. Our operating margin was 13.9% for the year ended December 31, 2017, as compared to 18.0% for 2016. The decrease of 408 basis points was primarily due to increases in operating expenses and lower same-unit revenue.
Net non-operating expenses were $69.7 million for the year ended December 31, 2017, as compared to $57.9 million for 2016. The net increase in non-operating expenses was primarily related to an increase in interest expense due to higher average borrowings outstanding under our credit agreement (the “Credit Agreement”).
Our effective income tax rate was 21.9% for the year ended December 31, 2017, as compared to 36.8% for 2016. After excluding a $70.0 million income tax benefit resulting from the reduction of our net deferred tax liability resulting from the reduction in the corporate tax rate enacted under the Tax Cuts and Jobs Act of 2017 during the fourth quarter of 2017, our effective income tax rate for the year ended December 31, 2017 was 39.0%. After excluding a $10.6 million income tax benefit resulting from the reversal of a liability for uncertain tax positions related to the favorable settlement of a tax matter during the third quarter of 2016, our effective income tax rate for the year ended December 31, 2016 was 38.9%. We believe that excluding the favorable impacts on our effective income tax rate related to these income tax benefits provides a more comparable view of our effective income tax rate. After excluding these favorable impacts, our effective tax rate was relatively unchanged.
Net income attributable to MEDNAX, Inc. was $320.4 million for the year ended December 31, 2017, as compared to $324.9 million for 2016. EBITDA was $587.9 million for the year ended December 31, 2017, as compared to $666.5 million for 2016.
Diluted net income attributable to MEDNAX, Inc. per common and common equivalent share was $3.45 on weighted average shares outstanding of 93.0 million for the year ended December 31, 2017, as compared to $3.49 on weighted average shares outstanding of 93.1 million for 2016. Adjusted EPS was $3.34 for the year ended December 31, 2017, as compared to $3.99 for 2016.
Year Ended December 31, 2016 as Compared to Year Ended December 31, 2015
Our net revenue increased $403.2 million, or 14.5%, to $3.18 billion for the year ended December 31, 2016, as compared to $2.78 billion for 2015. Of this $403.2 million increase, $356.4 million, or 12.7%, was attributable to revenue generated from acquisitions completed after December 31, 2014. Same-unit net revenue increased $46.8 million, or 1.8%, for the year ended December 31, 2016. Same units are those units at which we provided
56
Table of Contents
services for the entire current period and the entire comparable period. The increase in same-unit net revenue was comprised of a net increase of $34.2 million, or 1.3%, related to net reimbursement-related factors and an increase in revenue of $12.6 million, or 0.5%, from patient service volumes. The net increase in revenue of $34.2 million related to net reimbursement-related factors was primarily due to continued modest improvements in managed care contracting and the flow through of revenue from modest price increases, partially offset by the unfavorable impact from the decrease in parity revenue as there was no parity recorded during the year ended December 31, 2016, as compared to the year ended December 31, 2015, and the decrease in revenue caused by an increase in the percentage of our patients enrolled in GHC Programs. The increase in revenue of $12.6 million from patient service volumes was primarily related to growth in our anesthesiology and other pediatric services, primarily newborn nursery, partially offset by decreases in our neonatology services and our maternal-fetal medicine services. Our overall same-unit revenue increased $58.8 million, or 2.3%, after excluding the unfavorable impact of the $12.0 million decrease in parity revenue, and our revenue from net-reimbursement related factors increased by $46.2 million, or 1.8%, after excluding this same unfavorable impact. We believe that excluding the unfavorable impact from the decrease in parity revenue year over year provides a more comparable view of our changes in same-unit revenue.
Practice salaries and benefits increased $277.7 million, or 15.8%, to $2.03 billion for the year ended December 31, 2016, as compared to $1.75 billion for 2015. This $277.7 million increase was primarily attributable to increased costs associated with new physicians and other staff to support acquisition-related growth and growth at existing units, of which $251.5 million was related to salaries and $26.2 million was related to benefits and incentive compensation.
Practice supplies and other operating expenses increased $19.9 million, or 20.2%, to $118.4 million for the year ended December 31, 2016, as compared to $98.5 million for 2015. The increase was attributable to practice supply, rent and other costs related to our acquisitions as well as increases at existing units.
General and administrative expenses include all billing and collection functions and all other salaries, benefits, supplies and operating expenses not specifically related to the day-to-day operations of our physician practices and services, as well as those attributable to our non-physician service businesses. General and administrative expenses increased $66.7 million, or 21.8%, to $372.6 million for the year ended December 31, 2016, as compared to $305.9 million for 2015. The increase of $66.7 million is attributable to the overall growth of the Company including acquisition-related growth. General and administrative expenses as a percentage of net revenue was 11.7% for the year ended December 31, 2016, as compared to 11.0% for the same period in 2015. The increase of 70 basis points was driven by the mix of acquisitions, primarily our non-practice physician services business.
Depreciation and amortization expense increased $25.1 million, or 39.0%, to $89.3 million for the year ended December 31, 2016, as compared to $64.2 million for 2015. The increase was primarily attributable to the amortization of intangible assets related to acquisitions.
Income from operations increased $13.8 million, or 2.5%, to $571.7 million for the year ended December 31, 2016, as compared to $557.9 million for 2015. Our operating margin was 18.0% for the year ended December 31, 2016, as compared to 20.1% for 2015. The decrease of 211 basis points was primarily due to the variability in margins related to the mix of acquisitions completed after December 31, 2014.
Net non-operating expenses were $57.9 million for the year ended December 31, 2016, as compared to $18.1 million for 2015. The net increase in non-operating expenses was primarily related to an increase in interest expense related to our senior unsecured notes due 2023 (the “Senior Notes”) and higher outstanding borrowings under our Credit Agreement.
Our effective income tax rate was 36.8% for the year ended December 31, 2016, as compared to 37.8% for 2015. After excluding a $10.6 million income tax benefit resulting from the reversal of a liability for uncertain
57
Table of Contents
tax positions related to the favorable settlement of a tax matter during the third quarter of 2016, our effective income tax rate for the year ended December 31, 2016 was 38.9%. We believe that excluding the favorable impact on our effective income tax rate related to the settlement provides a more comparable view of our effective income tax rate. After excluding this favorable impact, the effective tax rate increased by 111 basis points, from 37.8% at December 31, 2015 to 38.9% at December 31, 2016, primarily reflecting the impact from certain favorable non-recurring items that occurred in 2015 and an increase in our valuation allowance on deferred taxes in 2016.
Net income attributable to MEDNAX, Inc. was $324.9 million for the year ended December 31, 2016, as compared to $336.3 million for 2015. EBITDA increased by 6.2% to $666.5 million for the year ended December 31, 2016, as compared to $627.7 million for 2015.
Diluted net income attributable to MEDNAX, Inc. per common and common equivalent share was $3.49 on weighted average shares outstanding of 93.1 million for the year ended December 31, 2016, as compared to $3.58 on weighted average shares outstanding of 94.0 million for 2015. Adjusted EPS was $3.99 for the year ended December 31, 2016, as compared to $4.07 for 2015.
LIQUIDITY AND CAPITAL RESOURCES
As of December 31, 2017, we had $60.2 million of cash and cash equivalents on hand as compared to $55.7 million at December 31, 2016. Additionally, we had working capital of $95.8 million at December 31, 2017, a decrease of $42.4 million from our working capital of $138.2 million at December 31, 2016. This net decrease in working capital is primarily due to the use of funds for acquisitions and repurchases of our common stock as well as a decrease in our long-term deferred tax liability resulting from the decrease in the corporate tax rate enacted under the Tax Cuts and Jobs Act of 2017, partially offset by 2017 earnings, net borrowings on our Credit Agreement, increases in our long-term professional liabilities and proceeds from the issuance of common stock under our Amended and Restated 2008 Incentive Plan, our 1996 Non-Qualified Employee Stock Purchase Plan, as amended (the “ESPP”), and our 2015 Non-Qualified Stock Purchase Plan (the “SPP”).
Cash Flows
Cash provided by (used in) operating, investing and financing activities is summarized as follows (in thousands):
| Years Ended December 31, | ||||||||||||
| 2017 | 2016 | 2015 | ||||||||||
| Operating activities |
$ | 511,378 | $ | 443,778 | $ | 368,701 | ||||||
| Investing activities |
(576,613 | ) | (821,217 | ) | (848,000 | ) | ||||||
| Financing activities |
89,737 | 381,565 | 482,943 | |||||||||
Operating Activities
We generated cash flow from operating activities of $511.4 million, $443.8 million and $368.7 million for the years ended December 31, 2017, 2016 and 2015, respectively. The net increase of $67.6 million in cash flow provided from operating activities for the year ended December 31, 2017, as compared to the year ended December 31, 2016, was primarily related to a net increase in cash flow related to an increase in income taxes payable resulting from fewer tax payments made due to a deferral allowed by the Internal Revenue Service for companies impacted by the hurricanes as well as an increase in cash flow due to decreases in accounts receivable, net of acquired accounts receivable and increases in professional liability reserves, partially offset by lower earnings.
During the year ended December 31, 2017, accounts receivable increased by $8.7 million, as compared to an increase of $50.5 million for 2016. The increases in accounts receivable are primarily due to higher accounts receivable balances related to acquisitions as well as increases at our existing units.
58
Table of Contents
Our cash flow from operating activities is significantly affected by the payment of physician incentive compensation. A large majority of our affiliated physicians participate in our performance-based incentive compensation program and almost all of the payments due under the program are made annually in the first quarter. As a result, we typically experience negative cash flow from operations in the first quarter of each year and fund our operations during this period with cash on hand or funds borrowed under our Credit Agreement. In addition, during the first quarter of each year, we use cash to make any discretionary matching contributions for participants in our qualified contributory savings plans.
We generated cash flow from operating activities of $443.8 million and $368.7 million for the years ended December 31, 2016 and 2015, respectively. Cash flow for the year ended December 31, 2016 was impacted by an increase in the adjustment to net income for non-cash depreciation and amortization expense, a net increase in cash flow related to changes in the components of our accounts payable and accrued expenses and an increase in cash flow related to accounts receivable. Cash flow for the year ended December 31, 2015 was impacted by changes in the components of accounts payable and accrued expenses, primarily related to increases in incentive compensation, partially offset by improved operating results.
Investing Activities
During the year ended December 31, 2017, our net cash used in investing activities of $576.6 million included acquisition payments of $531.7 million, capital expenditures of $49.3 million and net purchases of investments of $2.3 million. Our acquisition payments were related to the purchase of 10 physician practices.
Financing Activities
During the year ended December 31, 2017, our net cash provided from financing activities of $89.7 million consisted primarily of net borrowings on our Credit Facility of $147.0 million, proceeds from the exercise of employee stock options and the issuance of common stock under our ESPP and our SPP of $23.3 million, partially offset by the repurchase of $70.2 million of our common stock and the payment of $5.4 million for contingent consideration liabilities.
Liquidity
On October 30, 2017, we entered into the Credit Agreement which replaces our prior credit agreement. The Credit Agreement provides for a $2.0 billion unsecured revolving credit facility and includes a $37.5 million sub-facility for the issuance of letters of credit. The Credit Agreement matures on October 31, 2022 and is guaranteed by substantially all of our subsidiaries and affiliated professional associations and corporations. At our option, borrowings under the Credit Agreement will bear interest at (i) the alternate base rate (defined as the higher of (a) the prime rate, (b) the Federal Funds Rate plus 1/2 of 1.00% and (c) LIBOR for an interest period of one month plus 1.00%) plus an applicable margin rate ranging from 0.125% to 0.750% based on our consolidated leverage ratio or (ii) the LIBOR rate plus an applicable margin rate ranging from 1.125% to 1.750% based on our consolidated leverage ratio. The Credit Agreement also calls for other customary fees and charges, including an unused commitment fee ranging from 0.150% to 0.300% of the unused lending commitments, based on our consolidated leverage ratio. The Credit Agreement contains customary covenants and restrictions, including covenants that require us to maintain a minimum interest charge ratio, not to exceed a specified consolidated leverage ratio and to comply with laws, and restrictions on the ability to pay dividends and make certain other distributions, as specified therein. Failure to comply with these covenants would constitute an event of default under the Credit Agreement, notwithstanding the ability of the company to meet its debt service obligations. The Credit Agreement also includes various customary remedies for the lenders following an event of default, including the acceleration of repayment of outstanding amounts under the Credit Agreement.
At December 31, 2017, we had an outstanding principal balance of $1.1 billion on our Credit Agreement. We also had outstanding letters of credit of $0.2 million that reduced the amount available on our Credit Agreement to $889.3 million at December 31, 2017.
59
Table of Contents
At December 31, 2017, we had an outstanding principal balance of $750.0 million on our 2023 Senior Notes. Our obligations under the 2023 Senior Notes are guaranteed on an unsecured senior basis by the same subsidiaries and affiliated professional contractors that guarantee the Credit Agreement. Interest on the 2023 Senior Notes accrues at the rate of 5.25% per annum, or $39.4 million, and is payable semi-annually in arrears on June 1 and December 1.
The indenture under which the 2023 Senior Notes are issued, among other things, limits our ability to (1) incur liens and (2) enter into sale and lease-back transactions, and also limits our ability to merge or dispose of all or substantially all of our assets, in all cases, subject to a number of customary exceptions. Although we are not required to make mandatory redemption or sinking fund payments with respect to the 2023 Senior Notes, upon the occurrence of a change in control of MEDNAX, we may be required to repurchase the 2023 Senior Notes at a purchase price equal to 101% of the aggregate principal amount of the 2023 Senior Notes repurchased plus accrued and unpaid interest.
At December 31, 2017, we believe we were in compliance, in all material respects, with the financial covenants and other restrictions applicable to us under the Credit Agreement and the 2023 Senior Notes.
The exercise of employee stock options and the purchase of common stock by employees participating in our ESPP and SPP generated cash proceeds of $23.3 million, $22.0 million and $20.1 million for the years ended December 31, 2017, 2016 and 2015, respectively. Because stock option exercises and purchases under the ESPP and SPP are dependent on several factors, including the market price of our common stock, we cannot predict the timing and amount of any future proceeds.
We maintain professional liability insurance policies with third-party insurers, subject to self-insured retention, exclusions and other restrictions. We self-insure our liabilities to pay self-insured retention amounts under our professional liability insurance coverage through a wholly owned captive insurance subsidiary. We record liabilities for self-insured amounts and claims incurred but not reported based on an actuarial valuation using historical loss information, claim emergence patterns and various actuarial assumptions. Our total liability related to professional liability risks at December 31, 2017 was $250.2 million, of which $37.9 million is classified as a current liability within accounts payable and accrued expenses in the Consolidated Balance Sheet. In addition, there is a corresponding insurance receivable of $18.9 million recorded as a component of other assets for certain professional liability claims that are covered by insurance policies.
We anticipate that funds generated from operations, together with our current cash on hand and funds available under our Credit Agreement, will be sufficient to finance our working capital requirements, fund anticipated acquisitions and capital expenditures, fund our share repurchase programs and meet our contractual obligations as described below for at least the next 12 months from the date of issuance of this Form 10-K.
CONTRACTUAL OBLIGATIONS
At December 31, 2017, we had the following obligations and commitments (in thousands):
| Payments Due | ||||||||||||||||||||
| Obligation |
Total | 2018 | 2019 and 2020 |
2021 and 2022 |
2023 and Later |
|||||||||||||||
| Credit Agreement (1) |
$ | 1,291,847 | $ | 37,545 | $ | 75,090 | $ | 1,179,212 | $ | — | ||||||||||
| 2023 Senior Notes (1) |
982,969 | 39,375 | 78,750 | 78,750 | 786,094 | |||||||||||||||
| Capital leases |
1,826 | 1,401 | 351 | 74 | — | |||||||||||||||
| Operating leases |
105,272 | 34,337 | 40,811 | 20,190 | 9,934 | |||||||||||||||
|
|
|
|
|
|
|
|
|
|
|
|||||||||||
| $ | 2,381,914 | $ | 112,658 | $ | 195,002 | $ | 1,278,226 | $ | 796,028 | |||||||||||
|
|
|
|
|
|
|
|
|
|
|
|||||||||||
60
Table of Contents
| (1) | Amounts include interest payments at the applicable rate as of December 31, 2017 and assume the amount outstanding under our Credit Agreement as of December 31, 2017 will be paid on the maturity date and amounts outstanding under our 2023 Senior Notes will be paid on their maturity date of December 1, 2023. |
Certain of our acquisition agreements contain contingent consideration provisions based on volume and other performance measures over an up to five-year period. Potential payments under these provisions are not contingent upon the future employment of the sellers. As of December 31, 2017, cash payments of up to $32.2 million may be due through 2020 under all contingent consideration provisions as follows (in thousands):
| 2018 |
$ | 6.4 | ||
| 2019 |
24.5 | |||
| 2020 |
1.3 | |||
|
|
|
|||
| $ | 32.2 | |||
|
|
|
At December 31, 2017, our total liability for uncertain tax positions was $12.1 million, all of which is included within other liabilities on our Consolidated Balance Sheets. The timing and amount of future cash flows for each year beyond 2017 cannot be reasonably estimated. See Note 11 to our Consolidated Financial Statements in this Form 10-K for more information regarding our uncertain tax positions.
OFF-BALANCE SHEET ARRANGEMENTS
At December 31, 2017, we leased, under operating lease agreements, space in hospitals and other facilities for our business and medical offices, as well as certain equipment necessary for business operations, which are included in the table above. We did not have any other off-balance sheet arrangements that have or are reasonably likely to have a current or future effect on our financial condition, changes in financial condition, revenue or expenses, results of operations, liquidity, capital expenditures or capital resources.
RECENTLY ADOPTED ACCOUNTING PRONOUNCEMENTS
In January 2017, the accounting guidance related to goodwill impairment was amended to remove step two of the impairment test that requires a hypothetical purchase price allocation in order to measure the amount of any impairment. Under the new guidance, only a single-step quantitative test is required and any goodwill impairment will now be the amount by which a reporting unit’s carrying value exceeds its fair value. The new guidance does not amend the optional alternative to perform a qualitative assessment to determine if a quantitative goodwill impairment test is necessary. We early adopted this accounting guidance on December 31, 2017 as permitted. The adoption of this guidance did not have an impact on our Consolidated Financial Statements.
In January 2017, the accounting guidance related to business combinations was amended to clarify the definition of a business. We early adopted this accounting guidance on December 31, 2017 as permitted. The adoption of this guidance did not have an impact on our Company’s Consolidated Financial Statements.
In August 2016 and November 2016, the accounting guidance related to the statement of cash flows was amended with the intent of reducing diversity in practice as to the classification of certain transactions in the statement of cash flows as well as to clarify the presentation of restricted cash in the Statement of Cash Flows. We early adopted this accounting guidance on December 31, 2017 as permitted. The adoption of this guidance resulted in the inclusion of restricted cash balances in our Consolidated Statements of Cash Flows.
In March 2016, the accounting guidance related to various aspects of share-based payment transactions was amended, including income tax consequences, classification of awards as either equity or liabilities, and classification on the statement of cash flows. Under the new guidance, excess tax benefits and deficiencies are to
61
Table of Contents
be recognized as income tax benefits or expenses in the income statement as discrete items in the reporting period in which they occur instead of increases or decreases to shareholders’ equity. Excess tax benefits should be classified along with other income tax cash flows as operating activities. With regard to forfeitures, the entity may make an entity-wide accounting policy election to either estimate the number of awards that are expected to vest or account for forfeitures when they occur. This guidance became effective for us on January 1, 2017. We adopted this guidance prospectively for both the income statement and statement of cash flows, and the adoption of this guidance did not have a material impact on our Consolidated Financial Statements. We continue to estimate forfeitures based on the number of awards that are expected to vest.
NEW ACCOUNTING PRONOUNCEMENTS
In February 2016, accounting guidance related to leases was issued that will require an entity to recognize leased assets and the rights and obligations created by those leased assets on the balance sheet and to disclose key information about the entity’s leasing arrangements. This guidance will become effective for us on January 1, 2019, with early adoption permitted. We expect that the adoption of this guidance will have a material impact on our Consolidated Balance Sheets and related disclosures, resulting from the recognition of significant right of use assets and related liabilities primarily related to our operating lease arrangements for space in hospitals and certain other facilities for our business and medical offices. We are in the process of reviewing our existing lease portfolio and accumulating all of the necessary information required to properly account for leases under the new guidance. Additionally, we are assessing system requirements, required changes to our processes and internal control implications to ensure we will meet the reporting and disclosure requirements. Our evaluation of this guidance and its impacts are expected to continue through the third quarter of 2018.
In May 2014, the accounting guidance related to revenue recognition was amended to outline a single, comprehensive model for accounting for revenue from contracts with customers. The core principle of the new accounting guidance is to require an entity to recognize as revenue the amount that reflects the consideration to which it expects to be entitled in exchange for goods or services as it transfers control to its customers. The new guidance will become effective for us on January 1, 2018. Our current revenue recognition policies for our significant revenue streams materially comply with the amended guidance. The primary change for healthcare providers under the new guidance is the requirement to report the allowance for uncollectibles associated with patient responsibility amounts as a reduction in net revenue as opposed to bad debt expense as a component of operating expenses. The Company has historically included the allowance for uncollectibles associated with patient responsibility amounts with its allowance for contractual adjustments as a reduction in net revenue as such amounts are not material. Accordingly, the adoption of this guidance will not have an impact on our Consolidated Financial Statements.
62
Table of Contents
| ITEM 7A. | QUANTITATIVE AND QUALITATIVE DISCLOSURES ABOUT MARKET RISK |
We are subject to market risk primarily from exposure to changes in interest rates based on our financing, investing and cash management activities. We intend to manage interest rate risk through the use of a combination of fixed rate and variable rate debt. We borrow under our Credit Agreement at various interest rate options based on the Alternate Base Rate or LIBOR rate depending on certain financial ratios. At December 31, 2017, the outstanding principal balance on our Credit Agreement was $1.1 billion. Considering the total outstanding balance of $1.1 billion, a 1% change in interest rates would result in an impact to income before income taxes of $11.1 million per year.
63
Table of Contents
| ITEM 8. | FINANCIAL STATEMENTS AND SUPPLEMENTARY DATA |
The following Consolidated Financial Statements and Financial Statement Schedule of MEDNAX, Inc. and its subsidiaries are included in this Form 10-K on the pages set forth below:
INDEX TO FINANCIAL STATEMENTS
AND FINANCIAL STATEMENT SCHEDULE
64
Table of Contents
Report of Independent Registered Public Accounting Firm
To the Board of Directors and shareholders of
MEDNAX, Inc.
Opinions on the Financial Statements and Internal Control over Financial Reporting
We have audited the accompanying consolidated balance sheets of MEDNAX, Inc. and its subsidiaries as of December 31, 2017 and December 31, 2016, and the related consolidated statements of income, consolidated statements of equity, statements of cash flow for each of the three years in the period ended December 31, 2017, including the related notes and financial statement schedule listed in the accompanying index (collectively referred to as the “consolidated financial statements”). We also have audited the Company’s internal control over financial reporting as of December 31, 2017, based on criteria established in Internal Control—Integrated Framework (2013) issued by the Committee of Sponsoring Organizations of the Treadway Commission (COSO).
In our opinion, the consolidated financial statements referred to above present fairly, in all material respects, the financial position of the Company as of December 31, 2017 and December 31, 2016, and the results of their operations and their cash flows for each of the three years in the period ended December 31, 2017, in conformity with accounting principles generally accepted in the United States of America. Also in our opinion, the Company maintained, in all material respects, effective internal control over financial reporting as of December 31, 2017, based on criteria established in Internal Control—Integrated Framework (2013) issued by the COSO.
Basis for Opinions
The Company’s management is responsible for these consolidated financial statements, for maintaining effective internal control over financial reporting, and for its assessment of the effectiveness of internal control over financial reporting, included in Management’s Annual Report on Internal Control over Financial Reporting under Item 9A. Our responsibility is to express opinions on the Company’s consolidated financial statements and on the Company’s internal control over financial reporting based on our audits. We are a public accounting firm registered with the Public Company Accounting Oversight Board (United States) (“PCAOB”) and are required to be independent with respect to the Company in accordance with the U.S. federal securities laws and the applicable rules and regulations of the Securities and Exchange Commission and the PCAOB.
We conducted our audits in accordance with the standards of the PCAOB. Those standards require that we plan and perform the audits to obtain reasonable assurance about whether the consolidated financial statements are free of material misstatement, whether due to error or fraud, and whether effective internal control over financial reporting was maintained in all material respects.
Our audits of the consolidated financial statements included performing procedures to assess the risks of material misstatement of the consolidated financial statements, whether due to error or fraud, and performing procedures that respond to those risks. Such procedures included examining, on a test basis, evidence regarding the amounts and disclosures in the consolidated financial statements. Our audits also included evaluating the accounting principles used and significant estimates made by management, as well as evaluating the overall presentation of the consolidated financial statements. Our audit of internal control over financial reporting included obtaining an understanding of internal control over financial reporting, assessing the risk that a material weakness exists, and testing and evaluating the design and operating effectiveness of internal control based on the assessed risk. Our audits also included performing such other procedures as we considered necessary in the circumstances. We believe that our audits provide a reasonable basis for our opinions.
As described in Management’s Annual Report on Internal Control over Financial Reporting, management has excluded four radiology physician practices from its assessment of internal control over financial reporting as of December 31, 2017 because they were acquired by the Company in purchase business combinations during 2017.
65
Table of Contents
We have also excluded these four radiology physician practices from our audit of internal control over financial reporting. These four radiology physician practices are subsidiaries whose aggregate total assets and aggregate net revenues excluded from management’s assessment and our audit of internal control over financial reporting collectively represent approximately 2% and 3%, respectively, of the related consolidated financial statement amounts as of and for the year ended December 31, 2017.
Definition and Limitations of Internal Control over Financial Reporting
A company’s internal control over financial reporting is a process designed to provide reasonable assurance regarding the reliability of financial reporting and the preparation of financial statements for external purposes in accordance with generally accepted accounting principles. A company’s internal control over financial reporting includes those policies and procedures that (i) pertain to the maintenance of records that, in reasonable detail, accurately and fairly reflect the transactions and dispositions of the assets of the company; (ii) provide reasonable assurance that transactions are recorded as necessary to permit preparation of financial statements in accordance with generally accepted accounting principles, and that receipts and expenditures of the company are being made only in accordance with authorizations of management and directors of the company; and (iii) provide reasonable assurance regarding prevention or timely detection of unauthorized acquisition, use, or disposition of the company’s assets that could have a material effect on the financial statements.
Because of its inherent limitations, internal control over financial reporting may not prevent or detect misstatements. Also, projections of any evaluation of effectiveness to future periods are subject to the risk that controls may become inadequate because of changes in conditions, or that the degree of compliance with the policies or procedures may deteriorate.
/s/ PricewaterhouseCoopers LLP
Certified Public Accountants
Miami, Florida
February 14, 2018
We have served as the Company’s auditor since 1999.
66
Table of Contents
MEDNAX, INC.
(in thousands)
| December 31, | ||||||||
| 2017 | 2016 | |||||||
| ASSETS | ||||||||
| Current assets: |
||||||||
| Cash and cash equivalents |
$ | 60,200 | $ | 55,698 | ||||
| Short-term investments |
10,292 | 11,286 | ||||||
| Accounts receivable, net |
503,999 | 495,276 | ||||||
| Prepaid expenses |
15,584 | 11,051 | ||||||
| Other assets |
37,160 | 13,817 | ||||||
|
|
|
|
|
|||||
| Total current assets |
627,235 | 587,128 | ||||||
| Restricted cash |
20,000 | — | ||||||
| Investments |
80,682 | 78,975 | ||||||
| Property and equipment, net |
123,536 | 103,068 | ||||||
| Goodwill |
4,283,963 | 3,845,157 | ||||||
| Intangible assets, net |
639,928 | 668,529 | ||||||
| Other assets |
91,934 | 56,543 | ||||||
|
|
|
|
|
|||||
| Total assets |
$ | 5,867,278 | $ | 5,339,400 | ||||
|
|
|
|
|
|||||
| LIABILITIES & SHAREHOLDERS’ EQUITY | ||||||||
| Current liabilities: |
||||||||
| Accounts payable and accrued expenses |
$ | 438,017 | $ | 407,938 | ||||
| Current portion of long-term debt and capital lease obligations |
1,401 | 22,054 | ||||||
| Income taxes payable |
92,007 | 18,957 | ||||||
|
|
|
|
|
|||||
| Total current liabilities |
531,425 | 448,949 | ||||||
| Line of credit |
1,110,500 | 783,500 | ||||||
| Long-term debt and capital lease obligations, net |
740,923 | 900,128 | ||||||
| Long-term professional liabilities |
212,274 | 173,080 | ||||||
| Deferred income taxes |
147,797 | 227,802 | ||||||
| Other liabilities |
57,905 | 45,174 | ||||||
|
|
|
|
|
|||||
| Total liabilities |
2,800,824 | 2,578,633 | ||||||
|
|
|
|
|
|||||
| Commitments and contingencies |
||||||||
| Shareholders’ equity: |
||||||||
| Preferred stock; $.01 par value; 1,000 shares authorized; none issued |
— | — | ||||||
| Common stock; $.01 par value; 200,000 shares authorized; 93,721 and 93,718 shares issued and outstanding, respectively |
937 | 937 | ||||||
| Additional paid-in capital |
1,017,328 | 974,304 | ||||||
| Retained earnings |
2,048,189 | 1,785,526 | ||||||
|
|
|
|
|
|||||
| Total shareholders’ equity |
3,066,454 | 2,760,767 | ||||||
|
|
|
|
|
|||||
| Total liabilities and shareholders’ equity |
$ | 5,867,278 | $ | 5,339,400 | ||||
|
|
|
|
|
|||||
The accompanying notes are an integral part of these Consolidated Financial Statements.
67
Table of Contents
MEDNAX, INC.
CONSOLIDATED STATEMENTS OF INCOME
(in thousands, except for per share data)
| Years Ended December 31, | ||||||||||||
| 2017 | 2016 | 2015 | ||||||||||
| Net revenue |
$ | 3,458,312 | $ | 3,183,159 | $ | 2,779,996 | ||||||
|
|
|
|
|
|
|
|||||||
| Operating expenses: |
||||||||||||
| Practice salaries and benefits |
2,337,734 | 2,031,220 | 1,753,505 | |||||||||
| Practice supplies and other operating expenses |
120,518 | 118,416 | 98,480 | |||||||||
| General and administrative expenses |
417,105 | 372,572 | 305,915 | |||||||||
| Depreciation and amortization |
102,879 | 89,264 | 64,228 | |||||||||
|
|
|
|
|
|
|
|||||||
| Total operating expenses |
2,978,236 | 2,611,472 | 2,222,128 | |||||||||
|
|
|
|
|
|
|
|||||||
| Income from operations |
480,076 | 571,687 | 557,868 | |||||||||
| Investment and other income |
3,953 | 2,019 | 1,844 | |||||||||
| Interest expense |
(74,559 | ) | (63,092 | ) | (23,110 | ) | ||||||
| Equity in earnings of unconsolidated affiliates |
952 | 3,185 | 3,127 | |||||||||
|
|
|
|
|
|
|
|||||||
| Total non-operating expenses |
(69,654 | ) | (57,888 | ) | (18,139 | ) | ||||||
|
|
|
|
|
|
|
|||||||
| Income before income taxes |
410,422 | 513,799 | 539,729 | |||||||||
| Income tax provision |
(90,050 | ) | (189,203 | ) | (204,038 | ) | ||||||
|
|
|
|
|
|
|
|||||||
| Net income |
320,372 | 324,596 | 335,691 | |||||||||
| Net loss attributable to noncontrolling interests |
— | 318 | 629 | |||||||||
|
|
|
|
|
|
|
|||||||
| Net income attributable to MEDNAX, Inc. |
$ | 320,372 | $ | 324,914 | $ | 336,320 | ||||||
|
|
|
|
|
|
|
|||||||
| Per common and common equivalent share data: |
||||||||||||
| Net income attributable to MEDNAX, Inc.: |
||||||||||||
| Basic |
$ | 3.47 | $ | 3.52 | $ | 3.61 | ||||||
|
|
|
|
|
|
|
|||||||
| Diluted |
$ | 3.45 | $ | 3.49 | $ | 3.58 | ||||||
|
|
|
|
|
|
|
|||||||
| Weighted average common shares: |
||||||||||||
| Basic |
92,431 | 92,422 | 93,077 | |||||||||
|
|
|
|
|
|
|
|||||||
| Diluted |
92,958 | 93,109 | 93,960 | |||||||||
|
|
|
|
|
|
|
|||||||
The accompanying notes are an integral part of these Consolidated Financial Statements.
68
Table of Contents
MEDNAX, INC.
CONSOLIDATED STATEMENTS OF EQUITY
(in thousands)
| Common Stock | ||||||||||||||||||||||||
| Number of Shares |
Amount | Additional Paid-in Capital |
Retained Earnings |
Noncontrolling Interests |
Total Equity | |||||||||||||||||||
| Balance at December 31, 2014 |
96,030 | $ | 960 | $ | 886,877 | $ | 1,376,782 | $ | 947 | $ | 2,265,566 | |||||||||||||
| Net income (loss) |
— | — | — | 336,320 | (629 | ) | 335,691 | |||||||||||||||||
| Common stock issued under employee stock option and employee stock purchase plan |
463 | 5 | 20,123 | — | — | 20,128 | ||||||||||||||||||
| Issuance of restricted stock and vesting of deferred stock |
527 | 5 | (5 | ) | — | — | — | |||||||||||||||||
| Issuance of restricted stock for acquisition consideration |
114 | 1 | 7,799 | — | — | 7,800 | ||||||||||||||||||
| Stock-based compensation expense |
— | — | 32,129 | — | — | 32,129 | ||||||||||||||||||
| Forfeitures of restricted stock |
(30 | ) | — | — | — | — | — | |||||||||||||||||
| Repurchased common stock |
(3,365 | ) | (34 | ) | (32,271 | ) | (202,746 | ) | (235,051 | ) | ||||||||||||||
| Excess tax benefit related to employee stock incentive plans |
— | — | 11,583 | — | — | 11,583 | ||||||||||||||||||
|
|
|
|
|
|
|
|
|
|
|
|
|
|||||||||||||
| Balance at December 31, 2015 |
93,739 | $ | 937 | $ | 926,235 | $ | 1,510,356 | $ | 318 | $ | 2,437,846 | |||||||||||||
| Net income (loss) |
— | — | — | 324,914 | (318 | ) | 324,596 | |||||||||||||||||
| Common stock issued under employee stock option, employee stock purchase plan and stock purchase plan |
473 | 5 | 22,017 | — | — | 22,022 | ||||||||||||||||||
| Issuance of restricted stock |
505 | 5 | (5 | ) | — | — | — | |||||||||||||||||
| Stock-based compensation expense |
— | — | 34,000 | — | — | 34,000 | ||||||||||||||||||
| Forfeitures of restricted stock |
(53 | ) | (1 | ) | 1 | — | — | — | ||||||||||||||||
| Repurchased common stock |
(946 | ) | (9 | ) | (12,075 | ) | (49,744 | ) | (61,828 | ) | ||||||||||||||
| Excess tax benefit related to employee stock incentive plans |
— | — | 4,131 | — | — | 4,131 | ||||||||||||||||||
|
|
|
|
|
|
|
|
|
|
|
|
|
|||||||||||||
| Balance at December 31, 2016 |
93,718 | $ | 937 | $ | 974,304 | $ | 1,785,526 | $ | — | $ | 2,760,767 | |||||||||||||
| Net income |
— | — | — | 320,372 | — | 320,372 | ||||||||||||||||||
| Common stock issued under employee stock option, employee stock purchase plan and stock purchase plan |
528 | 5 | 23,271 | — | — | 23,276 | ||||||||||||||||||
| Issuance of restricted stock |
536 | 5 | (5 | ) | — | — | — | |||||||||||||||||
| Issuance of restricted stock for acquisition consideration |
69 | 1 | 2,657 | — | — | 2,658 | ||||||||||||||||||
| Stock-based compensation expense |
— | — | 29,573 | — | — | 29,573 | ||||||||||||||||||
| Forfeitures of restricted stock |
(92 | ) | (1 | ) | 1 | — | — | — | ||||||||||||||||
| Repurchased common stock |
(1,038 | ) | (10 | ) | (12,473 | ) | (57,709 | ) | (70,192 | ) | ||||||||||||||
|
|
|
|
|
|
|
|
|
|
|
|
|
|||||||||||||
| Balance at December 31, 2017 |
93,721 | $ | 937 | $ | 1,017,328 | $ | 2,048,189 | $ | — | $ | 3,066,454 | |||||||||||||
|
|
|
|
|
|
|
|
|
|
|
|
|
|||||||||||||
The accompanying notes are an integral part of these Consolidated Financial Statements.
69
Table of Contents
MEDNAX, INC.
CONSOLIDATED STATEMENTS OF CASH FLOWS
(in thousands)
| Years Ended December 31, | ||||||||||||
| 2017 | 2016 | 2015 | ||||||||||
| Cash flows from operating activities: |
||||||||||||
| Net income |
$ | 320,372 | $ | 324,596 | $ | 335,691 | ||||||
| Adjustments to reconcile net income to net cash provided from operating activities: |
||||||||||||
| Depreciation and amortization |
102,879 | 89,264 | 64,228 | |||||||||
| Amortization of premiums, discounts and issuance costs |
5,514 | 4,816 | 1,541 | |||||||||
| Stock-based compensation expense |
29,573 | 34,000 | 32,129 | |||||||||
| Deferred income taxes |
(60,073 | ) | 18,149 | 14,494 | ||||||||
| Other |
(3,783 | ) | 212 | (1,052 | ) | |||||||
| Changes in assets and liabilities: |
||||||||||||
| Accounts receivable |
7,803 | (34,000 | ) | (55,391 | ) | |||||||
| Prepaid expenses and other current assets |
(2,792 | ) | (783 | ) | (4,905 | ) | ||||||
| Other long-term assets |
(2,709 | ) | 10,035 | 98 | ||||||||
| Accounts payable and accrued expenses |
24,551 | 11,617 | (7,874 | ) | ||||||||
| Income taxes payable |
73,050 | (2,234 | ) | (4,101 | ) | |||||||
| Payments of contingent consideration liabilities |
(750 | ) | (1,037 | ) | (1,439 | ) | ||||||
| Long-term professional liabilities |
18,478 | (3,452 | ) | (2,064 | ) | |||||||
| Other liabilities |
(735 | ) | (7,405 | ) | (2,654 | ) | ||||||
|
|
|
|
|
|
|
|||||||
| Net cash provided from operating activities |
511,378 | 443,778 | 368,701 | |||||||||
|
|
|
|
|
|
|
|||||||
| Cash flows from investing activities: |
||||||||||||
| Acquisition payments, net of cash acquired |
(531,696 | ) | (762,302 | ) | (818,903 | ) | ||||||
| Purchases of investments |
(27,723 | ) | (60,976 | ) | (33,980 | ) | ||||||
| Proceeds from maturities of investments |
25,410 | 41,325 | 31,956 | |||||||||
| Purchases of property and equipment |
(49,309 | ) | (39,264 | ) | (27,073 | ) | ||||||
| Other |
6,705 | — | — | |||||||||
|
|
|
|
|
|
|
|||||||
| Net cash used in investing activities |
(576,613 | ) | (821,217 | ) | (848,000 | ) | ||||||
|
|
|
|
|
|
|
|||||||
| Cash flows from financing activities: |
||||||||||||
| Borrowings on credit agreement |
2,846,000 | 1,940,000 | 2,121,500 | |||||||||
| Payments on credit agreement |
(2,699,000 | ) | (1,510,000 | ) | (2,156,000 | ) | ||||||
| Proceeds from issuance of senior notes |
— | — | 750,000 | |||||||||
| Payments for financing costs |
(3,525 | ) | — | (14,190 | ) | |||||||
| Payments of contingent consideration liabilities |
(5,449 | ) | (10,740 | ) | (12,856 | ) | ||||||
| Payments on capital lease obligations |
(2,267 | ) | (2,130 | ) | (2,171 | ) | ||||||
| Excess tax benefit from exercises of stock options and vesting of restricted and deferred stock |
— | 4,241 | 11,583 | |||||||||
| Proceeds from issuance of common stock |
23,276 | 22,022 | 20,128 | |||||||||
| Contribution from noncontrolling interests |
894 | — | — | |||||||||
| Repurchases of common stock |
(70,192 | ) | (61,828 | ) | (235,051 | ) | ||||||
|
|
|
|
|
|
|
|||||||
| Net cash provided from financing activities |
89,737 | 381,565 | 482,943 | |||||||||
|
|
|
|
|
|
|
|||||||
| Net increase in cash and cash equivalents |
24,502 | 4,126 | 3,644 | |||||||||
| Cash, cash equivalents and restricted cash at beginning of year |
55,698 | 51,572 | 47,928 | |||||||||
|
|
|
|
|
|
|
|||||||
| Cash, cash equivalents and restricted cash at end of year |
$ | 80,200 | $ | 55,698 | $ | 51,572 | ||||||
|
|
|
|
|
|
|
|||||||
| Supplemental disclosure of cash flow information: |
||||||||||||
| Cash paid for: |
||||||||||||
| Interest |
$ | 73,837 | $ | 60,453 | $ | 20,367 | ||||||
| Income taxes |
$ | 75,427 | $ | 175,962 | $ | 181,005 | ||||||
| Non-cash investing and financing activities: |
||||||||||||
| Value of common stock issued for acquisitions |
$ | 2,657 | $ | — | $ | 7,800 | ||||||
| Equipment financed through capital leases |
$ | 684 | $ | 1,619 | $ | 3,135 | ||||||
| Property and equipment included in accounts payable |
$ | 2,700 | $ | 2,673 | $ | 1,800 | ||||||
The accompanying notes are an integral part of these Consolidated Financial Statements.
70
Table of Contents
MEDNAX, INC.
NOTES TO CONSOLIDATED FINANCIAL STATEMENTS
1. General:
The principal business activity of MEDNAX, Inc. (“MEDNAX” or the “Company”) and its subsidiaries is to provide neonatal, anesthesia, radiology and teleradiology, maternal-fetal and other pediatric subspecialty physician services. The Company has contracts with affiliated business corporations or professional associations, limited liability companies and partnerships (“affiliated professional contractors”), which are separate legal entities that provide physician services in certain states and Puerto Rico. The Company and its affiliated professional contractors also have contracts with hospitals and other healthcare facilities to provide physician services, which include (i) fee-for-service contracts, whereby hospitals and other customers agree, in exchange for the Company’s services, to authorize the Company and its healthcare professionals to bill and collect the charges for medical services rendered by the Company’s affiliated healthcare professionals, and (ii) administrative fee contracts, whereby the Company is assured a minimum revenue level.
In addition to its national physician network, the Company also provides services nationwide to healthcare providers, including its own, through complementary businesses including a management services organization specializing in full-service revenue cycle management and a consulting services company.
| 2. Summary | of Significant Accounting Policies: |
Principles of Presentation
The consolidated financial statements include all the accounts of the Company and its subsidiaries combined with the accounts of the affiliated professional contractors with which the Company currently has specific management arrangements. The Company’s agreements with affiliated professional contractors provide that the term of the arrangements are in most cases permanent, subject only to termination by the Company, except in the case of gross negligence, fraud or bankruptcy of the Company. The Company has the right to receive income, both as ongoing fees and as proceeds from the sale of its interest in the Company’s affiliated professional contractors, in an amount that fluctuates based on the performance of the affiliated professional contractors and the change in the fair value of the Company’s interest in the affiliated professional contractors. The Company has exclusive responsibility for the provision of all non-medical services required for the day-to-day operation and management of the Company’s affiliated professional contractors and establishes the guidelines for the employment and compensation of the physicians. In addition, the agreements provide that the Company has the right, but not the obligation, to purchase, or to designate a person(s) to purchase, the stock of the Company’s affiliated professional contractors for a nominal amount. Separately, in its sole discretion, the Company has the right to assign its interest in the agreements. Based upon the provisions of these agreements, the Company has determined that the affiliated professional contractors are variable interest entities and that the Company is the primary beneficiary as defined in the accounting guidance for consolidation. All significant intercompany and interaffiliate accounts and transactions have been eliminated.
The Company is a partner in a joint venture in which it owns a 37.5% economic interest. The Company accounts for this joint venture under the equity method of accounting because the Company exercises significant influence over, but does not control, this entity. On March 31, 2017, the Company sold its 75% economic interest in a second joint venture. The Company had a management agreement with the joint venture and, based on the terms of the agreement, the Company had determined that the joint venture was a variable interest entity for which the Company was the primary beneficiary. Accordingly, through the date of the sale, the financial results of the joint venture were fully consolidated into the Company’s operating results and the equity interests of the outside investor in the equity and results of operations of this consolidated entity were accounted for and presented as noncontrolling interests. See Note 6 for more information regarding the deconsolidation of this joint venture.
71
Table of Contents
Recently Adopted Accounting Pronouncements
In January 2017, the accounting guidance related to goodwill impairment was amended to remove step two of the impairment test that requires a hypothetical purchase price allocation in order to measure the amount of any impairment. Under the new guidance, only a single-step quantitative test is required and any goodwill impairment will now be the amount by which a reporting unit’s carrying value exceeds its fair value. The new guidance does not amend the optional alternative to perform a qualitative assessment to determine if a quantitative goodwill impairment test is necessary. The Company early adopted this accounting guidance on December 31, 2017 as permitted. The adoption of this guidance did not have an impact on the Company’s Consolidated Financial Statements.
In January 2017, the accounting guidance related to business combinations was amended to clarify the definition of a business. The Company early adopted this accounting guidance on December 31, 2017 as permitted. The adoption of this guidance did not have an impact on the Company’s Consolidated Financial Statements.
In August 2016 and November 2016, the accounting guidance related to the statement of cash flows was amended with the intent of reducing diversity in practice as to the classification of certain transactions in the statement of cash flows. The Company early adopted this accounting guidance on December 31, 2017 as permitted. The adoption of this guidance resulted in the inclusion of restricted cash balances in the Company’s Consolidated Statements of Cash Flows.
In March 2016, the accounting guidance related to various aspects of share-based payment transactions was amended, including income tax consequences, classification of awards as either equity or liabilities, and classification on the statement of cash flows. Under the new guidance, excess tax benefits and deficiencies are to be recognized as income tax benefits or expenses in the income statement as discrete items in the reporting period in which they occur instead of increases or decreases to shareholders’ equity. Excess tax benefits should be classified along with other income tax cash flows as operating activities. With regard to forfeitures, the entity may make an entity-wide accounting policy election to either estimate the number of awards that are expected to vest or account for forfeitures when they occur. This guidance became effective for the Company on January 1, 2017. The Company adopted this guidance prospectively for both the income statement and statement of cash flows, and the adoption of this guidance did not have a material impact on the Company’s Consolidated Financial Statements. The Company continues to estimate forfeitures based on the number of awards that are expected to vest.
New Accounting Pronouncements
In February 2016, the accounting guidance related to leases was issued that will require an entity to recognize leased assets and the rights and obligations created by those leased assets on the balance sheet and to disclose key information about the entity’s leasing arrangements. This guidance will become effective for the Company on January 1, 2019, with early adoption permitted. The Company expects that the adoption of this guidance will have a material impact on its Consolidated Balance Sheets and related disclosures, resulting from the recognition of significant right of use assets and related liabilities primarily related to its operating lease arrangements for space in hospitals and certain other facilities for its business and medical offices. The Company is in the process of reviewing its existing lease portfolio and accumulating all of the necessary information required to properly account for leases under the new guidance. Additionally, the Company is assessing system requirements, required changes to its processes and internal control implications to ensure the Company will meet the reporting and disclosure requirements. The Company’s evaluation of this guidance and its impacts are expected to continue through the third quarter of 2018.
In May 2014, the accounting guidance related to revenue recognition was amended to outline a single, comprehensive model for accounting for revenue from contracts with customers. The core principle of the new
72
Table of Contents
accounting guidance is to require an entity to recognize as revenue the amount that reflects the consideration to which it expects to be entitled in exchange for goods or services as it transfers control to its customers. The new guidance will become effective for the Company on January 1, 2018. The Company’s current revenue recognition policies for its significant revenue streams materially comply with the amended guidance. The primary change for healthcare providers under the new guidance is the requirement to report the allowance for uncollectibles associated with patient responsibility amounts as a reduction in net revenue as opposed to bad debt expense as a component of operating expenses. The Company has historically included the allowance for uncollectibles associated with patient responsibility amounts with its allowance for contractual adjustments as a reduction in net revenue as such amounts are not material. Accordingly, the adoption of this guidance will not have an impact on our Consolidated Financial Statements.
Accounting Estimates and Assumptions
The preparation of financial statements in conformity with accounting principles generally accepted in the United States (“GAAP”) requires management to make estimates and assumptions that affect the reported amounts of assets and liabilities and disclosure of contingent assets and liabilities at the date of the financial statements and the reported amounts of revenue and expenses during the reporting periods. Significant estimates and assumptions are involved in the calculation of the Company’s allowance for contractual adjustments and uncollectibles on accounts receivable, liabilities for self- insured amounts and claims incurred but not reported related to the Company’s professional liability risks and the fair value of goodwill. Actual results could differ from those estimates.
Segment Reporting
The results of the Company’s operations are aggregated into a single reportable segment for purposes of presenting financial information in accordance with the accounting guidance for segment reporting.
The following table summarizes the Company’s net revenue by service line (in percentages):
| Years Ended December 31, | ||||||||||||
| 2017 | 2016 | 2015 | ||||||||||
| Anesthesiology |
38 | % | 39 | % | 37 | % | ||||||
| Neonatology and other pediatric subspecialties |
37 | % | 39 | % | 44 | % | ||||||
| Maternal-fetal medicine |
8 | % | 8 | % | 9 | % | ||||||
| Radiology and teleradiology |
8 | % | 6 | % | 4 | % | ||||||
| Management services |
6 | % | 5 | % | 2 | % | ||||||
| Pediatric cardiology |
3 | % | 3 | % | 4 | % | ||||||
|
|
|
|
|
|
|
|||||||
| 100 | % | 100 | % | 100 | % | |||||||
|
|
|
|
|
|
|
|||||||
Revenue Recognition
Patient service revenue is recognized at the time services are provided by the Company’s affiliated physicians. Almost all of the Company’s patient service revenue is reimbursed by government-sponsored healthcare programs and third-party insurance payors. Payments for services rendered to the Company’s patients are generally less than billed charges. The Company monitors its revenue and receivables from these sources and records an estimated contractual allowance to properly account for the anticipated differences between billed and reimbursed amounts.
Accordingly, patient service revenue is presented net of an estimated provision for contractual adjustments and uncollectibles. The Company estimates allowances for contractual adjustments and uncollectibles on accounts receivable based upon historical experience and other factors, including days sales outstanding (“DSO”)
73
Table of Contents
for accounts receivable, evaluation of expected adjustments and delinquency rates, past adjustments and collection experience in relation to amounts billed, an aging of accounts receivable, current contract and reimbursement terms, changes in payor mix and other relevant information. Contractual adjustments result from the difference between the physician rates for services performed and the reimbursements by government-sponsored healthcare programs and insurance companies for such services.
In addition, the Company generates revenue for services rendered under various coding and billing contracts. Contract terms are specific to each customer and may include a combination of a flat fee for coding of medical charts, a fixed fee per patient visit as well as a percentage of cash collections received by the providers. Revenue for flat and fixed fee arrangements is recognized in the month the coding occurs or the patient visit occurs. Revenue for percentage fees are recognized in the month that cash is collected for customers from payors. Revenue recorded for these services during 2017 were immaterial.
Accounts receivable are primarily amounts due under fee-for-service contracts from third-party payors, such as insurance companies, self-insured employers and patients and government-sponsored healthcare programs geographically dispersed throughout the United States and its territories. Concentration of credit risk relating to accounts receivable is limited by the number, diversity and geographic dispersion of the business units managed by the Company, as well as by the large number of patients and payors, including the various governmental agencies in the states in which the Company provides services. Receivables from government agencies made up approximately 17% of net accounts receivable at December 31, 2017 and 2016.
Cash and Cash Equivalents
Cash equivalents are defined as all highly liquid financial instruments with maturities of 90 days or less from the date of purchase. The Company’s cash equivalents typically consist of demand deposits, amounts on deposit in money market accounts, and funds invested in overnight repurchase agreements. Cash equivalent balances may, at certain times, exceed federally insured limits.
Certain cash equivalents carried by the Company are subject to the fair value provisions of the accounting guidance for fair value measurements. See “Fair Value Measurements” below.
Restricted Cash
Restricted cash consists of funds in escrow related to a potential future payment for contingent consideration for an acquisition completed during the year ended December 31, 2017. See Note 6 for more information regarding the underlying contingent consideration arrangement.
Investments
Investments consist of municipal debt securities, federal home loan securities and certificates of deposit. Investments with remaining maturities of less than one year are classified as short-term investments. Investments classified as long-term have maturities of one year to six years.
The Company intends and has the ability to hold its securities to maturity, and therefore carries such investments at amortized cost in accordance with the provisions of the accounting guidance for investments in debt securities.
Property and Equipment
Property and equipment are recorded at original purchase cost. Depreciation of property and equipment is computed using the straight-line method over the estimated useful lives of the underlying assets. Estimated useful lives are generally 30 years for buildings; three to seven years for medical equipment, computer equipment,
74
Table of Contents
software and furniture; and the lesser of the useful life or the remaining lease term for leasehold improvements and capital leases. Upon sale or retirement of property and equipment, the related cost and accumulated depreciation are eliminated from the respective accounts and any resulting gain or loss is included in earnings.
Business Acquisitions
The Company accounts for all business acquisitions at fair value and expenses acquisition costs as they are incurred. Any identifiable assets acquired and liabilities assumed are recognized and measured at their respective fair values on the acquisition date. If information about facts and circumstances existing as of the acquisition date is incomplete at the end of the reporting period in which a business acquisition occurs, the Company will report provisional amounts for the items for which the accounting is incomplete. The measurement period ends once the Company receives sufficient information to finalize the fair values; however, the period will not exceed one year from the acquisition date. Prior to January 1, 2016, any material adjustments recognized during the measurement period were required to be reflected retrospectively in the Consolidated Financial Statements of the subsequent period. Beginning on January 1, 2016, any adjustments to provisional amounts that are identified during the measurement period are required to be recognized in the reporting period in which the adjustment amounts are determined.
In connection with certain acquisitions, the Company enters into agreements to pay additional amounts in cash or common stock based on the achievement of certain performance measures for up to five years ending after the acquisition dates. The Company measures this contingent consideration at fair value at the acquisition date and records such contingent consideration as a liability or equity on the Company’s Consolidated Balance Sheets on the acquisition date. The fair value of each contingent consideration liability is remeasured at each reporting period with any change in fair value recognized as income or expense within operations in the Company’s Consolidated Statements of Income. See Note 6 for more information on the Company’s business acquisitions.
Goodwill and Other Intangible Assets
The Company records acquired assets and assumed liabilities at their respective fair values under the acquisition method of accounting. Goodwill represents the excess of purchase price over the fair value of the net assets acquired. Intangible assets with finite lives, principally physician and hospital agreements, customer relationships, patented technology and trade names, are recognized apart from goodwill at the time of acquisition based on the contractual-legal and separability criteria established in the accounting guidance. Intangible assets with finite lives are amortized on either an accelerated basis based on the annual undiscounted economic cash flows associated with the particular intangible asset or on a straight-line basis over their estimated useful lives. Intangible assets with finite lives are amortized over periods of one to 20 years.
Goodwill is tested for impairment at a reporting unit level on at least an annual basis in accordance with the subsequent measurement provisions of the accounting guidance for goodwill. The Company defines a reporting unit based upon its management structure for services provided in specific regions of the United States. The Company early adopted new accounting guidance in 2017 that requires only a single-step quantitative test with any goodwill impairment measured as the amount by which a reporting unit’s carrying value exceeds its fair value. The Company uses income and market-based valuation approaches to determine the fair value of its reporting units. These approaches focus on discounted cash flows and market multiples based on the Company’s market capitalization to derive the fair value of a reporting unit. The Company also considers the economic outlook for the healthcare services industry and various other factors during the testing process, including hospital and physician contract changes, local market developments, changes in third-party payor payments, and other publicly available information. The Company completed annual impairment tests in the third quarter of each of 2017, 2016 and 2015 and determined that goodwill was not impaired in any of the three years.
75
Table of Contents
Long-Lived Assets
The Company is required to evaluate long-lived assets, including intangible assets subject to amortization, whenever events or changes in circumstances indicate that the carrying value of the assets may not be fully recoverable. The recoverability of such assets is measured by a comparison of the carrying value of the assets to the future undiscounted cash flows before interest charges to be generated by the assets. If long-lived assets are impaired, the impairment to be recognized is measured as the excess of the carrying value over the fair value. Long-lived assets held for disposal are reported at the lower of the carrying value or fair value less disposal costs. The Company does not believe there are any indicators that would require an adjustment to such assets or their estimated periods of recovery at December 31, 2017 pursuant to current accounting standards.
Common Stock Repurchases
The Company repurchases shares of its common stock as authorized from time to time by its Board of Directors. The Company treats repurchased shares of its common stock as retired as any repurchased shares become authorized but unissued shares. The reacquisition cost of repurchased shares is recorded as a reduction in the respective components of shareholders’ equity.
Professional Liability Coverage
The Company maintains professional liability insurance policies with third-party insurers generally on a claims-made basis, subject to deductibles or self-insured retention, exclusions and other restrictions. The Company’s self-insured retention under its professional liability insurance program is maintained primarily through a wholly owned captive insurance subsidiary. The Company records an estimate of liabilities for self-insured amounts and claims incurred but not reported based on an actuarial valuation using historical loss information, claim emergence patterns and various actuarial assumptions. Liabilities for claims incurred but not reported are not discounted.
Income Taxes
The Company records deferred income taxes using the liability method, whereby deferred tax assets and liabilities are determined based on the difference between the financial statement and tax bases of assets and liabilities using enacted tax rates in effect for the year in which the differences are expected to reverse. If it is more likely than not that all or a portion of deferred tax assets will not be realized, a valuation allowance is provided against such deferred tax assets. In making such determination, the Company considers all available positive and negative evidence, including future reversals of existing taxable temporary differences, projected future taxable income, tax-planning strategies, and results of recent operations.
The accounting guidance for uncertain tax positions prescribes a recognition threshold and measurement attribute for financial statement recognition and measurement of a tax position taken or expected to be taken in a tax return. The guidance also requires policy disclosures regarding penalties and interest and extensive disclosures regarding increases and decreases in uncertain tax positions as a result of tax positions taken in a current or prior period, settlements with taxing authorities and any lapse of an applicable statute of limitations. Additional qualitative discussion is required for any tax position that may result in a significant increase or decrease in uncertain tax positions within a 12-month period from the Company’s reporting date.
Stock Incentive Plans
The Company grants stock-based awards consisting primarily of restricted stock to key employees under its Amended and Restated 2008 Incentive Compensation Plan, as amended. The Company measures the cost of employee services received in exchange for stock-based awards based on grant-date fair value and allocates the resulting compensation expense over the corresponding requisite service period using the graded vesting attribution method. The Company also performs analyses to estimate forfeitures of stock-based awards on an annual basis and adjusts the estimates as necessary based on the number of awards that ultimately vest.
76
Table of Contents
Net Income Per Common Share
Basic net income per common share is calculated by dividing net income by the weighted average number of common shares outstanding during the period. Diluted net income per common share is calculated by dividing net income by the weighted average number of common and potential common shares outstanding during the period. Potential common shares consist of outstanding restricted stock, deferred stock and stock options and is calculated using the treasury stock method. On January 1, 2017, the Company adopted new accounting guidance that no longer permits the Company to include the assumed excess tax benefits related to the potential exercise or vesting of its stock-based awards in the treasury stock method computation. The impact on the weighted average number of common and common equivalent shares outstanding from excluding such assumed excess tax benefits for the year ended December 31, 2017 was not material. See “Recently Adopted Accounting Pronouncements” above for additional information on the adoption of the new accounting guidance.
Fair Value Measurements
In accordance with the accounting guidance for fair value measurements and disclosures, the Company carries its money market funds included in cash and cash equivalents at fair value. In accordance with the three-tier fair value hierarchy under this guidance, the Company determined the fair value using quoted market prices, a Level 1 input as defined under the accounting guidance for fair value measurements. At December 31, 2017 and 2016, the Company’s money market funds had a fair value of $9.2 million and $12.4 million, respectively.
The Company also carries the cash surrender value of life insurance related to its deferred compensation arrangements at fair value. The investments underlying the life insurance contracts consist primarily of exchange-traded equity securities and mutual funds with quoted prices in active markets. In accordance with the three-tier fair value hierarchy, the Company determined the fair value using the cash surrender value of the life insurance, a Level 2 input as defined under the accounting guidance for fair value measurements. At December 31, 2017 and 2016, the Company’s cash surrender value of life insurance had a fair value of $15.6 million and $15.8 million, respectively.
In addition, the Company carries its contingent consideration liabilities related to acquisitions at fair value. In accordance with the three-tier fair value hierarchy, the Company determined the fair value of its contingent consideration liabilities using the income approach with assumed discount rates and payment probabilities. The income approach uses Level 3, or unobservable inputs as defined under the accounting guidance for fair value measurements. At December 31, 2017 and 2016, the Company’s contingent consideration liabilities had a fair value of $30.5 million and $17.3 million, respectively. See Note 6 for more information regarding the Company’s contingent consideration liabilities.
The carrying amounts of cash equivalents, short-term investments, accounts receivable and accounts payable and accrued expenses approximate fair value due to the short maturities of the respective instruments. The carrying values of long-term investments, line of credit, variable rate long-term debt and capital lease obligations approximate fair value. If the Company’s investments were measured at fair value, they would be categorized as Level 2 in the fair value hierarchy. If the Company’s line of credit and variable long-term debt were measured at fair value, they would be categorized as Level 2 in the fair value hierarchy. See Note 10 for information regarding the fair value of the Company’s 5.25% senior unsecured notes due 2023 (the “2023 Notes”).
77
Table of Contents
3. Investments:
Investments held are summarized as follows (in thousands):
| December 31, 2017 | December 31, 2016 | |||||||||||||||
| Short-Term | Long-Term | Short-Term | Long-Term | |||||||||||||
| Municipal debt securities |
$ | 8,312 | $ | 46,195 | $ | 10,306 | $ | 46,513 | ||||||||
| Federal home loan securities |
1,000 | 30,322 | — | 28,747 | ||||||||||||
| Certificates of deposit |
980 | 4,165 | 980 | 3,715 | ||||||||||||
|
|
|
|
|
|
|
|
|
|||||||||
| $ | 10,292 | $ | 80,682 | $ | 11,286 | $ | 78,975 | |||||||||
|
|
|
|
|
|
|
|
|
|||||||||
Contractual maturities of long-term investments are summarized as follows (in thousands):
| December 31, | ||||||||
| 2017 | 2016 | |||||||
| Due after one year through five years |
$ | 78,561 | $ | 70,005 | ||||
| Due after five years through six years |
2,121 | 8,970 | ||||||
|
|
|
|
|
|||||
| $ | 80,682 | $ | 78,975 | |||||
|
|
|
|
|
|||||
4. Accounts Receivable and Net Revenue:
Accounts receivable, net consists of the following (in thousands):
| December 31, | ||||||||
| 2017 | 2016 | |||||||
| Gross accounts receivable |
$ | 1,790,034 | $ | 1,719,642 | ||||
| Allowance for contractual adjustments and uncollectibles |
(1,286,035 | ) | (1,224,366 | ) | ||||
|
|
|
|
|
|||||
| $ | 503,999 | $ | 495,276 | |||||
|
|
|
|
|
|||||
Net revenue consists of the following (in thousands):
| Years Ended December 31, | ||||||||||||
| 2017 | 2016 | 2015 | ||||||||||
| Gross revenue |
$ | 11,427,238 | $ | 10,374,813 | $ | 8,942,957 | ||||||
| Contractual adjustments and uncollectibles |
(8,285,317 | ) | (7,464,030 | ) | (6,389,195 | ) | ||||||
| Hospital contract administrative fees |
316,391 | 272,376 | 226,234 | |||||||||
|
|
|
|
|
|
|
|||||||
| $ | 3,458,312 | $ | 3,183,159 | $ | 2,779,996 | |||||||
|
|
|
|
|
|
|
|||||||
Accounts receivable of $504.0 million and $495.3 million at December 31, 2017 and 2016, respectively, consist primarily of amounts due from government-sponsored healthcare programs and third-party insurance payors for services provided by the Company’s affiliated physicians.
Net revenue of $3.5 billion, $3.2 billion and $2.8 billion for the years ended December 31, 2017, 2016 and 2015, respectively, consists primarily of gross billed charges for services provided by the Company’s affiliated physicians less an estimated allowance for contractual adjustments and uncollectibles to properly account for the anticipated differences between gross billed charge amounts and expected reimbursement amounts.
The Company’s contractual adjustments and uncollectibles as a percentage of gross patient service revenue vary slightly each year depending on several factors, including improved managed care contracting, changes in
78
Table of Contents
reimbursement from state Medicaid programs and other government-sponsored programs, shifts in the percentage of patient services being reimbursed under government-sponsored programs and annual price increases.
The Company’s annual price increases typically increase contractual adjustments as a percentage of gross patient service revenue. This increase is primarily due to Medicaid, Medicare and other government-sponsored healthcare programs that generally provide for reimbursements on a fee-schedule basis rather than on a gross charge basis. When the Company bills these programs, like other payors, on a gross-charge basis, it also increases its provision for contractual adjustments and uncollectibles by the amount of any price increase, resulting in a higher contractual adjustment percentage.
5. Property and Equipment:
Property and equipment consists of the following (in thousands):
| December 31, | ||||||||
| 2017 | 2016 | |||||||
| Building |
$ | 33,024 | $ | 26,572 | ||||
| Land |
6,683 | 6,683 | ||||||
| Equipment and other |
253,453 | 213,521 | ||||||
|
|
|
|
|
|||||
| 293,160 | 246,776 | |||||||
| Accumulated depreciation |
(169,624 | ) | (143,708 | ) | ||||
|
|
|
|
|
|||||
| $ | 123,536 | $ | 103,068 | |||||
|
|
|
|
|
|||||
At December 31, 2017 and 2016, property and equipment includes medical and other equipment held under capital leases of $6.1 million and $6.2 million, and related accumulated depreciation of $4.6 million and $4.0 million, respectively. The Company recorded depreciation expense of $33.9 million, $29.0 million and $22.2 million for the years ended December 31, 2017, 2016 and 2015, respectively.
6. Business Acquisitions:
During the year ended December 31, 2017, the Company completed 10 physician group practice acquisitions, including four radiology practices, two maternal-fetal medicine practices, one neonatology practice, one pediatric multi-specialty practice and two other pediatric subspecialty practices. The acquisition-date fair value of the total consideration for the 10 acquisitions was $554.0 million, net of cash acquired. Approximately $531.7 million was paid in cash, $2.7 million was paid by issuing 69,014 shares of the Company’s common stock, $18.6 million was recorded as a contingent consideration liability and $1.0 million was recorded as accrued purchase consideration within other current liabilities.
These acquisitions expanded the Company’s national network of physician practices. The Company expects to improve the results of physician practices through improved managed care contracting, improved collections and identification of growth initiatives, as well as operating and cost savings based on the significant infrastructure it has developed. With respect to the Company’s acquisition of radiology physician practices, the Company believes that it brings a unique value proposition to radiology physician groups, in that the Company can provide not only practice support, but also teleradiology capabilities that can enhance a physician group’s efficiency, provide subspecialty access and help them grow, remain competitive and meet the ever increasing demands of their hospital partners, payors and regulatory bodies. In addition, the Company believes that radiology physician group practice physicians can complement the staffing needs for its teleradiology services business during certain times, such as nights and weekends, when such physicians are not providing services at their practices.
79
Table of Contents
The 69,014 shares of the Company’s common stock issued as a component of the purchase consideration for acquisitions completed during the first quarter and fourth quarter of 2017 had an acquisition-date fair value of $2.7 million. The fair value of such shares was determined using the closing price on the New York Stock Exchange of the Company’s common stock less a discount for lack of marketability on the respective dates of acquisition, reflecting a three year contractual restriction on the disposition or assignment of such common stock.
The Company’s preliminary allocation of purchase price is as follows (in thousands):
| Current assets |
$ | 43,550 | ||
| Property and equipment |
5,281 | |||
| Other noncurrent assets |
52,611 | |||
| Goodwill |
439,822 | |||
| Other intangible assets |
39,414 | |||
| Current liabilities |
(5,674 | ) | ||
| Other long-term liabilities |
(21,086 | ) | ||
|
|
|
|||
| $ | 553,918 | |||
|
|
|
The Company has recorded provisional amounts for deferred income taxes related to certain acquisitions completed during the year ended December 31, 2017. Any adjustments will be recorded during the measurement period and are not expected to be material.
Current assets acquired and other noncurrent assets acquired include assets with a fair value of $23.5 million and $22.5 million, respectively, that are expected to be sold and contributed to a joint venture for an equity method investment in that joint venture, respectively, within the next twelve months. Accordingly, these assets are classified as held for sale.
The contingent consideration of $18.6 million recorded during the year ended December 31, 2017 is related to an agreement to pay an additional cash amount based on the achievement of certain performance measures for the period through June 1, 2019. The accrued contingent consideration was recorded as a liability at acquisition-date fair value using the income approach with assumed discount rates ranging from 4.0% to 4.75% over the applicable terms and an assumed payment probability assessment over the applicable years. The range of the undiscounted amount the Company could pay under the contingent consideration agreement is between $0 and $20.0 million. In connection with this contingent consideration arrangement, the Company has designated $20.0 million as restricted cash in its Consolidated Balance Sheet. In addition, during the year ended December 31, 2017, the Company paid $6.2 million for contingent consideration related to certain prior-period acquisitions, of which all but the accretion recorded during 2017 was accrued as of December 31, 2016.
In connection with certain prior period acquisitions, the Company recorded an increase in deferred tax liabilities of $0.5 million with a corresponding increase in goodwill of $0.5 million resulting from the finalization of income tax acquisition accounting.
During the year ended December 31, 2016, the Company completed 15 acquisitions, of which 13 were physician group practices including eight anesthesiology practices, two other pediatric subspecialty practices, one neonatology practice, one maternal-fetal medicine practice and one pediatric cardiology practice. In addition, the Company acquired a third-party receivables company and a patient engagement software company as additions to its existing management services organization. The total consideration for the 15 acquisitions was $759.6 million, net of $15.0 million cash acquired, of which $756.1 million was paid in cash and $3.5 million was recorded as a contingent consideration liability.
On March 31, 2017, the Company sold its 75% economic interest in a joint venture that was previously consolidated. The deconsolidation and removal of 100% of the carrying value of the joint venture’s net assets resulted in a gain on sale that was not material.
80
Table of Contents
7. Goodwill and Intangible Assets:
Goodwill was $4.3 billion and $3.8 billion at December 31, 2017 and 2016, respectively. The change in the carrying amount of goodwill of $438.8 million during the year ended December 31, 2017 is primarily related to the Company’s 2017 acquisitions. The Company expects that $159.5 million of the goodwill recorded during the year ended December 31, 2017 will be deductible for tax purposes.
Intangible assets, net, consist of the following (in thousands):
| December 31, 2017 | ||||||||||||
| Gross Carrying Value |
Accumulated Amortization |
Net Carrying Value |
||||||||||
| Physician and hospital agreements |
$ | 381,635 | $ | (203,915 | ) | $ | 177,720 | |||||
| Customer relationships |
443,300 | (48,837 | ) | 394,463 | ||||||||
| Trade names |
43,156 | (2,933 | ) | 40,223 | ||||||||
| Patented and other technology |
38,590 | (11,068 | ) | 27,522 | ||||||||
|
|
|
|
|
|
|
|||||||
| $ | 906,681 | $ | (266,753 | ) | $ | 639,928 | ||||||
|
|
|
|
|
|
|
|||||||
| December 31, 2016 | ||||||||||||
| Gross Carrying Value |
Accumulated Amortization |
Net Carrying Value |
||||||||||
| Physician and hospital agreements |
$ | 347,862 | $ | (168,488 | ) | $ | 179,374 | |||||
| Customer relationships |
443,300 | (27,368 | ) | 415,932 | ||||||||
| Trade names |
43,156 | (1,604 | ) | 41,552 | ||||||||
| Patented and other technology |
37,503 | (5,832 | ) | 31,671 | ||||||||
|
|
|
|
|
|
|
|||||||
| $ | 871,821 | $ | (203,292 | ) | $ | 668,529 | ||||||
|
|
|
|
|
|
|
|||||||
During the year ended December 31, 2017, the Company recorded intangible assets related to acquisitions totaling $39.4 million, consisting primarily of physician and hospital agreements. The weighted-average amortization period for these physician and hospital agreements is approximately 10 years.
Amortization expense for intangible assets was $68.9 million, $60.3 million and $42.0 million for the years ended December 31, 2017, 2016 and 2015, respectively.
Amortization expense for existing intangible assets for the next five years is expected to be as follows (in thousands):
| 2018 |
$ | 67,514 | ||
| 2019 |
62,669 | |||
| 2020 |
56,636 | |||
| 2021 |
51,069 | |||
| 2022 |
44,357 |
81
Table of Contents
8. Accounts Payable and Accrued Expenses:
Accounts payable and accrued expenses consist of the following (in thousands):
| December 31, | ||||||||
| 2017 | 2016 | |||||||
| Accounts payable |
$ | 34,632 | $ | 28,474 | ||||
| Accrued salaries and bonuses |
225,429 | 220,635 | ||||||
| Accrued payroll taxes and benefits |
75,672 | 67,830 | ||||||
| Accrued professional liabilities |
37,912 | 28,972 | ||||||
| Accrued contingent consideration |
6,259 | 6,566 | ||||||
| Accrued interest |
4,495 | 4,511 | ||||||
| Other accrued expenses |
53,618 | 50,950 | ||||||
|
|
|
|
|
|||||
| $ | 438,017 | $ | 407,938 | |||||
|
|
|
|
|
|||||
9. Accrued Professional Liabilities:
At December 31, 2017 and 2016, the Company’s total accrued professional liabilities of $250.2 million and $202.1 million, respectively, includes incurred but not reported loss reserves of $138.5 million and $128.1 million, respectively, and loss reserves for reported claims of $111.7 million and $74.0 million, respectively. Of the total liability, $37.9 million is classified as a current liability within accounts payable and accrued expenses in the Consolidated Balance Sheet. In addition, there is a corresponding insurance receivable of $18.9 million recorded as a component of other assets for certain professional liability claims that are covered by third-party insurance policies.
The activity related to the Company’s total accrued professional liability for the years ended December 31, 2017, 2016 and 2015 is as follows (in thousands):
| Years Ended December 31, | ||||||||||||
| 2017 | 2016 | 2015 | ||||||||||
| Balance at beginning of year |
$ | 202,052 | $ | 202,527 | $ | 168,369 | ||||||
| Assumed liabilities through acquisition |
20,716 | — | 35,968 | |||||||||
| Provision (adjustment) for losses related to: |
||||||||||||
| Current year |
41,291 | 38,129 | 39,204 | |||||||||
| Prior years |
9,983 | (25,428 | ) | (25,797 | ) | |||||||
|
|
|
|
|
|
|
|||||||
| Total provision for losses |
51,274 | 12,701 | 13,407 | |||||||||
| Claim payments related to: |
||||||||||||
| Current year |
(712 | ) | (766 | ) | (1,382 | ) | ||||||
| Prior years |
(23,143 | ) | (12,410 | ) | (13,835 | ) | ||||||
|
|
|
|
|
|
|
|||||||
| Total payments |
(23,855 | ) | (13,176 | ) | (15,217 | ) | ||||||
|
|
|
|
|
|
|
|||||||
| Balance at end of year |
$ | 250,187 | $ | 202,052 | $ | 202,527 | ||||||
|
|
|
|
|
|
|
|||||||
The net increase in the Company’s total accrued professional liability for the year ended December 31, 2017 is primarily related to growth in the program from acquisitions as well as overall unfavorable trends in the Company’s claims experience. The net decrease in 2016 was primarily attributable to the overall favorable trends in the Company’s claims experience.
10. Line of Credit, Long-Term Debt and Capital Lease Obligations:
On October 30, 2017, the Company entered into a new credit agreement (the “New Credit Agreement”), which replaces the Company’s prior credit agreement. The New Credit Agreement provides for a $2.0 billion
82
Table of Contents
unsecured revolving credit facility and includes a $37.5 million sub-facility for the issuance of letters of credit. The New Credit Agreement matures on October 31, 2022 and is guaranteed by substantially all of the Company’s subsidiaries and affiliated professional associations and corporations. At the Company’s option, borrowings under the New Credit Agreement will bear interest at (i) the alternate base rate (defined as the higher of (a) the prime rate, (b) the Federal Funds Rate plus 1/2 of 1.00% and (c) LIBOR for an interest period of one month plus 1.00%) plus an applicable margin rate ranging from 0.125% to 0.750% based on the Company’s consolidated leverage ratio or (ii) the LIBOR rate plus an applicable margin rate ranging from 1.125% to 1.750% based on the Company’s consolidated leverage ratio. The New Credit Agreement also calls for other customary fees and charges, including an unused commitment fee ranging from 0.150% to 0.300% of the unused lending commitments, based on the Company’s consolidated leverage ratio.
The New Credit Agreement contains customary covenants and restrictions, including covenants that require the Company to maintain a minimum interest charge ratio, not to exceed a specified consolidated leverage ratio and to comply with laws, and restrictions on the ability of the Company to pay dividends and make certain other distributions, as specified therein. Failure to comply with these covenants would constitute an event of default under the New Credit Agreement, notwithstanding the ability of the Company to meet its debt service obligations. The New Credit Agreement also includes various customary remedies for the lenders following an event of default, including the acceleration of repayment of outstanding amounts under the New Credit Agreement.
On December 8, 2015, the Company completed a private offering of $750.0 million aggregate principal amount of 2023 Senior Notes. The Company’s obligations under the 2023 Senior Notes are guaranteed on an unsecured senior basis by the same subsidiaries and affiliated professional contractors that guarantee the Credit Agreement. Interest on the 2023 Senior Notes accrues at the rate of 5.25% per annum and is payable semi-annually in arrears on June 1 and December 1.
At any time prior to December 1, 2018, the Company may redeem all or a portion of the 2023 Senior Notes at a redemption price equal to 100% of the principal amount of the notes being redeemed plus an applicable redemption premium and accrued and unpaid interest to the redemption date. In addition, at any time prior to December 1, 2018, the Company may redeem up to 35% of the aggregate principal amount of the 2023 Senior Notes at a redemption price of 105.250% of the principal amount thereof, plus accrued and unpaid interest, if any, to the redemption date, using proceeds from one or more equity offerings. On or after December 1, 2018, the Company may redeem all or a portion of the 2023 Senior Notes, at the redemption prices of 103.938% in 2018, 102.625% in 2019, 101.313% in 2020 and 100% in 2021 and thereafter, plus accrued and unpaid interest to the redemption date.
The indenture under which the 2023 Senior Notes are issued, among other things, limits our ability to (1) incur liens and (2) enter into sale and lease-back transactions, and also limits our ability to merge or dispose of all or substantially all of our assets, in all cases, subject to a number of customary exceptions. Although we are not required to make mandatory redemption or sinking fund payments with respect to the 2023 Senior Notes, upon the occurrence of a change in control of MEDNAX, we may be required to repurchase the 2023 Senior Notes at a purchase price equal to 101% of the aggregate principal amount of the 2023 Senior Notes repurchased plus accrued and unpaid interest.
The Company presents issuance costs related to long-term debt liabilities, other than revolving credit arrangements, as a direct deduction from the carrying value of that long-term debt.
83
Table of Contents
The carrying value of the Company’s long-term debt was $1.8 billion and $1.7 billion at December 31, 2017 and 2016, respectively, and consisted of the following (in thousands):
| December 31, 2017 | ||||||||||||
| Principal | Unamortized Debt Issuance Costs |
Total | ||||||||||
| 2023 Senior Notes |
$ | 750,000 | $ | (9,503 | ) | $ | 740,497 | |||||
| Revolving line of credit |
1,110,500 | (4,864 | ) | 1,105,636 | ||||||||
|
|
|
|
|
|
|
|||||||
| Total |
$ | 1,860,500 | $ | (14,367 | ) | $ | 1,846,133 | |||||
|
|
|
|
|
|
|
|||||||
| December 31, 2016 | ||||||||||||
| Principal | Unamortized Debt Issuance Costs |
Total | ||||||||||
| 2023 Senior Notes |
$ | 750,000 | $ | (11,109 | ) | $ | 738,891 | |||||
| Revolving line of credit |
783,500 | (3,388 | ) | 780,112 | ||||||||
| Term loan |
180,000 | (259 | ) | 179,741 | ||||||||
|
|
|
|
|
|
|
|||||||
| 1,713,500 | (14,756 | ) | 1,698,744 | |||||||||
| Less: Current portion |
(20,000 | ) | — | (20,000 | ) | |||||||
|
|
|
|
|
|
|
|||||||
| Long-term portion |
$ | 1,693,500 | $ | (14,756 | ) | $ | 1,678,744 | |||||
|
|
|
|
|
|
|
|||||||
The Company has outstanding letters of credit which reduced the amount available under the New Credit Agreement by $0.2 million at December 31, 2017. At December 31, 2017, the Company had an available balance on its New Credit Agreement of $889.3 million.
The carrying values of the Company’s variable rate revolving line of credit approximates fair value due to the short-term nature of the interest rates. The estimated fair value of the Company’s 2023 Notes was $763.1 million and $773.4 million, at December 31, 2017 and 2016, respectively, and was estimated using trading prices as of December 31, 2017 and December 31, 2016 as Level 2 inputs to estimate fair value.
The Company’s capital lease obligations consist of the following (in thousands):
| December 31, | ||||||||
| 2017 | 2016 | |||||||
| Capital lease obligations |
$ | 1,826 | $ | 3,550 | ||||
| Less: Current portion |
(1,401 | ) | (2,054 | ) | ||||
|
|
|
|
|
|||||
| Long-term portion |
$ | 425 | $ | 1,496 | ||||
|
|
|
|
|
|||||
The amounts due under the terms of the Company’s capital lease obligations at December 31, 2017 are as follows:
| 2018 |
$ | 1,401 | ||
| 2019 |
238 | |||
| 2020 |
113 | |||
| 2021 |
74 |
84
Table of Contents
11. Income Taxes:
The components of the income tax provision (benefit) are as follows (in thousands):
| December 31, | ||||||||||||
| 2017 | 2016 | 2015 | ||||||||||
| Federal: |
||||||||||||
| Current |
$ | 130,053 | $ | 166,758 | $ | 168,596 | ||||||
| Deferred |
(63,038 | ) | 15,596 | 12,866 | ||||||||
|
|
|
|
|
|
|
|||||||
| 67,015 | 182,354 | 181,462 | ||||||||||
|
|
|
|
|
|
|
|||||||
| State: |
||||||||||||
| Current |
20,070 | 4,296 | 20,948 | |||||||||
| Deferred |
2,965 | 2,553 | 1,628 | |||||||||
|
|
|
|
|
|
|
|||||||
| 23,035 | 6,849 | 22,576 | ||||||||||
|
|
|
|
|
|
|
|||||||
| Total |
$ | 90,050 | $ | 189,203 | $ | 204,038 | ||||||
|
|
|
|
|
|
|
|||||||
The Company files its tax return on a consolidated basis with its subsidiaries. The remaining affiliated professional contractors file tax returns on an individual basis.
The effective tax rate was 21.94%, 36.80% and 37.76% for the years ended December 31, 2017, 2016 and 2015, respectively. During the three months ended December 31, 2017, the Company recorded a $70.0 million income tax benefit related to the reduction of its net deferred tax liability resulting from the reduction in the corporate tax rate enacted in December 2017 under the Tax Cuts and Jobs Act of 2017. Excluding this favorable impact, our effective income tax rate for the year ended December 31, 2017 was 39.00%. During the three months ended September 30, 2016, the Company settled a certain tax matter with a taxing authority. In connection with this settlement, the Company’s effective income tax rate was favorably impacted by $10.6 million. Excluding this favorable impact, the effective tax rate for December 31, 2016 was 38.87%, as compared to 37.76% for 2015.
The differences between the effective rate and the United States federal income tax statutory rate are as follows:
| December 31, | ||||||||||||
| 2017 | 2016 | 2015 | ||||||||||
| Tax at statutory rate |
35.00 | % | 35.00 | % | 35.00 | % | ||||||
| State income tax, net of federal benefit |
3.33 | 2.94 | 2.97 | |||||||||
| Non-deductible expenses |
0.49 | 0.43 | 0.34 | |||||||||
| Change in accrual estimates relating to uncertain tax positions |
0.02 | (2.11 | ) | (0.43 | ) | |||||||
| Change in valuation allowance |
— | 0.48 | 0.29 | |||||||||
| Other, net |
0.16 | 0.06 | (0.41 | ) | ||||||||
| Change in tax law |
(17.06 | ) | — | — | ||||||||
|
|
|
|
|
|
|
|||||||
| Income tax provision |
21.94 | % | 36.80 | % | 37.76 | % | ||||||
|
|
|
|
|
|
|
|||||||
85
Table of Contents
All of the Company’s deferred tax assets and liabilities are classified as long-term. The significant components of deferred income tax assets and liabilities are as follows (in thousands):
| December 31, | ||||||||
| 2017 | 2016 | |||||||
| Allowance for uncollectible accounts |
$ | 80,056 | $ | 103,525 | ||||
| Reserves and accruals |
45,454 | 62,212 | ||||||
| Stock-based compensation |
7,975 | 13,726 | ||||||
| Net operating loss carryforward |
28,569 | 49,156 | ||||||
| Property and equipment |
685 | 1,621 | ||||||
| Other |
970 | 1,610 | ||||||
|
|
|
|
|
|||||
| Deferred tax assets before valuation allowance |
163,709 | 231,850 | ||||||
| Less: Valuation allowance |
(2,615 | ) | (4,014 | ) | ||||
|
|
|
|
|
|||||
| Deferred tax assets, net of valuation allowance |
161,094 | 227,836 | ||||||
|
|
|
|
|
|||||
| Gross deferred tax liabilities: |
||||||||
| Amortization |
(258,618 | ) | (380,594 | ) | ||||
| Accrual to cash adjustment |
(31,290 | ) | (53,771 | ) | ||||
| Other |
(4,150 | ) | (1,023 | ) | ||||
|
|
|
|
|
|||||
| Total deferred tax liabilities |
(294,058 | ) | (435,388 | ) | ||||
|
|
|
|
|
|||||
| Net deferred tax liability |
$ | (132,964 | ) | $ | (207,552 | ) | ||
|
|
|
|
|
|||||
The Company’s net deferred tax liability decreased by $74.6 million during 2017 of which $70.0 million is related to a reduction in the corporate tax rate enacted under the Tax Cuts and Jobs Act of 2017.
Beginning January 1, 2017, excess tax benefits or deficiencies associated with the exercise of stock options, the vesting of restricted and deferred stock and the purchase of shares under the Company’s non-qualified employee stock purchase plan are recognized as income tax benefits or expenses in the income statement in the reporting period in which they occur instead of an increase or decrease to additional paid-in-capital. For the year ended December 31, 2017, income tax expense of $0.2 million was recognized for excess tax deficiencies. For the years ended December 31, 2016 and 2015, respectively, additional paid-in-capital was increased by $4.2 million and $11.6 million for excess tax benefits.
The Company has net operating loss carryforwards for federal and state tax purposes totaling $116.0 million, $130.0 million, and $136.6 million at December 31, 2017, 2016 and 2015, respectively, expiring at various times in 2019 through 2037.
As of December 31, 2017, 2016 and 2015, the Company’s liability for uncertain tax positions, excluding accrued interest and penalties, was $11.0 million, $9.5 million and $18.4 million, respectively. As of December 31, 2017, the Company had $10.7 million of uncertain tax positions that, if recognized, would favorably impact its effective tax rate.
86
Table of Contents
The following table summarizes the activity related to the Company’s liability for uncertain tax positions for the years ended December 31, 2017, 2016 and 2015 (in thousands):
| Years Ended December 31, | ||||||||||||
| 2017 | 2016 | 2015 | ||||||||||
| Balance at beginning of year |
$ | 9,469 | $ | 18,447 | $ | 17,165 | ||||||
| Increases related to prior year tax positions |
2,284 | 301 | 467 | |||||||||
| Decreases related to prior year tax positions |
(143 | ) | (3,927 | ) | (1,168 | ) | ||||||
| Increases related to current year tax positions |
1,430 | 2,258 | 3,675 | |||||||||
| Settlements |
— | (5,644 | ) | — | ||||||||
| Decreases related to lapse of statutes of limitation |
(2,068 | ) | (1,966 | ) | (1,692 | ) | ||||||
|
|
|
|
|
|
|
|||||||
| Balance at end of year |
$ | 10,972 | $ | 9,469 | $ | 18,447 | ||||||
|
|
|
|
|
|
|
|||||||
During the year ended December 31, 2017, the Company increased its liability for uncertain tax positions by a total of $1.5 million, primarily related to additional taxes on current and prior year positions, partially offset by the expiration of statutes of limitation. During the year ended December 31, 2016, the Company decreased its liability for uncertain tax positions by a total of $9.0 million, primarily related to the settlement of a certain tax matter with a taxing authority and the expiration of statutes of limitation, partially offset by additional taxes on current year positions.
In addition, the Company anticipates that its liability for uncertain tax positions will be decreased by $1.1 million related to the expiration of certain statutes of limitation over the next 12 months.
The Company includes interest and penalties related to income tax liabilities in income tax expense. The Company recognized an income tax benefit of $0.2 million and $7.9 million and income tax expense of $0.6 million related to interest and penalties during the years ended December 31, 2017, 2016 and 2015, respectively. At December 31, 2017 and 2016, the Company’s accrued liability for interest and penalties related to income tax liabilities totaled $1.2 million and $1.4 million, respectively.
The Company is currently subject to U.S. Federal and various state income tax examinations for the tax years 2013 through 2016.
12. Common and Common Equivalent Shares:
The calculation of shares used in the basic and diluted net income per share calculation for the years ended December 31, 2017, 2016 and 2015 is as follows (in thousands):
| Years Ended December 31, | ||||||||||||
| 2017 | 2016 | 2015 | ||||||||||
| Weighted average number of common shares outstanding |
92,431 | 92,422 | 93,077 | |||||||||
| Weighted average number of dilutive common share equivalents |
527 | 687 | 883 | |||||||||
|
|
|
|
|
|
|
|||||||
| Weighted average number of common and common equivalent shares outstanding |
92,958 | 93,109 | 93,960 | |||||||||
|
|
|
|
|
|
|
|||||||
| Antidilutive securities not included in the diluted net income per common share calculation |
107 | 2 | — | |||||||||
|
|
|
|
|
|
|
|||||||
13. Stock Incentive Plans and Stock Purchase Plans:
The Company’s Amended and Restated 2008 Incentive Compensation Plan, as amended (the “Amended and Restated 2008 Incentive Plan”) provides for grants of stock options, stock appreciation rights, restricted stock, deferred stock, and other stock-related awards and performance awards that may be settled in cash, stock or other property.
87
Table of Contents
Under the Amended and Restated 2008 Incentive Plan, options to purchase shares of common stock may be granted at a price not less than the fair market value of the shares on the date of grant. The options must be exercised within 10 years from the date of grant and generally become exercisable on a pro rata basis over a three-year period from the date of grant. The Company issues new shares of its common stock upon exercise of its stock options. Restricted stock awards generally vest over periods of three years upon the fulfillment of specified service-based conditions and in certain instances performance-based conditions. Deferred stock awards generally vest upon the satisfaction of specified performance-based conditions or service-based conditions. The Company recognizes compensation expense related to its restricted stock and deferred stock awards ratably over the corresponding vesting periods. At December 31, 2017, the Company had 3.4 million shares available for future grants and awards under its Amended and Restated 2008 Incentive Plan.
Under the Company’s 1996 Non-Qualified Employee Stock Purchase Plan, as amended (the “ESPP”), employees are permitted to purchase the Company’s common stock at 85% of market value on January 1st, April 1st, July 1st and October 1st of each year. Under the Company’s 2015 Non-Qualified Stock Purchase Plan (the “SPP”), certain eligible non-employee service providers are permitted to purchase the Company’s common stock at 90% of market value on January 1st, April 1st, July 1st and October 1st of each year upon the SPP’s effective date of January 1, 2016.
Each of the ESPP and the SPP provide for the issuance of an of aggregate 2.6 million shares of the Company’s common stock less the number of shares of common stock purchased under the other plan. The Company recognizes stock-based compensation expense for the discount received by participating employees and non-employee service providers. During the year ended December 31, 2017, 0.4 million shares were issued under the ESPP and SPP. At December 31, 2017, the Company had 1.9 million shares in aggregate reserved for issuance under the ESPP and SPP.
The Company recognized $29.6 million, $34.0 million and $32.1 million of stock-based compensation expense related to its stock incentive plans, the ESPP and the SPP during the years ended December 31, 2017, 2016 and 2015, respectively.
The activity related to the Company’s restricted stock and deferred stock awards and the corresponding weighted average grant-date fair values for the year ended December 31, 2017 are as follows:
| Number of Shares |
Weighted Average Fair Value |
|||||||
| Non-vested shares at January 1, 2017 |
946,329 | $ | 66.98 | |||||
| Awarded |
637,529 | $ | 54.22 | |||||
| Forfeited |
(91,730 | ) | $ | 64.82 | ||||
| Vested |
(451,094 | ) | $ | 65.00 | ||||
|
|
|
|||||||
| Non-vested shares at December 31, 2017 |
1,041,034 | $ | 60.21 | |||||
|
|
|
|||||||
The aggregate fair value of the restricted and deferred stock that vested during the years ended December 31, 2017, 2016 and 2015 was $29.3 million, $29.8 million and $31.6 million, respectively.
The weighted average grant-date fair value of restricted and deferred stock awards that were granted during the years ended December 31, 2017, 2016 and 2015 was $54.22, $67.90 and $70.44, respectively.
At December 31, 2017, the total stock-based compensation cost related to non-vested restricted and deferred stock remaining to be recognized as compensation expense over a weighted-average period of 1.6 years was $30.9 million.
88
Table of Contents
The Company did not grant any stock options in 2017, 2016 or 2015, and all stock-based compensation cost related to stock options has been recognized. The activity and certain other information related to the Company’s outstanding stock option awards for the year ended December 31, 2017 are as follows:
| Number of Stock Options |
Weighted Average Exercise Price |
Weighted Average Remaining Contractual Term (in years) |
Aggregate Intrinsic Value (in millions) |
|||||||||||||
| Outstanding at January 1, 2017 |
410,286 | $ | 28.33 | |||||||||||||
| Exercised |
(163,944 | ) | $ | 29.57 | $ | 5.5 | ||||||||||
|
|
|
|
|
|||||||||||||
| Outstanding and exercisable at December 31, 2017 |
246,342 | $ | 27.51 | 1.5 | $ | 6.4 | ||||||||||
|
|
|
|
|
|
|
|||||||||||
The aggregate intrinsic value of stock options exercised during the years ended December 31, 2017, 2016 and 2015 was $5.5 million, $6.8 million and $11.3 million, respectively.
There were no excess tax benefits recognized in additional paid-in capital due to the adoption of new accounting guidance on January 1, 2017 that requires excess tax benefits to be recognized in the income statement. The net excess tax benefit recognized in additional paid-in capital related primarily to stock options, restricted stock and deferred stock for the years ended December 31, 2016 and 2015 was $4.1 million and $11.6 million, respectively. The cash proceeds received from the exercise of stock options for the years ended December 31, 2017, 2016 and 2015 were $4.8 million, $4.7 million and $6.1 million, respectively.
14. Common Stock Repurchase Programs:
In July 2013, the Company’s Board of Directors authorized the repurchase of shares of the Company’s common stock up to an amount sufficient to offset the dilutive impact from the issuance of shares under the Company’s equity compensation programs. The share repurchase program allows the Company to make open market purchases from time-to-time based on general economic and market conditions and trading restrictions. The repurchase program also allows for the repurchase of shares of the Company’s common stock to offset the dilutive impact from the issuance of shares, if any, related to the Company’s acquisition program.
During the year ended December 31, 2017, the Company repurchased 1.0 million shares of its common stock for $70.2 million, inclusive of 38,257 shares withheld to satisfy minimum statutory withholding obligations of $2.1 million in connection with the vesting of restricted stock.
In October 2014, the Company’s Board of Directors authorized the repurchase of up to $600.0 million of shares of the Company’s common stock in addition to its existing share repurchase program.
In December 2014, the Company entered into an uncollared accelerated share repurchase (“ASR”) agreement with an investment bank. Under the ASR agreement, the Company agreed to purchase $200.0 million of its common stock in total. On December 17, 2014, the Company paid a total of $200.0 million to an investment bank, which in turn delivered to the Company 2.5 million shares of the Company’s common stock in total based on the market price of a share of Company common stock on December 12, 2014. The payment was recorded as a reduction to the respective components of shareholders’ equity. The final number of shares of common stock that the Company may receive, or may be required to remit, upon settlement under the ASR agreement was to be based upon the average daily volume weighted-average price of the Company’s common stock during the term of the ASR agreement, less a negotiated discount. The ASR agreement was funded by borrowings under the Company’s Credit Agreement discussed in Note 10. Final settlement of the ASR occurred in July 2015 with the delivery to the Company of 0.3 million additional shares of common stock. The final number of shares of common stock that the Company received was based upon the average daily volume
89
Table of Contents
weighted-average price of the Company’s common stock during the term of the ASR agreement, less a negotiated discount.
In March 2015, the Company entered into a second uncollared ASR agreement with an investment bank. Under the ASR agreement, the Company agreed to purchase $200.0 million of its common stock in total. On March 16, 2015, the Company paid a total of $200.0 million to an investment bank, which in turn delivered to the Company 2.2 million shares of the Company’s common stock in total based on the market price of a share of Company common stock on March 12, 2015. The ASR agreement was funded by borrowings under the Company’s Credit Agreement, and the payment was recorded as a reduction to the respective components of shareholders’ equity. Final settlement of the ASR occurred in October 2015 with the delivery to the Company of 0.3 million additional shares of common stock. The final number of shares of common stock that the Company received was based upon the average daily volume weighted-average price of the Company’s common stock during the term of the ASR agreement, less a negotiated discount.
During the year ended December 31, 2016, the Company repurchased 0.9 million shares of its common stock for $61.8 million, inclusive of 46,490 shares withheld to satisfy minimum stock withholding obligations of $3.2 million in connection with the vesting of restricted stock.
The Company intends to utilize various methods to effect any future share repurchases, including, among others, open market purchases and accelerated share repurchase programs. The amount and timing of repurchases will depend upon several factors, including general economic and market conditions and trading restrictions.
15. Retirement Plans:
The Company maintains six qualified contributory savings plans as allowed under Section 401(k) of the Internal Revenue Code and Section 1165(e) of the Puerto Rico Income Tax Act of 1954 (the “401(k) Plans”). The 401(k) Plans permit participant contributions and allow elective and, in certain situations, non-elective Company contributions based on each participant’s contribution or a specified percentage of eligible wages. Participants may defer a percentage of their annual compensation subject to the limits defined in the 401(k) Plans. The Company recorded expense of $50.7 million, $45.2 million and $39.7 million for the years ended December 31, 2017, 2016 and 2015, respectively, primarily related to the 401(k) Plans.
16. Commitments and Contingencies:
The Company expects that audits, inquiries and investigations from government authorities and agencies will occur in the ordinary course of business. Such audits, inquiries and investigations and their ultimate resolutions, individually or in the aggregate, could have a material adverse effect on the Company’s business, financial condition, results of operations, cash flows and the trading price of its common stock. The Company has not included an accrual for these matters as of December 31, 2017 in its Consolidated Financial Statements, as the variables affecting any potential eventual liability depend on the currently unknown facts and circumstances that arise out of, and are specific to, any particular future audit, inquiry and investigation and cannot be reasonably estimated at this time.
In the ordinary course of business, the Company becomes involved in pending and threatened legal actions and proceedings, most of which involve claims of medical malpractice related to medical services provided by the Company’s affiliated physicians. The Company’s contracts with hospitals generally require the Company to indemnify them and their affiliates for losses resulting from the negligence of the Company’s affiliated physicians. The Company may also become subject to other lawsuits which could involve large claims and significant costs. The Company believes, based upon a review of pending actions and proceedings, that the outcome of such legal actions and proceedings will not have a material adverse effect on its business, financial condition, results of operations, cash flows and the trading price of its securities. The outcome of such actions and proceedings, however, cannot be predicted with certainty and an unfavorable resolution of one or more of
90
Table of Contents
them could have a material adverse effect on the Company’s business, financial condition, results of operations, cash flows and the trading price of its securities.
Although the Company currently maintains liability insurance coverage intended to cover professional liability and certain other claims, the Company cannot assure that its insurance coverage will be adequate to cover liabilities arising out of claims asserted against it in the future where the outcomes of such claims are unfavorable. With respect to professional liability risk, the Company generally self-insures a portion of this risk through its wholly owned captive insurance subsidiary. Liabilities in excess of the Company’s insurance coverage, including coverage for professional liability and certain other claims, could have a material adverse effect on the Company’s business, financial condition, results of operations, cash flows and the trading price of its securities.
The Company leases space for its regional, medical and business offices, storage space and temporary housing of medical staff. The Company also leases an aircraft. Rent expense for the years ended December 31, 2017, 2016 and 2015 was $42.6 million, $38.0 million and $31.6 million, respectively.
Future minimum lease payments under non-cancelable operating leases as of December 31, 2017 are as follows (in thousands):
| 2018 |
$ | 34,337 | ||
| 2019 |
24,178 | |||
| 2020 |
16,633 | |||
| 2021 |
12,065 | |||
| 2022 |
8,125 | |||
| Thereafter |
9,934 | |||
|
|
|
|||
| $ | 105,272 | |||
|
|
|
91
Table of Contents
17. Selected Quarterly Financial Information (Unaudited):
The following tables set forth a summary of the Company’s selected quarterly financial information for each of the four quarters ended December 31, 2017 and 2016 (in thousands, except for per share data):
| 2017 Quarters | ||||||||||||||||
| First | Second | Third | Fourth | |||||||||||||
| Net revenue |
$ | 835,597 | $ | 842,944 | $ | 868,951 | $ | 910,820 | ||||||||
|
|
|
|
|
|
|
|
|
|||||||||
| Operating expenses: |
||||||||||||||||
| Practice salaries and benefits |
572,385 | 561,418 | 586,476 | 617,455 | ||||||||||||
| Practice supplies and other operating expenses |
27,796 | 30,872 | 29,497 | 32,353 | ||||||||||||
| General and administrative expenses |
103,765 | 103,015 | 101,430 | 108,895 | ||||||||||||
| Depreciation and amortization |
25,614 | 25,735 | 25,116 | 26,414 | ||||||||||||
|
|
|
|
|
|
|
|
|
|||||||||
| Total operating expenses |
729,560 | 721,040 | 742,519 | 785,117 | ||||||||||||
|
|
|
|
|
|
|
|
|
|||||||||
| Income from operations |
106,037 | 121,904 | 126,432 | 125,703 | ||||||||||||
| Investment and other income |
576 | 365 | 235 | 2,777 | ||||||||||||
| Interest expense |
(17,752 | ) | (18,535 | ) | (18,428 | ) | (19,844 | ) | ||||||||
| Equity (losses) in earnings of unconsolidated affiliate |
797 | 689 | (240 | ) | (294 | ) | ||||||||||
|
|
|
|
|
|
|
|
|
|||||||||
| Total non-operating expenses |
(16,379 | ) | (17,481 | ) | (18,433 | ) | (17,361 | ) | ||||||||
| Income before income taxes |
89,658 | 104,423 | 107,999 | 108,342 | ||||||||||||
| Income tax (provision) benefit |
(34,967 | ) | (40,725 | ) | (42,119 | ) | 27,761 | |||||||||
|
|
|
|
|
|
|
|
|
|||||||||
| Net income attributable to MEDNAX, Inc. |
$ | 54,691 | $ | 63,698 | $ | 65,880 | $ | 136,103 | ||||||||
|
|
|
|
|
|
|
|
|
|||||||||
| Per common and common equivalent share data (1): |
||||||||||||||||
| Net income attributable to MEDNAX, Inc.: |
||||||||||||||||
| Basic |
$ | 0.59 | $ | 0.69 | $ | 0.71 | $ | 1.47 | ||||||||
|
|
|
|
|
|
|
|
|
|||||||||
| Diluted |
$ | 0.59 | $ | 0.69 | $ | 0.71 | $ | 1.46 | ||||||||
|
|
|
|
|
|
|
|
|
|||||||||
| Weighted average common shares: |
||||||||||||||||
| Basic |
92,360 | 92,181 | 92,589 | 92,756 | ||||||||||||
|
|
|
|
|
|
|
|
|
|||||||||
| Diluted |
93,143 | 92,812 | 92,881 | 93,159 | ||||||||||||
|
|
|
|
|
|
|
|
|
|||||||||
| (1) | Basic and diluted per share amounts are computed for each of the periods presented. Accordingly, the sum of the quarterly per share amounts may not agree with the full year amount. |
92
Table of Contents
| 2016 Quarters | ||||||||||||||||
| First | Second | Third | Fourth | |||||||||||||
| Net revenue |
$ | 752,624 | $ | 771,759 | $ | 828,006 | $ | 830,770 | ||||||||
|
|
|
|
|
|
|
|
|
|||||||||
| Operating expenses: |
||||||||||||||||
| Practice salaries and benefits |
491,811 | 484,625 | 521,832 | 532,952 | ||||||||||||
| Practice supplies and other operating expenses |
27,046 | 26,992 | 31,641 | 32,737 | ||||||||||||
| General and administrative expenses |
89,950 | 92,116 | 93,457 | 97,049 | ||||||||||||
| Depreciation and amortization |
19,584 | 20,241 | 24,185 | 25,254 | ||||||||||||
|
|
|
|
|
|
|
|
|
|||||||||
| Total operating expenses |
628,391 | 623,974 | 671,115 | 687,992 | ||||||||||||
|
|
|
|
|
|
|
|
|
|||||||||
| Income from operations |
124,233 | 147,785 | 156,891 | 142,778 | ||||||||||||
| Investment and other income |
618 | 410 | 221 | 770 | ||||||||||||
| Interest expense |
(14,463 | ) | (15,058 | ) | (17,215 | ) | (16,356 | ) | ||||||||
| Equity in earnings of unconsolidated affiliate |
794 | 789 | 796 | 806 | ||||||||||||
|
|
|
|
|
|
|
|
|
|||||||||
| Total non-operating expenses |
(13,051 | ) | (13,859 | ) | (16,198 | ) | (14,780 | ) | ||||||||
| Income before income taxes |
111,182 | 133,926 | 140,693 | 127,998 | ||||||||||||
| Income tax provision |
(43,411 | ) | (51,601 | ) | (44,272 | ) | (49,919 | ) | ||||||||
|
|
|
|
|
|
|
|
|
|||||||||
| Net income |
67,771 | 82,325 | 96,421 | 78,079 | ||||||||||||
| Net loss attributable to noncontrolling interests |
128 | 102 | 88 | — | ||||||||||||
|
|
|
|
|
|
|
|
|
|||||||||
| Net income attributable to MEDNAX, Inc. |
$ | 67,899 | $ | 82,427 | $ | 96,509 | $ | 78,079 | ||||||||
|
|
|
|
|
|
|
|
|
|||||||||
| Per common and common equivalent share data (2): |
||||||||||||||||
| Net income attributable to MEDNAX, Inc.: |
||||||||||||||||
| Basic |
$ | 0.74 | $ | 0.89 | $ | 1.04 | $ | 0.84 | ||||||||
|
|
|
|
|
|
|
|
|
|||||||||
| Diluted |
$ | 0.73 | $ | 0.89 | $ | 1.04 | $ | 0.84 | ||||||||
|
|
|
|
|
|
|
|
|
|||||||||
| Weighted average common shares: |
||||||||||||||||
| Basic |
92,269 | 92,182 | 92,604 | 92,728 | ||||||||||||
|
|
|
|
|
|
|
|
|
|||||||||
| Diluted |
93,091 | 92,945 | 93,146 | 93,347 | ||||||||||||
|
|
|
|
|
|
|
|
|
|||||||||
| (2) | Basic and diluted per share amounts are computed for each of the periods presented. Accordingly, the sum of the quarterly per share amounts may not agree with the full year amount. |
93
Table of Contents
| ITEM 9. | CHANGES IN AND DISAGREEMENTS WITH ACCOUNTANTS ON ACCOUNTING AND FINANCIAL DISCLOSURE |
None.
| ITEM 9A. | CONTROLS AND PROCEDURES |
Evaluation of Disclosure Controls and Procedures
We carried out an evaluation, under the supervision and with the participation of our management, including our Chief Executive Officer and Chief Financial Officer, of the effectiveness of our disclosure controls and procedures (as defined in Rules 13a-15(e) and 15d-15(e) under the Securities Exchange Act of 1934, as amended). Based upon that evaluation, the Chief Executive Officer and Chief Financial Officer have concluded that our disclosure controls and procedures were effective as of the end of the period covered by this report.
Management’s Annual Report on Internal Control Over Financial Reporting
Management of the Company is responsible for establishing and maintaining adequate internal control over financial reporting as defined in Rule 13a-15(f) or 15d-15(f) promulgated under the Securities Exchange Act of 1934, as amended. The Company’s internal control over financial reporting includes those policies and procedures that (i) pertain to the maintenance of records that, in reasonable detail, accurately and fairly reflect the transactions and dispositions of the assets of the Company; (ii) provide reasonable assurance that transactions are recorded as necessary to permit preparation of financial statements in accordance with generally accepted accounting principles, and that receipts and expenditures of the Company are being made only in accordance with authorizations of management and directors of the Company; and (iii) provide reasonable assurance regarding the prevention or timely detection of unauthorized acquisition, use, or disposition of the Company’s assets that could have a material effect on the Company’s financial statements.
Internal control over financial reporting is designed to provide reasonable assurance regarding the reliability of financial reporting and the preparation of financial statements prepared for external purposes in accordance with generally accepted accounting principles. Because of its inherent limitations, internal control over financial reporting may not prevent or detect misstatements. Also, projections of any evaluation of effectiveness to future periods are subject to the risk that controls may become inadequate because of changes in conditions, or that the degree of compliance with the policies or procedures may deteriorate.
Management assessed the effectiveness of the Company’s internal control over financial reporting as of the end of the period covered by this report. In making this assessment, management used the criteria set forth by the Committee of Sponsoring Organizations of the Treadway Commission (“COSO”) in “Internal Control—Integrated Framework (2013).” Based on our assessment we concluded that, as of the end of the period covered by this report, the Company’s internal control over financial reporting was effective based on those criteria.
Management has excluded four radiology physician practices from its assessment of internal control over financial reporting as of December 31, 2017 because they were acquired by the Company in purchase business combinations during 2017. The aggregate total assets and aggregate net revenue excluded from the Company’s assessment of internal control over financial reporting represent approximately 2% and 3%, respectively, of the related consolidated financial statement amounts as of and for the year ended December 31, 2017.
The Company’s independent registered certified public accounting firm, PricewaterhouseCoopers LLP, has audited our internal control over financial reporting as of December 31, 2017 as stated in their report which appears in this Annual Report on Form 10-K.
Changes in Internal Control Over Financial Reporting
No change in our internal control over financial reporting occurred during our last fiscal quarter that has materially affected, or is reasonably likely to materially affect, our internal control over financial reporting.
94
Table of Contents
| Item 9B. | OTHER INFORMATION. |
On February 12, 2018, the Company, through a wholly-owned subsidiary, entered into an Employment Agreement with Vivian Lopez-Blanco, the Chief Financial Officer and Treasurer of the Company (the “Employment Agreement”). The Employment Agreement replaces Ms. Lopez-Blanco’s current employment agreement with a wholly-owned subsidiary of the Company, which employment agreement will expire by its terms on May 26, 2018 and will not be renewed.
Pursuant to the Employment Agreement, Ms. Lopez-Blanco will receive an annual base salary as determined by the Compensation Committee of the Company’s Board of Directors (the “Compensation Committee”) and will be eligible to receive an annual performance bonus in accordance with Compensation Committee-approved incentive programs, with a target bonus payment of at least 100% of her base salary. The Employment Agreement also provides for participation in customary benefit plans and the Company’s incentive compensation plans, as determined by the Compensation Committee.
Upon the termination of Ms. Lopez-Blanco’s employment for certain specified reasons, the Employment Agreement provides for severance payments of up to 18 months of Ms. Lopez-Blanco’s base salary plus, in certain cases, the payment of an amount equal to the greater of (x) the Average Annual Performance Bonus (as defined in the Employment Agreement) and (y) Ms. Lopez-Blanco’s bonus for the year immediately preceding her termination, and the continuation of certain fringe benefits for specified periods. In addition, depending on the basis for Ms. Lopez-Blanco’s termination, all equity awards granted to her by the Company prior to such termination will continue to vest until fully vested and, in certain termination events following a change in control of the Company, will be accelerated to become fully vested and payable.
The Employment Agreement provides for customary protections of the Company’s confidential information and intellectual property and that Ms. Lopez-Blanco will not, during the term of her employment and for a period of 18 to 24 months thereafter, depending on the basis for termination, compete with the Company, hire away from or solicit to leave the Company its employees and independent contractors, or interfere in the Company’s relationships with its hospitals, other healthcare facilities, vendors, clients and other third parties.
The Employment Agreement has a three year term and is subject to automatic renewals for successive one year terms.
The foregoing description of the Employment Agreement is qualified in its entirety by reference to the terms of the Employment Agreement, a copy of which is attached to this Form 10-K as Exhibit 10.28 and is incorporated herein by reference.
95
Table of Contents
| ITEM 10. | DIRECTORS, EXECUTIVE OFFICERS AND CORPORATE GOVERNANCE |
The information required by this Item is incorporated by reference to the applicable information in the definitive proxy statement for our 2018 Annual Meeting of Shareholders, which is to be filed with the SEC within 120 days after our fiscal year end.
| ITEM 11. | EXECUTIVE COMPENSATION |
The information required by this Item is incorporated by reference to the applicable information in the definitive proxy statement for our 2018 Annual Meeting of Shareholders, which is to be filed with the SEC within 120 days after our fiscal year end.
| ITEM 12. | SECURITY OWNERSHIP OF CERTAIN BENEFICIAL OWNERS AND MANAGEMENT AND RELATED STOCKHOLDER MATTERS |
SECURITIES AUTHORIZED FOR ISSUANCE UNDER EQUITY COMPENSATION PLANS
The following table provides information as of December 31, 2017, with respect to shares of our common stock that may be issued under existing equity compensation plans, including our Amended and Restated 2008 Incentive Compensation Plan, as amended (“Amended and Restated 2008 Incentive Plan”), our 2004 Incentive Compensation Plan, as amended (“2004 Incentive Plan”), our ESPP and our SPP.
| Plan Category |
Number of securities to be issued upon exercise of outstanding options, warrants and rights |
Weighted-average exercise price of outstanding options, warrants and rights |
Number of securities remaining available for future issuance under equity compensation plans (excluding securities reflected in column (a)) |
|||||||||
| (a) | (b) | (c) | ||||||||||
| Equity compensation plans approved by security holders |
246,342 | (1) | $ | 27.51 | 5,338,411 | (2) | ||||||
| Equity compensation plans not approved by security holders |
N/A | N/A | N/A | |||||||||
|
|
|
|
|
|
|
|||||||
| Total |
246,342 | $ | 27.51 | 5,338,411 | ||||||||
|
|
|
|
|
|
|
|||||||
| (1) | All shares are issuable under the Amended and Restated 2008 Incentive Plan, as amended. |
| (2) | Under the Amended and Restated 2008 Incentive Plan, as amended, 3,400,093 shares remain available for future issuance, and under the ESPP and the SPP, an aggregate of 1,938,318 shares remain available for future issuance. |
The remaining information required by this Item is incorporated by reference to the applicable information in the definitive proxy statement for our 2018 Annual Meeting of Shareholders, which is to be filed with the SEC within 120 days after our fiscal year end.
| ITEM 13. | CERTAIN RELATIONSHIPS AND RELATED TRANSACTIONS, AND DIRECTOR INDEPENDENCE |
The information required by this Item is incorporated by reference to the applicable information in the definitive proxy statement for our 2018 Annual Meeting of Shareholders, which is to be filed with the SEC within 120 days after our fiscal year end.
96
Table of Contents
| ITEM 14. | PRINCIPAL ACCOUNTING FEES AND SERVICES |
The information required by this Item is incorporated by reference to the applicable information in the definitive proxy statement for our 2018 Annual Meeting of Shareholders, which is to be filed with the SEC within 120 days after our fiscal year end.
97
Table of Contents
| ITEM 15. | EXHIBITS AND FINANCIAL STATEMENT SCHEDULE |
(a)(1) Financial Statements
The information required by this Item is included in Item 8 of Part II of this Form 10-K.
(a)(2) Financial Statement Schedule
The following financial statement schedule for the years ended December 31, 2017, 2016 and 2015, is included in this Form 10-K as set forth below (in thousands).
MEDNAX, INC.
Schedule II: Valuation and Qualifying Accounts
| Years Ended December 31, | ||||||||||||
| 2017 | 2016 | 2015 | ||||||||||
| Allowance for contractual adjustments and uncollectibles: |
||||||||||||
| Balance at beginning of year |
$ | 1,224,366 | $ | 1,129,301 | $ | 848,767 | ||||||
| Amount charged against operating revenue |
8,285,317 | 7,464,030 | 6,389,195 | |||||||||
| Accounts receivable contractual adjustments and write-offs (net of recoveries) |
(8,223,648 | ) | (7,368,965 | ) | (6,108,661 | ) | ||||||
|
|
|
|
|
|
|
|||||||
| Balance at end of year |
$ | 1,286,035 | $ | 1,224,366 | $ | 1,129,301 | ||||||
|
|
|
|
|
|
|
|||||||
All other schedules have been omitted because they are not applicable, not required or the information is included elsewhere herein.
(a)(3) Exhibits
See Item 15(b) of this Form 10-K.
(b) Exhibits
98
Table of Contents
99
Table of Contents
100
Table of Contents
| * | Management contracts or compensation plans, contracts or arrangements. |
| + | Filed herewith |
| ITEM 16. | FORM 10-K SUMMARY |
None.
101
Table of Contents
SIGNATURES
Pursuant to the requirements of Section 13 or 15(d) of the Securities Exchange Act of 1934, the registrant has duly caused this report to be signed on its behalf by the undersigned, thereunto duly authorized.
| MEDNAX, INC. | ||||||
| Date: February 14, 2018 | By: | /s/ Roger J. Medel, M.D. | ||||
| Roger J. Medel, M.D. | ||||||
| Chief Executive Officer | ||||||
Pursuant to the requirements of the Securities Exchange Act of 1934, this report has been signed below by the following persons on behalf of the registrant in the capacities and on the dates indicated.
| Signature |
Title |
Date | ||
| /s/ Roger J. Medel, M.D. Roger J. Medel, M.D. |
Chief Executive Officer (Principal Executive Officer) |
February 14, 2018 | ||
| /s/ Vivian Lopez-Blanco Vivian Lopez-Blanco |
Chief Financial Officer and Treasurer (Principal Financial Officer) |
February 14, 2018 | ||
| /s/ John C. Pepia John C. Pepia |
Chief Accounting Officer (Principal Accounting Officer) |
February 14, 2018 | ||
| /s/ Cesar L. Alvarez Cesar L. Alvarez |
Director and Chairman of the Board | February 14, 2018 | ||
| /s/ Manuel Kadre Manuel Kadre |
Lead Independent Director | February 14, 2018 | ||
| /s/ Karey D. Barker Karey D. Barker |
Director | February 14, 2018 | ||
| /s/ Waldemar A. Carlo, M.D. Waldemar A. Carlo, M.D. |
Director | February 14, 2018 | ||
| /s/ Michael B. Fernandez Michael B. Fernandez |
Director | February 14, 2018 | ||
| /s/ Paul G. Gabos Paul G. Gabos |
Director | February 14, 2018 | ||
| /s/ Pascal J. Goldschmidt, M.D. Pascal J. Goldschmidt, M.D. |
Director | February 14, 2018 | ||
| /s/ Donna E. Shalala, Ph.D. Donna E. Shalala, Ph.D. |
Director | February 14, 2018 | ||
| /s/ Enrique J. Sosa, Ph.D. Enrique J. Sosa, Ph.D. |
Director | February 14, 2018 | ||
102