Attached files
| file | filename |
|---|---|
| EX-21.1 - EXHIBIT 21.1 - ILLUMINA, INC. | fy17ex211subsidiaries.htm |
| EX-32.2 - EXHIBIT 32.2 - ILLUMINA, INC. | fy1710-kex322.htm |
| EX-32.1 - EXHIBIT 32.1 - ILLUMINA, INC. | fy1710-kex321.htm |
| EX-31.2 - EXHIBIT 31.2 - ILLUMINA, INC. | fy1710-kex312.htm |
| EX-31.1 - EXHIBIT 31.1 - ILLUMINA, INC. | fy1710-kex311.htm |
| EX-23.1 - EXHIBIT 23.1 - ILLUMINA, INC. | ex231consentfy17.htm |
| EX-10.24 - EXHIBIT 10.24 - ILLUMINA, INC. | thirdamendmenttopooledpate.htm |
| EX-10.23 - EXHIBIT 10.23 - ILLUMINA, INC. | secondamendmenttopooledpat.htm |
| EX-10.22 - EXHIBIT 10.22 - ILLUMINA, INC. | firstamendmenttopooledpate.htm |
| EX-10.18 - EXHIBIT 10.18 - ILLUMINA, INC. | arelease.htm |
| EX-10.12 - EXHIBIT 10.12 - ILLUMINA, INC. | fy1710-kex10122015stockand.htm |
| EX-10.11 - EXHIBIT 10.11 - ILLUMINA, INC. | a2015stockandincentiveplan.htm |
UNITED STATES
SECURITIES AND EXCHANGE COMMISSION
Washington, D.C. 20549
Form 10-K
þ | ANNUAL REPORT PURSUANT TO SECTION 13 OR 15(d) OF THE SECURITIES EXCHANGE ACT OF 1934 | |
For the fiscal year ended December 31, 2017
or
o | TRANSITION REPORT PURSUANT TO SECTION 13 OR 15(d) OF THE SECURITIES EXCHANGE ACT OF 1934 | |
For the transition period from to | ||
Commission file number: 001-35406
Illumina, Inc.
(Exact name of registrant as specified in its charter)
Delaware | 33-0804655 | |
(State or other jurisdiction of incorporation or organization) | (I.R.S. Employer Identification No.) | |
5200 Illumina Way San Diego, California | 92122 | |
(Address of principal executive offices) | (Zip Code) | |
Registrant’s telephone number, including area code: (858) 202-4500
Securities registered pursuant to Section 12(b) of the Act:
Title of each class | Name of each exchange on which registered | |
Common Stock, $0.01 par value | The NASDAQ Global Select Market | |
Securities registered pursuant to Section 12(g) of the Act: None
Indicate by check mark if the registrant is a well-known seasoned issuer, as defined in Rule 405 of the Securities Act. Yes þ No o
Indicate by check mark if the registrant is not required to file reports pursuant to Section 13 or Section 15(d) of the Act. Yes o No þ
Indicate by check mark whether the registrant (1) has filed all reports required to be filed by Section 13 or 15(d) of the Securities Exchange Act of 1934 during the preceding 12 months (or for such shorter period that the registrant was required to file such reports), and (2) has been subject to such filing requirements for the past 90 days. Yes þ No o
Indicate by check mark whether the registrant has submitted electronically and posted on its corporate Web site, if any, every Interactive Data File required to be submitted and posted pursuant to Rule 405 of Regulation S-T during the preceding 12 months (or for such shorter period that the registrant was required to submit and post such files). Yes þ No o
Indicate by check mark if disclosure of delinquent filers pursuant to Item 405 of Regulation S-K is not contained herein, and will not be contained, to the best of registrant’s knowledge, in definitive proxy or information statements incorporated by reference in Part III of this Form 10-K or any amendment to this Form 10-K. o
Indicate by check mark whether the registrant is a large accelerated filer, an accelerated filer, a non-accelerated filer, or a smaller reporting company. See the definitions of “large accelerated filer,” “accelerated filer” and “smaller reporting company” in Rule 12b-2 of the Exchange Act. (Check one):
Large accelerated filer þ | Accelerated filer o | Non-accelerated filer o | Smaller reporting company o | Emerging growth company o |
(Do not check if a smaller reporting company) | ||||
If an emerging growth company, indicate by check mark if the registrant has elected not to use the extended transition period for complying with any new or revised financial accounting standards provided pursuant to Section 13a of the Exchange Act. o
Indicate by check mark whether the registrant is a shell company (as defined in Rule 12b-2 of the Exchange Act). Yes o No þ
As of February 9, 2018, there were 147 million shares (excluding 44 million shares held in treasury) of the registrant’s common stock outstanding. The aggregate market value of the common stock held by non-affiliates of the registrant as of July 2, 2017 (the last business day of the registrant’s most recently completed second fiscal quarter), based on the closing price for the common stock on The NASDAQ Global Select Market on June 30, 2017 (the last trading day before July 2, 2017), was $22.0 billion. This amount excludes an aggregate of approximately 19 million shares of common stock held by officers and directors and each person known by the registrant to own 10% or more of the outstanding common stock. Exclusion of shares held by any person should not be construed to indicate that such person possesses the power, directly or indirectly, to direct or cause the direction of the management or policies of the registrant, or that the registrant is controlled by or under common control with such person.
DOCUMENTS INCORPORATED BY REFERENCE
Portions of the registrant’s definitive proxy statement for the 2018 annual meeting of stockholders are incorporated by reference into Items 10 through 14 of Part III of this Report.
ILLUMINA, INC.
FORM 10-K
FOR THE FISCAL YEAR ENDED DECEMBER 31, 2017
TABLE OF CONTENTS
Page | ||
1
Special Note Regarding Forward-Looking Statements
This annual report on Form 10-K contains, and our officers and representatives may from time to time make, “forward-looking statements” within the meaning of the safe harbor provisions of the U.S. Private Securities Litigation Reform Act of 1995. Forward-looking statements can be identified by words such as: “anticipate,” “intend,” “plan,” “goal,” “seek,” “believe,” “project,” “estimate,” “expect,” “strategy,” “future,” “likely,” “may,” “should,” “will,” or the negative of these terms, and similar references to future periods. Examples of forward-looking statements include, among others, statements we make regarding:
• | our expectations as to our future financial performance, results of operations, or other operational results or metrics; |
• | our expectations regarding the launch of new products or services; |
• | the benefits that we expect will result from our business activities and certain transactions we have completed, such as product introductions, increased revenue, decreased expenses, and avoided expenses and expenditures; |
• | our expectations of the effect on our financial condition of claims, litigation, contingent liabilities, and governmental investigations, proceedings, and regulations; |
• | our strategies or expectations for product development, market position, financial results, and reserves; and |
• | other expectations, beliefs, plans, strategies, anticipated developments, and other matters that are not historical facts. |
Forward-looking statements are neither historical facts nor assurances of future performance. Instead, they are based only on our current beliefs, expectations, and assumptions regarding the future of our business, future plans and strategies, projections, anticipated events and trends, the economy, and other future conditions. Because forward-looking statements relate to the future, they are subject to inherent uncertainties, risks, and changes in circumstances that are difficult to predict and many of which are outside of our control. Our actual results and financial condition may differ materially from those indicated in the forward-looking statements. Therefore, you should not rely on any of these forward-looking statements. Important factors that could cause our actual results and financial condition to differ materially from those indicated in the forward-looking statements include, among others, the following:
• | challenges inherent in developing, manufacturing, and launching new products and services, including expanding manufacturing operations and reliance on third-party suppliers for critical components; |
• | the timing and mix of customer orders among our products and services; |
• | the impact of recently launched or pre-announced products and services on existing products and services; |
• | our ability to develop and commercialize our instruments and consumables, to deploy new products, services, and applications, and to expand the markets for our technology platforms; |
• | our ability to manufacture robust instrumentation and consumables; |
• | our ability to identify and integrate acquired technologies, products, or businesses successfully; |
• | our expectations and beliefs regarding prospects and growth for the business and its markets; |
• | the assumptions underlying our critical accounting policies and estimates; |
• | our assessments and estimates that determine our effective tax rate; |
• | our assessments and beliefs regarding the outcome of pending legal proceedings and any liability, that we may incur as a result of those proceedings; |
• | uncertainty, or adverse economic and business conditions, including as a result of slowing or uncertain economic growth in the United States or worldwide; and |
2
• | other factors detailed in our filings with the SEC, including the risks, uncertainties, and assumptions described in Item 1A “Risk Factors” below, or in information disclosed in public conference calls, the date and time of which are released beforehand. |
Any forward-looking statement made by us in this annual report on Form 10-K is based only on information currently available to us and speaks only as of the date on which it is made. We undertake no obligation, and do not intend, to publicly update any forward-looking statement, whether written or oral, that may be made from time to time, or to review or confirm analysts’ expectations, or to provide interim reports or updates on the progress of any current financial quarter, in each case whether as a result of new information, future developments, or otherwise.
Available Information
Our annual report on Form 10-K, quarterly reports on Form 10-Q, current reports on Form 8-K, and all amendments to those reports are available free of charge on our website, www.illumina.com. The information on our website is not incorporated by reference into this report. Such reports are made available as soon as reasonably practicable after filing with, or furnishing to, the SEC. The SEC also maintains an Internet site at www.sec.gov that contains reports, proxy and information statements, and other information regarding issuers that electronically file with the SEC. Copies of our annual report on Form 10-K will be made available, free of charge, upon written request.
_______________________________________
Illumina, 24sure, BaseSpace, BlueFish, BlueFuse, BlueGnome, Clarity LIMS, CSPro, DesignStudio, Durascript, Epicentre, Genetic Energy, GenomeStudio, Globin-Zero, GoldenGate, HiSeq, iHope, Illumina Propel Certified, IllumiNotes, Infinium, iScan, iSelect, iSeq, MiniSeq, MiSeq, MiSeqDx, MiSeq Dx, MyGenome by Illumina, NextBio, Nextera, NextSeq, NovaSeq, Powered by Illumina, Ribo-Zero, SeqMonitor, SureCell, TruGenome, TruSeq, TruSight, Understand Your Genome, UYG, verifi, Verinata, Verinata Health, VeriSeq, the pumpkin orange color, and the Genetic Energy streaming bases design are trademarks or registered trademarks of Illumina, Inc.
_______________________________________
Unless the context requires otherwise, references in this annual report on Form 10-K to “Illumina,” the “Company,” “we,” “us,” and “our” refer to Illumina, Inc. and its subsidiaries.
3
PART I
ITEM 1. Business.
Overview
We are the global leader in sequencing- and array-based solutions for genetic analysis. Our products and services serve customers in a wide range of markets, enabling the adoption of genomic solutions in research and clinical settings. We were incorporated in California in April 1998 and reincorporated in Delaware in July 2000. Our principal executive offices are located at 5200 Illumina Way, San Diego, California 92122. Our telephone number is (858) 202-4500.
Our customers include leading genomic research centers, academic institutions, government laboratories, and hospitals, as well as pharmaceutical, biotechnology, commercial molecular diagnostic laboratories, and consumer genomics companies.
Our portfolio of integrated sequencing and microarray systems, consumables, and analysis tools is designed to accelerate and simplify genetic analysis. This portfolio addresses the range of genomic complexity, price points, and throughput, enabling customers to select the best solution for their research or clinical challenge.
We have also enabled, or invested in, early-stage companies that are pursuing promising genomics-related technologies. For example, GRAIL, Inc. (GRAIL), formed in 2016, was created to develop a blood test for early-stage cancer detection; and Helix Holdings I, LLC (Helix) was established in 2015 to enable individuals to explore their genetic information by providing sequencing and services for consumers through third-party partners. Helix is a consolidated variable interest entity (VIE), and GRAIL was deconsolidated in February 2017.
Genetics Primer
The instruction set for all living cells is encoded in deoxyribonucleic acid, or DNA. The complete set of DNA for any organism is referred to as its genome. DNA contains small regions called genes, which comprise a string of nucleotide bases labeled A, C, G, and T, representing adenine, cytosine, guanine, and thymine, respectively. These nucleotide bases occur in a precise order known as the DNA sequence. When a gene is “expressed,” a copy of a portion of its DNA sequence called messenger RNA (mRNA) is used as a template to direct the synthesis of a particular protein. Proteins, in turn, direct all cellular function. The illustration below is a simplified gene expression schematic.

Variations among organisms are due, in large part, to differences in their DNA sequences. Changes can result from insertions, deletions, inversions, translocations, or duplications of nucleotide bases. These changes may result in certain genes becoming overexpressed (excessive protein production), underexpressed (reduced protein production), or silenced altogether, sometimes triggering changes in cellular function. These changes can be the result of heredity, but most often they occur at random. The most common form of variation in humans is called a single nucleotide polymorphism (SNP), which is a base change in a single position in a DNA sequence. Another type of variation, copy number variations (CNVs), occur when there are fewer or more copies of certain genes, segments of a gene, or stretches of DNA.
4
In humans, genetic variation accounts for many of the physical differences we see (e.g., height, hair, eye color, etc.). Genetic variations also can have medical consequences affecting disease susceptibility, including predisposition to complex genetic diseases such as cancer, diabetes, cardiovascular disease, and Alzheimer’s disease. They can affect individuals’ response to certain drug treatments, causing them to respond well, experience adverse side effects, or not respond at all.
Scientists are studying these variations and their consequences in humans, as well as in a broad range of animals, plants, and microorganisms. Such research takes place in government, university, pharmaceutical, biotechnology, and agrigenomics laboratories around the world, where scientists expand our knowledge of the biological functions essential for life. Beginning at the genetic level, our tools are used to elucidate the correlation between gene sequence and biological processes. Researchers who investigate human, viral, and bacterial genetic variation to understand the mechanisms of disease are enabling the development of more effective diagnostics and therapeutics. They also provide greater insight into genetic variation in plants (e.g., food and biofuel crops) and animals (e.g., livestock and domestic), enabling improvements in crop yields and animal breeding programs.
By empowering genetic analysis and facilitating a deeper understanding of genetic variation and function, our tools advance disease research, drug development, and the creation of molecular diagnostic tests. We believe that this will trigger a fundamental shift in the practice of medicine and health care, and that the increased emphasis on preventive and predictive molecular medicine will usher in the era of precision health care.
Our Principal Markets
Our organization is structured to target the markets and customers outlined below.
Life Sciences
Historically, our core business has been in the life sciences research market. This includes laboratories associated with universities, research centers, and government institutions, along with biotechnology and pharmaceutical companies. Researchers at these institutions use our products and services for basic and translational research across a spectrum of scientific applications, including targeted, exome, and whole-genome sequencing; genetic variation; gene expression; epigenetics; and metagenomics. Next-generation sequencing (NGS) technologies are being adopted due to their declining costs per sample and their ability to sequence large sample sizes quickly and accurately, generating vast amounts of high-quality data. Both private and public funding drive this research, along with global initiatives to characterize genetic variation.
Our products also serve various applied markets including consumer genomics and agrigenomics. For example, in consumer genomics, our customers use our technologies to provide personalized genetic data and analysis to individual consumers. In agrigenomics, government and corporate researchers use our products and services to explore the genetic and biological basis for productivity and nutritional constitution in crops and livestock. Researchers can identify natural and novel genomic variation and deploy genome-wide marker-based applications to accelerate breeding and production of healthier and higher-yielding crops and livestock.
Clinical Genomics
We are focused on enabling translational and clinical markets through the introduction of best-in-class sequencing instruments and reagents. Further, we are developing sample-to-answer solutions to catalyze adoption in the clinical setting, including in reproductive and genetic health and oncology. In reproductive health, our primary focus is driving noninvasive prenatal testing (NIPT) adoption globally through our technology, which identifies fetal chromosomal abnormalities by analyzing cell-free DNA in maternal blood. Our NGS technology is also accelerating rare and undiagnosed disease research to discover the genetic causes of inherited disorders by assessing many genes simultaneously. Using NGS can reduce costs compared to traditional methods of disease diagnosis, which are often expensive and inconclusive while requiring extensive testing.
Cancer is a disease of the genome, and the goal of cancer genomics is to identify genomic changes that transform a normal cell into a cancerous one. Understanding these genomic changes will improve diagnostic accuracy, increase understanding of the prognosis, and enable oncologists to target therapies to individuals. Customers in the translational and clinical oncology markets use our products to perform research that may help identify individuals who are genetically predisposed to cancer. Customers also utilize our technology to identify the molecular changes in a tumor so that physicians can tailor treatment based on the genetic variation. We believe that circulating tumor DNA (ctDNA) will become an important clinical tool for managing oncology patients during all stages of tumor progression. Our technology is being used to research the implications of ctDNA in treatment determination, treatment monitoring, minimal residual disease, and asymptomatic
5
screening. For example, we have invested in, and partnered with GRAIL, which we formed to develop a blood-based test for early-stage cancer detection that is enabled by our sequencing technology.
Our Principal Products and Technologies
Our unique technology platforms support the scale of experimentation necessary for population-scale studies, genome-wide discovery, target selection, and validation studies (see Figure 1 below). Customers use our products to analyze the genome at all levels of complexity, from targeted panels to whole-genome sequencing. A large and dynamic Illumina user community has published tens of thousands of customer-authored scientific papers using our technologies. Through rapid innovation, we are changing the economics of genetic research, enabling projects that were previously considered impossible, and supporting clinical advances towards precision medicine.
Most of our product sales consist of instruments and consumables (which include reagents, flow cells, and microarrays) based on our proprietary technologies. For the fiscal years ended December 31, 2017, January 1, 2017, and January 3, 2016, instrument sales comprised 19%, 20%, and 27%, respectively, of total revenues, and consumable sales represented 64%, 64%, and 58%, respectively, of total revenues.
Figure 1: Illumina Platform Overview:
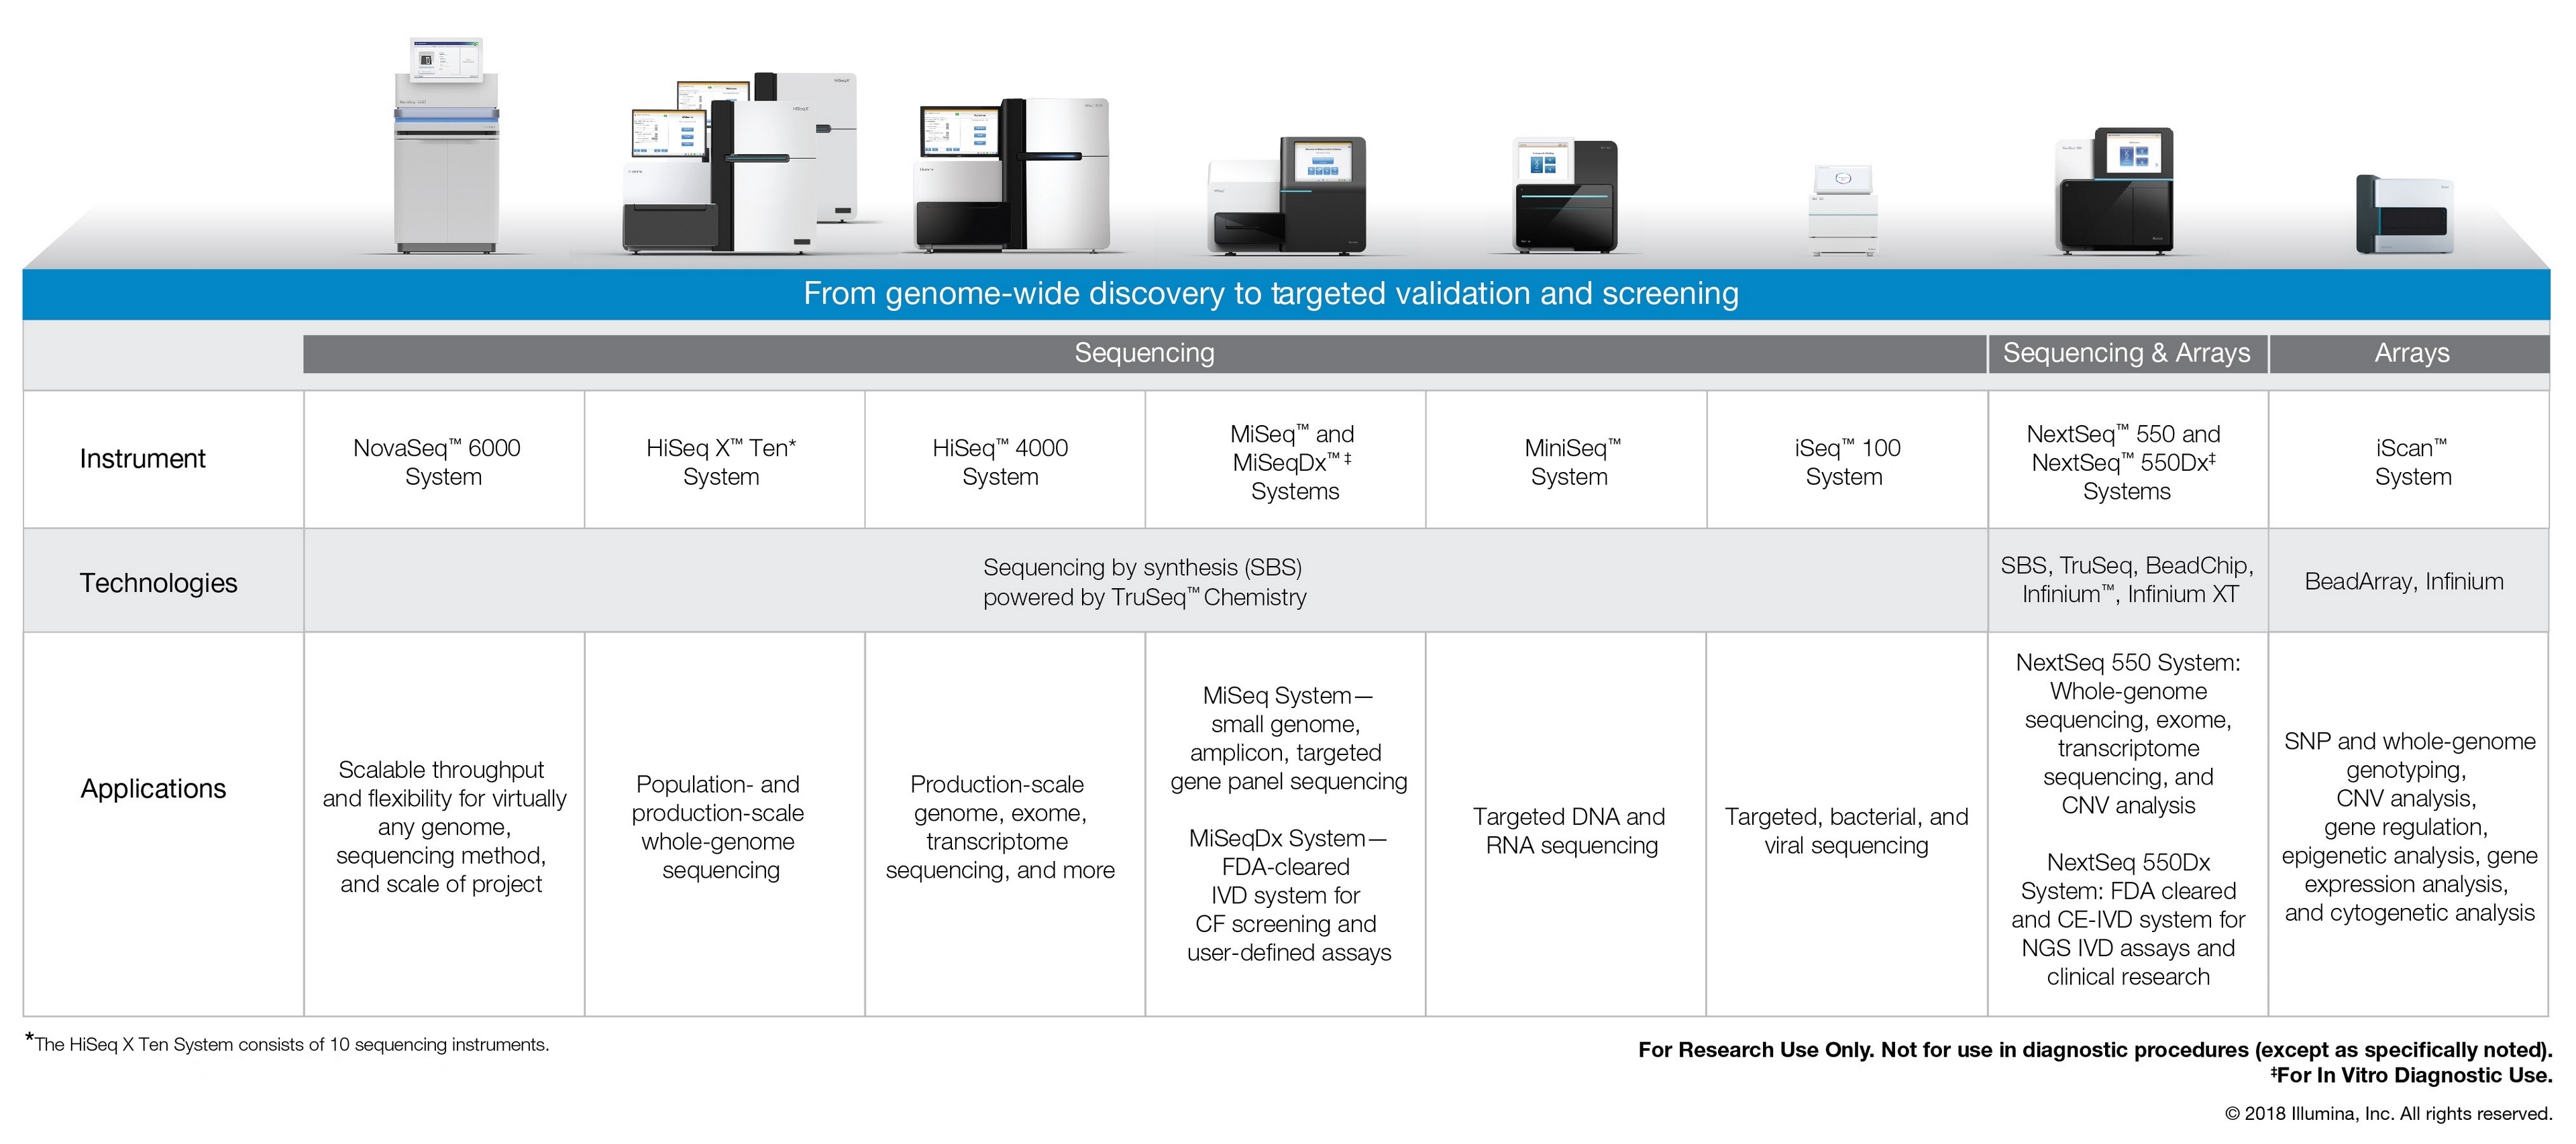
Sequencing
DNA sequencing is the process of determining the order of nucleotide bases (A, C, G, or T) in a DNA sample. Our portfolio of sequencing platforms represents a family of systems that we believe set the standard for productivity, cost-effectiveness, and accuracy among NGS technologies. Customers use our platforms to perform whole-genome, de novo, exome and RNA sequencing, and targeted resequencing of specific gene regions and genes.
Whole-genome sequencing determines the complete DNA sequence of an organism. In de novo sequencing, the goal is to sequence and analyze a sample without using information from prior sequencing of that species. In targeted resequencing, a portion of the sequence of an organism is compared to a standard or reference sequence from previously sequenced samples to identify genetic variation. Understanding the similarities and differences in DNA sequence between and within species helps us understand the function of the structures encoded in the DNA.
Our DNA sequencing technology is based on our proprietary reversible terminator-based sequencing chemistry, referred to as sequencing by synthesis (SBS) biochemistry. SBS tracks the addition of labeled nucleotides as the DNA chain is copied in a massively parallel fashion. Our SBS sequencing technology provides researchers with a broad range of applications and the ability to sequence even large mammalian genomes in a few days rather than weeks or years.
Our sequencing platforms can generate between 500 megabases (Mb) and 6.0 terabases (Tb) (equivalent to approximately 48 human genomes) of genomic data in a single run, depending on the instrument and application. There are different price
6
points per gigabase (Gb) for each instrument, and for different applications, which range from small-genome, amplicon, and targeted gene-panel sequencing to population-scale whole human genome sequencing. Since we launched our first sequencing system in 2007, our systems have reduced the cost of sequencing by more than a factor of 10,000. In addition, the sequencing time per Gb has dropped by a factor of approximately 12,000.
Our BaseSpace Informatics Suite cloud platform plays a critical role in supporting our sequencing applications. BaseSpace Suite integrates directly with our sequencing instruments, allowing customers to manage their biological sample and sequencing runs, process and analyze the raw genomic data, and derive meaningful results. It facilitates data sharing, provides data-storage solutions and streamlines analysis through a growing number of applications developed by us and the bioinformatics community.
For the fiscal years ended December 31, 2017, January 1, 2017, and January 3, 2016, sequencing revenue comprised 83%, 84%, and 86%, respectively, of total revenues.
Arrays
Arrays are used for a broad range of DNA and RNA analysis applications, including SNP genotyping, CNV analysis, gene expression analysis, and methylation analysis, and enable the detection of millions of known genetic markers on a single array.
Our BeadArray technology combines microscopic beads and a substrate in a proprietary manufacturing process to produce arrays that can perform many assays simultaneously. This facilitates large-scale analysis of genetic variation and biological function in a unique, high-throughput, cost-effective, and flexible manner. Using our BeadArray technology, we achieve high-throughput analysis via a high density of test sites per array and the ability to format arrays in various configurations. To serve the needs of multiple markets and market segments, we can vary the size, shape, and format of the substrate into which the beads self-assemble and create specific bead types for different applications. Our iScan System and our NextSeq 550 System can be used to image arrays.
For the fiscal years ended December 31, 2017, January 1, 2017, and January 3, 2016, array revenue comprised 17%, 16%, and 14%, respectively, of total revenues.
Consumables
We have developed various library preparation and sequencing kits to simplify workflows and accelerate analysis. Our sequencing applications include whole-genome sequencing kits, which sequence entire genomes of any size and complexity, and targeted resequencing kits, which can sequence exomes, specific genes, RNA or other genomic regions of interest. Our sequencing kits maximize the ability of our customers to characterize the target genome accurately and are sold in various configurations, addressing a wide range of applications.
Customers use Illumina array-based genotyping consumables for a wide range of analyses, including diverse species, disease-related mutations, and genetic characteristics associated with cancer. Customers can select from a range of human, animal, and agriculturally relevant genome panels or create their own custom arrays to investigate millions of genetic markers targeting any species.
Our Services
We provide whole-genome sequencing, genotyping, NIPT, and product support services. Human whole-genome sequencing services are provided through our CLIA-certified, CAP-accredited laboratory. Using our services, customers can perform whole-genome sequencing projects and microarray projects (including large-scale genotyping studies and whole-genome association studies). We also provide NIPT services through our partner laboratories that direct samples to us on a test send-out basis in our CLIA-certified, CAP-accredited laboratory. In addition, we also offer support services to customers who have purchased our products.
Intellectual Property
We have an extensive intellectual property portfolio. As of February 1, 2018, we own or have exclusive licenses to 719 issued U.S. patents and 473 pending U.S. patent applications, including 32 allowed applications that have not yet issued as patents. Our issued and pending patents cover various aspects of our arrays, assays, oligo synthesis, sequencing technology, instruments, digital microfluidics, software, bioinformatics, and chemical-detection technologies, and have terms that expire
7
between 2018 and 2038. We continue to file new patent applications to protect the full range of our technologies. We have filed or have been granted counterparts for many of these patents and applications in foreign countries.
We protect trade secrets, know-how, copyrights, and trademarks. Our success depends in part on obtaining patent protection for our products and processes, preserving trade secrets, patents, copyrights and trademarks, operating without infringing the proprietary rights of third parties, and acquiring licenses for technology or products. In addition, we invest in technological innovation, and we seek beneficial licensing opportunities to develop and maintain our competitive position.
We are party to various exclusive and nonexclusive license agreements and other arrangements with third parties that grant us rights to use key aspects of our sequencing and array technologies, assay methods, chemical detection methods, reagent kits, and scanning equipment. Our exclusive licenses expire with the termination of the underlying patents, which will occur between 2018 and 2032. We have additional nonexclusive license agreements with various third parties for other components of our products. In most cases, the agreements remain in effect over the term of the underlying patents, may be terminated at our request without further obligation, and require that we pay customary royalties.
Research and Development
Illumina has historically made substantial investments in research and development. Our research and development efforts prioritize continuous innovation coupled with product evolution.
Research and development expenses for the fiscal years ended December 31, 2017, January 1, 2017, and January 3, 2016 were $546 million, $504 million, and $401 million, respectively. We expect research and development expense to increase during 2018 to support business growth and continuing expansion in research and product-development efforts.
Marketing and Distribution
We market and distribute our products directly to customers in North America, Europe, Latin America, and the Asia-Pacific region. In each of these areas, dedicated sales, service, and application-support personnel are expanding and supporting their respective customer bases. In addition, we sell through life-science distributors in certain markets within Europe, the Asia-Pacific region, Latin America, the Middle East, and South Africa. We expect to continue increasing our sales and distribution resources during 2018 and beyond as we launch new products and expand our potential customer base.
Manufacturing
We manufacture sequencing and array platforms and reagent kits. In 2017, we continued to increase our manufacturing capacity to meet customer demand. To address increasing product complexity and volume, we continue to automate manufacturing processes to accelerate throughput and improve quality and yield. We are committed to providing medical devices and related services that consistently meet customer and applicable regulatory requirements. We adhere to access and safety standards required by federal, state, and local health ordinances, such as standards for the use, handling, and disposal of hazardous substances. Our key manufacturing and distribution facilities operate under a quality management system certified to ISO 13485.
Raw Materials
Our manufacturing operations require a wide variety of raw materials, electronic and mechanical components, chemical and biochemical materials, and other supplies. Multiple commercial sources provide many of our components and supplies, but there are some raw materials and components that we obtain from single-source suppliers. To manage potential risks arising from single-source suppliers, we believe that we could redesign our products using alternative components or for use with alternative reagents, if necessary. In addition, while we attempt to keep our inventory at minimal levels, we purchase incremental inventory as circumstances warrant to protect our supply chain. If the capabilities of our suppliers and component manufacturers are limited or stopped, due to disasters, quality, regulatory, or other reasons, it could negatively impact our ability to manufacture our products.
Competition
Although we believe that our products and services provide significant advantages over products and services currently available from other sources, we expect continued intense competition. Our competitors offer products and services for sequencing, SNP genotyping, gene expression, and molecular diagnostics markets. They include companies such as Agilent Technologies, Inc., BGI, Oxford Nanopore Technologies Limited, Pacific Biosciences of California, Inc., QIAGEN N.V., Roche
8
Holding AG., and Thermo Fisher Scientific, Inc., among others. Some of these companies have or will have substantially greater financial, technical, research, and other resources than we do, along with larger, more established marketing, sales, distribution, and service organizations. In addition, they may have greater name recognition than we do in the markets we address, and in some cases a larger installed base of systems. We expect new competitors to emerge and the intensity of competition to increase. To compete effectively, we must scale our organization and infrastructure appropriately and demonstrate that our products have superior throughput, cost, and accuracy.
Segment and Geographic Information
We have two reportable segments: Illumina’s core operations (Core Illumina) and one segment related to the combined activities of the consolidated VIEs, GRAIL and Helix (Consolidated VIEs). Following the GRAIL deconsolidation on February 28, 2017, the Consolidated VIEs no longer include GRAIL. Prior to 2016, the combined results of operations of the Consolidated VIEs were not material.
We currently sell our products to a number of customers outside the United States, including customers in other areas of North America, Latin America, Europe, and the Asia-Pacific region. Shipments to customers outside the United States totaled $1.2 billion, or 45% of total revenues, during fiscal 2017, compared to $1.1 billion, or 46%, and $1.0 billion, or 46%, in fiscal 2016 and 2015, respectively. The U.S. dollar has been determined to be the functional currency of our international operations due to the primary activities of our foreign subsidiaries. We expect that sales to international customers will continue to be an important and growing source of revenue. See note “11. Segment Information, Geographic Data, and Significant Customers” in Part II, Item 8 of this report for further information concerning our foreign and domestic operations.
Backlog
Our backlog was approximately $935 million and $650 million as of December 31, 2017 and January 1, 2017, respectively. Generally, our backlog consists of orders believed to be firm as of the balance sheet date. However, we may allow customers to make product substitutions as we launch new products. The timing of shipments depends on several factors, including agreed upon shipping schedules, which may span multiple quarters, and whether the product is catalog or custom. We expect approximately two-thirds of our backlog as of December 31, 2017, to be shipped within the fiscal year ending December 30, 2018. Although we generally recognize revenue upon the transfer of title to a customer, some customer agreements or applicable accounting treatments might require us to defer the recognition of revenue beyond title transfer.
Environmental Matters
We are committed to the protection of our employees and the environment. Our operations require the use of hazardous materials that subject us to various federal, state, and local environmental and safety laws and regulations. We believe that we are in material compliance with current applicable laws and regulations. However, we could be held liable for damages and fines should contamination of the environment or individual exposures to hazardous substances occur. In addition, we cannot predict how changes in these laws and regulations, or the development of new laws and regulations, will affect our business operations or the cost of compliance.
Government Regulation
As we expand product lines to address the diagnosis of disease, regulation by governmental authorities in the United States and other countries will become an increasingly significant factor in development, testing, production, and marketing. Products that we develop in the molecular diagnostic markets, depending on their intended use, may be regulated as medical devices or in vitro diagnostic products (IVDs) by the FDA and comparable agencies in other countries. In the United States, certain of our products may require FDA clearance following a pre-market notification process, also known as a 510(k) clearance, or premarket approval (PMA) from the FDA before marketing. The usually shorter 510(k) clearance process, which we used for the FDA-cleared assays that are run on our FDA-regulated MiSeqDx instrument, generally takes from three to six months after submission, but it can take significantly longer. The longer PMA process is much more costly and uncertain. It generally takes from 9 to 18 months after a complete filing, but it can take significantly longer and requires conducting clinical studies that are generally more extensive than those required for 510(k) clearance. All of the products that are currently regulated by the FDA as medical devices and IVDs are also subject to the FDA Quality System Regulation (QSR). Obtaining the requisite regulatory approvals, including the FDA quality system inspections that are required for PMA approval, can be expensive and may involve considerable delay.
We cannot be certain which of our planned molecular diagnostic products will be subject to the shorter 510(k) clearance process and, in fact, some of our products will need to go through the PMA process. The regulatory approval process for such
9
products may be significantly delayed, may be significantly more expensive than anticipated, and may conclude without such products being approved by the FDA. Without timely regulatory approval, we will not be able to launch or successfully commercialize such products.
Changes to the current regulatory framework, including the imposition of additional or new regulations, could arise at any time during the development or marketing of our products. This may negatively affect our ability to obtain or maintain FDA or comparable regulatory clearance or approval of our products. In addition, the FDA may introduce new requirements that may change the regulatory requirements for us or our customers, or both.
If our products labeled as “For Research Use Only. Not for use in diagnostic procedures,” or RUO, are used, or could be used, for the diagnosis of disease, the regulatory requirements related to marketing, selling, and supporting such products could be uncertain. This is true even if such use by our customers occurs without our consent. If the FDA or other regulatory authorities assert that any of our RUO products are subject to regulatory clearance or approval, our business, financial condition, or results of operations could be adversely affected.
Illumina products sold as medical devices or IVDs in Europe will be regulated under the In Vitro Diagnostics Directive (98/79/EC). A new regulation, the in vitro Diagnostic Medical Devices Regulation (EU) 2017/746, the IVDR, has been released and will become fully enforceable in 2020. These regulations include requirements for both presentation and review of performance data and quality-system requirements.
Certain of our diagnostic products are currently available through laboratories that are certified under the Clinical Laboratory Improvements Amendments (CLIA) of 1988. These products are commonly called “laboratory developed tests,” or LDTs. For a number of years, the FDA has exercised its regulatory enforcement discretion not to regulate LDTs as medical devices if created and used within a single laboratory. However, the FDA is reexamining this regulatory approach and changes to the agency’s handling of LDTs could impact our business in ways that cannot be predicted at this time. In October 2014, the FDA published two draft guidance documents suggesting an approach for registration and listing of laboratories and assays along with a framework for regulation of LDTs by the FDA based on risk to patients rather than whether the LDTs were made by a conventional manufacturer or a single laboratory. The draft framework guidance includes pre-market review for higher-risk LDTs, including many used to guide treatment decisions, as well as companion diagnostics that have entered the market as LDTs. We cannot predict the nature or extent of the FDA's final guidance or regulation of LDTs, in general, or with respect to our or our customers’ LDTs, in particular.
Certification of CLIA laboratories includes standards in the areas of personnel qualifications, administration, and participation in proficiency testing, patient test management, and quality control procedures. CLIA also mandates that, for high complexity labs such as ours, to operate as a lab, we must have an accreditation by an organization recognized by CLIA such as the College of Pathologists (CAP), which we have obtained and must maintain. If we were to lose our CLIA certification or CAP accreditation, our business, financial condition, or results of operations could be adversely affected. In addition, state laboratory licensing and inspection requirements may also apply to our products, which, in some cases, are more stringent than CLIA requirements.
Employees
As of December 31, 2017, we had more than 6,200 employees. We consider our employee relations to be positive. Our success will depend in large part upon our ability to attract and retain employees. In addition, we employ a number of temporary and contract employees. We face competition in this regard from other companies, research and academic institutions, government entities, and other organizations.
ITEM 1A. | Risk Factors. |
Our business is subject to various risks, including those described below. In addition to the other information included in this report, the following issues could adversely affect our operating results or our stock price.
Our continued growth is dependent on continuously developing and commercializing new products.
Our target markets are characterized by rapid technological change, evolving industry standards, changes in customer needs, existing and emerging competition, strong price competition, and frequent new product introductions. Accordingly, our continued growth depends on developing and commercializing new products and services, including improving our existing products and services, in order to address evolving market requirements on a timely basis. If we fail to innovate or adequately invest in new technologies, our products and services will become dated, and we could lose our competitive position in the
10
markets that we serve as customers purchase new products offered by our competitors. We believe that successfully introducing new products and technologies in our target markets on a timely basis provides a significant competitive advantage because customers make an investment of time in selecting and learning to use a new product and may be reluctant to switch once that selection is made.
To the extent that we fail to introduce new and innovative products, or such products are not accepted in the market or suffer significant delays in development, we may lose market share to our competitors, which will be difficult or impossible to regain. An inability, for technological or other reasons, to successfully develop and introduce new products on a timely basis could reduce our growth rate or otherwise have an adverse effect on our business. In the past, we have experienced, and are likely to experience in the future, delays in the development and introduction of new products. There can be no assurance that we will keep pace with the rapid rate of change in our markets or that our new products will adequately meet the requirements of the marketplace, achieve market acceptance, or compete successfully with competing technologies. Some of the factors affecting market acceptance of new products and services include:
• | availability, quality, and price relative to competing products and services; |
• | the functionality and performance of new and existing products and services; |
• | the timing of introduction of new products or services relative to competing products and services; |
• | scientists’ and customers’ opinions of the utility of new products or services; |
• | citation of new products or services in published research; |
• | regulatory trends and approvals; and |
• | general trends in life sciences research and applied markets. |
We may also have to write off excess or obsolete inventory if sales of our products are not consistent with our expectations or the market requirements for our products change due to technical innovations in the marketplace.
Our success depends upon the continued emergence and growth of markets for analysis of genetic variation and biological function.
Our products are designed for use in the life sciences, diagnostic, agricultural, pharmaceutical, and consumer genomics industries. The usefulness of our technologies depends in part upon the availability of genetic data and its usefulness in clinical, research, and consumer applications. We are focusing on markets for analysis of genetic variation or biological function, namely sequencing, genotyping, and gene expression profiling. These markets are relatively new and emerging, and they may not develop as quickly as we anticipate, or reach what we expect to be their full potential. Other methods of analysis of genetic variation and biological function may emerge and displace the methods we are developing. Also, researchers may not be able to successfully analyze raw genetic data or be able to convert raw genetic data into valuable information. In addition, factors affecting research and development spending generally, such as changes in the regulatory environment affecting life sciences and pharmaceutical companies, and changes in government programs that provide funding to companies and research institutions, could harm our business. If useful genetic data is not available or if our target markets do not develop in a timely manner, demand for our products may grow at a slower rate than we expect.
If we do not successfully manage the development, manufacturing, and launch of new products or services, including product transitions, our financial results could be adversely affected.
We face risks associated with launching new products and pre-announcing products and services when the products or services have not been fully developed or tested. In addition, we may experience difficulty in managing or forecasting customer reactions, purchasing decisions, transition requirements or programs with respect to newly-launched products (or products in development), which could adversely affect sales of our existing products. For instance, in 2017, we announced and launched our NovaSeq 6000 instrument system, which was developed using our new sequencing architecture, and in 2018 we launched our iSeq 100 instrument system, which combines CMOS sensor technology with our proprietary sequencing technology. If our products and services are not able to deliver the performance or results expected by our target markets or are not delivered on a timely basis, our reputation and credibility may suffer. If we encounter development challenges or discover errors in our products late in our development cycle, we may delay the product launch date. The expenses or losses associated with unsuccessful product development or launch activities or a lack of market acceptance of our new products could adversely affect our business, financial condition, or results of operations.
11
As we announce future products or integrate new products into our portfolio, such as new instruments or instrument platforms, we face numerous risks relating to product transitions and the evolution of our product portfolio. We may be unable to accurately forecast new product demand and the impact of new products on the demand for current or established products. We may experience challenges relating to managing excess and obsolete inventories, managing new or higher product cost structures, and managing different sales and support requirements. Announcements of currently planned or other new products may cause customers to defer or stop purchasing our current or established products until new products become available. In addition, customers may defer or stop purchasing our current or established products as they assess the features and technological characteristics of new products, as compared to our current or established products, before making a financial commitment. If customers elect to purchase newly-introduced products rather than established products, revenue recognition on such purchases may be delayed because the availability of newly-introduced products is generally constrained (compared to established products) as we scale-up manufacturing, sales, and support requirements for newly-introduced products. Our failure to effectively manage the evolution of our product portfolio, including product transitions or introductions, could adversely affect our business, financial condition, or results of operations.
We face intense competition, which could render our products obsolete, result in significant price reductions, or substantially limit the volume of products that we sell.
We compete with life sciences companies that design, manufacture, and market products for analysis of genetic variation and biological function and other applications using a wide range of competing technologies. We anticipate that we will continue to face increased competition as existing companies develop new or improved products and as new companies enter the market with new technologies. One or more of our competitors may render one or more of our technologies obsolete or uneconomical. Some of our competitors have greater financial and personnel resources, broader product lines, more focused product lines, a more established customer base, and more experience in research and development than we do. Furthermore, life sciences, clinical genomics, and pharmaceutical companies, which are our potential customers and strategic partners, could also develop competing products. We believe that customers in our markets display a significant amount of loyalty to their initial supplier of a particular product; therefore, it may be difficult to generate sales to potential customers who have purchased products from competitors. To the extent we are unable to be the first to develop or supply new products, our competitive position may suffer.
The market for molecular diagnostics products is currently limited and highly competitive, with several large companies already having significant market share, intellectual property portfolios, and regulatory expertise. For example, the market for noninvasive prenatal testing is rapidly developing, and if our competitors are able to develop and commercialize products superior to or less expensive than ours, our business could be adversely impacted. Established diagnostic companies also have an installed base of instruments in several markets, including clinical and reference laboratories, which could deter acceptance of our products. In addition, some of these companies have formed alliances with genomics companies that provide them access to genetic information that may be incorporated into their diagnostic tests, potentially creating a competitive advantage for them.
We and our competitors also compete on the basis of price. As the cost of analyzing genetic variation and biological function falls over time, as we expect, we cannot be sure that the demand for related products and services will increase proportionately. In the future, if the demand for our products and services proves to be more insensitive to lower sequencing costs than we expect, our business, financial condition, and results of operations will be adversely affected.
We depend on third-party manufacturers and suppliers for some of our products, or sub-assemblies, components, and materials used in our products, and if shipments from these manufacturers or suppliers are delayed or interrupted, or if the quality of the products, components, or materials supplied do not meet our requirements, we may not be able to launch, manufacture, or ship our products in a timely manner, or at all.
The complex nature of our products requires customized, precision-manufactured sub-assemblies, components, and materials that currently are available from a limited number of sources, and, in the case of some sub-assemblies, components, and materials, from only a single source. If deliveries from these vendors are delayed or interrupted for any reason, or if we are otherwise unable to secure a sufficient supply, we may not be able to obtain these sub-assemblies, components, or materials on a timely basis or in sufficient quantities or at satisfactory qualities, or at all, in order to meet demand for our products. We may need to enter into contractual relationships with manufacturers for commercial-scale production of some of our products, in whole or in part, or develop these capabilities internally, and there can be no assurance that we will be able to do this on a timely basis, in sufficient quantities, or on commercially reasonable terms. In addition, the lead time needed to establish a relationship with a new supplier can be lengthy, and we may experience delays in meeting demand in the event we must switch to a new supplier. The time and effort required to qualify a new supplier could result in additional costs, diversion of resources,
12
or reduced manufacturing yields, any of which would negatively impact our operating results. Accordingly, we may not be able to establish or maintain reliable, high-volume manufacturing at commercially reasonable costs or at all. In addition, the manufacture or shipment of our products may be delayed or interrupted if the quality of the products, sub-assemblies, components, or materials supplied by our vendors does not meet our requirements. Current or future social and environmental regulations or critical issues, such as those relating to the sourcing of conflict minerals from the Democratic Republic of the Congo or the need to eliminate environmentally sensitive materials from our products, could restrict the supply of components and materials used in production or increase our costs. Any delay or interruption to our manufacturing process or in shipping our products could result in lost revenue, which would adversely affect our business, financial condition, or results of operations.
If defects are discovered in our products, we may incur additional unforeseen costs, our products may be subject to recalls, customers may not purchase our products, our reputation may suffer, and ultimately our sales and operating earnings could be negatively impacted.
Our products incorporate complex, precision-manufactured mechanical parts, electrical components, optical components, and fluidics, as well as computer software, any of which may contain errors or failures, especially when first introduced. In the course of conducting our business, we must adequately address quality issues associated with our products and services, including defects in our engineering, design, and manufacturing processes, as well as defects in third-party components included in our products. In addition, new products or enhancements may contain undetected errors or performance problems that, despite testing, are discovered only after commercial shipment. Defects or errors in our products may discourage customers from purchasing our products. The costs incurred in correcting any defects or errors may be substantial and could adversely affect our operating margins. Identifying the root cause of quality issues, particularly those affecting reagents and third-party components, may be difficult, which increases the time needed to address quality issues as they arise, and increases the risk that similar problems could recur. Because our products are designed to be used to perform complex genomic analysis, we expect that our customers will have an increased sensitivity to such defects. If we do not meet applicable regulatory or quality standards, our products may be subject to recall, and, under certain circumstances, we may be required to notify applicable regulatory authorities about a recall. If our products are subject to recall or shipment holds, our reputation, business, financial condition, or results of operations could be adversely affected.
As we develop, market, or sell diagnostic tests, we may encounter delays in receipt, or limits in the amount, of reimbursement approvals and public health funding, which will impact our ability to grow revenues in the healthcare market.
Physicians and patients may not order diagnostic tests that we develop, market, sell, or enable such as our prenatal tests, unless third-party payors, such as managed care organizations as well as government payors such as Medicare and Medicaid and governmental payors outside of the United States, pay a substantial portion of the test price. Third-party payors are often reluctant to reimburse healthcare providers for the use of medical tests that involve new technologies or provide novel diagnostic information. In addition, third-party payors are increasingly limiting reimbursement coverage for medical diagnostic products and, in many instances, are exerting pressure on diagnostic product suppliers to reduce their prices. Reimbursement by a payor may depend on a number of factors, including a payor's determination that tests using our technologies are:
• | not experimental or investigational; |
• | medically necessary; |
• | appropriate for the specific patient; |
• | cost-effective; |
• | supported by peer-reviewed publications; and |
• | included in clinical practice guidelines. |
Since each third-party payor often makes reimbursement decisions on an individual patient basis, obtaining such approvals is a time-consuming and costly process that requires us to provide scientific and clinical data supporting the clinical benefits of each of our products. As a result, there can be no assurance that reimbursement approvals will be obtained. This process can delay the broad market introduction of new products, and could have a negative effect on our results of operations. As a result, third-party reimbursement may not be consistent or financially adequate to cover the cost of diagnostic products that we develop, market, or sell. This could limit our ability to sell our products or cause us to reduce prices, which would adversely affect our results of operations.
13
Even if our tests are being reimbursed, third-party payors may withdraw their coverage policies, cancel their contracts with our customers at any time, review and adjust the rate of reimbursement, require co-payments from patients, or stop paying for our tests, which would reduce our revenues. In addition, insurers, including managed care organizations as well as government payors such as Medicare and Medicaid, have increased their efforts to control the cost, utilization, and delivery of healthcare services. These measures have resulted in reduced payment rates and decreased utilization for the clinical laboratory industry. Reductions in the reimbursement rate of payors may occur in the future. Reductions in the prices at which our tests are reimbursed could have a negative impact on our results of operations.
Litigation, other proceedings, or third-party claims of intellectual property infringement could require us to spend significant time and money and could prevent us from selling our products or services.
Our success depends in part on our non-infringement of the patents or proprietary rights of third parties. Third parties have asserted and may in the future assert that we are employing their proprietary technology without authorization. As we enter new markets or introduce new products, we expect that competitors will likely claim that our products infringe their intellectual property rights as part of a business strategy to impede our successful competition. In addition, third parties may have obtained and may in the future obtain patents allowing them to claim that the use of our technologies infringes these patents. We could incur substantial costs and divert the attention of our management and technical personnel in defending ourselves against any of these claims. Any adverse ruling or perception of an adverse ruling in defending ourselves against these claims could have an adverse impact on our stock price, which may be disproportionate to the actual impact of the ruling itself. Furthermore, parties making claims against us may be able to obtain injunctive or other relief, which effectively could block our ability to develop further, commercialize, or sell products or services, and could result in the award of substantial damages against us. In the event of a successful infringement claim against us, we may be required to pay damages and obtain one or more licenses from third parties or be prohibited from selling certain products or services. In addition, we may be unable to obtain these licenses at a reasonable cost, if at all. We could therefore incur substantial costs related to royalty payments for licenses obtained from third parties, which could negatively affect our gross margins and earnings per share. In addition, we could encounter delays in product introductions while we attempt to develop alternative methods or products. Defense of any lawsuit or failure to obtain any of these licenses on favorable terms could prevent us from commercializing products, and the prohibition of sale of any of our products or services could adversely affect our ability to grow or maintain profitability.
Reduction or delay in research and development budgets and government funding may adversely affect our revenue.
The timing and amount of revenues from customers that rely on government and academic research funding may vary significantly due to factors that can be difficult to forecast, and there remains significant uncertainty concerning government and academic research funding worldwide. Funding for life science research has increased more slowly during the past several years compared to previous years and has declined in some countries. Government funding of research and development is subject to the political process, which is inherently fluid and unpredictable. Other programs, such as defense, entitlement programs, or general efforts to reduce budget deficits could be viewed by governments as a higher priority. These budgetary pressures may result in reduced allocations to government agencies that fund research and development activities, such as the U.S. National Institute of Health, or NIH. Past proposals to reduce budget deficits have included reduced NIH and other research and development allocations. Any shift away from the funding of life sciences research and development or delays surrounding the approval of government budget proposals may cause our customers to delay or forego purchases of our products, which could adversely affect our business, financial condition, or results of operations.
Our acquisitions expose us to risks that could adversely affect our business, and we may not achieve the anticipated benefits of acquisitions of businesses or technologies.
As part of our strategy to develop and identify new products, services, and technologies, we have made, and may continue to make, acquisitions of technologies, products, or businesses. Acquisitions involve numerous risks and operational, financial, and managerial challenges, including the following, any of which could adversely affect our business, financial condition, or results of operations:
• | difficulties in integrating new operations, technologies, products, and personnel; |
• | lack of synergies or the inability to realize expected synergies and cost-savings; |
• | difficulties in managing geographically dispersed operations; |
14
• | underperformance of any acquired technology, product, or business relative to our expectations and the price we paid; |
• | negative near-term impacts on financial results after an acquisition, including acquisition-related earnings charges; |
• | the potential loss of key employees, customers, and strategic partners of acquired companies; |
• | claims by terminated employees and shareholders of acquired companies or other third parties related to the transaction; |
• | the issuance of dilutive securities, assumption or incurrence of additional debt obligations or expenses, or use of substantial portions of our cash; |
• | diversion of management’s attention and company resources from existing operations of the business; |
• | inconsistencies in standards, controls, procedures, and policies; |
• | the impairment of intangible assets as a result of technological advancements, or worse-than-expected performance of acquired companies; and |
• | assumption of, or exposure to, known or unknown contingent liabilities or liabilities that are difficult to identify or accurately quantify. |
In addition, the successful integration of acquired businesses requires significant efforts and expense across all operational areas, including sales and marketing, research and development, manufacturing, finance, legal, and information technologies. There can be no assurance that any of the acquisitions we make will be successful or will be, or will remain, profitable. Our failure to successfully address the above risks may prevent us from achieving the anticipated benefits from any acquisition in a reasonable time frame, or at all.
If we are unable to increase our manufacturing or service capacity and develop and maintain operation of our manufacturing or service capability, we may not be able to launch or support our products or services in a timely manner, or at all.
We continue to increase our manufacturing and service capacity to meet the anticipated demand for our products. Although we have significantly increased our manufacturing and service capacity and we believe we have plans in place sufficient to ensure we have adequate capacity to meet our current business plans, there are uncertainties inherent in expanding our manufacturing and service capabilities, and we may not be able to sufficiently increase our capacity in a timely manner. For example, manufacturing and product quality issues may arise as we increase production rates at our manufacturing facilities and launch new products. Also, we may not manufacture the right product mix to meet customer demand, especially as we introduce new products. As a result, we may experience difficulties in meeting customer, collaborator, and internal demand, in which case we could lose customers or be required to delay new product introductions, and demand for our products could decline. Additionally, in the past, we have experienced variations in manufacturing conditions and quality control issues that have temporarily reduced or suspended production of certain products. Due to the intricate nature of manufacturing complex instruments, consumables, and products that contain DNA and enzymes, we may encounter similar or previously unknown manufacturing difficulties in the future that could significantly reduce production yields, impact our ability to launch or sell these products (or to produce them economically), or prevent us from achieving expected performance levels, any of which could adversely affect our business, financial condition, or results of operations.
An interruption in our ability to manufacture our products or an inability to obtain key components or raw materials due to a catastrophic disaster or infrastructure could adversely affect our business.
We currently manufacture in a limited number of locations. Our manufacturing facilities are located in San Diego and the San Francisco Bay Area in California; Madison, Wisconsin; and Singapore. These areas are subject to natural disasters such as earthquakes, wildfires, or floods. If a natural disaster were to damage one of our facilities significantly or if other events were to cause our operations to fail, we may be unable to manufacture our products, provide our services, or develop new products. In addition, if the capabilities of our suppliers and component manufacturers are limited or stopped, due to disasters, quality, regulatory, or other reasons, it could negatively impact our ability to manufacture our products.
Many of our manufacturing processes are automated and are controlled by our custom-designed laboratory information management system (LIMS). Additionally, the decoding process in our array manufacturing requires significant network and
15
storage infrastructure. If either our LIMS system or our networks or storage infrastructure were to fail for an extended period of time, our ability to manufacture our products on a timely basis could be adversely impacted and we could be prevented from achieving our expected shipments in any given period.
If we lose our key personnel or are unable to attract and retain additional personnel, we may be unable to achieve our goals.
Our future success depends upon the continuing services of members of our senior management team and scientific and engineering personnel. The loss of their services could adversely impact our ability to achieve our business objectives. In addition, the continued growth of our business depends on our ability to hire additional qualified personnel with expertise in molecular biology, chemistry, biological information processing, software, engineering, sales, marketing, and technical support. We compete for qualified management and scientific personnel with other life science and technology companies, universities, and research institutions. Competition for these individuals, particularly in the San Diego and San Francisco areas, is intense, and the turnover rate can be high. Moreover, changes in immigration policies, laws and regulations in the United States or other jurisdictions may make it more difficult for us to hire and retain members of management and scientific and engineering personnel. Failure to attract and retain management and scientific and engineering personnel could prevent us from pursuing collaborations or developing our products or technologies. Additionally, integration of acquired companies and businesses can be disruptive, causing key employees of the acquired business to leave. Further, we use share-based compensation, including restricted stock units and performance stock units to attract key personnel, incentivize them to remain with us, and align their interests with ours by building long-term stockholder value. If our stock price decreases, the value of these equity awards decreases and, therefore, reduces a key employee’s incentive to stay.
Any inability to effectively protect our proprietary technologies could harm our competitive position.
The proprietary positions of companies developing tools for the life sciences, genomics, forensics, agricultural, and pharmaceutical industries, including our proprietary position, generally are uncertain and involve complex legal and factual questions. Our success depends to a large extent on our ability to develop proprietary products and technologies and to obtain patents and maintain adequate protection of our intellectual property in the United States and other countries. The laws of some foreign countries do not protect proprietary rights to the same extent as the laws of the United States, and many companies have encountered significant challenges in establishing and enforcing their proprietary rights outside of the United States. These challenges can be caused by the absence of rules and methods for the establishment and enforcement of intellectual property rights outside of the United States.
We will be able to protect our proprietary rights from unauthorized use by third parties only to the extent that our proprietary technologies are covered by valid and enforceable patents or are effectively maintained as trade secrets. Any finding that our patents or applications are unenforceable could harm our ability to prevent others from practicing the related technology, and a finding that others have inventorship or ownership rights to our patents and applications could require us to obtain certain rights to practice related technologies, which may not be available on favorable terms, if at all. Furthermore, as issued patents expire, we may lose some competitive advantage as others develop competing products, and, as a result, we may lose revenue.
In addition, our existing patents and any future patents we obtain may not be sufficiently broad to prevent others from practicing our technologies or from developing competing products and may therefore fail to provide us with any competitive advantage. We may need to initiate lawsuits to protect or enforce our patents, or litigate against third-party claims, which would be expensive, and, if we lose, may cause us to lose some of our intellectual property rights and reduce our ability to compete in the marketplace. Furthermore, these lawsuits may divert the attention of our management and technical personnel. There is also the risk that others may independently develop similar or alternative technologies or design around our patented technologies. In that regard, certain patent applications in the United States may be maintained in secrecy until the patents issue, and publication of discoveries in the scientific or patent literature tend to lag behind actual discoveries by several months.
We also rely upon trade secrets and proprietary know-how protection for our confidential and proprietary information, and we have taken security measures to protect this information. These measures, however, may not provide adequate protection for our trade secrets, know-how, or other confidential information.
Our strategic investments and joint ventures may result in losses.
We periodically make strategic investments in various public and private companies with businesses or technologies that may complement our business. In addition, we periodically form companies, such as Helix, that remain consolidated within our financial statements but receive substantial funding from third-party investors who are granted certain control and
16
governance rights. The market values of these strategic investments may fluctuate due to market conditions and other conditions over which we have no control. Other-than-temporary declines in the market price and valuations of the securities that we hold in other companies would require us to record losses related to our investment. This could result in future charges to our earnings. It is uncertain whether or not we will realize any long-term benefits associated with these strategic investments.
Security breaches, including with respect to cyber-security, and other disruptions could compromise our information, products, and services and expose us to liability, which could cause our business and reputation to suffer.
In the ordinary course of our business, we collect and store sensitive data, including intellectual property, our proprietary business information (and that of our customers), and personally identifiable information of our customers and employees, in our data centers and on our networks. The secure maintenance of this information is important to our operations and business strategy. Despite our security measures, our information technology and infrastructure may be vulnerable to cyber-attacks by hackers or breached due to employee error, malfeasance, or other disruptions. As a leader in the field of genetic analysis, we may face cyber-attacks that attempt to penetrate our network security, including our data centers; sabotage or otherwise disable our research, products, and services, including instruments at our customers’ sites; misappropriate our or our customers' and partners' proprietary information, which may include personally identifiable information; or cause interruptions of our internal systems and services. Any such breach could compromise our networks and the information stored there could be accessed, publicly disclosed, lost, or stolen. Any such access, disclosure, or other loss of information could result in legal claims or proceedings, liability under laws that protect the privacy of personal information, and damage to our reputation.
Our products, if used for the diagnosis of disease, could be subject to government regulation, and the regulatory approval and maintenance process for such products may be expensive, time-consuming, and uncertain both in timing and in outcome.
Our products are not subject to FDA clearance or approval if they are not intended to be used for the diagnosis, treatment or prevention of disease. However, as we expand our product line to encompass products that are intended to be used for the diagnosis of disease, such as our FDA-regulated MiSeqDx, certain of our products will become subject to regulation by the FDA, or comparable international agencies, including requirements for regulatory clearance or approval of such products before they can be marketed. Such regulatory approval processes or clearances may be expensive, time-consuming, and uncertain, and our failure to obtain or comply with such approvals and clearances could have an adverse effect on our business, financial condition, or operating results. In addition, changes to the current regulatory framework, including the imposition of additional or new regulations, could arise at any time during the development or marketing of our products, which may negatively affect our ability to obtain or maintain FDA or comparable regulatory approval of our products, if required.
Molecular diagnostic products are regulated as medical devices by the FDA and comparable international agencies and may require either clearance from the FDA following the 510(k) pre-market notification process or premarket approval from the FDA, in each case prior to marketing. Obtaining the requisite regulatory approvals can be expensive and may involve considerable delay. If we fail to obtain, or experience significant delays in obtaining, regulatory approvals for molecular diagnostic products that we develop, we may not be able to launch or successfully commercialize such products in a timely manner, or at all.
In addition, if our products labeled as “For Research Use Only. Not for use in diagnostic procedures,” or RUO, are used, or could be used, for the diagnosis of disease, the regulatory requirements related to marketing, selling, and supporting such products could change or be uncertain, even if such use by our customers is without our consent. If the FDA or other regulatory authorities assert that any of our RUO products are subject to regulatory clearance or approval, our business, financial condition, or results of operations could be adversely affected.
If the FDA requires in the future that any of our LDT products be subject to regulatory clearance or approval, our business, financial condition, or results of operations could be adversely affected.
Certain of our diagnostic products are currently available through laboratories that are certified under the Clinical Laboratory Improvements Amendments (CLIA) of 1988. These products are commonly called “laboratory developed tests,” or LDTs. For a number of years, the FDA has exercised its regulatory enforcement discretion not to regulate LDTs as medical devices if created and used within a single laboratory. However, the FDA has been reconsidering its enforcement discretion policy and has commented that regulation of LDTs may be warranted because of the growth in the volume and complexity of testing services utilizing LDTs. In October 2014, the FDA published two draft guidance documents suggesting an approach for registration and listing of laboratories and assays along with a framework for regulation of LDTs by the FDA based on risk to patients rather than whether the LDTs were made by a conventional manufacturer or a single laboratory. The draft framework
17
guidance includes pre-market review for higher-risk LDTs, including many used to guide treatment decisions, as well as companion diagnostics that have entered the market as LDTs. We cannot predict the nature or extent of the FDA's final guidance or regulation of LDTs, in general, or with respect to our LDTs, in particular. If the FDA requires in the future that LDT products are subject to regulatory clearance or approval, our business, financial condition, or results of operations could be adversely affected.
If product or service liability lawsuits are successfully brought against us, we may face reduced demand for our products and incur significant liabilities.
Our products and services are used for sensitive applications, and we face an inherent risk of exposure to product or service liability claims if our products or services are alleged to have caused harm, resulted in false negatives or false positives, or do not perform in accordance with specifications. Product liability claims filed against us or against third parties to whom we may have an obligation could be costly and time-consuming to defend and result in substantial damages or reputational risk. We cannot be certain that we would be able to successfully defend any product or service liability lawsuit brought against us. Regardless of merit or eventual outcome, product or service liability claims may result in:
• | decreased demand for our products; |
• | injury to our reputation; |
• | increased product liability insurance costs; |
• | costs of related litigation; and |
• | substantial monetary awards to plaintiffs. |
Although we carry product and service liability insurance, if we become the subject of a successful product or service liability lawsuit, our insurance may not cover all substantial liabilities, which could have an adverse effect on our business, financial condition, or results of operations.
Doing business internationally creates operational and financial risks for our business.
Conducting and launching operations on an international scale requires close coordination of activities across multiple jurisdictions and time zones and consumes significant management resources. If we fail to coordinate and manage these activities effectively, including the risks noted below, our business, financial condition, or results of operations could be adversely affected. We have sales offices located internationally throughout Europe, the Asia-Pacific region, and Brazil, as well as manufacturing facilities in Singapore. Shipments to customers outside the United States comprised 45%, 46%, and 46% of our total revenue for fiscal years 2017, 2016, and 2015, respectively.
During 2017, a significant portion of our international sales were denominated in foreign currencies while the majority of our purchases of raw materials were denominated in U.S. dollars. Changes in the value of the relevant currencies may affect the cost of certain items required in our operations. Changes in currency exchange rates may also affect the relative prices at which we are able sell products in the same market. Our revenues from international customers may be negatively impacted as increases in the U.S. dollar relative to our international customers local currency could make our products more expensive, impacting our ability to compete. Our costs of materials from international suppliers may increase if, in order to continue doing business with us, they raise their prices as the value of the U.S. dollar decreases relative to their local currency. Foreign policies and actions regarding currency valuation could result in actions by the United States and other countries to offset the effects of such fluctuations. Recent global financial conditions have led to a high level of volatility in foreign currency exchange rates and that level of volatility may continue, which could adversely affect our business, financial condition, or results of operations.
In addition to the foregoing risks, international operations entail the following risks:
• | longer payment cycles and difficulties in collecting accounts receivable outside of the United States; |
• | longer sales cycles due to the volume of transactions taking place through public tenders; |
• | challenges in staffing and managing foreign operations; |
• | tariffs and other trade barriers; |
18
• | unexpected changes in legislative or regulatory requirements of foreign countries into which we sell our products; |
• | difficulties in obtaining export licenses or in overcoming other trade barriers and restrictions resulting in delivery delays; and |
• | significant taxes or other burdens of complying with a variety of foreign laws. |
Additionally, we must comply with complex foreign and U.S. laws and regulations, such as the U.S. Foreign Corrupt Practices Act, the U.K. Bribery Act, and other local laws prohibiting corrupt payments to governmental officials, anti-competition regulations and sanctions imposed by the U.S. Office of Foreign Assets Control and other similar laws and regulations. Violations of these laws and regulations could result in fines and penalties, criminal sanctions, restrictions on our business conduct and on our ability to offer our products in one or more countries, and could also materially affect our brand, our ability to attract and retain employees, our international operations, our business and our operating results. Although we have implemented policies and procedures designed to ensure compliance with these laws and regulations, there can be no assurance that our employees, contractors, or agents will not violate our policies.
We are subject to risks related to taxation in multiple jurisdictions.
We are subject to income taxes in both the United States and numerous foreign jurisdictions. Significant judgments based on interpretations of existing tax laws or regulations are required in determining the provision for income taxes. Our effective income tax rate could be adversely affected by various factors, including, but not limited to, changes in the mix of earnings in tax jurisdictions with different statutory tax rates, changes in the valuation of deferred tax assets and liabilities, changes in existing tax policies, laws, regulations, or rates, changes in the level of non-deductible expenses (including share-based compensation), location of operations, changes in our future levels of research and development spending, mergers and acquisitions, or the result of examinations by various tax authorities. Although we believe our tax estimates are reasonable, if the U.S. Internal Revenue Service or other taxing authority disagrees with the positions taken on our tax returns, we could have additional tax liability, including interest and penalties. If material, payment of such additional amounts upon final adjudication of any disputes could have a material impact on our results of operations and financial position.
Our operating results may vary significantly from period to period, and we may not be able to sustain operating profitability.
Our revenue is subject to fluctuations due to the timing of sales of high-value products and services, the effects of new product launches and related promotions, the timing and availability of our customers’ funding, the impact of seasonal spending patterns, the timing and size of research projects our customers perform, changes in overall spending levels in the life sciences industry, and other unpredictable factors that may affect customer ordering patterns. Given the difficulty in predicting the timing and magnitude of sales for our products and services, we may experience quarter-to-quarter fluctuations in revenue resulting in the potential for a sequential decline in quarterly revenue. While we anticipate future growth, there is some uncertainty as to the timing of revenue recognition on a quarterly basis. This is because a substantial portion of our quarterly revenue is typically recognized in the last month of a quarter and because the pattern for revenue generation during that month is normally not linear, with a concentration of orders in the final weeks of the quarter. In light of that, our revenue cut-off and recognition procedures, together with our manufacturing and shipping operations, may experience increased pressure and demand during the time period shortly before the end of a fiscal quarter.
A large portion of our expenses are relatively fixed, including expenses for facilities, equipment, and personnel. To meet the anticipated growth in our business, we may incur fixed expenses, such as costs related to facility expansions, before we generate revenue sufficient to fully support such expenses. In addition, we expect operating expenses to continue to increase significantly in absolute dollars, and we expect that our research and development and selling and marketing expenses will increase at a higher rate in the future as a result of the development and launch of new products. Accordingly, our ability to sustain profitability will depend in part on the rate of growth, if any, of our revenue and on the level of our expenses, and if revenue does not grow as anticipated, we may not be able to maintain annual or quarterly profitability. Any significant delays in the commercial launch of our products, unfavorable sales trends in our existing product lines, or impacts from the other factors mentioned above, could adversely affect our future revenue growth or cause a sequential decline in quarterly revenue. In addition, non-cash share-based compensation expense and expenses related to prior and future acquisitions are also likely to continue to adversely affect our future profitability. Due to the possibility of significant fluctuations in our revenue and expenses, particularly from quarter to quarter, we believe that quarterly comparisons of our operating results are not a good indication of our future performance. If our operating results fluctuate or do not meet the expectations of stock market analysts and investors, our stock price could decline.
19
From time to time, we receive large orders that have a significant effect on our operating results in the period in which the order is recognized as revenue. The timing of such orders is difficult to predict, and the timing of revenue recognition from such orders may affect period-to-period changes in net sales. As a result, our operating results could vary materially from quarter to quarter based on the receipt of such orders and their ultimate recognition as revenue.
We may not be able to convert our order backlog into revenue.
Our backlog consists of orders believed to be firm as of the balance sheet date. However, we may allow customers to make product substitutions as we launch new products. We may not receive revenue from some of these orders, and the order backlog we report may not be indicative of our future revenue. Many events can cause an order to be delayed or not completed at all, some of which may be out of our control. If we delay fulfilling customer orders, or if customers reconsider their orders, those customers may seek to cancel or modify their orders with us. Customers may otherwise seek to cancel or delay their orders even if we are prepared to fulfill them. If our orders in backlog do not result in sales, our operating results may suffer.
Disruption of critical information technology systems or material breaches in the security of our systems could have an adverse effect on our operations, business, customer relations, and financial condition.
Information technology (IT) systems help us operate efficiently, interface with customers, maintain financial accuracy and efficiency, and accurately produce our financial statements. IT systems are used extensively in virtually all aspects of our business, including product manufacturing and supply chain, sales forecast, order fulfillment and billing, customer service, logistics, and management of financial reports and data. Our success depends, in part, on the continued and uninterrupted performance of our IT systems. IT systems may be vulnerable to damage from a variety of sources, including telecommunications or network failures, power loss, natural disasters, human acts, terrorist attacks, computer viruses, computer denial-of-service attacks, unauthorized access to customer or employee data or company trade secrets, and other attempts to harm our systems. Certain of our systems are not redundant, and our disaster recovery planning is not sufficient for every eventuality. Despite any precautions we may take, such problems could result in, among other consequences, disruption of our operations, which could harm our reputation and financial results.
If we do not allocate and effectively manage the resources necessary to build and sustain the proper IT infrastructure, we could be subject to transaction errors, processing inefficiencies, the loss of customers, business disruptions, or the loss of or damage to intellectual property through security breach. If our data management systems do not effectively collect, store, process, and report relevant data for the operation of our business, whether due to equipment malfunction or constraints, software deficiencies, or human error, our ability to effectively plan, forecast, and execute our business plan and comply with applicable laws and regulations will be impaired. Any such impairment could adversely affect our reputation, financial condition, results of operations, cash flows, and the timeliness with which we report our internal and external operating results.
As we continuously adjust our work-flow and business practices and add additional functionality to our enterprise resource planning software and other software applications, problems could arise that we have not foreseen, including interruptions in service, loss of data, or reduced functionality. Such problems could adversely impact our ability to provide quotes, take customer orders, and otherwise run our business in a timely manner. In addition, if our new systems fail to provide accurate and increased visibility into pricing and cost structures, it may be difficult to improve or maximize our profit margins. As a result, our results of operations and cash flows could be adversely affected.
Changes in accounting standards and subjective assumptions, estimates, and judgments by management related to complex accounting matters could significantly affect our financial results or financial condition.
Generally accepted accounting principles and related accounting pronouncements, implementation guidelines, and interpretations with regard to a wide range of matters that are relevant to our business, such as revenue recognition, asset impairment and fair value determinations, inventories, business combinations and intangible asset valuations, and litigation, are highly complex and involve many subjective assumptions, estimates, and judgments. In particular, accounting rules related to companies that we form together with, or that receive substantial funding from, third-party investors, such as Helix, are highly complex and involve many subjective assumptions, estimates, and judgments. Changes in these rules or their interpretation or changes in underlying assumptions, estimates, or judgments could significantly change our reported or expected financial performance or financial condition.
20
Ethical, legal, and social concerns related to the use of genetic information could reduce demand for our products or services.
Our products may be used to provide genetic information about humans, agricultural crops, other food sources, and other living organisms. The information obtained from our products could be used in a variety of applications, which may have underlying ethical, legal, and social concerns regarding privacy and the appropriate uses of the resulting information, including preimplantation genetic screening of embryos, prenatal genetic testing, genetic engineering or modification of agricultural products, or testing genetic predisposition for certain medical conditions, particularly for those that have no known cure. Governmental authorities could, for social or other purposes, call for limits on or regulation of the use of genetic testing or prohibit testing for genetic predisposition to certain conditions, particularly for those that have no known cure. Similarly, such concerns may lead individuals to refuse to use genetics tests, even if permissible. These and other ethical, legal, and social concerns about genetic testing may limit market acceptance of our technology for certain applications or reduce the potential markets for our technology, either of which could have an adverse effect on our business, financial condition, or results of operations.
Conversion of our outstanding convertible notes may result in losses.
As of December 31, 2017, we had $633 million aggregate principal amount of convertible notes due 2019, and $517 million aggregate principal amount of convertible notes due 2021 outstanding. The notes are convertible into cash, and if applicable, shares of our common stock under certain circumstances, including trading price conditions related to our common stock. Upon conversion, we are required to record a gain or loss for the difference between the fair value of the notes to be extinguished and their corresponding net carrying value. The fair value of the notes to be extinguished depends on our current incremental borrowing rate. The net carrying value of our notes has an implicit interest rate of 2.9% with respect to convertible notes due 2019, and 3.5% with respect to convertible notes due 2021. If our incremental borrowing rate at the time of conversion is lower than the implied interest rate of the notes, we will record a loss in our consolidated statement of income during the period in which the notes are converted.
Our Certificate of Incorporation and Bylaws include anti-takeover provisions that may make it difficult for another company to acquire control of us or limit the price investors might be willing to pay for our stock.
Certain provisions of our Certificate of Incorporation and Bylaws could delay the removal of incumbent directors and could make it more difficult to successfully complete a merger, tender offer, or proxy contest involving us. Our Certificate of Incorporation has provisions that give our Board the ability to issue preferred stock and determine the rights and designations of the preferred stock at any time without stockholder approval. The rights of the holders of our common stock will be subject to, and may be adversely affected by, the rights of the holders of any preferred stock that may be issued in the future. The issuance of preferred stock, while providing flexibility in connection with possible acquisitions and other corporate purposes, could have the effect of making it more difficult for a third party to acquire, or of discouraging a third party from acquiring, a majority of our outstanding voting stock. In addition, the staggered terms of our board of directors could have the effect of delaying or deferring a change in control.
In addition, certain provisions of the Delaware General Corporation Law (DGCL), including Section 203 of the DGCL, may have the effect of delaying or preventing changes in the control or management of Illumina. Section 203 of the DGCL provides, with certain exceptions, for waiting periods applicable to business combinations with stockholders owning at least 15% and less than 85% of the voting stock (exclusive of stock held by directors, officers, and employee plans) of a company.
The above factors may have the effect of deterring hostile takeovers or otherwise delaying or preventing changes in the control or management of Illumina, including transactions in which our stockholders might otherwise receive a premium over the fair market value of our common stock.
ITEM 1B. | Unresolved Staff Comments. |
None.
21
ITEM 2. | Properties. |
The following table summarizes the facilities we lease as of December 31, 2017, including the location and size of each principal facility, and their designated use. We believe our facilities are adequate for our current and near-term needs, and will be able to locate additional facilities as needed.
Location | Approximate Square Feet | Operation | Lease Expiration Dates | |||||
San Diego, CA | 1,218,000 | R&D, Manufacturing, Warehouse, Distribution, and Administrative | 2018 – 2031 | |||||
San Francisco Bay Area, CA | 616,000 | R&D, Manufacturing, Warehouse, and Administrative | 2018 – 2025 | |||||
Singapore | 395,000 | R&D, Manufacturing, Warehouse, Distribution, and Administrative | 2018 – 2025 | |||||
Cambridge, United Kingdom* | 92,000 | R&D, Manufacturing, and Administrative | 2020 – 2024 | |||||
Eindhoven, the Netherlands | 42,000 | Distribution and Administrative | 2020 | |||||
Madison, WI* | 73,000 | R&D, Manufacturing, Warehouse, Distribution, and Administrative | 2018 – 2019 | |||||
Other* | 78,000 | Administrative | 2018 – 2022 | |||||
*Excludes approximately 309,000 square feet for which the leases do not commence until 2018 and beyond.
ITEM 3. | Legal Proceedings. |
We are involved in various lawsuits and claims arising in the ordinary course of business, including actions with respect to intellectual property, employment, and contractual matters. In connection with these matters, we assess, on a regular basis, the probability and range of possible loss based on the developments in these matters. A liability is recorded in the financial statements if it is believed to be probable that a loss has been incurred and the amount of the loss can be reasonably estimated. Because litigation is inherently unpredictable and unfavorable results could occur, assessing contingencies is highly subjective and requires judgments about future events. We regularly review outstanding legal matters to determine the adequacy of the liabilities accrued and related disclosures. The amount of ultimate loss may differ from these estimates. Each matter presents its own unique circumstances, and prior litigation does not necessarily provide a reliable basis on which to predict the outcome, or range of outcomes, in any individual proceeding. Because of the uncertainties related to the occurrence, amount, and range of loss on any pending litigation or claim, we are currently unable to predict their ultimate outcome, and, with respect to any pending litigation or claim where no liability has been accrued, to make a meaningful estimate of the reasonably possible loss or range of loss that could result from an unfavorable outcome. In the event opposing litigants in outstanding litigations or claims ultimately succeed at trial and any subsequent appeals on their claims, any potential loss or charges in excess of any established accruals, individually or in the aggregate, could have a material adverse effect on our business, financial condition, results of operations, and/or cash flows in the period in which the unfavorable outcome occurs or becomes probable, and potentially in future periods.
ITEM 4. | Mine Safety Disclosures. |
Not applicable.
22
PART II
ITEM 5. | Market for Registrant’s Common Equity, Related Stockholder Matters and Issuer Purchases of Equity Securities. |
Market Information
Our common stock has been quoted on The NASDAQ Global Select Market under the symbol “ILMN” since July 28, 2000. Prior to that time, there was no public market for our common stock. The following table sets forth, for the fiscal periods indicated, the quarterly high and low sales prices per share of our common stock as reported on The NASDAQ Global Select Market.
2017 | 2016 | ||||||||||||||
High | Low | High | Low | ||||||||||||
First Quarter | $ | 174.32 | $ | 128.16 | $ | 188.25 | $ | 130.37 | |||||||
Second Quarter | $ | 189.48 | $ | 167.16 | $ | 178.77 | $ | 127.10 | |||||||
Third Quarter | $ | 214.34 | $ | 167.98 | $ | 182.67 | $ | 132.65 | |||||||
Fourth Quarter | $ | 230.72 | $ | 198.21 | $ | 186.88 | $ | 119.37 | |||||||
Stock Performance Graph
The graph below compares the cumulative total stockholder returns on our common stock for the last five fiscal years with the cumulative total stockholder returns on the NASDAQ Composite Index, the NASDAQ Biotechnology Index, and the S&P 500 Index for the same period. The graph assumes that $100 was invested on December 30, 2012 in our common stock and in each index and that all dividends were reinvested. No cash dividends have been declared on our common stock. Stockholder returns over the indicated period should not be considered indicative of future stockholder returns.
Compare 5-Year Cumulative Total Return among Illumina, NASDAQ Composite Index,
NASDAQ Biotechnology Index, and S&P 500 Index
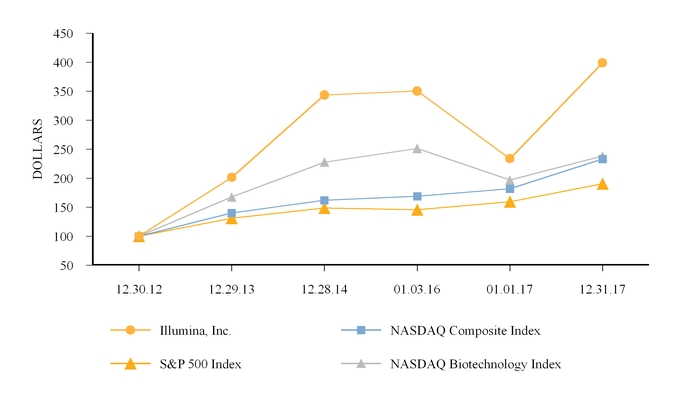
23
Holders
As of February 9, 2018, we had 163 record holders of our common stock.
Dividends
We have never paid cash dividends and have no present intention to pay cash dividends in the foreseeable future. The indentures for our 0% convertible senior notes due 2019 and 0.5% convertible senior notes due in 2021, which notes are convertible into cash and, in certain circumstances, shares of our common stock, require us to increase the conversion rate applicable to the notes if we pay any cash dividends.
Purchases of Equity Securities by the Issuer
On May 4, 2017, our Board of Directors authorized a share repurchase program to repurchase $250 million of outstanding common stock. The repurchases may be completed under a 10b5-1 plan or at management’s discretion. The following table summarizes shares repurchased pursuant to this program during the three months ended December 31, 2017 (in thousands except for price per share):
Period | Total Number of Shares Purchased (1) | Average Price Paid per Share | Total Number of Shares Purchased as Part of Publicly Announced Programs | Approximate Dollar Value of Shares that May Yet Be Purchased Under the Programs | |||||||||
October 2, 2017 - October 29, 2017 | 368 | $ | 203.99 | 368 | $ | 100,000 | |||||||
October 30, 2017 - November 26, 2017 | — | — | — | $ | 100,000 | ||||||||
November 27, 2017 - December 31, 2017 | — | — | — | $ | 100,000 | ||||||||
Total | 368 | $ | 203.99 | 368 | $ | 100,000 | |||||||
___________
(1) All shares purchased during the three months ended December 31, 2017, were made in open-market transactions under a 10b5-1 plan.
Sales of Unregistered Securities
None during the fiscal quarter ended December 31, 2017.
24
ITEM 6. | Selected Financial Data. |
The following table sets forth selected historical consolidated financial data for each of our last five fiscal years during the period ended December 31, 2017. This information should be read in conjunction with the consolidated financial statements and notes thereto included in in Part II, Item 8 of this report.
Statement of Income Data
Years Ended | |||||||||||||||||||
December 31, 2017 (52 weeks) | January 1, 2017 (52 weeks) | January 3, 2016 (53 weeks) | December 28, 2014 (52 weeks) | December 29, 2013 (52 weeks) | |||||||||||||||
(In millions, except per share data) | |||||||||||||||||||
Total revenue | $ | 2,752 | $ | 2,398 | $ | 2,220 | $ | 1,861 | $ | 1,421 | |||||||||
Income from operations | $ | 606 | $ | 587 | $ | 613 | $ | 515 | $ | 134 | |||||||||
Consolidated net income | $ | 678 | $ | 428 | $ | 458 | $ | 353 | $ | 125 | |||||||||
Net income attributable to Illumina stockholders | $ | 726 | $ | 463 | $ | 462 | $ | 353 | $ | 125 | |||||||||
Net income attributable to Illumina stockholders for earnings per share | $ | 725 | $ | 454 | $ | 462 | $ | 353 | $ | 125 | |||||||||
Earnings per share attributable to Illumina stockholders: | |||||||||||||||||||
Basic | $ | 4.96 | $ | 3.09 | $ | 3.19 | $ | 2.61 | $ | 1.00 | |||||||||
Diluted | $ | 4.92 | $ | 3.07 | $ | 3.10 | $ | 2.37 | $ | 0.90 | |||||||||
Shares used in calculating earnings per share: | |||||||||||||||||||
Basic | 146 | 147 | 145 | 136 | 125 | ||||||||||||||
Diluted | 148 | 148 | 149 | 149 | 140 | ||||||||||||||
Balance Sheet Data
December 31, 2017 | January 1, 2017 | January 3, 2016 | December 28, 2014 | December 29, 2013 | |||||||||||||||
(In millions) | |||||||||||||||||||
Cash, cash equivalents and short-term investments | $ | 2,145 | $ | 1,559 | $ | 1,386 | $ | 1,338 | $ | 1,166 | |||||||||
Total assets | $ | 5,257 | $ | 4,281 | $ | 3,688 | $ | 3,340 | $ | 3,019 | |||||||||
Long-term debt | $ | 1,182 | $ | 1,056 | $ | 1,016 | $ | 987 | $ | 839 | |||||||||
Redeemable noncontrolling interests | $ | 220 | $ | 44 | $ | 33 | — | — | |||||||||||
Total stockholders’ equity | $ | 2,749 | $ | 2,270 | $ | 1,849 | $ | 1,463 | $ | 1,533 | |||||||||
ITEM 7. | Management’s Discussion and Analysis of Financial Condition and Results of Operations. |
Our Management’s Discussion and Analysis of Financial Condition and Results of Operations (MD&A) will help readers understand our results of operations, financial condition, and cash flow. It is provided in addition to the accompanying consolidated financial statements and notes. This MD&A is organized as follows:
• | Business Overview and Outlook. High level discussion of our operating results and significant known trends that affect our business. |
• | Results of Operations. Detailed discussion of our revenues and expenses. |
• | Liquidity and Capital Resources. Discussion of key aspects of our statements of cash flows, changes in our financial position, and our financial commitments. |
• | Off-Balance Sheet Arrangements. We have no off-balance sheet arrangements. |
• | Contractual Obligations. Tabular disclosure of known contractual obligations as of December 31, 2017. |
25
• | Critical Accounting Policies and Estimates. Discussion of significant changes we believe are important to understanding the assumptions and judgments underlying our financial statements. |
• | Recent Accounting Pronouncements. |
This MD&A discussion contains forward-looking statements that involve risks and uncertainties. See “Special Note Regarding Forward-Looking Statements” preceding Item 1 of this report for additional factors relating to such statements. See “Risk Factors” in Item 1A of this report for a discussion of certain risk factors applicable to our business, financial condition, and results of operations. Operating results are not necessarily indicative of results that may occur in future periods.
Business Overview and Outlook
We have two reportable segments: Illumina’s core operations (Core Illumina) and one segment related to the combined activities of our consolidated VIEs, GRAIL and Helix (Consolidated VIEs). Following the GRAIL deconsolidation on February 28, 2017, our Consolidated VIEs no longer include GRAIL. For information on GRAIL and Helix, refer to note “11. Segment Information, Geographic Data, and Significant Customers” in Part II, Item 8 of this report.
We are the global leader in sequencing- and array-based technologies for genetic analysis, serving customers in a wide range of markets, enabling the adoption of genomic solutions in research and clinical settings.
Our customers include leading genomic research centers, academic institutions, government laboratories, and hospitals, as well as pharmaceutical, biotechnology, commercial molecular diagnostic laboratories, and consumer genomics companies.
Our portfolio of integrated systems, consumables, and analysis tools is designed to accelerate and simplify genetic analysis. This portfolio addresses the range of genomic complexity, price points, and throughput, enabling customers to select the best solution for their research or clinical challenge.
Consolidated financial highlights include the following:
• | Net revenue increased 15% in 2017 over 2016 due to the growth in sales of our sequencing consumables and genotyping services, as well as the launch of our NovaSeq platform, partially offset by lower shipments of our HiSeq instruments. We expect our revenue to continue to increase in 2018. |
• | Gross profit as a percentage of revenue (gross margin) decreased to 66.4% in 2017 from 69.5% in 2016. The gross margin decrease was driven by a variety of factors, including impairment of an acquired intangible asset, an increase in lower-margin array services mix, inventory reserves related to product transitions, and lower instrument margin from the NovaSeq introduction. Our gross margin in future periods will depend on several factors, including: market conditions that may impact our pricing power; sales mix changes among consumables, instruments, and services; product mix changes between established products and new products; excess and obsolete inventories; royalties; our cost structure for manufacturing operations relative to volume; and product support obligations. |
• | Income from operations as a percentage of revenue decreased to 22.0% in 2017 compared to 24.5% in 2016 primarily due to lower gross margins. We expect research and development and selling, general and administrative expenses to continue to grow. |
• | In accordance with the Tax Cuts and Jobs Act that was enacted on December 22, 2017 (U.S. Tax Reform), we have recorded a provision for income taxes of $150 million. The impact of U.S. Tax Reform primarily represents our provisional estimates of the one-time transition tax on earnings of certain foreign subsidiaries that were previously tax deferred, and the impact of revaluing our U.S. deferred tax assets and liabilities based on the rates at which they are expected to be recognized in the future. For U.S. federal purposes the corporate statutory income tax rate was reduced from 35% to 21%, effective for our 2018 tax year. The provisional impact of U.S. Tax Reform is our current best estimate based on a preliminary review of the new law and is subject to revision based on our existing accounting for income taxes policy as further information is gathered, and interpretation and analysis of the tax legislation evolves. The Securities and Exchange Commission has issued rules allowing for a measurement period of up to one year after the enactment date of U.S. Tax Reform to finalize the recording of the related tax impacts. Any future changes to our provisional estimated impact of U.S. Tax Reform will be included as an adjustment to the provision for income taxes. |
26
Our effective tax rate was 35.0% and 23.7% in 2017 and 2016, respectively. The effective tax rate in 2017 was primarily impacted by the mix of earnings in jurisdictions with lower statutory tax rates than the U.S. federal statutory tax rate, such as in Singapore and the United Kingdom, and excess tax benefits related to share-based compensation. Such impacts were offset primarily by the provisional estimated impact of U.S. Tax Reform of $150 million.
Our future effective tax rate may vary from the U.S. federal statutory tax rate due to the mix of earnings in tax jurisdictions with different statutory tax rates and the other factors discussed in the risk factor “We are subject to risks related to taxation in multiple jurisdictions” in Part I Item 1A “Risk Factors” of this report. We may also be adversely impacted in the future if the tax court opinion regarding the exclusion of stock compensation from cost-sharing charges is overturned. Based on our initial interpretation and analysis of U.S. Tax Reform and projected future financial results, we anticipate that our effective tax rate will trend lower than the U.S. federal statutory tax rate in the future due to the portion of our earnings that will be subject to lower statutory tax rates. As further information is gathered, and interpretation and analysis of the tax legislation evolves, we will update our estimate of the future effective tax rate.
• | We ended 2017 with cash, cash equivalents, and short-term investments totaling $2.1 billion, of which approximately $1.1 billion was held by our foreign subsidiaries. |
This overview and outlook provides a high-level discussion of our operating results and significant known trends that affect our business. We believe that an understanding of these trends is important to understanding our financial results for the periods reported herein as well as our future financial performance. This summary is not intended to be exhaustive, nor is it intended to be a substitute for the detailed discussion and analysis provided elsewhere in this report.
27
Results of Operations
To enhance comparability, the following table sets forth audited consolidated statement of operations data for the years ended December 31, 2017, January 1, 2017, and January 3, 2016, stated as a percentage of total revenue.
2017 | 2016 | 2015 | ||||||
Revenue: | ||||||||
Product revenue | 83.2 | % | 84.7 | % | 85.2 | % | ||
Service and other revenue | 16.8 | 15.3 | 14.8 | |||||
Total revenue | 100.0 | 100.0 | 100.0 | |||||
Cost of revenue: | ||||||||
Cost of product revenue | 24.7 | 22.3 | 22.1 | |||||
Cost of service and other revenue | 7.6 | 6.4 | 6.0 | |||||
Amortization of acquired intangible assets | 1.3 | 1.8 | 2.1 | |||||
Total cost of revenue | 33.6 | 30.5 | 30.2 | |||||
Gross profit | 66.4 | 69.5 | 69.8 | |||||
Operating expense: | ||||||||
Research and development | 19.8 | 21.0 | 18.1 | |||||
Selling, general and administrative | 24.6 | 24.4 | 23.2 | |||||
Legal contingencies | — | (0.4 | ) | 0.9 | ||||
Total operating expense | 44.4 | 45.0 | 42.2 | |||||
Income from operations | 22.0 | 24.5 | 27.6 | |||||
Other income (expense): | ||||||||
Interest income | 0.7 | 0.4 | 0.2 | |||||
Interest expense | (1.3 | ) | (1.4 | ) | (1.9 | ) | ||
Cost-method investment gain, net | — | — | 0.7 | |||||
Other income (expense), net | 16.5 | (0.1 | ) | (0.3 | ) | |||
Total other income (expense), net | 15.9 | (1.1 | ) | (1.3 | ) | |||
Income before income taxes | 37.9 | 23.4 | 26.3 | |||||
Provision for income taxes | 13.3 | 5.6 | 5.7 | |||||
Consolidated net income | 24.6 | 17.8 | 20.6 | |||||
Add: Net loss attributable to noncontrolling interests | 1.8 | 1.5 | 0.2 | |||||
Net income attributable to Illumina stockholders | 26.4 | % | 19.3 | % | 20.8 | % | ||
Percentages may not recalculate due to rounding
Our fiscal year is the 52 or 53 weeks ending the Sunday closest to December 31, with quarters of 13 or 14 weeks ending the Sunday closest to March 31, June 30, September 30, and December 31. Fiscal year 2017 and 2016 were 52 weeks, and fiscal year 2015 was 53 weeks.
Revenue
2017 - 2016 | 2016 - 2015 | ||||||||||||||||||||||||
(Dollars in millions) | 2017 | 2016 | Change | % Change | 2015 | Change | % Change | ||||||||||||||||||
Product revenue | $ | 2,289 | $ | 2,032 | $ | 257 | 13 | % | $ | 1,891 | $ | 141 | 7 | % | |||||||||||
Service and other revenue | 463 | 366 | 97 | 27 | 329 | 37 | 11 | ||||||||||||||||||
Total revenue | $ | 2,752 | $ | 2,398 | $ | 354 | 15 | % | $ | 2,220 | $ | 178 | 8 | % | |||||||||||
Product revenue consists primarily of revenue from sales of consumables and instruments. Service and other revenue consists primarily of sequencing and genotyping service revenue as well as instrument service contract revenue. Total revenue primarily relates to Core Illumina for all periods presented.
28
2017 Compared to 2016
Revenue increased $354 million, or 15%, to $2,752 million in 2017 compared to $2,398 million in 2016.
Consumables revenue increased $210 million, or 14%, to $1,753 million in 2017 compared to $1,543 million in 2016, driven by growth in the sequencing instrument installed base.
Instrument revenue increased $46 million, or 10%, to $515 million in 2017 compared to $469 million in 2016, primarily due to shipments of our NovaSeq instrument introduced in Q1 2017, partially offset by lower shipments of our HiSeq and HiSeq X instruments.
Service and other revenue increased $97 million, or 27%, to $463 million in 2017 compared to $366 million in 2016, driven by revenue from genotyping services and extended instrument service contracts associated with a larger sequencing installed base.
2016 Compared to 2015
Revenue increased $178 million, or 8%, to $2,398 million in 2016 compared to $2,220 million in 2015.
Consumables revenue increased $264 million, or 21%, to $1,543 million in 2016 compared to $1,279 million in the prior year, driven by growth in the sequencing instrument installed base.
Instrument revenue decreased $126 million, or 21%, to $469 million in 2016 compared to $595 million in the prior year, primarily due to lower shipments of our high-throughput platforms.
Service and other revenue increased $37 million, or 11%, to $366 million in 2016 compared to $329 million in the prior year, driven by revenue from genotyping services and instrument service contracts associated with a larger sequencing installed base, partially offset by our NIPT customers shifting to in-house testing on our sequencers.
Gross Margin
2017 - 2016 | 2016 - 2015 | ||||||||||||||||||||||||
(Dollars in millions) | 2017 | 2016 | Change | % Change | 2015 | Change | % Change | ||||||||||||||||||
Total gross profit | $ | 1,826 | $ | 1,666 | $ | 160 | 10 | % | $ | 1,549 | $ | 117 | 8 | % | |||||||||||
Total gross margin | 66.4 | % | 69.5 | % | 69.8 | % | |||||||||||||||||||
2017 Compared to 2016
Gross margin decreased to 66.4% in 2017 compared to 69.5% in 2016. The gross margin decrease was driven by a variety of factors, including an $18 million impairment of an acquired intangible asset, an increase in lower-margin array services mix, inventory reserves related to product transitions, and lower instrument margin from the NovaSeq introduction.
2016 Compared to 2015
Gross margin decreased to 69.5% compared to 69.8% in the prior year. Gross margin decreased primarily due to our increased manufacturing capacity, which was partially offset by a greater mix of sequencing consumables.
Operating Expense
2017 - 2016 | 2016 - 2015 | ||||||||||||||||||||||||
(Dollars in millions) | 2017 | 2016 | Change | % Change | 2015 | Change | % Change | ||||||||||||||||||
Research and development | $ | 546 | $ | 504 | $ | 42 | 8 | % | $ | 401 | $ | 103 | 26 | % | |||||||||||
Selling, general and administrative | 674 | 584 | 90 | 15 | 516 | 68 | 13 | ||||||||||||||||||
Legal contingencies | — | (9 | ) | 9 | (100 | ) | 19 | (28 | ) | (147 | ) | ||||||||||||||
Total operating expense | $ | 1,220 | $ | 1,079 | $ | 141 | 13 | % | $ | 936 | $ | 143 | 15 | % | |||||||||||
29
2017 Compared to 2016
Research and development (R&D) expense increased by $42 million, or 8%, in 2017 from 2016. Core Illumina R&D expense increased by $58 million, or 13%, primarily due to increased headcount as we continue to invest in the research and development of new products and enhancements to existing products. R&D expense of our Consolidated VIEs decreased by $16 million, primarily due to the deconsolidation of GRAIL in Q1 2017, partially offset by growth in Helix’s operations.
Selling, general and administrative (SG&A) expense increased by $90 million, or 15% in 2017 from 2016. Core Illumina SG&A expense increased by $73 million, or 13%, primarily due to increased headcount and facilities investment to support the continued growth and scale of our operations. SG&A expense of our Consolidated VIEs increased by $17 million due to marketing expenses related to Helix’s July 2017 platform launch and increased headcount, as well as performance-based compensation related to the GRAIL Series B financing. These results were partially offset by the deconsolidation of GRAIL in Q1 2017.
Legal contingencies in 2016 represent a reversal of previously recorded expense related to the settlement of patent litigation.
2016 Compared to 2015
Research and development expense increased by $103 million, or 26%, in 2016 from 2015. Core Illumina R&D expense increased by $60 million, or 15%, primarily due to increased headcount and outside services as we continue to invest in the development of new products as well as enhancements to existing products. Our Consolidated VIEs contributed $43 million to the increase, primarily due to $34 million incurred by GRAIL.
Selling, general and administrative expense increased by $68 million, or 13%, in 2016 from 2015. Core Illumina SG&A expense increased $45 million, or 9%, primarily due to headcount and facilities investment to support the continued growth and scale of our operations, as well as outside services. GRAIL and Helix contributed $14 million and $9 million to the increase, respectively.
Legal contingencies in 2016 represent a reversal of prior year expense related to the settlement of patent litigation.
Other Income (Expense), Net
2017 - 2016 | 2016 - 2015 | ||||||||||||||||||||||||
(Dollars in millions) | 2017 | 2016 | Change | % Change | 2015 | Change | % Change | ||||||||||||||||||
Interest income | $ | 19 | $ | 10 | $ | 9 | 90 | % | $ | 5 | $ | 5 | 100 | % | |||||||||||
Interest expense | (37 | ) | (33 | ) | (4 | ) | 12 | (43 | ) | 10 | (23 | ) | |||||||||||||
Cost-method investment gain, net | — | — | — | — | 16 | (16 | ) | (100 | ) | ||||||||||||||||
Other income (expense), net | 455 | (3 | ) | 458 | (15,267 | ) | (8 | ) | 5 | (63 | ) | ||||||||||||||
Total other income (expense), net | $ | 437 | $ | (26 | ) | $ | 463 | (1,781 | )% | $ | (30 | ) | $ | 4 | (13 | )% | |||||||||
Other income (expense), net primarily relates to Core Illumina for all periods presented.
2017 Compared to 2016
Interest income increased in 2017 compared to 2016 as a result of higher yields on our investments and higher savings and money market balances. Interest expense consisted primarily of accretion of discount on our convertible senior notes.
Other income (expense), net, increased in 2017 compared to 2016 primarily due to a $453 million gain recorded on the deconsolidation of GRAIL in Q1 2017 and an increase in net foreign exchange gains.
30
2016 Compared to 2015
Interest income increased in 2016 compared to 2015 as a result of higher yields on our investments and higher savings and money market balances. Interest expense consisted primarily of accretion of discount on our convertible senior notes. The decrease in interest expense in 2016 compared to 2015 was due to a lower outstanding principal balance on the 2016 Notes, which matured in March 2016.
Cost-method investment gain, net in 2015 consisted primarily of gains on dispositions of cost-method investments, partially offset by impairment charges on other investments.
Other expense, net, in 2015 consisted primarily of $4 million in net foreign exchange losses and $4 million in loss on extinguishment of debt.
Provision for Income Taxes
2017 - 2016 | 2016 - 2015 | ||||||||||||||||||||||||
(Dollars in millions) | 2017 | 2016 | Change | % Change | 2015 | Change | % Change | ||||||||||||||||||
Income before income taxes | $ | 1,043 | $ | 561 | $ | 482 | 86 | % | $ | 583 | $ | (22 | ) | (4 | )% | ||||||||||
Provision for income taxes | 365 | 133 | 232 | 174 | 125 | 8 | 6 | ||||||||||||||||||
Consolidated net income | $ | 678 | $ | 428 | $ | 250 | 58 | % | $ | 458 | $ | (30 | ) | (7 | )% | ||||||||||
Effective tax rate | 35.0 | % | 23.7 | % | 21.6 | % | |||||||||||||||||||
2017 Compared to 2016
Our effective tax rate was 35.0% and 23.7% in 2017 and 2016, respectively. The effective tax rate in 2017 was primarily impacted by the mix of earnings in jurisdictions with lower statutory tax rates than the U.S. federal statutory tax rate, such as in Singapore and the United Kingdom, and excess tax benefits related to share-based compensation. Such impacts were offset primarily by the provisional estimated impact of U.S. Tax Reform of $150 million. The impact of U.S. Tax Reform primarily represents our provisional estimates of the one-time transition tax on earnings of certain foreign subsidiaries that were previously tax deferred, and the impact of revaluing our U.S. deferred tax assets and liabilities based on the statutory rates at which they are expected to be recognized in the future, which for federal purposes was reduced from 35% to 21%. In 2016, the variance from the U.S. federal statutory tax rate of 35% was primarily attributable the mix of earnings in jurisdictions with lower statutory rates from the U.S. federal statutory rate, such as in Singapore and the United Kingdom, partially offset by the tax impact associated with the investment in our consolidated variable interest entities.
2016 Compared to 2015
Our effective tax rate was 23.7% and 21.6% in 2016 and 2015, respectively. In 2016, the variance from the U.S. federal statutory tax rate of 35% was primarily attributable the mix of earnings in jurisdictions with lower statutory rates from the U.S. federal statutory rate, such as in Singapore and the United Kingdom, partially offset by the tax impact associated with the investment in our consolidated variable interest entities. In 2015, the variance from the U.S. federal statutory tax rate of 35% was primarily attributable to a discrete tax benefit of $25 million, related to the exclusion of stock compensation from prior period cost-sharing charges as a result of a tax court opinion in which an unrelated third party was successful in challenging such charges. The decrease from the U.S. federal statutory tax rate also resulted from the mix of earnings in jurisdictions with lower statutory tax rates than the U.S. federal statutory tax rate, such as in Singapore and the United Kingdom.
Liquidity and Capital Resources
At December 31, 2017, we had approximately $1.2 billion in cash and cash equivalents, of which approximately $826 million was held by our foreign subsidiaries. Cash and cash equivalents held by our consolidated VIEs as of December 31, 2017 were $18 million. Cash and cash equivalents decreased by $490 million from last year, due to the factors described in the “Cash Flow Summary” below. Our primary source of liquidity, other than our holdings of cash, cash equivalents, and investments, has been cash flows from operations. Our ability to generate cash from operations provides us with the financial flexibility we need to meet operating, investing, and financing needs. It is our intention to indefinitely reinvest the historical earnings of our foreign subsidiaries generated prior to 2017. For the year ended December 31, 2017, we asserted that $869 million of foreign earnings generated in 2017 would not be indefinitely invested.
31
Historically, we have liquidated our short-term investments and/or issued debt and equity securities to finance our business needs as a supplement to cash provided by operating activities. As of December 31, 2017, we had $920 million in short-term investments. Short-term investments held by our foreign subsidiaries as of December 31, 2017 were approximately $305 million. Our short-term investments include marketable securities consisting of U.S government-sponsored entities, corporate debt securities, and U.S. Treasury securities.
We anticipate that our current cash, cash equivalents, and short-term investments, together with cash provided by operating activities are sufficient to fund our near-term capital and operating needs for at least the next 12 months. Operating needs include the planned costs to operate our business, including amounts required to fund working capital and capital expenditures. Our primary short-term needs for capital, which are subject to change, include:
• | support of commercialization efforts related to our current and future products, including expansion of our direct sales force and field support resources both in the United States and abroad; |
• | acquisitions of equipment and other fixed assets for use in our current and future manufacturing and research and development facilities; |
• | the continued advancement of research and development efforts; |
• | potential strategic acquisitions and investments; |
• | potential early repayment of debt obligations as a result of conversions; |
• | the expansion needs of our facilities, including costs of leasing and building out additional facilities; |
• | repurchases of our outstanding common stock; and |
• | the one-time transition tax on earnings of certain foreign subsidiaries that were previously tax deferred in accordance with the Tax Cuts and Jobs Act (U.S. Tax Reform) that was enacted on December 22, 2017. |
Our convertible senior notes due 2019 and 2021 were not convertible as of December 31, 2017.
On May 4, 2017, our Board of Directors authorized a share repurchase program to repurchase $250 million of outstanding common stock. The repurchases may be completed under a 10b5-1 plan or at management’s discretion. Authorizations to repurchase $100 million of our common stock remained available as of December 31, 2017.
Certain noncontrolling Helix investors may require Illumina to redeem all noncontrolling interests in cash at the then approximate fair market value. Such redemption right is exercisable at the option of certain noncontrolling interest holders after January 1, 2021, provided that a bona fide pursuit of the sale of Helix has occurred and an initial public offering of Helix has not been completed. The fair value of the redeemable noncontrolling interests related to Helix as of December 31, 2017, was $220 million.
We have $83 million remaining in our capital commitment to a venture capital investment fund as of December 31, 2017.
We expect that our revenue and the resulting operating income, as well as the status of each of our new product development programs, will significantly impact our cash management decisions.
Our future capital requirements and the adequacy of our available funds will depend on many factors, including:
• | our ability to successfully commercialize and further develop our technologies and create innovative products in our markets; |
• | scientific progress in our research and development programs and the magnitude of those programs; |
• | competing technological and market developments; and |
• | the need to enter into collaborations with other companies or acquire other companies or technologies to enhance or complement our product and service offerings. |
32
Cash Flow Summary
(In millions) | 2017 | 2016 | 2015 | ||||||||
Net cash provided by operating activities | $ | 875 | $ | 779 | $ | 786 | |||||
Net cash used in investing activities | (214 | ) | (515 | ) | (107 | ) | |||||
Net cash used in financing activities | (176 | ) | (296 | ) | (545 | ) | |||||
Effect of exchange rate changes on cash and cash equivalents | 5 | (2 | ) | (1 | ) | ||||||
Net increase (decrease) in cash and cash equivalents | $ | 490 | $ | (34 | ) | $ | 133 | ||||
Operating Activities
Net cash provided by operating activities in 2017 primarily consisted of net income of $678 million and net changes in net operating assets and liabilities of $195 million. We also had $2 million in net non-cash adjustments to net income, consisting of a gain on deconsolidation of GRAIL of $453 million, depreciation and amortization expenses of $156 million, share-based compensation of $164 million, deferred income taxes of $81 million, impairment of intangible assets of $23 million, and accretion of debt discount of $30 million. Cash flow impact from changes in net operating assets and liabilities were primarily driven by an increase in other long-term liabilities of $160 million related primarily to estimated taxes associated with the U.S. tax reform as well as increases in accrued liabilities, inventory, and accounts receivable.
Net cash provided by operating activities in 2016 consisted of net income of $428 million plus net adjustments of $396 million partially offset by net changes in net operating assets and liabilities of $45 million. The primary non-cash expenses added back to net income included depreciation and amortization expenses of $141 million, share-based compensation of $129 million, deferred income taxes of $94 million, and accretion of debt discount of $30 million. These non-cash add-backs were partially offset by a gain on litigation settlement of $11 million. Cash flow impact from changes in net operating assets and liabilities were primarily driven by an increase in inventory and a decrease in accrued liabilities.
Net cash provided by operating activities in 2015 consisted of net income of $458 million plus net adjustments of $368 million partially offset by net changes in net operating assets and liabilities of $40 million. The primary non-cash expenses added back to net income included share-based compensation of $133 million, depreciation and amortization expenses of $127 million, deferred income taxes of $81 million, and accretion of debt discount of $39 million. These non-cash add-backs were partially offset by a $16 million in cost-method investment gain. Cash flow impact from changes in net operating assets included increases in accounts receivable, inventory, and prepaid expenses and other current assets, partially offset by increases in accounts payable, and accrued liabilities.
Investing Activities
Net cash used in investing activities totaled $214 million in 2017. We purchased $742 million of available-for-sale securities and $643 million of our available-for-sale securities matured or were sold during the period. We received $278 million from the sale of a portion of our ownership interest in GRAIL. In connection with the sale, we removed $52 million in cash from our consolidated balance sheet as a result of the deconsolidation. We paid $29 million for strategic investments and invested $310 million in capital expenditures primarily associated with our investment in facilities.
Net cash used in investing activities totaled $515 million in 2016. We purchased $895 million of available-for-sale securities and $683 million of our available-for-sale securities matured or were sold during the period. We also paid net cash of $18 million for acquisitions, $14 million for strategic investments, $11 million for intangibles, and invested $260 million in capital expenditures primarily associated with facilities, and the purchase of manufacturing, research and development equipment.
Net cash used in investing activities totaled $107 million in 2015. We purchased $797 million of available-for-sale securities and $876 million of our available-for-sale securities matured or were sold during the period. We also paid net cash of $37 million for acquisitions and invested $143 million in capital expenditures primarily associated with machinery and equipment, facilities, and information technology equipment and systems primarily related to our enterprise resource planning system implementation.
33
Financing Activities
Net cash used in financing activities totaled $176 million in 2017. We used $251 million to repurchase our common stock and $68 million to pay taxes related to net share settlement of equity awards. We received $71 million in proceeds from the issuance of common stock through the exercise of stock options and the sale of shares under our employee stock purchase plan. Contributions from noncontrolling interest owners were $79 million. Additionally, $9 million was used by Helix to repay financing obligations.
Net cash used in financing activities totaled $296 million in 2016. We used $100 million to pay taxes related to net share settlement of equity awards, $29 million to pay acquisition-related contingent consideration and $249 million to repurchase our common stock. We used $66 million to repay financing obligations and received $47 million in proceeds from the issuance of common stock through the exercise of stock options and the sale of shares under our employee stock purchase plan. Contributions from noncontrolling interest owners were $89 million.
Net cash used in financing activities totaled $545 million in 2015. We used $127 million to pay taxes related to net share settlement of equity awards, and $274 million to repurchase our common stock. We used $245 million to repay financing obligations and received $72 million in proceeds from the issuance of common stock through the exercise of stock options and the sale of shares under our employee stock purchase plan. Contributions from noncontrolling interest owners were $32 million.
Off-Balance Sheet Arrangements
We do not participate in any transactions that generate relationships with unconsolidated entities or financial partnerships, such as entities often referred to as structured finance or special purpose entities, which would have been established for the purpose of facilitating off-balance sheet arrangements or other contractually narrow or limited purposes. During the fiscal year ended December 31, 2017, we were not involved in any “off-balance sheet arrangements” within the meaning of the rules of the Securities and Exchange Commission.
Contractual Obligations
Contractual obligations represent future cash commitments and liabilities under agreements with third parties, and exclude orders for goods and services entered into in the normal course of business that are not enforceable or legally binding. The following table represents our contractual obligations as of December 31, 2017, aggregated by type (in millions):
Payments Due by Period(1) | ||||||||||||||||||||
Less Than | More Than | |||||||||||||||||||
Contractual Obligation | Total | 1 Year | 1 – 3 Years | 3 – 5 Years | 5 Years | |||||||||||||||
Debt obligations(2) | $ | 1,159 | $ | 3 | $ | 637 | $ | 519 | $ | — | ||||||||||
Operating leases | 752 | 55 | 118 | 111 | 468 | |||||||||||||||
Build-to-suit leases | 294 | 22 | 40 | 42 | 190 | |||||||||||||||
Purchase obligations(3) | 107 | 27 | 80 | — | — | |||||||||||||||
Amounts due under executive deferred compensation plan | 33 | 33 | — | — | — | |||||||||||||||
Total | $ | 2,345 | $ | 140 | $ | 875 | $ | 672 | $ | 658 | ||||||||||
_______________________________________
(1) | The table excludes $79 million of uncertain tax positions, a $150 million provisional estimate of the one-time transition tax related to U.S. Tax Reform, $220 million of redeemable noncontrolling interest, and $83 million of capital commitments for the Venture Fund as the timing and amounts of the settlement remained uncertain as of December 31, 2017. See note “9. Income Taxes” and note “2. Balance Sheet Account Details” in Part II, Item 8 of this report for further discussions. |
(2) | Debt obligations include the principal amount of our convertible senior notes due 2019 and 2021, as well as interest payments to be made under the notes. Although these notes mature in 2019 and 2021, respectively, they may be converted into cash and shares of our common stock prior to maturity if certain conditions are met. Any conversion prior to maturity can result in repayments of the principal amounts sooner than the scheduled repayments as indicated in the table. See note “5. Debt and Other Commitments” in Part II, Item 8 of this report for further discussion. |
34
(3) | In the normal course of business, we enter into agreements to purchase goods or services that are not cancelable without penalty, primarily related to licensing and supply arrangements. See note “5. Debt and Other Commitments” in Part II, Item 8 of this report for further discussion. |
Critical Accounting Policies and Estimates
The preparation of financial statements in accordance with U.S. generally accepted accounting principles requires management to make estimates and assumptions that affect the amounts reported in our consolidated financial statements and accompanying notes. Management bases its estimates on historical experience, market and other conditions, and various other assumptions it believes to be reasonable. Although these estimates are based on management’s best knowledge of current events and actions that may impact us in the future, the estimation process is, by its nature, uncertain given that estimates depend on events over which we may not have control. If market and other conditions change from those that we anticipate, our consolidated financial statements may be materially affected. In addition, if our assumptions change, we may need to revise our estimates, or take other corrective actions, either of which may also have a material effect on our consolidated financial statements.
We believe that the following critical accounting policies and estimates have a higher degree of inherent uncertainty and require our most significant judgments. In addition, had we used estimates different from any of these, our consolidated financial statements could have been materially different from those presented. Members of our senior management have discussed the development and selection of our critical accounting policies and estimates, and our disclosure regarding them, with the audit committee of our board of directors. Our accounting policies are more fully described in note “1. Organization and Significant Accounting Policies” in Part II, Item 8 of this report.
Revenue Recognition
Our revenue is generated primarily from the sale of products and services. Product revenue primarily consists of sales of instruments and consumables used in genetic analysis. Service and other revenue primarily consists of revenue generated from genotyping and sequencing services and instrument service contracts. The timing of revenue recognition and the amount of revenue recognized in each case depends upon a variety of factors, including the specific terms of each arrangement and the nature of our deliverables and obligations. Determination of the appropriate amount of revenue recognized involves significant judgment and estimates.
We recognize revenue when persuasive evidence of an arrangement exists, delivery has occurred or services have been rendered, the seller’s price to the buyer is fixed or determinable, and collectibility is reasonably assured. In instances where final acceptance of the product or system is required, revenue is deferred until all the acceptance criteria have been met. We occasionally offer discounts on newly introduced products to recent customers of existing products. Where applicable, we defer a portion of revenue on the sales of existing products in recognition of the promotional discounts until the delivery of new products. All revenue is recorded net of discounts and sales taxes collected on behalf of governmental authorities.
Revenue from product sales is recognized generally upon transfer of title to the customer, provided that no significant obligations remain and collection of the receivable is reasonably assured. Revenue from instrument service contracts is recognized as the services are rendered, typically evenly over the contract term. Revenue from genotyping and sequencing services is recognized when earned, which is generally at the time the genotyping or sequencing analysis data is made available to the customer or agreed-upon milestones are reached.
In order to assess whether the price is fixed or determinable, we evaluate whether an arrangement is cancellable or subject to future changes in price, deliverables, or other terms. If it is determined that the price is not fixed or determinable, we defer revenue recognition until the price becomes fixed or determinable. We assess collectibility based on a number of factors, including past transaction history with, and the creditworthiness of, the customer. If we determine that collection of a payment is not reasonably assured, revenue recognition is deferred until receipt of payment.
We regularly enter into contracts where revenue is derived from multiple deliverables including products or services. These products or services are generally delivered within a short time frame, approximately three to six months, after the contract execution date. Revenue recognition for contracts with multiple deliverables is based on the individual units of accounting determined to exist in the contract. A delivered item is considered a separate unit of accounting when the delivered item has value to the customer on a stand-alone basis. Items are considered to have stand-alone value when they are sold separately by any vendor or when the customer could resell the item on a stand-alone basis.
35
For transactions with multiple deliverables, consideration is allocated at the inception of the contract to all deliverables based on their relative selling price. The relative selling price for each deliverable is determined using vendor-specific objective evidence (VSOE) of selling price or third-party evidence of selling price if VSOE does not exist. If neither VSOE nor third-party evidence exists, we use best estimate of the selling price for the deliverable.
In order to establish VSOE of selling price, we must regularly sell the product or service on a standalone basis with a substantial majority priced within a relatively narrow range. VSOE of selling price is usually the midpoint of that range. If there are not a sufficient number of standalone sales and VSOE of selling price cannot be determined, then we consider whether third-party evidence can be used to establish selling price. Due to the lack of similar products and services sold by other companies within the industry, we have rarely established selling price using third-party evidence. If neither VSOE nor third-party evidence of selling price exists, we determine our best estimate of selling price using average selling prices over a rolling 12-month period coupled with an assessment of current market conditions. If the product or service has no history of sales or if the sales volume is not sufficient, we rely upon prices set by our pricing committee adjusted for applicable discounts. We recognize revenue for delivered elements only when we determine there are no uncertainties regarding customer acceptance.
In certain markets, we sell products and provide services to customers through distributors that specialize in life science products. In most sales through distributors, the product is delivered directly to customers. In cases where the product is delivered to a distributor, revenue recognition is deferred until acceptance is received from the distributor, and/or the end-user, if required by the applicable sales contract. The terms of sales transactions through distributors are consistent with the terms of direct sales to customers. These transactions are accounted for in accordance with our revenue recognition policy described herein.
Investments
We invest in various types of securities, including debt securities in government-sponsored entities, corporate debt securities, and U.S. Treasury securities. As of December 31, 2017, we had $920 million in short-term investments. In accordance with the accounting standard for fair value measurements, we classify our investments as Level 1, 2, or 3 within the fair value hierarchy. Fair values determined by Level 1 inputs utilize quoted prices (unadjusted) in active markets for identical assets that we have the ability to access. Fair values determined by Level 2 inputs utilize data points that are observable such as quoted prices, interest rates and yield curves. Fair values determined by Level 3 inputs utilize unobservable data points for the asset.
As discussed in note “4. Fair Value Measurements” in Part II, Item 8 of this report, a majority of our security holdings have been classified as Level 2. These securities have been initially valued at the transaction price and subsequently valued utilizing a third-party service provider who assesses the fair value using inputs other than quoted prices that are observable either directly or indirectly, such as yield curve, volatility factors, credit spreads, default rates, loss severity, current market and contractual prices for the underlying instruments or debt, broker and dealer quotes, as well as other relevant economic measures. We perform certain procedures to corroborate the fair value of these holdings, and in the process, we apply judgment and estimates that if changed, could significantly affect our statement of financial positions.
Allowance for Doubtful Accounts
We maintain an allowance for doubtful accounts for estimated losses resulting from the inability of our customers to make required payments. We evaluate the collectibility of our accounts receivable based on a combination of factors. We regularly analyze customer accounts, review the length of time receivables are outstanding, review historical loss rates and assess current economic trends that may impact the level of credit losses in the future. Our allowance for doubtful accounts has generally been adequate to cover our actual credit losses. However, since we cannot reliably predict future changes in the financial stability of our customers, we may need to increase our reserves if the financial conditions of our customers deteriorate.
36
Inventory Valuation
Inventories are stated at lower of cost or net realizable value. We record adjustments to inventory for potentially excess, obsolete, or impaired goods in order to state inventory at net realizable value. We must make assumptions about future demand, market conditions, and the release of new products that will supersede old ones. We regularly review inventory for excess and obsolete products and components, taking into account product life cycles, quality issues, historical experience, and usage forecasts. Our gross inventory totaled $375 million and the cumulative adjustment for potentially excess and obsolete inventory was $42 million at December 31, 2017. Historically, our inventory adjustment has been adequate to cover our losses. However, if actual market conditions are less favorable than anticipated, additional inventory adjustments could be required.
Contingencies
We are involved in various lawsuits and claims arising in the ordinary course of business, including actions with respect to intellectual property, employment, and contractual matters. In connection with these matters, we assess, on a regular basis, the probability and range of possible loss based on the developments in these matters. A liability is recorded in the financial statements if it is believed to be probable that a loss has been incurred and the amount of the loss can be reasonably estimated. Because litigation is inherently unpredictable and unfavorable resolutions could occur, assessing contingencies is highly subjective and requires judgments about future events. We regularly review outstanding legal matters to determine the adequacy of the liabilities accrued and related disclosures in consideration of many factors, which include, but are not limited to, past history, scientific and other evidence, and the specifics and status of each matter. We may change our estimates if our assessment of the various factors changes and the amount of ultimate loss may differ from our estimates, resulting in a material effect on our business, financial condition, results of operations, and/or cash flows.
Business Combinations
Under the acquisition method of accounting, we allocate the fair value of the total consideration transferred to the tangible and identifiable intangible assets acquired and liabilities assumed based on their estimated fair values on the date of acquisition. The fair values assigned, defined as the price that would be received to sell an asset or paid to transfer a liability in an orderly transaction between willing market participants, are based on estimates and assumptions determined by management. We record the excess consideration over the aggregate fair value of tangible and intangible assets, net of liabilities assumed, as goodwill. These valuations require us to make significant estimates and assumptions, especially with respect to intangible assets.
In connection with certain of our acquisitions, additional contingent consideration is earned by the sellers upon completion of certain future performance milestones. In these cases, a liability is recorded on the acquisition date for an estimate of the acquisition date fair value of the contingent consideration by applying the income approach utilizing variable inputs such as anticipated future cash flows, risk-free adjusted discount rates, and nonperformance risk. Any change in the fair value of the contingent consideration subsequent to the acquisition date is recognized in acquisition-related (gain) expense, net, a component of operating expenses, in our consolidated statements of income. This method requires significant management judgment, including the probability of achieving certain future milestones and discount rates. Future changes in our estimates could result in expenses or gains.
Management typically uses the discounted cash flow method to value our acquired intangible assets. This method requires significant management judgment to forecast future operating results and establish residual growth rates and discount factors. The estimates we use to value and amortize intangible assets are consistent with the plans and estimates that we use to manage our business and are based on available historical information and industry estimates and averages. If the subsequent actual results and updated projections of the underlying business activity change compared with the assumptions and projections used to develop these values, we could experience impairment charges. In addition, we have estimated the economic lives of certain acquired assets and these lives are used to calculate depreciation and amortization expense. If our estimates of the economic lives change, depreciation or amortization expenses could be accelerated or slowed.
Intangible Assets and Other Long-Lived Assets — Impairment Assessments
We regularly perform reviews to determine if the carrying values of our long-lived assets are impaired. A review of identifiable intangible assets and other long-lived assets is performed when an event occurs indicating the potential for impairment. If indicators of impairment exist, we assess the recoverability of the affected long-lived assets and compare their fair values to the respective carrying amounts.
37
In order to estimate the fair value of identifiable intangible assets and other long-lived assets, we estimate the present value of future cash flows from those assets. The key assumptions that we use in our discounted cash flow model are the amount and timing of estimated future cash flows to be generated by the asset over an extended period of time and a rate of return that considers the relative risk of achieving the cash flows, the time value of money, and other factors that a willing market participant would consider. Significant judgment is required to estimate the amount and timing of future cash flows and the relative risk of achieving those cash flows.
Assumptions and estimates about future values and remaining useful lives are complex and often subjective. They can be affected by a variety of factors, including external factors such as industry and economic trends, and internal factors such as changes in our business strategy and our internal forecasts. For example, if our future operating results do not meet current forecasts or if we experience a sustained decline in our market capitalization that is determined to be indicative of a reduction in fair value of our reporting unit, we may be required to record future impairment charges for purchased intangible assets. Impairment charges could materially decrease our future net income and result in lower asset values on our balance sheet.
Share-Based Compensation
We are required to measure and recognize compensation expense for all share-based payments based on estimated fair value. We estimate the fair value of stock options granted and stock purchases under our employee stock purchase plan using the Black-Scholes-Merton (BSM) option-pricing model. The fair value of our restricted stock units is based on the market price of our common stock on the date of grant.
The determination of fair value of share-based awards requires the use of certain estimates and highly judgmental assumptions that affect the amount of share-based compensation expense recognized in our consolidated statements of income. These include estimates of the expected volatility of our stock price, expected life of an award, expected dividends, the risk-free interest rate, and forecast of our future financial performance, in the case of performance stock units. We determine the volatility of our stock price by equally weighing the historical and implied volatility of our common stock. The historical volatility of our common stock over the most recent period is generally commensurate with the estimated expected life of our stock awards, adjusted for the impact of unusual fluctuations not reasonably expected to recur, and other relevant factors. Implied volatility is calculated from the implied market volatility of exchange-traded call options on our common stock. The expected life of an award is based on historical forfeiture experience, exercise activity, and on the terms and conditions of the stock awards. We determined expected dividend yield to be 0% given we have never declared or paid any cash dividends on our common stock and we currently do not anticipate paying such cash dividends. The risk-free interest rate is based upon U.S. Treasury securities with remaining terms similar to the expected term of the share-based awards. We update our forecast of future financial performance periodically, which impacts our estimate of the number of shares to be issued pursuant to the outstanding performance stock units. We amortize the fair value of share-based compensation on a straight-line basis over the requisite service periods of the awards. If any of the assumptions used change significantly, share-based compensation expense may differ materially from what we have recorded in the current period.
Warranties
We generally provide a one-year warranty on instruments. Additionally, we provide a warranty on consumables through the expiration date, which generally ranges from six to twelve months after the manufacture date. We establish an accrual for estimated warranty expenses based on historical experience as well as anticipated product performance. We periodically review the adequacy of our warranty reserve, and adjust, if necessary, the warranty percentage and accrual based on actual experience and estimated costs to be incurred. If our estimates of warranty obligation change or if actual product performance is below our expectations, we may incur additional warranty expense.
Income Taxes
Our provision for income taxes, deferred tax assets and liabilities, and reserves for unrecognized tax benefits reflect our best assessment of estimated future taxes to be paid. Significant judgments and estimates based on interpretations of existing tax laws or regulations in the United States and the numerous foreign jurisdictions where we are subject to income tax are required in determining our provision for income taxes. Changes in tax laws, statutory tax rates, and estimates of our future taxable income could impact the deferred tax assets and liabilities provided for in the consolidated financial statements and would require an adjustment to the provision for income taxes.
In accordance with the Tax Cuts and Jobs Act that was enacted on December 22, 2017 (U.S. Tax Reform), we have recorded a provision for income taxes of $150 million. The impact of U.S. Tax Reform primarily represents our provisional estimates of the one-time transition tax on earnings of certain foreign subsidiaries that were previously tax deferred, and the
38
impact of revaluing our U.S. deferred tax assets and liabilities based on the rates at which they are expected to reverse in the future. For U.S. federal purposes the corporate statutory income tax rate was reduced from 35% to 21%, effective for our 2018 tax year. The provisional impact of U.S. Tax Reform is our current best estimate based on a preliminary review of the new law and is subject to revision based on our existing accounting for income taxes policy as further information is gathered, and interpretation and analysis of the tax legislation evolves. The Securities and Exchange Commission has issued rules allowing for a measurement period of up to one year after the enactment date of U.S. Tax Reform to finalize the recording of the related tax impacts. Any future changes to our provisional estimated impact of U.S. Tax Reform will be included as an adjustment to the provision for income taxes.
Deferred tax assets are regularly assessed to determine the likelihood they will be recovered from future taxable income. A valuation allowance is established when we believe it is more likely than not the future realization of all or some of a deferred tax asset will not be achieved. In evaluating our ability to recover deferred tax assets within the jurisdiction which they arise, we consider all available positive and negative evidence. Factors reviewed include the cumulative pre-tax book income for the past three years, scheduled reversals of deferred tax liabilities, our history of earnings and reliability of our forecasts, projections of pre-tax book income over the foreseeable future, and the impact of any feasible and prudent tax planning strategies.
We recognize the impact of a tax position in our financial statements only if that position is more likely than not of being sustained upon examination by taxing authorities, based on the technical merits of the position. Tax authorities regularly examine our returns in the jurisdictions in which we do business and we regularly assess the tax risk of our return filing positions. Due to the complexity of some of the uncertainties, the ultimate resolution may result in payments that are materially different from our current estimate of the tax liability. These differences, as well as any interest and penalties, will be reflected in the provision for income taxes in the period in which they are determined.
Recent Accounting Pronouncements
For summary of recent accounting pronouncements applicable to our consolidated financial statement see note “1. Organization and Summary of Significant Accounting Policies” in Part II, Item 8, Notes to Consolidated Financial Statements, which is incorporated herein by reference.
ITEM 7A. | Quantitative and Qualitative Disclosures About Market Risk. |
Interest Rate Sensitivity
Our investment portfolio is exposed to market risk from changes in interest rates. The fair market value of fixed-rate securities may be adversely impacted by fluctuations in interest rates while income earned on floating rate securities may decline as a result of decreases in interest rates. Under our current policies, we do not use interest rate derivative instruments to manage exposure to interest rate changes. We attempt to ensure the safety and preservation of our invested principal funds by limiting default risk, market risk, and reinvestment risk. We mitigate default risk by investing in investment-grade securities. We have historically maintained a relatively short average maturity for our investment portfolio, and we believe a hypothetical 100 basis point adverse move in interest rates along the entire interest rate yield curve would not materially affect the fair value of our interest-sensitive financial instruments.
Changes in interest rates may impact gains or losses from the conversion of our outstanding convertible senior notes. In June 2014, we issued $633 million aggregate principal amount of 0% convertible senior notes due 2019 (2019 Notes) and $517 million aggregate principal amount of 0.5% convertible senior notes due 2021 (2021 Notes). At our election, the notes are convertible into cash, shares of our common stock, or a combination of cash and shares of our common stock under certain circumstances, including trading price conditions related to our common stock. If the trading price of our common stock reaches a price at 130% above the conversion price, the notes will become convertible. Upon conversion, we are required to record a gain or loss for the difference between the fair value of the debt to be extinguished and its corresponding net carrying value. The fair value of the debt to be extinguished depends on our then-current incremental borrowing rate. If our incremental borrowing rate at the time of conversion is higher or lower than the implied interest rate of the notes, we will record a gain or loss in our consolidated statement of income during the period in which the notes are converted. The implicit interest rates for the 2019 and 2021 Notes were 2.9% and 3.5%, respectively. An incremental borrowing rate that is a hypothetical 100 basis points lower than the implicit interest rate upon conversion of $100 million aggregate principal amount of each of the 2019 and 2021 Notes would result in losses of approximately $2 million and $3 million, respectively.
39
Foreign Currency Exchange Risk
We conduct a portion of our business in currencies other than our U.S. dollar functional currency. These transactions give rise to monetary assets and liabilities that are denominated in currencies other than the U.S. dollar. The value of these monetary assets and liabilities are subject to changes in currency exchange rates from the time the transactions are originated until settlement in cash. Our foreign currency exposures are primarily concentrated in the euro, Yen, Australian dollar, and Canadian dollar. Both realized and unrealized gains or losses on the value of these monetary assets and liabilities are included in the determination of net income.
We use forward exchange contracts to manage foreign currency risks related to monetary assets and liabilities denominated in currencies other than the U.S. dollar. We only use derivative financial instruments to reduce foreign currency exchange rate risks; we do not hold any derivative financial instruments for trading or speculative purposes. We primarily use forward exchange contracts to hedge foreign currency exposures, and they generally have terms of one month or less. Realized and unrealized gains or losses on the value of financial contracts entered into to hedge the exchange rate exposure of these monetary assets and liabilities are also included in the determination of net income, as they have not been designated for hedge accounting. These contracts, which settle monthly, effectively fix the exchange rate at which these specific monetary assets and liabilities will be settled, so that gains or losses on the forward contracts offset the gains or losses from changes in the value of the underlying monetary assets and liabilities. As of December 31, 2017, the total notional amount of outstanding forward contracts in place for foreign currency purchases was $88 million.
40
ITEM 8. | Financial Statements and Supplementary Data. |
INDEX TO CONSOLIDATED FINANCIAL STATEMENTS
Page | |
41
REPORT OF INDEPENDENT REGISTERED PUBLIC ACCOUNTING FIRM
The Board of Directors and Stockholders of Illumina, Inc.
Opinion on the Financial Statements
We have audited the accompanying consolidated balance sheets of Illumina, Inc. (the Company) as of December 31, 2017 and January 1, 2017, the related consolidated statements of income, comprehensive income, stockholders’ equity, and cash flows for each of the three fiscal years in the period ended December 31, 2017, and the related notes (collectively referred to as the “consolidated financial statements”). In our opinion, the consolidated financial statements present fairly, in all material respects, the financial position of the Company at December 31, 2017 and January 1, 2017, and the results of its operations and its cash flows for each of the three fiscal years in the period ended December 31, 2017, in conformity with U.S. generally accepted accounting principles.
We also have audited, in accordance with the standards of the Public Company Accounting Oversight Board (United States) (PCAOB), the Company’s internal control over financial reporting as of December 31, 2017, based on criteria established in Internal Control-Integrated Framework issued by the Committee of Sponsoring Organizations of the Treadway Commission (2013 framework) and our report dated February 12, 2018 expressed an unqualified opinion thereon.
Adoption of ASU No. 2016-09
As discussed in Note 1 to the consolidated financial statements, the Company changed its method of accounting for share-based payment transactions in 2017 due to the adoption of the amendments to the FASB Accounting Standards Codification resulting from Accounting Standards Update (ASU) No. 2016-09, Compensation - Stock Compensation (Topic 718): Improvements to Employee Share-Based Payment Accounting, effective January 2, 2017.
Basis for Opinion
These financial statements are the responsibility of the Company’s management. Our responsibility is to express an opinion on the Company’s financial statements based on our audits. We are a public accounting firm registered with the PCAOB and are required to be independent with respect to the Company in accordance with the U.S. federal securities laws and the applicable rules and regulations of the Securities and Exchange Commission and the PCAOB.
We conducted our audits in accordance with the standards of the PCAOB. Those standards require that we plan and perform the audit to obtain reasonable assurance about whether the financial statements are free of material misstatement, whether due to error or fraud. Our audits included performing procedures to assess the risks of material misstatement of the financial statements, whether due to error or fraud, and performing procedures that respond to those risks. Such procedures included examining, on a test basis, evidence regarding the amounts and disclosures in the financial statements. Our audits also included evaluating the accounting principles used and significant estimates made by management, as well as evaluating the overall presentation of the financial statements. We believe that our audits provide a reasonable basis for our opinion.
/s/ ERNST & YOUNG LLP
We have served as the Company’s auditor since 1998.
San Diego, California
February 12, 2018
42
ILLUMINA, INC.
CONSOLIDATED BALANCE SHEETS
(in millions, except par value)
December 31, 2017 | January 1, 2017 | ||||||
ASSETS | |||||||
Current assets: | |||||||
Cash and cash equivalents | $ | 1,225 | $ | 735 | |||
Short-term investments | 920 | 824 | |||||
Accounts receivable, net | 411 | 381 | |||||
Inventory | 333 | 300 | |||||
Prepaid expenses and other current assets | 91 | 78 | |||||
Total current assets | 2,980 | 2,318 | |||||
Property and equipment, net | 931 | 713 | |||||
Goodwill | 771 | 776 | |||||
Intangible assets, net | 175 | 243 | |||||
Deferred tax assets, net | 88 | 123 | |||||
Other assets | 312 | 108 | |||||
Total assets | $ | 5,257 | $ | 4,281 | |||
LIABILITIES AND STOCKHOLDERS’ EQUITY | |||||||
Current liabilities: | |||||||
Accounts payable | $ | 160 | $ | 138 | |||
Accrued liabilities | 432 | 342 | |||||
Build-to-suit lease liability | 144 | 223 | |||||
Long-term debt, current portion | 10 | 2 | |||||
Total current liabilities | 746 | 705 | |||||
Long-term debt | 1,182 | 1,056 | |||||
Other long-term liabilities | 360 | 206 | |||||
Commitments and contingencies | |||||||
Redeemable noncontrolling interests | 220 | 44 | |||||
Stockholders’ equity: | |||||||
Preferred stock, $0.01 par value, 10 million shares authorized; no shares issued and outstanding at December 31, 2017 and January 1, 2017 | — | — | |||||
Common stock, $0.01 par value, 320 million shares authorized; 191 million shares issued and 147 million outstanding at December 31, 2017; 189 million shares issued and 146 million outstanding at January 1, 2017 | 2 | 2 | |||||
Additional paid-in capital | 2,833 | 2,733 | |||||
Accumulated other comprehensive loss | (1 | ) | (1 | ) | |||
Retained earnings | 2,256 | 1,485 | |||||
Treasury stock, 44 million shares and 43 million shares at cost at December 31, 2017 and January 1, 2017, respectively | (2,341 | ) | (2,022 | ) | |||
Total Illumina stockholders’ equity | 2,749 | 2,197 | |||||
Noncontrolling interests | — | 73 | |||||
Total stockholders’ equity | 2,749 | 2,270 | |||||
Total liabilities and stockholders’ equity | $ | 5,257 | $ | 4,281 | |||
See accompanying notes to consolidated financial statements.
43
ILLUMINA, INC.
CONSOLIDATED STATEMENTS OF INCOME
(In millions, except per share amounts)
Years Ended | |||||||||||
December 31, 2017 | January 1, 2017 | January 3, 2016 | |||||||||
Revenue: | |||||||||||
Product revenue | $ | 2,289 | $ | 2,032 | $ | 1,891 | |||||
Service and other revenue | 463 | 366 | 329 | ||||||||
Total revenue | 2,752 | 2,398 | 2,220 | ||||||||
Cost of revenue: | |||||||||||
Cost of product revenue | 679 | 534 | 491 | ||||||||
Cost of service and other revenue | 208 | 155 | 134 | ||||||||
Amortization of acquired intangible assets | 39 | 43 | 46 | ||||||||
Total cost of revenue | 926 | 732 | 671 | ||||||||
Gross profit | 1,826 | 1,666 | 1,549 | ||||||||
Operating expense: | |||||||||||
Research and development | 546 | 504 | 401 | ||||||||
Selling, general and administrative | 674 | 584 | 516 | ||||||||
Legal contingencies | — | (9 | ) | 19 | |||||||
Total operating expense | 1,220 | 1,079 | 936 | ||||||||
Income from operations | 606 | 587 | 613 | ||||||||
Other income (expense): | |||||||||||
Interest income | 19 | 10 | 5 | ||||||||
Interest expense | (37 | ) | (33 | ) | (43 | ) | |||||
Cost-method investment gain, net | — | — | 16 | ||||||||
Other income (expense), net | 455 | (3 | ) | (8 | ) | ||||||
Total other income (expense), net | 437 | (26 | ) | (30 | ) | ||||||
Income before income taxes | 1,043 | 561 | 583 | ||||||||
Provision for income taxes | 365 | 133 | 125 | ||||||||
Consolidated net income | 678 | 428 | 458 | ||||||||
Add: Net loss attributable to noncontrolling interests | 48 | 35 | 4 | ||||||||
Net income attributable to Illumina stockholders | $ | 726 | $ | 463 | $ | 462 | |||||
Net income attributable to Illumina stockholders for earnings per share | $ | 725 | $ | 454 | $ | 462 | |||||
Earnings per share attributable to Illumina stockholders: | |||||||||||
Basic | $ | 4.96 | $ | 3.09 | $ | 3.19 | |||||
Diluted | $ | 4.92 | $ | 3.07 | $ | 3.10 | |||||
Shares used in computing earnings per share: | |||||||||||
Basic | 146 | 147 | 145 | ||||||||
Diluted | 148 | 148 | 149 | ||||||||
See accompanying notes to consolidated financial statements.
44
ILLUMINA, INC.
CONSOLIDATED STATEMENTS OF COMPREHENSIVE INCOME
(In millions)
Years Ended | ||||||||||||
December 31, 2017 | January 1, 2017 | January 3, 2016 | ||||||||||
Consolidated net income | $ | 678 | $ | 428 | $ | 458 | ||||||
Unrealized (loss) gain on available-for-sale securities, net of deferred tax | — | (1 | ) | 1 | ||||||||
Total consolidated comprehensive income | 678 | 427 | 459 | |||||||||
Add: Comprehensive loss attributable to noncontrolling interests | 48 | 35 | 4 | |||||||||
Comprehensive income attributable to Illumina stockholders | $ | 726 | $ | 462 | $ | 463 | ||||||
See accompanying notes to consolidated financial statements.
45
ILLUMINA, INC.
CONSOLIDATED STATEMENTS OF STOCKHOLDERS’ EQUITY
(In millions)
Illumina Stockholders | |||||||||||||||||||||||||||||||||
Additional | Accumulated Other | Total | |||||||||||||||||||||||||||||||
Common Stock | Paid-In | Comprehensive | Retained | Treasury Stock | Noncontrolling | Stockholders’ | |||||||||||||||||||||||||||
Shares | Amount | Capital | (Loss) Income | Earnings | Shares | Amount | Interests | Equity | |||||||||||||||||||||||||
Balance as of December 28, 2014 | 181 | $ | 2 | $ | 2,173 | $ | (1 | ) | $ | 560 | (38 | ) | $ | (1,271 | ) | $ | — | $ | 1,463 | ||||||||||||||
Net income | — | — | — | — | 462 | — | — | — | 462 | ||||||||||||||||||||||||
Unrealized gain on available-for-sale securities, net of deferred tax | — | — | — | 1 | — | — | — | — | 1 | ||||||||||||||||||||||||
Issuance of common stock, net of repurchases | 6 | — | 70 | — | — | (2 | ) | (402 | ) | — | (332 | ) | |||||||||||||||||||||
Share-based compensation | — | — | 133 | — | — | — | — | — | 133 | ||||||||||||||||||||||||
Net incremental tax benefit related to share-based compensation | — | — | 126 | — | — | — | — | — | 126 | ||||||||||||||||||||||||
Adjustment to the carrying value of redeemable noncontrolling interests | — | — | (4 | ) | — | — | — | — | — | (4 | ) | ||||||||||||||||||||||
Balance as of January 3, 2016 | 187 | 2 | 2,498 | — | 1,022 | (40 | ) | (1,673 | ) | — | 1,849 | ||||||||||||||||||||||
Net income (loss) | — | — | — | — | 463 | — | — | (14 | ) | 449 | |||||||||||||||||||||||
Unrealized loss on available-for-sale securities, net of deferred tax | — | — | — | (1 | ) | — | — | — | — | (1 | ) | ||||||||||||||||||||||
Issuance of common stock, net of repurchases | 2 | — | 47 | — | — | (3 | ) | (349 | ) | — | (302 | ) | |||||||||||||||||||||
Share-based compensation | — | — | 129 | — | — | — | — | — | 129 | ||||||||||||||||||||||||
Net incremental tax benefit related to share-based compensation | — | — | 87 | — | — | — | — | — | 87 | ||||||||||||||||||||||||
Adjustment to the carrying value of redeemable noncontrolling interests | — | — | (21 | ) | — | — | — | — | — | (21 | ) | ||||||||||||||||||||||
Vesting of redeemable equity awards | — | — | (2 | ) | — | — | — | — | — | (2 | ) | ||||||||||||||||||||||
Issuance of subsidiary shares in business combination | — | — | 2 | — | — | — | — | — | 2 | ||||||||||||||||||||||||
Issuance of treasury stock | — | — | 3 | — | — | — | — | — | 3 | ||||||||||||||||||||||||
Contributions from noncontrolling interest owners | — | — | — | — | — | — | — | 80 | 80 | ||||||||||||||||||||||||
Proceeds from early exercise of equity awards from a subsidiary | — | — | — | — | — | — | — | 7 | 7 | ||||||||||||||||||||||||
Tax impact of deemed dividend from GRAIL | — | — | (10 | ) | — | — | — | — | — | (10 | ) | ||||||||||||||||||||||
Balance as of January 1, 2017 | 189 | 2 | 2,733 | (1 | ) | 1,485 | (43 | ) | (2,022 | ) | 73 | 2,270 | |||||||||||||||||||||
Net income (loss) | — | — | — | — | 726 | — | — | (7 | ) | 719 | |||||||||||||||||||||||
Issuance of common stock, net of repurchases | 2 | — | 71 | — | — | (1 | ) | (319 | ) | — | (248 | ) | |||||||||||||||||||||
Share-based compensation | — | — | 164 | — | — | — | — | — | 164 | ||||||||||||||||||||||||
Adjustment to the carrying value of redeemable noncontrolling interests | — | — | (136 | ) | — | — | — | — | — | (136 | ) | ||||||||||||||||||||||
Vesting of redeemable equity awards | — | — | (13 | ) | — | — | — | — | — | (13 | ) | ||||||||||||||||||||||
Cumulative-effect adjustment from adoption of ASU 2016-09 | — | — | 3 | — | 45 | — | — | — | 48 | ||||||||||||||||||||||||
Deconsolidation of GRAIL | — | — | 11 | — | — | — | — | (66 | ) | (55 | ) | ||||||||||||||||||||||
Balance as of December 31, 2017 | 191 | $ | 2 | $ | 2,833 | $ | (1 | ) | $ | 2,256 | (44 | ) | $ | (2,341 | ) | $ | — | $ | 2,749 | ||||||||||||||
See accompanying notes to consolidated financial statements.
46
ILLUMINA, INC. CONSOLIDATED STATEMENTS OF CASH FLOWS (In millions) | |||||||||||
Years Ended | |||||||||||
December 31, 2017 | January 1, 2017 | January 3, 2016 | |||||||||
Cash flows from operating activities: | |||||||||||
Consolidated net income | $ | 678 | $ | 428 | $ | 458 | |||||
Adjustments to reconcile net income to net cash provided by operating activities: | |||||||||||
Gain on deconsolidation of GRAIL | (453 | ) | — | — | |||||||
Depreciation expense | 110 | 90 | 73 | ||||||||
Amortization of intangible assets | 46 | 51 | 54 | ||||||||
Share-based compensation expense | 164 | 129 | 133 | ||||||||
Accretion of debt discount | 30 | 30 | 39 | ||||||||
Deferred income tax expense | 81 | 94 | 81 | ||||||||
Impairment of intangible assets | 23 | — | — | ||||||||
Cost-method investment gain, net | — | — | (16 | ) | |||||||
Gain on litigation settlement | — | (11 | ) | — | |||||||
Other | 1 | 13 | 4 | ||||||||
Changes in operating assets and liabilities: | |||||||||||
Accounts receivable | (26 | ) | 3 | (96 | ) | ||||||
Inventory | (33 | ) | (30 | ) | (81 | ) | |||||
Prepaid expenses and other current assets | 8 | (1 | ) | (11 | ) | ||||||
Other assets | (5 | ) | (7 | ) | (2 | ) | |||||
Accounts payable | 10 | (2 | ) | 46 | |||||||
Accrued liabilities | 81 | (24 | ) | 99 | |||||||
Other long-term liabilities | 160 | 16 | 5 | ||||||||
Net cash provided by operating activities | 875 | 779 | 786 | ||||||||
Cash flows from investing activities: | |||||||||||
Purchases of available-for-sale securities | (742 | ) | (895 | ) | (797 | ) | |||||
Sales of available-for-sale securities | 322 | 543 | 582 | ||||||||
Maturities of available-for-sale securities | 321 | 140 | 294 | ||||||||
Net cash paid for acquisitions | — | (18 | ) | (37 | ) | ||||||
Proceeds from sale of GRAIL securities | 278 | — | — | ||||||||
Deconsolidation of GRAIL cash | (52 | ) | — | — | |||||||
Net purchases of strategic investments | (29 | ) | (14 | ) | (6 | ) | |||||
Purchases of property and equipment | (310 | ) | (260 | ) | (143 | ) | |||||
Cash paid for intangible assets | (2 | ) | (11 | ) | — | ||||||
Net cash used in investing activities | (214 | ) | (515 | ) | (107 | ) | |||||
Cash flows from financing activities: | |||||||||||
Payments on financing obligations | (9 | ) | (66 | ) | (245 | ) | |||||
Payments on acquisition-related contingent consideration liability | (3 | ) | (29 | ) | (3 | ) | |||||
Proceeds from issuance of debt | 5 | 5 | — | ||||||||
Common stock repurchases | (251 | ) | (249 | ) | (274 | ) | |||||
Taxes paid related to net share settlement of equity awards | (68 | ) | (100 | ) | (127 | ) | |||||
Proceeds from issuance of common stock | 71 | 47 | 72 | ||||||||
Proceeds from early exercise of equity awards from a subsidiary | — | 7 | — | ||||||||
Contributions from noncontrolling interest owners | 79 | 89 | 32 | ||||||||
Net cash used in financing activities | (176 | ) | (296 | ) | (545 | ) | |||||
47
ILLUMINA, INC. CONSOLIDATED STATEMENTS OF CASH FLOWS — (Continued) (In thousands) | |||||||||||
Years Ended | |||||||||||
December 31, 2017 | January 1, 2017 | January 3, 2016 | |||||||||
Effect of exchange rate changes on cash and cash equivalents | 5 | (2 | ) | (1 | ) | ||||||
Net increase (decrease) in cash and cash equivalents | 490 | (34 | ) | 133 | |||||||
Cash and cash equivalents at beginning of year | 735 | 769 | 636 | ||||||||
Cash and cash equivalents at end of year | $ | 1,225 | $ | 735 | $ | 769 | |||||
Supplemental cash flow information: | |||||||||||
Cash paid for income taxes | $ | 149 | $ | 60 | $ | 17 | |||||
See accompanying notes to consolidated financial statements.
48
ILLUMINA, INC.
NOTES TO CONSOLIDATED FINANCIAL STATEMENTS
Unless the context requires otherwise, references in this report to “Illumina,” “we,” “us,” the “Company,” and “our” refer to Illumina, Inc. and its consolidated subsidiaries.
1. | Organization and Summary of Significant Accounting Policies |
Organization and Business
Illumina, Inc. is a provider of sequencing- and array-based solutions, which serves customers in a broad range of markets, enabling the adoption of genomic solutions in research and clinical settings. Our customers include leading genomic research centers, academic institutions, government laboratories, and hospitals, as well as pharmaceutical, biotechnology, agrigenomics, commercial molecular diagnostic laboratories, and consumer genomics companies.
Basis of Presentation
The consolidated financial statements have been prepared in conformity with U.S. generally accepted accounting principles and include our accounts and our wholly-owned subsidiaries, majority-owned or controlled companies, and variable interest entities (VIEs) for which we are the primary beneficiary. All intercompany transactions and balances have been eliminated in consolidation.
We evaluate our ownership, contractual and other interests in entities that are not wholly-owned by us to determine if these entities are VIEs, and, if so, whether we are the primary beneficiary of the VIE. In determining whether we are the primary beneficiary of a VIE and therefore required to consolidate the VIE, we apply a qualitative approach that determines whether we have both (1) the power to direct the activities of the VIE that most significantly impact the VIE’s economic performance and (2) the obligation to absorb losses of, or the rights to receive benefits from, the VIE that could potentially be significant to that VIE. We continuously assess whether we are the primary beneficiary of a VIE as changes to existing relationships or future transactions may result in the consolidation or deconsolidation, as the case may be, of such VIE. We have not provided financial or other support during the periods presented to our VIEs that we were not previously contractually required to provide.
The equity method is used to account for investments in which we have the ability to exercise significant influence, but not control, over the investee. Such investments are recorded within other assets, and the share of net income or losses of equity investments is recognized on a one quarter lag in other income (expense), net.
Redeemable Noncontrolling Interests
Noncontrolling interests represent the portion of equity (net assets) in a consolidated entity that is not wholly-owned by us that is not attributable, directly or indirectly, to us. Noncontrolling interests with embedded contingent redemption features, such as put rights, that are not solely within our control are considered redeemable noncontrolling interests. Redeemable noncontrolling interests are presented outside of stockholders’ equity on the consolidated balance sheets.
Fiscal Year
Our fiscal year is 52 or 53 weeks ending the Sunday closest to December 31, with quarters of 13 or 14 weeks ending the Sunday closest to March 31, June 30, September 30, and December 31. The years ended December 31, 2017 and January 1, 2017 were 52 weeks and the year ended January 3, 2016 was 53 weeks.
Reclassifications
Certain prior period amounts have been reclassified to conform to the current period presentation.
Use of Estimates
The preparation of financial statements requires that management make estimates and assumptions that affect the reported amounts of assets, liabilities, revenues, expenses, and related disclosures of contingent assets and liabilities. Actual results could differ from those estimates.
49
Recently Adopted Accounting Pronouncements
In March 2016, the Financial Accounting Standards Board issued Accounting Standard Update (ASU) 2016-09, Compensation - Stock Compensation (Topic 718), which aims to simplify the accounting for share-based payment transactions, including accounting for income taxes, classification on the statement of cash flows, accounting for forfeitures, and classification of awards as either liabilities or equity. This ASU was effective for us beginning in the first quarter of 2017.
This new standard increases the volatility of net income by requiring excess tax benefits from share-based payment arrangements to be classified as discrete items within the provision for income taxes, rather than recognizing excess tax benefits in additional paid-in capital. Upon adoption in Q1 2017, we recorded $45 million, net, to retained earnings, primarily related to unrealized tax benefits associated with share-based compensation. During the year ended December 31, 2017, excess tax benefits of $52 million were reflected as a component of the provision for income taxes. Also, as a result of the adoption of this new standard, we made an accounting policy election to recognize forfeitures as they occur and will no longer estimate expected forfeitures.
In addition, excess income tax benefits from share-based compensation arrangements are classified as cash flow from operations, rather than cash flow from financing activities. We elected to apply the cash flow classification guidance retrospectively and reclassified $91 million and $127 million from financing activity to operating activity for the years ended January 1, 2017 and January 3, 2016, respectively.
Recently Issued Accounting Pronouncements
In May 2014, the Financial Accounting Standards Board issued ASU 2014-09, Revenue from Contracts with Customers (Topic 606). The new standard is based on the principle that revenue should be recognized in an amount that reflects the consideration to which the entity expects to be entitled in exchange for the transfer of promised goods or services.
ASU 2014-09 and all subsequent amendments (collectively, the “new standards”) may be applied using either the full retrospective method, in which case the standard would be applied to each prior reporting period presented, or the modified retrospective method, in which case the cumulative effect of applying the standard would be recognized at the date of initial application. We will adopt the standards beginning the first quarter of 2018 using the modified retrospective method.
We have completed our assessment of the new standards and are finalizing the new required disclosures. Overall, we do not expect the timing of revenue recognition under the new standards to be materially different from our current revenue recognition policy. Based on our analysis of open contracts as of December 31, 2017, the cumulative effect of applying the new standards is not material.
In January 2016, the Financial Accounting Standards Board issued ASU 2016-01, Financial Instruments - Overall (Subtopic 825-10), which requires equity investments (other than those accounted for under the equity method or those that result in consolidation) to be measured at fair value, with changes in fair value recognized in net income. A measurement alternative may be elected for equity investments that do not have readily determinable fair values. Under the alternative, equity investments are measured at cost, less any impairment, plus or minus changes resulting from observable price changes in orderly transactions for an identical or similar investment of the same issuer. ASU 2016-01 will be effective for us beginning in the first quarter of 2018.
We expect to elect the measurement alternative for our cost-method investments. This election is applied prospectively and does not result in an adjustment to retained earnings. We anticipate that the adoption of ASU 2016-01 may increase the volatility of other income and expense, net, as a result of any remeasurement of our cost-method investments.
In February 2016, the Financial Accounting Standards Board issued Accounting Standard Update (ASU) 2016-02, Leases (Topic 842). The new standard requires lessees to recognize most leases on their balance sheet as lease liabilities with corresponding right-of-use assets and eliminates certain real estate-specific provisions. ASU 2016-02 will be effective for us beginning in the first quarter of 2019. ASU 2016-02 will be adopted on a modified retrospective transition basis for leases existing at, or entered into after, the beginning of the earliest comparative period presented in the financial statements. We are currently evaluating the impact of ASU 2016-02 on the consolidated financial statements.
50
In June 2016, the FASB issued Accounting Standards Update (ASU) 2016-13, Financial Instruments - Credit Losses: Measurement of Credit Losses on Financial Instruments, which amends the impairment model by requiring entities to use a forward-looking approach based on expected losses to estimate credit losses on certain types of financial instruments, including trade receivables and available for sale debt securities. The ASU is effective for us beginning in the first quarter of 2020, with early adoption permitted. We are currently evaluating the impact of ASU 2016-13 on the consolidated financial statements.
Concentrations of Risk
We operate in markets that are highly competitive and rapidly changing. Significant technological changes, shifting customer needs, the emergence of competitive products or services with new capabilities, and other factors could negatively impact our operating results. A portion of our customers consist of university and research institutions that management believes are, to some degree, directly or indirectly supported by the United States Government. A significant change in current research funding, particularly with respect to the U.S. National Institutes of Health, could have an adverse impact on future revenues and results of operations.
We are also subject to risks related to our financial instruments including cash and cash equivalents, investments, and accounts receivable. Most of our cash and cash equivalents as of December 31, 2017 were deposited with U.S. financial institutions, either domestically or with their foreign branches. Our investment policy restricts the amount of credit exposure to any one issuer to 5% of the portfolio or 5% of the total issue size outstanding at the time of purchase and to any one industry sector, as defined by Clearwater Analytics (Industry Sector Report), to 30% of the portfolio at the time of purchase. There is no limit to the percentage of the portfolio that may be maintained in debt securities in U.S. government-sponsored entities, U.S. Treasury securities, and money market funds.
We require customized products and components that currently are available from a limited number of sources. We source certain key products and components included in our products from single vendors.
We perform regular reviews of customer activity and associated credit risks and do not require collateral or enter into netting arrangements. Shipments to customers outside the United States comprised 45%, 46%, and 46% of total revenue for the years ended December 31, 2017, January 1, 2017, and January 3, 2016, respectively. Customers outside the United States represented 48% of gross trade accounts receivable balance at both December 31, 2017 and January 1, 2017.
International sales entail a variety of risks, including currency exchange fluctuations, longer payment cycles, and greater difficulty in accounts receivable collection. We are also subject to general geopolitical risks, such as political, social and economic instability, and changes in diplomatic and trade relations. The risks of international sales are mitigated in part by the extent to which sales are geographically distributed. We have historically not experienced significant credit losses from investments and accounts receivable.
Fair Value Measurements
The fair value of assets and liabilities are based on the exchange price that would be received for an asset or paid to transfer a liability (an exit price) in the principal or most advantageous market for the asset or liability in an orderly transaction between market participants on the measurement date. Valuation techniques used to measure fair value maximize the use of observable inputs and minimize the use of unobservable inputs. We use a fair value hierarchy with three levels of inputs, of which the first two are considered observable and the last unobservable, to measure fair value:
• | Level 1 — Quoted prices in active markets for identical assets or liabilities. |
• | Level 2 — Inputs, other than Level 1, that are observable, either directly or indirectly, such as quoted prices for similar assets or liabilities; quoted prices in markets that are not active; or other inputs that are observable or can be corroborated by observable market data for substantially the full term of the assets or liabilities. |
• | Level 3 — Unobservable inputs that are supported by little or no market activity and that are significant to the fair value of the assets or liabilities. |
The carrying amounts of financial instruments such as cash and cash equivalents, accounts receivable, prepaid expenses and other current assets, accounts payable, and accrued liabilities, excluding acquisition-related contingent consideration liabilities, approximate the related fair values due to the short-term maturities of these instruments.
51
Functional Currency
The U.S. dollar is the functional currency of our international operations. We re-measure foreign subsidiaries’ monetary assets and liabilities to the U.S. dollar and record the net gains or losses resulting from re-measurement in other income (expense), net in the consolidated statements of income.
Acquisitions
All assets acquired and liabilities assumed, including contingent consideration and all contractual contingencies, are measured at fair value as of the acquisition date. Contingent purchase consideration to be settled in cash are re-measured to estimated fair value at each reporting period with the change in fair value recorded in selling, general and administrative expenses. In addition, in-process research and development (IPR&D) is capitalized and either amortized over the life of the product upon commercialization, or impaired if the project is abandoned. Post-acquisition adjustments in deferred tax asset valuation allowances and liabilities for uncertain tax positions are recorded in current period income tax expense.
Cash Equivalents and Short-Term Investments
Cash equivalents are comprised of short-term, highly-liquid investments with maturities of 90 days or less at the date of purchase.
Short-term investments consist predominantly of debt securities in U.S. government-sponsored entities, corporate debt securities, and U.S. Treasury securities. We classify short-term investments as available-for-sale at the time of purchase and evaluate such classification as of each balance sheet date. All short-term investments are recorded at estimated fair value. Unrealized gains and losses for available-for-sale securities are included in accumulated other comprehensive income, a component of stockholders’ equity. We evaluate our investments to assess whether those with unrealized loss positions are other than temporarily impaired. Impairments are considered to be other than temporary if they are related to deterioration in credit risk or if it is likely that the securities will be sold before the recovery of their cost basis. Realized gains, losses, and declines in value judged to be other than temporary are determined based on the specific identification method and are reported in interest income in the consolidated statements of income.
Accounts Receivable
Trade accounts receivable are recorded at the net invoice value and are not interest bearing. Receivables are considered past due based on the contractual payment terms. We reserve specific receivables if collectibility is no longer reasonably assured. We also reserve a percentage of trade receivable balance based on collection history and current economic trends that might impact the level of future credit losses. These reserves are re-evaluated on a regular basis and adjusted as needed. Once a receivable is deemed to be uncollectible, such balance is charged against the reserve.
Inventory
Inventory is stated at the lower of cost or net realizable value, on a first-in, first-out basis. Inventory includes raw materials and finished goods that may be used in the research and development process and such items are expensed as consumed or expired. Provisions for slow-moving, excess, and obsolete inventories are estimated based on product life cycles, quality issues, historical experience, and usage forecasts.
Property and Equipment
Property and equipment are stated at cost, subject to review for impairment, and depreciated over the estimated useful lives of the assets, using the straight-line method. Depreciation of leasehold improvements is recorded over the shorter of the lease term or the estimated useful life of the related assets. Amortization of assets that are recorded under capital leases are included in depreciation expense. Maintenance and repairs are expensed as incurred. When assets are sold, or otherwise disposed of, the cost and related accumulated depreciation are removed from the accounts and any gain or loss is included in operating expense.
52
Costs incurred to develop internal-use software during the application development stage are recorded as computer software costs, at cost. Costs incurred in the development of such internal-use software, including external direct costs of materials and services and applicable compensation costs of employees devoted to specific software application development are capitalized. Cost incurred outside of the application development stage are expensed as incurred.
The estimated useful lives of the major classes of property and equipment are generally as follows:
Estimated Useful Lives | |
Building and leasehold improvements | 4 to 30 years |
Machinery and equipment | 3 to 5 years |
Computer hardware and software | 3 to 7 years |
Furniture and fixtures | 7 years |
Leases
Leases are reviewed and classified as capital or operating at their inception. Additionally, we evaluate whether we are the accounting owner during the construction period when we are involved in the construction of leased assets. For leases where we are the deemed accounting owner during the construction period, we record project construction costs paid or reimbursed by the landlord as construction in progress and a corresponding build-to-suit lease liability. For operating leases, rent expense is recorded on a straight-line basis over the term of the lease, which includes the construction build-out period and lease extension periods, if appropriate. The difference between rent payments and straight-line rent expense is recorded as deferred rent in accrued liabilities and other long-term liabilities. Lease incentives are amortized on a straight-line basis over the lease term as a reduction to rent expense. Leasehold improvements are capitalized and amortized over the shorter of the lease term or expected useful lives.
Goodwill, Intangible Assets and Other Long-Lived Assets
Goodwill, which has an indefinite useful life, represents the excess of cost over fair value of net assets acquired. Goodwill is reviewed for impairment at least annually during the second quarter, or more frequently if an event occurs indicating the potential for impairment. During the goodwill impairment review, we assess qualitative factors to determine whether it is more likely than not that the fair value of our reporting unit is less than the carrying amount, including goodwill. The qualitative factors include, but are not limited to, macroeconomic conditions, industry and market considerations, and the overall financial performance. If, after assessing the totality of these qualitative factors, we determine that it is not more likely than not that the fair value of our reporting unit is less than the carrying amount, then no additional assessment is deemed necessary. Otherwise, we proceed to perform the two-step test for goodwill impairment. The first step involves comparing the estimated fair value of the reporting unit with the carrying value, including goodwill. If the carrying amount of the reporting unit exceeds the fair value, the second step of the goodwill impairment test is performed to determine the amount of loss, which involves comparing the implied fair value of the goodwill to the carrying value of the goodwill. We may also elect to bypass the qualitative assessment in a period and elect to proceed to perform the first step of the goodwill impairment test. We performed the annual assessment for goodwill impairment in the second quarter of 2017, noting no impairment.
Our identifiable intangible assets are typically comprised of acquired core technologies, licensed technologies, customer relationships, license agreements, and trade names. The cost of identifiable intangible assets with finite lives is generally amortized on a straight-line basis over the assets’ respective estimated useful lives.
We regularly perform reviews to determine if any event has occurred that may indicate that intangible assets with finite useful lives and other long-lived assets are potentially impaired. If indicators of impairment exist, an impairment test is performed to assess the recoverability of the affected assets by determining whether the carrying amount of such assets exceeds the undiscounted expected future cash flows. If the affected assets are not recoverable, we estimate the fair value of the assets and record an impairment loss if the carrying value of the assets exceeds the fair value. Factors that may indicate potential impairment include a significant decline in our stock price and market capitalization compared to the net book value, significant changes in the ability of a particular asset to generate positive cash flows for our strategic business objectives, and the pattern of utilization of a particular asset.
53
During the year ended December 31, 2017, we performed a recoverability test when the planned use of a finite-lived acquired intangible asset changed, resulting in an impairment charge of $18 million recorded in cost of product revenue. Also, during the year ended December 31, 2017, we recorded a $5 million impairment charge of in-process research and development as the project had no future alternative use. Such impairments were recorded within the Core Illumina reportable segment. See further discussion of our segments in note “11. Segment Information, Geographic Data, and Significant Customers.”
Derivatives
We are exposed to foreign exchange rate risks in the normal course of business. We enter into foreign exchange contracts to manage foreign currency risks related to monetary assets and liabilities that are denominated in currencies other than the U.S. dollar. These foreign exchange contracts are carried at fair value in other current assets or accrued liabilities and are not designated as hedging instruments. Changes in the value of the derivatives are recognized in other income (expense), net, along with the re-measurement gain or loss on the foreign currency denominated assets or liabilities.
As of December 31, 2017, we had foreign exchange forward contracts in place to hedge exposures in the euro, Japanese yen, Australian dollar, and Canadian dollar. As of December 31, 2017 and January 1, 2017, the total notional amount of outstanding forward contracts in place for foreign currency purchases was $88 million and $69 million, respectively.
Warranties
We generally provide a one-year warranty on instruments. Additionally, a warranty on consumables is provided through the expiration date, which generally ranges from six to twelve months after the manufacture date. At the time revenue is recognized, an accrual is established for estimated warranty expenses based on historical experience as well as anticipated product performance. We periodically review the warranty reserve for adequacy and adjust the warranty accrual, if necessary, based on actual experience and estimated costs to be incurred. Warranty expense is recorded as a component of cost of product revenue.
Revenue Recognition
Revenue is generated primarily from the sale of products and services. Product revenue primarily consists of sales of instruments and consumables used in genetic analysis. Service and other revenue primarily consists of revenue generated from genotyping and sequencing services and instrument service contracts.
Revenue is recognized when persuasive evidence of an arrangement exists, delivery has occurred or services have been rendered, the seller’s price to the buyer is fixed or determinable, and collectibility is reasonably assured. In instances where final acceptance of the product or system is required, revenue is deferred until all the acceptance criteria have been met. We occasionally offer discounts on newly-introduced products to recent customers of existing products. Where applicable, a portion of revenue is deferred on the sales of existing products in recognition of the promotional discounts until the delivery of new products. All revenue is recorded net of discounts and sales taxes collected on behalf of governmental authorities.
Revenue from product sales is recognized generally upon transfer of title to the customer, provided that no significant obligations remain and collection of the receivable is reasonably assured. Revenue from instrument service contracts is recognized as the services are rendered, typically evenly over the contract term. Revenue from genotyping and sequencing services is recognized when earned, which is generally at the time the genotyping or sequencing analysis data is made available to the customer or agreed-upon milestones are reached.
In order to assess whether the price is fixed or determinable, we evaluate whether an arrangement is cancellable or subject to future changes in price, deliverables, or other terms. If it is determined that the price is not fixed or determinable, revenue recognition is deferred until the price becomes fixed or determinable. The collectibility is assessed based on a number of factors, including past transaction history with, and the creditworthiness of, the customer. If the collection of a payment is not determined to be reasonably assured, revenue recognition is deferred until receipt of payment.
We regularly enter into contracts where revenue is derived from multiple deliverables including products or services. These products or services are generally delivered within a short time frame, approximately three to six months, after the contract execution date. Revenue recognition for contracts with multiple deliverables is based on the individual units of accounting determined to exist in the contract. A delivered item is considered a separate unit of accounting when the delivered
54
item has value to the customer on a stand-alone basis. Items are considered to have stand-alone value when they are sold separately by any vendor or when the customer could resell the item on a stand-alone basis.
For transactions with multiple deliverables, consideration is allocated at the inception of the contract to all deliverables based on their relative selling price. The relative selling price for each deliverable is determined using vendor-specific objective evidence (VSOE) of selling price or third-party evidence of selling price if VSOE does not exist. If neither VSOE nor third-party evidence exists, our best estimate of the selling price is used for the deliverable.
In order to establish VSOE of selling price, the product or service must be regularly sold on a stand-alone basis with a substantial majority priced within a relatively narrow range. VSOE of selling price is usually the midpoint of that range. If there are not a sufficient number of stand-alone sales and VSOE of selling price cannot be determined, we consider whether third-party evidence can be used to establish selling price. Due to the lack of similar products and services sold by other companies within the industry, we have rarely established selling price using third-party evidence. If neither VSOE nor third-party evidence of selling price exists, we determine our best estimate of selling price using average selling prices over a rolling 12-month period coupled with an assessment of current market conditions. If the product or service has no history of sales or if the sales volume is not sufficient, we rely upon prices set by our pricing committee adjusted for applicable discounts. Revenue for delivered elements is recognized only when there are no uncertainties regarding customer acceptance.
In certain markets, products and services are sold to customers through distributors that specialize in life science products. In most sales through distributors, the product is delivered directly to customers. In cases where the product is delivered to a distributor, revenue recognition is deferred until acceptance is received from the distributor, and/or the end-user, if required by the applicable sales contract. The terms of sales transactions through distributors are consistent with the terms of direct sales to customers. These transactions are accounted for in accordance with our revenue recognition policy described herein.
Share-Based Compensation
Share-based compensation expense is incurred related to restricted stock, Employee Stock Purchase Plan (ESPP), and stock options.
Restricted stock units (RSU) and performance stock units (PSU) are both considered restricted stock. The fair value of restricted stock is determined by the closing market price of our common stock on the date of grant. Share-based compensation expense is recognized based on the fair value on a straight-line basis over the requisite service periods of the awards. PSU represents a right to receive a certain number of shares of common stock based on the achievement of corporate performance goals and continued employment during the vesting period. At each reporting period, we reassess the probability of the achievement of such corporate performance goals and any additional expenses resulting from an adjustment in the estimated shares to be released are treated as a cumulative catch-up in the period of adjustment.
The Black-Scholes-Merton option-pricing model is used to estimate the fair value of stock awards under ESPP. The model assumptions include expected volatility, term, dividends, and the risk-free interest rate. The expected volatility is determined by equally weighing the historical and implied volatility of our common stock. The historical volatility is generally commensurate with the estimated expected term of the stock awards, adjusted for the impact of unusual fluctuations and other relevant factors. The implied volatility is calculated from the implied market volatility of exchange-traded call options on our common stock. The expected term of an award is based on historical forfeiture experience, exercise activity, and on the terms and conditions of the stock awards. The expected dividend yield is determined to be 0% given that we have never declared or paid cash dividends on our common stock and do not anticipate paying such cash dividends. The risk-free interest rate is based upon U.S. Treasury securities with remaining terms similar to the expected term of the share-based awards.
Forfeitures are accounted for as incurred as reversal of any share-based compensation expense related to awards that will not vest.
Shipping and Handling Expenses
Shipping and handling expenses are included in cost of product revenue.
Research and Development
55
Research and development expenses include personnel expenses, contractor fees, license fees, facilities costs, and utilities. Expenditures relating to research and development are expensed in the period incurred.
Advertising Costs
Advertising costs are expensed as incurred. Advertising costs were $30 million, $20 million, and $19 million for the years ended December 31, 2017, January 1, 2017, and January 3, 2016, respectively.
Income Taxes
The provision for income taxes is computed using the asset and liability method, under which deferred tax assets and liabilities are recognized for the expected future tax consequences of temporary differences between the financial reporting and tax bases of assets and liabilities, and for the expected future tax benefit to be derived from tax loss and credit carryforwards. Deferred tax assets and liabilities are determined using the enacted tax rates in effect for the years in which those tax assets are expected to be realized. The effect of a change in tax rates on deferred tax assets and liabilities is recognized in the provision for income taxes in the period that includes the enactment date.
Deferred tax assets are regularly assessed to determine the likelihood they will be recovered from future taxable income. A valuation allowance is established when we believe it is more likely than not the future realization of all or some of a deferred tax asset will not be achieved. In evaluating the ability to recover deferred tax assets within the jurisdiction which they arise, we consider all available positive and negative evidence. Factors reviewed include the cumulative pre-tax book income for the past three years, scheduled reversals of deferred tax liabilities, history of earnings and reliable forecasting, projections of pre-tax book income over the foreseeable future, and the impact of any feasible and prudent tax planning strategies.
The impact of a tax position is recognized in the financial statements only if that position is more likely than not of being sustained upon examination by taxing authorities, based on the technical merits of the position. Any interest and penalties related to uncertain tax positions will be reflected in income tax expense.
Earnings per Share
Basic earnings per share attributable to Illumina stockholders is computed based on the weighted average number of common shares outstanding during the period. Diluted earnings per share attributable to Illumina stockholders is computed based on the sum of the weighted average number of common shares and potentially dilutive common shares outstanding during the period. Per-share earnings of our VIEs are included in the consolidated basic and diluted earnings per share computations based on our share of the VIE’s securities.
Potentially dilutive common shares consist of shares issuable under convertible senior notes and equity awards. Convertible senior notes have a dilutive impact when the average market price of our common stock exceeds the applicable conversion price of the respective notes. Potentially dilutive common shares from equity awards are determined using the average share price for each period under the treasury stock method. In addition, proceeds from exercise of equity awards and the average amount of unrecognized compensation expense for equity awards are assumed to be used to repurchase shares.
The following table presents the calculation of weighted average shares used to calculate basic and diluted earnings per share (in millions):
Years Ended | ||||||||
December 31, 2017 | January 1, 2017 | January 3, 2016 | ||||||
Weighted average shares outstanding | 146 | 147 | 145 | |||||
Effect of potentially dilutive common shares from: | ||||||||
Convertible senior notes | — | — | 2 | |||||
Equity awards | 2 | 1 | 2 | |||||
Weighted average shares used in calculating diluted earnings per share | 148 | 148 | 149 | |||||
56
Accumulated Other Comprehensive Loss
Comprehensive income is comprised of net income and other comprehensive income. Accumulated other comprehensive loss on the consolidated balance sheets at December 31, 2017 and January 1, 2017 includes accumulated foreign currency translation adjustments and unrealized gains and losses on the available-for-sale securities.
The components of accumulated other comprehensive income (loss) are as follows (in millions):
December 31, 2017 | January 1, 2017 | ||||||
Foreign currency translation adjustments | $ | 1 | $ | 1 | |||
Unrealized loss on available-for-sale securities, net of deferred tax | (2 | ) | (2 | ) | |||
Total accumulated other comprehensive loss | $ | (1 | ) | $ | (1 | ) | |
2. | Balance Sheet Account Details |
Short-Term Investments
The following is a summary of short-term investments (in millions):
December 31, 2017 | January 1, 2017 | ||||||||||||||||||||||
Amortized Cost | Gross Unrealized Losses | Estimated Fair Value | Amortized Cost | Gross Unrealized Losses | Estimated Fair Value | ||||||||||||||||||
Available-for-sale securities: | |||||||||||||||||||||||
Debt securities in government-sponsored entities | $ | 67 | $ | — | $ | 67 | $ | 34 | $ | — | $ | 34 | |||||||||||
Corporate debt securities | 423 | (2 | ) | 421 | 478 | (2 | ) | 476 | |||||||||||||||
U.S. Treasury securities | 433 | (1 | ) | 432 | 316 | (2 | ) | 314 | |||||||||||||||
Total available-for-sale securities | $ | 923 | $ | (3 | ) | $ | 920 | $ | 828 | $ | (4 | ) | $ | 824 | |||||||||
Contractual maturities of available-for-sale debt securities as of December 31, 2017 are as follows (in millions):
Estimated Fair Value | |||
Due within one year | $ | 686 | |
After one but within five years | 234 | ||
Total | $ | 920 | |
We have the ability, if necessary, to liquidate any of our cash equivalents and short-term investments in order to meet our liquidity needs in the next 12 months. Accordingly, those investments with contractual maturities greater than one year from the date of purchase nonetheless are classified as short-term on the accompanying consolidated balance sheets.
Strategic Investments
As of December 31, 2017 and January 1, 2017, the aggregate carrying amounts of our cost-method investments in non-publicly traded companies were $250 million and $57 million, respectively, included in other assets. Revenue recognized from transactions with such companies were $127 million, $56 million, and $61 million for the years ended December 31, 2017, January 1, 2017, and January 3, 2016, respectively.
Cost-method investments are assessed for impairment quarterly. We determine that it is not practicable to estimate the fair value of the cost-method investments on a regular basis and do not reassess the fair value of cost-method investments unless there are identified events or changes in circumstances that may have a significant adverse effect on the fair value of the investments. No material impairment losses were recorded during the years ended December 31, 2017, January 1, 2017, and January 3, 2016.
During the year ended January 3, 2016, we recognized an $18 million gain on the dispositions of cost-method investments.
We invest in a venture capital investment fund (the Fund) with a capital commitment of $100 million that is callable over ten years, of which $83 million remains as of December 31, 2017. Our investment in the Fund is accounted for as an equity method investment. The carrying amounts included in other assets were $16 million and $10 million as of December 31, 2017, and January 1, 2017, respectively.
Accounts Receivable
Accounts receivable, net consist of the following (in millions):
December 31, 2017 | January 1, 2017 | ||||||
Trade accounts receivable, gross | $ | 414 | $ | 385 | |||
Allowance for doubtful accounts | (3 | ) | (4 | ) | |||
Total accounts receivable, net | $ | 411 | $ | 381 | |||
Inventory
Inventory consists of the following (in millions):
December 31, 2017 | January 1, 2017 | ||||||
Raw materials | $ | 93 | $ | 102 | |||
Work in process | 188 | 161 | |||||
Finished goods | 52 | 37 | |||||
Total inventory | $ | 333 | $ | 300 | |||
Property and Equipment
Property and equipment, net consists of the following (in millions):
December 31, 2017 | January 1, 2017 | ||||||
Leasehold improvements | $ | 331 | $ | 270 | |||
Machinery and equipment | 316 | 274 | |||||
Computer hardware and software | 185 | 156 | |||||
Furniture and fixtures | 34 | 24 | |||||
Building | 155 | 9 | |||||
Construction in progress | 326 | 307 | |||||
Total property and equipment, gross | 1,347 | 1,040 | |||||
Accumulated depreciation | (416 | ) | (327 | ) | |||
Total property and equipment, net | $ | 931 | $ | 713 | |||
Property and equipment, net included non-cash expenditures of $117 million, $220 million and $24 million for the years ended December 31, 2017, January 1, 2017 and January 3, 2016, respectively, which were excluded from the consolidated statements of cash flows. Such non-cash expenditures included $79 million, $193 million and $10 million recorded under build-to-suit lease accounting for the years ended December 31, 2017, January 1, 2017 and January 3, 2016, respectively.
57
Goodwill
Changes to goodwill balance from January 3, 2016 through December 31, 2017 are as follows (in millions):
Goodwill | |||
Balance as of January 3, 2016 | $ | 753 | |
Acquisitions | 23 | ||
Balance as of January 1, 2017 | 776 | ||
GRAIL deconsolidation | (5 | ) | |
Balance as of December 31, 2017 | $ | 771 | |
In January 2016, we closed two acquisitions consisting of $18 million in upfront cash payments, equity instruments, and certain contingent consideration provisions.
Accrued Liabilities
Accrued liabilities consist of the following (in millions):
December 31, 2017 | January 1, 2017 | ||||||
Accrued compensation expenses | $ | 177 | $ | 112 | |||
Deferred revenue, current portion | 130 | 121 | |||||
Accrued taxes payable | 50 | 32 | |||||
Customer deposits | 20 | 20 | |||||
Other, including warranties (a) | 55 | 57 | |||||
Total accrued liabilities | $ | 432 | $ | 342 | |||
(a) Changes in reserve for product warranties from December 28, 2014 through December 31, 2017 are as follows (in millions):
Warranty Reserve | |||
Balance as of December 28, 2014 | $ | 16 | |
Additions charged to cost of revenue | 28 | ||
Repairs and replacements | (27 | ) | |
Balance as of January 3, 2016 | 17 | ||
Additions charged to cost of revenue | 21 | ||
Repairs and replacements | (25 | ) | |
Balance as of January 1, 2017 | 13 | ||
Additions charged to cost of revenue | 26 | ||
Repairs and replacements | (22 | ) | |
Balance as of December 31, 2017 | $ | 17 | |
58
Investments in Consolidated Variable Interest Entities
Helix Holdings I, LLC
In July 2015, we obtained a 50% voting equity ownership interest in Helix Holdings I, LLC (Helix), a limited liability company formed with unrelated third-party investors to pursue the development and commercialization of a marketplace for consumer genomics. We determined that Helix is a variable interest entity as the holders of the at-risk equity investments as a group lack the power to direct the activities of Helix that most significantly impact Helix’s economic performance. Additionally, we determined that we have (a) unilateral power over one of the activities that most significantly impacts the economic performance of Helix through its contractual arrangements and no one individual party has unilateral power over the remaining significant activities of Helix and (b) the obligation to absorb losses of and the right to receive benefits from Helix that are potentially significant to Helix. As a result, we are deemed to be the primary beneficiary of Helix and are required to consolidate Helix.
As contractually committed, we contributed certain perpetual licenses, instruments, intangibles, initial laboratory setup, and discounted supply terms in exchange for voting equity interests in Helix. Such contributions are recorded at their historical basis as they remain within the control of Illumina. Helix is financed through cash contributions made by the third-party investors in exchange for voting equity interests in Helix.
Certain noncontrolling Helix investors may require us to redeem all noncontrolling interests in cash at the then approximate fair market value. Such redemption right is exercisable at the option of certain noncontrolling interest holders after January 1, 2021, provided that a bona fide pursuit of the sale of Helix has occurred and an initial public offering of Helix has not been completed. The fair value of the redeemable noncontrolling interests is considered a Level 3 instrument.
As the contingent redemption is outside of the control of Illumina, the redeemable noncontrolling interests in Helix are classified outside of stockholders’ equity on the accompanying consolidated balance sheets. The balance of the redeemable noncontrolling interests is reported at the greater of its carrying value after receiving its allocation of Helix’s profits and losses or its estimated redemption value at each reporting date. As of December 31, 2017, the noncontrolling shareholders and Illumina each held 50% of Helix’s outstanding voting equity interests.
The assets and liabilities of Helix are not significant to our financial position as of December 31, 2017. Helix has an immaterial impact on our consolidated statements of income and cash flows for the fiscal year ended December 31, 2017.
As of December 31, 2017, the accompanying consolidated balance sheet includes $18 million of cash and cash equivalents attributable to Helix that will be used to settle their respective obligations and will not be available to settle obligations of Illumina.
GRAIL, Inc.
In January 2016, we obtained a majority equity ownership interest in GRAIL, a company formed with unrelated third-party investors to develop a blood test for early-stage cancer detection. We determined that GRAIL was a variable interest entity as the entity lacked sufficient equity to finance its activities without additional support. Additionally, we determined that we had (a) control of GRAIL’s board of directors, which had unilateral power over the activities that most significantly impacted the economic performance of GRAIL and (b) the obligation to absorb losses of, and the right to receive benefits from, GRAIL that were potentially significant to GRAIL. As a result, we were deemed to be the primary beneficiary of GRAIL and were required to consolidate GRAIL.
In January 2016, GRAIL completed its Series A convertible preferred stock financing, raising $120 million, of which we invested $40 million. Additionally, Illumina and GRAIL executed a long-term supply agreement in which we contributed employees and discounted supply terms in exchange for 113 million shares of GRAIL’s Class B common stock. Such contributions were recorded at their historical basis as they remained within the control of Illumina. The $80 million received by GRAIL from unrelated third-party investors upon issuance of its Series A convertible preferred stock was classified as noncontrolling interests in stockholders’ equity on the consolidated balance sheet.
In June 2016, GRAIL authorized for issuance 98 million shares of Series A-1 convertible preferred stock, all of which were issued to Illumina in exchange for Illumina’s 98 million shares of GRAIL Class B common stock. As a result of the
59
exchange, we recorded a $10 million deemed dividend, net of tax of $10 million, through equity, which was eliminated in consolidation.
Deconsolidation of GRAIL
On February 28, 2017, GRAIL completed the initial close of its Series B preferred stock financing, raising over $900 million, in which we did not participate. Concurrent with the financing, GRAIL repurchased from Illumina 35 million shares of its Series A preferred stock and approximately 34 million shares of its Series A-1 preferred stock for an aggregate purchase price of $278 million. At this time, we ceased to have a controlling financial interest in GRAIL and our equity ownership was reduced from 52% to 19%. Additionally, our voting interest was reduced to 13%, and we no longer had representation on GRAIL’s board of directors. As a result, we deconsolidated GRAIL’s financial statements effective February 28, 2017 and account for the remaining retained investment as a cost-method investment. During the three months ended July 2, 2017, we purchased approximately 3 million Series B preferred shares for $14 million resulting in an ownership of approximately 17% of GRAIL’s outstanding stock and a 12% voting interest. As of December 31, 2017, we hold $185 million in other assets related to this investment, which consists of 5 million Series A preferred shares, and approximately 3 million Series B preferred shares and 78 million Class A common shares of GRAIL.
The operations of GRAIL from January 2, 2017 up to February 28, 2017, the date of deconsolidation, are included in the accompanying consolidated statements of income for the year ended December 31, 2017. During this period, we absorbed approximately 50% of GRAIL’s losses based upon our proportional ownership of GRAIL’s common stock.
On February 28, 2017, we recorded a pretax gain of $453 million included in other income (expense), net, of which $159 million relates to the remeasurement of our retained equity interest to its fair value. The pretax gain on deconsolidation includes (i) the consideration received from GRAIL for its repurchase of a portion of our ownership interest, (ii) the derecognition of the carrying amounts of GRAIL’s assets and liabilities, (iii) the derecognition of the noncontrolling interest related to GRAIL, and (iv) the recording of our remaining interest in GRAIL at fair value. This fair value measurement of our remaining interest was derived using the market approach. Significant estimates and assumptions required for this valuation included, but were not limited to, various Black-Scholes option-pricing model assumptions as of the date of deconsolidation and estimated discounts for lack of marketability related to the equity securities. These unobservable inputs, which represent a Level 3 measurement, are supported by little or no market activity and reflect our own assumptions in measuring fair value.
In connection with the deconsolidation of GRAIL, the parties amended their long-term supply agreement, including the discounted supply terms. The repurchase and supply arrangements, which were entered into concurrently, contain various elements and, as such, are deemed to be an arrangement with multiple deliverables as defined under the respective authoritative accounting guidance. We determined that each of the elements, which include the purchase obligation, the purchase right, and services to be provided in accordance with the long-term supply agreement, were at, or approximated, fair value on a stand-alone basis, and therefore, there was no discount to allocate among the deliverables. As such, none of the deconsolidation gain was allocated to these elements.
60
Redeemable Noncontrolling Interests
The activity of the redeemable noncontrolling interests from December 28, 2014 through December 31, 2017 is as follows (in millions):
Redeemable Noncontrolling Interests | |||
Balance as of December 28, 2014 | $ | — | |
Cash contributions | 57 | ||
Amount held in escrow by third party | (24 | ) | |
Net loss attributable to noncontrolling interests | (4 | ) | |
Adjustment up to the redemption value | 4 | ||
Balance as of January 3, 2016 | 33 | ||
Cash contributions | 9 | ||
Vesting of redeemable equity awards | 2 | ||
Net loss attributable to noncontrolling interests | (21 | ) | |
Adjustment up to the redemption value | 21 | ||
Balance as of January 1, 2017 | 44 | ||
Amount released from escrow | 79 | ||
Vesting of redeemable equity awards | 13 | ||
Net loss attributable to noncontrolling interests | (41 | ) | |
Adjustment up to the redemption value | 136 | ||
Deconsolidation of GRAIL | (11 | ) | |
Balance as of December 31, 2017 | $ | 220 | |
3. | Intangible Assets |
Intangible assets, excluding goodwill, include acquired licensed and core technologies, customer relationships, license agreements, trade name, and in-process research and development (IPR&D). Amortization for the intangible assets that have finite useful lives is generally recorded on a straight-line basis over their useful lives.
A summary of the finite-lived identifiable intangible assets is as follows (in millions):
December 31, 2017 | January 1, 2017 | ||||||||||||||||||||||
Gross Carrying Amount | Accumulated Amortization | Intangibles, Net | Gross Carrying Amount | Accumulated Amortization | Intangibles, Net | ||||||||||||||||||
Licensed technologies | $ | 95 | $ | (74 | ) | $ | 21 | $ | 95 | $ | (64 | ) | $ | 31 | |||||||||
Core technologies | 300 | (161 | ) | 139 | 328 | (142 | ) | 186 | |||||||||||||||
Customer relationships | 32 | (25 | ) | 7 | 33 | (22 | ) | 11 | |||||||||||||||
License agreements | 14 | (8 | ) | 6 | 14 | (7 | ) | 7 | |||||||||||||||
Trade name | 7 | (5 | ) | 2 | 5 | (3 | ) | 2 | |||||||||||||||
Total finite-lived intangible assets, net | $ | 448 | $ | (273 | ) | $ | 175 | $ | 475 | $ | (238 | ) | $ | 237 | |||||||||
61
The estimated annual amortization of finite-lived intangible assets for the next five years is shown in the following table (in millions). Actual amortization expense to be reported in future periods could differ from these estimates as a result of acquisitions, divestitures, and asset impairments, among other factors.
Estimated Annual Amortization | |||
2018 | $ | 36 | |
2019 | 32 | ||
2020 | 24 | ||
2021 | 21 | ||
2022 | 17 | ||
Thereafter | 45 | ||
Total | $ | 175 | |
4. | Fair Value Measurements |
Fair value hierarchy for assets and liabilities measured at fair value on a recurring basis as of December 31, 2017 and January 1, 2017 are as follows (in millions):
December 31, 2017 | January 1, 2017 | ||||||||||||||||||||||||||||||
Level 1 | Level 2 | Level 3 | Total | Level 1 | Level 2 | Level 3 | Total | ||||||||||||||||||||||||
Assets: | |||||||||||||||||||||||||||||||
Money market funds (cash equivalent) | $ | 957 | $ | — | $ | — | $ | 957 | $ | 386 | $ | — | $ | — | $ | 386 | |||||||||||||||
Debt securities in government-sponsored entities | — | 67 | — | 67 | — | 34 | — | 34 | |||||||||||||||||||||||
Corporate debt securities | — | 421 | — | 421 | — | 476 | — | 476 | |||||||||||||||||||||||
U.S. Treasury securities | 432 | — | — | 432 | 314 | — | — | 314 | |||||||||||||||||||||||
Deferred compensation plan assets | — | 35 | — | 35 | — | 31 | — | 31 | |||||||||||||||||||||||
Total assets measured at fair value | $ | 1,389 | $ | 523 | $ | — | $ | 1,912 | $ | 700 | $ | 541 | $ | — | $ | 1,241 | |||||||||||||||
Liabilities: | |||||||||||||||||||||||||||||||
Acquisition-related contingent consideration liabilities | $ | — | $ | — | $ | — | $ | — | $ | — | $ | — | $ | 4 | $ | 4 | |||||||||||||||
Deferred compensation liability | — | 33 | — | 33 | — | 29 | — | 29 | |||||||||||||||||||||||
Total liabilities measured at fair value | $ | — | $ | 33 | $ | — | $ | 33 | $ | — | $ | 29 | $ | 4 | $ | 33 | |||||||||||||||
We hold available-for-sale securities that consist of highly-liquid, investment-grade debt securities. We consider information provided by our investment accounting and reporting service provider in the measurement of fair value of our debt securities. The investment service provider provides valuation information from an industry-recognized valuation service. Such valuations may be based on trade prices in active markets for identical assets or liabilities (Level 1 inputs) or valuation models using inputs that are observable either directly or indirectly (Level 2 inputs), such as quoted prices for similar assets or liabilities, yield curve, volatility factors, credit spreads, default rates, loss severity, current market and contractual prices for the underlying instruments or debt, broker and dealer quotes, as well as other relevant economic measures. Our deferred compensation plan assets consist primarily of investments in life insurance contracts carried at cash surrender value, which reflects the net asset value of the underlying publicly traded mutual funds. We perform control procedures to corroborate the fair value of our holdings, including comparing valuations obtained from our investment service provider to valuations reported by our asset custodians, validating pricing sources and models, and reviewing key model inputs, if necessary.
The fair value of any contingent consideration liabilities is reassessed on a quarterly basis using the income approach. Assumptions used to estimate the acquisition date fair value of the contingent consideration include discount rates ranging from 4% to 6% and the probability of achieving certain milestones. The fair value measurement of the contingent consideration is based on significant inputs not observed in the market (Level 3 inputs). Significant inputs used in the measurement include probabilities of achieving the remaining milestones and the discount rates, which depend on the milestone risk profiles. The
62
changes in fair value of the contingent consideration during the years ended December 31, 2017, January 1, 2017, and January 3, 2016 were due to changes in the estimated payments and discounting periods.
Changes in estimated fair value of contingent consideration liabilities from December 28, 2014 through December 31, 2017 are as follows (in millions):
Contingent Consideration Liability (Level 3 Measurement) | |||
Balance as of December 28, 2014 | $ | 44 | |
Change in estimated fair value, recorded in selling, general and administrative expenses | (6 | ) | |
Cash payments | (3 | ) | |
Balance as of January 3, 2016 | 35 | ||
Additional liability recorded as a result of a current period acquisition | 5 | ||
Change in estimated fair value, recorded in selling, general and administrative expenses | (1 | ) | |
Cash payments | (35 | ) | |
Balance as of January 1, 2017 | 4 | ||
Change in estimated fair value, recorded in selling, general and administrative expenses | (1 | ) | |
Cash payments | (3 | ) | |
Balance as of December 31, 2017 | $ | — | |
5. Debt and Other Commitments
Summary of debt obligations
Debt obligations consist of the following (dollars in millions):
December 31, 2017 | January 1, 2017 | ||||||
Principal amount of 2019 Notes outstanding | $ | 633 | $ | 633 | |||
Principal amount of 2021 Notes outstanding | 517 | 517 | |||||
Unamortized discount of liability component | (75 | ) | (105 | ) | |||
Net carrying amount of liability component | 1,075 | 1,045 | |||||
Obligations under financing leases | 113 | 9 | |||||
Other | 4 | 4 | |||||
Less: current portion | (10 | ) | (2 | ) | |||
Long-term debt | $ | 1,182 | $ | 1,056 | |||
Carrying value of equity component, net of issuance costs | $ | 161 | $ | 161 | |||
Fair value of outstanding notes (Level 2) | $ | 1,305 | $ | 1,108 | |||
Weighted average remaining amortization period of discount on the liability component | 2.8 years | 3.6 years | |||||
63
0% Convertible Senior Notes due 2019 (2019 Notes) and 0.5% Convertible Senior Notes due 2021 (2021 Notes)
In June 2014, we issued $633 million aggregate principal amount of 0% convertible senior notes due 2019 (2019 Notes) and $517 million aggregate principal amount of 0.5% convertible senior notes due 2021 (2021 Notes) in an offering conducted in accordance with Rule 144A under the Securities Act of 1933, as amended. The Notes were issued at 100% of par value. The net proceeds from the issuance, after deducting the offering expenses payable by us, was $1,132 million. We used the net proceeds plus cash on hand to repurchase a portion of the outstanding 2016 Notes in privately negotiated transactions concurrently with the issuance of the 2019 and 2021 Notes.
Both the 2019 and 2021 Notes will be convertible into cash, shares of common stock, or a combination of cash and shares of common stock, at our election, based on an initial conversion rate, subject to adjustment, of 3.9318 shares per $1,000 principal amount of the notes (which represents an initial conversion price of approximately $254.34 per share), only in the following circumstances and to the following extent: (1) during the five business-day period after any 10 consecutive trading day period (the measurement period) in which the trading price per 2019 and 2021 Note for each day of such measurement period was less than 98% of the product of the last reported sale price of our common stock and the conversion rate on each such day; (2) during any calendar quarter (and only during that quarter) after the calendar quarter ending September 30, 2014, if the last reported sale price of our common stock for 20 or more trading days in the period of 30 consecutive trading days ending on the last trading day of the immediately preceding calendar quarter exceeds 130% of the applicable conversion price in effect on the last trading day of the immediately preceding calendar quarter; (3) upon the occurrence of specified events described in the indenture for the 2019 and 2021 Notes; and (4) at any time on or after March 15, 2019 for the 2019 Notes, or March 15, 2021 for the 2021 Notes, through the second scheduled trading day immediately preceding the maturity date.
As noted in the indentures for the 2019 and 2021 Notes, it is our intent and policy to settle conversions through combination settlement, which essentially involves repayment of an amount of cash equal to the “principal portion” and delivery of the “share amount” in excess of the conversion value over the principal portion in shares of common stock. In general, for each $1,000 in principal, the “principal portion” of cash upon settlement is defined as the lesser of $1,000 and the conversion value during the 20-day observation period. The conversion value is the sum of the daily conversion value which is the product of the effective conversion rate divided by 20 days and the daily volume weighted average price (VWAP) of our common stock. The “share amount” is the cumulative “daily share amount” during the observation period, which is calculated by dividing the daily VWAP into the difference between the daily conversion value (i.e., conversion rate x daily VWAP) and $1,000.
The 2019 Notes carry no coupon interest. We pay 0.5% interest per annum on the principal amount of the 2021 Notes, payable semiannually in arrears in cash on June 15 and December 15 of each year, beginning on December 15, 2014. The 2019 and 2021 Notes mature on June 15, 2019 and June 15, 2021, respectively. If a designated event, as defined in the indentures for the 2019 and 2021 Notes, such as acquisition, merger, or liquidation, occurs prior to the maturity date, subject to certain limitations, holders of the notes may require us to repurchase all or a portion of their notes for cash at a repurchase price equal to 100% of the principal amount of the notes to be repurchased, plus any accrued and unpaid interest to, but excluding, the repurchase date.
The liability and equity components of the 2019 and 2021 Notes are accounted for in accordance with authoritative guidance for convertible debt instruments that may be settled in cash upon conversion. The guidance requires the carrying amount of the liability component to be estimated by measuring the fair value of a similar liability that does not have an associated conversion feature. Because we have no outstanding non-convertible public debt, we determined that market-traded senior, unsecured corporate bonds represent a similar liability to the convertible senior notes without the conversion option. Based on market data available for publicly traded, senior, unsecured corporate bonds issued by companies in the same industry as us, and with similar maturities to the 2019 and 2021 Notes, we estimated the implied interest rates of our 2019 and 2021 Notes to be 2.9% and 3.5%, respectively, assuming no conversion option. Assumptions used in the estimate represent what market participants would use in pricing the liability component, including market interest rates, credit standing, and yield curves, all of which are defined as Level 2 observable inputs. The estimated implied interest rates were applied to the 2019 and 2021 Notes, which resulted in a fair value of the liability component in aggregate of $972 million upon issuance, calculated as the present value of implied future payments based on the $1,150 million aggregate principal amount. The $161 million difference between the cash proceeds of $1,133 million and the estimated fair value of the liability component was recorded in additional paid-in capital as the 2019 and 2021 Notes are not considered redeemable.
64
As a policy election under applicable guidance related to the calculation of diluted net income per share, we elected the combination settlement method as our stated settlement policy and applied the treasury stock method in the calculation of the potential dilutive impact of the 2019 and 2021 Notes. Neither the 2019 nor the 2021 Notes were convertible as of December 31, 2017, and had no dilutive impact during the year ended December 31, 2017. If the 2019 and 2021 Notes had been converted as of December 31, 2017, the if-converted value would not exceed the principal amount.
0.25% Convertible Senior Notes due 2016
In 2011, we issued $920 million aggregate principal amount of 0.25% convertible senior notes due 2016 (2016 Notes) with a maturity date of March 15, 2016. The effective rate of the liability component was estimated to be 4.5%. Based upon meeting the stock trading price conversion requirement during the three months ended March 30, 2014, the 2016 Notes became convertible on April 1, 2014 through, and including, March 11, 2016. All notes were converted by March 11, 2016.
Leases
We lease office and manufacturing facilities under various non-cancellable lease agreements. Facility leases generally provide for periodic rent increases, and many contain escalation clauses and renewal options. Certain leases require us to pay property taxes and routine maintenance. We are headquartered in San Diego, California and lease facilities in San Diego and the San Francisco Bay Area in California; Madison, Wisconsin; Morrisville, North Carolina; Australia; Brazil; Canada; China; France; Japan; Singapore; the Netherlands; South Korea; and the United Kingdom.
We evaluate whether we are the accounting owner of leased assets during the construction period when we are involved in the construction of leased assets. As of December 31, 2017, we are considered the owner of two construction projects for accounting purposes only under build-to-suit lease accounting due to certain indemnification obligations related to the construction. As of December 31, 2017 and January 1, 2017, we recorded $144 million and $223 million, respectively, in project construction costs paid or reimbursed by the landlord as construction in progress and a corresponding build-to-suit lease liability.
During the year ended December 31, 2017, construction of a build-to-suit property was completed. We concluded that we do not qualify for “sale-leaseback” treatment and the lease is accounted for as a financing obligation. Accordingly, $104 million of construction in progress and build-to-suit lease liability were reclassified to building asset and obligations under financing leases, respectively.
On February 28, 2017, GRAIL was deconsolidated, as further described in note “2. Balance Sheet Account Details”, and $58 million of construction in progress and the corresponding build-to-suit lease liability were removed.
As of December 31, 2017, annual future minimum payments of our operating leases and build-to-suit leases, which include those leases accounted for as a financing obligation, were as follows (in millions):
Operating Leases | Sublease Income | Net Operating Leases | Build-to-suit Leases | ||||||||||||
2018 | $ | 55 | $ | (9 | ) | $ | 46 | $ | 22 | ||||||
2019 | 60 | (10 | ) | 50 | 20 | ||||||||||
2020 | 58 | (10 | ) | 48 | 20 | ||||||||||
2021 | 57 | (10 | ) | 47 | 21 | ||||||||||
2022 | 54 | (11 | ) | 43 | 21 | ||||||||||
Thereafter | 468 | (16 | ) | 452 | 190 | ||||||||||
Total minimum lease payments | $ | 752 | $ | (66 | ) | $ | 686 | $ | 294 | ||||||
Rent expense was $46 million, $46 million, and $39 million for the years ended December 31, 2017, January 1, 2017, and January 3, 2016, respectively. As of December 31, 2017 and January 1, 2017, the deferred rent balance related to our operating leases was $115 million and $107 million, respectively, of which the long-term portion of $113 million and $104 million, respectively, were recorded in other long-term liabilities.
65
Facility exit obligations were recorded upon vacating our former headquarters in 2011. Changes in the facility exit obligation from December 28, 2014 through December 31, 2017, are as follows (in millions):
Facility Exit Obligation | |||
Balance as of December 28, 2014 | $ | 38 | |
Adjustment to facility exit obligation | (5 | ) | |
Accretion of interest expense | 2 | ||
Cash payments | (13 | ) | |
Balance as of January 3, 2016 | 22 | ||
Accretion of interest expense | 1 | ||
Cash payments | (4 | ) | |
Balance as of January 1, 2017 | 19 | ||
Accretion of interest expense | 1 | ||
Cash payments | (3 | ) | |
Balance as of December 31, 2017 | $ | 17 | |
Purchase Obligations
In the normal course of business, we enter into agreements to purchase goods or services that are not cancelable without penalty, primarily related to licensing and supply arrangements. For those agreements with variable terms, we do not estimate the total obligation beyond any minimum quantities or pricing as of the reporting date. Licensing agreements under which we commit to minimum royalty payments, some of which are subject to adjustment, may be terminated prior to the expiration of underlying intellectual property under certain circumstances. Annual minimum payments for noncancelable purchase obligations as of December 31, 2017 are as follows (in millions):
Minimum Payments | |||
2018 | $ | 27 | |
2019 | 60 | ||
2020 | 20 | ||
Total | $ | 107 | |
6. | Share-based Compensation Expense |
Share-based compensation expense for all stock awards consists of the following (in millions):
Years Ended | |||||||||||
December 31, 2017 | January 1, 2017 | January 3, 2016 | |||||||||
Cost of product revenue | $ | 12 | $ | 9 | $ | 10 | |||||
Cost of service and other revenue | 2 | 2 | 2 | ||||||||
Research and development | 51 | 42 | 42 | ||||||||
Selling, general and administrative | 99 | 76 | 79 | ||||||||
Share-based compensation expense before taxes | 164 | 129 | 133 | ||||||||
Related income tax benefits | (48 | ) | (41 | ) | (39 | ) | |||||
Share-based compensation expense, net of taxes | $ | 116 | $ | 88 | $ | 94 | |||||
66
The assumptions used for the specified reporting periods and the resulting estimates of weighted-average fair value per share for stock purchased under the ESPP are as follows:
Years Ended | |||||||||||
December 31, 2017 | January 1, 2017 | January 3, 2016 | |||||||||
Risk-free interest rate | 0.50% - 1.22% | 0.40% - 0.50% | 0.07% - 0.33% | ||||||||
Expected volatility | 29% - 44% | 40% - 44% | 29% - 38% | ||||||||
Expected term | 0.5 - 1.0 year | 0.5 - 1.0 year | 0.5 - 1.0 year | ||||||||
Expected dividends | 0 | % | 0 | % | 0 | % | |||||
Weighted-average grant-date fair value per share | $ | 46.81 | $ | 48.29 | $ | 53.92 | |||||
As of December 31, 2017, approximately $394 million of total unrecognized compensation cost related to restricted stock and ESPP shares issued to date are expected to be recognized over a weighted-average period of approximately 2.7 years.
7. | Stockholders’ Equity |
The 2015 Stock and Incentive Compensation Plan (the 2015 Stock Plan) and the New Hire Stock and Incentive Plan allow for the issuance of stock options, restricted stock units and awards, and performance stock units. As of December 31, 2017, approximately 5.3 million shares remained available for future grants under the 2015 Stock Plan. There is no set number of shares reserved for issuance under the New Hire Stock and Incentive Plan.
Restricted Stock
We issue restricted stock units (RSU) and performance stock units (PSU), which are both considered restricted stock. We grant restricted stock pursuant to the 2015 Stock Plan and satisfy such grants through the issuance of new shares. RSU are share awards that, upon vesting, will deliver to the holder shares of our common stock. RSU generally vest over a four-year period with equal vesting on anniversaries of the grant date. We issue PSU for which the number of shares issuable at the end of a three-year performance period can reach up to 150% of the shares approved in the award based on our performance relative to specified earnings per share targets and continued employment through the vesting period.
A summary of restricted stock activity and related information from December 28, 2014 through December 31, 2017 is as follows (in thousands, except per share amounts):
Restricted Stock Units (RSU) | Performance Stock Units (PSU)(1) | Weighted-Average Grant- Date Fair Value per Share | |||||||||||
RSU | PSU | ||||||||||||
Outstanding at December 28, 2014 | 2,841 | 1,257 | $ | 92.35 | $ | 96.21 | |||||||
Awarded | 756 | 194 | $ | 184.10 | $ | 183.29 | |||||||
Vested | (1,138 | ) | (741 | ) | $ | 75.29 | $ | 60.80 | |||||
Cancelled | (253 | ) | (127 | ) | $ | 99.50 | $ | 99.30 | |||||
Outstanding at January 3, 2016 | 2,206 | 583 | $ | 131.80 | $ | 169.41 | |||||||
Awarded | 1,245 | 172 | $ | 132.47 | $ | 113.56 | |||||||
Vested | (928 | ) | (199 | ) | $ | 105.49 | $ | 148.99 | |||||
Cancelled | (230 | ) | (96 | ) | $ | 139.74 | $ | 163.05 | |||||
Outstanding at January 1, 2017 | 2,293 | 460 | $ | 141.80 | $ | 158.66 | |||||||
Awarded | 879 | 238 | $ | 207.38 | $ | 191.53 | |||||||
Vested | (861 | ) | (92 | ) | $ | 131.62 | $ | 189.09 | |||||
Cancelled | (226 | ) | (64 | ) | $ | 149.03 | $ | 173.83 | |||||
Outstanding at December 31, 2017 | 2,085 | 542 | $ | 172.92 | $ | 166.15 | |||||||
______________________________________
(1) | The number of units reflect the estimated number of shares to be issued at the end of the performance period. |
67
Pre-tax intrinsic values and fair value of vested restricted stock are as follows (in millions):
Years Ended | |||||||||||
December 31, 2017 | January 1, 2017 | January 3, 2016 | |||||||||
Pre-tax intrinsic value of outstanding restricted stock: | |||||||||||
RSU | $ | 456 | $ | 294 | $ | 423 | |||||
PSU | $ | 118 | $ | 59 | $ | 112 | |||||
Fair value of restricted stock vested: | |||||||||||
RSU | $ | 113 | $ | 98 | $ | 86 | |||||
PSU | $ | 17 | $ | 30 | $ | 45 | |||||
Stock Options
Stock option activity from December 28, 2014 through December 31, 2017 is as follows:
Options (in thousands) | Weighted- Average Exercise Price | |||||
Outstanding at December 28, 2014 | 3,211 | $ | 34.74 | |||
Exercised | (1,529 | ) | $ | 28.54 | ||
Cancelled | (83 | ) | $ | 10.31 | ||
Outstanding at January 3, 2016 | 1,599 | $ | 41.95 | |||
Exercised | (552 | ) | $ | 29.41 | ||
Cancelled | (2 | ) | $ | 46.35 | ||
Outstanding at January 1, 2017 | 1,045 | $ | 48.56 | |||
Exercised | (723 | ) | $ | 49.31 | ||
Outstanding and exercisable at December 31, 2017 | 322 | $ | 46.93 | |||
The weighted-average remaining life of options outstanding and exercisable is 3.0 years as of December 31, 2017.
The aggregate intrinsic value of options outstanding and options exercisable as of December 31, 2017 was $55 million. Aggregate intrinsic value represents the product of the number of options outstanding multiplied by the difference between our closing stock price per share on the last trading day of the fiscal period, which was $218.49 as of December 29, 2017, and the exercise price. Total intrinsic value of options exercised was $101 million, $71 million, and $256 million for the years ended December 31, 2017, January 1, 2017, and January 3, 2016, respectively.
Employee Stock Purchase Plan
A total of 15.5 million shares of our common stock have been reserved for issuance under our 2000 Employee Stock Purchase Plan, or ESPP. The ESPP permits eligible employees to purchase common stock at a discount through payroll deductions during defined offering periods. The price at which stock is purchased under the ESPP is equal to 85% of the fair market value of the common stock on the first of the offering period or purchase date, whichever is lower. The initial offering period commenced in July 2000.
Approximately 0.3 million, 0.2 million, and 0.2 million shares were issued under the ESPP during the years ended December 31, 2017, January 1, 2017, and January 3, 2016, respectively. As of December 31, 2017 and January 1, 2017, there were approximately 14.0 million and 14.3 million shares available for issuance under the ESPP, respectively.
68
Share Repurchases
On July 28, 2016, our Board of Directors authorized a new share repurchase program, which superseded all prior and available repurchase authorizations, to repurchase $250 million of outstanding common stock. During Q1 2017, we repurchased the remaining shares, completing the program.
On May 4, 2017, our Board of Directors authorized an additional share repurchase program to repurchase $250 million of outstanding commons stock. The repurchases may be completed under a 10b5-1 plan or at management’s discretion.
During the years ended December 31, 2017, January 1, 2017, and January 3, 2016, we repurchased approximately 1.4 million shares for $251 million, 1.8 million shares for $249 million, and 1.7 million shares for $274 million, respectively. Authorizations to repurchase $100 million of our common stock remained available as of December 31, 2017.
8. | Legal Proceedings |
We are involved in various lawsuits and claims arising in the ordinary course of business, including actions with respect to intellectual property, employment, and contractual matters. In connection with these matters, we assess, on a regular basis, the probability and range of possible loss based on the developments in these matters. A liability is recorded in the financial statements if it is believed to be probable that a loss has been incurred and the amount of the loss can be reasonably estimated. Because litigation is inherently unpredictable and unfavorable results could occur, assessing contingencies is highly subjective and requires judgments about future events. We regularly review outstanding legal matters to determine the adequacy of the liabilities accrued and related disclosures. The amount of ultimate loss may differ from these estimates. Each matter presents its own unique circumstances, and prior litigation does not necessarily provide a reliable basis on which to predict the outcome, or range of outcomes, in any individual proceeding. Because of the uncertainties related to the occurrence, amount, and range of loss on any pending litigation or claim, we are currently unable to predict their ultimate outcome, and, with respect to any pending litigation or claim where no liability has been accrued, to make a meaningful estimate of the reasonably possible loss or range of loss that could result from an unfavorable outcome. In the event that opposing litigants in outstanding litigations or claims ultimately succeed at trial and any subsequent appeals on their claims, any potential loss or charges in excess of any established accruals, individually or in the aggregate, could have a material adverse effect on our business, financial condition, results of operations, and/or cash flows in the period in which the unfavorable outcome occurs or becomes probable, and potentially in future periods.
Enzo
On July 1, 2016, we entered into a Settlement and License Agreement with Enzo Life Sciences, Inc. (Enzo) that settled all claims in the litigation. Pursuant to the terms of the Settlement and License Agreement, we paid Enzo a one-time payment of $21 million for release of past damages claimed and a fully paid-up non-exclusive license to U.S. Patent No. 7,064,197. None of the parties made any admission of liability in entering into the Settlement and License Agreement. We allocated the $21 million settlement on a relative fair value basis, resulting in $12 million capitalized as an intangible asset and a corresponding gain recorded in legal contingencies for the value of the license, which will be amortized over a period of 7 years on a straight-line basis. The remaining $9 million related to past damages claimed. The fair value of the license and past damages was estimated using a discounted cash flow model, and is considered to be a Level 3 measurement.
9. | Income Taxes |
The income before income taxes summarized by region is as follows (in millions):
Years Ended | |||||||||||
December 31, 2017 | January 1, 2017 | January 3, 2016 | |||||||||
United States | $ | 458 | $ | 120 | $ | 218 | |||||
Foreign | 585 | 441 | 365 | ||||||||
Total income before income taxes | $ | 1,043 | $ | 561 | $ | 583 | |||||
69
The provision for income taxes consists of the following (in millions):
Years Ended | |||||||||||
December 31, 2017 | January 1, 2017 | January 3, 2016 | |||||||||
Current: | |||||||||||
Federal | $ | 259 | $ | 71 | $ | 106 | |||||
State | 21 | 10 | 18 | ||||||||
Foreign | 51 | 45 | 46 | ||||||||
Total current provision | 331 | 126 | 170 | ||||||||
Deferred: | |||||||||||
Federal | 36 | 16 | (11 | ) | |||||||
State | — | (5 | ) | (32 | ) | ||||||
Foreign | (2 | ) | (4 | ) | (2 | ) | |||||
Total deferred expense (benefit) | 34 | 7 | (45 | ) | |||||||
Total tax provision | $ | 365 | $ | 133 | $ | 125 | |||||
The provision for income taxes reconciles to the amount computed by applying the federal statutory rate to income before taxes as follows (in millions):
Years Ended | |||||||||||
December 31, 2017 | January 1, 2017 | January 3, 2016 | |||||||||
Tax at federal statutory rate | $ | 365 | $ | 196 | $ | 204 | |||||
State, net of federal benefit | 19 | 10 | 9 | ||||||||
Research and other credits | (12 | ) | (13 | ) | (20 | ) | |||||
Change in valuation allowance | 12 | 5 | (4 | ) | |||||||
Impact of foreign operations | (130 | ) | (86 | ) | (42 | ) | |||||
Cost sharing adjustment | — | (7 | ) | (25 | ) | ||||||
Investments in consolidated variable interest entities | (3 | ) | 25 | 1 | |||||||
Impact of U.S. Tax Reform | 150 | — | — | ||||||||
Stock compensation | (41 | ) | 3 | 2 | |||||||
Other | 5 | — | — | ||||||||
Total tax provision | $ | 365 | $ | 133 | $ | 125 | |||||
In accordance with the Tax Cuts and Jobs Act that was enacted on December 22, 2017 (U.S. Tax Reform), we have recorded a provision for income taxes of $150 million. The impact of U.S. Tax Reform primarily represents our provisional estimates of the one-time transition tax on earnings of certain foreign subsidiaries that were previously tax deferred, and the impact of revaluing our U.S. deferred tax assets and liabilities based on the rates at which they are expected to reverse in the future. For U.S. federal purposes the corporate statutory income tax rate was reduced from 35% to 21%, effective for our 2018 tax year. The provisional impact of U.S. Tax Reform is our current best estimate based on a preliminary review of the new law and is subject to revision based on our existing accounting for income taxes policy as further information is gathered and interpretation and analysis of the tax legislation evolves. The Securities and Exchange Commission has issued rules allowing for a measurement period of up to one year after the enactment date of U.S. Tax Reform to finalize the recording of the related tax impacts. Any future changes to our provisional estimated impact of U.S. Tax Reform will be included as an adjustment to the provision for income taxes.
We continue to evaluate the impacts of U.S. Tax Reform as we interpret the legislation, including the newly enacted global intangible low-taxed income (GILTI) provisions which subject our foreign earnings to a minimum level of tax. Because of the complexities of the new legislation, we have not elected an accounting policy for GILTI at this time. Recent FASB guidance indicates that accounting for GILTI either as part of deferred taxes or as a period cost are both acceptable methods.
70
Once further information is gathered and interpretation and analysis of the tax legislation evolves we will make an appropriate accounting method election.
The impact of foreign operations primarily represents the difference between the actual provision for income taxes for our legal entities that operate primarily in jurisdictions that have statutory tax rates lower than the U.S. federal statutory tax rate of 35%. The most significant tax benefits from foreign operations were from our earnings in Singapore and the United Kingdom, which had statutory tax rates of 17% and 19.25%, respectively, in the year ended December 31, 2017. The impact of foreign operations also includes the U.S. foreign tax credit impact of non-U.S. earnings and uncertain tax positions related to foreign items.
Significant components of deferred tax assets and liabilities are as follows (in millions):
December 31, 2017 | January 1, 2017 | ||||||
Deferred tax assets: | |||||||
Net operating losses | $ | 18 | $ | 20 | |||
Tax credits | 57 | 43 | |||||
Other accruals and reserves | 25 | 24 | |||||
Stock compensation | 19 | 38 | |||||
Deferred rent | 28 | 38 | |||||
Cost sharing adjustment | 21 | 32 | |||||
Other amortization | 12 | 16 | |||||
Lease obligation | 27 | — | |||||
Investments | 13 | 6 | |||||
Other | 26 | 32 | |||||
Total gross deferred tax assets | 246 | 249 | |||||
Valuation allowance on deferred tax assets | (25 | ) | (18 | ) | |||
Total deferred tax assets | 221 | 231 | |||||
Deferred tax liabilities: | |||||||
Purchased intangible amortization | (26 | ) | (53 | ) | |||
Convertible debt | (18 | ) | (37 | ) | |||
Property and equipment | (44 | ) | (17 | ) | |||
Investments | (40 | ) | — | ||||
Other | (5 | ) | (1 | ) | |||
Total deferred tax liabilities | (133 | ) | (108 | ) | |||
Deferred tax assets, net | $ | 88 | $ | 123 | |||
A valuation allowance is established when it is more likely than not the future realization of all or some of the deferred tax assets will not be achieved. The evaluation of the need for a valuation allowance is performed on a jurisdiction-by-jurisdiction basis, and includes a review of all available positive and negative evidence. Based on the available evidence as of December 31, 2017, we were not able to conclude it is more likely than not certain deferred tax assets will be realized. Therefore, a valuation allowance of $25 million was recorded against certain U.S. and foreign deferred tax assets.
As of December 31, 2017, we had net operating loss carryforwards for federal and state tax purposes of $10 million and $136 million, respectively, which will begin to expire in 2019 and 2018, respectively, unless utilized prior. We also had state tax credit carryforwards of $95 million, which will begin to expire in 2022, unless utilized prior.
Pursuant to Section 382 and 383 of the Internal Revenue Code, utilization of net operating losses and credits may be subject to annual limitations in the event of any significant future changes in its ownership structure. These annual limitations may result in the expiration of net operating losses and credits prior to utilization. The deferred tax assets as of December 31, 2017 are net of any previous limitations due to Section 382 and 383.
71
Our manufacturing operations in Singapore operate under various tax holidays and incentives that begin to expire in 2018. These tax holidays and incentives resulted in a $49 million, $32 million, and $23 million decrease to the provision for income taxes for the years ended December 31, 2017, January 1, 2017, and January 3, 2016, respectively. These tax holidays and incentives resulted in an increase in diluted earnings per share attributable to Illumina stockholders of $0.33, $0.22, and $0.16, for the years ended December 31, 2017, January 1, 2017, and January 3, 2016, respectively.
It is our intention to indefinitely reinvest the historical earnings of our foreign subsidiaries generated prior to 2017 to ensure sufficient working capital and to expand existing operations outside the United States. Accordingly, U.S. and foreign income and withholding taxes have not been provided on $1.1 billion of undistributed earnings of foreign subsidiaries as of December 31, 2017. In the event we are required to repatriate funds from outside of the United States, such repatriation would be subject to local laws, customs, and tax consequences. For the year ended December 31, 2017, we asserted that $869 million of foreign earnings generated in 2017 would not be indefinitely reinvested, and accordingly, recorded a deferred tax liability of $5 million.
The following table summarizes the gross amount of our uncertain tax positions (in millions):
December 31, 2017 | January 1, 2017 | January 3, 2016 | |||||||||
Balance at beginning of year | $ | 65 | $ | 56 | $ | 52 | |||||
Increases related to prior year tax positions | 2 | — | 2 | ||||||||
Decreases related to prior year tax positions | — | (2 | ) | (1 | ) | ||||||
Increases related to current year tax positions | 14 | 13 | 11 | ||||||||
Decreases related to lapse of statute of limitations | (2 | ) | (2 | ) | (8 | ) | |||||
Balance at end of year | $ | 79 | $ | 65 | $ | 56 | |||||
Included in the balance of uncertain tax positions as of December 31, 2017 and January 1, 2017, were $70 million and $55 million, respectively, of net unrecognized tax benefits that, if recognized, would reduce the effective income tax rate in future periods.
Any interest and penalties related to uncertain tax positions are reflected in the provision for income taxes. We recognized expense of $1 million, expense of $1 million, and income of $0.2 million during the years ended December 31, 2017, January 1, 2017, and January 3, 2016, respectively, related to potential interest and penalties on uncertain tax positions. We recorded a liability for potential interest and penalties of $8 million and $6 million as of December 31, 2017 and January 1, 2017, respectively.
Tax years 1997 to 2016 remain subject to future examination by the major tax jurisdictions in which we are subject to tax. Given the uncertainty of potential adjustments from examination as well as the potential expiration of the statute of limitations, it is reasonably possible that the balance of unrecognized tax benefits could change significantly over the next 12 months. However, at this time, an estimate of the range of reasonably possible adjustments to the balance of unrecognized tax benefits cannot be determined given the number of matters and the number of years that are potentially subject to examination.
10. | Employee Benefit Plans |
Retirement Plan
We have a 401(k) savings plan covering substantially all of our employees in the United States. Our contributions to the plan are discretionary. During the years ended December 31, 2017, January 1, 2017, and January 3, 2016, we made matching contributions of $17 million, $14 million, and $12 million, respectively.
Deferred Compensation Plan
The Illumina, Inc. Deferred Compensation Plan (the Plan) allows senior level employees to contribute up to 80% of their base salary and 100% of their variable cash compensation, and members of the board of directors to contribute up to 100% of their director fees and equity awards. Under the Plan, we credit the participants’ contributions with earnings that reflect the performance of certain independent investment funds. On a discretionary basis, we may also make employer contributions to participant accounts in any amount determined by us. The vesting schedules of employer contributions are at the sole
72
discretion of the Compensation Committee. However, all employer contributions shall become 100% vested upon the occurrence of the participant’s disability, death or retirement or a change in control of Illumina. The benefits under this plan are unsecured. Participants are generally eligible to receive payment of their vested benefit at the end of their elected deferral period or after termination of their employment for any reason or at a later date to comply with the restrictions of Section 409A.
We also established a rabbi trust for the benefit of the participants under the Plan, and have included the assets of the rabbi trust in the consolidated balance sheets. As of December 31, 2017 and January 1, 2017, the assets of the trust were $35 million and $31 million, respectively, and our liabilities were $33 million and $29 million, respectively. The assets and liabilities are classified as other assets and accrued liabilities, respectively, on the consolidated balance sheets. Changes in the values of the assets held by the rabbi trust are recorded in other income (expense), net in the consolidated statements of income, and changes in the values of the deferred compensation liabilities are recorded in cost of revenue or operating expenses.
11. | Segment Information, Geographic Data, and Significant Customers |
We have two reportable segments: Illumina’s core operations (Core Illumina) and one segment related to the combined activities of the consolidated VIEs, GRAIL and Helix (Consolidated VIEs). Following the GRAIL deconsolidation on February 28, 2017, the Consolidated VIEs no longer include GRAIL. Prior to 2016, the combined results of operations of the Consolidated VIEs were not material.
We report segment information based on the management approach. This approach designates the internal reporting used by the Chief Operating Decision Maker (“CODM”) for making decisions and assessing performance as the source of our reportable segments. The CODM allocates resources and assesses the performance of each operating segment using information about its revenue and income (loss) from operations. Based on the information used by the CODM, we have determined its reportable segments as follows:
Core Illumina:
Core Illumina’s products and services serve customers in the research, clinical and applied markets, and enable the adoption of a variety of genomic solutions. Core Illumina includes all of our operations, excluding the results of its consolidated VIEs.
Consolidated VIEs:
Helix: Helix was established to enable individuals to explore their genetic information by providing affordable sequencing and database services for consumers through third-party partners, driving the creation of an ecosystem of consumer applications.
GRAIL: GRAIL was created to develop a blood test for early-stage cancer detection. GRAIL was in the early stages of developing this test and as such, had no revenues through the date of deconsolidation.
Management evaluates the performance of our operating segments based upon income (loss) from operations. We do not allocate expenses between segments. Core Illumina sells products and provides services to GRAIL and Helix in accordance with contractual agreements between the entities.
73
The following table presents the operating performance of each reportable segment (in millions):
Years Ended | |||||||||||
December 31, 2017 | January 1, 2017 | January 3, 2016 | |||||||||
Revenue: | |||||||||||
Core Illumina | $ | 2,754 | $ | 2,428 | $ | 2,220 | |||||
Consolidated VIEs | 6 | — | — | ||||||||
Eliminations | (8 | ) | (30 | ) | — | ||||||
Consolidated revenue | $ | 2,752 | $ | 2,398 | $ | 2,220 | |||||
Depreciation and amortization: | |||||||||||
Core Illumina | $ | 153 | $ | 138 | $ | 127 | |||||
Consolidated VIEs | 6 | 4 | — | ||||||||
Eliminations | (3 | ) | (1 | ) | — | ||||||
Consolidated depreciation and amortization | $ | 156 | $ | 141 | $ | 127 | |||||
Income (loss) from operations: | |||||||||||
Core Illumina | $ | 696 | $ | 684 | $ | 621 | |||||
Consolidated VIEs | (92 | ) | (81 | ) | (8 | ) | |||||
Eliminations | 2 | (16 | ) | — | |||||||
Consolidated income from operations | $ | 606 | $ | 587 | $ | 613 | |||||
Other income (expense), net primarily relate to Core Illumina and we do not allocate income taxes to our segments.
The following table presents the total assets and capital expenditures of each reportable segment (in millions):
Years Ended | |||||||||||
December 31, 2017 | January 1, 2017 | January 3, 2016 | |||||||||
Total assets: | |||||||||||
Core Illumina | $ | 5,223 | $ | 4,167 | $ | 3,658 | |||||
Consolidated VIEs | 45 | 180 | 31 | ||||||||
Eliminations | (11 | ) | (66 | ) | (1 | ) | |||||
Consolidated total assets | $ | 5,257 | $ | 4,281 | $ | 3,688 | |||||
Capital expenditures: | |||||||||||
Core Illumina | $ | 306 | $ | 238 | $ | 142 | |||||
Consolidated VIEs | 4 | 22 | 1 | ||||||||
Consolidated capital expenditures | $ | 310 | $ | 260 | $ | 143 | |||||
74
The following table represents revenue by geographic area for the years ended December 31, 2017, January 1, 2017, and January 3, 2016 (in millions):
Years Ended | |||||||||||
December 31, 2017 | January 1, 2017 | January 3, 2016 | |||||||||
United States | $ | 1,511 | $ | 1,294 | $ | 1,207 | |||||
Europe | 632 | 553 | 527 | ||||||||
Greater China (a) | 292 | — | — | ||||||||
Asia-Pacific (a) | 222 | 456 | 380 | ||||||||
Other markets | 95 | 95 | 106 | ||||||||
Total | $ | 2,752 | $ | 2,398 | $ | 2,220 | |||||
(a) Revenue for the Greater China region, which includes China, Taiwan, and Hong Kong, became material for the year ended December 31, 2017. Therefore, such revenue is reported separately and the Asia-Pacific region no longer includes the Greater China region. Greater China region revenue is included in the Asia-Pacific region for the years ended January 1, 2017, and January 3, 2016.
Revenue is attributable to geographic area based on the region of destination.
The majority of our revenue consists of sales of consumables and instruments. For the years ended December 31, 2017, January 1, 2017, and January 3, 2016, consumable sales represented 64%, 64%, and 58%, respectively, of total revenue and instrument sales comprised 19%, 20%, and 27%, respectively, of total revenue. Our customers include leading genomic research centers, academic institutions, government laboratories, and hospitals, as well as pharmaceutical, biotechnology, agrigenomics, commercial molecular diagnostic laboratories, and consumer genomics companies. We had no customers that provided more than 10% of total revenue in the years ended December 31, 2017, January 1, 2017, and January 3, 2016.
Net long-lived assets exclude goodwill and other intangible assets since they are not allocated on a geographic basis. We had net long-lived assets, consisting of property and equipment, in the following regions as of December 31, 2017 and January 1, 2017 (in millions):
December 31, 2017 | January 1, 2017 | ||||||
United States | $ | 828 | $ | 636 | |||
Singapore | 54 | 44 | |||||
United Kingdom | 43 | 28 | |||||
Other countries | 6 | 5 | |||||
Total | $ | 931 | $ | 713 | |||
75
12. | Quarterly Financial Information (unaudited) |
The following financial information reflects all normal recurring adjustments, which are, in the opinion of management, necessary for a fair statement of the results and cash flows of interim periods. All quarters for fiscal years 2017 and 2016 ended December 31, 2017 and January 1, 2017 were 13 weeks. Summarized quarterly data for fiscal years 2017 and 2016 are as follows (in millions, except per share amounts):
First Quarter | Second Quarter | Third Quarter | Fourth Quarter | ||||||||||||
2017 | |||||||||||||||
Total revenue | $ | 598 | $ | 662 | $ | 714 | $ | 778 | |||||||
Gross profit | $ | 368 | $ | 434 | $ | 482 | $ | 542 | |||||||
Consolidated net income | $ | 348 | $ | 120 | $ | 152 | $ | 58 | |||||||
Net income attributable to Illumina stockholders (a) | $ | 367 | $ | 128 | $ | 163 | $ | 68 | |||||||
Earnings per share attributable to Illumina stockholders: | |||||||||||||||
Basic | $ | 2.50 | $ | 0.87 | $ | 1.12 | $ | 0.47 | |||||||
Diluted | $ | 2.48 | $ | 0.87 | $ | 1.11 | $ | 0.46 | |||||||
2016 | |||||||||||||||
Total revenue | $ | 572 | $ | 600 | $ | 607 | $ | 619 | |||||||
Gross profit | $ | 397 | $ | 424 | $ | 426 | $ | 419 | |||||||
Consolidated net income | $ | 88 | $ | 116 | $ | 117 | $ | 108 | |||||||
Net income attributable to Illumina stockholders | $ | 90 | $ | 120 | $ | 129 | $ | 124 | |||||||
Earnings per share attributable to Illumina stockholders: | |||||||||||||||
Basic | $ | 0.61 | $ | 0.83 | $ | 0.88 | $ | 0.84 | |||||||
Diluted | $ | 0.60 | $ | 0.82 | $ | 0.87 | $ | 0.84 | |||||||
Certain amounts may not recalculate using the rounded amounts provided.
(a) First quarter of 2017 includes the results of GRAIL through February 28, 2017, the date of deconsolidation. Refer to note “2. Balance Sheet Account Details” for further discussions.
ITEM 9. Changes In and Disagreements with Accountants on Accounting and Financial Disclosure.
None.
ITEM 9A. | Controls and Procedures. |
We design our internal controls to provide reasonable assurance that (1) our transactions are properly authorized; (2) our assets are safeguarded against unauthorized or improper use; and (3) our transactions are properly recorded and reported in conformity with U.S. generally accepted accounting principles. We also maintain internal controls and procedures to ensure that we comply with applicable laws and our established financial policies.
Based on management’s evaluation (under the supervision and with the participation of our chief executive officer (CEO) and chief financial officer (CFO)), as of the end of the period covered by this report, our CEO and CFO concluded that our disclosure controls and procedures (as defined in Rules 13a-15(e) and 15d-15(e) under the Securities Exchange Act of 1934, as amended (the Exchange Act)), are effective to provide reasonable assurance that information required to be disclosed by us in reports that we file or submit under the Exchange Act is recorded, processed, summarized, and reported within the time periods specified in SEC rules and forms, and is accumulated and communicated to management, including our principal executive officer and principal financial officer, as appropriate, to allow timely decisions regarding required disclosure.
During the fourth quarter of 2017, we continued to monitor and evaluate the operating effectiveness of key controls. There were no changes in our internal control over financial reporting (as defined in Rules 13a-15(f) and 15d-15(f) of the Exchange Act) that materially affected or are reasonably likely to materially affect internal control over financial reporting.
76
MANAGEMENT’S REPORT ON INTERNAL CONTROL OVER FINANCIAL REPORTING
Our management is responsible for establishing and maintaining adequate internal control over financial reporting, as such term is defined in Exchange Act Rules 13a-15(f). Because of its inherent limitations, internal control over financial reporting may not prevent or detect all misstatements. Therefore, even those systems determined to be effective can provide only reasonable assurance with respect to financial statement preparation and presentation.
We conducted an evaluation of the effectiveness of our internal control over financial reporting based on the framework in Internal Control — Integrated Framework issued by the Committee of Sponsoring Organizations of the Treadway Commission (2013 framework). Based on our evaluation under the framework in Internal Control — Integrated Framework, our management concluded that our internal control over financial reporting was effective as of December 31, 2017. The effectiveness of our internal control over financial reporting as of December 31, 2017 has been audited by Ernst & Young LLP, an independent registered public accounting firm, as stated in their report which is included herein.
77
REPORT OF INDEPENDENT REGISTERED PUBLIC ACCOUNTING FIRM
The Board of Directors and Stockholders of Illumina, Inc.
Opinion on Internal Control over Financial Reporting
We have audited Illumina, Inc.’s internal control over financial reporting as of December 31, 2017, based on criteria established in Internal Control — Integrated Framework issued by the Committee of Sponsoring Organizations of the Treadway Commission (2013 framework) (the COSO criteria). In our opinion, Illumina, Inc. (the Company) maintained, in all material respects, effective internal control over financial reporting as of December 31, 2017, based on the COSO criteria.
We also have audited, in accordance with the standards of the Public Company Accounting Oversight Board (United States) (PCAOB), the consolidated balance sheets of Illumina, Inc. as of December 31, 2017 and January 1, 2017, the related consolidated statements of income, comprehensive income, stockholders’ equity, and cash flows for each of the three fiscal years in the period ended December 31, 2017, and the related notes of the Company and our report dated February 12, 2018 expressed an unqualified opinion thereon.
Basis for Opinion
The Company’s management is responsible for maintaining effective internal control over financial reporting, and for its assessment of the effectiveness of internal control over financial reporting included in the accompanying Management’s Report on Internal Control over Financial Reporting. Our responsibility is to express an opinion on the Company’s internal control over financial reporting based on our audit. We are a public accounting firm registered with the PCAOB and are required to be independent with respect to the Company in accordance with the U.S. federal securities laws and the applicable rules and regulations of the Securities and Exchange Commission and the PCAOB.
We conducted our audit in accordance with the standards of the PCAOB. Those standards require that we plan and perform the audit to obtain reasonable assurance about whether effective internal control over financial reporting was maintained in all material respects.
Our audit included obtaining an understanding of internal control over financial reporting, assessing the risk that a material weakness exists, testing and evaluating the design and operating effectiveness of internal control based on the assessed risk, and performing such other procedures as we considered necessary in the circumstances. We believe that our audit provides a reasonable basis for our opinion.
Definition and Limitations of Internal Control Over Financial Reporting
A company’s internal control over financial reporting is a process designed to provide reasonable assurance regarding the reliability of financial reporting and the preparation of financial statements for external purposes in accordance with generally accepted accounting principles. A company’s internal control over financial reporting includes those policies and procedures that (1) pertain to the maintenance of records that, in reasonable detail, accurately and fairly reflect the transactions and dispositions of the assets of the company; (2) provide reasonable assurance that transactions are recorded as necessary to permit preparation of financial statements in accordance with generally accepted accounting principles, and that receipts and expenditures of the company are being made only in accordance with authorizations of management and directors of the company; and (3) provide reasonable assurance regarding prevention or timely detection of unauthorized acquisition, use, or disposition of the company’s assets that could have a material effect on the financial statements.
Because of its inherent limitations, internal control over financial reporting may not prevent or detect misstatements. Also, projections of any evaluation of effectiveness to future periods are subject to the risk that controls may become inadequate because of changes in conditions, or that the degree of compliance with the policies or procedures may deteriorate.
/s/ ERNST & YOUNG LLP
San Diego, California
February 12, 2018
78
ITEM 9B. | Other Information. |
None.
PART III
ITEM 10. | Directors, Executive Officers, and Corporate Governance. |
(a) Identification of Directors. Information concerning our directors is incorporated by reference from the section entitled “Proposal One: Election of Directors,” “Information About Directors,” “Director Compensation,” and “Board of Directors and Corporate Governance” to be contained in our definitive Proxy Statement with respect to our 2018 Annual Meeting of Stockholders to be filed with the SEC no later than May 1, 2018.
(b) Identification of Executive Officers. Information concerning our executive officers is incorporated by reference from the section entitled “Executive Officers” to be contained in our definitive Proxy Statement with respect to our 2018 Annual Meeting of Stockholders to be filed with the SEC no later than May 1, 2018.
(c) Compliance with Section 16(a) of the Exchange Act. Information concerning compliance with Section 16(a) of the Securities Exchange Act of 1934 is incorporated by reference from the section entitled “Section 16(a) Beneficial Ownership Reporting Compliance” to be contained in our definitive Proxy Statement with respect to our 2018 Annual Meeting of Stockholders to be filed with the SEC no later than May 1, 2018.
(d) Information concerning the audit committee financial expert as defined by the SEC rules adopted pursuant to the Sarbanes-Oxley Act of 2002 is incorporated by reference from the section entitled “Board of Directors and Corporate Governance” to be contained in our definitive Proxy Statement with respect to our 2018 Annual Meeting of Stockholders to be filed with the SEC no later than May 1, 2018.
Code of Conduct
We have a code of conduct for our directors, officers, and employees, which is available on our website at www.illumina.com in the Corporate Governance portal of the Investor Information section under “Company.” A copy of the Code of Conduct is available in print free of charge to any stockholder who requests a copy. Interested parties may address a written request for a printed copy of the Code of Ethics to: Corporate Secretary, Illumina, Inc., 5200 Illumina Way, San Diego, California 92122. We intend to satisfy the disclosure requirement regarding any amendment to, or a waiver from, a provision of the Code of Ethics for our principal executive officer, principal financial officer, principal accounting officer or controller, or persons performing similar functions, by posting such information on our website. The information on, or that can be accessed from, our website is not incorporated by reference into this report.
ITEM 11. | Executive Compensation. |
Information concerning executive compensation is incorporated by reference from the sections entitled “Compensation Discussion and Analysis,” “Director Compensation,” and “Executive Compensation” to be contained in our definitive Proxy Statement with respect to our 2018 Annual Meeting of Stockholders to be filed with the SEC no later than May 1, 2018.
ITEM 12. | Security Ownership of Certain Beneficial Owners and Management and Related Stockholder Matters. |
Information concerning the security ownership of certain beneficial owners and management and information covering securities authorized for issuance under equity compensation plans is incorporated by reference from the sections entitled “Stock Ownership of Principal Stockholders and Management,” “Executive Compensation,” and “Equity Compensation Plan Information” to be contained in our definitive Proxy Statement with respect to our 2018 Annual Meeting of Stockholders to be filed with the SEC no later than May 1, 2018.
ITEM 13. | Certain Relationships and Related Transactions, and Director Independence. |
Information concerning certain relationships and related transactions, and director independence is incorporated by reference from the sections entitled “Proposal One: Election of Directors,” “Information About Directors,” “Director Compensation,” “Executive Compensation,” and “Certain Relationships and Related Party Transactions” to be contained in our definitive Proxy Statement with respect to our 2018 Annual Meeting of Stockholders to be filed with the SEC no later than May 1, 2018.
79
ITEM 14. | Principal Accountant Fees and Services. |
Information concerning principal accountant fees and services is incorporated by reference from the sections entitled “Proposal Two: Ratification of Appointment of Independent Registered Public Accounting Firm” and “Independent Registered Public Accountants” to be contained in our definitive Proxy Statement with respect to our 2018 Annual Meeting of Stockholders to be filed with the SEC no later than May 1, 2018.
PART IV
ITEM 15. | Exhibits, Financial Statement Schedules. |
1. Financial Statements: See “Index to Consolidated Financial Statements” in Part II, Item 8 of this report.
2. Financial Statement Schedule: All financial schedules have been omitted as the required information is not applicable, not material, or because the information required is included in the consolidated financial statements and notes thereto included in Part II, Item 8 of this report.
3. Exhibits: The exhibits listed in the accompanying index to exhibits are filed or incorporated by reference as part of this report.
80
INDEX TO EXHIBITS | |||||||||||||
Incorporated by Reference | |||||||||||||
Exhibit | Filing | Filed | |||||||||||
Number | Exhibit Description | Form | File Number | Exhibit | Date | Herewith | |||||||
3.1 | Amended and Restated Certificate of Incorporation | 8-K | 000-30361 | 3.1 | 9/23/2008 | ||||||||
3.2 | Amended and Restated Bylaws | 8-K | 001-35406 | 3.2 | 1/11/2017 | ||||||||
4.1 | Specimen Common Stock Certificate | S-1/A | 333-33922 | 4.1 | 7/3/2000 | ||||||||
4.2 | Indenture related to the 0% Convertible Senior Notes due 2019, dated as of June 11, 2014, between Illumina and The Bank of New York Mellon Trust Company, N.A., as trustee | 8-K | 001-35406 | 4.1 | 6/11/2014 | ||||||||
4.3 | Indenture related to the 0.5% Convertible Senior Notes due 2021, dated as of June 11, 2014, between Illumina and The Bank of New York Mellon Trust Company, N.A., as trustee | 8-K | 001-35406 | 4.2 | 6/11/2014 | ||||||||
4.4 | First Supplemental Indenture related to the 0.5% Convertible Senior Notes due 2021, dated as of August 27, 2014, between Illumina and The Bank of New York Mellon Trust Company, N.A., as trustee | 10-Q | 001-35406 | 4.1 | 10/29/2014 | ||||||||
+10.1 | Form of Indemnification Agreement between Illumina and each of its directors and executive officers | 10-Q | 000-30361 | 10.55 | 7/25/2008 | ||||||||
+10.2 | Amended and Restated Change in Control Severance Agreement between Illumina and Jay T Flatley, dated October 22, 2008 | 10-K | 000-30361 | 10.33 | 2/26/2009 | ||||||||
+10.3 | Form of Change in Control Severance Agreement between Illumina and each of its executive officers | 10-K | 000-30361 | 10.34 | 2/26/2009 | ||||||||
+10.4 | 2000 Employee Stock Purchase Plan, as amended and restated through February 2, 2012 | 10-K | 001-35406 | 10.4 | 2/24/2012 | ||||||||
+10.5 | New Hire Stock and Incentive Plan, as amended and restated through October 28, 2009 | 10-K | 000-30361 | 10.7 | 2/26/2010 | ||||||||
10.6 | License Agreement, effective as of May 6, 1998, between Tufts University and Illumina | 10-Q | 000-30361 | 10.5 | 5/3/2007 | ||||||||
+10.7 | The Solexa Unapproved Company Share Option Plan | 8-K | 000-30361 | 99.3 | 11/26/2007 | ||||||||
+10.7 | The Solexa Share Option Plan for Consultants | 8-K | 000-30361 | 99.4 | 11/26/2007 | ||||||||
+10.8 | Solexa Limited Enterprise Management Incentive Plan | 8-K | 000-30361 | 99.5 | 11/26/2007 | ||||||||
+10.9 | Amended and Restated Solexa 2005 Equity Incentive Plan | 10-K | 000-30361 | 10.25 | 2/26/2009 | ||||||||
+A29.10 | Amended and Restated Solexa 1992 Stock Option Plan | 10-K | 000-30361 | 10.26 | 2/26/2009 | ||||||||
2015 Stock and Incentive Plan | X | ||||||||||||
Form of Restricted Stock Unit Agreement for Employees Under 2015 Stock and Incentive Plan | X | ||||||||||||
81
INDEX TO EXHIBITS — (Continued) | |||||||||||||
Incorporated by Reference | |||||||||||||
Exhibit | Filing | Filed | |||||||||||
Number | Exhibit Description | Form | File Number | Exhibit | Date | Herewith | |||||||
10.13 | Amended and Restated Lease between BMR-9885 Towne Centre Drive LLC and Illumina for the 9885 Towne Centre Drive property, dated January 26, 2007 | 10-Q | 000-30361 | 10.41 | 5/3/2007 | ||||||||
10.14 | Lease between BMR-9885 Towne Centre Drive LLC and Illumina for the 9865 Towne Centre Drive property, dated January 26, 2007 | 10-Q | 000-30361 | 10.42 | 5/3/2007 | ||||||||
10.15 | Amended and Restated Lease Agreement, dated March 27, 2012, between ARE-SD Region No. 32, LLC and Illumina | 10-Q | 001-35406 | 10.1 | 5/3/2012 | ||||||||
10.16 | First Amendment to Amended and Restated Lease Agreement, dated March 27, 2012, between ARE-SD Region No. 32, LLC and Illumina | 10-K | 001-35406 | 10.23 | 2/18/2015 | ||||||||
10.17 | Second Amendment to Amended and Restated Lease Agreement, dated March 27, 2012, between ARE-SD Region No. 32, LLC and Illumina | 10-K | 001-35406 | 10.24 | 2/18/2015 | ||||||||
Amended and Restated Second Amendment to Amended and Restated Lease Agreement, dated March 27, 2012, between ARE-SD Region No. 32, LLC and Illumina | X | ||||||||||||
+10.19 | Deferred Compensation Plan, effective December 1, 2007 | 14D-9 | 005-60457 | 99(e)(6) | 2/7/2012 | ||||||||
10.20 | Lease between BMR-Lincoln Centre LP and Illumina, dated December 30, 2014 | 10-K | 001-35406 | 10.26 | 2/18/2015 | ||||||||
10.21 | Pooled Patents Agreement between Illumina and Sequenom, Inc., dated December 2, 2014 (with certain confidential portions omitted) | 10-K | 001-35406 | 10.27 | 2/18/2015 | ||||||||
First Amendment to Pooled Patents Agreement between Illumina and Sequenom, Inc., effective as of April 21, 2016 | X | ||||||||||||
Second Amendment to Pooled Patents Agreement between Illumina and Sequenom, Inc., effective as of April 17, 2017 | X | ||||||||||||
Third Amendment to Pooled Patents Agreement between Illumina and Sequenom, Inc., effective as of August 28, 2017 (with certain confidential portions omitted) | X | ||||||||||||
10.25 | Agreement for Lease between Granta Park Park Jco 1 Limited and Illumina, dated June 25, 2015 | 10-Q | 001-35406 | 10.1 | 7/31/2015 | ||||||||
10.26 | Third Amendment to Lease between ARE-SD Region No. 32, LLC and Illumina, dated September 2, 2015 | 10-K | 001-35406 | 10.29 | 3/2/2016 | ||||||||
82
INDEX TO EXHIBITS — (Continued) | |||||||||||||
Incorporated by Reference | |||||||||||||
Exhibit | Filing | Filed | |||||||||||
Number | Exhibit Description | Form | File Number | Exhibit | Date | Herewith | |||||||
10.27 | First Amendment to Lease between BMR-Lincoln Center LP and Illumina, dated February 23, 2016 | 10-K | 001-35406 | 10.30 | 3/2/2016 | ||||||||
10.28 | Fourth Amendment to Lease between ARE-SD Region No. 32, LLC and Illumina, dated April 14, 2016 | 10-K | 001-35406 | 10.28 | 2/14/2017 | ||||||||
10.29 | Second Amendment to Lease between BMR-Lincoln Center LP and Illumina dated August 15, 2016 | 10-K | 001-35406 | 10.29 | 2/14/2017 | ||||||||
10.30 | Deed of Variation to the Agreement for Lease between Granta Park Jco 1 Limited and Illumina dated October 24, 2016 | 10-K | 001-35406 | 10.30 | 2/14/2017 | ||||||||
10.31 | Separation Agreement and General Release of All Claims between Illumina and Christian Henry | 10-K | 001-35406 | 10.31 | 2/14/2017 | ||||||||
Subsidiaries of Illumina | X | ||||||||||||
Consent of Independent Registered Public Accounting Firm | X | ||||||||||||
24.1 | Power of Attorney (included on the signature page) | X | |||||||||||
Certification of Francis A. deSouza pursuant to Section 302 of the Sarbanes-Oxley Act of 2002 | X | ||||||||||||
Certification of Sam A. Samad pursuant to Section 302 of the Sarbanes-Oxley Act of 2002 | X | ||||||||||||
Certification of Francis A. deSouza pursuant to 18 U.S.C. Section 1350, as adopted pursuant to Section 906 of the Sarbanes-Oxley Act of 2002 | X | ||||||||||||
Certification of Sam A. Samad pursuant to 18 U.S.C. Section 1350, as adopted pursuant to Section 906 of the Sarbanes-Oxley Act of 2002 | X | ||||||||||||
XBRL Instance Document | X | ||||||||||||
XBRL Taxonomy Extension Schema | X | ||||||||||||
XBRL Taxonomy Extension Calculation Linkbase | X | ||||||||||||
XBRL Taxonomy Extension Label Linkbase | X | ||||||||||||
XBRL Taxonomy Extension Presentation Linkbase | X | ||||||||||||
XBRL Taxonomy Extension Definition Linkbase | X | ||||||||||||
_______________________________________
+ | Management contract or corporate plan or arrangement | |
Supplemental Information
No Annual Report to stockholders or proxy materials has been sent to stockholders as of the date of this report. The Annual Report to stockholders and proxy material will be furnished to our stockholders after the filing of this Annual Report on Form 10-K and we will furnish such material to the SEC at that time.
83
84
SIGNATURES
Pursuant to the requirements of the Section 13 or 15(d) of the Securities Exchange Act of 1934, the Registrant has duly caused this Report to be signed on its behalf by the undersigned, thereunto duly authorized, on February 12, 2018.
ILLUMINA, INC. | ||
By | /s/ FRANCIS A. DESOUZA | |
Francis A. deSouza President and Chief Executive Officer | ||
85
February 12, 2018
POWER OF ATTORNEY
KNOW ALL PERSONS BY THESE PRESENT, that each person whose signature appears below constitutes and appoints Francis A. deSouza and Sam A. Samad, and each or any one of them, his or her true and lawful attorney-in-fact and agent, with full power of substitution and resubstitution, for him and in his or her name, place and stead, in any and all capacities, to sign any and all amendments to this Annual Report on Form 10-K, and to file the same, with all exhibits thereto, and other documents in connection therewith, with the Securities and Exchange Commission, granting unto said attorneys-in-fact and agents, and each of them, full power and authority to do and perform each and every act and thing requisite and necessary to be done in connection therewith, as fully to all intents and purposes as he might or could do in person, hereby ratifying and confirming all that said attorneys-in-fact and agents, or any of them, or their, his, or her substitutes or substitute, may lawfully do or cause to be done by virtue hereof.
Pursuant to the requirements of the Securities Exchange Act of 1934, this Annual Report on Form 10-K has been signed below by the following persons on behalf of the registrant and in the capacities and on the dates indicated.
/s/ FRANCIS A. DESOUZA | President, Chief Executive Officer, and Director (Principal Executive Officer) | February 12, 2018 | ||
Francis A. deSouza | ||||
/s/ SAM A. SAMAD | Senior Vice President and Chief Financial Officer (Principal Financial Officer) | February 12, 2018 | ||
Sam A. Samad | ||||
/s/ KAREN McGINNIS | Vice President and Chief Accounting Officer (Principal Accounting Officer) | February 12, 2018 | ||
Karen McGinnis | ||||
/s/ JAY T. FLATLEY | Executive Chairman of the Board of Directors | February 12, 2018 | ||
Jay T. Flatley | ||||
/s/ FRANCES ARNOLD | Director | February 12, 2018 | ||
Frances Arnold | ||||
/s/ A. BLAINE BOWMAN | Director | February 12, 2018 | ||
A. Blaine Bowman | ||||
/s/ CAROLINE D. DORSA | Director | February 12, 2018 | ||
Caroline D. Dorsa | ||||
/s/ KARIN EASTHAM | Director | February 12, 2018 | ||
Karin Eastham | ||||
/s/ ROBERT S. EPSTEIN | Director | February 12, 2018 | ||
Robert S. Epstein | ||||
/s/ GARY S. GUTHART | Director | February 12, 2018 | ||
Gary S. Guthart, Ph.D. | ||||
/s/ PHILIP W. SCHILLER | Director | February 12, 2018 | ||
Philip W. Schiller | ||||
/s/ JOHN W. THOMPSON | Director | February 12, 2018 | ||
John W. Thompson | ||||
86