Attached files
| file | filename |
|---|---|
| EX-21.1 - EXHIBIT 21.1 - ARES CAPITAL CORP | arccq4-17exhibit211.htm |
| EX-32.1 - EXHIBIT 32.1 - ARES CAPITAL CORP | arccq4-17exhibit321.htm |
| EX-31.2 - EXHIBIT 31.2 - ARES CAPITAL CORP | arccq4-17exhibit312.htm |
| EX-31.1 - EXHIBIT 31.1 - ARES CAPITAL CORP | arccq4-17exhibit311.htm |
UNITED STATES
SECURITIES AND EXCHANGE COMMISSION
Washington, D.C. 20549
____________________________________________________________________________
FORM 10-K
ý | ANNUAL REPORT PURSUANT TO SECTION 13 OR 15(d) OF THE SECURITIES EXCHANGE ACT OF 1934 | |
For the fiscal year ended December 31, 2017 | ||
OR | ||
o | TRANSITION REPORT PURSUANT TO SECTION 13 OR 15(d) OF THE SECURITIES EXCHANGE ACT OF 1934 | |
For the transition period from _____ to _____ | ||
Commission File No. 814-00663 | ||
__________________________________________________________________________
ARES CAPITAL CORPORATION
(Exact name of registrant as specified in its charter)
Maryland | 33-1089684 | |
(State or other jurisdiction of incorporation or organization) | (I.R.S. Employer Identification No.) | |
245 Park Avenue, 44th Floor, New York, New York 10167 (Address of principal executive offices) (Zip Code) | ||
(212) 750-7300 (Registrant’s telephone number, including area code) | ||
____________________________________________________________________________
Securities registered pursuant to Section 12(b) of the Act:
Title of each class | Name of each exchange on which registered | |
Common Stock, par value $0.001 per share | The NASDAQ Global Select Market | |
6.875% Senior Notes due 2047 | The New York Stock Exchange | |
Securities registered pursuant to Section 12(g) of the Act: None
Indicate by check mark if the registrant is a well-known seasoned issuer, as defined in Rule 405 of the Securities Act. Yes o No ý
Indicate by check mark if the registrant is not required to file reports pursuant to Section 13 or Section 15(d) of the Act. Yes o No ý
Indicate by check mark whether the registrant (1) has filed all reports required to be filed by Section 13 or 15(d) of the Securities Exchange Act of 1934 during the preceding 12 months (or for such shorter period that the registrant was required to file such reports), and (2) has been subject to such filing requirements for the past 90 days: Yes ý No o
Indicate by check mark whether the registrant has submitted electronically and posted on its corporate Web site, if any, every Interactive Data File required to be submitted and posted pursuant to Rule 405 of Regulation S-T (Section §232.405 of this chapter) during the preceding 12 months (or for such shorter period that the registrant was required to submit and post such files). Yes o No o
Indicate by check mark if disclosure of delinquent filers pursuant to Item 405 of Regulation S-K is not contained herein, and will not be contained, to the best of registrant’s knowledge, in definitive proxy or information statements incorporated by reference in Part III of this Form 10-K or any amendment to this Form 10-K. o
Indicate by check mark whether the registrant is a large accelerated filer, an accelerated filer, a non-accelerated filer, a smaller reporting company, or emerging growth company. See the definitions of “large accelerated filer,” “accelerated filer,” “smaller reporting company” and “emerging growth company” in Rule 12b-2 of the Exchange Act:
Large accelerated filer ý | Accelerated filer o | Non-accelerated filer o (Do not check if a smaller reporting company) | Smaller reporting company o | Emerging Growth Company o | ||||
If an emerging growth company, indicate by check mark if the registrant has elected not to use the extended transition period complying with any new or revised financial accounting standards provided pursuant to Section 13(a) of the Exchange Act. o
Indicate by check mark whether the registrant is a shell company (as defined in Rule 12b-2 of the Exchange Act). Yes o No ý
The aggregate market value of the voting stock held by non-affiliates of the registrant on June 30, 2017, based on the closing price on that date of $16.38 on The NASDAQ Global Select Market, was approximately $6,950,838,049. As of February 8, 2018, there were 426,299,165 shares of the registrant’s common stock outstanding.
Portions of the registrant’s Proxy Statement for its 2018 Annual Meeting of Stockholders to be filed not later than 120 days after the end of the fiscal year covered by this Annual Report on Form 10-K are incorporated by reference into Part III of this Form 10-K.
ARES CAPITAL CORPORATION
TABLE OF CONTENTS
2
PART I
Item 1. Business
GENERAL
Ares Capital Corporation
Ares Capital Corporation, a Maryland corporation (together with its subsidiaries, where applicable, “Ares Capital” or the “Company,” which may also be referred to as “we,” “us” or “our”), is a specialty finance company that is a closed-end, non-diversified management investment company. We have elected to be regulated as a business development company (“BDC”) under the Investment Company Act of 1940, as amended and the rules and regulations promulgated thereunder, the “Investment Company Act.” We were founded on April 16, 2004, were initially funded on June 23, 2004 and completed our initial public offering (“IPO”) on October 8, 2004. As of December 31, 2017, we were the largest BDC in the U.S. with approximately $12.3 billion of total assets.
We are externally managed by Ares Capital Management LLC (“Ares Capital Management” or our “investment adviser”), a subsidiary of Ares Management, L.P. (NYSE:ARES) (“Ares Management” or “Ares”), a publicly traded, leading global alternative asset manager, pursuant to our investment advisory and management agreement. Ares Operations LLC (“Ares Operations” or our “administrator”), a subsidiary of Ares Management, provides certain administrative and other services necessary for us to operate.
Our investment objective is to generate both current income and capital appreciation through debt and equity investments. We invest primarily in U.S. middle-market companies, where we believe the supply of primary capital is limited and the investment opportunities are most attractive. However, we may from time to time invest in larger or smaller companies. We generally use the term “middle-market” to refer to companies with annual EBITDA between $10 million and $250 million. As used herein, EBITDA represents net income before net interest expense, income tax expense, depreciation and amortization.
We invest primarily in first lien senior secured loans (including “unitranche” loans, which are loans that combine both senior and mezzanine debt, generally in a first lien position), second lien senior secured loans and mezzanine debt, which in some cases includes an equity component. First and second lien senior secured loans generally are senior debt instruments that rank ahead of subordinated debt of a given portfolio company. Mezzanine debt is subordinated to senior loans and is generally unsecured. Our investments in corporate borrowers generally range between $30 million and $500 million each and investments in project finance/power generation projects generally range between $10 million and $200 million. However, the investment sizes may be more or less than these ranges and may vary based on, among other things, our capital availability, the composition of our portfolio and general micro- and macro-economic factors.
To a lesser extent, we also make preferred and/or common equity investments, which have generally been non-control equity investments of less than $20 million (usually in conjunction with a concurrent debt investment). However, we may increase the size or change the nature of these investments. Also, as a result of the American Capital Acquisition (as defined below), American Capital’s (as defined below) equity investments, including equity investments pursuant to which American Capital controlled a particular portfolio company, became part of our portfolio.
The proportion of these types of investments will change over time given our views on, among other things, the economic and credit environment in which we are operating. In connection with our investing activities, we may make commitments with respect to indebtedness or securities of a potential portfolio company substantially in excess of our final investment. In such situations, while we may initially agree to fund up to a certain dollar amount of an investment, we may subsequently syndicate or sell a portion of such amount (including, without limitation, to vehicles managed by our portfolio company, Ivy Hill Asset Management, L.P. (“IHAM”)), such that we are left with a smaller investment than what was reflected in our original commitment. In addition to originating investments, we may also acquire investments in the secondary market (including purchases of a portfolio of investments).
The first and second lien senior secured loans in which we invest generally have stated terms of three to 10 years and the mezzanine debt investments in which we invest generally have stated terms of up to 10 years, but the expected average life of such first and second lien loans and mezzanine debt is generally between three and seven years. However, we may invest in loans and securities with any maturity or duration. The instruments in which we invest typically are not rated by any rating agency, but we believe that if such instruments were rated, they would be below investment grade (rated lower than “Baa3” by Moody’s Investors Service, lower than “BBB-” by Fitch Ratings or lower than “BBB-” by Standard & Poor’s Ratings Services), which, under the guidelines established by these entities, is an indication of having predominantly speculative
3
characteristics with respect to the issuer’s capacity to pay interest and repay principal. Bonds that are rated below investment grade are sometimes referred to as “high yield bonds” or “junk bonds.” We may invest without limit in debt or other securities of any rating, as well as debt or other securities that have not been rated by any nationally recognized statistical rating organization.
We believe that our investment adviser, Ares Capital Management, is able to leverage the current investment platform, resources and existing relationships of Ares Management with financial sponsors, financial institutions, hedge funds and other investment firms to provide us with attractive investment opportunities. For purposes of this document, we refer to Ares Management and its affiliated companies (other than portfolio companies of its affiliated funds) as “Ares.” In addition to deal flow, the Ares investment platform assists our investment adviser in analyzing, structuring and monitoring investments. Ares has been in existence for over 20 years and its partners have an average of approximately 25 years of experience in leveraged finance, private equity, distressed debt, commercial real estate finance, investment banking and capital markets. We have access to Ares’ investment professionals and administrative professionals, who provide assistance in accounting, finance, legal, compliance, operations, information technology and investor relations. As of December 31, 2017, Ares had approximately 390 investment professionals and approximately 615 administrative professionals.
While our primary focus is to generate current income and capital appreciation through investments in first and second lien senior secured loans and mezzanine debt and, to a lesser extent, equity securities of eligible portfolio companies, we also may invest up to 30% of our portfolio in non‑qualifying assets, as permitted by the Investment Company Act. Specifically, as part of this 30% basket, we may invest in entities that are not considered “eligible portfolio companies” (as defined in the Investment Company Act), including companies located outside of the United States, entities that are operating pursuant to certain exceptions under the Investment Company Act, and publicly traded entities whose public equity market capitalization exceeds the levels provided for under the Investment Company Act.
American Capital Acquisition
On January 3, 2017, we completed our acquisition of American Capital, Ltd. (“American Capital”) (the “American Capital Acquisition”) in a cash and stock transaction valued at approximately $4.2 billion. Pursuant to the terms and conditions of the Agreement and Plan of Merger, dated May 23, 2016 (the “Merger Agreement”), American Capital stockholders received the right to the following merger consideration for each share of American Capital common stock owned: (i) $6.48 per share in cash from the Company (including a make‑up dividend in the amount of $0.07 per share), (ii) 0.483 shares of our common stock for each share of American Capital common stock held immediately prior to the mergers, (iii) $2.45 per share in cash, which amount represents the per share cash consideration paid to American Capital pursuant to the sale by American Capital Asset Management, LLC of American Capital Mortgage Management, LLC to American Capital Agency Corp., which was completed on July 1, 2016 and (iv) approximately $1.20 per share in cash from Ares Capital Management, acting solely on its own behalf. In connection with the stock consideration, we issued approximately 112 million shares of our common stock to American Capital’s then‑existing stockholders (including holders of outstanding in‑the‑money American Capital stock options), thereby resulting in our then‑existing stockholders owning approximately 73.7% of the combined company and American Capital’s then‑existing stockholders owning approximately 26.3% of the combined company. As a result of the American Capital Acquisition, we acquired $3.6 billion of assets, including $2.5 billion of investments, and assumed $226 million of liabilities.
In connection with the American Capital Acquisition, Ares Capital Management has agreed to waive up to $100 million in income based fees from the Company for the first ten calendar quarters beginning with the second quarter of 2017, in an amount equal to the lesser of (1) $10 million of income based fees and (2) the amount of income based fees for each such quarter, in each case, to the extent earned and payable by us in such quarter pursuant to and as calculated under our investment advisory and management agreement (the “Fee Waiver”). See “Management’s Discussion And Analysis Of Financial Condition And Results Of Operations—Overview—American Capital Acquisition” and Notes 3 and 16 to our consolidated financial statements for the year ended December 31, 2017 for additional information regarding the American Capital Acquisition.
Ares Management, L.P.
Ares is a publicly traded, leading global alternative asset manager. As of December 31, 2017, Ares had over 1,000 employees in over 15 principal and originating offices across the United States, Europe, Asia and Australia. Since its inception in 1997, Ares has adhered to a disciplined investment philosophy that focuses on delivering strong risk-adjusted investment returns throughout market cycles. Ares believes each of its three distinct but complementary investment groups in Credit, Private Equity and Real Estate is a market leader based on investment performance. Ares was built upon the fundamental principle that each group benefits from being part of the greater whole.
4
Ares Capital Management LLC
Ares Capital Management, our investment adviser, is served by an origination, investment and portfolio management team of approximately 100 U.S.-based investment professionals as of December 31, 2017 and led by certain partners of the Ares Credit Group: Kipp deVeer, Mitchell Goldstein and Michael Smith. Ares Capital Management leverages off of Ares’ investment platform and benefits from the significant capital markets, trading and research expertise of Ares’ investment professionals. Ares Capital Management’s investment committee has eight members primarily comprised of certain of the U.S.-based partners of the Ares Credit Group.
MARKET OPPORTUNITY
We believe that current market conditions present attractive opportunities for us to invest in middle-market companies, specifically:
• | We believe that many commercial and investment banks have, in recent years, de-emphasized their service and product offerings to middle-market businesses in favor of lending to large corporate clients and managing capital markets transactions. In addition, these lenders may be constrained in their ability to underwrite and hold bank loans and high yield securities for middle-market issuers as they seek to meet existing and future regulatory capital requirements. These factors may result in opportunities for alternative funding sources to middle-market companies and therefore more new-issue market opportunities for us. |
• | We believe disruption and volatility that occurs periodically in the credit markets, reduces capital available to certain capital providers, causing a reduction in competition. When these volatile market conditions occur, they often create opportunities to achieve attractive risk-adjusted returns. |
• | We believe that there is a lack of market participants that are willing to hold meaningful amounts of certain middle-market loans. As a result, we believe our ability to minimize syndication risk for a company seeking financing by being able to hold our loans without having to syndicate them is a competitive advantage. |
• | We believe that middle-market companies have faced difficulty in raising debt through the capital markets. This approach to financing may become more difficult to the extent institutional investors seek to invest in larger, more liquid offerings, leaving less competition and fewer financing alternatives for middle-market companies. |
• | We believe there is a large pool of un-invested private equity capital for middle-market businesses. We expect private equity firms will seek to leverage their investments by combining equity capital with senior secured loans and mezzanine debt from other sources such as us. |
• | We believe the middle-market represents a significant portion of the overall economy, and the demand for capital by middle-market companies reflects generally stronger growth trends and financial performance. In addition, due to the fragmented nature of the middle-market and the lack of publicly available information, we believe lenders have an opportunity to originate and underwrite investments with more favorable terms, including stronger covenant and reporting packages, as well as better call protection and change of control provisions as compared to the large, broadly syndicated loan market. |
COMPETITIVE ADVANTAGES
We believe that we have the following competitive advantages over other capital providers to middle-market companies:
The Ares Platform
Ares operates three distinct but complementary investment groups, including the Ares Credit Group, the Ares Private Equity Group and the Ares Real Estate Group. We believe our affiliation with Ares provides a distinct competitive advantage through Ares’ originations, due diligence, and marketing activities. In particular, we believe that the Ares platform provides us with an advantage through its deal flow generation and investment evaluation process. Ares’ asset management platform also provides additional market information, company knowledge and industry insight that benefit our investment and due diligence process. Ares’ professionals maintain extensive financial sponsor and intermediary relationships, which provide valuable insight and access to transactions and information.
5
Seasoned Management Team
The investment professionals in the Ares Credit Group and members of our investment adviser’s investment committee also have significant experience investing across market cycles. This experience also provides us with a competitive advantage in identifying, originating, investing in and managing a portfolio of investments in middle-market companies.
Broad Origination Strategy
We focus on self-originating most of our investments by pursuing a broad array of investment opportunities in middle-market companies and power generation projects across multiple channels. We also leverage off of the extensive relationships of the broader Ares platform, including relationships with the portfolio companies in the IHAM Vehicles (as defined below), to identify investment opportunities. We believe that this allows for asset selectivity and that there is a significant relationship between proprietary deal origination and credit performance. We believe that our focus on generating proprietary deal flow and lead investing also gives us greater control over capital structure, deal terms, pricing and documentation and enables us to actively manage our portfolio investments. Moreover, by leading the investment process, we are often able to secure controlling positions in credit tranches, thereby providing additional control in investment outcomes. We also have originated substantial proprietary deal flow from middle-market intermediaries, which often allows us to act as the sole or principal source of institutional capital to the borrower.
Scale and Flexible Transaction Structuring
We believe that being one of the largest BDCs makes us a more desirable and flexible capital provider, especially in competitive markets. We are flexible with the types of investments we make and the terms associated with those investments. We believe this approach and experience enables our investment adviser to identify attractive investment opportunities throughout economic cycles and across a company’s capital structure so we can make investments consistent with our stated investment objective and preserve principal while seeking appropriate risk adjusted returns. In addition, we have the flexibility to provide “one stop” financing with the ability to invest capital across the balance sheet and syndicate and hold larger investments than many of our competitors. We believe that the ability to underwrite, syndicate and hold larger investments benefits our stockholders by (a) potentially increasing net income and earnings through syndication, (b) increasing originated deal flow flexibility, (c) broadening market relationships and deal flow, (d) allowing us to optimize our portfolio composition and (e) allowing us to provide capital to a broader spectrum of middle-market companies, which we believe currently have limited access to capital from traditional lending sources. In addition, we believe that the ability to provide capital at every level of the balance sheet provides a strong value proposition to middle-market borrowers and our senior debt capabilities provide superior deal origination and relative value analysis capabilities compared to junior capital focused lenders.
Experience with and Focus on Middle-Market Companies
Ares has historically focused on investments in middle-market companies and we benefit from this experience. In sourcing and analyzing deals, our investment adviser benefits from Ares’ extensive network of relationships focused on middle-market companies, including management teams, members of the investment banking community, private equity groups and other investment firms with whom Ares has had long-term relationships. We believe this network enables us to identify well-positioned prospective portfolio company investments. The Ares Credit Group works closely with Ares’ other investment professionals. As of December 31, 2017, Ares oversaw a portfolio of investments in over 1,480 companies, approximately 505 structured assets and over 170 properties across approximately 60 industries, which provides access to an extensive network of relationships and insights into industry trends and the state of the capital markets.
Disciplined Investment Philosophy
In making its investment decisions, our investment adviser has adopted Ares’ long-standing, consistent, credit-based investment approach that was developed over 20 years ago by its founders. Specifically, our investment adviser’s investment philosophy, portfolio construction and portfolio management involve an assessment of the overall macroeconomic environment and financial markets and company-specific research and analysis. Its investment approach emphasizes capital preservation, low volatility and minimization of downside risk. In addition to engaging in extensive due diligence from the perspective of a long-term investor, our investment adviser’s approach seeks to reduce risk in investments by focusing on:
• | businesses with strong franchises and sustainable competitive advantages; |
• | industries with positive long-term dynamics; |
6
• | businesses and industries with cash flows that are dependable and predictable; |
• | management teams with demonstrated track records and appropriate economic incentives; |
• | rates of return commensurate with the perceived risks; |
• | securities or investments that are structured with appropriate terms and covenants; and |
• | businesses backed by experienced private equity sponsors. |
Extensive Industry Focus
We seek to concentrate our investing activities in industries with a history of predictable and dependable cash flows and in which the Ares investment professionals have had extensive investment experience. Ares investment professionals have developed long-term relationships with management teams and management consultants in approximately 60 industries, and have accumulated substantial information and identified potential trends within these industries. In turn, we benefit from these relationships, information and identification of potential trends in making investments.
OPERATING AND REGULATORY STRUCTURE
Our investment activities are managed by our investment adviser, Ares Capital Management, which is a subsidiary of Ares, and supervised by our board of directors, a majority of whom are independent of Ares and its affiliates. Ares Capital Management is registered under the Investment Advisers Act of 1940, or the “Advisers Act.” Under our Amended and Restated Investment Advisory and Management Agreement with Ares Capital Management, referred to herein as our “investment advisory and management agreement,” we have agreed to pay Ares Capital Management base management fees based on our total assets, as defined under the Investment Company Act (other than cash and cash equivalents, but including assets purchased with borrowed funds) (“base management fees”), fees based on our net investment income (“income based fees”) and fees based on our net capital gains (“capital gains incentive fees”). See “—Investment Advisory and Management Agreement”. Ares Operations provides us with certain administrative and other services necessary for us to operate pursuant to an Amended and Restated Administration Agreement, referred to herein as our “administration agreement.” See “—Administration Agreement.”
As a BDC, we are required to comply with certain regulatory requirements. For example, we are not generally permitted to co-invest in any portfolio company in which a fund managed by Ares or any of its downstream affiliates (other than us and our downstream affiliates) is also co-investing. On January 18, 2017, we received an order from the SEC that permits us and other BDCs and registered closed-end management investment companies managed by Ares to co-invest in portfolio companies with each other and with affiliated investment funds (the “Co-investment Exemptive Order”). Co-investments made under the Co-investment Exemptive Order are subject to compliance with certain conditions and other requirements, which could limit our ability to participate in a co-investment transaction. We may also co-invest with funds managed by Ares or any of its downstream affiliates, subject to compliance with existing regulatory guidance, applicable regulations and our allocation procedures.
Also, while we may borrow funds to make investments, our ability to use debt is limited in certain significant aspects. See “Regulation.” In particular, BDCs must have at least 200% asset coverage calculated pursuant to the Investment Company Act (i.e., we are permitted to borrow one dollar for every dollar we have in assets less all liabilities and indebtedness not represented by senior securities issued by us) in order to incur debt or issue preferred stock (which we refer to collectively as “senior securities”), which requires us to finance our investments with at least as much equity as senior securities in the aggregate. Certain of our credit facilities also require that we maintain asset coverage of at least 200%. As of December 31, 2017, our asset coverage was 242%.
In addition, as a consequence of our being a regulated investment company (“RIC”) under the Internal Revenue Code of 1986, as amended (the “Code”) for U.S. federal income tax purposes, our asset growth is dependent on our ability to raise equity capital through the issuance of common stock. RICs generally must distribute substantially all of their investment company taxable income (as defined under the Code) to stockholders as dividends in order to preserve their status as a RIC and not to be subject to additional U.S. federal corporate-level income taxes. This requirement, in turn, generally prevents us from using our earnings to support our operations, including making new investments.
7
INVESTMENTS
Ares Capital Corporation Portfolio
We have built an investment portfolio of primarily first and second lien senior secured loans, mezzanine debt and, to a lesser extent, equity investments in private middle-market companies. Our portfolio is well diversified by industry sector and its concentration to any single issuer is limited.
Our debt investments in corporate borrowers generally range between $30 million and $500 million each and investments in project finance/power generation projects generally range between $10 million and $200 million each. However, the sizes of our investments may be more or less than these ranges and may vary based on, among other things, our capital availability, the composition of our portfolio and general micro- and macro-economic factors.
Our preferred and/or common equity investments have generally been non-control equity investments of less than $20 million (usually in conjunction with a concurrent debt investment). However, we may increase the size or change the nature of these investments. Also, as a result of the American Capital Acquisition, American Capital’s equity investments, including equity investments pursuant to which American Capital controlled a particular portfolio company, became part of our portfolio.
In addition, the proportion of these types of investments will change over time given our views on, among other things, the economic and credit environment in which we are operating. In connection with our investing activities, we may make commitments with respect to indebtedness or securities of a potential portfolio company substantially in excess of our expected final hold size. In such situations, while we may initially agree to fund up to a certain dollar amount of an investment, we may subsequently syndicate a portion of such amount such that we are left with a smaller investment than what was reflected in our original commitment. In addition to originating investments, we may also acquire investments in the secondary market (including purchases of a portfolio of investments).
We make senior secured loans primarily in the form of first lien loans (including unitranche loans) and second lien loans. Our senior secured loans generally have terms of three to ten years. In connection with our senior secured loans we generally receive a security interest in certain of the assets of the borrower and consequently such assets serve as collateral in support of the repayment of such senior secured loans. Senior secured loans are generally exposed to the least amount of credit risk because they typically hold a senior position with respect to scheduled interest and principal payments and security interests in assets of the borrower. However, unlike mezzanine debt, senior secured loans typically do not receive any stock, warrants to purchase stock or other yield enhancements. Senior secured loans may include both revolving lines of credit and term loans.
Structurally, mezzanine debt usually ranks subordinate in priority of payment to senior secured loans and is often unsecured. However, mezzanine debt ranks senior to preferred and common equity in a borrower’s capital structure. Mezzanine debt investments generally offer lenders fixed returns in the form of interest payments and will often provide lenders an opportunity to participate in the capital appreciation of a borrower, if any, through an equity interest. This equity interest typically takes the form of an equity co-investment and/or warrants. Due to its higher risk profile and often less restrictive covenants as compared to senior secured loans, mezzanine debt generally bears a higher stated interest rate than senior secured loans. The equity co-investment and warrants (if any) associated with a mezzanine debt investment typically allow lenders to receive repayment of their principal on an agreed amortization schedule while retaining their equity interest in the borrower. Equity issued in connection with mezzanine debt also may include a “put” feature, which permits the holder to sell its equity interest back to the borrower at a price determined through an agreed formula.
In making an equity investment, in addition to considering the factors discussed under “—Investment Selection” below, we also consider the anticipated timing of a liquidity event, such as a public offering, sale of the company or redemption of our equity securities.
While our primary focus is to generate current income and capital appreciation through investments in first and second lien senior secured loans and mezzanine debt and, to a lesser extent, equity securities of eligible portfolio companies, we also may invest up to 30% of our portfolio in non-qualifying assets, as permitted by the Investment Company Act. See “—Regulation”. Specifically, as part of this 30% basket, we may invest in entities that are not considered “eligible portfolio companies” (as defined in the Investment Company Act), including companies located outside of the United States, entities that are operating pursuant to certain exceptions under the Investment Company Act, and publicly traded entities whose public equity market capitalization exceeds the levels provided for under the Investment Company Act.
8
Senior Direct Lending Program
We have established a joint venture with Varagon Capital Partners (“Varagon”) to make certain first lien senior secured loans, including certain stretch senior and unitranche loans, primarily to U.S. middle-market companies. Varagon was formed in 2013 as a lending platform by American International Group, Inc. (NYSE:AIG) and other partners. The joint venture is called the Senior Direct Lending Program (the “SDLP”). In July 2016, the Company and Varagon and its clients completed the initial funding of the SDLP. The SDLP may generally commit and hold individual loans of up to $300 million. We may directly co‑invest with the SDLP to accommodate larger transactions. The SDLP is capitalized as transactions are completed and all portfolio decisions and generally all other decisions in respect of the SDLP must be approved by an investment committee of the SDLP consisting of representatives of ours and Varagon (with approval from a representative of each required).
We provide capital to the SDLP in the form of subordinated certificates (the “SDLP Certificates”), and Varagon and its clients provide capital to the SDLP in the form of senior notes, intermediate funding notes and SDLP Certificates. As of December 31, 2017, we and a client of Varagon owned 87.5% and 12.5%, respectively, of the outstanding SDLP Certificates. The SDLP Certificates pay a coupon of LIBOR plus a stated spread and also entitle the holders thereof to receive a portion of the excess cash flow from the loan portfolio, which may result in a return to the holders of the SDLP Certificates that is greater than the stated coupon. The SDLP Certificates are junior in right of payment to the senior notes and intermediate funding notes.
As of December 31, 2017, we and Varagon and its clients had agreed to make capital available to the SDLP of $2.9 billion in the aggregate, of which $591 million has been made available from us. This capital will only be committed to the SDLP upon approval of transactions by the investment committee of the SDLP as discussed above.
For more information on the SDLP, see “Management’s Discussion and Analysis of Financial Condition and Results of Operations—Portfolio and Investment Activity—Senior Direct Lending Program” and note 4 to our consolidated financial statements for the year ended December 31, 2017.
Ivy Hill Asset Management, L.P.
As of December 31, 2017, our portfolio company, IHAM, an SEC-registered investment adviser, managed 21 vehicles and served as the sub-manager/sub-servicer for two other vehicles (such vehicles, the “IHAM Vehicles”). As of December 31, 2017, IHAM had assets under management of approximately $4.1 billion. As of December 31, 2017, the amortized cost and fair value of our investment in IHAM was $244 million and $315 million, respectively. In connection with IHAM’s registration as a registered investment adviser, on March 30, 2012, we received exemptive relief from the SEC allowing us to, subject to certain conditions, own directly or indirectly up to 100% of IHAM’s outstanding equity interests and make additional investments in IHAM. From time to time, IHAM or certain IHAM Vehicles may purchase investments from us or sell investments to us, in each case for a price equal to the fair market value of such investments determined at the time of such transactions.
On January 3, 2017, in connection with the American Capital Acquisition, American Capital Asset Management, LLC, a wholly-owned portfolio company of American Capital (“ACAM”), merged with and into IHAM, with IHAM remaining as the surviving entity as a wholly owned portfolio company of ours. As a result, IHAM now manages certain funds that were previously managed by ACAM, including American Capital Senior Floating, Ltd., a Maryland corporation that has elected to be regulated as a BDC under the Investment Company Act.
See Notes 4 and 16 to our consolidated financial statements for the year ended December 31, 2017 for more information about IHAM and its role in the American Capital Acquisition.
Industry Composition
We generally seek to invest in companies in the industries in which Ares’ investment professionals have direct expertise. The following is a representative list of the industries in which we have invested:
• | Aerospace and Defense |
• | Automotive Services |
• | Business Services |
• | Consumer Products |
9
• | Containers and Packaging |
• | Education |
• | Environmental Services |
• | Financial Services |
• | Food and Beverage |
• | Healthcare Services |
• | Investment Funds and Vehicles |
• | Manufacturing |
• | Oil and Gas |
• | Other Services |
• | Power Generation |
• | Restaurant and Food Services |
• | Retail |
• | Telecommunications |
However, we may invest in other industries if we are presented with attractive opportunities.
The industrial and geographic compositions of our portfolio at fair value as of December 31, 2017 and 2016 were as follows:
As of December 31, | |||||
2017 | 2016 | ||||
Industry | |||||
Healthcare Services | 22.5 | % | 14.3 | % | |
Business Services | 19.2 | 9.8 | |||
Consumer Products | 6.8 | 7.2 | |||
Other Services | 6.2 | 8.9 | |||
Manufacturing | 6.0 | 3.8 | |||
Investment Funds and Vehicles(1) | 5.8 | 25.2 | |||
Financial Services | 4.3 | 4.2 | |||
Food and Beverage | 4.3 | 2.2 | |||
Power Generation | 3.6 | 6.4 | |||
Restaurants and Food Services | 3.3 | 4.5 | |||
Automotive Services | 3.0 | 1.9 | |||
Education | 3.0 | 2.0 | |||
Wholesale Distribution | 2.5 | — | |||
Oil and Gas | 2.5 | 1.0 | |||
Containers and Packaging | 2.1 | 2.8 | |||
Other | 4.9 | 5.8 | |||
Total | 100.0 | % | 100.0 | % | |
10
_______________________________________________________________________________
(1) | Includes our investment in the SDLP, which had made first lien senior secured loans to 19 and 14 different borrowers as of December 31, 2017 and 2016, respectively, and our investment in the SSLP, which had made first lien senior secured loans to 19 different borrowers as of December 31, 2016. The portfolio companies in the SDLP are in industries similar to the companies in our portfolio. The portfolio companies in the SSLP were in industries similar to the companies in our portfolio. |
As of December 31, | |||||
2017 | 2016 | ||||
Geographic Region | |||||
Southeast | 28.5 | % | 19.5 | % | |
Midwest | 25.3 | 19.7 | |||
West(1) | 23.9 | 41.5 | |||
Mid Atlantic | 15.0 | 14.7 | |||
Northeast | 3.9 | 3.6 | |||
International | 3.4 | 1.0 | |||
Total | 100.0 | % | 100.0 | % | |
_______________________________________________________________________________
(1) | Includes our investment in the SDLP, which represented 4.1% and 3.1% of the total investment portfolio at fair value as of December 31, 2017 and 2016, respectively, and our investment in the SSLP, which represented 21.7% of the total investment portfolio at fair value as of December 31, 2016. |
As of December 31, 2017, 3.1% of total investments at amortized cost (or 1.4% of total investments at fair value) were on non-accrual status. As of December 31, 2016, 2.9% of total investments at amortized cost (or 0.8% of total investments at fair value) were on non-accrual status.
Since our IPO on October 8, 2004 through December 31, 2017, our exited investments resulted in an aggregate cash flow realized internal rate of return (as discussed in more detail in footnote 1 to the table below) to us of approximately 14% (based on original cash invested, net of syndications, of approximately $20.6 billion and total proceeds from such exited investments of approximately $26.4 billion). Approximately 65% of these exited investments resulted in an aggregate cash flow realized internal rate of return to us of 10% or greater.
The aggregate cash flow realized internal rate of return, original cash invested, net of syndications, and total proceeds, in each case from exited investments, are listed below from our IPO on October 8, 2004 through the end of each period shown below.
Exited Investments IPO through December 31, | |||||||||||||||||||||||||||||||||||||||||||||||||||||||
(dollar amounts in millions) | 2017 | 2016 | 2015 | 2014 | 2013 | 2012 | 2011 | 2010 | 2009 | 2008 | 2007 | 2006 | 2005 | 2004 | |||||||||||||||||||||||||||||||||||||||||
Realized internal rate of return to Ares Capital(1) | 14 | % | 13 | % | 13 | % | 13 | % | 13 | % | 13 | % | 14 | % | 15 | % | 14 | % | 19 | % | 21 | % | 26 | % | 41 | % | 17 | % | |||||||||||||||||||||||||||
Original cash invested, net of syndications | $ | 20,613 | $ | 14,264 | $ | 12,170 | $ | 9,883 | $ | 7,717 | $ | 6,817 | $ | 4,638 | $ | 2,696 | $ | 1,220 | $ | 923 | $ | 684 | $ | 424 | $ | 119 | $ | 28 | |||||||||||||||||||||||||||
Total proceeds | $ | 26,424 | $ | 17,523 | $ | 14,903 | $ | 12,121 | $ | 9,445 | $ | 8,264 | $ | 5,627 | $ | 3,256 | $ | 1,405 | $ | 1,104 | $ | 818 | $ | 511 | $ | 140 | $ | 32 | |||||||||||||||||||||||||||
_______________________________________________________________________________
(1) | Internal rate of return is the discount rate that makes the net present value of all cash flows related to a particular investment equal to zero. Internal rate of return is gross of expenses related to investments as these expenses are not allocable to specific investments. Investments are considered to be exited when the original investment objective has been achieved through the receipt of cash and/or non-cash consideration upon the repayment of a debt investment or sale of an investment or through the determination that no further consideration was collectible and, thus, a loss may have been realized. |
11
Additionally, since our IPO on October 8, 2004 through December 31, 2017, our realized gains exceeded our realized losses by approximately $613 million (excluding a one-time gain on the acquisition of Allied Capital Corporation (“Allied Capital”) in April 2010 (the “Allied Acquisition”) and realized gains/losses from the extinguishment of debt and other assets). For the same time period, our average annualized net realized gain rate was approximately 1.1% (excluding a one-time gain on the Allied Acquisition and realized gains/losses from the extinguishment of debt and other assets). Net realized gain/loss rates for a particular period are the amount of net realized gains/losses during such period divided by the average quarterly investments at amortized cost in such period.
Information included herein regarding internal rates of return, realized gains and losses and annualized net realized gain rates are historical results relating to our past performance and are not necessarily indicative of future results, the achievement of which cannot be assured.
INVESTMENT SELECTION
Ares’ investment philosophy was developed over 20 years ago and has remained consistent and relevant throughout a number of economic cycles. We are managed using a similar investment philosophy used by the investment professionals of Ares in respect of its other investment funds.
This investment philosophy involves, among other things:
• | an assessment of the overall macroeconomic environment and financial markets and how such assessment may impact industry and asset selection; |
• | company-specific research and analysis; and |
• | with respect to each individual company, an emphasis on capital preservation, low volatility and minimization of downside risk. |
The foundation of Ares’ investment philosophy is intensive credit investment analysis, a portfolio management discipline based on both market technicals and fundamental value-oriented research, and diversification strategy. We follow a rigorous investment process based on:
• | a comprehensive analysis of issuer creditworthiness, including a quantitative and qualitative assessment of the issuer’s business; |
• | an evaluation of management and its economic incentives; |
• | an analysis of business strategy and industry trends; and |
• | an in-depth examination of capital structure, financial results and projections. |
We seek to identify those companies exhibiting superior fundamental risk-reward profiles and strong defensible business franchises while focusing on the relative value of the investment across the industry as well as for the specific company.
Intensive Due Diligence
The process through which an investment decision is made involves extensive research into the target company, its industry, its growth prospects and its ability to withstand adverse conditions. If the senior investment professional responsible for the potential transaction determines that an investment opportunity should be pursued, we will engage in an intensive due diligence process. Approximately 30-40% of the investments initially reviewed by us proceed to this phase. Though each transaction will involve a somewhat different approach, the regular due diligence steps generally undertaken include:
• | meeting with the target company’s management team to get a detailed review of the business, and to probe for potential weaknesses in business prospects; |
• | checking management’s backgrounds and references; |
12
• | performing a detailed review of historical financial performance, including performance through various economic cycles, and the quality of earnings; |
• | reviewing both short and long term projections of the business, and sensitizing them for both upside and downside risk; |
• | visiting headquarters and company operations and meeting with top and middle-level executives; |
• | contacting customers and vendors to assess both business prospects and standard practices; |
• | conducting a competitive analysis, and comparing the issuer to its main competitors on an operating, financial, market share and valuation basis; |
• | researching the industry for historic growth trends and future prospects as well as to identify future exit alternatives (including available Wall Street research, industry association literature and general news); |
• | assessing asset value and the ability of physical infrastructure and information systems to handle anticipated growth; and |
• | investigating legal risks and financial and accounting systems. |
Selective Investment Process
After an investment has been identified and preliminary diligence has been completed, a credit research and analysis report is prepared. This report is reviewed by the senior investment professional in charge of the potential investment. If such senior and other investment professionals are in favor of the potential investment, then it is first presented to the investment committee on a preliminary basis.
After the investment committee approves continued work on the potential investment, a more extensive due diligence process is employed by the transaction team. Additional due diligence with respect to any investment may be conducted on our behalf by attorneys, independent accountants, and other third party consultants and research firms prior to the closing of the investment, as appropriate on a case-by-case basis. Approximately 7-10% of all investments initially reviewed by us will be presented to the investment committee. Approval of an investment for funding requires the approval of the majority of the investment committee of our investment adviser, although unanimous consent is sought.
Issuance of Formal Commitment
Once we have determined that a prospective portfolio company is suitable for investment, we work with the management and/or sponsor of that company and its other capital providers, including senior, junior and equity capital providers, if any, to finalize the structure of the investment. Approximately 5-7% of the investments initially reviewed by us eventually result in the issuance of formal commitments and the closing of such transactions.
Debt Investments
We invest in portfolio companies primarily in the form of first lien senior secured loans (including unitranche loans), second lien senior secured loans and mezzanine debt. The first and second lien senior secured loans generally have terms of three to ten years. In connection with our first and second lien senior secured loans we generally receive security interests in certain assets of our portfolio companies that could serve as collateral in support of the repayment of such loans. First and second lien senior secured loans generally have floating interest rates, which may have LIBOR floors, and also may provide for some amortization of principal and excess cash flow payments, with the remaining principal balance due at maturity.
We structure our mezzanine investments primarily as unsecured subordinated loans that provide for relatively higher fixed interest rates. The mezzanine debt investments generally have terms of up to ten years. These loans typically have interest-only payments, with amortization of principal, if any, deferred to the later years of the mezzanine investment. In some cases, we may enter into loans that, by their terms, convert into equity or additional debt or defer payments of interest (or at least cash interest) for the first few years after our investment. Also, in some cases our mezzanine debt will be secured by a subordinated lien on some or all of the assets of the borrower.
13
In some cases, our debt investments may provide for a portion of the interest payable to be payment-in-kind (“PIK”) interest. To the extent interest is PIK, it will be payable through the increase of the principal amount of the loan by the amount of interest due on the then-outstanding aggregate principal amount of such loan.
In the case of our first and second lien senior secured loans and mezzanine debt, we tailor the terms of the investment to the facts and circumstances of the transaction and the prospective portfolio company, negotiating a structure that aims to protect our rights and manage our risk while creating incentives for the portfolio company to achieve its business plan and improve its profitability. For example, in addition to seeking a senior position in the capital structure of our portfolio companies, we will seek, where appropriate, to limit the downside potential of our investments by:
• | targeting a total return on our investments (including both interest and potential equity appreciation) that compensates us for credit risk; |
• | incorporating “put” rights, call protection and LIBOR floors for floating rate loans, into the investment structure; and |
• | negotiating covenants in connection with our investments that afford our portfolio companies as much flexibility in managing their businesses as possible, consistent with preservation of our capital. Such restrictions may include affirmative and negative covenants, default penalties, lien protection, change of control provisions and board rights, including either observation or participation rights. |
We generally require financial covenants and terms that require an issuer to reduce leverage, thereby enhancing credit quality. These methods include: (a) maintenance leverage covenants requiring a decreasing ratio of indebtedness to cash flow over time, (b) maintenance cash flow covenants requiring an increasing ratio of cash flow to the sum of interest expense and capital expenditures and (c) indebtedness incurrence prohibitions, limiting a company’s ability to take on additional indebtedness. In addition, by including limitations on asset sales and capital expenditures we may be able to prevent a borrower from changing the nature of its business or capitalization without our consent.
Our debt investments may include equity features, such as warrants or options to buy a minority interest in the portfolio company. Warrants we receive with our debt investments may require only a nominal cost to exercise, and thus, as a portfolio company appreciates in value, we may achieve additional investment return from this equity interest. We may structure the warrants to provide provisions protecting our rights as a minority-interest holder, as well as puts, or rights to sell such securities back to the portfolio company, upon the occurrence of specified events. In many cases, we also obtain registration rights in connection with these equity interests, which may include demand and “piggyback” registration rights.
Equity Investments
To a lesser extent, we also make preferred and/or common equity investments, which have generally been non-control equity investments of less than $20 million (usually in conjunction with a concurrent debt investment). However, we may increase the size or change the nature of these investments. Also, as a result of the American Capital Acquisition, American Capital’s equity investments, including equity investments pursuant to which American Capital controlled a particular portfolio company, became part of our portfolio.
ACQUISITION OPPORTUNITIES
We believe that there may be opportunity for further consolidation in our industry. From time to time, we evaluate potential strategic opportunities, including acquisitions of:
• | asset portfolios; |
• | other private and public finance companies, business development companies and asset managers; and |
• | selected secondary market assets. |
In this regard, on January 3, 2017, we completed the American Capital Acquisition.
We have been in, and from time to time may engage in, discussions with counterparties in respect of various potential strategic acquisition and investment transactions, including potential acquisitions of other finance companies, business development companies and asset managers. Some of these transactions could be material to our business and, if completed,
14
could be difficult to integrate, result in increased leverage or dilution and/or subject us to unexpected liabilities. However, other than in connection with the American Capital Acquisition, none of these discussions has progressed to the point at which the completion of any such transaction could be deemed to be probable or reasonably certain as of the date of this Annual Report. Completion of any such transaction would be subject to completion of due diligence, finalization of key business and financial terms (including price) and negotiation of final definitive documentation as well as a number of other factors and conditions including, without limitation, the approval of our board of directors, any required third party consents and, in certain cases, the approval of our stockholders. We cannot predict how quickly the terms of any such transaction could be finalized, if at all. Accordingly, there can be no assurance that such transaction would be completed. In connection with evaluating potential strategic acquisition and investment transactions, we have, and may in the future, incur significant expenses for the evaluation and due diligence investigation of these potential transactions.
See “Management's Discussion and Analysis of Financial Condition and Results of Operations—Overview” and Note 16 to our consolidated financial statements for the year ended December 31, 2017 for information regarding the American Capital Acquisition.
ON-GOING RELATIONSHIPS WITH AND MONITORING OF PORTFOLIO COMPANIES
We closely monitor each investment we make, maintain a regular dialogue with both the management team and other stakeholders and seek specifically tailored financial reporting. In addition, senior investment professionals may take board seats or obtain board observation rights in connection with our portfolio companies. As of December 31, 2017, of our 314 portfolio companies, we were entitled to board seats or board observation rights on 32% of these companies and these companies represented approximately 47% of our portfolio at fair value.
We seek to exert significant influence post-investment, in addition to covenants and other contractual rights and through board participation, when appropriate, by actively working with management on strategic initiatives. We often introduce managers of companies in which we have invested to other portfolio companies to capitalize on complementary business activities and best practices.
Our investment adviser employs an investment rating system to categorize our investments. In addition to various risk management and monitoring tools, our investment adviser grades the credit risk of all investments on a scale of 1 to 4 no less frequently than quarterly. This system is intended primarily to reflect the underlying risk of a portfolio investment relative to our initial cost basis in respect of such portfolio investment (i.e., at the time of origination or acquisition), although it may also take into account under certain circumstances the performance of the portfolio company’s business, the collateral coverage of the investment and other relevant factors. Under this system, investments with a grade of 4 involve the least amount of risk to our initial cost basis. The trends and risk factors for this investment since origination or acquisition are generally favorable, which may include the performance of the portfolio company or a potential exit. Investments graded 3 involve a level of risk to our initial cost basis that is similar to the risk to our initial cost basis at the time of origination or acquisition. This portfolio company is generally performing as expected and the risk factors to our ability to ultimately recoup the cost of our investment are neutral to favorable. All investments or acquired investments in new portfolio companies are initially assessed a grade of 3. Investments graded 2 indicate that the risk to our ability to recoup the initial cost basis of such investment has increased materially since origination or acquisition, including as a result of factors such as declining performance and non-compliance with debt covenants; however, payments are generally not more than 120 days past due. An investment grade of 1 indicates that the risk to our ability to recoup the initial cost basis of such investment has substantially increased since origination or acquisition, and the portfolio company likely has materially declining performance. For debt investments with an investment grade of 1, most or all of the debt covenants are out of compliance and payments are substantially delinquent. For investments graded 1, it is anticipated that we will not recoup our initial cost basis and may realize a substantial loss of our initial cost basis upon exit. For investments graded 1 or 2, our investment adviser enhances its level of scrutiny over the monitoring of such portfolio company. The grade of a portfolio investment may be reduced or increased over time.
We assigned a fair value as of January 3, 2017 (the “Acquisition Date”) to each of the portfolio investments acquired in connection with the American Capital Acquisition. The initial cost basis of each investment acquired was equal to the fair value of such investment as of the Acquisition Date. Many of these portfolio investments were assigned a fair value reflecting a discount to American Capital’s cost basis at the time of American Capital’s origination or acquisition. Each investment was initially assessed a grade of 3 (i.e., generally the grade we assign a portfolio company at acquisition), reflecting the relative risk to our initial cost basis of such investments. It is important to note that our grading system does not take into account factors or events in respect of the period from when American Capital originated or acquired such portfolio investments or the status of these portfolio investments in terms of compliance with debt facilities, financial performance and similar factors. Rather, it is only intended to measure risk from the time that we acquired the portfolio investment in connection with the American Capital
15
Acquisition. Accordingly, it is possible that the grades of these portfolio investments may be reduced or increased after the Acquisition Date.
As of December 31, 2017, the weighted average grade of our portfolio at fair value was 3.1. For more information, see “Management’s Discussion and Analysis of Financial Condition and Results of Operations—Portfolio and Investment Activity.”
MANAGERIAL ASSISTANCE
As a BDC, we must offer, and must provide upon request, significant managerial assistance to certain of our portfolio companies. This assistance could involve, among other things, monitoring the operations of our portfolio companies, participating in board and management meetings, consulting with and advising officers of portfolio companies and providing other organizational and financial guidance. Ares Operations may provide all or a portion of this assistance pursuant to our administration agreement, the costs of which will be reimbursed by us. We may receive fees for these services.
COMPETITION
Our primary competitors include public and private funds, commercial and investment banks, commercial finance companies, other BDCs and private equity funds, each of which we compete with for financing opportunities. Many of our competitors are substantially larger and have considerably greater financial and marketing resources than we do. For example, some competitors may have access to funding sources that are not available to us. In addition, some of our competitors may have higher risk tolerances or different risk assessments, which could allow them to consider more investments and establish more relationships than we do. Furthermore, many of our competitors are not subject to the regulatory restrictions that the Investment Company Act imposes on us as a BDC. For additional information concerning the competitive risks we face, see “Risk Factors—Risks Relating to Our Business—We operate in a highly competitive market for investment opportunities.”
We believe that the relationships of the members of our investment adviser’s investment committee and of the partners of Ares enable us to learn about, and compete effectively for, financing opportunities with attractive middle-market companies in the industries in which we seek to invest. We believe that Ares’ professionals’ deep and long-standing direct sponsor relationships and the resulting proprietary transaction opportunities that these relationships often present, provide valuable insight and access to transactions and information. We use the industry information of Ares’ investment professionals to which we have access to assess investment risks and determine appropriate pricing for our investments in portfolio companies.
STAFFING
We do not currently have any employees and do not expect to have any employees. Services necessary for our business are provided by individuals who are employees or affiliates of our investment adviser, Ares Capital Management, and our administrator, Ares Operations, each of which is a subsidiary of Ares Management, pursuant to the terms of our investment advisory and management agreement and our administration agreement, respectively, each as described below. Each of our executive officers is an employee or affiliate of our investment adviser or our administrator. Our day-to-day investment activities are managed by our investment adviser. Most of the services necessary for the origination of our investment portfolio are provided by investment professionals employed by Ares Capital Management. Ares Capital Management had approximately 100 U.S.-based investment professionals as of December 31, 2017 who focus on origination, transaction development, investment and the ongoing monitoring of our investments. See “—Investment Advisory and Management Agreement“ below. We reimburse both our investment adviser and our administrator for a certain portion of expenses incurred in connection with such staffing, as described in more detail below. Because we have no employees, Ares Capital does not have a formal employee relations policy.
INVESTMENT ADVISORY AND MANAGEMENT AGREEMENT
Management Services
Ares Capital Management serves as our investment adviser and is registered as an investment adviser under the Advisers Act. Subject to the overall supervision of our board of directors, our investment adviser manages the day-to-day operations of, and provides investment advisory and management services to, Ares Capital. Under the terms of the investment advisory and management agreement, our investment adviser:
• | determines the composition of our portfolio, the nature and timing of the changes to our portfolio and the manner of implementing such changes; |
16
• | identifies, evaluates and negotiates the structure of the investments we make (including performing due diligence on our prospective portfolio companies); |
• | closes and monitors the investments we make; |
• | determines the investments and other assets that we purchase, retain or sell; and |
• | provides us with such other investment advisory and research and related services as we may from time to time reasonably require. |
Ares Capital Management’s services to us under the investment advisory and management agreement are not exclusive, and it is free to furnish similar services to other entities. Similarly, our investment adviser or its affiliates may directly or indirectly manage funds or other investment vehicles with investment objectives similar to ours. Accordingly, we may compete with these Ares funds or other investment vehicles managed by our investment adviser and its affiliates for capital and investment opportunities. Ares Capital Management endeavors to allocate investment opportunities in a fair and equitable manner, and in any event consistent with any fiduciary duties owed to Ares Capital. Nevertheless, it is possible that we may not be given the opportunity to participate in certain investments made by investment funds or other investment vehicles managed by our investment adviser or its affiliates. See “Risk Factors-Risks Relating to Our Business-There are significant potential conflicts of interest that could impact our investment returns.”
Base Management Fee
Pursuant to the investment advisory and management agreement and subject to the overall supervision of our board of directors, our investment adviser provides investment advisory and management services to us. For providing these services, our investment adviser receives fees from us consisting of a base management fee, an income based fee and a capital gains incentive fee.
The base management fee is calculated at an annual rate of 1.5% based on the average value of our total assets (other than cash or cash equivalents but including assets purchased with borrowed funds) at the end of the two most recently completed calendar quarters. The base management fee is payable quarterly in arrears.
Income Based Fee
The income based fee is calculated and payable quarterly in arrears based on our pre-incentive fee net investment income, as defined in the investment advisory and management agreement, for the quarter. Pre-incentive fee net investment income means interest income, dividend income and any other income (including any other fees such as commitment, origination, structuring, diligence and consulting fees or other fees that we receive from portfolio companies but excluding fees for providing managerial assistance) accrued during the calendar quarter, minus operating expenses for the quarter (including the base management fee, any expenses payable under the administration agreement, and any interest expense and dividends paid on any outstanding preferred stock, but excluding the income based fee and capital gains incentive fee accrued under U.S. generally accepted accounting principles (“GAAP”)). Pre-incentive fee net investment income includes, in the case of investments with a deferred interest feature such as market discount, debt instruments with PIK interest, preferred stock with PIK dividends and zero coupon securities, accrued income that we have not yet received in cash. Our investment adviser is not under any obligation to reimburse us for any part of the income based fees it received that were based on accrued interest that we never actually received. See “Risk Factors—Risks Relating to Our Business—There are significant potential conflicts of interest that could impact our investment returns” and “Risk Factors—Risks Relating to Our Business—We may be obligated to pay our investment adviser certain fees even if we incur a loss.”
Pre-incentive fee net investment income does not include any realized capital gains, realized capital losses, unrealized capital appreciation, unrealized capital depreciation or income tax expense related to realized gains and losses. Because of the structure of the income based fee, it is possible that we may pay such fees in a quarter where we incur a loss. For example, if we receive pre-incentive fee net investment income in excess of the hurdle rate for a quarter, we will pay the applicable income based fee even if we have incurred a loss in that quarter due to realized and/or unrealized capital losses.
Pre-incentive fee net investment income, expressed as a rate of return on the value of our net assets (defined as total assets less indebtedness and before taking into account any income based fees and capital gains incentive fees payable during the period) at the end of the immediately preceding calendar quarter, is compared to a fixed “hurdle rate” of 1.75% per quarter. If market credit spreads rise, we may be able to invest in debt instruments that provide for a higher return, which may increase our pre-incentive fee net investment income and make it easier for our investment adviser to surpass the fixed hurdle rate and
17
receive an income based fee based on such net investment income. To the extent we have retained pre-incentive fee net investment income that has been used to calculate the income based fee, it is also included in the amount of our total assets (other than cash and cash equivalents but including assets purchased with borrowed funds) used to calculate the 1.5% base management fee.
We pay our investment adviser an income based fee with respect to our pre-incentive fee net investment income in each calendar quarter as follows:
• | No income based fee in any calendar quarter in which our pre-incentive fee net investment income does not exceed the hurdle rate; |
• | 100% of our pre-incentive fee net investment income with respect to that portion of such pre-incentive fee net investment income, if any, that exceeds the hurdle rate but is less than 2.1875% in any calendar quarter. We refer to this portion of our pre-incentive fee net investment income (which exceeds the hurdle rate but is less than 2.1875%) as the “catch-up” provision. The “catch-up” is meant to provide our investment adviser with 20% of the pre-incentive fee net investment income as if a hurdle rate did not apply if this net investment income exceeded 2.1875% in any calendar quarter; and |
• | 20% of the amount of our pre-incentive fee net investment income, if any, that exceeds 2.1875% in any calendar quarter. |
The following is a graphical representation of the calculation of the income based fee:
Quarterly Income Based Fee Based on Net Investment Income
Pre-incentive fee net investment income return
(expressed as a percentage of the value of net assets)
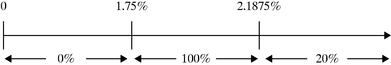
Percentage of pre-incentive fee net investment income
allocated to income based fee
These calculations are adjusted for any share issuances or repurchases during the quarter.
In connection with the American Capital Acquisition, our investment adviser has agreed to waive, for each of the first ten calendar quarters beginning with the second calendar quarter of 2017, the lesser of (x) $10 million of income based fees and (y) the amount of income based fees for such quarter, in each case, to the extent earned and payable by us in such quarter pursuant to and as calculated under the investment advisory and management agreement. See “Management's Discussion and Analysis of Financial Condition and Results of Operations—Overview” and Note 16 to our consolidated financial statements for the year ended December 31, 2017 for information regarding a transaction support agreement entered into between us and Ares Capital Management in connection with the American Capital Acquisition.
Capital Gains Incentive Fee
The capital gains incentive fee is determined and payable in arrears as of the end of each calendar year (or, upon termination of our investment advisory and management agreement, as of the termination date) and is calculated at the end of each applicable year by subtracting (a) the sum of our cumulative aggregate realized capital losses and aggregate unrealized capital depreciation from (b) our cumulative aggregate realized capital gains, in each case calculated from October 8, 2004, (the date we completed our IPO). Realized capital gains and losses include gains and losses on investments and foreign currencies, gains and losses on extinguishment of debt and from other assets, as well as any income tax and other expenses related to cumulative aggregate realized gains and losses. If such amount is positive at the end of such year, then the capital gains incentive fee for such year is equal to 20% of such amount, less the aggregate amount of capital gains incentive fees paid in all prior years. If such amount is negative, then there is no capital gains incentive fee for such year.
18
The cumulative aggregate realized capital gains are calculated as the sum of the differences, if positive, between (a) the net sales price of each investment in our portfolio when sold and (b) the accreted or amortized cost basis of such investment.
The cumulative aggregate realized capital losses are calculated as the sum of the amounts by which (a) the net sales price of each investment in our portfolio when sold is less than (b) the accreted or amortized cost basis of such investment.
The aggregate unrealized capital depreciation is calculated as the sum of the differences, if negative, between (a) the valuation of each investment in our portfolio as of the applicable capital gains incentive fee calculation date and (b) the accreted or amortized cost basis of such investment.
Notwithstanding the foregoing, as a result of an amendment to the capital gains incentive fee under the investment advisory and management agreement that was adopted on June 6, 2011, if we are required by GAAP to record an investment at its fair value as of the time of acquisition instead of at the actual amount paid for such investment by us (including, for example, as a result of the application of the asset acquisition method of accounting), then solely for the purposes of calculating the capital gains incentive fee, the “accreted or amortized cost basis” of an investment shall be an amount (the “Contractual Cost Basis”) equal to (1) (x) the actual amount paid by us for such investment plus (y) any amounts recorded in our financial statements as required by GAAP that are attributable to the accretion of such investment plus (z) any other adjustments made to the cost basis included in our financial statements, including PIK interest or additional amounts funded (net of repayments) minus (2) any amounts recorded in our financial statements as required by GAAP that are attributable to the amortization of such investment, whether such calculated Contractual Cost Basis is higher or lower than the fair value of such investment (as determined in accordance with GAAP) at the time of acquisition.
We defer cash payment of any income based fee and the capital gains incentive fee otherwise earned by our investment adviser if during the most recent four full calendar quarter period ending on or prior to the date such payment is to be made the sum of (a) the aggregate distributions to our stockholders and (b) the change in net assets (defined as total assets less indebtedness and before taking into account any income based fees and capital gains incentive fees payable during the period) is less than 7.0% of our net assets (defined as total assets less indebtedness) at the beginning of such period. Any deferred income based fees and capital gains incentive fees are carried over for payment in subsequent calculation periods to the extent such payment is payable under our investment advisory and management agreement.
Payment of Our Expenses
The services of all investment professionals and staff of our investment adviser, when and to the extent engaged in providing investment advisory and management services to us and routine overhead expenses of such personnel allocable to such services, are provided and paid for by our investment adviser. We bear all other costs and expenses of our operations and transactions, including, but not limited to, those relating to: rent for the offices in which we operate, including rent expenses for our investment activities; organization; calculation of our net asset value (including, but not limited to, the cost and expenses of any independent valuation firm); expenses incurred by our investment adviser payable to third parties, including agents, consultants or other advisers, in monitoring our financial and legal affairs and in monitoring our investments (including the cost of consultants hired to develop information technology systems designed to monitor our investments) and performing due diligence on our prospective portfolio companies; interest payable on indebtedness, if any, incurred to finance our investments (including payments to third party vendors for financial information services); offerings of our common stock and other securities; investment advisory and management fees; administration fees; fees payable to third parties, including agents, consultants or other advisers, relating to, or associated with, evaluating and making investments regardless of whether such transactions are ultimately consummated; costs of marketing; transfer agent and custodial fees; registration fees; listing fees; taxes; independent directors’ fees and expenses; costs of preparing and filing reports or other documents with the SEC; the costs of any reports, proxy statements or other notices to stockholders, including printing costs; to the extent we are covered by any joint insurance policies, our allocable portion of the insurance premiums for such policies; direct costs and expenses of administration, including auditor and legal costs; and all other expenses incurred by us or our administrator in connection with administering our business as described in more detail under “—Administration Agreement” below.
Duration, Termination and Amendment
At an in-person meeting of our board of directors on March 16, 2011, the form of our current investment advisory and management agreement, including two proposed amendments to our then existing investment advisory and management agreement, was approved by our board of directors with the recommendation that stockholders of the Company vote to approve the proposed amendments. On June 6, 2011, our stockholders approved the proposed amendments, and we entered into a restated investment advisory and management agreement, reflecting such amendments on June 6, 2011. At an in-person
19
meeting of our board of directors on April 26, 2017, our board of directors, including a majority of the directors who are not “interested persons” of the Company as defined in the Investment Company Act, voted to approve the continuation of the investment advisory and management agreement to June 6, 2018. A discussion regarding the basis for our board of directors’ approval of the 2011 adoption of the form of our current investment advisory and management agreement is available in our Annual Report on Form 10-K for the fiscal year ended December 31, 2011.
Unless terminated earlier, the investment advisory and management agreement will automatically renew for successive annual periods if approved annually by our board of directors or by the affirmative vote of the holders of a majority of our outstanding voting securities, including, in either case, approval by a majority of our directors who are not “interested persons” of the Company (as defined in the Investment Company Act). The investment advisory and management agreement will automatically terminate in the event of its assignment. The investment advisory and management agreement may be terminated by either party without penalty upon 60 days’ written notice to the other party.
In voting to approve the continuation of the investment advisory and management agreement, the independent directors had the opportunity to consult in executive session with counsel to the Company regarding the approval of such agreement. In reaching a decision to approve the continuation of the investment advisory and management agreement, our board of directors reviewed a significant amount of information and considered, among other things:
(i) | the nature, extent and quality of the advisory and other services to be provided to the Company by our investment adviser; |
(ii) | the long and short-term investment performance of the Company and our investment adviser; |
(iii) | the costs of the services provided by our investment adviser (including the base management fee, income based fee and capital gains incentive fee (including the applicable hurdle rates and conditions for the deferral of fee payments) and expense ratios) and comparative data based on publicly available information; |
(iv) | the limited potential for economies of scale in investment management associated with a larger capital base for investments in first and second lien senior loans and mezzanine debt and whether such limited economies of scale would benefit our stockholders; |
(v) | our investment adviser’s estimated pro forma profitability with respect to managing us based on financial information provided by our investment adviser; |
(vi) | the limited potential for additional benefits to be derived by our investment adviser and its affiliates as a result of our relationship with our investment adviser, including soft dollar arrangements; and |
(vii) | various other matters, including the alignment of interests of our stockholders. |
In voting to approve the continuation of the investment advisory and management agreement, our board of directors, including all of the directors who are not “interested persons,” of the Company, made the following conclusions:
• | Nature, Extent and Quality of Services. Our board of directors considered the nature, extent and quality of the investment selection process employed by our investment adviser, including the flow of transaction opportunities resulting from Ares Capital Management’s investment professionals’ significant capital markets, trading and research expertise, the employment of Ares Capital Management’s investment philosophy, diligence procedures, credit recommendation process, investment structuring, and ongoing relationships with and monitoring of portfolio companies, in light of the investment objective of the Company. Our board of directors also considered our investment adviser’s personnel and their prior experience in connection with the types of investments made by us, including such personnel’s network of relationships with intermediaries focused on middle-market companies. Our board of directors also considered the benefit and increasing costs of our investment adviser continuing to be able to recruit and retain top talent. In addition, our board of directors considered the other terms and conditions of the investment advisory and management agreement. Our board of directors determined that the substantive terms of the investment advisory and management agreement (other than the fees payable thereunder, which our board of directors reviewed separately), including the services to be provided, are generally the same as those of comparable BDCs described in the available market data and that it would be difficult to obtain similar services of similar quality on a comparable basis from other third party service providers or through an internally managed structure. In addition, our board of directors considered the fact that we have the ability to terminate the investment advisory and management agreement without penalty upon 60 days’ written notice to our investment |
20
adviser. Our board of directors further determined that our investment adviser is served by a dedicated origination, transaction development and investment team of investment professionals, and that these investment professionals have historically focused on investments in middle- market companies and have developed an investment evaluation process and an extensive network of relationships with financial sponsors and intermediaries focused on middle-market companies, which experience and relationships coincide with our investment objective and generally equal or exceed those of the management teams or investment advisers of other comparable BDCs described in the available market data.
• | Investment Performance. Our board of directors reviewed the long-term and short-term investment performance of the Company and our investment adviser, as well as comparative data with respect to the long-term and short-term investment performance of other externally managed BDCs and their investment advisers. Our board of directors noted the longevity and consistency of the Company’s investment performance and determined that our investment adviser was delivering results consistent with the investment objective of the Company and that the Company’s investment performance was generally above average when compared to comparable BDCs, including with respect to the Company’s total return to stockholders (based on stock price and dividends paid), the ratio of the Company’s average net realized gains to our average net asset value and the ratio of the Company’s GAAP earnings to our average net asset value during the period, on both a long-term basis (during the past three calendar years) and a short-term basis (during the most recent calendar year ended December 31, 2016). Our board of directors also noted that the Company’s return on equity was more consistent and showed less volatility compared to comparable BDCs. Our board of directors further determined that in light of the performance history of the Company, our investment adviser’s extensive experience with our particular investment objectives and policies and our investment adviser’s commitment to the Company, the investment performance of the Company was likely to remain consistent with the approval of the continuation of the investment advisory and management agreement. |
• | Costs of the Services Provided to the Company. Our board of directors considered (i) comparative data based on publicly available information with respect to services rendered and the advisory fees (including the base management fee, income based fee and capital gains incentive fee or similar fees (including applicable hurdle rates and/or other payment conditions)) of other BDCs with similar investment objectives, our operating expenses and expense ratios compared to other BDCs of similar size and with similar investment objectives and (ii) the administrative services that our administrator will provide to us at cost. Based upon its review, our board of directors determined that the fees to be paid under the investment advisory and management agreement are generally equal to or less than those payable under agreements of comparable BDCs described in the available market data. After a detailed discussion with management and examining market data and information prepared by management, our board of directors noted that while our total expenses (adjusted for certain non-recurring items and including interest expense and credit facility fees) as a percentage of assets for the year ended December 31, 2016 were slightly above average as compared to those disclosed in market data by comparable externally managed BDCs, our total expenses (adjusted for certain non-recurring items and excluding interest expense and credit facility fees) as a percentage of assets for the year ended December 31, 2016 were similar to or lower than those disclosed by comparable externally managed BDCs. Our board of directors and management also discussed that the ratio of the sum of our total management fees (and other compensation expenses) and general and administrative expenses since the date of inception to the sum of our cumulative net income plus management fees paid since the date of inception were similar to or lower than that of comparable BDCs and that the Company’s overall expense levels and expenses relative to the Company’s overall investment performance were generally lower than those of comparable BDCs. Our board of directors noted that the ratio of the Company’s expenses to the Company’s net income compared favorably to similarly sized commercial banks. Our board of directors also noted that the terms of the investment advisory and management agreement provide that the Company will defer cash payment of any income based fee and capital gains incentive fee otherwise earned by our investment adviser if during the most recent four full calendar quarter period ending on or prior to the date such payment is to be made the sum of (a) the aggregate distributions to the stockholders and (b) the change in net assets (before taking into account any income based fees or capital gains incentive fees accrued during the period) is less than 7.0% of net assets at the beginning of such period, to be carried over for payment in a subsequent calculation period (compared to a number of the Company’s competitors that did not have similar payment conditions). Our board of directors further noted that, in connection with the American Capital Acquisition, our investment adviser agreed to waive, for each of the first ten calendar quarters beginning with the second calendar quarter of 2017, the lesser of (1) $10 million of income based fees and (2) the amount of the income based fees for such quarter, in each case, to the extent earned and payable by the Company in such quarter pursuant to and as calculated under the investment advisory and management agreement. |
21
• | Economies of Scale. Our board of directors considered information about the potential of our stockholders to experience economies of scale as the Company grows in size. Our board of directors considered that the direct lending business is one of the least scalable businesses because it requires additional resources as it grows, it is origination focused and similar investing strategies charge similar fee rates. Our board of directors also considered that because there are no break points in our investment adviser’s base management fee, any benefits resulting from the growth in the Company’s assets where the Company’s fixed costs did not increase proportionately would not inure to the benefit of the stockholders. Taking into account such information, our board of directors determined that the advisory fee structure with respect to the investment advisory and management agreement was reasonable and that no changes were currently necessary to reflect economies of scale. |
• | Estimated Pro Forma Profitability of the Investment Adviser. Our board of directors considered information about our investment adviser’s budget and determined that, based on the information available to our board of directors, our investment adviser’s estimated pro forma profitability with respect to managing the Company was generally equal to or less than the profitability of investment advisers managing comparable BDCs though not much market data was available for such advisers and relying, in particular, on the fact that the base management fee payable to our investment adviser is 1.50% (compared to 1.75% or 2.00% for a number of the Company’s competitors) and is not paid on cash or cash equivalents held by the Company (unlike several of the Company’s competitors). |
• | Limited Potential for Additional Benefits Derived by the Investment Adviser. Our board of directors believed that there was limited potential for additional benefits, such as soft dollar arrangements with brokers, to be derived by our investment adviser and its affiliates as a result of our relationship with our investment adviser. |
• | Other Matters Considered. Our board of directors considered the interests of senior management and determined that the judgment and performance of our senior management were not impaired by those interests. |
In view of the wide variety of factors that our board of directors considered in connection with its evaluation of the investment advisory and management agreement, it is not practical to quantify, rank or otherwise assign relative weights to the specific factors it considered in reaching its decision. Our board of directors did not undertake to make any specific determination as to whether any particular factor, or any aspect of any particular factor, was favorable or unfavorable to the ultimate determination of our board of directors. Rather, our board of directors based its approval on the totality of information presented to, and the investigation conducted by, it. In considering the factors discussed above, individual directors may have given different weights to different factors.
Based on the information reviewed and the factors discussed above, our directors (including those directors who are not “interested persons” of the Company) concluded that the terms of the investment advisory and management agreement, including the fee rates thereunder, are fair and reasonable in relation to the services provided and approved the continuation of the investment advisory and management agreement with our investment adviser as being in the best interests of the Company and its stockholders.
Conflicts of interest may arise if our investment adviser seeks to change the terms of our investment advisory and management agreement, including, for example, the amount of the base management fee, the income based fee, the capital gains incentive fee or other compensation terms. Material amendments to our investment advisory and management agreement must be approved by the affirmative vote of the holders of a majority of our outstanding voting securities and by a majority of our independent directors, and we may from time to time decide it is appropriate to seek the requisite approval to change the terms of the agreement.
Indemnification
The investment advisory and management agreement provides that, absent willful misfeasance, bad faith or gross negligence in the performance of its duties or by reason of the reckless disregard of its duties and obligations, our investment adviser, its members and their respective officers, managers, partners, agents, employees, controlling persons and members and any other persons or entities affiliated with it are entitled to indemnification from us for any damages, liabilities, costs and expenses (including reasonable attorneys’ fees and amounts reasonably paid in settlement) arising from the rendering of our investment adviser’s services under the investment advisory and management agreement or otherwise as our investment adviser.
22
Organization of our Investment Adviser
Our investment adviser is a Delaware limited liability company that is registered as an investment adviser under the Advisers Act. The principal executive offices of Ares Capital Management are located at 2000 Avenue of the Stars, 12th Floor, Los Angeles, California 90067.
ADMINISTRATION AGREEMENT
We are also party to an administration agreement, referred to herein as the “administration agreement”, with our administrator, Ares Operations. Our board of directors approved the continuation of our administration agreement on April 26, 2017, which extended the term of the agreement until June 1, 2018. Pursuant to the administration agreement, Ares Operations furnishes us with office equipment and clerical, bookkeeping and record keeping services at our office facilities. Under the administration agreement, Ares Operations also performs, or oversees the performance of, our required administrative services, which include, among other things, providing assistance in accounting, legal, compliance, operations, technology and investor relations, being responsible for the financial records that we are required to maintain and preparing reports to our stockholders and reports filed with the SEC. In addition, Ares Operations assists us in determining and publishing our net asset value, assists us in providing managerial assistance to our portfolio companies, oversees the preparation and filing of our tax returns and the printing and dissemination of reports to our stockholders, and generally oversees the payment of our expenses and the performance of administrative and professional services rendered to us by others. Payments under the administration agreement are equal to an amount based upon our allocable portion of Ares Operations’ overhead and other expenses (including travel expenses) incurred by Ares Operations in performing its obligations under the administration agreement, including our allocable portion of the compensation, rent and other expenses of certain of our officers (including our chief compliance officer, chief financial officer, chief accounting officer, general counsel, treasurer and assistant treasurer) and their respective staffs. The administration agreement may be terminated by either party without penalty upon 60 days’ written notice to the other party.
For each of the years ended December 31, 2017, 2016 and 2015, the Company incurred $12 million, $14 million and $14 million, respectively, in administrative fees. In addition, for the year ended December 31, 2017, the Company incurred an additional $8 million in administrative fees related to the integration of the American Capital Acquisition. These acquisition-related expenses are included in “professional fees and other costs related to the American Capital Acquisition” in the consolidated statement of operations. As of December 31, 2017 and 2016, $4 million and $4 million of the administrative fees were unpaid and included in “accounts payable and other liabilities” in the Company’s December 31, 2017 and 2016 consolidated balance sheets, respectively.
Indemnification
The administration agreement provides that, absent willful misfeasance, bad faith or negligence in the performance of its duties or by reason of the reckless disregard of its duties and obligations, Ares Operations, its members and their respective officers, managers, partners, agents, employees, controlling persons and members and any other persons or entities affiliated with it are entitled to indemnification from us for any damages, liabilities, costs and expenses (including reasonable attorneys’ fees and amounts reasonably paid in settlement) arising from the rendering of Ares Operations’ services under the administration agreement or otherwise as our administrator.
LEVERAGE
We may from time to time borrow funds to make investments, a practice known as “leverage,” to attempt to increase returns to our stockholders. With certain limited exceptions, we are only allowed to borrow amounts such that our asset coverage, as calculated in accordance with the Investment Company Act, equals at least 200% after such borrowing. The amount of leverage that we employ at any particular time will depend on our investment adviser’s and our board of directors’ assessments of market and other factors at the time of any proposed borrowing. As of February 8, 2018, we had $5.0 billion in total aggregate principal amount of debt outstanding under the various debt instruments described below. See “Risk Factors—Risks Relating to Our Business—We borrow money, which magnifies the potential for gain or loss on amounts invested and may increase the risk of investing with us.”
We may from time to time seek to retire or repurchase our common stock through cash purchases, as well as retire, cancel or purchase our outstanding debt through cash purchases and/or exchanges, in open market purchases, privately negotiated transactions or otherwise. Such repurchases or exchanges, if any, will depend on prevailing market conditions, our liquidity requirements, contractual and regulatory restrictions and other factors. The amounts involved may be material.
23
We are party to a revolving credit facility that allows us to borrow up to $2.1 billion, which includes a $395 million term loan tranche, at any one time outstanding (the “Revolving Credit Facility”). The Revolving Credit Facility also provides for a feature that allows us, under certain circumstances, to increase the size of the facility to a maximum of $3.1 billion. For $1.6 billion of the Revolving Credit Facility, the end of the revolving period and the stated maturity date are January 4, 2021 and January 4, 2022, respectively. For $38 million of the Revolving Credit Facility, the end of the revolving period and the stated maturity date are May 4, 2020 and May 4, 2021, respectively. For the remaining $45 million of the Revolving Credit Facility, the end of the revolving period and the stated maturity date are May 4, 2019 and May 4, 2020, respectively. Subject to certain exceptions, the interest rate charged on the Revolving Credit Facility is based on an applicable spread of either 1.75% or 2.00% over LIBOR or 0.75% or 1.00% over an “alternate base rate” (as defined in the agreements governing the Revolving Credit Facility), in each case, determined monthly based on the total amount of the borrowing base relative to the total commitments of the Revolving Credit Facility and other debt, if any, secured by the same collateral as the Revolving Credit Facility.
Our consolidated subsidiary, Ares Capital CP Funding LLC (“Ares Capital CP”), is party to a revolving funding facility that allows us to borrow up to $1.0 billion at any one time outstanding (the “Revolving Funding Facility”). The Revolving Funding Facility is secured by all of the assets held by, and the membership interest in, Ares Capital CP. The end of the reinvestment period and the stated maturity date for the Revolving Funding Facility is January 3, 2019 and January 3, 2022, respectively. Subject to certain exceptions, the interest rate charged on the Revolving Funding Facility is based on LIBOR plus 2.15% per annum or a “base rate” plus 1.15% per annum (as defined in the agreements governing the Revolving Funding Facility).
Our consolidated subsidiary, Ares Capital JB Funding LLC (“ACJB”) is party to a revolving funding facility with Sumitomo Mitsui Banking Corporation (“SMBC”) that allows us to borrow up to $400 million at any one time outstanding (the “SMBC Funding Facility” and together with the Revolving Credit Facility and the Revolving Funding Facility, the “Facilities”). The SMBC Funding Facility is secured by all of the assets held by ACJB. The end of the reinvestment period and the stated maturity date for the SMBC Funding Facility is September 14, 2018 and September 14, 2023, respectively. The reinvestment period and the stated maturity date are both subject to two one-year extensions by mutual agreement. Subject to certain exceptions, the interest rate charged on the SMBC Funding Facility is based on an applicable spread of either 1.75% or 2.00% over LIBOR or 0.75% or 1.00% over a “base rate” (as defined in the agreements governing the SMBC Funding Facility), in each case, determined monthly based on the amount of the average borrowings outstanding under the SMBC Funding Facility.
Our consolidated subsidiary, Ares Venture Finance, L.P. (“AVF LP”) received a license from the Small Business Administration (“SBA”) to operate as a Small Business Investment Company (“SBIC”) that allows us to borrow up to $150 million at any one time outstanding (the “SBA Debentures”). The original amount committed to AVF LP by the SBA was $75 million. The SBA Debentures are non-recourse to us, have interest payable semi-annually, have a ten-year maturity and may be prepaid at any time without penalty. The interest rate for the SBA Debentures is fixed at the time the SBA Debentures and other applicable issued SBA-guaranteed debentures can be pooled and sold to the public and is based on a spread over U.S. treasury notes with ten-year maturities. The pooling of newly issued SBA Debentures occurs twice per year. The spread includes an annual charge as determined by the SBA (the “Annual Charge”) as well as a market-driven component. Prior to the ten-year fixed interest rate being determined, the interest rate charged for the SBA Debentures is based on LIBOR plus an applicable spread of 0.30% and the Annual Charge. In September 2017, AVF LP fully repaid the $25 million of the aggregate principal amount of the SBA Debentures outstanding at the time, and as result had $50 million of remaining commitments to AVF LP by the SBA.
As of February 8, 2018, we had approximately $688 million aggregate principal amount of unsecured convertible notes outstanding comprised of $300 million aggregate principal amount of unsecured convertible notes that mature on January 15, 2019 (the “2019 Convertible Notes”) and $388 million aggregate principal amount of unsecured convertible notes that mature on February 1, 2022 (the “2022 Convertible Notes”). The 2019 Convertible Notes and the 2022 Convertible Notes mature upon their respective maturity dates unless previously converted or repurchased in accordance with their terms. We do not have the right to redeem the 2019 Convertible Notes and the 2022 Convertible Notes prior to maturity. The 2019 Convertible Notes and the 2022 Convertible Notes bear interest at a rate of 4.375% and 3.75%, respectively, per year, payable semi-annually.
As of February 8, 2018, we had approximately $3.5 billion aggregate principal amount of senior unsecured notes outstanding comprised of $750 million aggregate principal amount of senior unsecured notes that mature on November 30, 2018 and bear interest at a rate of 4.875% (the “2018 Notes”), $600 million aggregate principal amount of senior unsecured notes that mature on January 15, 2020 and bear interest at a rate of 3.875% (the “2020 Notes”), $600 million aggregate principal amount of senior unsecured notes that mature on January 19, 2022 and bear interest at a rate of 3.625% (the “January
24
2022 Notes”), $750 million aggregate principal amount of senior unsecured notes that mature on February 10, 2023 and bear interest at a rate of 3.500% (the “2023 Notes”), $600 million aggregate principal amount of senior unsecured notes that mature on March 1, 2025 and bear interest at a rate of 4.25% (the “2025 Notes”), $230 million aggregate principal amount of senior unsecured notes that mature on April 15, 2047 and bear interest at a rate of 6.875% (the “2047 Notes”). The 2047 Notes are listed on The New York Stock Exchange.
See "Management’s Discussion and Analysis of Financial Condition and Results of Operations—Recent Developments" as well as Note 18 to our consolidated financial statements for the year ended December 31, 2017 for more information regarding the issuance of the 2025 Notes.
We intend to continue borrowing under the Facilities in the future and we may increase the size of the Facilities, add additional credit facilities or otherwise issue additional debt securities or other evidences of indebtedness in the future, although there can be no assurance that we will be able to do so.
For more information on our debt, see “Management’s Discussion and Analysis of Financial Condition and Results of Operations—Financial Condition, Liquidity and Capital Resources.”
REGULATION
We have elected to be regulated as a BDC under the Investment Company Act and have elected to be treated as a RIC under the Code. As with other companies regulated by the Investment Company Act, a BDC must adhere to certain substantive regulatory requirements. The Investment Company Act contains prohibitions and restrictions relating to certain transactions between BDCs and certain affiliates (including any investment advisers or sub-advisers), principal underwriters and certain affiliates of those affiliates or underwriters. Among other things, we generally cannot co-invest in any portfolio company in which a fund managed by Ares or any of its downstream affiliates other than us and our downstream affiliates) is also co-investing. On January 18, 2017, we received the Co-investment Exemptive Order from the SEC that permits us and other business development companies and registered closed-end management investment companies managed by Ares to co-invest in portfolio companies with each other and with affiliated investment funds. Co-investments made under the Co-investment Exemptive Order are subject to compliance with certain conditions and other requirements, which could limit our ability to participate in a co-investment transaction. We may also co-invest with funds managed by Ares or any of its downstream affiliates, subject to compliance with existing regulatory guidance, applicable regulations and our allocation procedures.
The Investment Company Act contains certain restrictions on certain types of investments we may make. Specifically, we may only invest up to 30% of our portfolio in entities that are not considered “eligible portfolio companies” (as defined in the Investment Company Act), including companies located outside of the United States, entities that are operating pursuant to certain exceptions under the Investment Company Act, and publicly traded entities whose public equity market capitalization exceeds the levels provided for under the Investment Company Act.
The Investment Company Act also requires that a majority of our directors be persons other than “interested persons,” as that term is defined in Section 2(a)(19) of the Investment Company Act, referred to herein as “independent directors.” In addition, the Investment Company Act provides that we may not change the nature of our business so as to cease to be, or to withdraw our election as, a BDC unless that change is approved by holders of at least a majority of our outstanding voting securities. Under the Investment Company Act, the vote of holders of at least a “majority of outstanding voting securities” means the vote of the holders of the lesser of: (a) 67% or more of the outstanding shares of our common stock present at a meeting or represented by proxy if holders of more than 50% of the shares of our common stock are present or represented by proxy or (b) more than 50% of the outstanding shares of our common stock.
We may invest up to 100% of our assets in securities acquired directly from issuers in privately negotiated transactions. Our intention is to not write (sell) or buy put or call options to manage risks associated with the publicly traded securities of our portfolio companies. We may enter into hedging transactions to manage the risks associated with interest rate and currency fluctuations. We may purchase or otherwise receive warrants or options to purchase the common stock of our portfolio companies in connection with acquisition financings or other investments. In connection with such an acquisition, we may acquire rights to require the issuers of acquired securities or their affiliates to repurchase them under certain circumstances.
We also do not intend to acquire securities issued by any investment company that exceed the limits imposed by the Investment Company Act. Under these limits, we generally cannot acquire more than 3% of the voting stock of any investment company (as defined in the Investment Company Act), invest more than 5% of the value of our total assets in the securities of one investment company or invest more than 10% of the value of our total assets in the securities of investment companies in
25
the aggregate. With regard to that portion of our portfolio invested in securities issued by investment companies, it should be noted that such investments might subject our stockholders to additional expenses.
SBA REGULATION
In April 2015, our consolidated subsidiary, AVF LP, received a license from the SBA to operate as a SBIC under the provisions of Section 301(c) of the Small Business Investment Act of 1958, as amended. The SBA places certain limitations on the financing of investments by SBICs in portfolio companies, including regulating the types of financings, restricting investments to only include small businesses with certain characteristics or in certain industries, and requiring capitalization thresholds that may limit distributions to the Company. AVF LP will invest in small businesses, as such term is defined in the SBA regulations, in accordance with SBA regulations.
The license from the SBA allows AVF LP to obtain leverage by issuing the SBA Debentures, subject to the issuance of a capital commitment by the SBA and other customary procedures. The SBA Debentures carry long‑term fixed rates that are generally lower than rates on comparable bank and other debt. Leverage through the SBA Debentures is subject to required capitalization thresholds. Current SBA regulations limit the amount that any SBIC may borrow to $150 million. Debentures guaranteed by the SBA have a maturity of ten years, require semi‑annual payments of interest and do not require any principal payments prior to maturity. AVF LP is subject to regulation and oversight by the SBA, including requirements with respect to reporting financial information, such as the extent of capital impairment if applicable, on a regular basis and annual examinations conducted by the SBA. The SBA, as a creditor, will have a superior claim to AVF LP’s assets over the Company’s stockholders in the event AVF LP is liquidated or the SBA exercises its remedies under the SBA Debentures issued by AVF LP upon an event of default.
SBICs are designed to stimulate the flow of private investor capital to eligible small businesses as defined by the SBA. Under SBA regulations, SBICs may make loans to eligible small businesses, invest in the equity securities of such businesses and provide them with consulting and advisory services. Under present SBA regulations, eligible small businesses generally include businesses that (together with their affiliates) have a tangible net worth not exceeding $19.5 million for the two most recent fiscal years and have average annual net income after U.S. federal income taxes not exceeding $6.5 million (average net income to be computed without benefit of any carryover loss) for the two most recent fiscal years. In addition, an SBIC must invest 25% of its investment capital in “smaller enterprises,” as defined by the SBA. The definition of a smaller enterprise generally includes businesses that have a tangible net worth not exceeding $6.0 million for the most recent fiscal year and have average annual net income after U.S. federal income taxes not exceeding $2.0 million (average net income to be computed without benefit of any net carryover loss) for the two most recent fiscal years. SBA regulations also provide alternative size standard criteria to determine eligibility for designation as an eligible small business or smaller enterprise, which criteria depend on the primary industry in which the business is engaged and is based on such factors as the number of employees and gross revenue. However, once an SBIC has invested in an eligible small business, it may continue to make follow on investments in the company, regardless of the size of the company at the time of the follow on investment.
The SBA prohibits an SBIC from providing funds to small businesses with certain characteristics, such as businesses with the majority of their employees located outside the U.S., or from investing in project finance, real estate, farmland, financial intermediaries or “passive” (i.e., non‑operating) businesses. Without prior SBA approval, an SBIC may not invest an amount equal to more than approximately 30% of the SBIC’s regulatory capital in any one company and its affiliates.
The SBA places certain limitations on the financing terms of investments by SBICs in portfolio companies (such as limiting the permissible interest rate on debt securities held by an SBIC in a portfolio company). An SBIC may exercise control over a small business for a period of up to seven years from the date on which the SBIC initially acquires its control position. This control period may be extended for an additional period of time with the SBA’s prior written approval.
The SBA restricts the ability of an SBIC to lend money to any of its officers, directors and employees or to invest in associates thereof. The SBA also prohibits, without prior SBA approval, a “change of control” of an SBIC or transfers that would result in any person (or a group of persons acting in concert) owning 10% or more of a class of capital stock of a licensed SBIC. A “change of control” is any event which would result in the transfer of the power, direct or indirect, to direct the management and policies of an SBIC, whether through ownership, contractual arrangements or otherwise.
The SBA regulations require, among other things, an annual periodic examination of a licensed SBIC by an SBA examiner to determine the SBIC’s compliance with the relevant SBA regulations, and the performance of a financial audit by an independent auditor.
26
PRIVACY PRINCIPLES
We endeavor to maintain the privacy of our recordholders and safeguard their non-public personal information. The following information is provided to help our recordholders understand what personal information we collect, how we protect that information and why, in certain cases, we may share information with select other parties.
Generally, we will not receive any non-public personal information about recordholders of our common stock, although certain of our recordholders’ non-public information may become available to us. The non-public personal information that we may receive falls into the following categories:
• | information we receive from recordholders, whether we receive it orally, in writing or electronically. This includes recordholders’ communications to us concerning their investment; |
• | information about recordholders’ transactions and history with us; and |
• | other general information that we may obtain about recordholders, such as demographic and contact information such as address. |
We disclose non-public personal information about recordholders:
• | to our affiliates (such as our investment adviser and administrator) and their employees for everyday business purposes; |
• | to our service providers (such as our accountants, attorneys, custodians, transfer agent, underwriters and proxy solicitors) and their employees, as is necessary to service recordholder accounts or otherwise provide the applicable service; |
• | to comply with court orders, subpoenas, lawful discovery requests or other legal or regulatory requirements; or |
• | as allowed or required by applicable law or regulation. |
When we share non-public recordholder personal information referred to above, the information is made available for limited business purposes and under controlled circumstances designed to protect our recordholders’ privacy. We do not permit use of recordholder information for any non-business or marketing purpose, nor do we permit third parties to rent, sell, trade or otherwise release or disclose information to any other party.
Our service providers, such as our investment adviser, administrator and transfer agent, are required to maintain physical, electronic, and procedural safeguards to protect recordholder non-public personal information, to prevent unauthorized access or use and to dispose of such information when it is no longer required.
Personnel of affiliates may access recordholder information only for business purposes. The degree of access is based on the sensitivity of the information and on personnel need for the information to service a recordholder’s account or comply with legal requirements.
If a recordholder ceases to be a recordholder, we will adhere to the privacy policies and practices as described above. We may choose to modify our privacy policies at any time. Before we do so, we will notify recordholders and provide a description of our privacy policy.
In the event of a corporate change in control resulting from, for example, a sale to, or merger with, another entity, or in the event of a sale of assets, we reserve the right to transfer non-public personal information of holders of our securities to the new party in control or the party acquiring assets.
AVAILABLE INFORMATION
We file with or submit to the SEC annual, quarterly and current periodic reports, proxy statements and other information meeting the informational requirements of the Securities Exchange Act of 1934 (the “Exchange Act”). This information is available free of charge by calling us collect at (310) 201-4200 or on our website at www.arescapitalcorp.com. Information contained on our website is not incorporated into this Annual Report and you should not consider such information to be part of this Annual Report. You also may inspect and copy these reports, proxy statements and other information, as well
27
as the Annual Report and related exhibits and schedules, at the Public Reference Room of the SEC at 100 F Street, N.E., Washington, D.C. 20549, the SEC’s Northeast Regional Office at 3 World Financial Center, Suite 400, New York, NY 10281 and the SEC’s Midwest Regional Office at 175 W. Jackson Blvd., Suite 900, Chicago, IL 60604. Such information is also available from the EDGAR database on the SEC’s web site at http://www.sec.gov. You also can obtain copies of such information, after paying a duplicating fee, by sending a request by e-mail to publicinfo@sec.gov or by writing the SEC’s Public Reference Branch, Office of Consumer Affairs and Information Services, Securities and Exchange Commission, Washington, D.C. 20549. You may obtain information on the operation of the SEC’s Public Reference Room by calling the SEC at (202) 551-8090 or (800) SEC-0330.
28
Item 1A. Risk Factors
RISK FACTORS
You should carefully consider the risk factors described below, together with all of the other information included in this Annual Report, including our consolidated financial statements and the related notes thereto, before you decide whether to make an investment in our securities. The risks set out below are not the only risks we face. Additional risks and uncertainties not currently known to us or that we currently deem to be immaterial also may materially adversely affect our business, financial condition and/or operating results. If any of the following events occur, our business, financial condition and results of operations could be materially adversely affected. In such case, the net asset value of our common stock and the trading price, if any, of our securities could decline, and you may lose all or part of your investment.
RISKS RELATING TO OUR BUSINESS
The capital markets may experience periods of disruption and instability. Such market conditions may materially and adversely affect debt and equity capital markets, which may have a negative impact on our business and operations.
From time to time, capital markets may experience periods of disruption and instability. For example, between 2008 and 2009, the global capital markets were unstable as evidenced by periodic disruptions in liquidity in the debt capital markets, significant write-offs in the financial services sector, the re-pricing of credit risk in the broadly syndicated credit market and the failure of major financial institutions. Despite actions of the U.S. federal government and foreign governments, these events contributed to worsening general economic conditions that materially and adversely impacted the broader financial and credit markets and reduced the availability of debt and equity capital for the market as a whole and financial services firms in particular. While market conditions have largely recovered from the events of 2008 and 2009, there have been continuing periods of volatility, some lasting longer than others. For example, the referendum by British voters to exit the European Union (“E.U.”) (“Brexit”) in June 2016 led to further disruption and instability in the global markets. There can be no assurance these market conditions will not repeat themselves or worsen in the future.
Equity capital may be difficult to raise during periods of adverse or volatile market conditions because, subject to some limited exceptions, as a BDC, we are generally not able to issue additional shares of our common stock at a price less than net asset value without first obtaining approval for such issuance from our stockholders and our independent directors. We generally seek approval from our stockholders so that we have the flexibility to issue up to 25% of our then outstanding shares of our common stock at a price below net asset value. Pursuant to approval granted at a special meeting of stockholders held on May 22, 2017, we currently are permitted to sell or otherwise issue shares of our common stock at a price below net asset value, subject to certain limitations and determinations that must be made by our board of directors. Such stockholder approval expires on May 22, 2018.
Volatility and dislocation in the capital markets can also create a challenging environment in which to raise or access debt capital. The reappearance of market conditions similar to those experienced from 2008 through 2009 for any substantial length of time could make it difficult to extend the maturity of or refinance our existing indebtedness or obtain new indebtedness with similar terms and any failure to do so could have a material adverse effect on our business. The debt capital that will be available to us in the future, if at all, may be at a higher cost and on less favorable terms and conditions than what we currently experience including being at a higher cost due to a rising rate environment. If we are unable to raise or refinance debt, then our equity investors may not benefit from the potential for increased returns on equity resulting from leverage and we may be limited in our ability to make new commitments or to fund existing commitments to our portfolio companies.
Significant changes or volatility in the capital markets may also have a negative effect on the valuations of our investments. While most of our investments are not publicly traded, applicable accounting standards require us to assume as part of our valuation process that our investments are sold in a principal market to market participants (even if we plan on holding an investment through its maturity). Significant changes in the capital markets may also affect the pace of our investment activity and the potential for liquidity events involving our investments. Thus, the illiquidity of our investments may make it difficult for us to sell such investments to access capital if required, and as a result, we could realize significantly less than the value at which we have recorded our investments if we were required to sell them for liquidity purposes. An inability to raise or access capital could have a material adverse effect on our business, financial condition or results of operations.
29
Uncertainty about the financial stability of the United States, China and several countries in Europe could have a significant adverse effect on our business, financial condition and results of operations.
Due to federal budget deficit concerns, Standard & Poor’s Financial Services LLC (“S&P”) downgraded the federal government’s credit rating from AAA to AA+ for the first time in history on August 5, 2011. Further, Moody’s Investor Services, Inc. (“Moody’s”) and Fitch Ratings Inc. (“Fitch”) had warned that they may downgrade the federal government’s credit rating under certain circumstances. Further downgrades or warnings by S&P or other rating agencies, and the United States government’s credit and deficit concerns in general, could cause interest rates and borrowing costs to rise, which may negatively impact both the perception of credit risk associated with our debt portfolio and our ability to access the debt markets on favorable terms. In addition, a decreased U.S. government credit rating could create broader financial turmoil and uncertainty, which may weigh heavily on our financial performance and the value of our common stock.
Deterioration in the economic conditions in the Eurozone and globally, including instability in financial markets, may pose a risk to our business. In recent years, financial markets have been affected at times by a number of global macroeconomic and political events, including the following: large sovereign debts and fiscal deficits of several countries in Europe and in emerging markets jurisdictions, levels of non‑performing loans on the balance sheets of European banks, the potential effect of any European country leaving the Eurozone, the potential effect of the United Kingdom leaving the European Union, the potential effect of Scotland leaving the United Kingdom, and market volatility and loss of investor confidence driven by political events, including the general elections in the United Kingdom in June 2017 and in Germany in September 2017 and referenda in the United Kingdom in June 2016 and Italy in December 2016. Market and economic disruptions have affected, and may in the future affect, consumer confidence levels and spending, personal bankruptcy rates, levels of incurrence and default on consumer debt and home prices, among other factors. We cannot assure you that market disruptions in Europe, including the increased cost of funding for certain governments and financial institutions, will not impact the global economy, and we cannot assure you that assistance packages will be available, or if available, be sufficient to stabilize countries and markets in Europe or elsewhere affected by a financial crisis. To the extent uncertainty regarding any economic recovery in Europe negatively impacts consumer confidence and consumer credit factors, our business, financial condition and results of operations could be significantly and adversely affected.
In the second quarter of 2015, stock prices in China experienced a significant drop, resulting primarily from continued sell‑off of shares trading in Chinese markets. In addition, in August 2015, Chinese authorities sharply devalued China’s currency. Since then, the Chinese capital markets have continued to experience periods of instability. These market and economic disruptions have affected, and may in the future affect, the U.S. capital markets, which could adversely affect our business, financial condition or results of operations.
The Federal Reserve raised the Federal Funds Rate in December 2015, in December 2016, in March 2017, in June 2017 and again in December 2017, and has announced its intention to continue to raise the federal funds rate over time. These developments, along with the United States government’s credit and deficit concerns, the European sovereign debt crisis and the economic slowdown in China, could cause interest rates to be volatile, which may negatively impact our ability to access the debt markets on favorable terms.
A failure on our part to maintain our status as a BDC may significantly reduce our operating flexibility.
If we fail to maintain our status as a BDC, we might be regulated as a closed-end investment company that is required to register under the Investment Company Act, which would subject us to additional regulatory restrictions and significantly decrease our operating flexibility. In addition, any such failure could cause an event of default under our outstanding indebtedness, which could have a material adverse effect on our business, financial condition or results of operations.
We are dependent upon certain key personnel of Ares for our future success and upon their access to other Ares investment professionals.
We depend on the diligence, skill and network of business contacts of certain key personnel of the Ares Credit Group. We also depend, to a significant extent, on access to the investment professionals of other groups within Ares and the information and deal flow generated by Ares’ investment professionals in the course of their investment and portfolio management activities. Our future success depends on the continued service of certain key personnel of the Ares Credit Group. The departure of any of these individuals, or of a significant number of the investment professionals or partners of Ares, could have a material adverse effect on our business, financial condition or results of operations. In addition, we cannot assure you that Ares Capital Management will remain our investment adviser or that we will continue to have access to Ares’ investment professionals or its information and deal flow. Further, there can be no assurance that Ares Capital will replicate its own or
30
Ares’ historical success, and we caution you that our investment returns could be substantially lower than the returns achieved by other Ares-managed funds.
We may be unable to realize the benefits anticipated by the American Capital Acquisition, including estimated cost
savings and synergies, or it may take longer than anticipated to achieve such benefits.
On January 3, 2017, we completed the American Capital Acquisition. The realization of certain benefits anticipated as a result of the American Capital Acquisition will depend in part on the integration of American Capital’s investment portfolio with our investment portfolio and the integration of American Capital’s business with our business. There can be no assurance that American Capital’s investment portfolio or business can be operated profitably or integrated successfully into our business in a timely fashion or at all. The dedication of management resources to such integration may detract attention from our day-to-day business and there can be no assurance that there will not be substantial costs associated with the transition process or that there will not be other material adverse effects as a result of these integration efforts. Such effects, including but not limited to, incurring unexpected costs or delays in connection with such integration and failure of American Capital’s investment portfolio to perform as expected, could have a material adverse effect on our financial results.
We also expect to achieve certain cost savings and synergies from the American Capital Acquisition when the two companies have fully integrated their portfolios. It is possible that our estimates of the potential cost savings and synergies could turn out to be incorrect. If the estimates turn out to be incorrect or we are not able to successfully combine the investment portfolios and businesses of the two companies, the anticipated cost savings and synergies may not be fully realized or realized at all or may take longer to realize than expected.
Our financial condition and results of operations depend on our ability to manage future growth effectively.
Our ability to achieve our investment objective depends on our ability to acquire suitable investments and monitor and administer those investments, which depends, in turn, on our investment adviser’s ability to identify, invest in and monitor companies that meet our investment criteria.
Accomplishing this result on a cost-effective basis is largely a function of the structuring of our investment process and the ability of our investment adviser to provide competent, attentive and efficient services to us. Our executive officers and the members of our investment adviser’s investment committee have substantial responsibilities in connection with their roles at Ares and with the other Ares funds, as well as responsibilities under the investment advisory and management agreement. They may also be called upon to provide significant managerial assistance to certain of our portfolio companies. These demands on their time, which will increase as the number of investments grow, may distract them or slow the rate of investment. In order to grow, Ares will need to hire, train, supervise, manage and retain new employees. However, we cannot assure you that Ares will be able to do so effectively. Any failure to manage our future growth effectively could have a material adverse effect on our business, financial condition and results of operations.
In addition, as we grow, we may open up new offices in new geographic regions that may increase our direct operating expenses without corresponding revenue growth.
Our ability to grow depends on our ability to raise capital.
We will need to periodically access the capital markets to raise cash to fund new investments in excess of our repayments, and we may also need to access the capital markets to refinance existing debt obligations to the extent such maturing obligations are not repaid with availability under our revolving credit facilities or cash flows from operations. We have elected to be treated as a RIC and operate in a manner so as to qualify for the U.S. federal income tax treatment applicable to RICs. Among other things, in order to maintain our RIC status, we must distribute to our stockholders on a timely basis generally an amount equal to at least 90% of our investment company taxable income, and, as a result, such distributions will not be available to fund investment originations or repay maturing debt. We must continue to borrow from financial institutions and issue additional securities to fund our growth. Unfavorable economic or capital market conditions may increase our funding costs, limit our access to the capital markets or could result in a decision by lenders not to extend credit to us. An inability to successfully access the capital markets may limit our ability to refinance our existing debt obligations as they come due and/or to fully execute our business strategy and could limit our ability to grow or cause us to have to shrink the size of our business, which could decrease our earnings, if any.
In addition, with certain limited exceptions, we are only allowed to borrow amounts or issue debt securities or preferred stock, which we refer to collectively as “senior securities,” such that our asset coverage, as calculated pursuant to the Investment Company Act, equals at least 200% immediately after such borrowing, which, in certain circumstances, may restrict
31
our ability to borrow or issue debt securities or preferred stock. The amount of leverage that we employ will depend on our investment adviser’s and our board of directors’ assessments of market and other factors at the time of any proposed borrowing or issuance of senior securities. We cannot assure you that we will be able to maintain our current Facilities (as defined below), obtain other lines of credit or issue senior securities at all or on terms acceptable to us.
Regulations governing our operation as a BDC affect our ability to, and the way in which we, raise additional capital.
We may issue senior securities or borrow money from banks or other financial institutions, up to the maximum amount permitted by the Investment Company Act. Under the provisions of the Investment Company Act, we are permitted, as a BDC, to incur indebtedness or issue senior securities only in amounts such that our asset coverage, as calculated pursuant to the Investment Company Act, equals at least 200% after each such incurrence or issuance. If the value of our assets declines, we may be unable to satisfy this test, which may prohibit us from paying dividends and could prevent us from maintaining our status as a RIC or may prohibit us from repurchasing shares of our common stock. In addition, our inability to satisfy this test could cause an event of default under our existing indebtedness. If we cannot satisfy this test, we may be required to sell a portion of our investments at a time when such sales may be disadvantageous and, depending on the nature of our leverage, repay a portion of our indebtedness. Accordingly, any failure to satisfy this test could have a material adverse effect on our business, financial condition or results of operations. As of December 31, 2017, our asset coverage calculated in accordance with the Investment Company Act was 242%. Also, to generate cash for funding new investments, we may in the future seek to issue additional debt or to securitize certain of our loans. The Investment Company Act may impose restrictions on the structure of any such securitization.
We are not generally able to issue and sell our common stock at a price below net asset value per share. We may, however, sell our common stock, or warrants, options or rights to acquire our common stock, at a price below the current net asset value per share of our common stock if our board of directors determines that such sale is in our best interests and the best interests of our stockholders, and our stockholders approve such sale. Any such sale would be dilutive to the net asset value per share of our common stock. In any such case, the price at which our securities are to be issued and sold may not be less than a price that, in the determination of our board of directors, closely approximates the market value of such securities (less any commission or discount). If our common stock trades at a discount to net asset value, this restriction could adversely affect our ability to raise capital.
Pursuant to approval granted at a special meeting of stockholders held on May 22, 2017, we currently are permitted to sell or otherwise issue shares of our common stock at a price below net asset value, subject to certain limitations and determinations that must be made by our board of directors. Such stockholder approval expires on May 22, 2018.
We borrow money, which magnifies the potential for gain or loss on amounts invested and may increase the risk of investing with us.
Borrowings, also known as leverage, magnify the potential for gain or loss on amounts invested and, therefore, increase the risks associated with investing in our securities. We currently borrow under the Facilities and have issued or assumed other senior securities, and in the future may borrow from, or issue additional senior securities to, banks, insurance companies, funds, institutional investors and other lenders and investors. Lenders and holders of such senior securities have fixed dollar claims on our consolidated assets that are superior to the claims of our common stockholders or any preferred stockholders. If the value of our consolidated assets increases, then leveraging would cause the net asset value per share of our common stock to increase more sharply than it would have had we not incurred leverage.
Conversely, if the value of our consolidated assets decreases, leveraging would cause net asset value to decline more sharply than it otherwise would have had we not incurred leverage. Similarly, any increase in our consolidated income in excess of consolidated interest payable on the borrowed funds would cause our net income to increase more than it would had we not incurred leverage, while any decrease in our consolidated income would cause net income to decline more sharply than it would have had we not incurred leverage. Such a decline could negatively affect our ability to make common stock dividend payments. There can be no assurance that a leveraging strategy will be successful.
As of December 31, 2017, we had approximately $1.1 billion of outstanding borrowings under the Facilities, approximately $958 million in aggregate principal amount outstanding of the unsecured convertible notes that mature on January 15, 2018, the 2019 Convertible Notes and 2022 Convertible Notes (together the “Convertible Unsecured Notes”) and approximately $2.9 billion in aggregate principal amount outstanding of the 2018 Notes, the 2020 Notes, the January 2022 Notes, the 2023 Notes and the 2047 Notes (together the “Unsecured Notes”). Unsecured Notes. In order for us to cover our annual interest payments on our outstanding indebtedness at December 31, 2017, we must achieve annual returns on our December 31, 2017 total assets of at least 1.6%. The weighted average stated interest rate charged on our principal amount of
32
outstanding indebtedness as of December 31, 2017 was 4.1%. We intend to continue borrowing under the Facilities in the future and we may increase the size of the Facilities or issue additional debt securities or other evidences of indebtedness (although there can be no assurance that we will be successful in doing so). For more information on our indebtedness, see “Management’s Discussion and Analysis of Financial Condition and Results of Operations—Financial Condition, Liquidity and Capital Resources” and “Recent Developments.” Our ability to service our debt depends largely on our financial performance and is subject to prevailing economic conditions and competitive pressures. The amount of leverage that we employ at any particular time will depend on our investment adviser’s and our board of directors’ assessments of market and other factors at the time of any proposed borrowing.
The Facilities, the SBA Debentures, the Convertible Unsecured Notes and the Unsecured Notes impose financial and operating covenants that restrict our business activities, including limitations that could hinder our ability to finance additional loans and investments or to make the distributions required to maintain our status as a RIC. A failure to renew the Facilities or to add new or replacement debt facilities or to issue additional debt securities or other evidences of indebtedness could have a material adverse effect on our business, financial condition and results of operations.
The following table illustrates the effect on return to a holder of our common stock of the leverage created by our use of borrowing at the weighted average stated interest rate of 4.1% as of December 31, 2017, together with (a) our total value of net assets as of December 31, 2017; (b) approximately $4.9 billion in aggregate principal amount of indebtedness outstanding as of December 31, 2017 and (c) hypothetical annual returns on our portfolio of minus 15% to plus 15%.
Assumed Return on Portfolio (Net of Expenses)(1) | -15.00 | % | -10.00 | % | -5.00 | % | — | % | 5.00 | % | 10.00 | % | 15.00 | % | ||||||
Corresponding Return to Common Stockholders(2) | -28.93 | % | -20.23 | % | -11.54 | % | -2.84 | % | 5.86 | % | 14.56 | % | 23.26 | % | ||||||
_______________________________________________________________________________
(1) | The assumed portfolio return is required by SEC regulations and is not a prediction of, and does not represent, our projected or actual performance. Actual returns may be greater or less than those appearing in the table. Pursuant to SEC regulations, this table is calculated as of December 31, 2017. As a result, it has not been updated to take into account any changes in assets or leverage since December 31, 2017. |
(2) | In order to compute the “Corresponding Return to Common Stockholders,” the “Assumed Return on Portfolio” is multiplied by the total value of our assets at December 31, 2017 to obtain an assumed return to us. From this amount, the interest expense (calculated by multiplying the weighted average stated interest rate of 4.1% by the approximately $4.9 billion of principal debt outstanding) is subtracted to determine the return available to stockholders. The return available to stockholders is then divided by the total value of our net assets as of December 31, 2017 to determine the “Corresponding Return to Common Stockholders.” |
In addition to regulatory requirements that restrict our ability to raise capital, the Facilities, the Convertible Unsecured Notes, the Unsecured Notes and the SBA Debentures contain various covenants that, if not complied with, could accelerate repayment under the Facilities, the Convertible Unsecured Notes, the Unsecured Notes and SBA Debentures, thereby materially and adversely affecting our liquidity, financial condition and results of operations.
The agreements governing the Facilities, the Convertible Unsecured Notes, the Unsecured Notes and the SBA Debentures require us to comply with certain financial and operational covenants. These covenants may include, among other things:
• | restrictions on the level of indebtedness that we are permitted to incur in relation to the value of our assets; |
• | restrictions on our ability to incur liens; and |
• | maintenance of a minimum level of stockholders’ equity. |
As of the date of this Annual Report, we are in compliance in all material respects with the covenants of the Facilities, the Convertible Unsecured Notes, the Unsecured Notes and the SBA Debentures. However, our continued compliance with these covenants depends on many factors, some of which are beyond our control. For example, depending on the condition of the public debt and equity markets and pricing levels, unrealized depreciation in our portfolio may increase in the future. Any such increase could result in our inability to comply with our obligation to restrict the level of indebtedness that we are able to incur in relation to the value of our assets or to maintain a minimum level of stockholders’ equity.
33
Accordingly, although we believe we will continue to be in compliance, there are no assurances that we will continue to comply with the covenants in the Facilities, the Convertible Unsecured Notes, the Unsecured Notes and the SBA Debentures. Failure to comply with these covenants could result in a default under the Facilities, the Convertible Unsecured Notes, the Unsecured Notes or the SBA Debentures that, if we were unable to obtain a waiver from the lenders or holders of such indebtedness, as applicable, such lenders or holders could accelerate repayment under such indebtedness and thereby have a material adverse impact on our business, financial condition and results of operations.
We operate in a highly competitive market for investment opportunities.
A number of entities compete with us to make the types of investments that we make in middle-market companies. We compete with other BDCs, public and private funds, commercial and investment banks, commercial financing companies, insurance companies, hedge funds, and, to the extent they provide an alternative form of financing, private equity funds. Many of our competitors are substantially larger and have considerably greater financial, technical and marketing resources than we do. Some competitors may have a lower cost of funds and access to funding sources that are not available to us. In addition, some of our competitors may have higher risk tolerances or different risk assessments, which could allow them to consider a wider variety of investments and establish more relationships than us. Furthermore, many of our competitors are not subject to the regulatory restrictions that the Investment Company Act imposes on us as a BDC and that the Code imposes on us as a RIC. We cannot assure you that the competitive pressures we face will not have a material adverse effect on our business, financial condition and results of operations. Also, as a result of this competition, we may not be able to pursue attractive investment opportunities from time to time.
We do not seek to compete primarily based on the interest rates we offer and we believe that some of our competitors may make loans with interest rates that are comparable to or lower than the rates we offer. Rather, we compete with our competitors based on our existing investment platform, seasoned investment professionals, experience and focus on middle-market companies, disciplined investment philosophy, extensive industry focus and flexible transaction structuring. For a more detailed discussion of these competitive advantages, see “Business—Competitive Advantages.”
We may lose investment opportunities if we do not match our competitors’ pricing, terms and structure. If we match our competitors’ pricing, terms and structure, we may experience decreased net interest income and increased risk of credit loss. As a result of operating in such a competitive environment, we may make investments that are on less favorable terms than what we may have originally anticipated, which may impact our return on these investments.
We may be subject to additional corporate-level income taxes if we fail to maintain our status as a RIC.
We have elected to be treated as a RIC under the Code and operate in a manner so as to qualify for the U.S. federal income tax treatment applicable to RICs. As a RIC, we generally will not pay U.S. federal corporate-level income taxes on our income and net capital gains that we distribute to our stockholders as dividends on a timely basis. We will be subject to U.S. federal corporate-level income tax on any undistributed income and/or gains. To maintain our status as a RIC, we must meet certain source of income, asset diversification and annual distribution requirements. We may also be subject to certain U.S. federal excise taxes, as well as state, local and foreign taxes.
To maintain our RIC status, we must timely distribute an amount equal to at least 90% of our investment company taxable income (as defined by the Code, which generally includes net ordinary income and net short term capital gains) to our stockholders (the “Annual Distribution Requirement”). We have the ability to pay a large portion of our dividends in shares of our stock, and as long as a portion of such dividend is paid in cash and other requirements are met, such stock dividends will be taxable as a dividend for U.S. federal income tax purposes. This may result in our U.S. stockholders having to pay tax on such dividends, even if no cash is received, and may result in our non-U.S. stockholders being subject to withholding tax in respect of amounts distributed in our stock. Because we use debt financing, we are subject to certain asset coverage ratio requirements under the Investment Company Act and financial covenants under our indebtedness that could, under certain circumstances, restrict us from making distributions necessary to qualify as a RIC. If we are unable to obtain cash from other sources, we may fail to maintain our status as a RIC and, thus, may be subject to corporate-level income tax on all of our income and/or gains.
To maintain our status as a RIC, in addition to the Annual Distribution Requirement, we must also meet certain annual source of income requirements at the end of each taxable year and asset diversification requirements at the end of each calendar quarter. Failure to meet these requirements may result in our having to (a) dispose of certain investments quickly or (b) raise additional capital to prevent the loss of RIC status. Because most of our investments are in private companies and are generally illiquid, any such dispositions may be at disadvantageous prices and may result in losses. Also, the rules applicable to our qualification as a RIC are complex with many areas of uncertainty. Accordingly, no assurance can be given that we have qualified or will continue to qualify as a RIC. If we fail to maintain our status as a RIC for any reason and become subject to
34
regular “C” corporation income tax, the resulting corporate-level income taxes could substantially reduce our net assets, the amount of income available for distribution and the amount of our distributions. Such a failure would have a material adverse effect on us and on any investment in us. Certain provisions of the Code provide some relief from RIC disqualification due to failures of the source of income and asset diversification requirements, although there may be additional taxes due in such cases. We cannot assure you that we would qualify for any such relief should we fail the source of income or asset diversification requirements.
We may have difficulty paying our required distributions under applicable tax rules if we recognize income before or without receiving cash representing such income.
For U.S. federal income tax purposes, we generally are required to include in income certain amounts that we have not yet received in cash, such as original issue discount, which may arise, for example, if we receive warrants in connection with the making of a loan, or PIK interest representing contractual interest added to the loan principal balance and due at the end of the loan term. Such original issue discount or PIK interest is included in income before we receive any corresponding cash payments. We also may be required to include in income certain other amounts that we will not receive in cash, including, for example, amounts attributable to hedging and foreign currency transactions.
Since, in certain cases, we may recognize income before or without receiving cash in respect of such income, we may have difficulty meeting the U.S. federal income tax requirement to distribute generally an amount equal to at least 90% of our investment company taxable income to maintain our status as a RIC. Accordingly, we may have to sell some of our investments at times we would not consider advantageous, raise additional debt or equity capital or reduce new investment originations to meet these distribution requirements. If we are not able to obtain cash from other sources, we may fail to qualify as a RIC and thus be subject to additional corporate-level income taxes. Such a failure could have a material adverse effect on us and on any investment in us.
We are exposed to risks associated with changes in interest rates.
General interest rate fluctuations may have a substantial negative impact on our investments and investment opportunities and, accordingly, may have a material adverse effect on our investment objective and rate of return on invested capital. Because we borrow money and may issue debt securities or preferred stock to make investments, our net investment income is dependent upon the difference between the rate at which we borrow funds or pay interest or dividends on such debt securities or preferred stock and the rate at which we invest these funds. From time to time, we may also enter into certain hedging transactions to mitigate our exposure to rising borrowing costs. There can be no assurance that a significant change in market interest rates will not have a material adverse effect on our net investment income.
Trading prices for debt that pays a fixed rate of return tend to fall as interest rates rise. Trading prices tend to fluctuate more for fixed-rate securities that have longer maturities. In the past, we have entered into certain hedging transactions, such as interest rate swap agreements, to mitigate our exposure to adverse fluctuations in interest rates, and we may do so again in the future. In addition, we may increase our floating rate investments to position the portfolio for rate increases. However, we cannot assure you that such transactions will be successful in mitigating our exposure to interest rate risk. Hedging transactions may also limit our ability to participate in the benefits of lower interest rates with respect to our indebtedness.
Although we have no policy governing the maturities of our investments, under current market conditions we expect that we will invest in a portfolio of debt generally having maturities of up to 10 years. This means that we are subject to greater risk (other things being equal) than a fund invested solely in shorter-term securities. A decline in the prices of the debt we own could adversely affect the trading price of our common stock. Also, an increase in interest rates available to investors could make an investment in our common stock less attractive if we are not able to increase our dividend rate, which could reduce the value of our common stock.
Most of our portfolio investments are not publicly traded and, as a result, the fair value of these investments may not be readily determinable.
A large percentage of our portfolio investments are not publicly traded. The fair value of investments that are not publicly traded may not be readily determinable. We value these investments quarterly at fair value as determined in good faith by our board of directors based on, among other things, the input of our management and audit committee and independent valuation firms that have been engaged at the direction of our board of directors to assist in the valuation of each portfolio investment without a readily available market quotation at least once during a trailing 12-month period (with certain de minimis exceptions). The valuation process is conducted at the end of each fiscal quarter, with a portion (based on value) of our valuations of portfolio companies without readily available market quotations subject to review by an independent valuation
35
firm each quarter. However, we may use these independent valuation firms to review the value of our investments more frequently, including in connection with the occurrence of significant events or changes in value affecting a particular investment. In addition, our independent registered public accounting firm obtains an understanding of, and performs select procedures relating to, our investment valuation process within the context of performing the integrated audit.
The types of factors that may be considered in valuing our investments include the enterprise value of the portfolio company (the entire value of the portfolio company to a market participant, including the sum of the values of debt and equity securities used to capitalize the enterprise at a point in time), the nature and realizable value of any collateral, the portfolio company’s ability to make payments and its earnings and discounted cash flows, the markets in which the portfolio company does business, a comparison of the portfolio company’s securities to similar publicly traded securities, changes in the interest rate environment and the credit markets generally that may affect the price at which similar investments would trade in their principal markets and other relevant factors. When an external event such as a purchase transaction, public offering or subsequent equity sale occurs, we consider the pricing indicated by the external event to corroborate our valuation. Because such valuations, and particularly valuations of private investments and private companies, are inherently uncertain, may fluctuate over short periods of time and may be based on estimates, our determinations of fair value may differ materially from the values that would have been used if a ready market for these investments existed and may differ materially from the values that we may ultimately realize. Our net asset value per share could be adversely affected if our determinations regarding the fair value of these investments are higher than the values that we realize upon disposition of such investments.
The lack of liquidity in our investments may adversely affect our business.
As we generally make investments in private companies, substantially all of these investments are subject to legal and other restrictions on resale or are otherwise less liquid than publicly traded securities. The illiquidity of our investments may make it difficult for us to sell such investments if the need arises. In addition, if we are required to liquidate all or a portion of our portfolio quickly, we could realize significantly less than the value at which we have recorded our investments or could be unable to dispose of our investments in a timely manner. In addition, we may face other restrictions on our ability to liquidate an investment in a portfolio company to the extent that we or an affiliated manager of Ares has material non-public information regarding such portfolio company.
We may experience fluctuations in our quarterly results.
We could experience fluctuations in our quarterly operating results due to a number of factors, including the interest rates payable on the debt investments we make, the default rates on such investments, the level of our expenses, variations in and the timing of the recognition of realized and unrealized gains or losses, the degree to which we encounter competition in our markets and general economic conditions. As a result of these factors, results for any period should not be relied upon as being indicative of performance in future periods.
Our financial condition and results of operations could be negatively affected if a significant investment fails to perform as expected.
Our investment portfolio includes investments that may be significant individually or in the aggregate. If a significant investment in one or more companies fails to perform as expected, such a failure could have a material adverse effect on our financial condition and results of operations, and the magnitude of such effect could be more significant than if we had further diversified our portfolio.
There are significant potential conflicts of interest that could impact our investment returns.
Certain of our executive officers and directors, and members of the investment committee of our investment adviser, serve or may serve as officers, directors or principals of other entities and affiliates of our investment adviser and investment funds managed by our investment adviser or its affiliates. Accordingly, they may have obligations to investors in those entities, the fulfillment of which might not be in our or our stockholders’ best interests or may require them to devote time to services for other entities, which could interfere with the time available to provide services to us. Members of our investment adviser’s investment committee may have significant responsibilities for other Ares funds. Similarly, although the professional staff of our investment adviser will devote as much time to the management of the Company as appropriate to enable our investment adviser to perform its duties in accordance with the investment advisory and management agreement, the investment professionals of our investment adviser may have conflicts in allocating their time and services among the Company, on the one hand, and investment vehicles managed by our investment adviser or one or more of its affiliates, on the other hand. These activities could be viewed as creating a conflict of interest insofar as the time and effort of the professional staff of our
36
investment adviser and its officers and employees will not be devoted exclusively to the business of the Company but will instead be allocated between the business of the Company and the management of these other investment vehicles.
In addition, certain Ares funds may have investment objectives that compete or overlap with, and may from time to time invest in asset classes similar to those targeted by, Ares Capital. Consequently, we, on the one hand, and these other entities, on the other hand, may from time to time pursue the same or similar capital and investment opportunities. Ares and our investment adviser endeavor to allocate investment opportunities in a fair and equitable manner, and in any event consistent with any fiduciary duties owed to Ares Capital. Nevertheless, it is possible that we may not be given the opportunity to participate in certain investments made by investment funds managed by investment managers affiliated with Ares (including our investment adviser). In addition, there may be conflicts in the allocation of investments among us and the funds managed by investment managers affiliated with Ares (including our investment adviser) or one or more of our controlled affiliates or among the funds they manage, including investments made pursuant to the Co-investment Exemptive Order. Further, such other Ares-managed funds may hold positions in portfolio companies in which Ares Capital has also invested. Such investments may raise potential conflicts of interest between Ares Capital and such other Ares-managed funds, particularly if Ares Capital and such other Ares-managed funds invest in different classes or types of securities or investments of the same underlying portfolio company. In that regard, actions may be taken by such other Ares-managed funds that are adverse to Ares Capital’s interests, including, but not limited to, during a restructuring, bankruptcy or other insolvency proceeding or similar matter occurring at the underlying portfolio company.
We have from time to time sold assets to IHAM and certain of the IHAM Vehicles managed by IHAM and, as part of our investment strategy, we may offer to sell additional assets to vehicles managed by one or more of our affiliates (including IHAM) or we may purchase assets from vehicles managed by one or more of our affiliates (including IHAM). In addition, vehicles managed by one or more of our affiliates (including IHAM) may offer assets to or may purchase assets from one another. While assets may be sold or purchased at prices that are consistent with those that could be obtained from third parties in the marketplace, and although these types of transactions generally require approval of one or more independent parties, there may be an inherent conflict of interest in such transactions between us and funds managed by one of our affiliates.
We pay a base management fee, an income based fee and a capital gains incentive fee to our investment adviser, and reimburse our investment adviser for certain expenses it incurs. In addition, investors in our common stock will invest on a gross basis and receive distributions on a net basis after expenses, resulting in, among other things, a lower rate of return than one might achieve if distributions were made on a gross basis.
Our investment adviser’s base management fee is based on a percentage of our total assets (other than cash or cash equivalents but including assets purchased with borrowed funds) and, consequently, our investment adviser may have conflicts of interest in connection with decisions that could affect our total assets, such as decisions as to whether to incur indebtedness or to make future investments.
The income based fees payable by us to our investment adviser that relate to our pre-incentive fee net investment income is computed and paid on income that may include interest that is accrued but not yet received in cash. If a portfolio company defaults on a loan that is structured to provide accrued interest, it is possible that accrued interest previously used in the calculation of such fee will become uncollectible. Our investment adviser is not under any obligation to reimburse us for any part of the income based fees it received that were based on accrued interest that we never actually receive.
Our investment advisory and management agreement renews for successive annual periods if approved by our board of directors or by the affirmative vote of the holders of a majority of our outstanding voting securities, including, in either case, approval by a majority of our directors who are not “interested persons” of the Company as defined in Section 2(a)(19) of the Investment Company Act. However, both we and our investment adviser have the right to terminate the agreement without penalty upon 60 days’ written notice to the other party. Moreover, conflicts of interest may arise if our investment adviser seeks to change the terms of our investment advisory and management agreement, including, for example, the terms for compensation to our investment adviser. While any material change to the investment advisory and management agreement must be submitted to stockholders for approval under the Investment Company Act, we may from time to time decide it is appropriate to seek stockholder approval to change the terms of the agreement.
We are party to an administration agreement with our administrator, Ares Operations, a subsidiary of Ares Management, pursuant to which our administrator furnishes us with administrative services and we pay our administrator at cost our allocable portion of overhead and other expenses (including travel expenses) incurred by our administrator in performing its obligations under our administration agreement, including our allocable portion of the cost of certain of our officers (including our chief compliance officer, chief financial officer, chief accounting officer, general counsel, treasurer and assistant treasurer) and their respective staffs, but not investment professionals.
37
Our portfolio company, IHAM, is party to an administration agreement, referred to herein as the “IHAM administration agreement,” with Ares Operations. Pursuant to the IHAM administration agreement, our administrator provides IHAM with administrative services and IHAM reimburses our administrator for all of the actual costs associated with such services, including its allocable portion of our administrator’s overhead and the cost of our administrator’s officers and respective staff in performing its obligations under the IHAM administration agreement. Prior to entering into the IHAM administration agreement, IHAM was party to a services agreement with our investment adviser, pursuant to which our investment adviser provided similar services.
As a result of the arrangements described above, there may be times when the management team of Ares Management (including those members of management focused primarily on managing Ares Capital) has interests that differ from those of yours, giving rise to a conflict.
Our stockholders may have conflicting investment, tax and other objectives with respect to their investments in us. The conflicting interests of individual stockholders may relate to or arise from, among other things, the nature of our investments, the structure or the acquisition of our investments, and the timing of dispositions of our investments. As a consequence, conflicts of interest may arise in connection with decisions made by our investment adviser, including with respect to the nature or structuring of our investments, that may be more beneficial for one stockholder than for another stockholder, especially with respect to stockholders’ individual tax situations. In selecting and structuring investments appropriate for us, our investment adviser will consider the investment and tax objectives of the Company and our stockholders, as a whole, not the investment, tax or other objectives of any stockholder individually.
We are dependent on information systems and systems failures could significantly disrupt our business, which may, in turn, negatively affect our liquidity, financial condition or results of operations.
Our business is dependent on our and third parties’ communications and information systems. Further, in the ordinary course of our business we or our investment adviser may engage certain third party service providers to provide us with services necessary for our business. Any failure or interruption of those systems or services, including as a result of the termination or suspension of an agreement with any third-party service providers, could cause delays or other problems in our business activities. Our financial, accounting, data processing, backup or other operating systems and facilities may fail to operate properly or become disabled or damaged as a result of a number of factors including events that are wholly or partially beyond our control and adversely affect our business. There could be:
• | sudden electrical or telecommunications outages; |
• | natural disasters such as earthquakes, tornadoes and hurricanes; |
• | disease pandemics; |
• | events arising from local or larger scale political or social matters, including terrorist acts; and |
• | cyber-attacks. |
These events, in turn, could have a material adverse effect on our business, financial condition and operating results and negatively affect the market price of our common stock and our ability to pay dividends to our stockholders.
Cybersecurity risks and cyber incidents may adversely affect our business by causing a disruption to our operations, a compromise or corruption of our confidential information and/or damage to our business relationships, all of which could negatively impact our business, financial condition and operating results.
A cyber incident is considered to be any adverse event that threatens the confidentiality, integrity or availability of our information resources. These incidents may be an intentional attack or an unintentional event and could involve gaining unauthorized access to our information systems for purposes of misappropriating assets, stealing confidential information, corrupting data or causing operational disruption. The result of these incidents may include disrupted operations, misstated or unreliable financial data, liability for stolen assets or information, increased cybersecurity protection and insurance costs, litigation and damage to our business relationships. As our reliance on technology has increased, so have the risks posed to our information systems, both internal and those provided by Ares Management and third-party service providers. Ares Management has implemented processes, procedures and internal controls to help mitigate cybersecurity risks and cyber intrusions, but these measures, as well as our increased awareness of the nature and extent of a risk of a cyber incident, do not
38
guarantee that a cyber incident will not occur and/or that our financial results, operations or confidential information will not be negatively impacted by such an incident.
Ineffective internal controls could impact our business and operating results.
Our internal control over financial reporting may not prevent or detect misstatements because of its inherent limitations, including the possibility of human error, the circumvention or overriding of controls, or fraud. Even effective internal controls can provide only reasonable assurance with respect to the preparation and fair presentation of financial statements. If we fail to maintain the adequacy of our internal controls, including any failure to implement required new or improved controls, or if we experience difficulties in their implementation, our business and operating results could be harmed and we could fail to meet our financial reporting obligations.
Changes in laws or regulations governing our operations or the operations of our portfolio companies or our SBIC subsidiary or changes in the interpretation thereof or newly enacted laws or regulations, such as the Wall Street Reform and Consumer Protection Act (the “Dodd-Frank Act”) and Public Law No. 115-97 (the “Tax Cuts and Jobs Act”), could require changes to certain business practices of us or our portfolio companies, negatively impact the operations, cash flows or financial condition of us or our portfolio companies, impose additional costs on us or our portfolio companies or otherwise adversely affect our business or the business of our portfolio companies.
We and our portfolio companies are subject to regulation by laws and regulations at the local, state, federal and, in some cases, foreign levels. These laws and regulations, as well as their interpretation, may be changed from time to time, and new laws and regulations may be enacted. Accordingly, any change in these laws or regulations, changes in their interpretation, or newly enacted laws or regulations could require changes to certain business practices of us or our portfolio companies, negatively impact the operations, cash flows or financial condition of us or our portfolio companies, impose additional costs on us or our portfolio companies or otherwise adversely affect our business or the business of our portfolio companies.
On July 21, 2010, President Obama signed into law the Dodd-Frank Act. Many of the provisions of the Dodd-Frank Act have had extended implementation periods and delayed effective dates and have required extensive rulemaking by regulatory authorities. While many of the rules required to be written have been promulgated, some have not yet been implemented. Although the full impact of the Dodd-Frank Act on us and our portfolio companies may not be known for an extended period of time, the Dodd-Frank Act, including the rules implementing its provisions and the interpretation of those rules, may negatively impact the operations, cash flows or financial condition of us or our portfolio companies, impose additional costs on us or our portfolio companies, intensify the regulatory supervision of us or our portfolio companies or otherwise adversely affect our business or the business of our portfolio companies.
Over the last several years, there also has been an increase in regulatory attention to the extension of credit outside of the traditional banking sector, raising the possibility that some portion of the non-bank financial sector will be subject to new regulation. While it cannot be known at this time whether any regulation will be implemented or what form it will take, increased regulation of non-bank credit extension could negatively impact our operating results or financial condition, impose additional costs on us, intensify the regulatory supervision of us or otherwise adversely affect our business.
On December 22, 2017, President Trump signed into law the Tax Cuts and Jobs Act, which significantly changed the Code, including, a reduction in the corporate income tax rate, a new limitation on the deductibility of interest expense, and significant changes to the taxation of income earned from foreign sources and foreign subsidiaries. The Tax Cuts and Jobs Act also authorizes the IRS to issue regulations with respect to the new provisions. We cannot predict how the changes in the Tax Cuts and Jobs Act, or regulations or other guidance issued under it, might affect us, our business or the business of our portfolio companies.
On February 3, 2017, President Trump signed Executive Order 13772 announcing the new Administration’s policy to regulate the U.S. financial system in a manner consistent with certain “Core Principles,” including regulation that is efficient, effective and appropriately tailored. The Executive Order directed the Secretary of the Treasury, in consultation with the heads of the member agencies of the Financial Stability Oversight Council, to report to the President on the extent to which existing laws, regulations and other government policies promote the Core Principles and to identify any laws, regulations or other government policies that inhibit federal regulation of the U.S. financial system. On June 12, 2017, the U.S. Department of the Treasury published the first of several reports in response to the Executive Order on the depository system covering banks and other savings institutions. On October 6, 2017, the Treasury released a second report outlining ways to streamline and reform the U.S. regulatory system for capital markets, followed by a third report, on October 26, 2017, examining the current regulatory framework for the asset management and insurance industries. Subsequent reports are expected to address: retail and
39
institutional investment products and vehicles; as well as non-bank financial institutions, financial technology, and financial innovation.
On June 8, 2017, the U. S. House of Representatives passed the Financial Choice Act, which includes legislation intended to repeal or replace substantial portions of the Dodd-Frank Act. Among other things, the proposed law would repeal the Volcker Rule limiting certain proprietary investment and trading activities by banks, eliminate the authority of regulators to designate asset managers and other large non-bank institutions as "systemically important financial institutions" or "SIFIs," and repeal the Department of Labor ("DOL") "fiduciary rule" governing standards for dealing with retirement plans until the SEC issues standards for similar dealings by broker-dealers and limiting the substance of any subsequent DOL rule to the SEC standards. The bill was referred to the Senate, where it is unlikely to pass as proposed. On November 16, 2017, a bipartisan group of U.S. Senators, led by Senate Banking Committee Chairman, introduced the Economic Growth, Regulatory Relief, and Consumer Protection Act (the "Senate Regulatory Relief Bill"). The Senate Regulatory Relief Bill would revise various post-crisis regulatory requirements and provide targeted regulatory relief to certain financial institutions. Among the most significant of its proposed amendments to the Dodd-Frank Act are a substantial increase in the $50 billion asset threshold for automatic regulation of bank holding companies as SIFIs, an exemption from the Volcker Rule for insured depository institutions with less than $10 billion in consolidated assets and lower levels of trading assets and liabilities, as well as amendments to the liquidity leverage ratio and supplementary leverage ratio requirements. On December 5, 2017, the Senate Banking Committee approved the Senate Regulatory Relief Bill. If the legislation is adopted in the Senate, it remains unclear whether and how it would be reconciled with its House-passed counterpart, the Financial Choice Act, which is substantially different in scope and substance, and ultimately approved by both chambers of Congress. At this time it is not possible to determine whether any such particular proposal will become law or its potential impact on us.
Our investment adviser’s liability is limited under the investment advisory and management agreement, and we are required to indemnify our investment adviser against certain liabilities, which may lead our investment adviser to act in a riskier manner on our behalf than it would when acting for its own account.
Our investment adviser has not assumed any responsibility to us other than to render the services described in the investment advisory and management agreement, and it will not be responsible for any action of our board of directors in declining to follow our investment adviser’s advice or recommendations. Pursuant to the investment advisory and management agreement, our investment adviser and its members and their respective officers, managers, partners, agents, employees, controlling persons and members and any other persons or entities affiliated with it will not be liable to us for their acts under the investment advisory and management agreement, absent willful misfeasance, bad faith, gross negligence or reckless disregard in the performance of their duties. We have agreed to indemnify, defend and protect our investment adviser and its members and their respective officers, managers, partners, agents, employees, controlling persons and members and any other persons or entities affiliated with it with respect to all damages, liabilities, costs and expenses arising out of or otherwise based upon the performance of any of our investment adviser’s duties or obligations under the investment advisory and management agreement or otherwise as an investment adviser for the Company, and not arising out of willful misfeasance, bad faith, gross negligence or reckless disregard in the performance of their duties under the investment advisory and management agreement. These protections may lead our investment adviser to act in a riskier manner when acting on our behalf than it would when acting for its own account. See “Risk Factors—Risks Relating to Our Investments—Our investment adviser's fee structure may induce it to make certain investments on our behalf, including speculative investments.”
We may be obligated to pay our investment adviser certain fees even if we incur a loss.
Our investment adviser is entitled to income based fees for each fiscal quarter in an amount equal to a percentage of the excess of our pre-incentive fee net investment income for that quarter (before deducting any income based fee and capital gains incentive fees and certain other items) above a threshold return for that quarter. Our pre-incentive fee net investment income for income based fee purposes excludes realized and unrealized capital losses or depreciation and income taxes related to realized gains that we may incur in the fiscal quarter, even if such capital losses or depreciation and income taxes related to realized gains result in a net loss on our statement of operations for that quarter. Thus, we may be required to pay our investment adviser income based fees for a fiscal quarter even if there is a decline in the value of our portfolio or the net asset value of our common stock or we incur a net loss for that quarter.
Under the investment advisory and management agreement, we will defer cash payment of any income based fee and the capital gains incentive fee otherwise earned by our investment adviser if, during the most recent four full calendar quarter periods ending on or prior to the date such payment is to be made, the sum of (a) our aggregate distributions to our stockholders and (b) our change in net assets (defined as total assets less indebtedness and before taking into account any income based fees or capital gains incentive fees accrued during the period) is less than 7.0% of our net assets (defined as total assets less indebtedness) at the beginning of such period. These calculations will be adjusted for any share issuances or repurchases. Any
40
such deferred fees will be carried over for payment in subsequent calculation periods to the extent such payment can then be made under the investment advisory and management agreement.
If a portfolio company defaults on a loan that is structured to provide interest, it is possible that accrued and unpaid interest previously used in the calculation of income based fees will become uncollectible. Our investment adviser is not under any obligation to reimburse us for any part of income based fees it received that was based on accrued income that we never receive.
Our SBIC subsidiary is subject to SBA regulations.
Our consolidated subsidiary, AVF LP, is a licensed SBIC and is regulated by the SBA. As of December 31, 2017, AVF LP held approximately $52 million in assets and accounted for approximately 0.4% of our total assets. AVF LP may obtain leverage by issuing the SBA Debentures. As of December 31, 2017, AVF LP had no SBA Debentures outstanding.
If AVF LP fails to comply with applicable regulations, the SBA could, depending on the severity of the violation, limit or prohibit AVF LP’s use of SBA Debentures, declare outstanding SBA Debentures immediately due and payable, and/or limit AVF LP from making new investments. In addition, the SBA could revoke or suspend AVF LP’s license for willful or repeated violation of, or willful or repeated failure to observe, any provision of the SBA or any rule or regulation promulgated thereunder. AVF LP’s status as an SBIC does not automatically assure that it will receive SBA Debenture funding. Receipt of SBA leverage funding is dependent upon whether AVF LP is and continues to be in compliance with SBA regulations and policies and whether funding is available. The amount of SBA leverage funding available to SBICs is dependent upon annual Congressional authorizations and in the future may be subject to annual Congressional appropriations. There can be no assurance that there will be sufficient debenture funding available at the times desired by AVF LP. For more information on SBA Debentures or the SBA regulations to which AVF LP is subject, see “Regulation—SBA Regulation.”
We have elected to be treated as a RIC and operate in a manner so as to qualify for the U.S. federal income tax treatment applicable to RICs. Among other things, in order to maintain our RIC status, we must distribute to our stockholders on a timely basis generally an amount equal to at least 90% of our investment company taxable income, which includes taxable income from AVF LP. AVF LP may be limited by SBA regulations from making certain distributions to us that may be necessary to timely make distributions to stockholders and to maintain our status as a RIC. Compliance with the SBA regulations may cause us to fail to qualify as a RIC and consequently result in the imposition of additional corporate‑level income taxes on us. Noncompliance with the SBA regulations may result in adverse consequences for AVF LP as described above.
RISKS RELATING TO OUR INVESTMENTS
Declines in market prices and liquidity in the corporate debt markets can result in significant net unrealized depreciation of our portfolio, which in turn would reduce our net asset value.
As a BDC, we are required to carry our investments at market value or, if no market value is ascertainable, at fair value as determined in good faith by or under the direction of our board of directors. We may take into account the following types of factors, if relevant, in determining the fair value of our investments: the enterprise value of a portfolio company (the entire value of the portfolio company to a market participant, including the sum of the values of debt and equity securities used to capitalize the enterprise at a point in time), the nature and realizable value of any collateral, the portfolio company’s ability to make payments and its earnings and discounted cash flow, the markets in which the portfolio company does business, a comparison of the portfolio company’s securities to similar publicly traded securities, changes in the interest rate environment and the credit markets generally that may affect the price at which similar investments would trade in their principal markets and other relevant factors. When an external event such as a purchase transaction, public offering or subsequent equity sale occurs, we use the pricing indicated by the external event to corroborate our valuation. While most of our investments are not publicly traded, applicable accounting standards require us to assume as part of our valuation process that our investments are sold in a principal market to market participants (even if we plan on holding an investment through its maturity). As a result, volatility in the capital markets can also adversely affect our investment valuations. Decreases in the market values or fair values of our investments are recorded as unrealized depreciation. The effect of all of these factors on our portfolio can reduce our net asset value (and, as a result our asset coverage calculation) by increasing net unrealized depreciation in our portfolio. Depending on market conditions, we could incur substantial realized losses and may suffer unrealized losses, which could have a material adverse effect on our business, financial condition or results of operations.
41
Economic recessions or downturns could impair our portfolio companies and harm our operating results.
Many of our portfolio companies may be susceptible to economic downturns or recessions and may be unable to repay our loans during these periods. Therefore, during these periods our non-performing assets may increase and the value of our portfolio may decrease if we are required to write down the values of our investments. Adverse economic conditions may also decrease the value of collateral securing some of our loans and the value of our equity investments. Economic slowdowns or recessions could lead to financial losses in our portfolio and a decrease in revenues, net income and assets. Unfavorable economic conditions also could increase our funding costs, limit our access to the capital markets or result in a decision by lenders not to extend credit to us. These events could prevent us from increasing investments and harm our operating results. We experienced to some extent such effects as a result of the economic downturn that occurred from 2008 through 2009 and may experience such effects again in any future downturn or recession.
A portfolio company’s failure to satisfy financial or operating covenants imposed by us or other lenders could lead to defaults and, potentially, acceleration of the time when the loans are due and foreclosure on its assets representing collateral for its obligations, which could trigger cross defaults under other agreements and jeopardize our portfolio company’s ability to meet its obligations under the debt that we hold and the value of any equity securities we own. We may incur expenses to the extent necessary to seek recovery upon default or to negotiate new terms with a defaulting portfolio company.
Investments in privately held middle-market companies involve significant risks.
We primarily invest in privately held U.S. middle-market companies. Investments in privately held middle-market companies involve a number of significant risks, including the following:
• | these companies may have limited financial resources and may be unable to meet their obligations, which may be accompanied by a deterioration in the value of any collateral; |
• | they typically have shorter operating histories, narrower product lines and smaller market shares than larger businesses, which tend to render them more vulnerable to competitors’ actions and market conditions, as well as general economic downturns; |
• | they typically depend on the management talents and efforts of a small group of persons; therefore, the death, disability, resignation or termination of one or more of these persons could have a material adverse effect on our portfolio company and, in turn, on us; |
• | there is generally little public information about these companies. These companies and their financial information are generally not subject to the Exchange Act (as defined below) and other regulations that govern public companies, and we may be unable to uncover all material information about these companies, which may prevent us from making a fully informed investment decision and cause us to lose money on our investments; |
• | they generally have less predictable operating results and may require substantial additional capital to support their operations, finance expansion or maintain their competitive position; |
• | we, our executive officers, directors and our investment adviser may, in the ordinary course of business, be named as defendants in litigation arising from our investments in our portfolio companies; |
• | changes in laws and regulations (including the Tax Cuts and Jobs Act), as well as their interpretations, may adversely affect their business, financial structure or prospects; and |
• | they may have difficulty accessing the capital markets to meet future capital needs. |
Our debt investments may be risky and we could lose all or part of our investment.
The debt that we invest in is typically not initially rated by any rating agency, but we believe that if such investments were rated, they would be below investment grade (rated lower than “Baa3” by Moody’s Investors Service, lower than “BBB-” by Fitch Ratings or lower than “BBB-” by Standard & Poor’s Ratings Services), which under the guidelines established by these entities is an indication of having predominantly speculative characteristics with respect to the issuer’s capacity to pay interest and repay principal. Bonds that are rated below investment grade are sometimes referred to as “high yield bonds” or “junk bonds.” Therefore, our investments may result in an above average amount of risk and volatility or loss of principal. While the debt we invest in is often secured, such security does not guarantee that we will receive principal and interest
42
payments according to the terms of the loan, or that the value of any collateral will be sufficient to allow us to recover all or a portion of the outstanding amount of the loan should we be forced to enforce our remedies.
We also may invest in assets other than first and second lien and mezzanine debt investments, including high-yield securities, U.S. government securities, credit derivatives and other structured securities and certain direct equity investments. These investments entail additional risks that could adversely affect our investment returns.
Investments in equity securities, many of which are illiquid with no readily available market, involve a substantial degree of risk.
We may purchase common and other equity securities. Although common stock has historically generated higher average total returns than fixed income securities over the long-term, common stock also has experienced significantly more volatility in those returns. The equity securities we acquire may fail to appreciate and may decline in value or become worthless and our ability to recover our investment will depend on the underlying portfolio company’s success. Investments in equity securities involve a number of significant risks, including:
• | any equity investment we make in a portfolio company could be subject to further dilution as a result of the issuance of additional equity interests and to serious risks as a junior security that will be subordinate to all indebtedness (including trade creditors) or senior securities in the event that the issuer is unable to meet its obligations or becomes subject to a bankruptcy process; |
• | to the extent that the portfolio company requires additional capital and is unable to obtain it, we may not recover our investment; and |
• | in some cases, equity securities in which we invest will not pay current dividends, and our ability to realize a return on our investment, as well as to recover our investment, will be dependent on the success of the portfolio company. Even if the portfolio company is successful, our ability to realize the value of our investment may be dependent on the occurrence of a liquidity event, such as a public offering or the sale of the portfolio company. It is likely to take a significant amount of time before a liquidity event occurs or we can otherwise sell our investment. In addition, the equity securities we receive or invest in may be subject to restrictions on resale during periods in which it could be advantageous to sell them. |
There are special risks associated with investing in preferred securities, including:
• | preferred securities may include provisions that permit the issuer, at its discretion, to defer distributions for a stated period without any adverse consequences to the issuer. If we own a preferred security that is deferring its distributions, we may be required to report income for tax purposes before we receive such distributions; |
• | preferred securities are subordinated to debt in terms of priority to income and liquidation payments, and therefore will be subject to greater credit risk than debt; |
• | preferred securities may be substantially less liquid than many other securities, such as common stock or U.S. government securities; and |
• | generally, preferred security holders have no voting rights with respect to the issuing company, subject to limited exceptions. |
Additionally, when we invest in first lien senior secured loans (including unitranche loans), second lien senior secured loans or mezzanine debt, we may acquire warrants or other equity securities as well. Our goal is ultimately to dispose of such equity interests and realize gains upon our disposition of such interests. However, the equity interests we receive may not appreciate in value and, in fact, may decline in value. Accordingly, we may not be able to realize gains from our equity interests and any gains that we do realize on the disposition of any equity interests may not be sufficient to offset any other losses we experience.
We may invest, to the extent permitted by law, in the equity securities of investment funds that are operating pursuant to certain exceptions to the Investment Company Act and in advisers to similar investment funds and, to the extent we so invest, will bear our ratable share of any such company’s expenses, including management and performance fees. We will also remain obligated to pay the base management fee, income based fee and capital gains incentive fee to our investment adviser with respect to the assets invested in the securities and instruments of such companies. With respect to each of these
43
investments, each of our common stockholders will bear his or her share of the base management fee, income based fee and capital gains incentive fee due to our investment adviser as well as indirectly bearing the management and performance fees and other expenses of any such investment funds or advisers.
Also, as a result of the American Capital Acquisition, American Capital’s equity investments, including equity investments pursuant to which American Capital controlled a particular portfolio company, became part of our portfolio. We intend to actively seek opportunities over time to dispose of certain of these investments and rotate them into yielding assets consistent with our investment policy. However, there can be no assurance that this strategy will be successful.
There may be circumstances in which our debt investments could be subordinated to claims of other creditors or we could be subject to lender liability claims.
If one of our portfolio companies were to go bankrupt, even though we may have structured our interest as senior debt, depending on the facts and circumstances, a bankruptcy court might recharacterize our debt holding as an equity investment and subordinate all or a portion of our claim to that of other creditors. In addition, lenders can be subject to lender liability claims for actions taken by them where they become too involved in the borrower’s business or exercise control over the borrower. For example, we could become subject to a lender’s liability claim, if, among other things, we actually render significant managerial assistance.
Our portfolio companies may incur debt or issue equity securities that rank equally with, or senior to, our investments in such companies.
Our portfolio companies may have, or may be permitted to incur, other debt, or issue other equity securities, that rank equally with, or senior to, our investments. By their terms, such instruments may provide that the holders are entitled to receive payment of dividends, interest or principal on or before the dates on which we are entitled to receive payments in respect of our investments. These debt instruments would usually prohibit the portfolio companies from paying interest on or repaying our investments in the event and during the continuance of a default under such debt. Also, in the event of insolvency, liquidation, dissolution, reorganization or bankruptcy of a portfolio company, holders of securities ranking senior to our investment in that portfolio company typically are entitled to receive payment in full before we receive any distribution in respect of our investment. After repaying such holders, the portfolio company may not have any remaining assets to use for repaying its obligation to us. In the case of securities ranking equally with our investments, we would have to share on an equal basis any distributions with other security holders in the event of an insolvency, liquidation, dissolution, reorganization or bankruptcy of the relevant portfolio company.
The rights we may have with respect to the collateral securing any junior priority loans we make to our portfolio companies may also be limited pursuant to the terms of one or more intercreditor agreements (including agreements governing “first out” and “last out” structures) that we enter into with the holders of senior debt. Under such an intercreditor agreement, at any time that senior obligations are outstanding, we may forfeit certain rights with respect to the collateral to the holders of the senior obligations. These rights may include the right to commence enforcement proceedings against the collateral, the right to control the conduct of such enforcement proceedings, the right to approve amendments to collateral documents, the right to release liens on the collateral and the right to waive past defaults under collateral documents. We may not have the ability to control or direct such actions, even if as a result our rights as junior lenders are adversely affected.
When we are a debt or minority equity investor in a portfolio company, we are often not in a position to exert influence on the entity, and other equity holders and management of the company may make decisions that could decrease the value of our investment in such portfolio company.
When we make debt or minority equity investments, we are subject to the risk that a portfolio company may make business decisions with which we disagree and the other equity holders and management of such company may take risks or otherwise act in ways that do not serve our interests. As a result, a portfolio company may make decisions that could decrease the value of our investment.
Our portfolio companies may be highly leveraged.
Some of our portfolio companies may be highly leveraged, which may have adverse consequences to these companies and to us as an investor. These companies may be subject to restrictive financial and operating covenants and the leverage may impair these companies’ ability to finance their future operations and capital needs. As a result, these companies’ flexibility to respond to changing business and economic conditions and to take advantage of business opportunities may be limited. Further,
44
a leveraged company’s income and net assets will tend to increase or decrease at a greater rate than if borrowed money were not used.
Our investment adviser's fee structure may induce it to make certain investments on our behalf, including speculative investments.
The fees payable by us to our investment adviser may create an incentive for our investment adviser to make investments on our behalf that are risky or more speculative than would be the case in the absence of such compensation arrangement. The way in which income based fees payable to our investment adviser are determined, which are calculated as a percentage of the return on invested capital, may encourage our investment adviser to use leverage to increase the return on our investments. Under certain circumstances, the use of leverage may increase the likelihood of default, which would disfavor the holders of our common stock and the holders of securities convertible into our common stock. In addition, our investment adviser will receive the capital gains incentive fee based, in part, upon net capital gains realized on our investments. Unlike income based fees, there is no hurdle rate applicable to the capital gains incentive fee. As a result, our investment adviser may have a tendency to invest more in investments that are likely to result in capital gains as compared to income producing securities. Such a practice could result in our investing in more speculative securities than would otherwise be the case, which could result in higher investment losses, particularly during economic downturns.
The income based fees will be computed and paid on income that has been accrued but not yet received in cash, including as a result of investments with a deferred interest feature such as debt instruments with PIK interest, preferred stock with PIK dividends and zero coupon securities. If a portfolio company defaults on a loan that is structured to provide accrued interest, it is possible that accrued interest previously used in the calculation of the income based fee will become uncollectible. Our investment adviser is not under any obligation to reimburse us for any part of the fees it received that were based on such accrued interest that we never actually received.
Because of the structure of the income based fees, it is possible that we may have to pay income based fees in a quarter during which we incur a loss. For example, if we receive pre-incentive fee net investment income in excess of the hurdle rate for a quarter, we will pay the applicable income based fees even if we have incurred a loss in that quarter due to realized and/or unrealized capital losses. In addition, if market interest rates rise, our investment adviser may be able to invest our funds in debt instruments that provide for a higher return, which would increase our pre-incentive fee net investment income and make it easier for our investment adviser to surpass the fixed hurdle rate and receive income based fees.
Our investments in foreign companies may involve significant risks in addition to the risks inherent in U.S. investments.
Our investment strategy contemplates potential investments in foreign companies. Investing in foreign companies may expose us to additional risks not typically associated with investing in U.S. companies. These risks include changes in exchange control regulations, political and social instability, expropriation, imposition of foreign taxes (potentially at confiscatory levels), less liquid markets, less available information than is generally the case in the United States, higher transaction costs, less government supervision of exchanges, brokers and issuers, less developed bankruptcy laws, difficulty in enforcing contractual obligations, lack of uniform accounting and auditing standards and greater price volatility.
Although we expect most of our investments will be U.S. dollar denominated, our investments that are denominated in a foreign currency will be subject to the risk that the value of a particular currency will change in relation to one or more other currencies. Among the factors that may affect currency values are trade balances, the level of short-term interest rates, differences in relative values of similar assets in different currencies, long-term opportunities for investment and capital appreciation and political developments. We may employ hedging techniques to minimize these risks, but we cannot assure you that such strategies will be effective or without risk to us.
We may expose ourselves to risks if we engage in hedging transactions.
We have and may in the future enter into hedging transactions, which may expose us to risks associated with such transactions. We may utilize instruments such as forward contracts, currency options and interest rate swaps, caps, collars and floors to seek to hedge against fluctuations in the relative values of our portfolio positions from changes in currency exchange rates and market interest rates. Use of these hedging instruments may include counter-party credit risk.
Hedging against a decline in the values of our portfolio positions does not eliminate the possibility of fluctuations in the values of such positions or prevent losses if the values of such positions decline. However, such hedging can establish other positions designed to gain from those same developments, thereby offsetting the decline in the value of such portfolio positions. Such hedging transactions may also limit the opportunity for gain if the values of the underlying portfolio positions should
45
increase. Moreover, it may not be possible to hedge against an exchange rate or interest rate fluctuation that is so generally anticipated that we are not able to enter into a hedging transaction at an acceptable price.
The success of our hedging transactions will depend on our ability to correctly predict movements in currencies and interest rates. Therefore, while we may enter into such transactions to seek to reduce currency exchange rate and interest rate risks, unanticipated changes in currency exchange rates or interest rates may result in poorer overall investment performance than if we had not engaged in any such hedging transactions. In addition, the degree of correlation between price movements of the instruments used in a hedging strategy and price movements in the portfolio positions being hedged may vary. Moreover, for a variety of reasons, we may not seek to (or be able to) establish a perfect correlation between such hedging instruments and the portfolio holdings being hedged. Any such imperfect correlation may prevent us from achieving the intended hedge and expose us to risk of loss. In addition, it may not be possible to hedge fully or perfectly against currency fluctuations affecting the value of securities denominated in non-U.S. currencies because the value of those securities is likely to fluctuate as a result of factors not related to currency fluctuations. See also “Risk Factors—Risks Relating to Our Business—We are exposed to risks associated with changes in interest rates.”
RISKS RELATING TO OUR COMMON STOCK AND PUBLICLY TRADED NOTES
Our shares of common stock have traded at a discount from net asset value and may do so again, which could limit our ability to raise additional equity capital.
Shares of closed‑end investment companies frequently trade at a market price that is less than the net asset value that is attributable to those shares. This characteristic of closed‑end investment companies is separate and distinct from the risk that our net asset value per share may decline. It is not possible to accurately predict whether any shares of our common stock will trade at, above, or below net asset value. In the recent past, the stocks of BDCs as an industry, including at times shares of our common stock, have traded below net asset value and during much of 2009 traded at near historic lows as a result of concerns over liquidity, leverage restrictions and distribution requirements. When our common stock is trading below its net asset value per share, we will generally not be able to issue additional shares of our common stock at its market price without first obtaining approval for such issuance from our stockholders and our independent directors. Pursuant to approval granted at a special meeting of stockholders held on May 22, 2017, we currently are permitted to sell or otherwise issue shares of our common stock at a price below net asset value, subject to certain limitations and determinations that must be made by our board of directors. Such stockholder approval expires on May 22, 2018.
There is a risk that investors in our common stock may not receive dividends or that our dividends may not grow over time and that investors in our debt securities may not receive all of the interest income to which they are entitled.
We intend to make distributions on a quarterly basis to our stockholders out of assets legally available for distribution. We cannot assure you that we will achieve investment results that will allow us to make a specified level of cash distributions or year-to-year increases in cash distributions. If we declare a dividend and if more stockholders opt to receive cash distributions rather than participate in our dividend reinvestment plan, we may be forced to sell some of our investments in order to make cash dividend payments.
In addition, due to the asset coverage test applicable to us as a BDC, we may be limited in our ability to make distributions. Certain of the Facilities may also limit our ability to declare dividends if we default under certain provisions. Further, if we invest a greater amount of assets in non-income producing securities, it could reduce the amount available for distribution and may also inhibit our ability to make required interest payments to holders of our debt, which may cause a default under the terms of our debt agreements. Such a default could materially increase our cost of raising capital, as well as cause us to incur penalties under the terms of our debt agreements. See "Market For Registrant's Common Equity, Related Stockholder Matters And Issuer Purchases Of Equity Securities-Dividend/Distribution Policy."
Provisions of the Maryland General Corporation Law and of our charter and bylaws could deter takeover attempts and have an adverse effect on the price of our common stock.
The Maryland General Corporation Law, our charter and our bylaws contain provisions that may discourage, delay or make more difficult a change in control of Ares Capital or the removal of our directors. We are subject to the Maryland Business Combination Act (the “Business Combination Act”), subject to any applicable requirements of the Investment Company Act. Our board of directors has adopted a resolution exempting from the Business Combination Act any business combination between us and any other person, subject to prior approval of such business combination by our board, including approval by a majority of our disinterested directors. If the resolution exempting business combinations is repealed or our board or disinterested directors do not approve a business combination, the Business Combination Act may discourage third parties
46
from trying to acquire control of us and may increase the difficulty of consummating such an offer. Our bylaws exempt from the Maryland Control Share Acquisition Act (the “Control Share Acquisition Act”) acquisitions of our stock by any person. If we amend our bylaws to repeal the exemption from the Control Share Acquisition Act, subject to any applicable requirements of the Investment Company Act, the Control Share Acquisition Act also may make it more difficult for a third party to obtain control of us and may increase the difficulty of consummating such an offer.
We have also adopted measures that may make it difficult for a third party to obtain control of us, including provisions of our charter classifying our board of directors into three classes serving staggered three-year terms, and provisions of our charter authorizing our board of directors to classify or reclassify shares of our stock into one or more classes or series, to cause the issuance of additional shares of our stock, and to amend our charter from time to time, without stockholder approval, to increase or decrease the aggregate number of shares of stock or the number of shares of stock of any class or series that we have authority to issue. These provisions, as well as other provisions of our charter and bylaws, may discourage, delay, defer, make more difficult or prevent a transaction or a change in control that might otherwise be in your best interest.
Investing in our common stock may involve an above average degree of risk.
The investments we make in accordance with our investment objective may result in a higher amount of risk than alternative investment options and volatility or loss of principal. Our investments in portfolio companies may be highly speculative and aggressive and, therefore, an investment in our securities may not be suitable for someone with lower risk tolerance.
The market price of our common stock may fluctuate significantly.
The capital and credit markets have experienced periods of extreme volatility and disruption over the past several years. The market price and liquidity of the market for shares of our common stock may be significantly affected by numerous factors, some of which are beyond our control and may not be directly related to our operating performance. These factors include:
• | significant volatility in the market price and trading volume of securities of publicly traded RICs, BDCs or other companies in our sector, which are not necessarily related to the operating performance of these companies; |
• | price and volume fluctuations in the overall stock market from time to time; |
• | the inclusion or exclusion of our common stock from certain indices; |
• | changes in law, regulatory policies or tax guidelines, or interpretations thereof, particularly with respect to RICs or BDCs; |
• | loss of our RIC status; |
• | our ability to manage our capital resources effectively, including rotating out of certain investments acquired in connection with the American Capital Acquisition and re-deploying such capital effectively and on favorable terms; |
• | changes in our earnings or variations in our operating results; |
• | changes in the value of our portfolio of investments; |
• | any shortfall in revenue or net income or any increase in losses from levels expected by investors or securities analysts; |
• | departure of Ares’ key personnel; |
• | operating performance of companies comparable to us; |
• | short-selling pressure with respect to shares of our common stock or BDCs generally; |
• | future sales of our securities convertible into or exchangeable or exercisable for our common stock or the conversion of such securities, including the Convertible Unsecured Notes; |
47
• | uncertainty surrounding the strength of the U.S. economy; |
• | concerns regarding European sovereign debt; |
• | concerns regarding volatility in the Chinese stock market and Chinese currency; |
• | general economic trends and other external factors; and |
• | loss of a major funding source. |
In the past, following periods of volatility in the market price of a company’s securities, securities class action litigation has often been brought against that company. If our stock price fluctuates significantly, we may be the target of securities litigation in the future. Securities litigation could result in substantial costs and divert management’s attention and resources from our business.
We may in the future determine to issue preferred stock, which could adversely affect the market value of our common stock.
The issuance of shares of preferred stock with dividend or conversion rights, liquidation preferences or other economic terms favorable to the holders of preferred stock could adversely affect the market price for our common stock by making an investment in the common stock less attractive. In addition, the dividends on any preferred stock we issue must be cumulative. Payment of dividends and repayment of the liquidation preference of preferred stock must take preference over any dividends or other payments to our common stockholders, and holders of preferred stock are not subject to any of our expenses or losses and are not entitled to participate in any income or appreciation in excess of their stated preference (other than convertible preferred stock that converts into common stock). In addition, under the Investment Company Act, preferred stock constitutes a “senior security” for purposes of the 200% asset coverage test.
The net asset value per share of our common stock may be diluted if we sell shares of our common stock in one or more offerings at prices below the then current net asset value per share of our common stock or securities to subscribe for or convertible into shares of our common stock.
At a special meeting of stockholders held on May 22, 2017, subject to certain determinations required to be made by our board of directors, our stockholders approved our ability to sell or otherwise issue shares of our common stock, in an amount not exceeding 25% of our then outstanding common stock, at a price below the then current net asset value per share during a period that began on May 22, 2017 and expires on May 22, 2018.
In addition, at our 2009 annual stockholders meeting, our stockholders approved a proposal authorizing us to sell or otherwise issue warrants or securities to subscribe for or convertible into shares of our common stock subject to certain limitations (including, without limitation, that the number of shares issuable does not exceed 25% of our then outstanding common stock and that the exercise or conversion price thereof is not, at the date of issuance, less than the greater of the market value per share and the net asset value per share of our common stock). The authorization granted to sell or issue warrants or securities to subscribe for or convertible into shares of our common stock has no expiration.
Any decision to sell shares of our common stock below its then current net asset value per share or securities to subscribe for or convertible into shares of our common stock would be subject to the determination by our board of directors that such issuance is in our and our stockholders’ best interests.
If we were to sell shares of our common stock below its then current net asset value per share, such sales would result in an immediate dilution to the net asset value per share of our common stock. This dilution would occur as a result of the sale of shares at a price below the then current net asset value per share of our common stock and a proportionately greater decrease in the stockholders’ interest in our earnings and assets and their voting interest in us than the increase in our assets resulting from such issuance. Because the number of shares of common stock that could be so issued and the timing of any issuance is not currently known, the actual dilutive effect cannot be predicted.
In addition, if we issue warrants or securities to subscribe for or convertible into shares of our common stock, subject to certain limitations, the exercise or conversion price per share could be less than net asset value per share at the time of exercise or conversion (including through the operation of anti‑dilution protections). Because we would incur expenses in connection with any issuance of such securities, such issuance could result in a dilution of the net asset value per share at the
48
time of exercise or conversion. This dilution would include reduction in net asset value per share as a result of the proportionately greater decrease in the stockholders’ interest in our earnings and assets and their voting interest than the increase in our assets resulting from such issuance.
Further, if current stockholders of the Company do not purchase any shares to maintain their percentage interest, regardless of whether such offering is above or below the then current net asset value per share, their voting power will be diluted.
Our stockholders will experience dilution in their ownership percentage if they opt out of our dividend reinvestment plan.
All dividends declared in cash payable to stockholders that are participants in our dividend reinvestment plan are automatically reinvested in shares of our common stock. As a result, our stockholders that opt out of our dividend reinvestment plan will experience dilution in their ownership percentage of our common stock over time.
Our stockholders may experience dilution upon the conversion of the Convertible Unsecured Notes.
The 2019 Convertible Notes are convertible into shares of our common stock beginning on July 15, 2018 or, under certain circumstances, earlier. The 2022 Convertible Notes are convertible into shares of our common stock beginning on August 1, 2021 or, under certain circumstances, earlier. Upon conversion of the other Convertible Unsecured Notes, we have the choice to pay or deliver, as the case may be, at our election, cash, shares of our common stock or a combination of cash and shares of our common stock. As of December 31, 2017, the conversion price of the 2019 Convertible Notes was effectively $19.99 per share and the conversion price of the 2022 Convertible Notes was effectively $19.39 per share, in each case taking into account certain de minimis adjustments that will be made on the conversion date and subject to further adjustment in certain circumstances. If we elect to deliver shares of common stock upon a conversion at the time our tangible book value per share exceeds the conversion price in effect at such time, our stockholders may incur dilution. In addition, our stockholders will experience dilution in their ownership percentage of common stock upon our issuance of common stock in connection with the conversion of the Convertible Unsecured Notes and any dividends paid on our common stock will also be paid on shares issued in connection with such conversion after such issuance.
Our stockholders may receive shares of our common stock as dividends, which could result in adverse cash flow consequences to them.
In order to satisfy the Annual Distribution Requirement applicable to RICs, we have the ability to declare a large portion of a dividend in shares of our common stock instead of in cash. As long as a portion of such dividend is paid in cash (which portion could be as low as 20%) and certain requirements are met, the entire distribution would be treated as a dividend for U.S. federal income tax purposes. As a result, a stockholder would be taxed on 100% of the fair market value of the shares received as part of the dividend on the date a stockholder received it in the same manner as a cash dividend, even though most of the dividend was paid in shares of our common stock.
Sales of substantial amounts of our common stock in the public market may have an adverse effect on the market price of our common stock.
Sales of substantial amounts of our common stock, or the availability of such common stock for sale (including as a result of the conversion of our Convertible Unsecured Notes into common stock), could adversely affect the prevailing market prices for our common stock. If this occurs and continues, it could impair our ability to raise additional capital through the sale of securities should we desire to do so.
The trading market or market value of our publicly issued debt securities may fluctuate.
Our publicly issued debt securities may or may not have an established trading market. We cannot assure holders of our debt securities that a trading market for our publicly issued debt securities will ever develop or be maintained if developed. In addition to our creditworthiness, many factors may materially adversely affect the trading market for, and market value of, our publicly issued debt securities. These factors include, but are not limited to, the following:
• | the time remaining to the maturity of these debt securities; |
• | the outstanding principal amount of debt securities with terms identical to these debt securities; |
49
• | the ratings assigned by national statistical ratings agencies; |
• | the general economic environment; |
• | the supply of such debt securities trading in the secondary market, if any; |
• | the redemption or repayment features, if any, of these debt securities; |
• | the level, direction and volatility of market interest rates generally; and |
• | market rates of interest higher or lower than rates borne by the debt securities. |
Holders of our debt securities should also be aware that there may be a limited number of buyers if and when they decide to sell their debt securities. This too may materially adversely affect the market value of the debt securities or the trading market for the debt securities.
Terms relating to redemption may materially adversely affect our noteholders’ return on any debt securities that we may issue.
If our noteholders’ debt securities are redeemable at our option, we may choose to redeem their debt securities at times when prevailing interest rates are lower than the interest rate paid on their debt securities. In addition, if our noteholders’ debt securities are subject to mandatory redemption, we may be required to redeem their debt securities also at times when prevailing interest rates are lower than the interest rate paid on their debt securities. In this circumstance, our noteholders may not be able to reinvest the redemption proceeds in a comparable security at an effective interest rate as high as their debt securities being redeemed.
Our credit ratings may not reflect all risks of an investment in our debt securities.
Our credit ratings are an assessment by third parties of our ability to pay our obligations. Consequently, real or anticipated changes in our credit ratings will generally affect the market value of our debt securities. Our credit ratings, however, may not reflect the potential impact of risks related to market conditions generally or other factors discussed above on the market value of or trading market for the publicly issued debt securities.
Item 1B. Unresolved Staff Comments
None.
Item 2. Properties
We do not own any real estate or other physical properties materially important to our operation. Our headquarters are currently located at 245 Park Avenue, 44th Floor, New York, New York 10167. We are party to office leases pursuant to which we are leasing office facilities from third parties. For certain of these office leases, we have also entered into separate subleases with Ares Management LLC and IHAM, pursuant to which Ares Management LLC, the sole member of Ares Capital Management, and IHAM sublease a portion of these leases. Ares Management LLC has also entered into separate subleases with us, pursuant to which we sublease certain office spaces from Ares Management LLC.
Item 3. Legal Proceedings
We are party to certain lawsuits in the normal course of business. In addition, American Capital and Allied Capital were involved in various legal proceedings that we assumed in connection with the American Capital Acquisition and the Allied Acquisition, respectively. Furthermore, third parties may try to seek to impose liability on us in connection with our activities or the activities of our portfolio companies. While the outcome of any such legal proceedings cannot at this time be predicted with certainty, we do not expect that these legal proceedings will materially affect our business, financial condition or results of operations.
On May 20, 2013, we were named as one of several defendants in an action filed in the United States District Court for the Eastern District of Pennsylvania by the bankruptcy trustee of DSI Renal Holdings LLC (“DSI Renal”) and two affiliate companies. On March 17, 2014, the motion by us and the other defendants to transfer the case to the United States District Court for the District of Delaware (the “Delaware Court”) was granted. On May 6, 2014, the Delaware Court referred the
50
matter to the United States Bankruptcy Court for the District of Delaware (the “Bankruptcy Court”). The complaint alleges, among other things, that each of the named defendants participated in a purported fraudulent transfer involving the restructuring of a subsidiary of DSI Renal. Among other things, the complaint seeks, jointly and severally from all defendants, (1) damages of approximately $425 million, of which the complaint states our individual share is approximately $117 million, and (2) punitive damages. The defendants filed a motion to dismiss all claims on August 5, 2013. On July 20, 2017, the Bankruptcy Court issued an order granting the motion to dismiss certain claims and denying the motion to dismiss certain other claims, including the purported fraudulent transfer claims. The defendants answered the complaint on August 31, 2017. Under the operative scheduling order, discovery will continue until early 2019 with dispositive motions due on April 30, 2019. No trial date has been set. We are currently unable to assess with any certainty whether we may have any exposure in this matter. However, we believe the plaintiff’s claims are without merit and intend to vigorously defend ourselves in this matter.
On or about February 10, 2017, shareholders of American Capital filed a second consolidated amended putative shareholder class action complaint allegedly on behalf of holders of the common stock of American Capital against the former members of American Capital’s board of directors and certain former American Capital officers (collectively, “the American Capital defendants”), as well as Elliott Management Corporation, Elliott Associates, L.P., Elliott International, L.P. and Elliott International Capital Advisors Inc. (collectively “Elliott”) in the Circuit Court for Montgomery County, Maryland challenging the American Capital Acquisition. This action is a consolidation of putative shareholder complaints filed against the directors of American Capital on June 24, 2016, July 12, 2016, July 21, 2016 and July 27, 2016, which were consolidated and in which an amended consolidated putative shareholder class action complaint was filed on August 18, 2016. The action alleges that the directors, officers and Elliott failed to adequately discharge their fiduciary duties to the public shareholders of American Capital by hastily commencing a sales process due to the board’s manipulation by Elliott. In the alternative, the complaint alleges Elliott aided and abetted breaches of fiduciary duty by the American Capital directors and officers. The complaint also alleges that the directors and officers failed to obtain for the shareholders the highest value available in the marketplace for their shares in the American Capital Acquisition. The complaint further alleges that the merger was the product of a flawed process due to Elliott’s continued manipulation, the use of deal protection devices in the American Capital Acquisition that precluded other bidders from making a higher offer to American Capital and the directors’ conflicts of interest due to special benefits, including the full vesting of American Capital stock options and incentive awards or golden parachutes the directors received upon consummation of the proposed merger. Additionally, the complaint alleges that the registration statement, which was filed with the SEC on July 20, 2016 and included a joint proxy statement to American Capital’s shareholders, is materially false and misleading because it omits material information concerning the financial and procedural fairness of the American Capital Acquisition. The complaint seeks to recover compensatory damages for all losses resulting from the alleged breaches of fiduciary duty and waste. The American Capital defendants filed their motion to dismiss the second consolidated amended complaint on March 3, 2017. Elliott filed its motion to dismiss the second consolidated amended complaint on April 14, 2017. Briefing on defendants’ motions was completed on May 26, 2017. A hearing on the motions to dismiss was scheduled for June 9, 2017 before Judge Ronald Rubin of the Circuit Court for Montgomery County, Maryland (the “Court”); however, that hearing was stayed as to the American Capital defendants in light of the settlement described below.
On June 9, 2017, the American Capital defendants reached an agreement in principle with plaintiffs regarding the proposed settlement of claims asserted against them in this action, and the American Capital defendants and plaintiffs subsequently executed a settlement term sheet (the “Term Sheet”) on June 19, 2017. As set forth in the Term Sheet, the American Capital defendants have agreed to the proposed settlement solely to eliminate the burden, expense, distraction and uncertainties inherent in further litigation, and without admitting any liability or wrongdoing. The plaintiffs and American Capital defendants filed a stipulation of settlement and motion for preliminary approval of the settlement with the Court on August 3, 2017. On August 23, 2017, the Court entered an order preliminarily approving the settlement. On August 28, 2017, Elliott filed a cross claim against the American Capital defendants asserting claims for contribution, although the cross claim would not have been expected to result in any additional monetary liability for the American Capital defendants or American Capital.
On October 11, 2017, the plaintiffs and Elliott advised the Court that they reached an agreement in principle to settle the remaining claims in the case, which would also resolve the cross claims against the American Capital defendants. Both the American Capital defendant settlement and Elliott settlement are subject to Court approval. The parties filed a joint stipulation on or about November 17, 2017, notice was sent to stockholders on December 18, 2017, and a final approval hearing to approve the settlements is scheduled for February 16, 2018. If both settlements are approved, then the case will be dismissed in its entirety.
There can be no assurance that the Court will approve the proposed settlements. The proposed settlement by the American Capital defendants is not, and should not be construed as, an admission of wrongdoing or liability by any American Capital defendant.
51
On August 3, 2017, American Capital and one of its former portfolio companies were awarded a judgment plus prejudgment interest by the United States District Court for the District of Maryland (the “District Court”) following a bench trial in a case first filed by one of American Capital’s insurance companies concerning coverage for bodily injury claims against American Capital and/or its former portfolio company. The District Court found that the carrier breached its duty to defend American Capital and its former portfolio company against more than 1,000 bodily injury claims and awarded damages plus prejudgment interest. American Capital’s carrier filed a notice of appeal to the United States Court of Appeals for the Fourth Circuit; thereafter, American Capital and its former portfolio company filed a notice of cross appeal. The parties are now in the process of filing their respective briefs in the appeal, which will be fully briefed by late April 2018. It is currently expected the appeal will be adjudicated in late 2018 at the earliest. American Capital’s recovery will not be known until such time as the appeal is resolved.
Item 4. Mine Safety Disclosures
Not applicable.
52
PART II
Item 5. Market for Registrant’s Common Equity, Related Stockholder Matters and Issuer Purchases of Equity Securities
PRICE RANGE OF COMMON STOCK
Our common stock is traded on The NASDAQ Global Select Market under the symbol “ARCC.” Our common stock has historically traded at prices both above and below our net asset value per share. It is not possible to predict whether our common stock will trade at, above or below net asset value. See “Risk Factors—Risks Relating to Our Common Stock—Our shares of common stock have traded at a discount from net asset value and may do so again, which could limit our ability to raise additional equity capital.”
The following table sets forth the net asset value per share of our common stock, the range of high and low closing sales prices of our common stock as reported on The NASDAQ Global Select Market and the dividends or distributions paid by us in each fiscal quarter for the years ended December 31, 2017 and 2016. On February 8, 2018, the last reported closing sales price of our common stock on The NASDAQ Global Select Market was $15.56 per share, which represented a discount of approximately 6.5% to the net asset value per share reported by us as of December 31, 2017.
Net Asset Value(1) | Price Range | Cash Dividend Per Share(2) | |||||||||||||
High | Low | ||||||||||||||
Fiscal 2016 | |||||||||||||||
First Quarter | $ | 16.50 | $ | 14.84 | $ | 12.54 | $ | 0.38 | |||||||
Second Quarter | $ | 16.62 | $ | 15.38 | $ | 13.87 | $ | 0.38 | |||||||
Third Quarter | $ | 16.59 | $ | 16.40 | $ | 13.96 | $ | 0.38 | |||||||
Fourth Quarter | $ | 16.45 | $ | 16.86 | $ | 15.16 | $ | 0.38 | |||||||
Fiscal 2017 | |||||||||||||||
First Quarter | $ | 16.50 | $ | 17.81 | $ | 16.42 | $ | 0.38 | |||||||
Second Quarter | $ | 16.54 | $ | 17.64 | $ | 16.18 | $ | 0.38 | |||||||
Third Quarter | $ | 16.49 | $ | 16.52 | $ | 15.67 | $ | 0.38 | |||||||
Fourth Quarter | $ | 16.65 | $ | 16.61 | $ | 15.69 | $ | 0.38 | |||||||
_______________________________________________________________________________
(1) | Net asset value per share is determined as of the last day in the relevant quarter and therefore may not reflect the net asset value per share on the date of the high and low closing sales prices. The net asset values shown are based on outstanding shares at the end of the relevant quarter. |
(2) | Represents the dividend or distribution paid in the relevant quarter. |
HOLDERS
As of February 8, 2018, there were 1,557 holders of record of our common stock (including Cede & Co.).
DIVIDEND/DISTRIBUTION POLICY
We currently intend to distribute dividends or make distributions to our stockholders on a quarterly basis out of assets legally available for distribution. We may also distribute additional dividends or make additional distributions to our stockholders from time to time. Our quarterly and additional dividends or distributions, if any, will be determined by our board of directors.
53
The following table summarizes our dividends or distributions declared for the fiscal years ended December 31, 2017 and 2016:
Date Declared | Record Date | Payment Date | Amount | |||||
November 2, 2017 | December 15, 2017 | December 29, 2017 | $ | 0.38 | ||||
August 2, 2017 | September 15, 2017 | September 29, 2017 | 0.38 | |||||
May 3, 2017 | June 15, 2017 | June 30, 2017 | 0.38 | |||||
February 22, 2017 | March 15, 2017 | March 31, 2017 | 0.38 | |||||
Total declared for 2017 | $ | 1.52 | ||||||
November 2, 2016 | December 15, 2016 | December 30, 2016 | $ | 0.38 | ||||
August 3, 2016 | September 15, 2016 | September 30, 2016 | 0.38 | |||||
May 4, 2016 | June 15, 2016 | June 30, 2016 | 0.38 | |||||
February 26, 2016 | March 15, 2016 | March 31, 2016 | 0.38 | |||||
Total declared for 2016 | $ | 1.52 | ||||||
Of the $1.52 per share in dividends declared and payable for the year ended December 31, 2017, $1.45 per share was comprised of ordinary income and $0.07 was comprised of long-term capital gains. Of the $1.52 per share in dividends declared and payable for the year ended December 31, 2016, $1.26 per share was comprised of ordinary income and $0.26 was comprised of long‑term capital gains.
To maintain our RIC status under the Code, we must timely distribute an amount equal to at least 90% of our investment company taxable income (as defined by the Code, which generally includes net ordinary income and net short term capital gains) to our stockholders. In addition, we generally will be required to pay an excise tax equal to 4% on certain undistributed taxable income unless we distribute in a timely manner an amount at least equal to the sum of (i) 98% of our ordinary income recognized during a calendar year and (ii) 98.2% of our capital gain net income, as defined by the Code, recognized for the one year period ending October 31st in that calendar year and (iii) any income recognized, but not distributed, in preceding years. The taxable income on which we pay excise tax is generally distributed to our stockholders in the next tax year. Depending on the level of taxable income earned in a tax year, we may choose to carry forward such taxable income for distribution in the following year, and pay any applicable excise tax. For the years ended December 31, 2017, 2016 and 2015, we recorded a net excise tax expense of $12 million, $12 million and $9 million, respectively. We cannot assure you that we will achieve results that will permit the payment of any cash distributions. We maintain an “opt out” dividend reinvestment plan for our common stockholders. As a result, if we declare a cash dividend, stockholders’ cash dividends will be automatically reinvested in additional shares of our common stock, unless they specifically opt out of the dividend reinvestment plan so as to receive cash dividends. See “Dividend Reinvestment Plan.”
54
RECENT SALES OF UNREGISTERED EQUITY SECURITIES
We did not sell any securities during the period covered by this Annual Report that were not registered under the Securities Act of 1933.
ISSUER PURCHASES OF EQUITY SECURITIES
Dividend Reinvestment Plan
During the year ended December 31, 2017, as a part of our dividend reinvestment plan for our common stockholders, we purchased 1,237,221 shares of our common stock for an average price per share of $16.48 in the open market in order to satisfy the reinvestment portion of our dividends. The following chart outlines such purchases of our common stock during the year ended December 31, 2017.
(dollars in millions, except per share data) Period | Total Number of Shares Purchased | Average Price Paid Per Share | Total Number of Shares Purchased as Part of Publicly Announced Plans or Programs | Maximum (or Approximate Dollar Value) of Shares that May Yet Be Purchased Under the Plans or Programs | ||||||||||
January 1, 2017 through January 31, 2017 | 236,941 | $ | 16.46 | — | $ | — | ||||||||
February 1, 2017 through February 28, 2017 | — | — | — | — | ||||||||||
March 1, 2017 through March 31, 2017 | — | — | — | — | ||||||||||
April 1, 2017 through April 30, 2017 | — | — | — | — | ||||||||||
May 1, 2017 through May 31, 2017 | — | — | — | — | ||||||||||
June 1, 2017 through June 30, 2017 | — | — | — | — | ||||||||||
July 1, 2017 through July 31, 2017 | 612,744 | 16.53 | — | — | ||||||||||
August 1, 2017 through August 31, 2017 | — | — | — | — | ||||||||||
September 1, 2017 through September 30, 2017 | — | — | — | — | ||||||||||
October 1, 2017 through October 31, 2017 | 387,536 | 16.39 | — | — | ||||||||||
November 1, 2017 through November 30, 2017 | — | — | — | — | ||||||||||
December 1, 2017 through December 31, 2017 | — | — | — | — | ||||||||||
Total | 1,237,221 | $ | 16.48 | — | $ | — | ||||||||
Stock Repurchase Program
In February 2018, our board of directors authorized an amendment to our $300 million stock repurchase program to extend the expiration date of the program from February 28, 2018 to February 28, 2019. Under the program, we may repurchase up to $300 million in the aggregate of our outstanding common stock in the open market at certain thresholds below its net asset value per share, in accordance with the guidelines specified in Rule 10b-18 of the Exchange Act. The timing, manner, price and amount of any share repurchases will be determined by us, in our discretion, based upon the evaluation of economic and market conditions, stock price, applicable legal and regulatory requirements and other factors. The program will be in effect through February 28, 2019, unless extended or until the approved dollar amount has been used to repurchase shares. The program does not require us to repurchase any specific number of shares and it cannot assure stockholders that any shares will be repurchased under the program. The program may be suspended, extended, modified or discontinued at any time.
55
For the year ended December 31, 2017, there were no repurchases of our common stock under our stock repurchase program. As of December 31, 2017, the approximate dollar value of shares that may yet be purchased under the program was $293 million. For the year ended December 31, 2016, repurchases of our common stock under our stock repurchase program were as follows:
(dollars in millions, except per share data) Period | Total Number of Shares Purchased | Average Price Paid Per Share (1) | Total Number of Shares Purchased as Part of Publicly Announced Plans or Programs | Maximum (or Approximate Dollar Value) of Shares that May Yet Be Purchased Under the Plans or Programs | ||||||||||
January 1, 2016 through January 31, 2016 | — | — | — | — | ||||||||||
February 1, 2016 through February 29, 2016 | — | — | — | — | ||||||||||
March 1, 2016 through March 31, 2016 | 393,056 | $ | 13.94 | 393,056 | $ | 93 | ||||||||
April 1, 2016 through April 30, 2016 | — | — | — | — | ||||||||||
May 1, 2016 through May 31, 2016 | — | — | — | — | ||||||||||
June 1, 2016 through June 30, 2016 | — | — | — | — | ||||||||||
July 1, 2016 through July 31, 2016 | — | — | — | — | ||||||||||
August 1, 2016 through August 31, 2016 | — | — | — | — | ||||||||||
September 1, 2016 through September 30, 2016 | — | — | — | — | ||||||||||
October 1, 2016 through October 31, 2016 | — | — | — | — | ||||||||||
November 1, 2016 through November 30, 2016 | — | — | — | — | ||||||||||
December 1, 2016 through December 31, 2016 | — | — | — | — | ||||||||||
Total | 393,056 | $ | 13.94 | 393,056 | $ | 93 | ||||||||
_______________________________________________________________________________
(1) | Amount includes commissions paid. |
56
COMPARISON OF CUMULATIVE TOTAL RETURN AMONG ARES CAPITAL
CORPORATION, S&P 500 INDEX AND SNL US INVESTMENT COMPANY INDEX
Total Return Performance
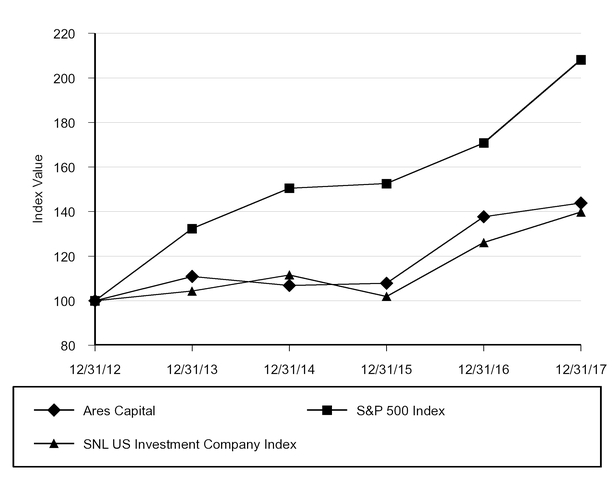
SOURCE: | S&P Global Market Intelligence |
NOTES: | Assumes $100 invested on December 31, 2012 in Ares Capital, the S&P 500 Index and the SNL US Investment Company Index. Assumes all dividends are reinvested on the respective dividend payment dates without commissions. |
Dec12 | Dec13 | Dec14 | Dec15 | Dec16 | Dec17 | ||||||||||||
Ares Capital | 100.00 | 110.91 | 106.85 | 107.81 | 137.69 | 143.82 | |||||||||||
S&P 500 Index | 100.00 | 132.39 | 150.51 | 152.59 | 170.84 | 208.14 | |||||||||||
SNL US Investment Company Index | 100.00 | 104.35 | 111.60 | 101.96 | 126.12 | 139.82 | |||||||||||
The stock performance graph and other information above shall not be deemed to be “soliciting material” or to be “filed” with the Securities and Exchange Commission (“SEC”) or subject to Regulation 14A or 14C, or to the liabilities of Section 18 of the Exchange Act, as amended.
57
Item 6. Selected Financial Data
The following selected financial and other data for the years ended December 31, 2017, 2016, 2015, 2014 and 2013 are derived from our consolidated financial statements which have been audited by KPMG LLP, an independent registered public accounting firm whose report thereon is included elsewhere in this Annual Report. The data should be read in conjunction with our consolidated financial statements and notes thereto and “Management’s Discussion and Analysis of Financial Condition and Results of Operations,” which are included elsewhere in this Annual Report.
58
ARES CAPITAL CORPORATION AND SUBSIDIARIES
SELECTED FINANCIAL DATA
(dollar amounts in millions, except per share data and as otherwise indicated)
As of and For the Years Ended December 31, | |||||||||||||||||||
2017 | 2016 | 2015 | 2014 | 2013 | |||||||||||||||
Total Investment Income | $ | 1,160 | $ | 1,012 | $ | 1,025 | $ | 989 | $ | 882 | |||||||||
Total Expenses, Net of Waiver of Income Based Fees | 630 | 497 | 499 | 533 | 437 | ||||||||||||||
Net Investment Income Before Income Taxes | 530 | 515 | 526 | 456 | 445 | ||||||||||||||
Income Tax Expense, Including Excise Tax | 19 | 21 | 18 | 18 | 14 | ||||||||||||||
Net Investment Income | 511 | 494 | 508 | 438 | 431 | ||||||||||||||
Net Realized and Unrealized Gains (Losses) on Investments, Foreign Currencies and Other Transactions and Extinguishment of Debt | 156 | (20 | ) | (129 | ) | 153 | 58 | ||||||||||||
Net Increase in Stockholders’ Equity Resulting from Operations | $ | 667 | $ | 474 | $ | 379 | $ | 591 | $ | 489 | |||||||||
Per Share Data: | |||||||||||||||||||
Net Increase in Stockholders’ Equity Resulting from Operations: | |||||||||||||||||||
Basic | $ | 1.57 | $ | 1.51 | $ | 1.20 | $ | 1.94 | $ | 1.83 | |||||||||
Diluted | $ | 1.57 | $ | 1.51 | $ | 1.20 | $ | 1.94 | $ | 1.83 | |||||||||
Cash Dividends Declared and Payable(1) | $ | 1.52 | $ | 1.52 | $ | 1.57 | $ | 1.57 | $ | 1.57 | |||||||||
Net Asset Value | $ | 16.65 | $ | 16.45 | $ | 16.46 | $ | 16.82 | $ | 16.46 | |||||||||
Total Assets(2) | $ | 12,347 | $ | 9,245 | $ | 9,507 | $ | 9,454 | $ | 8,094 | |||||||||
Total Debt (Carrying Value)(2) | $ | 4,854 | $ | 3,874 | $ | 4,114 | $ | 3,881 | $ | 2,938 | |||||||||
Total Debt (Principal Amount) | $ | 4,943 | $ | 3,951 | $ | 4,197 | $ | 3,999 | $ | 3,079 | |||||||||
Total Stockholders’ Equity | $ | 7,098 | $ | 5,165 | $ | 5,173 | $ | 5,284 | $ | 4,904 | |||||||||
Other Data: | |||||||||||||||||||
Number of Portfolio Companies at Period End(3) | 314 | 218 | 218 | 205 | 193 | ||||||||||||||
Principal Amount of Investments Purchased(4) | $ | 7,263 | $ | 3,490 | $ | 3,905 | $ | 4,534 | $ | 3,493 | |||||||||
Principal Amount of Investments Acquired as part of the American Capital Acquisition on the Acquisition Date | $ | 2,543 | $ | — | $ | — | $ | — | $ | — | |||||||||
Principal Amount of Investments Sold and Repayments | $ | 7,107 | $ | 3,655 | $ | 3,651 | $ | 3,213 | $ | 1,801 | |||||||||
Total Return Based on Market Value(5) | 4.5 | % | 26.4 | % | 1.3 | % | (3.3 | )% | 10.5 | % | |||||||||
Total Return Based on Net Asset Value(6) | 10.5 | % | 9.2 | % | 7.2 | % | 11.8 | % | 11.4 | % | |||||||||
Weighted Average Yield of Debt and Other Income Producing Securities at Fair Value(7) | 9.8 | % | 9.4 | % | 10.3 | % | 10.1 | % | 10.4 | % | |||||||||
Weighted Average Yield of Debt and Other Income Producing Securities at Amortized Cost(7) | 9.7 | % | 9.3 | % | 10.1 | % | 10.1 | % | 10.4 | % | |||||||||
Weighted Average Yield of Total Investments at Fair Value(8) | 8.7 | % | 8.5 | % | 9.2 | % | 9.1 | % | 9.3 | % | |||||||||
Weighted Average Yield of Total Investments at Amortized Cost(8) | 8.7 | % | 8.3 | % | 9.1 | % | 9.3 | % | 9.4 | % | |||||||||
_______________________________________________________________________________
(1) | Includes an additional dividend of $0.05 per share paid in the year ended December 31, 2015, an additional dividend of $0.05 per share paid in the year ended December 31, 2014 and an additional dividend of $0.05 per share paid in the year ended December 31, 2013. |
(2) | Certain prior year amounts have been reclassified to conform to the 2017 and 2016 presentation. In particular, unamortized debt issuance costs were previously included in other assets and were reclassified to long‑term debt as a |
59
result of the adoption of Accounting Standards Update 2015‑03, Interest-Imputation of Interest (Topic 835): Simplifying the Presentation of Debt Issuance Costs during the first quarter of 2016.
(3) | Includes commitments to portfolio companies for which funding had yet to occur. |
(4) | Excludes $2.5 billion of investments acquired as part of the American Capital Acquisition on the Acquisition Date. |
(5) | For the year ended December 31, 2017, the total return based on market value equaled the decrease of the ending market value at December 31, 2017 of $15.72 per share from the ending market value at December 31, 2016 of $16.49 per share plus the declared and payable dividends of $1.52 per share for the year ended December 31, 2017, divided by the market value at December 31, 2016. For the year ended December 31, 2016, the total return based on market value equaled the increase of the ending market value at December 31, 2016 of $16.49 per share from the ending market value at December 31, 2015 of $14.25 per share plus the declared and payable dividends of $1.52 per share for the year ended December 31, 2016, divided by the market value at December 31, 2015. For the year ended December 31, 2015, the total return based on market value equaled the decrease of the ending market value at December 31, 2015 of $14.25 per share from the ending market value at December 31, 2014 of $15.61 per share plus the declared and payable dividends of $1.57 per share for the year ended December 31, 2015, divided by the market value at December 31, 2014. For the year ended December 31, 2014 , the total return based on market value equaled the decrease of the ending market value at December 31, 2014 of $15.61 per share from the ending market value at December 31, 2013 of $17.77 per share plus the declared and payable dividends of $1.57 per share for the year ended December 31, 2014, divided by the market value at December 31, 2013. For the year ended December 31, 2013, the total return based on market value equaled the increase of the ending market value at December 31, 2013 of $17.77 per share from the ending market value at December 31, 2012 of $17.50 per share plus the declared and payable dividends of $1.57 per share for the year ended December 31, 2013, divided by the market value at December 31, 2012. The Company’s shares fluctuate in value. The Company’s performance changes over time and currently may be different than that shown. Past performance is no guarantee of future results. |
(6) | For the year ended December 31, 2017, the total return based on net asset value equaled the change in net asset value during the period plus the declared and payable dividends of $1.52 per share for the year ended December 31, 2017, divided by the beginning net asset value for the period. For the year ended December 31, 2016, the total return based on net asset value equaled the change in net asset value during the period plus the declared and payable dividends of $1.52 per share for the year ended December 31, 2016, divided by the beginning net asset value for the period. For the year ended December 31, 2015, the total return based on net asset value equaled the change in net asset value during the period plus the declared and payable dividends of $1.57 per share for the year ended December 31, 2015, divided by the beginning net asset value for the period. For the year ended December 31, 2014, the total return based on net asset value equaled the change in net asset value during the period plus the declared and payable dividends of $1.57 per share for the year ended December 31, 2014, divided by the beginning net asset value for the period. For the year ended December 31, 2013, the total return based on net asset value equaled the change in net asset value during the period plus the declared and payable dividends of $1.57 per share for the year ended December 31, 2013 divided by the beginning net asset value for the period. These calculations are adjusted for shares issued in connection with the dividend reinvestment plan and the issuance of common stock in connection with any equity offerings and the equity components of any convertible notes issued during the period. The Company’s performance changes over time and currently may be different than that shown. Past performance is no guarantee of future results. |
(7) | “Weighted average yield of debt and other income producing securities” is computed as (a) the annual stated interest rate or yield earned plus the net annual amortization of original issue discount and market discount or premium earned on accruing debt and other income producing securities, divided by (b) the total accruing debt and other income producing securities at amortized cost or at fair value, as applicable. The weighted average yield of debt and other income producing securities that were acquired as part of the American Capital Acquisition and held as of December 31, 2017 was 10.3% and 10.1% at amortized cost and fair value, respectively. |
(8) | “Weighted average yield on total investments” is computed as (a) the annual stated interest rate or yield earned plus the net annual amortization of original issue discount and market discount or premium earned on accruing debt and other income producing securities, divided by (b) the total investments at amortized cost or at fair value, as applicable. The weighted average yield on total investments that were acquired as part of the American Capital Acquisition and held as of December 31, 2017 was 8.7% and 7.8% at amortized cost and fair value, respectively. |
60
Item 7. Management’s Discussion and Analysis of Financial Condition and Results of Operations
The information contained in this section should be read in conjunction with the Selected Financial Data and our financial statements and notes thereto appearing elsewhere in this Annual Report. Further, the financial information and other data set forth below subsequent to the completion of the American Capital Acquisition (as defined below) on January 3, 2017, reflect the results of the combined company and the financial information and other data prior to the completion of the American Capital Acquisition does not give effect to the American Capital Acquisition, unless otherwise noted. For this reason, period to period comparisons may not be meaningful. In addition, some of the statements in this Annual Report (including in the following discussion) constitute forward- looking statements, which relate to future events, or the future performance or financial condition of Ares Capital Corporation (the “Company,” “Ares Capital,” “we,” “us,” or “our”). The forward-looking statements contained in this report involve a number of risks and uncertainties, including statements concerning:
• | our, or our portfolio companies’, future business, operations, operating results or prospects; |
• | the return or impact of current and future investments; |
• | the impact of a protracted decline in the liquidity of credit markets on our business; |
• | the impact of fluctuations in interest rates on our business; |
• | the impact of changes in laws or regulations (including the interpretation thereof),including the Tax Cuts and Jobs Act, governing our operations or the operations of our portfolio companies or the operations of our competitors; |
• | the valuation of our investments in portfolio companies, particularly those having no liquid trading market; |
• | our ability to successfully integrate our business with the business of American Capital (as defined below), including rotating out of certain investments acquired in connection therewith and re-deploying such capital effectively and on favorable terms; |
• | our ability to recover unrealized losses; |
• | market conditions and our ability to access alternative debt markets and additional debt and equity capital and our ability to manage our capital resources effectively; |
• | our contractual arrangements and relationships with third parties, including parties to our co-investment program; |
• | the general economy and its impact on the industries in which we invest; |
• | uncertainty surrounding the financial stability of the United States, Europe and China; |
• | the social, geopolitical, financial, trade and legal implications of Brexit; |
• | Middle East turmoil and the potential for volatility in energy prices and its impact on the industries in which we invest; |
• | the financial condition of and ability of our current and prospective portfolio companies to achieve their objectives; |
• | our expected financings and investments; |
• | our ability to successfully complete and integrate any other acquisitions; |
• | the outcome and impact of any litigation or other regulatory matters acquired in connection with the American Capital Acquisition (as defined below); |
• | the adequacy of our cash resources and working capital; |
• | the timing, form and amount of any dividend distributions; |
61
• | the timing of cash flows, if any, from the operations of our portfolio companies; and |
• | the ability of our investment adviser to locate suitable investments for us and to monitor and administer our investments. |
We use words such as “anticipates,” “believes,” “expects,” “intends,” “will,” “should,” “may” and similar expressions to identify forward-looking statements, although not all forward-looking statements include these words. Our actual results and condition could differ materially from those implied or expressed in the forward-looking statements for any reason, including the factors set forth in “Risk Factors” and the other information included in this Annual Report.
We have based the forward-looking statements included in this Annual Report on information available to us on the date of this Annual Report, and we assume no obligation to update any such forward-looking statements. Although we undertake no obligation to revise or update any forward-looking statements, whether as a result of new information, future events or otherwise, you are advised to consult any additional disclosures that we may make directly to you or through reports that we have filed or in the future may file with the Securities and Exchange Commission (“SEC”), including annual reports on Form 10-K, registration statements on Form N-2, quarterly reports on Form 10-Q and current reports on Form 8-K.
OVERVIEW
We are a specialty finance company that is a closed-end, non-diversified management investment company incorporated in Maryland. We have elected to be regulated as a business development company (“BDC”) under the Investment Company Act of 1940, as amended (together with the rules and regulations promulgated thereunder, the “Investment Company Act”).
We are externally managed by Ares Capital Management LLC (“Ares Capital Management” or our “investment adviser”), a subsidiary of Ares Management L.P. (NYSE: ARES) (“Ares Management”), a publicly traded, leading global alternative asset manager, pursuant to our investment advisory and management agreement. Ares Operations LLC (“Ares Operations” or our “administrator”), a subsidiary of Ares Management, provides certain administrative and other services necessary for us to operate.
Our investment objective is to generate both current income and capital appreciation through debt and equity investments. We invest primarily in first lien senior secured loans (including unitranche loans), second lien senior secured loans and mezzanine debt, which in some cases includes an equity component like warrants.
To a lesser extent, we also make preferred and/or common equity investments, which have generally been non-control equity investments, of less than $20 million (usually in conjunction with a concurrent debt investment). However, we may increase the size or change the nature of these investments. Also, as a result of the American Capital Acquisition (as defined below), American Capital’s (as defined below) equity investments, including equity investments pursuant to which American Capital controlled a particular portfolio company, became part of our portfolio.
Since our initial public offering (“IPO”) on October 8, 2004 through December 31, 2017, our exited investments resulted in an aggregate cash flow realized internal rate of return to us of approximately 14% (based on original cash invested, net of syndications, of approximately $20.6 billion and total proceeds from such exited investments of approximately $26.4 billion). Internal rate of return is the discount rate that makes the net present value of all cash flows related to a particular investment equal to zero. Internal rate of return is gross of expenses related to investments as these expenses are not allocable to specific investments. Investments are considered to be exited when the original investment objective has been achieved through the receipt of cash and/or non-cash consideration upon the repayment of a debt investment or sale of an investment or through the determination that no further consideration was collectible and, thus, a loss may have been realized. Approximately 65% of these exited investments resulted in an aggregate cash flow realized internal rate of return to us of 10% or greater.
Additionally, since our IPO on October 8, 2004 through December 31, 2017, our realized gains have exceeded our realized losses by approximately $613 million (excluding a one-time gain on the acquisition of Allied Capital Corporation (“Allied Capital”) and realized gains/losses from the extinguishment of debt and other assets). For this same time period, our average annualized net realized gain rate was approximately 1.1% (excluding a one-time gain on the acquisition of Allied Capital and realized gains/losses from the extinguishment of debt and other assets). Net realized gain/loss rates for a particular period are the amount of net realized gains/losses during such period divided by the average quarterly investments at amortized cost in such period.
62
Information included herein regarding internal rates of return, realized gains and losses and annualized net realized gain rates are historical results relating to our past performance and are not necessarily indicative of future results, the achievement of which cannot be assured.
As a BDC, we are required to comply with certain regulatory requirements. For instance, we generally have to invest at least 70% of our total assets in “qualifying assets,” including securities and indebtedness of private U.S. companies and certain public U.S. companies, cash, cash equivalents, U.S. government securities and high-quality debt investments that mature in one year or less. We also may invest up to 30% of our portfolio in non-qualifying assets, as permitted by the Investment Company Act. Specifically, as part of this 30% basket, we may invest in entities that are not considered “eligible portfolio companies” (as defined in the Investment Company Act), including companies located outside of the United States, entities that are operating pursuant to certain exceptions under the Investment Company Act, and publicly traded entities whose public equity market capitalization exceeds the levels provided for under the Investment Company Act.
We have elected to be treated as a regulated investment company (“RIC”) under the Internal Revenue Code of 1986, as amended (the “Code”) and operate in a manner so as to qualify for the tax treatment applicable to RICs. To qualify as a RIC, we must, among other things, meet certain source-of-income and asset diversification requirements and timely distribute to our stockholders generally at least 90% of our investment company taxable income, as defined by the Code, for each year. Pursuant to this election, we generally will not have to pay U.S. federal corporate-level taxes on any income that we distribute to our stockholders provided that we satisfy those requirements.
American Capital Acquisition
On May 23, 2016, we entered into a definitive agreement (the “Merger Agreement”) to acquire American Capital, Ltd. (“American Capital”), a Delaware corporation (the “American Capital Acquisition”) in a cash and stock transaction valued at approximately $4.2 billion. Pursuant to the Merger Agreement, American Capital shareholders received total consideration of approximately $18.06 per share comprised of: (i) $14.41 per share from us consisting of approximately $6.48 per share of cash (including a make-up dividend in the amount of $0.07 per share) and 0.483 shares of our common stock for each American Capital share at a value of $7.93 per American Capital share (based on the closing price per share of our common stock on January 3, 2017 (the “Acquisition Date”)), (ii) $2.45 per share of cash from American Capital’s sale of American Capital Mortgage Management, LLC, and (iii) approximately $1.20 per share of cash as transaction support provided by Ares Capital Management acting solely on its own behalf. As of the Acquisition Date, the transaction was valued at approximately $4.2 billion. The total cash and stock consideration paid by us was $3.3 billion. In connection with the stock consideration, we issued approximately 112 million shares of our common stock to American Capital’s then-existing stockholders (including holders of outstanding in-the-money American Capital stock options), thereby resulting in our then-existing stockholders owning approximately 73.7% of the combined company and then-existing American Capital stockholders owning approximately 26.3% of the combined company. As a result of the American Capital Acquisition, Ares Capital acquired $3.6 billion of assets, including $2.5 billion of investments, and assumed $226 million of liabilities.
In connection with the American Capital Acquisition, Ares Capital Management also agreed to waive, for each of the first ten calendar quarters beginning with the second quarter of 2017, the lesser of (x) $10 million of income based fees and (y) the amount of income based fees for such quarter, in each case, to the extent earned and payable by us in such quarter pursuant to and as calculated under our investment advisory and management agreement (the “Fee Waiver”). See Notes 3 and 16 to our consolidated financial statements for the year ended December 31, 2017 for additional information regarding the American Capital Acquisition.
PORTFOLIO AND INVESTMENT ACTIVITY
Our investment activity for the years ended December 31, 2017, 2016 and 2015 is presented below (information presented herein is at amortized cost unless otherwise indicated).
For the Years Ended December 31, | |||||||||||
(dollar amounts in millions) | 2017 | 2016 | 2015 | ||||||||
New investment commitments(1)(5)(10): | |||||||||||
New portfolio companies | $ | 2,155 | $ | 2,107 | $ | 2,483 | |||||
Existing portfolio companies | 3,734 | 1,596 | 1,334 | ||||||||
Total new investment commitments(2) | 5,889 | 3,703 | 3,817 | ||||||||
63
Less: | |||||||||||
Investment commitments exited(3) | 5,593 | 3,844 | 3,816 | ||||||||
Net investment commitments | $ | 296 | $ | (141 | ) | $ | 1 | ||||
Principal amount of investments funded(5)(10): | |||||||||||
First lien senior secured loans | $ | 3,442 | $ | 1,965 | $ | 2,071 | |||||
Second lien senior secured loans | 1,491 | 987 | 1,232 | ||||||||
Subordinated certificates of the SDLP(4) | 222 | 272 | — | ||||||||
Subordinated certificates of the SSLP | — | 3 | 229 | ||||||||
Senior subordinated loans | 273 | 173 | 257 | ||||||||
Preferred equity securities | 120 | 37 | 89 | ||||||||
Other equity securities | 116 | 53 | 27 | ||||||||
Total | $ | 5,664 | $ | 3,490 | $ | 3,905 | |||||
Principal amount of investments sold or repaid(6): | |||||||||||
First lien senior secured loans | $ | 2,394 | $ | 2,522 | $ | 2,948 | |||||
Second lien senior secured loans | 1,536 | 903 | 195 | ||||||||
Subordinated certificates of the SDLP(4) | 4 | 2 | — | ||||||||
Subordinated certificates of the SSLP(5) | 474 | — | 330 | ||||||||
Senior subordinated loans | 269 | 189 | 132 | ||||||||
Collateralized loan obligations | 150 | — | — | ||||||||
Preferred equity securities | 275 | 4 | 11 | ||||||||
Other equity securities | 476 | 35 | 33 | ||||||||
Commercial real estate | — | — | 2 | ||||||||
Total | $ | 5,578 | $ | 3,655 | $ | 3,651 | |||||
Principal amount of investments acquired as part of the American Capital Acquisition on the Acquisition Date: | |||||||||||
First lien senior secured loans | $ | 550 | |||||||||
Second lien senior secured loans | 855 | ||||||||||
Senior subordinated loans | 244 | ||||||||||
Collateralized loan obligations | 265 | ||||||||||
Preferred equity securities | 109 | ||||||||||
Other equity securities | 520 | ||||||||||
Total | $ | 2,543 | |||||||||
Number of new investment commitment(5)(7)(10) | 155 | 82 | 86 | ||||||||
Average new investment commitment amount(5)(10) | 38 | $ | 45 | $ | 44 | ||||||
Weighted average term for new investment commitments (in months)(5)(8)(10) | 75 | 80 | 65 | ||||||||
Percentage of new investment commitments at floating rates(5)(10) | 94 | % | 91 | % | 89 | % | |||||
Percentage of new investment commitments at fixed rates(5)(10) | 4 | % | 6 | % | 8 | % | |||||
Weighted average yield of debt and other income producing securities(5)(8)(10): | |||||||||||
Funded during the period at amortized cost | 9.0 | % | 9.3 | % | 9.0 | % | |||||
Funded during the period at fair value(9) | 9.0 | % | 9.2 | % | 9.0 | % | |||||
Exited or repaid during the period at amortized cost | 8.9 | % | 8.5 | % | 7.9 | % | |||||
Exited or repaid during the period at fair value(9) | 8.9 | % | 8.4 | % | 7.9 | % | |||||
Weighted average yield of debt and other income producing securities acquired as part of the American Capital Acquisition on the Acquisition Date: | |||||||||||
Funded during the period at amortized cost | 10.0 | % | — | — | |||||||
64
Funded during the period at fair value(9) | 10.0 | % | — | — | |||||||
_______________________________________________________________________________
(1) | New investment commitments include new agreements to fund revolving credit facilities or delayed draw loans. See “Off Balance Sheet Arrangements” as well as Note 7 to our consolidated financial statements for the year ended December 31, 2017, for more information on our commitments to fund revolving credit facilities or delayed draw loans. |
(2) | Includes both funded and unfunded commitments. Of these new investment commitments, we funded $5.1 billion, $3.3 billion and $3.6 billion for the years ended December 31, 2017, 2016 and 2015, respectively. |
(3) | Includes both funded and unfunded commitments. For the years ended December 31, 2017, 2016 and 2015, investment commitments exited included exits of unfunded commitments of $301 million, $341 million and $263 million, respectively. |
(4) | See “Senior Direct Lending Program” below and Note 4 to our consolidated financial statements for the year ended December 31, 2017 for more information on the SDLP (as defined below). |
(5) | In July 2017, in connection with the effective termination of Senior Secured Loan Fund LLC (d/b/a the “Senior Secured Loan Program” or the “SSLP”), we purchased $1.6 billion in aggregate principal amount of first lien senior secured loans outstanding at par plus accrued and unpaid interest and fees from the SSLP (the “SSLP Loan Sale”) and assumed the SSLP’s remaining unfunded loan commitments totaling $50 million. The loans purchased from the SSLP included loans to 10 different borrowers with a weighted average yield at amortized cost and fair value of 7.1% and 7.1%, respectively. Upon completion of the SSLP Loan Sale, the SSLP made a liquidation distribution to the holders of the subordinated certificates of the SSLP (the “SSLP Certificates”), of which Ares Capital received $1.5 billion. The impact of these transactions is excluded from the information presented in the table. See “Senior Secured Loan Program” below and Note 4 to our consolidated financial statements for the year ended December 31, 2017 for more information on the SSLP. |
(6) | For the year ended December 31, 2017, the principal amount of investments sold or repaid included $1.1 billion of investments acquired as part of the American Capital Acquisition. |
(7) | Number of new investment commitments represents each commitment to a particular portfolio company. |
(8) | “Weighted average yield of debt and other income producing securities” is computed as (a) the annual stated interest rate or yield earned plus the net annual amortization of original issue discount and market discount or premium earned on accruing debt and other income producing securities, divided by (b) the total accruing debt and other income producing securities at amortized cost or at fair value, as applicable. |
(9) | Represents fair value for investments in the portfolio as of the most recent prior quarter end, if applicable. |
(10) | Excludes investments acquired as part of the American Capital Acquisition on the Acquisition Date. See Note 16 to our consolidated financial statements for the year ended December 31, 2017 for additional information regarding the American Capital Acquisition. |
65
As of December 31, 2017 and 2016, our investments consisted of the following:
As of December 31, | |||||||||||||||
2017 | 2016 | ||||||||||||||
(in millions) | Amortized Cost | Fair Value | Amortized Cost | Fair Value | |||||||||||
First lien senior secured loans | $ | 5,337 | $ | 5,197 | $ | 2,102 | $ | 2,036 | |||||||
Second lien senior secured loans | 3,885 | 3,744 | 3,069 | 2,987 | |||||||||||
Subordinated certificates of the SDLP(1) | 487 | 487 | 270 | 270 | |||||||||||
Subordinated certificates of the SSLP(2) | — | — | 1,938 | 1,914 | |||||||||||
Senior subordinated loans | 978 | 995 | 692 | 714 | |||||||||||
Collateralized loan obligations | 115 | 114 | — | — | |||||||||||
Preferred equity securities | 485 | 532 | 505 | 273 | |||||||||||
Other equity securities | 618 | 772 | 458 | 626 | |||||||||||
Total | $ | 11,905 | $ | 11,841 | $ | 9,034 | $ | 8,820 | |||||||
_______________________________________________________________________________
(1) | The proceeds from these certificates were applied to co-investments with Varagon Capital Partners (“Varagon”) and its clients to fund first lien senior secured loans to 19 and 14 different borrowers as of December 31, 2017 and 2016, respectively. |
(2) | The proceeds from these certificates were applied to co-investments with GE Global Sponsor Finance LLC and General Electric Capital Corporation (together, “GE”) to fund first lien senior secured loans to 19 different borrowers as of December 31, 2016. |
The weighted average yields at amortized cost and fair value of the following portions of our portfolio as of December 31, 2017 and 2016 were as follows:
As of December 31, | |||||||||||
2017 | 2016 | ||||||||||
Amortized Cost | Fair Value | Amortized Cost | Fair Value | ||||||||
Debt and other income producing securities(1) | 9.7 | % | 9.8 | % | 9.3 | % | 9.4 | % | |||
Total portfolio(2) | 8.7 | % | 8.7 | % | 8.3 | % | 8.5 | % | |||
First lien senior secured loans(2) | 7.9 | % | 8.1 | % | 8.4 | % | 8.6 | % | |||
Second lien senior secured loans(2) | 9.7 | % | 10.0 | % | 9.8 | % | 10.1 | % | |||
Subordinated certificates of the SDLP(2)(3) | 14.5 | % | 14.5 | % | 14.0 | % | 14.0 | % | |||
Subordinated certificates of the SSLP(2)(4) | — | % | — | % | 7.0 | % | 7.1 | % | |||
Senior subordinated loans(2) | 13.0 | % | 12.8 | % | 12.4 | % | 12.0 | % | |||
Collateralized loan obligations | 9.7 | % | 9.7 | % | — | % | — | % | |||
Income producing equity securities(2) | 13.0 | % | 13.0 | % | 13.8 | % | 13.8 | % | |||
_______________________________________________________________________________
(1) | ”Weighted average yield of debt and other income producing securities” is computed as (a) the annual stated interest rate or yield earned plus the net annual amortization of original issue discount and market discount or premium earned on accruing debt and other income producing securities, divided by (b) the total accruing debt and other income producing securities at amortized cost or at fair value, as applicable. The weighted average yield of debt and other income producing securities that were acquired as part of the American Capital Acquisition and held as of December 31, 2017 was 10.3% and 10.1% at amortized cost and fair value, respectively. |
(2) | ”Weighted average yields” are computed as (a) the annual stated interest rate or yield earned plus the net annual amortization of original issue discount and market discount or premium earned on the relevant accruing debt and other income producing securities, divided by (b) the total relevant investments at amortized cost or at fair value, as applicable. The weighted average yield on total investments that were acquired as part of the American Capital Acquisition and held as of December 31, 2017 was 8.7% and 7.8% at amortized cost and fair value, respectively. |
66
(3) | The proceeds from these certificates were applied to co-investments with Varagon and its clients to fund first lien senior secured loans. |
(4) | The proceeds from these certificates were applied to co-investments with GE to fund first lien senior secured loans. |
Ares Capital Management, our investment adviser, employs an investment rating system to categorize our investments. In addition to various risk management and monitoring tools, our investment adviser grades the credit risk of all investments on a scale of 1 to 4 no less frequently than quarterly. This system is intended primarily to reflect the underlying risk of a portfolio investment relative to our initial cost basis in respect of such portfolio investment (i.e., at the time of origination or acquisition), although it may also take into account under certain circumstances the performance of the portfolio company’s business, the collateral coverage of the investment and other relevant factors. Under this system, investments with a grade of 4 involve the least amount of risk to our initial cost basis. The trends and risk factors for this investment since origination or acquisition are generally favorable, which may include the performance of the portfolio company or a potential exit. Investments graded 3 involve a level of risk to our initial cost basis that is similar to the risk to our initial cost basis at the time of origination or acquisition. This portfolio company is generally performing as expected and the risk factors to our ability to ultimately recoup the cost of our investment are neutral to favorable. All investments or acquired investments in new portfolio companies are initially assessed a grade of 3. Investments graded 2 indicate that the risk to our ability to recoup the initial cost basis of such investment has increased materially since origination or acquisition, including as a result of factors such as declining performance and non-compliance with debt covenants; however, payments are generally not more than 120 days past due. An investment grade of 1 indicates that the risk to our ability to recoup the initial cost basis of such investment has substantially increased since origination or acquisition, and the portfolio company likely has materially declining performance. For debt investments with an investment grade of 1, most or all of the debt covenants are out of compliance and payments are substantially delinquent. For investments graded 1, it is anticipated that we will not recoup our initial cost basis and may realize a substantial loss of our initial cost basis upon exit. For investments graded 1 or 2, our investment adviser enhances its level of scrutiny over the monitoring of such portfolio company. The grade of a portfolio investment may be reduced or increased over time.
We assigned a fair value as of the Acquisition Date to each of the portfolio investments acquired in connection with the American Capital Acquisition. The initial cost basis of each investment acquired was equal to the fair value of such investment as of the Acquisition Date. Many of these portfolio investments were assigned a fair value reflecting a discount to American Capital’s cost basis at the time of American Capital’s origination or acquisition. Each investment was initially assessed a grade of 3 (i.e., generally the grade we assign a portfolio company at acquisition), reflecting the relative risk to our initial cost basis of such investments. It is important to note that our grading system does not take into account factors or events in respect of the period from when American Capital originated or acquired such portfolio investments or the status of these portfolio investments in terms of compliance with debt facilities, financial performance and similar factors. Rather, it is only intended to measure risk from the time that we acquired the portfolio investment in connection with the American Capital Acquisition. Accordingly, it is possible that the grades of these portfolio investments may be reduced or increased after the Acquisition Date.
Set forth below is the grade distribution of our portfolio companies as of December 31, 2017 and 2016:
As of December 31, | |||||||||||||||||||||||||
2017 | 2016 | ||||||||||||||||||||||||
(dollar amounts in millions) | Fair Value | % | Number of Companies | % | Fair Value | % | Number of Companies | % | |||||||||||||||||
Grade 1 | $ | 72 | 0.6 | % | 16 | 5.1 | % | $ | 92 | 1.0 | % | 13 | 6.0 | % | |||||||||||
Grade 2 | 343 | 2.9 | % | 14 | 4.5 | % | 323 | 3.7 | % | 12 | 5.5 | % | |||||||||||||
Grade 3 | 10,099 | 85.3 | % | 268 | 85.3 | % | 7,451 | 84.4 | % | 172 | 78.9 | % | |||||||||||||
Grade 4 | 1,327 | 11.2 | % | 16 | 5.1 | % | 954 | 10.9 | % | 21 | 9.6 | % | |||||||||||||
Total | $ | 11,841 | 100.0 | % | 314 | 100.0 | % | $ | 8,820 | 100.0 | % | 218 | 100.0 | % | |||||||||||
As of December 31, 2017 and 2016, the weighted average grade of the investments in our portfolio at fair value was 3.1 and 3.1, respectively.
As of December 31, 2017, investments on non-accrual status represented 3.1% and 1.4% of the total investments at amortized cost and at fair value, respectively. As of December 31, 2016, investments on non-accrual status represented 2.9% and 0.8% of the total investments at amortized cost and at fair value, respectively.
67
Co-Investment Programs
Senior Direct Lending Program
We have established a joint venture with Varagon to make certain first lien senior secured loans, including certain stretch senior and unitranche loans, primarily to U.S. middle market companies. Varagon was formed in 2013 as a lending platform by American International Group, Inc. (NYSE:AIG) and other partners. The joint venture is called the Senior Direct Lending Program LLC (d/b/a the “Senior Direct Lending Program” or the “SDLP”). In July 2016, we and Varagon and its clients completed the initial funding of the SDLP. In conjunction with the initial funding, we and Varagon and its clients sold investment commitments to the SDLP. Such investment commitments included $529 million of investment commitments sold to the SDLP by us. No realized gains or losses were recorded by us on these transactions. The SDLP may generally commit and hold individual loans of up to $300 million. The SDLP is capitalized as transactions are completed and all portfolio decisions and generally all other decisions in respect of the SDLP must be approved by an investment committee of the SDLP consisting of representatives of ours and Varagon (with approval from a representative of each required).
We provide capital to the SDLP in the form of subordinated certificates (the “SDLP Certificates”), and Varagon and its clients provide capital to the SDLP in the form of senior notes, intermediate funding notes and SDLP Certificates. As of December 31, 2017, we and a client of Varagon owned 87.5% and 12.5%, respectively, of the outstanding SDLP Certificates.
As of December 31, 2017, we and Varagon and its clients had agreed to make capital available to the SDLP of $2.9 billion in the aggregate, of which $591 million is to be made available from us. This capital will only be committed to the SDLP upon approval of transactions by the investment committee of the SDLP. Below is a summary of the funded capital and unfunded capital commitments of the SDLP.
As of December 31, | |||||||
(in millions) | 2017 | 2016 | |||||
Total capital funded to the SDLP(1) | $ | 2,319 | $ | 1,285 | |||
Total capital funded to the SDLP by the Company(1) | $ | 487 | $ | 270 | |||
Total unfunded capital commitments to the SDLP(2) | $ | 92 | $ | 177 | |||
Total unfunded capital commitments to the SDLP by the Company(2) | $ | 19 | $ | 37 | |||
___________________________________________________________________________
(1) | At principal amount. |
(2) | These commitments have been approved by the investment committee of the SDLP and will be funded as the transactions are completed. |
The SDLP Certificates pay a coupon of the London Interbank Offered Rate (“LIBOR”) plus 8.0% and also entitle the holders thereof to receive a portion of the excess cash flow from the loan portfolio, after expenses, which may result in a return to the holders of the SDLP Certificates that is greater than the stated coupon. The SDLP Certificates are junior in right of payment to the senior notes and intermediate funding notes.
The amortized cost and fair value of our SDLP Certificates held by us were $487 million and $487 million, respectively, as of December 31, 2017 and $270 million and $270 million, respectively, as of December 31, 2016. Our yield on our investment in the SDLP at amortized cost and fair value was 14.5% and 14.5%, respectively, as of December 31, 2017 and 14.0% and 14.0%, respectively as of December 31, 2016. For the years ended December 31, 2017 and 2016, we earned interest income of $52 million and $13 million, respectively, from our investment in the SDLP Certificates. We are also entitled to certain fees in connection with the SDLP. For the years ended December 31, 2017 and 2016, in connection with the SDLP, we earned capital structuring service and other fees totaling $11 million and $6 million, respectively.
As of December 31, 2017 and 2016, the portfolio was comprised of all first lien senior secured loans primarily to U.S. middle market companies and were in industries similar to the companies in our portfolio. As of December 31, 2017 and 2016, none of the loans were on non-accrual status. Below is a summary of the SDLP’s portfolio as of December 31, 2017 and 2016:
68
As of December 31, | |||||||
(dollar amounts in millions) | 2017 | 2016 | |||||
Total first lien senior secured loans(1) | $ | 2,316 | $ | 1,281 | |||
Weighted average yield on first lien senior secured loans(2) | 7.6 | % | 7.4 | % | |||
Largest loan to a single borrower(1) | $ | 200 | $ | 125 | |||
Total of five largest loans to borrowers(1) | $ | 947 | $ | 560 | |||
Number of borrowers in the SDLP | 19 | 14 | |||||
Commitments to fund delayed draw loans(3) | $ | 92 | $ | 177 | |||
_______________________________________________________________________________
(1) At principal amount.
(2) | Computed as (a) the annual stated interest rate on accruing first lien senior secured loans, divided by (b) total first lien senior secured loans at principal amount. |
(3) | As discussed above, these commitments have been approved by the investment committee of the SDLP. |
Senior Secured Loan Program
We and GE had previously co-invested in first lien senior secured loans of middle market companies through an unconsolidated Delaware limited liability company, the Senior Secured Loan Fund LLC (d/b/a the “Senior Secured Loan Program” or the “SSLP”). The SSLP was capitalized as transactions were completed. All portfolio decisions and generally all other decisions in respect of the SSLP were approved by an investment committee of the SSLP consisting of representatives of ours and GE (with approval from a representative of each required). We provided capital to the SSLP in the form of the SSLP Certificates. GE provided capital to the SSLP in the form of senior notes and SSLP Certificates.
As of June 30, 2017, our investment in the SSLP Certificates at amortized cost and fair value was $1.9 billion and $1.9 billion, respectively, and our yield on our investment in the SSLP Certificates at amortized cost and fair value was 5.8% and 5.8%, respectively. As of June 30, 2017, the SSLP had $1.2 billion in cash and GE’s senior notes outstanding totaled $601 million. In July 2017, the SSLP made its monthly waterfall distribution from this cash, which fully repaid the outstanding principal amount of the senior notes of the SSLP with the remaining amounts distributed to the holders of the SSLP Certificates. From this distribution, we received $474 million in respect of our SSLP Certificates. After this distribution, the amortized cost of our SSLP Certificates was $1.5 billion.
In addition, in July 2017, we and GE agreed to an effective termination of the SSLP whereby on July 26, 2017, we purchased the remaining $1.6 billion in aggregate principal amount of first lien senior secured loans outstanding at par plus accrued and unpaid interest and fees from the SSLP (the “SSLP Loan Sale”) and assumed the SSLP’s remaining unfunded loan commitments totaling $50 million. Upon completion of the SSLP Loan Sale, the SSLP made a liquidation distribution to the holders of the SSLP Certificates (the “SSLP Liquidation Distribution”), of which we received $1.5 billion. In connection with the SSLP Liquidation Distribution, we recognized an $18 million realized loss. After completion of the transactions described above, the operations of the SSLP were effectively terminated pursuant to the terms of the documents governing the SSLP and the SSLP no longer has an obligation to fund existing commitments and other amounts in respect of its former portfolio companies.
Below is a summary of the funded capital and unfunded capital commitments of the SSLP as of December 31, 2016.
(in millions) | |||
Total capital funded to the SSLP(1) | $ | 3,819 | |
Total capital funded to the SSLP by the Company(1) | $ | 2,004 | |
Total unfunded capital commitments to the SSLP(2) | $ | 50 | |
Total unfunded capital commitments to the SSLP by the Company(2) | $ | 7 | |
___________________________________________________________________________
(1) | At principal amount. |
(2) | These commitments were approved by the investment committee of the SSLP. |
69
The amortized cost and fair value of our SSLP Certificates were $1.9 billion and $1.9 billion, respectively, as of December 31, 2016. Our yield on our investment in the SSLP Certificates at amortized cost and fair value was 7.0% and 7.1%, respectively, as of December 31, 2016. For the years ended December 31, 2017, 2016 and 2015, we earned interest income of $69 million, $208 million and $276 million, respectively, from our investment in the SSLP Certificates. We were also entitled to certain fees in connection with the SSLP. For the years ended December 31, 2017, 2016 and 2015, in connection with the SSLP, we earned capital structuring service, sourcing and other fees totaling $5 million, $20 million and $48 million, respectively.
As of December 31, 2016, the SSLP’s portfolio was comprised of all first lien senior secured loans to U.S. middle-market companies and were in industries similar to the companies in our portfolio. As of December 31, 2016, none of these loans were on non-accrual status. Below is a summary of the SSLP’s portfolio as of December 31, 2016.
(dollar amounts in millions) | |||
Total first lien senior secured loans(1) | $ | 3,360 | |
Weighted average yield on first lien senior secured loans(2) | 6.9 | % | |
Largest loan to a single borrower(1) | $ | 260 | |
Total of five largest loans to borrowers(1) | $ | 1,257 | |
Number of borrowers in the SSLP | 19 | ||
Commitments to fund delay draw loans(3) | $ | 50 | |
_______________________________________________________________________________
(1) At principal amount.
(2) Computed as (a) the annual stated interest rate on accruing first lien senior secured loans, divided by (b) total first lien senior secured loans at principal amount.
(3) | As discussed above, these commitments were approved by the investment committee of the SSLP. |
70
SSLP Loan Portfolio as of December 31, 2016
(dollar amounts in millions) Portfolio Company | Business Description | Maturity Date | Stated Interest Rate(1) | Principal Amount | Fair Value(2) | ||||||||||
AMZ Holding Corp. | Specialty chemicals manufacturer | 12/2018 | 6.8 | % | $ | 214 | $ | 214 | |||||||
Breg, Inc. | Designer, manufacturer, and distributor of non-surgical orthopedic products for preventative, post-operative and rehabilitative use | 10/2020 | 6.8 | % | 147 | 147 | |||||||||
Connoisseur Media, LLC | Owner and operator of radio stations | 6/2019 | 7.3 | % | 94 | 94 | |||||||||
DFS Holding Company, Inc. | Distributor of maintenance, repair, and operations parts, supplies, and equipment to the foodservice industry | 2/2022 | 6.5 | % | 191 | 191 | |||||||||
Drayer Physical Therapy Institute, LLC | Outpatient physical therapy provider | 7/2018 | 8.8 | % | 132 | 132 | |||||||||
ECI Purchaser Company, LLC | Manufacturer of equipment to safely control pressurized gases | 12/2018 | 6.5 | % | 207 | 201 | |||||||||
Excelligence Learning Corporation | Developer, manufacturer and retailer of educational products | 12/2020 | 6.8 | % | 175 | 175 | |||||||||
Gehl Foods, LLC (4) | Producer of low-acid, aseptic food and beverage products | 6/2019 | 7.5 | % | 155 | 155 | |||||||||
Implus Footcare, LLC | Provider of footwear and other accessories | 4/2021 | 7.0 | % | 260 | 252 | |||||||||
Intermedix Corporation(3) | Revenue cycle management provider to the emergency healthcare industry | 12/2019 | 5.8 | % | 254 | 251 | |||||||||
Mavis Tire Supply LLC | Auto parts retailer | 10/2020 | 6.3 | % | 230 | 225 | |||||||||
MCH Holdings, Inc.(4) | Healthcare professional provider | 1/2020 | 6.5 | % | 168 | 168 | |||||||||
Palermo Finance Corporation | Provider of mission-critical integrated public safety software and services to local, state, and federal agencies | 11/2020 | 7.0 | % | 185 | 185 | |||||||||
Sanders Industries Holdings, Inc.(4) | Elastomeric parts, mid-sized composite structures, and composite tooling | 5/2020 | 6.5 | % | 76 | 76 | |||||||||
Singer Sewing Company | Manufacturer of consumer sewing machines | 6/2017 | 7.8 | % | 181 | 178 | |||||||||
STATS Acquisition, LLC | Sports technology, data and content company | 6/2018 | 10.8 | % | 102 | 99 | |||||||||
U.S. Anesthesia Partners, Inc.(3) | Anesthesiology service provider | 12/2019 | 6.0 | % | 259 | 259 | |||||||||
WCI-Quantum Holdings, Inc.(4) | Distributor of instructional products, services and resources | 10/2020 | 6.1 | % | 76 | 76 | |||||||||
Woodstream Group, Inc. | Pet products manufacturer | 5/2022 | 7.3 | % | 254 | 254 | |||||||||
$ | 3,360 | $ | 3,332 | ||||||||||||
______________________________________________________________________________
(1) | Represents the weighted average annual stated interest rate as of December 31, 2016. All interest rates were payable in cash except for 0.5% and 2.0% of the interest rates for Singer Sewing Company and STATS Acquisition, LLC, respectively, which are payment-in-kind interest. |
(2) | Represents the fair value in accordance with Accounting Standards Codification (“ASC”) 820-10. The determination of such fair value was not included in our board of directors valuation process described elsewhere herein. |
(3) | We held a portion of this company’s second lien senior secured loan. |
(4) | We held an equity investment in this company. |
71
Selected financial information for the SSLP as of and for the year ended December 31, 2016 was as follows:
(in millions) | |||
Selected Balance Sheet Information: | |||
Investments in loans receivable, net | $ | 3,343 | |
Cash and other assets | 439 | ||
Total assets | $ | 3,782 | |
Senior notes | $ | 1,529 | |
Other liabilities | 45 | ||
Total liabilities | 1,574 | ||
Subordinated certificates and members’ capital | 2,208 | ||
Total liabilities and members’ capital | $ | 3,782 | |
(in millions) | |||
Selected Statement of Operations Information: | |||
Total interest and other income | $ | 473 | |
Interest expense | 146 | ||
Management and sourcing fees | 48 | ||
Other expenses | 20 | ||
Total expenses | 214 | ||
Net income | $ | 259 | |
RESULTS OF OPERATIONS
For the years ended December 31, 2017, 2016 and 2015
Operating results for the years ended December 31, 2017, 2016 and 2015 were as follows:
For the Years Ended December 31, | |||||||||||
(in millions) | 2017 | 2016 | 2015 | ||||||||
Total investment income | $ | 1,160 | $ | 1,012 | $ | 1,025 | |||||
Total expenses, net of waiver of income based fees | 630 | 497 | 499 | ||||||||
Net investment income before income taxes | 530 | 515 | 526 | ||||||||
Income tax expense, including excise tax | 19 | 21 | 18 | ||||||||
Net investment income | 511 | 494 | 508 | ||||||||
Net realized gains on investments and foreign currency transactions | 24 | 110 | 127 | ||||||||
Net unrealized gains (losses) on investments, foreign currency and other transactions | 136 | (130 | ) | (246 | ) | ||||||
Realized losses on extinguishment of debt | (4 | ) | — | (10 | ) | ||||||
Net increase in stockholders’ equity resulting from operations | $ | 667 | $ | 474 | $ | 379 | |||||
Net income can vary substantially from period to period due to various factors, including acquisitions, the level of new investment commitments, the recognition of realized gains and losses and unrealized appreciation and depreciation. As a result, comparisons of net increase in stockholders’ equity resulting from operations may not be meaningful.
72
Investment Income
For the Years Ended December 31, | |||||||||||
(in millions) | 2017 | 2016 | 2015 | ||||||||
Interest income from investments | $ | 951 | $ | 806 | $ | 817 | |||||
Capital structuring service fees | 105 | 99 | 95 | ||||||||
Dividend income | 76 | 75 | 74 | ||||||||
Management and other fees | 6 | 16 | 24 | ||||||||
Other income | 22 | 16 | 15 | ||||||||
Total investment income | $ | 1,160 | $ | 1,012 | $ | 1,025 | |||||
The increase in interest income from investments for the year ended December 31, 2017 from the comparable period in 2016 was primarily due to an increase in the average size of our portfolio, partially offset by a decrease in the weighted average yield of our portfolio. The size of our portfolio increased from an average of $9.0 billion at amortized cost for the year ended December 31, 2016 to an average of $11.4 billion at amortized cost for the comparable period in 2017, which was largely due to the investments acquired as part of the American Capital Acquisition. The weighted average yield of our total portfolio decreased from 9.0% for the year ended December 31, 2016 to 8.5% for the comparable period in 2017. The decline in the weighted average yield was primarily due to the declining yield of the SSLP Certificates up until the SSLP Liquidation Distribution and the effective termination of the SSLP, during the year ended December 31, 2017. The increase in capital structuring service fees for the year ended December 31, 2017 from the comparable period in 2016 was due to the increase in new investment commitments (excluding investments acquired from the American Capital Acquisition and investments acquired from the SSLP Loan Sale), which increased from $3.7 billion for year ended December 31, 2016 to $5.9 billion for the comparable period in 2017. This increase was partially offset by a decrease in weighted average capital structuring fees received on new investment commitments, which decreased from 2.7% for the year ended December 31, 2016 to 1.8% for the comparable period in 2017. This decline was primarily due to having a higher percentage of new investment commitments made to existing portfolio companies during the year ended December 31, 2017 as compared to the comparable period in 2016. Dividend income for the years ended December 31, 2017 and 2016 included dividends received from Ivy Hill Asset Management, L.P. (“IHAM”), a wholly owned portfolio company, totaling $40 million and $40 million, respectively. Also during the year ended December 31, 2017, we received $19 million in other non-recurring dividends from non-income producing equity securities compared to $20 million for the comparable period in 2016. The decrease in management and other fees for the year ended December 31, 2017 from the comparable period in 2016 was due to lower sourcing fees from the SSLP resulting from the continued decrease in the size of the SSLP portfolio and eventually the effective termination of the SSLP in July 2017. The increase in other income for the year ended December 31, 2017 from the comparable period in 2016 was primarily attributable to higher amendment fees and administrative agent fees.
The decrease in interest income from investments for the year ended December 31, 2016 from the comparable period in 2015 was primarily due to a decrease in the weighted average yield of our portfolio, partially offset by an increase in the average size of our portfolio. The weighted average yield of our portfolio decreased from 9.5% for the year ended December 31, 2015 to 9.0% for the comparable period in 2016, primarily driven by the decrease in the yield of the SSLP Certificates. The size of our portfolio increased from an average of $8.6 billion at amortized cost for the year ended December 31, 2015 to an average of $9.0 billion at amortized cost for the comparable period in 2016. The increase in capital structuring service fees for the year ended December 31, 2016 from the comparable period in 2015 was due to the increase in weighted average capital structuring fees received on new investment commitments, which increased from 2.5% for the year ended December 31, 2015 to 2.7% for the comparable period in 2016. Dividend income for the years ended December 31, 2016 and 2015 included dividends received from IHAM, totaling $40 million and $50 million, respectively. The dividends received from IHAM for the year ended December 31, 2015 included additional dividends of $10 million that were paid in addition to the quarterly dividends generally paid by IHAM. IHAM paid the additional dividends out of accumulated earnings that had previously been retained by IHAM. Also during the year ended December 31, 2016, we received $20 million in other non-recurring dividends from non-income producing equity securities compared to $9 million for the comparable period in 2015. The decrease in management and other fees for the year ended December 31, 2016 from the comparable period in 2015 was due to lower sourcing fees from the SSLP resulting from a decrease in the size of the SSLP portfolio.
73
Operating Expenses
For the Years Ended December 31, | |||||||||||
(in millions) | 2017 | 2016 | 2015 | ||||||||
Interest and credit facility fees | $ | 225 | $ | 186 | $ | 227 | |||||
Base management fees | 171 | 137 | 134 | ||||||||
Income based fees | 134 | 123 | 121 | ||||||||
Capital gains incentive fees | 41 | (5 | ) | (27 | ) | ||||||
Administrative fees | 12 | 14 | 14 | ||||||||
Professional fees and other costs related to the American Capital Acquisition | 45 | 15 | — | ||||||||
Other general and administrative | 32 | 27 | 30 | ||||||||
Total operating expenses | $ | 660 | $ | 497 | $ | 499 | |||||
Waiver of income based fees | (30 | ) | $ | — | $ | — | |||||
Total expenses, net of waiver of income based fees | $ | 630 | $ | 497 | $ | 499 | |||||
Interest and credit facility fees for the years ended December 31, 2017, 2016 and 2015, were comprised of the following:
For the Years Ended December 31, | |||||||||||
(in millions) | 2017 | 2016 | 2015 | ||||||||
Stated interest expense | $ | 189 | $ | 161 | $ | 183 | |||||
Facility fees | 12 | 5 | 10 | ||||||||
Amortization of debt issuance costs | 18 | 14 | 17 | ||||||||
Net accretion of discount on notes payable | 6 | 6 | 17 | ||||||||
Total interest and credit facility fees | $ | 225 | $ | 186 | $ | 227 | |||||
Stated interest expense for the year ended December 31, 2017 increased from the comparable period in 2016 primarily due to the increase in our average principal amount of debt outstanding. For the year ended December 31, 2017, our average debt outstanding increased to $4.6 billion as compared to $3.9 billion for the comparable period in 2016, which was largely a result of the American Capital Acquisition. The weighted average stated interest rate on our outstanding debt was 4.1% for both the year ended December 31, 2017 and for the comparable period in 2016. Facility fees for the year ended December 31, 2017 increased from the comparable period in 2016 primarily due to the increased commitments under our revolving facilities resulting in higher unused commitment fees. Amortization of debt issuance costs for the year ended December 31, 2017 increased from the comparable period in 2016 primarily due to the increase in debt issuance costs in connection with the amendments to the Revolving Credit Facility and Revolving Funding Facility.
Stated interest expense for the year ended December 31, 2016 decreased from the comparable period in 2015 primarily due to the decrease in our weighted average stated interest rate of our debt outstanding, partially offset by an increase in the average principal amount of debt outstanding. The weighted average stated interest rate on our outstanding debt was 4.1% for the year ended December 31, 2016 as compared to 5.0% for the comparable period in 2015 primarily as a result of the repayment upon maturity of certain higher cost of unsecured convertible notes and increased utilization of our lower cost revolving facilities. For the year ended December 31, 2016, our average principal debt outstanding increased to $3.9 billion as compared to $3.7 billion for the comparable period in 2015. Facility fees for the year ended December 31, 2016 decreased from the comparable period in 2015 primarily due to the increased utilization of our revolving facilities resulting in lower unused commitment fees. Amortization of debt issuance costs and net accretion of discount on notes payable for the year ended December 31, 2016 decreased from the comparable period in 2015 primarily due to the maturity of the $575 aggregate principal amount of unsecured convertible notes and the $230 aggregate principal amount of unsecured convertible notes.
The increase in base management fees for the year ended December 31, 2017 from the comparable period in 2016 was primarily due to the increase in the average size of the portfolio for the year ended December 31, 2017 (including the approximately $2.5 billion in investments acquired in the American Capital Acquisition) as compared to the year ended December 31, 2016. The increase in income based fees for the year ended December 31, 2017 from the comparable period in 2016 was primarily due to the pre-incentive fee net investment income, as defined in the investment advisory and management
74
agreement, for the year ended December 31, 2017 being higher than in the comparable periods in 2016. As discussed earlier, the year ended December 31, 2017 also reflects the Fee Waiver of $30 million.
For the year ended December 31, 2017, the capital gains incentive fee expense calculated in accordance with U.S. generally accepted accounting principles (“GAAP”) was $41 million. For the years ended December 31, 2016 and 2015, the reduction in capital gains incentive fees calculated in accordance with GAAP was $5 million and $27 million, respectively. The capital gains incentive fee expense accrual for the year ended December 31, 2017 changed from the comparable period in 2016 primarily due to net gains on investments, foreign currency and other transactions and the extinguishment of debt during the year ended December 31, 2017 of $156 million compared to net losses of $20 million during the year ended December 31, 2016. The capital gains incentive fee expense accrual for the year ended December 31, 2017 included an $11 million accrual related to the American Capital Acquisition as a result of the fair value of the net assets acquired exceeding the fair value of the merger consideration paid by us. The capital gains incentive fee expense accrual for the year ended December 31, 2016 changed from the comparable period in 2015 primarily due to net losses on investments, foreign currency and other transactions and the extinguishment of debt during the year ended December 31, 2016 of $20 million compared to net losses of $129 million during the year ended December 31, 2015. The capital gains incentive fee accrued under GAAP includes an accrual related to unrealized capital appreciation, whereas the capital gains incentive fee actually payable under our investment advisory and management agreement does not. There can be no assurance that such unrealized capital appreciation will be realized in the future. The accrual for any capital gains incentive fee under GAAP in a given period may result in an additional expense if such cumulative amount is greater than in the prior period or a reduction of previously recorded expense if such cumulative amount is less than in the prior period. If such cumulative amount is negative, then there is no accrual. As of December 31, 2017, 2016 and 2015, the total capital gains incentive fee accrual calculated in accordance with GAAP was $79 million, $38 million and $42 million, respectively. As of December 31, 2017 and 2016, there was no capital gains incentive fee actually payable under our investment advisory and management agreement. See Note 3 to our consolidated financial statements for the year ended December 31, 2017, for more information on the base management fees, income based fees and capital gains incentive fees.
Administrative fees represent fees paid to Ares Operations for our allocable portion of overhead and other expenses incurred by Ares Operations in performing its obligations under the administration agreement, including our allocable portion of the compensation, rent and other expenses of certain of our executive officers and their respective staffs. Administrative fees incurred related specifically to the American Capital Acquisition are included in professional fees and other costs related to the American Capital Acquisition as discussed below.
For the years ended December 31, 2017 and 2016, the Company incurred $45 million and $15 million, respectively, in professional fees and other costs related to the American Capital Acquisition. For the year ended December 31, 2017, these costs included $4 million of expenses related to a long term incentive plan liability assumed in the American Capital Acquisition. See Note 13 to our consolidated financial statements for the year ended December 31, 2017 for a description of the assumed long term incentive plan liability. For the year ended December 31, 2017, these costs also included $18 million in one-time investment banking fees incurred in January 2017 upon the closing of the American Capital Acquisition.
Other general and administrative expenses includes professional fees, rent and related utilities, insurance, marketing costs, director’s fees and depreciation, among other costs.
Income Tax Expense, Including Excise Tax
We have elected to be treated as a RIC under the Code and operate in a manner so as to qualify for the tax treatment applicable to RICs. To qualify as a RIC, we must generally (among other requirements) timely distribute to our stockholders at least 90% of our investment company taxable income, as defined by the Code, for each year. In order to maintain our RIC status, we have made and intend to continue to make the requisite distributions to our stockholders which will generally relieve us from U.S. federal corporate-level income taxes.
Depending on the level of taxable income earned in a tax year, we may choose to carry forward such taxable income in excess of current year dividend distributions from such current year taxable income into the next tax year and pay a 4% excise tax on such income, as required. If we determine that our estimated current year taxable income will be in excess of estimated dividend distributions for the current year from such income, we accrue excise tax on estimated excess taxable income as such taxable income is earned. For the years ended December 31, 2017, 2016 and 2015, we recorded a net expense of $12 million, $12 million and $9 million, respectively, for U.S. federal excise tax. The net expense for the years ended December 31, 2017, 2016 and 2015 each included a net reduction in expense related to the recording of a requested refund resulting from the overpayment of the prior year’s excise tax of $1 million, $1 million and $1 million, respectively.
75
Certain of our consolidated subsidiaries are subject to U.S. federal and state income taxes. For the years ended December 31, 2017, 2016 and 2015, we recorded a net tax expense of approximately $7 million, $9 million and $9 million, respectively, for these subsidiaries. The income tax expense for our taxable consolidated subsidiaries will vary depending on the level of realized gains from the exits of investments held by such taxable subsidiaries during the respective periods.
Net Realized Gains/Losses
The net realized gains from the sales, repayments or exits of investments during the years ended December 31, 2017, 2016 and 2015 were comprised of the following:
For the Years Ended December 31, | |||||||||||
(in millions) | 2017 | 2016 | 2015 | ||||||||
Sales, repayments or exits of investments(1) | $ | 7,037 | (2) | $ | 3,749 | (3) | $ | 3,741 | |||
Net realized gains on investments: | |||||||||||
Gross realized gains | 281 | $ | 121 | $ | 125 | ||||||
Gross realized losses | (237 | ) | (11 | ) | (4 | ) | |||||
Total net realized gains on investments | $ | 44 | (4) | $ | 110 | $ | 121 | ||||
_______________________________________________________________________________
(1) | Includes $134 million, $472 million and $538 million of investments sold to IHAM and certain vehicles managed by IHAM during the years ended December 31, 2017, 2016 and 2015, respectively. A net realized loss of $0 million was recorded on these transactions with IHAM during the year ended December 31, 2017. A net realized gain of $1 million and $1 million was recorded on these transactions with IHAM during the years ended December 31, 2016 and 2015, respectively. See Note 4 to our consolidated financial statements for the year ended December 31, 2017 for more detail on IHAM and its managed vehicles. |
(2) | Includes the $1.5 billion of proceeds from the SSLP Liquidation Distribution discussed above. |
(3) | Includes $474 million of investments sold to the SDLP in conjunction with the initial funding of the SDLP. No realized gains or losses were recorded on these transactions with the SDLP. |
(4) | Includes approximately $85 million of net realized gains on investments acquired as part of the American Capital Acquisition. |
76
The net realized gains on investments during the year ended December 31, 2017 consisted of the following:
(in millions) Portfolio Company | Net Realized Gains (Losses) | |||
Bellotto Holdings Limited | $ | 58 | ||
10th Street, LLC | 34 | |||
Community Education Centers, Inc. | 24 | |||
Tectum Holdings, Inc. | 17 | |||
American Broadband Holding Company | 15 | |||
NECCO Realty Investments LLC | 13 | |||
GHX Ultimate Parent Corporation | 11 | |||
Wilcon Holdings LLC | 10 | |||
La Paloma Generating Company, LLC | (9 | ) | ||
Pegasus Community Energy, LLC | (9 | ) | ||
The Greeley Company, Inc. and HCP Acquisition Holdings, LLC | (12 | ) | ||
Senior Secured Loan Fund LLC | (18 | ) | ||
Competitor Group, Inc., Calera XVI, LLC and Champion Parent Corporation | (21 | ) | ||
Infilaw Holding, LLC | (140 | ) | ||
Other, net | 71 | |||
Total, net | $ | 44 | ||
During the year ended December 31, 2017, we recognized net realized losses on foreign currency transactions of $20 million. In addition, during the year ended December 31, 2017, we redeemed the entire $183 million aggregate principal amount outstanding of the unsecured notes that were scheduled to mature on October 1, 2022 (the “October 2022 Notes”). The October 2022 Notes were redeemed at par plus accrued and unpaid interest for a total redemption price of approximately $185 million, which resulted in a realized loss on the extinguishment of debt of $4 million.
The net realized gains on investments during the year ended December 31, 2016 consisted of the following:
(in millions) Portfolio Company | Net Realized Gains (Losses) | |||
The Step2 Company, LLC | $ | 18 | ||
Napa Management Services Corporation | 16 | |||
UL Holding Co., LLC | 13 | |||
Physiotherapy Associates Holdings, Inc. | 8 | |||
Q9 Holdings Inc. | (9 | ) | ||
Other, net | 64 | |||
Total, net | $ | 110 | ||
The net realized gains on investments during the year ended December 31, 2015 consisted of the following:
(in millions) Portfolio Company | Net Realized Gains (Losses) | |||
Cast & Crew Payroll, LLC | $ | 26 | ||
Tripwire, Inc. | 14 | |||
TPP Holdings, LLC | 11 | |||
Global Healthcare Exchange, LLC | 8 | |||
Protective Industries, Inc. | 8 | |||
Other, net | 54 | |||
Total | $ | 121 | ||
77
During the year ended December 31, 2015, we recognized net realized gains on foreign currency transactions of $6 million. In addition, during the year ended December 31, 2015, we redeemed the entire $144 million aggregate principal amount outstanding of the unsecured notes that were scheduled to mature on February 15, 2022 (the “February 2022 Notes”). The February 2022 Notes were redeemed at par plus accrued and unpaid interest for a total redemption price of approximately $145 million, which resulted in a realized loss on the extinguishment of debt of $4 million. Also during the year ended December 31, 2016, the $200 million aggregate principal amount of unsecured notes that were scheduled to mature on October 15, 2040 were redeemed at par plus accrued and unpaid interest for a total redemption price of approximately $201 million, which resulted in a realized loss on the extinguishment of debt of $6 million.
Net Unrealized Gains/Losses
We value our portfolio investments quarterly and the changes in value are recorded as unrealized gains or losses in our consolidated statement of operations. Net unrealized gains and losses for our portfolio for the years ended December 31, 2017, 2016 and 2015, were comprised of the following:
For the Years Ended December 31, | |||||||||||
(in millions) | 2017 | 2016 | 2015 | ||||||||
Unrealized appreciation | $ | 331 | $ | 168 | $ | 116 | |||||
Unrealized depreciation | (301 | ) | (306 | ) | (304 | ) | |||||
Net unrealized (appreciation) depreciation reversed related to net realized gains or losses(1) | 113 | 13 | (60 | ) | |||||||
Total net unrealized gains (losses) | $ | 143 | $ | (125 | ) | $ | (248 | ) | |||
_______________________________________________________________________________
(1) | The net unrealized (appreciation) depreciation reversed related to net realized gains or losses represents the unrealized appreciation or depreciation recorded on the related asset at the end of the prior period. |
The changes in net unrealized appreciation and depreciation on investments during the year ended December 31, 2017 consisted of the following:
(in millions) Portfolio Company | Net Unrealized Appreciation (Depreciation) | |||
Alcami Holdings, LLC | $ | 167 | ||
Ivy Hill Asset Management, L.P. | 13 | |||
Columbo MidCo Limited | 13 | |||
CCS Intermediate Holdings, LLC | 12 | |||
Imperial Capital Private Opportunities, LP | 11 | |||
Ciena Capital LLC | 11 | |||
Singer Sewing Company | (9 | ) | ||
Shock Doctor, Inc. | (9 | ) | ||
Indra Holdings Corp. | (15 | ) | ||
ADF Capital, Inc. | (16 | ) | ||
Instituto de Banca y Comercio, Inc. | (23 | ) | ||
New Trident Holdcorp, Inc. | (45 | ) | ||
Other, net | (80 | ) | ||
Total | $ | 30 | ||
During the year ended December 31, 2017, we also recognized net unrealized losses on foreign currency and other transactions of $7 million.
78
The changes in net unrealized appreciation and depreciation during the year ended December 31, 2016 consisted of the following:
(in millions) Portfolio Company | Net Unrealized Appreciation (Depreciation) | |||
Senior Secured Loan Fund LLC | $ | 26 | ||
UL Holding Co., LLC | 20 | |||
Community Education Centers, Inc. | 19 | |||
ADF Capital, Inc. | (9 | ) | ||
10th Street, LLC | (9 | ) | ||
Indra Holdings Corp. | (11 | ) | ||
CCS Intermediate Holdings, LLC | (22 | ) | ||
Instituto de Banca y Comercio, Inc. | (52 | ) | ||
Infilaw Holdings, LLC | (127 | ) | ||
Other, net | 27 | |||
Total, net | $ | (138 | ) | |
During the year ended December 31, 2016, we also recognized net unrealized losses on foreign currency and other transactions of $5 million.
The changes in net unrealized appreciation and depreciation on investments during the year ended December 31, 2015 consisted of the following:
(in millions) Portfolio Company | Net Unrealized Appreciation (Depreciation) | |||
OTG Management, LLC | $ | 28 | ||
Ciena Capital LLC | 11 | |||
Green Energy Partners | (8 | ) | ||
Primexx Energy Corporation | (8 | ) | ||
Nodality, Inc. | (9 | ) | ||
Competitor Group, Inc. | (9 | ) | ||
2329497 Ontario Inc. | (10 | ) | ||
Instituto de Banca y Comercio, Inc. | (14 | ) | ||
CCS Intermediate Holdings, LLC | (14 | ) | ||
Infilaw Holdings, LLC | (14 | ) | ||
Ivy Hill Asset Management, L.P. | (24 | ) | ||
Petroflow Energy Corporation | (26 | ) | ||
Senior Secured Loan Fund LLC | (77 | ) | ||
Other, net | (14 | ) | ||
Total | $ | (188 | ) | |
During the year ended December 31, 2015, we also recognized net unrealized gains on foreign currency transactions of $2 million.
79
FINANCIAL CONDITION, LIQUIDITY AND CAPITAL RESOURCES
Our liquidity and capital resources are generated primarily from the net proceeds of public offerings of equity and debt securities, advances from the Revolving Credit Facility, the Revolving Funding Facility and the SMBC Funding Facility (each as defined below, and together, the “Facilities”), net proceeds from the issuance of other securities, including unsecured notes and Small Business Administration (“SBA”)-guaranteed debentures (the “SBA Debentures”), as well as cash flows from operations.
As of December 31, 2017, we had $316 million in cash and cash equivalents and $4.9 billion in total aggregate principal amount of debt outstanding ($4.9 billion at carrying value). Subject to leverage, borrowing base and other restrictions, we had approximately $2.5 billion available for additional borrowings under the Facilities and the SBA Debentures as of December 31, 2017.
We may from time to time seek to retire or repurchase our common stock through cash purchases, as well as retire, cancel or purchase our outstanding debt through cash purchases and/or exchanges, in open market purchases, privately negotiated transactions or otherwise. Such purchases or exchanges, if any, will depend on prevailing market conditions, our liquidity requirements, contractual and regulatory restrictions and other factors. The amounts involved may be material. In addition, we may from time to time enter into additional debt facilities, increase the size of existing facilities or issue additional debt securities, including unsecured debt and/or debt securities convertible into common stock. Any such incurrence or issuance would be subject to prevailing market conditions, our liquidity requirements, contractual and regulatory restrictions and other factors. In accordance with the Investment Company Act, with certain limited exceptions, we are only allowed to borrow amounts such that our asset coverage, calculated pursuant to the Investment Company Act, is at least 200% after such borrowing. On June 21, 2016, we received exemptive relief from the SEC allowing us to modify our calculation of asset coverage requirements to exclude the SBA Debentures. This exemptive relief provides us with increased investment flexibility but also increases our risk related to leverage. As of December 31, 2017, our asset coverage was 242% (excluding the SBA Debentures).
Equity Capital Activities
As of December 31, 2017 and 2016, our total equity market capitalization was $6.7 billion and $5.2 billion, respectively. There were no sales of our equity securities during the years ended December 31, 2017, 2016 and 2015.
On the Acquisition Date, in connection with the American Capital Acquisition, we issued 112 million shares valued at approximately $16.42 per share.
In September 2015, our board of directors approved a stock repurchase program authorizing us to repurchase up to $100 million in the aggregate of our outstanding common stock in the open market at certain thresholds below our net asset value per share, in accordance with the guidelines specified in Rule 10b-18 under the Securities Exchange Act of 1934, as amended. The timing, manner, price and amount of any share repurchases will be determined by us, in our discretion, based upon the evaluation of economic and market conditions, stock price, applicable legal and regulatory requirements and other factors. In May 2016, we suspended our stock repurchase program pending the completion of the American Capital Acquisition. In February 2017, our board of directors authorized an amendment to our stock repurchase program to (a) increase the total authorization under the program from $100 million to $300 million and (b) extend the expiration date of the program from February 28, 2017 to February 28, 2018. Under the stock repurchase program, we may repurchase up to $300 million in the aggregate of our outstanding common stock in the open market at a price per share that meets certain thresholds below our net asset value per share, in accordance with the guidelines specified in Rule 10b-18 of the Exchange Act. The program does not require us to repurchase any specific number of shares and we cannot assure stockholders that any shares will be repurchased under the program. The program may be suspended, extended, modified or discontinued at any time.
As of December 31, 2017, we had repurchased a total of 0.5 million shares of our common stock in the open market under the stock repurchase program since its inception in September 2015, at an average price of $13.92 per share, including commissions paid, leaving approximately $293 million available for additional repurchases under the program.
See "Recent Developments," as well as Note 18 to our consolidated financial statements for the year ended December 31, 2017 for a subsequent event relating to our stock repurchase program.
80
Debt Capital Activities
Our debt obligations consisted of the following as of December 31, 2017 and 2016:
As of December 31, | ||||||||||||||||||||||||
2017 | 2016 | |||||||||||||||||||||||
(in millions) | Total Aggregate Principal Amount Available/ Outstanding(1) | Principal Amount | Carrying Value | Total Aggregate Principal Amount Available/ Outstanding(1) | Principal Amount | Carrying Value | ||||||||||||||||||
Revolving Credit Facility | $ | 2,108 | (2) | $ | 395 | $ | 395 | $ | 1,265 | $ | 571 | $ | 571 | |||||||||||
Revolving Funding Facility | 1,000 | 600 | 600 | 540 | 155 | 155 | ||||||||||||||||||
SMBC Funding Facility | 400 | 60 | 60 | 400 | 105 | 105 | ||||||||||||||||||
SBA Debentures | 50 | — | — | 75 | 25 | 24 | ||||||||||||||||||
2017 Convertible Notes | — | — | (3) | 162 | 162 | 162 | (4) | |||||||||||||||||
2018 Convertible Notes | 270 | 270 | 270 | (4) | 270 | 270 | 267 | (4) | ||||||||||||||||
2019 Convertible Notes | 300 | 300 | 298 | (4) | 300 | 300 | 296 | (4) | ||||||||||||||||
2022 Convertible Notes | 388 | 388 | 368 | (4) | — | — | — | |||||||||||||||||
2018 Notes | 750 | 750 | 748 | (5) | 750 | 750 | 745 | (5) | ||||||||||||||||
2020 Notes | 600 | 600 | 597 | (6) | 600 | 600 | 596 | (6) | ||||||||||||||||
January 2022 Notes | 600 | 600 | 593 | (7) | 600 | 600 | 592 | (7) | ||||||||||||||||
October 2022 Notes | — | — | — | (8) | 183 | 183 | 179 | (9) | ||||||||||||||||
2023 Notes | 750 | 750 | 743 | (10) | — | — | — | |||||||||||||||||
2047 Notes | 230 | 230 | 182 | (11) | 230 | 230 | 182 | (11) | ||||||||||||||||
Total | $ | 7,446 | $ | 4,943 | $ | 4,854 | $ | 5,375 | $ | 3,951 | $ | 3,874 | ||||||||||||
________________________________________
(1) | Subject to borrowing base, leverage and other restrictions. Represents the total aggregate amount committed or outstanding, as applicable, under such instrument. |
(2) | Provides for a feature that allows us, under certain circumstances, to increase the size of the Revolving Credit Facility (as defined below) to a maximum of $3.1 billion. |
(3) | See below for more information on the repayment of the 2017 Convertible Notes (as defined below) at maturity. |
(4) | Represents the aggregate principal amount outstanding of the Convertible Unsecured Notes (as defined below). As of December 31, 2017, the total unamortized debt issuance costs and the unaccreted discount for the 2018 Convertible Notes, the 2019 Convertible Notes and the 2022 Convertible Notes (each as defined below) were $0 million, $2 million and $20 million, respectively. As of December 31, 2016, the total unamortized debt issuance costs and the unaccreted discount for the 2017 Convertible Notes, the 2018 Convertible Notes and the 2019 Convertible Notes (each as defined below) were $0 million, $3 million and $4 million, respectively. |
(5) | Represents the aggregate principal amount outstanding of the 2018 Notes (as defined below) less unamortized debt issuance costs and plus the net unamortized premium that was recorded upon the issuances of the 2018 Notes. As of December 31, 2017 and 2016, the total unamortized debt issuance costs less the net unamortized premium were $2 million and $5 million, respectively. |
(6) | Represents the aggregate principal amount outstanding of the 2020 Notes (as defined below) less unamortized debt issuance costs and the net unaccreted discount recorded upon the issuances of the 2020 Notes. As of December 31, 2017 and 2016, the total unamortized debt issuance costs and the net unaccreted discount were $3 million and $4 million, respectively. |
81
(7) | Represents the aggregate principal amount outstanding of the January 2022 Notes (as defined below) less unamortized debt issuance costs and the net unaccreted discount recorded upon the issuances of the January 2022 Notes. As of December 31, 2017 and 2016, the total unamortized debt issuance costs and the net unaccreted discount were $7 million and $8 million, respectively. |
(8) | See above for more information on the repayment of the October 2022 Notes. |
(9) | Represents the aggregate principal amount outstanding of the October 2022 Notes less unamortized debt issuance costs. As of December 31, 2016, the total unamortized debt issuance costs was $4 million. |
(10) | Represents the aggregate principal amount outstanding of the 2023 Notes (as defined below), less unamortized debt issuance costs and the unaccreted discount recorded upon the issuance of the 2023 Notes. As of December 31, 2017, the total unamortized debt issuance costs and the unaccreted discount was $7 million. |
(11) | Represents the aggregate principal amount outstanding of the 2047 Notes (as defined below) less the unaccreted purchased discount recorded as part of the acquisition of Allied Capital in April 2010 (the “Allied Acquisition”). As of December 31, 2017 and 2016, the total unaccreted purchased discount was $48 million and $48 million, respectively. |
The weighted average stated interest rate and weighted average maturity, both on aggregate principal amount, of all our debt outstanding as of December 31, 2017 were 4.1% and 4.3 years, respectively, and as of December 31, 2016 were 4.2% and 4.8 years, respectively.
The ratio of total principal amount of debt outstanding to stockholders’ equity as of December 31, 2017 was 0.70:1.00 compared to 0.77:1.00 as of December 31, 2016.
Revolving Credit Facility
We are party to a senior secured revolving credit facility (as amended and restated, the “Revolving Credit Facility”), that allows us to borrow up to $2.1 billion at any one time outstanding. The Revolving Credit Facility consists of a $395 million term loan tranche with a stated maturity date of January 4, 2022 and a $1.7 billion revolving tranche. For $1.6 billion of the revolving tranche, the end of the revolving period and the stated maturity date are January 4, 2021 and January 4, 2022, respectively. For $38 million of the revolving tranche, the end of the revolving period and the stated maturity date are May 4, 2020 and May 4, 2021, respectively. For the remaining $45 million of the revolving tranche, the end of the revolving period and the stated maturity date are May 4, 2019 and May 4, 2020, respectively. The Revolving Credit Facility also provides for a feature that allows us, under certain circumstances, to increase the overall size of the Revolving Credit Facility to a maximum of $3.1 billion. The interest rate charged on the Revolving Credit Facility is based on an applicable spread of either 1.75% or 2.00% over LIBOR or 0.75% or 1.00% over an “alternate base rate” (as defined in the agreements governing the Revolving Credit Facility), in each case, determined monthly based on the total amount of the borrowing base relative to the total commitments of the Revolving Credit Facility and other debt, if any, secured by the same collateral as the Revolving Credit Facility. As of December 31, 2017, the interest rate in effect was LIBOR plus 1.75%. We are also required to pay a letter of credit fee of either 2.00% or 2.25% per annum on letters of credit issued, determined monthly based on the total amount of the borrowing base relative to the total commitments of the Revolving Credit Facility and other debt, if any, secured by the same collateral as the Revolving Credit Facility. Additionally, we are required to pay a commitment fee of 0.375% per annum on any unused portion of the Revolving Credit Facility. As of December 31, 2017, there was $395 million outstanding under the Revolving Credit Facility and we were in compliance in all material respects with the terms of the Revolving Credit Facility.
Revolving Funding Facility
Our consolidated subsidiary, Ares Capital CP Funding LLC (“Ares Capital CP”) is party to a revolving funding facility (as amended, the “Revolving Funding Facility”), that allows Ares Capital CP to borrow up to $1 billion at any one time outstanding. The Revolving Funding Facility is secured by all of the assets held by, and the membership interest in, Ares Capital CP. The end of the reinvestment period and the stated maturity date for the Revolving Funding Facility are January 3, 2019 and January 3, 2022, respectively. As of December 31, 2017, the interest rate charged on the Revolving Funding Facility was based on LIBOR plus 2.15% per annum or a “base rate” (as defined in the agreements governing the Revolving Funding Facility) plus 1.15% per annum. Ares Capital CP is also required to pay a commitment fee of between 0.50% and 1.50% per annum depending on the size of the unused portion of the Revolving Funding Facility. As of December 31, 2017, there was $600 million outstanding under the Revolving Funding Facility and we and Ares Capital CP were in compliance in all material respects with the terms of the Revolving Funding Facility.
82
SMBC Funding Facility
Our consolidated subsidiary, Ares Capital JB Funding LLC (“ACJB”), is party to a revolving funding facility (as amended, the “SMBC Funding Facility”) that allows ACJB to borrow up to $400 million at any one time outstanding. The SMBC Funding Facility is secured by all of the assets held by ACJB. As of December 31, 2017, the end of the reinvestment period and the stated maturity date for the SMBC Funding Facility were September 14, 2018 and September 14, 2023, respectively. The reinvestment period and the stated maturity date are both subject to two one-year extensions by mutual agreement. The interest rate charged on the SMBC Funding Facility is based on an applicable spread of either 1.75% or 2.00% over LIBOR or 0.75% or 1.00% over a “base rate” (as defined in the agreements governing the SMBC Funding Facility), in each case, determined monthly based on the amount of the average borrowings outstanding under the SMBC Funding Facility. As of December 31, 2017, the interest rate in effect was LIBOR plus 2.00%. Additionally, ACJB is required to pay a commitment fee of between 0.35% and 0.875% per annum depending on the size of the unused portion of the SMBC Funding Facility. As of December 31, 2017, there was $60 million outstanding under the SMBC Funding Facility and we and ACJB were in compliance in all material respects with the terms of the SMBC Funding Facility.
SBA Debentures
In April 2015, our consolidated subsidiary, Ares Venture Finance, L.P. (“AVF LP”), received a license from the SBA to operate as a Small Business Investment Company (“SBIC”) under the provisions of Section 301(c) of the Small Business Investment Act of 1958, as amended. The SBA places certain limitations on the financing of investments by SBICs in portfolio companies, including regulating the types of financings, restricting investments to only include small businesses with certain characteristics or in certain industries, and requiring capitalization thresholds that may limit distributions to us.
The license from the SBA allows AVF LP to obtain leverage by issuing SBA Debentures, subject to issuance of a capital commitment by the SBA and other customary procedures. Leverage through the SBA Debentures is subject to required capitalization thresholds. Current SBA regulations limit the amount that any SBIC may borrow to $150 million and the original amount committed to AVF LP by the SBA was $75 million. Any undrawn commitments expire on September 30, 2019. The SBA Debentures are non-recourse to us, have interest payable semi-annually, have a 10-year maturity and may be prepaid at any time without penalty. In September 2017, AVF LP fully repaid the $25 million of the aggregate principal amount of the SBA Debentures outstanding at the time, and as a result had $50 million of remaining commitments to AVF LP by the SBA. As of December 31, 2017, AVF LP was in compliance in all material respects with SBA regulatory requirements.
The interest rate for the SBA Debentures were fixed at the time the SBA Debentures and other applicable SBA-guaranteed debentures were pooled and sold to the public and were based on a spread over U.S. treasury notes with 10-year maturities. The pooling of newly issued SBA-guaranteed debentures occurred twice per year. The spread included an annual charge as determined by the SBA (the “Annual Charge”) as well as a market-driven component. Prior to the 10-year fixed interest rate being determined, the interim interest rate charged for the SBA Debentures was based on LIBOR plus an applicable spread of 0.30% and the Annual Charge. As of December 31, 2016, the weighted average fixed interest rate in effect for the SBA Debentures was 3.48%.
Convertible Unsecured Notes
We have issued $270 million aggregate principal amount of unsecured convertible notes that mature on January 15, 2018 (the “2018 Convertible Notes”), $300 million aggregate principal amount of unsecured convertible notes that mature on January 15, 2019 (the “2019 Convertible Notes”) and the $388 million aggregate principal amount of unsecured convertible notes that mature on February 1, 2022 (the “2022 Convertible Notes” and together with the 2018 Convertible Notes and the 2019 Convertible Notes, the “Convertible Unsecured Notes”). The Convertible Unsecured Notes mature upon their respective maturity dates unless previously converted or repurchased in accordance with their terms. We do not have the right to redeem the Convertible Unsecured Notes prior to maturity. The 2018 Convertible Notes, the 2019 Convertible Notes and the 2022 Convertible Notes bear interest at a rate of 4.75%, 4.375% and 3.75%, respectively, per year, payable semi-annually.
Certain key terms related to the convertible features for each of the Convertible Unsecured Notes as of December 31, 2017 are listed below.
83
2018 Convertible Notes | 2019 Convertible Notes | 2022 Convertible Notes | ||||||||||
Conversion premium | 17.5 | % | 15.0 | % | 15.0 | % | ||||||
Closing stock price at issuance | $ | 16.91 | $ | 17.53 | $ | 16.86 | ||||||
Closing stock price date | October 3, 2012 | July 15, 2013 | January 23, 2017 | |||||||||
Conversion price(1) | $ | 19.64 | $ | 19.99 | $ | 19.39 | ||||||
Conversion rate (shares per one thousand dollar principal amount)(1) | 50.9054 | 50.0292 | 51.5756 | |||||||||
Conversion dates | July 15, 2017 | July 15, 2018 | August 1, 2021 | |||||||||
________________________________________
(1) | Represents conversion price and conversion rate, as applicable, as of December 31, 2017, taking into account certain de minimis adjustments that will be made on the conversion date. |
In certain circumstances, the Convertible Unsecured Notes will be convertible into cash, shares of our common stock or a combination of cash and shares of our common stock, at our election, at their respective conversion rates (listed below as of December 31, 2017) subject to customary anti-dilution adjustments and the requirements of their respective indenture (the “Convertible Unsecured Notes Indentures”). To the extent the 2018 Convertible Notes are converted, we have elected to settle with a combination of cash and shares of our common stock. Prior to the close of business on the business day immediately preceding their respective conversion date (listed below), holders may convert their Convertible Unsecured Notes only under certain circumstances set forth in the respective Convertible Unsecured Notes Indenture. On or after their respective conversion dates until the close of business on the scheduled trading day immediately preceding their respective maturity date, holders may convert their Convertible Unsecured Notes at any time. In addition, if we engage in certain corporate events as described in their respective Convertible Unsecured Notes Indenture, holders of the Convertible Unsecured Notes may require us to repurchase for cash all or part of the Convertible Unsecured Notes at a repurchase price equal to 100% of the principal amount of the Convertible Unsecured Notes to be repurchased, plus accrued and unpaid interest through, but excluding, the required repurchase date.
In March 2017, we repaid in full $162 million in aggregate principal amount of the unsecured convertible notes due in March 2017 (the “2017 Convertible Notes”) at par upon their maturity.
Unsecured Notes
2018 Notes
We have issued $750 million in aggregate principal amount of unsecured notes, which bear interest at a rate of 4.875% per year and mature on November 30, 2018 (the “2018 Notes”). The 2018 Notes require payment of interest semi-annually, and all principal is due upon maturity. These notes are redeemable in whole or in part at any time at our option at a redemption price equal to par plus a “make whole” premium, as determined pursuant to the indenture governing the 2018 Notes, and any accrued and unpaid interest.
2020 Notes
We have issued $600 million in aggregate principal amount of unsecured notes, which bear interest at a rate of 3.875% per year and mature on January 15, 2020 (the “2020 Notes”). The 2020 Notes require payment of interest semi-annually, and all principal is due upon maturity. These notes are redeemable in whole or in part at any time at our option at a redemption price equal to par plus a “make whole” premium, if applicable, as determined pursuant to the indenture governing the 2020 Notes, and any accrued and unpaid interest.
January 2022 Notes
We have issued $600 million in aggregate principal amount of unsecured notes, which bear interest at a rate of 3.625% per year and mature on January 19, 2022 (the “January 2022 Notes”). The January 2022 Notes require payment of interest semi-annually, and all principal is due upon maturity. These notes are redeemable in whole or in part at any time at our option at a redemption price equal to par plus a “make whole” premium, if applicable, as determined pursuant to the indenture governing the January 2022 Notes, and any accrued and unpaid interest.
84
2023 Notes
We have issued $750 million in aggregate principal amount of unsecured notes, that mature on February 10, 2023 (the “2023 Notes”). The 2023 Notes bear interest at a rate of 3.500% per year, payable semi annually and all principal is due upon maturity. The 2023 Notes may be redeemed in whole or in part at any time at our option at a redemption price equal to par plus a “make whole” premium, if applicable, as determined pursuant to the indenture governing the 2023 Notes, and any accrued and unpaid interest.
2047 Notes
As part of the Allied Acquisition, we assumed $230 million aggregate principal amount of unsecured notes which bear interest at a rate of 6.875% and mature on April 15, 2047 (the “2047 Notes” and together with the 2018 Notes, the 2020 Notes, the January 2022 Notes and the 2023 Notes, the “Unsecured Notes”). The 2047 Notes require payment of interest quarterly, and all principal is due upon maturity. These notes are redeemable in whole or in part at any time or from time to time at our option, at a par redemption price of $25.00 per security plus accrued and unpaid interest.
See “Recent Developments,” as well as Note 18 to our consolidated financial statements for the year ended December 31, 2017 for a subsequent event relating to an additional issuance of unsecured notes.
As of December 31, 2017, we were in compliance in all material respects with the terms of the Convertible Unsecured Notes Indentures and the indentures governing the Unsecured Notes.
The Convertible Unsecured Notes and the Unsecured Notes are our senior unsecured obligations and rank senior in right of payment to any future indebtedness that is expressly subordinated in right of payment to the Convertible Unsecured Notes and the Unsecured Notes; equal in right of payment to our existing and future unsecured indebtedness that is not expressly subordinated; effectively junior in right of payment to any of our secured indebtedness (including existing unsecured indebtedness that we later secure) to the extent of the value of the assets securing such indebtedness; and structurally junior to all existing and future indebtedness (including trade payables) incurred by our subsidiaries, financing vehicles or similar facilities.
See Note 5 to our consolidated financial statements for the year ended December 31, 2017 for more information on our debt obligations.
CONTRACTUAL OBLIGATIONS
A summary of the maturities of our principal amounts of debt and other contractual payment obligations as of December 31, 2017 are as follows:
Payments Due by Period | ||||||||||||||||||||
(in millions) | Total | Less than 1 year | 1-3 years | 3-5 years | After 5 years | |||||||||||||||
Revolving Credit Facility | $ | 395 | $ | — | $ | — | $ | 395 | $ | — | ||||||||||
Revolving Funding Facility | 600 | — | — | 600 | (1) | — | ||||||||||||||
SMBC Funding Facility | 60 | — | — | — | 60 | (2) | ||||||||||||||
2018 Convertible Notes | 270 | 270 | — | — | — | |||||||||||||||
2019 Convertible Notes | 300 | — | 300 | — | — | |||||||||||||||
2022 Convertible Notes | 388 | 388 | — | |||||||||||||||||
2018 Notes | 750 | 750 | — | — | — | |||||||||||||||
2020 Notes | 600 | — | 600 | — | ||||||||||||||||
January 2022 Notes | 600 | 600 | ||||||||||||||||||
2023 Notes | 750 | 750 | ||||||||||||||||||
2047 Notes | 230 | — | — | — | 230 | |||||||||||||||
Operating lease obligations(3) | $ | 192 | 26 | 50 | 51 | 65 | ||||||||||||||
$ | 5,135 | $ | 1,046 | $ | 950 | $ | 2,034 | $ | 1,105 | |||||||||||
85
_______________________________________________________________________________
(1) | As of December 31, 2017, the end of the reinvestment period for the Revolving Funding Facility was January 3, 2019. Subsequent to the end of this reinvestment period and prior to the stated maturity date of January 3, 2022, any principal proceeds from sales and repayments of loan assets held by Ares Capital CP will be used to repay the aggregate principal amount outstanding. |
(2) | As of December 31, 2017, the end of the reinvestment period for the SMBC Funding Facility was September 14, 2018. Subsequent to the end of this reinvestment period and prior to the stated maturity date of September 14, 2023, any principal proceeds from sales and repayments of loan assets held by ACJB will be used to repay the aggregate principal amount outstanding. |
(3) | We are obligated under a number of operating leases and subleases to pay for office spaces with terms ranging from less than one year to more than 5 years. See Note 7 to our consolidated financial statements for the year ended December 31, 2017 for more information on our lease obligations. |
OFF BALANCE SHEET ARRANGEMENTS
We have various commitments to fund investments in our portfolio, as described below.
As of December 31, 2017 and 2016, we had the following commitments to fund various revolving and delayed draw senior secured and subordinated loans, including commitments to fund which are at (or substantially at) our discretion:
As of December 31, | |||||||
(in millions) | 2017 | 2016 | |||||
Total revolving and delayed draw loan commitments | $ | 881 | $ | 411 | |||
Less: drawn commitments | (201 | ) | (81 | ) | |||
Total undrawn commitments | 680 | 330 | |||||
Less: commitments substantially at our discretion | (11 | ) | (12 | ) | |||
Less: unavailable commitments due to borrowing base or other covenant restrictions | — | — | |||||
Total net adjusted undrawn revolving and delayed draw loan commitments | $ | 669 | $ | 318 | |||
Included within the total revolving and delayed draw loan commitments as of December 31, 2017 and 2016 were delayed draw loan commitments totaling $251 million and $92 million, respectively. Our commitment to fund delayed draw loans is triggered upon the satisfaction of certain pre-negotiated terms and conditions. Generally, the most significant and uncertain term requires the borrower to satisfy a specific use of proceeds covenant. The use of proceeds covenant typically requires the borrower to use the additional loans for the specific purpose of a permitted acquisition or permitted investment, for example. In addition to the use of proceeds covenant, the borrower is generally required to satisfy additional negotiated covenants (including specified leverage levels).
Also included within the total revolving and delayed draw loan commitments as of December 31, 2017 were commitments to issue up to $158 million in letters of credit through a financial intermediary on behalf of certain portfolio companies. As of December 31, 2017, we had $29 million in letters of credit issued and outstanding under these commitments on behalf of the portfolio companies. For all these letters of credit issued and outstanding, we would be required to make payments to third parties if the portfolio companies were to default on their related payment obligations. Of these letters of credit, $28 million expire in 2018 and $1 million expires in 2019. As of December 31, 2017, we recorded a liability of $7 million for certain letters of credit issued and outstanding and none of the other letters of credit issued and outstanding were recorded as a liability on our balance sheet as such other letters of credit are considered in the valuation of the investments in the portfolio company.
We also have commitments to co-invest in the SDLP for our portion of the SDLP’s commitments to fund delayed draw loans to certain portfolio companies of the SDLP. We previously had commitments to co invest in the SSLP for our portion of the SSLP’s commitments to fund delayed draw loans to certain portfolio companies of the SSLP. See “Senior Direct Lending Program” and “Senior Secured Loan Program” above and Note 4 to our consolidated financial statements for the year ended December 31, 2017 for more information.
86
As of December 31, 2017 and 2016, we were party to subscription agreements to fund equity investments in private equity investment partnerships as follows:
As of December 31, | |||||||
(in millions) | 2017 | 2016 | |||||
Total private equity commitments | $ | 111 | $ | 57 | |||
Less: funded private equity commitments | (62 | ) | (17 | ) | |||
Total unfunded private equity commitments | 49 | 40 | |||||
Less: private equity commitments substantially our discretion | (48 | ) | (39 | ) | |||
Total net adjusted unfunded private equity commitments | $ | 1 | $ | 1 | |||
In the ordinary course of business, we may sell certain of our investments to third party purchasers. In particular, in connection with the sale of certain controlled portfolio company equity investments (as well as certain other sales), we have, and may continue to do so in the future, agreed to indemnify such purchasers for future liabilities arising from the investments and the related sale transaction. Such indemnification provisions have given rise to liabilities in the past and may do so in the future.
In addition, in the ordinary course of business, we may guarantee certain obligations in connection with our portfolio companies (in particular, certain controlled portfolio companies). Under these guarantee arrangements, payments may be required to be made to third parties if such guarantees are called upon or if the portfolio companies were to default on their related obligations, as applicable.
RECENT DEVELOPMENTS
In January 2018, we issued $600 million aggregate principal amount of unsecured notes that mature on March 1, 2025 (the “2025 Notes”). The 2025 Notes bear interest at a rate of 4.25% per year, payable semi‑annually on March 1 and September 1 of each year, commencing on September 1, 2018. The 2025 Notes may be redeemed in whole or in part at our option at any time at the redemption prices as determined pursuant to the indenture governing the 2025 Notes.
In January 2018, the SDLP’s total available capital was increased from $2.9 billion to $6.4 billion. In connection with this expansion, Varagon and its clients agreed to make capital available to the SDLP of up to approximately $5.0 billion and we agreed to make capital available to the SDLP of up to approximately $1.4 billion. We will continue to provide capital to the SDLP in the form of SDLP Certificates, and Varagon and its clients will provide capital to the SDLP in the form of senior notes, intermediate funding notes and SDLP Certificates. Investment of any unfunded amount must be approved by the investment committee of the SDLP consisting of representatives of ours and Varagon (with approval from a representative of each required).
In February 2018, our board of directors authorized an amendment to our $300 million stock repurchase program to extend the expiration date of the program from February 28, 2018 to February 28, 2019. Under the stock repurchase program, we may repurchase up to $300 million in the aggregate of our outstanding common stock in the open market at a price per share that meets certain thresholds below our net asset value per share, in accordance with the guidelines specified in Rule 10b-18 of the Exchange Act. The timing, manner, price and amount of any share repurchases will be determined by us, in our discretion, based upon the evaluation of economic and market conditions, stock price, applicable legal and regulatory requirements and other factors.
From January 1, 2018 through February 8, 2018, we made new investment commitments of approximately $938 million, of which $749 million were funded. Of these new commitments, 48% were in first lien senior secured loans, 21% were in other equity securities, 18% were in senior subordinated loans, 7% were in second lien senior secured loans and 6% were in investments in the SDLP Certificates to make co-investments with Varagon and its clients in floating rate first lien senior secured loans through the SDLP. Of the approximately $938 million of new investment commitments, 68% were floating rate, 11% fixed rate and 21% were non-interest bearing. The weighted average yield of debt and other income producing securities funded during the period at amortized cost was 9.6%. We may seek to sell all or a portion of these new investment commitments, although there can be no assurance that we will be able to do so.
From January 1, 2018 through February 8, 2018, we exited approximately $871 million of investment commitments, including $166 million of investment commitments acquired in the American Capital Acquisition. Of the total investment commitments exited, 60% were first lien senior secured loans, 33% were second lien senior secured loans, 3% were senior
87
subordinated loans, 3% were investments in the SDLP Certificates and 1% was other equity securities. Of the approximately $871 million of exited investment commitments, 99% were floating rate and 1% was non-interest bearing. The weighted average yield of debt and other income producing securities exited or repaid during the period at amortized cost was 8.5% and the weighted average yield on total investments exited or repaid during the period at amortized cost was 8.3%. On the approximately $871 million of investment commitments exited from January 1, 2018 through February 8, 2018, we recognized total net realized gains of approximately $3 million.
In addition, as of February 8, 2018, we had an investment backlog and pipeline of approximately $505 million and $240 million, respectively. Investment backlog includes transactions approved by our investment adviser’s investment committee and/or for which a formal mandate, letter of intent or a signed commitment have been issued, and therefore we believe are likely to close. Investment pipeline includes transactions where due diligence and analysis are in process, but no formal mandate, letter of intent or signed commitment have been issued. The consummation of any of the investments in this backlog and pipeline depends upon, among other things, one or more of the following: satisfactory completion of our due diligence investigation of the prospective portfolio company, our acceptance of the terms and structure of such investment and the execution and delivery of satisfactory transaction documentation. In addition, we may sell all or a portion of these investments and certain of these investments may result in the repayment of existing investments. We cannot assure you that we will make any of these investments or that we will sell all or any portion of these investments.
CRITICAL ACCOUNTING POLICIES
See Note 2 to our consolidated financial statements for the year ended December 31, 2017, which describes our critical accounting policies.
Recent Accounting Pronouncements
In February 2016, the Financial Accounting Standards Board issued Accounting Standards Update (“ASU”) No. 2016‑02, Leases (Topic 842). The guidance in this ASU supersedes the leasing guidance in Leases (Topic 840). Under the new guidance, lessees are required to recognize lease assets and lease liabilities on the balance sheet for those leases previously classified as operating leases. The guidance requires the use of a modified retrospective transition approach, which includes a number of optional practical expedients that entities may elect to apply. The amendments in ASU No. 2016‑02 are effective for annual reporting periods beginning after December 15, 2018, including interim periods within that reporting period, with early adoption permitted. While we are currently evaluating the impact of ASU No. 2016-02, we expect an increase to the consolidated balance sheets for the lease assets and associated lease liabilities for our lease agreements previously accounted for as operating leases.
Item 7A. Quantitative and Qualitative Disclosures About Market Risk
We are subject to financial market risks, including changes in interest rates and the valuations of our investment portfolio.
Interest Rate Risk
Interest rate sensitivity refers to the change in our earnings that may result from changes in the level of interest rates. Because we fund a portion of our investments with borrowings, our net investment income is affected by the difference between the rate at which we invest and the rate at which we borrow. As a result, there can be no assurance that a significant change in market interest rates will not have a material adverse effect on our net investment income. See “Risk Factors—Risks Relating to Our Business—We are exposed to risks associated with changes in interest rates.”
As of December 31, 2017, 81% of the investments at fair value in our portfolio bore interest at variable rates, 8% bore interest at fixed rates, 10% were non-interest earning and 1% were on non-accrual status. Additionally, for the variable rate investments, 94% of these investments contained interest rate floors (representing 76% of total investments at fair value). Also, as of December 31, 2017, all the loans made through the SDLP contained interest rate floors. The Facilities all bear interest at variable rates with no interest rate floors, while the SBA Debentures, the Unsecured Notes and the Convertible Unsecured Notes bear interest at fixed rates.
We regularly measure our exposure to interest rate risk. We assess interest rate risk and manage our interest rate exposure on an ongoing basis by comparing our interest rate sensitive assets to our interest rate sensitive liabilities. Based on
88
that review, we determine whether or not any hedging transactions are necessary to mitigate exposure to changes in interest rates.
While hedging activities may mitigate our exposure to adverse fluctuations in interest rates, certain hedging transactions that we may enter into in the future, such as interest rate swap agreements, may also limit our ability to participate in the benefits of lower interest rates with respect to our portfolio investments. In addition, there can be no assurance that we will be able to effectively hedge our interest rate risk. See “Risk Factors—Risks Relating to Our Investments—We may expose ourselves to risks if we engage in hedging transactions.”
In December 2017, in connection with the $395 million term loan tranche of our Revolving Credit Facility, we entered into a three-year interest rate swap agreement for a total notional amount of $395 million. Under the interest rate swap agreement, we will pay a fixed interest rate of 2.06% and receive a floating rate based on the prevailing one-month LIBOR. See Note 5 to our consolidated financial statements for the year ended December 31, 2017 for more information on the Revolving Credit Facility and see Note 6 to our consolidated financial statements for the year ended December 31, 2017 for more information on the interest rate swap.
Based on our December 31, 2017, balance sheet, the following table shows the annual impact on net income of base rate changes in interest rates (considering interest rate floors for variable rate instruments) assuming no changes in our investment and borrowing structure and reflecting the effect of our interest rate swap agreement discussed in the paragraph above:
(in millions) Basis Point Change | Interest Income | Interest Expense(1) | Net Income(2) | |||||||||
Up 300 basis points | $ | 289 | $ | 20 | $ | 269 | ||||||
Up 200 basis points | $ | 192 | $ | 13 | $ | 179 | ||||||
Up 100 basis points | $ | 96 | $ | 7 | $ | 89 | ||||||
Down 100 basis points | $ | (44 | ) | $ | (7 | ) | $ | (37 | ) | |||
Down 200 basis points | $ | (37 | ) | $ | (10 | ) | $ | (27 | ) | |||
Down 300 basis points | $ | (38 | ) | $ | (10 | ) | $ | (28 | ) | |||
________________________________________
(1) | Includes the impact of the interest rate swap (discussed above) as a result of changes in interest rates. |
(2) | Excludes the impact of income based fees. See Note 3 to our consolidated financial statements for the year ended December 31, 2017 for more information on the income based fees. |
The above sensitivity analysis does not include our collateralized loan obligation (“CLO”) equity investments. CLO equity investments are levered structures that are collateralized primarily with first lien floating rate loans that may have LIBOR floors and are levered primarily with floating rate debt that does not have a LIBOR floor. The residual cash flows available to the equity holders of the CLOs will decline as interest rates increase until interest rates surpass the LIBOR floors on the floating rate loans. However, the revenue recognized on our CLO equity investments is calculated using the effective interest method which incorporates a forward LIBOR curve in the projected cash flows. Any change to interest rates that is not in-line with the forward LIBOR curve used in the projections, in either the timing or magnitude of the change, will cause actual distributions to differ from the current projections and will impact the related revenue recognized from these investments.
Based on our December 31, 2016, balance sheet, the following table shows the annual impact on net income of base rate changes in interest rates (considering interest rate floors for variable rate instruments) assuming no changes in our investment and borrowing structure:
(in millions) Basis Point Change | Interest Income | Interest Expense | Net Income(1) | |||||||||
Up 300 basis points | $ | 205 | $ | 25 | $ | 180 | ||||||
Up 200 basis points | $ | 136 | $ | 17 | $ | 119 | ||||||
Up 100 basis points | $ | 67 | $ | 9 | $ | 58 | ||||||
Down 100 basis points | $ | 9 | $ | (6 | ) | $ | 15 | |||||
89
Down 200 basis points | $ | 8 | $ | (6 | ) | $ | 14 | |||||
Down 300 basis points | $ | 8 | $ | (6 | ) | $ | 14 | |||||
_______________________________________________________________________________
(1) | Excludes the impact of income based fees. See Note 3 to our consolidated financial statements for the year ended December 31, 2017 for more information on the income based fees. |
Item 8. Financial Statements and Supplementary Data
See the Index to Consolidated Financial Statements.
Item 9. Changes in and Disagreements With Accountants on Accounting and Financial Disclosure
None.
Item 9A. Controls and Procedures
(a) Evaluation of Disclosure Controls and Procedures. We maintain disclosure controls and procedures (as that term is defined in Rules 13a‑15(e) and 15d‑15(e) under the Exchange Act) that are designed to ensure that information required to be disclosed in our reports under the Exchange Act is recorded, processed, summarized and reported within the time periods specified in the SEC’s rules and forms, and that such information is accumulated and communicated to our management, including our principal executive officer and principal financial officer, as appropriate, to allow timely decisions regarding required disclosures. Any controls and procedures, no matter how well designed and operated, can provide only reasonable assurance of achieving the desired control objectives. Our management, with the participation of our principal executive officer and principal financial officer, has evaluated the effectiveness of the design and operation of our disclosure controls and procedures as of December 31, 2017. Based upon that evaluation and subject to the foregoing, our principal executive officer and principal financial officer concluded that, as of December 31, 2017, the design and operation of our disclosure controls and procedures were effective to accomplish their objectives at the reasonable assurance level.
(b) Management’s Report on Internal Control over Financial Reporting. Our management is responsible for establishing and maintaining adequate internal control over financial reporting for the Company. Internal control over financial reporting is a process to provide reasonable assurance regarding the reliability of our financial reporting for external purposes in accordance with accounting principles generally accepted in the United States of America. Internal control over financial reporting includes maintaining records that in reasonable detail accurately and fairly reflect our transactions; providing reasonable assurance that transactions are recorded as necessary for preparation of our consolidated financial statements; providing reasonable assurance that receipts and expenditures of company assets are made in accordance with management authorization; and providing reasonable assurance that unauthorized acquisition, use or disposition of company assets that could have a material effect on our consolidated financial statements would be prevented or detected on a timely basis. Because of its inherent limitations, internal control over financial reporting is not intended to provide absolute assurance that a misstatement of our consolidated financial statements would be prevented or detected.
Management conducted an evaluation of the effectiveness of our internal control over financial reporting based on the framework in Internal Control — Integrated Framework (2013) issued by the Committee of Sponsoring Organizations of the Treadway Commission. Based on this evaluation, management concluded that the Company's internal control over financial reporting was effective as of December 31, 2017. The Company's independent registered public accounting firm, KPMG LLP, has issued an audit report on the effectiveness of the Company's internal control over financial reporting.
(c) Attestation Report of the Registered Public Accounting Firm. Our independent registered public accounting firm, KPMG LLP, has issued an attestation report on the effectiveness of our internal control over financial reporting which is set forth under the heading “Report of Independent Registered Public Accounting Firm” on page F-2.
(d) Changes in Internal Control over Financial Reporting. There have been no changes in our internal control over financial reporting (as defined in Rules 13a-15(f) and 15d-15(f) under the Exchange Act) during the quarter ended December 31, 2017, that have materially affected, or are reasonably likely to materially affect, our internal control over financial reporting.
Item 9B. Other Information
90
None.
91
PART III
Item 10. Directors, Executive Officers and Corporate Governance
The information required by this item will be contained in the Company’s definitive Proxy Statement for its 2018 Annual Stockholder Meeting, to be filed with the SEC within 120 days after December 31, 2017, and is incorporated herein by reference.
Item 11. Executive Compensation
The information required by this item will be contained in the Company’s definitive Proxy Statement for its 2018 Annual Stockholder Meeting, to be filed with the SEC within 120 days after December 31, 2017, and is incorporated herein by reference.
Item 12. Security Ownership of Certain Beneficial Owners and Management and Related Stockholder Matters
The information required by this item will be contained in the Company’s definitive Proxy Statement for its 2018 Annual Stockholder Meeting, to be filed with the SEC within 120 days after December 31, 2017, and is incorporated herein by reference.
Item 13. Certain Relationships and Related Transactions, and Director Independence
The information required by this item will be contained in the Company’s definitive Proxy Statement for its 2018 Annual Stockholder Meeting, to be filed with the SEC within 120 days after December 31, 2017, and is incorporated herein by reference.
Item 14. Principal Accountant Fees and Services
The information required by this item will be contained in the Company’s definitive Proxy Statement for its 2018 Annual Stockholder Meeting, to be filed with the SEC within 120 days after December 31, 2017, and is incorporated herein by reference.
92
PART IV
Item 15. Exhibits, Financial Statement Schedules
The following documents are filed as part of this Annual Report:
1. | Financial Statements—See the Index to Consolidated Financial Statements on Page F-1. |
2. | Financial Statement Schedules—None. We have omitted financial statement schedules because they are not required or are not applicable, or the required information is shown in the financial statements or notes to the financial statements. |
3. | Exhibits. |
Number | Document |
Articles of Amendment and Restatement, as amended(1) | |
Second Amended and Restated Bylaws, as amended(2) | |
Form of Stock Certificate(3) | |
Form of Subscription Certificate(4) | |
Indenture, dated June 16, 2006, between Allied Capital Corporation and The Bank of New York, as trustee(5) | |
Form of Note under the Indenture, dated June 16, 2006, between Allied Capital Corporation and The Bank of New York, as trustee(6) | |
Third Supplemental Indenture, dated as of March 28, 2007, between Allied Capital Corporation and The Bank of New York, as trustee(6) | |
Form of 6.875% Notes due 2047(6) | |
Fourth Supplemental Indenture, dated as of April 1, 2010, among Ares Capital Corporation, Allied Capital Corporation and The Bank of New York Mellon, as trustee(7) | |
Indenture, dated as of October 21, 2010, between Ares Capital Corporation and U.S. Bank National Association, as trustee(8) | |
Fourth Supplemental Indenture, dated as of November 19, 2013, relating to the 4.875% Senior Notes due 2018, between Ares Capital Corporation and U.S. Bank National Association, as trustee(9) | |
Form of 4.875% Senior Notes due 2018(9) | |
Fifth Supplemental Indenture, dated as of November 21, 2014, relating to the 3.875% Notes due 2020, between Ares Capital Corporation and U.S. Bank National Association, as trustee (10) | |
Form of 3.875% Notes due 2020 (10) | |
Sixth Supplemental Indenture, dated as of September 9, 2016, relating to the 3.625% Notes due 2022, between Ares Capital Corporation and U.S. Bank National Association, as trustee(11) | |
Form of 3.625% Notes due 2022(11) | |
Seventh Supplemental Indenture, dated as of August 10, 2017, relating to the 3.500% Notes due 2023, between Ares Capital Corporation and U.S. Bank National Association, as trustee(12) | |
Form of 3.500% Notes due 2023(12) | |
Eighth Supplemental Indenture, dated as of January 11, 2018, relating to the 4.250% Notes due 2025, between Ares Capital Corporation and U.S. Bank National Association, as trustee(13) | |
Form of 4.250% Notes due 2025(13) | |
Indenture, dated as of October 10, 2012, between Ares Capital Corporation and U.S. Bank National Association, as trustee(14) | |
Form of 4.75% Convertible Senior Notes due 2018(14) | |
Indenture, dated as of July 19, 2013, between Ares Capital Corporation and U.S. Bank National Association, as trustee(15) | |
Form of 4.375% Convertible Senior Notes due 2019(15) | |
Indenture, dated as of January 27, 2017, between Ares Capital Corporation and U.S. Bank National Association, as trustee(16) | |
Form of 3.75% Convertible Senior Notes due 2022(16) | |
93
Number | Document |
Dividend Reinvestment Plan of Ares Capital Corporation(17) | |
Restated Investment Advisory and Management Agreement, dated as of June 6, 2011, between Ares Capital Corporation and Ares Capital Management LLC(18) | |
Amended and Restated Administration Agreement, dated as of June 1, 2007, between Ares Capital Corporation and Ares Operations LLC(19) | |
Amended and Restated Custodian Agreement, dated as of May 15, 2009, between Ares Capital Corporation and U.S. Bank National Association(20) | |
Amendment No. 1, dated as of December 19, 2014, to the Amended and Restated Custodian Agreement dated as of May 15, 2009, by and among Ares Capital Corporation and U.S. Bank National Association(21) | |
Trademark License Agreement between Ares Capital Corporation and Ares Management LLC(22) | |
Form of Indemnification Agreement between Ares Capital Corporation and directors and certain officers(23) | |
Form of Indemnification Agreement between Ares Capital Corporation and members of Ares Capital Management LLC investment committee(23) | |
Amended and Restated Purchase and Sale Agreement, dated as of January 22, 2010, among Ares Capital Corporation, as seller, and Ares Capital CP Funding Holdings LLC, as purchaser(24) | |
Amendment No. 1 to Amended and Restated Purchase and Sale Agreement, dated as of June 7, 2012, among Ares Capital Corporation, as seller, and Ares Capital CP Funding Holdings LLC, as purchaser(25) | |
Second Tier Purchase and Sale Agreement, dated as of January 22, 2010, among Ares Capital CP Funding Holdings LLC, as seller, and Ares Capital CP Funding LLC, as purchaser(24) | |
Amendment No. 1 to Second Tier Purchase and Sale Agreement, dated as of June 7, 2012, among Ares Capital CP Funding Holdings LLC, as seller, and Ares Capital CP Funding LLC, as purchaser(25) | |
Amended and Restated Sale and Servicing Agreement, dated as of January 22, 2010, among Ares Capital CP Funding LLC, as borrower, Ares Capital Corporation, as servicer, Wachovia Bank, National Association, as note purchaser, U.S. Bank National Association, as trustee and collateral custodian, and Wells Fargo Securities, LLC, as agent(24) | |
Amendment No. 1 to the Amended and Restated Sale and Servicing Agreement, dated as of May 6, 2010, among Ares Capital CP Funding LLC, as borrower, Ares Capital Corporation, as servicer, Wells Fargo Bank, National Association, as successor by merger to Wachovia Bank as note purchaser, U.S. Bank, National Association, as trustee and collateral custodian, and Wells Fargo Securities LLC, as agent(26) | |
Amendment No. 2 to the Amended and Restated Sale and Servicing Agreement, dated as of January 18, 2011, among Ares Capital CP Funding LLC, as borrower, Ares Capital Corporation, as servicer, Wells Fargo Bank, National Association, as successor by merger to Wachovia Bank as note purchaser, U.S. Bank National Association, as trustee and collateral custodian, and Wells Fargo Securities, LLC, as agent(27) | |
Amendment No. 3 to the Amended and Restated Sale and Servicing Agreement, dated as of October 13, 2011, among Ares Capital CP Funding LLC, as borrower, Ares Capital Corporation, as servicer and as transferor, Wells Fargo Bank, National Association (as successor by merger to Wachovia Bank, National Association), as note purchaser, U.S. Bank National Association, as trustee, collateral custodian and bank and Wells Fargo Securities, LLC, as agent(28) | |
Amendment No. 4 to the Amended and Restated Sale and Servicing Agreement, dated as of January 18, 2012, among Ares Capital CP Funding LLC, as borrower, Ares Capital Corporation, as servicer and transferor, Wells Fargo Bank, National Association (as successor by merger to Wachovia Bank, National Association), as note purchaser, Wells Fargo Securities, LLC, as agent, and U.S. Bank National Association, as collateral custodian, trustee and bank(29) | |
Amendment No. 5 to the Amended and Restated Sale and Servicing Agreement, dated as of June 7, 2012, among Ares Capital CP Funding LLC, as borrower, Ares Capital Corporation, as servicer and transferor, Wells Fargo Bank, National Association (as successor by merger to Wachovia Bank, National Association), as note purchaser, Wells Fargo Securities, LLC, as agent, and U.S. Bank National Association, as collateral custodian, trustee and bank(25) | |
Amendment No. 6 to Loan and Servicing Agreement, dated as of January 25, 2013, among Ares Capital CP Funding LLC, as borrower, Ares Capital Corporation, as servicer and transferor, Wells Fargo Securities, LLC, as agent, Wells Fargo Bank, National Association, as swingline lender, and the other lenders party thereto (30) | |
Omnibus Amendment, dated as of May 14, 2014, among Ares Capital CP Funding LLC, Ares Capital CP Funding Holdings LLC, Ares Capital Corporation, Wells Fargo Bank, National Association, as swingline lender and as a lender, Wells Fargo Securities, LLC, as agent, and U.S. Bank National Association, as trustee, bank and collateral custodian (amending the Loan and Servicing Agreement, dated as of January 22, 2010, the Amended and Restated Purchase and Sale Agreement, dated as of January 22, 2010, and the Second Tier Purchase and Sale Agreement, dated as of January 22, 2010)(31) | |
94
Number | Document |
Amendment No. 8 to the Loan and Servicing Agreement, dated as of January 3, 2017, among Ares Capital CP Funding LLC, as borrower, Ares Capital Corporation, as servicer and transferor, Wells Fargo Securities, LLC, as agent, and Wells Fargo Bank, National Association, as swingline lender, and the other lenders party thereto(32) | |
Seventh Amended and Restated Senior Secured Revolving Credit Agreement, dated as of January 4, 2017, among Ares Capital Corporation, the lenders party thereto, and JPMorgan Chase Bank, N.A., as administrative agent(32) | |
Loan and Servicing Agreement, dated as of January 20, 2012, among Ares Capital JB Funding LLC, as borrower, Ares Capital Corporation, as servicer and transferor, Sumitomo Mitsui Banking Corporation, as administrative agent, collateral agent and lender, and U.S. Bank National Association, as collateral custodian and bank(33) | |
Purchase and Sale Agreement, dated as of January 20, 2012, between Ares Capital JB Funding LLC, as purchaser, and Ares Capital Corporation, as seller(33) | |
Omnibus Amendment No. 1, dated as of September 14, 2012, among Ares Capital JB Funding LLC, as borrower, Ares Capital Corporation, as servicer and transferor, Sumitomo Mitsui Banking Corporation, as administrative agent, lender and collateral agent, and U.S. Bank National Association, as collateral custodian and bank (amending the Loan and Servicing Agreement, dated as of January 20, 2012, and the Purchase and Sale Agreement, dated as of January 20, 2012)(34) | |
Omnibus Amendment No. 2, dated as of December 20, 2013, among Ares Capital JB Funding LLC, as borrower, Ares Capital Corporation, as servicer and transferor, Sumitomo Mitsui Banking Corporation, as administrative agent, lender and collateral agent, and U.S. Bank National Association, as collateral custodian and bank (amending the Loan and Servicing Agreement, dated as of January 20, 2012, and the Purchase and Sale Agreement, dated as of January 20, 2012)(35) | |
Omnibus Amendment No. 3, dated as of June 20, 2015, among Ares Capital JB Funding LLC, as borrower, Ares Capital Corporation, as servicer and transferor, Sumitomo Mitsui Banking Corporation, as administrative agent, lender and collateral agent, and U.S. Bank National Association, as collateral custodian and bank (amending the Loan and Servicing Agreement, dated as of January 20, 2012, and the Purchase and Sale Agreement, dated as of January 20, 2012)(36) | |
Omnibus Amendment No. 4, dated as of August 24, 2017, among Ares Capital JB Funding LLC, as borrower, Ares Capital Corporation, as servicer and transferor, Sumitomo Mitsui Banking Corporation, as administrative agent, lender and collateral agent, and U.S. Bank National Association, as collateral custodian and bank (amending the Loan and Servicing Agreement, dated as of January 20, 2012)(37) | |
Transaction Support and Fee Waiver Agreement, dated May 23, 2016, between Ares Capital Corporation and Ares Capital Management LLC(38) | |
Form of Underwriting Agreement for Equity Securities(39) | |
Form of Underwriting Agreement for Debt Securities(39) | |
Form of Equity Distribution Agreement(39) | |
Statement of Computation of Per Share Earnings(40) | |
Subsidiaries of Ares Capital Corporation* | |
Certification by President pursuant to Exchange Act Rule 13a-14(a), as adopted pursuant to Section 302 of the Sarbanes-Oxley Act of 2002* | |
Certification by Chief Financial Officer pursuant to Exchange Act Rule 13a-14(a), as adopted pursuant to Section 302 of the Sarbanes-Oxley Act of 2002* | |
Certification by President and Chief Financial Officer pursuant to 18 U.S.C. Section 1350, as adopted pursuant to Section 906 of the Sarbanes-Oxley Act of 2002* | |
________________________________________
* | Filed herewith |
(1) | Incorporated by reference to Exhibit 3.1 to the Company’s Form 10-K (File No. 814-00663), for the year ended December 31, 2016, filed on February 22, 2017. |
(2) | Incorporated by reference to Exhibit 3.2 to the Company’s Form 10‑Q (File No. 814‑00663) for the quarter ended June 30, 2010, filed on August 5, 2010. |
(3) | Incorporated by reference to Exhibit (d) to the Company’s pre‑effective Amendment No. 2 to the Registration Statement under the Securities Act of 1933, as amended, on Form N‑2 (File No. 333‑114656), filed on September 28, 2004. |
(4) | Incorporated by reference to Exhibit (d)(4) to the Company’s pre effective Amendment No. 2 to the Registration Statement under the Securities Act of 1933, as amended, on Form N-2 (File No. 333-149139), filed on April 9, 2008. |
(5) | Incorporated by reference to Exhibit d.2 to Allied Capital’s Registration Statement under the Securities Act of 1933, as amended, on Form N‑2/A (File No. 333‑133755), filed on June 21, 2006. |
95
(6) | Incorporated by reference to Exhibits d.8 and d.9, as applicable, to Allied Capital’s post‑effective Amendment No. 3 to the Registration Statement under the Securities Act of 1933, as amended, on Form N‑2/A (File No. 333‑133755), filed on March 28, 2007. |
(7) | Incorporated by reference to Exhibit 10.1 to the Company’s Form 8‑K (File No. 814‑00663), filed on April 7, 2010. |
(8) | Incorporated by reference to Exhibits 4.1 and 4.2, as applicable, to the Company’s Form 8‑K (File No. 814‑00663), filed on October 22, 2010. |
(9) | Incorporated by reference to Exhibits 4.1 and 4.2, as applicable, to the Company’s Form 8‑K (File No. 814‑00663), filed on November 19, 2013. |
(10) | Incorporated by reference to Exhibits 4.1 and 4.2, as applicable, to the Company’s Form 8‑K (File No. 814‑00663), filed on November 21, 2014. |
(11) | Incorporated by reference to Exhibits 4.1 and 4.2, as applicable, to the Company’s Form 8-K (File No. 814-00663), filed on September 19, 2016. |
(12) | Incorporated by reference to Exhibits 4.1 and 4.2, as applicable, to the Registrant’s Form 8-K (File No. 814-00663), filed on August 10, 2017. |
(13) | Incorporated by reference to Exhibits 4.1 and 4.2, as applicable, to the Registrant’s Form 8-K (File No. 814-00663), filed on January 11, 2018. |
(14) | Incorporated by reference to Exhibits 4.1 and 4.2, as applicable, to the Company’s Form 8‑K (File No. 814‑00663), filed on October 10, 2012. |
(15) | Incorporated by reference to Exhibits 4.1 and 4.2, as applicable, to the Company’s Form 8‑K (File No. 814‑00663), filed on July 19, 2013. |
(16) | Incorporated by reference to Exhibits 4.1 and 4.2, as applicable, to the Company’s Form 8‑K (File No. 814‑00663), filed on January 27, 2017. |
(17) | Incorporated by reference to Exhibit 10.1 to the Company’s Form 8‑K (File No. 814‑00663), filed on February 27, 2012. |
(18) | Incorporated by reference to Exhibit 10.1 to the Company’s Form 8‑K (File No. 814‑00663), filed on June 8, 2011. |
(19) | Incorporated by reference to Exhibit 10.1 to the Company’s Form 10‑Q (File No. 814‑00663) for the quarter ended June 30, 2007, filed on August 9, 2007. |
(20) | Incorporated by reference to Exhibit (j) to the Company’s pre‑effective Amendment No. 1 to the Registration Statement under the Securities Act of 1933, as amended, on Form N‑2 (File No. 333‑158211), filed on May 28, 2009. |
(21) | Incorporated by reference to Exhibit 10.5 to the Company’s Form 10‑K (File No. 814‑00663) for the year ended December 31, 2014, filed on February 26, 2015. |
(22) | Incorporated by reference to Exhibit 99(K)(3) to the Company’s pre-effective Amendment No. 1 to the Registration Statement under the Securities Act of 1933, as amended, on Form N-2 (File No. 333-114656), filed on September 17, 2004. |
(23) | Incorporated by reference to Exhibits (k)(3) and (k)(4), as applicable, to the Company’s Registration Statement under the Securities Act of 1933, as amended, on Form N‑2 (File No. 333‑188175), filed on April 26, 2013. |
(24) | Incorporated by reference to Exhibits 10.2 through 10.4, as applicable, to the Company’s Form 8‑K (File No. 814‑00663), filed on January 25, 2010. |
(25) | Incorporated by reference to Exhibits 10.1 through 10.3, as applicable, to the Company’s Form 8‑K (File No. 814‑0663), filed on June 8, 2012. |
(26) | Incorporated by reference to Exhibit 10.5 to the Company’s Form 10‑Q (File No. 814‑00663) for the quarter ended March 30, 2010, filed on May 10, 2010. |
(27) | Incorporated by reference to Exhibit 10.1 to the Company’s Form 8‑K (File No. 814‑00663), filed on January 19, 2011. |
(28) | Incorporated by reference to Exhibit 10.1 to the Company’s Form 8‑K (File No. 814‑00663), filed on October 14, 2011. |
(29) | Incorporated by reference to Exhibit 10.1 to the Company’s Form 8‑K (File No. 814‑00663), filed on January 19, 2012. |
(30) | Incorporated by reference to Exhibit 10.1 to the Company’s Form 8‑K (File No. 814‑00663), filed on January 28, 2013. |
(31) | Incorporated by reference to Exhibit 10.1 to the Company’s Form 8‑K (File No. 814‑00663), filed on May 15, 2014. |
(32) | Incorporated by reference to Exhibits 10.1 and 10.2, as applicable, to the Company’s Form 8-K (File No. 814-00663), filed on January 4, 2017. |
(33) | Incorporated by reference to Exhibit 10.1 and 10.2, as applicable, to the Company’s Form 8‑K (File No. 814‑00663), filed on January 24, 2012. |
96
(34) | Incorporated by reference to Exhibit 10.1 to the Company’s Form 8‑K (File No. 814‑00663), filed on September 17, 2012. |
(35) | Incorporated by reference to Exhibit 10.1 to the Company’s Form 8‑K (File No. 814‑00663), filed on December 23, 2013. |
(36) | Incorporated by reference to Exhibit 10.1 to the Company’s Form 8‑K (File No. 814‑00663), filed on July 1, 2015. |
(37) | Incorporated by reference to Exhibit 10.1 to the Company’s Form 8-K (File No. 814-00663), filed on August 28, 2017. |
(38) | Incorporated by reference to Exhibit 2.1 to the Company’s Form 8-K (File No. 814-00663), filed on May 26, 2016. |
(39) | Incorporated by reference to Exhibits (h)(1), (h)(2) and (h)(3), as applicable, to the Company’s pre-effective Amendment No. 2 to the Registration Statement under the Securities Act of 1933, as amended, on Form N-2 (File No. 333-212142), filed on July 31, 2017. |
(40) | Included in Note 10 to the Company’s Notes to Consolidated Financial Statements filed herewith. |
Item 16. Form 10-K Summary
None.
97
INDEX TO CONSOLIDATED FINANCIAL STATEMENTS
F-1
Report of Independent Registered Public Accounting Firm
To the stockholders and board of directors
Ares Capital Corporation:
Opinion on the Consolidated Financial Statements
We have audited the accompanying consolidated balance sheets of Ares Capital Corporation and subsidiaries (the “Company”), including the consolidated schedules of investments, as of December 31, 2017 and 2016, the related consolidated statements of operations, stockholders’ equity, and cash flows for each of the years in the three-year period ended December 31, 2017, and the related notes (collectively, the “consolidated financial statements”). In our opinion, the consolidated financial statements present fairly, in all material respects, the financial position of the Company as of December 31, 2017 and 2016, and the results of its operations and its cash flows for each of the years in the three-year period ended December 31, 2017, in conformity with U.S. generally accepted accounting principles.
We also have audited, in accordance with the standards of the Public Company Accounting Oversight Board (United States) (“PCAOB”), the Company’s internal control over financial reporting as of December 31, 2017, based on criteria established in Internal Control - Integrated Framework (2013) issued by the Committee of Sponsoring Organizations of the Treadway Commission, and our report dated February 13, 2018 expressed an unqualified opinion on the effectiveness of the Company’s internal control over financial reporting.
Basis for Opinion
These consolidated financial statements are the responsibility of the Company’s management. Our responsibility is to express an opinion on these consolidated financial statements based on our audits. We are a public accounting firm registered with the PCAOB and are required to be independent with respect to the Company in accordance with the U.S. federal securities laws and the applicable rules and regulations of the Securities and Exchange Commission and the PCAOB.
We conducted our audits in accordance with auditing standards of the PCAOB. Those standards require that we plan and perform the audit to obtain reasonable assurance about whether the consolidated financial statements are free of material misstatement, whether due to error or fraud. Our audits included performing procedures to assess the risks of material misstatement of the consolidated financial statements, whether due to error or fraud, and performing procedures that respond to those risks. Such procedures included examining, on a test basis, evidence regarding the amounts and disclosures in the consolidated financial statements. Such procedures also included confirmation of investments as of December 31, 2017, by correspondence with custodians, portfolio companies or agents. Our audits also included evaluating the accounting principles used and significant estimates made by management, as well as evaluating the overall presentation of the consolidated financial statements. We believe that our audits provide a reasonable basis for our opinion.
We have served as the Company’s auditor since 2004.
Los Angeles, California
February 13, 2018
F-2
Report of Independent Registered Public Accounting Firm
The stockholders and board of directors
Ares Capital Corporation:
Opinion on Internal Control Over Financial Reporting
We have audited Ares Capital Corporation and subsidiaries’ (the “Company”) internal control over financial reporting as of December 31, 2017, based on criteria established in Internal Control - Integrated Framework (2013) issued by the Committee of Sponsoring Organizations of the Treadway Commission. In our opinion, the Company maintained, in all material respects, effective internal control over financial reporting as of December 31, 2017, based on criteria established in Internal Control - Integrated Framework (2013) issued by the Committee of Sponsoring Organizations of the Treadway Commission.
We also have audited, in accordance with the standards of the Public Company Accounting Oversight Board (United States) (“PCAOB”), the consolidated balance sheets of the Company as of December 31, 2017 and 2016, including the consolidated schedules of investments, as of December 31, 2017 and 2016, and the related consolidated statements of operations, stockholders’ equity, and cash flows, for each of the years in the three-year period ended December 31, 2017 and the related notes (collectively, the consolidated financial statements), and our report dated February 13, 2018 expressed an unqualified opinion on those consolidated financial statements.
Basis for Opinion
The Company’s management is responsible for maintaining effective internal control over financial reporting and for its assessment of the effectiveness of internal control over financial reporting, included in the accompanying Management’s Report on Internal Control over Financial Reporting. Our responsibility is to express an opinion on the Company’s internal control over financial reporting based on our audit. We are a public accounting firm registered with the PCAOB and are required to be independent with respect to the Company in accordance with the U.S. federal securities laws and the applicable rules and regulations of the Securities and Exchange Commission and the PCAOB.
We conducted our audit in accordance with the standards of the PCAOB. Those standards require that we plan and perform the audit to obtain reasonable assurance about whether effective internal control over financial reporting was maintained in all material respects. Our audit of internal control over financial reporting included obtaining an understanding of internal control over financial reporting, assessing the risk that a material weakness exists, and testing and evaluating the design and operating effectiveness of internal control based on the assessed risk. Our audit also included performing such other procedures as we considered necessary in the circumstances. We believe that our audit provides a reasonable basis for our opinion.
Definition and Limitations of Internal Control Over Financial Reporting
A company’s internal control over financial reporting is a process designed to provide reasonable assurance regarding the reliability of financial reporting and the preparation of financial statements for external purposes in accordance with generally accepted accounting principles. A company’s internal control over financial reporting includes those policies and procedures that (1) pertain to the maintenance of records that, in reasonable detail, accurately and fairly reflect the transactions and dispositions of the assets of the company; (2) provide reasonable assurance that transactions are recorded as necessary to permit preparation of financial statements in accordance with generally accepted accounting principles, and that receipts and expenditures of the company are being made only in accordance with authorizations of management and directors of the company; and (3) provide reasonable assurance regarding prevention or timely detection of unauthorized acquisition, use, or disposition of the company’s assets that could have a material effect on the financial statements.
Because of its inherent limitations, internal control over financial reporting may not prevent or detect misstatements. Also, projections of any evaluation of effectiveness to future periods are subject to the risk that controls may become inadequate because of changes in conditions, or that the degree of compliance with the policies or procedures may deteriorate.
Los Angeles, California
February 13, 2018
F-3
ARES CAPITAL CORPORATION AND SUBSIDIARIES
CONSOLIDATED BALANCE SHEET
(in millions, except per share data)
As of December 31, | |||||||
2017 | 2016 | ||||||
ASSETS | |||||||
Investments at fair value | |||||||
Non-controlled/non-affiliate company investments | $ | 10,010 | $ | 5,940 | |||
Non-controlled affiliate company investments | 216 | 185 | |||||
Controlled affiliate company investments | 1,615 | 2,695 | |||||
Total investments at fair value (amortized cost of $11,905 and $9,034, respectively) | 11,841 | 8,820 | |||||
Cash and cash equivalents | 316 | 223 | |||||
Interest receivable | 93 | 112 | |||||
Receivable for open trades | 1 | 29 | |||||
Other assets | 96 | 61 | |||||
Total assets | $ | 12,347 | $ | 9,245 | |||
LIABILITIES | |||||||
Debt | $ | 4,854 | $ | 3,874 | |||
Base management fees payable | 44 | 34 | |||||
Income based fees payable | 27 | 32 | |||||
Capital gains incentive fees payable | 79 | 38 | |||||
Accounts payable and other liabilities | 181 | 58 | |||||
Interest and facility fees payable | 64 | 44 | |||||
Total liabilities | 5,249 | 4,080 | |||||
Commitments and contingencies (Note 7) | |||||||
STOCKHOLDERS’ EQUITY | |||||||
Common stock, par value $0.001 per share, 600 and 500 common shares authorized, respectively; 426 and 314 common shares issued and outstanding, respectively | — | — | |||||
Capital in excess of par value | 7,192 | 5,292 | |||||
Accumulated undistributed (overdistributed) net investment income | (81 | ) | 37 | ||||
Accumulated undistributed net realized gains on investments, foreign currency transactions, extinguishment of debt and other assets | 72 | 57 | |||||
Net unrealized losses on investments, foreign currency and other transactions | (85 | ) | (221 | ) | |||
Total stockholders’ equity | 7,098 | 5,165 | |||||
Total liabilities and stockholders’ equity | $ | 12,347 | $ | 9,245 | |||
NET ASSETS PER SHARE | $ | 16.65 | $ | 16.45 | |||
See accompanying notes to consolidated financial statements.
F-4
ARES CAPITAL CORPORATION AND SUBSIDIARIES
CONSOLIDATED STATEMENT OF OPERATIONS
(in millions, except per share data)
For the Years Ended December 31, | |||||||||||
2017 | 2016 | 2015 | |||||||||
INVESTMENT INCOME: | |||||||||||
From non-controlled/non-affiliate company investments: | |||||||||||
Interest income from investments | $ | 753 | $ | 549 | $ | 508 | |||||
Capital structuring service fees | 95 | 90 | 70 | ||||||||
Dividend income | 26 | 35 | 19 | ||||||||
Other income | 19 | 14 | 13 | ||||||||
Total investment income from non-controlled/non-affiliate company investments | 893 | 688 | 610 | ||||||||
From non-controlled affiliate company investments: | |||||||||||
Interest income from investments | 17 | 16 | 14 | ||||||||
Capital structuring service fees | — | 1 | 3 | ||||||||
Dividend income | 1 | — | 4 | ||||||||
Total investment income from non-controlled affiliate company investments | 18 | 17 | 21 | ||||||||
From controlled affiliate company investments: | |||||||||||
Interest income from investments | 181 | 241 | 295 | ||||||||
Capital structuring service fees | 10 | 8 | 22 | ||||||||
Dividend income | 49 | 40 | 51 | ||||||||
Management and other fees | 6 | 16 | 24 | ||||||||
Other income | 3 | 2 | 2 | ||||||||
Total investment income from controlled affiliate company investments | 249 | 307 | 394 | ||||||||
Total investment income | 1,160 | 1,012 | 1,025 | ||||||||
EXPENSES: | |||||||||||
Interest and credit facility fees | 225 | 186 | 227 | ||||||||
Base management fees | 171 | 137 | 134 | ||||||||
Income based fees | 134 | 123 | 121 | ||||||||
Capital gain incentive fees | 41 | (5 | ) | (27 | ) | ||||||
Administrative fees | 12 | 14 | 14 | ||||||||
Professional fees and other costs related to the American Capital Acquisition | 45 | 15 | — | ||||||||
Other general and administrative | 32 | 27 | 30 | ||||||||
Total expenses | 660 | 497 | 499 | ||||||||
Waiver of income based fees | (30 | ) | — | — | |||||||
Total expenses, net of waiver of income based fees | 630 | 497 | 499 | ||||||||
NET INVESTMENT INCOME BEFORE INCOME TAXES | 530 | 515 | 526 | ||||||||
Income tax expense, including excise tax | 19 | 21 | 18 | ||||||||
NET INVESTMENT INCOME | 511 | 494 | 508 | ||||||||
REALIZED AND UNREALIZED GAINS (LOSSES) ON INVESTMENTS, FOREIGN CURRENCY AND OTHER TRANSACTIONS: | |||||||||||
Net realized gains (losses): | |||||||||||
Non-controlled/non-affiliate company investments | (56 | ) | 66 | 95 | |||||||
Non-controlled affiliate company investments | — | 14 | 26 | ||||||||
Controlled affiliate company investments | 100 | 30 | — | ||||||||
Foreign currency transactions | (20 | ) | — | 6 | |||||||
Net realized gains | 24 | 110 | 127 | ||||||||
Net unrealized gains (losses): | |||||||||||
Non-controlled/non-affiliate company investments | (42 | ) | (179 | ) | (149 | ) | |||||
Non-controlled affiliate company investments | (2 | ) | 14 | (8 | ) | ||||||
Controlled affiliate company investments | 187 | 40 | (91 | ) | |||||||
Foreign currency and other transactions | (7 | ) | (5 | ) | 2 | ||||||
Net unrealized gains (losses) | 136 | (130 | ) | (246 | ) | ||||||
Net realized and unrealized gains (losses) on investments, foreign currency and other transactions | 160 | (20 | ) | (119 | ) | ||||||
REALIZED LOSSES ON EXTINGUISHMENT OF DEBT | (4 | ) | — | (10 | ) | ||||||
NET INCREASE IN STOCKHOLDERS’ EQUITY RESULTING FROM OPERATIONS | $ | 667 | $ | 474 | $ | 379 | |||||
BASIC AND DILUTED EARNINGS PER COMMON SHARE (see Note 10) | $ | 1.57 | $ | 1.51 | $ | 1.20 | |||||
WEIGHTED AVERAGE SHARES OF COMMON STOCK OUTSTANDING (see Note 10) | 425 | 314 | 314 | ||||||||
See accompanying notes to consolidated financial statements.
F-5
ARES CAPITAL CORPORATION AND SUBSIDIARIES
CONSOLIDATED SCHEDULE OF INVESTMENTS
As of December 31, 2017
(dollar amounts in millions)
Company(1) | Business Description | Investment | Interest(6)(12) | Acquisition Date | Amortized Cost | Fair Value | Percentage of Net Assets | ||||||||||||
Healthcare Services | |||||||||||||||||||
Absolute Dental Management LLC and ADM Equity, LLC | Dental services provider | First lien senior secured loan ($18.8 par due 1/2022) | 11.08% (Libor + 9.39%/Q) | 1/5/2016 | $ | 18.8 | $ | 17.6 | (2)(17) | ||||||||||
First lien senior secured loan ($5.0 par due 1/2022) | 11.08% (Libor + 9.39%/Q) | 1/5/2016 | 5.0 | 4.7 | (4)(17) | ||||||||||||||
Class A preferred units (4,000,000 units) | 1/5/2016 | 4.0 | 0.9 | (2) | |||||||||||||||
Class A common units (4,000,000 units) | 1/5/2016 | — | — | (2) | |||||||||||||||
27.8 | 23.2 | ||||||||||||||||||
Acessa Health Inc. (fka HALT Medical, Inc.) | Medical supply provider | Common stock (569,823 shares) | 6/22/2017 | 0.1 | — | ||||||||||||||
ADCS Billings Intermediate Holdings, LLC (21) | Dermatology practice | First lien senior secured revolving loan | — | 5/18/2016 | — | — | (19) | ||||||||||||
ADG, LLC and RC IV GEDC Investor LLC (21) | Dental services provider | First lien senior secured revolving loan ($1.0 par due 9/2022) | 6.14% (Libor + 4.75%/Q) | 9/28/2016 | 1.0 | 1.0 | (2)(17) | ||||||||||||
First lien senior secured revolving loan ($1.4 par due 9/2022) | 6.24% (Libor + 4.75%/Q) | 9/28/2016 | 1.4 | 1.3 | (2)(17) | ||||||||||||||
First lien senior secured revolving loan ($8.5 par due 9/2022) | 6.32% (Libor + 4.75%/Q) | 9/28/2016 | 8.5 | 8.3 | (2)(17) | ||||||||||||||
First lien senior secured revolving loan ($0.6 par due 9/2022) | 8.25% (Base Rate + 3.75%/Q) | 9/28/2016 | 0.6 | 0.6 | (2)(17) | ||||||||||||||
Second lien senior secured loan ($87.5 par due 3/2024) | 10.57% (Libor + 9.00%/Q) | 9/28/2016 | 87.5 | 81.4 | (2)(17) | ||||||||||||||
Membership units (3,000,000 units) | 9/28/2016 | 3.0 | 1.9 | (2) | |||||||||||||||
102.0 | 94.5 | ||||||||||||||||||
Alcami Holdings, LLC (8)(21) | Outsourced drug development services provider | First lien senior secured revolving loan ($2.0 par due 10/2019) | 6.89% (Libor + 5.50%/Q) | 1/3/2017 | 2.0 | 2.0 | (2)(17) | ||||||||||||
First lien senior secured revolving loan ($15.9 par due 10/2019) | 6.96% (Libor + 5.50%/Q) | 1/3/2017 | 15.9 | 15.9 | (2)(17) | ||||||||||||||
First lien senior secured revolving loan ($7.7 par due 10/2019) | 7.06% (Libor + 5.50%/Q) | 1/3/2017 | 7.7 | 7.7 | (2)(17) | ||||||||||||||
First lien senior secured loan ($10.0 par due 10/2020) | 7.07% (Libor + 5.50%/Q) | 1/3/2017 | 10.0 | 10.0 | (2)(17) | ||||||||||||||
First lien senior secured loan ($95.7 par due 10/2020) | 7.07% (Libor + 5.50%/Q) | 1/3/2017 | 95.7 | 95.7 | (3)(17) | ||||||||||||||
First lien senior secured loan ($0.2 par due 10/2020) | 11.00% (Base Rate + 6.50%/Q) | 1/3/2017 | 0.2 | 0.2 | (3)(17) | ||||||||||||||
Senior subordinated loan ($30.0 par due 10/2020) | 11.75% | 1/3/2017 | 30.0 | 30.0 | (2) | ||||||||||||||
Senior subordinated loan ($30.0 par due 10/2020) | 12.00% | 1/3/2017 | 30.0 | 30.0 | (2) | ||||||||||||||
Senior subordinated loan ($25.0 par due 10/2020) | 12.25% | 1/3/2017 | 25.0 | 25.0 | (2) | ||||||||||||||
Senior subordinated loan ($36.1 par due 10/2020) | 14.75% PIK | 1/3/2017 | 36.1 | 36.1 | (2) | ||||||||||||||
Senior subordinated loan ($36.6 par due 10/2020) | 15.25% PIK | 1/3/2017 | 22.8 | 36.6 | (2) | ||||||||||||||
Series R preferred membership units (30,000 units) | 1/3/2017 | — | 54.1 | ||||||||||||||||
Series R-2 preferred membership units (54,936 units) | 1/3/2017 | — | 99.0 | ||||||||||||||||
275.4 | 442.3 | ||||||||||||||||||
Alegeus Technologies Holdings Corp. | Benefits administration and transaction processing provider | Preferred stock (2,997 shares) | 12/13/2013 | 3.1 | 2.8 | ||||||||||||||
Common stock (3 shares) | 12/13/2013 | — | — | ||||||||||||||||
3.1 | 2.8 | ||||||||||||||||||
Alteon Health, LLC | Provider of physician management services | First lien senior secured loan ($3.5 par due 9/2022) | 7.00% (Libor + 5.50%/Q) | 5/15/2017 | 3.5 | 3.3 | (2)(17) | ||||||||||||
F-6
As of December 31, 2017
(dollar amounts in millions)
Company(1) | Business Description | Investment | Interest(6)(12) | Acquisition Date | Amortized Cost | Fair Value | Percentage of Net Assets | ||||||||||||
American Academy Holdings, LLC (21) | Provider of education, training, certification, networking, and consulting services to medical coders and other healthcare professionals | First lien senior secured revolving loan ($0.9 par due 12/2022) | 9.75% (Base Rate + 5.25%/Q) | 12/15/2017 | 0.9 | 0.9 | (2)(17) | ||||||||||||
First lien senior secured loan ($0.5 par due 12/2022) | 7.84% (Libor + 6.25%/Q) | 12/15/2017 | 0.5 | 0.5 | (2)(17) | ||||||||||||||
First lien senior secured loan ($199.8 par due 12/2022) | 8.01% (Libor + 6.25%/Q) | 12/15/2017 | 199.8 | 197.8 | (2)(17) | ||||||||||||||
Senior subordinated loan ($75.0 par due 6/2023) | 15.76% (Libor + 14.00%/Q) | 12/15/2017 | 75.0 | 73.5 | (2)(17) | ||||||||||||||
276.2 | 272.7 | ||||||||||||||||||
Argon Medical Devices, Inc. | Manufacturer and marketer of single-use specialty medical devices | Second lien senior secured loan ($9.0 par due 6/2022) | 11.07% (Libor + 9.50%/Q) | 12/23/2015 | 8.8 | 9.0 | (2)(17) | ||||||||||||
AwarePoint Corporation | Healthcare technology platform developer | First lien senior secured loan ($8.1 par due 12/2019) | 13.98% (Libor + 12.50%/M) | 9/5/2014 | 8.0 | 6.5 | (2)(15)(17) | ||||||||||||
Warrant to purchase up to 3,213,367 shares of Series 1 preferred stock (expires 9/2024) | 11/14/2014 | — | 0.4 | (2) | |||||||||||||||
8.0 | 6.9 | ||||||||||||||||||
Bambino CI Inc. (21) | Manufacturer and provider of single-use obstetrics products | First lien senior secured revolving loan ($1.1 par due 10/2022) | 7.49% (Libor + 6.00%/Q) | 10/17/2017 | 1.1 | 1.1 | (2)(17) | ||||||||||||
First lien senior secured loan ($43.7 par due 10/2023) | 7.49% (Libor + 6.00%/Q) | 10/17/2017 | 43.7 | 43.3 | (2)(17) | ||||||||||||||
44.8 | 44.4 | ||||||||||||||||||
CCS Intermediate Holdings, LLC and CCS Group Holdings, LLC (21) | Correctional facility healthcare operator | First lien senior secured revolving loan ($4.5 par due 7/2019) | 5.69% (Libor + 4.00%/Q) | 7/23/2014 | 4.5 | 4.1 | (2)(17)(20) | ||||||||||||
First lien senior secured loan ($6.5 par due 7/2021) | 5.69% (Libor + 4.00%/Q) | 7/23/2014 | 6.5 | 5.9 | (2)(17) | ||||||||||||||
Second lien senior secured loan ($135.0 par due 7/2022) | 9.86% (Libor + 8.38%/Q) | 7/23/2014 | 134.2 | 112.0 | (2)(17) | ||||||||||||||
Class A units (1,000,000 units) | 8/19/2010 | — | 0.9 | (2) | |||||||||||||||
145.2 | 122.9 | ||||||||||||||||||
Correctional Medical Group Companies, Inc. | Correctional facility healthcare operator | First lien senior secured loan ($48.8 par due 9/2021) | 9.62% (Libor + 8.62%/Q) | 9/29/2015 | 48.8 | 48.8 | (3)(17) | ||||||||||||
First lien senior secured loan ($3.1 par due 9/2021) | 9.62% (Libor + 8.62%/Q) | 9/29/2015 | 3.1 | 3.1 | (2)(17) | ||||||||||||||
51.9 | 51.9 | ||||||||||||||||||
CSHM LLC (8) | Dental services provider | Class A membership units (1,979 units) | 1/3/2017 | — | — | ||||||||||||||
D4C Dental Brands HoldCo, Inc. and Bambino Group Holdings, LLC (21) | Dental services provider | Class A preferred units (1,000,000 units) | 12/21/2016 | 1.0 | 1.1 | (2) | |||||||||||||
DCA Investment Holding, LLC (21) | Multi-branded dental practice management | First lien senior secured revolving loan | — | 7/2/2015 | — | — | (19) | ||||||||||||
First lien senior secured loan ($18.7 par due 7/2021) | 6.94% (Libor + 5.25%/Q) | 7/2/2015 | 18.6 | 18.4 | (4)(17) | ||||||||||||||
18.6 | 18.4 | ||||||||||||||||||
Drayer Physical Therapy Institute LLC | Outpatient physical therapy provider | First lien senior secured loan ($12.3 par due 7/2018) | 10.50% (Base Rate + 6.00%/Q) | 7/26/2017 | 12.3 | 12.3 | (2)(17) | ||||||||||||
First lien senior secured loan ($114.6 par due 7/2018) | 10.50% (Base Rate + 6.00%/Q) | 7/26/2017 | 114.6 | 114.6 | (2)(17) | ||||||||||||||
126.9 | 126.9 | ||||||||||||||||||
Emerus Holdings, Inc. (21) | Freestanding 24-hour emergency care micro-hospitals operator | First lien senior secured revolving loan ($0.3 par due 9/2020) | 8.00% (Base Rate + 3.50%/Q) | 3/14/2017 | 0.3 | 0.3 | (2)(17) | ||||||||||||
First lien senior secured loan ($2.3 par due 9/2021) | 6.07% (Libor + 4.50%/Q) | 3/14/2017 | 2.0 | 2.1 | (2)(17) | ||||||||||||||
2.3 | 2.4 | ||||||||||||||||||
F-7
As of December 31, 2017
(dollar amounts in millions)
Company(1) | Business Description | Investment | Interest(6)(12) | Acquisition Date | Amortized Cost | Fair Value | Percentage of Net Assets | ||||||||||||
GHX Ultimate Parent Corporation, Commerce Parent, Inc. and Commerce Topco, LLC | On-demand supply chain automation solutions provider to the healthcare industry | Second lien senior secured loan ($103.7 par due 6/2025) | 9.69% (Libor + 8.00%/Q) | 6/30/2017 | 102.8 | 103.7 | (2)(17) | ||||||||||||
Series A perpetual preferred stock (110,425 shares) | 12.44% PIK (Libor + 10.75%/Q) | 6/30/2017 | 117.4 | 117.4 | (2)(17) | ||||||||||||||
Class A units (14,013,303 units) | 6/30/2017 | 14.0 | 16.9 | (2) | |||||||||||||||
234.2 | 238.0 | ||||||||||||||||||
Greenphire, Inc. and RMCF III CIV XXIX, L.P | Software provider for clinical trial management | Limited partnership interest (99.90% interest) | 12/19/2014 | 1.0 | 2.4 | (2) | |||||||||||||
Heartland Dental, LLC | Detanl services provider | Second lien senior secured loan ($27.8 par due 7/2024) | 9.75% (Libor + 8.50%/Q) | 7/31/2017 | 27.4 | 27.8 | (2)(17) | ||||||||||||
Hygiena Borrower LLC (21) | Adenosine triphosphate testing technology provider | Second lien senior secured loan ($10.0 par due 8/2023) | 10.69% (Libor + 9.00%/Q) | 8/26/2016 | 10.0 | 10.0 | (2)(17) | ||||||||||||
Second lien senior secured loan ($10.7 par due 8/2023) | 10.69% (Libor + 9.00%/Q) | 2/27/2017 | 10.7 | 10.7 | (2)(17) | ||||||||||||||
20.7 | 20.7 | ||||||||||||||||||
Intermedix Corporation | Revenue cycle management provider to the emergency healthcare industry | First lien senior secured loan ($72.3 par due 12/2019) | 6.16% (Libor + 4.75%/Q) | 7/26/2017 | 72.3 | 70.8 | (2)(17) | ||||||||||||
First lien senior secured loan ($35.2 par due 12/2019) | 6.16% (Libor + 4.75%/Q) | 7/26/2017 | 35.2 | 34.5 | (3)(17) | ||||||||||||||
First lien senior secured loan ($9.3 par due 12/2019) | 6.16% (Libor + 4.75%/Q) | 7/26/2017 | 9.3 | 9.1 | (4)(17) | ||||||||||||||
First lien senior secured loan ($80.8 par due 12/2019) | 6.35% (Libor + 4.75%/Q) | 7/26/2017 | 80.8 | 79.2 | (2)(17) | ||||||||||||||
First lien senior secured loan ($39.3 par due 12/2019) | 6.35% (Libor + 4.75%/Q) | 7/26/2017 | 39.3 | 38.5 | (3)(17) | ||||||||||||||
First lien senior secured loan ($10.4 par due 12/2019) | 6.35% (Libor + 4.75%/Q) | 7/26/2017 | 10.4 | 10.2 | (4)(17) | ||||||||||||||
Second lien senior secured loan ($112.0 par due 6/2020) | 9.94% (Libor + 8.25%/Q) | 12/27/2012 | 112.0 | 107.5 | (2)(17) | ||||||||||||||
359.3 | 349.8 | ||||||||||||||||||
JDC Healthcare Management, LLC (21) | Dental services provider | First lien senior secured revolving loan ($1.5 par due 4/2022) | 7.82% (Libor + 6.25%/Q) | 4/10/2017 | 1.5 | 1.5 | (2)(17) | ||||||||||||
First lien senior secured loan ($9.9 par due 4/2023) | 7.82% (Libor + 6.25%/Q) | 4/10/2017 | 9.9 | 9.7 | (2)(17) | ||||||||||||||
First lien senior secured loan ($19.9 par due 4/2023) | 7.82% (Libor + 6.25%/Q) | 4/10/2017 | 19.9 | 19.5 | (4)(17) | ||||||||||||||
31.3 | 30.7 | ||||||||||||||||||
KBHS Acquisition, LLC (d/b/a Alita Care, LLC) (21) | Provider of behavioral health services | First lien senior secured revolving loan ($0.2 par due 3/2022) | 6.43% (Libor + 5.00%/Q) | 3/17/2017 | 0.2 | 0.2 | (2)(17) | ||||||||||||
First lien senior secured revolving loan ($0.1 par due 3/2022) | 6.46% (Libor + 5.00%/Q) | 3/17/2017 | 0.1 | 0.1 | (2)(17) | ||||||||||||||
First lien senior secured revolving loan ($0.2 par due 3/2022) | 6.50% (Libor + 5.00%/Q) | 3/17/2017 | 0.2 | 0.2 | (2)(17) | ||||||||||||||
First lien senior secured revolving loan ($0.2 par due 3/2022) | 6.56% (Libor + 5.00%/Q) | 3/17/2017 | 0.2 | 0.2 | (2)(17) | ||||||||||||||
First lien senior secured revolving loan ($0.8 par due 3/2022) | 6.57% (Libor + 5.00%/Q) | 3/17/2017 | 0.8 | 0.8 | (2)(17) | ||||||||||||||
First lien senior secured revolving loan ($0.3 par due 3/2022) | 8.50% (Base Rate + 4.00%/Q) | 3/17/2017 | 0.3 | 0.3 | (2)(17) | ||||||||||||||
1.8 | 1.8 | ||||||||||||||||||
Key Surgical LLC (21) | Provider of sterile processing, operating room and instrument care supplies for hospitals | First lien senior secured revolving loan ($0.9 par due 6/2022) | 6.35% (Libor + 4.75%/Q) | 6/1/2017 | 0.9 | 0.9 | (2)(17) | ||||||||||||
F-8
As of December 31, 2017
(dollar amounts in millions)
Company(1) | Business Description | Investment | Interest(6)(12) | Acquisition Date | Amortized Cost | Fair Value | Percentage of Net Assets | ||||||||||||
First lien senior secured loan ($18.0 par due 6/2023) | 5.75% (EURIBOR + 4.75%/Q) | 6/1/2017 | 16.9 | 18.0 | (2)(17) | ||||||||||||||
First lien senior secured loan ($4.4 par due 6/2023) | 6.23% (Libor + 4.75%/Q) | 6/1/2017 | 4.3 | 4.4 | (4)(17) | ||||||||||||||
22.1 | 23.3 | ||||||||||||||||||
MB2 Dental Solutions, LLC (21) | Dental services provider | First lien senior secured revolving loan ($1.3 par due 9/2023) | 8.25% (Base Rate + 3.75%/Q) | 9/29/2017 | 1.3 | 1.3 | (2)(17) | ||||||||||||
First lien senior secured loan ($4.7 par due 9/2023) | 6.44% (Libor + 4.75%/Q) | 9/29/2017 | 4.7 | 4.7 | (2)(17) | ||||||||||||||
6.0 | 6.0 | ||||||||||||||||||
MCH Holdings, Inc. and MC Acquisition Holdings I, LLC | Healthcare professional provider | First lien senior secured loan ($65.3 par due 1/2020) | 6.96% (Libor + 5.50%/Q) | 7/26/2017 | 65.3 | 64.6 | (2)(17) | ||||||||||||
First lien senior secured loan ($79.0 par due 1/2020) | 7.07% (Libor + 5.50%/Q) | 7/26/2017 | 79.0 | 78.3 | (2)(17) | ||||||||||||||
First lien senior secured loan ($9.0 par due 1/2020) | 6.96% (Libor + 5.50%/Q) | 7/26/2017 | 9.0 | 9.0 | (4)(17) | ||||||||||||||
First lien senior secured loan ($11.0 par due 1/2020) | 7.07% (Libor + 5.50%/Q) | 7/26/2017 | 11.0 | 10.8 | (4)(17) | ||||||||||||||
Class A units (1,438,643 shares) | 1/17/2014 | 1.5 | 1.0 | (2) | |||||||||||||||
165.8 | 163.7 | ||||||||||||||||||
MW Dental Holding Corp. (21) | Dental services provider | First lien senior secured revolving loan ($9.7 par due 4/2018) | 9.19% (Libor + 7.50%/Q) | 4/12/2011 | 9.7 | 9.7 | (2)(17) | ||||||||||||
First lien senior secured loan ($44.4 par due 4/2018) | 9.19% (Libor + 7.50%/Q) | 4/12/2011 | 44.4 | 44.4 | (2)(17) | ||||||||||||||
First lien senior secured loan ($46.8 par due 4/2018) | 9.19% (Libor + 7.50%/Q) | 4/12/2011 | 46.8 | 46.8 | (3)(17) | ||||||||||||||
First lien senior secured loan ($19.3 par due 4/2018) | 9.19% (Libor + 7.50%/Q) | 4/12/2011 | 19.3 | 19.3 | (4)(17) | ||||||||||||||
120.2 | 120.2 | ||||||||||||||||||
My Health Direct, Inc. | Healthcare scheduling exchange software solution provider | Warrant to purchase up to 4,548 shares of Series D preferred stock (expires 9/2024) | 9/18/2014 | — | — | (2) | |||||||||||||
New Trident Holdcorp, Inc. and Trident Holding Company, LLC | Outsourced mobile diagnostic healthcare service provider | First lien senior secured loan ($19.9 par due 7/2019) | 7.44% (Libor + 5.75%/Q) | 8/1/2013 | 15.9 | 16.0 | (2)(17) | ||||||||||||
Second lien senior secured loan ($80.0 par due 7/2020) | — | 8/1/2013 | 79.3 | 44.2 | (2)(14)(16) | ||||||||||||||
Senior subordinated loan ($8.9 par due 7/2020) | — | 11/29/2017 | 8.8 | — | (2)(16) | ||||||||||||||
104.0 | 60.2 | ||||||||||||||||||
NMSC Holdings, Inc. and ASP NAPA Holdings, LLC | Anesthesia management services provider | Second lien senior secured loan ($72.8 par due 10/2023) | 11.69% (Libor + 10.00%/Q) | 4/19/2016 | 72.8 | 67.0 | (2)(17) | ||||||||||||
Class A units (25,277 units) | 4/19/2016 | 2.5 | 1.3 | (2) | |||||||||||||||
75.3 | 68.3 | ||||||||||||||||||
Nodality, Inc. | Biotechnology company | First lien senior secured loan ($2.3 par due 8/2016) | — | 11/12/2015 | 2.1 | — | (2)(16) | ||||||||||||
First lien senior secured loan ($10.9 par due 8/2016) | — | 4/25/2014 | 9.7 | — | (2)(16) | ||||||||||||||
Warrant to purchase up to 3,736,255 shares of common stock (expires 3/2026) | 5/1/2016 | — | — | (2) | |||||||||||||||
11.8 | — | ||||||||||||||||||
nThrive, Inc. (fka Precyse Acquisition Corp.) | Provider of healthcare information management technology and services | Second lien senior secured loan ($10.0 par due 4/2023) | 11.32% (Libor + 9.75%/Q) | 4/20/2016 | 9.7 | 10.0 | (2)(17) | ||||||||||||
OmniSYS Acquisition Corporation, OmniSYS, LLC, and OSYS Holdings, LLC (21) | Provider of technology-enabled solutions to pharmacies | First lien senior secured loan ($5.9 par due 11/2018) | 9.19% (Libor + 7.50%/Q) | 11/21/2013 | 5.9 | 5.9 | (4)(17) | ||||||||||||
Limited liability company membership interest (1.57%) | 11/21/2013 | 1.0 | 0.8 | (2) | |||||||||||||||
6.9 | 6.7 | ||||||||||||||||||
F-9
As of December 31, 2017
(dollar amounts in millions)
Company(1) | Business Description | Investment | Interest(6)(12) | Acquisition Date | Amortized Cost | Fair Value | Percentage of Net Assets | ||||||||||||
Pathway Partners Vet Management Company LLC (21) | Owner and operator of veterinary hospitals | First lien senior secured loan ($0.3 par due 10/2024) | 6.07% (Libor + 4.50%/Q) | 10/4/2017 | 0.3 | 0.3 | (2)(17) | ||||||||||||
First lien senior secured loan ($6.0 par due 10/2024) | 6.07% (Libor + 4.50%/Q) | 10/4/2017 | 6.0 | 6.0 | (2)(17) | ||||||||||||||
6.3 | 6.3 | ||||||||||||||||||
Patterson Medical Supply, Inc. | Distributor of rehabilitation supplies and equipment | Second lien senior secured loan ($78.0 par due 8/2023) | 9.98% (Libor + 8.50%/Q) | 9/2/2015 | 76.4 | 72.5 | (2)(17) | ||||||||||||
PhyMED Management LLC | Provider of anesthesia services | Second lien senior secured loan ($47.2 par due 5/2021) | 10.21% (Libor + 8.75%/Q) | 12/18/2015 | 46.8 | 45.3 | (2)(17) | ||||||||||||
Practice Insight, LLC (21) | Revenue cycle management provider to the emergency healthcare industry | First lien senior secured revolving loan ($0.6 par due 8/2022) | 8.50% (Base Rate + 4.00%/Q) | 8/23/2017 | 0.6 | 0.6 | (2)(17) | ||||||||||||
First lien senior secured loan ($12.7 par due 8/2022) | 6.48% (Libor + 5.00%/Q) | 8/23/2017 | 12.7 | 12.7 | (2)(17) | ||||||||||||||
13.3 | 13.3 | ||||||||||||||||||
Respicardia, Inc. | Developer of implantable therapies to improve cardiovascular health | Warrant to purchase up to 99,094 shares of Series C preferred stock (expires 6/2022) | 6/28/2012 | — | — | (2) | |||||||||||||
Sarnova HC, LLC, Tri-Anim Health Services, Inc., and BEMS Holdings, LLC | Distributor of emergency medical service and respiratory products | Second lien senior secured loan ($54.0 par due 7/2022) | 11.07% (Libor + 9.50%/Q) | 1/29/2016 | 54.0 | 54.0 | (2)(17) | ||||||||||||
TerSera Therapeutics LLC | Acquirer and developer of specialty therapeutic pharmaceutical products | First lien senior secured loan ($5.3 par due 3/2023) | 6.94% (Libor + 5.25%/Q) | 5/3/2017 | 5.2 | 5.3 | (4)(17) | ||||||||||||
Transaction Data Systems, Inc. | Pharmacy management software provider | Second lien senior secured loan ($35.3 par due 6/2022) | 10.35% (Libor + 9.00%/Q) | 6/15/2015 | 35.3 | 35.3 | (2)(17) | ||||||||||||
Second lien senior secured loan ($3.8 par due 6/2022) | 10.35% (Libor + 9.00%/Q) | 12/19/2017 | 3.8 | 3.8 | (2)(17) | ||||||||||||||
39.1 | 39.1 | ||||||||||||||||||
U.S. Anesthesia Partners, Inc. | Anesthesiology service provider | Second lien senior secured loan ($71.8 par due 6/2025) | 8.82% (Libor + 7.25%/Q) | 6/16/2017 | 70.8 | 71.8 | (2)(17) | ||||||||||||
Urgent Cares of America Holdings I, LLC and FastMed Holdings I, LLC (21) | Operator of urgent care clinics | Preferred units (7,696,613 units) | 6/11/2015 | 7.7 | 0.5 | ||||||||||||||
Series A common units (2,000,000 units) | 6/11/2015 | 2.0 | — | ||||||||||||||||
Series C common units (5,288,427 units) | 6/11/2015 | — | — | ||||||||||||||||
9.7 | 0.5 | ||||||||||||||||||
VistaPharm, Inc. and Vertice Pharma UK Parent Limited (21) | Manufacturer and distributor of generic pharmaceutical products | First lien senior secured loan ($7.8 par due 12/2021) | 7.86% (Libor + 6.00%/Q) | 11/6/2017 | 7.8 | 7.7 | (2)(17) | ||||||||||||
Preferred shares (40,662 shares) | 12/21/2015 | 0.3 | 0.5 | (9) | |||||||||||||||
8.1 | 8.2 | ||||||||||||||||||
2,622.8 | 2,668.6 | 37.60 | % | ||||||||||||||||
Business Services | |||||||||||||||||||
Accruent, LLC, Accruent Holding, LLC and Athena Parent, Inc. (21) | Real estate and facilities management software provider | First lien senior secured revolving loan ($0.7 par due 7/2023) | 6.36% (Libor + 4.75%/Q) | 7/28/2017 | 0.7 | 0.7 | (2)(17) | ||||||||||||
Second lien senior secured loan ($13.2 par due 7/2024) | 10.13% (Libor + 8.75%/Q) | 7/28/2017 | 13.2 | 13.2 | (2)(17) | ||||||||||||||
Second lien senior secured loan ($0.5 par due 7/2024) | 10.36% (Libor + 8.75%/Q) | 7/28/2017 | 0.5 | 0.5 | (2)(17) | ||||||||||||||
Second lien senior secured loan ($2.6 par due 7/2024) | 10.16% (Libor + 8.75%/Q) | 7/28/2017 | 2.6 | 2.6 | (2)(17) | ||||||||||||||
Second lien senior secured loan ($58.4 par due 7/2024) | 10.13% (Libor + 8.75%/Q) | 7/28/2017 | 58.4 | 58.4 | (2)(17) | ||||||||||||||
Senior subordinated loan ($21.2 par due 7/2025) | 11.50% PIK | 7/28/2017 | 21.2 | 20.4 | (2) | ||||||||||||||
Senior subordinated loan ($75.7 par due 7/2025) | 11.50% PIK | 7/28/2017 | 75.7 | 72.8 | (2) | ||||||||||||||
Common stock (3,464 shares) | 5/16/2016 | 3.6 | 2.7 | (2) | |||||||||||||||
F-10
As of December 31, 2017
(dollar amounts in millions)
Company(1) | Business Description | Investment | Interest(6)(12) | Acquisition Date | Amortized Cost | Fair Value | Percentage of Net Assets | ||||||||||||
Warrant to purchase up to 11,380 shares of common stock (expires 7/2037) | 7/28/2017 | — | 3.3 | (2) | |||||||||||||||
175.9 | 174.6 | ||||||||||||||||||
Achilles Acquisition LLC (21) | Benefits broker and outsourced workflow automation platform provider for brokers | First lien senior secured loan ($3.0 par due 6/2023) | 7.69% (Libor + 6.00%/Q) | 6/6/2017 | 3.0 | 3.0 | (2)(17) | ||||||||||||
First lien senior secured loan ($10.2 par due 6/2023) | 7.69% (Libor + 6.00%/Q) | 6/6/2017 | 10.2 | 10.2 | (4)(17) | ||||||||||||||
13.2 | 13.2 | ||||||||||||||||||
Acrisure, LLC, Acrisure Investors FO, LLC and Acrisure Investors SO, LLC | Retail insurance advisor and brokerage | Membership interests (10,793,504 units) | 11/18/2016 | 10.8 | 10.8 | (2) | |||||||||||||
Membership interests (2,698,376 units) | 11/18/2016 | 2.7 | 2.7 | (2) | |||||||||||||||
13.5 | 13.5 | ||||||||||||||||||
BeyondTrust Software, Inc. | Management software solutions provider | First lien senior secured loan ($46.2 par due 11/2023) | 7.89% (Libor + 6.25%/Q) | 11/21/2017 | 45.5 | 45.7 | (3)(17) | ||||||||||||
Brandtone Holdings Limited (9) | Mobile communications and marketing services provider | First lien senior secured loan ($4.7 par due 11/2018) | — | 5/11/2015 | 4.5 | — | (2)(16) | ||||||||||||
First lien senior secured loan ($3.1 par due 2/2019) | — | 5/11/2015 | 2.9 | — | (2)(16) | ||||||||||||||
Warrant to purchase up to 184,003 units of convertible preferred shares (expires 8/2026) | 5/11/2015 | — | — | (2) | |||||||||||||||
7.4 | — | ||||||||||||||||||
CallMiner, Inc. | Provider of cloud-based conversational analytics solutions | Warrant to purchase up to 2,350,636 shares of Series 1 preferred stock (expires 7/2024) | 7/23/2014 | — | — | (2) | |||||||||||||
Chesapeake Research Review, LLC and Schulman Associates Institutional Review Board, Inc. (21) | Provider of central institutional review boards over clinical trials | First lien senior secured revolving loan ($0.6 par due 11/2023) | 7.14% (Libor + 5.75%/Q) | 11/7/2017 | 0.6 | 0.6 | (2)(17) | ||||||||||||
First lien senior secured loan ($30.8 par due 11/2023) | 7.14% (Libor + 5.75%/Q) | 11/7/2017 | 30.8 | 30.5 | (2)(17) | ||||||||||||||
31.4 | 31.1 | ||||||||||||||||||
Clearwater Analytics, LLC (21) | Provider of integrated cloud-based investment portfolio management, accounting, reporting and analytics software | First lien senior secured revolving loan ($0.4 par due 9/2022) | 9.00% (Libor + 7.50%/Q) | 9/1/2016 | 0.4 | 0.4 | (2)(17) | ||||||||||||
CMW Parent LLC (fka Black Arrow, Inc.) | Multiplatform media firm | Series A units (32 units) | 9/11/2015 | — | — | (2) | |||||||||||||
Columbo Midco Limited, Columbo Bidco Limited and Columbo Topco Limited (8)(9) | Compliance, accounting and tax consulting services provider | Preferred stock (34,028,135 shares) | 1/3/2017 | 2.3 | 9.9 | ||||||||||||||
Preferred stock (17,653,253 shares) | 1/3/2017 | 21.6 | 26.0 | ||||||||||||||||
Preferred stock (3,232,666 shares) | 1/3/2017 | 4.0 | 4.7 | ||||||||||||||||
27.9 | 40.6 | ||||||||||||||||||
Command Alkon Incorporated (21) | Software solutions provider to the ready-mix concrete industry | First lien senior secured revolving loan ($1.5 par due 9/2022) | 8.50% (Base Rate + 4.00%/Q) | 9/1/2017 | 1.5 | 1.5 | (2)(17)(20) | ||||||||||||
First lien senior secured loan ($25.6 par due 9/2023) | 6.48% (Libor + 5.00%/Q) | 9/1/2017 | 25.6 | 25.3 | (2)(17) | ||||||||||||||
Second lien senior secured loan ($33.8 par due 3/2024) | 10.48% (Libor + 9.00%/Q) | 9/1/2017 | 33.8 | 33.4 | (2)(17) | ||||||||||||||
60.9 | 60.2 | ||||||||||||||||||
Compusearch Software Systems, Inc. | Provider of enterprise software and services for organizations in the public sector | Second lien senior secured loan ($51.0 par due 11/2021) | 10.16% (Libor + 8.75%/Q) | 1/3/2017 | 51.0 | 51.0 | (2)(17) | ||||||||||||
Compuware Parent, LLC | Web and mobile cloud performance testing and monitoring services provider | Class A-1 common stock (4,132 units) | 12/15/2014 | 2.2 | 2.2 | (2) | |||||||||||||
F-11
As of December 31, 2017
(dollar amounts in millions)
Company(1) | Business Description | Investment | Interest(6)(12) | Acquisition Date | Amortized Cost | Fair Value | Percentage of Net Assets | ||||||||||||
Class B-1 common stock (4,132 units) | 12/15/2014 | 0.4 | 0.4 | (2) | |||||||||||||||
Class C-1 common stock (4,132 units) | 12/15/2014 | 0.3 | 0.3 | (2) | |||||||||||||||
Class A-2 common stock (4,132 units) | 12/15/2014 | — | — | (2) | |||||||||||||||
Class B-2 common stock (4,132 units) | 12/15/2014 | — | — | (2) | |||||||||||||||
Class C-2 common stock (4,132 units) | 12/15/2014 | — | — | (2) | |||||||||||||||
2.9 | 2.9 | ||||||||||||||||||
Convergint Technologies LLC | Integrated services provider for security, fire and life safety | Second lien senior secured loan ($25.0 par due 12/2020) | 10.27% (Libor + 8.50%/Q) | 12/18/2017 | 25.0 | 25.0 | (2)(17) | ||||||||||||
Second lien senior secured loan ($3.0 par due 12/2020) | 10.12% (Libor + 8.50%/Q) | 1/3/2017 | 3.0 | 3.0 | (2)(17) | ||||||||||||||
Second lien senior secured loan ($6.0 par due 12/2020) | 9.98% (Libor + 8.50%/Q) | 1/3/2017 | 6.0 | 6.0 | (2)(17) | ||||||||||||||
Second lien senior secured loan ($14.0 par due 12/2020) | 10.00% (Libor + 8.50%/Q) | 1/3/2017 | 14.0 | 14.0 | (2)(17) | ||||||||||||||
Second lien senior secured loan ($8.0 par due 12/2020) | 10.27% (Libor + 8.50%/Q) | 1/3/2017 | 8.0 | 8.0 | (2)(17) | ||||||||||||||
Second lien senior secured loan ($8.0 par due 12/2020) | 9.45% (Libor + 8.00%/Q) | 1/3/2017 | 8.0 | 8.0 | (2)(17) | ||||||||||||||
Second lien senior secured loan ($11.0 par due 12/2020) | 9.50% (Libor + 8.00%/Q) | 1/3/2017 | 11.0 | 11.0 | (2)(17) | ||||||||||||||
Second lien senior secured loan ($75.0 par due 12/2020) | 9.61% (Libor + 8.00%/Q) | 1/3/2017 | 75.0 | 75.0 | (2)(17) | ||||||||||||||
150.0 | 150.0 | ||||||||||||||||||
Directworks, Inc. and Co-Exprise Holdings, Inc. | Provider of cloud-based software solutions for direct materials sourcing and supplier management for manufacturers | First lien senior secured loan ($1.8 par due 4/2018) | — | 12/19/2014 | 1.3 | 0.2 | (2)(16) | ||||||||||||
Warrant to purchase up to 1,875,000 shares of Series 1 preferred stock (expires 12/2024) | 12/19/2014 | — | — | (2) | |||||||||||||||
1.3 | 0.2 | ||||||||||||||||||
DRB Holdings, LLC (21) | Provider of integrated technology solutions to car wash operators | First lien senior secured loan ($36.7 par due 10/2023) | 7.10% (Libor + 5.75%/Q) | 10/6/2017 | 36.7 | 36.3 | (2)(17) | ||||||||||||
DTI Holdco, Inc. and OPE DTI Holdings, Inc. (21) | Provider of legal process outsourcing and managed services | First lien senior secured loan ($4.1 par due 10/2023) | 6.63% (Libor + 5.25%/Q) | 9/23/2016 | 4.1 | 4.1 | (4)(17) | ||||||||||||
Class A common stock (7,500 shares) | 8/19/2014 | 7.5 | 6.9 | (2) | |||||||||||||||
Class B common stock (7,500 shares) | 8/19/2014 | — | — | (2) | |||||||||||||||
11.6 | 11.0 | ||||||||||||||||||
Emergency Communications Network, LLC (21) | Provider of mission critical emergency mass notification solutions | First lien senior secured loan ($37.9 par due 6/2023) | 7.82% (Libor + 6.25%/Q) | 6/1/2017 | 37.7 | 37.5 | (2)(17) | ||||||||||||
First lien senior secured loan ($19.9 par due 6/2023) | 7.82% (Libor + 6.25%/Q) | 6/1/2017 | 19.8 | 19.8 | (4)(17) | ||||||||||||||
57.5 | 57.3 | ||||||||||||||||||
EN Engineering, L.L.C. (21) | National utility services firm providing engineering and consulting services to natural gas, electric power and other energy and industrial end markets | First lien senior secured revolving loan | — | 6/30/2015 | — | — | (19) | ||||||||||||
Entertainment Partners, LLC and Entertainment Partners Canada Inc. (21) | Provider of entertainment workforce and production management solutions | First lien senior secured loan ($7.9 par due 5/2022) | 6.85% (Libor + 5.50%/Q) | 5/8/2017 | 7.3 | 7.9 | (2)(9)(17) | ||||||||||||
F-12
As of December 31, 2017
(dollar amounts in millions)
Company(1) | Business Description | Investment | Interest(6)(12) | Acquisition Date | Amortized Cost | Fair Value | Percentage of Net Assets | ||||||||||||
First lien senior secured loan ($4.2 par due 5/2023) | 7.15% (Libor + 5.75%/Q) | 5/8/2017 | 4.2 | 4.1 | (2)(17) | ||||||||||||||
First lien senior secured loan ($26.1 par due 5/2023) | 7.15% (Libor + 5.75%/Q) | 5/8/2017 | 26.1 | 25.8 | (3)(17) | ||||||||||||||
First lien senior secured loan ($3.6 par due 5/2023) | 7.44% (Libor + 5.75%/Q) | 5/8/2017 | 3.6 | 3.6 | (2)(17) | ||||||||||||||
First lien senior secured loan ($22.5 par due 5/2023) | 7.44% (Libor + 5.75%/Q) | 5/8/2017 | 22.5 | 22.2 | (3)(17) | ||||||||||||||
First lien senior secured loan ($4.2 par due 5/2023) | 7.34% (Libor + 5.75%/Q) | 5/8/2017 | 4.2 | 4.1 | (2)(17) | ||||||||||||||
First lien senior secured loan ($26.1 par due 5/2023) | 7.34% (Libor + 5.75%/Q) | 5/8/2017 | 26.1 | 25.8 | (3)(17) | ||||||||||||||
94.0 | 93.5 | ||||||||||||||||||
First Insight, Inc. | Software company providing merchandising and pricing solutions to companies worldwide | Warrant to purchase up to 122,827 units of Series C preferred stock (expires 3/2024) | 3/20/2014 | — | — | (2) | |||||||||||||
Flexera Software LLC | Provider of software and software applications that manages application usage, compliance and security risk | Second lien senior secured loan ($5.0 par due 4/2021) | 8.57% (Libor + 7.00%/Q) | 1/3/2017 | 4.8 | 5.0 | (2)(17) | ||||||||||||
Foundation Risk Partners, Corp. (21) | Full service independent insurance agency | First lien senior secured loan ($23.5 par due 11/2023) | 6.16% (Libor + 4.75%/Q) | 11/10/2017 | 23.5 | 23.3 | (3)(17) | ||||||||||||
Second lien senior secured loan ($27.5 par due 11/2024) | 9.91% (Libor + 8.50%/Q) | 11/10/2017 | 27.5 | 27.2 | (2)(17) | ||||||||||||||
51.0 | 50.5 | ||||||||||||||||||
Graphpad Software, LLC (21) | Provider of data analysis, statistics, and visualization software solutions for scientific research applications | First lien senior secured revolving loan ($0.6 par due 12/2023) | 7.66% (Libor + 6.00%/Q) | 12/21/2017 | 0.6 | 0.6 | (2)(17) | ||||||||||||
First lien senior secured loan ($8.8 par due 12/2023) | 7.66% (Libor + 6.00%/Q) | 12/21/2017 | 8.8 | 8.7 | (2)(17) | ||||||||||||||
9.4 | 9.3 | ||||||||||||||||||
GTCR-Ultra Acquisition, Inc. and GTCR-Ultra Holdings, LLC (21) | Provider of payment processing and merchant acquiring solutions | First lien senior secured loan ($8.9 par due 8/2024) | 7.37% (Libor + 6.00%/Q) | 8/1/2017 | 8.9 | 8.9 | (4)(17) | ||||||||||||
Class A-2 units (911 units) | 8/1/2017 | 0.9 | 1.0 | (2) | |||||||||||||||
Class B units (2,878,372 units) | 8/1/2017 | — | — | (2) | |||||||||||||||
9.8 | 9.9 | ||||||||||||||||||
HAI Acquisition Corporation and Aloha Topco, LLC (21) | Professional employer organization provider of human resources, compliance and risk management services | First lien senior secured revolving loan ($4.7 par due 11/2023) | 7.38% (Libor + 6.00%/Q) | 11/1/2017 | 4.7 | 4.7 | (2)(17) | ||||||||||||
First lien senior secured loan ($81.4 par due 11/2024) | 9.50% (Base Rate + 5.00%/Q) | 11/1/2017 | 81.4 | 80.6 | (2)(17) | ||||||||||||||
Class A units (16,980 units) | 11/1/2017 | 1.7 | 1.7 | (2) | |||||||||||||||
87.8 | 87.0 | ||||||||||||||||||
IfByPhone Inc. | Voice-based marketing automation software provider | Warrant to purchase up to 124,300 shares of Series C preferred stock (expires 10/2022) | 10/15/2012 | 0.1 | 0.1 | (2) | |||||||||||||
Implementation Management Assistance, LLC (21) | Revenue cycle consulting firm to the healthcare industry | First lien senior secured loan ($8.0 par due 12/2023) | 5.46% (Libor + 4.00%/Q) | 12/13/2017 | 8.0 | 7.9 | (2)(17) | ||||||||||||
Infogix, Inc. and Infogix Parent Corporation | Enterprise data analytics and integrity software solutions provider | First lien senior secured loan ($51.6 par due 12/2021) | 8.44% (Libor + 6.75%/Q) | 1/3/2017 | 51.6 | 51.6 | (2)(12)(17) | ||||||||||||
First lien senior secured loan ($34.9 par due 12/2021) | 8.44% (Libor + 6.75%/Q) | 1/3/2017 | 34.9 | 34.9 | (3)(12)(17) | ||||||||||||||
Series A preferred stock (2,475 shares) | 1/3/2017 | 2.5 | 2.9 | ||||||||||||||||
F-13
As of December 31, 2017
(dollar amounts in millions)
Company(1) | Business Description | Investment | Interest(6)(12) | Acquisition Date | Amortized Cost | Fair Value | Percentage of Net Assets | ||||||||||||
Common stock (1,297,768 shares) | 1/3/2017 | — | 0.3 | ||||||||||||||||
89.0 | 89.7 | ||||||||||||||||||
Inmar, Inc. | Technology-driven solutions provider for retailers, wholesalers and manufacturers | Second lien senior secured loan ($28.3 par due 5/2025) | 9.42% (Libor + 8.00%/Q) | 4/25/2017 | 27.9 | 28.3 | (2)(17) | ||||||||||||
InterVision Systems, LLC and InterVision Holdings, LLC | Provider of cloud based IT solutions, infrastructure and services | First lien senior secured loan ($24.7 par due 5/2022) | 9.79% (Libor + 7.95%/Q) | 5/31/2017 | 24.7 | 24.7 | (2)(17) | ||||||||||||
First lien senior secured loan ($10.0 par due 5/2022) | 9.79% (Libor + 7.95%/Q) | 5/31/2017 | 10.0 | 10.0 | (4)(17) | ||||||||||||||
Class A membership units (1,000 units) | 5/31/2017 | 1.0 | 1.4 | ||||||||||||||||
35.7 | 36.1 | ||||||||||||||||||
iParadigms Holdings, LLC | Anti-plagiarism software provider to the education market | Second lien senior secured loan ($37.5 par due 7/2022) | 8.94% (Libor + 7.25%/Q) | 1/3/2017 | 36.8 | 36.7 | (2)(17) | ||||||||||||
iPipeline, Inc., Internet Pipeline, Inc., iPipeline Limited and iPipeline Holdings, Inc. (21) | Provider of SaaS-based software solutions to the insurance and financial services industry | First lien senior secured loan ($7.5 par due 8/2022) | 7.74% (Libor + 6.25%/Q) | 6/15/2017 | 7.4 | 7.5 | (2)(17) | ||||||||||||
First lien senior secured loan ($9.1 par due 8/2022) | 7.74% (Libor + 6.25%/Q) | 9/15/2017 | 9.1 | 9.1 | (2)(17) | ||||||||||||||
First lien senior secured loan ($46.4 par due 8/2022) | 8.60% (Libor + 7.25%/Q) | 8/4/2015 | 46.4 | 46.4 | (3)(17) | ||||||||||||||
First lien senior secured loan ($14.7 par due 8/2022) | 8.60% (Libor + 7.25%/Q) | 8/4/2015 | 14.7 | 14.7 | (4)(17) | ||||||||||||||
First lien senior secured loan ($12.2 par due 8/2022) | 8.07% (Libor + 6.50%/Q) | 12/18/2017 | 12.0 | 12.2 | (2)(9)(17) | ||||||||||||||
Preferred stock (1,100 shares) | 8/4/2015 | 1.1 | 3.5 | (2) | |||||||||||||||
Common stock (668,781 shares) | 8/4/2015 | — | — | (2) | |||||||||||||||
90.7 | 93.4 | ||||||||||||||||||
IQMS | Provider of enterprise resource planning and manufacturing execution software for small and midsized manufacturers | First lien senior secured loan ($4.0 par due 3/2022) | 9.82% (Libor + 8.25%/Q) | 3/28/2017 | 4.0 | 4.0 | (2)(17) | ||||||||||||
First lien senior secured loan ($18.8 par due 3/2022) | 9.82% (Libor + 8.25%/Q) | 3/28/2017 | 18.8 | 18.8 | (3)(17) | ||||||||||||||
First lien senior secured loan ($15.0 par due 3/2022) | 9.82% (Libor + 8.25%/Q) | 3/28/2017 | 15.0 | 15.0 | (4)(17) | ||||||||||||||
37.8 | 37.8 | ||||||||||||||||||
Iron Bow Technologies, LLC | Provider and value added reseller of information technology products and solutions | Second lien senior secured loan ($10.0 par due 2/2021) | 13.11% (Libor + 10.00% Cash, 1.75% PIK/Q) | 1/3/2017 | 10.0 | 10.0 | (2)(17) | ||||||||||||
IronPlanet, Inc. | Online auction platform provider for used heavy equipment | Warrant to purchase to up to 133,333 shares of Series C preferred stock (expires 9/2023) | 9/23/2013 | 0.2 | 0.4 | (2) | |||||||||||||
LLSC Holdings Corporation (dba Lawrence Merchandising Services) (8) | Marketing services provider | Series A preferred stock (9,000 shares) | 1/3/2017 | 19.2 | 18.2 | ||||||||||||||
Common stock (1,000 shares) | 1/3/2017 | — | — | ||||||||||||||||
19.2 | 18.2 | ||||||||||||||||||
Miles 33 (Finance) Limited (8)(9) | Software provider to the regional media industry and magazines | First lien senior secured loan ($0.4 par due 9/2018) | 7.00% (EURIBOR + 3.50% Cash, 3.00% PIK/Q) | 1/3/2017 | 0.3 | 0.4 | |||||||||||||
First lien senior secured loan ($4.1 par due 9/2018) | 7.00% (EURIBOR + 3.50% Cash, 3.00% PIK/Q) | 1/3/2017 | 3.7 | 4.1 | |||||||||||||||
Senior subordinated loan ($17.4 par due 9/2021) | 5.00% (EURIBOR + 4.50%/Q) | 1/3/2017 | 9.9 | 13.4 | |||||||||||||||
Preferred stock (19,500,000 shares) | 1/3/2017 | — | — | ||||||||||||||||
F-14
As of December 31, 2017
(dollar amounts in millions)
Company(1) | Business Description | Investment | Interest(6)(12) | Acquisition Date | Amortized Cost | Fair Value | Percentage of Net Assets | ||||||||||||
Preferred stock (900,000 shares) | 1/3/2017 | — | — | ||||||||||||||||
Common stock (600,000 shares) | 1/3/2017 | — | — | ||||||||||||||||
13.9 | 17.9 | ||||||||||||||||||
Ministry Brands, LLC and MB Parent HoldCo, L.P. (21) | Software and payment services provider to faith-based institutions | First lien senior secured revolving loan ($10.9 par due 12/2022) | 6.57% (Libor + 5.00%/Q) | 12/2/2016 | 10.9 | 10.9 | (2)(17) | ||||||||||||
First lien senior secured loan ($1.7 par due 12/2022) | 6.57% (Libor + 5.00%/Q) | 8/22/2017 | 1.7 | 1.7 | (2)(17) | ||||||||||||||
First lien senior secured loan ($1.4 par due 12/2022) | 6.38% (Libor + 5.00%/Q) | 8/22/2017 | 1.4 | 1.4 | (2)(17) | ||||||||||||||
First lien senior secured loan ($10.6 par due 12/2022) | 6.38% (Libor + 5.00%/Q) | 4/6/2017 | 10.6 | 10.6 | (2)(17) | ||||||||||||||
First lien senior secured loan ($16.7 par due 12/2022) | 6.38% (Libor + 5.00%/Q) | 4/6/2017 | 16.5 | 16.7 | (2)(17) | ||||||||||||||
Second lien senior secured loan ($4.6 par due 6/2023) | 10.82% (Libor + 9.25%/Q) | 8/22/2017 | 4.6 | 4.6 | (2)(17) | ||||||||||||||
Second lien senior secured loan ($1.6 par due 6/2023) | 10.60% (Libor + 9.25%/Q) | 8/22/2017 | 1.6 | 1.6 | (2)(17) | ||||||||||||||
Second lien senior secured loan ($5.1 par due 6/2023) | 10.63% (Libor + 9.25%/Q) | 8/22/2017 | 5.1 | 5.1 | (2)(17) | ||||||||||||||
Second lien senior secured loan ($16.6 par due 6/2023) | 10.63% (Libor + 9.25%/Q) | 12/2/2016 | 16.6 | 16.6 | (2)(17) | ||||||||||||||
Second lien senior secured loan ($4.7 par due 6/2023) | 10.63% (Libor + 9.25%/Q) | 4/6/2017 | 4.7 | 4.7 | (2)(17) | ||||||||||||||
Second lien senior secured loan ($9.2 par due 6/2023) | 10.63% (Libor + 9.25%/Q) | 4/6/2017 | 9.2 | 9.2 | (2)(17) | ||||||||||||||
Second lien senior secured loan ($90.0 par due 6/2023) | 10.63% (Libor + 9.25%/Q) | 12/2/2016 | 89.3 | 90.0 | (2)(17) | ||||||||||||||
Class A units (500,000 units) | 12/2/2016 | 5.0 | 6.8 | (2) | |||||||||||||||
177.2 | 179.9 | ||||||||||||||||||
MVL Group, Inc. (8) | Marketing research provider | Common stock (560,716 shares) | 4/1/2010 | — | — | (2) | |||||||||||||
NAS, LLC, Nationwide Marketing Group, LLC and Nationwide Administrative Services, Inc. | Buying and marketing services organization for appliance, furniture and consumer electronics dealers | Second lien senior secured loan ($24.1 par due 12/2021) | 10.32% (Libor + 9.00%/Q) | 6/1/2015 | 24.1 | 24.1 | (2)(17) | ||||||||||||
Novetta Solutions, LLC | Provider of advanced analytics solutions for the government, defense and commercial industries | First lien senior secured loan ($12.7 par due 10/2022) | 6.70% (Libor + 5.00%/Q) | 1/3/2017 | 12.3 | 12.1 | (2)(17) | ||||||||||||
Second lien senior secured loan ($31.0 par due 10/2023) | 10.20% (Libor + 8.50%/Q) | 1/3/2017 | 28.4 | 27.9 | (2)(17) | ||||||||||||||
40.7 | 40.0 | ||||||||||||||||||
Palermo Finance Corporation (21) | Provider of mission-critical integrated public safety software and services to local, state and federal agencies | First lien senior secured revolving loan | — | 4/17/2017 | — | — | (19) | ||||||||||||
First lien senior secured loan ($11.0 par due 4/2023) | 5.85% (Libor + 4.50%/Q) | 4/17/2017 | 10.9 | 11.0 | (4)(17) | ||||||||||||||
Second lien senior secured loan ($54.3 par due 10/2023) | 9.85% (Libor + 8.50%/Q) | 4/17/2017 | 54.3 | 54.3 | (2)(17) | ||||||||||||||
65.2 | 65.3 | ||||||||||||||||||
Park Place Technologies, LLC | Provider of third party hardware maintenance and support services for IT data centers | Second lien senior secured loan ($41.5 par due 12/2022) | 10.54% (Libor + 9.00%/Q) | 1/3/2017 | 41.5 | 41.5 | (2)(17) | ||||||||||||
PayNearMe, Inc. | Electronic cash payment system provider | Warrant to purchase up to 195,726 shares of Series E preferred stock (expires 3/2023) | 3/11/2016 | 0.2 | — | (5) | |||||||||||||
PDI TA Holdings, Inc. (21) | Provider of enterprise management software for the convenience retail and petroleum wholesale markets | First lien senior secured revolving loan ($0.9 par due 8/2023) | 8.25% (Base Rate + 3.75%/Q) | 8/25/2017 | 0.9 | 0.9 | (2)(17) | ||||||||||||
First lien senior secured loan ($3.7 par due 8/2023) | 6.32% (Libor + 4.75%/Q) | 8/25/2017 | 3.7 | 3.7 | (2)(17) | ||||||||||||||
F-15
As of December 31, 2017
(dollar amounts in millions)
Company(1) | Business Description | Investment | Interest(6)(12) | Acquisition Date | Amortized Cost | Fair Value | Percentage of Net Assets | ||||||||||||
First lien senior secured loan ($26.4 par due 8/2023) | 6.21% (Libor + 4.75%/Q) | 8/25/2017 | 26.4 | 26.1 | (2)(17) | ||||||||||||||
Second lien senior secured loan ($8.2 par due 8/2024) | 10.32% (Libor + 8.75%/Q) | 8/25/2017 | 8.2 | 8.1 | (2)(17) | ||||||||||||||
Second lien senior secured loan ($66.8 par due 8/2024) | 10.21% (Libor + 8.75%/Q) | 8/25/2017 | 66.8 | 66.1 | (2)(17) | ||||||||||||||
106.0 | 104.9 | ||||||||||||||||||
PHL Investors, Inc., and PHL Holding Co. (8) | Mortgage services | Class A common stock (576 shares) | 7/31/2012 | 3.8 | — | (2) | |||||||||||||
PHNTM Holdings, Inc. and Planview Parent, Inc. | Provider of project and portfolio management software | First lien senior secured loan ($5.1 par due 1/2023) | 6.82% (Libor + 5.25%/Q) | 12/7/2017 | 5.1 | 5.1 | (2)(17) | ||||||||||||
First lien senior secured loan ($31.6 par due 1/2023) | 6.82% (Libor + 5.25%/Q) | 1/27/2017 | 31.1 | 31.6 | (2)(17) | ||||||||||||||
First lien senior secured loan ($5.0 par due 1/2023) | 6.82% (Libor + 5.25%/Q) | 1/27/2017 | 4.9 | 5.0 | (4)(17) | ||||||||||||||
Second lien senior secured loan ($62.0 par due 7/2023) | 11.32% (Libor + 9.75%/Q) | 1/27/2017 | 61.2 | 62.0 | (2)(17) | ||||||||||||||
Class A common shares (990 shares) | 1/27/2017 | 1.0 | 1.1 | (2) | |||||||||||||||
Class B common shares (168,329 shares) | 1/27/2017 | — | 0.2 | (2) | |||||||||||||||
103.3 | 105.0 | ||||||||||||||||||
Poplicus Incorporated | Business intelligence and market analytics platform for companies that sell to the public sector | Warrant to purchase up to 2,402,991 shares of Series C preferred stock (expires 6/2025) | 6/25/2015 | 0.1 | — | (5) | |||||||||||||
PowerPlan, Inc. and Project Torque Ultimate Parent Corporation | Fixed asset financial management software provider | Second lien senior secured loan ($30.0 par due 2/2023) | 10.57% (Libor + 9.00%/Q) | 2/23/2015 | 29.8 | 30.0 | (2)(17) | ||||||||||||
Second lien senior secured loan ($50.0 par due 2/2023) | 10.57% (Libor + 9.00%/Q) | 2/23/2015 | 49.7 | 50.0 | (3)(17) | ||||||||||||||
Class A common stock (1,697 shares) | 2/23/2015 | 1.7 | 3.3 | (2) | |||||||||||||||
Class B common stock (989,011 shares) | 2/23/2015 | — | — | (2) | |||||||||||||||
81.2 | 83.3 | ||||||||||||||||||
Project Alpha Intermediate Holding, Inc. and Qlik Parent, Inc. | Provider of data visualization software for data analytics | Class A common shares (7,444 shares) | 8/22/2016 | 7.4 | 7.6 | (2) | |||||||||||||
Class B common shares (1,841,608.69 shares) | 8/22/2016 | 0.1 | — | (2) | |||||||||||||||
7.5 | 7.6 | ||||||||||||||||||
R2 Acquisition Corp. | Marketing services | Common stock (250,000 shares) | 5/29/2007 | 0.2 | 0.3 | (2) | |||||||||||||
SCM Insurance Services Inc. (9)(21) | Provider of claims management, claims investigation & support and risk management solutions for the Canadian property and casualty insurance industry | First lien senior secured loan ($21.5 par due 8/2024) | 6.35% (Libor + 5.00%/Q) | 8/29/2017 | 21.5 | 21.2 | (2)(17) | ||||||||||||
Second lien senior secured loan ($60.5 par due 3/2025) | 10.35% (Libor + 9.00%/Q) | 8/29/2017 | 60.5 | 59.9 | (2)(17) | ||||||||||||||
82.0 | 81.1 | ||||||||||||||||||
Shift PPC LLC (21) | Digital solutions provider | First lien senior secured loan ($1.7 par due 12/2021) | 7.57% (Libor + 6.00%/Q) | 12/22/2016 | 1.7 | 1.7 | (4)(17) | ||||||||||||
First lien senior secured loan ($3.3 par due 12/2021) | 7.69% (Libor + 6.00%/Q) | 12/22/2016 | 3.3 | 3.3 | (4)(17) | ||||||||||||||
First lien senior secured loan ($5.0 par due 12/2021) | 7.84% (Libor + 6.00%/Q) | 12/22/2016 | 5.0 | 5.0 | (4)(17) | ||||||||||||||
10.0 | 10.0 | ||||||||||||||||||
Sparta Systems, Inc., Project Silverback Holdings Corp. and Silverback Holdings, Inc. (21) | Quality management software provider | Second lien senior secured loan ($20.0 par due 8/2025) | 9.69% (Libor + 8.25%/Q) | 8/21/2017 | 19.6 | 19.8 | (2)(17) | ||||||||||||
Series B preferred shares (10,084 shares) | 8/21/2017 | 1.1 | 1.1 | ||||||||||||||||
20.7 | 20.9 | ||||||||||||||||||
F-16
As of December 31, 2017
(dollar amounts in millions)
Company(1) | Business Description | Investment | Interest(6)(12) | Acquisition Date | Amortized Cost | Fair Value | Percentage of Net Assets | ||||||||||||
Talari Networks, Inc. | Networking equipment provider | First lien senior secured loan ($6.0 par due 10/2019) | 10.88% (Libor + 9.50%/M) | 8/3/2015 | 6.0 | 5.7 | (5)(17) | ||||||||||||
Warrant to purchase up to 421,052 shares of Series D-1 preferred stock (expires 8/2022) | 8/3/2015 | 0.1 | 0.1 | (5) | |||||||||||||||
6.1 | 5.8 | ||||||||||||||||||
The Gordian Group, Inc. (21) | Construction software and service provider | First lien senior secured loan ($8.4 par due 7/2019) | 6.14% (Libor + 4.50%/Q) | 1/3/2017 | 8.3 | 8.4 | (3)(17) | ||||||||||||
First lien senior secured loan ($3.2 par due 7/2019) | 6.14% (Libor + 4.50%/Q) | 1/3/2017 | 3.1 | 3.2 | (4)(17) | ||||||||||||||
First lien senior secured loan ($8.9 par due 7/2019) | 5.86% (Libor + 4.50%/Q) | 1/3/2017 | 8.8 | 8.9 | (3)(17) | ||||||||||||||
First lien senior secured loan ($3.4 par due 7/2019) | 5.86% (Libor + 4.50%/Q) | 1/3/2017 | 3.3 | 3.4 | (4)(17) | ||||||||||||||
First lien senior secured loan ($7.8 par due 7/2019) | 5.95% (Libor + 4.50%/Q) | 1/3/2017 | 7.6 | 7.8 | (3)(17) | ||||||||||||||
First lien senior secured loan ($2.9 par due 7/2019) | 5.95% (Libor + 4.50%/Q) | 1/3/2017 | 2.9 | 2.9 | (4)(17) | ||||||||||||||
34.0 | 34.6 | ||||||||||||||||||
The Greeley Company, Inc. and HCP Acquisition Holdings, LLC (8) | Healthcare compliance advisory services | Senior subordinated loan ($10.5 par due 3/2017) | 3/5/2013 | — | — | (2)(16) | |||||||||||||
Class A units (14,293,110 units) | 6/26/2008 | — | — | (2) | |||||||||||||||
— | — | ||||||||||||||||||
UL Holding Co., LLC (7) | Provider of collection and landfill avoidance solutions for food waste and unsold food products | Senior subordinated loan ($2.8 par due 5/2020) | 10.00% PIK | 4/30/2012 | 0.9 | 2.8 | (2) | ||||||||||||
Senior subordinated loan ($0.4 par due 5/2020) | 4/30/2012 | 0.1 | 0.4 | (2) | |||||||||||||||
Senior subordinated loan ($6.2 par due 5/2020) | 10.00% PIK | 4/30/2012 | 1.9 | 6.2 | (2) | ||||||||||||||
Senior subordinated loan ($0.5 par due 5/2020) | 4/30/2012 | 0.2 | 0.5 | (2) | |||||||||||||||
Senior subordinated loan ($24.5 par due 5/2020) | 10.00% PIK | 4/30/2012 | 7.6 | 24.5 | (2) | ||||||||||||||
Senior subordinated loan ($3.8 par due 5/2020) | 4/30/2012 | 1.2 | 3.8 | (2) | |||||||||||||||
Class A common units (533,351 units) | 6/17/2011 | 5.0 | 2.8 | (2) | |||||||||||||||
Class B-5 common units (272,834 units) | 6/17/2011 | 2.5 | 1.4 | (2) | |||||||||||||||
Class C common units (758,546 units) | 4/25/2008 | — | — | (2) | |||||||||||||||
Warrant to purchase up to 719,044 shares of Class A units | 5/2/2014 | — | — | (2) | |||||||||||||||
Warrant to purchase up to 28,663 shares of Class B-1 units | 5/2/2014 | — | — | (2) | |||||||||||||||
Warrant to purchase up to 57,325 shares of Class B-2 units | 5/2/2014 | — | — | (2) | |||||||||||||||
Warrant to purchase up to 29,645 shares of Class B-3 units | 5/2/2014 | — | — | (2) | |||||||||||||||
Warrant to purchase up to 80,371 shares of Class B-5 units | 5/2/2014 | — | — | (2) | |||||||||||||||
Warrant to purchase up to 59,655 shares of Class B-6 units | 5/2/2014 | — | — | (2) | |||||||||||||||
Warrant to purchase up to 1,046,713 shares of Class C units | 5/2/2014 | — | — | (2) | |||||||||||||||
19.4 | 42.4 | ||||||||||||||||||
Velocity Holdings Corp. | Hosted enterprise resource planning application management services provider | Common units (1,713,546 units) | 12/13/2013 | 4.5 | 3.4 | ||||||||||||||
F-17
As of December 31, 2017
(dollar amounts in millions)
Company(1) | Business Description | Investment | Interest(6)(12) | Acquisition Date | Amortized Cost | Fair Value | Percentage of Net Assets | ||||||||||||
Visual Edge Technology, Inc. | Provider of outsourced office solutions with a focus on printer and copier equipment and other parts and supplies | First lien senior secured loan ($1.2 par due 8/2022) | 7.32% (Libor + 5.75%/Q) | 8/31/2017 | 1.2 | 1.2 | (2)(17) | ||||||||||||
First lien senior secured loan ($3.8 par due 8/2022) | 7.13% (Libor + 5.75%/Q) | 8/31/2017 | 3.8 | 3.8 | (2)(17) | ||||||||||||||
First lien senior secured loan ($10.0 par due 8/2022) | 7.23% (Libor + 5.75%/Q) | 8/31/2017 | 10.0 | 10.0 | (2)(17) | ||||||||||||||
Senior subordinated loan ($41.5 par due 9/2024) | 12.50% PIK | 8/31/2017 | 37.6 | 39.0 | (2) | ||||||||||||||
Warrant to purchase up to 1,816,089 shares of common stock (expires 8/2027) | 8/31/2017 | — | 0.9 | (2) | |||||||||||||||
Warrant to purchase up to 2,070,511 shares of preferred stock (expires 8/2027) | 8/31/2017 | 4.1 | 4.4 | (2) | |||||||||||||||
56.7 | 59.3 | ||||||||||||||||||
VRC Companies, LLC (21) | Provider of records and information management services | First lien senior secured revolving loan ($0.8 par due 3/2022) | 10.00% (Base Rate + 5.50%/Q) | 4/17/2017 | 0.8 | 0.8 | (2)(17) | ||||||||||||
First lien senior secured loan ($1.4 par due 3/2023) | 7.82% (Libor + 6.50%/Q) | 4/17/2017 | 1.4 | 1.4 | (2)(17) | ||||||||||||||
First lien senior secured loan ($0.2 par due 3/2023) | 8.03% (Libor + 6.50%/Q) | 4/17/2017 | 0.2 | 0.2 | (2)(17) | ||||||||||||||
First lien senior secured loan ($0.4 par due 3/2023) | 7.93% (Libor + 6.50%/Q) | 10/3/2017 | 0.4 | 0.4 | (2)(17) | ||||||||||||||
First lien senior secured loan ($0.3 par due 3/2023) | 7.98% (Libor + 6.50%/Q) | 10/3/2017 | 0.3 | 0.3 | (2)(17) | ||||||||||||||
First lien senior secured loan ($0.3 par due 3/2023) | 8.03% (Libor + 6.50%/Q) | 10/3/2017 | 0.3 | 0.3 | (2)(17) | ||||||||||||||
First lien senior secured loan ($5.5 par due 3/2023) | 8.12% (Libor + 6.50%/Q) | 4/17/2017 | 5.5 | 5.5 | (2)(17) | ||||||||||||||
8.9 | 8.9 | ||||||||||||||||||
WorldPay Group PLC (9) | Payment processing company | C2 shares (73,974 shares) | 10/21/2015 | — | — | (24) | |||||||||||||
Zywave, Inc. (21) | Provider of software and technology-enabled content and analytical solutions to insurance brokers | First lien senior secured revolving loan ($1.3 par due 11/2022) | 6.57% (Libor + 5.00%/Q) | 11/17/2016 | 1.3 | 1.3 | (2)(17) | ||||||||||||
First lien senior secured revolving loan ($1.0 par due 11/2022) | 8.50% (Base Rate + 4.00%/Q) | 11/17/2016 | 1.0 | 1.0 | (2)(17) | ||||||||||||||
Second lien senior secured loan ($27.0 par due 11/2023) | 10.42% (Libor + 9.00%/Q) | 11/17/2016 | 27.0 | 27.0 | (2)(17) | ||||||||||||||
29.3 | 29.3 | ||||||||||||||||||
2,235.8 | 2,267.3 | 31.94 | % | ||||||||||||||||
Consumer Products | |||||||||||||||||||
Badger Sportswear Acquisition, Inc. | Provider of team uniforms and athletic wear | Second lien senior secured loan ($56.8 par due 3/2024) | 10.46% (Libor + 9.00%/Q) | 9/6/2016 | 56.7 | 56.8 | (2)(17) | ||||||||||||
BRG Sports, Inc. | Designer, manufacturer and licensor of branded sporting goods | Preferred stock (2,009 shares) | 1/3/2017 | — | — | ||||||||||||||
Common stock (6,566,655 shares) | 1/3/2017 | — | 0.3 | ||||||||||||||||
— | 0.3 | ||||||||||||||||||
Consumer Health Parent LLC | Developer and marketer of over-the-counter cold remedy products | Preferred units (1,072 units) | 12/15/2017 | 1.1 | 1.1 | (2) | |||||||||||||
Series A units (1,072 units) | 12/15/2017 | — | — | (2) | |||||||||||||||
1.1 | 1.1 | ||||||||||||||||||
Feradyne Outdoors, LLC and Bowhunter Holdings, LLC | Provider of branded archery and bowhunting accessories | Common units (421 units) | 4/24/2014 | 4.2 | 1.0 | (2) | |||||||||||||
Implus Footcare, LLC | Provider of footwear and other accessories | First lien senior secured loan ($14.6 par due 4/2021) | 8.44% (Libor + 6.75%/Q) | 6/1/2017 | 14.6 | 14.6 | (2)(17) | ||||||||||||
F-18
As of December 31, 2017
(dollar amounts in millions)
Company(1) | Business Description | Investment | Interest(6)(12) | Acquisition Date | Amortized Cost | Fair Value | Percentage of Net Assets | ||||||||||||
First lien senior secured loan ($77.5 par due 4/2021) | 8.44% (Libor + 6.75%/Q) | 6/1/2017 | 77.5 | 77.5 | (2)(17) | ||||||||||||||
First lien senior secured loan ($19.9 par due 4/2021) | 8.44% (Libor + 6.75%/Q) | 6/1/2017 | 19.9 | 19.9 | (4)(17) | ||||||||||||||
112.0 | 112.0 | ||||||||||||||||||
Indra Holdings Corp. | Designer, marketer, and distributor of rain and cold weather products | Second lien senior secured loan ($80.0 par due 11/2021) | — | 5/1/2014 | 76.9 | 43.6 | (2)(16) | ||||||||||||
Plantation Products, LLC, Seed Holdings, Inc. and Flora Parent, Inc. | Provider of branded lawn and garden products | Second lien senior secured loan ($2.0 par due 6/2021) | 9.41% (Libor + 7.99%/Q) | 12/23/2014 | 2.0 | 2.0 | (2)(17) | ||||||||||||
Second lien senior secured loan ($54.0 par due 6/2021) | 9.41% (Libor + 7.99%/Q) | 12/23/2014 | 53.8 | 54.0 | (3)(17) | ||||||||||||||
Second lien senior secured loan ($10.0 par due 6/2021) | 9.41% (Libor + 7.99%/Q) | 12/23/2014 | 10.0 | 10.0 | (4)(17) | ||||||||||||||
Common stock (30,000 shares) | 12/23/2014 | 3.0 | 6.0 | (2) | |||||||||||||||
68.8 | 72.0 | ||||||||||||||||||
Rug Doctor, LLC and RD Holdco Inc. (8) | Manufacturer and marketer of carpet cleaning machines | Second lien senior secured loan ($16.9 par due 12/2018) | 11.42% (Libor + 9.75%/Q) | 1/3/2017 | 16.9 | 16.9 | (2)(17) | ||||||||||||
Common stock (458,596 shares) | 1/3/2017 | 14.0 | 10.8 | ||||||||||||||||
Warrant to purchase up to 56,372 shares of common stock (expires 12/2023) | 1/3/2017 | — | — | ||||||||||||||||
30.9 | 27.7 | ||||||||||||||||||
S Toys Holdings LLC (fka The Step2 Company, LLC) (8) | Toy manufacturer | Class B common units (126,278,000 units) | 10/30/2014 | — | 0.5 | (2) | |||||||||||||
Common units (1,116,879 units) | 4/1/2011 | — | — | ||||||||||||||||
Warrant to purchase up to 3,157,895 units | 4/1/2010 | — | — | ||||||||||||||||
— | 0.5 | ||||||||||||||||||
SHO Holding I Corporation | Manufacturer and distributor of slip resistant footwear | Second lien senior secured loan ($100.0 par due 4/2023) | 9.92% (Libor + 8.50%/Q) | 10/27/2015 | 98.2 | 92.0 | (2)(17) | ||||||||||||
Shock Doctor, Inc. and Shock Doctor Holdings, LLC (7) | Developer, marketer and distributor of sports protection equipment and accessories | Second lien senior secured loan ($89.4 par due 10/2021) | 11.86% (Libor + 10.50%/Q) | 4/22/2015 | 89.4 | 82.3 | (2)(17) | ||||||||||||
Class A preferred units (50,000 units) | 3/14/2014 | 5.0 | 1.9 | (2) | |||||||||||||||
Class C preferred units (50,000 units) | 4/22/2015 | 5.0 | 1.9 | (2) | |||||||||||||||
99.4 | 86.1 | ||||||||||||||||||
Singer Sewing Company | Manufacturer of consumer sewing machines | First lien senior secured loan ($174.5 par due 12/2017) | 9.19% (Libor + 7.00% Cash, 0.50% PIK/Q) | 7/26/2017 | 174.5 | 165.7 | (2)(17) | ||||||||||||
Varsity Brands Holding Co., Inc., Hercules Achievement, Inc., Hercules Achievement Holdings, Inc. and Hercules VB Holdings, Inc. | Leading manufacturer and distributor of textiles, apparel & luxury goods | Second lien senior secured loan ($122.7 par due 12/2025) | 9.82% (Libor + 8.25%/Q) | 12/15/2017 | 122.7 | 122.7 | (2)(17) | ||||||||||||
Common stock (3,548,841 shares) | 12/11/2014 | 3.8 | 6.1 | (2) | |||||||||||||||
Common stock (3,548,841 shares) | 12/11/2014 | 4.3 | 6.1 | (2) | |||||||||||||||
130.8 | 134.9 | ||||||||||||||||||
Woodstream Group, Inc. and Woodstream Corporation (21) | Pet products manufacturer | First lien senior secured loan ($1.0 par due 5/2022) | 7.69% (Libor + 6.25%/Q) | 6/21/2017 | 1.0 | 1.0 | (2)(17) | ||||||||||||
First lien senior secured loan ($2.0 par due 5/2022) | 7.69% (Libor + 6.25%/Q) | 6/21/2017 | 2.0 | 2.0 | (4)(17) | ||||||||||||||
First lien senior secured loan ($3.1 par due 5/2022) | 7.89% (Libor + 6.25%/Q) | 6/21/2017 | 3.1 | 3.1 | (2)(17) | ||||||||||||||
First lien senior secured loan ($6.2 par due 5/2022) | 7.89% (Libor + 6.25%/Q) | 6/21/2017 | 6.2 | 6.2 | (4)(17) | ||||||||||||||
12.3 | 12.3 | ||||||||||||||||||
865.8 | 806.0 | 11.36 | % | ||||||||||||||||
Other Services | |||||||||||||||||||
F-19
As of December 31, 2017
(dollar amounts in millions)
Company(1) | Business Description | Investment | Interest(6)(12) | Acquisition Date | Amortized Cost | Fair Value | Percentage of Net Assets | ||||||||||||
American Residential Services L.L.C. | Heating, ventilation and air conditioning services provider | Second lien senior secured loan ($67.0 par due 12/2022) | 9.57% (Libor + 8.00%/Q) | 6/30/2014 | 66.7 | 66.3 | (2)(17) | ||||||||||||
Associated Asphalt Partners, LLC | Provider of asphalt terminalling, storage and distribution | First lien senior secured loan ($4.2 par due 4/2024) | 6.82% (Libor + 5.25%/Q) | 3/30/2017 | 4.2 | 3.8 | (2)(17) | ||||||||||||
Champion Parent Corporation and Calera XVI, LLC (8) | Endurance sports media and event operator | First lien senior secured revolving loan ($0.7 par due 11/2018) | — | 11/30/2012 | — | — | (2)(16) | ||||||||||||
First lien senior secured loan ($5.9 par due 11/2018) | — | 11/30/2012 | 0.9 | 0.2 | (2)(16) | ||||||||||||||
Preferred shares (18,875 shares) | 3/25/2016 | — | — | (2) | |||||||||||||||
Membership units (2,522,512 units) | 11/30/2012 | — | — | (2) | |||||||||||||||
Common shares (114,000 shares) | 3/25/2016 | — | — | (2) | |||||||||||||||
0.9 | 0.2 | ||||||||||||||||||
Crown Health Care Laundry Services, LLC and Crown Laundry Holdings, LLC (7)(21) | Provider of outsourced healthcare linen management solutions | First lien senior secured revolving loan ($2.0 par due 12/2021) | 7.82% (Libor + 6.25%/Q) | 3/13/2014 | 2.0 | 2.0 | (2)(17)(20) | ||||||||||||
First lien senior secured loan ($12.0 par due 12/2021) | 7.82% (Libor + 6.25%/Q) | 4/6/2017 | 12.0 | 12.0 | (2)(17) | ||||||||||||||
First lien senior secured loan ($5.0 par due 12/2021) | 7.82% (Libor + 6.25%/Q) | 3/13/2014 | 5.0 | 5.0 | (2)(17) | ||||||||||||||
First lien senior secured loan ($5.2 par due 12/2021) | 7.82% (Libor + 6.25%/Q) | 3/13/2014 | 5.2 | 5.2 | (3)(17) | ||||||||||||||
Class A preferred units (2,475,000 units) | 3/13/2014 | 2.5 | 3.9 | (2) | |||||||||||||||
Class B common units (275,000 units) | 3/13/2014 | 0.3 | 0.4 | (2) | |||||||||||||||
27.0 | 28.5 | ||||||||||||||||||
CST Buyer Company (d/b/a Intoxalock) (21) | Provider of ignition interlock devices | First lien senior secured loan ($11.3 par due 3/2023) | 7.75% (Libor + 6.25%/Q) | 3/1/2017 | 11.0 | 11.3 | (2)(17) | ||||||||||||
Dwyer Acquisition Parent, Inc. and TDG Group Holding Company | Operator of multiple franchise concepts primarily related to home maintenance or repairs | Senior subordinated loan ($52.7 par due 2/2020) | 11.00% | 8/15/2014 | 52.7 | 52.7 | (2) | ||||||||||||
Senior subordinated loan ($23.5 par due 2/2020) | 11.00% | 5/1/2017 | 23.5 | 23.5 | (2) | ||||||||||||||
Senior subordinated loan ($31.5 par due 2/2020) | 11.00% | 6/12/2015 | 31.5 | 31.5 | (2) | ||||||||||||||
Common stock (32,843 shares) | 8/15/2014 | 2.2 | 5.1 | (2) | |||||||||||||||
109.9 | 112.8 | ||||||||||||||||||
Massage Envy, LLC and ME Equity LLC (21) | Franchisor in the massage industry | First lien senior secured revolving loan ($0.5 par due 9/2020) | 8.44% (Libor + 6.75%/Q) | 6/28/2017 | 0.5 | 0.5 | (2)(17) | ||||||||||||
First lien senior secured loan ($0.3 par due 9/2020) | 8.23% (Libor + 6.75%/Q) | 4/12/2017 | 0.3 | 0.3 | (2)(17) | ||||||||||||||
First lien senior secured loan ($1.0 par due 9/2020) | 8.24% (Libor + 6.75%/Q) | 4/12/2017 | 1.0 | 1.0 | (2)(17) | ||||||||||||||
First lien senior secured loan ($0.1 par due 9/2020) | 10.00% (Base Rate + 5.50%/Q) | 4/12/2017 | 0.1 | 0.1 | (2)(17) | ||||||||||||||
First lien senior secured loan ($0.3 par due 9/2020) | 8.11% (Libor + 6.75%/Q) | 7/27/2017 | 0.3 | 0.3 | (2)(17) | ||||||||||||||
First lien senior secured loan ($0.5 par due 9/2020) | 8.23% (Libor + 6.75%/Q) | 7/27/2017 | 0.5 | 0.5 | (2)(17) | ||||||||||||||
First lien senior secured loan ($38.5 par due 9/2020) | 8.37% (Libor + 6.75%/Q) | 9/27/2012 | 38.5 | 38.5 | (3)(17) | ||||||||||||||
First lien senior secured loan ($18.7 par due 9/2020) | 8.37% (Libor + 6.75%/Q) | 9/27/2012 | 18.7 | 18.7 | (4)(17) | ||||||||||||||
Common stock (3,000,000 shares) | 9/27/2012 | 3.0 | 4.2 | (2) | |||||||||||||||
62.9 | 64.1 | ||||||||||||||||||
McKenzie Sports Products, LLC (21) | Designer, manufacturer and distributor of hunting-related supplies | First lien senior secured revolving loan ($0.9 par due 9/2020) | 7.25% (Base Rate + 2.75%/Q) | 9/18/2014 | 0.9 | 0.9 | (3)(17) | ||||||||||||
F-20
As of December 31, 2017
(dollar amounts in millions)
Company(1) | Business Description | Investment | Interest(6)(12) | Acquisition Date | Amortized Cost | Fair Value | Percentage of Net Assets | ||||||||||||
First lien senior secured loan ($0.8 par due 9/2020) | 7.44% (Libor + 5.75%/Q) | 9/18/2014 | 0.8 | 0.8 | (3)(13)(17) | ||||||||||||||
First lien senior secured loan ($2.5 par due 9/2020) | 5.32% (Libor + 3.75%/Q) | 9/18/2014 | 2.5 | 2.5 | (3)(17) | ||||||||||||||
First lien senior secured loan ($2.2 par due 9/2020) | 5.44% (Libor + 3.75%/Q) | 9/18/2014 | 2.2 | 2.2 | (3)(17) | ||||||||||||||
First lien senior secured loan ($84.5 par due 9/2020) | 7.44% (Libor + 5.75%/Q) | 9/18/2014 | 84.5 | 84.5 | (3)(13)(17) | ||||||||||||||
90.9 | 90.9 | ||||||||||||||||||
MSHC, Inc. (21) | Heating, ventilation and air conditioning services provider | First lien senior secured revolving loan ($0.1 par due 7/2022) | 7.75% (Base Rate + 3.25%/Q) | 7/31/2017 | 0.1 | 0.1 | (2)(17) | ||||||||||||
First lien senior secured loan ($1.1 par due 7/2023) | 5.92% (Libor + 4.25%/Q) | 7/31/2017 | 1.1 | 1.1 | (2)(17) | ||||||||||||||
First lien senior secured loan ($3.2 par due 7/2023) | 5.94% (Libor + 4.25%/Q) | 7/31/2017 | 3.1 | 3.2 | (2)(17) | ||||||||||||||
Second lien senior secured loan ($46.0 par due 7/2024) | 9.94% (Libor + 8.25%/Q) | 7/31/2017 | 46.0 | 46.0 | (2)(17) | ||||||||||||||
50.3 | 50.4 | ||||||||||||||||||
OpenSky Project, Inc. and OSP Holdings, Inc. | Social commerce platform operator | Warrant to purchase up to 159,496 shares of Series D preferred stock (expires 4/2025) | 6/29/2015 | — | — | (2) | |||||||||||||
Osmose Utilities Services, Inc. (21) | Provider of structural integrity management services to transmission and distribution infrastructure | First lien senior secured revolving loan | — | 1/3/2017 | — | — | (19) | ||||||||||||
Second lien senior secured loan ($25.0 par due 8/2023) | 9.44% (Libor + 7.75%/Q) | 9/3/2015 | 24.6 | 25.0 | (2)(17) | ||||||||||||||
Second lien senior secured loan ($34.0 par due 8/2023) | 9.44% (Libor + 7.75%/Q) | 1/3/2017 | 33.4 | 34.0 | (2)(17) | ||||||||||||||
58.0 | 59.0 | ||||||||||||||||||
SocialFlow, Inc. | Social media optimization platform provider | Warrant to purchase up to 215,331 shares of Series C preferred stock (expires 1/2026) | 1/13/2016 | — | — | (5) | |||||||||||||
SoundCloud Limited (9) | Platform for receiving, sending, and distributing music | Common stock (73,422 shares) | 8/15/2017 | 0.4 | 0.7 | (2) | |||||||||||||
Spin HoldCo Inc. | Laundry service and equipment provider | Second lien senior secured loan ($175.0 par due 5/2023) | 9.21% (Libor + 7.75%/Q) | 6/23/2017 | 175.0 | 175.0 | (2)(17) | ||||||||||||
Tyden Cayman Holdings Corp. (9) | Producer and marketer of global cargo security, product identification and traceability products and utility meter products | Preferred stock (46,276 shares) | 1/3/2017 | 0.4 | 0.4 | ||||||||||||||
Common stock (5,521,203 shares) | 1/3/2017 | 2.0 | 2.9 | ||||||||||||||||
2.4 | 3.3 | ||||||||||||||||||
VLS Recovery Services, LLC (21) | Provider of commercial and industrial waste processing and disposal services | First lien senior secured revolving loan ($1.6 par due 10/2023) | 7.53% (Libor + 6.00%/Q) | 10/17/2017 | 1.6 | 1.6 | (2)(17)(20) | ||||||||||||
First lien senior secured loan ($23.9 par due 10/2023) | 7.53% (Libor + 6.00%/Q) | 10/17/2017 | 23.9 | 23.7 | (2)(17) | ||||||||||||||
First lien senior secured loan ($7.4 par due 10/2023) | 7.35% (Libor + 6.00%/Q) | 10/17/2017 | 7.4 | 7.4 | (2)(17) | ||||||||||||||
First lien senior secured loan ($0.1 par due 10/2023) | 9.50% (Base Rate + 5.00%/Q) | 10/17/2017 | 0.1 | 0.1 | (2)(17) | ||||||||||||||
33.0 | 32.8 | ||||||||||||||||||
WASH Multifamily Acquisition Inc. and Coinamatic Canada Inc. | Laundry service and equipment provider | Second lien senior secured loan ($3.7 par due 5/2023) | 8.57% (Libor + 7.00%/Q) | 5/14/2015 | 3.7 | 3.7 | (2)(17) | ||||||||||||
Second lien senior secured loan ($21.3 par due 5/2023) | 8.57% (Libor + 7.00%/Q) | 5/14/2015 | 21.0 | 21.1 | (2)(17) | ||||||||||||||
24.7 | 24.8 | ||||||||||||||||||
Wrench Group LLC (21) | Provider of essential home services to residential customers | First lien senior secured loan ($4.0 par due 3/2022) | 6.19% (Libor + 4.50%/Q) | 1/31/2017 | 4.0 | 4.0 | (2)(17) | ||||||||||||
F-21
As of December 31, 2017
(dollar amounts in millions)
Company(1) | Business Description | Investment | Interest(6)(12) | Acquisition Date | Amortized Cost | Fair Value | Percentage of Net Assets | ||||||||||||
First lien senior secured loan ($4.3 par due 3/2022) | 5.85% (Libor + 4.50%/Q) | 12/15/2017 | 4.3 | 4.3 | (2)(17) | ||||||||||||||
8.3 | 8.3 | ||||||||||||||||||
725.6 | 732.2 | 10.32 | % | ||||||||||||||||
Manufacturing | |||||||||||||||||||
Chariot Acquisition, LLC (21) | Aftermarket golf cart parts and accessories | First lien senior secured loan ($18.4 par due 9/2021) | 7.91% (Libor + 6.25%/Q) | 1/3/2017 | 18.2 | 18.0 | (3)(17) | ||||||||||||
First lien senior secured loan ($9.4 par due 9/2021) | 7.91% (Libor + 6.25%/Q) | 1/3/2017 | 9.3 | 9.2 | (4)(17) | ||||||||||||||
27.5 | 27.2 | ||||||||||||||||||
Component Hardware Group, Inc. (21) | Commercial equipment | First lien senior secured revolving loan ($1.9 par due 7/2019) | 6.19% (Libor + 4.50%/Q) | 7/1/2013 | 1.9 | 1.9 | (2)(17) | ||||||||||||
First lien senior secured loan ($7.9 par due 7/2019) | 6.19% (Libor + 4.50%/Q) | 7/1/2013 | 7.9 | 7.9 | (4)(17) | ||||||||||||||
9.8 | 9.8 | ||||||||||||||||||
Dorner Holding Corp. (21) | Manufacturer of precision unit conveyors | First lien senior secured revolving loan ($1.3 par due 3/2022) | 7.32% (Libor + 5.75%/Q) | 3/15/2017 | 1.3 | 1.3 | (2)(17) | ||||||||||||
First lien senior secured loan ($4.4 par due 3/2023) | 7.32% (Libor + 5.75%/Q) | 3/15/2017 | 4.4 | 4.4 | (2)(17) | ||||||||||||||
5.7 | 5.7 | ||||||||||||||||||
ECI Purchaser Company, LLC | Manufacturer of equipment to safely control pressurized gases | First lien senior secured loan ($21.8 par due 12/2018) | 7.09% (Libor + 5.25%/Q) | 7/26/2017 | 21.8 | 21.5 | (2)(17) | ||||||||||||
First lien senior secured loan ($88.7 par due 12/2018) | 6.92% (Libor + 5.25%/Q) | 7/26/2017 | 88.7 | 87.8 | (2)(17) | ||||||||||||||
First lien senior secured loan ($74.8 par due 12/2018) | 6.92% (Libor + 5.25%/Q) | 7/26/2017 | 74.8 | 74.0 | (3)(17) | ||||||||||||||
First lien senior secured loan ($0.3 par due 12/2018) | 7.09% (Libor + 5.25%/Q) | 7/26/2017 | 0.3 | 0.3 | (2)(17) | ||||||||||||||
First lien senior secured loan ($0.2 par due 12/2018) | 7.09% (Libor + 5.25%/Q) | 7/26/2017 | 0.2 | 0.2 | (3)(17) | ||||||||||||||
185.8 | 183.8 | ||||||||||||||||||
ETG Holdings, Inc. (8) | Industrial woven products | Common stock (3,000 shares) | 1/3/2017 | — | — | ||||||||||||||
Harvey Tool Company, LLC (21) | Cutting tool provider to the metalworking industry | First lien senior secured revolving loan ($1.8 par due 10/2023) | 5.96% (Libor + 4.50%/Q) | 10/12/2017 | 1.8 | 1.7 | (2)(17) | ||||||||||||
First lien senior secured loan ($40.8 par due 10/2024) | 6.11% (Libor + 4.75%/Q) | 10/12/2017 | 40.8 | 40.4 | (2)(17) | ||||||||||||||
Second lien senior secured loan ($43.7 par due 10/2025) | 10.02% (Libor + 8.50%/Q) | 10/12/2017 | 43.7 | 43.2 | (2)(17) | ||||||||||||||
86.3 | 85.3 | ||||||||||||||||||
Ioxus, Inc (7) | Energy storage devices | First lien senior secured loan ($10.2 par due 12/2019) | 12.00% PIK | 4/29/2014 | 10.0 | 10.2 | (2)(15) | ||||||||||||
First lien senior secured loan ($1.0 par due 12/2019) | — | 4/29/2014 | 1.0 | 1.0 | (2)(15) | ||||||||||||||
Series CC preferred stock (67,330,609 shares) | 1/27/2017 | 0.7 | — | (2) | |||||||||||||||
Warrant to purchase up to 3,038,730 shares of common stock (expires 1/2026) | 1/28/2016 | — | — | (2) | |||||||||||||||
Warrant to purchase up to 1,210,235 shares of Series BB preferred stock (expires 8/2026) | 1/28/2016 | — | — | (2) | |||||||||||||||
Warrant to purchase up to 336,653,045 shares of Series CC preferred stock (expires 1/2027) | 1/27/2017 | — | — | (2) | |||||||||||||||
11.7 | 11.2 | ||||||||||||||||||
KPS Global LLC | Walk-in cooler and freezer systems | First lien senior secured loan ($1.7 par due 4/2022) | 3.93% (Libor + 2.50%/Q) | 4/5/2017 | 1.7 | 1.7 | (2)(17) | ||||||||||||
First lien senior secured loan ($11.2 par due 4/2022) | 7.18% (Libor + 5.75%/Q) | 4/5/2017 | 11.2 | 11.0 | (2)(17) | ||||||||||||||
F-22
As of December 31, 2017
(dollar amounts in millions)
Company(1) | Business Description | Investment | Interest(6)(12) | Acquisition Date | Amortized Cost | Fair Value | Percentage of Net Assets | ||||||||||||
First lien senior secured loan ($5.6 par due 4/2022) | 7.18% (Libor + 5.75%/Q) | 4/5/2017 | 5.6 | 5.5 | (4)(17) | ||||||||||||||
18.5 | 18.2 | ||||||||||||||||||
MacLean-Fogg Company and MacLean-Fogg Holdings, L.L.C. | Manufacturer and supplier for the power utility and automotive markets worldwide | Senior subordinated loan ($103.0 par due 10/2025) | 10.50% Cash, 3.00% PIK | 10/31/2013 | 103.0 | 103.0 | (2) | ||||||||||||
Preferred units (70,183 units) | 4.50% Cash, 9.25% PIK | 10/9/2015 | 76.3 | 76.3 | |||||||||||||||
179.3 | 179.3 | ||||||||||||||||||
Niagara Fiber Intermediate Corp. (21) | Insoluble fiber filler products | First lien senior secured revolving loan ($0.9 par due 5/2018) | — | 5/8/2014 | — | — | (2)(16) | ||||||||||||
First lien senior secured loan ($5.9 par due 5/2018) | — | 5/8/2014 | 0.2 | — | (2)(16) | ||||||||||||||
First lien senior secured loan ($0.6 par due 5/2018) | — | 5/8/2014 | — | — | (2)(16) | ||||||||||||||
0.2 | — | ||||||||||||||||||
Nordco Inc. (21) | Railroad maintenance-of-way machinery | First lien senior secured revolving loan | — | 8/26/2015 | — | — | (19) | ||||||||||||
Pelican Products, Inc. | Flashlights | Second lien senior secured loan ($40.0 par due 4/2021) | 9.94% (Libor + 8.25%/Q) | 4/11/2014 | 40.0 | 39.6 | (2)(17) | ||||||||||||
Sanders Industries Holdings, Inc. and SI Holdings, Inc. (21) | Elastomeric parts, mid-sized composite structures, and composite tooling | First lien senior secured loan ($56.5 par due 5/2020) | 7.38% (Libor + 6.00%/Q) | 7/21/2017 | 56.5 | 55.4 | (2)(17) | ||||||||||||
First lien senior secured loan ($14.8 par due 5/2020) | 7.38% (Libor + 6.00%/Q) | 7/21/2017 | 14.8 | 14.5 | (4)(17) | ||||||||||||||
Common stock (1,500 shares) | 5/30/2014 | 1.5 | 0.8 | (2) | |||||||||||||||
72.8 | 70.7 | ||||||||||||||||||
Saw Mill PCG Partners LLC | Metal precision engineered components | Common units (1,000 units) | 1/30/2007 | 1.0 | — | (2) | |||||||||||||
Sonny's Enterprises, LLC (21) | Manufacturer and supplier of car wash equipment, parts and supplies to the conveyorized car wash market | First lien senior secured revolving loan ($1.0 par due 12/2022) | 6.30% (Libor + 4.75%/Q) | 11/30/2017 | 1.0 | 1.0 | (2)(17) | ||||||||||||
First lien senior secured loan ($0.9 par due 12/2022) | 6.44% (Libor + 4.75%/Q) | 12/5/2017 | 0.9 | 0.9 | (2)(17) | ||||||||||||||
First lien senior secured loan ($0.4 par due 12/2022) | 6.44% (Libor + 4.75%/Q) | 6/1/2017 | 0.4 | 0.4 | (2)(17) | ||||||||||||||
First lien senior secured loan ($0.2 par due 12/2022) | 6.44% (Libor + 4.75%/Q) | 5/3/2017 | 0.2 | 0.2 | (2)(17) | ||||||||||||||
First lien senior secured loan ($0.2 par due 12/2022) | 6.44% (Libor + 4.75%/Q) | 9/28/2017 | 0.2 | 0.2 | (2)(17) | ||||||||||||||
2.7 | 2.7 | ||||||||||||||||||
Sunk Rock Foundry Partners LP, Hatteras Electrical Manufacturing Holding Company and Sigma Electric Manufacturing Corporation (21) | Manufacturer of metal castings, precision machined components and sub-assemblies in the electrical products, power transmission and distribution and general industrial markets | First lien senior secured revolving loan ($1.5 par due 10/2022) | 6.16% (Libor + 4.75%/Q) | 10/31/2017 | 1.5 | 1.5 | (2)(17) | ||||||||||||
First lien senior secured loan ($16.4 par due 10/2023) | 6.13% (Libor + 4.75%/Q) | 10/31/2017 | 16.4 | 16.2 | (2)(17) | ||||||||||||||
First lien senior secured loan ($9.3 par due 10/2023) | 6.13% (Libor + 4.75%/Q) | 10/31/2017 | 9.3 | 9.2 | (2)(17) | ||||||||||||||
27.2 | 26.9 | ||||||||||||||||||
TPTM Merger Corp. (21) | Time temperature indicator products | First lien senior secured loan ($10.5 par due 9/2018) | 9.98% (Libor + 8.42%/Q) | 9/12/2013 | 10.5 | 10.5 | (3)(17) | ||||||||||||
First lien senior secured loan ($6.2 par due 9/2018) | 9.98% (Libor + 8.42%/Q) | 9/12/2013 | 6.2 | 6.2 | (4)(17) | ||||||||||||||
First lien senior secured loan ($6.5 par due 9/2018) | 10.11% (Libor + 8.42%/Q) | 9/12/2013 | 6.5 | 6.5 | (3)(17) | ||||||||||||||
First lien senior secured loan ($3.8 par due 9/2018) | 10.11% (Libor + 8.42%/Q) | 9/12/2013 | 3.8 | 3.8 | (4)(17) | ||||||||||||||
27.0 | 27.0 | ||||||||||||||||||
F-23
As of December 31, 2017
(dollar amounts in millions)
Company(1) | Business Description | Investment | Interest(6)(12) | Acquisition Date | Amortized Cost | Fair Value | Percentage of Net Assets | ||||||||||||
WP CPP Holdings, LLC | Precision engineered castings | Second lien senior secured loan ($19.7 par due 4/2021) | 9.13% (Libor + 7.75%/Q) | 1/3/2017 | 18.8 | 19.3 | (2)(17) | ||||||||||||
714.3 | 706.7 | 9.96 | % | ||||||||||||||||
Investment Funds and Vehicles | |||||||||||||||||||
ACAS Equity Holdings Corporation (8)(10) | Investment company | Common stock (589 shares) | 1/3/2017 | 0.5 | 0.4 | ||||||||||||||
Ares IIIR/IVR CLO Ltd. (8)(9)(10) | Investment vehicle | Subordinated notes ($20.0 par due 4/2021) | 1/3/2017 | — | 0.1 | ||||||||||||||
Blue Wolf Capital Fund II, L.P. (9)(10) | Investment partnership | Limited partnership interest (8.50% interest) | 1/3/2017 | 3.0 | 3.5 | (24) | |||||||||||||
Carlyle Global Market Strategies CLO 2013-3 (9)(10) | Investment vehicle | Subordinated notes ($5.0 par due 10/2030) | 15.00% | 1/3/2017 | 2.6 | 3.2 | |||||||||||||
Cent CLO 2014-22 Limited (9)(10) | Investment vehicle | Subordinated notes ($45.4 par due 11/2026) | 11.75% | 1/3/2017 | 23.6 | 22.7 | |||||||||||||
Centurion CDO 8 Limited (9)(10) | Investment vehicle | Subordinated notes ($5.0 par due 3/2019) | 1/3/2017 | — | — | ||||||||||||||
CGMS 2015-3A (9)(10) | Investment vehicle | Subordinated notes ($24.6 par due 7/2028) | 10.00% | 1/3/2017 | 19.2 | 18.9 | |||||||||||||
CoLTs 2005-1 Ltd. (8)(9)(10) | Investment vehicle | Preferred shares (360 shares) | 1/3/2017 | — | — | ||||||||||||||
CoLTs 2005-2 Ltd. (8)(9)(10) | Investment vehicle | Preferred shares (34,170,000 shares) | 1/3/2017 | — | — | ||||||||||||||
CREST Exeter Street Solar 2004-1 (9)(10) | Investment vehicle | Preferred shares (3,500,000 shares) | 1/3/2017 | — | — | ||||||||||||||
Eaton Vance CDO X plc (9)(10) | Investment vehicle | Subordinated notes ($15.0 par due 2/2027) | 3.00% | 1/3/2017 | 4.1 | 6.4 | |||||||||||||
European Capital UK SME Debt LP (8)(9)(10)(22) | Investment partnership | Limited partnership interest (45% interest) | 1/3/2017 | 41.1 | 41.7 | ||||||||||||||
Flagship CLO V (9)(10) | Investment vehicle | Subordinated notes ($0.0 par due 9/2019) | 1/3/2017 | — | — | ||||||||||||||
Goldentree Loan Opportunities VII, Limited (9)(10) | Investment vehicle | Subordinated notes ($35.3 par due 4/2025) | 4.25% | 1/3/2017 | 18.7 | 19.1 | |||||||||||||
Halcyon Loan Advisors Funding 2015-2 Ltd. (9)(10) | Investment vehicle | Subordinated notes ($21.7 par due 7/2027) | 16.35% | 1/3/2017 | 14.0 | 11.3 | |||||||||||||
HCI Equity, LLC (8)(9)(10) | Investment company | Member interest (100.00% interest) | 4/1/2010 | — | 0.1 | (24) | |||||||||||||
Herbert Park B.V. (9)(10) | Investment vehicle | Subordinated notes ($5.4 par due 10/2026) | 1/3/2017 | 0.9 | 0.5 | ||||||||||||||
Imperial Capital Private Opportunities, LP (10) | Investment partnership | Limited partnership interest (80.00% interest) | 5/10/2007 | 1.0 | 15.1 | (2) | |||||||||||||
LightPoint CLO VII, Ltd. (9)(10) | Investment vehicle | Subordinated notes ($9.0 par due 5/2021) | 1/3/2017 | — | — | ||||||||||||||
Montgomery Lane, LLC and Montgomery Lane, Ltd. (8)(9)(10) | Investment company | Common stock (100 shares) | 1/3/2017 | — | 0.6 | ||||||||||||||
Common stock (50,000 shares) | 1/3/2017 | — | — | ||||||||||||||||
— | 0.6 | ||||||||||||||||||
OAKC 2015-11 (9)(10) | Investment vehicle | Subordinated notes ($17.8 par due 10/2028) | 9.50% | 1/3/2017 | 14.3 | 13.0 | |||||||||||||
Partnership Capital Growth Fund I, L.P. (10) | Investment partnership | Limited partnership interest (25.00% interest) | 6/16/2006 | — | 0.1 | (2)(24) | |||||||||||||
Partnership Capital Growth Investors III, L.P. (10)(22) | Investment partnership | Limited partnership interest (2.50% interest) | 10/5/2011 | 2.5 | 3.5 | (2)(24) | |||||||||||||
PCG-Ares Sidecar Investment II, L.P. (10)(22) | Investment partnership | Limited partnership interest (100.00% interest) | 10/31/2014 | 7.5 | 11.7 | (2) | |||||||||||||
PCG-Ares Sidecar Investment, L.P. (10)(22) | Investment partnership | Limited partnership interest (100.00% interest) | 5/22/2014 | 4.4 | 5.1 | (2) | |||||||||||||
Piper Jaffray Merchant Banking Fund I, L.P. (10)(22) | Investment partnership | Limited partnership interest (2.00% interest) | 8/16/2012 | 1.5 | 1.6 | (24) | |||||||||||||
Qualium Investissement (9)(10) | Investment partnership | Class A common stock (9,900,000 shares) | 1/3/2017 | 5.9 | 6.5 | (24) | |||||||||||||
Class B common stock (100,000 shares) | 1/3/2017 | 0.1 | 0.1 | (24) | |||||||||||||||
Class C common stock (48,939 shares) | 1/3/2017 | 0.1 | 0.1 | (24) | |||||||||||||||
6.1 | 6.7 | ||||||||||||||||||
Senior Direct Lending Program, LLC (8)(10)(23) | Co-investment vehicle | Subordinated certificates ($487.1 par due 12/2036) | 9.34% (Libor + 8.00%/Q)(18) | 7/27/2016 | 487.1 | 487.1 | |||||||||||||
F-24
As of December 31, 2017
(dollar amounts in millions)
Company(1) | Business Description | Investment | Interest(6)(12) | Acquisition Date | Amortized Cost | Fair Value | Percentage of Net Assets | ||||||||||||
Member interest (87.50% interest) | 7/27/2016 | — | — | ||||||||||||||||
487.1 | 487.1 | ||||||||||||||||||
Vitesse CLO, Ltd. (9)(10) | Investment vehicle | Preferred shares (20,000,000 shares) | 1/3/2017 | — | — | ||||||||||||||
Voya CLO 2014-4 Ltd. (9)(10) | Investment vehicle | Subordinated notes ($26.7 par due 10/2026) | 10.50% | 1/3/2017 | 17.0 | 18.6 | |||||||||||||
VSC Investors LLC (10) | Investment company | Membership interest (1.95% interest) | 1/24/2008 | 0.3 | 1.3 | (2)(24) | |||||||||||||
669.4 | 692.3 | 9.75 | % | ||||||||||||||||
Financial Services | |||||||||||||||||||
Callidus Capital Corporation (8) | Asset management services | Common stock (100 shares) | 4/1/2010 | 3.0 | 1.7 | ||||||||||||||
Ciena Capital LLC (8)(21) | Real estate and small business loan servicer | First lien senior secured revolving loan ($14.0 par due 12/2017) | 6.00% | 11/29/2010 | 14.0 | 14.0 | (2) | ||||||||||||
Equity interests | 11/29/2010 | 25.0 | 18.3 | (2) | |||||||||||||||
39.0 | 32.3 | ||||||||||||||||||
Commercial Credit Group, Inc. | Commercial equipment finance and leasing company | Senior subordinated loan ($28.0 par due 8/2022) | 11.11% (Libor + 9.75%/Q) | 5/10/2012 | 28.0 | 28.0 | (2)(17) | ||||||||||||
DFC Global Facility Borrower II LLC (21) | Non-bank provider of alternative financial services | First lien senior secured revolving loan ($75.0 par due 9/2022) | 12.11% (Libor + 10.75%/Q) | 9/27/2017 | 75.0 | 75.0 | (2)(17) | ||||||||||||
Financial Asset Management Systems, Inc. and FAMS Holdings, Inc. (7) | Debt collection services provider | Common stock (180 shares) | 1/11/2017 | — | — | (2) | |||||||||||||
Gordian Group, LLC | Provider of products, services and software to organizations pursuing efficient and effective procurement and information solutions | Common stock (526 shares) | 11/30/2012 | — | — | (2) | |||||||||||||
Imperial Capital Group LLC | Investment services | Class A common units (24,945 units) | 5/10/2007 | 6.1 | 10.2 | (2) | |||||||||||||
2006 Class B common units (8,173 units) | 5/10/2007 | — | — | (2) | |||||||||||||||
6.1 | 10.2 | ||||||||||||||||||
Ivy Hill Asset Management, L.P. (8)(10) | Asset management services | Member interest (100.00% interest) | 6/15/2009 | 244.0 | 315.1 | ||||||||||||||
Javlin Three LLC, Javlin Four LLC, and Javlin Five LLC (10) | Asset-backed financial services company | First lien senior secured loan ($18.6 par due 6/2017) | 11.36% (Libor + 10.00%/Q) | 6/24/2014 | 18.6 | 16.8 | (2)(17) | ||||||||||||
LS DE LLC and LM LSQ Investors LLC (10) | Asset based lender | Senior subordinated loan ($3.0 par due 6/2021) | 10.50% | 6/15/2017 | 3.0 | 3.0 | (2) | ||||||||||||
Senior subordinated loan ($27.0 par due 6/2021) | 10.50% | 6/25/2015 | 27.0 | 27.0 | (2) | ||||||||||||||
Membership units (3,275,000 units) | 6/25/2015 | 3.3 | 3.9 | ||||||||||||||||
33.3 | 33.9 | ||||||||||||||||||
447.0 | 513.0 | 7.23 | % | ||||||||||||||||
Food and Beverage | |||||||||||||||||||
American Seafoods Group LLC and American Seafoods Partners LLC | Harvester and processor of seafood | Second lien senior secured loan ($87.0 par due 2/2024) | 9.57% (Libor + 8.13%/Q) | 8/21/2017 | 86.8 | 87.0 | (2)(17) | ||||||||||||
Class A units (77,922 units) | 8/19/2015 | 0.1 | 0.1 | (2) | |||||||||||||||
Warrant to purchase up to 7,422,078 Class A units (expires 8/2035) | 8/19/2015 | 7.4 | 10.1 | (2) | |||||||||||||||
94.3 | 97.2 | ||||||||||||||||||
Bakemark Holdings, Inc. | Manufacturer and distributor of specialty bakery ingredients | First lien senior secured loan ($1.7 par due 8/2023) | 6.94% (Libor + 5.25%/Q) | 8/14/2017 | 1.7 | 1.7 | (2)(17) | ||||||||||||
DecoPac, Inc. (21) | Supplier of cake decorating solutions and products to in-store bakeries | First lien senior secured revolving loan ($2.3 par due 9/2023) | 5.94% (Libor + 4.25%/Q) | 9/29/2017 | 2.3 | 2.2 | (2)(17) | ||||||||||||
F-25
As of December 31, 2017
(dollar amounts in millions)
Company(1) | Business Description | Investment | Interest(6)(12) | Acquisition Date | Amortized Cost | Fair Value | Percentage of Net Assets | ||||||||||||
First lien senior secured revolving loan ($0.3 par due 9/2023) | 5.89% (Libor + 4.25%/Q) | 9/29/2017 | 0.3 | 0.3 | (2)(17) | ||||||||||||||
First lien senior secured loan ($8.4 par due 9/2024) | 5.94% (Libor + 4.25%/Q) | 9/29/2017 | 8.4 | 8.3 | (2)(17) | ||||||||||||||
11.0 | 10.8 | ||||||||||||||||||
Eagle Family Foods Group LLC | Manufacturer and producer of milk products | First lien senior secured loan ($0.2 par due 12/2021) | 5.69% (Libor + 4.00%/Q) | 8/29/2017 | 0.2 | 0.2 | (2)(17) | ||||||||||||
First lien senior secured loan ($7.9 par due 12/2021) | 10.74% (Libor + 9.05%/Q) | 9/11/2017 | 7.8 | 7.5 | (2)(17) | ||||||||||||||
First lien senior secured loan ($1.4 par due 12/2021) | 10.74% (Libor + 9.05%/Q) | 8/22/2016 | 1.4 | 1.3 | (2)(17) | ||||||||||||||
First lien senior secured loan ($20.2 par due 12/2021) | 10.74% (Libor + 9.05%/Q) | 8/22/2016 | 20.2 | 19.2 | (3)(17) | ||||||||||||||
First lien senior secured loan ($54.8 par due 12/2021) | 10.74% (Libor + 9.05%/Q) | 12/31/2015 | 54.5 | 52.0 | (3)(17) | ||||||||||||||
84.1 | 80.2 | ||||||||||||||||||
Edward Don & Company, LLC and VCP-EDC Co-Invest, LLC | Distributor of foodservice equipment and supplies | First lien senior secured loan ($47.6 par due 9/2022) | 10.00% (Libor + 8.50%/Q) | 3/31/2017 | 47.6 | 47.6 | (2)(17) | ||||||||||||
Membership units (2,970,000 units) | 6/9/2017 | 3.0 | 3.4 | ||||||||||||||||
50.6 | 51.0 | ||||||||||||||||||
FPI Holding Corporation (8)(21) | Distributor of fruits | First lien senior secured loan ($0.7 par due 6/2018) | — | 1/3/2017 | 0.4 | 0.4 | (16) | ||||||||||||
Gehl Foods, LLC and GF Parent LLC | Producer of low-acid, aseptic food and beverage products | First lien senior secured loan ($120.7 par due 6/2019) | 7.88% (Libor + 6.50%/Q) | 7/26/2017 | 120.7 | 120.7 | (2)(17) | ||||||||||||
Class A preferred units (2,940 units) | 5/13/2015 | 2.9 | 1.9 | (2) | |||||||||||||||
Class A common units (60,000 units) | 5/13/2015 | 0.1 | — | (2) | |||||||||||||||
Class B common units (0.26 units) | 5/13/2015 | — | — | (2) | |||||||||||||||
123.7 | 122.6 | ||||||||||||||||||
JWC/KI Holdings, LLC | Foodservice sales and marketing agency | Membership units (5,000 units) | 11/16/2015 | 5.0 | 5.3 | (2) | |||||||||||||
Kettle Cuisine, LLC | Manufacturer of fresh refrigerated and frozen food products | Second lien senior secured loan ($28.5 par due 2/2022) | 11.21% (Libor + 9.75%/Q) | 8/21/2015 | 28.5 | 28.5 | (2)(17) | ||||||||||||
NECCO Holdings, Inc. and New England Confectionery Company, Inc. (8)(21) | Producer and supplier of candy | First lien senior secured revolving loan ($21.7 par due 1/2018) | — | 1/3/2017 | 9.7 | 9.2 | (16) | ||||||||||||
First lien senior secured loan ($0.6 par due 8/2018) | — | 11/20/2017 | 0.6 | — | (16) | ||||||||||||||
First lien senior secured loan ($10.9 par due 1/2018) | — | 1/3/2017 | 0.9 | 1.3 | (16) | ||||||||||||||
First lien senior secured loan ($0.7 par due 1/2018) | — | 11/20/2017 | 0.7 | 0.1 | (16) | ||||||||||||||
Common stock (860,189 shares) | 1/3/2017 | — | — | ||||||||||||||||
11.9 | 10.6 | ||||||||||||||||||
RF HP SCF Investor, LLC (10) | Branded specialty food company | Membership interest (10.08% interest) | 12/22/2016 | 12.5 | 14.4 | (2) | |||||||||||||
Teasdale Foods, Inc. (21) | Provider of beans, sauces and hominy to the retail, foodservice and wholesale channels | First lien senior secured revolving loan ($0.2 par due 10/2020) | 6.18% (Libor + 4.75%/Q) | 6/30/2017 | 0.2 | 0.2 | (2)(17) | ||||||||||||
First lien senior secured revolving loan ($0.2 par due 10/2020) | 8.25% (Base Rate + 3.75%/Q) | 6/30/2017 | 0.2 | 0.2 | (2)(17) | ||||||||||||||
Second lien senior secured loan ($33.6 par due 10/2021) | 10.44% (Libor + 8.75%/Q) | 1/3/2017 | 33.6 | 33.3 | (2)(17) | ||||||||||||||
Second lien senior secured loan ($21.3 par due 10/2021) | 10.11% (Libor + 8.75%/Q) | 1/3/2017 | 21.3 | 21.1 | (2)(17) | ||||||||||||||
Second lien senior secured loan ($31.5 par due 10/2021) | 10.13% (Libor + 8.75%/Q) | 1/3/2017 | 31.5 | 31.2 | (2)(17) | ||||||||||||||
86.8 | 86.0 | ||||||||||||||||||
F-26
As of December 31, 2017
(dollar amounts in millions)
Company(1) | Business Description | Investment | Interest(6)(12) | Acquisition Date | Amortized Cost | Fair Value | Percentage of Net Assets | ||||||||||||
510.5 | 508.7 | 7.17 | % | ||||||||||||||||
Power Generation | |||||||||||||||||||
Alphabet Energy, Inc. | Technology developer to convert waste-heat into electricity | First lien senior secured loan ($3.4 par due 8/2017) | 12/16/2013 | 3.3 | 0.4 | (2)(16) | |||||||||||||
Series 1B preferred stock (12,976 shares) | 6/21/2016 | 0.2 | — | (2) | |||||||||||||||
Warrant to purchase up to 125,000 shares of Series 2 preferred stock (expires 12/2023) | 6/30/2016 | 0.1 | — | (2) | |||||||||||||||
3.6 | 0.4 | ||||||||||||||||||
CPV Maryland Holding Company II, LLC | Gas turbine power generation facilities operator | Senior subordinated loan ($46.1 par due 12/2020) | 5.00% Cash, 5.00% PIK | 8/8/2014 | 46.1 | 42.4 | (2) | ||||||||||||
Warrant to purchase up to 4 units of common stock (expires 8/2018) | 8/8/2014 | — | — | (2) | |||||||||||||||
46.1 | 42.4 | ||||||||||||||||||
DESRI VI Management Holdings, LLC | Wind power generation facility operator | Senior subordinated loan ($13.9 par due 12/2021) | 10.00% | 12/24/2014 | 13.9 | 13.9 | (2) | ||||||||||||
Green Energy Partners, Stonewall LLC and Panda Stonewall Intermediate Holdings II LLC | Gas turbine power generation facilities operator | First lien senior secured loan ($24.9 par due 11/2021) | 7.19% (Libor + 5.50%/Q) | 11/13/2014 | 24.8 | 24.4 | (2)(17) | ||||||||||||
Senior subordinated loan ($20.2 par due 12/2021) | 8.00% Cash, 5.25% PIK | 11/13/2014 | 20.2 | 19.5 | (2) | ||||||||||||||
Senior subordinated loan ($94.6 par due 12/2021) | 8.00% Cash, 5.25% PIK | 11/13/2014 | 94.6 | 91.3 | (2) | ||||||||||||||
139.6 | 135.2 | ||||||||||||||||||
Joule Unlimited Technologies, Inc. and Stichting Joule Global Foundation | Renewable fuel and chemical production developer | First lien senior secured loan ($8.3 par due 10/2018) | — | 3/31/2015 | 7.9 | 0.4 | (2)(16) | ||||||||||||
Warrant to purchase up to 32,051 shares of Series C-2 preferred stock (expires 7/2023) | 7/25/2013 | — | — | (2)(9) | |||||||||||||||
7.9 | 0.4 | ||||||||||||||||||
Moxie Patriot LLC | Gas turbine power generation facilities operator | First lien senior secured loan ($33.9 par due 12/2020) | 7.44% (Libor + 5.75%/Q) | 12/19/2013 | 33.8 | 33.4 | (2)(17) | ||||||||||||
Navisun LLC and Navisun Holdings LLC (8)(21) | Owner and operater of commercial and industrial solar projects | First lien senior secured loan ($2.6 par due 11/2023) | 8.00% PIK | 11/15/2017 | 2.6 | 2.6 | (2) | ||||||||||||
Series A Preferred units (1,000 units) | 10.50% PIK | 11/15/2017 | 0.3 | 0.3 | (2) | ||||||||||||||
Class A units (550 units) | 11/15/2017 | — | — | (2) | |||||||||||||||
2.9 | 2.9 | ||||||||||||||||||
Panda Liberty LLC (fka Moxie Liberty LLC) | Gas turbine power generation facilities operator | First lien senior secured loan ($5.0 par due 8/2020) | 8.19% (Libor + 6.50%/Q) | 5/8/2017 | 4.6 | 4.6 | (2)(17) | ||||||||||||
First lien senior secured loan ($34.4 par due 8/2020) | 8.19% (Libor + 6.50%/Q) | 8/21/2013 | 34.2 | 31.6 | (2)(17) | ||||||||||||||
38.8 | 36.2 | ||||||||||||||||||
Panda Temple Power II, LLC | Gas turbine power generation facilities operator | First lien senior secured loan ($19.6 par due 4/2019) | 7.69% (Libor + 6.00%/Q) | 4/3/2013 | 19.6 | 17.4 | (2)(17) | ||||||||||||
Panda Temple Power, LLC | Gas turbine power generation facilities operator | First lien senior secured revolving loan ($2.3 par due 4/2018) | 10.35% (Libor + 9.00%/Q) | 4/28/2017 | 2.3 | 2.3 | (2)(17) | ||||||||||||
First lien senior secured loan ($24.8 par due 3/2022) | — | 3/6/2015 | 23.6 | 18.4 | (2)(16) | ||||||||||||||
25.9 | 20.7 | ||||||||||||||||||
PERC Holdings 1 LLC | Operator of recycled energy, combined heat and power, and energy efficiency facilities | Class B common units (21,653,543 units) | 10/20/2014 | 21.7 | 24.0 | (2) | |||||||||||||
Riverview Power LLC | Operator of natural gas and oil fired power generation facilities | First lien senior secured loan ($98.1 par due 12/2022) | 9.69% (Libor + 8.00%/Q) | 12/29/2016 | 95.9 | 98.2 | (2)(17) | ||||||||||||
449.7 | 425.1 | 5.99 | % | ||||||||||||||||
F-27
As of December 31, 2017
(dollar amounts in millions)
Company(1) | Business Description | Investment | Interest(6)(12) | Acquisition Date | Amortized Cost | Fair Value | Percentage of Net Assets | ||||||||||||
Restaurants and Food Services | |||||||||||||||||||
ADF Capital, Inc., ADF Restaurant Group, LLC, and ARG Restaurant Holdings, Inc. (8)(21) | Restaurant owner and operator | First lien senior secured loan ($3.7 par due 12/2018) | 19.67% PIK (Libor + 18.00%/Q) | 12/22/2016 | 3.7 | 3.7 | (2)(17) | ||||||||||||
First lien senior secured loan ($49.3 par due 12/2018) | — | 11/27/2006 | 39.9 | 12.3 | (2)(16) | ||||||||||||||
Promissory note ($29.2 par due 12/2023) | 11/27/2006 | 13.8 | — | (2) | |||||||||||||||
Warrant to purchase up to 0.95 units of Series D common stock (expires 12/2023) | 12/18/2013 | — | — | (2) | |||||||||||||||
57.4 | 16.0 | ||||||||||||||||||
Benihana, Inc. (21) | Restaurant owner and operator | First lien senior secured revolving loan ($0.5 par due 7/2018) | 8.57% (Libor + 7.00%/Q) | 8/21/2012 | 0.5 | 0.5 | (2)(17)(20) | ||||||||||||
First lien senior secured revolving loan ($1.1 par due 7/2018) | 8.69% (Libor + 7.00%/Q) | 8/21/2012 | 1.1 | 1.1 | (2)(17)(20) | ||||||||||||||
First lien senior secured revolving loan ($1.0 par due 7/2018) | 10.25% (Base Rate + 5.75%/Q) | 8/21/2012 | 1.0 | 0.9 | (2)(17)(20) | ||||||||||||||
First lien senior secured loan ($0.3 par due 1/2019) | 8.59% (Libor + 7.00%/Q) | 12/28/2016 | 0.3 | 0.3 | (2)(17) | ||||||||||||||
First lien senior secured loan ($4.7 par due 1/2019) | 8.59% (Libor + 7.00%/Q) | 8/21/2012 | 4.7 | 4.5 | (4)(17) | ||||||||||||||
7.6 | 7.3 | ||||||||||||||||||
Cozzini Bros., Inc. and BH-Sharp Holdings LP (21) | Provider of commercial knife sharpening and cutlery services in the restaurant industry | First lien senior secured loan ($1.9 par due 3/2023) | 7.07% (Libor + 5.50%/Q) | 3/10/2017 | 1.9 | 1.9 | (2)(17) | ||||||||||||
First lien senior secured loan ($1.2 par due 3/2023) | 6.92% (Libor + 5.50%/Q) | 3/10/2017 | 1.2 | 1.2 | (2)(17) | ||||||||||||||
First lien senior secured loan ($19.3 par due 3/2023) | 6.92% (Libor + 5.50%/Q) | 3/10/2017 | 19.3 | 19.3 | (4)(17) | ||||||||||||||
Common units (2,950,000 units) | 3/10/2017 | 3.0 | 2.8 | (2) | |||||||||||||||
25.4 | 25.2 | ||||||||||||||||||
FWR Holding Corporation (21) | Restaurant owner, operator, and franchisor | First lien senior secured revolving loan ($0.3 par due 8/2023) | 7.57% (Libor + 6.00%/Q) | 8/21/2017 | 0.3 | 0.3 | (2)(17) | ||||||||||||
First lien senior secured loan ($0.2 par due 8/2023) | 7.60% (Libor + 6.00%/Q) | 8/21/2017 | 0.2 | 0.2 | (2)(17) | ||||||||||||||
First lien senior secured loan ($2.0 par due 8/2023) | 7.32% (Libor + 6.00%/Q) | 8/21/2017 | 2.0 | 2.0 | (2)(17) | ||||||||||||||
First lien senior secured loan ($2.0 par due 8/2023) | 7.48% (Libor + 6.00%/Q) | 8/21/2017 | 2.0 | 2.0 | (2)(17) | ||||||||||||||
4.5 | 4.5 | ||||||||||||||||||
Garden Fresh Restaurant Corp. and GFRC Holdings LLC (8)(21) | Restaurant owner and operator | First lien senior secured revolving loan ($0.1 par due 2/2022) | 9.50% (Libor + 8.00%/Q) | 2/1/2017 | 0.1 | 0.1 | (2)(17)(20) | ||||||||||||
First lien senior secured loan ($24.9 par due 2/2022) | 9.50% (Libor + 8.00%/Q) | 10/3/2013 | 24.9 | 24.9 | (2)(17) | ||||||||||||||
25.0 | 25.0 | ||||||||||||||||||
Global Franchise Group, LLC (21) | Worldwide franchisor of quick service restaurants | First lien senior secured loan ($8.7 par due 12/2019) | 7.44% (Libor + 5.75%/Q) | 9/15/2017 | 8.7 | 8.6 | (2)(17) | ||||||||||||
Heritage Food Service Group, Inc. and WCI-HFG Holdings, LLC | Distributor of repair and replacement parts for commercial kitchen equipment | Second lien senior secured loan ($31.6 par due 10/2022) | 9.92% (Libor + 8.50%/Q) | 10/20/2015 | 31.6 | 31.6 | (2)(17) | ||||||||||||
Preferred units (3,000,000 units) | 10/20/2015 | 3.0 | 3.6 | (2) | |||||||||||||||
34.6 | 35.2 | ||||||||||||||||||
Hojeij Branded Foods, LLC (21) | Leading operator of airport concessions across the U.S. | First lien senior secured loan ($0.3 par due 7/2022) | 7.29% (Libor + 6.00%/Q) | 7/20/2017 | 0.3 | 0.3 | (2)(17) | ||||||||||||
First lien senior secured loan ($6.3 par due 7/2022) | 7.57% (Libor + 6.00%/Q) | 7/20/2017 | 6.2 | 6.3 | (4)(17) | ||||||||||||||
6.5 | 6.6 | ||||||||||||||||||
F-28
As of December 31, 2017
(dollar amounts in millions)
Company(1) | Business Description | Investment | Interest(6)(12) | Acquisition Date | Amortized Cost | Fair Value | Percentage of Net Assets | ||||||||||||
Jim N Nicks Management, LLC (21) | Restaurant owner and operator | First lien senior secured revolving loan ($1.2 par due 7/2023) | 6.71% (Libor + 5.25%/Q) | 7/10/2017 | 1.2 | 1.2 | (2)(17) | ||||||||||||
First lien senior secured revolving loan ($0.5 par due 7/2023) | 6.64% (Libor + 5.25%/Q) | 7/10/2017 | 0.5 | 0.5 | (2)(17) | ||||||||||||||
First lien senior secured loan ($0.6 par due 7/2023) | 6.63% (Libor + 5.25%/Q) | 7/10/2017 | 0.6 | 0.6 | (2)(17) | ||||||||||||||
First lien senior secured loan ($0.6 par due 7/2023) | 6.94% (Libor + 5.25%/Q) | 7/10/2017 | 0.6 | 0.6 | (2)(17) | ||||||||||||||
First lien senior secured loan ($14.1 par due 7/2023) | 6.94% (Libor + 5.25%/Q) | 7/10/2017 | 14.1 | 13.8 | (4)(17) | ||||||||||||||
17.0 | 16.7 | ||||||||||||||||||
Orion Foods, LLC (8) | Convenience food service retailer | First lien senior secured loan ($1.2 par due 9/2015) | — | 4/1/2010 | 1.2 | 0.5 | (2)(16) | ||||||||||||
Second lien senior secured loan ($19.4 par due 9/2015) | — | 4/1/2010 | — | — | (2)(16) | ||||||||||||||
Preferred units (10,000 units) | 10/28/2010 | — | — | (2) | |||||||||||||||
Class A common units (25,001 units) | 4/1/2010 | — | — | (2) | |||||||||||||||
Class B common units (1,122,452 units) | 4/1/2010 | — | — | (2) | |||||||||||||||
1.2 | 0.5 | ||||||||||||||||||
OTG Management, LLC (21) | Airport restaurant operator | First lien senior secured revolving loan ($8.4 par due 8/2021) | 9.85% (Libor + 8.50%/Q) | 8/26/2016 | 8.4 | 8.4 | (2)(17) | ||||||||||||
First lien senior secured loan ($4.9 par due 8/2021) | 9.88% (Libor + 8.50%/Q) | 8/26/2016 | 4.9 | 4.9 | (2)(17) | ||||||||||||||
First lien senior secured loan ($1.6 par due 8/2021) | 9.91% (Libor + 8.50%/Q) | 8/26/2016 | 1.6 | 1.6 | (2)(17) | ||||||||||||||
First lien senior secured loan ($2.2 par due 8/2021) | 9.98% (Libor + 8.50%/Q) | 8/26/2016 | 2.2 | 2.2 | (2)(17) | ||||||||||||||
First lien senior secured loan ($97.8 par due 8/2021) | 9.88% (Libor + 8.50%/Q) | 8/26/2016 | 97.8 | 97.8 | (3)(17) | ||||||||||||||
Senior subordinated loan ($25.3 par due 2/2022) | 17.50% PIK | 8/26/2016 | 25.1 | 25.3 | (2) | ||||||||||||||
Class A preferred units (3,000,000 units) | 8/26/2016 | 30.0 | 34.7 | (2) | |||||||||||||||
Common units (3,000,000 units) | 1/5/2011 | 3.0 | 9.1 | (2) | |||||||||||||||
Warrant to purchase up to 7.73% of common units (expires 6/2018) | 6/19/2008 | 0.1 | — | (2) | |||||||||||||||
Warrant to purchase 0.60% of the common units deemed outstanding (expires 12/2018) | 8/29/2016 | — | 19.9 | (2) | |||||||||||||||
173.1 | 203.9 | ||||||||||||||||||
Restaurant Holding Company, LLC | Fast food restaurant operator | First lien senior secured loan ($31.7 par due 2/2019) | 9.32% (Libor + 7.75%/Q) | 3/13/2014 | 31.6 | 30.7 | (3)(17) | ||||||||||||
Restaurant Technologies, Inc. (21) | Provider of bulk cooking oil management services to the restaurant and fast food service industries | First lien senior secured revolving loan ($0.2 par due 11/2021) | 6.32% (Libor + 4.75%/Q) | 11/23/2016 | 0.2 | 0.2 | (2)(17)(20) | ||||||||||||
First lien senior secured revolving loan ($0.4 par due 11/2021) | 6.30% (Libor + 4.75%/Q) | 11/23/2016 | 0.4 | 0.4 | (2)(17)(20) | ||||||||||||||
0.6 | 0.6 | ||||||||||||||||||
SFE Intermediate Holdco LLC (21) | Provider of outsourced foodservice to K-12 school districts | First lien senior secured revolving loan ($0.8 par due 7/2022) | 6.50% (Libor + 5.00%/Q) | 7/31/2017 | 0.8 | 0.8 | (2)(17) | ||||||||||||
First lien senior secured loan ($6.8 par due 7/2023) | 6.38% (Libor + 5.00%/Q) | 7/31/2017 | 6.7 | 6.8 | (4)(17) | ||||||||||||||
7.5 | 7.6 | ||||||||||||||||||
400.7 | 388.4 | 5.47 | % | ||||||||||||||||
Automotive Services | |||||||||||||||||||
F-29
As of December 31, 2017
(dollar amounts in millions)
Company(1) | Business Description | Investment | Interest(6)(12) | Acquisition Date | Amortized Cost | Fair Value | Percentage of Net Assets | ||||||||||||
A.U.L. Corp. (21) | Provider of vehicle service contracts (“VSCs”) and limited warranties for passenger vehicles | First lien senior secured revolving loan ($0.4 par due 6/2023) | 9.00% (Base Rate + 4.50%/Q) | 6/7/2017 | 0.4 | 0.4 | (2)(17) | ||||||||||||
First lien senior secured loan ($7.8 par due 6/2023) | 6.75% (Libor + 5.00%/Q) | 6/7/2017 | 7.8 | 7.8 | (2)(17) | ||||||||||||||
8.2 | 8.2 | ||||||||||||||||||
AEP Holdings, Inc. and Arrowhead Holdco Company | Distributor of non-discretionary, mission-critical aftermarket replacement parts | First lien senior secured loan ($0.1 par due 8/2021) | 7.09% (Libor + 5.75%/Q) | 7/21/2017 | 0.1 | 0.1 | (2)(17) | ||||||||||||
First lien senior secured loan ($3.0 par due 8/2021) | 7.13% (Libor + 5.75%/Q) | 7/21/2017 | 3.0 | 3.0 | (2)(17) | ||||||||||||||
First lien senior secured loan ($1.5 par due 8/2021) | 7.23% (Libor + 5.75%/Q) | 7/21/2017 | 1.5 | 1.5 | (2)(17) | ||||||||||||||
Common stock (3,467 shares) | 8/31/2015 | 3.5 | 4.3 | (2) | |||||||||||||||
8.1 | 8.9 | ||||||||||||||||||
ChargePoint, Inc. | Developer and operator of electric vehicle charging stations | Warrant to purchase up to 809,126 shares of Series E preferred stock (expires 12/2024) | 12/30/2014 | 0.3 | 2.1 | (2) | |||||||||||||
Dent Wizard International Corporation and DWH Equity Investors, L.P. | Automotive reconditioning services | Second lien senior secured loan ($50.0 par due 10/2020) | 10.24% (Libor + 8.75%/Q) | 4/7/2015 | 50.0 | 50.0 | (2)(17) | ||||||||||||
Class A common stock (10,000 shares) | 4/7/2015 | 0.2 | 0.5 | (2) | |||||||||||||||
Class B common stock (20,000 shares) | 4/7/2015 | 0.4 | 1.0 | (2) | |||||||||||||||
50.6 | 51.5 | ||||||||||||||||||
Eckler Industries, Inc. (21) | Restoration parts and accessories provider for classic automobiles | First lien senior secured revolving loan ($2.0 par due 12/2017) | — | 7/12/2012 | 2.0 | 1.5 | (2)(16) | ||||||||||||
First lien senior secured loan ($6.6 par due 12/2017) | — | 7/12/2012 | 6.6 | 4.9 | (2)(16) | ||||||||||||||
First lien senior secured loan ($24.3 par due 12/2017) | — | 7/12/2012 | 24.3 | 18.0 | (2)(16) | ||||||||||||||
Series A preferred stock (1,800 shares) | 7/12/2012 | 1.8 | — | (2) | |||||||||||||||
Common stock (20,000 shares) | 7/12/2012 | 0.2 | — | (2) | |||||||||||||||
34.9 | 24.4 | ||||||||||||||||||
EcoMotors, Inc. | Engine developer | First lien senior secured loan ($9.4 par due 3/2018) | — | 9/1/2015 | 9.1 | 0.1 | (2)(16) | ||||||||||||
Warrant to purchase up to 321,888 shares of Series C preferred stock (expires 12/2022) | 12/28/2012 | — | — | (2) | |||||||||||||||
Warrant to purchase up to 70,000 shares of Series C preferred stock (expires 2/2025) | 2/24/2015 | — | — | (2) | |||||||||||||||
9.1 | 0.1 | ||||||||||||||||||
ESCP PPG Holdings, LLC (7) | Distributor of new equipment and aftermarket parts to the heavy-duty truck industry | Class A units (3,500,000 units) | 12/14/2016 | 3.5 | 2.8 | (2) | |||||||||||||
Mavis Tire Supply LLC | Auto parts retailer | First lien senior secured loan ($38.5 par due 10/2020) | 6.67% (Libor + 5.25%/Q) | 7/26/2017 | 38.5 | 38.5 | (2)(17) | ||||||||||||
First lien senior secured loan ($2.0 par due 10/2020) | 6.67% (Libor + 5.25%/Q) | 10/18/2017 | 2.0 | 2.0 | (2)(17) | ||||||||||||||
First lien senior secured loan ($179.0 par due 10/2020) | 6.67% (Libor + 5.25%/Q) | 7/26/2017 | 179.0 | 179.0 | (2)(17) | ||||||||||||||
219.5 | 219.5 | ||||||||||||||||||
Simpson Performance Products, Inc. | Provider of motorsports safety equipment | First lien senior secured loan ($10.0 par due 2/2020) | 9.25% (Libor + 7.59%/Q) | 2/20/2015 | 10.0 | 10.0 | (2)(17) | ||||||||||||
First lien senior secured loan ($18.3 par due 2/2020) | 9.25% (Libor + 7.59%/Q) | 2/20/2015 | 18.3 | 18.3 | (3)(17) | ||||||||||||||
28.3 | 28.3 | ||||||||||||||||||
SK SPV IV, LLC | Collision repair site operators | Series A common stock (12,500 units) | 8/18/2014 | 0.6 | 3.2 | (2) | |||||||||||||
F-30
As of December 31, 2017
(dollar amounts in millions)
Company(1) | Business Description | Investment | Interest(6)(12) | Acquisition Date | Amortized Cost | Fair Value | Percentage of Net Assets | ||||||||||||
Series B common stock (12,500 units) | 8/18/2014 | 0.6 | 3.2 | (2) | |||||||||||||||
1.2 | 6.4 | ||||||||||||||||||
363.7 | 352.2 | 4.96 | % | ||||||||||||||||
Education | |||||||||||||||||||
Campus Management Acquisition Corp. (7) | Education software developer | Preferred stock (485,159 shares) | 2/8/2008 | 10.5 | 11.0 | (2) | |||||||||||||
Excelligence Holdings Corp. | Developer, manufacturer and retailer of educational products | First lien senior secured loan ($10.0 par due 4/2023) | 7.35% (Libor + 6.00%/Q) | 4/17/2017 | 10.0 | 9.6 | (4)(17) | ||||||||||||
Flinn Scientific, Inc. and WCI-Quantum Holdings, Inc. | Distributor of instructional products, services and resources | First lien senior secured loan ($32.0 par due 10/2020) | 6.50% (Libor + 5.00%/Q) | 7/26/2017 | 32.0 | 32.0 | (2)(17) | ||||||||||||
First lien senior secured loan ($38.7 par due 10/2020) | 6.37% (Libor + 5.00%/Q) | 7/26/2017 | 38.7 | 38.7 | (2)(17) | ||||||||||||||
Series A preferred stock (1,272 shares) | 10/24/2014 | 1.0 | 1.2 | (2) | |||||||||||||||
71.7 | 71.9 | ||||||||||||||||||
Frontline Technologies Group Holding LLC, Frontline Technologies Blocker Buyer, Inc., Frontline Technologies Holdings, LLC and Frontline Technologies Parent, LLC (21) | Provider of human capital management (“HCM”) and SaaS-based software solutions to employees and administrators of K-12 school organizations | First lien senior secured loan ($39.6 par due 9/2023) | 8.09% (Libor + 6.50%/Q) | 9/19/2017 | 39.1 | 39.0 | (2)(17) | ||||||||||||
Class A preferred units (4,574 units) | 9/18/2017 | 4.6 | 4.8 | ||||||||||||||||
Class B units (499,050 units) | 9/18/2017 | — | — | ||||||||||||||||
43.7 | 43.8 | ||||||||||||||||||
Infilaw Holding, LLC (21) | Operator of for-profit law schools | First lien senior secured revolving loan ($4.5 par due 2/2018) | — | 8/25/2011 | 3.5 | — | (2)(16)(20) | ||||||||||||
Instituto de Banca y Comercio, Inc. & Leeds IV Advisors, Inc. (21) | Private school operator | First lien senior secured revolving loan ($11.8 par due 12/2018) | 12.50% (Base Rate + 8.00%/Q) | 5/18/2017 | 11.8 | 11.8 | (2)(17) | ||||||||||||
First lien senior secured loan ($3.2 par due 12/2018) | 10.50% (Libor + 9.00%/Q) | 10/31/2015 | 3.2 | 3.2 | (2)(17) | ||||||||||||||
Senior preferred series A-1 shares (163,902 shares) | 10/31/2015 | 119.4 | 25.2 | (2) | |||||||||||||||
Series B preferred stock (1,401,385 shares) | 8/5/2010 | 4.0 | — | (2) | |||||||||||||||
Series C preferred stock (1,994,644 shares) | 6/7/2010 | 0.5 | — | (2) | |||||||||||||||
Series B preferred stock (348,615 shares) | 8/5/2010 | 1.0 | — | (2) | |||||||||||||||
Series C preferred stock (517,942 shares) | 6/7/2010 | 0.1 | — | (2) | |||||||||||||||
Common stock (16 shares) | 6/7/2010 | — | — | (2) | |||||||||||||||
Common stock (4 shares) | 6/7/2010 | — | — | (2) | |||||||||||||||
140.0 | 40.2 | ||||||||||||||||||
Liaison Acquisition, LLC (21) | Provider of centralized applications services to educational associations | Second lien senior secured loan ($15.0 par due 8/2023) | 10.81% (Libor + 9.25%/Q) | 2/9/2017 | 14.7 | 15.0 | (2)(17) | ||||||||||||
PIH Corporation and Primrose Holding Corporation (7)(21) | Franchisor of education-based early childhood centers | First lien senior secured revolving loan ($0.6 par due 12/2018) | 6.63% (Libor + 5.25%/Q) | 12/13/2013 | 0.6 | 0.6 | (2)(17) | ||||||||||||
First lien senior secured revolving loan ($0.4 par due 12/2018) | 8.75% (Base Rate + 4.25%/Q) | 12/13/2013 | 0.4 | 0.4 | (2)(17) | ||||||||||||||
First lien senior secured loan ($1.6 par due 12/2018) | 7.07% (Libor + 5.50%/Q) | 12/15/2017 | 1.6 | 1.6 | (2)(17) | ||||||||||||||
Common stock (7,227 shares) | 1/3/2017 | 10.7 | 17.8 | ||||||||||||||||
13.3 | 20.4 | ||||||||||||||||||
R3 Education Inc., Equinox EIC Partners LLC and Sierra Education Finance Corp. | Medical school operator | Preferred stock (1,977 shares) | 7/30/2008 | 0.5 | 0.5 | (2) | |||||||||||||
F-31
As of December 31, 2017
(dollar amounts in millions)
Company(1) | Business Description | Investment | Interest(6)(12) | Acquisition Date | Amortized Cost | Fair Value | Percentage of Net Assets | ||||||||||||
Common membership interest (15.76% interest) | 9/21/2007 | 15.8 | 26.2 | (2) | |||||||||||||||
Warrant to purchase up to 27,890 shares (expires 11/2019) | 12/8/2009 | — | 9.1 | (2) | |||||||||||||||
16.3 | 35.8 | ||||||||||||||||||
Regent Education, Inc. | Provider of software solutions designed to optimize the financial aid and enrollment processes | Warrant to purchase up to 987 shares of common stock (expires 12/2026) | 12/23/2016 | — | — | (2) | |||||||||||||
Warrant to purchase up to 5,393,194 shares of common stock (expires 12/2026) | 12/23/2016 | — | — | (2) | |||||||||||||||
— | — | ||||||||||||||||||
RuffaloCODY, LLC (21) | Provider of student fundraising and enrollment management services | First lien senior secured revolving loan | — | 5/29/2013 | — | — | (19) | ||||||||||||
Severin Acquisition, LLC (21) | Provider of student information system software solutions to the K-12 education market | Second lien senior secured loan ($38.7 par due 7/2022) | 10.32% (Libor + 8.75%/Q) | 2/1/2017 | 37.9 | 38.7 | (2)(17) | ||||||||||||
Second lien senior secured loan ($3.1 par due 7/2022) | 10.57% (Libor + 9.00%/Q) | 10/14/2016 | 3.1 | 3.1 | (17) | ||||||||||||||
Second lien senior secured loan ($4.2 par due 7/2022) | 10.32% (Libor + 8.75%/Q) | 10/28/2015 | 4.1 | 4.2 | (2)(17) | ||||||||||||||
Second lien senior secured loan ($15.0 par due 7/2022) | 10.32% (Libor + 8.75%/Q) | 7/31/2015 | 14.8 | 15.0 | (2)(17) | ||||||||||||||
Second lien senior secured loan ($3.3 par due 7/2022) | 10.82% (Libor + 9.25%/Q) | 2/1/2016 | 3.2 | 3.3 | (2)(17) | ||||||||||||||
Second lien senior secured loan ($2.8 par due 7/2022) | 10.82% (Libor + 9.25%/Q) | 8/8/2016 | 2.8 | 2.8 | (17) | ||||||||||||||
Second lien senior secured loan ($3.1 par due 7/2022) | 10.57% (Libor + 9.00%/Q) | 1/3/2017 | 3.1 | 3.1 | (17) | ||||||||||||||
Second lien senior secured loan ($5.5 par due 7/2022) | 10.32% (Libor + 8.75%/Q) | 1/3/2017 | 5.5 | 5.5 | (2)(17) | ||||||||||||||
Second lien senior secured loan ($20.0 par due 7/2022) | 10.32% (Libor + 8.75%/Q) | 1/3/2017 | 20.0 | 20.0 | (2)(17) | ||||||||||||||
Second lien senior secured loan ($4.4 par due 7/2022) | 10.82% (Libor + 9.25%/Q) | 1/3/2017 | 4.4 | 4.4 | (2)(17) | ||||||||||||||
Second lien senior secured loan ($2.8 par due 7/2022) | 10.82% (Libor + 9.25%/Q) | 1/3/2017 | 2.8 | 2.8 | (17) | ||||||||||||||
101.7 | 102.9 | ||||||||||||||||||
425.4 | 350.6 | 4.94 | % | ||||||||||||||||
Wholesale Distribution | |||||||||||||||||||
DFS Holding Company, Inc. | Distributor of maintenance, repair, and operations parts, supplies, and equipment to the foodservice industry | First lien senior secured loan ($4.7 par due 2/2022) | 6.69% (Libor + 5.00%/Q) | 3/1/2017 | 4.7 | 4.6 | (2)(17) | ||||||||||||
First lien senior secured loan ($188.7 par due 2/2022) | 7.19% (Libor + 5.50%/Q) | 7/26/2017 | 188.7 | 186.8 | (2)(17) | ||||||||||||||
193.4 | 191.4 | ||||||||||||||||||
Flow Solutions Holdings, Inc. | Distributor of high value fluid handling, filtration and flow control products | Second lien senior secured loan ($6.0 par due 10/2018) | 10.57% (Libor + 9.00%/Q) | 12/16/2014 | 6.0 | 6.0 | (2)(17) | ||||||||||||
Second lien senior secured loan ($29.5 par due 10/2018) | 10.57% (Libor + 9.00%/Q) | 12/16/2014 | 29.5 | 29.5 | (2)(17) | ||||||||||||||
35.5 | 35.5 | ||||||||||||||||||
KHC Holdings, Inc. and Kele Holdco, Inc. (21) | Catalog-based distribution services provider for building automation systems | First lien senior secured revolving loan ($0.7 par due 10/2020) | 5.80% (Libor + 4.25%/Q) | 1/3/2017 | 0.7 | 0.7 | (2)(17) | ||||||||||||
First lien senior secured loan ($66.2 par due 10/2022) | 7.69% (Libor + 6.00%/Q) | 1/3/2017 | 66.2 | 66.2 | (3)(17) | ||||||||||||||
Common stock (30,000 shares) | 1/3/2017 | 3.1 | 3.1 | ||||||||||||||||
70.0 | 70.0 | ||||||||||||||||||
F-32
As of December 31, 2017
(dollar amounts in millions)
Company(1) | Business Description | Investment | Interest(6)(12) | Acquisition Date | Amortized Cost | Fair Value | Percentage of Net Assets | ||||||||||||
298.9 | 296.9 | 4.18 | % | ||||||||||||||||
Oil and Gas | |||||||||||||||||||
Moss Creek Resources, LLC | Exploration and production company | Senior subordinated loan ($30.0 par due 4/2022) | 9.50% (Libor + 8.00%/Q) | 5/5/2017 | 29.7 | 30.0 | (2)(17) | ||||||||||||
Penn Virginia Holding Corp. | Exploration and production company | Second lien senior secured loan ($90.1 par due 9/2022) | 8.57% (Libor + 7.00%/Q) | 9/28/2017 | 90.1 | 88.3 | (2)(17) | ||||||||||||
Petroflow Energy Corporation and TexOak Petro Holdings LLC (7) | Oil and gas exploration and production company | First lien senior secured loan ($12.8 par due 6/2019) | 3.36% (Libor + 2.00%/Q) | 6/29/2016 | 11.7 | 12.4 | (2)(17) | ||||||||||||
Second lien senior secured loan ($24.7 par due 12/2019) | — | 6/29/2016 | 21.9 | — | (2)(16) | ||||||||||||||
Common units (202,000 units) | 6/29/2016 | 11.1 | — | ||||||||||||||||
44.7 | 12.4 | ||||||||||||||||||
VPROP Operating, LLC and Vista Proppants and Logistics, LLC | Sand based proppant producer and distributor to the oil and natural gas industry | First lien senior secured loan ($28.2 par due 8/2021) | 10.98% (Libor + 9.50%/Q) | 8/1/2017 | 28.1 | 28.2 | (2)(17) | ||||||||||||
First lien senior secured loan ($35.3 par due 8/2021) | 10.74% (Libor + 8.50% Cash, 1.00% PIK/Q) | 11/9/2017 | 35.3 | 35.3 | (2)(17) | ||||||||||||||
First lien senior secured loan ($15.2 par due 3/2021) | 10.98% (Libor + 8.50% Cash, 1.00% PIK/Q) | 3/1/2017 | 15.2 | 15.2 | (2)(17) | ||||||||||||||
First lien senior secured loan ($75.5 par due 3/2021) | 10.98% (Libor + 8.50% Cash, 1.00% PIK/Q) | 3/1/2017 | 75.5 | 75.5 | (3)(17) | ||||||||||||||
Common units (997,864 units) | 11/9/2017 | 9.7 | 9.7 | (2) | |||||||||||||||
163.8 | 163.9 | ||||||||||||||||||
328.3 | 294.6 | 4.15 | % | ||||||||||||||||
Containers and Packaging | |||||||||||||||||||
GS Pretium Holdings, Inc. | Manufacturer and supplier of high performance plastic containers | Common stock (500,000 shares) | 6/2/2014 | 0.5 | 0.8 | (2) | |||||||||||||
ICSH Parent, Inc. and Vulcan Container Services Holdings, Inc. | Industrial container manufacturer, reconditioner and servicer | Second lien senior secured loan ($63.6 par due 4/2025) | 9.38% (Libor + 8.00%/Q) | 4/28/2017 | 62.9 | 63.6 | (2)(17) | ||||||||||||
Series A common stock (24,900 shares) | 4/28/2017 | 2.5 | 3.3 | (2) | |||||||||||||||
65.4 | 66.9 | ||||||||||||||||||
LBP Intermediate Holdings LLC (21) | Manufacturer of paper and corrugated foodservice packaging | First lien senior secured revolving loan | — | 7/10/2015 | — | — | (19) | ||||||||||||
First lien senior secured loan ($11.8 par due 7/2020) | 7.19% (Libor + 5.50%/Q) | 7/10/2015 | 11.8 | 11.8 | (3)(17) | ||||||||||||||
First lien senior secured loan ($5.0 par due 7/2020) | 7.19% (Libor + 5.50%/Q) | 7/10/2015 | 5.0 | 5.0 | (4)(17) | ||||||||||||||
16.8 | 16.8 | ||||||||||||||||||
Microstar Logistics LLC, Microstar Global Asset Management LLC, and MStar Holding Corporation | Keg management solutions provider | Second lien senior secured loan ($78.5 par due 12/2018) | 9.05% (Libor + 7.50%/Q) | 12/14/2012 | 78.5 | 78.5 | (2)(17) | ||||||||||||
Second lien senior secured loan ($54.0 par due 12/2018) | 9.05% (Libor + 7.50%/Q) | 12/14/2012 | 54.0 | 54.0 | (3)(17) | ||||||||||||||
Second lien senior secured loan ($10.0 par due 12/2018) | 9.05% (Libor + 7.50%/Q) | 12/14/2012 | 10.0 | 10.0 | (4)(17) | ||||||||||||||
Common stock (50,000 shares) | 12/14/2012 | 4.0 | 6.8 | (2) | |||||||||||||||
146.5 | 149.3 | ||||||||||||||||||
NSI Holdings, Inc. (7) | Manufacturer of plastic containers for the wholesale nursery industry | Series A preferred stock (2,192 shares) | 1/3/2017 | — | — | ||||||||||||||
Ranpak Corp. | Manufacturer and marketer of paper-based protective packaging systems and materials | Second lien senior secured loan ($13.3 par due 10/2022) | 8.75% (Libor + 7.25%/Q) | 1/3/2017 | 12.8 | 13.3 | (2)(17) | ||||||||||||
242.0 | 247.1 | 3.48 | % | ||||||||||||||||
F-33
As of December 31, 2017
(dollar amounts in millions)
Company(1) | Business Description | Investment | Interest(6)(12) | Acquisition Date | Amortized Cost | Fair Value | Percentage of Net Assets | ||||||||||||
Environmental Services | |||||||||||||||||||
MPH Energy Holdings, LP | Operator of municipal recycling facilities | Limited partnership interest (3.13% interest) | 1/8/2014 | — | — | (2) | |||||||||||||
RE Community Holdings GP, LLC and RE Community Holdings, LP | Operator of municipal recycling facilities | Limited partnership interest (2.86% interest) | 3/1/2011 | — | — | (2) | |||||||||||||
Limited partnership interest (2.49% interest) | 3/1/2011 | — | — | (2) | |||||||||||||||
— | — | ||||||||||||||||||
Soil Safe, Inc. and Soil Safe Acquisition Corp. (8)(21) | Provider of soil treatment, recycling and placement services | First lien senior secured revolving loan | — | 1/3/2017 | — | — | (19) | ||||||||||||
First lien senior secured loan ($22.0 par due 1/2020) | 8.00% (Libor + 6.25%/Q) | 1/3/2017 | 22.0 | 22.0 | (2)(17) | ||||||||||||||
Second lien senior secured loan ($12.7 par due 6/2020) | 10.75% (Libor + 7.75%/Q) | 1/3/2017 | 12.7 | 12.7 | (2)(17) | ||||||||||||||
Senior subordinated loan ($36.7 par due 12/2020) | 16.50% PIK | 1/3/2017 | 36.7 | 36.7 | (2) | ||||||||||||||
Senior subordinated loan ($31.5 par due 12/2020) | 14.50% PIK | 1/3/2017 | 31.5 | 31.5 | (2) | ||||||||||||||
Senior subordinated loan ($30.5 par due 12/2020) | — | 1/3/2017 | 11.5 | 4.0 | (16) | ||||||||||||||
Common stock (810 shares) | 1/3/2017 | — | — | ||||||||||||||||
114.4 | 106.9 | ||||||||||||||||||
Storm UK Holdco Limited and Storm US Holdco Inc. (9)(21) | Provider of water infrastructure software solutions for municipalities / utilities and engineering consulting firms | First lien senior secured revolving loan ($0.1 par due 5/2022) | 9.00% (Base Rate + 4.50%/Q) | 5/5/2017 | 0.1 | 0.1 | (2)(17) | ||||||||||||
First lien senior secured loan ($1.6 par due 5/2023) | 6.89% (Libor + 5.50%/Q) | 5/5/2017 | 1.6 | 1.5 | (2)(17) | ||||||||||||||
1.7 | 1.6 | ||||||||||||||||||
Waste Pro USA, Inc | Waste management services | Second lien senior secured loan ($75.2 par due 10/2020) | 9.05% (Libor + 7.50%/Q) | 10/15/2014 | 75.2 | 75.2 | (3)(17) | ||||||||||||
191.3 | 183.7 | 2.59 | % | ||||||||||||||||
Printing, Publishing and Media | |||||||||||||||||||
Connoisseur Media, LLC | Owner and operator of radio stations | First lien senior secured loan ($21.0 par due 6/2019) | 7.74% (Libor + 6.38%/Q) | 7/26/2017 | 21.0 | 20.8 | (2)(17) | ||||||||||||
First lien senior secured loan ($0.1 par due 6/2019) | 9.88% (Base Rate + 5.38%/Q) | 7/26/2017 | 0.1 | 0.1 | (2)(17) | ||||||||||||||
First lien senior secured loan ($0.7 par due 6/2019) | 8.07% (Libor + 6.38%/Q) | 7/26/2017 | 0.7 | 0.6 | (2)(17) | ||||||||||||||
First lien senior secured loan ($0.3 par due 6/2019) | 8.07% (Libor + 6.38%/Q) | 7/26/2017 | 0.3 | 0.3 | (4)(17) | ||||||||||||||
First lien senior secured loan ($41.4 par due 6/2019) | 7.76% (Libor + 6.38%/Q) | 7/26/2017 | 41.4 | 41.0 | (2)(17) | ||||||||||||||
First lien senior secured loan ($17.8 par due 6/2019) | 7.76% (Libor + 6.38%/Q) | 7/26/2017 | 17.8 | 17.6 | (4)(17) | ||||||||||||||
81.3 | 80.4 | ||||||||||||||||||
Earthcolor Group, LLC | Printing management services | Limited liability company interests (9.30%) | 5/18/2012 | — | — | ||||||||||||||
EDS Group (8)(9) | Provider of print and digital services | Common stock (2,432,750 shares) | 1/3/2017 | — | 2.7 | ||||||||||||||
Roark-Money Mailer LLC | Marketer, advertiser and distributor of coupons in the mail industry | Membership units (35,000 units) | 1/3/2017 | — | — | ||||||||||||||
The Teaching Company Holdings, Inc. | Education publications provider | Preferred stock (10,663 shares) | 9/29/2006 | 1.1 | 2.4 | (2) | |||||||||||||
Common stock (15,393 shares) | 9/29/2006 | — | — | (2) | |||||||||||||||
1.1 | 2.4 | ||||||||||||||||||
82.4 | 85.5 | 1.20 | % | ||||||||||||||||
Chemicals | |||||||||||||||||||
AMZ Holding Corp. (21) | Specialty chemicals manufacturer | First lien senior secured loan ($12.2 par due 6/2022) | 6.57% (Libor + 5.00%/Q) | 6/27/2017 | 12.2 | 12.2 | (4)(17) | ||||||||||||
F-34
As of December 31, 2017
(dollar amounts in millions)
Company(1) | Business Description | Investment | Interest(6)(12) | Acquisition Date | Amortized Cost | Fair Value | Percentage of Net Assets | ||||||||||||
Genomatica, Inc. | Developer of a biotechnology platform for the production of chemical products | Warrant to purchase 322,422 shares of Series D preferred stock (expires 3/2023) | 3/28/2013 | — | — | (2) | |||||||||||||
K2 Pure Solutions Nocal, L.P. (21) | Chemical producer | First lien senior secured revolving loan ($1.5 par due 2/2021) | 8.70% (Libor + 7.13%/Q) | 8/19/2013 | 1.5 | 1.5 | (2)(17) | ||||||||||||
First lien senior secured loan ($40.0 par due 2/2021) | 7.57% (Libor + 6.00%/Q) | 8/19/2013 | 40.0 | 40.0 | (3)(17) | ||||||||||||||
First lien senior secured loan ($13.0 par due 2/2021) | 7.57% (Libor + 6.00%/Q) | 8/19/2013 | 13.0 | 13.0 | (4)(17) | ||||||||||||||
54.5 | 54.5 | ||||||||||||||||||
66.7 | 66.7 | 0.94 | % | ||||||||||||||||
Retail | |||||||||||||||||||
Fashion Holding Luxembourg SCA (Modacin/Camaeiu) (8)(9) | Retailer of women's clothing | Preferred stock (241,776,675 shares) | 1/3/2017 | — | — | ||||||||||||||
Galls, LLC | Distributor of public safety, private security and defense products in the United States | Second lien senior secured loan ($2.0 par due 8/2021) | 9.71% (Libor + 8.25%/Q) | 8/25/2017 | 2.0 | 2.0 | (2)(17) | ||||||||||||
Second lien senior secured loan ($7.1 par due 8/2021) | 9.85% (Libor + 8.25%/Q) | 8/25/2017 | 7.1 | 7.1 | (2)(17) | ||||||||||||||
Second lien senior secured loan ($1.9 par due 8/2021) | 9.94% (Libor + 8.25%/Q) | 8/25/2017 | 1.9 | 1.9 | (2)(17) | ||||||||||||||
Second lien senior secured loan ($14.3 par due 8/2021) | 9.94% (Libor + 8.25%/Q) | 1/3/2017 | 14.3 | 14.3 | (2)(17) | ||||||||||||||
Second lien senior secured loan ($26.0 par due 8/2021) | 9.94% (Libor + 8.25%/Q) | 1/3/2017 | 26.0 | 26.0 | (2)(17) | ||||||||||||||
51.3 | 51.3 | ||||||||||||||||||
Paper Source, Inc. and Pine Holdings, Inc. (21) | Retailer of fine and artisanal paper products | First lien senior secured loan ($9.6 par due 9/2019) | 7.94% (Libor + 6.25%/Q) | 9/23/2013 | 9.6 | 9.4 | (4)(17) | ||||||||||||
Class A common stock (36,364 shares) | 9/23/2013 | 6.0 | 3.1 | (2) | |||||||||||||||
15.6 | 12.5 | ||||||||||||||||||
Things Remembered, Inc. and TRM Holdco Corp. (7)(21) | Personalized gifts retailer | First lien senior secured loan ($12.3 par due 3/2020) | — | 8/30/2016 | 10.5 | 1.5 | (2)(16) | ||||||||||||
Common stock (10,631,940 shares) | 8/30/2016 | 6.1 | — | (2) | |||||||||||||||
16.6 | 1.5 | ||||||||||||||||||
83.5 | 65.3 | 0.92 | % | ||||||||||||||||
Aerospace and Defense | |||||||||||||||||||
Cadence Aerospace, LLC (21) | Aerospace precision components manufacturer | First lien senior secured revolving loan ($0.7 par due 11/2022) | 7.91% (Libor + 6.50%/Q) | 11/14/2017 | 0.7 | 0.7 | (2)(17)(20) | ||||||||||||
First lien senior secured loan ($32.5 par due 11/2023) | 7.91% (Libor + 6.50%/Q) | 11/14/2017 | 32.2 | 32.2 | (2)(17) | ||||||||||||||
32.9 | 32.9 | ||||||||||||||||||
Jazz Acquisition, Inc. | Designer and distributor of aftermarket replacement components to the commercial airlines industry | Second lien senior secured loan ($25.0 par due 6/2022) | 8.44% (Libor + 6.75%/Q) | 1/3/2017 | 19.8 | 22.5 | (2)(17) | ||||||||||||
52.7 | 55.4 | 0.78 | % | ||||||||||||||||
Health Clubs | |||||||||||||||||||
Athletic Club Holdings, Inc. | Premier health club operator | First lien senior secured loan ($35.0 par due 10/2020) | 10.07% (Libor + 8.50%/Q) | 10/11/2007 | 35.0 | 35.0 | (3)(17) | ||||||||||||
CFW Co-Invest, L.P., NCP Curves, L.P. and Curves International Holdings, Inc. | Health club franchisor | Limited partnership interest (4,152,165 shares) | 7/31/2012 | 4.2 | 4.4 | (2) | |||||||||||||
Limited partnership interest (2,218,235 shares) | 7/31/2012 | 2.2 | 9.7 | (2)(9) | |||||||||||||||
Common stock (1,680 shares) | 11/12/2014 | — | — | (2)(9) | |||||||||||||||
6.4 | 14.1 | ||||||||||||||||||
Movati Athletic (Group) Inc. (9)(21) | Premier health club operator | First lien senior secured loan ($0.3 par due 10/2022) | 5.90% (Libor + 4.50%/Q) | 10/5/2017 | 0.3 | 0.3 | (2)(17) | ||||||||||||
F-35
As of December 31, 2017
(dollar amounts in millions)
Company(1) | Business Description | Investment | Interest(6)(12) | Acquisition Date | Amortized Cost | Fair Value | Percentage of Net Assets | ||||||||||||
First lien senior secured loan ($3.1 par due 10/2022) | 5.91% (Libor + 4.50%/Q) | 10/5/2017 | 3.0 | 3.0 | (2)(17) | ||||||||||||||
3.3 | 3.3 | ||||||||||||||||||
44.7 | 52.4 | 0.74 | % | ||||||||||||||||
Farming and Agriculture | |||||||||||||||||||
QC Supply, LLC (21) | Specialty distributor and solutions provider to the swine and poultry markets | First lien senior secured revolving loan ($4.0 par due 12/2021) | 7.57% (Libor + 6.00%/Q) | 12/29/2016 | 4.0 | 3.9 | (2)(17) | ||||||||||||
First lien senior secured loan ($2.5 par due 12/2022) | 7.57% (Libor + 6.00%/Q) | 12/29/2016 | 2.5 | 2.4 | (2)(17) | ||||||||||||||
First lien senior secured loan ($11.2 par due 12/2022) | 7.57% (Libor + 6.00%/Q) | 12/29/2016 | 11.2 | 11.0 | (2)(17) | ||||||||||||||
First lien senior secured loan ($14.9 par due 12/2022) | 7.57% (Libor + 6.00%/Q) | 12/29/2016 | 14.9 | 14.6 | (4)(17) | ||||||||||||||
32.6 | 31.9 | ||||||||||||||||||
32.6 | 31.9 | 0.45 | % | ||||||||||||||||
Hotel Services | |||||||||||||||||||
Pyramid Management Advisors, LLC and Pyramid Investors, LLC | Hotel Operator | First lien senior secured loan ($3.0 par due 7/2021) | 8.69% (Libor + 7.00%/Q) | 7/15/2016 | 3.0 | 3.0 | (2)(17) | ||||||||||||
First lien senior secured loan ($19.5 par due 7/2021) | 11.37% (Libor + 10.06%/Q) | 7/15/2016 | 19.5 | 19.5 | (3)(17) | ||||||||||||||
Membership units (996,833 units) | 7/15/2016 | 1.0 | 0.8 | (2) | |||||||||||||||
23.5 | 23.3 | ||||||||||||||||||
23.5 | 23.3 | 0.33 | % | ||||||||||||||||
Computers and Electronics | |||||||||||||||||||
Everspin Technologies, Inc. | Designer and manufacturer of computer memory solutions | Warrant to purchase up to 18,461 shares of common stock (expires 10/2026) | 6/5/2015 | 0.4 | — | (5)(24) | |||||||||||||
Imaging Business Machines, L.L.C. and Scanner Holdings Corporation (8) | Provider of high-speed intelligent document scanning hardware and software | Senior subordinated loan ($8.3 par due 6/2022) | 14.00% | 1/3/2017 | 8.1 | 8.3 | (2) | ||||||||||||
Senior subordinated loan ($8.3 par due 6/2022) | 14.00% | 1/3/2017 | 8.1 | 8.3 | (2) | ||||||||||||||
Series A preferred stock (66,424,135 shares) | 1/3/2017 | — | 4.5 | ||||||||||||||||
Class A common stock (33,173 shares) | 1/3/2017 | — | — | ||||||||||||||||
Class B common stock (134,214 shares) | 1/3/2017 | — | — | ||||||||||||||||
16.2 | 21.1 | ||||||||||||||||||
16.6 | 21.1 | 0.30 | % | ||||||||||||||||
Telecommunications | |||||||||||||||||||
Adaptive Mobile Security Limited (9) | Developer of security software for mobile communications networks | First lien senior secured loan ($0.9 par due 10/2018) | 12.00% (EURIBOR + 8.00% Cash, 2.00% PIK/M) | 10/17/2016 | 0.8 | 0.8 | (2)(17) | ||||||||||||
First lien senior secured loan ($0.8 par due 7/2018) | 12.00% (EURIBOR + 8.00% Cash, 2.00% PIK/M) | 1/16/2015 | 0.7 | 0.7 | (2)(17) | ||||||||||||||
First lien senior secured loan ($0.3 par due 10/2018) | 12.00% (EURIBOR + 8.00% Cash, 2.00% PIK/M) | 1/16/2015 | 0.3 | 0.3 | (2)(17) | ||||||||||||||
1.8 | 1.8 | ||||||||||||||||||
CHL, LTD. | Repair and service solutions provider for cable, satellite and telecommunications based service providers | Warrant to purchase up to 120,000 shares of Series A common stock (expires 5/2020) | 1/3/2017 | — | — | ||||||||||||||
Warrant to purchase up to 280,000 shares of Series B common stock (expires 5/2020) | 1/3/2017 | — | — | ||||||||||||||||
F-36
As of December 31, 2017
(dollar amounts in millions)
Company(1) | Business Description | Investment | Interest(6)(12) | Acquisition Date | Amortized Cost | Fair Value | Percentage of Net Assets | ||||||||||||
Warrant to purchase up to 80,000 shares of Series C common stock (expires 5/2020) | 1/3/2017 | — | — | ||||||||||||||||
— | — | ||||||||||||||||||
LTG Acquisition, Inc. | Designer and manufacturer of display, lighting and passenger communication systems for mass transportation markets | Class A membership units (5,000 units) | 1/3/2017 | 5.1 | 1.7 | ||||||||||||||
Startec Equity, LLC (8) | Communication services | Member interest | 4/1/2010 | — | — | ||||||||||||||
6.9 | 3.5 | 0.05 | % | ||||||||||||||||
Commercial Real Estate Financial | |||||||||||||||||||
ACAS Real Estate Holdings Corporation (8) | Real estate holding company | Common stock (1,000 shares) | 1/3/2017 | 2.6 | 2.1 | ||||||||||||||
NECCO Realty Investments LLC (8) | Real estate holding company | Membership units (7,450 units) | 1/3/2017 | — | — | ||||||||||||||
2.6 | 2.1 | 0.03 | % | ||||||||||||||||
Housing and Building Materials | |||||||||||||||||||
Halex Holdings, Inc. (8)(21) | Manufacturer of flooring installation products | First lien senior secured revolving loan ($1.1 par due 12/2018) | 1/24/2017 | 1.1 | — | ||||||||||||||
Common stock (51,853 shares) | 1/3/2017 | — | — | ||||||||||||||||
1.1 | — | ||||||||||||||||||
1.1 | — | — | % | ||||||||||||||||
Total Investments | $ | 11,904.5 | $ | 11,840.6 | 166.83 | % | |||||||||||||
Derivative Instruments
Foreign currency forward contracts
Description | Notional Amount to be Purchased | Notional Amount to be sold | Counterparty | Settlement Date | Unrealized Appreciation / (Depreciation) | ||||||
Foreign currency forward contract | $ | 3 | CAD | 4 | Bank of Montreal | January 4, 2018 | $ | — | |||
Foreign currency forward contract | $ | 8 | CAD | 10 | Bank of Montreal | January 16, 2018 | — | ||||
Foreign currency forward contract | $ | 81 | CAD | 103 | Bank of Montreal | February 16, 2018 | (1 | ) | |||
Foreign currency forward contract | $ | 18 | € | 15 | Bank of Montreal | January 16, 2018 | — | ||||
Foreign currency forward contract | $ | 9 | € | 8 | Bank of Montreal | February 15, 2018 | — | ||||
Foreign currency forward contract | $ | 2 | € | 2 | Bank of Montreal | March 15, 2018 | — | ||||
Foreign currency forward contract | $ | 90 | ₤ | 68 | Bank of Montreal | February 15, 2018 | (2 | ) | |||
Foreign currency forward contract | $ | 12 | ₤ | 9 | Bank of Montreal | February 16, 2018 | — | ||||
Total | $ | (3 | ) | ||||||||
Interest rate swap
Description | Payment Terms | Counterparty | Maturity Date | Notional Amount | Value | Upfront Payments/Receipts | Unrealized Appreciation / (Depreciation) | |||||||||
Interest rate swap | Pay Fixed 2.0642% | Receive Floating One-Month LIBOR of 1.50% | Bank of Montreal | January 4, 2021 | $ | 395 | $ | (1 | ) | $ | — | $ | (1 | ) | ||
Total | $ | (1 | ) | |||||||||||||
____________________________________________________
(1) | Other than the Company’s investments listed in footnote 8 below (subject to the limitations set forth therein), the Company does not “Control” any of its portfolio companies, for the purposes of the Investment Company Act of 1940, as amended (together with the rules and regulations promulgated thereunder, the “Investment Company Act”). In general, under the Investment Company Act, the Company would “Control” a portfolio company if the Company owned more than 25% of its outstanding voting securities (i.e., securities with the right to elect directors) and/or had |
F-37
the power to exercise control over the management or policies of such portfolio company. All of the Company’s portfolio company investments, which as of December 31, 2017 represented 167% of the Company’s net assets or 96% of the Company’s total assets, are subject to legal restrictions on sales.
(2) | These assets are pledged as collateral for the Revolving Credit Facility (as defined below) and, as a result, are not directly available to the creditors of the Company to satisfy any obligations of the Company other than the Company’s obligations under the Revolving Credit Facility (see Note 5 to the consolidated financial statements). |
(3) | These assets are owned by the Company’s consolidated subsidiary Ares Capital CP Funding LLC (“Ares Capital CP”), are pledged as collateral for the Revolving Funding Facility (as defined below) and, as a result, are not directly available to the creditors of the Company to satisfy any obligations of the Company other than Ares Capital CP’s obligations under the Revolving Funding Facility (see Note 5 to the consolidated financial statements). |
(4) | These assets are owned by the Company’s consolidated subsidiary Ares Capital JB Funding LLC (“ACJB”), are pledged as collateral for the SMBC Funding Facility (as defined below) and, as a result, are not directly available to the creditors of the Company to satisfy any obligations of the Company other than ACJB’s obligations under the SMBC Funding Facility (see Note 5 to the consolidated financial statements). |
(5) | These assets are owned by the Company’s consolidated subsidiary Ares Venture Finance, L.P. (“AVF LP”), are pledged as collateral for the SBA-guaranteed debentures (the “SBA Debentures”) and, as a result, are not directly available to the creditors of the Company to satisfy any obligations of the Company other than AVF LP’s obligations (see Note 5 to the consolidated financial statements). AVF LP operates as a Small Business Investment Company (“SBIC”) under the provisions of Section 301(c) of the Small Business Investment Act of 1958, as amended. |
(6) | Investments without an interest rate are non-income producing. |
(7) | As defined in the Investment Company Act, the Company is deemed to be an “Affiliated Person” because it owns 5% or more of the portfolio company’s outstanding voting securities or it has the power to exercise control over the management or policies of such portfolio company (including through a management agreement). Transactions during the year ended December 31, 2017 in which the issuer was an Affiliated Person (but not a portfolio company that the Company is deemed to Control) are as follows: |
(in millions) Company | Purchases (cost) | Redemptions (cost) | Sales (cost) | Interest income | Capital structuring service fees | Dividend income | Other income | Net realized gains (losses) | Net unrealized gains (losses) | |||||||||||||||||||||||||||
Campus Management Acquisition Corp. | $ | — | $ | — | $ | — | $ | — | $ | — | $ | — | $ | — | $ | — | $ | 0.7 | ||||||||||||||||||
Crown Health Care Laundry Services, LLC and Crown Laundry Holdings, LLC | $ | 14.0 | $ | 0.8 | $ | — | $ | 1.1 | $ | 0.1 | $ | — | $ | 0.2 | $ | — | $ | 1.0 | ||||||||||||||||||
ESCP PPG Holdings, LLC | $ | — | $ | — | $ | — | $ | — | $ | — | $ | — | $ | — | $ | — | $ | (0.9 | ) | |||||||||||||||||
Financial Asset Management Systems, Inc. and FAMS Holdings, Inc. | $ | 3.0 | $ | 3.0 | $ | — | $ | — | $ | — | $ | — | $ | — | $ | — | $ | — | ||||||||||||||||||
Ioxus, Inc | $ | — | $ | — | $ | — | $ | 1.3 | $ | — | $ | — | $ | — | $ | — | $ | (0.1 | ) | |||||||||||||||||
Multi-Ad Services, Inc. | $ | — | $ | — | $ | — | $ | — | $ | — | $ | — | $ | — | $ | 0.1 | $ | — | ||||||||||||||||||
NSI Holdings, Inc. | $ | — | $ | — | $ | — | $ | — | $ | — | $ | — | $ | — | $ | — | $ | — | ||||||||||||||||||
Petroflow Energy Corporation and TexOak Petro Holdings LLC | $ | — | $ | 2.6 | $ | 1.8 | $ | 0.4 | $ | — | $ | — | $ | — | $ | 0.2 | $ | (4.8 | ) | |||||||||||||||||
PIH Corporation and Primrose Holding Corporation | $ | 17.0 | $ | 6.2 | $ | — | $ | — | $ | — | $ | 1.4 | $ | — | $ | — | $ | 7.0 | ||||||||||||||||||
Shock Doctor, Inc. and Shock Doctor Holdings, LLC | $ | — | $ | — | $ | — | $ | 10.7 | $ | — | $ | — | $ | 0.1 | $ | — | $ | (9.1 | ) | |||||||||||||||||
Things Remembered, Inc. and TRM Holdco Corp. | $ | 5.1 | $ | 5.0 | $ | 0.3 | $ | 0.1 | $ | — | $ | — | $ | 0.1 | $ | — | $ | (1.9 | ) | |||||||||||||||||
UL Holding Co., LLC | $ | — | $ | — | $ | — | $ | 3.3 | $ | — | $ | — | $ | — | $ | — | $ | 6.3 | ||||||||||||||||||
(8) | As defined in the Investment Company Act, the Company is deemed to be both an “Affiliated Person” and “Control” this portfolio company because it owns more than 25% of the portfolio company’s outstanding voting securities or it has the power to exercise control over the management or policies of such portfolio company (including through a management agreement). Transactions during the year ended December 31, 2017 in which the issuer was both an Affiliated Person and a portfolio company that the Company is deemed to Control are as follows: |
F-38
(in millions) Company | Purchases (cost) | Redemptions (cost) | Sales (cost) | Interest income | Capital structuring service fees | Dividend income | Other income | Net realized gains (losses) | Net unrealized gains (losses) | |||||||||||||||||||||||||||
10th Street, LLC and New 10th Street, LLC | $ | — | $ | 53.3 | $ | 0.6 | $ | 2.0 | $ | — | $ | — | $ | — | $ | 34.5 | $ | (34.7 | ) | |||||||||||||||||
ACAS 2007-1 CLO | $ | — | $ | — | $ | — | $ | — | $ | — | $ | — | $ | — | $ | — | $ | — | ||||||||||||||||||
ACAS Equity Holdings Corporation | $ | 0.5 | $ | — | $ | — | $ | — | $ | — | $ | — | $ | — | $ | — | $ | (0.1 | ) | |||||||||||||||||
ACAS Real Estate Holdings Corporation | $ | 2.6 | $ | — | $ | — | $ | — | $ | — | $ | — | $ | — | $ | — | $ | (0.5 | ) | |||||||||||||||||
ADF Capital, Inc., ADF Restaurant Group, LLC, and ARG Restaurant Holdings, Inc. | $ | — | $ | — | $ | — | $ | 0.6 | $ | — | $ | — | $ | 0.1 | $ | — | $ | (15.9 | ) | |||||||||||||||||
Alcami Holdings, LLC | $ | 273.1 | $ | 5.5 | $ | 0.3 | $ | 29.8 | $ | — | $ | — | $ | 2.1 | $ | — | $ | 166.8 | ||||||||||||||||||
AllBridge Financial, LLC | $ | — | $ | — | $ | — | $ | — | $ | — | $ | 0.4 | $ | — | $ | — | $ | (0.4 | ) | |||||||||||||||||
Ares IIIR/IVR CLO Ltd. | $ | — | $ | 5.2 | $ | — | $ | 0.4 | $ | — | $ | — | $ | — | $ | 0.5 | $ | 0.1 | ||||||||||||||||||
Bellotto Holdings Limited | $ | 193.6 | $ | 193.6 | $ | — | $ | — | $ | — | $ | — | $ | — | $ | 58.1 | $ | — | ||||||||||||||||||
Callidus Capital Corporation | $ | — | $ | — | $ | — | $ | — | $ | — | $ | — | $ | — | $ | — | $ | — | ||||||||||||||||||
Ciena Capital LLC | $ | — | $ | — | $ | 10.0 | $ | 0.8 | $ | — | $ | — | $ | — | $ | — | $ | 10.6 | ||||||||||||||||||
CoLTS 2005-1 | $ | — | $ | — | $ | — | $ | — | $ | — | $ | — | $ | — | $ | — | $ | — | ||||||||||||||||||
CoLTS 2005-2 | $ | — | $ | — | $ | — | $ | — | $ | — | $ | — | $ | — | $ | — | $ | — | ||||||||||||||||||
Columbo Midco Limited, Columbo Bidco Limited and Columbo Topco Limited | $ | 27.9 | $ | — | $ | — | $ | — | $ | — | $ | — | $ | — | $ | — | $ | 12.7 | ||||||||||||||||||
Community Education Centers, Inc. and CEC Parent Holdings LLC | $ | — | $ | 36.2 | $ | 38.1 | $ | 1.2 | $ | — | $ | 8.4 | $ | 0.1 | $ | 24.3 | $ | (10.9 | ) | |||||||||||||||||
Competitor Group, Inc., Calera XVI, LLC and Champion Parent Corporation | $ | 0.5 | $ | 18.6 | $ | 42.8 | $ | — | $ | — | $ | — | $ | — | $ | (20.1 | ) | $ | 17.3 | |||||||||||||||||
CSHM LLC | $ | — | $ | — | $ | — | $ | — | $ | — | $ | — | $ | — | $ | — | $ | — | ||||||||||||||||||
EDS Group | $ | 11.8 | $ | 12.1 | $ | — | $ | 0.4 | $ | — | $ | — | $ | — | $ | 3.3 | $ | 2.7 | ||||||||||||||||||
ETG Holdings, Inc. | $ | — | $ | — | $ | — | $ | — | $ | — | $ | — | $ | — | $ | — | $ | — | ||||||||||||||||||
European Capital Private Debt LP | $ | 97.9 | $ | 0.3 | $ | 97.7 | $ | — | $ | — | $ | — | $ | — | $ | 1.1 | $ | — | ||||||||||||||||||
European Capital UK SME Debt LP | $ | 46.8 | $ | 4.8 | $ | 0.8 | $ | — | $ | — | $ | — | $ | — | $ | 0.1 | $ | 0.6 | ||||||||||||||||||
Fashion Holding Luxembourg SCA (Modacin/Camaeiu) | $ | — | $ | — | $ | — | $ | — | $ | — | $ | — | $ | — | $ | — | $ | — | ||||||||||||||||||
FPI Holding Corporation | $ | 0.4 | $ | — | $ | — | $ | — | $ | — | $ | — | $ | — | $ | — | $ | (1.0 | ) | |||||||||||||||||
Garden Fresh Restaurant Corp. and GFRC Holdings LLC | $ | 14.6 | $ | 12.3 | $ | 18.9 | $ | 3.6 | $ | — | $ | — | $ | 0.2 | $ | — | $ | 2.0 | ||||||||||||||||||
Halex Holdings, Inc. | $ | 1.1 | $ | — | $ | — | $ | — | $ | — | $ | — | $ | — | $ | 2.4 | $ | (2.0 | ) | |||||||||||||||||
HALT Medical, Inc. | $ | 0.7 | $ | — | $ | 0.6 | $ | — | $ | — | $ | — | $ | — | $ | — | $ | — | ||||||||||||||||||
Hard 8 Games, LLC | $ | 9.4 | $ | — | $ | 9.4 | $ | — | $ | — | $ | — | $ | — | $ | 4.6 | $ | — | ||||||||||||||||||
HCI Equity, LLC | $ | — | $ | — | $ | — | $ | — | $ | — | $ | — | $ | — | $ | — | $ | — | ||||||||||||||||||
Imaging Business Machines, L.L.C. and Scanner Holdings Corporation | $ | 16.1 | $ | — | $ | — | $ | 2.4 | $ | — | $ | — | $ | 0.6 | $ | — | $ | 5.0 | ||||||||||||||||||
Ivy Hill Asset Management, L.P. | $ | 228.6 | $ | 155.5 | $ | — | $ | — | $ | — | $ | 40.0 | $ | — | $ | — | $ | 12.8 | ||||||||||||||||||
LLSC Holdings Corporation (dba Lawrence Merchandising Services) | $ | 19.2 | $ | — | $ | — | $ | — | $ | — | $ | — | $ | 0.2 | $ | — | $ | (1.0 | ) | |||||||||||||||||
Miles 33 (Finance) Limited | $ | 15.2 | $ | 1.5 | $ | 0.6 | $ | 2.0 | $ | — | $ | — | $ | — | $ | 0.2 | $ | 3.9 | ||||||||||||||||||
Montgomery Lane, LLC and Montgomery Lane, Ltd. | $ | 2.2 | $ | 2.3 | $ | — | $ | — | $ | — | $ | — | $ | — | $ | 1.1 | $ | 0.6 | ||||||||||||||||||
MVL Group, Inc. | $ | — | $ | 0.2 | $ | — | $ | — | $ | — | $ | — | $ | — | $ | 0.1 | $ | — | ||||||||||||||||||
Navisun LLC and Navisun Holdings LLC | $ | 2.9 | $ | — | $ | — | $ | — | $ | — | $ | — | $ | — | $ | — | $ | — | ||||||||||||||||||
NECCO Holdings, Inc. | $ | 60.4 | $ | 41.9 | $ | 7.1 | $ | — | $ | — | $ | — | $ | — | $ | — | $ | (1.3 | ) | |||||||||||||||||
NECCO Realty Investments LLC | $ | 32.7 | $ | 27.4 | $ | 6.4 | $ | 1.2 | $ | — | $ | — | $ | — | $ | 13.0 | $ | — | ||||||||||||||||||
Orion Foods, LLC | $ | — | $ | — | $ | — | $ | — | $ | — | $ | — | $ | — | $ | — | $ | — | ||||||||||||||||||
Pillar Processing LLC and PHL Investors, Inc. | $ | — | $ | — | $ | — | $ | — | $ | — | $ | — | $ | — | $ | — | $ | — | ||||||||||||||||||
Rug Doctor, LLC and RD Holdco Inc. | $ | 30.9 | $ | — | $ | — | $ | 1.9 | $ | — | $ | — | $ | — | $ | — | $ | (3.2 | ) | |||||||||||||||||
S Toys Holdings LLC (fka The Step2 Company, LLC) | $ | — | $ | — | $ | — | $ | — | $ | — | $ | — | $ | — | $ | 6.8 | $ | (5.7 | ) | |||||||||||||||||
Senior Direct Lending Program, LLC | $ | 221.4 | $ | 2.0 | $ | 2.1 | $ | 52.3 | $ | 9.1 | $ | — | $ | 1.5 | $ | — | $ | — | ||||||||||||||||||
Senior Secured Loan Fund LLC | $ | — | $ | 1,938.4 | $ | — | $ | 69.3 | $ | 0.9 | $ | — | $ | 4.5 | $ | (17.5 | ) | $ | 24.2 | |||||||||||||||||
Soil Safe, Inc. and Soil Safe Acquisition Corp. | $ | 110.6 | $ | 4.2 | $ | 1.0 | $ | 13.0 | $ | — | $ | — | $ | 0.1 | $ | — | $ | (7.6 | ) | |||||||||||||||||
Startec Equity, LLC | $ | — | $ | — | $ | — | $ | — | $ | — | $ | — | $ | — | $ | — | $ | — | ||||||||||||||||||
The Greeley Company, Inc. and HCP Acquisition Holdings, LLC | $ | — | $ | — | $ | 12.8 | $ | — | $ | — | $ | — | $ | — | $ | (12.3 | ) | $ | 12.4 | |||||||||||||||||
F-39
______________________________________________________________________
* | Together with Varagon Capital Partners (“Varagon”) and its clients, the Company has co-invested through the Senior Direct Lending Program LLC (d/b/a the “Senior Direct Lending Program” or the “SDLP”). The SDLP has been capitalized as transactions are completed and all portfolio decisions and generally all other decisions in respect of the SDLP must be approved by an investment committee of the SDLP consisting of representatives of the Company and Varagon (with approval from a representative of each required); therefore, although the Company owns more than 25% of the voting securities of the SDLP, the Company does not believe that it has control over the SDLP (for purposes of the Investment Company Act or otherwise) because, among other things, these “voting securities” do not afford the Company the right to elect directors of the SDLP or any other special rights (see Note 4 to the consolidated financial statements). |
(9) | Non-U.S. company or principal place of business outside the U.S. and as a result is not a qualifying asset under Section 55(a) of the Investment Company Act. Under the Investment Company Act, the Company may not acquire any non-qualifying asset unless, at the time such acquisition is made, qualifying assets represent at least 70% of the Company’s total assets. Pursuant to Section 55(a) of the Investment Company Act, 12% of the Company’s total assets are represented by investments at fair value and other assets that are considered “non-qualifying assets” as of December 31, 2017. |
(10) | Exception from the definition of investment company under Section 3(c) of the Investment Company Act and as a result is not a qualifying asset under Section 55(a) of the Investment Company Act. Under the Investment Company Act, the Company may not acquire any non-qualifying asset unless, at the time such acquisition is made, qualifying assets represent at least 70% of the Company’s total assets. |
(11) | Variable rate loans to the Company’s portfolio companies bear interest at a rate that may be determined by reference to either the London Interbank Offered Rate (“LIBOR”) or an alternate base rate (commonly based on the Federal Funds Rate or the Prime Rate), at the borrower’s option, which reset annually (A), semi-annually (S), quarterly (Q), bi-monthly (B), monthly (M) or daily (D). For each such loan, the Company has provided the interest rate in effect on the date presented. |
(12) | In addition to the interest earned based on the stated interest rate of this security, the Company is entitled to receive an additional interest amount of 1.75% on $63 aggregate principal amount of a “first out” tranche of the portfolio company’s senior term debt previously syndicated by the Company into “first out” and “last out” tranches, whereby the “first out” tranche will have priority as to the “last out” tranche with respect to payments of principal, interest and any other amounts due thereunder. |
(13) | In addition to the interest earned based on the stated interest rate of this security, the Company is entitled to receive an additional interest amount of 2.00% on $73 aggregate principal amount of a “first out” tranche of the portfolio company’s first lien senior secured loans, whereby the “first out” tranche will have priority as to the “last out” tranche with respect to payments of principal, interest and any other amounts due thereunder. |
(14) | The Company sold a participating interest of approximately $9 million of aggregate principal amount of the portfolio company’s second lien senior secured term loan as a “first out” tranche. As the transaction did not qualify as a “true sale” in accordance with U.S. generally accepted accounting principles, the Company recorded a corresponding $9 million secured borrowing included in “accounts payable and other liabilities” in the accompanying consolidated balance sheet.” |
(15) | The Company is entitled to receive a fixed fee upon the occurrence of certain events as defined in the credit agreement governing the Company’s debt investment in the portfolio company. The fair value of such fee is included in the fair value of the debt investment. |
(16) | Loan was on non-accrual status as of December 31, 2017. |
(17) | Loan includes interest rate floor feature. |
(18) | In addition to the interest earned based on the stated contractual interest rate of this security, the certificates entitle the holders thereof to receive a portion of the excess cash flow from the SDLP’s loan portfolio, after expenses, which may result in a return to the Company greater than the contractual stated interest rate. |
F-40
(19) | As of December 31, 2017, no amounts were funded by the Company under this first lien senior secured revolving loan; however, there were letters of credit issued and outstanding through a financial intermediary under the loan. See Note 7 to the consolidated financial statements for further information on letters of credit commitments related to certain portfolio companies. |
(20) | As of December 31, 2017, in addition to the amounts funded by the Company under this first lien senior secured revolving loan, there were also letters of credit issued and outstanding through a financial intermediary under the loan. See Note 7 to the consolidated financial statements for further information on letters of credit commitments related to certain portfolio companies. |
(21) | As of December 31, 2017, the Company had the following commitments to fund various revolving and delayed draw senior secured and subordinated loans, including commitments to issue letters of credit through a financial intermediary on behalf of certain portfolio companies. Such commitments are subject to the satisfaction of certain conditions set forth in the documents governing these loans and letters of credit and there can be no assurance that such conditions will be satisfied. See Note 7 to the consolidated financial statements for further information on revolving and delayed draw loan commitments, including commitments to issue letters of credit, related to certain portfolio companies. |
.
(in millions) Portfolio Company | Total revolving and delayed draw loan commitments | Less: drawn commitments | Total undrawn commitments | Less: commitments substantially at discretion of the Company | Less: unavailable commitments due to borrowing base or other covenant restrictions | Total net adjusted undrawn revolving and delayed draw commitments | ||||||||||||
A.U.L. Corp. | $ | 1.3 | $ | (0.4 | ) | $ | 0.9 | $ | — | $ | — | $ | 0.9 | |||||
Accruent, LLC, Accruent Holding, LLC and Athena Parent, Inc. | 9.9 | (0.7 | ) | 9.2 | — | — | 9.2 | |||||||||||
Achilles Acquisition LLC | 1.1 | — | 1.1 | — | — | 1.1 | ||||||||||||
ADCS Billings Intermediate Holdings, LLC | 5.0 | — | 5.0 | — | — | 5.0 | ||||||||||||
ADF Pizza I LLC | 1.3 | — | 1.3 | — | — | 1.3 | ||||||||||||
ADG, LLC | 13.7 | (11.5 | ) | 2.2 | — | — | 2.2 | |||||||||||
Alcami Holdings, LLC | 30.0 | (25.6 | ) | 4.4 | — | — | 4.4 | |||||||||||
American Academy Holdings, LLC | 7.0 | (0.9 | ) | 6.1 | — | — | 6.1 | |||||||||||
AMZ Holding Corp. | 3.4 | — | 3.4 | — | — | 3.4 | ||||||||||||
Bambino CI Inc. | 9.6 | (1.1 | ) | 8.5 | — | — | 8.5 | |||||||||||
Benihana, Inc. | 3.2 | (3.1 | ) | 0.1 | — | — | 0.1 | |||||||||||
Cadence Aerospace, LLC | 14.3 | (1.5 | ) | 12.8 | — | — | 12.8 | |||||||||||
CCS Intermediate Holdings, LLC and CCS Group Holdings, LLC | 7.5 | (6.4 | ) | 1.1 | — | — | 1.1 | |||||||||||
Chariot Acquisition, LLC | 1.0 | — | 1.0 | — | — | 1.0 | ||||||||||||
Chesapeake Research Review, LLC | 5.8 | (0.6 | ) | 5.2 | — | — | 5.2 | |||||||||||
Ciena Capital LLC | 20.0 | (14.0 | ) | 6.0 | (6.0 | ) | — | — | ||||||||||
Clearwater Analytics, LLC | 5.0 | (0.5 | ) | 4.5 | — | — | 4.5 | |||||||||||
Command Alkon Incorporated | 3.3 | (1.6 | ) | 1.7 | — | — | 1.7 | |||||||||||
Component Hardware Group, Inc | 3.7 | (1.9 | ) | 1.8 | — | — | 1.8 | |||||||||||
Cozzini Bros., Inc. and BH-Sharp Holdings LP | 16.0 | — | 16.0 | — | — | 16.0 | ||||||||||||
Crown Health Care Laundry Services, LLC and Crown Laundry Holdings, LLC | 5.0 | (2.6 | ) | 2.4 | — | — | 2.4 | |||||||||||
CST Buyer Company | 4.2 | — | 4.2 | — | — | 4.2 | ||||||||||||
D4C Dental Brands, Inc. | 5.0 | — | 5.0 | — | — | 5.0 | ||||||||||||
DCA Investment Holding, LLC | 5.8 | (0.1 | ) | 5.7 | — | — | 5.7 | |||||||||||
DecoPac, Inc. | 8.1 | (2.6 | ) | 5.5 | — | — | 5.5 | |||||||||||
DFC Global Facility Borrower II LLC | 40.0 | — | 40.0 | — | — | 40.0 | ||||||||||||
Dorner Holding Corp. | 3.3 | (1.3 | ) | 2.0 | — | — | 2.0 | |||||||||||
DRB Holdings, LLC | 9.9 | — | 9.9 | — | — | 9.9 | ||||||||||||
DTI Holdco, Inc. and OPE DTI Holdings, Inc. | 8.8 | — | 8.8 | — | — | 8.8 | ||||||||||||
Eckler Industries, Inc. | 4.0 | (2.0 | ) | 2.0 | (2.0 | ) | — | — | ||||||||||
Emergency Communications Network, LLC | 6.5 | — | 6.5 | — | — | 6.5 | ||||||||||||
Emerus Holdings, Inc. | 2.0 | (0.3 | ) | 1.7 | — | — | 1.7 | |||||||||||
EN Engineering, LLC | 5.0 | (1.2 | ) | 3.8 | — | — | 3.8 | |||||||||||
Entertainment Partners, LLC and Entertainment Partners Canada Inc. | 28.0 | — | 28.0 | — | — | 28.0 | ||||||||||||
F-41
(in millions) Portfolio Company | Total revolving and delayed draw loan commitments | Less: drawn commitments | Total undrawn commitments | Less: commitments substantially at discretion of the Company | Less: unavailable commitments due to borrowing base or other covenant restrictions | Total net adjusted undrawn revolving and delayed draw commitments | ||||||||||||
Foundation Risk Partners, Corp. | 19.9 | — | 19.9 | — | — | 19.9 | ||||||||||||
FPI Holding Corporation | 2.6 | — | 2.6 | — | — | 2.6 | ||||||||||||
Frontline Technologies Group Holding LLC | 8.4 | — | 8.4 | — | — | 8.4 | ||||||||||||
FWR Holding Corporation | 3.3 | (0.3 | ) | 3.0 | — | — | 3.0 | |||||||||||
Garden Fresh Restaurant Corp. | 7.5 | (2.9 | ) | 4.6 | — | — | 4.6 | |||||||||||
Gentle Communications, LLC | 5.0 | — | 5.0 | — | — | 5.0 | ||||||||||||
Global Franchise Group, LLC | 1.2 | — | 1.2 | — | — | 1.2 | ||||||||||||
GraphPAD Software, LLC | 1.1 | (0.6 | ) | 0.5 | — | — | 0.5 | |||||||||||
GTCR-Ultra Acquisition, Inc. and GTCR-Ultra Holdings, LLC | 2.0 | — | 2.0 | — | — | 2.0 | ||||||||||||
HAI Acquisition Corporation | 19.0 | (4.7 | ) | 14.3 | — | — | 14.3 | |||||||||||
Halex Holdings, Inc. | 2.0 | (1.1 | ) | 0.9 | — | — | 0.9 | |||||||||||
Harvey Tool Company, LLC | 35.5 | (1.8 | ) | 33.7 | — | — | 33.7 | |||||||||||
Hojeij Branded Foods, LLC | 2.9 | — | 2.9 | — | — | 2.9 | ||||||||||||
Hygiena Borrower LLC | 5.3 | — | 5.3 | — | — | 5.3 | ||||||||||||
Implementation Management Assistance, LLC | 24.1 | — | 24.1 | — | — | 24.1 | ||||||||||||
Infilaw Holdings, LLC | 11.5 | (11.5 | ) | — | — | — | — | |||||||||||
Instituto de Banca y Comercio, Inc. | 11.8 | (11.8 | ) | — | — | — | — | |||||||||||
iPipeline, Inc. | 4.0 | — | 4.0 | — | — | 4.0 | ||||||||||||
JDC Healthcare Management, LLC | 13.9 | (1.5 | ) | 12.4 | — | — | 12.4 | |||||||||||
Jim N Nicks Management, LLC | 9.7 | (1.7 | ) | 8.0 | — | — | 8.0 | |||||||||||
K2 Pure Solutions Nocal, L.P. | 5.0 | (1.5 | ) | 3.5 | — | — | 3.5 | |||||||||||
KBHS Acquisition, LLC (d/b/a Alita Care, LLC) | 5.0 | (1.8 | ) | 3.2 | — | — | 3.2 | |||||||||||
Key Surgical LLC | 2.8 | (0.9 | ) | 1.9 | — | — | 1.9 | |||||||||||
KHC Holdings, Inc. | 6.9 | (0.7 | ) | 6.2 | — | — | 6.2 | |||||||||||
Lakeland Tours, LLC | 1.9 | (1.9 | ) | — | — | — | — | |||||||||||
LBP Intermediate Holdings LLC | 0.9 | (0.1 | ) | 0.8 | — | — | 0.8 | |||||||||||
Liaison Acquisition, LLC | 3.9 | — | 3.9 | — | — | 3.9 | ||||||||||||
Massage Envy, LLC | 5.0 | (0.5 | ) | 4.5 | — | — | 4.5 | |||||||||||
Massage Envy, LLC and ME Equity LLC | 0.6 | — | 0.6 | — | — | 0.6 | ||||||||||||
MB2 Dental Solutions, LLC | 3.5 | (1.3 | ) | 2.2 | — | — | 2.2 | |||||||||||
McKenzie Sports Products, LLC | 4.5 | (0.9 | ) | 3.6 | — | — | 3.6 | |||||||||||
Ministry Brands, LLC | 19.5 | (10.9 | ) | 8.6 | — | — | 8.6 | |||||||||||
Movati Athletic (Group) Inc. | 2.8 | — | 2.8 | — | — | 2.8 | ||||||||||||
MSHC, Inc. | 9.8 | (0.1 | ) | 9.7 | — | — | 9.7 | |||||||||||
MW Dental Holding Corp. | 10.0 | (9.7 | ) | 0.3 | — | — | 0.3 | |||||||||||
Navisun LLC | 42.4 | — | 42.4 | — | — | 42.4 | ||||||||||||
NECCO Holdings, Inc. | 25.0 | (21.7 | ) | 3.3 | (3.3 | ) | — | — | ||||||||||
Niagara Fiber Intermediate Corp. | 1.2 | (0.9 | ) | 0.3 | — | — | 0.3 | |||||||||||
Nordco Inc. | 12.5 | — | 12.5 | — | — | 12.5 | ||||||||||||
NSM Sub Holdings Corp. | 5.0 | — | 5.0 | — | — | 5.0 | ||||||||||||
OmniSYS Acquisition Corporation, OmniSYS, LLC, and OSYS Holdings, LLC | 2.5 | — | 2.5 | — | — | 2.5 | ||||||||||||
Osmose Utilities Services, Inc. | 6.0 | (1.0 | ) | 5.0 | — | — | 5.0 | |||||||||||
OTG Management, LLC | 13.6 | (8.4 | ) | 5.2 | — | — | 5.2 | |||||||||||
Palermo Finance Corporation | 1.1 | (0.2 | ) | 0.9 | — | — | 0.9 | |||||||||||
Paper Source, Inc. | 3.3 | — | 3.3 | — | — | 3.3 | ||||||||||||
Pathway Partners Vet Management Company LLC | 2.4 | — | 2.4 | — | — | 2.4 | ||||||||||||
PDI TA Holdings, Inc. | 12.5 | (0.9 | ) | 11.6 | — | — | 11.6 | |||||||||||
Pegasus Intermediate Holdings, LLC | 5.0 | — | 5.0 | — | — | 5.0 | ||||||||||||
PIH Corporation and Primrose Holding Corporation | 3.3 | (1.0 | ) | 2.3 | — | — | 2.3 | |||||||||||
Practice Insight, LLC | 2.9 | (0.6 | ) | 2.3 | — | — | 2.3 | |||||||||||
QC Supply, LLC | 24.2 | (4.0 | ) | 20.2 | — | — | 20.2 | |||||||||||
Restaurant Technologies, Inc. | 5.4 | (1.1 | ) | 4.3 | — | — | 4.3 | |||||||||||
F-42
(in millions) Portfolio Company | Total revolving and delayed draw loan commitments | Less: drawn commitments | Total undrawn commitments | Less: commitments substantially at discretion of the Company | Less: unavailable commitments due to borrowing base or other covenant restrictions | Total net adjusted undrawn revolving and delayed draw commitments | ||||||||||||
Retriever Medical/Dental Payments LLC | 3.5 | — | 3.5 | — | — | 3.5 | ||||||||||||
RuffaloCODY, LLC | 7.7 | (0.2 | ) | 7.5 | — | — | 7.5 | |||||||||||
Sanders Industries Holdings, Inc. | 15.0 | — | 15.0 | — | — | 15.0 | ||||||||||||
SCM Insurance Services Inc. | 4.3 | — | 4.3 | — | — | 4.3 | ||||||||||||
SCSG EA Acquisition Company, Inc. | 4.0 | — | 4.0 | — | — | 4.0 | ||||||||||||
Severin Acquisition, LLC | 2.9 | — | 2.9 | — | — | 2.9 | ||||||||||||
SFE Intermediate Holdco LLC | 3.8 | (0.8 | ) | 3.0 | — | — | 3.0 | |||||||||||
Shift PPC LLC | 3.6 | — | 3.6 | — | — | 3.6 | ||||||||||||
Sigma Electric Manufacturing Corporation | 10.0 | (1.5 | ) | 8.5 | — | — | 8.5 | |||||||||||
Soil Safe, Inc. and Soil Safe Acquisition Corp. | 10.5 | (4.6 | ) | 5.9 | — | — | 5.9 | |||||||||||
Sonny's Enterprises, LLC | 1.8 | (1.0 | ) | 0.8 | — | — | 0.8 | |||||||||||
Sparta Systems, Inc. | 6.5 | — | 6.5 | — | — | 6.5 | ||||||||||||
Storm UK Holdco Limited and Storm US Holdco Inc. | 1.1 | (0.1 | ) | 1.0 | — | — | 1.0 | |||||||||||
Teasdale Foods, Inc. | 0.8 | (0.4 | ) | 0.4 | — | — | 0.4 | |||||||||||
The Gordian Group, Inc. | 1.1 | — | 1.1 | — | — | 1.1 | ||||||||||||
Things Remembered, Inc. | 2.4 | — | 2.4 | — | — | 2.4 | ||||||||||||
Towne Holdings, Inc. | 1.0 | — | 1.0 | — | — | 1.0 | ||||||||||||
TPTM Merger Corp. | 2.5 | — | 2.5 | — | — | 2.5 | ||||||||||||
Urgent Cares of America Holdings I, LLC | 10.0 | — | 10.0 | — | — | 10.0 | ||||||||||||
VistaPharm, Inc. | 2.5 | — | 2.5 | — | — | 2.5 | ||||||||||||
VLS Recovery Services, LLC | 22.1 | (1.8 | ) | 20.3 | — | — | 20.3 | |||||||||||
VRC Companies, LLC | 1.9 | (0.8 | ) | 1.1 | — | — | 1.1 | |||||||||||
Woodstream Group, Inc. and Woodstream Corporation | 4.7 | — | 4.7 | — | — | 4.7 | ||||||||||||
Wrench Group LLC | 4.6 | — | 4.6 | — | — | 4.6 | ||||||||||||
Zemax, LLC | 3.0 | — | 3.0 | — | — | 3.0 | ||||||||||||
Zywave, Inc. | 11.4 | (2.4 | ) | 9.0 | — | — | 9.0 | |||||||||||
$ | 881.5 | $ | (201.5 | ) | $ | 680.0 | $ | (11.3 | ) | $ | — | $ | 668.7 | |||||
(22) | As of December 31, 2017, the Company was party to subscription agreements to fund equity investments in private equity investment partnerships as follows: |
(in millions) Company | Total private equity commitments | Less: funded private equity commitments | Total unfunded private equity commitments | Less: private equity commitments substantially at the discretion of the Company | Total net adjusted unfunded private equity commitments | ||||||||||
Partnership Capital Growth Investors III, L.P. | $ | 5.0 | $ | (4.5 | ) | $ | 0.5 | $ | — | $ | 0.5 | ||||
PCG-Ares Sidecar Investment, L.P. and PCG-Ares Sidecar Investment II, L.P. | 50.0 | (12.1 | ) | 37.9 | (37.9 | ) | — | ||||||||
Piper Jaffray Merchant Banking Fund I, L.P. | 2.0 | (1.8 | ) | 0.2 | — | 0.2 | |||||||||
European Capital UK SME Debt LP | 54.0 | (44.0 | ) | 10.0 | (10.0 | ) | — | ||||||||
$ | 111.0 | $ | (62.4 | ) | $ | 48.6 | $ | (47.9 | ) | $ | 0.7 | ||||
(23) | As of December 31, 2017, the Company had commitments to co-invest in the SDLP for its portion of the SDLP’s commitment to fund delayed draw loans of up to $19. See Note 4 to the consolidated financial statements for more information on the SDLP. |
(24) | Other than the investments noted by this footnote, the fair value of the Company’s investments is determined using unobservable inputs that are significant to the overall fair value measurement. See Note 8 to the consolidated financial statements for more information regarding the fair value of the Company’s investments. |
(25) | As of December 31, 2017, the net estimated unrealized loss for federal tax purposes was $0.8 billion based on a tax cost basis of $12.7 billion. As of December 31, 2017, the estimated aggregate gross unrealized loss for federal income tax purposes was $1.3 billion and the estimated aggregate gross unrealized gain for federal income tax purposes was $0.5 billion. |
F-43
ARES CAPITAL CORPORATION AND SUBSIDIARIES
CONSOLIDATED SCHEDULE OF INVESTMENTS
As of December 31, 2016
(dollar amounts in millions)
Company(1) | Business Description | Investment | Interest(6)(12) | Acquisition Date | Amortized Cost | Fair Value | Percentage of Net Assets | ||||||||||||
Investment Funds and Vehicles | |||||||||||||||||||
HCI Equity, LLC (8)(9)(10) | Investment company | Member interest (100.00% interest) | 4/1/2010 | $ | — | $ | 0.1 | ||||||||||||
Imperial Capital Private Opportunities, LP (10)(25) | Investment partnership | Limited partnership interest (80.00% interest) | 5/10/2007 | 4.0 | 16.8 | (2) | |||||||||||||
Partnership Capital Growth Fund I, L.P. (10) | Investment partnership | Limited partnership interest (25.00% interest) | 6/16/2006 | — | 0.1 | (2) | |||||||||||||
Partnership Capital Growth Investors III, L.P. (10)(25) | Investment partnership | Limited partnership interest (2.50% interest) | 10/5/2011 | 2.7 | 3.2 | (2) | |||||||||||||
PCG-Ares Sidecar Investment II, L.P. (10)(25) | Investment partnership | Limited partnership interest (100.00% interest) | 10/31/2014 | 7.5 | 12.5 | (2) | |||||||||||||
PCG-Ares Sidecar Investment, L.P. (10)(25) | Investment partnership | Limited partnership interest (100.00% interest) | 5/22/2014 | 3.4 | 4.2 | (2) | |||||||||||||
Piper Jaffray Merchant Banking Fund I, L.P. (10)(25) | Investment partnership | Limited partnership interest (2.00% interest) | 8/16/2012 | 1.7 | 1.5 | ||||||||||||||
Senior Direct Lending Program, LLC (8)(10)(27) | Co-investment vehicle | Subordinated certificates ($269.8 par due 12/2036)(21) | 9.00% (Libor + 8.00%/Q) (21) | 7/27/2016 | 269.8 | 269.8 | |||||||||||||
Member interest (87.50% interest) | 7/27/2016 | — | — | ||||||||||||||||
269.8 | 269.8 | ||||||||||||||||||
Senior Secured Loan Fund LLC (8)(11)(26) | Co-investment vehicle | Subordinated certificates ($2,004.0 par due 12/2024)(20) | 9.00% (Libor + 8.00%/M) (20) | 10/30/2009 | 1,938.4 | 1,914.2 | |||||||||||||
Member interest (87.50% interest) | 10/30/2009 | — | — | ||||||||||||||||
1,938.4 | 1,914.2 | ||||||||||||||||||
VSC Investors LLC (10) | Investment company | Membership interest (1.95% interest) | 1/24/2008 | 0.3 | 1.2 | (2) | |||||||||||||
2,227.8 | 2,223.6 | 43.05 | % | ||||||||||||||||
Healthcare Services | |||||||||||||||||||
Absolute Dental Management LLC and ADM Equity, LLC | Dental services provider | First lien senior secured loan ($18.8 par due 1/2022) | 9.06% (Libor + 8.06%/Q) | 1/5/2016 | 18.8 | 17.8 | (3)(19) | ||||||||||||
First lien senior secured loan ($5.0 par due 1/2022) | 9.06% (Libor + 8.06%/Q) | 1/5/2016 | 5.0 | 4.8 | (4)(19) | ||||||||||||||
Class A preferred units (4,000,000 units) | 1/5/2016 | 4.0 | 0.8 | (2) | |||||||||||||||
Class A common units (4,000,000 units) | 1/5/2016 | — | 0.8 | (2) | |||||||||||||||
27.8 | 24.2 | ||||||||||||||||||
ADCS Billings Intermediate Holdings, LLC (24) | Dermatology practice | First lien senior secured revolving loan ($1.6 par due 5/2022) | 8.50% (Base Rate + 4.75%/Q) | 5/18/2016 | 1.6 | 1.6 | (2)(19)(23) | ||||||||||||
ADG, LLC and RC IV GEDC Investor LLC (24) | Dental services provider | First lien senior secured revolving loan ($2.0 par due 9/2022) | 5.75% (Libor + 4.75%/Q) | 9/28/2016 | 2.0 | 2.0 | (2)(19) | ||||||||||||
Second lien senior secured loan ($87.5 par due 3/2024) | 10.00% (Libor + 9.00%/Q) | 9/28/2016 | 87.5 | 87.5 | (2)(19) | ||||||||||||||
Membership units (3,000,000 units) | 9/28/2016 | 3.0 | 3.0 | (2) | |||||||||||||||
92.5 | 92.5 | ||||||||||||||||||
Alegeus Technologies Holdings Corp. | Benefits administration and transaction processing provider | Preferred stock (2,997 shares) | 12/13/2013 | 3.1 | 2.2 | ||||||||||||||
Common stock (3 shares) | 12/13/2013 | — | — | ||||||||||||||||
3.1 | 2.2 | ||||||||||||||||||
Argon Medical Devices, Inc. | Manufacturer and marketer of single-use specialty medical devices | Second lien senior secured loan ($9.0 par due 6/2022) | 10.50% (Libor + 9.50%/Q) | 12/23/2015 | 8.8 | 9.0 | (2)(19) | ||||||||||||
AwarePoint Corporation | Healthcare technology platform developer | First lien senior secured loan ($8.8 par due 6/2018) | 11.50% (Libor + 10.50%/M) | 9/5/2014 | 8.6 | 8.8 | (2)(19) | ||||||||||||
Warrant to purchase up to 3,213,367 shares of Series 1 preferred stock (expires 9/2024) | 11/14/2014 | — | 0.6 | (2) | |||||||||||||||
8.6 | 9.4 | ||||||||||||||||||
CCS Intermediate Holdings, LLC and CCS Group Holdings, LLC (24) | Correctional facility healthcare operator | First lien senior secured revolving loan ($3.8 par due 7/2019) | 5.00% (Libor + 4.00%/Q) | 7/23/2014 | 3.8 | 3.2 | (2)(19)(23) | ||||||||||||
F-44
As of December 31, 2016
(dollar amounts in millions)
Company(1) | Business Description | Investment | Interest(6)(12) | Acquisition Date | Amortized Cost | Fair Value | Percentage of Net Assets | ||||||||||||
First lien senior secured revolving loan ($1.6 par due 7/2019) | 6.75% (Base Rate + 3.00%/Q) | 7/23/2014 | 1.6 | 1.4 | (2)(19)(23) | ||||||||||||||
First lien senior secured loan ($6.6 par due 7/2021) | 5.00% (Libor + 4.00%/Q) | 7/23/2014 | 6.6 | 5.6 | (2)(19) | ||||||||||||||
Second lien senior secured loan ($135.0 par due 7/2022) | 9.38% (Libor + 8.38%/Q) | 7/23/2014 | 134.0 | 101.3 | (2)(19) | ||||||||||||||
Class A units (601,937 units) | 8/19/2010 | — | 0.1 | (2) | |||||||||||||||
146.0 | 111.6 | ||||||||||||||||||
Correctional Medical Group Companies, Inc. | Correctional facility healthcare operator | First lien senior secured loan ($3.1 par due 9/2021) | 9.38% (Libor + 8.38%/Q) | 9/29/2015 | 3.1 | 3.0 | (2)(19) | ||||||||||||
First lien senior secured loan ($48.8 par due 9/2021) | 9.38% (Libor + 8.38%/Q) | 9/29/2015 | 48.8 | 47.8 | (3)(19) | ||||||||||||||
51.9 | 50.8 | ||||||||||||||||||
D4C Dental Brands HoldCo, Inc. and Bambino Group Holdings, LLC (24) | Dental services provider | Class A preferred units (1,000,000 units) | 12/21/2016 | 1.0 | 1.0 | (2) | |||||||||||||
DCA Investment Holding, LLC (24) | Multi-branded dental practice management | First lien senior secured revolving loan ($2.1 par due 7/2021) | 8.00% (Base Rate + 4.25%/Q) | 7/2/2015 | 2.1 | 2.0 | (2)(19)(23) | ||||||||||||
First lien senior secured loan ($18.9 par due 7/2021) | 6.25% (Libor + 5.25%/Q) | 7/2/2015 | 18.8 | 18.5 | (4)(19) | ||||||||||||||
20.9 | 20.5 | ||||||||||||||||||
DNAnexus, Inc. | Bioinformatics company | First lien senior secured loan ($9.7 par due 10/2018) | 9.25% (Libor + 8.25%/M) | 3/21/2014 | 9.5 | 9.7 | (2)(19) | ||||||||||||
Warrant to purchase up to 909,092 units of Series C preferred stock (expires 3/2024) | 3/21/2014 | — | 0.1 | (2) | |||||||||||||||
9.5 | 9.8 | ||||||||||||||||||
Global Healthcare Exchange, LLC and GHX Ultimate Parent Corp. | On-demand supply chain automation solutions provider | Second lien senior secured loan ($47.5 par due 8/2023) | 9.75% (Libor + 8.75%/Q) | 8/18/2016 | 46.8 | 47.5 | (2)(19) | ||||||||||||
Class A common stock (1,788 shares) | 3/11/2014 | 1.8 | 1.8 | (2) | |||||||||||||||
Class B common stock (980 shares) | 3/11/2014 | — | 5.5 | (2) | |||||||||||||||
48.6 | 54.8 | ||||||||||||||||||
Greenphire, Inc. and RMCF III CIV XXIX, L.P (24) | Software provider for clinical trial management | First lien senior secured loan ($1.5 par due 12/2018) | 9.00% (Libor + 8.00%/M) | 12/19/2014 | 1.5 | 1.5 | (2)(19) | ||||||||||||
First lien senior secured loan ($3.6 par due 12/2018) | 9.00% (Libor + 8.00%/M) | 12/19/2014 | 3.6 | 3.6 | (2)(19) | ||||||||||||||
Limited partnership interest (99.90% interest) | 12/19/2014 | 1.0 | 1.2 | (2) | |||||||||||||||
6.1 | 6.3 | ||||||||||||||||||
Hygiena Borrower LLC (24) | Adenosine triphosphate testing technology provider | Second lien senior secured loan ($10.0 par due 8/2023) | 10.00% (Libor + 9.00%/Q) | 8/26/2016 | 10.0 | 10.0 | (2)(19) | ||||||||||||
INC Research Mezzanine Co-Invest, LLC | Pharmaceutical and biotechnology consulting services | Common stock (13,252 shares) | 9/27/2010 | — | 0.7 | (2) | |||||||||||||
Intermedix Corporation | Revenue cycle management provider to the emergency healthcare industry | Second lien senior secured loan ($112.0 par due 6/2020) | 9.25% (Libor + 8.25%/Q) | 12/27/2012 | 112.0 | 108.6 | (2)(19) | ||||||||||||
MC Acquisition Holdings I, LLC | Healthcare professional provider | Class A units (1,338,314 shares) | 1/17/2014 | 1.3 | 1.2 | (2) | |||||||||||||
MW Dental Holding Corp. (24) | Dental services provider | First lien senior secured revolving loan ($1.5 par due 4/2018) | 9.00% (Libor + 7.50%/Q) | 4/12/2011 | 1.5 | 1.5 | (2)(19) | ||||||||||||
First lien senior secured loan ($44.9 par due 4/2018) | 9.00% (Libor + 7.50%/Q) | 4/12/2011 | 44.9 | 44.9 | (2)(19) | ||||||||||||||
First lien senior secured loan ($47.3 par due 4/2018) | 9.00% (Libor + 7.50%/Q) | 4/12/2011 | 47.3 | 47.3 | (3)(19) | ||||||||||||||
First lien senior secured loan ($19.5 par due 4/2018) | 9.00% (Libor + 7.50%/Q) | 4/12/2011 | 19.5 | 19.5 | (4)(19) | ||||||||||||||
113.2 | 113.2 | ||||||||||||||||||
F-45
As of December 31, 2016
(dollar amounts in millions)
Company(1) | Business Description | Investment | Interest(6)(12) | Acquisition Date | Amortized Cost | Fair Value | Percentage of Net Assets | ||||||||||||
My Health Direct, Inc. (24) | Healthcare scheduling exchange software solution provider | First lien senior secured revolving loan ($0.5 par due 9/2017) | 8.75% (Base Rate + 5.00%/M) | 9/18/2014 | 0.5 | 0.5 | (2)(19) | ||||||||||||
First lien senior secured loan ($1.3 par due 1/2018) | 10.75% | 9/18/2014 | 1.3 | 1.3 | (2) | ||||||||||||||
Warrant to purchase up to 4,548 shares of Series D preferred stock (expires 9/2024) | 9/18/2014 | — | — | (2) | |||||||||||||||
1.8 | 1.8 | ||||||||||||||||||
New Trident Holdcorp, Inc. | Outsourced mobile diagnostic healthcare service provider | Second lien senior secured loan ($80.0 par due 7/2020) | 10.75% (Libor + 9.50%/Q) | 8/6/2013 | 79.1 | 80.0 | (2)(19) | ||||||||||||
NMSC Holdings, Inc. and ASP NAPA Holdings, LLC | Anesthesia management services provider | Second lien senior secured loan ($72.8 par due 10/2023) | 11.00% (Libor + 10.00%/Q) | 4/19/2016 | 72.8 | 72.8 | (2)(19) | ||||||||||||
Class A units (25,277 units) | 4/19/2016 | 2.5 | 2.4 | (2) | |||||||||||||||
75.3 | 75.2 | ||||||||||||||||||
Nodality, Inc. | Biotechnology company | First lien senior secured loan ($2.3 par due 8/2016) | 11/12/2015 | 2.1 | 0.4 | (2)(18) | |||||||||||||
First lien senior secured loan ($10.9 par due 8/2016) | 4/25/2014 | 9.7 | 2.0 | (2)(18) | |||||||||||||||
Warrant to purchase up to 3,736,255 shares of common stock (expires 3/2026) | 3/15/2016 | — | — | (2) | |||||||||||||||
11.8 | 2.4 | ||||||||||||||||||
NSM Sub Holdings Corp. (24) | Provider of customized mobility, rehab and adaptive seating systems | First lien senior secured revolving loan ($0.6 par due 10/2022) | 6.00% (Libor + 5.00%/Q) | 10/3/2016 | 0.6 | 0.6 | (2)(19) | ||||||||||||
First lien senior secured revolving loan ($0.3 par due 10/2022) | 7.75% (Base Rate + 4.00%/Q) | 10/3/2016 | 0.3 | 0.3 | (2)(19) | ||||||||||||||
0.9 | 0.9 | ||||||||||||||||||
nThrive, Inc. (fka Precyse Acquisition Corp.) | Provider of healthcare information management technology and services | Second lien senior secured loan ($10.0 par due 4/2023) | 10.75% (Libor + 9.75%/Q) | 4/20/2016 | 9.6 | 10.0 | (2)(19) | ||||||||||||
OmniSYS Acquisition Corporation, OmniSYS, LLC, and OSYS Holdings, LLC (24) | Provider of technology-enabled solutions to pharmacies | First lien senior secured loan ($5.9 par due 11/2018) | 8.50% (Libor + 7.50%/Q) | 11/21/2013 | 5.9 | 5.9 | (4)(19) | ||||||||||||
Limited liability company membership interest (1.57%) | 11/21/2013 | 1.0 | 0.7 | (2) | |||||||||||||||
6.9 | 6.6 | ||||||||||||||||||
Patterson Medical Supply, Inc. | Distributor of rehabilitation supplies and equipment | Second lien senior secured loan ($78.0 par due 8/2023) | 9.50% (Libor + 8.50%/Q) | 9/2/2015 | 76.1 | 78.0 | (2)(19) | ||||||||||||
PerfectServe, Inc. | Communications software platform provider for hospitals and physician practices | First lien senior secured loan ($9.0 par due 3/2020) | 9.00% (Libor + 8.00%/M) | 9/15/2015 | 8.7 | 9.0 | (2)(19) | ||||||||||||
First lien senior secured loan ($2.0 par due 6/2020) | 9.00% (Libor + 8.00%/M) | 9/15/2015 | 2.0 | 2.0 | (2)(19) | ||||||||||||||
First lien senior secured loan ($3.0 par due 6/2021) | 9.00% (Libor + 8.00%/M) | 9/15/2015 | 3.0 | 3.0 | (2)(19) | ||||||||||||||
Warrant to purchase up to 28,428 shares of Series C preferred stock (expires 9/2025) | 9/15/2015 | 0.2 | 0.3 | (2) | |||||||||||||||
Warrant to purchase up to 34,113 units of Series C preferred stock (expires 12/2023) | 12/26/2013 | — | 0.3 | (2) | |||||||||||||||
13.9 | 14.6 | ||||||||||||||||||
PhyMED Management LLC | Provider of anesthesia services | Second lien senior secured loan ($47.2 par due 5/2021) | 9.75% (Libor + 8.75%/Q) | 12/18/2015 | 46.6 | 45.8 | (2)(19) | ||||||||||||
Respicardia, Inc. | Developer of implantable therapies to improve cardiovascular health | Warrant to purchase up to 99,094 shares of Series C preferred stock (expires 6/2022) | 6/28/2012 | — | — | (2) | |||||||||||||
Sarnova HC, LLC, Tri-Anim Health Services, Inc., and BEMS Holdings, LLC | Distributor of emergency medical service and respiratory products | Second lien senior secured loan ($54.0 par due 7/2022) | 10.50% (Libor + 9.50%/Q) | 1/29/2016 | 54.0 | 54.0 | (2)(19) | ||||||||||||
F-46
As of December 31, 2016
(dollar amounts in millions)
Company(1) | Business Description | Investment | Interest(6)(12) | Acquisition Date | Amortized Cost | Fair Value | Percentage of Net Assets | ||||||||||||
Transaction Data Systems, Inc. | Pharmacy management software provider | Second lien senior secured loan ($7.8 par due 6/2022) | 10.00% (Libor + 9.00%/Q) | 6/15/2015 | 7.8 | 7.8 | (2)(19) | ||||||||||||
Second lien senior secured loan ($27.5 par due 6/2022) | 10.00% (Libor + 9.00%/Q) | 6/15/2015 | 27.5 | 27.5 | (2)(19) | ||||||||||||||
35.3 | 35.3 | ||||||||||||||||||
U.S. Anesthesia Partners, Inc. | Anesthesiology service provider | Second lien senior secured loan ($23.5 par due 9/2020) | 10.25% (Libor + 9.25%/Q) | 12/14/2015 | 23.5 | 23.5 | (2)(19) | ||||||||||||
Second lien senior secured loan ($50.0 par due 9/2020) | 10.25% (Libor + 9.25%/Q) | 9/24/2014 | 50.0 | 50.0 | (2)(19) | ||||||||||||||
73.5 | 73.5 | ||||||||||||||||||
Urgent Cares of America Holdings I, LLC and FastMed Holdings I, LLC (24) | Operator of urgent care clinics | First lien senior secured loan ($13.9 par due 12/2022) | 7.00% (Libor + 6.00%/Q) | 12/1/2015 | 13.9 | 12.6 | (2)(19) | ||||||||||||
First lien senior secured loan ($54.2 par due 12/2022) | 7.00% (Libor + 6.00%/Q) | 12/1/2015 | 54.2 | 49.3 | (2)(19) | ||||||||||||||
Preferred units (7,696,613 units) | 6/11/2015 | 7.7 | 9.4 | ||||||||||||||||
Series A common units (2,000,000 units) | 6/11/2015 | 2.0 | 0.1 | ||||||||||||||||
Series C common units (1,026,866 units) | 6/11/2015 | — | — | ||||||||||||||||
77.8 | 71.4 | ||||||||||||||||||
Vertice Pharma UK Parent Limited | Manufacturer and distributor of generic pharmaceutical products | Preferred shares (40,662 shares) | 12/21/2015 | 0.4 | 0.4 | (9) | |||||||||||||
Young Innovations, Inc. | Dental supplies and equipment manufacturer | Second lien senior secured loan ($31.4 par due 7/2019) | 10.25% (Libor + 9.25%/Q) | 10/18/2016 | 31.4 | 31.4 | (2)(19) | ||||||||||||
Second lien senior secured loan ($55.0 par due 7/2019) | 10.25% (Libor + 9.25%/Q) | 5/30/2014 | 55.0 | 55.0 | (2)(19) | ||||||||||||||
86.4 | 86.4 | ||||||||||||||||||
1,312.3 | 1,263.7 | 24.47 | % | ||||||||||||||||
Business Services | |||||||||||||||||||
Accruent, LLC and Athena Parent, Inc. (24) | Real estate and facilities management software provider | First lien senior secured revolving loan ($0.3 par due 5/2022) | 8.00% (Base Rate + 4.25%/Q) | 5/16/2016 | 0.3 | 0.3 | (2)(19) | ||||||||||||
Second lien senior secured loan ($10.5 par due 11/2022) | 12.50% (Base Rate + 8.75%/Q) | 9/19/2016 | 10.5 | 10.5 | (2)(19) | ||||||||||||||
Second lien senior secured loan ($42.5 par due 11/2022) | 10.75% (Libor + 9.75%/Q) | 9/19/2016 | 42.5 | 42.5 | (2)(19) | ||||||||||||||
Series A preferred stock (778 shares) | 9/19/2016 | 0.8 | 0.8 | (2) | |||||||||||||||
Common stock (3,000 shares) | 5/16/2016 | 3.0 | 3.1 | (2) | |||||||||||||||
57.1 | 57.2 | ||||||||||||||||||
Acrisure, LLC, Acrisure Investors FO, LLC and Acrisure Investors SO, LLC (24) | Retail insurance advisor and brokerage | Second lien senior secured loan ($88.6 par due 11/2024) | 10.25% (Libor + 9.25%/Q) | 11/22/2016 | 88.6 | 88.6 | (2)(19) | ||||||||||||
Membership interests (8,502,697 units) | 11/18/2016 | 8.5 | 8.5 | (2) | |||||||||||||||
Membership interests (2,125,674 units) | 11/18/2016 | 2.1 | 2.1 | (2) | |||||||||||||||
99.2 | 99.2 | ||||||||||||||||||
Brandtone Holdings Limited (9) | Mobile communications and marketing services provider | First lien senior secured loan ($4.7 par due 11/2018) | 5/11/2015 | 4.5 | — | (2)(18) | |||||||||||||
First lien senior secured loan ($3.1 par due 2/2019) | 5/11/2015 | 3.0 | — | (2)(18) | |||||||||||||||
Warrant to purchase up to 184,003 units of Series Three participating convertible preferred shares (expires 8/2026) | 5/11/2015 | — | — | (2) | |||||||||||||||
7.5 | — | ||||||||||||||||||
CallMiner, Inc. | Provider of cloud-based conversational analytics solutions | Second lien senior secured loan ($2.1 par due 5/2018) | 10.50% (Libor + 9.50%/M) | 7/23/2014 | 2.1 | 2.1 | (2)(19) | ||||||||||||
F-47
As of December 31, 2016
(dollar amounts in millions)
Company(1) | Business Description | Investment | Interest(6)(12) | Acquisition Date | Amortized Cost | Fair Value | Percentage of Net Assets | ||||||||||||
Second lien senior secured loan ($1.2 par due 8/2018) | 10.50% (Libor + 9.50%/M) | 7/23/2014 | 1.2 | 1.2 | (2)(19) | ||||||||||||||
Warrant to purchase up to 2,350,636 shares of Series 1 preferred stock (expires 7/2024) | 7/23/2014 | — | — | (2) | |||||||||||||||
3.3 | 3.3 | ||||||||||||||||||
CIBT Investment Holdings, LLC | Expedited travel document processing services | Class A shares (2,500 shares) | 12/15/2011 | 2.5 | 5.9 | (2) | |||||||||||||
CMW Parent LLC (fka Black Arrow, Inc.) | Multiplatform media firm | Series A units (32 units) | 9/11/2015 | — | — | (2) | |||||||||||||
Command Alkon, Incorporated and CA Note Issuer, LLC | Software solutions provider to the ready-mix concrete industry | Second lien senior secured loan ($10.0 par due 8/2020) | 9.25% (Libor + 8.25%/Q) | 9/28/2012 | 10.0 | 10.0 | (2)(19) | ||||||||||||
Second lien senior secured loan ($11.5 par due 8/2020) | 9.44% (Libor + 8.25%/Q) | 9/28/2012 | 11.5 | 11.5 | (2)(19) | ||||||||||||||
Second lien senior secured loan ($26.5 par due 8/2020) | 9.25% (Libor + 8.25%/Q) | 9/28/2012 | 26.5 | 26.5 | (2)(19) | ||||||||||||||
Senior subordinated loan ($23.3 par due 8/2021) | 14.00% PIK | 8/8/2014 | 23.3 | 23.3 | (2) | ||||||||||||||
71.3 | 71.3 | ||||||||||||||||||
Compuware Parent, LLC | Web and mobile cloud performance testing and monitoring services provider | Class A-1 common stock (4,132 units) | 12/15/2014 | 2.3 | 2.0 | (2) | |||||||||||||
Class B-1 common stock (4,132 units) | 12/15/2014 | 0.5 | 0.4 | (2) | |||||||||||||||
Class C-1 common stock (4,132 units) | 12/15/2014 | 0.3 | 0.3 | (2) | |||||||||||||||
Class A-2 common stock (4,132 units) | 12/15/2014 | — | — | (2) | |||||||||||||||
Class B-2 common stock (4,132 units) | 12/15/2014 | — | — | (2) | |||||||||||||||
Class C-2 common stock (4,132 units) | 12/15/2014 | — | — | (2) | |||||||||||||||
3.1 | 2.7 | ||||||||||||||||||
Directworks, Inc. and Co-Exprise Holdings, Inc. | Provider of cloud-based software solutions for direct materials sourcing and supplier management for manufacturers | First lien senior secured loan ($1.9 par due 4/2018) | 10.25% (Libor + 9.25%/M) | 12/19/2014 | 1.9 | 1.7 | (2)(19) | ||||||||||||
Warrant to purchase up to 1,875,000 shares of Series 1 preferred stock (expires 12/2024) | 12/19/2014 | — | — | (2) | |||||||||||||||
1.9 | 1.7 | ||||||||||||||||||
DTI Holdco, Inc. and OPE DTI Holdings, Inc. (24) | Provider of legal process outsourcing and managed services | First lien senior secured loan ($4.2 par due 9/2023) | 6.25% (Libor + 5.25%/Q) | 9/23/2016 | 4.1 | 4.1 | (2)(19) | ||||||||||||
Class A common stock (7,500 shares) | 8/19/2014 | 7.5 | 3.8 | (2) | |||||||||||||||
Class B common stock (7,500 shares) | 8/19/2014 | — | 3.8 | (2) | |||||||||||||||
11.6 | 11.7 | ||||||||||||||||||
Faction Holdings, Inc. and The Faction Group LLC (fka PeakColo Holdings, Inc.) (24) | Wholesaler of cloud-based software applications and services | First lien senior secured revolving loan ($2.0 par due 11/2017) | 8.00% (Base Rate + 4.25%/M) | 11/3/2014 | 2.0 | 2.0 | (2)(19) | ||||||||||||
First lien senior secured loan ($3.0 par due 12/2019) | 9.75% (Libor + 8.75%/M) | 12/3/2015 | 3.0 | 3.0 | (2)(19) | ||||||||||||||
First lien senior secured loan ($3.2 par due 5/2019) | 9.75% (Libor + 8.75%/M) | 11/3/2014 | 3.2 | 3.2 | (2)(19) | ||||||||||||||
Warrant to purchase up to 1,481 shares of Series A preferred stock (expires 12/2025) | 12/3/2015 | — | — | (2) | |||||||||||||||
Warrant to purchase up to 2,037 shares of Series A preferred stock (expires 11/2024) | 11/3/2014 | 0.1 | 0.1 | (2) | |||||||||||||||
8.3 | 8.3 | ||||||||||||||||||
F-48
As of December 31, 2016
(dollar amounts in millions)
Company(1) | Business Description | Investment | Interest(6)(12) | Acquisition Date | Amortized Cost | Fair Value | Percentage of Net Assets | ||||||||||||
First Insight, Inc. | Software company providing merchandising and pricing solutions to companies worldwide | Warrant to purchase up to 122,827 units of Series C preferred stock (expires 3/2024) | 3/20/2014 | — | — | (2) | |||||||||||||
iControl Networks, Inc. and uControl Acquisition, LLC | Software and services company for the connected home market | Second lien senior secured loan ($20.0 par due 3/2019) | 9.74% (Libor + 8.50%/M) | 2/19/2015 | 19.8 | 20.2 | (2)(17)(19) | ||||||||||||
Warrant to purchase up to 385,616 shares of Series D preferred stock (expires 2/2022) | 2/19/2015 | — | — | (2) | |||||||||||||||
19.8 | 20.2 | ||||||||||||||||||
IfByPhone Inc. | Voice-based marketing automation software provider | Warrant to purchase up to 124,300 shares of Series C preferred stock (expires 10/2022) | 10/15/2012 | 0.1 | 0.1 | (2) | |||||||||||||
Interactions Corporation | Developer of a speech recognition software based customer interaction system | Second lien senior secured loan ($2.3 par due 7/2019) | 9.85% (Libor + 8.85%/M) | 6/16/2015 | 2.1 | 2.3 | (19) | ||||||||||||
Second lien senior secured loan ($21.1 par due 7/2019) | 9.85% (Libor + 8.85%/M) | 6/16/2015 | 20.9 | 21.1 | (5)(19) | ||||||||||||||
Warrant to purchase up to 68,187 shares of Series G-3 convertible preferred stock (expires 6/2022) | 6/16/2015 | 0.3 | 0.3 | (2) | |||||||||||||||
23.3 | 23.7 | ||||||||||||||||||
iPipeline, Inc., Internet Pipeline, Inc. and iPipeline Holdings, Inc. (24) | Provider of SaaS-based software solutions to the insurance and financial services industry | First lien senior secured loan ($46.9 par due 8/2022) | 8.25% (Libor + 7.25%/Q) | 8/4/2015 | 46.9 | 46.9 | (3)(19) | ||||||||||||
First lien senior secured loan ($14.8 par due 8/2022) | 8.25% (Libor + 7.25%/Q) | 8/4/2015 | 14.8 | 14.8 | (4)(19) | ||||||||||||||
Preferred stock (1,485 shares) | 8/4/2015 | 1.5 | 2.7 | (2) | |||||||||||||||
Common stock (647,542 shares) | 8/4/2015 | — | 0.1 | (2) | |||||||||||||||
63.2 | 64.5 | ||||||||||||||||||
IronPlanet, Inc. | Online auction platform provider for used heavy equipment | Warrant to purchase up to 133,333 shares of Series C preferred stock (expires 9/2023) | 9/24/2013 | 0.2 | 0.1 | (2) | |||||||||||||
Itel Laboratories, Inc. (24) | Data services provider for building materials to property insurance industry | Preferred units (1,798,391 units) | 6/29/2012 | 1.0 | 1.3 | (2) | |||||||||||||
Market Track Holdings, LLC | Business media consulting services company | Preferred stock (1,685 shares) | 12/13/2013 | 2.2 | 2.8 | ||||||||||||||
Common stock (16,251 shares) | 12/13/2013 | 2.2 | 2.8 | ||||||||||||||||
4.4 | 5.6 | ||||||||||||||||||
Maximus Holdings, LLC | Provider of software simulation tools and related services | Warrant to purchase up to 1,050,013 shares of common stock (expires 10/2019) | 12/13/2013 | — | 1.5 | ||||||||||||||
Ministry Brands, LLC and MB Parent HoldCo, L.P. (24) | Software and payment services provider to faith-based institutions | First lien senior secured revolving loan ($3.8 par due 12/2022) | 6.00% (Libor + 5.00%/Q) | 12/2/2016 | 3.8 | 3.8 | (2)(19) | ||||||||||||
First lien senior secured loan ($7.6 par due 12/2022) | 6.00% (Libor + 5.00%/Q) | 12/2/2016 | 7.5 | 7.6 | (2)(19) | ||||||||||||||
Second lien senior secured loan ($90.0 par due 6/2023) | 10.25% (Libor + 9.25%/Q) | 12/2/2016 | 89.2 | 90.0 | (2)(19) | ||||||||||||||
Class A units (500,000 units) | 12/2/2016 | 5.0 | 5.0 | (2) | |||||||||||||||
105.5 | 106.4 | ||||||||||||||||||
MVL Group, Inc. (8) | Marketing research provider | Senior subordinated loan ($0.5 par due 7/2012) | 4/1/2010 | 0.2 | 0.2 | (2)(18) | |||||||||||||
Common stock (560,716 shares) | 4/1/2010 | — | — | (2) | |||||||||||||||
0.2 | 0.2 | ||||||||||||||||||
NAS, LLC, Nationwide Marketing Group, LLC and Nationwide Administrative Services, Inc. | Buying and marketing services organization for appliance, furniture and consumer electronics dealers | Second lien senior secured loan ($24.1 par due 12/2021) | 9.75% (Libor + 8.75%/Q) | 6/1/2015 | 24.1 | 22.4 | (2)(19) | ||||||||||||
F-49
As of December 31, 2016
(dollar amounts in millions)
Company(1) | Business Description | Investment | Interest(6)(12) | Acquisition Date | Amortized Cost | Fair Value | Percentage of Net Assets | ||||||||||||
PayNearMe, Inc. | Electronic cash payment system provider | First lien senior secured loan ($10.0 par due 9/2019) | 9.50% (Libor + 8.50%/M) | 3/11/2016 | 9.6 | 10.0 | (5)(19) | ||||||||||||
Warrant to purchase up to 195,726 shares of Series E preferred stock (expires 3/2023) | 3/11/2016 | 0.2 | — | (5) | |||||||||||||||
9.8 | 10.0 | ||||||||||||||||||
Pegasus Intermediate Holdings, LLC (24) | Plant maintenance and scheduling process software provider | First lien senior secured loan ($1.3 par due 11/2022) | 7.25% (Libor + 6.25%/Q) | 11/7/2016 | 1.3 | 1.3 | (2)(19) | ||||||||||||
PHL Investors, Inc., and PHL Holding Co. (8) | Mortgage services | Class A common stock (576 shares) | 7/31/2012 | 3.8 | — | (2) | |||||||||||||
Planview, Inc. | Provider of project and portfolio management software | Second lien senior secured loan ($30.0 par due 8/2022) | 10.50% (Libor + 9.50%/Q) | 8/9/2016 | 30.0 | 30.5 | (2)(19) | ||||||||||||
Poplicus Incorporated | Business intelligence and market analytics platform for companies that sell to the public sector | First lien senior secured loan ($5.3 par due 1/2018) | 6/25/2015 | 4.7 | 2.6 | (5)(18) | |||||||||||||
Warrant to purchase up to 2,402,991 shares of Series C preferred stock (expires 6/2025) | 6/25/2015 | 0.1 | — | (5) | |||||||||||||||
4.8 | 2.6 | ||||||||||||||||||
PowerPlan, Inc. and Project Torque Ultimate Parent Corporation | Fixed asset financial management software provider | Second lien senior secured loan ($30.0 par due 2/2023) | 10.00% (Libor + 9.00%/Q) | 2/23/2015 | 29.8 | 30.0 | (2)(19) | ||||||||||||
Second lien senior secured loan ($50.0 par due 2/2023) | 10.00% (Libor + 9.00%/Q) | 2/23/2015 | 49.6 | 50.0 | (3)(19) | ||||||||||||||
Class A common stock (1,980 shares) | 2/23/2015 | 2.0 | — | (2) | |||||||||||||||
Class B common stock (989,011 shares) | 2/23/2015 | — | 3.8 | (2) | |||||||||||||||
81.4 | 83.8 | ||||||||||||||||||
Powersport Auctioneer Holdings, LLC | Powersport vehicle auction operator | Common units (1,972 units) | 3/2/2012 | 1.0 | 1.5 | (2) | |||||||||||||
Project Alpha Intermediate Holding, Inc. and Qlik Parent, Inc. | Provider of data visualization software for data analytics | First lien senior secured loan ($50.4 par due 8/2022) | 9.25% (Libor + 8.25%/Q) | 8/22/2016 | 49.7 | 50.4 | (2)(19) | ||||||||||||
First lien senior secured loan ($59.9 par due 8/2022) | 9.25% (Libor + 8.25%/Q) | 8/22/2016 | 59.0 | 59.9 | (3)(19) | ||||||||||||||
First lien senior secured loan ($20.0 par due 8/2022) | 9.25% (Libor + 8.25%/Q) | 8/22/2016 | 19.7 | 20.0 | (4)(19) | ||||||||||||||
Class A common shares (7,445 shares) | 8/22/2016 | 7.4 | 0.1 | (2) | |||||||||||||||
Class B common shares (1,841,609 shares) | 8/22/2016 | 0.1 | 8.3 | (2) | |||||||||||||||
135.9 | 138.7 | ||||||||||||||||||
R2 Acquisition Corp. | Marketing services | Common stock (250,000 shares) | 5/29/2007 | 0.3 | 0.3 | (2) | |||||||||||||
Rocket Fuel Inc. | Provider of open and integrated software for digital marketing optimization | Common stock (11,405 shares) | 9/9/2014 | — | — | (2) | |||||||||||||
Shift PPC LLC | Digital solutions provider | First lien senior secured loan ($12.5 par due 12/2021) | 7.00% (Libor + 6.00%/Q) | 12/22/2016 | 12.5 | 12.5 | (2)(19) | ||||||||||||
Sonian Inc. | Cloud-based email archiving platform | First lien senior secured loan ($7.5 par due 6/2020) | 8.65% (Libor + 7.65%/M) | 9/9/2015 | 7.4 | 7.5 | (5)(17)(19) | ||||||||||||
Warrant to purchase up to 169,045 shares of Series C preferred stock (expires 9/2022) | 9/9/2015 | 0.1 | 0.1 | (5) | |||||||||||||||
7.5 | 7.6 | ||||||||||||||||||
Talari Networks, Inc. | Networking equipment provider | First lien senior secured loan ($6.0 par due 12/2018) | 9.75% (Libor + 8.75%/M) | 8/3/2015 | 5.9 | 6.0 | (5)(19) | ||||||||||||
Warrant to purchase up to 421,052 shares of Series D-1 preferred stock (expires 8/2022) | 8/3/2015 | 0.1 | 0.1 | (5) | |||||||||||||||
6.0 | 6.1 | ||||||||||||||||||
The Greeley Company, Inc. and HCP Acquisition Holdings, LLC (8) | Healthcare compliance advisory services | Senior subordinated loan ($10.2 par due 3/2017) | 3/5/2013 | — | 0.4 | (2)(18) | |||||||||||||
F-50
As of December 31, 2016
(dollar amounts in millions)
Company(1) | Business Description | Investment | Interest(6)(12) | Acquisition Date | Amortized Cost | Fair Value | Percentage of Net Assets | ||||||||||||
Class A units (14,293,110 units) | 6/26/2008 | 12.8 | — | (2) | |||||||||||||||
12.8 | 0.4 | ||||||||||||||||||
TraceLink, Inc. | Supply chain management software provider for the pharmaceutical industry | Warrant to purchase up to 283,353 shares of Series A-2 preferred stock (expires 1/2025) | 1/2/2015 | 0.1 | 2.5 | (2) | |||||||||||||
UL Holding Co., LLC (7) | Manufacturer and distributor of re-refined oil products | Senior subordinated loan ($5.8 par due 5/2020) | 10.00% PIK | 4/30/2012 | 1.4 | 5.4 | (2) | ||||||||||||
Senior subordinated loan ($0.3 par due 5/2020) | 4/30/2012 | 0.1 | 0.3 | (2) | |||||||||||||||
Senior subordinated loan ($23.9 par due 5/2020) | 10.00% PIK | 4/30/2012 | 5.9 | 22.4 | (2) | ||||||||||||||
Senior subordinated loan ($2.0 par due 5/2020) | 4/30/2012 | 0.5 | 1.9 | (2) | |||||||||||||||
Senior subordinated loan ($2.8 par due 5/2020) | 10.00% PIK | 4/30/2012 | 0.7 | 2.6 | (2) | ||||||||||||||
Senior subordinated loan ($0.2 par due 5/2020) | 4/30/2012 | 0.1 | 0.2 | (2) | |||||||||||||||
Class A common units (533,351 units) | 6/17/2011 | 5.0 | — | (2) | |||||||||||||||
Class B-5 common units (272,834 units) | 6/17/2011 | 2.5 | — | (2) | |||||||||||||||
Class C common units (758,546 units) | 4/25/2008 | — | — | (2) | |||||||||||||||
Warrant to purchase up to 719,044 shares of Class A units | 5/2/2014 | — | — | (2) | |||||||||||||||
Warrant to purchase up to 28,663 shares of Class B-1 units | 5/2/2014 | — | — | (2) | |||||||||||||||
Warrant to purchase up to 57,325 shares of Class B-2 units | 5/2/2014 | — | — | (2) | |||||||||||||||
Warrant to purchase up to 29,645 shares of Class B-3 units | 5/2/2014 | — | — | (2) | |||||||||||||||
Warrant to purchase up to 80,371 shares of Class B-5 units | 5/2/2014 | — | — | (2) | |||||||||||||||
Warrant to purchase up to 59,655 shares of Class B-6 units | 5/2/2014 | — | — | (2) | |||||||||||||||
Warrant to purchase up to 1,046,713 shares of Class C units | 5/2/2014 | — | — | (2) | |||||||||||||||
16.2 | 32.8 | ||||||||||||||||||
Velocity Holdings Corp. | Hosted enterprise resource planning application management services provider | Common units (1,713,546 units) | 12/13/2013 | 4.5 | 2.8 | ||||||||||||||
WorldPay Group PLC (9) | Payment processing company | C2 shares (73,974 shares) | 10/21/2015 | — | — | ||||||||||||||
Zywave, Inc. (24) | Provider of software and technology-enabled content and analytical solutions to insurance brokers | Second lien senior secured loan ($27.0 par due 11/2023) | 10.00% (Libor + 9.00%/Q) | 11/17/2016 | 27.0 | 27.0 | (2)(19) | ||||||||||||
862.5 | 867.7 | 16.80 | % | ||||||||||||||||
Other Services | |||||||||||||||||||
American Residential Services L.L.C. | Heating, ventilation and air conditioning services provider | Second lien senior secured loan ($67.0 par due 12/2021) | 9.00% (Libor + 8.00%/Q) | 6/30/2014 | 66.7 | 67.0 | (2)(19) | ||||||||||||
Community Education Centers, Inc. and CEC Parent Holdings LLC (8) | Offender re-entry and in-prison treatment services provider | First lien senior secured loan ($13.6 par due 12/2017) | 6.25% (Libor + 5.25%/Q) | 12/10/2010 | 13.6 | 13.6 | (2)(13)(19) | ||||||||||||
First lien senior secured loan ($0.7 par due 12/2017) | 8.00% (Base Rate + 4.25%/Q) | 12/10/2010 | 0.7 | 0.7 | (2)(13)(19) | ||||||||||||||
Second lien senior secured loan ($21.9 par due 6/2018) | 15.89% (Libor + 15.00%/Q) | 12/10/2010 | 21.9 | 21.9 | (2) | ||||||||||||||
Class A senior preferred units (7,846 units) | 3/27/2015 | 9.4 | 11.9 | (2) | |||||||||||||||
F-51
As of December 31, 2016
(dollar amounts in millions)
Company(1) | Business Description | Investment | Interest(6)(12) | Acquisition Date | Amortized Cost | Fair Value | Percentage of Net Assets | ||||||||||||
Class A junior preferred units (26,154 units) | 3/27/2015 | 20.2 | 28.5 | (2) | |||||||||||||||
Class A common units (134 units) | 3/27/2015 | — | — | (2) | |||||||||||||||
65.8 | 76.6 | ||||||||||||||||||
Competitor Group, Inc., Calera XVI, LLC and Champion Parent Corporation (8)(24) | Endurance sports media and event operator | First lien senior secured revolving loan ($0.9 par due 11/2018) | 5.00% (Libor + 3.75%/Q) | 9/29/2016 | 0.9 | 0.9 | (2)(19) | ||||||||||||
First lien senior secured revolving loan ($4.7 par due 11/2018) | 5.00% (Libor + 3.75%/Q) | 11/30/2012 | 4.5 | 4.5 | (2)(19) | ||||||||||||||
First lien senior secured loan ($39.6 par due 11/2018) | 5.00% (Libor + 3.75%/Q) | 11/30/2012 | 38.0 | 38.6 | (2)(19) | ||||||||||||||
Preferred shares (18,875 shares) | 3/25/2016 | 16.0 | — | (2) | |||||||||||||||
Membership units (2,522,512 units) | 11/30/2012 | 2.5 | — | (2) | |||||||||||||||
Common shares (114,000 shares) | 3/25/2016 | — | — | (2) | |||||||||||||||
61.9 | 44.0 | ||||||||||||||||||
Crown Health Care Laundry Services, LLC and Crown Laundry Holdings, LLC (7)(24) | Provider of outsourced healthcare linen management solutions | First lien senior secured revolving loan | - | 3/13/2014 | — | — | (22) | ||||||||||||
First lien senior secured loan ($5.8 par due 12/2021) | 7.25% (Libor + 6.25%/Q) | 3/13/2014 | 5.8 | 5.8 | (2)(19) | ||||||||||||||
First lien senior secured loan ($5.2 par due 12/2021) | 7.25% (Libor + 6.25%/Q) | 3/13/2014 | 5.2 | 5.2 | (3)(19) | ||||||||||||||
Class A preferred units (2,475,000 units) | 3/13/2014 | 2.5 | 3.0 | (2) | |||||||||||||||
Class B common units (275,000 units) | 3/13/2014 | 0.3 | 0.3 | (2) | |||||||||||||||
13.8 | 14.3 | ||||||||||||||||||
Dwyer Acquisition Parent, Inc. and TDG Group Holding Company | Operator of multiple franchise concepts primarily related to home maintenance or repairs | Senior subordinated loan ($31.5 par due 2/2020) | 11.00% | 6/12/2015 | 31.5 | 31.5 | (2) | ||||||||||||
Senior subordinated loan ($52.7 par due 2/2020) | 11.00% | 8/15/2014 | 52.7 | 52.7 | (2) | ||||||||||||||
Common stock (32,843 shares) | 8/15/2014 | 3.4 | 5.0 | (2) | |||||||||||||||
87.6 | 89.2 | ||||||||||||||||||
Massage Envy, LLC and ME Equity LLC (24) | Franchisor in the massage industry | First lien senior secured revolving loan ($3.5 par due 9/2020) | 7.75% (Libor + 6.75%/Q) | 9/27/2012 | 3.5 | 3.5 | (2)(19) | ||||||||||||
First lien senior secured loan ($38.9 par due 9/2020) | 7.75% (Libor + 6.75%/Q) | 9/27/2012 | 38.9 | 38.9 | (3)(19) | ||||||||||||||
First lien senior secured loan ($18.9 par due 9/2020) | 7.75% (Libor + 6.75%/Q) | 9/27/2012 | 18.9 | 18.9 | (4)(19) | ||||||||||||||
Common stock (3,000,000 shares) | 9/27/2012 | 3.0 | 3.3 | (2) | |||||||||||||||
64.3 | 64.6 | ||||||||||||||||||
McKenzie Sports Products, LLC (24) | Designer, manufacturer and distributor of hunting-related supplies | First lien senior secured loan ($5.5 par due 9/2020) | 6.75% (Libor + 5.75%/Q) | 9/18/2014 | 5.5 | 5.4 | (3)(14)(19) | ||||||||||||
First lien senior secured loan ($84.5 par due 9/2020) | 6.75% (Libor + 5.75%/Q) | 9/18/2014 | 84.5 | 82.8 | (3)(14)(19) | ||||||||||||||
90.0 | 88.2 | ||||||||||||||||||
OpenSky Project, Inc. and OSP Holdings, Inc. | Social commerce platform operator | First lien senior secured loan ($0.9 par due 9/2017) | 10.00% | 6/4/2014 | 0.9 | 0.9 | (2) | ||||||||||||
Warrant to purchase up to 159,496 shares of Series D preferred stock (expires 4/2025) | 6/29/2015 | — | — | (2) | |||||||||||||||
0.9 | 0.9 | ||||||||||||||||||
Osmose Holdings, Inc. | Provider of structural integrity management services to transmission and distribution infrastructure | Second lien senior secured loan ($25.0 par due 8/2023) | 8.75% (Libor + 7.75%/Q) | 9/3/2015 | 24.6 | 24.5 | (2)(19) | ||||||||||||
F-52
As of December 31, 2016
(dollar amounts in millions)
Company(1) | Business Description | Investment | Interest(6)(12) | Acquisition Date | Amortized Cost | Fair Value | Percentage of Net Assets | ||||||||||||
SocialFlow, Inc. | Social media optimization platform provider | First lien senior secured loan ($4.0 par due 8/2019) | 9.50% (Libor + 8.50%/M) | 1/29/2016 | 3.9 | 4.0 | (5)(19) | ||||||||||||
Warrant to purchase up to 215,331 shares of Series C preferred stock (expires 1/2026) | 1/29/2016 | — | — | (5) | |||||||||||||||
3.9 | 4.0 | ||||||||||||||||||
Spin HoldCo Inc. | Laundry service and equipment provider | Second lien senior secured loan ($140.0 par due 5/2020) | 8.00% (Libor + 7.00%/Q) | 5/14/2013 | 140.0 | 138.6 | (2)(19) | ||||||||||||
Surface Dive, Inc. | SCUBA diver training and certification provider | Second lien senior secured loan ($31.6 par due 1/2022) | 9.00% (Libor + 8.00%/Q) | 7/28/2015 | 31.6 | 31.6 | (2)(19) | ||||||||||||
Second lien senior secured loan ($94.1 par due 1/2022) | 10.25% (Libor + 9.25%/Q) | 1/29/2015 | 93.8 | 94.1 | (2)(19) | ||||||||||||||
125.4 | 125.7 | ||||||||||||||||||
U.S. Security Associates Holdings, Inc | Security guard service provider | Second lien senior secured loan ($25.0 par due 7/2018) | 11.00% | 11/24/2015 | 25.0 | 25.0 | (2) | ||||||||||||
WASH Multifamily Acquisition Inc. and Coinamatic Canada Inc. | Laundry service and equipment provider | Second lien senior secured loan ($3.7 par due 5/2023) | 8.00% (Libor + 7.00%/Q) | 5/14/2015 | 3.7 | 3.7 | (2)(19) | ||||||||||||
Second lien senior secured loan ($21.3 par due 5/2023) | 8.00% (Libor + 7.00%/Q) | 5/14/2015 | 20.9 | 21.1 | (2)(19) | ||||||||||||||
24.6 | 24.8 | ||||||||||||||||||
794.5 | 787.4 | 15.25 | % | ||||||||||||||||
Consumer Products | |||||||||||||||||||
Badger Sportswear Acquisition, Inc. | Provider of team uniforms and athletic wear | Second lien senior secured loan ($50.0 par due 3/2024) | 10.00% (Libor + 9.00%/Q) | 9/6/2016 | 49.9 | 50.0 | (2)(19) | ||||||||||||
Feradyne Outdoors, LLC and Bowhunter Holdings, LLC | Provider of branded archery and bowhunting accessories | First lien senior secured loan ($4.4 par due 3/2019) | 4.00% (Libor + 3.00%/Q) | 4/24/2014 | 4.4 | 4.3 | (3)(19) | ||||||||||||
First lien senior secured loan ($5.2 par due 3/2019) | 4.00% (Libor + 3.00%/Q) | 4/24/2014 | 5.2 | 5.1 | (3)(19) | ||||||||||||||
First lien senior secured loan ($9.5 par due 3/2019) | 6.55% (Libor + 5.55%/Q) | 4/24/2014 | 9.5 | 9.0 | (3)(16)(19) | ||||||||||||||
First lien senior secured loan ($50.1 par due 3/2019) | 6.55% (Libor + 5.55%/Q) | 4/24/2014 | 50.1 | 47.6 | (3)(16)(19) | ||||||||||||||
Common units (300 units) | 4/24/2014 | 3.7 | 2.4 | (2) | |||||||||||||||
72.9 | 68.4 | ||||||||||||||||||
Indra Holdings Corp. | Designer, marketer, and distributor of rain and cold weather products | Second lien senior secured loan ($80.0 par due 11/2021) | 8.50% (Libor + 7.50%/Q) | 5/1/2014 | 79.2 | 60.8 | (2)(19) | ||||||||||||
Plantation Products, LLC, Seed Holdings, Inc. and Flora Parent, Inc. | Provider of branded lawn and garden products | Second lien senior secured loan ($2.0 par due 6/2021) | 8.99% (Libor + 7.99%/Q) | 12/23/2014 | 2.0 | 2.0 | (2)(19) | ||||||||||||
Second lien senior secured loan ($54.0 par due 6/2021) | 8.99% (Libor + 7.99%/Q) | 12/23/2014 | 53.8 | 54.0 | (3)(19) | ||||||||||||||
Second lien senior secured loan ($10.0 par due 6/2021) | 8.99% (Libor + 7.99%/Q) | 12/23/2014 | 10.0 | 10.0 | (4)(19) | ||||||||||||||
Common stock (30,000 shares) | 12/23/2014 | 3.0 | 5.2 | (2) | |||||||||||||||
68.8 | 71.2 | ||||||||||||||||||
SHO Holding I Corporation | Manufacturer and distributor of slip resistant footwear | Second lien senior secured loan ($100.0 par due 4/2023) | 9.50% (Libor + 8.50%/Q) | 10/27/2015 | 97.8 | 99.0 | (2)(19) | ||||||||||||
Shock Doctor, Inc. and Shock Doctor Holdings, LLC (7) | Developer, marketer and distributor of sports protection equipment and accessories | Second lien senior secured loan ($89.4 par due 10/2021) | 11.76% (Libor + 10.50%/Q) | 4/22/2015 | 89.4 | 87.6 | (2)(19) | ||||||||||||
Class A preferred units (50,000 units) | 3/14/2014 | 5.0 | 3.8 | (2) | |||||||||||||||
Class C preferred units (50,000 units) | 4/22/2015 | 5.0 | 3.8 | (2) | |||||||||||||||
99.4 | 95.2 | ||||||||||||||||||
The Step2 Company, LLC (8) | Toy manufacturer | Common units (1,116,879 units) | 4/1/2011 | — | 6.2 | ||||||||||||||
Class B common units (126,278,000 units) | 10/30/2014 | — | — | (2) | |||||||||||||||
Warrant to purchase up to 3,157,895 units | 4/1/2010 | — | — | ||||||||||||||||
F-53
As of December 31, 2016
(dollar amounts in millions)
Company(1) | Business Description | Investment | Interest(6)(12) | Acquisition Date | Amortized Cost | Fair Value | Percentage of Net Assets | ||||||||||||
— | 6.2 | ||||||||||||||||||
Varsity Brands Holding Co., Inc., Hercules Achievement, Inc., Hercules Achievement Holdings, Inc. and Hercules VB Holdings, Inc. | Leading manufacturer and distributor of textiles, apparel & luxury goods | Second lien senior secured loan ($25.0 par due 12/2022) | 9.75% (Libor + 8.75%/Q) | 10/28/2016 | 25.0 | 25.0 | (2)(19) | ||||||||||||
Second lien senior secured loan ($1.6 par due 12/2022) | 9.75% (Libor + 8.75%/Q) | 12/11/2014 | 1.6 | 1.6 | (2)(19) | ||||||||||||||
Second lien senior secured loan ($54.0 par due 12/2022) | 9.75% (Libor + 8.75%/Q) | 12/11/2014 | 53.6 | 54.0 | (3)(19) | ||||||||||||||
Second lien senior secured loan ($91.7 par due 12/2022) | 9.75% (Libor + 8.75%/Q) | 12/11/2014 | 91.0 | 91.7 | (2)(19) | ||||||||||||||
Common stock (3,353,370 shares) | 12/11/2014 | 3.4 | 3.7 | (2) | |||||||||||||||
Common stock (3,353,371 shares) | 12/11/2014 | 4.1 | 4.6 | (2) | |||||||||||||||
178.7 | 180.6 | ||||||||||||||||||
Wonder Holdings Acquisition Corp. | Developer and marketer of OTC healthcare products | Warrant to purchase up to 1,654,678 shares of common stock (expires 6/2021) | 7/27/2011 | — | 0.8 | (2) | |||||||||||||
Warrant to purchase up to 941 shares of preferred stock (expires 6/2021) | 7/27/2011 | — | 1.5 | (2) | |||||||||||||||
— | 2.3 | ||||||||||||||||||
646.7 | 633.7 | 12.27 | % | ||||||||||||||||
Power Generation | |||||||||||||||||||
Alphabet Energy, Inc. | Technology developer to convert waste-heat into electricity | First lien senior secured loan ($3.9 par due 8/2017) | 14.50% (Libor + 11.50% Cash, 2.00% PIK/M) | 12/16/2013 | 3.8 | 3.9 | (2)(17)(19) | ||||||||||||
Series 1B preferred stock (12,976 shares) | 6/21/2016 | 0.2 | 0.1 | (2) | |||||||||||||||
Warrant to purchase up to 125,000 shares of Series 2 preferred stock (expires 12/2023) | 6/30/2016 | 0.1 | 0.1 | (2) | |||||||||||||||
4.1 | 4.1 | ||||||||||||||||||
CEI Kings Mountain Investor, LP | Gas turbine power generation facilities operator | Senior subordinated loan ($32.6 par due 3/2017) | 11.00% PIK | 3/11/2016 | 32.6 | 32.6 | (2) | ||||||||||||
CPV Maryland Holding Company II, LLC | Gas turbine power generation facilities operator | Senior subordinated loan ($44.5 par due 12/2020) | 10.00% | 8/8/2014 | 44.5 | 43.3 | (2) | ||||||||||||
Warrant to purchase up to 4 units of common stock (expires 8/2018) | 8/8/2014 | — | 0.2 | (2) | |||||||||||||||
44.5 | 43.5 | ||||||||||||||||||
DESRI VI Management Holdings, LLC | Wind power generation facility operator | Senior subordinated loan ($25.0 par due 12/2021) | 9.75% | 12/24/2014 | 25.0 | 25.0 | (2) | ||||||||||||
Non-controlling units (10.0 units) | 12/24/2014 | 1.6 | 1.8 | (2) | |||||||||||||||
26.6 | 26.8 | ||||||||||||||||||
Green Energy Partners, Stonewall LLC and Panda Stonewall Intermediate Holdings II LLC | Gas turbine power generation facilities operator | First lien senior secured loan ($25.0 par due 11/2021) | 6.50% (Libor + 5.50%/Q) | 11/13/2014 | 24.8 | 24.6 | (2)(19) | ||||||||||||
Senior subordinated loan ($19.5 par due 12/2021) | 8.00% Cash, 5.25% PIK | 11/13/2014 | 19.5 | 19.2 | (2) | ||||||||||||||
Senior subordinated loan ($91.2 par due 12/2021) | 8.00% Cash, 5.25% PIK | 11/13/2014 | 91.2 | 89.8 | (2) | ||||||||||||||
135.5 | 133.6 | ||||||||||||||||||
Joule Unlimited Technologies, Inc. and Stichting Joule Global Foundation | Renewable fuel and chemical production developer | First lien senior secured loan ($8.8 par due 10/2018) | 3/31/2015 | 8.5 | 6.2 | (2)(17)(18) | |||||||||||||
Warrant to purchase up to 32,051 shares of Series C-2 preferred stock (expires 7/2023) | 7/25/2013 | — | — | (2)(9) | |||||||||||||||
8.5 | 6.2 | ||||||||||||||||||
La Paloma Generating Company, LLC | Natural gas fired, combined cycle plant operator | Second lien senior secured loan ($10.0 par due 2/2020) | 2/20/2014 | 8.8 | — | (2)(18) | |||||||||||||
F-54
As of December 31, 2016
(dollar amounts in millions)
Company(1) | Business Description | Investment | Interest(6)(12) | Acquisition Date | Amortized Cost | Fair Value | Percentage of Net Assets | ||||||||||||
Moxie Liberty LLC | Gas turbine power generation facilities operator | First lien senior secured loan ($34.7 par due 8/2020) | 7.50% (Libor + 6.50%/Q) | 8/21/2013 | 34.5 | 34.7 | (2)(19) | ||||||||||||
Moxie Patriot LLC | Gas turbine power generation facilities operator | First lien senior secured loan ($34.3 par due 12/2020) | 6.75% (Libor + 5.75%/Q) | 12/19/2013 | 34.0 | 34.1 | (2)(19) | ||||||||||||
Noonan Acquisition Company, LLC | Gas turbine power generation facilities operator | Senior subordinated loan ($50.9 par due 10/2017) | 10.25% | 7/22/2016 | 50.9 | 50.9 | (2) | ||||||||||||
Panda Power Annex Fund Hummel Holdings II LLC | Gas turbine power generation facilities operator | Senior subordinated loan ($52.2 par due 1/2017) | 13.00% PIK | 10/27/2015 | 52.2 | 52.2 | (2) | ||||||||||||
Panda Temple Power II, LLC | Gas turbine power generation facilities operator | First lien senior secured loan ($19.8 par due 4/2019) | 7.25% (Libor + 6.00%/Q) | 4/3/2013 | 19.7 | 18.0 | (2)(19) | ||||||||||||
Panda Temple Power, LLC | Gas turbine power generation facilities operator | First lien senior secured loan ($24.6 par due 3/2022) | 7.25% (Libor + 6.25%/Q) | 3/6/2015 | 23.6 | 21.4 | (2)(19) | ||||||||||||
PERC Holdings 1 LLC | Operator of recycled energy, combined heat and power, and energy efficiency facilities | Class B common units (21,653,543 units) | 10/20/2014 | 21.7 | 26.1 | (2) | |||||||||||||
Riverview Power LLC | Natural gas and oil fired power generation facilities operator | First lien senior secured loan ($8.6 par due 12/2021) | 7.25% (Base Rate + 3.50%/Q) | 12/29/2016 | 8.6 | 8.6 | (2)(19) | ||||||||||||
First lien senior secured loan ($73.6 par due 12/2022) | 11.00% (Base Rate + 7.25%/Q) | 12/29/2016 | 73.6 | 73.6 | (2)(19) | ||||||||||||||
82.2 | 82.2 | ||||||||||||||||||
579.4 | 566.4 | 10.97 | % | ||||||||||||||||
Restaurants and Food Services | |||||||||||||||||||
ADF Capital, Inc., ADF Restaurant Group, LLC, and ARG Restaurant Holdings, Inc. (8) | Restaurant owner and operator | First lien senior secured loan ($3.1 par due 12/2018) | 15.00% (Libor + 14.00%/Q) | 12/22/2016 | 3.1 | 3.1 | (2)(19) | ||||||||||||
First lien senior secured loan ($29.6 par due 12/2018) | 11/27/2006 | 28.9 | 20.4 | (2)(18) | |||||||||||||||
First lien senior secured loan ($11.3 par due 12/2018) | 11/27/2006 | 11.0 | 7.8 | (3)(18) | |||||||||||||||
Promissory note ($25.5 par due 12/2023) | 11/27/2006 | 13.8 | — | (2) | |||||||||||||||
Warrant to purchase up to 23,750 units of Series D common stock (expires 12/2023) | 12/18/2013 | — | — | (2) | |||||||||||||||
56.8 | 31.3 | ||||||||||||||||||
Benihana, Inc. (24) | Restaurant owner and operator | First lien senior secured revolving loan ($0.8 par due 7/2018) | 8.25% (Libor + 7.00%/Q) | 8/21/2012 | 0.8 | 0.8 | (2)(19)(23) | ||||||||||||
First lien senior secured revolving loan ($0.7 par due 7/2018) | 9.50% (Base Rate + 5.75%/Q) | 8/21/2012 | 0.7 | 0.7 | (2)(19)(23) | ||||||||||||||
First lien senior secured loan ($4.8 par due 1/2019) | 8.25% (Libor + 7.00%/Q) | 8/21/2012 | 4.8 | 4.6 | (4)(19) | ||||||||||||||
First lien senior secured loan ($0.3 par due 1/2019) | 8.25% (Libor + 7.00%/Q) | 12/28/2016 | 0.3 | 0.3 | (2)(19) | ||||||||||||||
6.6 | 6.4 | ||||||||||||||||||
DineInFresh, Inc. | Meal-delivery provider | First lien senior secured loan ($4.8 par due 7/2018) | 9.75% (Libor + 8.75%/M) | 12/19/2014 | 4.7 | 4.8 | (2)(19) | ||||||||||||
Warrant to purchase up to 143,079 shares of Series A preferred stock (expires 12/2024) | 12/19/2014 | — | — | (2) | |||||||||||||||
4.7 | 4.8 | ||||||||||||||||||
Garden Fresh Restaurant Corp. (24) | Restaurant owner and operator | First lien senior secured revolving loan | - | 10/3/2013 | — | — | (22) | ||||||||||||
First lien senior secured loan ($40.1 par due 7/2018) | 10.50% (Libor + 9.00%/Q) | 10/3/2013 | 40.1 | 38.1 | (2)(19) | ||||||||||||||
First lien senior secured loan ($1.5 par due 10/2017) | 15.50% PIK | 11/14/2016 | 1.5 | 1.5 | (2) | ||||||||||||||
41.6 | 39.6 | ||||||||||||||||||
F-55
As of December 31, 2016
(dollar amounts in millions)
Company(1) | Business Description | Investment | Interest(6)(12) | Acquisition Date | Amortized Cost | Fair Value | Percentage of Net Assets | ||||||||||||
Global Franchise Group, LLC and GFG Intermediate Holding, Inc. | Worldwide franchisor of quick service restaurants | First lien senior secured loan ($60.8 par due 12/2019) | 10.47% (Libor + 9.47%/Q) | 12/18/2014 | 60.8 | 60.8 | (3)(19) | ||||||||||||
Heritage Food Service Group, Inc. and WCI-HFG Holdings, LLC | Distributor of repair and replacement parts for commercial kitchen equipment | Second lien senior secured loan ($31.6 par due 10/2022) | 9.50% (Libor + 8.50%/Q) | 10/20/2015 | 31.6 | 31.6 | (2)(19) | ||||||||||||
Preferred units (3,000,000 units) | 10/20/2015 | 3.0 | 3.1 | (2) | |||||||||||||||
34.6 | 34.7 | ||||||||||||||||||
Orion Foods, LLC (8) | Convenience food service retailer | First lien senior secured loan ($1.2 par due 9/2015) | 4/1/2010 | 1.2 | 0.5 | (2)(18) | |||||||||||||
Second lien senior secured loan ($19.4 par due 9/2015) | 4/1/2010 | — | — | (2)(18) | |||||||||||||||
Preferred units (10,000 units) | 10/28/2010 | — | — | ||||||||||||||||
Class A common units (25,001 units) | 4/1/2010 | — | — | ||||||||||||||||
Class B common units (1,122,452 units) | 4/1/2010 | — | — | ||||||||||||||||
1.2 | 0.5 | ||||||||||||||||||
OTG Management, LLC (24) | Airport restaurant operator | First lien senior secured loan ($97.8 par due 8/2021) | 9.50% (Libor + 8.50%/Q) | 8/26/2016 | 97.8 | 97.8 | (3)(19) | ||||||||||||
Senior subordinated loan ($21.2 par due 2/2022) | 17.50% PIK | 8/26/2016 | 21.1 | 21.2 | (2) | ||||||||||||||
Class A preferred units (3,000,000 units) | 8/26/2016 | 30.0 | 30.9 | (2) | |||||||||||||||
Common units (3,000,000 units) | 1/5/2011 | 3.0 | 11.0 | (2) | |||||||||||||||
Warrant to purchase up to 7.73% of common units (expires 6/2018) | 6/19/2008 | 0.1 | 24.2 | (2) | |||||||||||||||
Warrant to purchase 0.60% of the common units deemed outstanding (expires 12/2018) | 8/26/2016 | — | — | (2) | |||||||||||||||
152.0 | 185.1 | ||||||||||||||||||
Restaurant Holding Company, LLC | Fast food restaurant operator | First lien senior secured loan ($34.5 par due 2/2019) | 8.75% (Libor + 7.75%/Q) | 3/13/2014 | 34.4 | 33.8 | (3)(19) | ||||||||||||
Restaurant Technologies, Inc. (24) | Provider of bulk cooking oil management services to the restaurant and fast food service industries | First lien senior secured revolving loan ($0.3 par due 11/2021) | 7.50% (Base Rate + 3.75%/Q) | 11/23/2016 | 0.3 | 0.3 | (2)(19)(23) | ||||||||||||
393.0 | 397.3 | 7.69 | % | ||||||||||||||||
Financial Services | |||||||||||||||||||
AllBridge Financial, LLC (8) | Asset management services | Equity interests | 4/1/2010 | — | 0.4 | ||||||||||||||
Callidus Capital Corporation (8) | Asset management services | Common stock (100 shares) | 4/1/2010 | 3.0 | 1.7 | ||||||||||||||
Ciena Capital LLC (8)(24) | Real estate and small business loan servicer | First lien senior secured revolving loan ($14.0 par due 12/2017) | 6.00% | 11/29/2010 | 14.0 | 14.0 | (2) | ||||||||||||
Equity interests | 11/29/2010 | 35.0 | 17.7 | (2) | |||||||||||||||
49.0 | 31.7 | ||||||||||||||||||
Commercial Credit Group, Inc. | Commercial equipment finance and leasing company | Senior subordinated loan ($28.0 par due 8/2022) | 11.00% (Libor + 9.75%/Q) | 5/10/2012 | 28.0 | 28.0 | (2)(19) | ||||||||||||
Imperial Capital Group LLC | Investment services | Class A common units (32,369 units) | 5/10/2007 | 7.9 | 12.2 | (2) | |||||||||||||
2006 Class B common units (10,605 units) | 5/10/2007 | — | — | (2) | |||||||||||||||
2007 Class B common units (1,323 units) | 5/10/2007 | — | — | (2) | |||||||||||||||
7.9 | 12.2 | ||||||||||||||||||
Ivy Hill Asset Management, L.P. (8)(10) | Asset management services | Member interest (100.00% interest) | 6/15/2009 | 171.0 | 229.2 | ||||||||||||||
Javlin Three LLC, Javlin Four LLC, and Javlin Five LLC (10) | Asset-backed financial services company | First lien senior secured loan ($32.1 par due 6/2017) | 10.47% (Libor + 10%/Q) | 6/24/2014 | 32.1 | 32.1 | (2) | ||||||||||||
LSQ Funding Group, L.C. and LM LSQ Investors LLC (10) | Asset based lender | Senior subordinated loan ($30.0 par due 6/2021) | 10.50% | 6/25/2015 | 30.0 | 30.0 | (2) | ||||||||||||
F-56
As of December 31, 2016
(dollar amounts in millions)
Company(1) | Business Description | Investment | Interest(6)(12) | Acquisition Date | Amortized Cost | Fair Value | Percentage of Net Assets | ||||||||||||
Membership units (3,275,000 units) | 6/25/2015 | 3.3 | 3.3 | ||||||||||||||||
33.3 | 33.3 | ||||||||||||||||||
The Gordian Group, Inc. | Financial services firm | Common stock (526 shares) | 11/30/2012 | — | — | (2) | |||||||||||||
324.3 | 368.6 | 7.14 | % | ||||||||||||||||
Manufacturing | |||||||||||||||||||
Component Hardware Group, Inc. (24) | Commercial equipment | First lien senior secured revolving loan ($1.9 par due 7/2019) | 5.50% (Libor + 4.50%/Q) | 7/1/2013 | 1.9 | 1.9 | (2)(19) | ||||||||||||
First lien senior secured loan ($8.0 par due 7/2019) | 5.50% (Libor + 4.50%/Q) | 7/1/2013 | 8.0 | 8.0 | (4)(19) | ||||||||||||||
9.9 | 9.9 | ||||||||||||||||||
Harvey Tool Company, LLC and Harvey Tool Holding, LLC (24) | Cutting tool provider to the metalworking industry | First lien senior secured revolving loan | - | 8/13/2015 | — | — | (22) | ||||||||||||
Senior subordinated loan ($28.1 par due 9/2020) | 10.00% Cash, 1.00% PIK | 8/13/2015 | 28.1 | 28.1 | (2) | ||||||||||||||
Class A membership units (750 units) | 3/28/2014 | 0.9 | 1.7 | (2) | |||||||||||||||
29.0 | 29.8 | ||||||||||||||||||
Ioxus, Inc | Energy storage devices | First lien senior secured loan ($0.7 par due 8/2017) | 12.00% PIK | 8/24/2016 | 0.7 | 0.6 | (2) | ||||||||||||
First lien senior secured loan ($10.2 par due 6/2019) | 5.00 % Cash, 7.00% PIK | 4/29/2014 | 10.0 | 9.7 | (2) | ||||||||||||||
First lien senior secured loan ($0.4 par due 6/2019) | 4/29/2014 | 0.4 | 0.4 | (2) | |||||||||||||||
Warrant to purchase up to 1,210,235 shares of Series BB preferred stock (expires 8/2026) | 1/28/2016 | — | — | (2) | |||||||||||||||
Warrant to purchase up to 3,038,730 shares of common stock (expires 1/2026) | 1/28/2016 | — | — | (2) | |||||||||||||||
11.1 | 10.7 | ||||||||||||||||||
KPS Global LLC | Walk-in cooler and freezer systems | First lien senior secured loan ($27.1 par due 12/2020) | 9.67% (Libor + 8.67%/Q) | 12/4/2015 | 27.1 | 27.1 | (2)(19) | ||||||||||||
MacLean-Fogg Company and MacLean-Fogg Holdings, L.L.C. | Manufacturer and supplier for the power utility and automotive markets worldwide | Senior subordinated loan ($99.9 par due 10/2025) | 10.50% Cash, 3.00% PIK | 10/31/2013 | 99.9 | 99.9 | (2) | ||||||||||||
Preferred units (70,183 units) | 4.50% Cash, 9.25% PIK | 10/9/2015 | 73.5 | 73.5 | |||||||||||||||
173.4 | 173.4 | ||||||||||||||||||
Niagara Fiber Intermediate Corp. (24) | Insoluble fiber filler products | First lien senior secured revolving loan ($1.9 par due 5/2018) | 5/8/2014 | 1.8 | 1.4 | (2)(18) | |||||||||||||
First lien senior secured loan ($1.4 par due 5/2018) | 5/8/2014 | 1.3 | 1.0 | (2)(18) | |||||||||||||||
First lien senior secured loan ($13.6 par due 5/2018) | 5/8/2014 | 12.9 | 10.0 | (2)(18) | |||||||||||||||
16.0 | 12.4 | ||||||||||||||||||
Nordco Inc. | Railroad maintenance-of-way machinery | First lien senior secured revolving loan | - | 8/26/2015 | — | — | (22) | ||||||||||||
Pelican Products, Inc. | Flashlights | Second lien senior secured loan ($40.0 par due 4/2021) | 9.25% (Libor + 8.25%/Q) | 4/11/2014 | 40.0 | 38.0 | (2)(19) | ||||||||||||
Saw Mill PCG Partners LLC | Metal precision engineered components | Common units (1,000 units) | 1/30/2007 | 1.0 | — | (2) | |||||||||||||
SI Holdings, Inc. | Elastomeric parts, mid-sized composite structures, and composite tooling | Common stock (1,500 shares) | 5/30/2014 | 1.5 | 1.5 | (2) | |||||||||||||
TPTM Merger Corp. (24) | Time temperature indicator products | First lien senior secured revolving loan ($1.3 par due 9/2018) | 7.50% (Libor + 6.50%/Q) | 9/12/2013 | 1.3 | 1.3 | (2)(19) | ||||||||||||
First lien senior secured loan ($17.0 par due 9/2018) | 9.67% (Libor + 8.67%/Q) | 9/12/2013 | 17.0 | 17.0 | (3)(19) | ||||||||||||||
First lien senior secured loan ($10.0 par due 9/2018) | 9.67% (Libor + 8.67%/Q) | 9/12/2013 | 10.0 | 10.0 | (4)(19) | ||||||||||||||
28.3 | 28.3 | ||||||||||||||||||
F-57
As of December 31, 2016
(dollar amounts in millions)
Company(1) | Business Description | Investment | Interest(6)(12) | Acquisition Date | Amortized Cost | Fair Value | Percentage of Net Assets | ||||||||||||
337.3 | 331.1 | 6.41 | % | ||||||||||||||||
Containers and Packaging | |||||||||||||||||||
Charter NEX US Holdings, Inc. | Producer of high-performance specialty films used in flexible packaging | Second lien senior secured loan ($11.8 par due 2/2023) | 9.25% (Libor + 8.25%/Q) | 2/5/2015 | 11.7 | 11.8 | (2)(19) | ||||||||||||
GS Pretium Holdings, Inc. | Manufacturer and supplier of high performance plastic containers | Common stock (500,000 shares) | 6/2/2014 | 0.5 | 0.8 | (2) | |||||||||||||
ICSH, Inc. (24) | Industrial container manufacturer, reconditioner and servicer | First lien senior secured revolving loan ($1.0 par due 12/2018) | 6.75% (Libor + 5.75%/Q) | 8/30/2011 | 1.0 | 1.0 | (2)(19)(23) | ||||||||||||
Second lien senior secured loan ($66.0 par due 12/2019) | 10.00% (Libor + 9.00%/Q) | 12/31/2015 | 66.0 | 66.0 | (2)(19) | ||||||||||||||
67.0 | 67.0 | ||||||||||||||||||
LBP Intermediate Holdings LLC (24) | Manufacturer of paper and corrugated foodservice packaging | First lien senior secured revolving loan | - | 7/10/2015 | — | — | (22) | ||||||||||||
First lien senior secured loan ($12.7 par due 7/2020) | 6.50% (Libor + 5.50%/Q) | 7/10/2015 | 12.6 | 12.7 | (3)(19) | ||||||||||||||
12.6 | 12.7 | ||||||||||||||||||
Microstar Logistics LLC, Microstar Global Asset Management LLC, and MStar Holding Corporation | Keg management solutions provider | Second lien senior secured loan ($78.5 par due 12/2018) | 8.50% (Libor + 7.50%/Q) | 12/14/2012 | 78.5 | 78.5 | (2)(19) | ||||||||||||
Second lien senior secured loan ($54.0 par due 12/2018) | 8.50% (Libor + 7.50%/Q) | 12/14/2012 | 54.0 | 54.0 | (3)(19) | ||||||||||||||
Second lien senior secured loan ($10.0 par due 12/2018) | 8.50% (Libor + 7.50%/Q) | 12/14/2012 | 10.0 | 10.0 | (4)(19) | ||||||||||||||
Common stock (50,000 shares) | 12/14/2012 | 4.0 | 8.1 | (2) | |||||||||||||||
146.5 | 150.6 | ||||||||||||||||||
238.3 | 242.9 | 4.70 | % | ||||||||||||||||
Food and Beverage | |||||||||||||||||||
American Seafoods Group LLC and American Seafoods Partners LLC (24) | Harvester and processor of seafood | First lien senior secured loan ($6.9 par due 8/2021) | 6.00% (Libor + 5.00%/Q) | 8/19/2015 | 6.9 | 6.9 | (2)(19) | ||||||||||||
First lien senior secured loan ($0.1 par due 8/2021) | 7.75% (Base Rate + 4.00%/Q) | 8/19/2015 | 0.1 | 0.1 | (2)(19) | ||||||||||||||
Second lien senior secured loan ($55.0 par due 2/2022) | 10.00% (Libor + 9.00%/Q) | 8/19/2015 | 55.0 | 55.0 | (2)(19) | ||||||||||||||
Class A units (77,922 units) | 8/19/2015 | 0.1 | 0.1 | (2) | |||||||||||||||
Warrant to purchase up to 7,422,078 Class A units (expires 8/2035) | 8/19/2015 | 7.4 | 7.8 | (2) | |||||||||||||||
69.5 | 69.9 | ||||||||||||||||||
Eagle Family Foods Group LLC | Manufacturer and producer of milk products | First lien senior secured loan ($21.6 par due 12/2021) | 10.05% (Libor + 9.05%/Q) | 8/22/2016 | 21.6 | 21.6 | (3)(19) | ||||||||||||
First lien senior secured loan ($54.8 par due 12/2021) | 10.05% (Libor + 9.05%/Q) | 12/31/2015 | 54.4 | 54.8 | (3)(19) | ||||||||||||||
76.0 | 76.4 | ||||||||||||||||||
GF Parent LLC | Producer of low-acid, aseptic food and beverage products | Class A preferred units (2,940 units) | 5/13/2015 | 2.9 | 1.4 | (2) | |||||||||||||
Class A common units (60,000 units) | 5/13/2015 | 0.1 | — | (2) | |||||||||||||||
3.0 | 1.4 | ||||||||||||||||||
JWC/KI Holdings, LLC | Foodservice sales and marketing agency | Membership units (5,000 units) | 11/16/2015 | 5.0 | 6.2 | (2) | |||||||||||||
Kettle Cuisine, LLC | Manufacturer of fresh refrigerated and frozen food products | Second lien senior secured loan ($28.5 par due 2/2022) | 10.75% (Libor + 9.75%/Q) | 8/21/2015 | 28.5 | 28.5 | (2)(19) | ||||||||||||
RF HP SCF Investor, LLC | Branded specialty food company | Membership interest (10.08% interest) | 12/22/2016 | 12.5 | 12.8 | (2) | |||||||||||||
194.5 | 195.2 | 3.78 | % | ||||||||||||||||
Education | |||||||||||||||||||
F-58
As of December 31, 2016
(dollar amounts in millions)
Company(1) | Business Description | Investment | Interest(6)(12) | Acquisition Date | Amortized Cost | Fair Value | Percentage of Net Assets | ||||||||||||
Campus Management Acquisition Corp. (7) | Education software developer | Preferred stock (485,159 shares) | 2/8/2008 | 10.5 | 10.4 | (2) | |||||||||||||
Infilaw Holdings, LLC (24) | Operator of for-profit law schools | First lien senior secured revolving loan ($6.0 par due 2/2018) | 8/25/2011 | 6.0 | 6.0 | (2)(18)(23) | |||||||||||||
Series A preferred units (1.25 units) | 8/25/2011 | 125.5 | 1.3 | (2)(18) | |||||||||||||||
Series A-1 preferred units (0.03 units) | 7/29/2016 | 2.5 | 2.5 | (2) | |||||||||||||||
Series B preferred units (0.39 units) | 10/19/2012 | 9.2 | — | (2) | |||||||||||||||
143.2 | 9.8 | ||||||||||||||||||
Instituto de Banca y Comercio, Inc. & Leeds IV Advisors, Inc. | Private school operator | First lien senior secured loan ($2.9 par due 12/2018) | 10.50% PIK (Libor + 9.00%/Q) | 10/31/2015 | 2.9 | 2.9 | (2)(19) | ||||||||||||
Series B preferred stock (1,750,000 shares) | 8/5/2010 | 5.0 | — | (2) | |||||||||||||||
Series C preferred stock (2,512,586 shares) | 6/7/2010 | 0.7 | — | (2) | |||||||||||||||
Senior preferred series A-1 shares (163,902 shares) | 10/31/2015 | 119.4 | 47.8 | (2) | |||||||||||||||
Common stock (20 shares) | 6/7/2010 | — | — | (2) | |||||||||||||||
128.0 | 50.7 | ||||||||||||||||||
Lakeland Tours, LLC (24) | Educational travel provider | First lien senior secured revolving loan | - | 2/10/2016 | — | — | (22) | ||||||||||||
First lien senior secured loan ($5.0 par due 2/2022) | 5.75% (Libor + 4.75%/Q) | 2/10/2016 | 5.0 | 5.0 | (2)(19) | ||||||||||||||
First lien senior secured loan ($31.7 par due 2/2022) | 10.43% (Libor + 9.43%/Q) | 2/10/2016 | 31.3 | 31.7 | (3)(19) | ||||||||||||||
36.3 | 36.7 | ||||||||||||||||||
PIH Corporation (24) | Franchisor of education-based early childhood centers | First lien senior secured revolving loan ($0.6 par due 12/2018) | 7.00% (Libor + 6.00%/Q) | 12/13/2013 | 0.6 | 0.6 | (2)(19) | ||||||||||||
R3 Education Inc., Equinox EIC Partners LLC and Sierra Education Finance Corp. | Medical school operator | Preferred stock (1,977 shares) | 7/30/2008 | 0.5 | 0.5 | (2) | |||||||||||||
Common membership interest (15.76% interest) | 9/21/2007 | 15.8 | 32.4 | (2) | |||||||||||||||
Warrant to purchase up to 27,890 shares (expires 11/2019) | 12/8/2009 | — | — | (2) | |||||||||||||||
16.3 | 32.9 | ||||||||||||||||||
Regent Education, Inc. | Provider of software solutions designed to optimize the financial aid and enrollment processes | First lien senior secured loan ($3.8 par due 1/2021) | 12.00% (Libor + 8.00% Cash, 2.00% PIK/M) | 7/1/2014 | 3.7 | 3.8 | (2)(19) | ||||||||||||
First lien senior secured loan ($0.1 par due 1/2021) | 7/1/2014 | 0.1 | 0.1 | (2) | |||||||||||||||
Warrant to purchase up to 987 shares of common stock (expires 12/2026) | 12/23/2016 | — | — | (2) | |||||||||||||||
Warrant to purchase up to 5,393,194 shares of common stock (expires 12/2026) | 12/23/2016 | — | 0.1 | (2) | |||||||||||||||
3.8 | 4.0 | ||||||||||||||||||
RuffaloCODY, LLC (24) | Provider of student fundraising and enrollment management services | First lien senior secured revolving loan | 5/29/2013 | — | — | (23) | |||||||||||||
Severin Acquisition, LLC | Provider of student information system software solutions to the K-12 education market | Second lien senior secured loan ($15.0 par due 7/2022) | 9.75% (Libor + 8.75%/Q) | 7/31/2015 | 14.8 | 15.0 | (2)(19) | ||||||||||||
Second lien senior secured loan ($4.2 par due 7/2022) | 9.75% (Libor + 8.75%/Q) | 10/28/2015 | 4.1 | 4.2 | (2)(19) | ||||||||||||||
Second lien senior secured loan ($3.3 par due 7/2022) | 10.25% (Libor + 9.25%/Q) | 2/1/2016 | 3.2 | 3.3 | (2)(19) | ||||||||||||||
Second lien senior secured loan ($2.8 par due 7/2022) | 10.25% (Libor + 9.25%/Q) | 8/8/2016 | 2.8 | 2.8 | (2)(19) | ||||||||||||||
F-59
As of December 31, 2016
(dollar amounts in millions)
Company(1) | Business Description | Investment | Interest(6)(12) | Acquisition Date | Amortized Cost | Fair Value | Percentage of Net Assets | ||||||||||||
Second lien senior secured loan ($3.1 par due 7/2022) | 10.00% (Libor + 9.00%/Q) | 10/14/2016 | 3.1 | 3.1 | (2)(19) | ||||||||||||||
28.0 | 28.4 | ||||||||||||||||||
WCI-Quantum Holdings, Inc. | Distributor of instructional products, services and resources | Series A preferred stock (1,272 shares) | 10/24/2014 | 1.0 | 1.3 | (2) | |||||||||||||
367.7 | 174.8 | 3.38 | % | ||||||||||||||||
Automotive Services | |||||||||||||||||||
AEP Holdings, Inc. and Arrowhead Holdco Company | Distributor of non-discretionary, mission-critical aftermarket replacement parts | First lien senior secured loan ($1.9 par due 8/2021) | 7.75% (Libor + 6.75%/Q) | 12/14/2016 | 1.9 | 1.9 | (2)(19) | ||||||||||||
Common stock (3,467 shares) | 8/31/2015 | 3.5 | 3.8 | (2) | |||||||||||||||
5.4 | 5.7 | ||||||||||||||||||
CH Hold Corp. (24) | Collision repair company | First lien senior secured revolving loan ($1.2 par due 11/2019) | 8.00% (Base Rate + 4.25%/Q) | 2/24/2016 | 1.2 | 1.2 | (2)(19)(23) | ||||||||||||
ChargePoint, Inc. | Developer and operator of electric vehicle charging stations | Second lien senior secured loan ($20.0 par due 8/2020) | 9.75% (Libor + 8.75%/M) | 12/24/2014 | 19.5 | 20.0 | (2)(19) | ||||||||||||
Warrant to purchase up to 809,126 shares of Series E preferred stock (expires 12/2024) | 12/24/2014 | 0.3 | 1.5 | (2) | |||||||||||||||
19.8 | 21.5 | ||||||||||||||||||
Dent Wizard International Corporation and DWH Equity Investors, L.P. | Automotive reconditioning services | Second lien senior secured loan ($50.0 par due 10/2020) | 10.25% (Libor + 9.25%/Q) | 4/7/2015 | 50.0 | 50.0 | (3)(19) | ||||||||||||
Class A common stock (10,000 shares) | 4/7/2015 | 0.3 | 0.7 | (2) | |||||||||||||||
Class B common stock (20,000 shares) | 4/7/2015 | 0.7 | 1.3 | (2) | |||||||||||||||
51.0 | 52.0 | ||||||||||||||||||
Eckler Industries, Inc. (24) | Restoration parts and accessories provider for classic automobiles | First lien senior secured revolving loan ($2.0 par due 7/2017) | 8.75% (Base Rate + 5.00%/Q) | 7/12/2012 | 2.0 | 1.9 | (2)(19) | ||||||||||||
First lien senior secured loan ($6.9 par due 7/2017) | 7.25% (Libor + 6.00%/Q) | 7/12/2012 | 6.9 | 6.7 | (3)(19) | ||||||||||||||
First lien senior secured loan ($25.9 par due 7/2017) | 7.25% (Libor + 6.00%/Q) | 7/12/2012 | 25.9 | 25.2 | (3)(19) | ||||||||||||||
Series A preferred stock (1,800 shares) | 7/12/2012 | 1.8 | — | (2) | |||||||||||||||
Common stock (20,000 shares) | 7/12/2012 | 0.2 | — | (2) | |||||||||||||||
36.8 | 33.8 | ||||||||||||||||||
EcoMotors, Inc. | Engine developer | First lien senior secured loan ($9.8 par due 3/2018) | 11.00% | 9/1/2015 | 9.5 | 7.9 | (2) | ||||||||||||
Warrant to purchase up to 321,888 shares of Series C preferred stock (expires 12/2022) | 12/28/2012 | — | — | (2) | |||||||||||||||
Warrant to purchase up to 70,000 shares of Series C preferred stock (expires 2/2025) | 2/24/2015 | — | — | (2) | |||||||||||||||
9.5 | 7.9 | ||||||||||||||||||
ESCP PPG Holdings, LLC (7) | Distributor of new equipment and aftermarket parts to the heavy-duty truck industry | Class A units (3,500,000 units) | 12/14/2016 | 3.5 | 3.7 | (2) | |||||||||||||
Simpson Performance Products, Inc. | Provider of motorsports safety equipment | First lien senior secured loan ($18.5 par due 2/2020) | 9.70% (Libor + 8.70%/Q) | 2/20/2015 | 18.5 | 18.5 | (3)(19) | ||||||||||||
SK SPV IV, LLC | Collision repair site operators | Series A common stock (12,500 units) | 8/18/2014 | 0.6 | 2.9 | (2) | |||||||||||||
Series B common stock (12,500 units) | 8/18/2014 | 0.6 | 2.9 | (2) | |||||||||||||||
1.2 | 5.8 | ||||||||||||||||||
TA THI Parent, Inc. | Collision repair company | Series A preferred stock (50,000 shares) | 7/28/2014 | 5.0 | 14.3 | (2) | |||||||||||||
151.9 | 164.4 | 3.18 | % | ||||||||||||||||
F-60
As of December 31, 2016
(dollar amounts in millions)
Company(1) | Business Description | Investment | Interest(6)(12) | Acquisition Date | Amortized Cost | Fair Value | Percentage of Net Assets | ||||||||||||
Oil and Gas | |||||||||||||||||||
Lonestar Prospects, Ltd. | Sand proppant producer and distributor to the oil and natural gas industry | First lien senior secured loan ($70.1 par due 9/2018) | 8.50% (Libor + 6.50% Cash, 1.00% PIK/Q) | 9/18/2014 | 70.1 | 70.1 | (3)(19) | ||||||||||||
Petroflow Energy Corporation and TexOak Petro Holdings LLC (7) | Oil and gas exploration and production company | First lien senior secured loan ($16.5 par due 6/2019) | 3.00% (Libor + 2.00%/Q) | 6/29/2016 | 16.1 | 15.0 | (2)(19) | ||||||||||||
Second lien senior secured loan ($22.6 par due 12/2019) | 6/29/2016 | 21.8 | 6.6 | (2)(18) | |||||||||||||||
Common units (202,000 units) | 6/29/2016 | 11.1 | — | ||||||||||||||||
49.0 | 21.6 | ||||||||||||||||||
119.1 | 91.7 | 1.78 | % | ||||||||||||||||
Commercial Real Estate Finance | |||||||||||||||||||
10th Street, LLC and New 10th Street, LLC (8) | Real estate holding company | First lien senior secured loan ($25.6 par due 11/2019) | 12.00% Cash, 1.00% PIK | 3/31/2014 | 25.6 | 25.6 | (2) | ||||||||||||
Senior subordinated loan ($27.5 par due 11/2019) | 12.00% Cash, 1.00% PIK | 4/1/2010 | 27.5 | 27.5 | (2) | ||||||||||||||
Member interest (10.00% interest) | 4/1/2010 | 0.6 | — | ||||||||||||||||
Option (25,000 units) | 4/1/2010 | — | 35.3 | ||||||||||||||||
53.7 | 88.4 | ||||||||||||||||||
53.7 | 88.4 | 1.71 | % | ||||||||||||||||
Aerospace and Defense | |||||||||||||||||||
Cadence Aerospace, LLC | Aerospace precision components manufacturer | First lien senior secured loan ($4.0 par due 5/2018) | 7.00% (Libor + 5.75%/Q) | 5/15/2012 | 4.0 | 4.0 | (4)(19) | ||||||||||||
Second lien senior secured loan ($79.7 par due 5/2019) | 11.00% (Libor + 9.75%/Q) | 5/10/2012 | 79.7 | 77.3 | (2)(19) | ||||||||||||||
83.7 | 81.3 | ||||||||||||||||||
83.7 | 81.3 | 1.57 | % | ||||||||||||||||
Environmental Services | |||||||||||||||||||
MPH Energy Holdings, LP | Operator of municipal recycling facilities | Limited partnership interest (3.13% interest) | 1/8/2014 | — | — | (2) | |||||||||||||
Pegasus Community Energy, LLC | Operator of municipal recycling facilities | Preferred stock (1,000 shares) | 3/1/2011 | 8.8 | — | (2) | |||||||||||||
Waste Pro USA, Inc | Waste management services | Second lien senior secured loan ($75.9 par due 10/2020) | 8.50% (Libor + 7.50%/Q) | 10/15/2014 | 75.9 | 75.9 | (3)(19) | ||||||||||||
84.7 | 75.9 | 1.47 | % | ||||||||||||||||
Chemicals | |||||||||||||||||||
Genomatica, Inc. | Developer of a biotechnology platform for the production of chemical products | Warrant to purchase 322,422 shares of Series D preferred stock (expires 3/2023) | 3/28/2013 | — | — | (2) | |||||||||||||
K2 Pure Solutions Nocal, L.P. (24) | Chemical Producer | First lien senior secured revolving loan ($1.5 par due 2/2021) | 8.125% (Libor + 7.125%/Q) | 8/19/2013 | 1.5 | 1.5 | (2)(19) | ||||||||||||
First lien senior secured loan ($40.0 par due 2/2021) | 7.00% (Libor + 6.00%/Q) | 8/19/2013 | 40.0 | 40.0 | (3)(19) | ||||||||||||||
First lien senior secured loan ($13.0 par due 2/2021) | 7.00% (Libor + 6.00%/Q) | 8/19/2013 | 13.0 | 13.0 | (4)(19) | ||||||||||||||
54.5 | 54.5 | ||||||||||||||||||
Kinestral Technologies, Inc. | Designer of adaptive, dynamic glass for the commercial and residential markets | First lien senior secured loan ($8.5 par due 10/2018) | 8.75% (Libor + 7.75%/M) | 4/22/2014 | 8.4 | 8.5 | (2)(17)(19) | ||||||||||||
Warrant to purchase up to 325,000 shares of Series A preferred stock (expires 4/2024) | 4/22/2014 | 0.1 | 0.2 | (2) | |||||||||||||||
Warrant to purchase up to 131,883 shares of Series B preferred stock (expires 4/2025) | 4/9/2015 | — | — | (2) | |||||||||||||||
8.5 | 8.7 | ||||||||||||||||||
63.0 | 63.2 | 1.22 | % | ||||||||||||||||
Health Clubs | |||||||||||||||||||
F-61
As of December 31, 2016
(dollar amounts in millions)
Company(1) | Business Description | Investment | Interest(6)(12) | Acquisition Date | Amortized Cost | Fair Value | Percentage of Net Assets | ||||||||||||
Athletic Club Holdings, Inc. | Premier health club operator | First lien senior secured loan ($35.0 par due 10/2020) | 9.50% (Libor + 8.50%/Q) | 10/11/2007 | 35.0 | 35.0 | (3)(19) | ||||||||||||
CFW Co-Invest, L.P., NCP Curves, L.P. and Curves International Holdings, Inc. | Health club franchisor | Limited partnership interest (4,152,165 shares) | 7/31/2012 | 4.2 | 0.8 | (2) | |||||||||||||
Common stock (1,680 shares) | 11/12/2014 | — | — | (2)(9) | |||||||||||||||
Limited partnership interest (2,218,235 shares) | 7/31/2012 | 2.2 | 8.5 | (2)(9) | |||||||||||||||
6.4 | 9.3 | ||||||||||||||||||
41.4 | 44.3 | 0.86 | % | ||||||||||||||||
Hotel Services | |||||||||||||||||||
Aimbridge Hospitality, LLC (24) | Hotel operator | First lien senior secured loan ($2.9 par due 10/2018) | 8.25% (Libor + 7.00%/Q) | 1/7/2016 | 2.8 | 2.9 | (2)(15)(19) | ||||||||||||
First lien senior secured loan ($3.3 par due 10/2018) | 8.25% (Libor + 7.00%/Q) | 7/15/2015 | 3.2 | 3.3 | (2)(15)(19) | ||||||||||||||
First lien senior secured loan ($14.8 par due 10/2018) | 8.25% (Libor + 7.00%/Q) | 7/15/2015 | 14.7 | 14.8 | (4)(15)(19) | ||||||||||||||
20.7 | 21.0 | ||||||||||||||||||
Pyramid Management Advisors, LLC and Pyramid Investors, LLC | Hotel operator | First lien senior secured loan ($3.0 par due 7/2021) | 11.12% (Libor + 10.12%/Q) | 7/15/2016 | 3.0 | 2.9 | (2)(19) | ||||||||||||
First lien senior secured loan ($19.5 par due 7/2021) | 11.12% (Libor + 10.12%/Q) | 7/15/2016 | 19.5 | 19.1 | (3)(19) | ||||||||||||||
Membership units (990,369 units) | 7/15/2016 | 1.0 | 0.7 | (2) | |||||||||||||||
23.5 | 22.7 | ||||||||||||||||||
44.2 | 43.7 | 0.85 | % | ||||||||||||||||
Wholesale Distribution | |||||||||||||||||||
Flow Solutions Holdings, Inc. | Distributor of high value fluid handling, filtration and flow control products | Second lien senior secured loan ($6.0 par due 10/2018) | 10.00% (Libor + 9.00%/Q) | 12/16/2014 | 6.0 | 5.3 | (2)(19) | ||||||||||||
Second lien senior secured loan ($29.5 par due 10/2018) | 10.00% (Libor + 9.00%/Q) | 12/16/2014 | 29.5 | 26.0 | (2)(19) | ||||||||||||||
35.5 | 31.3 | ||||||||||||||||||
35.5 | 31.3 | 0.61 | % | ||||||||||||||||
Farming and Agriculture | |||||||||||||||||||
QC Supply, LLC (24) | Specialty distributor and solutions provider to the swine and poultry markets | First lien senior secured revolving loan ($2.3 par due 12/2021) | 7.00% (Libor + 6.00%/Q) | 12/29/2016 | 2.3 | 2.3 | (2)(19) | ||||||||||||
First lien senior secured loan ($28.9 par due 12/2022) | 7.00% (Libor + 6.00%/Q) | 12/29/2016 | 28.9 | 28.9 | (2)(19) | ||||||||||||||
31.2 | 31.2 | ||||||||||||||||||
31.2 | 31.2 | 0.60 | % | ||||||||||||||||
Telecommunications | |||||||||||||||||||
Adaptive Mobile Security Limited (9) | Developer of security software for mobile communications networks | First lien senior secured loan ($1.8 par due 7/2018) | 12.00% (Euribor + 9.00% Cash, 1% PIK/M) | 1/16/2015 | 2.0 | 1.8 | (2)(17)(19) | ||||||||||||
First lien senior secured loan ($0.5 par due 10/2018) | 12.00% (Euribor + 9.00% Cash, 1% PIK/M) | 1/16/2015 | 0.5 | 0.5 | (2)(17)(19) | ||||||||||||||
First lien senior secured loan ($1.1 par due 10/2018) | 12.00% (Euribor + 9.00% Cash, 1% PIK/M) | 10/17/2016 | 1.1 | 1.1 | (2)(17)(19) | ||||||||||||||
3.6 | 3.4 | ||||||||||||||||||
American Broadband Holding Company and Cameron Holdings of NC, Inc. | Broadband communication services | Warrant to purchase up to 208 shares (expires 11/2017) | 11/7/2007 | — | 7.2 | ||||||||||||||
Warrant to purchase up to 200 shares (expires 9/2020) | 9/1/2010 | — | 6.9 | ||||||||||||||||
— | 14.1 | ||||||||||||||||||
Startec Equity, LLC (8) | Communication services | Member interest | 4/1/2010 | — | — | ||||||||||||||
F-62
As of December 31, 2016
(dollar amounts in millions)
Company(1) | Business Description | Investment | Interest(6)(12) | Acquisition Date | Amortized Cost | Fair Value | Percentage of Net Assets | ||||||||||||
Wilcon Holdings LLC | Communications infrastructure provider | Class A common stock (2,000,000 shares) | 12/13/2013 | 1.8 | 3.7 | ||||||||||||||
5.4 | 21.2 | 0.41 | % | ||||||||||||||||
Retail | |||||||||||||||||||
Paper Source, Inc. and Pine Holdings, Inc. (24) | Retailer of fine and artisanal paper products | First lien senior secured loan ($9.7 par due 9/2018) | 7.25% (Libor + 6.25%/Q) | 9/23/2013 | 9.7 | 9.7 | (4)(19) | ||||||||||||
Class A common stock (36,364 shares) | 9/23/2013 | 6.0 | 5.9 | (2) | |||||||||||||||
15.7 | 15.6 | ||||||||||||||||||
Things Remembered, Inc. and TRM Holdco Corp. (7) | Personalized gifts retailer | First lien senior secured loan ($11.0 par due 3/2020) | 8/30/2016 | 10.6 | 3.5 | (2)(18) | |||||||||||||
Common stock (10,631,940 shares) | 8/30/2016 | 6.1 | — | (2) | |||||||||||||||
16.7 | 3.5 | ||||||||||||||||||
32.4 | 19.1 | 0.37 | % | ||||||||||||||||
Computers and Electronics | |||||||||||||||||||
Everspin Technologies, Inc. (24) | Designer and manufacturer of computer memory solutions | First lien senior secured revolving loan ($1.1 par due 6/2017) | 7.50% (Base Rate + 7.50%/M) | 6/5/2015 | 1.1 | 1.1 | (5)(19) | ||||||||||||
First lien senior secured loan ($7.3 par due 6/2019) | 8.75% (Libor + 7.75%/M) | 6/5/2015 | 7.0 | 7.3 | (5)(19) | ||||||||||||||
Warrant to purchase up to 18,461 shares of common stock (expires 10/2026) | 6/5/2015 | 0.4 | 0.4 | (5) | |||||||||||||||
8.5 | 8.8 | ||||||||||||||||||
8.5 | 8.8 | 0.17 | % | ||||||||||||||||
Printing, Publishing and Media | |||||||||||||||||||
Earthcolor Group, LLC | Printing management services | Limited liability company interests (9.30%) | 5/18/2012 | — | — | ||||||||||||||
The Teaching Company Holdings, Inc. | Education publications provider | Preferred stock (10,663 shares) | 9/29/2006 | 1.1 | 3.0 | (2) | |||||||||||||
Common stock (15,393 shares) | 9/29/2006 | — | — | (2) | |||||||||||||||
1.1 | 3.0 | ||||||||||||||||||
1.1 | 3.0 | 0.06 | % | ||||||||||||||||
Total Investments | $ | 9,034.1 | $ | 8,819.9 | (29) | 170.77 | % | ||||||||||||
Derivative Instruments
Description | Notional Amount to be Purchased | Notional Amount to be Sold | Counterparty | Settlement Date | Unrealized Appreciation / (Depreciation) | ||||
Foreign currency forward contract | $ | 3 | € | 2 | Bank of Montreal | January 5, 2017 | — | ||
____________________________________________________
(1) | Other than the Company’s investments listed in footnote 8 below (subject to the limitations set forth therein), the Company does not “Control” any of its portfolio companies, for the purposes of the Investment Company Act of 1940, as amended (together with the rules and regulations promulgated thereunder, the “Investment Company Act”). In general, under the Investment Company Act, the Company would “Control” a portfolio company if the Company owned more than 25% of its outstanding voting securities (i.e., securities with the right to elect directors) and/or had the power to exercise control over the management or policies of such portfolio company. All of the Company’s portfolio company investments, which as of December 31, 2016 represented 171% of the Company’s net assets or 95% of the Company’s total assets, are subject to legal restrictions on sales. |
(2) | These assets are pledged as collateral for the Revolving Credit Facility (as defined below) and, as a result, are not directly available to the creditors of the Company to satisfy any obligations of the Company other than the Company’s obligations under the Revolving Credit Facility (see Note 5 to the consolidated financial statements). |
(3) | These assets are owned by the Company’s consolidated subsidiary Ares Capital CP Funding LLC (“Ares Capital CP”), are pledged as collateral for the Revolving Funding Facility (as defined below) and, as a result, are not directly |
F-63
available to the creditors of the Company to satisfy any obligations of the Company other than Ares Capital CP’s obligations under the Revolving Funding Facility (see Note 5 to the consolidated financial statements).
(4) | These assets are owned by the Company’s consolidated subsidiary Ares Capital JB Funding LLC (“ACJB”), are pledged as collateral for the SMBC Funding Facility (as defined below) and, as a result, are not directly available to the creditors of the Company to satisfy any obligations of the Company other than ACJB’s obligations under the SMBC Funding Facility (see Note 5 to the consolidated financial statements). |
(5) | These assets are owned by the Company’s consolidated subsidiary Ares Venture Finance, L.P. (“AVF LP”), are pledged as collateral for the SBA-guaranteed debentures (the “SBA Debentures”) and, as a result, are not directly available to the creditors of the Company to satisfy any obligations of the Company other than AVF LP’s obligations (see Note 5 to the consolidated financial statements). AVF LP operates as a Small Business Investment Company (“SBIC”) under the provisions of Section 301(c) of the Small Business Investment Act of 1958, as amended. |
(6) | Investments without an interest rate are non-income producing. |
(7) | As defined in the Investment Company Act, the Company is deemed to be an “Affiliated Person” because it owns 5% or more of the portfolio company’s outstanding voting securities or it has the power to exercise control over the management or policies of such portfolio company (including through a management agreement). Transactions during the year ended December 31, 2016 in which the issuer was an Affiliated Person (but not a portfolio company that the Company is deemed to Control) are as follows: |
(in millions) Company | Purchases (cost) | Redemptions (cost) | Sales (cost) | Interest income | Capital structuring service fees | Dividend income | Other income | Net realized gains (losses) | Net unrealized gains (losses) | |||||||||||||||||||||||||||
Campus Management Corp. and Campus Management Acquisition Corp. | $ | — | $ | — | $ | — | $ | — | $ | — | $ | — | $ | — | $ | — | $ | 1.0 | ||||||||||||||||||
Crown Health Care Laundry Services, Inc. and Crown Laundry Holdings, LLC | $ | 9.3 | $ | 4.1 | $ | 18.0 | $ | 1.2 | $ | 0.4 | $ | — | $ | — | $ | — | $ | (0.6 | ) | |||||||||||||||||
ESCP PPG Holdings, LLC | $ | 3.5 | $ | — | $ | — | $ | — | $ | — | $ | — | $ | — | $ | — | $ | — | ||||||||||||||||||
Investor Group Services, LLC | $ | — | $ | — | $ | — | $ | — | $ | — | $ | — | $ | — | $ | 0.4 | $ | — | ||||||||||||||||||
Multi-Ad Services, Inc. | $ | — | $ | — | $ | — | $ | — | $ | — | $ | — | $ | — | $ | — | $ | — | ||||||||||||||||||
Petroflow Energy Corporation and TexOak Petro Holdings LLC | $ | — | $ | — | $ | — | $ | — | $ | — | $ | — | $ | — | $ | — | $ | 3.4 | ||||||||||||||||||
Shock Doctor, Inc. and Shock Doctor Holdings, LLC | $ | — | $ | — | $ | — | $ | 10.5 | $ | — | $ | — | $ | — | $ | — | $ | (4.8 | ) | |||||||||||||||||
Things Remembered, Inc. and TRM Holdco Corp. | $ | 3.3 | $ | 3.3 | $ | — | $ | — | $ | — | $ | — | $ | — | $ | — | $ | (2.1 | ) | |||||||||||||||||
UL Holding Co., LLC and Universal Lubricants, LLC | $ | — | $ | 45.3 | $ | — | $ | 3.8 | $ | — | $ | — | $ | — | $ | 13.2 | $ | 17.2 | ||||||||||||||||||
(8) | As defined in the Investment Company Act, the Company is deemed to be both an “Affiliated Person” and “Control” this portfolio company because it owns more than 25% of the portfolio company’s outstanding voting securities or it has the power to exercise control over the management or policies of such portfolio company (including through a management agreement). Transactions during the year ended December 31, 2016 in which the issuer was both an Affiliated Person and a portfolio company that the Company is deemed to Control are as follows: |
(in millions) Company | Purchases (cost) | Redemptions (cost) | Sales (cost) | Interest income | Capital structuring service fees | Dividend income | Other income | Net realized gains (losses) | Net unrealized gains (losses) | |||||||||||||||||||||||||||
10th Street, LLC and New 10th Street, LLC | $ | — | $ | — | $ | — | $ | 6.9 | $ | — | $ | — | $ | — | $ | — | $ | (9.2 | ) | |||||||||||||||||
ADF Capital, Inc., ADF Restaurant Group, LLC, and ARG Restaurant Holdings, Inc. | $ | 3.1 | $ | — | $ | — | $ | — | $ | — | $ | — | $ | — | $ | — | $ | (10.8 | ) | |||||||||||||||||
AllBridge Financial, LLC | $ | — | $ | 1.1 | $ | — | $ | — | $ | — | $ | — | $ | — | $ | 6.3 | $ | (6.5 | ) | |||||||||||||||||
Callidus Capital Corporation | $ | — | $ | — | $ | — | $ | — | $ | — | $ | — | $ | — | $ | — | $ | — | ||||||||||||||||||
Ciena Capital LLC | $ | — | $ | 12.0 | $ | — | $ | 1.5 | $ | — | $ | — | $ | — | $ | — | $ | 0.9 | ||||||||||||||||||
Community Education Centers, Inc. and CEC Parent Holdings LLC | $ | — | $ | — | $ | — | $ | 4.6 | $ | — | $ | — | $ | — | $ | — | $ | 18.9 | ||||||||||||||||||
Competitor Group, Inc., Calera XVI, LLC and Champion Parent Corporation | $ | 2.5 | $ | — | $ | — | $ | 1.7 | $ | — | $ | — | $ | — | $ | — | $ | (0.8 | ) | |||||||||||||||||
Crescent Hotels & Resorts, LLC and affiliates | $ | — | $ | — | $ | — | $ | 1.2 | $ | — | $ | — | $ | — | $ | 2.5 | $ | (2.7 | ) | |||||||||||||||||
HCI Equity, LLC | $ | — | $ | — | $ | — | $ | — | $ | — | $ | — | $ | — | $ | — | $ | — | ||||||||||||||||||
F-64
Industrial Air Tool, LP and Affiliates d/b/a Industrial Air Tool | $ | — | $ | — | $ | — | $ | — | $ | — | $ | — | $ | — | $ | — | $ | — | ||||||||||||||||||
Ivy Hill Asset Management, L.P. | $ | — | $ | — | $ | — | $ | — | $ | — | $ | 40.0 | $ | — | $ | — | $ | (6.3 | ) | |||||||||||||||||
Liquid Light, Inc. | $ | — | $ | 2.4 | $ | — | $ | — | $ | — | $ | — | $ | — | $ | (0.6 | ) | $ | — | |||||||||||||||||
MVL Group, Inc. | $ | — | $ | — | $ | — | $ | — | $ | — | $ | — | $ | — | $ | — | $ | — | ||||||||||||||||||
Orion Foods, LLC | $ | — | $ | 6.4 | $ | — | $ | — | $ | — | $ | — | $ | — | $ | — | $ | 3.1 | ||||||||||||||||||
PHL Investors, Inc., and PHL Holding Co. | $ | — | $ | — | $ | — | $ | — | $ | — | $ | — | $ | — | $ | — | $ | — | ||||||||||||||||||
Senior Direct Lending Program, LLC* | $ | 271.6 | $ | 1.7 | $ | — | $ | 12.6 | $ | 4.9 | $ | — | $ | 0.7 | $ | — | $ | — | ||||||||||||||||||
Senior Secured Loan Fund LLC** | $ | 3.0 | $ | — | $ | — | $ | 208.0 | $ | 2.9 | $ | — | $ | 17.0 | $ | — | $ | 26.3 | ||||||||||||||||||
Startec Equity, LLC | $ | — | $ | — | $ | — | $ | — | $ | — | $ | — | $ | — | $ | — | $ | — | ||||||||||||||||||
The Greeley Company, Inc. and HCP Acquisition Holdings, LLC | $ | — | $ | 2.7 | $ | — | $ | — | $ | — | $ | — | $ | — | $ | 3.9 | $ | 3.1 | ||||||||||||||||||
The Step2 Company, LLC | $ | — | $ | 64.7 | $ | — | $ | 4.6 | $ | — | $ | — | $ | — | $ | 18.1 | $ | 24.4 | ||||||||||||||||||
______________________________________________________________________
* | Together with Varagon Capital Partners (“Varagon”), the Company has co-invested through the Senior Direct Lending Program LLC (d/b/a the “Senior Direct Lending Program” or the “SDLP”). The SDLP has been capitalized as transactions are completed and all portfolio decisions and generally all other decisions in respect of the SDLP must be approved by an investment committee of the SDLP consisting of representatives of the Company and Varagon (with approval from a representative of each required); therefore, although the Company owns more than 25% of the voting securities of the SDLP, the Company does not believe that it has control over the SDLP (for purposes of the Investment Company Act or otherwise) because, among other things, these “voting securities” do not afford the Company the right to elect directors of the SDLP or any other special rights (see Note 4 to the consolidated financial statements). |
** | Together with GE Global Sponsor Finance LLC and General Electric Capital Corporation (together,“GE”), the Company had previously co-invested through the Senior Secured Loan Fund LLC (d/b/a the “Senior Secured Loan Program” or the “SSLP”). The SSLP was capitalized as transactions were completed and all portfolio decisions and generally all other decisions in respect of the SSLP were approved by an investment committee of the SSLP consisting of representatives of the Company and GE (with approval from a representative of each required); therefore, although the Company owned more than 25% of the voting securities of the SSLP, the Company did not believe that it had control over the SSLP (for purposes of the Investment Company Act or otherwise) because, among other things, these “voting securities” did not afford the Company the right to elect directors of the SSLP or any other special rights (see Note 4 to the consolidated financial statements). |
(9) | Non-U.S. company or principal place of business outside the U.S. and as a result is not a qualifying asset under Section 55(a) of the Investment Company Act. Under the Investment Company Act, the Company may not acquire any non-qualifying asset unless, at the time such acquisition is made, qualifying assets represent at least 70% of the Company’s total assets. |
(10) | Exception from the definition of investment company under Section 3(c) of the Investment Company Act and as a result is not a qualifying asset under Section 55(a) of the Investment Company Act. Under the Investment Company Act, the Company may not acquire any non-qualifying asset unless, at the time such acquisition is made, qualifying assets represent at least 70% of the Company’s total assets. |
(11) | In the first quarter of 2011, the staff of the Securities and Exchange Commission (the “Staff”) informally communicated to certain business development companies (“BDCs”) the Staff’s belief that certain entities, which would be classified as an “investment company” under the Investment Company Act but for the exception from the definition of “investment company” set forth in Rule 3a-7 promulgated under the Investment Company Act, could not be treated as eligible portfolio companies (as defined in Section 2(a)(46) under Investment Company Act) (i.e. not eligible to be included in a BDC’s 70% “qualifying assets” basket). Subsequently, in August 2011 the Securities and Exchange Commission issued a concept release (the “Concept Release”) which stated that “[a]s a general matter, the Commission presently does not believe that Rule 3a-7 issuers are the type of small, developing and financially troubled businesses in which the U.S. Congress intended BDCs primarily to invest” and requested comment on whether or not a 3a-7 issuer should be considered an “eligible portfolio company”. The Company provided a comment letter in respect of the Concept Release and continues to believe that the language of Section 2(a)(46) of the Investment Company Act permits a BDC to treat as “eligible portfolio companies” entities that rely on the 3a-7 exception. However, given the current uncertainty in this area (including the language in the Concept Release) and subsequent discussions with the Staff, the Company has, solely for purposes of calculating the composition of its |
F-65
portfolio pursuant to Section 55(a) of the Investment Company Act, identified such entities, which include the SSLP, as “non-qualifying assets” should the Staff ultimately disagree with the Company’s position. Pursuant to Section 55(a) of the Investment Company Act (using the Staff’s methodology described above solely for this purpose), 29% of the Company’s total assets are represented by investments at fair value and other assets that are considered “non-qualifying assets” as of December 31, 2016.
(12) | Variable rate loans to the Company’s portfolio companies bear interest at a rate that may be determined by reference to either the LIBOR or an alternate base rate (commonly based on the Federal Funds Rate or the Prime Rate), at the borrower’s option, which reset annually (A), semi-annually (S), quarterly (Q), bi-monthly (B), monthly (M) or daily (D). For each such loan, the Company has provided the interest rate in effect on the date presented. |
(13) | In addition to the interest earned based on the stated interest rate of this security, the Company is entitled to receive an additional interest amount of 1.13% on $8.9 aggregate principal amount of a “first out” tranche of the portfolio company’s senior term debt previously syndicated by the Company into “first out” and “last out” tranches, whereby the “first out” tranche will have priority as to the “last out” tranche with respect to payments of principal, interest and any other amounts due thereunder. |
(14) | In addition to the interest earned based on the stated interest rate of this security, the Company is entitled to receive an additional interest amount of 2.00% on $81.5 aggregate principal amount of a “first out” tranche of the portfolio company’s senior term debt previously syndicated by the Company into “first out” and “last out” tranches, whereby the “first out” tranche will have priority as to the “last out” tranche with respect to payments of principal, interest and any other amounts due thereunder. |
(15) | In addition to the interest earned based on the stated interest rate of this security, the Company is entitled to receive an additional interest amount of 2.50% on $69.5 aggregate principal amount of a “first out” tranche of the portfolio company’s senior term debt previously syndicated by the Company into “first out” and “last out” tranches, whereby the “first out” tranche will have priority as to the “last out” tranche with respect to payments of principal, interest and any other amounts due thereunder. |
(16) | In addition to the interest earned based on the stated interest rate of this security, the Company is entitled to receive an additional interest amount of 2.55% on $35.2 aggregate principal amount of a “first out” tranche of the portfolio company’s first lien senior secured loans, whereby the “first out” tranche will have priority as to the “last out” tranche with respect to payments of principal, interest and any other amounts due thereunder. |
(17) | The Company is entitled to receive a fixed fee upon the occurrence of certain events as defined in the credit agreement governing the Company’s debt investment in the portfolio company. The fair value of such fee is included in the fair value of the debt investment. |
(18) | Loan was on non-accrual status as of December 31, 2016. |
(19) | Loan includes interest rate floor feature. |
(20) | The certificates have a stated contractual interest rate and also entitle the holders thereof to receive a portion of the excess cash flow from the SSLP’s loan portfolio, after expenses. However, the SSLP Certificates (defined below) are junior in right of payment to the senior notes held by GE, and the Company expects that for so long as principal proceeds from SSLP repayments are directed entirely to repay the senior notes as discussed above, the yield on the SSLP Certificates will be lower than the stated coupon and continue to decline. See Note 4 to the consolidated financial statements for more information on the SSLP. |
(21) | In addition to the interest earned based on the stated contractual interest rate of this security, the certificates entitle the holders thereof to receive a portion of the excess cash flow from the SDLP’s loan portfolio, after expenses, which may result in a return to the Company greater than the contractual stated interest rate. |
(22) | As of December 31, 2016, no amounts were funded by the Company under this first lien senior secured revolving loan; however, there were letters of credit issued and outstanding through a financial intermediary under the loan. See Note 7 to the consolidated financial statements for further information on letters of credit commitments related to certain portfolio companies. |
F-66
(23) | As of December 31, 2016, in addition to the amounts funded by the Company under this first lien senior secured revolving loan, there were also letters of credit issued and outstanding through a financial intermediary under the loan. See Note 7 to the consolidated financial statements for further information on letters of credit commitments related to certain portfolio companies. |
(24) | As of December 31, 2016, the Company had the following commitments to fund various revolving and delayed draw senior secured and subordinated loans, including commitments to issue letters of credit through a financial intermediary on behalf of certain portfolio companies. Such commitments are subject to the satisfaction of certain conditions set forth in the documents governing these loans and letters of credit and there can be no assurance that such conditions will be satisfied. See Note 7 to the consolidated financial statements for further information on revolving and delayed draw loan commitments, including commitments to issue letters of credit, related to certain portfolio companies. |
(in millions) Portfolio Company | Total revolving and delayed draw loan commitments | Less: drawn commitments | Total undrawn commitments | Less: commitments substantially at discretion of the Company | Less: unavailable commitments due to borrowing base or other covenant restrictions | Total net adjusted undrawn revolving and delayed draw commitments | |||||||||||||||||
Accruent, LLC | $ | 3.2 | $ | (0.3 | ) | $ | 2.9 | $ | — | $ | — | $ | 2.9 | ||||||||||
Acrisure, LLC | 9.7 | — | 9.7 | — | — | 9.7 | |||||||||||||||||
ADCS Clinics Intermediate Holdings, LLC | 5.0 | (1.7 | ) | 3.3 | — | — | 3.3 | ||||||||||||||||
ADG, LLC | 13.7 | (2.0 | ) | 11.7 | — | — | 11.7 | ||||||||||||||||
Aimbridge Hospitality, LLC | 2.4 | — | 2.4 | — | — | 2.4 | |||||||||||||||||
American Seafoods Group LLC | 22.1 | — | 22.1 | — | — | 22.1 | |||||||||||||||||
Benihana, Inc. | 3.2 | (2.1 | ) | 1.1 | — | — | 1.1 | ||||||||||||||||
CCS Intermediate Holdings, LLC | 7.5 | (7.3 | ) | 0.2 | — | — | 0.2 | ||||||||||||||||
CH Hold Corp. | 5.0 | (1.2 | ) | 3.8 | — | — | 3.8 | ||||||||||||||||
Chariot Acquisition, LLC | 1.0 | — | 1.0 | — | — | 1.0 | |||||||||||||||||
Ciena Capital LLC | 20.0 | (14.0 | ) | 6.0 | (6.0 | ) | — | — | |||||||||||||||
Clearwater Analytics, LLC | 5.0 | — | 5.0 | — | — | 5.0 | |||||||||||||||||
Competitor Group, Inc. | 5.7 | (5.5 | ) | 0.2 | — | — | 0.2 | ||||||||||||||||
Component Hardware Group, Inc. | 3.7 | (1.9 | ) | 1.8 | — | — | 1.8 | ||||||||||||||||
Crown Health Care Laundry Services, Inc. | 17.0 | (0.6 | ) | 16.4 | — | — | 16.4 | ||||||||||||||||
D4C Dental Brands, Inc. | 5.0 | — | 5.0 | — | — | 5.0 | |||||||||||||||||
DCA Investment Holding, LLC | 5.8 | (2.2 | ) | 3.6 | — | — | 3.6 | ||||||||||||||||
DTI Holdco, Inc. and OPE DTI Holdings, Inc. | 8.8 | — | 8.8 | — | — | 8.8 | |||||||||||||||||
Eckler Industries, Inc. | 4.0 | (2.0 | ) | 2.0 | — | — | 2.0 | ||||||||||||||||
EN Engineering, L.L.C. | 5.0 | — | 5.0 | — | — | 5.0 | |||||||||||||||||
Everspin Technologies, Inc. | 4.0 | (1.1 | ) | 2.9 | — | — | 2.9 | ||||||||||||||||
Faction Holdings, Inc. | 2.0 | (2.0 | ) | — | — | — | — | ||||||||||||||||
Garden Fresh Restaurant Corp. | 7.0 | (2.3 | ) | 4.7 | — | — | 4.7 | ||||||||||||||||
Gentle Communications, LLC | 5.0 | — | 5.0 | — | — | 5.0 | |||||||||||||||||
Greenphire, Inc. | 2.0 | — | 2.0 | — | — | 2.0 | |||||||||||||||||
Harvey Tool Company, LLC | 0.8 | — | 0.8 | — | — | 0.8 | |||||||||||||||||
Hygiena Borrower LLC | 1.9 | — | 1.9 | — | — | 1.9 | |||||||||||||||||
ICSH, Inc. | 5.0 | (1.8 | ) | 3.2 | — | — | 3.2 | ||||||||||||||||
Infilaw Holdings, LLC | 20.0 | (13.6 | ) | 6.4 | (6.4 | ) | — | — | |||||||||||||||
iPipeline, Inc. | 4.0 | — | 4.0 | — | — | 4.0 | |||||||||||||||||
Itel Laboratories, Inc. | 2.5 | — | 2.5 | — | — | 2.5 | |||||||||||||||||
K2 Pure Solutions Nocal, L.P. | 5.0 | (1.5 | ) | 3.5 | — | — | 3.5 | ||||||||||||||||
Lakeland Tours, LLC | 11.9 | (0.5 | ) | 11.4 | — | — | 11.4 | ||||||||||||||||
LBP Intermediate Holdings LLC | 0.9 | (0.1 | ) | 0.8 | — | — | 0.8 | ||||||||||||||||
Massage Envy, LLC | 5.0 | (3.5 | ) | 1.5 | — | — | 1.5 | ||||||||||||||||
McKenzie Sports Products, LLC | 4.5 | — | 4.5 | — | — | 4.5 | |||||||||||||||||
Ministry Brands LLC | 29.2 | (3.8 | ) | 25.4 | — | — | 25.4 | ||||||||||||||||
MW Dental Holding Corp. | 10.0 | (1.5 | ) | 8.5 | — | — | 8.5 | ||||||||||||||||
My Health Direct, Inc. | 1.0 | (0.5 | ) | 0.5 | — | — | 0.5 | ||||||||||||||||
Niagara Fiber Intermediate Corp. | 1.9 | (1.9 | ) | — | — | — | — | ||||||||||||||||
Nordco Inc | 11.3 | — | 11.3 | — | — | 11.3 | |||||||||||||||||
F-67
(in millions) Portfolio Company | Total revolving and delayed draw loan commitments | Less: drawn commitments | Total undrawn commitments | Less: commitments substantially at discretion of the Company | Less: unavailable commitments due to borrowing base or other covenant restrictions | Total net adjusted undrawn revolving and delayed draw commitments | |||||||||||||||||
NSM Sub Holdings Corp. | 5.0 | (0.8 | ) | 4.2 | — | — | 4.2 | ||||||||||||||||
OmniSYS Acquisition Corporation | 2.5 | — | 2.5 | — | — | 2.5 | |||||||||||||||||
OTG Management, LLC | 22.2 | — | 22.2 | — | — | 22.2 | |||||||||||||||||
Paper Source, Inc. | 2.5 | — | 2.5 | — | — | 2.5 | |||||||||||||||||
Pegasus Intermediate Holdings, LLC | 5.0 | — | 5.0 | — | — | 5.0 | |||||||||||||||||
PIH Corporation | 3.3 | (0.6 | ) | 2.7 | — | — | 2.7 | ||||||||||||||||
QC Supply, LLC | 28.1 | (2.3 | ) | 25.8 | — | — | 25.8 | ||||||||||||||||
Restaurant Technologies, Inc. | 5.4 | (0.7 | ) | 4.7 | — | — | 4.7 | ||||||||||||||||
RuffaloCODY, LLC | 7.7 | (0.2 | ) | 7.5 | — | — | 7.5 | ||||||||||||||||
Severin Acquisition, LLC | 2.9 | — | 2.9 | — | — | 2.9 | |||||||||||||||||
Shift PPC LLC | 1.5 | — | 1.5 | — | — | 1.5 | |||||||||||||||||
Sonny’s Enterprises, LLC | 1.8 | — | 1.8 | — | — | 1.8 | |||||||||||||||||
Things Remembered, Inc. | 2.8 | — | 2.8 | — | — | 2.8 | |||||||||||||||||
Towne Holdings, Inc. | 1.0 | — | 1.0 | — | — | 1.0 | |||||||||||||||||
TPTM Merger Corp. | 2.5 | (1.3 | ) | 1.2 | — | — | 1.2 | ||||||||||||||||
Urgent Cares of America Holdings I, LLC | 16.0 | — | 16.0 | — | — | 16.0 | |||||||||||||||||
Zemax, LLC | 3.0 | — | 3.0 | — | — | 3.0 | |||||||||||||||||
Zywave, Inc. | 10.5 | — | 10.5 | — | — | 10.5 | |||||||||||||||||
$ | 411.4 | $ | (80.8 | ) | $ | 330.6 | $ | (12.4 | ) | $ | — | $ | 318.2 | ||||||||||
(25) | As of December 31, 2016, the Company was party to subscription agreements to fund equity investments in private equity investment partnerships as follows: |
(in millions) Portfolio Company | Total private equity commitments | Less: funded private equity commitments | Total unfunded private equity commitments | Less: private equity commitments substantially at the discretion of the Company | Total net adjusted unfunded private equity commitments | ||||||||||
Partnership Capital Growth Investors III, L.P. | $ | 5.0 | $ | (4.2 | ) | $ | 0.8 | $ | — | $ | 0.8 | ||||
PCG-Ares Sidecar Investment, L.P. and PCG-Ares Sidecar Investment II, L.P. | 50.0 | (10.9 | ) | 39.1 | (39.1 | ) | — | ||||||||
Piper Jaffray Merchant Banking Fund I, L.P. | 2.0 | (1.7 | ) | 0.3 | — | 0.3 | |||||||||
$ | 57.0 | $ | (16.8 | ) | $ | 40.2 | $ | (39.1 | ) | $ | 1.1 | ||||
(26) | As of December 31, 2016, the Company had commitments to co-invest in the SSLP for its portion of the SSLP’s commitment to fund delayed draw loans of up to $7.3. See Note 4 to the consolidated financial statements for more information on the SSLP. |
(27) | As of December 31, 2016, the Company had commitments to co-invest in the SDLP for its portion of the SDLP’s commitment to fund delayed draw loans of up to $37.1. See Note 4 to the consolidated financial statements for more information on the SDLP. |
(28) | Other than the investments noted by this footnote, the fair value of the Company’s investments is determined using unobservable inputs that are significant to the overall fair value measurement. See Note 8 to the consolidated financial statements for more information regarding the fair value of the Company’s investments. |
(29) | As of December 31, 2016, the net estimated unrealized loss for federal tax purposes was $0.8 billion based on a tax cost basis of $9.7 billion. As of December 31, 2016, the estimated aggregate gross unrealized loss for federal income tax purposes was $0.9 billion and the estimated aggregate gross unrealized gain for federal income tax purposes was $0.1 billion. |
F-68
ARES CAPITAL CORPORATION AND SUBSIDIARIES
CONSOLIDATED STATEMENT OF STOCKHOLDERS’ EQUITY
(in millions, except per share data)
Common Stock | Capital in Excess of Par Value | Accumulated Undistributed (Overdistributed) Net Investment Income | Accumulated Undistributed (Overdistributed) Net Realized Gains (Losses) on Investments, Foreign Currency Transactions, Extinguishment of Debt and Other Assets | Net Unrealized Gains (Losses) on Investments, Foreign Currency and Other Transactions | Total Stockholders’ Equity | |||||||||||||||||||||
Shares | Amount | |||||||||||||||||||||||||
Balance at December 31, 2014 | 314 | $ | — | $ | 5,328 | $ | (33 | ) | $ | (167 | ) | $ | 155 | $ | 5,283 | |||||||||||
Shares issued in connection with dividend reinvestment plan | — | — | 6 | — | — | — | 6 | |||||||||||||||||||
Repurchase of common stock | — | — | (2 | ) | — | — | — | (2 | ) | |||||||||||||||||
Net increase in stockholders’ equity resulting from operations | — | — | — | 508 | 117 | (246 | ) | 379 | ||||||||||||||||||
Dividends declared and payable ($1.57 per share) | — | — | — | (493 | ) | — | — | (493 | ) | |||||||||||||||||
Tax reclassification of stockholders’ equity in accordance with GAAP | — | — | (14 | ) | 17 | (3 | ) | — | — | |||||||||||||||||
Balance at December 31, 2015 | 314 | $ | — | $ | 5,318 | $ | (1 | ) | $ | (53 | ) | $ | (91 | ) | $ | 5,173 | ||||||||||
Repurchases of common stock | — | — | (5 | ) | — | — | — | (5 | ) | |||||||||||||||||
Net increase in stockholders’ equity resulting from operations | — | — | — | 494 | 110 | (130 | ) | 474 | ||||||||||||||||||
Dividends declared and payable ($1.52 per share) | — | — | — | (477 | ) | — | — | (477 | ) | |||||||||||||||||
Tax reclassification of stockholders’ equity in accordance with GAAP | — | — | (21 | ) | 21 | — | — | — | ||||||||||||||||||
Balance at December 31, 2016 | 314 | $ | — | $ | 5,292 | $ | 37 | $ | 57 | $ | (221 | ) | $ | 5,165 | ||||||||||||
Issuance of common stock in connection with the American Capital Acquisition | 112 | — | 1,839 | — | — | — | 1,839 | |||||||||||||||||||
Deemed contributions from Ares Capital Management (See Note 16) | — | — | 54 | — | — | — | 54 | |||||||||||||||||||
Shares issued in connection with dividend reinvestment plan | — | — | 6 | — | — | — | 6 | |||||||||||||||||||
Issuance of Convertible Unsecured Notes (See Note 5) | — | — | 15 | — | — | — | 15 | |||||||||||||||||||
Net increase in stockholders’ equity resulting from operations | — | — | — | 511 | 20 | 136 | 667 | |||||||||||||||||||
Dividends declared and payable ($1.52 per share) | — | — | — | (648 | ) | — | — | (648 | ) | |||||||||||||||||
Tax reclassification of stockholders’ equity in accordance with GAAP | — | — | (14 | ) | 19 | (5 | ) | — | — | |||||||||||||||||
Balance at December 31, 2017 | 426 | $ | — | $ | 7,192 | $ | (81 | ) | $ | 72 | $ | (85 | ) | $ | 7,098 | |||||||||||
See accompanying notes to consolidated financial statements.
F-69
ARES CAPITAL CORPORATION AND SUBSIDIARIES
CONSOLIDATED STATEMENT OF CASH FLOWS
(in millions)
For the Years Ended December 31, | |||||||||||
2017 | 2016 | 2015 | |||||||||
OPERATING ACTIVITIES: | |||||||||||
Net increase in stockholders’ equity resulting from operations | $ | 667 | $ | 474 | $ | 379 | |||||
Adjustments to reconcile net increase in stockholders’ equity resulting from operations: | |||||||||||
Net realized gains on investments and foreign currency transactions | (24 | ) | (110 | ) | (127 | ) | |||||
Net unrealized losses (gains) on investments, foreign currency and other transactions | (136 | ) | 130 | 246 | |||||||
Realized losses on extinguishment of debt | 4 | — | 10 | ||||||||
Net accretion of discount on investments | (10 | ) | (6 | ) | (4 | ) | |||||
Payment-in-kind interest and dividends | (79 | ) | (48 | ) | (24 | ) | |||||
Collections of payment-in-kind interest and dividends | 65 | 12 | 1 | ||||||||
Amortization of debt issuance costs | 18 | 14 | 17 | ||||||||
Net accretion of discount on notes payable | 6 | 6 | 17 | ||||||||
Depreciation | 1 | 1 | 1 | ||||||||
Acquisition of American Capital, net of cash acquired | (2,381 | ) | — | — | |||||||
Proceeds from sales and repayments of investments | 7,047 | 3,711 | 3,691 | ||||||||
Purchases of investments | (7,229 | ) | (3,475 | ) | (3,816 | ) | |||||
Changes in operating assets and liabilities: | |||||||||||
Interest receivable | 28 | 26 | 23 | ||||||||
Other assets | 31 | (12 | ) | 19 | |||||||
Base management fees payable | 10 | — | — | ||||||||
Income based fees payable | (5 | ) | 1 | (2 | ) | ||||||
Capital gains incentive fees payable | 41 | (4 | ) | (51 | ) | ||||||
Accounts payable and other liabilities | (122 | ) | (6 | ) | (24 | ) | |||||
Interest and facility fees payable | 20 | (7 | ) | 4 | |||||||
Net cash provided by (used in) operating activities | (2,048 | ) | 707 | 360 | |||||||
FINANCING ACTIVITIES: | |||||||||||
Borrowings on debt | 12,209 | 9,855 | 3,895 | ||||||||
Repayments and repurchases of debt | (11,228 | ) | (10,104 | ) | (3,698 | ) | |||||
Debt issuance costs | (37 | ) | (10 | ) | (6 | ) | |||||
Dividends paid | (642 | ) | (477 | ) | (487 | ) | |||||
Repurchases of common stock | — | (5 | ) | (2 | ) | ||||||
Net proceeds from issuance of common stock | 1,839 | — | — | ||||||||
Net cash provided by (used in) financing activities | 2,141 | (741 | ) | (298 | ) | ||||||
CHANGE IN CASH AND CASH EQUIVALENTS | 93 | (34 | ) | 62 | |||||||
CASH AND CASH EQUIVALENTS, BEGINNING OF PERIOD | 223 | 257 | 195 | ||||||||
CASH AND CASH EQUIVALENTS, END OF PERIOD | $ | 316 | $ | 223 | $ | 257 | |||||
Supplemental Information: | |||||||||||
Interest paid during the period | $ | 171 | $ | 168 | $ | 181 | |||||
Taxes, including excise tax, paid during the period | $ | 24 | $ | 18 | $ | 16 | |||||
Dividends declared and payable during the period | $ | 648 | $ | 477 | $ | 493 | |||||
See accompanying notes to consolidated financial statements.
F-70
ARES CAPITAL CORPORATION AND SUBSIDIARIES
NOTES TO CONSOLIDATED FINANCIAL STATEMENTS
As of December 31, 2017
(in millions, except per share data, percentages and as otherwise indicated;
for example, with the word “billion” or otherwise)
1. ORGANIZATION
Ares Capital Corporation (the “Company”) is a specialty finance company that is a closed-end, non-diversified management investment company incorporated in Maryland. The Company has elected to be regulated as a BDC under the Investment Company Act. The Company has elected to be treated as a regulated investment company (“RIC”) under the Internal Revenue Code of 1986, as amended (the “Code”) and operates in a manner so as to qualify for the tax treatment applicable to RICs.
The Company’s investment objective is to generate both current income and capital appreciation through debt and equity investments. The Company invests primarily in first lien senior secured loans (including “unitranche” loans, which are loans that combine both senior and mezzanine debt, generally in a first lien position), second lien senior secured loans and mezzanine debt, which in some cases includes an equity component. To a lesser extent, the Company also makes equity investments.
The Company is externally managed by Ares Capital Management LLC (“Ares Capital Management” or the Company’s “investment adviser”), a subsidiary of Ares Management, L.P. (“Ares Management”), a publicly traded, leading global alternative asset manager, pursuant to an investment advisory and management agreement. Ares Operations LLC (“Ares Operations” or the Company’s “administrator”), a subsidiary of Ares Management, provides certain administrative and other services necessary for the Company to operate.
2. SIGNIFICANT ACCOUNTING POLICIES
Basis of Presentation
The accompanying consolidated financial statements have been prepared on the accrual basis of accounting in conformity with U.S. generally accepted accounting principles (“GAAP”), and include the accounts of the Company and its consolidated subsidiaries. The Company is an investment company following accounting and reporting guidance in Accounting Standards Codification (“ASC”) 946. The consolidated financial statements reflect all adjustments and reclassifications that, in the opinion of management, are necessary for the fair presentation of the results of the operations and financial condition as of and for the periods presented. All significant intercompany balances and transactions have been eliminated.
Cash and Cash Equivalents
Cash and cash equivalents include funds from time to time deposited with financial institutions and short-term, liquid investments in a money market account. Cash and cash equivalents are carried at cost which approximates fair value.
Concentration of Credit Risk
The Company places its cash and cash equivalents with financial institutions and, at times, cash held in money market accounts may exceed the Federal Deposit Insurance Corporation insured limit.
Investments
Investment transactions are recorded on the trade date. Realized gains or losses are measured by the difference between the net proceeds from the repayment or sale and the amortized cost basis of the investment using the specific identification method without regard to unrealized gains or losses previously recognized, and include investments charged off during the period, net of recoveries. Unrealized gains or losses primarily reflect the change in investment values, including the reversal of previously recorded unrealized gains or losses when gains or losses are realized.
Investments for which market quotations are readily available are typically valued at such market quotations. In order to validate market quotations, the Company looks at a number of factors to determine if the quotations are representative of fair value, including the source and nature of the quotations. Debt and equity securities that are not publicly traded or whose market prices are not readily available (i.e., substantially all of the Company’s investments) are valued at fair value as determined in
F-71
good faith by the Company’s board of directors, based on, among other things, the input of the Company’s investment adviser, audit committee and independent third-party valuation firms that have been engaged at the direction of the Company’s board of directors to assist in the valuation of each portfolio investment without a readily available market quotation at least once during a trailing 12-month period (with certain de minimis exceptions) and under a valuation policy and a consistently applied valuation process. The valuation process is conducted at the end of each fiscal quarter, and a portion of the Company’s investment portfolio at fair value is subject to review by an independent valuation firm each quarter. In addition, the Company’s independent registered public accounting firm obtains an understanding of, and performs select procedures relating to, the Company’s investment valuation process within the context of performing the integrated audit.
As part of the valuation process, the Company may take into account the following types of factors, if relevant, in determining the fair value of the Company’s investments: the enterprise value of a portfolio company (the entire value of the portfolio company to a market participant, including the sum of the values of debt and equity securities used to capitalize the enterprise at a point in time), the nature and realizable value of any collateral, the portfolio company’s ability to make payments and its earnings and discounted cash flow, the markets in which the portfolio company does business, a comparison of the portfolio company’s securities to any similar publicly traded securities, changes in the interest rate environment and the credit markets, which may affect the price at which similar investments would trade in their principal markets and other relevant factors. When an external event such as a purchase transaction, public offering or subsequent equity sale occurs, the Company considers the pricing indicated by the external event to corroborate its valuation.
Because there is not a readily available market value for most of the investments in its portfolio, the Company values substantially all of its portfolio investments at fair value as determined in good faith by its board of directors, as described herein. Due to the inherent uncertainty of determining the fair value of investments that do not have a readily available market value, the fair value of the Company’s investments may fluctuate from period to period. Additionally, the fair value of the Company’s investments may differ significantly from the values that would have been used had a ready market existed for such investments and may differ materially from the values that the Company may ultimately realize. Further, such investments are generally subject to legal and other restrictions on resale or otherwise are less liquid than publicly traded securities. If the Company was required to liquidate a portfolio investment in a forced or liquidation sale, the Company could realize significantly less than the value at which the Company has recorded it.
In addition, changes in the market environment and other events that may occur over the life of the investments may cause the gains or losses ultimately realized on these investments to be different than the unrealized gains or losses reflected in the valuations currently assigned.
The Company’s board of directors undertakes a multi-step valuation process each quarter, as described below:
• | The Company’s quarterly valuation process begins with each portfolio company or investment being initially valued by the investment professionals responsible for the portfolio investment in conjunction with the Company’s portfolio management team. |
• | Preliminary valuations are reviewed and discussed with the Company’s investment adviser’s management and investment professionals, and then valuation recommendations are presented to the Company’s board of directors. |
• | The audit committee of the Company’s board of directors reviews these valuations, as well as the input of third parties, including independent third-party valuation firms who have reviewed a portion of the investments in the Company’s portfolio at fair value. |
• | The Company’s board of directors discusses valuations and ultimately determines the fair value of each investment in the Company’s portfolio without a readily available market quotation in good faith based on, among other things, the input of the Company’s investment adviser, audit committee and, where applicable, independent third-party valuation firms. |
See Note 8 for more information on the Company’s valuation process.
Interest and Dividend Income Recognition
Interest income is recorded on an accrual basis and includes the accretion of discounts and amortization of premiums. Discounts from and premiums to par value on securities purchased are accreted/amortized into interest income over the life of the respective security using the effective yield method. The amortized cost of investments represents the original cost adjusted for the accretion of discounts and amortization of premiums, if any.
F-72
Loans are generally placed on non-accrual status when principal or interest payments are past due 30 days or more or when there is reasonable doubt that principal or interest will be collected in full. Accrued and unpaid interest is generally reversed when a loan is placed on non-accrual status. Interest payments received on non-accrual loans may be recognized as income or applied to principal depending upon management’s judgment regarding collectability. Non-accrual loans are restored to accrual status when past due principal and interest is paid and, in management’s judgment, are likely to remain current. The Company may make exceptions to this policy if the loan has sufficient collateral value and is in the process of collection.
Dividend income on preferred equity securities is recorded as dividend income on an accrual basis to the extent that such amounts are payable by the portfolio company and are expected to be collected. Dividend income on common equity securities is recorded on the record date for private portfolio companies or on the ex-dividend date for publicly traded portfolio companies.
Payment-in-Kind Interest
The Company has loans in its portfolio that contain payment-in-kind (“PIK”) provisions. The PIK interest, computed at the contractual rate specified in each loan agreement, is added to the principal balance of the loan and recorded as interest income. To maintain the Company’s status as a RIC, this non-cash source of income must be paid out to stockholders in the form of dividends, even though the Company has not yet collected the cash.
Capital Structuring Service Fees and Other Income
The Company’s investment adviser seeks to provide assistance to its portfolio companies and in return the Company may receive fees for capital structuring services. These fees are generally only available to the Company as a result of the Company’s underlying investments, are normally paid at the closing of the investments, are generally non-recurring and are recognized as revenue when earned upon closing of the investment. The services that the Company’s investment adviser provides vary by investment, but generally include reviewing existing credit facilities, arranging bank financing, arranging equity financing, structuring financing from multiple lenders, structuring financing from multiple equity investors, restructuring existing loans, raising equity and debt capital, and providing general financial advice, which concludes upon closing of the investment. Any services of the above nature subsequent to the closing would generally generate a separate fee payable to the Company. In certain instances where the Company is invited to participate as a co-lender in a transaction and does not provide significant services in connection with the investment, a portion of loan fees paid to the Company in such situations will be deferred and amortized over the estimated life of the loan.
Other income includes fees for management and consulting services, loan guarantees, commitments, amendments and other services rendered by the Company to portfolio companies. Such fees are recognized as income when earned or the services are rendered.
Foreign Currency Translation
The Company’s books and records are maintained in U.S. dollars. Any foreign currency amounts are translated into U.S. dollars on the following basis:
(1) | Fair value of investment securities, other assets and liabilities—at the exchange rates prevailing at the end of the period. |
(2) | Purchases and sales of investment securities, income and expenses—at the exchange rates prevailing on the respective dates of such transactions, income or expenses. |
Results of operations based on changes in foreign exchange rates are separately disclosed in the statement of operations, if any. Foreign security and currency translations may involve certain considerations and risks not typically associated with investing in U.S. companies and U.S. government securities. These risks include, but are not limited to, currency fluctuations and revaluations and future adverse political, social and economic developments, which could cause investments in foreign markets to be less liquid and prices more volatile than those of comparable U.S. companies or U.S. government securities.
F-73
Derivative Instruments
The Company does not utilize hedge accounting and as such values its derivatives at fair value with the unrealized gains or losses recorded in “net unrealized gains (losses) from foreign currency and other transactions” in the Company’s consolidated statement of operations.
Equity Offering Expenses
The Company’s offering costs are charged against the proceeds from equity offerings when proceeds are received.
Debt Issuance Costs
Debt issuance costs are amortized over the life of the related debt instrument using the straight line method or the effective yield method, depending on the type of debt instrument.
Income Taxes
The Company has elected to be treated as a RIC under the Code and operates in a manner so as to qualify for the tax treatment applicable to RICs. To qualify as a RIC, the Company must (among other requirements) meet certain source-of- income and asset diversification requirements and timely distribute to its stockholders at least 90% of its investment company taxable income, as defined by the Code, for each year. The Company (among other requirements) has made and intends to continue to make the requisite distributions to its stockholders, which will generally relieve the Company from U.S. federal corporate-level income taxes.
Depending on the level of taxable income earned in a tax year, the Company may choose to carry forward taxable income in excess of current year dividend distributions from such current year taxable income into the next tax year and pay a 4% excise tax on such income, as required. To the extent that the Company determines that its estimated current year taxable income will be in excess of estimated dividend distributions for the current year, the Company accrues excise tax, if any, on estimated excess taxable income as such taxable income is earned.
Certain of the Company’s consolidated subsidiaries are subject to U.S. federal and state corporate-level income taxes.
Dividends to Common Stockholders
Dividends and distributions to common stockholders are recorded on the ex-dividend date. The amount to be paid out as a dividend is determined by the Company’s board of directors each quarter and is generally based upon the earnings estimated by management. Net realized capital gains, if any, are generally distributed, although the Company may decide to retain such capital gains for investment.
The Company has adopted a dividend reinvestment plan that provides for reinvestment of any distributions the Company declares in cash on behalf of its stockholders, unless a stockholder elects to receive cash. As a result, if the Company’s board of directors authorizes, and the Company declares, a cash dividend, then the Company’s stockholders who have not “opted out” of the Company’s dividend reinvestment plan will have their cash dividends automatically reinvested in additional shares of the Company’s common stock, rather than receiving the cash dividend. The Company intends to use primarily newly issued shares to implement the dividend reinvestment plan (so long as the Company is trading at a premium to net asset value). If the Company’s shares are trading at a discount to net asset value and the Company is otherwise permitted under applicable law to purchase such shares, the Company may purchase shares in the open market in connection with the Company’s obligations under the dividend reinvestment plan. However, the Company reserves the right to issue new shares of the Company’s common stock in connection with the Company’s obligations under the dividend reinvestment plan even if the Company’s shares are trading below net asset value.
Use of Estimates in the Preparation of Financial Statements
The preparation of financial statements in conformity with GAAP requires management to make estimates and assumptions that affect the reported amounts of actual and contingent assets and liabilities at the date of the financial statements and the reported amounts of income or loss and expenses during the reporting period. Actual results could differ from those estimates. Significant estimates include the valuation of investments.
F-74
Recent Accounting Pronouncements
In May 2014, the Financial Accounting Standards Board (the “FASB”) issued ASU No. 2014-09, Revenue from Contracts with Customers (Topic 606). The guidance in this ASU supersedes the revenue recognition requirements in Revenue Recognition (Topic 605). Under the new guidance, an entity should recognize revenue to depict the transfer of promised goods or services to customers in an amount that reflects the consideration to which the entity expects to be entitled in exchange for those goods or services. The amendments in ASU No. 2014-09 are effective for annual reporting periods beginning after December 15, 2017, including interim periods within that reporting period. The application of this guidance will not have a material impact on the Company’s consolidated financial statements.
3. AGREEMENTS
Investment Advisory and Management Agreement
The Company is party to an investment advisory and management agreement (the “investment advisory and management agreement”) with Ares Capital Management. Subject to the overall supervision of the Company’s board of directors, Ares Capital Management provides investment advisory and management services to the Company. For providing these services, Ares Capital Management receives fees from the Company consisting of a base management fee, a fee based on the Company’s net investment income (“income based fee”) and a fee based on the Company’s net capital gains (“capital gains incentive fee”). The investment advisory and management agreement may be terminated by either party without penalty upon 60 days’ written notice to the other party.
The base management fee is calculated at an annual rate of 1.5% based on the average value of the Company’s total assets (other than cash or cash equivalents, but including assets purchased with borrowed funds) at the end of the two most recently completed calendar quarters. The base management fee is payable quarterly in arrears.
The income based fee is calculated and payable quarterly in arrears based on the Company’s pre-incentive fee net investment income, as defined in the investment advisory and management agreement, for the quarter. Pre-incentive fee net investment income means interest income, dividend income and any other income (including any other fees such as commitment, origination, structuring, diligence and consulting fees or other fees that the Company receives from portfolio companies but excluding fees for providing managerial assistance) accrued during the calendar quarter, minus operating expenses for the quarter (including the base management fee, any expenses payable under the administration agreement, and any interest expense and dividends paid on any outstanding preferred stock, but excluding the income based fee and capital gains incentive fee accrued under GAAP). Pre-incentive fee net investment income includes, in the case of investments with a deferred interest feature such as market discount, debt instruments with PIK interest, preferred stock with PIK dividends and zero coupon securities, accrued income that the Company has not yet received in cash. The Company’s investment adviser is not under any obligation to reimburse the Company for any part of the income based fees it received that was based on accrued interest that the Company never actually received.
Pre-incentive fee net investment income does not include any realized capital gains, realized capital losses, unrealized capital appreciation, unrealized capital depreciation or income tax expense related to realized gains and losses. Because of the structure of the income based fee, it is possible that the Company may pay such fees in a quarter where the Company incurs a loss. For example, if the Company receives pre-incentive fee net investment income in excess of the hurdle rate (as defined below) for a quarter, the Company will pay the applicable income based fee even if the Company has incurred a loss in that quarter due to realized and/or unrealized capital losses.
Pre-incentive fee net investment income, expressed as a rate of return on the value of the Company’s net assets (defined as total assets less indebtedness and before taking into account any income based fees and capital gains incentive fees payable during the period) at the end of the immediately preceding calendar quarter, is compared to a fixed “hurdle rate” of 1.75% per quarter. If market credit spreads rise, the Company may be able to invest its funds in debt instruments that provide for a higher return, which may increase the Company’s pre-incentive fee net investment income and make it easier for the Company’s investment adviser to surpass the fixed hurdle rate and receive an income based fee based on such net investment income. To the extent the Company has retained pre-incentive fee net investment income that has been used to calculate the income based fee, it is also included in the amount of the Company’s total assets (other than cash and cash equivalents but including assets purchased with borrowed funds) used to calculate the 1.5% base management fee.
The Company pays its investment adviser an income based fee with respect to the Company’s pre-incentive fee net investment income in each calendar quarter as follows:
F-75
• | No income based fee in any calendar quarter in which the Company’s pre- incentive fee net investment income does not exceed the hurdle rate; |
• | 100% of the Company’s pre-incentive fee net investment income with respect to that portion of such pre-incentive fee net investment income, if any, that exceeds the hurdle rate but is less than 2.1875% in any calendar quarter. The Company refers to this portion of its pre-incentive fee net investment income (which exceeds the hurdle rate but is less than 2.1875%) as the “catch-up” provision. The “catch-up” is meant to provide the Company’s investment adviser with 20% of the pre-incentive fee net investment income as if a hurdle rate did not apply if this net investment income exceeded 2.1875% in any calendar quarter; and |
• | 20% of the amount of the Company’s pre-incentive fee net investment income, if any, that exceeds 2.1875% in any calendar quarter. |
These calculations are adjusted for any share issuances or repurchases during the quarter.
In connection with the Company's acquisition of American Capital, Ltd., a Delaware corporation (“American Capital”) (the “American Capital Acquisition”), Ares Capital Management agreed to waive, for each of the first ten calendar quarters beginning with the second quarter of 2017, the lesser of (x) $10 of income based fees and (y) the amount of income based fees for such quarter, in each case, to the extent earned and payable by the Company in such quarter pursuant to and as calculated under the Company's investment advisory and management agreement (the “Fee Waiver”). See Note 16 for additional information regarding the American Capital Acquisition.
The capital gains incentive fee is determined and payable in arrears as of the end of each calendar year (or, upon termination of the investment advisory and management agreement, as of the termination date) and is calculated at the end of each applicable year by subtracting (a) the sum of the Company’s cumulative aggregate realized capital losses and aggregate unrealized capital depreciation from (b) the Company’s cumulative aggregate realized capital gains, in each case calculated from October 8, 2004 (the date the Company completed its initial public offering). Realized capital gains and losses include gains and losses on investments and foreign currencies, gains and losses on extinguishment of debt and from other assets, as well as any income tax and other expenses related to cumulative aggregate realized gains and losses. If such amount is positive at the end of such year, then the capital gains incentive fee for such year is equal to 20% of such amount, less the aggregate amount of capital gains incentive fees paid in all prior years. If such amount is negative, then there is no capital gains incentive fee for such year.
The cumulative aggregate realized capital gains are calculated as the sum of the differences, if positive, between (a) the net sales price of each investment in the Company’s portfolio when sold and (b) the accreted or amortized cost basis of such investment.
The cumulative aggregate realized capital losses are calculated as the sum of the amounts by which (a) the net sales price of each investment in the Company’s portfolio when sold is less than (b) the accreted or amortized cost basis of such investment.
The aggregate unrealized capital depreciation is calculated as the sum of the differences, if negative, between (a) the valuation of each investment in the Company’s portfolio as of the applicable capital gains incentive fee calculation date and (b) the accreted or amortized cost basis of such investment.
Notwithstanding the foregoing, as a result of an amendment to the capital gains incentive fee under the investment advisory and management agreement that was adopted on June 6, 2011, if the Company is required by GAAP to record an investment at its fair value as of the time of acquisition instead of at the actual amount paid for such investment by the Company (including, for example, as a result of the application of the asset acquisition method of accounting), then solely for the purposes of calculating the capital gains incentive fee, the “accreted or amortized cost basis” of an investment shall be an amount (the “Contractual Cost Basis”) equal to (1) (x) the actual amount paid by the Company for such investment plus (y) any amounts recorded in the Company’s financial statements as required by GAAP that are attributable to the accretion of such investment plus (z) any other adjustments made to the cost basis included in the Company’s financial statements, including PIK interest or additional amounts funded (net of repayments) minus (2) any amounts recorded in the Company’s financial statements as required by GAAP that are attributable to the amortization of such investment, whether such calculated Contractual Cost Basis is higher or lower than the fair value of such investment (as determined in accordance with GAAP) at the time of acquisition.
F-76
There was no capital gains incentive fee earned by the Company’s investment adviser as calculated under the investment advisory and management agreement (as described above) for the years ended December 31, 2017, 2016 and 2015. However, in accordance with GAAP, the Company had cumulatively accrued a capital gains incentive fee of $79 as of December 31, 2017, of which $79 is not currently due under the investment advisory and management agreement. GAAP requires that the capital gains incentive fee accrual consider the cumulative aggregate unrealized capital appreciation in the calculation, as a capital gains incentive fee would be payable if such unrealized capital appreciation were realized, even though such unrealized capital appreciation is not permitted to be considered in calculating the fee actually payable under the investment advisory and management agreement. This GAAP accrual is calculated using the aggregate cumulative realized capital gains and losses and aggregate cumulative unrealized capital depreciation included in the calculation of the capital gains incentive fee plus the aggregate cumulative unrealized capital appreciation, net of any expense associated with cumulative unrealized capital depreciation or appreciation. If such amount is positive at the end of a period, then GAAP requires the Company to record a capital gains incentive fee equal to 20% of such cumulative amount, less the aggregate amount of actual capital gains incentive fees paid or capital gains incentive fees accrued under GAAP in all prior periods. As of December 31, 2017, the Company has paid capital gains incentive fees since inception totaling $57. The resulting accrual for any capital gains incentive fee under GAAP in a given period may result in an additional expense if such cumulative amount is greater than in the prior period or a reversal of previously recorded expense if such cumulative amount is less than in the prior period. If such cumulative amount is negative, then there is no accrual. There can be no assurance that such unrealized capital appreciation will be realized in the future.
The Company defers cash payment of any income based fees and capital gains incentive fees otherwise earned by the Company’s investment adviser if during the most recent four full calendar quarter period ending on or prior to the date such payment is to be made the sum of (a) the aggregate distributions to the Company’s stockholders and (b) the change in net assets (defined as total assets less indebtedness and before taking into account any income based fees and capital gains incentive fees payable during the period) is less than 7.0% of the Company’s net assets (defined as total assets less indebtedness) at the beginning of such period. Any deferred income based fees and capital gains incentive fees are carried over for payment in subsequent calculation periods to the extent such payment is payable under the investment advisory and management agreement.
For the year ended December 31, 2017, base management fees were $171 and income based fees were $134. The income based fees for the year ended December 31, 2017 were net of the Fee Waiver of $30. For the year ended December 31, 2017, the capital gains incentive fees calculated in accordance with GAAP was $41. For the year ended December 31, 2017, $11 of capital gains incentive fees calculated in accordance with GAAP was recorded in connection with the American Capital Acquisition as a result of the fair value of the net assets acquired exceeding the fair value of the merger consideration paid by the Company. See Note 16 for additional information regarding the American Capital Acquisition. For the year ended December 31, 2016, base management fees were $137 and income based fees were $123. For the year ended December 31, 2016, the reduction in capital gains incentive fees calculated in accordance with GAAP was $5. For the year ended December 31, 2015, base management fees were $134 and income based fees were $121. For the year ended December 31, 2015, the capital gains incentive fees calculated in accordance with GAAP was $27.
The services of all investment professionals and staff of the Company’s investment adviser, when and to the extent engaged in providing investment advisory and management services to the Company and routine overhead expenses of such personnel allocable to such services, are provided and paid for by the Company’s investment adviser. The Company bears all other costs and expenses of its operations and transactions, including, but not limited to, those relating to: rent for the offices in which the Company operates, including rent expenses for investment activities of the Company (see Note 7); organization; calculation of the Company’s net asset value (including, but not limited to, the cost and expenses of any independent valuation firm); expenses incurred by the Company’s investment adviser payable to third parties, including agents, consultants or other advisers, in monitoring the Company’s financial and legal affairs and in monitoring the Company’s investments (including the cost of consultants hired to develop information technology systems designed to monitor the Company’s investments) and performing due diligence on the Company’s prospective portfolio companies; interest payable on indebtedness, if any, incurred to finance the Company’s investments (including payments to third party vendors for financial information services); offerings of the Company’s common stock and other securities; investment advisory and management fees; administration fees; fees payable to third parties, including agents, consultants or other advisers, relating to, or associated with, evaluating and making investments regardless of whether such transactions are ultimately consummated; costs of marketing; transfer agent and custodial fees; registration fees; listing fees; taxes; independent directors’ fees and expenses; costs of preparing and filing reports or other documents with the SEC; the costs of any reports, proxy statements or other notices to stockholders, including printing costs; to the extent the Company is covered by any joint insurance policies, the Company’s allocable portion of the insurance premiums for such policies; direct costs and expenses of administration, including auditor and legal costs; and all other expenses incurred by the Company or its administrator in connection with administering the Company’s business as described in more detail under “Administration Agreement” below.
F-77
Administration Agreement
The Company is party to an administration agreement, referred to herein as the “administration agreement”, with its administrator, Ares Operations. Pursuant to the administration agreement, Ares Operations furnishes the Company with office equipment and clerical, bookkeeping and record keeping services at the Company’s office facilities. Under the administration agreement, Ares Operations also performs, or oversees the performance of, the Company’s required administrative services, which include, among other things, providing assistance in accounting, legal, compliance, operations, technology and investor relations, being responsible for the financial records that the Company is required to maintain and preparing reports to its stockholders and reports filed with the Securities and Exchange Commission (the “SEC”). In addition, Ares Operations assists the Company in determining and publishing its net asset value, assists the Company in providing managerial assistance to its portfolio companies, oversees the preparation and filing of the Company’s tax returns and the printing and dissemination of reports to its stockholders, and generally oversees the payment of its expenses and the performance of administrative and professional services rendered to the Company by others. Payments under the administration agreement are equal to an amount based upon its allocable portion of Ares Operations’ overhead and other expenses (including travel expenses) incurred by Ares Operations in performing its obligations under the administration agreement, including the Company’s allocable portion of the compensation, rent and other expenses of certain of its officers (including the Company’s chief compliance officer, chief financial officer, chief accounting officer, general counsel, treasurer and assistant treasurer) and their respective staffs. The administration agreement may be terminated by either party without penalty upon 60 days’ written notice to the other party.
For the years ended December 31, 2017, 2016 and 2015, the Company incurred $12, $14 and $14 in administrative fees, respectively. In addition, for the year ended December 31, 2017, the Company incurred an additional $8 in administrative fees related to the integration of the American Capital Acquisition. These acquisition-related expenses are included in “professional fees and other costs related to the American Capital Acquisition” in the consolidated statement of operations. As of December 31, 2017, $4 of the administrative fees were unpaid and included in “accounts payable and other liabilities” in the accompanying consolidated balance sheet.
4. INVESTMENTS
As of December 31, 2017 and 2016, investments consisted of the following:
As of December 31, | |||||||||||||||
2017 | 2016 | ||||||||||||||
Amortized Cost(1) | Fair Value | Amortized Cost(1) | Fair Value | ||||||||||||
First lien senior secured loans | $ | 5,337 | $ | 5,197 | $ | 2,102 | $ | 2,036 | |||||||
Second lien senior secured loans | 3,885 | 3,744 | 3,069 | 2,987 | |||||||||||
Subordinated certificates of the SDLP (2) | 487 | 487 | 270 | 270 | |||||||||||
Subordinated certificates of the SSLP (3) | — | — | 1,938 | 1,914 | |||||||||||
Senior subordinated loans | 978 | 995 | 692 | 714 | |||||||||||
Collateralized loan obligations | 115 | 114 | — | — | |||||||||||
Preferred equity securities | 485 | 532 | 505 | 273 | |||||||||||
Other equity securities | 618 | 772 | 458 | 626 | |||||||||||
Total | $ | 11,905 | $ | 11,841 | $ | 9,034 | $ | 8,820 | |||||||
________________________________________
(1) | The amortized cost represents the original cost adjusted for the accretion of discounts and amortization of premiums, if any. |
(2) | The proceeds from these certificates were applied to co-investments with Varagon and its clients to fund first lien senior secured loans to 19 and 14 different borrowers as of December 31, 2017 and 2016, respectively. |
(3) | The proceeds from these certificates were applied to co-investments with GE to fund first lien senior secured loans to 19 different borrowers as of December 31, 2016. |
F-78
The industrial and geographic compositions of the Company’s portfolio at fair value as of December 31, 2017 and 2016 were as follows:
As of December 31, | |||||
2017 | 2016 | ||||
Industry | |||||
Healthcare Services | 22.5 | % | 14.3 | % | |
Business Services | 19.2 | 9.8 | |||
Consumer Products | 6.8 | 7.2 | |||
Other Services | 6.2 | 8.9 | |||
Manufacturing | 6.0 | 3.8 | |||
Investment Funds and Vehicles(1) | 5.8 | 25.2 | |||
Financial Services | 4.3 | 4.2 | |||
Food and Beverage | 4.3 | 2.2 | |||
Power Generation | 3.6 | 6.4 | |||
Restaurants and Food Services | 3.3 | 4.5 | |||
Automotive Services | 3.0 | 1.9 | |||
Education | 3.0 | 2.0 | |||
Wholesale Distribution | 2.5 | 0.4 | |||
Oil and Gas | 2.5 | 1.0 | |||
Containers and Packaging | 2.1 | 2.8 | |||
Other | 4.9 | 5.4 | |||
Total | 100.0 | % | 100.0 | % | |
________________________________________
(1) | Includes the Company’s investment in the SDLP, which had made first lien senior secured loans to 19 and 14 different borrowers as of December 31, 2017 and 2016, respectively, and the Company’s investment in the SSLP, which had made first lien senior secured loans to 19 different borrowers as of December 31, 2016. The portfolio companies in the SDLP are in industries similar to the companies in the Company’s portfolio. The portfolio companies in the SSLP were in industries similar to the companies in the Company’s portfolio. |
As of December 31, | |||||
Geographic Region | 2017 | 2016 | |||
Southeast | 28.5 | % | 19.5 | % | |
Midwest | 25.3 | 19.7 | |||
West(1) | 23.9 | 41.5 | |||
Mid Atlantic | 15.0 | 14.7 | |||
Northeast | 3.9 | 3.6 | |||
International | 3.4 | 1.0 | |||
Total | 100.0 | % | 100.0 | % | |
________________________________________
(1) | Includes the Company’s investment in the SDLP, which represented 4.1% and 3.1% of the total investment portfolio at fair value as of December 31, 2017 and 2016, respectively, and the Company’s investment in the SSLP, which represented 21.7% of the total investment portfolio at fair value as of December 31, 2016. |
As of December 31, 2017, 3.1% of total investments at amortized cost (or 1.4% of total investments at fair value) were on non-accrual status. As of December 31, 2016, 2.9% of total investments at amortized cost (or 0.8% of total investments at fair value) were on non‑accrual status.
F-79
Co-Investment Programs
Senior Direct Lending Program
The Company has established a joint venture with Varagon to make certain first lien senior secured loans, including certain stretch senior and unitranche loans, primarily to U.S. middle market companies. Varagon was formed in 2013 as a lending platform by American International Group, Inc. (NYSE:AIG) and other partners. The joint venture is called the SDLP. In July 2016, the Company and Varagon and its clients completed the initial funding of the SDLP. In conjunction with the initial funding, we and Varagon and its clients sold investment commitments to the SDLP. Such investment commitments included $529 of investment commitments sold to the SDLP by the Company. No realized gains or losses were recorded by the Company on these transactions. The SDLP may generally commit and hold individual loans of up to $300. The Company and other accounts managed by the Company’s investment adviser and its affiliates may directly co-invest with the SDLP to accommodate larger transactions. The SDLP is capitalized as transactions are completed and all portfolio decisions and generally all other decisions in respect of the SDLP must be approved by an investment committee of the SDLP consisting of representatives of the Company and Varagon (with approval from a representative of each required).
The Company provides capital to the SDLP in the form of subordinated certificates (the “SDLP Certificates”), and Varagon and its clients provide capital to the SDLP in the form of senior notes, intermediate funding notes and SDLP Certificates. As of December 31, 2017 and 2016, the Company and a client of Varagon owned 87.5% and 12.5%, respectively, of the outstanding SDLP Certificates.
As of December 31, 2017, the Company and Varagon and its clients had agreed to make capital available to the SDLP of $2,925 in the aggregate, of which $591 is to be made available from the Company. This capital will only be committed to the SDLP upon approval of transactions by the investment committee of the SDLP as discussed above. Below is a summary of the funded capital and unfunded capital commitments of the SDLP.
As of December 31, | |||||||
2017 | 2016 | ||||||
Total capital funded to the SDLP(1) | $ | 2,319 | $ | 1,285 | |||
Total capital funded to the SDLP by the Company(1) | $ | 487 | $ | 270 | |||
Total unfunded capital commitments to the SDLP(2) | $ | 92 | $ | 177 | |||
Total unfunded capital commitments to the SDLP by the Company(2) | $ | 19 | $ | 37 | |||
___________________________________________________________________________
(1) At principal amount.
(2) | These commitments have been approved by the investment committee of the SDLP and will be funded as the transactions are completed. |
The SDLP Certificates pay a coupon of LIBOR plus 8.0% and also entitle the holders thereof to receive a portion of the excess cash flow from the loan portfolio, after expenses, which may result in a return to the holders of the SDLP Certificates that is greater than the stated coupon. The SDLP Certificates are junior in right of payment to the senior notes and intermediate funding notes.
The amortized cost and fair value of the SDLP Certificates held by the Company were $487 and $487, respectively, as of December 31, 2017. The Company’s yield on its investment in the SDLP at amortized cost and fair value was 14.5% and 14.5%, respectively, as of December 31, 2017. The amortized cost and fair value of the SDLP Certificates held by the Company were $270 and $270, respectively, as of December 31, 2016. The Company’s yield on its investment in the SDLP at amortized cost and fair value was 14.0% and 14.0%, respectively, as of December 31, 2016. For the years ended December 31, 2017 and 2016, the Company earned interest income of $52 and $13, respectively, from its investment in the SDLP Certificates. The Company is also entitled to certain fees in connection with the SDLP. For the years ended December 31, 2017 and 2016, in connection with the SDLP, the Company earned capital structuring service and other fees totaling $11 and $6, respectively.
As of December 31, 2017 and 2016, the SDLP’s portfolio was comprised entirely of first lien senior secured loans to U.S. middle market companies and were in industries similar to the companies in the Company’s portfolio. As of December 31, 2017 and 2016, none of the loans were on non-accrual status. Below is a summary of the SDLP’s portfolio.
F-80
As of December 31, | |||||||
2017 | 2016 | ||||||
Total first lien senior secured loans(1) | $ | 2,316 | $ | 1,281 | |||
Largest loan to a single borrower(1) | $ | 200 | $ | 125 | |||
Total of five largest loans to borrowers(1) | $ | 947 | $ | 560 | |||
Number of borrowers in the SDLP | 19 | 14 | |||||
Commitments to fund delayed draw loans(2) | $ | 92 | $ | 177 | |||
___________________________________________________________________________
(1) At principal amount.
(2) | As discussed above, these commitments have been approved by the investment committee of the SDLP. |
Senior Secured Loan Program
The Company and GE had previously co-invested in first lien senior secured loans of middle market companies through the SSLP. The SSLP was capitalized as transactions were completed. All portfolio decisions and generally all other decisions in respect of the SSLP were approved by an investment committee of the SSLP consisting of representatives of the Company and GE (with approval from a representative of each required). The Company provided capital to the SSLP in the form of subordinated certificates (the “SSLP Certificates”). GE provided capital to the SSLP in the form of senior notes and the SSLP Certificates.
As of June 30, 2017, the Company’s investment in the SSLP Certificates at amortized cost and fair value was $1.9 billion and $1.9 billion, respectively. As of June 30, 2017, the SSLP had $1.2 billion in cash and GE’s senior notes outstanding totaled $601. In July 2017, the SSLP made its monthly waterfall distribution from this cash, which fully repaid the senior notes of the SSLP with the remaining amounts distributed to the holders of the SSLP Certificates. From this distribution, the Company received $474 in respect of the Company’s SSLP Certificates. After this distribution, the Company’s amortized cost in its SSLP Certificates was $1.5 billion.
In addition, in July 2017, the Company and GE agreed to an effective termination of the SSLP whereby on July 26, 2017, the Company purchased the remaining $1.6 billion in aggregate principal amount of first lien senior secured loans outstanding at par plus accrued and unpaid interest and fees from the SSLP (the “SSLP Loan Sale”) and assumed the SSLP’s remaining unfunded loan commitments totaling $50. Upon completion of the SSLP Loan Sale, the SSLP made a liquidation distribution to the holders of the SSLP Certificates (the “SSLP Liquidation Distribution”), of which the Company received $1.5 billion. In connection with the SSLP Liquidation Distribution, the Company recognized an $18 realized loss. After completion of the transactions above, the operations of the SSLP were effectively terminated pursuant to the terms of the documents governing the SSLP and the SSLP no longer has an obligation to fund existing commitments and other amounts in respect of its former portfolio companies.
Below is a summary of the funded capital and unfunded capital commitments of the SSLP as of December 31, 2016.
Total capital funded to the SSLP(1) | $ | 3,819 | |
Total capital funded to the SSLP by the Company(1) | $ | 2,004 | |
Total unfunded capital commitments to the SSLP(2) | $ | 50 | |
Total unfunded capital commitments to the SSLP by the Company(2) | $ | 7 | |
___________________________________________________________________________
(1) At principal amount.
(2) | These commitments were approved by the investment committee of the SSLP. |
As of December 31, 2016, the amortized cost and fair value of the SSLP Certificates held by the Company were $1,938 and $1,914, respectively. The Company’s yield on its investment in the SSLP at amortized cost and fair value was 7.0% and 7.1%, respectively, as of December 31, 2016. For the years ended December 31, 2017, 2016 and 2015, the Company
F-81
earned interest income of $69, $208 and $276, respectively, from its investment in the SSLP Certificates. The Company was also entitled to certain fees in connection with the SSLP. For the years ended December 31, 2017, 2016 and 2015, in connection with the SSLP, the Company earned capital structuring service, sourcing and other fees totaling $5, $20 and $48, respectively.
In June 2017, the Company purchased the SSLP’s entire $259 aggregate principal amount of first lien senior secured loan investments in Implus Footcare, LLC (“Implus”) at fair value of $259. As a result of the transaction, the SSLP fully exited its investment in Implus.
As of December 31, 2016, the SSLP’s portfolio was comprised of all first lien senior secured loans to U.S. middle-market companies and were in industries similar to the companies in the Company’s portfolio. As of December 31, 2016, none of these loans were on non-accrual status. Below is a summary of the SSLP’s portfolio as of December 31, 2016.
Total first lien senior secured loans(1) | $ | 3,360 | |
Largest loan to a single borrower(1) | $ | 260 | |
Total of five largest loans to borrowers(1) | $ | 1,257 | |
Number of borrowers in the SSLP | 19 | ||
Commitments to fund delayed draw loans(2) | $ | 50 | |
___________________________________________________________________________
(1) At principal amount.
(2) | As discussed above, these commitments were approved by the investment committee of the SSLP. |
Ivy Hill Asset Management, L.P.
Ivy Hill Asset Management, L.P. (“IHAM”) is an asset management services company and an SEC-registered investment adviser. The Company has made investments in IHAM, its wholly owned portfolio company and previously made investments in certain vehicles managed by IHAM. As of December 31, 2017, IHAM had assets under management of approximately $4.1 billion. As of December 31, 2017, IHAM managed 21 vehicles and served as the sub-manager/sub-servicer for two other vehicles (these vehicles managed or sub-managed/sub-serviced by IHAM are collectively referred to as the “IHAM Vehicles”). IHAM earns fee income from managing the IHAM Vehicles and has also invested in certain of these vehicles as part of its business strategy. As of December 31, 2017 and 2016, IHAM had total investments of $229 and $223, respectively. For the years ended December 31, 2017, 2016 and 2015, IHAM had management and incentive fee income of $44, $17 and $20 respectively, and other investment-related income of $26, $24 and $25, respectively.
In connection with the American Capital Acquisition, which was completed on January 3, 2017 (the “Acquisition Date”), American Capital Asset Management, LLC (“ACAM”), a wholly owned portfolio company of American Capital, merged with and into IHAM, with IHAM remaining as the surviving entity as a wholly owned portfolio company of the Company. As a result of the merger of IHAM and ACAM, the Company’s investment in IHAM increased by $179, which was recorded as a capital contribution in the amount of the fair value of the net assets of ACAM as of the Acquisition Date. In January 2017, as a result of sales of certain assets previously held by ACAM, IHAM made a distribution to the Company of $103, which was recorded as a return of the Company’s capital contribution discussed above. Also in connection with the American Capital Acquisition, the Company assumed a $7 bridge loan receivable from a consolidated subsidiary of ACAM. Such receivable amount was repaid by IHAM in January 2017. See Note 16 for additional information regarding the American Capital Acquisition. In March 2017, the Company made an additional capital contribution of $50 to IHAM, which was unrelated to the American Capital Acquisition. In June 2017, IHAM made a distribution to the Company of $52, which was recorded as a return of the Company’s capital.
The amortized cost and fair value of the Company’s investment in IHAM was $244 and $315, respectively, as of December 31, 2017, and $171 and $229, respectively, as of December 31, 2016. For the years ended December 31, 2017, 2016 and 2015, the Company received dividend income distributions from IHAM of $40, $40 and $50, respectively. The dividend income for the year ended December 31, 2015 included additional dividends of $10 for the period in addition to the quarterly dividends generally paid by IHAM. IHAM paid the additional dividends out of accumulated earnings that had previously been retained by IHAM.
From time to time, IHAM or certain IHAM Vehicles may purchase investments from, or sell investments to, the Company. For any such sales or purchases by the IHAM Vehicles to or from the Company, the IHAM Vehicles must obtain approval from third parties unaffiliated with the Company or IHAM, as applicable. During the years ended December 31, 2017,
F-82
2016 and 2015, IHAM or certain of the IHAM Vehicles purchased $137, $495 and $538, respectively, of investments from the Company. A net realized loss of $0 was recorded by the Company on these transactions for the year end December 31, 2017. Net realized gains of $1 and $1 were recorded by the Company on these transactions for the years ended December 31, 2016 and 2015, respectively. During the year ended December 31, 2015, the Company purchased $12 of investments from certain of the IHAM Vehicles. The Company made no purchases from IHAM for the years ended December 31, 2017 and 2016, respectively.
IHAM is party to an administration agreement, referred to herein as the “IHAM administration agreement,” with Ares Operations. Pursuant to the IHAM administration agreement, Ares Operations provides IHAM with, among other things, office facilities, equipment, clerical, bookkeeping and record keeping services, services relating to the marketing and sale of interests in vehicles managed by IHAM, services of, and oversight of, custodians, depositories, accountants, attorneys, underwriters and such other persons in any other capacity deemed to be necessary. Under the IHAM administration agreement, IHAM reimburses Ares Operations for all of the actual costs associated with such services, including Ares Operations’ allocable portion of the compensation, rent and other expenses of its officers, employees and respective staff in performing its obligations under the IHAM administration agreement.
5. DEBT
In accordance with the Investment Company Act, with certain limited exceptions, the Company is only allowed to borrow amounts such that its asset coverage, calculated pursuant to the Investment Company Act, is at least 200% after such borrowing. On June 21, 2016, the Company, Ares Capital Management, Ares Venture Finance GP LLC and Ares Venture Finance,L.P. (“AVF LP”) received exemptive relief from the SEC allowing the Company to modify the Company’s calculation of asset coverage requirements to exclude the SBA Debentures (defined below). As such, the Company’s ratio of total consolidated assets to outstanding indebtedness may be less than 200%. This exemptive relief provides the Company with increased investment flexibility but also increases the Company’s risk related to leverage. As of December 31, 2017 the Company’s asset coverage was 242%.
The Company’s outstanding debt as of December 31, 2017 and 2016 were as follows:
As of December 31, | ||||||||||||||||||||||||
2017 | 2016 | |||||||||||||||||||||||
Total Aggregate Principal Amount Committed/ Outstanding(1) | Principal Amount Outstanding | Carrying Value | Total Aggregate Principal Amount Committed/ Outstanding(1) | Principal Amount Outstanding | Carrying Value | |||||||||||||||||||
Revolving Credit Facility | $ | 2,108 | (2) | $ | 395 | $ | 395 | $ | 1,265 | $ | 571 | $ | 571 | |||||||||||
Revolving Funding Facility | 1,000 | 600 | 600 | 540 | 155 | 155 | ||||||||||||||||||
SMBC Funding Facility | 400 | 60 | 60 | 400 | 105 | 105 | ||||||||||||||||||
SBA Debentures | 50 | — | — | 75 | 25 | 24 | ||||||||||||||||||
2017 Convertible Notes | — | — | — | (3) | 162 | 162 | 162 | (4) | ||||||||||||||||
2018 Convertible Notes | 270 | 270 | 270 | (4) | 270 | 270 | 267 | (4) | ||||||||||||||||
2019 Convertible Notes | 300 | 300 | 298 | (4) | 300 | 300 | 296 | (4) | ||||||||||||||||
2022 Convertible Notes | 388 | 388 | 368 | (4) | ||||||||||||||||||||
2018 Notes | 750 | 750 | 748 | (5) | 750 | 750 | 745 | (5) | ||||||||||||||||
2020 Notes | 600 | 600 | 597 | (6) | 600 | 600 | 596 | (6) | ||||||||||||||||
January 2022 Notes | 600 | 600 | 593 | (7) | 600 | 600 | 592 | (7) | ||||||||||||||||
October 2022 Notes | — | — | — | (8) | 183 | 183 | 179 | (9) | ||||||||||||||||
F-83
2023 Notes | 750 | 750 | 743 | (10) | ||||||||||||||||||||
2047 Notes | 230 | 230 | 182 | (11) | 230 | 230 | 182 | (11) | ||||||||||||||||
Total | $ | 7,446 | $ | 4,943 | $ | 4,854 | $ | 5,375 | $ | 3,951 | $ | 3,874 | ||||||||||||
________________________________________
(1) | Subject to borrowing base, leverage and other restrictions. Represents the total aggregate amount committed or outstanding, as applicable, under such instrument. |
(2) | Provides for a feature that allows the Company, under certain circumstances, to increase the size of the Revolving Credit Facility (as defined below) to a maximum of $3,095. |
(3) | See below for more information on the repayment of the 2017 Convertible Notes (as defined below) at maturity. |
(4) | Represents the aggregate principal amount outstanding of the Convertible Unsecured Notes (as defined below). As of December 31, 2017, the total unamortized debt issuance costs and the unaccreted discount for the 2018 Convertible Notes, the 2019 Convertible Notes and the 2022 Convertible Notes (each as defined below) were $0, $2 and $20, respectively. As of December 31, 2016, the total unamortized debt issuance costs and the unaccreted discount for the 2017 Convertible Notes, the 2018 Convertible Notes and the 2019 Convertible Notes (each as defined below) were $0, $3 and $4, respectively. |
(5) | Represents the aggregate principal amount outstanding of the 2018 Notes (as defined below) less unamortized debt issuance costs and plus the net unamortized premium that was recorded upon the issuances of the 2018 Notes. As of December 31, 2017 and 2016, the total unamortized debt issuance costs less the net unamortized premium was $2 and $5, respectively. |
(6) | Represents the aggregate principal amount outstanding of the 2020 Notes (as defined below) less unamortized debt issuance costs and the net unaccreted discount recorded upon the issuances of the 2020 Notes. As of December 31, 2017 and 2016, the total unamortized debt issuance costs and the net unaccreted discount was $3 and $4, respectively. |
(7) | Represents the aggregate principal amount outstanding of the January 2022 Notes (as defined below), less unamortized debt issuance costs and the unaccreted discount recorded upon the issuance of the January 2022 Notes. As of December 31, 2017 and 2016, the total unamortized debt issuance costs and the unaccreted discount was $7 and $8, respectively. |
(8) | See below for more information on the repayment of the October 2022 Notes (as defined below). |
(9) | Represents the aggregate principal amount outstanding of the October 2022 Notes (as defined below) less unamortized debt issuance costs. As of December 31, 2016, the total unamortized debt issuance costs was $4. |
(10) | Represents the aggregate principal amount outstanding of the 2023 Notes (as defined below), less unamortized debt issuance costs and the unaccreted discount recorded upon the issuance of the 2023 Notes. As of December 31, 2017, the total unamortized debt issuance costs and the unaccreted discount was $7. |
(11) | Represents the aggregate principal amount outstanding of the 2047 Notes (as defined below) less the unaccreted purchased discount recorded as a part of the Allied Acquisition (as defined below). As of December 31, 2017 and 2016, the total unaccreted purchased discount was $48 and $48, respectively. |
The weighted average stated interest rate and weighted average maturity, both on aggregate principal amount, of all the Company’s outstanding debt as of December 31, 2017 were 4.1% and 4.3 years, respectively, and as of December 31, 2016 were 4.2% and 4.8 years, respectively.
Revolving Credit Facility
The Company is party to a senior secured revolving credit facility (as amended and restated, the “Revolving Credit Facility”), which allows the Company to borrow up to $2,108 at any one time outstanding. The Revolving Credit Facility consists of a $395 term loan tranche with a stated maturity date of January 4, 2022 and a $1,713 revolving tranche. For $1,630 of the revolving tranche, the end of the revolving period and the stated maturity date are January 4, 2021 and January 4, 2022,
F-84
respectively. For $38 of the revolving tranche, the end of the revolving period and the stated maturity date are May 4, 2020 and May 4, 2021, respectively. For the remaining $45 of the revolving tranche, the end of the revolving period and the stated maturity date are May 4, 2019 and May 4, 2020, respectively. The Revolving Credit Facility also provides for a feature that allows the Company, under certain circumstances, to increase the overall size of the Revolving Credit Facility to a maximum of $3,095. The Revolving Credit Facility generally requires payments of interest at the end of each LIBOR interest period, but no less frequently than quarterly, on LIBOR based loans, and monthly payments of interest on other loans. From the end of the revolving period to the stated maturity date as applicable for each revolving tranche, the Company is required to repay outstanding principal amounts under such revolving tranche on a monthly basis in an amount equal to 1/12th of the outstanding principal amount at the end of the revolving period.
Under the Revolving Credit Facility, the Company is required to comply with various covenants, reporting requirements and other customary requirements for similar revolving credit facilities, including, without limitation, covenants related to: (a) limitations on the incurrence of additional indebtedness and liens, (b) limitations on certain investments, (c) limitations on certain restricted payments, (d) maintaining a certain minimum stockholders’ equity, (e) maintaining a ratio of total assets (less total liabilities other than indebtedness) to total indebtedness of the Company and its consolidated subsidiaries (subject to certain exceptions) of not less than 2.0:1.0, (f) limitations on pledging certain unencumbered assets, and (g) limitations on the creation or existence of agreements that prohibit liens on certain properties of the Company and certain of its subsidiaries. These covenants are subject to important limitations and exceptions that are described in the documents governing the Revolving Credit Facility. Amounts available to borrow under the Revolving Credit Facility (and the incurrence of certain other permitted debt) are also subject to compliance with a borrowing base that applies different advance rates to different types of assets in the Company’s portfolio that are pledged as collateral. As of December 31, 2017, the Company was in compliance in all material respects with the terms of the Revolving Credit Facility.
As of December 31, 2017 and 2016, there was $395 and $571 outstanding, respectively, under the Revolving Credit Facility. As of December 31, 2017, the Revolving Credit Facility also provides for a sub-limit for the issuance of letters of credit for up to an aggregate amount of $150. As of December 31, 2017 and 2016, the Company had $44 and $28, respectively, in letters of credit issued through the Revolving Credit Facility. The amount available for borrowing under the Revolving Credit Facility is reduced by any letters of credit issued. As of December 31, 2017, there was $1,669 available for borrowing (net of letters of credit issued) under the Revolving Credit Facility.
Since March 26, 2015, the interest rate charged on the Revolving Credit Facility is based on an applicable spread of either 1.75% or 2.00% over LIBOR or 0.75% or 1.00% over an “alternate base rate” (as defined in the agreements governing the Revolving Credit Facility), in each case, determined monthly based on the total amount of the borrowing base relative to the total commitments of the Revolving Credit Facility and other debt, if any, secured by the same collateral as the Revolving Credit Facility. As of December 31, 2017, the interest rate in effect was LIBOR plus 1.75%. Prior to and including March 25, 2015, the interest rate charged on the Revolving Credit Facility was based on an applicable spread of 2.00% over LIBOR or an applicable spread of 1.00% over an “alternate base rate.” As of December 31, 2017, the one, two, three and six month LIBOR was 1.56%, 1.62%, 1.69% and 1.84%, respectively. As of December 31, 2016, the one, two, three and six month LIBOR was 0.77%, 0.82%, 1.00% and 1.32%, respectively. In addition to the stated interest expense on the Revolving Credit Facility, the Company is required to pay a commitment fee of 0.375% per annum on any unused portion of the Revolving Credit Facility. Since March 26, 2015, the Company is also required to pay a letter of credit fee of either 2.00% or 2.25% per annum on letters of credit issued, determined monthly based on the total amount of the borrowing base relative to the total commitments of the Revolving Credit Facility and other debt, if any, secured by the same collateral as the Revolving Credit Facility. Prior to and including March 25, 2015, the Company paid a letter of credit fee of 2.25% per annum on letters of credit issued.
In December 2017, the Company entered into an interest rate swap agreement to effectively fix the interest rate in connection with the $395 term loan tranche of the Revolving Credit Facility. See Note 6 for more information on the interest rate swap.
The Revolving Credit Facility is secured by certain assets in the Company’s portfolio and excludes investments held by Ares Capital CP under the Revolving Funding Facility, those held by ACJB under the SMBC Funding Facility (as defined below) and those held by AVF LP under the SBA Debentures, each as described below, and certain other investments.
For the years ended December 31, 2017, 2016 and 2015, the components of interest and credit facility fees expense, cash paid for interest expense, average stated interest rates (i.e., rate in effect plus the spread) and average outstanding balances for the Revolving Credit Facility were as follows:
F-85
For the Years Ended December 31, | |||||||||||
2017 | 2016 | 2015 | |||||||||
Stated interest expense | $ | 15 | $ | 18 | $ | 1 | |||||
Facility fees | 7 | 2 | 5 | ||||||||
Amortization of debt issuance costs | 4 | 3 | 3 | ||||||||
Total interest and credit facility fees expense | $ | 26 | $ | 23 | $ | 9 | |||||
Cash paid for interest expense | $ | 15 | $ | 18 | $ | 1 | |||||
Average stated interest rate | 2.90 | % | 2.29 | % | 2.03 | % | |||||
Average outstanding balance | $ | 514 | $ | 799 | $ | 67 | |||||
Revolving Funding Facility
The Company’s consolidated subsidiary, Ares Capital CP Funding LLC (“Ares Capital CP”), is party to a revolving funding facility (as amended, the “Revolving Funding Facility”), which allows Ares Capital CP to borrow up to $1,000 at any one time outstanding. The Revolving Funding Facility is secured by all of the assets held by, and the membership interest in, Ares Capital CP. The end of the reinvestment period and the stated maturity date for the Revolving Funding Facility are January 3, 2019 and January 3, 2022, respectively.
Amounts available to borrow under the Revolving Funding Facility are subject to a borrowing base that applies different advance rates to different types of assets held by Ares Capital CP. Ares Capital CP is also subject to limitations with respect to the loans securing the Revolving Funding Facility, including restrictions on sector concentrations, loan size, payment frequency and status, collateral interests, loans with fixed rates and loans with certain investment ratings, as well as restrictions on portfolio company leverage, which may also affect the borrowing base and therefore amounts available to borrow. The Company and Ares Capital CP are also required to comply with various covenants, reporting requirements and other customary requirements for similar facilities. These covenants are subject to important limitations and exceptions that are described in the agreements governing the Revolving Funding Facility. As of December 31, 2017, the Company and Ares Capital CP were in compliance in all material respects with the terms of the Revolving Funding Facility.
As of December 31, 2017 and 2016, there was $600 and $155 outstanding, respectively, under the Revolving Funding Facility. From October 2, 2017 to December 31, 2017, the interest rate charged on the Revolving Funding Facility was based on LIBOR plus 2.15% per annum or a “base rate” (as defined in the agreements governing the Revolving Funding Facility) plus 1.15% per annum. From January 4, 2017 to October 1, 2017, the interest rate charged on the Revolving Funding Facility was based on LIBOR plus 2.30% per annum or a “base rate” plus 1.30% per annum. Prior to and including January 3, 2017, the interest rate charged on the Revolving Funding Facility was based on an applicable spread ranging from 2.25% to 2.50% over LIBOR or ranging from 1.25% to 1.50% over a “base rate” in each case, determined monthly based on the composition of the borrowing base relative to outstanding borrowings under the Revolving Funding Facility. Ares Capital CP is also required to pay a commitment fee between 0.50% and 1.50% per annum depending on the size of the unused portion of the Revolving Funding Facility. Ares Capital CP is also required to pay a commitment termination premium in an amount equal to 1.00% of any commitment reduction prior to January 3, 2018 and 0.50% for any commitment reduction prior to July 3, 2018.
For the years ended December 31, 2017, 2016 and 2015, the components of interest and credit facility fees expense, cash paid for interest expense, average stated interest rates (i.e., rate in effect plus the spread) and average outstanding balances for the Revolving Funding Facility were as follows:
For the Years Ended December 31, | |||||||||||
2017 | 2016 | 2015 | |||||||||
Stated interest expense | $ | 17 | $ | 4 | $ | 2 | |||||
Facility fees | 4 | 2 | 4 | ||||||||
Amortization of debt issuance costs | 3 | 2 | 2 | ||||||||
Total interest and credit facility fees expense | $ | 24 | $ | 8 | $ | 8 | |||||
Cash paid for interest expense | $ | 14 | $ | 3 | $ | 3 | |||||
Average stated interest rate | 3.41 | % | 2.80 | % | 2.47 | % | |||||
Average outstanding balance | $ | 512 | $ | 142 | $ | 64 | |||||
F-86
SMBC Funding Facility
The Company’s consolidated subsidiary, Ares Capital JB Funding LLC (“ACJB”), is party to a revolving funding facility (as amended, the “SMBC Funding Facility”) with ACJB, as the borrower, and Sumitomo Mitsui Banking Corporation (“SMBC”), as the administrative agent, collateral agent, and lender, that allows ACJB to borrow up to $400 at any one time outstanding. The SMBC Funding Facility is secured by all of the assets held by ACJB. The end of the reinvestment period and the stated maturity date for the SMBC Funding Facility are September 14, 2018 and September 14, 2023, respectively. The reinvestment period and the stated maturity date are both subject to two one-year extensions by mutual agreement.
Amounts available to borrow under the SMBC Funding Facility are subject to a borrowing base that applies an advance rate to assets held by ACJB. The Company and ACJB are also required to comply with various covenants, reporting requirements and other customary requirements for similar facilities. These covenants are subject to important limitations and exceptions that are described in the documents governing the SMBC Funding Facility. As of December 31, 2017, the Company and ACJB were in compliance in all material respects with the terms of the SMBC Funding Facility.
As of December 31, 2017 and 2016, there was $60 and $105 outstanding, respectively, under the SMBC Funding Facility. Since June 30, 2015, the interest rate charged on the SMBC Funding Facility is based on an applicable spread of either 1.75% or 2.00% over LIBOR or 0.75% or 1.00% over a “base rate” (as defined in the agreements governing the SMBC Funding Facility), in each case, determined monthly based on the amount of the average borrowings outstanding under the SMBC Funding Facility. As of December 31, 2017 and 2016, the interest rate in effect was LIBOR plus 2.00%. Prior to and including June 30, 2015, the interest rate charged on the SMBC Funding Facility was based on an applicable spread of 2.00% over LIBOR or 1.00% over a “base rate.” As of December 31, 2017 and 2016, the interest rate in effect was based on the one month LIBOR, which was 1.57% and 0.71%, respectively. ACJB is required to pay a commitment fee of between 0.35% and 0.875% per annum depending on the size of the unused portion of the SMBC Funding Facility.
For the years ended December 31, 2017, 2016 and 2015, the components of interest and credit facility fees expense, cash paid for interest expense, average stated interest rates (i.e., rate in effect plus the spread) and average outstanding balances for the SMBC Funding Facility were as follows:
For the Years Ended December 31, | |||||||||||
2017 | 2016 | 2015 | |||||||||
Stated interest expense | $ | 2 | $ | 3 | $ | 1 | |||||
Facility fees | 1 | 1 | 1 | ||||||||
Amortization of debt issuance costs | 1 | 1 | 1 | ||||||||
Total interest and credit facility fees expense | $ | 4 | $ | 5 | $ | 3 | |||||
Cash paid for interest expense | $ | 2 | $ | 3 | $ | 1 | |||||
Average stated interest rate | 2.87 | % | 2.29 | % | 2.09 | % | |||||
Average outstanding balance | $ | 76 | $ | 112 | $ | 31 | |||||
SBA Debentures
In April 2015, the Company’s consolidated subsidiary, Ares Venture Finance, L.P. (“AVF LP”), received a license from the Small Business Administration (“SBA”) to operate as a Small Business Investment Company (“SBIC”) under the provisions of Section 301(c) of the Small Business Investment Act of 1958, as amended. The SBA places certain limitations on the financing of investments by SBICs in portfolio companies, including regulating the types of financings, restricting investments to only include small businesses with certain characteristics or in certain industries, and requiring capitalization thresholds that may limit distributions to the Company.
The license from the SBA allows AVF LP to obtain leverage by issuing SBA-guaranteed debentures (the “SBA Debentures”), subject to issuance of a capital commitment by the SBA and other customary procedures. Leverage through the SBA Debentures is subject to required capitalization thresholds. Current SBA regulations limit the amount that any SBIC may borrow to $150 and the original amount committed to AVF LP by the SBA was $75. Any undrawn commitments expire on September 30, 2019. The SBA Debentures are non-recourse to the Company, have interest payable semi-annually, have a 10-year maturity and may be prepaid at any time without penalty. In September 2017, AVF LP fully repaid the $25 of the aggregate principal amount of the SBA Debentures outstanding at the time, and as a result had $50 of remaining commitments to AVF LP by the SBA.
F-87
The interest rate for the SBA Debentures was fixed at the time the SBA Debentures and other applicable SBA-guaranteed debentures were pooled and sold to the public and were based on a spread over U.S. treasury notes with 10-year maturities. The pooling of newly issued SBA-guaranteed debentures occurred twice per year. The spread included an annual charge as determined by the SBA (the ‘‘Annual Charge’’) as well as a market-driven component. Prior to the 10-year fixed interest rate being determined, the interim interest rate charged for the SBA-guarantee debentures was based on LIBOR plus an applicable spread of 0.30% and the Annual Charge. As of December 31, 2016, the weighted average fixed interest rate in effect for the SBA Debentures was 3.48%.
For the years ended December 31, 2017, 2016 and 2015, the components of interest expense, cash paid for interest expense, average stated interest rate and average outstanding balances for the SBA Debentures were as follows:
For the Years Ended December 31, | |||||||||||
2017 | 2016 | 2015 | |||||||||
Stated interest expense | $ | 1 | $ | 1 | $ | — | |||||
Amortization of debt issuance costs | — | — | — | ||||||||
Total interest and credit facility fees expense | $ | 1 | $ | 1 | $ | — | |||||
Cash paid for interest expense | $ | 1 | $ | 1 | $ | — | |||||
Average stated interest rate | 3.48 | % | 3.41 | % | 2.42 | % | |||||
Average outstanding balance | $ | 17 | $ | 25 | $ | 18 | |||||
Convertible Unsecured Notes
The Company has issued $270 aggregate principal amount of unsecured convertible notes that mature on January 15, 2018 (the “2018 Convertible Notes”), $300 aggregate principal amount of unsecured convertible notes that mature on January 15, 2019 (the “2019 Convertible Notes”) and $388 aggregate principal amount of unsecured convertible notes that mature on February 1, 2022 (the “2022 Convertible Notes” and together with the 2018 Convertible Notes and the 2019 Convertible Notes, the “Convertible Unsecured Notes”). The Convertible Unsecured Notes mature upon their respective maturity dates unless previously converted or repurchased in accordance with their terms. The Company does not have the right to redeem the Convertible Unsecured Notes prior to maturity. The 2018 Convertible Notes, the 2019 Convertible Notes and the 2022 Convertible Notes bear interest at a rate of 4.75%, 4.375% and 3.75%, respectively, per year, payable semi-annually.
In certain circumstances, the Convertible Unsecured Notes will be convertible into cash, shares of the Company’s common stock or a combination of cash and shares of its common stock, at the Company’s election, at their respective conversion rates (listed below as of December 31, 2017) subject to customary anti-dilution adjustments and the requirements of their respective indenture (the “Convertible Unsecured Notes Indentures”). To the extent the 2018 Convertible Notes are converted, the Company has elected to settle with a combination of cash and shares of its common stock. Prior to the close of business on the business day immediately preceding their respective conversion date (listed below), holders may convert their Convertible Unsecured Notes only under certain circumstances set forth in the Convertible Unsecured Notes Indentures. On or after their respective conversion dates until the close of business on the scheduled trading day immediately preceding their respective maturity date, holders may convert their Convertible Unsecured Notes at any time. In addition, if the Company engages in certain corporate events as described in their respective Convertible Unsecured Notes Indenture, holders of the Convertible Unsecured Notes may require the Company to repurchase for cash all or part of the Convertible Unsecured Notes at a repurchase price equal to 100% of the principal amount of the Convertible Unsecured Notes to be repurchased, plus accrued and unpaid interest through, but excluding, the required repurchase date.
Certain key terms related to the convertible features for each of the Convertible Unsecured Notes as of December 31, 2017 are listed below.
F-88
2018 Convertible Notes | 2019 Convertible Notes | 2022 Convertible Notes | ||||||||||
Conversion premium | 17.5 | % | 15.0 | % | 15.0 | % | ||||||
Closing stock price at issuance | $ | 16.91 | $ | 17.53 | $ | 16.86 | ||||||
Closing stock price date | October 3, 2012 | July 15, 2013 | January 23, 2017 | |||||||||
Conversion price(1) | $ | 19.64 | $ | 19.99 | $ | 19.39 | ||||||
Conversion rate (shares per one thousand dollar principal amount)(1) | 50.9054 | 50.0292 | 51.5756 | |||||||||
Conversion dates | July 15, 2017 | July 15, 2018 | August 1, 2021 | |||||||||
________________________________________
(1) | Represents conversion price and conversion rate, as applicable, as of December 31, 2017, taking into account certain de minimis adjustments that will be made on the conversion date. |
As of December 31, 2017, the principal amounts of each series of the Convertible Unsecured Notes exceeded the value of the underlying shares multiplied by the per share closing price of the Company’s common stock.
The Convertible Unsecured Notes Indentures contain certain covenants, including covenants requiring the Company to comply with Section 18(a)(1)(A) as modified by Section 61(a)(1) of the Investment Company Act and to provide financial information to the holders of the Convertible Unsecured Notes under certain circumstances. These covenants are subject to important limitations and exceptions that are described in the Convertible Unsecured Notes Indentures. As of December 31, 2017, the Company was in compliance in all material respects with the terms of the Convertible Unsecured Notes Indentures.
The Convertible Unsecured Notes are accounted for in accordance with ASC 470-20. Upon conversion of any of the other Convertible Unsecured Notes, the Company intends to pay the outstanding principal amount in cash and to the extent that the conversion value exceeds the principal amount, the Company has the option to pay in cash or shares of the Company’s common stock (or a combination of cash and shares) in respect of the excess amount, subject to the requirements of the Convertible Unsecured Notes Indentures. The Company has determined that the embedded conversion options in the Convertible Unsecured Notes are not required to be separately accounted for as a derivative under GAAP. In accounting for the Convertible Unsecured Notes, the Company estimated at the time of issuance separate debt and equity components for each of the Convertible Unsecured Notes. An original issue discount equal to the equity components of the Convertible Unsecured Notes was recorded in “capital in excess of par value” in the accompanying consolidated balance sheet. Additionally, the issuance costs associated with the Convertible Unsecured Notes were allocated to the debt and equity components in proportion to the allocation of the proceeds and accounted for as debt issuance costs and equity issuance costs, respectively.
The debt and equity component percentages, the issuance costs and the equity component amounts for each of the Convertible Unsecured Notes are listed below.
2018 Convertible Notes | 2019 Convertible Notes | 2022 Convertible Notes | |||||||||
Debt and equity component percentages, respectively(1) | 98.0% and 2.0% | 99.8% and 0.2% | 96.0% and 4.0% | ||||||||
Debt issuance costs(1) | $ | 6 | $ | 4 | $ | 9 | |||||
Equity issuance costs(1) | $ | — | $ | — | $ | — | |||||
Equity component, net of issuance costs(2) | $ | 5 | $ | 1 | $ | 15 | |||||
________________________________________
(1) | At time of issuance. |
(2) | At time of issuance and as of December 31, 2017. |
In addition to the original issue discount equal to the equity components of the Convertible Unsecured Notes, the 2018 Convertible Notes and the 2019 Convertible Notes were each issued at a discount. The Company records interest expense comprised of both stated interest expense as well as accretion of any original issue discount.
As of December 31, 2017, the components of the carrying value of the Convertible Unsecured Notes, the stated interest rate and the effective interest rate were as follows:
F-89
2018 Convertible Notes | 2019 Convertible Notes | 2022 Convertible Notes | |||||||||
Principal amount of debt | $ | 270 | $ | 300 | $ | 388 | |||||
Debt issuance costs, net of amortization | — | (1 | ) | (13 | ) | ||||||
Original issue discount, net of accretion | — | (1 | ) | (7 | ) | ||||||
Carrying value of debt | $ | 270 | $ | 298 | $ | 368 | |||||
Stated interest rate | 4.750 | % | 4.375 | % | 3.750 | % | |||||
Effective interest rate(1) | 5.3 | % | 4.7 | % | 4.5 | % | |||||
________________________________________
(1) | The effective interest rate of the debt component of the Convertible Unsecured Notes is equal to the stated interest rate plus the accretion of original issue discount. |
In February 2016, the Company repaid in full the $575 aggregate principal amount of unsecured convertible notes upon their maturity. In June 2016, the Company repaid in full the $230 aggregate principal amount of unsecured convertible notes upon their maturity. In March 2017, the Company repaid in full the $162 aggregate principal amount of unsecured convertible notes (the “2017 Convertible Notes”) upon their maturity.
For the years ended December 31, 2017, 2016 and 2015, the components of interest expense and cash paid for interest expense for the Convertible Unsecured Notes, as well as any other convertible unsecured notes outstanding during the periods presented are listed below.
For the Years Ended December 31, | |||||||||||
2017 | 2016 | 2015 | |||||||||
Stated interest expense | $ | 41 | $ | 42 | $ | 79 | |||||
Amortization of debt issuance costs | 4 | 4 | 7 | ||||||||
Accretion of original issue discount | 5 | 6 | 17 | ||||||||
Total interest expense | $ | 50 | $ | 52 | $ | 103 | |||||
Cash paid for interest expense | $ | 37 | $ | 56 | $ | 79 | |||||
Unsecured Notes
2018 Notes
The Company has issued $750 in aggregate principal amount of unsecured notes that mature on November 30, 2018 (the “2018 Notes”). The 2018 Notes bear interest at a rate of 4.875% per year, payable semi-annually and all principal is due upon maturity. The 2018 Notes may be redeemed in whole or in part at any time at the Company’s option at a redemption price equal to par plus a “make whole” premium, as determined pursuant to the indenture governing the 2018 Notes, and any accrued and unpaid interest. $600 in aggregate principal amount of the 2018 Notes were issued at a discount to the principal amount and $150 in aggregate principal amount of the 2018 Notes were issued at a premium to the principal amount.
2020 Notes
The Company has issued $600 in aggregate principal amount of unsecured notes that mature on January 15, 2020 (the “2020 Notes”). The 2020 Notes bear interest at a rate of 3.875% per year, payable semi-annually and all principal is due upon maturity. The 2020 Notes may be redeemed in whole or in part at any time at the Company’s option at a redemption price equal to par plus a “make whole” premium, if applicable, as determined pursuant to the indenture governing the 2020 Notes, and any accrued and unpaid interest. $400 in aggregate principal amount of the 2020 Notes were issued at a discount to the principal amount and $200 in aggregate principal amount of the 2020 Notes were issued at a premium to the principal amount.
January 2022 Notes
The Company has issued $600 in aggregate principal amount of unsecured notes that mature on January 19, 2022 (the “January 2022 Notes”). The January 2022 Notes bear interest at a rate of 3.625% per year, payable semi-annually and all
F-90
principal is due upon maturity. The January 2022 Notes may be redeemed in whole or in part at any time at the Company’s option at a redemption price equal to par plus a “make whole” premium, if applicable, as determined pursuant to the indenture governing the January 2022 Notes, and any accrued and unpaid interest. The January 2022 Notes were issued at a discount to the principal amount.
October 2022 Notes
In June 2017, the Company redeemed the entire $183 in aggregate principal amount outstanding of the unsecured notes that were scheduled to mature on October 1, 2022 (the ‘‘October 2022 Notes’’) in accordance with the terms of the indenture governing the October 2022 Notes. The October 2022 Notes bore interest at a rate of 5.875% per year, payable quarterly. The October 2022 Notes were redeemed at par plus accrued and unpaid interest for a total redemption price of approximately $185, which resulted in a realized loss on the extinguishment of debt of $4.
2023 Notes
The Company has issued $750 in aggregate principal amount of unsecured notes that mature on February 10, 2023 (the “2023 Notes”). The 2023 Notes bear interest at a rate of 3.500% per year, payable semi-annually and all principal is due upon maturity. The 2023 Notes may be redeemed in whole or in part at any time at the Company’s option at a redemption price equal to par plus a “make whole” premium, if applicable, as determined pursuant to the indenture governing the 2023 Notes, and any accrued and unpaid interest. The 2023 Notes were issued at a discount to the principal amount.
2047 Notes
As part of the acquisition of Allied Capital Corporation (“Allied Capital”) in April 2010 (the “Allied Acquisition”), the Company assumed $230 aggregate principal amount of unsecured notes due on April 15, 2047 (the “2047 Notes” and together with the 2018 Notes, the 2020 Notes, the January 2022 Notes and the 2023 Notes, the “Unsecured Notes”). The 2047 Notes bear interest at a rate of 6.875%, payable quarterly and all principal is due upon maturity. The 2047 Notes may be redeemed in whole or in part at any time or from time to time at the Company’s option, at a par redemption price of $25.00 per security plus accrued and unpaid interest. As of December 31, 2017 and 2016, the outstanding principal was $230 and $230 respectively, and the carrying value was $182 and $182, respectively. The carrying value represents the outstanding principal amount of the 2047 Notes less the unaccreted purchased discount recorded as a part of the Allied Acquisition.
See Note 18 for a subsequent event regarding an additional issuance of unsecured notes.
For the years ended December 31, 2017, 2016 and 2015, the components of interest expense and cash paid for interest expense for the Unsecured Notes, as well as any other unsecured notes outstanding during the periods presented are listed below.
For the Years Ended December 31, | |||||||||||
2017 | 2016 | 2015 | |||||||||
Stated interest expense | $ | 113 | $ | 93 | $ | 100 | |||||
Amortization of debt issuance costs | 6 | 4 | 4 | ||||||||
Net accretion of original issue discount | 1 | — | — | ||||||||
Accretion of purchase discount | — | — | — | ||||||||
Total interest expense | $ | 120 | $ | 97 | $ | 104 | |||||
Cash paid for interest expense | $ | 102 | $ | 87 | $ | 97 | |||||
The Unsecured Notes contain certain covenants, including covenants requiring the Company to comply with Section 18(a)(1)(A) as modified by Section 61(a)(1) of the Investment Company Act and to provide financial information to the holders of such notes under certain circumstances. These covenants are subject to important limitations and exceptions set forth in the indentures governing such notes. As of December 31, 2017, the Company was in compliance in all material respects with the terms of the respective indentures governing each of the Unsecured Notes.
The Convertible Unsecured Notes and the Unsecured Notes are the Company’s unsecured senior obligations and rank senior in right of payment to any future indebtedness that is expressly subordinated in right of payment to the Convertible Unsecured Notes and the Unsecured Notes; equal in right of payment to the Company’s existing and future unsecured
F-91
indebtedness that is not expressly subordinated; effectively junior in right of payment to any of its secured indebtedness (including existing unsecured indebtedness that the Company later secures) to the extent of the value of the assets securing such indebtedness; and structurally junior to all existing and future indebtedness (including trade payables) incurred by the Company’s subsidiaries, financing vehicles or similar facilities.
6. DERIVATIVE INSTRUMENTS
The Company enters into forward currency contracts from time to time to help mitigate the impact that an adverse change in foreign exchange rates would have on the value of the Company’s investments denominated in foreign currencies. As of December 31, 2017 and 2016, the counterparty to these forward currency contracts was Bank of Montreal. Net unrealized gains or losses on foreign currency contracts are included in “net unrealized gains (losses) from foreign currency and other transactions” and net realized gains or losses on forward currency contracts are included in “net realized gains (losses) from foreign currency transactions” in the accompanying consolidated statement of operations.
The Company had an agreement with the SDLP to sell certain of the Company’s investments to the SDLP at a mutually agreed upon price on a future date (the “Forward Sale Agreement”). The value of the Forward Sale Agreement with the SDLP changed as the fair value of the identified loans changed and as additional loans were added to such agreement. In July 2016, the Company and Varagon and its clients completed the initial funding of the SDLP. In conjunction with the initial funding, the Company and Varagon and its clients sold investment commitments to the SDLP and the Forward Sale Agreement was terminated. For the year ended December 31, 2016, the unrealized gain related to this agreement was included in the “net unrealized gains (losses) from foreign currency and other transactions” in the accompanying consolidated statement of operations.
Forward currency contracts and interest rate swaps are considered undesignated derivative instruments.
Certain information related to the Company’s foreign currency forward contracts is presented below as of December 31, 2017 and 2016.
As of December 31, 2017 | ||||||||||||||||
Description | Notional Amount | Maturity Date | Gross Amount of Recognized Assets | Gross Amount of Recognized Liabilities | Balance Sheet Location of Net Amounts | |||||||||||
Foreign currency forward contract | CAD | 4 | 1/4/2018 | $ | — | $ | — | Other Assets | ||||||||
Foreign currency forward contract | CAD | 10 | 1/16/2018 | — | — | Other Assets | ||||||||||
Foreign currency forward contract | CAD | 103 | 2/16/2018 | — | (1 | ) | Accounts payable and other liabilities | |||||||||
Foreign currency forward contract | € | 15 | 1/16/2018 | — | — | Accounts payable and other liabilities | ||||||||||
Foreign currency forward contract | € | 8 | 2/15/2018 | — | — | Accounts payable and other liabilities | ||||||||||
Foreign currency forward contract | € | 2 | 3/15/2018 | — | — | Accounts payable and other liabilities | ||||||||||
Foreign currency forward contract | ₤ | 68 | 2/15/2018 | — | (2 | ) | Accounts payable and other liabilities | |||||||||
Foreign currency forward contract | ₤ | 9 | 2/16/2018 | — | — | Accounts payable and other liabilities | ||||||||||
Total | $ | — | $ | (3 | ) | |||||||||||
As of December 31, 2016 | ||||||||||||||||
Description | Notional Amount | Maturity Date | Gross Amount of Recognized Assets | Gross Amount of Recognized Liabilities | Balance Sheet Location of Net Amounts | |||||||||||
Foreign currency forward contract | € | 2 | 1/5/2017 | $ | — | $ | — | Other Assets | ||||||||
Total | $ | — | $ | — | ||||||||||||
In December 2017, in connection with the $395 term loan tranche of the Revolving Credit Facility the Company entered into a three-year interest rate swap agreement to mitigate our exposure to adverse fluctuations in interest rates for a
F-92
total notional amount of $395 and a maturity date of January 4, 2021. Under the interest rate swap agreement, the Company will pay a fixed interest rate of 2.06% and receive a floating rate based on the prevailing one-month LIBOR, with the ability to elect one, two or three-month LIBOR. As of December 31, 2017 the one-month LIBOR rate in effect was 1.50%. For the year ended December 31, 2017, the Company recognized $1 in unrealized depreciation related to this swap agreement. As of December 31, 2017, this swap agreement had a fair value of $(1), which is included in the "accounts payable and other liabilities" in the accompanying consolidated balance sheet. Net unrealized gains or losses on the interest rate swap are included in “net unrealized gains (losses) from foreign currency and other transactions.”
Certain information related to the Company’s interest rate swap is presented below as of December 31, 2017.
As of December 31, 2017 | |||||||||||||||||||
Description | Payment Terms | Notional Amount | Maturity Date | Gross Amount of Recognized Assets | Gross Amount of Recognized Liabilities | Balance Sheet Location of Net Amounts | |||||||||||||
Interest rate swap | Pay Fixed 2.0642% | Receive Floating One-Month LIBOR of 1.50% | $ | 395 | 1/4/2021 | $ | — | $ | (1 | ) | Accounts payable and other liabilities | ||||||||
Total | $ | — | $ | (1 | ) | ||||||||||||||
7. COMMITMENTS AND CONTINGENCIES
The Company has various commitments to fund investments in its portfolio as described below. As of December 31, 2017 and 2016, the Company had the following commitments to fund various revolving and delayed draw senior secured and subordinated loans, including commitments to fund which are at (or substantially at) the Company’s discretion:
As of December 31, | |||||||
2017 | 2016 | ||||||
Total revolving and delayed draw loan commitments | $ | 881 | $ | 411 | |||
Less: drawn commitments | (201 | ) | (81 | ) | |||
Total undrawn commitments | 680 | 330 | |||||
Less: commitments substantially at discretion of the Company | (11 | ) | (12 | ) | |||
Less: unavailable commitments due to borrowing base or other covenant restrictions | — | — | |||||
Total net adjusted undrawn revolving and delayed draw loan commitments | $ | 669 | $ | 318 | |||
Included within the total revolving and delayed draw loan commitments as of December 31, 2017 and 2016 were delayed draw loan commitments totaling $251 and $92, respectively. The Company’s commitment to fund delayed draw loans is triggered upon the satisfaction of certain pre-negotiated terms and conditions. Generally, the most significant and uncertain term requires the borrower to satisfy a specific use of proceeds covenant. The use of proceeds covenant typically requires the borrower to use the additional loans for the specific purpose of a permitted acquisition or permitted investment, for example. In addition to the use of proceeds covenant, the borrower is generally required to satisfy additional negotiated covenants (including specified leverage levels).
Also included within the total revolving and delayed draw loan commitments as of December 31, 2017 were commitments to issue up to $158 in letters of credit through a financial intermediary on behalf of certain portfolio companies. As of December 31, 2017, the Company had $29 in letters of credit issued and outstanding under these commitments on behalf of portfolio companies. For all these letters of credit issued and outstanding, the Company would be required to make payments to third parties if the portfolio companies were to default on their related payment obligations. Of these letters of credit, $28 expire in 2018 and $1 expire in 2019. As of December 31, 2017, the Company recorded a liability of $7 for certain letters of credit issued and outstanding and none of the other letters of credit issued and outstanding were recorded as a liability on the Company’s balance sheet as such other letters of credit are considered in the valuation of the investments in the portfolio company.
The Company also has commitments to co-invest in the SDLP for the Company’s portion of the SDLP’s commitments to fund delayed draw loans to certain portfolio companies of the SDLP. The Company previously had commitments to co-invest in the SSLP for the Company’s portion of the SSLP’s commitments to fund delayed draw loans to certain portfolio companies of the SSLP. See Note 4 for more information.
F-93
As of December 31, 2017 and 2016, the Company was party to subscription agreements to fund equity investments in private equity investment partnerships as follows:
As of December 31, | |||||||
2017 | 2016 | ||||||
Total private equity commitments | $ | 111 | $ | 57 | |||
Less: funded private equity commitments | (62 | ) | (17 | ) | |||
Total unfunded private equity commitments | 49 | 40 | |||||
Less: private equity commitments substantially at discretion of the Company | (48 | ) | (39 | ) | |||
Total net adjusted unfunded private equity commitments | $ | 1 | $ | 1 | |||
In the ordinary course of business, the Company may sell certain of its investments to third party purchasers. In particular, in connection with the sale of certain controlled portfolio company equity investments (as well as certain other sales) the Company has, and may continue to do so in the future, agreed to indemnify such purchasers for future liabilities arising from the investments and the related sale transaction. Such indemnification provisions have given rise to liabilities in the past and may do so in the future.
In addition, in the ordinary course of business, the Company may guarantee certain obligations in connection with its portfolio companies (in particular, certain controlled portfolio companies). Under these guarantee arrangements, payments may be required to be made to third parties if such guarantees are called upon or if the portfolio companies were to default on their related obligations, as applicable.
Lease Commitments
The Company is obligated under a number of operating leases and subleases for office spaces with terms ranging from less than one year to more than 15 years. Total rent expense incurred by the Company for the years ended December 31, 2017, 2016 and 2015 was $3, $4 and $4, respectively.
The following table shows future minimum payments under the Company’s operating leases and subleases where it is a sublessee as of December 31, 2017:
For the Years Ending December 31, | Amount | |||
2018 | $ | 26 | ||
2019 | 25 | |||
2020 | 25 | |||
2021 | 25 | |||
2022 | 25 | |||
Thereafter | 65 | |||
Total | $ | 191 | ||
For certain of its operating leases, the Company has entered into subleases including ones with Ares Management and IHAM. See Note 13 for further description of these subleases.
The following table shows future expected rental payments to be received under the Company’s subleases where the Company is the sublessor as of December 31, 2017. The current allocations reflected below are as of December 31, 2017. The allocations in connection with the Company’s subleases are subject to change and future review. Further, such allocations are subject to change depending on the composition of, and functions performed by, the staff in each office.
F-94
For the Years Ending December 31, | Amount | |||
2018 | $ | 14 | ||
2019 | 17 | |||
2020 | 16 | |||
2021 | 17 | |||
2022 | 16 | |||
Thereafter | 44 | |||
Total | $ | 124 | ||
8. FAIR VALUE OF FINANCIAL INSTRUMENTS
The Company follows ASC 825-10, which provides companies the option to report selected financial assets and liabilities at fair value. ASC 825-10 also establishes presentation and disclosure requirements designed to facilitate comparisons between companies that choose different measurement attributes for similar types of assets and liabilities and to more easily understand the effect of the company’s choice to use fair value on its earnings. ASC 825-10 also requires entities to display the fair value of the selected assets and liabilities on the face of the balance sheet. The Company has not elected the ASC 825-10 option to report selected financial assets and liabilities at fair value. With the exception of the line items entitled “other assets” and “debt,” which are reported at amortized cost, all assets and liabilities approximate fair value on the balance sheet. The carrying value of the lines titled “interest receivable,” “receivable for open trades,” “payable for open trades,” “accounts payable and other liabilities,” “base management fees payable,” “income based fees payable,” “capital gains incentive fees payable” and “interest and facility fees payable” approximate fair value due to their short maturity.
The Company also follows ASC 820-10, which expands the application of fair value accounting. ASC 820-10 defines fair value, establishes a framework for measuring fair value in accordance with GAAP and expands disclosure of fair value measurements. ASC 820-10 determines fair value to be the price that would be received for an investment in a current sale, which assumes an orderly transaction between market participants on the measurement date. ASC 820-10 requires the Company to assume that the portfolio investment is sold in its principal market to market participants or, in the absence of a principal market, the most advantageous market, which may be a hypothetical market. Market participants are defined as buyers and sellers in the principal or most advantageous market that are independent, knowledgeable, and willing and able to transact. In accordance with ASC 820-10, the Company has considered its principal market as the market in which the Company exits its portfolio investments with the greatest volume and level of activity. ASC 820-10 specifies a hierarchy of valuation techniques based on whether the inputs to those valuation techniques are observable or unobservable. In accordance with ASC 820-10, these inputs are summarized in the three broad levels listed below:
• | Level 1—Valuations based on quoted prices in active markets for identical assets or liabilities that the Company has the ability to access. |
• | Level 2—Valuations based on quoted prices in markets that are not active or for which all significant inputs are observable, either directly or indirectly. |
• | Level 3—Valuations based on inputs that are unobservable and significant to the overall fair value measurement. |
In addition to using the above inputs in investment valuations, the Company continues to employ the net asset valuation policy approved by the Company’s board of directors that is consistent with ASC 820-10 (see Note 2). Consistent with the Company’s valuation policy, it evaluates the source of inputs, including any markets in which the Company’s investments are trading (or any markets in which securities with similar attributes are trading), in determining fair value. The Company’s valuation policy considers the fact that because there is not a readily available market value for most of the investments in the Company’s portfolio, the fair value of the investments must typically be determined using unobservable inputs.
The Company’s portfolio investments (other than as described below in the following paragraph) are typically valued using two different valuation techniques. The first valuation technique is an analysis of the enterprise value (“EV”) of the portfolio company. Enterprise value means the entire value of the portfolio company to a market participant, including the sum of the values of debt and equity securities used to capitalize the enterprise at a point in time. The primary method for determining EV uses a multiple analysis whereby appropriate multiples are applied to the portfolio company’s EBITDA (generally defined as net income before net interest expense, income tax expense, depreciation and amortization). EBITDA
F-95
multiples are typically determined based upon review of market comparable transactions and publicly traded comparable companies, if any. The Company may also employ other valuation multiples to determine EV, such as revenues or, in the case of certain portfolio companies in the power generation industry, kilowatt capacity. The second method for determining EV uses a discounted cash flow analysis whereby future expected cash flows of the portfolio company are discounted to determine a present value using estimated discount rates (typically a weighted average cost of capital based on costs of debt and equity consistent with current market conditions). The EV analysis is performed to determine the value of equity investments, the value of debt investments in portfolio companies where the Company has control or could gain control through an option or warrant security, and to determine if there is credit impairment for debt investments. If debt investments are credit impaired, an EV analysis may be used to value such debt investments; however, in addition to the methods outlined above, other methods such as a liquidation or wind-down analysis may be utilized to estimate enterprise value. The second valuation technique is a yield analysis, which is typically performed for non-credit impaired debt investments in portfolio companies where the Company does not own a controlling equity position. To determine fair value using a yield analysis, a current price is imputed for the investment based upon an assessment of the expected market yield for a similarly structured investment with a similar level of risk. In the yield analysis, the Company considers the current contractual interest rate, the maturity and other terms of the investment relative to risk of the company and the specific investment. A key determinant of risk, among other things, is the leverage through the investment relative to the enterprise value of the portfolio company. As debt investments held by the Company are substantially illiquid with no active transaction market, the Company depends on primary market data, including newly funded transactions, as well as secondary market data with respect to high yield debt instruments and syndicated loans, as inputs in determining the appropriate market yield, as applicable.
For other portfolio investments such as investments in the SDLP Certificates, discounted cash flow analysis is the primary technique utilized to determine fair value. Expected future cash flows associated with the investment are discounted to determine a present value using a discount rate that reflects estimated market return requirements.
The following tables summarize the significant unobservable inputs the Company used to value the majority of its investments categorized within Level 3 as of December 31, 2017 and 2016. The tables are not intended to be all-inclusive, but instead capture the significant unobservable inputs relevant to the Company’s determination of fair values.
As of December 31, 2017 | |||||||||||||
Unobservable Input | |||||||||||||
Asset Category | Fair Value | Primary Valuation Techniques | Input | Estimated Range | Weighted Average | ||||||||
First lien senior secured loans | $ | 5,197 | Yield analysis | Market yield | 4.2% - 19.8% | 8.7% | |||||||
Second lien senior secured loans | 3,744 | Yield analysis | Market yield | 8.7% - 17.5% | 10.9% | ||||||||
Subordinated certificates of the SDLP | 487 | Discounted cash flow analysis | Discount rate | 11.5% - 12.5% | 12.0% | ||||||||
Senior subordinated loans | 995 | Yield analysis | Market yield | 9.7% - 17.5% | 13.2% | ||||||||
Collateralized loan obligations | 114 | Discounted cash flow analysis | Discount rate | 4.3% - 16.4% | 10.2% | ||||||||
Constant prepayment rate | 18.7% - 27.1% | 21.8% | |||||||||||
Constant default rate | 1.8% - 2.6% | 2.3% | |||||||||||
Preferred equity securities | 532 | EV market multiple analysis | EBITDA multiple | 3.0x - 19.0x | 11.2x | ||||||||
Other equity securities and other | 755 | EV market multiple analysis | EBITDA multiple | 3.5x - 19.0x | 10.4x | ||||||||
Total investments | $ | 11,824 | |||||||||||
F-96
As of December 31, 2016 | ||||||||||||||
Unobservable Input | ||||||||||||||
Asset Category | Fair Value | Primary Valuation Techniques | Input | Estimated Range | Weighted Average | |||||||||
First lien senior secured loans | $ | 2,036 | Yield analysis | Market yield | 5.5% - 20.0% | 9.3 | % | |||||||
Second lien senior secured loans | 2,987 | Yield analysis | Market yield | 8.4% - 20.8% | 10.7 | % | ||||||||
Subordinated certificates of the SDLP | 270 | Discounted cash flow analysis | Discount rate | 11.0% - 12.0% | 11.5 | % | ||||||||
Subordinated certificates of the SSLP | 1,914 | Discounted cash flow analysis | Discount rate | 6.5% - 7.5% | 7.0 | % | ||||||||
Senior subordinated loans | 714 | Yield analysis | Market yield | 9.8% - 17.5% | 12.2 | % | ||||||||
Preferred equity securities | 273 | EV market multiple analysis | EBITDA multiple | 3.5x - 14.8x | 8.6 | x | ||||||||
Other equity securities and other | 619 | EV market multiple analysis | EBITDA multiple | 5.0x - 16.4x | 10.7 | x | ||||||||
Total investments | $ | 8,813 | ||||||||||||
Changes in market yields, discount rates or EBITDA multiples, each in isolation, may change the fair value of certain of the Company’s investments. Generally, an increase in market yields or discount rates or decrease in EBITDA multiples may result in a decrease in the fair value of certain of the Company’s investments.
Due to the inherent uncertainty of determining the fair value of investments that do not have a readily available market value, the fair value of the Company’s investments may fluctuate from period to period. Additionally, the fair value of the Company’s investments may differ significantly from the values that would have been used had a ready market existed for such investments and may differ materially from the values that the Company may ultimately realize. Further, such investments are generally subject to legal and other restrictions on resale or otherwise are less liquid than publicly traded securities. If the Company was required to liquidate a portfolio investment in a forced or liquidation sale, it could realize significantly less than the value at which the Company has recorded it.
In addition, changes in the market environment and other events that may occur over the life of the investments may cause the gains or losses ultimately realized on these investments to be different than the unrealized gains or losses reflected in the valuations currently assigned.
The following table presents fair value measurements of cash and cash equivalents, investments and derivatives as of December 31, 2017:
Fair Value Measurements Using | |||||||||||||||
Total | Level 1 | Level 2 | Level 3 | ||||||||||||
Cash and cash equivalents | $ | 316 | $ | 316 | $ | — | $ | — | |||||||
Investments not measured at net asset value | $ | 11,824 | $ | — | $ | — | $ | 11,824 | |||||||
Investments measured at net asset value (1) | $ | 17 | |||||||||||||
Total investments | $ | 11,841 | |||||||||||||
Derivatives | $ | (4 | ) | $ | — | $ | (4 | ) | $ | — | |||||
________________________________________
(1) | Certain investments that are measured at fair value using the net asset value per share (or its equivalent) practical expedient have not been categorized in the fair value hierarchy. The fair value amounts presented in this table are intended to permit reconciliation of the fair value hierarchy to the amounts presented in the consolidated balance sheet. |
F-97
The following table presents fair value measurements of cash and cash equivalents, investments and derivatives as of December 31, 2016:
Fair Value Measurements Using | |||||||||||||||
Total | Level 1 | Level 2 | Level 3 | ||||||||||||
Cash and cash equivalents | $ | 223 | $ | 223 | $ | — | $ | — | |||||||
Investments not measured at net asset value | $ | 8,814 | $ | 1 | $ | — | $ | 8,813 | |||||||
Investments measured at net asset value (1) | $ | 6 | |||||||||||||
Total investments | $ | 8,820 | |||||||||||||
Derivatives | $ | — | $ | — | $ | — | $ | — | |||||||
________________________________________
(1) | Certain investments that are measured at fair value using the net asset value per share (or its equivalent) practical expedient have not been categorized in the fair value hierarchy. The fair value amounts presented in this table are intended to permit reconciliation of the fair value hierarchy to the amounts presented in the consolidated balance sheet. |
Transfers between levels, if any, are recognized at the beginning of the quarter in which the transfers occur.
The following table presents changes in investments that use Level 3 inputs as of and for the year ended December 31, 2017:
As of and For the Year Ended December 31, 2017 | |||
Balance as of December 31, 2016 | $ | 8,813 | |
Net realized gains | 43 | ||
Net unrealized gains | 141 | ||
Investments acquired as part of the American Capital Acquisition | 2,527 | ||
Purchases | 7,228 | ||
Sales | (1,838 | ) | |
Redemptions | (5,179 | ) | |
Payment-in-kind interest and dividends | 79 | ||
Net accretion of discount on securities | 10 | ||
Net transfers in and/or out of Level 3 | — | ||
Balance as of December 31, 2017 | $ | 11,824 | |
As of December 31, 2017, the net unrealized depreciation on the investments that use Level 3 inputs was $82. For the year ended December 31, 2017, the net transfers out of Level 3 were due to privately held equity investments converting to publicly traded stock.
For the year ended December 31, 2017, the total amount of gains (losses) for the period included in earnings attributable to the change in unrealized gains (losses) relating to the Company’s Level 3 assets still held as of December 31, 2017, and reported within the net unrealized gains (losses) from investments, foreign currency and other transactions in the Company’s consolidated statement of operations was $107.
The following table presents changes in investments that use Level 3 inputs as of and for the year ended December 31, 2016:
F-98
As of and For the Year Ended December 31, 2016 | |||
Balance as of December 31, 2015 | $ | 9,045 | |
Net realized gains | 105 | ||
Net unrealized losses | (113 | ) | |
Purchases | 3,474 | ||
Sales | (1,776 | ) | |
Redemptions | (1,970 | ) | |
Payment-in-kind interest and dividends | 48 | ||
Net accretion of discount on securities | 6 | ||
Net transfers in and/or out of Level 3 | (6 | ) | |
Balance as of December 31, 2016 | $ | 8,813 | |
As of December 31, 2016, the net unrealized depreciation on the investments that use Level 3 inputs was $223. For the year ended December 31, 2016, the net transfers out of Level 3 were due to privately held equity investments converting to publicly traded stock.
For the year ended December 31, 2016, the total amount of gains (losses) for the period included in earnings attributable to the change in unrealized gains (losses) relating to the Company’s Level 3 assets still held as of December 31, 2016, and reported within the net unrealized gains (losses) from investments, foreign currency and other transactions in the Company’s consolidated statement of operations was $(139).
The following table presents changes in derivatives that use Level 3 inputs as of and for the year ended December 31, 2016:
As of and For the Year Ended December 31, 2016 | |||
Balance as of December 31, 2015 | $ | 3 | |
Net unrealized appreciation reversed related to the termination of the Forward Sale Agreement | (3 | ) | |
Balance as of December 31, 2016 | $ | — | |
As of December 31, 2016, the Company did not have any net unrealized appreciation on the derivatives that use Level 3 inputs.
Following are the carrying and fair values of the Company’s debt obligations as of December 31, 2017 and 2016. Fair value is estimated by discounting remaining payments using applicable current market rates, which take into account changes in the Company’s marketplace credit ratings, or market quotes, if available.
As of December 31, | |||||||||||||||
2017 | 2016 | ||||||||||||||
Carrying value(1) | Fair value | Carrying value(1) | Fair value | ||||||||||||
Revolving Credit Facility | $ | 395 | $ | 395 | $ | 571 | $ | 571 | |||||||
Revolving Funding Facility | 600 | 600 | 155 | 155 | |||||||||||
SMBC Funding Facility | 60 | 60 | 105 | 105 | |||||||||||
SBA Debentures | — | — | 24 | 25 | |||||||||||
2017 Convertible Notes (principal amount outstanding of $0 and $162, respectively) | — | — | 162 | (2) | 163 | ||||||||||
2018 Convertible Notes (principal amount outstanding of $270) | 270 | (2) | 270 | 267 | (2) | 278 | |||||||||
2019 Convertible Notes (principal amount outstanding of $300) | 298 | (2) | 307 | 296 | (2) | 312 | |||||||||
2022 Convertible Notes (principal amount outstanding of $388 and $0, respectively) | 368 | (2) | $ | 398 | — | — | |||||||||
F-99
2018 Notes (principal amount outstanding of $750) | 748 | (3) | 767 | 745 | (3) | 776 | |||||||||
2020 Notes (principal amount outstanding of $600) | 597 | (4) | 611 | 596 | (4) | 608 | |||||||||
January 2022 Notes (principal amount outstanding of $600) | 593 | (5) | 603 | 592 | (5) | 584 | |||||||||
October 2022 Notes (principal amount outstanding of $0 and $183, respectively) | — | — | 179 | (6) | 184 | ||||||||||
2023 Notes (principal amount outstanding of $750 and $0, respectively) | 743 | (7) | 740 | — | — | ||||||||||
2047 Notes (principal amount outstanding of $230) | 182 | (8) | 231 | 182 | (8) | 228 | |||||||||
$ | 4,854 | (9) | $ | 4,982 | $ | 3,874 | (9) | $ | 3,989 | ||||||
________________________________________
(1) | The Revolving Credit Facility, the Revolving Funding Facility and the SMBC Funding Facility carrying values are the same as the principal amounts outstanding. |
(2) | Represents the aggregate principal amount outstanding of the Convertible Unsecured Notes less unamortized debt issuance costs and the unaccreted discount recorded upon the issuances of such notes. |
(3) | Represents the aggregate principal amount outstanding of the 2018 Notes less unamortized debt issuance costs plus the net unamortized premium recorded upon the issuances of the 2018 Notes. |
(4) | Represents the aggregate principal amount outstanding of the 2020 Notes less unamortized debt issuance costs and the net unaccreted discount recorded upon the issuances of the 2020 Notes. |
(5) | Represents the aggregate principal amount outstanding of the January 2022 Notes less unamortized debt issuance costs and the unaccreted discount recorded upon the issuance of the January 2022 Notes. |
(6) | Represents the aggregate principal amount outstanding of the October 2022 Notes less unamortized debt issuance costs. |
(7) | Represents the aggregate principal amount outstanding of the 2023 Notes less unamortized debt issuance costs and the unaccreted discount recorded upon the issuance of the 2023 Notes. |
(8) | Represents the aggregate principal amount outstanding of the 2047 Notes less the unaccreted purchased discount. |
(9) | Total principal amount of debt outstanding totaled $4,943 and $3,951 as of December 31, 2017 and December 31, 2016, respectively. |
The following table presents fair value measurements of the Company’s debt obligations as of December 31, 2017 and 2016:
As of December 31, | ||||||||
Fair Value Measurements Using | 2017 | 2016 | ||||||
Level 1 | $ | 231 | $ | 412 | ||||
Level 2 | 4,751 | 3,577 | ||||||
Total | $ | 4,982 | $ | 3,989 | ||||
9. STOCKHOLDERS’ EQUITY
There were no sales of the Company’s equity securities for the years ended December 31, 2017, 2016 and 2015. See Note 12 for information regarding shares of common stock issued or purchased in accordance with the Company’s dividend reinvestment plan.
In connection with the American Capital Acquisition, the Company issued 112 shares valued at approximately $1,839. See Note 16 for additional information regarding the American Capital Acquisition.
F-100
Stock Repurchase Program
In September 2015, the Company's board of directors approved a stock repurchase program authorizing the Company to repurchase up to $100 in the aggregate of its outstanding common stock in the open market at certain thresholds below its net asset value per share, in accordance with the guidelines specified in Rule 10b-18 under the Securities Exchange Act of 1934, as amended. The timing, manner, price and amount of any share repurchases will be determined by the Company, in its discretion, based upon the evaluation of economic and market conditions, stock price, applicable legal and regulatory requirements and other factors. In May 2016, the Company suspended its stock repurchase program pending the completion of the American Capital Acquisition. In February 2017, the Company’s board of directors authorized an amendment to its $300 stock repurchase program to (a) increase the total authorization under the program from $100 to $300 and (b) extend the expiration date of the program from February 28, 2017 to February 28, 2018 (see Note 18 for more information). Under the stock repurchase program, the Company may repurchase up to $300 in the aggregate of its outstanding common stock in the open market at a price per share that meets certain thresholds below its net asset value per share, in accordance with the guidelines specified in Rule 10b-18 of the Exchange Act. The program does not require the Company to repurchase any specific number of shares and it cannot assure stockholders that any shares will be repurchased under the program. The program may be suspended, extended, modified or discontinued at any time.
As of December 31, 2017, the Company had repurchased a total of 0.5 shares of its common stock in the open market under the stock repurchase program since the program’s inception in September 2015, at an average price of $13.92 per share, including commissions paid, leaving approximately $293 available for additional repurchases under the program. During the year ended December 31, 2017, the Company did not repurchase any shares of the Company’s common stock under the stock repurchase program. During the year ended December 31, 2016, the Company repurchased a total of 0.4 shares of the Company’s common stock in the open market for $5 under the stock repurchase program. The shares were repurchased at an average price of $13.94 per share, including commissions paid.
10. EARNINGS PER SHARE
The following information sets forth the computations of basic and diluted net increase in stockholders’ equity resulting from operations per share for the years ended December 31, 2017, 2016 and 2015:
For the Years Ended December 31, | |||||||||||
2017 | 2016 | 2015 | |||||||||
Net increase in stockholders’ equity resulting from operations available to common stockholders | $ | 667 | $ | 474 | $ | 379 | |||||
Weighted average shares of common stock outstanding—basic and diluted | 425 | 314 | 314 | ||||||||
Basic and diluted net increase in stockholders’ equity resulting from operations per share | $ | 1.57 | $ | 1.51 | $ | 1.20 | |||||
For the purpose of calculating diluted net increase in stockholders’ equity resulting from operations per share, the average closing price of the Company’s common stock for the year ended December 31, 2017 was less than the conversion price for each of the Convertible Unsecured Notes outstanding as of December 31, 2017, as well as any other convertible unsecured notes outstanding during the period. For the year ended December 31, 2016, the average closing price of the Company’s common stock was less than the conversion price for each of the Convertible Unsecured Notes outstanding as of December 31, 2016, as well as any other convertible unsecured notes outstanding during the period. Therefore, for all periods presented in the financial statements, the underlying shares for the intrinsic value of the embedded options in the Convertible Unsecured Notes and any other convertible unsecured notes outstanding during the periods presented had no impact on the computation of diluted net increase in stockholders’ equity resulting from operations per share.
11. INCOME AND EXCISE TAXES
For U.S. Federal income tax purposes, dividends paid and distributions made to the Company’s stockholders are reported by the Company to the stockholders as ordinary income, capital gains, or a combination thereof. Dividends paid per common share for the years ended December 31, 2017, 2016 and 2015 were taxable as follows (unaudited):
F-101
For the Years Ended December 31, | |||||||||||
2017 | 2016 | 2015 | |||||||||
Ordinary income(1) | $ | 1.45 | $ | 1.26 | $ | 1.56 | |||||
Capital gains | 0.07 | 0.26 | 0.01 | ||||||||
Total(2) | $ | 1.52 | $ | 1.52 | $ | 1.57 | |||||
_______________________________________________________________________________
(1) | For the years ended December 31, 2017, 2016 and 2015, ordinary income included dividend income of approximately $0.0296, $0.0892 and $0.0730, per share, respectively, that qualified to be taxed at the maximum capital gains rate. For certain eligible corporate shareholders, these dividends were eligible for the dividends received deduction. |
(2) | For the years ended December 31, 2017, 2016 and 2015, dividends paid were comprised of interest-sourced dividends in amounts equal to 86.8%, 81.4% and 91.1% of total dividends paid, respectively. |
The following reconciles net increase in stockholders’ equity resulting from operations to taxable income for the years ended December 31, 2017, 2016 and 2015:
For the Years Ended December 31, | |||||||||||
2017 | 2016 | 2015 | |||||||||
(Estimated)(1) | |||||||||||
Net increase in stockholders’ equity resulting from operations | $ | 667 | $ | 474 | $ | 379 | |||||
Adjustments: | |||||||||||
Net unrealized losses (gains) on investments, foreign currency and other transactions | (136 | ) | 130 | 246 | |||||||
Income not currently taxable | (66 | ) | (59 | ) | (56 | ) | |||||
Income for tax but not book | 142 | 57 | 49 | ||||||||
Expenses not currently deductible | 90 | 37 | 14 | ||||||||
Expenses for tax but not book | (5 | ) | (6 | ) | (3 | ) | |||||
Realized gain/loss differences | (38 | ) | (78 | ) | (44 | ) | |||||
Taxable income | $ | 654 | $ | 555 | $ | 585 | |||||
_______________________________________________________________________________
(1) | The calculation of estimated 2017 U.S. Federal taxable income includes a number of estimated inputs, including information received from third parties and, as a result, actual 2017 U.S. Federal taxable income will not be finally determined until the Company’s 2017 U.S. Federal tax return is filed in 2018 (and, therefore, such estimate is subject to change). |
Taxable income generally differs from net increase in stockholders’ equity resulting from operations for financial reporting purposes due to temporary and permanent differences in the recognition of income and expenses, and generally excludes net unrealized gains or losses, as unrealized gains or losses are generally not included in taxable income until they are realized. In addition, on April 1, 2010, the Company acquired Allied Capital in a “tax-free” merger under the Code, which has caused certain merger-related items to vary in their deductibility for GAAP and tax purposes.
Capital losses in excess of capital gains earned in a tax year may generally be carried forward and used to offset capital gains, subject to certain limitations. As of December 31, 2017, the Company estimates that it will have a capital loss carryforward of approximately $43 available for use in later tax years. Because of the loss limitation rules of the Code, some of the tax basis capital losses may be limited in their use. The unused balance will be carried forward and utilized as gains are realized, subject to such limitations. In addition to the capital loss carryforwards, the Company realized tax basis net losses totaling approximately $0.3 billion from the Allied Capital portfolio since the Allied Acquisition through December 31, 2017, that have not yet been deducted for tax purposes as their deductibility in years since the Allied Acquisition was limited by the Code. While the Company’s ability to utilize losses in the future depends upon a variety of factors that cannot be known in advance, substantially all of the Company’s capital loss carryforwards and the net realized losses from the Allied Capital portfolio may become permanently unavailable due to limitations by the Code. Unlike the Allied Acquisition, the American Capital Acquisition was treated as a taxable purchase of the American Capital assets for purposes of the Company’s taxable
F-102
income calculations, therefore, there is not expected to be significant unrecognizable losses from the legacy American Capital portfolio.
For the year ended December 31, 2017, the Company had estimated U.S. Federal taxable income in excess of the distributions made from such taxable income during the year, and therefore, the Company has elected to carry forward the excess for distribution to shareholders in 2018. The amount carried forward to 2018 is estimated to be approximately $346, all of which is expected to be ordinary income, although these amounts will not be finalized until the 2017 tax returns are filed in 2018. For the years ended December 31, 2016 and 2015, the Company had taxable income in excess of the distributions made from such taxable income during the year, and therefore, the Company elected to carry forward the excess for distribution to shareholders in 2017 and 2016, respectively. The amounts carried forward to 2017 and 2016 were approximately $339 and $262, respectively. To the extent that the Company determines that its estimated current year annual taxable income will be in excess of estimated current year dividend distributions from such income, the Company accrues excise tax on estimated excess taxable income. For the years ended December 31, 2017, 2016 and 2015, a net expense of $12, $12 and $9, respectively, was recorded for U.S. federal excise tax. The net expense for the years ended December 31, 2017, 2016 and 2015 each included a reduction in expense related to the recording of a requested refund resulting from the overpayment of the prior year’s excise tax of $1, $1 and $1, respectively.
As of December 31, 2017, the estimated cost basis of investments for U.S. Federal tax purposes was $12.7 billion resulting in estimated gross unrealized gains and losses of $0.5 billion and $1.3 billion, respectively. As of December 31, 2016, the estimated cost basis of investments for U.S. Federal tax purposes was $9.7 billion resulting in estimated gross unrealized gains and losses of $0.1 billion and $0.8 billion, respectively. As of December 31, 2017 and 2016, the cost of investments for U.S. Federal tax purposes was greater than the amortized cost of investments for book purposes of $11.9 billion and $9.0 billion, respectively, primarily as a result of the Allied Acquisition. The Allied Acquisition qualified as a “tax-free” merger under the Code, which resulted in the acquired assets retaining Allied Capital’s cost basis at the merger date.
In general, the Company may make certain adjustments to the classification of stockholders’ equity as a result of permanent book-to-tax differences, which may include merger-related items, differences in the book and tax basis of certain assets and liabilities, and nondeductible federal taxes, among other items. During the year ended December 31, 2017, the Company decreased accumulated overdistributed net investment income by $19, decreased capital in excess of par value by $14 and decreased accumulated undistributed net realized gains on investments, foreign currency translations, extinguishment of debt and other assets by $5. During the year ended December 31, 2016, the Company increased accumulated undistributed net investment income by $21 and decreased capital in excess of par value by $21. During the year ended December 31, 2015, the Company decreased accumulated overdistributed net investment income by $17, increased accumulated net realized loss on investments, foreign currency transactions, extinguishment of debt and other assets by $3 and decreased capital in excess of par value by $14.
Certain of the Company’s consolidated subsidiaries are subject to U.S. federal and state income taxes. For the years ended December 31, 2017, 2016 and 2015, the Company recorded a tax expense of approximately $7, $9 and $9, respectively, for these subsidiaries.
12. DIVIDENDS AND DISTRIBUTIONS
The following table summarizes the Company’s dividends or distributions declared during the years ended December 31, 2017, 2016 and 2015:
Date declared | Record date | Payment date | Per share amount | Total amount | ||||||||
November 2, 2017 | December 15, 2017 | December 29, 2017 | $ | 0.38 | $ | 162 | ||||||
August 2, 2017 | September 15, 2017 | September 29, 2017 | 0.38 | 162 | ||||||||
May 3, 2017 | June 15, 2017 | June 30, 2017 | 0.38 | 162 | ||||||||
February 22, 2017 | March 15, 2017 | March 31, 2017 | 0.38 | 162 | ||||||||
Total declared for 2017 | $ | 1.52 | $ | 648 | ||||||||
November 2, 2016 | December 15, 2016 | December 30, 2016 | $ | 0.38 | $ | 119 | ||||||
August 3, 2016 | September 15, 2016 | September 30, 2016 | 0.38 | 119 | ||||||||
May 4, 2016 | June 15, 2016 | June 30, 2016 | 0.38 | 119 | ||||||||
February 26, 2016 | March 15, 2016 | March 31, 2016 | 0.38 | 120 | ||||||||
F-103
Total declared for 2016 | $ | 1.52 | $ | 477 | ||||||||
November 4, 2015 | December 15, 2015 | December 31, 2015 | $ | 0.38 | $ | 120 | ||||||
August 4, 2015 | September 15, 2015 | September 30, 2015 | 0.38 | 119 | ||||||||
May 4, 2015 | June 15, 2015 | June 30, 2015 | 0.38 | 119 | ||||||||
February 26, 2015 | March 13, 2015 | March 31, 2015 | 0.38 | 119 | ||||||||
February 26, 2015 | March 13, 2015 | March 31, 2015 | 0.05 | (1) | 16 | |||||||
Total declared for 2015 | $ | 1.57 | $ | 493 | ||||||||
_______________________________________________________________________________
(1) | Represents an additional dividend. |
The Company has a dividend reinvestment plan, whereby the Company may buy shares of its common stock in the open market or issue new shares in order to satisfy dividend reinvestment requests. When the Company issues new shares in connection with the dividend reinvestment plan, the issue price is equal to the closing price of its common stock on the dividend payment date. Dividend reinvestment plan activity for the years ended December 31, 2017, 2016 and 2015, was as follows:
For the Years Ended December 31, | |||||||||||
2017 | 2016 | 2015 | |||||||||
Shares issued | 0.4 | — | 0.4 | ||||||||
Average issue price per share | $ | 17.38 | $ | — | $ | 17.17 | |||||
Shares purchased by plan agent to satisfy dividends declared and payable during the period for stockholders | 1.5 | 1.3 | 0.7 | ||||||||
Average purchase price per share | $ | 16.28 | $ | 15.14 | $ | 15.70 | |||||
13. RELATED PARTY TRANSACTIONS
In accordance with the investment advisory and management agreement, the Company bears all costs and expenses of the operation of the Company and reimburses its investment adviser or its affiliates for certain of such costs and expenses incurred in the operation of the Company. For the years ended December 31, 2017, 2016 and 2015, the Company’s investment adviser or its affiliates incurred such expenses totaling $5, $5 and $7, respectively.
The Company is party to office leases pursuant to which it is leasing office facilities from third parties. For certain of these office leases, the Company has also entered into separate subleases with Ares Management LLC, the sole member of Ares Capital Management, and IHAM, pursuant to which Ares Management LLC and IHAM sublease a portion of these leases. For the years ended December 31, 2017, 2016 and 2015, amounts payable to the Company under these subleases totaled $7, $6 and $5, respectively.
Ares Management LLC has also entered into separate subleases with the Company, pursuant to which the Company subleases certain office spaces from Ares Management LLC. For the years ended December 31, 2017, 2016 and 2015, amounts payable to Ares Management LLC under these subleases totaled $1, $1 and $1, respectively.
The Company has also entered into agreements with Ares Management LLC and IHAM, pursuant to which Ares Management LLC and IHAM are entitled to use the Company’s proprietary portfolio management software. For the years ended December 31, 2017, 2016 and 2015, amounts payable to the Company under these agreements totaled $0, $0 and $0, respectively.
As part of the American Capital Acquisition, the Company assumed a long term incentive plan liability related to certain employees of a subsidiary of ACAM, which is now a subsidiary of IHAM. The liability is determined based on the fair value of certain investments acquired in the American Capital Acquisition. As of December 31, 2017, the liability amount was estimated to be $29 and is included within accounts payable and other liabilities in the Company’s consolidated balance sheet. This liability will be paid on an annual basis based on exited investments in a given calendar year and the value received upon their exit.
See Notes 3, 4, 6 and 16 for descriptions of other related party transactions.
F-104
14. FINANCIAL HIGHLIGHTS
The following is a schedule of financial highlights as of and for the years ended December 31, 2017, 2016 and 2015:
As of and For the Years Ended December 31, | ||||||||||||
Per Share Data: | 2017 | 2016 | 2015 | |||||||||
Net asset value, beginning of period(1) | $ | 16.45 | $ | 16.46 | $ | 16.82 | ||||||
Issuances of common stock | (0.01 | ) | — | 0.01 | ||||||||
Repurchases of common stock | — | — | (0.01 | ) | ||||||||
Deemed contribution from Ares Capital Management (See Note 16) | 0.13 | — | — | |||||||||
Issuances of convertible notes | 0.04 | — | — | |||||||||
Net investment income for period(2) | 1.20 | 1.57 | 1.62 | |||||||||
Net realized and unrealized gains(losses) for period(2) | 0.36 | (0.06 | ) | (0.41 | ) | |||||||
Net increase in stockholders’ equity | 1.72 | 1.51 | 1.21 | |||||||||
Total distributions to stockholders(3) | (1.52 | ) | (1.52 | ) | (1.57 | ) | ||||||
Net asset value at end of period(1) | $ | 16.65 | $ | 16.45 | $ | 16.46 | ||||||
Per share market value at end of period | $ | 15.72 | $ | 16.49 | $ | 14.25 | ||||||
Total return based on market value(4) | 4.55 | % | 26.39 | % | 1.35 | % | ||||||
Total return based on net asset value(5) | 10.53 | % | 9.15 | % | 7.16 | % | ||||||
Shares outstanding at end of period | 426 | 314 | 314 | |||||||||
Ratio/Supplemental Data: | ||||||||||||
Net assets at end of period | $ | 7,098 | $ | 5,165 | $ | 5,173 | ||||||
Ratio of operating expenses to average net assets(6)(7) | 9.45 | % | 9.59 | % | 9.51 | % | ||||||
Ratio of net investment income to average net assets(6)(8) | 7.65 | % | 9.58 | % | 9.75 | % | ||||||
Portfolio turnover rate(6) | 51 | % | 39 | % | 42 | % | ||||||
_______________________________________________________________________________
(1) | The net assets used equals the total stockholders’ equity on the consolidated balance sheet. |
(2) | Weighted average basic per share data. |
(3) | Includes an additional dividend of $0.05 per share for the three months ended March 31, 2015. |
(4) | For the year ended December 31, 2017, the total return based on market value equaled the decrease of the ending market value at December 31, 2017 of $15.72 per share from the ending market value at December 31, 2016 of $16.49 per share plus the declared and payable dividends of $1.52 per share for the year ended December 31, 2017, divided by the market value at December 31, 2016. For the year ended December 31, 2016, the total return based on market value equaled the increase of the ending market value at December 31, 2016 of $16.49 per share from the ending market value at December 31, 2015 of $14.25 per share plus the declared and payable dividends of $1.52 per share for the year ended December 31, 2016, divided by the market value at December 31, 2015. For the year ended December 31, 2015, the total return based on market value equaled the decrease of the ending market value at December 31, 2015 of $14.25 per share from the ending market value at December 31, 2014 of $15.61 per share plus the declared and payable dividends of $1.57 per share for the year ended December 31, 2015, divided by the market value at December 31, 2014. The Company’s shares fluctuate in value. The Company’s performance changes over time and currently may be different than that shown. Past performance is no guarantee of future results. |
(5) | For the year ended December 31, 2017, the total return based on net asset value equaled the change in net asset value during the period plus the declared and payable dividends of $1.52 per share for the year ended December 31, 2017, divided by the beginning net asset value for the period. For the year ended December 31, 2016, the total return based on net asset value equaled the change in net asset value during the period plus the declared and payable dividends of $1.52 per share for the year ended December 31, 2016, divided by the beginning net asset value for the period. For the year ended December 31, 2015, the total return based on net asset value equaled the change in net asset value during |
F-105
the period plus the declared and payable dividends of $1.57 per share for the year ended December 31, 2015, divided by the beginning net asset value for the period. These calculations are adjusted for shares issued in connection with the dividend reinvestment plan, the issuance of common stock in connection with any equity offerings and the equity components of any convertible notes issued during the period. The Company’s performance changes over time and currently may be different than that shown. Past performance is no guarantee of future results.
(6) | The ratios reflect an annualized amount. |
(7) | For the year ended December 31, 2017, the ratio of operating expenses to average net assets consisted of 2.57% of base management fees, 2.18% of income based fees and capital gains incentive fees, net of the Fee Waiver (2.32% of income based fees and capital gains incentive fees excluding the Fee Waiver), 3.37% of the cost of borrowing and 1.33% of other operating expenses. For the year ended December 31, 2016, the ratio of operating expenses to average net assets consisted of 2.64% of base management fees, 2.29% of income based fees and capital gains incentive fees, 3.58% of the cost of borrowing and 1.08% of other operating expenses. For the year ended December 31, 2015, the ratio of operating expenses to average net assets consisted of 2.55% of base management fees, 2.31% of income based fees and capital gains incentive fees, 4.32% of the cost of borrowing and 0.33% of other operating expenses. |
(8) | The ratio of net investment income to average net assets excludes income taxes related to realized gains and losses. |
15. SELECTED QUARTERLY DATA (Unaudited)
2017 | |||||||||||||||
Q4 | Q3 | Q2 | Q1 | ||||||||||||
Total investment income | $ | 307 | $ | 294 | $ | 284 | $ | 275 | |||||||
Net investment income before net realized and unrealized gains (losses) and income based fees and capital gains incentive fees, net of waiver of income based fees (See Note 3) | $ | 185 | $ | 175 | $ | 154 | $ | 142 | |||||||
Income based fees and capital gains incentive fees, net of waiver of income based fees (See Note 3) | $ | 45 | $ | 22 | $ | 30 | $ | 48 | |||||||
Net investment income before net realized and unrealized gains (losses) | $ | 140 | $ | 153 | $ | 124 | $ | 94 | |||||||
Net realized and unrealized gains (losses) | $ | 92 | $ | (14 | ) | 54 | $ | 24 | |||||||
Net increase in stockholders’ equity resulting from operations | $ | 232 | $ | 139 | $ | 178 | $ | 118 | |||||||
Basic and diluted earnings per common share | $ | 0.54 | $ | 0.33 | $ | 0.42 | $ | 0.28 | |||||||
Net asset value per share as of the end of the quarter | $ | 16.65 | $ | 16.49 | $ | 16.54 | $ | 16.50 | |||||||
2016 | |||||||||||||||
Q4 | Q3 | Q2 | Q1 | ||||||||||||
Total investment income | $ | 261 | $ | 258 | $ | 245 | $ | 248 | |||||||
Net investment income before net realized and unrealized gains (losses) and income based fees and capital gains incentive fees | $ | 157 | $ | 164 | $ | 144 | $ | 147 | |||||||
Income based fees and capital gains incentive fees | $ | 19 | $ | 27 | $ | 39 | $ | 33 | |||||||
Net investment income before net realized and unrealized gains (losses) | $ | 138 | $ | 137 | $ | 105 | $ | 114 | |||||||
Net realized and unrealized gains (losses) | $ | (63 | ) | $ | (28 | ) | $ | 53 | $ | 18 | |||||
Net increase in stockholders’ equity resulting from operations | $ | 75 | $ | 109 | $ | 158 | $ | 132 | |||||||
Basic and diluted earnings per common share | $ | 0.24 | $ | 0.35 | $ | 0.50 | $ | 0.42 | |||||||
Net asset value per share as of the end of the quarter | $ | 16.45 | $ | 16.59 | $ | 16.62 | $ | 16.50 | |||||||
F-106
2015 | |||||||||||||||
Q4 | Q3 | Q2 | Q1 | ||||||||||||
Total investment income | $ | 262 | $ | 261 | $ | 249 | $ | 253 | |||||||
Net investment income before net realized and unrealized gains and income based fees and capital gains incentive fees | $ | 151 | $ | 160 | $ | 145 | $ | 147 | |||||||
Income based fees and capital gains incentive fees | $ | 4 | $ | 29 | $ | 36 | $ | 25 | |||||||
Net investment income before net realized and unrealized gains | $ | 147 | $ | 131 | $ | 108 | $ | 122 | |||||||
Net realized and unrealized gains | $ | (132 | ) | $ | (14 | ) | $ | 38 | $ | (21 | ) | ||||
Net increase in stockholders’ equity resulting from operations | $ | 15 | $ | 117 | $ | 146 | $ | 101 | |||||||
Basic and diluted earnings per common share | $ | 0.05 | $ | 0.37 | $ | 0.47 | $ | 0.32 | |||||||
Net asset value per share as of the end of the quarter | $ | 16.46 | $ | 16.79 | $ | 16.80 | $ | 16.71 | |||||||
16. AMERICAN CAPITAL ACQUISITION
On May 23, 2016, the Company entered into a definitive agreement (the “Merger Agreement”) to acquire American Capital. On the Acquisition Date, the Company completed the American Capital Acquisition pursuant to the terms and conditions of the Merger Agreement. Pursuant to the Merger Agreement, American Capital shareholders received total consideration of approximately $18.06 per share comprised of: (i) $14.41 per share from the Company consisting of approximately $6.48 per share of cash (including a make-up dividend in the amount of $0.07 per share) and 0.483 shares of the Company’s common stock for each American Capital share at a value of $7.93 per American Capital share (based on the closing price per share of the Company’s common stock on the Acquisition Date), (ii) $2.45 per share of cash from American Capital’s sale of American Capital Mortgage Management, LLC, and (iii) approximately $1.20 per share of cash as transaction support provided by Ares Capital Management acting solely on its own behalf. As of the Acquisition Date, the transaction was valued at approximately $4.2 billion. The total cash and stock consideration paid by the Company was $3.3 billion. In connection with the stock consideration, the Company issued approximately 112 shares of its common stock to American Capital’s then-existing stockholders (including holders of outstanding in-the-money American Capital stock options), thereby resulting in the Company’s then-existing stockholders owning approximately 73.7% of the combined company and then-existing American Capital stockholders owning approximately 26.3% of the combined company. In addition, in connection with the American Capital Acquisition, Ares Capital Management agreed to waive certain income based fees as described in Note 3.
The American Capital Acquisition was accounted for in accordance with the asset acquisition method of accounting as detailed in ASC 805-50, Business Combinations-Related Issues. The fair value of the merger consideration paid by the Company was allocated to the assets acquired and liabilities assumed based on their relative fair values as of the date of acquisition and did not give rise to goodwill. Since the fair value of the net assets acquired exceeded the fair value of the merger consideration paid by the Company, the Company recognized a deemed contribution from Ares Capital Management.
The following table summarizes the allocation of the purchase price to the assets acquired and liabilities assumed as a result of the American Capital Acquisition:
Common stock issued by the Company | $ | 1,839 | |
Cash consideration paid by the Company | 1,502 | ||
Deemed contribution from Ares Capital Management | 54 | ||
Total purchase price | $ | 3,395 | |
Assets acquired: | |||
Investments(1) | $ | 2,543 | |
Cash and cash equivalents | 961 | ||
Other assets(2) | 117 | ||
Total assets acquired | $ | 3,621 | |
Liabilities assumed(3) | (226 | ) | |
Net assets acquired | $ | 3,395 | |
F-107
_______________________________________________________________________________
(1) Investments acquired were recorded at fair value, which is also the Company’s initial cost basis.
(2) Other assets acquired in the American Capital Acquisition consisted of the following:
Receivable for open trades | $ | 45 | |
Escrows receivable | 41 | ||
Interest receivable | 9 | ||
Other assets | 22 | ||
Total | $ | 117 | |
(3) Liabilities assumed in the American Capital Acquisition consisted of the following:
Severance and other payroll related | $ | 95 | |
Lease abandonments | 55 | ||
Long term incentive plan (see Note 13) | 31 | ||
Escrows payable | 25 | ||
Other liabilities | 20 | ||
Total | $ | 226 | |
During the year ended December 31, 2017, the Company incurred $45 in professional fees and other costs related to the American Capital Acquisition. For the year ended December 31, 2017, these costs included $4 of expenses related to a long term incentive plan liability assumed in the American Capital Acquisition (see Note 13). For the year ended December 31, 2017, these costs also included $18 in one-time investment banking fees incurred in January 2017 upon the closing of the American Capital Acquisition.
F-108
17. LITIGATION
The Company is party to certain lawsuits in the normal course of business. In addition, American Capital and Allied Capital were involved in various legal proceedings that the Company assumed in connection with the American Capital Acquisition and the Allied Acquisition, respectively. Furthermore, third parties may try to seek to impose liability on the Company in connection with the Company’s activities or the activities of its portfolio companies. While the outcome of any such legal proceedings cannot at this time be predicted with certainty, the Company does not expect that these legal proceedings will materially affect its business, financial condition or results of operations.
On May 20, 2013, the Company was named as one of several defendants in an action filed in the United States District Court for the Eastern District of Pennsylvania by the bankruptcy trustee of DSI Renal Holdings LLC (“DSI Renal”) and two affiliate companies. On March 17, 2014, the motion by the Company and the other defendants to transfer the case to the United States District Court for the District of Delaware (the “Delaware Court”) was granted. On May 6, 2014, the Delaware Court referred the matter to the United States Bankruptcy Court for the District of Delaware (the “Bankruptcy Court”). The complaint alleges, among other things, that each of the named defendants participated in a purported fraudulent transfer involving the restructuring of a subsidiary of DSI Renal. Among other things, the complaint seeks, jointly and severally from all defendants, (1) damages of approximately $425 million, of which the complaint states the Company’s individual share is approximately $117 million, and (2) punitive damages. The defendants filed a motion to dismiss all claims on August 5, 2013. On July 20, 2017, the Bankruptcy Court issued an order granting the motion to dismiss certain claims and denying the motion to dismiss certain other claims, including the purported fraudulent transfer claims. The defendants answered the complaint on August 31, 2017. Under the operative scheduling order, discovery will continue until early 2019 with dispositive motions due on April 30, 2019. No trial date has been set. The Company is currently unable to assess with any certainty whether it may have any exposure in this matter. However, the Company believes the plaintiff’s claims are without merit and intends to vigorously defend itself in this matter.
On or about February 10, 2017, shareholders of American Capital filed a second consolidated amended putative shareholder class action complaint allegedly on behalf of holders of the common stock of American Capital against the former members of American Capital’s board of directors and certain former American Capital officers (collectively, the “American Capital defendants”), as well as Elliott Management Corporation, Elliott Associates, L.P., Elliott International, L.P. and Elliott International Capital Advisors Inc. (collectively “Elliott”) in the Circuit Court for Montgomery County, Maryland challenging the American Capital Acquisition. This action is a consolidation of putative shareholder complaints filed against the directors of American Capital on June 24, 2016, July 12, 2016, July 21, 2016 and July 27, 2016, which were consolidated and in which an amended consolidated putative shareholder class action complaint was filed on August 18, 2016. The action alleges that the directors, officers and Elliott failed to adequately discharge their fiduciary duties to the public shareholders of American Capital by hastily commencing a sales process due to the board’s manipulation by Elliott. In the alternative, the complaint alleges Elliott aided and abetted breaches of fiduciary duty by the American Capital directors and officers. The complaint also alleges that the directors and officers failed to obtain for the shareholders the highest value available in the marketplace for their shares in the American Capital Acquisition. The complaint further alleges that the merger was the product of a flawed process due to Elliott’s continued manipulation, the use of deal protection devices in the American Capital Acquisition that precluded other bidders from making a higher offer to American Capital and the directors’ conflicts of interest due to special benefits, including the full vesting of American Capital stock options and incentive awards or golden parachutes the directors received upon consummation of the proposed merger. Additionally, the complaint alleges that the registration statement, which was filed with the SEC on July 20, 2016 and included a joint proxy statement to American Capital’s shareholders, is materially false and misleading because it omits material information concerning the financial and procedural fairness of the American Capital Acquisition. The complaint seeks to recover compensatory damages for all losses resulting from the alleged breaches of fiduciary duty and waste. The American Capital defendants filed their motion to dismiss the second consolidated amended complaint on March 3, 2017. Elliott filed its motion to dismiss the second consolidated amended complaint on April 14, 2017. Briefing on defendants’ motions was completed on May 26, 2017. A hearing on the motions to dismiss was scheduled for June 9, 2017 before Judge Ronald Rubin of the Circuit Court for Montgomery County, Maryland (the “Court”); however, that hearing was stayed as to the American Capital defendants in light of the settlement described below.
On June 9, 2017, the American Capital defendants reached an agreement in principle with plaintiffs regarding the proposed settlement of claims asserted against them in this action, and the American Capital defendants and plaintiffs subsequently executed a settlement term sheet (the “Term Sheet”) on June 19, 2017. As set forth in the Term Sheet, the American Capital defendants have agreed to the proposed settlement solely to eliminate the burden, expense, distraction and uncertainties inherent in further litigation, and without admitting any liability or wrongdoing. The plaintiffs and American Capital defendants filed a stipulation of settlement and motion for preliminary approval of the settlement with the Court on August 3, 2017. On August 23, 2017, the Court entered an order preliminarily approving the settlement. On August 28, 2017, Elliott filed a cross claim against the American Capital defendants asserting claims for contribution, although the cross claim
F-109
would not have been expected to result in any additional monetary liability for the American Capital defendants or American Capital.
On October 11, 2017, the plaintiffs and Elliott advised the Court that they reached an agreement in principle to settle the remaining claims in the case, which would also resolve the cross claims against the American Capital defendants. Both the American Capital defendant settlement and Elliott settlement are subject to Court approval. The parties filed a joint stipulation on or about November 17, 2017, notice was sent to stockholders on December 18, 2017, and a final approval hearing to approve the settlements is scheduled for February 16, 2018. If both settlements are approved, then the case will be dismissed in its entirety.
There can be no assurance that the Court will approve the proposed settlements. The proposed settlement by the American Capital defendants is not, and should not be construed as, an admission of wrongdoing or liability by any American Capital defendant.
On August 3, 2017, American Capital and one of its former portfolio companies were awarded a judgment plus prejudgment interest by the United States District Court for the District of Maryland (the “District Court”) following a bench trial in a case first filed by one of American Capital’s insurance companies concerning coverage for bodily injury claims against American Capital and/or its former portfolio company. The District Court found that the carrier breached its duty to defend American Capital and its former portfolio company against more than 1,000 bodily injury claims and awarded damages plus prejudgment interest. American Capital’s carrier filed a notice of appeal to the United States Court of Appeals for the Fourth Circuit; thereafter, American Capital and its former portfolio company filed a notice of cross appeal. The parties are now in the process of filing their respective briefs in appeal, which will be fully briefed by late April 2018. It is currently expected the appeal will be adjudicated in late 2018 at the earliest. American Capital’s recovery will not be known until such time as the appeal is resolved.
18. SUBSEQUENT EVENTS
The Company's management has evaluated subsequent events through the date of issuance of the consolidated financial statements included herein. There have been no subsequent events that occurred during such period that would require disclosure in this Form 10-K or would be required to be recognized in the consolidated financial statements as of and for the year ended December 31, 2017, except as disclosed below.
In January 2018, the Company issued $600 aggregate principal amount of unsecured notes that mature on March 1, 2025 (the “2025 Notes”). The 2025 Notes bear interest at a rate of 4.25% per year, payable semi‑annually on March 1 and September 1 of each year, commencing on September 1, 2018. The 2025 Notes may be redeemed in whole or in part at the Company’s option at any time at the redemption prices as determined pursuant to the indenture governing the 2025 Notes.
In January 2018, the SDLP’s total available capital was increased from $2.9 billion to $6.4 billion. In connection with this expansion, Varagon and its clients agreed to make capital available to the SDLP of up to approximately $5.0 billion and the Company agreed to make capital available to the SDLP of up to approximately $1.4 billion. The Company will continue to provide capital to the SDLP in the form of SDLP Certificates, and Varagon and its clients will provide capital to the SDLP in the form of senior notes, intermediate funding notes and SDLP Certificates. Investment of any unfunded amount must be approved by the investment committee of the SDLP consisting of representatives of the Company and Varagon (with approval from a representative of each required).
In February 2018, the Company's board of directors authorized an amendment to its $300 stock repurchase program to extend the expiration date of the program from February 28, 2018 to February 28, 2019. Under the stock repurchase program, the Company may repurchase up to $300 in the aggregate of its outstanding common stock in the open market at a price per share that meets certain thresholds below its net asset value per share, in accordance with the guidelines specified in Rule 10b-18 of the Exchange Act. The timing, manner, price and amount of any share repurchases will be determined by the Company, in its discretion, based upon the evaluation of economic and market conditions, stock price, applicable legal and regulatory requirements and other factors.
F-110
SIGNATURES
Pursuant to the requirements of Section 13 or 15(d) of the Securities Exchange Act of 1934, the registrant has duly caused this report to be signed on its behalf by the undersigned, thereunto duly authorized.
ARES CAPITAL CORPORATION | ||
By: | /s/ R. KIPP DEVEER | |
R. Kipp deVeer Chief Executive Officer and Director | ||
Date: February 13, 2018 | ||
Pursuant to the requirements of the Securities Exchange Act of 1934, this report has been signed below by the following persons on behalf of the registrant and in the capacities and on the dates indicated.
By: | /s/ R. KIPP DEVEER | |
R. Kipp deVeer Chief Executive Officer (principal executive officer) and Director | ||
Date: February 13, 2018 | ||
By: | /s/ PENNI F. ROLL | |
Penni F. Roll Chief Financial Officer (principal financial officer) | ||
Date: February 13, 2018 | ||
By: | /s/ SCOTT C. LEM | |
Scott C. Lem Chief Accounting Officer (principal accounting officer) | ||
Date: February 13, 2018 | ||
By: | /s/ MICHAEL J AROUGHETI | |
Michael J Arougheti Director | ||
Date: February 13, 2018 | ||
By: | /s/ STEVE BARTLETT | |
Steve Bartlett Director | ||
Date: February 13, 2018 | ||
By: | /s/ ANN TORRE BATES | |
Ann Torre Bates Director | ||
Date: February 13, 2018 | ||
By: | /s/ STEVEN B. MCKEEVER | |
Steven B. McKeever Director | ||
Date: February 13, 2018 | ||
By: | /s/ DANIEL KELLY, JR. | |
Daniel Kelly, JR. Director | ||
Date: February 13, 2018 | ||
By: | /s/ ROBERT L. ROSEN | |
Robert L. Rosen Director | ||
Date: February 13, 2018 | ||
By: | /s/ BENNETT ROSENTHAL | |
Bennett Rosenthal Director | ||
Date: February 13, 2018 | ||
By: | /s/ ERIC B. SIEGEL | |
Eric B. Siegel Director | ||
Date: February 13, 2018 | ||