Attached files
| file | filename |
|---|---|
| 8-K - 8-K - SOUTH STATE Corp | ssb-20180206x8k.htm |
Exhibit 99.1
|
|
Investor Presentation KBW Winter Financial Services Symposium February 8, 2018 |
|
|
Forward Looking Statements Statements included in this communication, which are not historical in nature are intended to be, and are hereby identified as, forward looking statements for purposes of the safe harbor provided by Section 27A of the Securities Act of 1933 and Section 21E of the Securities Exchange Act of 1934. Forward looking statements generally include words such as “expects,” “projects,” “anticipates,” “believes,” “intends,” “estimates,” “strategy,” “plan,” “potential,” “possible” and other similar expressions. South State Corporation (“South State”) cautions readers that forward looking statements are subject to certain risks and uncertainties that could cause actual results to differ materially from anticipated results. Such risks and uncertainties, include, among others, the following possibilities: (1) the outcome of any legal proceedings instituted against South State or Park Sterling Corporation (“Park Sterling”); (2) the possibility that the anticipated benefits of the transaction are not realized when expected or at all, including as a result of the impact of, or problems arising from, the integration of the two companies or as a result of the strength of the economy and competitive factors in the areas where South State and Park Sterling do business; (3) the possibility that the transaction may be more expensive to complete than anticipated, including as a result of unexpected factors or events; (4) diversion of management’s attention from ongoing business operations and opportunities; (5) potential adverse reactions or changes to business or employee relationships, including those resulting from the announcement or completion of the transaction; (6) South State’s ability to complete the integration of Park Sterling successfully; (7) credit risks associated with an obligor’s failure to meet the terms of any contract with the bank or otherwise fail to perform as agreed under the terms of any loan-related document; (8) interest risk involving the effect of a change in interest rates on the bank’s earnings, the market value of the bank’s loan and securities portfolios, and the market value of South State’s equity; (9) liquidity risk affecting the bank’s ability to meet its obligations when they come due; (10) risks associated with an anticipated increase in South State’s investment securities portfolio, including risks associated with acquiring and holding investment securities or potentially determining that the amount of investment securities South State desires to acquire are not available on terms acceptable to South State; (11) price risk focusing on changes in market factors that may affect the value of traded instruments in “mark-to-market” portfolios; (12) transaction risk arising from problems with service or product delivery; (13) compliance risk involving risk to earnings or capital resulting from violations of or nonconformance with laws, rules, regulations, prescribed practices, or ethical standards; (14) regulatory change risk resulting from new laws, rules, regulations, accounting principles, proscribed practices or ethical standards, including, without limitation, increased capital requirements (including, without limitation, the impact of the capital rules adopted to implement Basel III), Consumer Financial Protection Bureau rules and regulations, and potential changes in accounting principles relating to loan loss recognition; (15) strategic risk resulting from adverse business decisions or improper implementation of business decisions; (16) reputation risk that adversely affects earnings or capital arising from negative public opinion; (17) terrorist activities risk that results in loss of consumer confidence and economic disruptions; (18) cybersecurity risk related to the dependence of South State and Park Sterling on internal computer systems and the technology of outside service providers, as well as the potential impacts of third party security breaches, subjects each company to potential business disruptions or financial losses resulting from deliberate attacks or unintentional events; (19) economic downturn risk potentially resulting in deterioration in the credit markets, greater than expected non-interest expenses, excessive loan losses and other negative consequences, with risks could be exacerbated by potential negative economic developments resulting from federal spending cuts and/or one or more federal budget-related impasses or actions; (20) greater than expected noninterest expenses; (21) excessive loan losses; (22) failure to realize synergies and other financial benefits from, and to limit liabilities associated with, mergers and acquisitions within the expected time frame; (23) potential deposit attrition, higher than expected costs, customer loss and business disruption associated with merger and acquisition integration, including, without limitation, potential difficulties in maintaining relationships with key personnel and other integration related-matters; (24) the risks of fluctuations in market prices for South State common stock that may or may not reflect economic condition or performance of South State; (25) the payment of dividends on South State common stock is subject to regulatory supervision as well as the discretion of the board of directors of South State, South State’s performance and other factors; and (26) other risks and uncertainties disclosed in South State’s or Park Sterling’s most recent Annual Report on Form 10-K filed with the U.S. Securities and Exchange Commission (“SEC) or disclosed in documents filed or furnished by South State or Park Sterling with or to the SEC after the filing of such Annual Reports on Form 10-K, and of which could cause actual results to differ materially from future results expressed, implied or otherwise anticipated by such forward-looking statements. All forward-looking statements speak only as of the date they are made and are based on information available at that time. South State does not undertake any obligation to update or otherwise revise any forward-looking statements, whether as a result of new information, future events, or otherwise, except as required by federal securities laws. As forward-looking statements involve significant risks and uncertainties, caution should be exercised against placing undue reliance on such statements. |
|
|
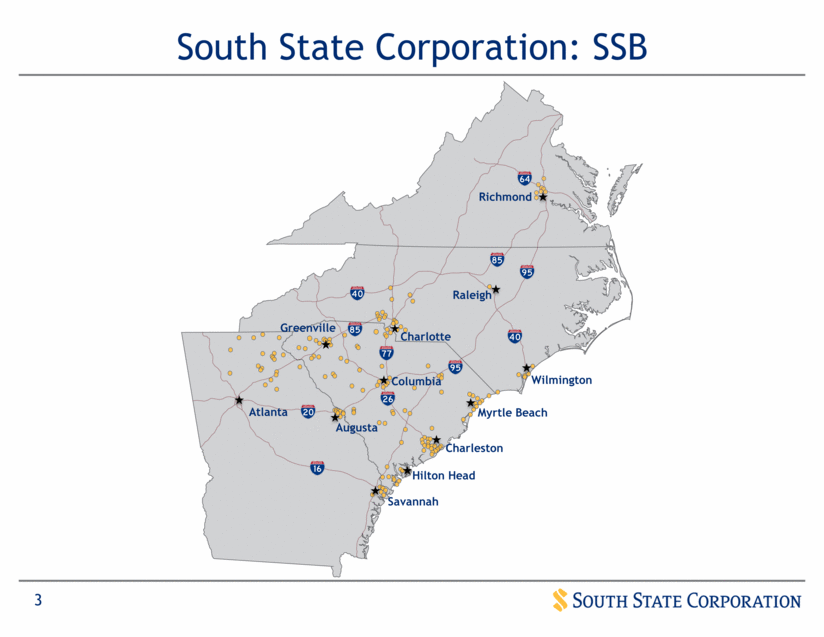
South State Corporation: SSB Columbia Greenville Charlotte Charleston Richmond Wilmington Savannah Myrtle Beach Hilton Head Raleigh Atlanta Augusta |
|
|
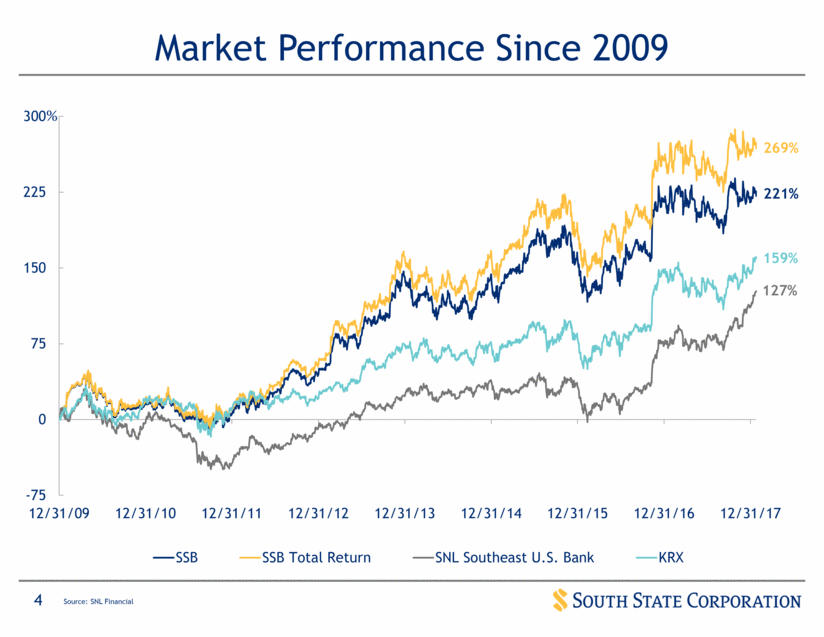
Market Performance Since 2009 Source: SNL Financial % -75 0 75 150 225 300 12/31/09 12/31/10 12/31/11 12/31/12 12/31/13 12/31/14 12/31/15 12/31/16 12/31/17 SSB SSB Total Return SNL Southeast U.S. Bank KRX 269% 221% 159% 127% |
|
|
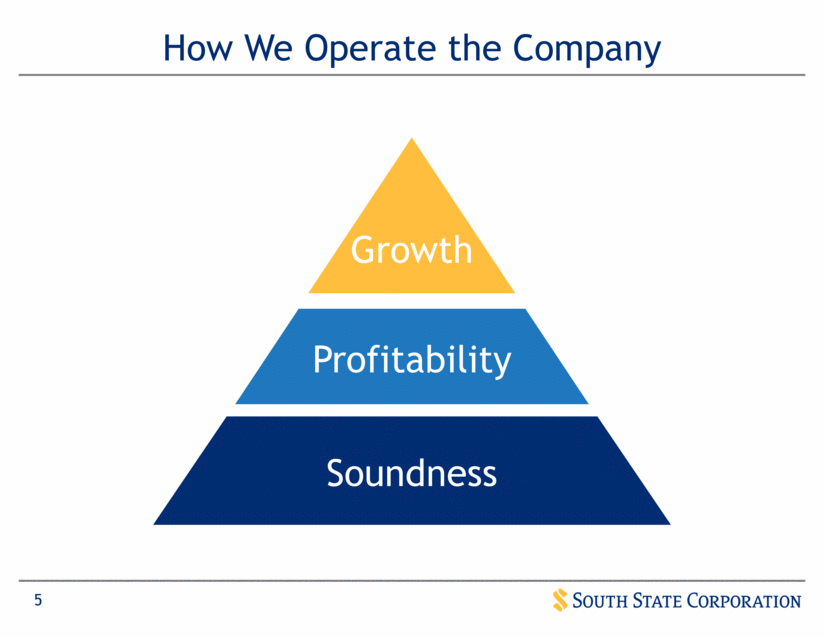
How We Operate the Company Soundness Profitability Growth |
|
|
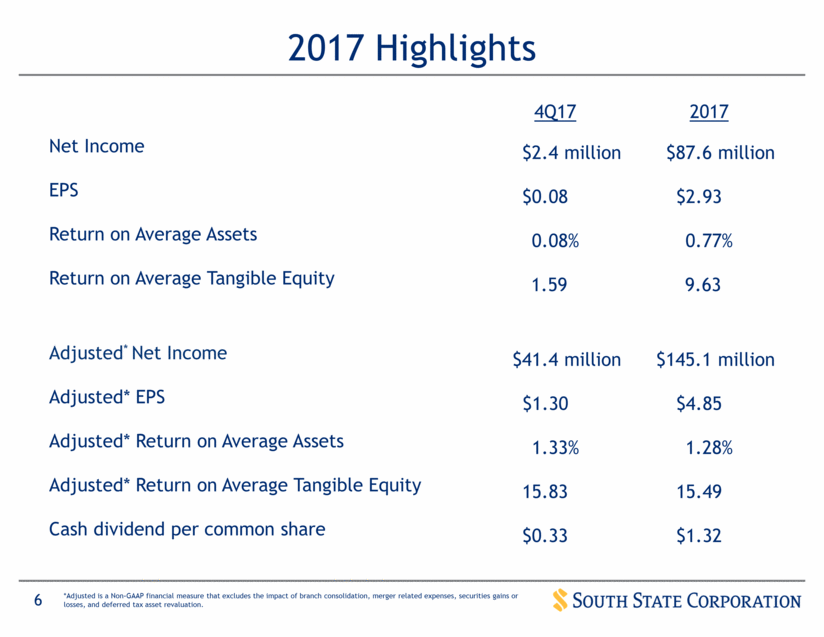
2017 Highlights *Adjusted is a Non-GAAP financial measure that excludes the impact of branch consolidation, merger related expenses, securities gains or losses, and deferred tax asset revaluation. 4Q17 2017 Net Income $2.4 million $87.6 million EPS $0.08 $2.93 Return on Average Assets 0.08% 0.77% Return on Average Tangible Equity 1.59 9.63 Adjusted* Net Income $41.4 million $145.1 million Adjusted* EPS $1.30 $4.85 Adjusted* Return on Average Assets 1.33% 1.28% Adjusted* Return on Average Tangible Equity 15.83 15.49 Cash dividend per common share $0.33 $1.32 |
|
|
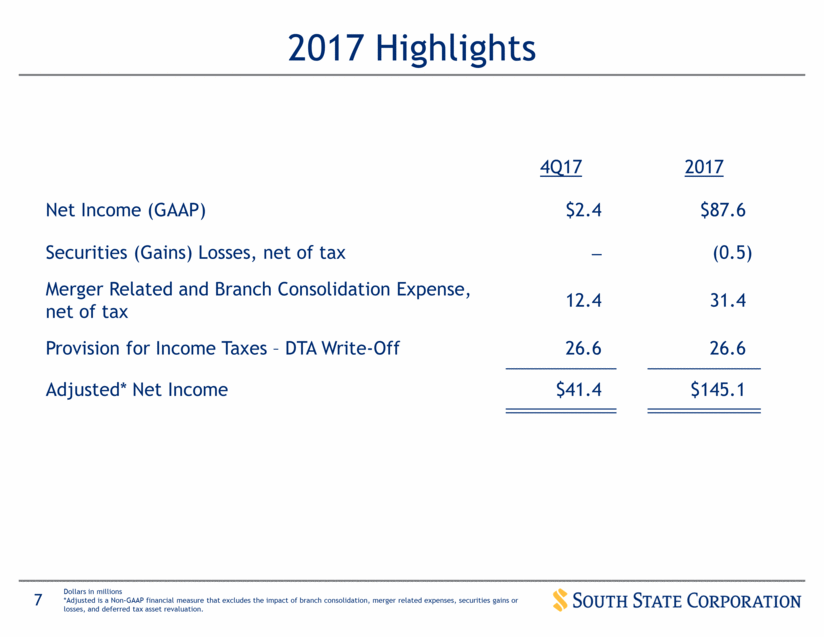
2017 Highlights Dollars in millions *Adjusted is a Non-GAAP financial measure that excludes the impact of branch consolidation, merger related expenses, securities gains or losses, and deferred tax asset revaluation. 4Q17 2017 Net Income (GAAP) $2.4 $87.6 Securities (Gains) Losses, net of tax _ (0.5) Merger Related and Branch Consolidation Expense, net of tax 12.4 31.4 Provision for Income Taxes – DTA Write-Off 26.6 26.6 Adjusted* Net Income $41.4 $145.1 |
|
|
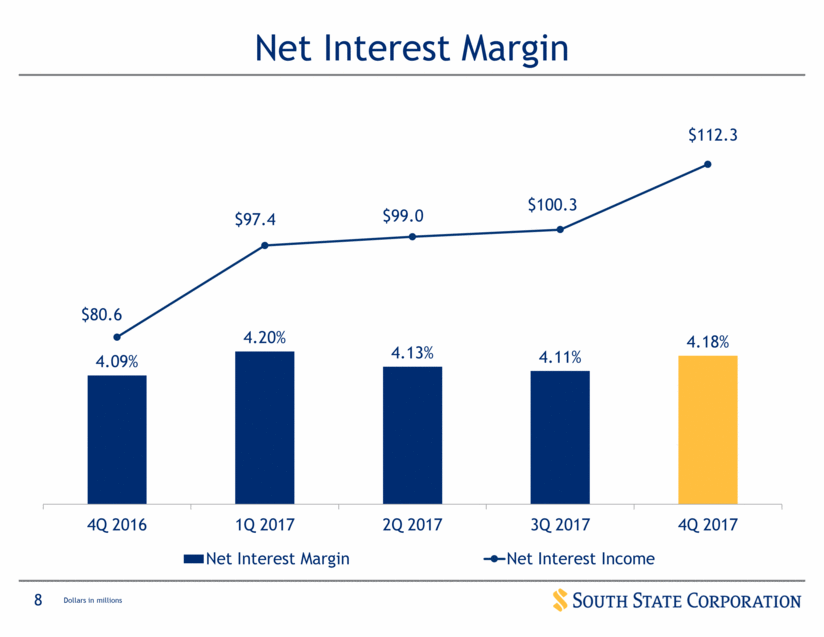
Net Interest Margin Dollars in millions |
|
|
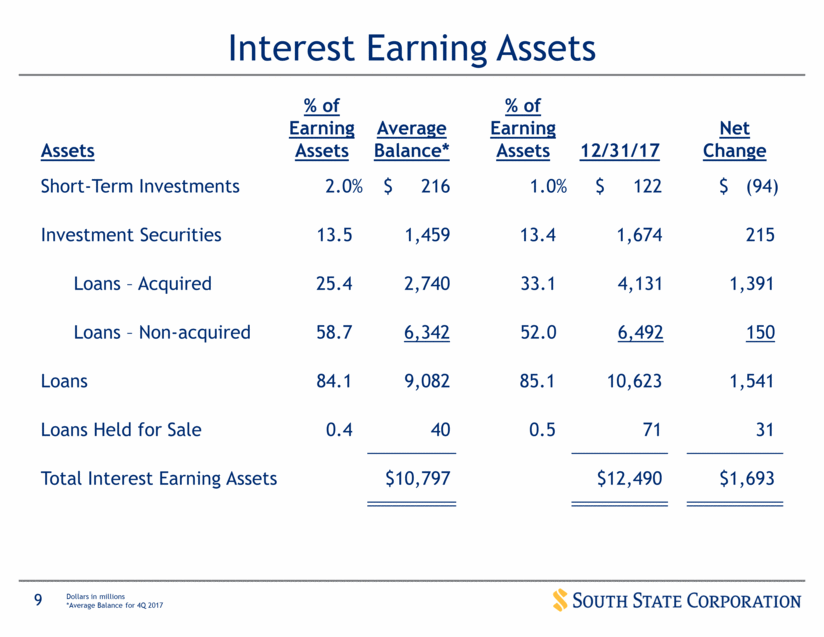
Interest Earning Assets Dollars in millions *Average Balance for 4Q 2017 Assets % of Earning Assets Average Balance* % of Earning Assets 12/31/17 Net Change Short-Term Investments 2.0% $ 216 1.0% $ 122 $ (94) Investment Securities 13.5 1,459 13.4 1,674 215 Loans – Acquired 25.4 2,740 33.1 4,131 1,391 Loans – Non-acquired 58.7 6,342 52.0 6,492 150 Loans 84.1 9,082 85.1 10,623 1,541 Loans Held for Sale 0.4 40 0.5 71 31 Total Interest Earning Assets $10,797 $12,490 $1,693 |
|
|
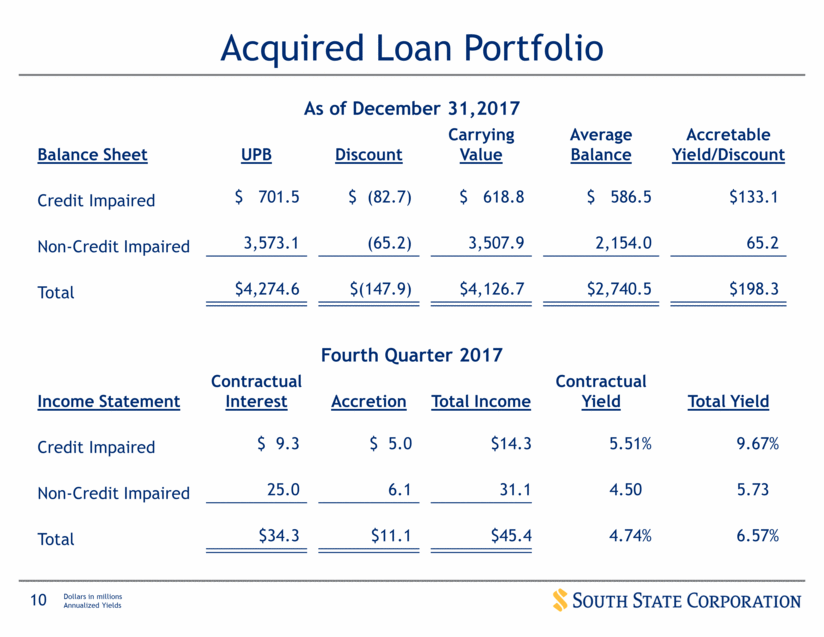
Acquired Loan Portfolio Dollars in millions Annualized Yields As of December 31,2017 Balance Sheet UPB Discount Carrying Value Average Balance Accretable Yield/Discount Credit Impaired $ 701.5 $ (82.7) $ 618.8 $ 586.5 $133.1 Non-Credit Impaired 3,573.1 (65.2) 3,507.9 2,154.0 65.2 Total $4,274.6 $(147.9) $4,126.7 $2,740.5 $198.3 Fourth Quarter 2017 Income Statement Contractual Interest Accretion Total Income Contractual Yield Total Yield Credit Impaired $ 9.3 $ 5.0 $14.3 5.51% 9.67% Non-Credit Impaired 25.0 6.1 31.1 4.50 5.73 Total $34.3 $11.1 $45.4 4.74% 6.57% |
|
|
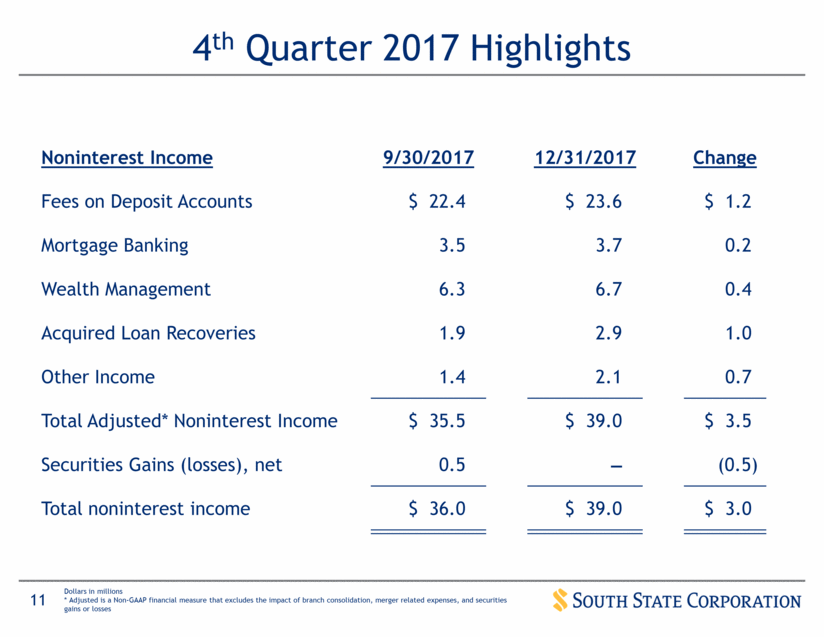
4th Quarter 2017 Highlights Dollars in millions * Adjusted is a Non-GAAP financial measure that excludes the impact of branch consolidation, merger related expenses, and securities gains or losses Noninterest Income 9/30/2017 12/31/2017 Change Fees on Deposit Accounts $ 22.4 $ 23.6 $ 1.2 Mortgage Banking 3.5 3.7 0.2 Wealth Management 6.3 6.7 0.4 Acquired Loan Recoveries 1.9 2.9 1.0 Other Income 1.4 2.1 0.7 Total Adjusted* Noninterest Income $ 35.5 $ 39.0 $ 3.5 Securities Gains (losses), net 0.5 _ (0.5) Total noninterest income $ 36.0 $ 39.0 $ 3.0 |
|
|
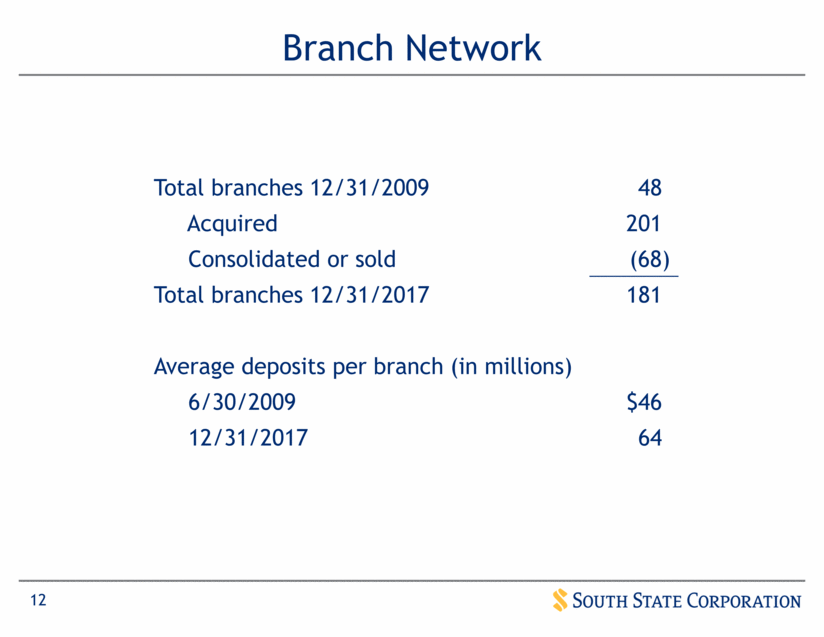
Branch Network Total branches 12/31/2009 48 Acquired 201 Consolidated or sold (68) Total branches 12/31/2017 181 Average deposits per branch (in millions) 6/30/2009 $46 12/31/2017 64 |
|
|
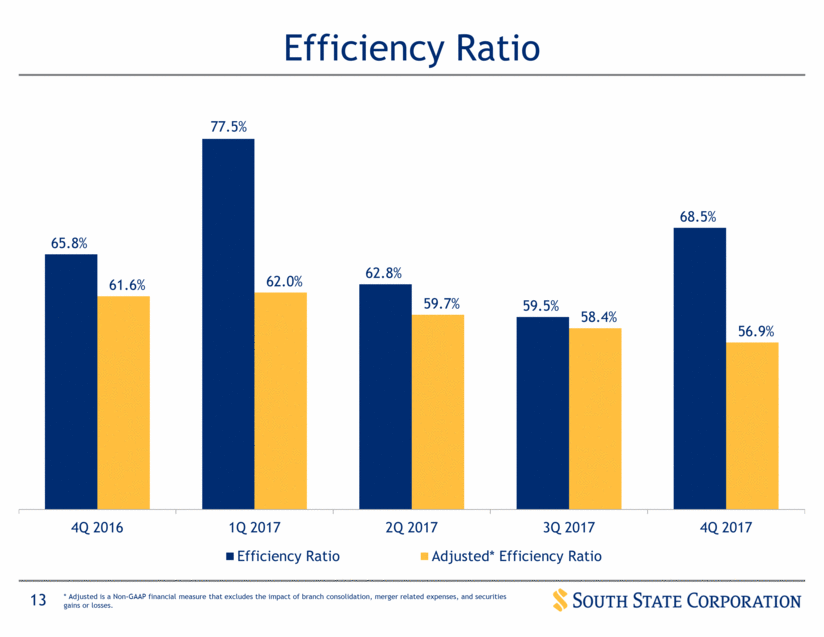
Efficiency Ratio * Adjusted is a Non-GAAP financial measure that excludes the impact of branch consolidation, merger related expenses, and securities gains or losses. |
|
|
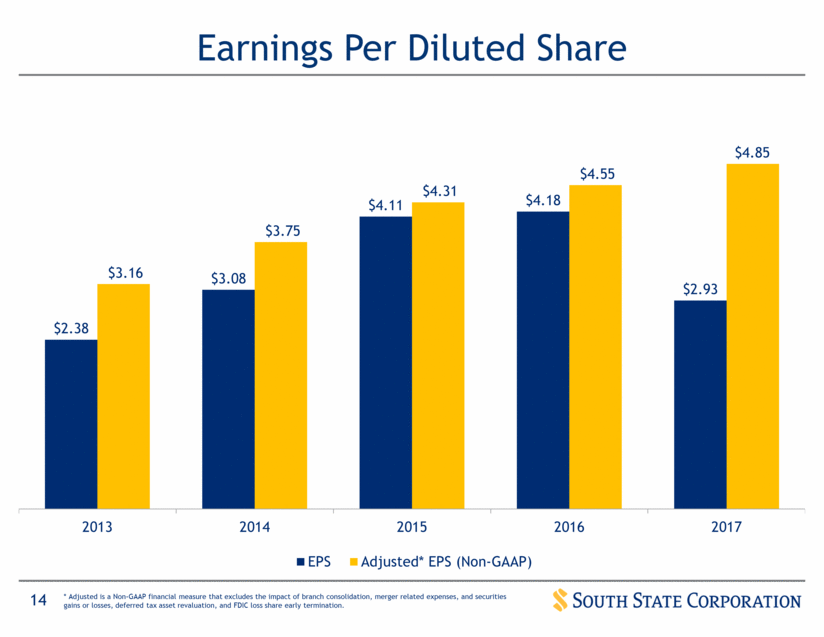
Earnings Per Diluted Share * Adjusted is a Non-GAAP financial measure that excludes the impact of branch consolidation, merger related expenses, and securities gains or losses, deferred tax asset revaluation, and FDIC loss share early termination. |
|
|
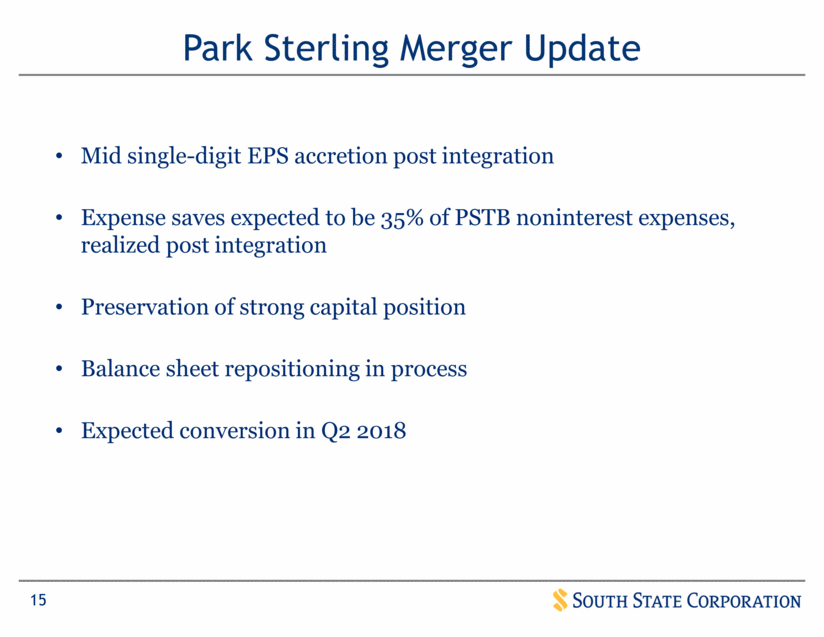
Park Sterling Merger Update * Adjusted is a Non-GAAP financial measure that excludes the impact of branch consolidation, merger related expenses, and securities gains or losses, and FDIC loss share early termination Mid single-digit EPS accretion post integration Expense saves expected to be 35% of PSTB noninterest expenses, realized post integration Preservation of strong capital position Balance sheet repositioning in process Expected conversion in Q2 2018 |
|
|
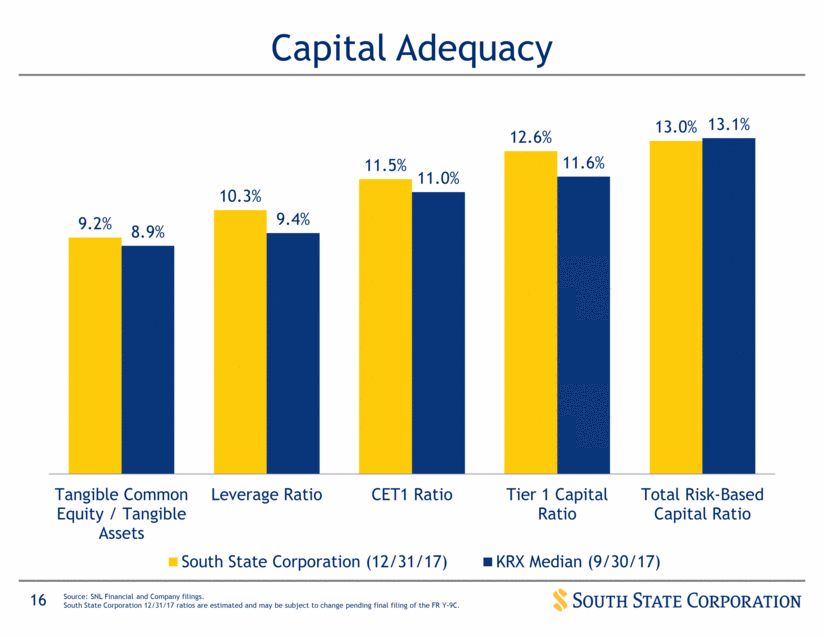
Capital Adequacy Source: SNL Financial and Company filings. South State Corporation 12/31/17 ratios are estimated and may be subject to change pending final filing of the FR Y-9C. 9.2% 10.3% 11.5% 12.6% 13.0% 8.9% 9.4% 11.0% 11.6% 13.1% Tangible Common Equity / Tangible Assets Leverage Ratio CET1 Ratio Tier 1 Capital Ratio Total Risk-Based Capital Ratio South State Corporation (12/31/17) KRX Median (9/30/17) |
|
|
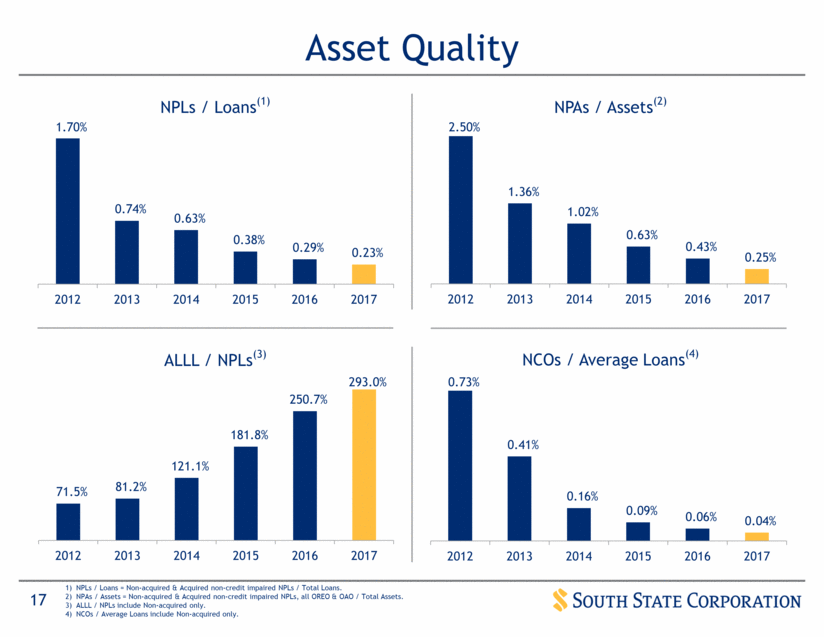
Asset Quality NPLs / Loans(1) NPAs / Assets(2) ALLL / NPLs(3) NCOs / Average Loans(4) NPLs / Loans = Non-acquired & Acquired non-credit impaired NPLs / Total Loans. NPAs / Assets = Non-acquired & Acquired non-credit impaired NPLs, all OREO & OAO / Total Assets. ALLL / NPLs include Non-acquired only. NCOs / Average Loans include Non-acquired only. 2.50% 1.36% 1.02% 0.63% 0.43% 0.25% 2012 2013 2014 2015 2016 2017 71.5% 81.2% 121.1% 181.8% 250.7% 293.0% 2012 2013 2014 2015 2016 2017 0.73% 0.41% 0.16% 0.09% 0.06% 0.04% 2012 2013 2014 2015 2016 2017 |
|
|
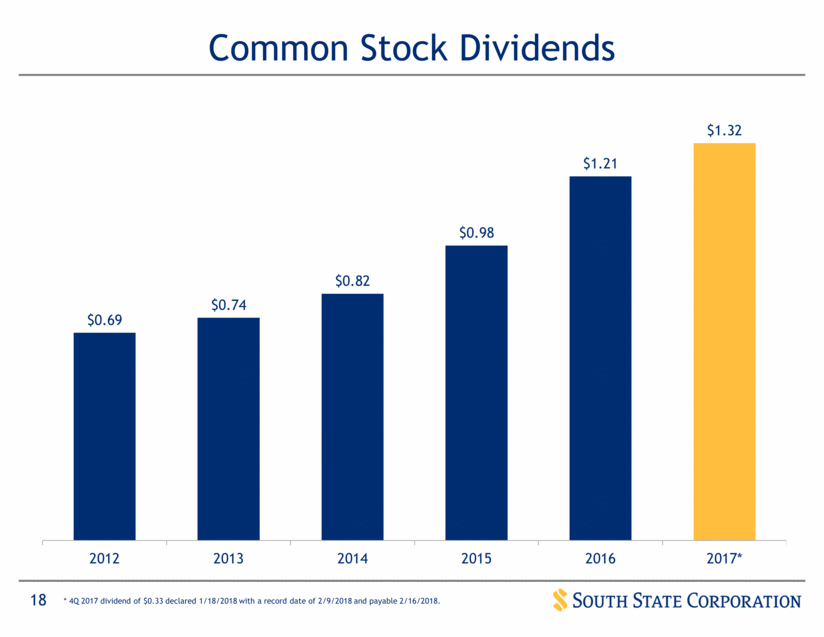
Common Stock Dividends * 4Q 2017 dividend of $0.33 declared 1/18/2018 with a record date of 2/9/2018 and payable 2/16/2018. |
|
|
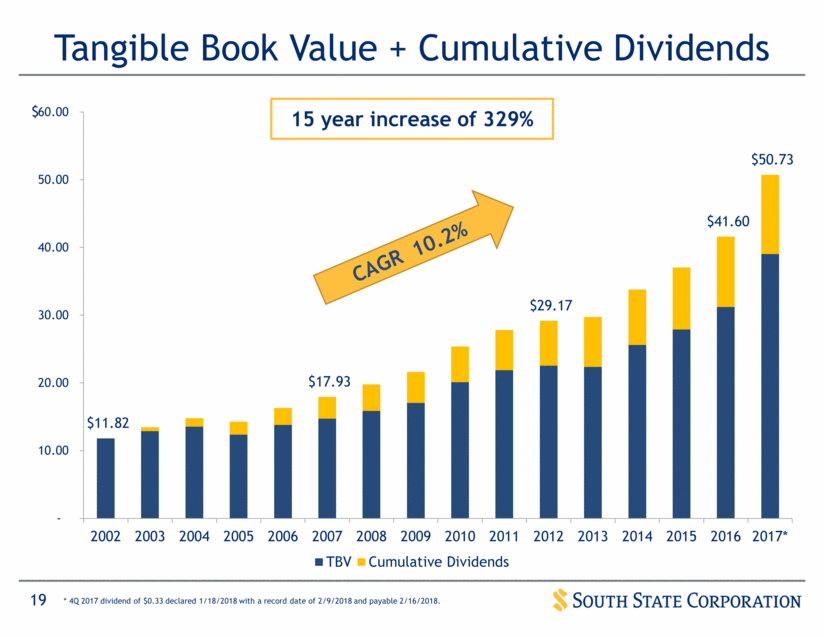
Tangible Book Value + Cumulative Dividends CAGR 10.2% 15 year increase of 329% $ * 4Q 2017 dividend of $0.33 declared 1/18/2018 with a record date of 2/9/2018 and payable 2/16/2018. $11.82 $17.93 $29.17 $41.60 $50.73 - 10.00 20.00 30.00 40.00 50.00 60.00 2002 2003 2004 2005 2006 2007 2008 2009 2010 2011 2012 2013 2014 2015 2016 2017* TBV Cumulative Dividends |
|
|
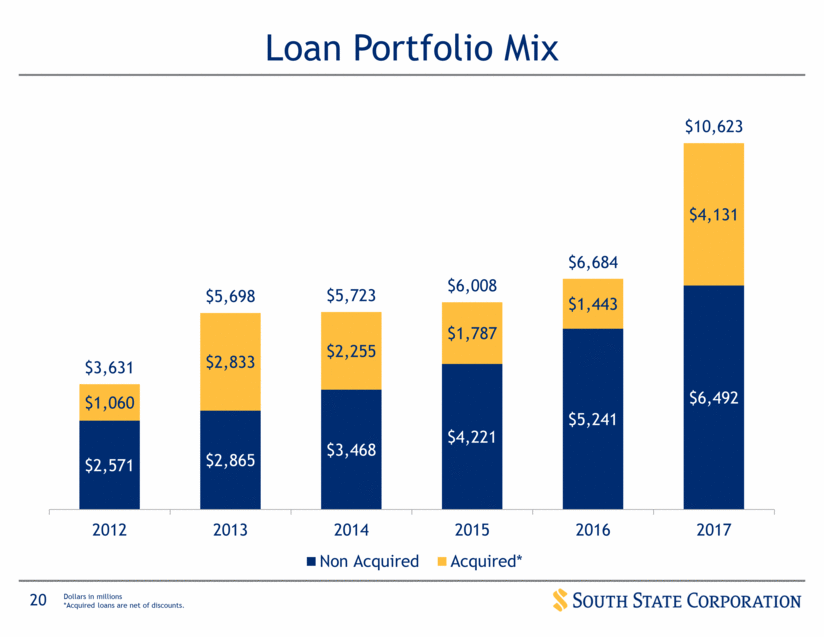
Loan Portfolio Mix Dollars in millions *Acquired loans are net of discounts. |
|
|
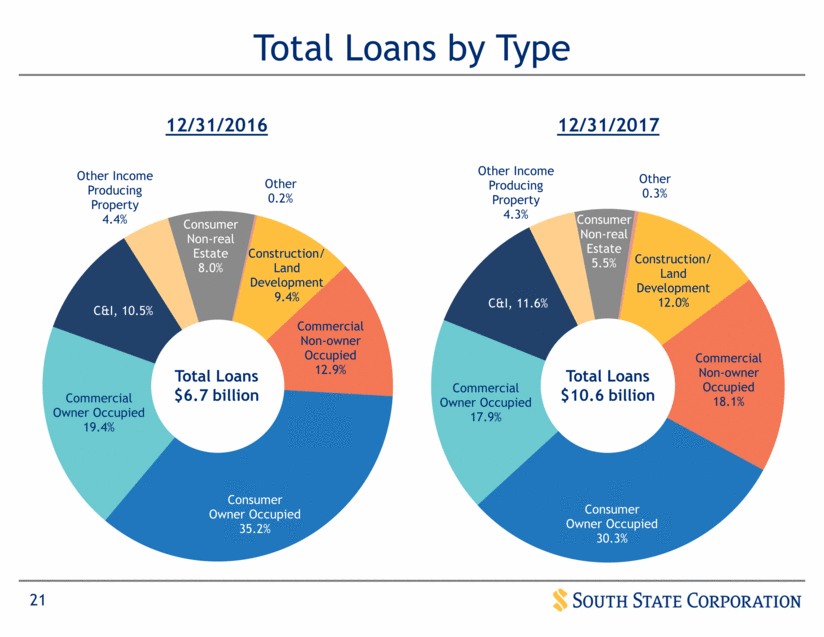
Total Loans by Type Total Loans $10.6 billion Total Loans $6.7 billion Construction/ Land Development 9.4% Commercial Non - owner Occupied 12.9% Consumer Owner Occupied 35.2% Commercial Owner Occupied 19.4% C&I , 10.5% Other Income Producing Property 4.4% Consumer Non - real Estate 8.0% Other 0.2% 12/31/2016 |
|
|
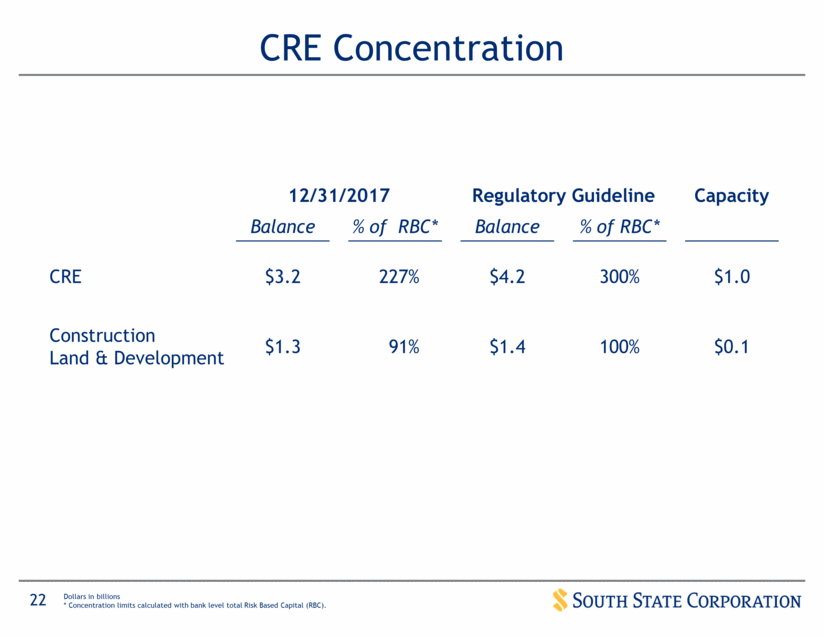
CRE Concentration 12/31/2017 Regulatory Guideline Capacity Balance % of RBC* Balance % of RBC* CRE $3.2 227% $4.2 300% $1.0 Construction Land & Development $1.3 91% $1.4 100% $0.1 Dollars in billions * Concentration limits calculated with bank level total Risk Based Capital (RBC). |
|
|
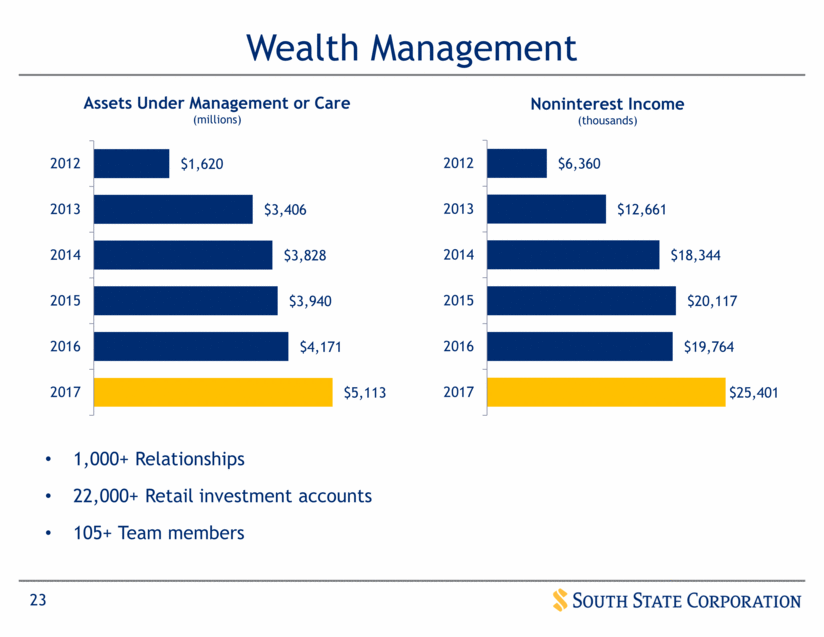
Wealth Management 1,000+ Relationships 22,000+ Retail investment accounts 105+ Team members $5,113 $4,171 $3,940 $3,828 $3,406 $1,620 2017 2016 2015 2014 2013 2012 Assets Under Management or Care (millions) $25,401 $19,764 $20,117 $18,344 $12,661 $6,360 2017 2016 2015 2014 2013 2012 Noninterest Income (thousands) |
|
|
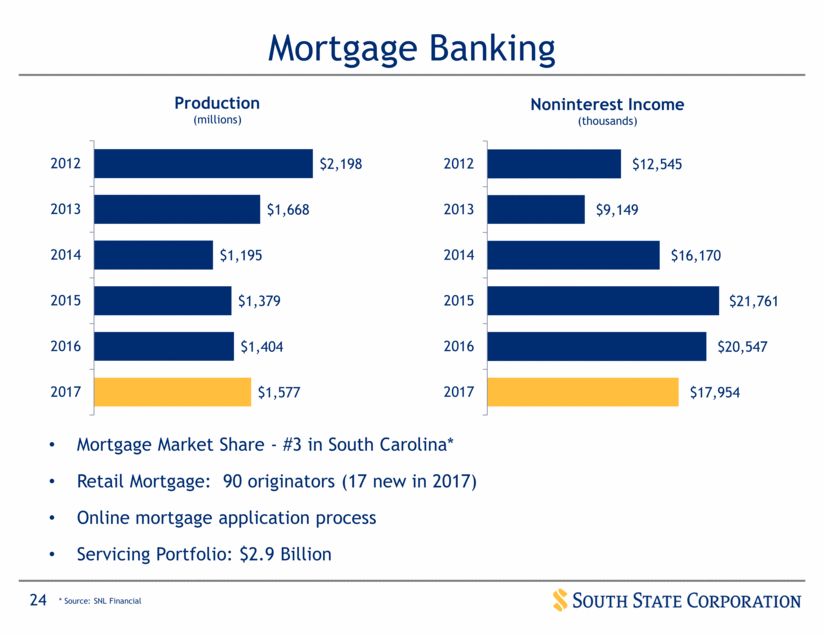
Mortgage Market Share - #3 in South Carolina* Retail Mortgage: 90 originators (17 new in 2017) Online mortgage application process Servicing Portfolio: $2.9 Billion Mortgage Banking * Source: SNL Financial $1,577 $1,404 $1,379 $1,195 $1,668 $2,198 2017 2016 2015 2014 2013 2012 Production (millions) $17,954 $20,547 $21,761 $16,170 $9,149 $12,545 2017 2016 2015 2014 2013 2012 Noninterest Income (thousands) |
|
|
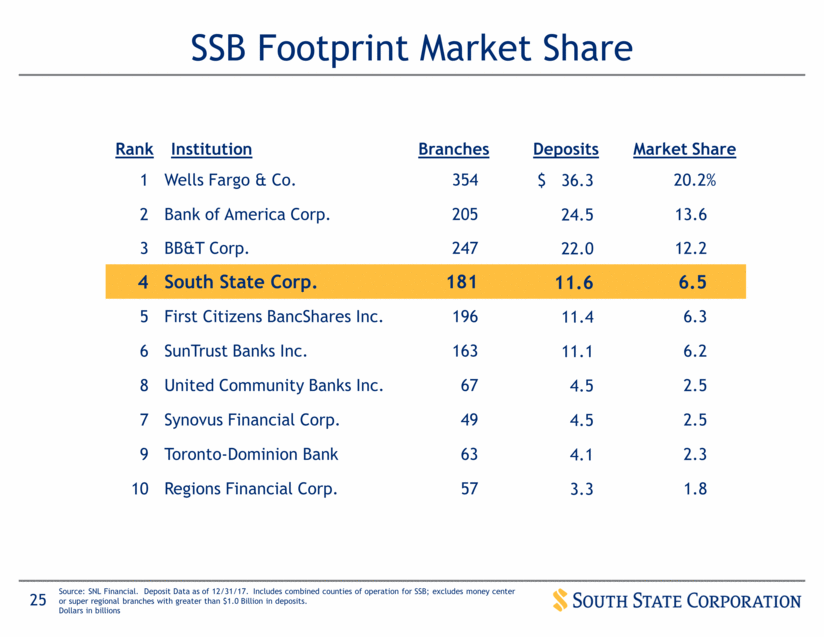
SSB Footprint Market Share Rank Institution Branches Deposits Market Share 1 Wells Fargo & Co. 354 $ 36.3 20.2% 2 Bank of America Corp. 205 24.5 13.6 3 BB&T Corp. 247 22.0 12.2 4 South State Corp. 181 11.6 6.5 5 First Citizens BancShares Inc. 196 11.4 6.3 6 SunTrust Banks Inc. 163 11.1 6.2 8 United Community Banks Inc. 67 4.5 2.5 7 Synovus Financial Corp. 49 4.5 2.5 9 Toronto-Dominion Bank 63 4.1 2.3 10 Regions Financial Corp. 57 3.3 1.8 Source: SNL Financial. Deposit Data as of 12/31/17. Includes combined counties of operation for SSB; excludes money center or super regional branches with greater than $1.0 Billion in deposits. Dollars in billions |
|
|
Appendix |
|
|
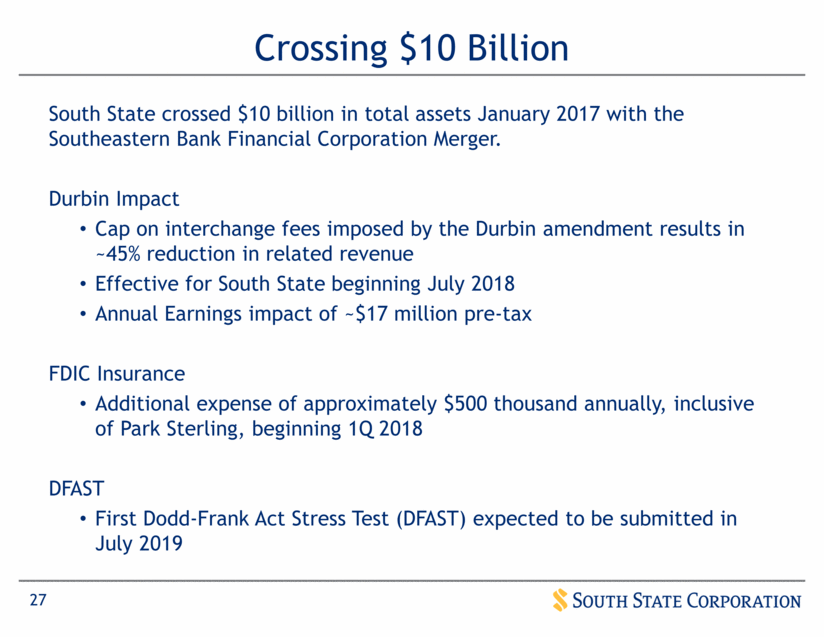
South State crossed $10 billion in total assets January 2017 with the Southeastern Bank Financial Corporation Merger. Durbin Impact Cap on interchange fees imposed by the Durbin amendment results in ~45% reduction in related revenue Effective for South State beginning July 2018 Annual Earnings impact of ~$17 million pre-tax FDIC Insurance Additional expense of approximately $500 thousand annually, inclusive of Park Sterling, beginning 1Q 2018 DFAST First Dodd-Frank Act Stress Test (DFAST) expected to be submitted in July 2019 Crossing $10 Billion |
|
|
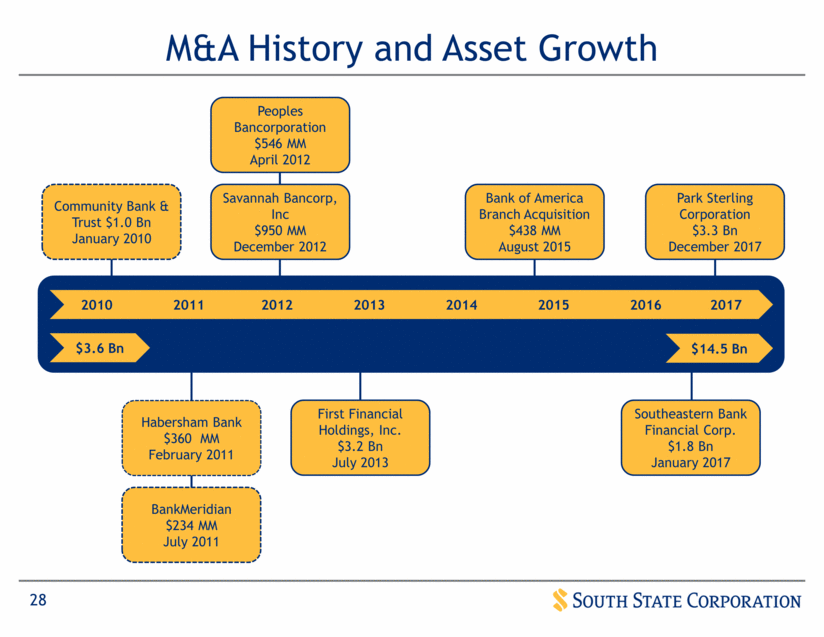
M&A History and Asset Growth 2010 2011 2012 2013 2014 2015 2016 2017 $3.6 Bn $14.5 Bn Community Bank & Trust $1.0 Bn January 2010 BankMeridian $234 MM July 2011 First Financial Holdings, Inc. $3.2 Bn July 2013 Peoples Bancorporation $546 MM April 2012 Savannah Bancorp, Inc $950 MM December 2012 Bank of America Branch Acquisition $438 MM August 2015 Habersham Bank $360 MM February 2011 Southeastern Bank Financial Corp. $1.8 Bn January 2017 Park Sterling Corporation $3.3 Bn December 2017 |
|
|
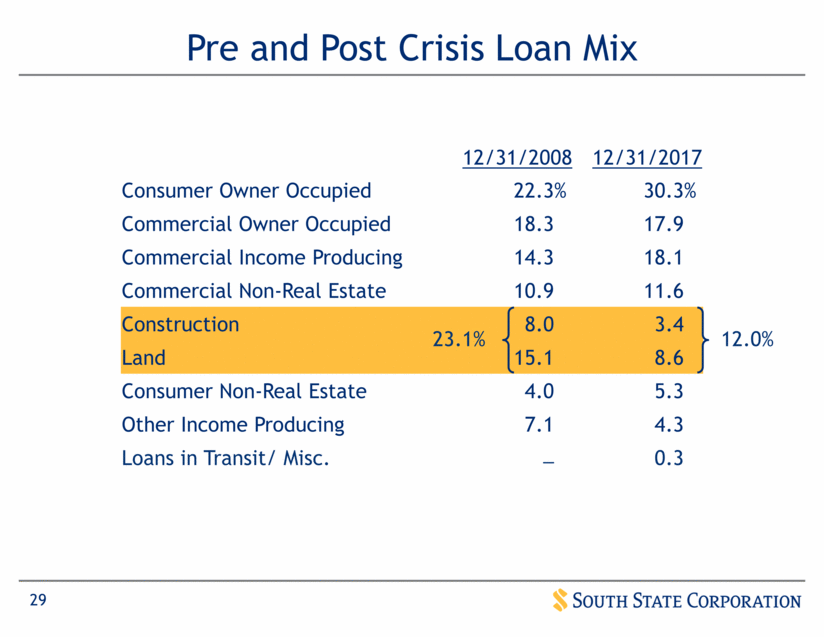
12/31/2008 12/31/2017 Consumer Owner Occupied 22.3% 30.3% Commercial Owner Occupied 18.3 17.9 Commercial Income Producing 14.3 18.1 Commercial Non-Real Estate 10.9 11.6 Construction 8.0 3.4 Land 15.1 8.6 Consumer Non-Real Estate 4.0 5.3 Other Income Producing 7.1 4.3 Loans in Transit/ Misc. _ 0.3 Pre and Post Crisis Loan Mix 12.0% 23.1% |
|
|
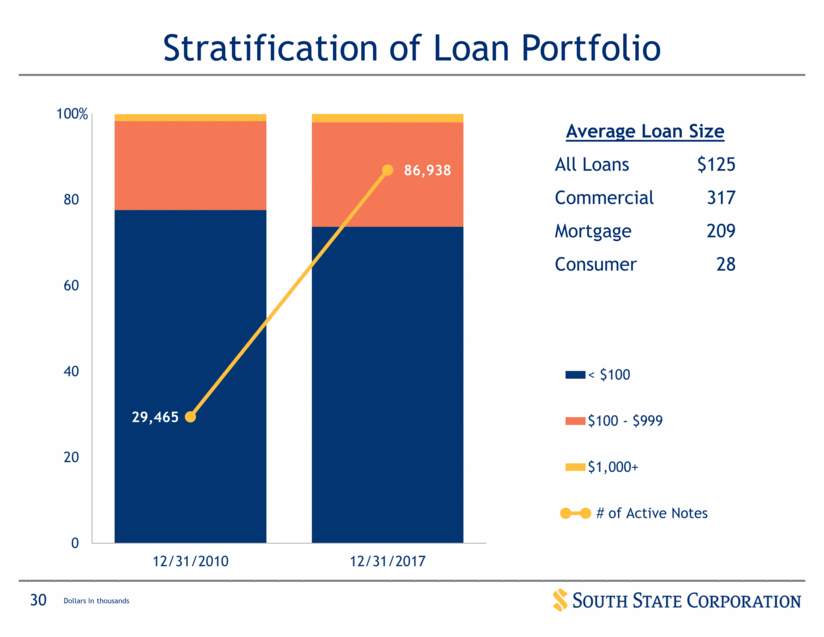
Stratification of Loan Portfolio % Average Loan Size All Loans $125 Commercial 317 Mortgage 209 Consumer 28 Dollars In thousands 29,465 86,938 0 20 40 60 80 100 12/31/2010 12/31/2017 < $100 $100 - $999 $1,000+ # of Active Notes |
|
|
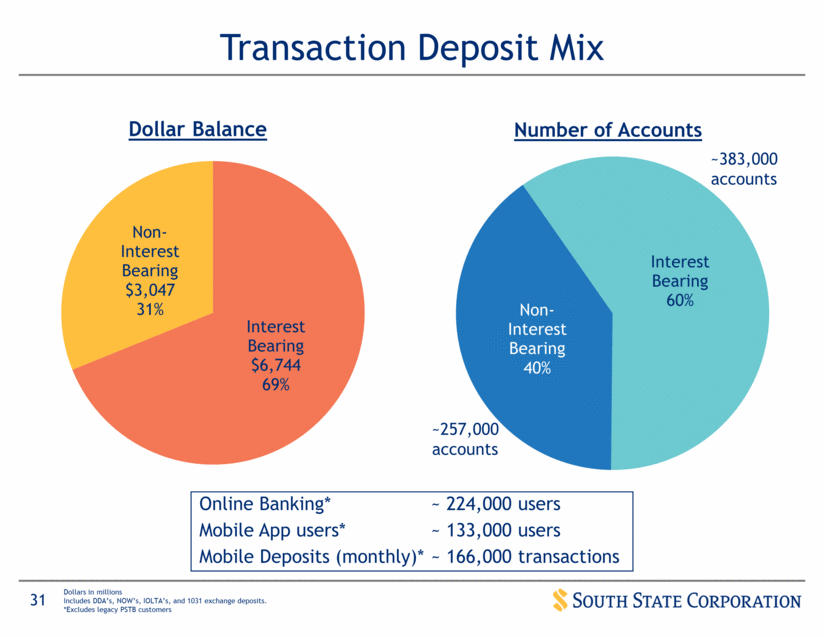
Transaction Deposit Mix ~383,000 accounts ~257,000 accounts Dollars in millions Includes DDA’s, NOW’s, IOLTA’s, and 1031 exchange deposits. *Excludes legacy PSTB customers Online Banking* ~ 224,000 users Mobile App users* ~ 133,000 users Mobile Deposits (monthly)* ~ 166,000 transactions Interest Bearing $6,744 69% Non - Interest Bearing $3,047 31% Dollar Balance Interest Bearing 60% Non - Interest Bearing 40% Number of Accounts |
|
|
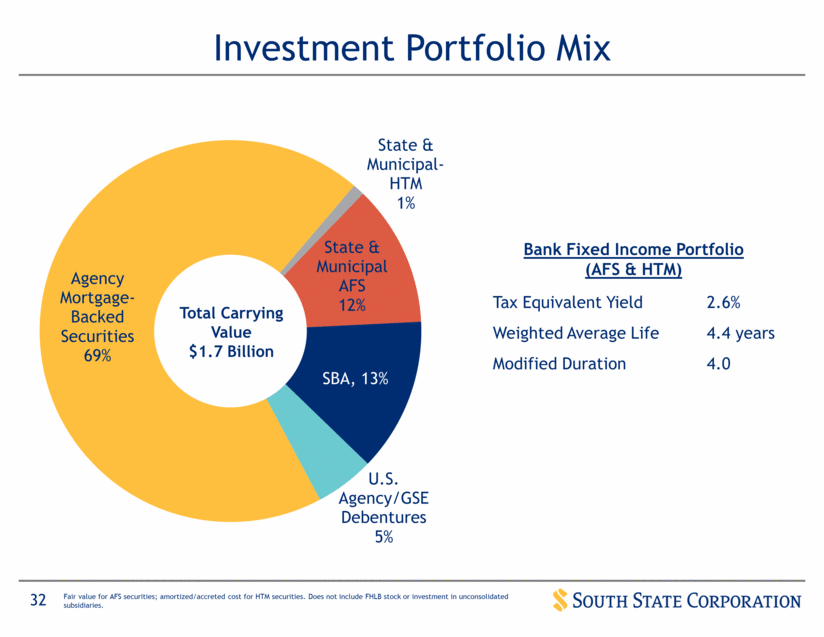
Investment Portfolio Mix Bank Fixed Income Portfolio (AFS & HTM) Tax Equivalent Yield 2.6% Weighted Average Life 4.4 years Modified Duration 4.0 Total Carrying Value $1.7 Billion Fair value for AFS securities; amortized/accreted cost for HTM securities. Does not include FHLB stock or investment in unconsolidated subsidiaries. |
|
|
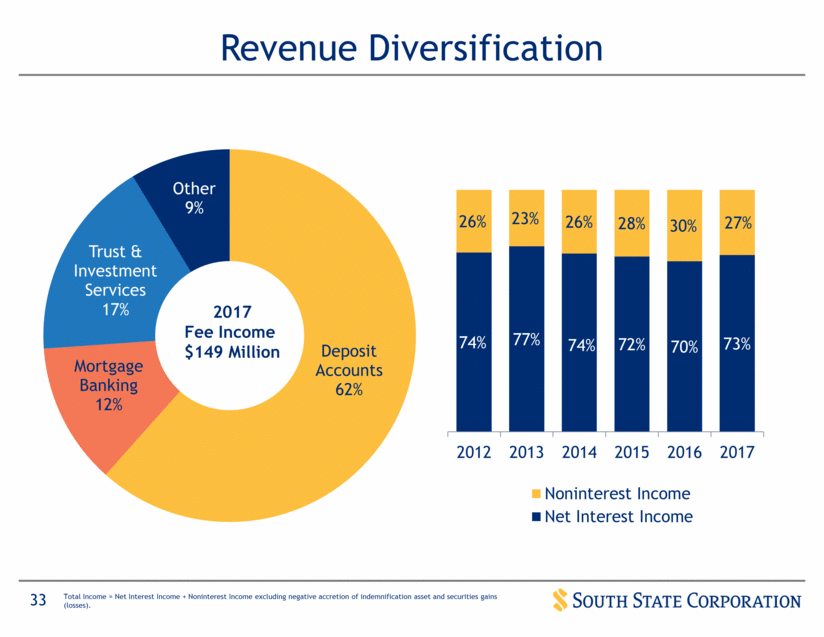
Revenue Diversification Total Income = Net Interest Income + Noninterest Income excluding negative accretion of indemnification asset and securities gains (losses). 74% 77% 74% 72% 70% 73% 26% 23% 26% 28% 30% 27% 2012 2013 2014 2015 2016 2017 Noninterest Income Net Interest Income |
|
|
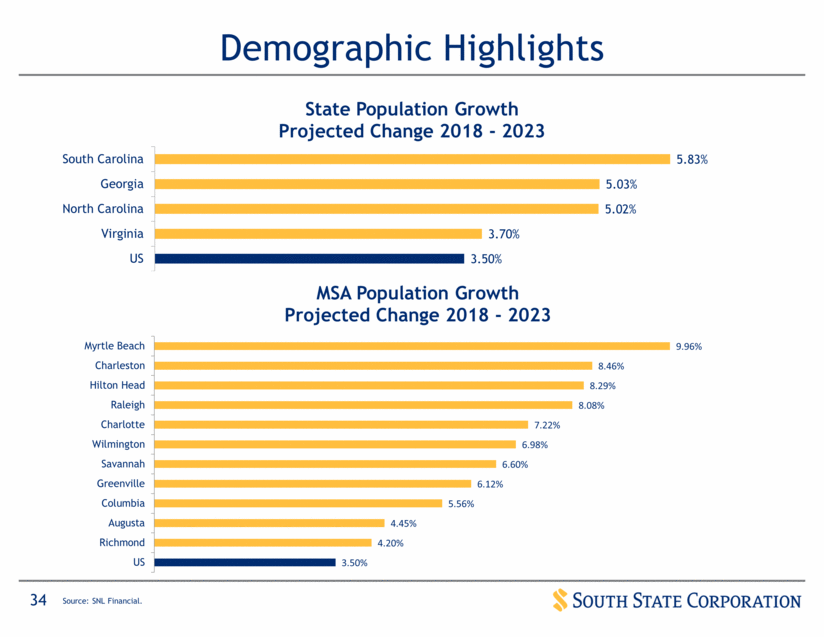
Demographic Highlights Source: SNL Financial. 5.83% 5.03% 5.02% 3.70% 3.50% South Carolina Georgia North Carolina Virginia US State Population Growth Projected Change 2018 - 2023 9.96% 8.46% 8.29% 8.08% 7.22% 6.98% 6.60% 6.12% 5.56% 4.45% 4.20% 3.50% Myrtle Beach Charleston Hilton Head Raleigh Charlotte Wilmington Savannah Greenville Columbia Augusta Richmond US MSA Population Growth Projected Change 2018 - 2023 |
|
|
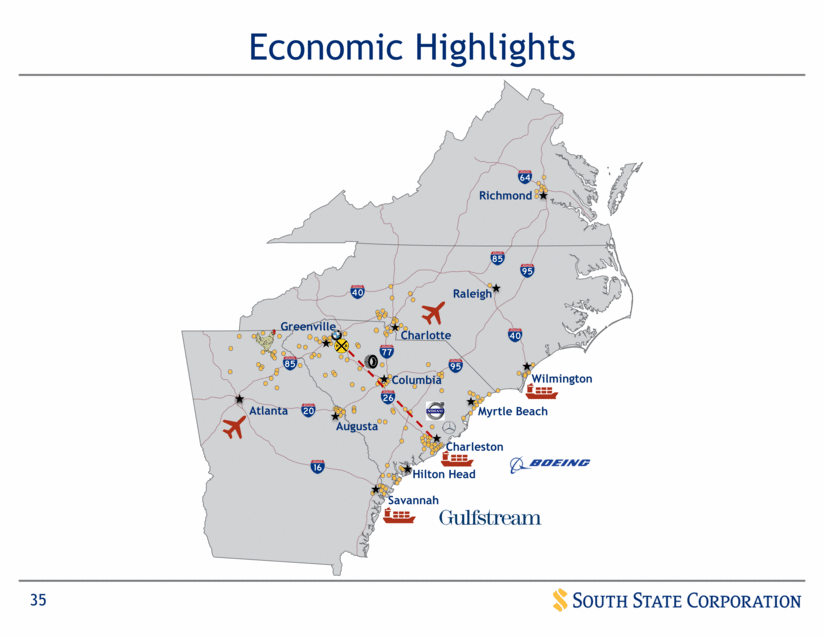
Economic Highlights Columbia Greenville Charlotte Charleston Richmond Wilmington Savannah Myrtle Beach Hilton Head Raleigh Atlanta Augusta |
|
|
[LOGO] |
|
|
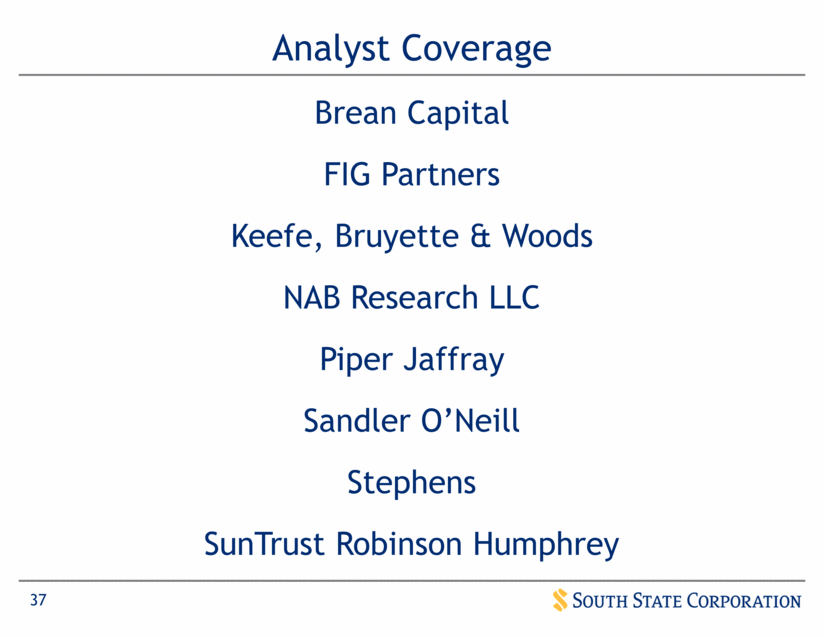
Analyst Coverage Brean Capital FIG Partners Keefe, Bruyette & Woods NAB Research LLC Piper Jaffray Sandler O’Neill Stephens SunTrust Robinson Humphrey |
|
|
[LOGO] |
|
|
Investor Contacts 520 Gervais Street Columbia, South Carolina 29201 800-277-2175 www.southstatebank.com Robert R. Hill, Jr. Chief Executive Officer John C. Pollok Senior Executive Vice President and Chief Financial Officer / Chief Operating Officer James C. Mabry IV Executive Vice President Investor Relations and Mergers & Acquisitions |
|
|
[LOGO] |

