Attached files
| file | filename |
|---|---|
| EX-99.1 - EXHIBIT 99.1 - Roadrunner Transportation Systems, Inc. | rrts-20180131xex991xpressr.htm |
| 8-K - 8-K - Roadrunner Transportation Systems, Inc. | rrts-20180131x8xkpressrele.htm |

Restatement Summary, 2016 Results &
2017 Business Trends
January 31, 2018

2
This presentation contains forward-looking statements within the meaning of Section 27A of the Securities Act of
1933, as amended, and Section 21E of the Securities Exchange Act of 1934, as amended, which relate to future
events or performance. Forward-looking statements include, among others, statements regarding the anticipated
filing of Roadrunner’s future quarterly and annual reports, Roadrunner’s expected results for 2017, the positive
momentum and better environment for operational improvements in Roadrunner’s Truckload Logistics segment
and growth in Roadrunner’s LTL and Ascent Global Logistics segments during 2018 and the ability of
Roadrunner’s financing and capital to support its current business levels and organic growth over the next five
years. These statements are often, but not always, made through the use of words or phrases such as “may,”
“will,” “anticipate,” “estimate,” “plan,” “project,” “continuing,” “ongoing,” “expect,” “believe,” “intend,” “predict,”
“potential,” “opportunity,” and similar words or phrases or the negatives of these words or phrases. These forward-
looking statements are based on Roadrunner’s current assumptions, expectations and beliefs and are subject to
substantial risks, estimates, assumptions, uncertainties and changes in circumstances that may cause
Roadrunner’s actual results, performance or achievements, to differ materially from those expressed or implied in
any forward-looking statement. Such factors include, among others, risks related to the restatement of
Roadrunner’s previously issued financial statements, the remediation of Roadrunner’s identified material
weaknesses in its internal control over financial reporting, the litigation resulting from the restatement of
Roadrunner’s previously issued financial statements and the other risk factors contained in Roadrunner’s SEC
filings, including Roadrunner’s Annual Report on Form 10-K for the year ended December 31, 2016. Because the
risks, estimates, assumptions and uncertainties referred to above could cause actual results or outcomes to differ
materially from those expressed in any forward-looking statements, you should not place undue reliance on any
forward-looking statements. Any forward-looking statement speaks only as of the date hereof, and, except as
required by law, Roadrunner assumes no obligation and does not intend to update any forward-looking statement
to reflect events or circumstances after the date hereof.
Safe Harbor Statement

3
Topics for Today’s Call
1. Restatement Summary
2. 2016 Financial Results
3. 2017 Business Trends
4. Question & Answer Session
Restatement Summary
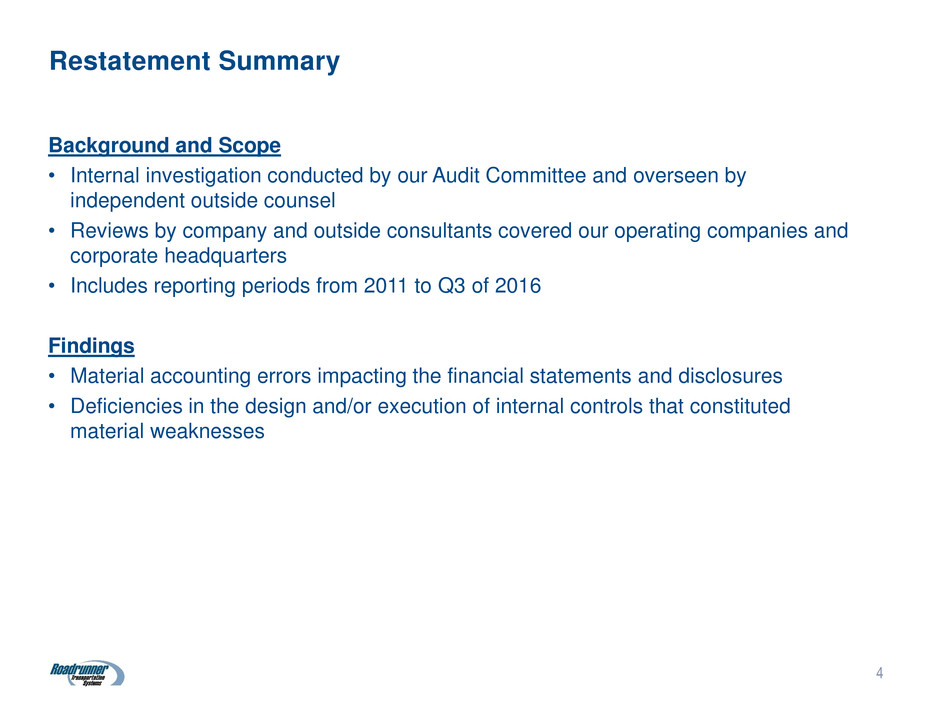
Background and Scope
• Internal investigation conducted by our Audit Committee and overseen by
independent outside counsel
• Reviews by company and outside consultants covered our operating companies and
corporate headquarters
• Includes reporting periods from 2011 to Q3 of 2016
Findings
• Material accounting errors impacting the financial statements and disclosures
• Deficiencies in the design and/or execution of internal controls that constituted
material weaknesses
4
Restatement Summary
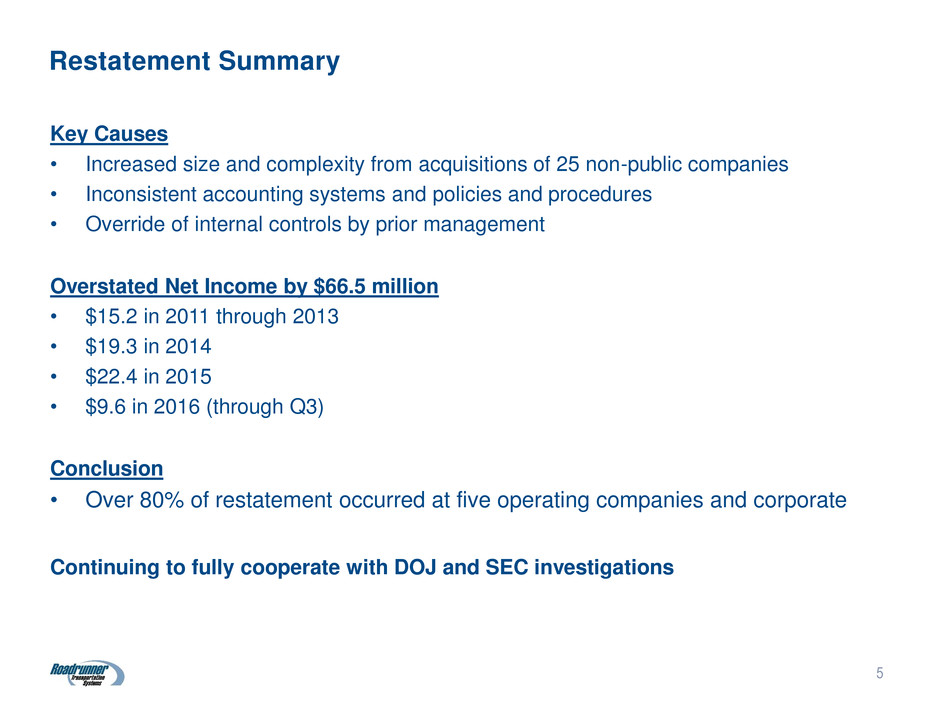
Key Causes
• Increased size and complexity from acquisitions of 25 non-public companies
• Inconsistent accounting systems and policies and procedures
• Override of internal controls by prior management
Overstated Net Income by $66.5 million
• $15.2 in 2011 through 2013
• $19.3 in 2014
• $22.4 in 2015
• $9.6 in 2016 (through Q3)
Conclusion
• Over 80% of restatement occurred at five operating companies and corporate
Continuing to fully cooperate with DOJ and SEC investigations
5
6
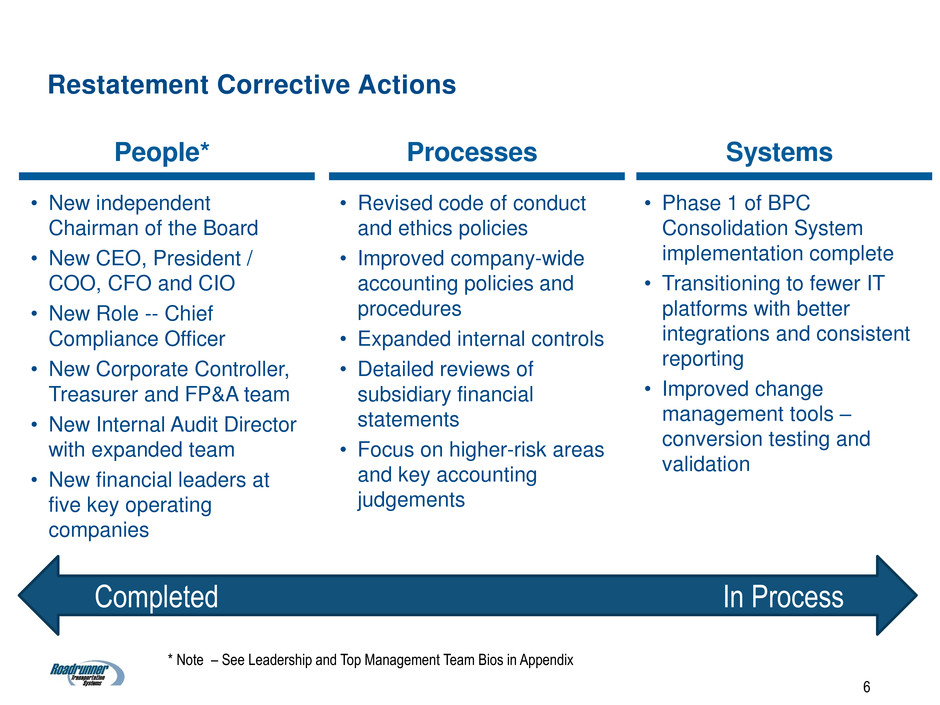
Restatement Corrective Actions
* Note – See Leadership and Top Management Team Bios in Appendix
• New independent
Chairman of the Board
• New CEO, President /
COO, CFO and CIO
• New Role -- Chief
Compliance Officer
• New Corporate Controller,
Treasurer and FP&A team
• New Internal Audit Director
with expanded team
• New financial leaders at
five key operating
companies
People*
• Revised code of conduct
and ethics policies
• Improved company-wide
accounting policies and
procedures
• Expanded internal controls
• Detailed reviews of
subsidiary financial
statements
• Focus on higher-risk areas
and key accounting
judgements
Processes Systems
• Phase 1 of BPC
Consolidation System
implementation complete
• Transitioning to fewer IT
platforms with better
integrations and consistent
reporting
• Improved change
management tools –
conversion testing and
validation
Completed In Process

Capital In Place to Support the Operational Turnaround
Raised more than $540 million in new financing
• Preferred stock investment* - recorded as debt for GAAP purposes
• No mandatory redemption payments until 2023
• Allows for deferred payment of dividends, if deferred earns interest until paid
• Asset-based lending (ABL) facility - supported by A/R and transportation equipment
• Covenant light requirements enables focus on operational improvements
Sold Unitrans for $95 million
• Non-core business unit
• Divestiture completed on September 15, 2017
• Reduced debt and provided additional liquidity
Current Status
• In compliance with ABL and preferred stock investment agreements
• Current available borrowing capacity under the ABL facility plus a standby
commitment for ~$50 million of additional preferred stock investment
7
* Note – See Preferred Stock Investment in Appendix
Summary of 2016 Results
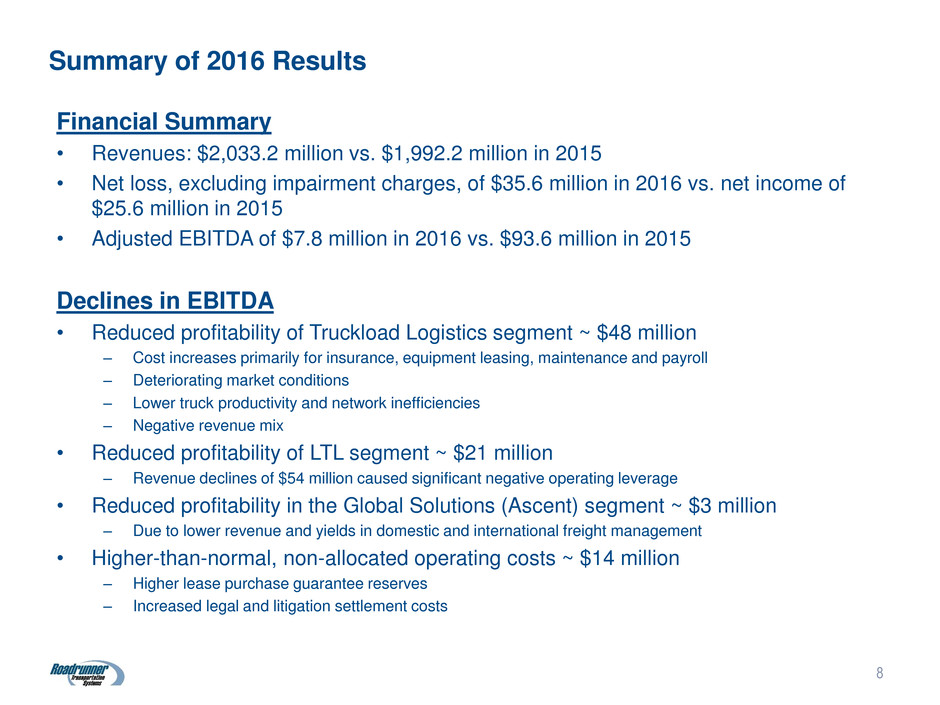
Financial Summary
• Revenues: $2,033.2 million vs. $1,992.2 million in 2015
• Net loss, excluding impairment charges, of $35.6 million in 2016 vs. net income of
$25.6 million in 2015
• Adjusted EBITDA of $7.8 million in 2016 vs. $93.6 million in 2015
Declines in EBITDA
• Reduced profitability of Truckload Logistics segment ~ $48 million
– Cost increases primarily for insurance, equipment leasing, maintenance and payroll
– Deteriorating market conditions
– Lower truck productivity and network inefficiencies
– Negative revenue mix
• Reduced profitability of LTL segment ~ $21 million
– Revenue declines of $54 million caused significant negative operating leverage
• Reduced profitability in the Global Solutions (Ascent) segment ~ $3 million
– Due to lower revenue and yields in domestic and international freight management
• Higher-than-normal, non-allocated operating costs ~ $14 million
– Higher lease purchase guarantee reserves
– Increased legal and litigation settlement costs
8

2017 Business Trends

10
2017 Business Trends
• Difficult market conditions
in first three quarters,
particularly at Express
Ground, Intermodal and
Temp Control
• Improving rate environment
later in year benefiting
these businesses
Truckload Logistics
• Continuing investment
cycle focused on improving
customer experience
• Overall revenue stable with
improving trends later in
year
• Use of purchased power a
detriment as truckload rate
environment improves
LTL
Ascent Global
Logistics
• Continued top and bottom
line growth in these asset
free businesses
• Sale of Unitrans in
September of 2017 --$9.3
million of EBITDA in 2016
Overall
Revenue in line with 2016
Higher costs associated with upgrading finance, HR and IT talent
Approximately $30 million of restatement and refinancing costs
11
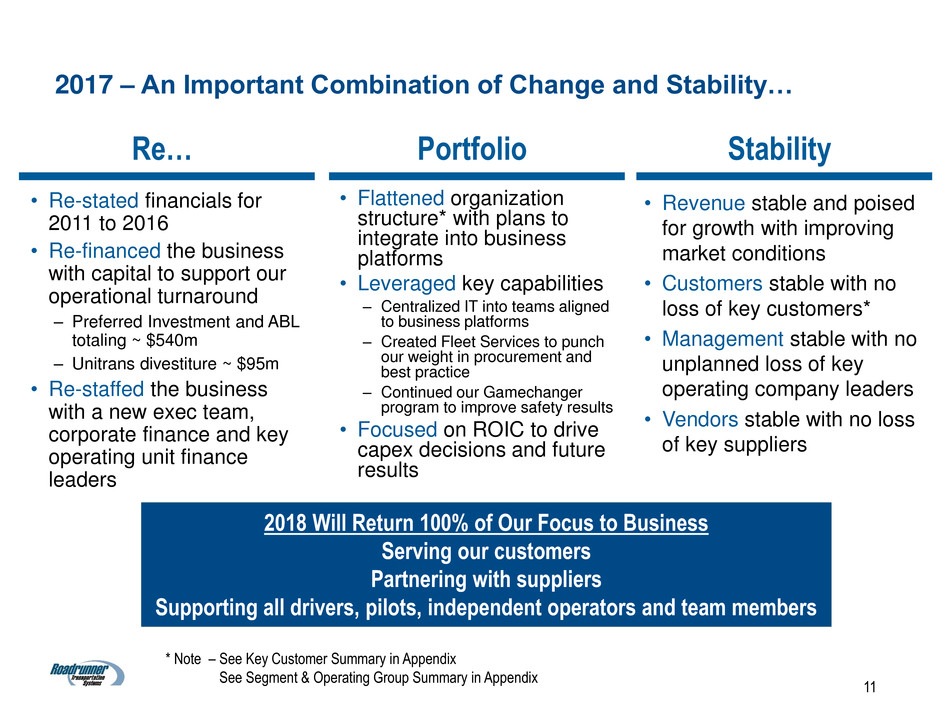
2017 – An Important Combination of Change and Stability…
• Re-stated financials for
2011 to 2016
• Re-financed the business
with capital to support our
operational turnaround
– Preferred Investment and ABL
totaling ~ $540m
– Unitrans divestiture ~ $95m
• Re-staffed the business
with a new exec team,
corporate finance and key
operating unit finance
leaders
Re…
• Flattened organization
structure* with plans to
integrate into business
platforms
• Leveraged key capabilities
– Centralized IT into teams aligned
to business platforms
– Created Fleet Services to punch
our weight in procurement and
best practice
– Continued our Gamechanger
program to improve safety results
• Focused on ROIC to drive
capex decisions and future
results
Portfolio Stability
• Revenue stable and poised
for growth with improving
market conditions
• Customers stable with no
loss of key customers*
• Management stable with no
unplanned loss of key
operating company leaders
• Vendors stable with no loss
of key suppliers
2018 Will Return 100% of Our Focus to Business
Serving our customers
Partnering with suppliers
Supporting all drivers, pilots, independent operators and team members
* Note – See Key Customer Summary in Appendix
See Segment & Operating Group Summary in Appendix

Future Communications
12
Topics for our Next Conference Call
• 2017 Results & Analysis
– 10-Qs through 9/30/17 by March
– Full Year 2017 as soon as possible thereafter
• Details surrounding 2018 plans and goals
– Don’t expect guidance
– What you can expect
• Guideposts for progress over the next few years
• CapEx guidelines for 2018 and future estimated annualized run rate
• Tax rate estimates
Other Communications
– Future announcements related to simplification and integration

Q&A

Appendix

New Executive Leadership Team
Chief Executive Officer
• Joined Roadrunner in early 2016 as
President and COO
• Previously served as CEO of RC2
Corp from 2003 to 2011 and at TOMY
International for two years after they
acquired RC2
• Deep experience in consumer
products, brand and channel
management, global sourcing and
logistics
• Strong track record of driving long-
term Sales and EBITDA Growth (11%
CAGR @ RC2)
• Extensive public company executive
management experience as CFO,
COO and CEO of acquisitive, levered
growth-oriented company
Curt Stoetling Curt Stoelting
President & COO
Mike Gettle
• Joined Roadrunner in 2016 as
Executive Vice President
• Previously served as Americas CEO
and Global CFO of market-research
firm TNS, a highly acquisitive $2 billion
division of multinational WPP plc
• Earlier was Global CFO of sister firm
Millward Brown; grew it from $200M to
$1B through 29 acquisitions to
become one of the most profitable and
respected global research firms
• Background in finance, operations,
and leadership of people-oriented,
data intensive, geographically
dispersed businesses
• Strong track record of success in both
high growth, acquisitive and
turnaround environments
EVP & CFO
Terry Rogers
• Joined Roadrunner in May 2017 with
extensive public company and private
equity experience at Ryerson
• Most recently CFO of an acquisitive
manufacturing company with over 40
distinct businesses and revenues in
excess of $2 billion
• Extensive background in financings,
treasury management, investor
relations, internal controls and
enterprise-wide financial planning and
reporting systems
15

Top Management Team
16
Key Management Positions
Scott Cousins, Chief Information Officer
• Joined Roadrunner in January 2017 as CIO
• Held previous CIO positions at food distributor KeHe and NCH Marketing
• Earlier served as Senior Vice President of Information Technology at IndyMac Bank and as Associate Partner at Accenture
Bob Milane, General Counsel and Chief Compliance Officer
• Joined Roadrunner in 2014 and recently served as EVP for Risk Management and GC (new role remains responsible for risk management)
• Previously served as Managing Director for Risk Management at FedEx Ground and Assistant VP of Risk Management for Canal Insurance
Craig Paulson, SVP of Human Resources
• Joined Roadrunner in October 2017
• Previously HR experience at Danaher, Eaton/Cooper Industries, Dover and Generac
• Has managed all function HR areas and partnered with business leaders on people deployment and development
Frank Hurst, President - Roadrunner Freight
• Joined Roadrunner in January 2017 with 21 years of management and transportation industry experience
• Previously business and sales leader at North America Corp., Vitrans Express and Fed Ex
Bill Goodgion, President - Ascent Global Logistics
• Joined Roadrunner in April 2015 as President of Roadrunner Ascent Global Logistics
• Previously spent 15 year at FedEx Trade Networks where he served as MD of Regional Operations and then MD of Global Distribution
17
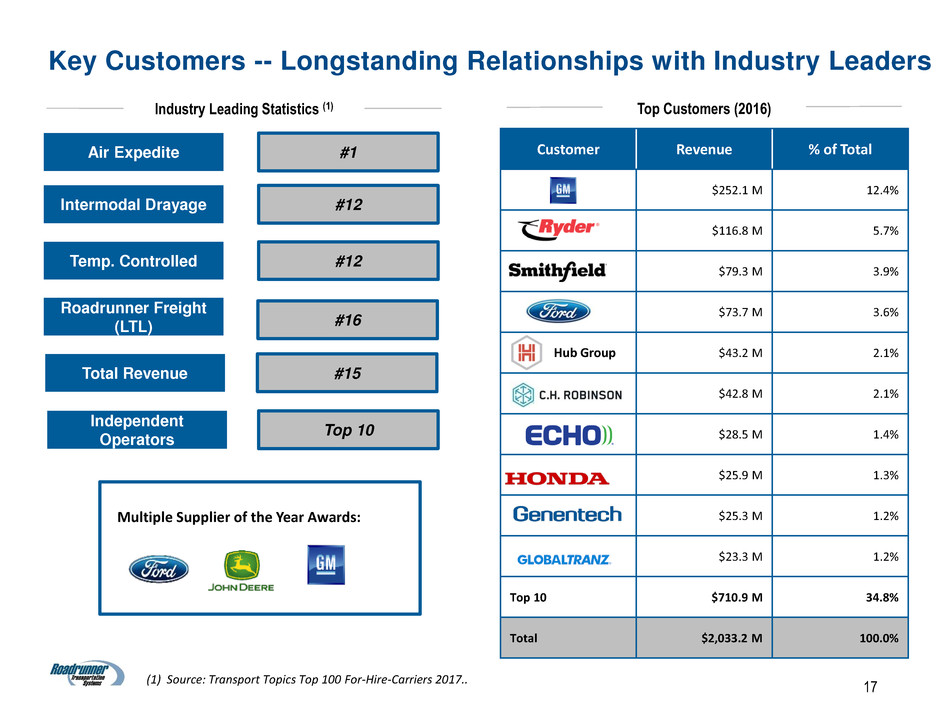
Top Customers (2016) Industry Leading Statistics (1)
Customer Revenue % of Total
$252.1 M 12.4%
(2) $116.8 M 5.7%
(2) $79.3 M 3.9%
( $73.7 M 3.6%
$43.2 M 2.1%
$42.8 M 2.1%
$28.5 M 1.4%
$25.9 M 1.3%
$25.3 M 1.2%
$23.3 M 1.2%
Top 10 $710.9 M 34.8%
Total $2,033.2 M 100.0%
Air Expedite
Intermodal Drayage
Temp. Controlled
Roadrunner Freight
(LTL)
Total Revenue
Independent
Operators
#1
#12
#12
#16
#15
Top 10
(1) Source: Transport Topics Top 100 For-Hire-Carriers 2017..
Key Customers -- Longstanding Relationships with Industry Leaders
Hub Group
Multiple Supplier of the Year Awards:
18
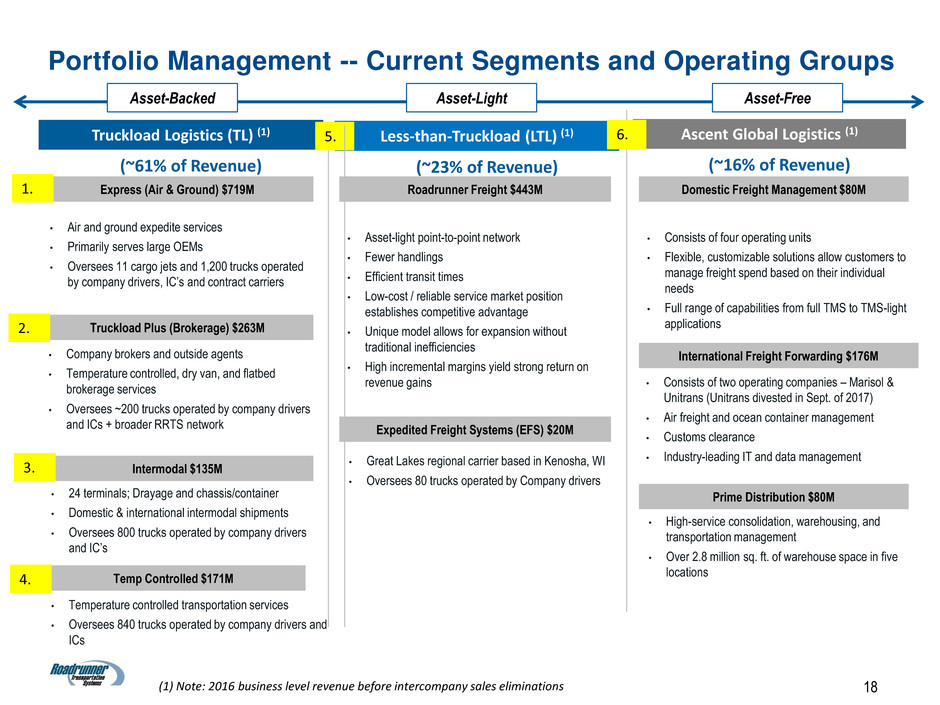
Truckload Logistics (TL) (1)
(~61% of Revenue)
2016 Revenue
Express (Air & Ground) $719M
• Air and ground expedite services
• Primarily serves large OEMs
• Oversees 11 cargo jets and 1,200 trucks operated
by company drivers, IC’s and contract carriers
Truckload Plus (Brokerage) $263M
• Company brokers and outside agents
• Temperature controlled, dry van, and flatbed
brokerage services
• Oversees ~200 trucks operated by company drivers
and ICs + broader RRTS network
Intermodal $135M
• 24 terminals; Drayage and chassis/container
• Domestic & international intermodal shipments
• Oversees 800 trucks operated by company drivers
and IC’s
Temp Controlled $171M
• Temperature controlled transportation services
• Oversees 840 trucks operated by company drivers and
ICs
Less-than-Truckload (LTL) (1)
(~23% of Revenue)
2016 Revenue
Roadrunner Freight $443M
• Asset-light point-to-point network
• Fewer handlings
• Efficient transit times
• Low-cost / reliable service market position
establishes competitive advantage
• Unique model allows for expansion without
traditional inefficiencies
• High incremental margins yield strong return on
revenue gains
Expedited Freight Systems (EFS) $20M
• Great Lakes regional carrier based in Kenosha, WI
• Oversees 80 trucks operated by Company drivers
Ascent Global Logistics (1)
(~16% of Revenue)
2016 Revenue
Domestic Freight Management $80M
• Consists of four operating units
• Flexible, customizable solutions allow customers to
manage freight spend based on their individual
needs
• Full range of capabilities from full TMS to TMS-light
applications
International Freight Forwarding $176M
• Consists of two operating companies – Marisol &
Unitrans (Unitrans divested in Sept. of 2017)
• Air freight and ocean container management
• Customs clearance
• Industry-leading IT and data management
Prime Distribution $80M
• High-service consolidation, warehousing, and
transportation management
• Over 2.8 million sq. ft. of warehouse space in five
locations
Portfolio Management -- Current Segments and Operating Groups
Asset-Backed Asset-Free
(1) Note: 2016 business level revenue before intercompany sales eliminations
1.
2.
3.
4.
5. 6.
Asset-Light

19
Preferred Investment Summary – treated as debt for GAAP purposes
• Elliott Management $540 million Preferred Investment provided a full refinancing of existing credit facility
• Over half of the Preferred Investment redeemed and retired with ABL Financing and Sale of Unitrans (see notes)
• Dividends payable quarterly in cash or deferred at company’s option; Deferred amounts earn additional interest
19
Preferred E Preferred B Preferred C Preferred D
Structure • Preferred equity
• Convertible to second lien
notes upon approval of ABL
lenders
• Preferred equity • Preferred equity • Preferred Equity valued at
4.01% of common equity
• Warrant Agreement for
380K shares (1% of
common equity)
Face Amount
Outstanding
$37.5M (2) $155MM $55MM 5% common equity economic
interest in company
Preferred Rate L + 5.25% + Additional Rate
(8.50%)
L + 3.00% + Additional Rate
(4.75 – 12.50%) based on
leverage
L + 3.00% + Additional Rate
(4.75 – 12.50%) based on
leverage
N/A
Redemption Term 6 years 8 years 8 years 8 years
Amortization None None None None
Financial
Covenants
None None None None
Redemption Rights 106.5 / 103.5 / Par NC 1 / 105 / 103 / Par 65% premium (subject to
stock price movement)
Subject to stock price
movement
Notes: 1) Series F preferred stock with a face value of $240.5M was redeemed on July 21, 2017 with proceeds from asset-based-lending financing
2) Series E preferred stock with a face value of $52.5M was redeemed on September 14, 2017 with proceeds from the sale of Unitrans.
