Attached files
| file | filename |
|---|---|
| EX-99.1 - PRESS RELEASE - Midland States Bancorp, Inc. | exh_991.htm |
| 8-K - FORM 8-K - Midland States Bancorp, Inc. | f8k_012518.htm |
EXHIBIT 99.2

Midland States Bancorp, Inc. NASDAQ: MSBI Fourth Quarter 2017 Earnings Call
2 Forward - Looking Statements. This presentation may contain forward - looking statements within the meaning of the federal securities laws. Forward - looking statements express management’s current expectations, forecasts of future events or long - term goals, and may be based upon beliefs, expectations and assumptions of Midland’s management, are generally identifiable by the use of words such as “believe,” “expect,” “anticipate,” “plan,” “intend,” “estimate,” “may,” “will,” “would,” “could,” “shoul d” or other similar expressions. All statements in this presentation speak only as of the date they are made, and Midland undertakes no obligation to update any statement. A number of factors, many of which are beyond the ability of Midland to control or predic t, could cause actual results to differ materially from those in its forward - looking statements. These risks and uncertainties sho uld be considered in evaluating forward - looking statements and undue reliance should not be placed on such statements. Additional information concerning Midland and its respective businesses, including additional factors that could materially affect Midla nd’ s financial results, are included in Midland’s filings with the Securities and Exchange Commission. Use of Non - GAAP Financial Measures. This presentation contains certain financial information determined by methods other than in accordance with accounting principles generally accepted in the United States (“GAAP”). These non - GAAP financial measures include “Adjusted Earnings,” “Adjusted Diluted Earnings Per Share,” “Adjusted Return on Average Assets,” “Adjusted Return on Average Shareholders’ Equity,” “Adjusted Return on Average Tangible Common Equity,” “Adjusted Pre - Tax, Pre - Provision Earnings,” “Efficiency Ratio,” “Tangible Common Equity to Tangible Assets,” “Tangible Book Value Per Share” and “Return on Average Tangible Common Equity.” The Company believes that these non - GAAP financial measures provide both management and investors a more complete understanding of the Company’s funding profile and profitability. These non - GAAP financial measures are supplemental and are not a substitute for any analysis based on GAAP financial measures. The Company believes that these non - GAAP financial measures provide both management and investors a more complete understanding of the Company’s funding profile and profitability. These non - GAAP financial measures are supplemental and are not a substitute for any analysis based on GAAP financial measures. Not all companies use the same calculation of these measures; therefore this presentation may not be comparable to other similarly titled measures as presented by other companies. Reconciliations of these non - GAAP measures are provided in the Appendix section of this presentation.
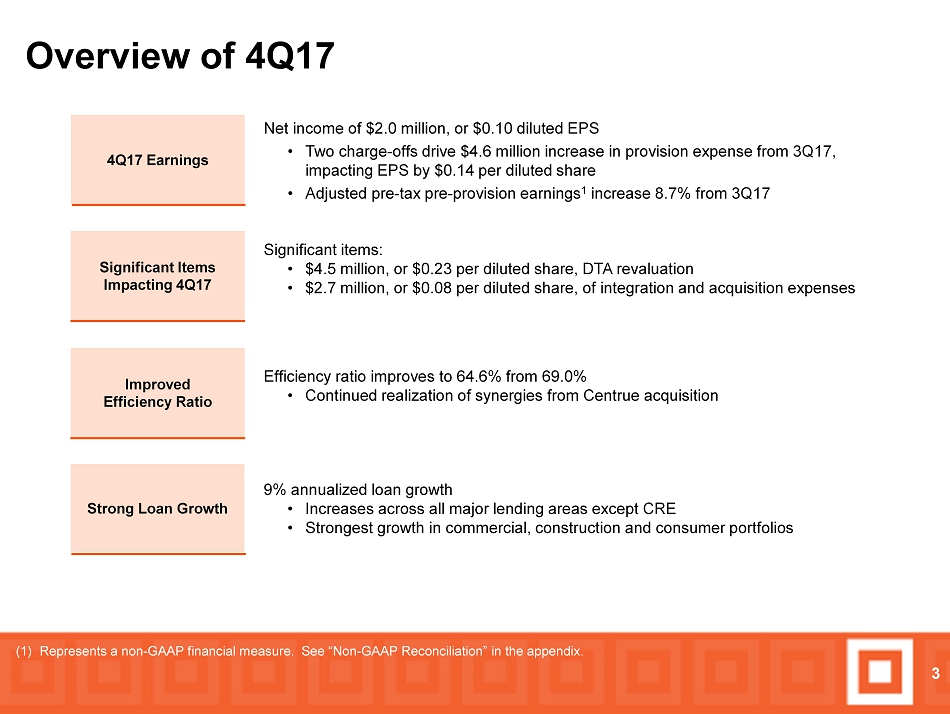
Overview of 4Q17 3 Improved Efficiency Ratio 4Q17 Earnings Strong Loan Growth Net income of $2.0 million, or $ 0.10 diluted EPS • Two charge - offs drive $4.6 million increase in provision expense from 3Q17, impacting EPS by $0.14 per diluted share • Adjusted pre - tax pre - provision earnings 1 increase 8.7% from 3Q17 Efficiency ratio improves to 64.6% from 69.0% • Continued realization of synergies from Centrue acquisition 9% annualized loan growth • Increases across all major lending areas except CRE • Strongest growth in commercial, construction and consumer portfolios Significant Items Impacting 4Q17 Significant items: • $4.5 million , or $0.23 per diluted share, DTA revaluation • $2.7 million, or $0.08 per diluted share, of integration and acquisition expenses (1) Represents a non - GAAP financial measure. See “Non - GAAP Reconciliation” in the appendix.
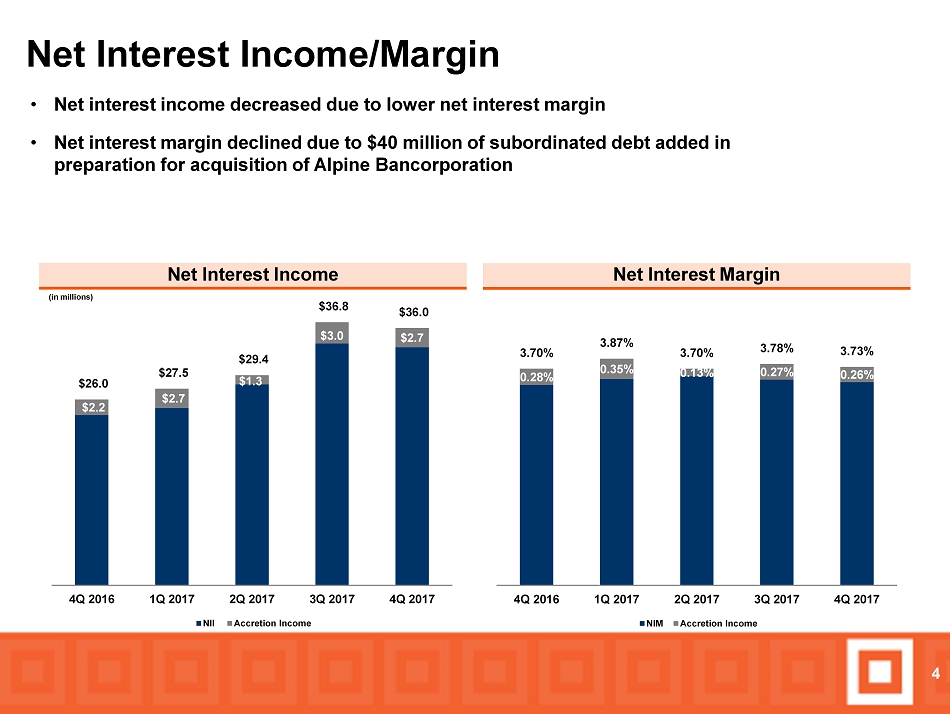
0.28% 0.35% 0.13% 0.27% 0.26% 3.70% 3.87% 3.70% 3.78% 3.73% 4Q 2016 1Q 2017 2Q 2017 3Q 2017 4Q 2017 NIM Accretion Income • Net interest income decreased due to lower net interest margin • Net interest margin declined due to $40 million of subordinated debt added in preparation for acquisition of Alpine Bancorporation Net Interest Income/Margin Net Interest Margin 4 Net Interest Income (in millions) $5.9 $2.6 $4.4 $1.9 $4.9 $2.2 $2.7 $1.3 $3.0 $2.7 $26.0 $27.5 $29.4 $36.8 $36.0 4Q 2016 1Q 2017 2Q 2017 3Q 2017 4Q 2017 NII Accretion Income
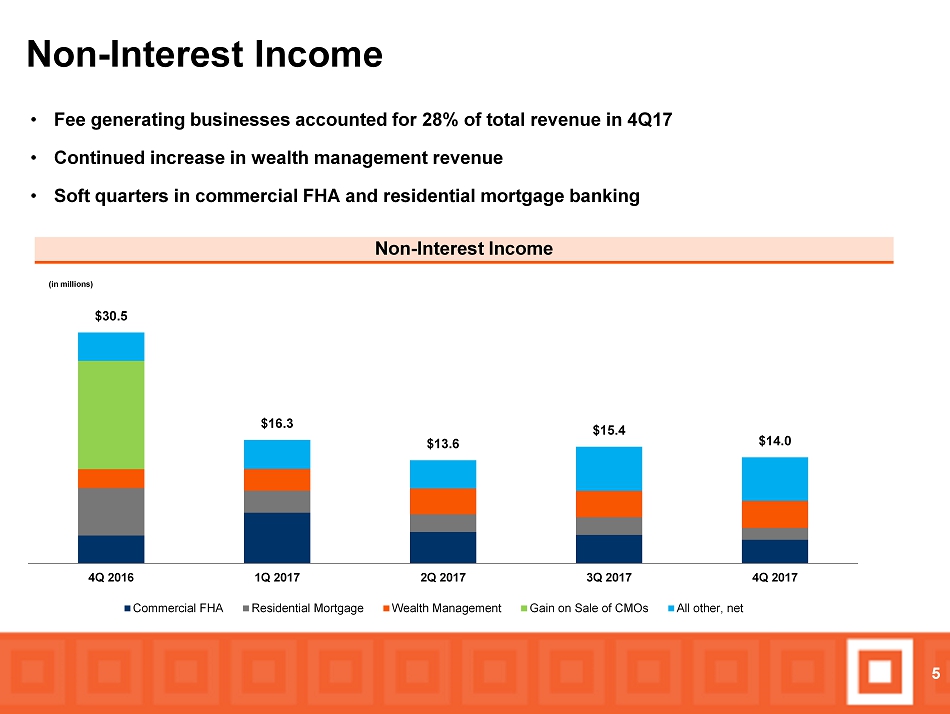
Non - Interest Income 5 • Fee generating businesses accounted for 28% of total revenue in 4Q17 • Continued increase in wealth management revenue • Soft quarters in commercial FHA and residential mortgage banking Non - Interest Income (in millions) $30.5 $16.3 $13.6 $15.4 $14.0 4Q 2016 1Q 2017 2Q 2017 3Q 2017 4Q 2017 Commercial FHA Residential Mortgage Wealth Management Gain on Sale of CMOs All other, net
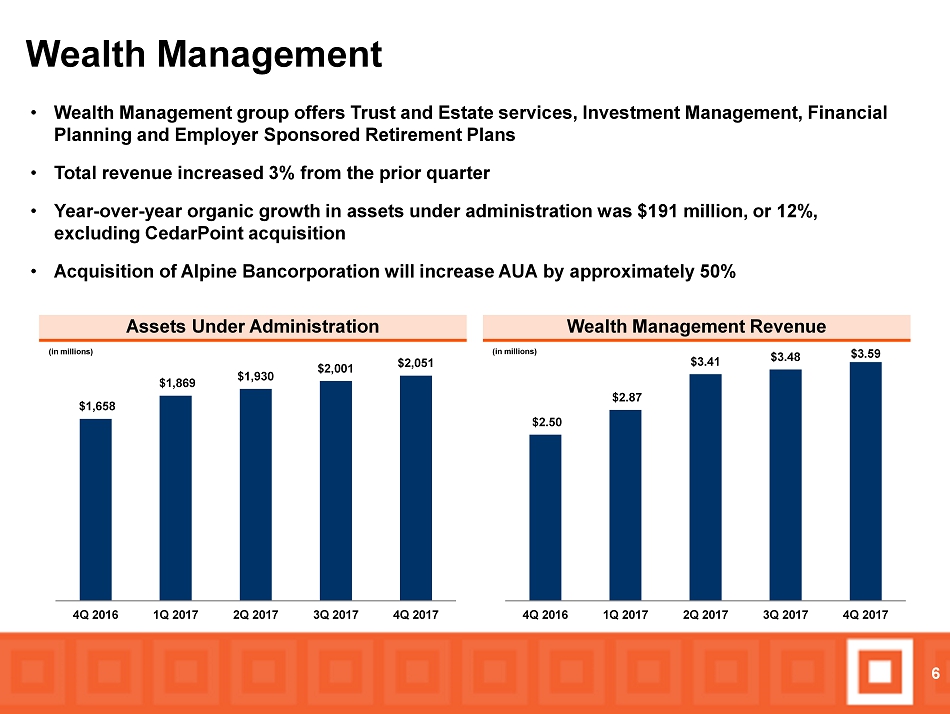
$2.50 $2.87 $3.41 $3.48 $3.59 4Q 2016 1Q 2017 2Q 2017 3Q 2017 4Q 2017 $1,658 $1,869 $1,930 $2,001 $2,051 4Q 2016 1Q 2017 2Q 2017 3Q 2017 4Q 2017 • Wealth Management group offers Trust and Estate services, Investment Management, Financial Planning and Employer Sponsored Retirement Plans • Total revenue increased 3% from the prior quarter • Year - over - year organic growth in assets under administration was $191 million , or 12%, excluding CedarPoint acquisition • Acquisition of Alpine Bancorporation will increase AUA by approximately 50% Wealth Management Wealth Management Revenue 6 Assets Under Administration (in millions) (in millions)
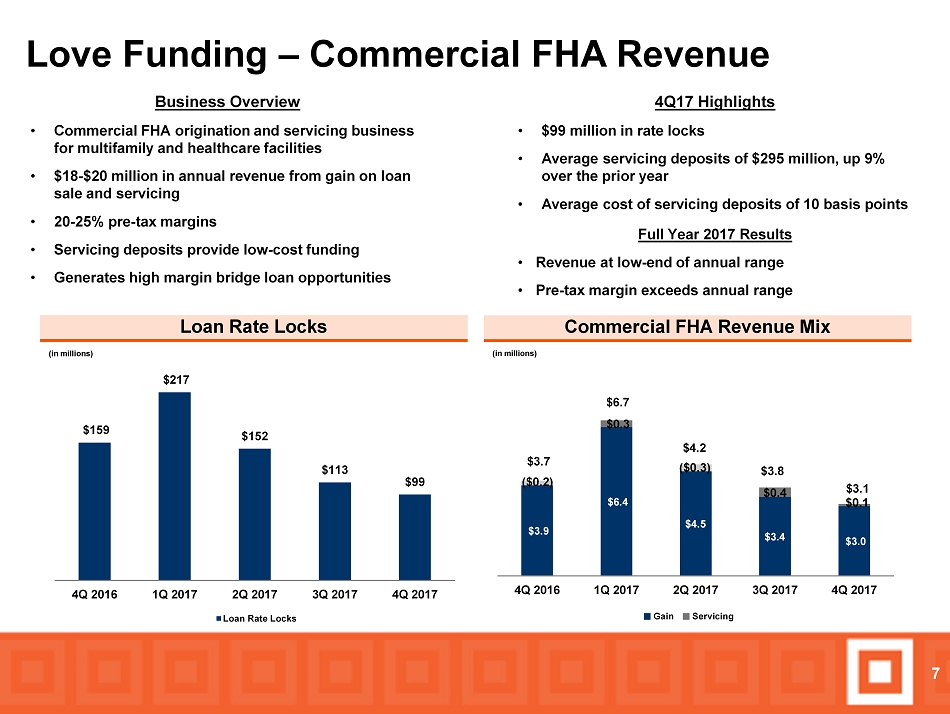
$3.9 $6.4 $4.5 $3.4 $3.0 $0.3 $0.1 $3.7 $6.7 $4.2 $3.8 $3.1 4Q 2016 1Q 2017 2Q 2017 3Q 2017 4Q 2017 Gain Servicing $0.4 $159 $217 $152 $113 $99 4Q 2016 1Q 2017 2Q 2017 3Q 2017 4Q 2017 Loan Rate Locks Business Overview • Commercial FHA origination and servicing business for multifamily and healthcare facilities • $18 - $20 million in annual revenue from gain on loan sale and servicing • 20 - 25% pre - tax margins • Servicing deposits provide low - cost funding • Generates high margin bridge loan opportunities Love Funding – Commercial FHA Revenue Commercial FHA Revenue Mix 7 Loan Rate Locks (in millions) (in millions) 4Q17 Highlights • $99 million in rate locks • Average servicing deposits of $295 million, up 9% over the prior year • Average cost of servicing deposits of 10 basis points Full Year 2017 Results • Revenue at low - end of annual range • Pre - tax margin exceeds annual range ($0.3) ($0.2)
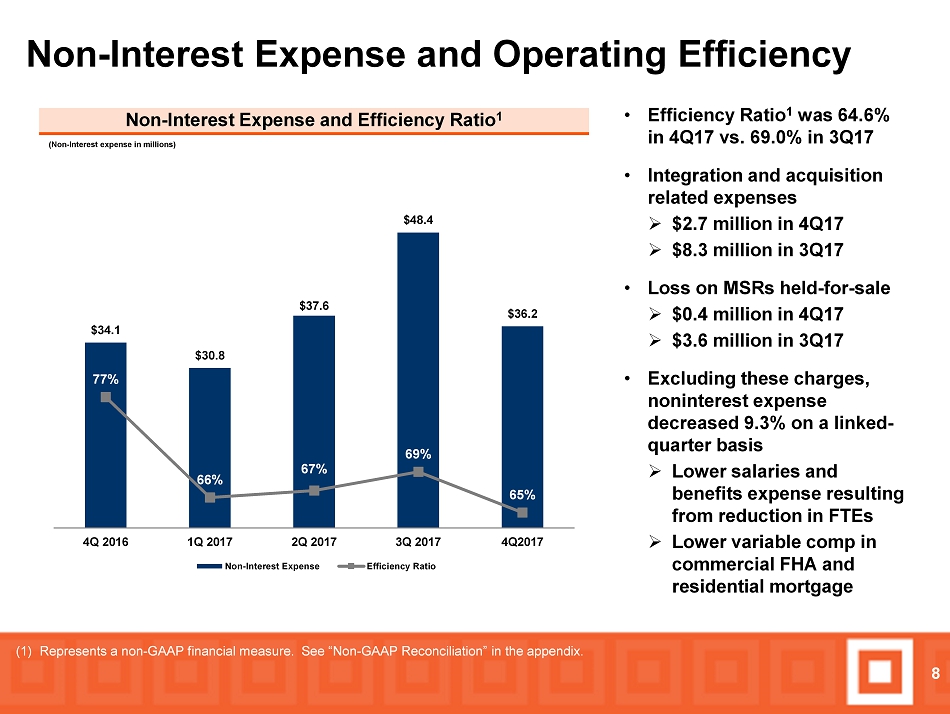
Non - Interest Expense and Operating Efficiency 8 • Efficiency Ratio 1 was 64.6% in 4Q17 vs. 69.0% in 3Q17 • Integration and acquisition related expenses » $2.7 million in 4Q17 » $8.3 million in 3Q17 • Loss on MSRs held - for - sale » $0.4 million in 4Q17 » $3.6 million in 3Q17 • Excluding these charges, noninterest expense decreased 9.3% on a linked - quarter basis » Lower salaries and benefits expense resulting from reduction in FTEs » Lower variable comp in commercial FHA and residential mortgage Non - Interest Expense and Efficiency Ratio 1 (Non - Interest expense in millions) $34.1 $30.8 $37.6 $48.4 $36.2 77% 66% 67% 69% 65% 4Q 2016 1Q 2017 2Q 2017 3Q 2017 4Q2017 Non-Interest Expense Efficiency Ratio (1) Represents a non - GAAP financial measure. See “Non - GAAP Reconciliation” in the appendix.
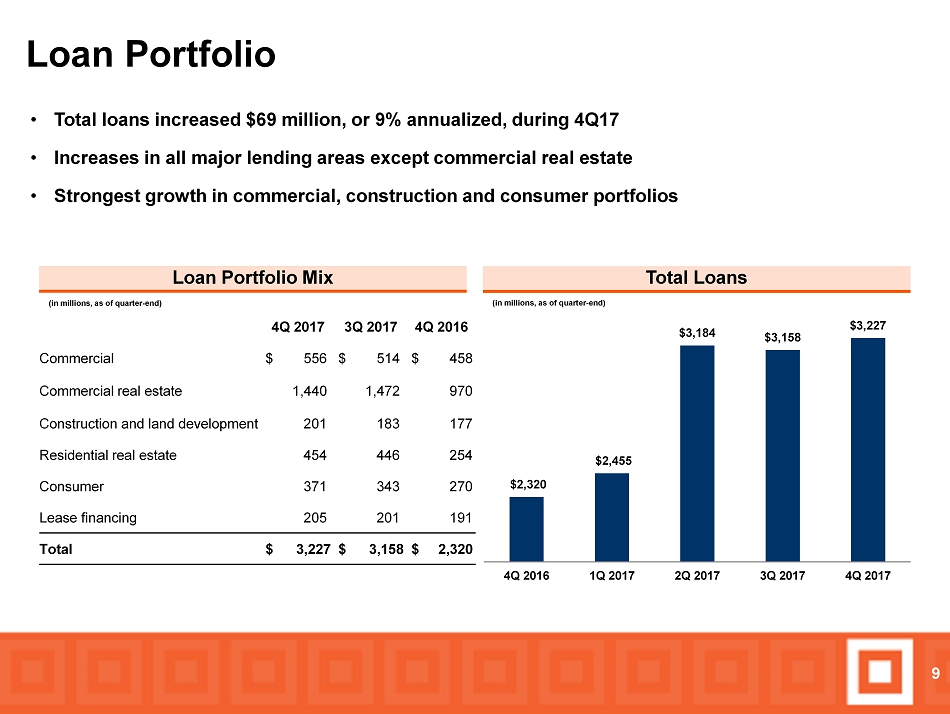
Loan Portfolio Total Loans 9 • Total loans increased $69 million, or 9% annualized, during 4Q17 • Increases in all major lending areas except commercial real estate • Strongest growth in commercial, construction and consumer portfolios Loan Portfolio Mix (in millions, as of quarter - end) (in millions, as of quarter - end) 4Q 2017 3Q 2017 4Q 2016 Commercial $ 556 $ 514 $ 458 Commercial real estate 1,440 1,472 970 Construction and land development 201 183 177 Residential real estate 454 446 254 Consumer 371 343 270 Lease financing 205 201 191 Total $ 3,227 $ 3,158 $ 2,320 $2,320 $2,455 $3,184 $3,158 $3,227 4Q 2016 1Q 2017 2Q 2017 3Q 2017 4Q 2017
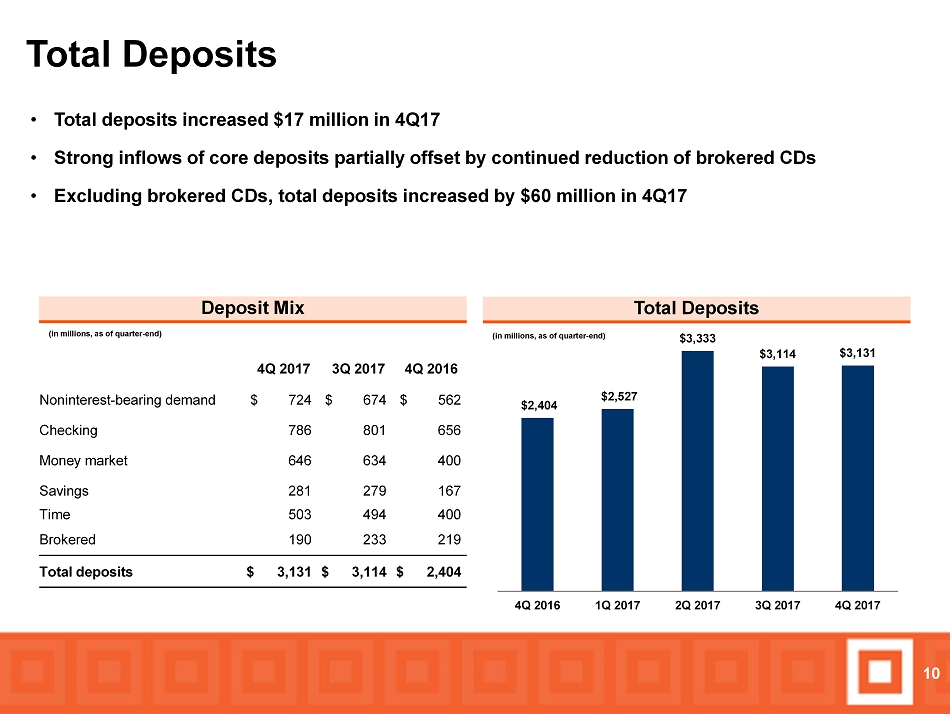
Total Deposits Total Deposits 10 • Total deposits increased $17 million in 4Q17 • Strong inflows of core deposits partially offset by continued reduction of brokered CDs • Excluding brokered CDs, total deposits increased by $60 million in 4Q17 Deposit Mix (in millions, as of quarter - end) (in millions, as of quarter - end) 4Q 2017 3Q 2017 4Q 2016 Noninterest - bearing demand $ 724 $ 674 $ 562 Checking 786 801 656 Money market 646 634 400 Savings 281 279 167 Time 503 494 400 Brokered 190 233 219 Total deposits $ 3,131 $ 3,114 $ 2,404 $2,404 $2,527 $3,333 $3,114 $3,131 4Q 2016 1Q 2017 2Q 2017 3Q 2017 4Q 2017
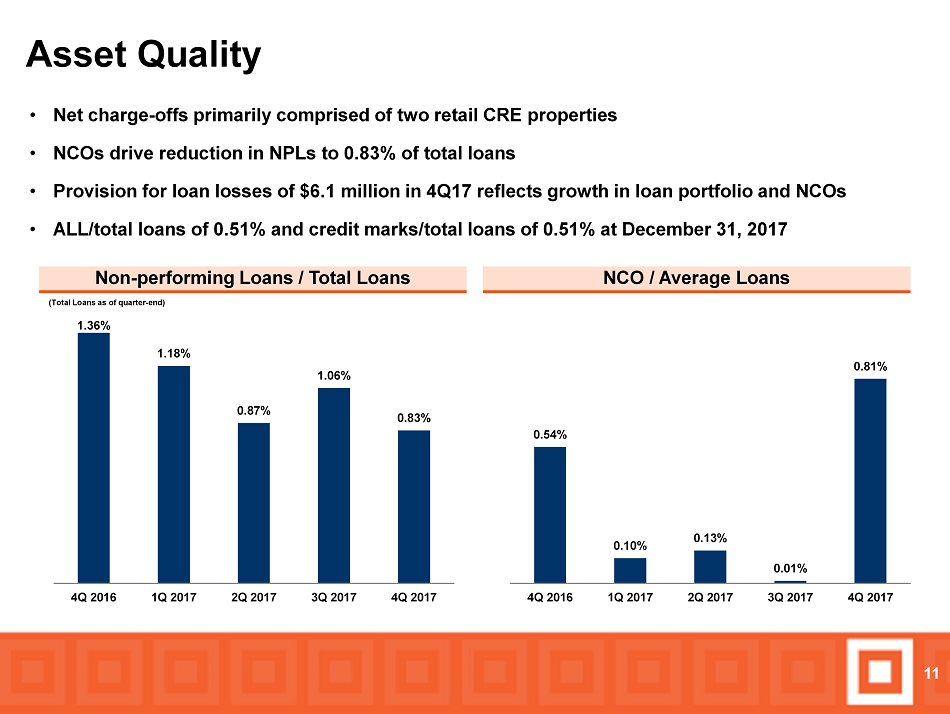
Asset Quality NCO / Average Loans 11 • Net charge - offs primarily comprised of two retail CRE properties • NCOs drive reduction in NPLs to 0.83% of total loans • Provision for loan losses of $6.1 million in 4Q17 reflects growth in loan portfolio and NCOs • ALL/total loans of 0.51% and credit marks/total loans of 0.51% at December 31, 2017 Non - performing Loans / Total Loans (Total Loans as of quarter - end) 1.36% 1.18% 0.87% 1.06% 0.83% 4Q 2016 1Q 2017 2Q 2017 3Q 2017 4Q 2017 0.54% 0.10% 0.13% 0.01% 0.81% 4Q 2016 1Q 2017 2Q 2017 3Q 2017 4Q 2017
Outlook • Alpine acquisition expected to close by end of February 2018 • 2018 will see a significant shift in Midland’s business mix » Core community banking and wealth management becoming larger percentage of revenue mix » Commercial FHA and residential mortgage businesses becoming lower percentage of revenue mix • Increasing scale expected to drive improvement in efficiency ratio • Expanding equipment finance business • Lower effective tax rate: 23% projected for 2018 • Priorities for use of capital generated from lower tax rate » Rebuild capital base following closing of Alpine acquisition » Continue 15 - year track record of increasing dividend by at least 10% annually 12

APPENDIX
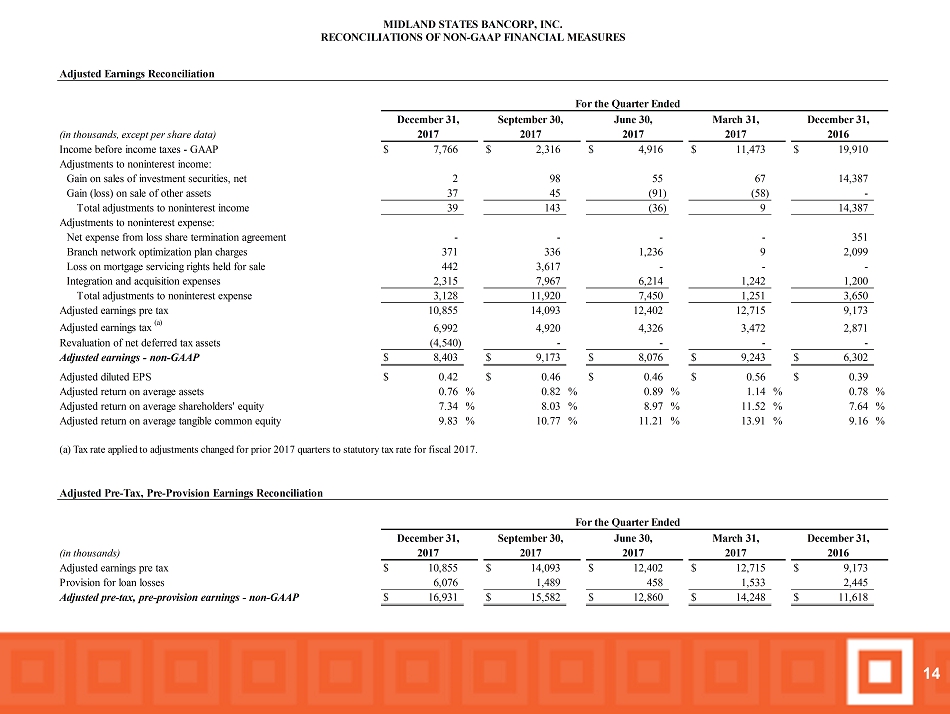
14 Adjusted Earnings Reconciliation (in thousands, except per share data) Income before income taxes - GAAP $ 7,766 $ 2,316 $ 4,916 $ 11,473 $ 19,910 Adjustments to noninterest income: Gain on sales of investment securities, net 2 98 55 67 14,387 Gain (loss) on sale of other assets 37 45 (91) (58) - Total adjustments to noninterest income 39 143 (36) 9 14,387 Adjustments to noninterest expense: Net expense from loss share termination agreement - - - - 351 Branch network optimization plan charges 371 336 1,236 9 2,099 Loss on mortgage servicing rights held for sale 442 3,617 - - - Integration and acquisition expenses 2,315 7,967 6,214 1,242 1,200 Total adjustments to noninterest expense 3,128 11,920 7,450 1,251 3,650 Adjusted earnings pre tax 10,855 14,093 12,402 12,715 9,173 Adjusted earnings tax (a) 6,992 4,920 4,326 3,472 2,871 Revaluation of net deferred tax assets (4,540) - - - - Adjusted earnings - non-GAAP $ 8,403 $ 9,173 $ 8,076 $ 9,243 $ 6,302 Adjusted diluted EPS $ 0.42 $ 0.46 $ 0.46 $ 0.56 $ 0.39 Adjusted return on average assets 0.76 % 0.82 % 0.89 % 1.14 % 0.78 % Adjusted return on average shareholders' equity 7.34 % 8.03 % 8.97 % 11.52 % 7.64 % Adjusted return on average tangible common equity 9.83 % 10.77 % 11.21 % 13.91 % 9.16 % (a) Tax rate applied to adjustments changed for prior 2017 quarters to statutory tax rate for fiscal 2017. Adjusted Pre-Tax, Pre-Provision Earnings Reconciliation (in thousands) Adjusted earnings pre tax $ 10,855 $ 14,093 $ 12,402 $ 12,715 $ 9,173 Provision for loan losses 6,076 1,489 458 1,533 2,445 Adjusted pre-tax, pre-provision earnings - non-GAAP $ 16,931 $ 15,582 $ 12,860 $ 14,248 $ 11,618 2017 2017 2017 2017 2016 December 31, September 30, June 30, March 31, December 31, MIDLAND STATES BANCORP, INC. RECONCILIATIONS OF NON-GAAP FINANCIAL MEASURES For the Quarter Ended For the Quarter Ended December 31, September 30, June 30, March 31, December 31, 2017 2017 2017 2017 2016
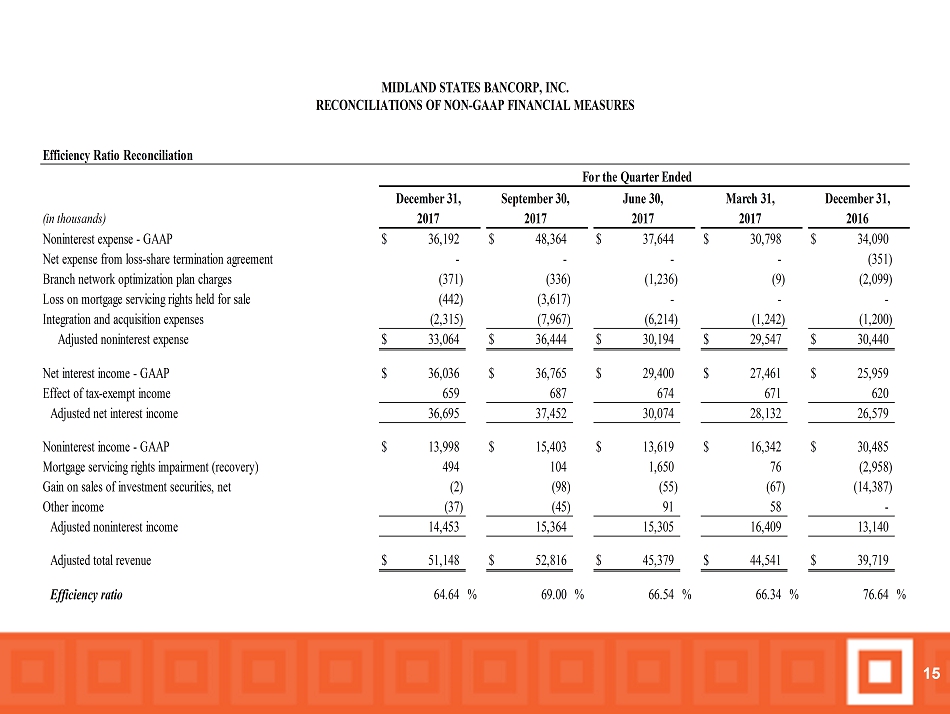
15 Efficiency Ratio Reconciliation (in thousands) Noninterest expense - GAAP $ 36,192 $ 48,364 $ 37,644 $ 30,798 $ 34,090 Net expense from loss-share termination agreement - - - - (351) Branch network optimization plan charges (371) (336) (1,236) (9) (2,099) Loss on mortgage servicing rights held for sale (442) (3,617) - - - Integration and acquisition expenses (2,315) (7,967) (6,214) (1,242) (1,200) Adjusted noninterest expense $ 33,064 $ 36,444 $ 30,194 $ 29,547 $ 30,440 Net interest income - GAAP $ 36,036 $ 36,765 $ 29,400 $ 27,461 $ 25,959 Effect of tax-exempt income 659 687 674 671 620 Adjusted net interest income 36,695 37,452 30,074 28,132 26,579 Noninterest income - GAAP $ 13,998 $ 15,403 $ 13,619 $ 16,342 $ 30,485 Mortgage servicing rights impairment (recovery) 494 104 1,650 76 (2,958) Gain on sales of investment securities, net (2) (98) (55) (67) (14,387) Other income (37) (45) 91 58 - Adjusted noninterest income 14,453 15,364 15,305 16,409 13,140 Adjusted total revenue $ 51,148 $ 52,816 $ 45,379 $ 44,541 $ 39,719 Efficiency ratio 64.64 % 69.00 % 66.54 % 66.34 % 76.64 % MIDLAND STATES BANCORP, INC. RECONCILIATIONS OF NON-GAAP FINANCIAL MEASURES For the Quarter Ended 2017 2017 2017 2017 2016 December 31, September 30, June 30, March 31, December 31,
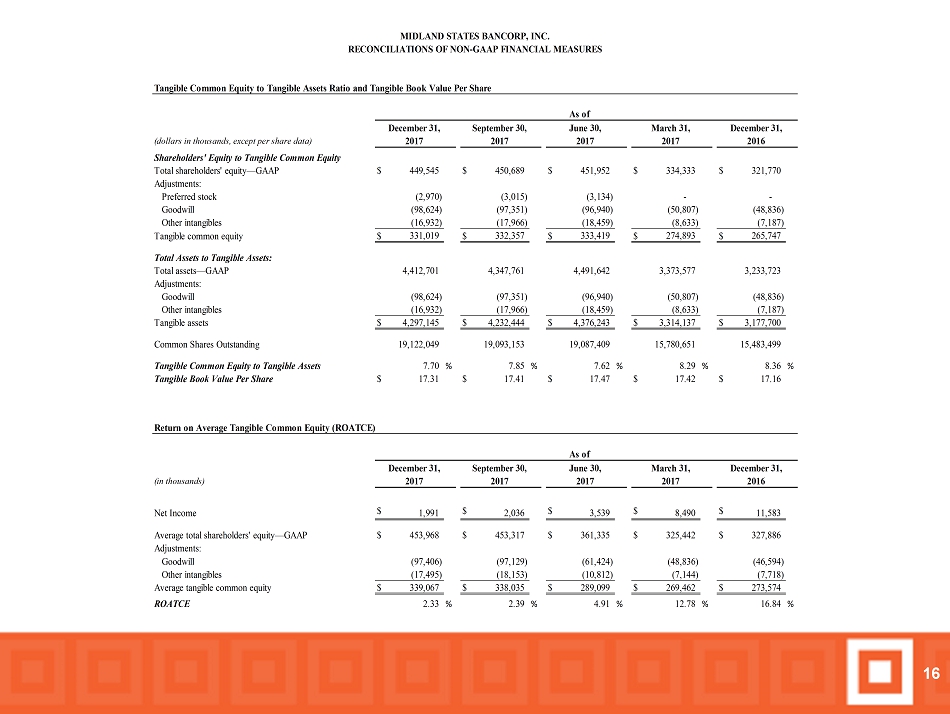
16 Tangible Common Equity to Tangible Assets Ratio and Tangible Book Value Per Share (dollars in thousands, except per share data) Shareholders' Equity to Tangible Common Equity Total shareholders' equity—GAAP $ 449,545 $ 450,689 $ 451,952 $ 334,333 $ 321,770 Adjustments: Preferred stock (2,970) (3,015) (3,134) - - Goodwill (98,624) (97,351) (96,940) (50,807) (48,836) Other intangibles (16,932) (17,966) (18,459) (8,633) (7,187) Tangible common equity $ 331,019 $ 332,357 $ 333,419 $ 274,893 $ 265,747 Total Assets to Tangible Assets: Total assets—GAAP 4,412,701 4,347,761 4,491,642 3,373,577 3,233,723 Adjustments: Goodwill (98,624) (97,351) (96,940) (50,807) (48,836) Other intangibles (16,932) (17,966) (18,459) (8,633) (7,187) Tangible assets $ 4,297,145 $ 4,232,444 $ 4,376,243 $ 3,314,137 $ 3,177,700 Common Shares Outstanding 19,122,049 19,093,153 19,087,409 15,780,651 15,483,499 Tangible Common Equity to Tangible Assets 7.70 % 7.85 % 7.62 % 8.29 % 8.36 % Tangible Book Value Per Share $ 17.31 $ 17.41 $ 17.47 $ 17.42 $ 17.16 Return on Average Tangible Common Equity (ROATCE) (in thousands) Net Income $ 1,991 $ 2,036 $ 3,539 $ 8,490 $ 11,583 Average total shareholders' equity—GAAP $ 453,968 $ 453,317 $ 361,335 $ 325,442 $ 327,886 Adjustments: Goodwill (97,406) (97,129) (61,424) (48,836) (46,594) Other intangibles (17,495) (18,153) (10,812) (7,144) (7,718) Average tangible common equity $ 339,067 $ 338,035 $ 289,099 $ 269,462 $ 273,574 ROATCE 2.33 % 2.39 % 4.91 % 12.78 % 16.84 % 2017 2017 2017 2017 2016 As of December 31, September 30, June 30, March 31, December 31, 2017 2017 2017 2017 2016 MIDLAND STATES BANCORP, INC. RECONCILIATIONS OF NON-GAAP FINANCIAL MEASURES As of December 31, September 30, June 30, March 31, December 31,