Attached files
| file | filename |
|---|---|
| 8-K - 8-K - BILL BARRETT CORP | bbg-01222018x8k.htm |
Corporate Update
January 2018

NYSE: BBG www.billbarrettcorp.com 2
Forward-Looking & Other Cautionary Statements
• Please reference the appendix at the end of this
presentation for important disclosures on:
Forward-looking statements
Non-GAAP measures
Reserves

Transaction Highlights
Creates Leading DJ Basin Pure Play Focused on Rural, Oily Portion of Basin
Highlights
3
Leading Pure Play Asset Base
Fifth Creek Acreage
BBG Acreage
Chalk Bluffs
~5,700 net acres
353 gross locations
Hereford Field
~81,000 net acres
1,179 gross locations
Robust operating performance drives basin leading operating margins
~151,100 largely contiguous net acres primed for XRL development
Decades of drilling inventory – 2,865 gross undeveloped total locations with a
65% weighted average IRR at NYMEX strip(1)
Liquids-rich production base of ~24 MBoe/d (81% liquids, 64% oil)(2)
NE Wattenberg
~64,400 net acres
1,333 gross locations
Strong balance sheet to fund development and opportunistically pursue additional M&A
(1) NYMEX strip pricing as of 11/24/2017
(2) Includes 2 Mboe/d of production associated with Uinta Basin asset divestiture that closed December 29, 2017
• Strategic combination with Fifth Creek Energy (“Fifth Creek”)
materially expands DJ Basin footprint
~81,000 net acres in Hereford Field in rural northern Weld
County, Colorado
100% operated with high working interest
Proved reserves of 113 MMBoe (75% oil)
2.9 MBoe/d of Q3 2017 net production (72% oil)
• De-risked position offsetting prolific EOG Fairway Field with
strong, multi-bench results
>310 ft of stacked pay with 2 producing horizontal zones
Extensive well control (62 producing SRLs and 7 producing
XRLs) and extensive 3D seismic result in low risk
development
Seven XRLs completed in 2017 with avg. IP30 of 1,052 Boe/d
(84% oil) (two-stream basis)
• Contiguous acreage block provides decades of highly economic
Niobrara and Codell drilling inventory
1,179 gross drilling locations across primary targets of
Niobrara B and Codell; conducive to XRL development
Further upside from de-risking of additional Niobrara
benches and downspacing opportunities
>80% weighted average IRR at NYMEX strip(1)
• Existing infrastructure supports development
• Largely undeveloped nature allows BBG to immediately apply
established execution skillset and best-in-class cost structure
• Strong pro forma balance sheet underpinned by significant cash
position, significant liquidity and improved credit metrics
Exchanged $50 mm of 7% Notes for common stock and a
completed $116 mm common stock offering

Transaction Overview
4
• Unanimously approved by both boards
• BBG shareholder approval required
• Regulatory and other customary approvals
• Closing expected in late Q1 or early Q2 2018
• NGP locked up for 90 days post closing
Key Conditions
and Timing
• 100 mm shares to be issued to Fifth Creek
• Combined company initial equity value in excess of
$1.0 billion
• BBG Unsecured Notes will be left outstanding
Transaction Terms
• ~81,000 net acres in Weld County
• Q3 2017 net production of 2,898 Boe/d (72% oil)
• YE 2016 proved reserves of 113 MMBoe (75% oil)
• 1,179 gross undeveloped locations
• 3 wells being completed and 9 wells waiting on
completion
Key Asset
Information
• Attractive entry price with adjusted $/net acre of
~$6,900/acre (PDP valued at $30,000 Boe/d)
• Transaction is accretive to BBG NAV at current NYMEX
strip(1)
Valuation Metrics
• Scot Woodall will serve as CEO and President of the
combined company
• Current board will be increased by five Fifth Creek
nominated directors; Jim W. Mogg will continue to
serve as Chairman
Management and
Governance
Fifth Creek Offset Operators
Weld
(1) NYMEX strip pricing as of 11/24/2017.
Laramie

Strategic Rationale
5
• Applying BBG’s leading cost structure and operational momentum to the Fifth Creek asset base will drive
significantly enhanced economic returns to shareholders
• Transfer of on-going completions optimization & flow back strategy presents substantial upside to resource
potential and return profile
Delivers
Meaningful
Operating
Efficiencies
• Merger consistent with strategic focus on high-quality, low-risk oil-weighted properties in the DJ Basin
• Continues preference for rural, open space assets that allow for XRL development
• Dramatically increases scale with 70% increase in gross undeveloped drilling locations
• Provides drill-ready opportunity to drive long-term cash flow growth
• High-quality asset base to be led by BBG team with established execution track record and peer-leading
operating margins of $28.35 per Boe(1)
Strategic Fit
• Combined acreage position of 151,100 net acres
• 2,865 gross undeveloped locations (~95% XRL) across combined position
• Undeveloped inventory represents decades of operated drilling inventory
• Strong economics across the portfolio with a 65% weighted average IRR at NYMEX strip(2)
Creates Leading DJ
Basin Pure Play with
Robust Inventory
• Credit accretive transaction with pro forma BBG having modest leverage at close and improving metrics
going forward with substantially larger scale
• Significant liquidity to internally fund development program and 2018 anticipated capital plan
• Attractive debt maturity profile with nearest note maturity not until 2022
• Debt exchange and equity offering further strengthens capital structure
Strengthens
Balance Sheet
(1) Based on company filings and calculated for the third quarter 2017 results. Peers include: BCEI, PDCE, SRCI, XOG
(2) NYMEX strip pricing as of 11/24/2017

Successfully Increases Scale & Value
6
Q3 2017 Production (MBoe/d)
Net Location Count-Indicative
Economics NYMEX Strip Price Deck(3)
YE 2016 Proved Reserves (MMBoe)(1)DJ Basin Net Acres
Gross Undeveloped Locations
+112% +14% +206%
+70%
(1) Proved reserves at YE16 for Bill Barrett Corporation include 12 MMBoe associated with the Uinta Basin and Fifth Creek YE16 proved reserves are comprised of 97% PUD reserves (both reviewed by NSAI)
(2) Includes 2 Mboe/d of production associated with Uinta Basin asset divestiture that closed December 29, 2017
(3) NYMEX strip pricing as of 11/24/2017
(4) BBG XRL location base indicative well economics
(1) f
(2) d
(3) D
(1) d
(2) N
(3) I
(4) s

Pro Forma Capitalization
Improved Leverage & Ample Liquidity to Fund High-Return Development Plan
7
Overview of Announced Financings
• Uinta sale announced in November 2017 for proceeds
of $110 million, closed on December 29, 2017
• Raised $116 million of gross proceeds through sale of
common stock (including overallotment)
• Reduced long term debt by $50 million in a private
exchange of common stock for 7% Senior Notes due
2022
Pro Forma Financial Profile
• Undrawn BBG credit facility with borrowing base of
$300 million
No anticipated need to draw on revolver in 2018
Borrowing base was reaffirmed during Fall redetermination;
no impact from UOP sale
Expect to launch a new combined credit facility at or before
close with Fifth Creek reserves
• Strong liquidity at close to fund development
Uinta Basin divestiture
Equity raise pre funds majority of anticipated 2018/2019
activity
Pro Forma Capitalization (Excludes Fifth Creek Assumed Debt)
Note: Pro forma for BBG stand-along financing activities
Market Cap (1) ~$580 million
Enterprise Value (1) ~$890 million
1 Based on closing stock price as of January 19, 2018, pro forma for financing transactions, projected YE2017
net debt and excluding 100 mm shares to be issued to Fifth Creek at closing of acquisition
($ in millions) BBG @ 9/30/2017 Financings PF BBG @ 9/30/2017
Cash $156 $219 $375
RCF Borrowings - - -
Unsecured Debt 675 (50) 625
Lease Financing Obligation 2 - 2
Total Debt $677 ($50) $627
Net Debt $522 ($257) $252
Borrowing Base $300 $0 $300
Letters of Credit 26 - 26
Revolver Availability 274 - 274
Liquidity 430 219 649

NYSE: BBG www.billbarrettcorp.com 8
Credit Accretive Transaction
• Significant debt reduction accomplished
in challenging commodity price
environment
Completed April 2017 debt offering that
reduced gross debt by 6%
Completed December 2017 debt exchange
that reduced gross debt by 7%
• No near term debt maturities
Nearest note maturity not until 2022
• Improving leverage metrics
• Expect to achieve strategic objective of
<1.5x net debt to EBITDAX in 2019
Track Record of Debt Reduction
2.5 2.4
1.5–2.0
Net Debt / EBITDAX
1.5–2.0
1.0–1.5

Fifth Creek Acreage
Complementary Rural Position
9
Combined acreage position is rural in nature with no urban exposure or associated development complexities
Operate in
rural area of
DJ Basin
Favorable
Regulatory
Environment
Controllable and
efficient
development
Rural PositioningFavorable Development Setting
Less Dense
< 340k sq. mile
More Dense
> 3.8mm sq. mile
Population Density
Laramie
BBG Acreage
Source: U.S. Census Bureau; 2010 Census

Fifth Creek Acreage Position
10
Significant Well ControlHereford Field Meets All Key Geologic Criteria
Silo Field
Fairway
Field
Hereford
Field
DJ Geothermal Gradient Map
WYO
CO
• Hereford Field is where the horizontal Niobrara play
kicked off with the “Jake well” in 2009
• Fifth Creek position lies in favorable Thermal Maturity
fairway for the Niobrara/Codell petroleum system
• Optimal GOR with 78% crude oil
• HBP Acreage & Proven Production: 2009 to 2012
drilling included 58 Niobrara, 1 Codell and 1
Greenhorn horizontal well
• Early vintage Niobrara wells in Hereford Field have
outperformed similar vintage wells in the Fairway
Field area to the north
• Fifth Creek 2017 drilling program results are
comparable with EOG Fairway Results
Enhanced Maturity
& High Niobrara
Resistivity Fairway
*Only drilled horizontal wells shown
Jake
Well
Fifth Creek
Position
Source: COGCC and WOGCC

Primary Targets Consistent Across Acreage
11Source: COGCC and WOGCC
• Consistent geology from Colorado Hereford Field to Wyoming Fairway Field
• Continuity and consistency of primary targets across acreage position
Niobrara B bench thickness range = 100’ to 120’
Codell thickness range = 17’ to 23’
• BBG Talmadge core well on north edge of position: 317 ft of Niobrara & Codell core analyzed with
data tied to Petrophysical evaluation
Petrophysical analysis confirms pay and resource in place
• Seismic coverage: ~143 square miles of 3D covering majority of acreage block
W
E
BBC Talmadge
Core Well

Strong Well Results Validate Hereford Field Position
Initial Well Performance Ranks Among the Best in the DJ Basin
12
Legend
Operators
Fifth Creek Acreage
HRM
EOG
Fifth Creek
Niobrara well
Codell well
Critter Creek 278-1527H (Sep-2017)
IP30: 1,249 Boe/d | 73% Oil
Target: Niobrara | LL: 9,797’
20Jubilee 154-1034H (Aug-2014)
IP30: 1,032 Boe/d | 90% Oil
Target: Niobrara | LL: 9,838’
1
1 3
Jubilee 153-1034H (Aug-2014)
IP30: 710 Boe/d | 90% Oil
Target: Niobrara | LL: 9,051’
2
2
Jubilee 151-1034H (Aug-2014)
IP30: 792 Boe/d | 91% Oil
Target: Niobrara | LL: 9,837’
3
4
Bull Canyon 508-0607H (Dec-2014)
IP30: 1,004 Boe/d | 88% Oil
Target: Codell | LL: 8,503’
12
5
Windy 508-1806H (Nov-2014)
IP30: 1,133 Boe/d | 91% Oil
Target: Codell | LL: 9,132’
4
6
Windy 573-1720H (Jul-2015)
IP30: 1,086 Boe/d | 81% Oil
Target: Codell | LL: 8,468’
6
7
Jubilee 604-2425H (Mar-2016)
IP30: 1,062 Boe/d | 91% Oil
Target: Codell | LL: 9,006’
7
8
Jubilee 529-2227H (Sep-2014)
IP30: 1,109 Boe/d | 90% Oil
Target: Codell | LL: 8,651’
8
9 10
Jubilee 143-3601H (Oct-2017)
IP30: 1,075 Boe/d | 97% Oil
Target: Codell | LL: 8,900’
10
11
Jubilee 546-3601H(Oct-2017)
IP30: 1,080 Boe/d | 93% Oil
Target: Codell | LL: 9,500’
11
Jubilee 541-3502H (Apr-2016)
IP30: 1,080 Boe/d | 91% Oil
Target: Codell | LL: 9,039’
9
12
Windy 01-18H (Mar-2013)
IP30: 394 Boe/d | 90% Oil
Target: Niobrara | LL: 3,533’
5
13
Cushing 24-8H (Mar-2012)
IP30: 647 Boe/d | 95% Oil
Target: Niobrara | LL: 3,886’
13
14
Fox Creek 222-3422H (Mar-2017)
IP30: 1,089 Boe/d | 88% Oil
Target: Niobrara | LL: 9,100’
14
Fox Creek 504-2524H (Mar-2017)
IP30: 847 Boe/d | 88% Oil
Target: Codell | LL: 9,186’
15
16
15
Critter Creek 512-1510H (Sep-2017)
IP30: 1,086 Boe/d | 87% Oil
Target: Codell | LL: 10,129’
1618
Fox Creek 505-2501H (May-2017)
IP30: 1,017 Boe/d | 84% Oil
Target: Codell | LL: 9,954’
18
19
Critter Creek 562-1527H (Sep-2017)
IP30: 1,348 Boe/d | 83% Oil
Target: Codell | LL: 9,822’
19
20
Fox Creek 501-3403H (Jan-2017)
IP30: 730 Boe/d | 88% Oil
Target: Codell | LL: 8,902’
17
17
Note: IP30 rates show above calculated on two-stream basis
Laramie
Weld

Fifth Creek Undeveloped Well Economics
Deep Inventory of High Return Niobrara & Codell Locations
13(1) NYMEX strip pricing as of 11/24/2017
(2) WTI price required for a 10% pre-tax, pre-G&A IRR assuming a 20:1 oil to gas price ratio.
Fifth Creek XRL (9,500') Illustrative Economics
Niobrara Codell
2-Phase EUR (MBoe) 400 - 475 475 - 575
% Oil 78% 78%
D&C ($mm) $5.1 $5.1
IRR @ NYMEX Strip(1) 59% - 98% 56% - 86%
NPV10 @ NYMEX Strip ($mm) $3.0 - $4.7 $3.9 - $5.7
Payout (Months) 11 13
Breakeven Oil Price ($/Bbl)(2) $35 - $40 $30 - $40
Gross Proved Undeveloped Locations 739 440
Net Proved Undeveloped Locations 487 289

$8.25
$6.25
$4.75 $4.75
2014 2015 2016 2017
Efficiencies offset
cost of enhanced
completions
Implement Development Efficiencies
14
Hereford Field Development Plan
• Initiate full DSU development
• Drill 100% XRL wells (~9,500’ lateral
length)
Replicate cost efficiencies currently
being realized in NE Wattenberg
Achieve similar operational cycle times
• Optimize lateral spacing
Develop both Niobrara and Codell
formations
• Implement enhanced completions
1,500 – 2,000 pounds of sand per
lateral foot
Reduce frac stage spacing with 80-90
stages per lateral
Implement enhanced flowback process
BBG NE Wattenberg XRL D&C Cost ($mm)
BBG NE Wattenberg Combined Cycle Time (Days)
0
5
10
15
20
25
30
35
40
2014 2015 2016 2017
Drill Days Frac Days Drill Out Days

DJ Basin Infrastructure
15
• Addition of Saddlehorn / Grand Mesa oil pipeline in 2016 significantly increased takeaway capacity to ~650 MBbls/d(1)
DJ Basin oil production currently in excess of 350 MBbls/d(1)
Local refineries and rail provide additional outlets
• Current infrastructure provides multiple outlets out of the basin
• BBG benefits from having no firm marketing commitments and favorable API
gravity crude
Acreage position near all pipelines to provide optionality
• Q3 2017 differential averaged $2.06/Bbl
79% improvement in oil differentials since 2015
• Executed agreement for additional gas processing capacity
DJ Basin Infrastructure / NE Wattenburg
• No long-term crude contracts or minimum volume commitments
Current oil differential of $2.20/Bbl
• Gas gathering and processing with Summit Midstream (20 MMcf/d current capacity)
In November 2017, Summit announced an expansion of its Northern Weld County process complex with a new 60 MMcf/d
processing plant that is expected to be placed online by year-end 2018
Modest minimum volume commitments associated with Summit Midstream
Line pressures are contractually obligated at less than 50 psig
Fifth Creek Midstream Overview
Bill Barrett Midstream Overview
(1) COGCC and company estimates

Natural Gas
~20%
NGLs
~15%
Crude
~65%
Preliminary 2018 Outlook
16
2018E Production Mix
• Drilling and Completion Capital
Anticipate operating 3 rigs in 2018
2018E capital expenditures of $500 – $600 mm
Capital will be allocated to the highest return inventory
across the combined position
High degree of operational control and proximity of
acreage blocks provides ability to opportunistically
adjust capital deployment
• Production
Net sales production of 11 – 12 MMBoe (~65% oil)
• Actively manage hedge portfolio to support capital
program, protect future cash flow and reduce
commodity price risk
• Formal 2018 guidance anticipated to be issued
post the closing of the Fifth Creek transaction
• 2018 activity to be internally funded through a
combination of cash on hand and cash flow from
operations
Note: 2017 guidance reflects updated guidance as issued by BBG on 10/31/2017, the 2018 preliminary plans assumes full-year outlooks for each company, formal 2018 guidance is anticipated to be issued following the
closing of the transaction
Net Sales Production (MMBoe)
Value Proposition to BBG Shareholders
NYSE: BBG www.billbarrettcorp.com 17
• Combination creates leading DJ Basin pure-play with high-quality, oily, rural acreage that is
consistent with strategic focus
• Unique opportunity to add a large, undeveloped acreage position at an attractive cost that is highly
complementary to our legacy acreage
• Visibility into decades of development drilling – 70% increase to 2,865 gross undeveloped locations
with strong weighted average IRR of 65%
• Contiguous acreage position and operational control allows for returns-focused capital allocation
flexibility
• Ability to immediately transfer superior execution skills and operational expertise through
enhanced completion and flowback techniques to deliver peer-leading margins of $28.35 per boe
• Credit accretive transaction with pro forma BBG having modest leverage at close and improving
metrics going forward with substantially larger scale
• Balance sheet strength highlighted by improving leverage metrics, no near-term debt maturities
and strong liquidity to fund development

Appendix
Bill Barrett Corporation Overview
NYSE: BBG www.billbarrettcorp.com 19
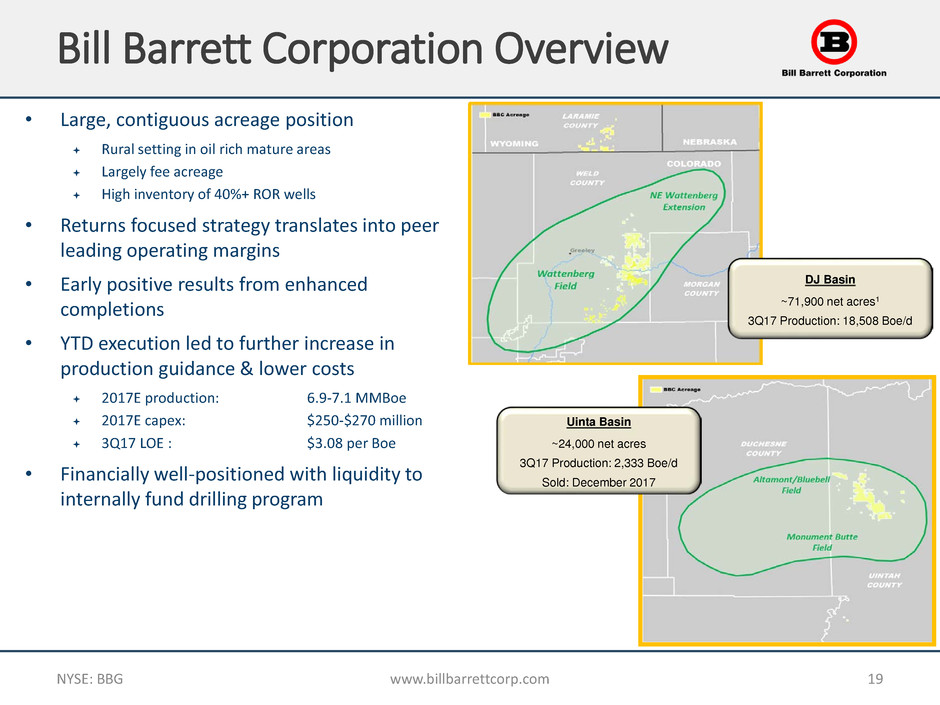
• Large, contiguous acreage position
Rural setting in oil rich mature areas
Largely fee acreage
High inventory of 40%+ ROR wells
• Returns focused strategy translates into peer
leading operating margins
• Early positive results from enhanced
completions
• YTD execution led to further increase in
production guidance & lower costs
2017E production: 6.9-7.1 MMBoe
2017E capex: $250-$270 million
3Q17 LOE : $3.08 per Boe
• Financially well-positioned with liquidity to
internally fund drilling program
DJ Basin
~71,900 net acres1
3Q17 Production: 18,508 Boe/d
Uinta Basin
~24,000 net acres
3Q17 Production: 2,333 Boe/d
Sold: December 2017

Key Messages
NYSE: BBG www.billbarrettcorp.com 20
• Demonstrated execution of focused operational and financial strategy
Delivering solid results with basin leading margins
Exceeding growth and cost targets that translates into second positive guidance revision
• NE Wattenberg located in rural setting that is favorable for oil development
~44% rate of return at wellhead assuming base assumptions
• Have the capital resources to facilitate growth strategy
Cash position of ~$300 million at December 31, 2017 plus $300 million undrawn credit facility
UOP asset sale cash proceeds of $110 million
Gross proceeds of $116 million associated with recent sale of stock
Anticipated 2018 capital program is pre-funded with no need to draw on revolver
• Delivering continued improvement across corporate structure in 3Q17
LOE of $3.08 per Boe, represents 15% q/q improvement
DJ Basin LOE of $2.52 per Boe, represents 18% q/q improvement
DJ Basin oil price differential narrowed to $2.06 per barrel
• Returns focused capital program underpins continued improvement in
leverage ratio
2017 activity expected to deliver 2018 production growth in excess of 30% on legacy assets
Expect year-end 2017 net debt to EBITDAX of ~2.0x, pro forma for UOP asset sale and equity offering
3Q17 Achievements
NYSE: BBG www.billbarrettcorp.com 21
Production of 1.92 MMBoe, 26% sequential growth
Exceeded guidance by 10% with oil volumes growing 33% sequentially
4Q17 production expected to grow ~10% sequentially
Corporate oil price differential narrowed to $2.12 per barrel
DJ Basin differential improves to a basin leading $2.06 per barrel
Benefit from having no long-term oil marketing agreements
Delivering continued cost improvement with LOE of $3.08 per Boe
DJ Basin LOE of $2.52 per Boe, represents 18% sequential improvement
D&C cycle times have improved 28% compared to 2016
37% improvement in number of frac stages completed per day
27% improvement in days required to mill frac plugs
Encouraging early results from enhanced completions in the DJ Basin
Commenced marketed sales process to divest Uinta Basin assets
Improved capital efficiency and program execution lead to guidance increase
2017 production guidance increased to 6.9-7.1 MMBoe; represents 21% pro forma growth over 2016
Positioned to generate greater than 30% growth in 2018 on legacy assets
Translates into improved leverage metrics as Uinta Basin asset sale pre funds 2018 capital program

0
1,000
2,000
3,000
4,000
5,000
6,000
7,000
8,000
9,000
2012 2013 2014 2015 2016 2017E 2018E
Demonstrated Ability to Grow Production
NYSE: BBG www.billbarrettcorp.com 22
• Track record of delivering consistent
growth despite lower activity levels in
challenging crude market environment
Met or exceeded guidance for 12 consecutive
quarters
Increased 4Q17 and 2017 production guidance
• Early adopters of recognizing economic
benefit of XRL development
• Seeing early positive results from
enhanced completions
Implementing greater sand volume (1,500
lbs/lateral foot), tighter frac stage spacing (120’
per stage) and enhanced flowback technique
• Drilling and completion cycle times
increased by 28% over 2016
Driven by significant improvement in stage
completions per day and amount of sand placed
per day
• Maintain two rig drilling program on NE
Wattenberg asset
1 2017 and 2018 estimated production sales volumes based on corporate operating guidance
DJ Basin
Net Sales Volumes (Mboe)1
+30%

NE Wattenberg Cross Section
NYSE: BBG www.billbarrettcorp.com 23
Resistivity
Highlight > 20 ohms
Clay Bound Water / Free Water
/ Hydrocarbon Volume
Resistivity
Highlight > 20 ohms
GR
0-300
Resistivity
Highlight > 20 ohms
N
io
br
ar
a
P
ay
S
ec
tio
n
A
Bench
B
Bench
C
Bench
A A’
Clay Bound Water / Free Water
/ Hydrocarbon Volume
Clay Bound Water / Free Water
/ Hydrocarbon Volume
GR
0-300
GR
0-300
• Detailed core analysis confirms reservoir and resource
quality is consistent
Over 920’ of core was analyzed from four distinct well locations
throughout acreage position
Strong average oil saturations (So) across acreage = 45%-57%
• Nine mineral petrophysical model calibrated from core
data for more accurate reservoir and resource
assessment
Calculated oil saturated pore volume (SoPhiH), an indicator of
resource in place, is consistent with range = 5.5’-8’
Net footage of resistivity greater than 20 Ohms, an indicator of overall
hydrocarbon charge, is also fairly consistent, with a range of 59’-79’
Avg So = 48%
SoPhiH = 5.5
Net feet > 20 Ohmms = 59’
Avg So = 45%
SoPhiH = 8
Net feet > 20 Ohmms = 79’
Avg So = 57%
SoPhiH = 7.5
Net feet > 20 Ohmms = 73’
A’
A

7
Current XRL Development
NYSE: BBG www.billbarrettcorp.com 24
BBG horizontal wells
XRL well activity
NE Wattenberg Focus Area
Section 5-61-20 (8 XRL wells)
Enhanced proppant (~1,500 lbs/lateral foot)
Frac stage spacing of ~120’ (82-stages)
Initial flowback in 4Q17
Section 4-62-29 and 4-62-32 (10 XRL wells
per DSU)
4-62-29 Initial flowback in 4Q17
4-62-32 Currently completing
Section 3-62-4 (10 XRL wells)
Currently completing
Section 5-61-27 (4 XRL wells)
Currently drilling
Section 4-62-28 (5 XRL wells)
Currently drilling
Planned development beneath reservoir

0
5
10
15
20
25
30
35
40
2014 2015 2016 2017
Drill Days Frac Days Drill Out Days
0
2
4
6
8
10
12
14
2014 2015 2016 2017
0
4
8
12
16
20
2014 2015 2016 2017
Significant Improvement in Cycle Times
NYSE: BBG www.billbarrettcorp.com 25
Drill Days Frac Days
Drill Out Days
0
3
6
9
2014 2015 2016 2017
Combined Cycle Time
$4.75 mm current XRL well cost
Enhanced Completions Optimizing Results
NYSE: BBG www.billbarrettcorp.com 26
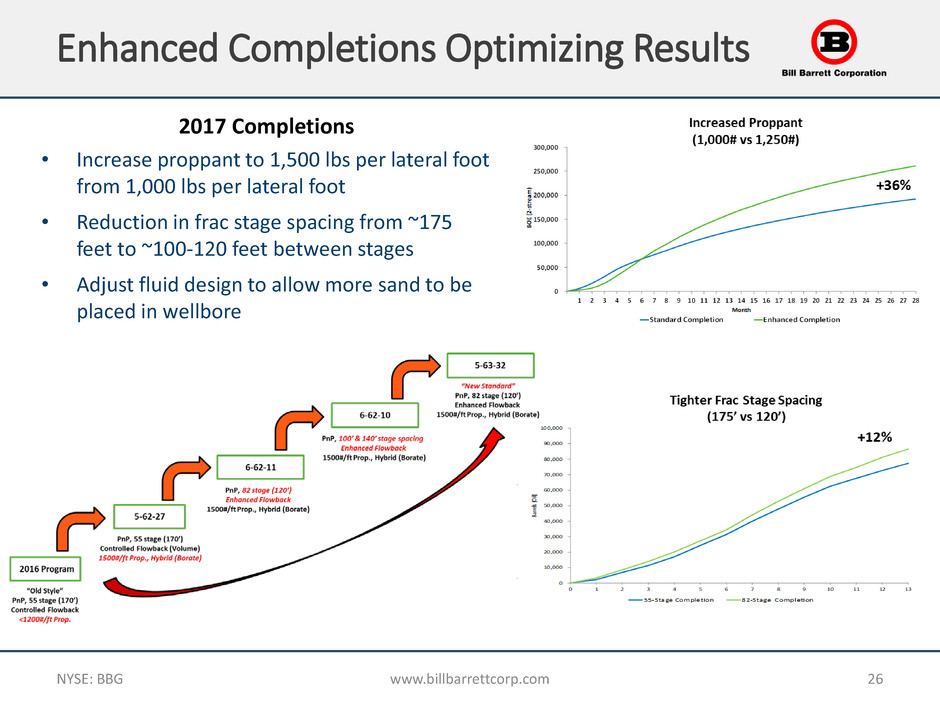
2017 Completions
• Increase proppant to 1,500 lbs per lateral foot
from 1,000 lbs per lateral foot
• Reduction in frac stage spacing from ~175
feet to ~100-120 feet between stages
• Adjust fluid design to allow more sand to be
placed in wellbore
DJ Basin XRL Indicative Economics
NYSE: BBG www.billbarrettcorp.com 27
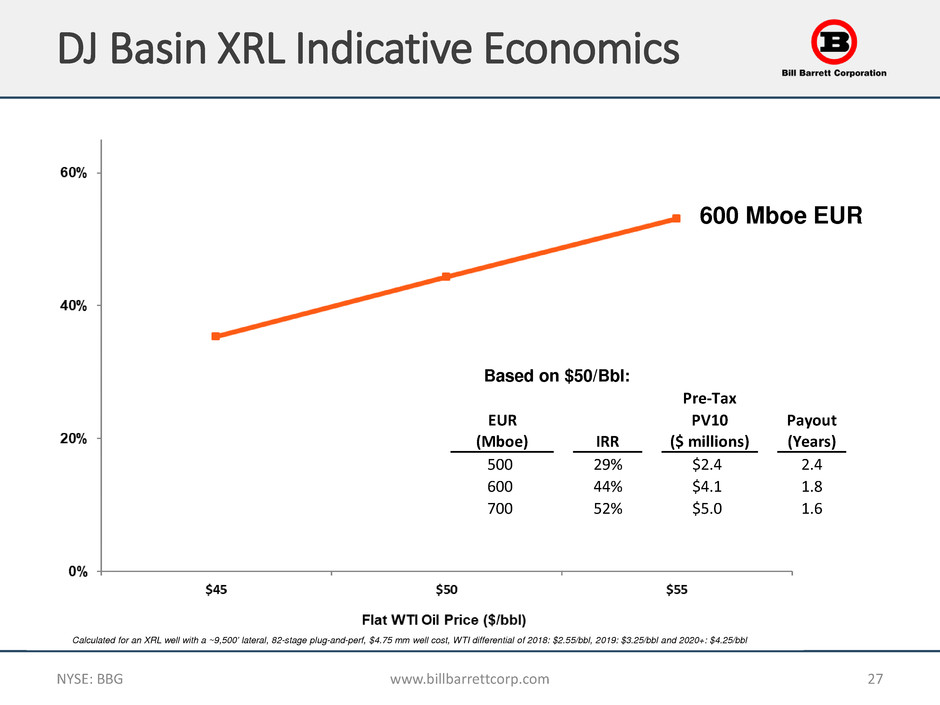
600 Mboe EUR
Calculated for an XRL well with a ~9,500’ lateral, 82-stage plug-and-perf, $4.75 mm well cost, WTI differential of 2018: $2.55/bbl, 2019: $3.25/bbl and 2020+: $4.25/bbl
Based on $50/Bbl:
Pre-Tax
EUR PV10 Payout
(Mboe) IRR ($ millions) (Years)
500 29% $2.4 2.4
600 44% $4.1 1.8
700 52% $5.0 1.6

Best in Class DJ Basin Operating Margins
NYSE: BBG www.billbarrettcorp.com 28
Source: Company filings and calculated for third quarter 2017 results
Peers include: BCEI, PDCE, SRCI, XOG
Generating 31% greater unhedged operating
margins compared to DJ Basin peers

0
3,000
6,000
9,000
12,000
1Q18 2Q18 3Q18 4Q18 2019
V
ol
um
es
(b
bl
/d
)
Legacy BBG Crude Oil Hedges
$52.99 $53.28
$53.09
$53.49
NYSE: BBG www.billbarrettcorp.com 29
Hedging Program Protects Cash Flow
• Actively manage hedge portfolio to support
capital program, protect future cash flow
and reduce commodity price risk
• Strategy is to hedge 50-70% of production on
a forward 12-month to 18-month basis
2018 – 9,563 Bbls/d of crude oil hedged at an
average WTI price of $53.12/Bbl
2019 – 4,496 Bbls/d of crude oil hedged at an
average WTI price of $53.49/Bbl
• Fifth Creek has a total of ~954,000 Bbls
swapped at $51.97/Bbl in 2018 and 2019
1 Hedge position as of January 19, 2018
$53.09

Legacy BBG Oil and Natural Gas Hedge Summary
NYSE: BBG www.billbarrettcorp.com 30
2018-2019 hedge position, as of January 19, 2018
Swaps
Period Oil Natural Gas
Volume
(Bbls/d)
WTI Price
($/Bbl)
Volume
(MMBtu/d)
NWPL Price
($MMBtu)
1Q18 9,250 $ 52.99 5,000 $ 2.68
2Q18 10,000 $ 53.28 5,000 $ 2.68
3Q18 9,500 $ 53.09 5,000 $ 2.68
4Q18 9,500 $ 53.09 5,000 $ 2.68
1Q19 5,000 $ 53.66
2Q19 5,000 $ 53.66
3Q19 4,000 $ 53.29
4Q19 4,000 $ 53.29

$23
$25
$27
$29
Initial Current
$
m
m
$28.5
$24.5
2017 Operating Guidance
NYSE: BBG www.billbarrettcorp.com 31
• Production sales volumes of 6.9-7.1 MMBoe
Represents 21% production growth at the mid-point compared to pro forma 2016 production
4Q17 production expected to approximate 2.0-2.2 MMBoe - ~10% sequential growth
2017 activity expected to deliver 2018 production growth in excess of 30% on legacy assets
• Capital expenditures of $250-$270 million
Assumes $4.75 mm XRL well cost reflecting enhanced completions
Capital program funded through cash flow and cash on hand
4Q17 capital expenditures are expected to total $80-$90 million
• Lease operating expense of $24-$25 million
Driven by positive well results, the timing of well completions and
greater operating efficiencies
Production Capital Expenditures Lease Operating Expense
Represents initial 2017 guidance and mid-point of current guidance range
6.0
6.2
6.4
6.6
6.8
7.0
Initial Current
M
M
B
oe
7.0
6.25
$250
$255
$260
$265
$270
Initial Current
$
m
m
$270
$260

Three and Nine month Financial Results
NYSE: BBG www.billbarrettcorp.com 32
1 Discretionary cash flow, adjusted net income (loss) and EBITDAX are non-GAAP (Generally Accepted Accounting Principles) measures. Please reference the reconciliations to GAAP financial statements on the following pages
Three Months Ended Nine Months Ended
September 30, September 30,
2017 2016 2017 2016
Net cash provided by operating activities ($ millions) $57.2 $67.4 $95.4 $116.2
Discretionary cash flow ($ millions)1 $34.8 $36.5 $79.4 $93.7
Net income (loss) ($ millions) ($28.8) ($26.2) ($60.4) ($121.0)
Per share, basic ($0.39) ($0.44) ($0.81) ($2.28)
Per share, dilutive ($0.39) ($0.44) ($0.81) ($2.28)
Adjusted net income (loss) ($ millions)1 ($5.9) ($6.2) ($30.3) ($26.6)
Per share, basic ($0.08) ($0.10) ($0.41) ($0.50)
Per share, dilutive ($0.08) ($0.10) ($0.41) ($0.50)
Weighted average shares outstanding, basic (in thousands) 74,886 58,852 74,743 53,082
Weighted average shares outstanding, diluted (in thousands) 74,886 58,852 74,743 53,082
EBITDAX ($ millions)1 $47.9 $49.8 $120.7 $136.6
Three Months Ended Nine Months Ended
September 30, September 30,
2017 2016 2017 2016
Production sales volumes (Mboe) 1,920 1,566 4,879 4,540
Daily production sales volumes (Boe/d) 20,870 17,022 17,872 16,569
Oil price differential (per barrel) $2.12 $3.02 $2.95 $4.44
DJ Basin oil price differential (per barrel) $2.06 $2.21 $2.48 $3.51
Average Costs (per Boe):
Lease operating expenses $3.08 $3.06 $3.54 $4.87
Gathering, transportation and processing $0.32 $0.30 $0.34 $0.41
Production tax $2.80 $2.45 $1.87 $1.55
Depreciation, depletion and amortization $22.52 $27.51 $24.81 $27.64
General and administrative expense $6.51 $5.86 $6.31 $6.95

Non-GAAP Reconciliation (Unaudited)
NYSE: BBG www.billbarrettcorp.com 33
EBITDAX Reconciliation
Three Months Ended Nine Months Ended
September 30, September 30,
2017 2016 2017 2016
(in thousands)
Net Income (Loss) ($28,842) ($26,186) ($60,404) ($121,101)
Adjustments to reconcile to EBITDAX:
Depreciation, depletion and amortization 41,732 43,083 119,409 125,491
Impairment, dry hole and abandonment expense 261 974 8,336 1,766
Exploration expense 18 16 48 64
Unrealized derivative (gain) loss 19,672 14,358 (2,592) 85,675
Incentive compensation and other non-cash charges 1,480 1,777 5,134 7,208
(Gain) loss on sale of properties — 1,914 (92) 1,206
(Gain) loss on extinguishment of debt — (29) 7,904 (8,726)
Interest and other income (332) (72) (1,030) (166)
Interest expense 13,926 13,991 44,014 45,160
Provision for (benefit from) income taxes — — — —
EBITDAX $47,915 $49,826 $120,727 $136,577
Discretionary cash flow and adjusted net income (loss) are non-GAAP measures. These measures are presented because management believes that they provide useful additional
information to investors for analysis of the Company's ability to internally generate funds for exploration, development and acquisitions as well as adjusting net income (loss) for certain
items to allow for a more consistent comparison from period to period. In addition, the Company believes that these measures are widely used by professional research analysts and others
in the valuation, comparison and investment recommendations of companies in the oil and gas exploration and production industry, and that many investors use the published research of
industry research analysts in making investment decisions.
These measures should not be considered in isolation or as a substitute for net income, income from operations, net cash provided by operating activities or other income, profitability, cash
flow or liquidity measures prepared in accordance with GAAP. The definition of these measures may vary among companies, and, therefore, the amounts presented may not be
comparable to similarly titled measures of other companies.

Non-GAAP Reconciliation (Unaudited)
NYSE: BBG www.billbarrettcorp.com 34
1 Adjusted (provision for) benefit from income taxes is calculated using the Company’s current effective tax rate prior to applying the valuation allowance against deferred tax assets
Discretionary Cash Flow Reconciliation
Three Months Ended Nine Months Ended
September 30, September 30,
2017 2016 2017 2016
(in thousands)
Net Cash Provided by (Used in) Operating Activities $57,184 $67,428 $95,383 $116,207
Adjustments to reconcile to discretionary cash flow:
Exploration expense 18 16 48 64
Changes in working capital (22,371) (30,964) (16,023) (22,613)
Discretionary Cash Flow 34,831 36,480 79,408 93,658
Adjusted Net Income (Loss) Reconciliation
Three Months Ended Nine Months Ended
September 30, September 30,
2017 2016 2017 2016
(in thousands, except per share amounts)
Net Income (Loss) ($28,842) ($26,186) ($60,404) ($121,101)
Provision for (Benefit from) income taxes — — — —
Income (Loss) before Income Taxes (28,842) (26,186) (60,404) (121,101)
Adjustments to Net Income (Loss):
Unrealized derivative (gain) loss 19,672 14,358 (2,592) 85,675
Impairment expense — — 8,010 183
(Gain) loss on sale of properties — 1,914 (92) 1,206
(Gain) loss on extinguishment of debt — (29) 7,904 (8,726)
One-time items:
(Income) expense related to properties sold (282) — (1,610) —
Adjusted Income (Loss) before Income Taxes (9,452) (9,943) (48,784) (42,763)
Adjusted (provision for) benefit from income taxes (1) 3,549 3,791 18,460 16,164
Adjusted Net Income (Loss) ($5,903) ($6,152) ($30,324) ($26,599)
Per share, diluted ($0.08) ($0.10) ($0.41) ($0.50)

Forward-Looking & Other Cautionary Statements
DISCLOSURE STATEMENTS:
Cautionary statement regarding forward-looking statements: Throughout this prospectus supplement and the accompanying base prospectus, including in the documents and information incorporated by reference
herein and therein, we make statements that may be deemed “forward-looking” statements within the meaning of Section 27A of the Securities Act of 1933, as amended (the “Securities Act”), Section 21E of the
Securities Exchange Act of 1934, as amended (the “Exchange Act”) and the Private Securities Litigation Reform Act of 1995. Forward-looking statements include statements about the closing of the Merger, the timing of
such closing, the expected benefits of the Merger, the closing and effect of the debt exchange (as defined below) and our future strategy, plans, estimates, beliefs, timing and expected performance. All of these types of
statements, other than statements of historical fact included in or incorporated by reference into this prospectus supplement, are forward-looking statements. In some cases, you can identify forward-looking statements
by terminology such as “expect”, “seek”, “believe”, “upside”, “will”, “may”, “expect”, “anticipate”, “plan”, “will be dependent on”, “project”, “potential”, “intend”, “could”, “should”, “estimate”, “predict”, “pursue”,
“target”, “objective”, “continue”, the negative of such terms or other comparable terminology.
Forward-looking statements are dependent upon events, risks and uncertainties that may be outside our control. The term “outlook” may be used to indicate our current perspective on possible outcomes in periods
beyond the current fiscal year. Because statements of this type relate to events or conditions further in the future, they are subject to increased levels of uncertainty. Our actual results could differ materially from those
discussed in these forward-looking statements. Factors that could cause or contribute to such differences include, but are not limited to, the following risks and uncertainties:
• risks and uncertainties relating to the Merger, including the possibility that the Merger does not close when expected or at all because conditions to closing are not satisfied on a timely basis or at all;
• potential adverse reactions or changes to business or employee relationships, including those resulting from the announcement or completion of the Merger;
• timing of the Merger;
• the possibility that the anticipated benefits of the Merger are not realized when expected or at all, including as a result of the impact of, or problems arising from the integration of the two companies;
• the possibility that the Merger may be more expensive to complete than anticipated, including as a result of unexpected factors or events;
• diversion of management’s attention from ongoing business operations and opportunities;
• oil, natural gas liquids (“NGLs”) and natural gas price volatility, including regional price differentials;
• changes in operational and capital plans;
• costs, availability and timing of build-out of third party facilities for gathering, processing, refining and transportation; delays or other impediments to drilling and completing wells arising from political or judicial
developments at the local, state or federal level, including voter initiatives related to hydraulic fracturing; development drilling and testing results;
• the potential for production decline rates to be greater than expected;
• regulatory delays, including seasonal or other wildlife restrictions on federal lands;
• exploration risks such as drilling unsuccessful wells;
• higher than expected costs and expenses, including the availability and cost of services and material and our potential inability to achieve expected cost savings;
• unexpected future capital expenditures;
• economic and competitive conditions;
• debt and equity market conditions, including the availability and costs of financing to fund the Company’s operations;
• the ability to obtain industry partners to jointly explore certain prospects, and the willingness and ability of those partners to meet capital obligations when requested;
• declines in the values of our oil and gas properties resulting in impairments;
• changes in estimates of proved reserves;
• compliance with environmental and other regulations;
• derivative and hedging activities;
• risks associated with operating in one major geographic area;
• the success of the Company’s risk management activities;
• title to properties, including those to be acquired in the Merger;
• litigation, including litigation concerning the Merger;
• environmental liabilities ; and
• other uncertainties, as well as those factors discussed in this prospectus and in our Annual Report on Form 10-K for the year ended December 31, 2016 and our Quarterly Reports on Form 10-Q for the quarters
ended March 31, 2017, June 30, 2017 and September 30, 2017 under the headings “Cautionary Note Regarding Forward-Looking Statements” and “Risk Factors” and in other documents incorporated by
reference in this prospectus supplement.
35
Forward-Looking & Other Cautionary Statements
The forward-looking statements contained in this prospectus supplement are largely based on our expectations, which reflect estimates and assumptions made by our management. These estimates and assumptions
reflect our judgment based on currently known market conditions and other factors. Although we believe such estimates and assumptions to be reasonable, they are inherently uncertain and involve a number of risks
and uncertainties that are beyond our control. In addition, management’s assumptions about future events may prove to be inaccurate. Management cautions all readers that the forward-looking statements contained in
this prospectus supplement are not guarantees of future performance, and we cannot assure any reader that such statements will be realized or that forward-looking events and circumstances will occur. Actual results
may differ materially from those anticipated or implied in the forward-looking statements due to many factors including those listed above and in the documents incorporated by reference herein. All forward-looking
statements contained in this prospectus supplement speak only as of the date of this prospectus supplement and all forward-looking statements incorporated by reference into this prospectus supplement speak only as
of the dates such statements were made. Readers should not place undue reliance on these forward-looking statements, which reflect management’s views only as of the date hereof. Other than as required under the
securities laws, we do not intend to, and do not undertake any obligation to, publicly update or revise any forward-looking statements as a result of changes in internal estimates or expectations, new information,
subsequent events or circumstances or otherwise. These cautionary statements qualify all forward-looking statements attributable to us or persons acting on our behalf.
IMPORTANT ADDITIONAL INFORMATION
This communication does not constitute an offer to sell or the solicitation of an offer to buy any securities or a solicitation of any vote or approval. In connection with the proposed transaction, the Company and Fifth
Creek will cause New BBG to file with the SEC a registration statement on Form S-4, which will include a prospectus with respect to the shares of New BBG to be issued in the proposed transaction and a proxy statement
of the Company with respect to the obtaining of stockholder approval for the transaction. The Company and New BBG also plan to file other documents with the SEC regarding the proposed merger. After the registration
statement has been declared effective by the SEC, a definitive proxy statement/prospectus will be mailed to the stockholders of the Company. STOCKHOLDERS OF THE COMPANY ARE URGED TO READ THE REGISTRATION
STATEMENT AND PROXY STATEMENT/PROSPECTUS (INCLUDING ALL AMENDMENTS AND SUPPLEMENTS THERETO) AND OTHER DOCUMENTS RELATING TO THE PROPOSED MERGER THAT WILL BE FILED WITH THE SEC
CAREFULLY AND IN THEIR ENTIRETY WHEN THEY BECOME AVAILABLE BECAUSE THEY WILL CONTAIN IMPORTANT INFORMATION ABOUT THE PROPOSED MERGER. Investors will be able to obtain free copies of the proxy
statement/prospectus and other documents containing important information about New BBG, the Company and Fifth Creek, once such documents are filed with the SEC, through the website maintained by the SEC at
http://www.sec.gov. Copies of the documents filed with the SEC by the Company will be available free of charge on the Company’s internet website at www.billbarrettcorp.com under the tab “Investors” and then under
the tab “SEC Filings” or by contacting the Company’s Investor Relations Department at (303) 293-9100.
PARTICIPANTS IN THE SOLICITATION
New BBG, The Company, and their respective directors and executive officers may be deemed to be participants in the solicitation of proxies in connection with the proposed transaction. Information about the directors
and executive officers of the Company is set forth in the Company’s public filings with the SEC, including its definitive proxy statement filed with the SEC on April 6, 2017. Other information regarding the participants in
the proxy solicitation and a description of their direct and indirect interests, by security holdings or otherwise, will be contained in the proxy statement/prospectus and other relevant materials filed with the SEC. Free
copies of these documents can be obtained as described in the preceding paragraph.
36

Forward-Looking & Other Cautionary Statements
NYSE: BBG www.billbarrettcorp.com 37
Reserve Disclosure
The SEC generally permits oil and gas companies, in filings made with the SEC, to disclose proved reserves, which are reserve estimates that geological and engineering data
demonstrate with reasonable certainty to be recoverable in future years from known reservoirs under existing economic and operating conditions and certain probable and possible
reserves that meet the SEC’s definitions for such terms. In this presentation, the Company uses the terms “estimated ultimate recovery”, “EUR” or other descriptions of potential
reserves or volumes of reserves, as well as aggregated proved, probable and possible (“3P”) reserves, which the SEC guidelines restrict from being included in filings with the SEC.
The estimates conform to Society of Petroleum Evaluation Engineers (SPEE) methodology. They are not prepared or reviewed by third party engineers. EURs refer to the Company’s
internal estimates of per-well hydrocarbon quantities that may be potentially recovered from a hypothetical and/or actual well completed in the area. Actual quantities that may be
ultimately recovered from the Company’s interests are unknown. Factors affecting ultimate recovery include the scope of the Company’s ongoing drilling program, which will be
directly affected by the availability of capital, drilling and production costs, availability and cost of drilling services and equipment, lease expirations, transportation constraints,
regulatory approvals and other factors, as well as actual drilling results, including geological and mechanical factors affecting recovery rates. Estimates of ultimate recovery from
reserves may change significantly as development of the Company’s core assets provide additional data. In addition, the Company’s production forecasts and expectations for future
periods are dependent upon many assumptions, including estimates of production decline rates from existing wells and the undertaking and outcome of future drilling activity, which
may be affected by significant commodity price declines or drilling cost increases. The Company's EURs are provided in this presentation because management believes it is useful,
additional information that is widely used by the investment community in the valuation, comparison and analysis of companies.
ADDITIONAL INFORMATION:
Rate of return estimates do not reflect lease acquisition costs or corporate general and administrative expenses.
Initial and test results from a well do not necessarily reflect the well’s longer-term performance or the performance of other wells in the same area.

1099 Eighteenth Street, Suite 2300
Denver, CO 80202
303.293.9100
Website: www.billbarrettcorp.com
Investor Relations Contact:
Larry C. Busnardo
(303) 312-8514
lbusnardo@billbarrettcorp.com
