Attached files
| file | filename |
|---|---|
| 8-K - FB FINANCIAL CORPORATION 8-K - FB Financial Corp | a51746977.htm |
| EX-99.2 - EXHIBIT 99.2 - FB Financial Corp | a51746977ex99_2.htm |
| EX-99.1 - EXHIBIT 99.1 - FB Financial Corp | a51746977ex99_1.htm |
Exhibit 99.3

Fourth Quarter and Year End 2017 Earnings Presentation January 23, 2018
This presentation contains “forward-looking statements” made pursuant to the safe harbor provisions of the Private Securities Litigation Reform Act of 1995. All statements other than statements of historical fact are forward-looking statements. You can identify these forward-looking statements through the Company’s use of words such as “believes,” “anticipates,” “expects,” “may,” “will,” “assumes,” “should,” “predicts,” “could,” “would,” “intends,” “targets,” “estimates,” “projects,” “plans,” “potential,” “confident,” “future” and other similar words and expressions of the future or otherwise regarding the outlook for the Company’s future business and financial performance, including, without limitation, the impact of the 2017 Tax Cuts and Jobs Act on the Company and its operations and financial results, the performance of the banking and mortgage industry and the economy in general and the benefits, cost, synergies and financial impact of the Company’s acquisition of the Clayton Banks. Investors are cautioned that any such forward-looking statements are not guarantees of future performance and involve known and unknown risks and uncertainties which may cause the actual results, performance or achievements of the Company to be materially different from the future results, performance or achievements expressed or implied by such forward-looking statements. Forward-looking statements are based on the information known to, and current beliefs and expectations of, the Company’s management and are subject to significant risks and uncertainties. Actual results may differ materially from those contemplated by such forward-looking statements. A number of factors could cause actual results to differ materially from those contemplated by the forward-looking statements in this Earnings Release including, without limitation, the risks and other factors set forth in the Company’s Annual Report on Form 10-K for the year ended December 31, 2016, filed with the SEC on March 31, 2017 under the captions “Cautionary note regarding forward-looking statements” and “Risk factors.” Many of these factors are beyond the Company’s ability to control or predict. The Company believes the forward-looking statements contained herein are reasonable; however, undue reliance should not be placed on any forward-looking statements, which are based on current expectations and speak only as of the date that they are made. The Company does not assume any obligation to update any forward-looking statements as a result of new information, future developments or otherwise, except as otherwise may be required by law. Forward looking statements

Use of non-GAAP financial measures This presentation contains certain financial measures that are not measures recognized under U.S. generally accepted accounting principles (“GAAP”) and therefore are considered non-GAAP financial measures. These non‐GAAP financial measures include, without limitation, pro forma core net income, pro forma core income tax expense, pro forma core diluted earnings per share, core noninterest expense and core noninterest income, core efficiency ratio (tax equivalent basis), Banking segment core efficiency ratio (tax equivalent basis), Mortgage segment core efficiency ratio (tax equivalent basis), pro forma core return on average assets and equity and pro forma core total revenue. Each of these non-GAAP metrics excludes certain income and expense items that the Company’s management considers to be non‐core in nature. The Company refers to these non‐GAAP measures as core measures. This Earnings Release also presents tangible assets, tangible common equity, tangible book value per common share, tangible common equity to tangible assets, return on average tangible common equity, pro forma return on average tangible common equity and pro forma core return on average tangible common equity. Each of these non-GAAP metrics excludes the impact of goodwill and other intangibles.The Company’s management uses these non-GAAP financial measures in their analysis of the Company’s performance, financial condition and the efficiency of its operations as management believes such measures facilitate period-to-period comparisons and provide meaningful indications of its operating performance as they eliminate both gains and charges that management views as non-recurring or not indicative of operating performance. Management believes that these non-GAAP financial measures provide a greater understanding of ongoing operations and enhance comparability of results with prior periods as well as demonstrating the effects of significant non-core gains and charges in the current and prior periods. The Company’s management also believes that investors find these non-GAAP financial measures useful as they assist investors in understanding the Company’s underlying operating performance and in the analysis of ongoing operating trends. In addition, because intangible assets such as goodwill and other intangibles, and the other items excluded each vary extensively from company to company, the Company believes that the presentation of this information allows investors to more easily compare the Company’s results to the results of other companies. However, the non-GAAP financial measures discussed herein should not be considered in isolation or as a substitute for the most directly comparable or other financial measures calculated in accordance with GAAP. Moreover, the manner in which the Company calculates the non-GAAP financial measures discussed herein may differ from that of other companies reporting measures with similar names. You should understand how such other banking organizations calculate their financial measures similar or with names similar to the non-GAAP financial measures the Company has discussed herein when comparing such non-GAAP financial measures. The following tables provide a reconciliation of these measures to the most directly comparable GAAP financial measures.

Three months endedDecember 31, 2017 Non-GAAP Core results1 Reported GAAP results Diluted earnings per share $0.60 $0.74 Net income ($million) $18.7 $23.0 Net interest margin 4.35% 4.63% Return on average assets 1.59% 1.96% Return on average equity 12.8% 15.8% Return on average tangible common equity 17.4% 21.4% Efficiency ratio 63.6% 66.9% 4Q 2017 and full-year 2017 highlights Key highlights Financial results 1 Core results are non-GAAP financial measures that adjust GAAP reported net income and other metrics for non-core income and expense items as outlined in the non-GAAP reconciliation calculations, using a combined marginal income tax rate of 39.225% excluding one-time items. See “Use of non-GAAP financial measures” and the Appendix hereto.2 Excludes accretion from acquired / purchased loans and collection of interest income on nonaccrual loans. Core EPS of $0.60 and $2.14, driven by core ROAA of 1.59% and 1.56% for 4Q 2017 and 2017, respectivelyLoans (HFI) grew to $3.17 billion, a 71.3% increase from 4Q 2016; organic loans grew 13.9% from 4Q 2016 and 6.7% annualized from 3Q 2017Total deposits grew to $3.66 billion, a 37.2% increase from 4Q 2016; organic customer deposits grew 2.0% from 4Q 2016 and declined 3.9% annualized from 3Q 2017Continued customer-focused balance sheet growth resulting in a net interest margin of 4.63% for 4Q 2017 and 4.46% for 2017Banking Segment core efficiency ratio1 improved to 55.6% in 4Q 2017, down from 56.2% in 3Q 2017Mortgage banking revenue of $30.3 million, a 15.7% increase from 4Q 2016, driven by interest rate lock commitment (IRLC) volume of $1.8 billion for the quarter, up 24.0% from 4Q 2016Income tax benefit of $5.9 million in 4Q 2017 due to revaluation of recorded deferred tax liability; 2018 expected effective tax rate of 24.5% - 25.5% 2

Consistently delivering balanced profitability and growth Drivers of profitability Core pro forma return on average assets1 ($million) Net interest margin Noninterest income ($mn) Loans / deposits 1 Our pro forma net income includes a pro forma provision for federal income taxes using a combined effective income tax rate of 35.63%, 35.08% and 36.75% for the years ended December 31, 2014, 2015 and 2016, respectively, and also includes the exclusion of a one-time tax charge in 3Q 2016. The years ended December 31 2014, 2015, 2016 and 2017 are annual percentages. +64 bps NPLs (HFI) / loans (HFI) (%)

Peer-leading net interest margin remains strong Historical yield and costs 1 Includes tax-equivalent adjustment NIM (%) 3.99% 4.28% 4.19% 4.61% 4.63% NIM, ex-accretion and nonaccrual interest collections (%) 3.90% 4.04% 4.03% 4.33% 4.35% Deposit cost (%) 0.29% 0.32% 0.34% 0.46% 0.50% Loan (HFI) yield 4Q 2016 3Q 2017 4Q 2017 Contractual interest rate on loans HFI1 4.71% 5.08% 5.20% Origination and other loan fee income 0.41% 0.38% 0.26% 5.12% 5.46% 5.46% Nonaccrual interest collections 0.07% 0.16% 0.15% Accretion on purchased loans 0.08% 0.23% 0.24% Syndication fee income -- 0.05% 0.03% Total loan yield (HFI) 5.27% 5.90% 5.88%

Consistent loan growth and balanced portfolio Total loan growth1 ($million) and commercial real estate concentration Loan portfolio breakdown1 4Q 2012 4Q 2017 Total HFI loans: $3,167 million 1 Exclude HFS loans, C&I includes owner-occupied CRE2 Risk-based capital at FirstBank as defined in Call Report. 4Q 2017 calculation is preliminary and subject to change.3 Excludes owner-occupied CRE Commercial real estate (CRE) concentrations2 % of Risk-Based Capital 4Q 2016 4Q 2017(preliminary) C&D loans subject to 100% risk-based capital threshold3 81% 96% Total CRE loans subject to 300% risk-based capital threshold3 185% 228%

Stable, low cost core deposit franchise Total deposits ($million) 1 Includes mortgage servicing-related escrow deposits of $46.7 million, $43.7 million, $49.9 million, $56.8 million and $53.7 million for the quarters ended December 31, 2016, March 31, 2017, June 30, 2017, September 30, 2017 and December 31, 2017 respectively. Noninterest bearing deposits ($million)1 Growth: 27.4% y/y Deposit composition Cost of deposits Customer growth: 34.0% y/y Organic customer growth: 2.0% y/y

$29.5 $29.6 $29.6 ($7.1) ($0.8) ($3.3) $3.8 $3.5 $4.2 $ -- ($0.9) ($0.2) $26.2 $31.3 $30.3 Mortgage banking continues to execute across channels 2017 Mortgage Segment pre-tax core contribution of $16.8 millionTypical seasonal weakness offset by higher than expected Consumer Direct volumes and strength in retail and reverse channelsMortgage banking income $30.3 million, up 15.7% from 4Q 2016IRLC volume of $1.8 billion during 4Q 2017 from $1.5 billion during 4Q 2016Continuing to create operational leverage and refine efficiencies as business model develops, focusing on overall direct contribution Highlights Note: Values by channel in dollars are included on page 8 of the Quarterly Financial Supplement for IRLC volume, IRLC pipeline and Mortgage sales. Gain on Sale IRLC volume mix by purpose (%) IRLC volume by line of business (%) Consumer Direct Correspondent Third party originated Retail Retail footprint Refinance Purchase 4Q 2016 3Q 2017 4Q 2017 $1,463mn $2,001mn $1,814mn IRLC volume: IRLC pipeline: $533mn $541mn $504mn Fair value changes Fair value MSR change Mortgage banking income ($million) Total Servicing Revenue

Improving operating leverage remains a key objective Consolidated 4Q 2017 core efficiency ratio of 63.6% driven by Banking Segment core efficiency ratio of 55.6%, approaching our target level of sub-55% Conversion of Clayton Banks core systems on December 1; expect 1Q 2018 to be the first quarter with cost savings fully phased-inBank’s investment in IT systems, including a new core system, created a scalable platform designed to drive and support growth across marketsContinuing to refine mortgage banking with operational efficiency improvements while maintaining contribution Core efficiency ratio (tax-equivalent basis)1 Improving operating efficiency 1 See “Use of non-GAAP financial measures” and the Appendix hereto.

Asset quality remains strong Classified & PCI loans ($million) Net charge-offs / average loans Nonperforming ratios LLR / loans 1 Includes $5.9 million of acquired excess land and facilities at December 31, 2017 and $43.0 million of GNMA rebooked loans – see page 11 of the Quarterly Financial Supplement. 1

Strong capital position for future growth 1 Total regulatory capital, FB Financial Corporation. 4Q 2017 calculation is preliminary and subject to change.2 See “Use of non-GAAP financial measures” and the Appendix hereto. Capital position Simple capital structure 4Q 2016 3Q 2017 4Q 20171 Shareholder’s equity / Assets 10.1% 12.5% 12.6% TCE / TA2 8.7% 9.5% 9.7% Common equity tier 1 / Risk-weighted assets 11.0% 10.8% 10.7% Tier 1 capital / Risk-weighted assets 12.2% 11.6% 11.4% Total capital / Risk-weighted assets 13.0% 12.2% 12.0% Tier 1 capital / Average assets 10.1% 11.4% 10.5% Tangible book value per share Growth: 26.0% since IPO (September 2016)

Appendix

GAAP reconciliation and use of non-GAAP financial measures Core net income (Dollars in thousands) 2017 2016 Core net income Fourth Quarter Third Quarter Second Quarter First Quarter Fourth Quarter Pre-tax net income $ 27,504 $ 12,990 $ 17,813 $ 15,178 $ 13,797 Non-core items: Noninterest income Less change in fair value on mortgage servicing rights, net (190) (893) (1,840) (501) - Less gain from securities, net 1 254 29 1 - Less (loss) gain on sales or write-downs of other real estate owned and other assets (386) (314) 62 748 (349) Noninterest expenses Plus variable compensation charge related to cash settled equity awards - - - 635 1,041 Plus merger and conversion 2,069 15,711 767 487 - Plus (recovery of) impairment of mortgage servicing rights - - - - (3,411) Plus loss on sale of mortgage servicing rights - - 249 - 4,447 Pre tax core net income $ 30,148 $ 29,654 $ 20,578 $ 16,052 $ 16,223 Core income tax expense 11,471 11,138 7,659 5,768 5,739 Core net income $ 18,677 $ 18,516 $ 12,919 $ 10,284 $ 10,484 Weighted average common shares outstanding fully diluted 31,166,080 30,604,537 26,301,458 24,610,991 24,500,943 Core diluted earnings per share Diluted earning per share $ 0.74 $ 0.27 $ 0.43 $ 0.40 $ 0.37 Non-core items: Noninterest income Less change in fair value on mortgage servicing rights (0.01) (0.03) (0.07) (0.02) - Less gain from securities, net 0.00 0.01 0.00 0.00 0.00 Less (loss) gain on sales or write-downs of other real estate owned and other assets (0.01) (0.01) 0.00 0.03 (0.01) Noninterest expenses Plus variable compensation charge related to cash settled equity awards - - - 0.03 0.04 Plus merger and conversion 0.07 0.51 0.03 0.02 - Plus (recovery of) impairment of mortgage servicing rights - - - - (0.14) Plus loss on sale of mortgage servicing rights - - 0.01 - 0.18 Tax effect (0.2) (0.2) (0.0) (0.01) (0.04) Core diluted earnings per share $ 0.60 $ 0.60 $ 0.49 $ 0.42 $ 0.43

GAAP reconciliation and use of non-GAAP financial measures Pro forma core net income (Dollars in thousands) Pro forma core net income YTD 2017 2016 2015 2014 Pre-tax net income $ 73,485 $ 62,324 $ 50,824 $ 34,731 Non-core items: Noninterest income Less change in fair value on mortgage servicing rights, net (3,424) - - - Less gain from securities, net 285 4,407 1,844 2,000 Less (loss) gain on sales or write-downs of other real estate owned and other assets 110 1,179 (710) 151 Noninterest expenses Plus one-time equity grants - 2,960 - 3,000 Plus variable compensation charge related to cash settled equity awards 635 1,254 - - Plus merger and conversion 19,034 3,268 3,543 - Plus (recovery of) impairment of mortgage servicing rights - 4,678 194 - Plus loss on sale of mortgage servicing rights 249 4,447 - - Pre tax core net income $ 96,432 $ 73,345 $ 53,427 $ 35,580 Pro forma core income tax expense 36,036 27,225 18,850 12,708 Pro forma core net income $ 60,396 $ 46,120 $ 34,577 $ 22,872 Weighted average common shares outstanding fully diluted 28,207,602 19,312,174 17,180,000 17,180,000 Pro forma core diluted earnings per share Diluted earning per share $ 1.86 $ 2.04 $ 2.79 $ 1.89 Non-core items: Noninterest income Less change in fair value on mortgage servicing rights (0.13) - - - Less gain from securities, net 0.01 0.23 0.11 0.12 Less (loss) gain on sales or write-downs of other real estate owned and other assets 0.01 0.06 (0.04) 0.01 Noninterest expenses Plus one-time equity grants - 0.15 - 0.17 Plus variable compensation charge related to cash settled equity awards 0.03 0.06 - - Plus merger and conversion 0.63 0.17 0.21 - Plus (recovery of) impairment of mortgage servicing rights - 0.24 0.01 - Plus loss on sale of mortgage servicing rights 0.01 0.23 - - Tax effect (0.5) (0.2) (0.9) 2.07 Pro forma core diluted earnings per share $ 2.14 $ 2.39 $ 2.01 $ 1.33

GAAP reconciliation and use of non-GAAP financial measures Tax-equivalent efficiency ratio (Dollars in thousands) 2017 2016 Core efficiency ratio (tax-equivalent basis) Fourth Quarter Third Quarter Second Quarter First Quarter Fourth Quarter Total noninterest expense $ 57,540 $ 69,224 $ 49,136 $ 46,417 $ 47,319 Less variable compensation charge related to cash settled equity awards - - - 635 1,041 Less merger and conversion expenses 2,069 15,711 767 487 - Less (recovery of) impairment of mortgage servicing rights - - - - (3,411) Less loss on sale of mortgage servicing rights - - 249 - 4,447 Core noninterest expense $ 55,471 $ 53,513 $ 48,120 $ 45,295 $ 45,242 Net interest income (tax-equivalent basis) 49,692 44,281 31,158 30,963 29,686 Total noninterest income 37,017 37,820 35,657 31,087 31,332 Less change in fair value on mortgage servicing rights (190) (893) (1,840) (501) - Less gain on sales or write-downs of other real estate owned and other assets (386) (314) 62 748 (349) Less gain on sales of securities, net 1 254 29 1 - Core noninterest income 37,592 38,773 37,406 30,839 31,681 Core revenue $ 87,284 $ 83,054 $ 68,564 $ 61,802 $ 61,367 Efficiency ratio (GAAP)(1) 66.91% 85.01% 74.35% 75.67% 78.39% Core efficiency ratio (tax-equivalent basis) 63.55% 64.43% 70.18% 73.29% 73.72% (1) Efficiency ratio (GAAP) is calculated by dividing non-interest expense by total revenue

GAAP reconciliation and use of non-GAAP financial measures Segment tax-equivalent efficiency ratio (Dollars in thousands) 2017 2016 Banking segment core efficiency ratio (tax equivalent) Fourth Quarter Third Quarter Second Quarter First Quarter Fourth Quarter Core consolidated noninterest expense $ 55,471 $ 53,513 $ 48,120 $ 45,295 $ 45,242 Less Mortgage segment noninterest expense 20,117 19,510 19,802 17,670 22,256 Add (recovery of) impairment of mortgage servicing rights - - - - (3,411) Add loss on sale of mortgage servicing rights - - 249 - 4,447 Adjusted Banking segment noninterest expense 35,354 34,003 28,567 27,625 24,022 Adjusted core revenue 87,284 83,054 68,564 61,802 61,367 Less Mortgage segment noninterest income 23,825 23,588 23,121 19,414 22,975 Less change in fair value on mortgage servicing rights (190) (893) (1,840) (501) - Adjusted Banking segment total revenue $ 63,649 $ 60,359 $ 47,283 $ 42,889 $ 38,392 Banking segment core efficiency ratio (tax-equivalent basis) 55.55% 56.33% 60.42% 64.41% 62.57% Mortgage segment core efficiency ratio (tax equivalent) Consolidated noninterest expense $ 57,540 $ 69,224 $ 49,136 $ 46,417 $ 47,319 Less (recovery of) impairment of mortgage servicing rights - - - - (3,411) Less loss on sale of mortgage servicing rights - - 249 - 4,447 Less Banking segment noninterest expense 37,423 49,714 29,334 28,747 25,030 Adjusted Mortgage segment noninterest expense $ 20,117 $ 19,510 $ 19,553 $ 17,670 $ 21,253 Total noninterest income 37,017 37,820 35,657 31,087 31,332 Less Banking segment noninterest income 13,192 14,232 12,536 11,673 8,357 Less change in fair value on mortgage servicing rights (190) (893) (1,840) (501) - Adjusted Mortgage segment total revenue $ 24,015 $ 24,481 $ 24,961 $ 19,915 $ 22,975 Mortgage segment core efficiency ratio (tax-equivalent basis) 83.77% 79.69% 78.33% 88.73% 92.50%

GAAP reconciliation and use of non-GAAP financial measures Tangible assets and equity Return on average tangible equity (Dollars in thousands) 2017 2016 Tangible assets and equity Fourth Quarter Third Quarter Second Quarter First Quarter Fourth Quarter Tangible Assets Total assets $ 4,727,713 $ 4,581,943 $ 3,346,570 $ 3,166,459 $ 3,276,881 Less goodwill 137,190 138,910 46,867 46,867 46,867 Less intangibles, net 14,902 12,550 4,048 4,171 4,563 Tangible assets $ 4,575,621 $ 4,430,483 $ 3,295,655 $ 3,115,421 $ 3,255,451 Tangible Common Equity Total shareholders' equity $ 596,729 $ 572,528 $ 509,517 $ 342,142 $ 330,498 Less goodwill 137,190 138,910 46,867 46,867 46,867 Less intangibles, net 14,902 12,550 4,048 4,171 4,563 Tangible common equity $ 444,637 $ 421,068 $ 458,602 $ 291,104 $ 279,068 Common shares outstanding 30,535,517 30,526,592 28,968,160 24,154,323 24,107,660 Book value per common share $ 19.54 $ 18.75 $ 17.59 $ 14.16 $ 13.71 Tangible book value per common share $ 14.56 $ 13.79 $ 15.83 $ 12.05 $ 11.58 Total shareholders' equity to total assets 12.62% 12.50% 15.23% 10.81% 10.09% Tangible common equity to tangible assets 9.72% 9.50% 13.92% 9.34% 8.65% Net income $ 23,018 $ 8,388 $ 11,239 $ 9,753 $ 9,010 Return on tangible common equity 20.54% 7.90% 9.83% 13.59% 12.84% (Dollars in thousands) 2017 2016 Return on average tangible common equity Fourth Quarter Third Quarter Second Quarter First Quarter Fourth Quarter Total average shareholders' equity $ 578,856 $ 550,409 $ 398,805 $ 333,178 $ 318,986 Less average goodwill 138,093 108,220 46,839 46,839 46,839 Less intangibles, net 13,726 9,983 4,124 4,353 4,694 Average tangible common equity $ 427,037 $ 432,206 $ 347,842 $ 281,986 $ 267,453 Net income $ 23,018 $ 8,388 $ 11,239 $ 9,753 $ 9,010 Return on average tangible common equity 21.38% 7.70% 12.96% 14.03% 13.40%

GAAP reconciliation and use of non-GAAP financial measures Core return on average tangible equity Core return on average assets and equity (Dollars in thousands) 2017 2016 Core return on average tangible equity Fourth Quarter Third Quarter Second Quarter First Quarter Fourth Quarter Pre-tax net income $ 27,504 $ 12,990 $ 17,813 $ 15,178 $ 13,797 Adjustments: Add non-core items 2,644 16,664 2,765 874 2,426 Less core income tax expense 11,471 11,138 7,659 5,768 5,739 Core net income $ 18,677 $ 18,516 $ 12,919 $ 10,284 $ 10,484 Core return on average tangible common equity 17.35% 17.00% 14.90% 14.79% 15.60% (Dollars in thousands) 2017 2016 Core return on average assets and equity Fourth Quarter Third Quarter Second Quarter First Quarter Fourth Quarter Net income $ 23,018 $ 8,388 $ 11,239 $ 9,753 $ 9,010 Average assets 4,664,669 4,162,478 3,224,783 3,172,149 3,206,398 Average equity 578,856 550,409 398,805 333,178 318,986 Return on average assets 1.96% 80.00% 1.40% 1.25% 1.12% Return on average equity 15.78% 6.05% 11.30% 11.87% 11.24% Core net income 18,677 18,516 12,919 10,284 10,484 Core return on average assets 1.59% 1.76% 1.61% 1.31% 1.30% Core return on average equity 12.80% 13.35% 12.99% 12.52% 13.08%
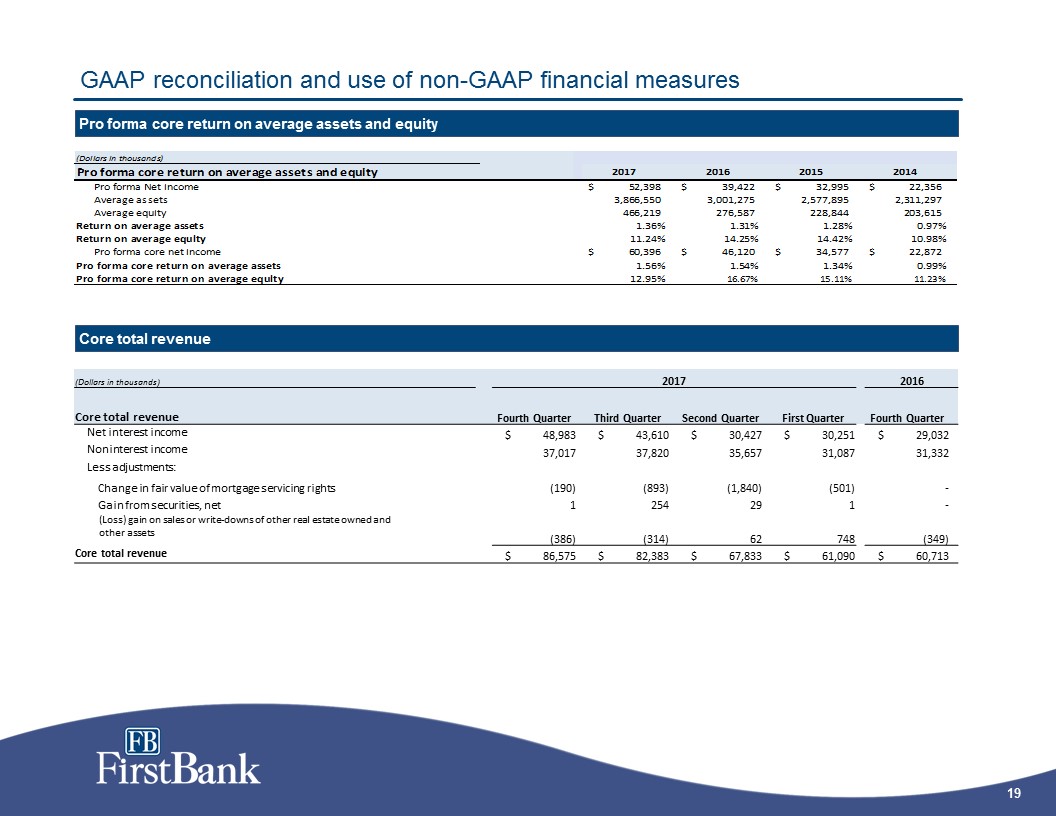
GAAP reconciliation and use of non-GAAP financial measures Pro forma core return on average assets and equity Core total revenue (Dollars in thousands) 2017 2016 Core total revenue Fourth Quarter Third Quarter Second Quarter First Quarter Fourth Quarter Net interest income $ 48,983 $ 43,610 $ 30,427 $ 30,251 $ 29,032 Noninterest income 37,017 37,820 35,657 31,087 31,332 Less adjustments: Change in fair value of mortgage servicing rights (190) (893) (1,840) (501) - Gain from securities, net 1 254 29 1 - (Loss) gain on sales or write-downs of other real estate owned and other assets (386) (314) 62 748 (349) Core total revenue $ 86,575 $ 82,383 $ 67,833 $ 61,090 $ 60,713
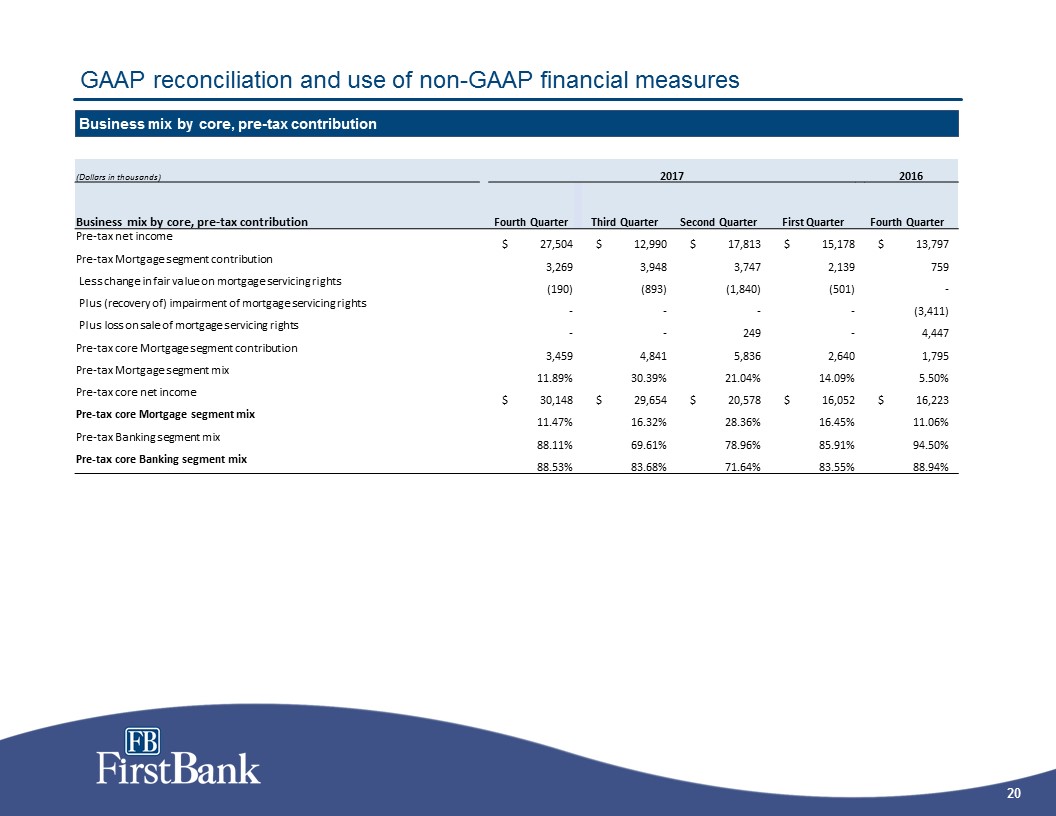
GAAP reconciliation and use of non-GAAP financial measures Business mix by core, pre-tax contribution (Dollars in thousands) 2017 2016 Business mix by core, pre-tax contribution Fourth Quarter Third Quarter Second Quarter First Quarter Fourth Quarter Pre-tax net income $ 27,504 $ 12,990 $ 17,813 $ 15,178 $ 13,797 Pre-tax Mortgage segment contribution 3,269 3,948 3,747 2,139 759 Less change in fair value on mortgage servicing rights (190) (893) (1,840) (501) - Plus (recovery of) impairment of mortgage servicing rights - - - - (3,411) Plus loss on sale of mortgage servicing rights - - 249 - 4,447 Pre-tax core Mortgage segment contribution 3,459 4,841 5,836 2,640 1,795 Pre-tax Mortgage segment mix 11.89% 30.39% 21.04% 14.09% 5.50% Pre-tax core net income $ 30,148 $ 29,654 $ 20,578 $ 16,052 $ 16,223 Pre-tax core Mortgage segment mix 11.47% 16.32% 28.36% 16.45% 11.06% Pre-tax Banking segment mix 88.11% 69.61% 78.96% 85.91% 94.50% Pre-tax core Banking segment mix 88.53% 83.68% 71.64% 83.55% 88.94%