Attached files
| file | filename |
|---|---|
| 8-K - 8-K - Atkore Inc. | jan2018lp8k.htm |

0
Public Lenders Presentation | January 2018

1
This presentation contains forward-looking statements that are subject to known and unknown risks and uncertainties, many of which are beyond our control. All statements other than statements of historical
fact included in this presentation are forward-looking statements. Forward-looking statements appearing throughout this presentation include, without limitation, statements regarding our intentions, beliefs,
assumptions or current expectations concerning, among other things, financial position; results of operations; cash flows; prospects; growth strategies or expectations; customer retention; the outcome (by
judgment or settlement) and costs of legal, administrative or regulatory proceedings, investigations or inspections, including, without limitation, collective, representative or any other litigation; and the impact of
prevailing economic conditions. You can identify forward-looking statements by the fact that they do not relate strictly to historical or current facts. These statements may include words such as “believes,”
“expects,” “may,” “will,” “shall,” “should,” “would,” “could,” “seeks,” “aims,” “projects,” “is optimistic,” “intends,” “plans,” “estimates,” “anticipates” and other comparable terms. We caution you that forward-looking
statements are not guarantees of future performance or outcomes and that actual performance and outcomes, including, without limitation, our actual results of operations, financial condition and liquidity, and
the development of the market in which we operate, may differ materially from those made in or suggested by the forward-looking statements contained in this presentation. In addition, even if our results of
operations, financial condition and cash flows, and the development of the market in which we operate, are consistent with the forward-looking statements contained in this presentation, those results or
developments may not be indicative of results or developments in subsequent periods. A number of important factors, including, without limitation, the risks and uncertainties discussed under the captions “Risk
Factors” and “Management’s Discussion and Analysis of Financial Condition and Results of Operations” in the Annual Report on Form 10-K for the fiscal year ended September 30, 2017, filed with the U.S.
Securities and Exchange Commission on November 29, 2017 (File No. 001-37793), could cause actual results and outcomes to differ materially from those reflected in the forward-looking statements. Because
of these risks, we caution that you should not place undue reliance on any of our forward-looking statements. New risks and uncertainties arise from time to time, and it is impossible for us to predict those
events or how they may affect us. Further, any forward-looking statement speaks only as of the date on which it is made. We undertake no obligation to revise the forward-looking statements in this
presentation after the date of this presentation.
Market data and industry information used throughout this presentation are based on management’s knowledge of the industry and the good faith estimates of management. We also relied, to the extent
available, upon management’s review of independent industry surveys, forecasts and publications and other publicly available information prepared by a number of third party sources. All of the market data
and industry information used in this presentation involves a number of assumptions and limitations which we believe to be reasonable, and you are cautioned not to give undue weight to such estimates.
Although we believe that these sources are reliable, we cannot guarantee the accuracy or completeness of this information, and we have not independently verified this information. While we believe the
estimated market position, market opportunity and market size information included in this presentation are generally reliable, such information, which is derived in part from management’s estimates and
beliefs, is inherently uncertain and imprecise. Projections, assumptions and estimates of our future performance and the future performance of the industry in which we operate are subject to a high degree of
uncertainty and risk due to a variety of factors, including those described above. These and other factors could cause results to differ materially from those expressed in our estimates and beliefs and in the
estimates prepared by independent parties.
We present Adjusted Net Sales, Adjusted EBITDA, Adjusted EBITDA margin, Net debt (total debt less cash and cash equivalents), and Leverage ratio (net debt or total debt less cash and cash equivalents,
over Adjusted EBITDA on trailing twelve month basis) to help us describe our operating and financial performance. Adjusted Net Sales, Adjusted EBITDA, Adjusted EBITDA margin, Net debt (total debt less
cash and cash equivalents) and Leverage ratio are non-GAAP financial measures commonly used in our industry and have certain limitations and should not be construed as alternatives to net income, net
sales and other income data measures (as determined in accordance with generally accepted accounting principles in the United States, or GAAP), or as better indicators of operating performance. Adjusted
Net Sales, Adjusted EBITDA, Adjusted EBITDA margin, Net debt (total debt less cash and cash equivalents), and Leverage ratio (net debt or total debt less cash and cash equivalents over Adjusted EBITDA on
a trailing twelve month basis), as defined by us may not be comparable to similar non-GAAP measures presented by other issuers. Our presentation of such measures should not be construed as an inference
that our future results will be unaffected by unusual or non-recurring items. See the appendix to this presentation for a reconciliation of Adjusted EBITDA to net income, and net debt over Adjusted EBITDA on a
trailing twelve month basis.
Fiscal Periods - The Company has a fiscal year that ends on September 30th. It is the Company's practice to establish quarterly closings using a 4-5-4 calendar. The Company's fiscal quarters end on the last
Friday in December, March and June.
Cautionary statements

2
Jim Mallak
Chief Financial Officer, Atkore International
Chuck Cohrs
Treasurer, Atkore International
Presenters
Joseph Pandolfo
Vice President, Deutsche Bank
John Williamson
Chief Executive Officer, Atkore International
Alvin Varughese
Director, Deutsche Bank
Keith Whisenand
Vice President - Investor Relations, Atkore International

3
1
2
4
3
5
Transaction overview
Atkore overview
Financial overview
Key credit highlights
Agenda
Appendix

4
• Atkore International Inc. (“Atkore” or the “Company”) is a leading manufacturer of Electric Raceway products primarily for the non-
residential and construction and renovation markets, as well as Mechanical Products and Solutions for the construction and industrial
markets
• Electrical Raceway products form the critical infrastructure that enable the deployment, isolation and protection of a structure’s
electrical circuitry from the original power source to the final outlet
• Mechanical Products and Solutions products frame, support and secure components in a broad range of structures, equipment
and systems
• Atkore continues its strong performance, generating pro forma1 TTM 12/29/17 Revenue, TTM 12/29/17 reported net income, and pro
forma1 TTM 12/29/17 Adjusted EBITDA of $1,653 million, $94 million, and $251 million respectively. These operating measures have
grown by 10.0%, 40%, and 6.0%, respectively, compared to the TTM period ended 12/30/16.
• The Company has strong free cash flow generation and has made substantial progress in deleveraging – from a 5.4x leverage ratio at
the time of its 2014 recapitalization to a 2.0x leverage ratio currently
• Atkore is seeking to raise $425 million of incremental 1st lien term loan
• The incremental loan will rank pari passu to the existing term loan facility and will have an identical covenant package and
maturity (December 2023) as the existing facility
• Use of proceeds will be to (1) repurchase approximately 17 million Atkore shares from CD&R at a purchase price of $375 million,
reducing CD&R’s ownership percentage to approximately 29% (fully diluted) of the Company, (2) repay the outstanding ABL
facility draw and (3) to pay fees and expenses
• Pro forma for the transaction, the Company will have a leverage ratio of 3.5x based on TTM 12/29/17 Adjusted EBITDA of $251 million
and net debt of $875 million2
Transaction overview
1 Pro forma TTM adjustments add the Adjusted EBITDA impact of acquisitions completed in FY 2017 from 12/30/2016 to the acquisition date of those transactions in
FY2017 for year over year Revenue and Adjusted EBITDA growth calculation. See non-GAAP reconciliations in appendix.
2 See Page 5 for reconciliation

5
Sources & Uses and Pro Forma2 Capitalization
1 Equity as of 1/12/18
2
Pro forma adjustments to capitalization calculations add this transaction to equity as of 1/12/18
3
Pro forma Adjusted EBITDA adjustments add the Adjusted EBITDA impact of acquisitions completed in FY 2017 from 10/1/2016 to the acquisition date of those transactions in FY2017.
See non-GAAP reconciliations in appendix
Sources Uses
Incremental 1st lien term loan $425 Share Repurchase $375
Cash from balance sheet $8 Paying down ABL $42
Cash to balance sheet $8
Fees and expenses $8
Total sources of funds $433 Total uses of funds $433
TTM
12/29/17
TTM
12/29/17
xPF Adj.
EBITDA
% Total
Cap.
Cash $40 8 (8) $40
Revolver $42 (42) $-- -- --
Incremental 1st lien term loan $-- 425 425 1.7x 21.3%
Existing 1st lien term loan $490 490 2.0x 24.6%
Total debt $532 $915 3.6x 45.9%
Net debt $492 $875 3.5x 43.9%
Existing equity1 1,454 (375) $1,079 4.3x 54.1%
Total equity $1,454 $1,079 4.3x 54.1%
Total capitalization $1,986 $1,994 7.9x 100.0%
Financial statistics
Pro forma Adj. EBITDA $251
Adjustments
+ -
Pro-forma capitalization
Pro forma
3

6
1
2
4
3
Transaction overview
Atkore overview
Financial overview
Key credit highlights
5 Appendix

7
$ 164
$ 235 $ 228
$ 236
FY 2015 FY 2016 FY 2017 TTM Q1 '18
9.5%
15.4% 15.1% 14.9%
■ #1 or #2 market positions in most of our products
■ Offer must-stock products to distribution and OEM customers
via single integrated platform
■ Established reputation as an industry leader in quality,
availability, delivery, value and innovation
■ Organized into two complementary segments: Electrical
Raceway and Mechanical Products & Solutions (“MP&S”)
■ U.S.-centric player with large addressable market and close
adjacent opportunities
Net Sales Breakdown
By reportable segment By end market
Addressable market opportunity
$1bn
$13
Bil
li
o
n
Electrical
raceway
market
$78
Billio
n
U.S. electrical
products market
$500mm
$3.8
Billio
n
U.S. mechanical
products &
solutions market
Electrical Raceway Mechanical Products & Solutions
U.S.
Construction
70%
OEM
16%
Int'l
8%
Other
6%
Electrical
Raceway
73%
Mechanical
Products &
Solutions
27%
Strong recent financial performance (Adjusted EBITDA)
Adj. EBITDA margin
($mm)
FY 2017 net sales: $1,504mm
$ 251
PF Adj. EBITDA
Atkore Overview

8
Atkore Overview: Transformation
■ Limited strategic vision
■ Little customer coordination
■ Underperforming leadership
■ No growth or M&A strategy
2011 2011 - 2017 Atkore strategy
■ Leading market positions/brands
■ Upgraded over 90% of leadership
■ Developed clear strategy
■ Implemented Atkore Business System
(“ABS”)
■ Transformed portfolio (10 acquisitions
and 8 divestitures / closures)
■ Invested in new product development
■ Improved quality, delivery & service
■ Reduced fixed overhead
■ Drive growth
− Market position expansion
− New product innovation
− M&A growth execution
− Remix portfolio to improve margin and multiple
■ Expand margin
− Strategic and tactical pricing
− Mix driven by innovation and pricing
− Raw material and material usage savings
− Manufacturing productivity savings
− Volume leverage
■ Deliver cash flow
− Strong cash flow from earnings
− Limited CapEx requirements
− Efficient Working Capital Management
Electrical
Raceway
44%
MP&S
30%
Divested
Businesses
26%
Proven track record with majority of growth from initiatives in Atkore’s control
Portfolio evolution
FY 2011 FY 2017
Adjusted EBITDA margin evolution
5.9%
15.1%
20%+
FY 2011
Adjusted
EBITDA
margin
Portfolio Commodity Strategic
pricing
and mix
management
Productivity FY 2017
Adjusted
EBITDA
margin
Further
opportunity
Illustrative
long-term
Adj. EBITDA
margin
Electrical
Raceway
73%
MP&S
27%

9
Atkore Overview: Atkore Business System
■ Market Intelligence, Benchmarking and VOC
Analysis
■ Market-based Evergreen Strategy
■ Dynamic Portfolio Management
■ Dynamic Product Management
■ Active Account and Channel Strategy
■ Culture of Customer Centric Innovation
■ Engagement and Alignment
■ Communication
■ Workforce Planning and Talent
Acquisition
■ Performance Management
■ Leadership Development
■ Aligned Incentives and
Compensation
■ Recognition
■ Continuous Improvement
Methodologies
■ Visual Workplace and Lean
Daily Management
■ Built in Quality
■ Information and Material Flow
■ Equipment Availability and
Reliability
■ Commercial Processes
Strategy
Process
People
Adjusted EBITDA margin increased 920bps1
Defective parts per million down 84%1
Perfect order rate increased from 81% to 94%1
ABS driving performance1
How we continuously improve the
business we have, and create
breakthrough to be the business
we want to become...
1 From FY 2011 to FY 2017.
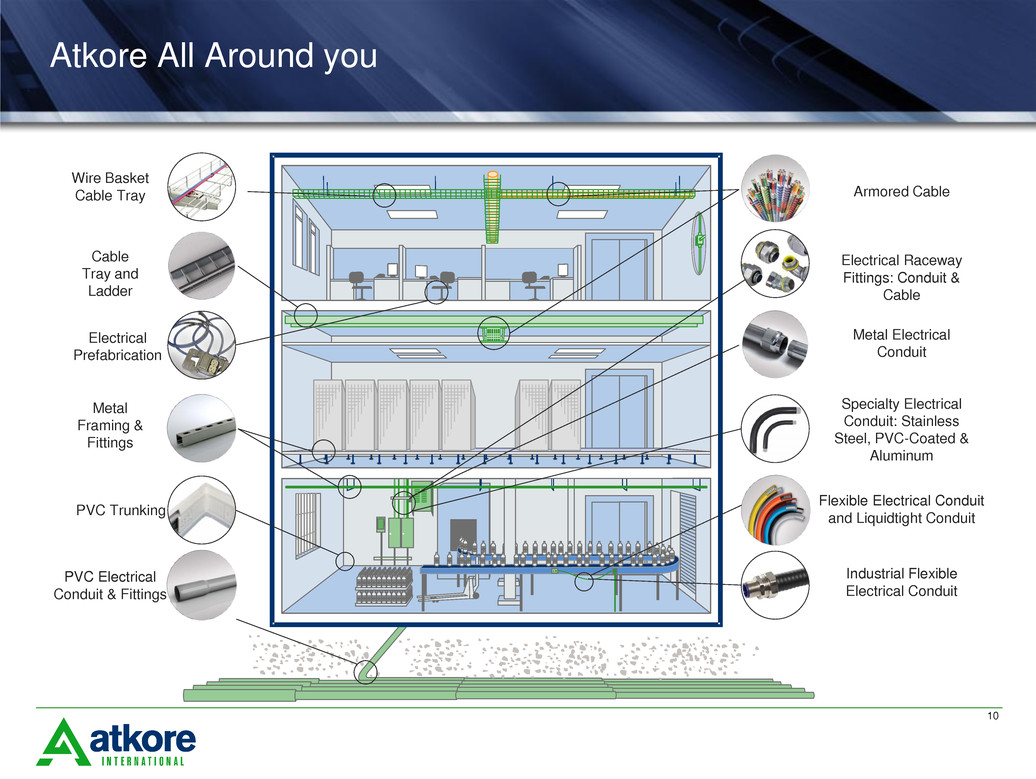
10
Atkore All Around you
Cable
Tray and
Ladder
Armored Cable
Metal
Framing &
Fittings
Flexible Electrical Conduit
and Liquidtight Conduit
PVC Electrical
Conduit & Fittings
Metal Electrical
Conduit
PVC Trunking
Wire Basket
Cable Tray
Industrial Flexible
Electrical Conduit
Electrical Raceway
Fittings: Conduit &
Cable
Specialty Electrical
Conduit: Stainless
Steel, PVC-Coated &
Aluminum
Electrical
Prefabrication

11
Atkore’ Electrical Raceway segment
$113
$182
$189 $203
10%
17% 17% 17%
6%
8%
10%
12%
14%
16%
18%
20%
FY 2015 FY 2016 FY 2017 TTM Dec 2017
Adjusted EBITDA ($mm) Adjusted EBITDA Margin
PVC Electrical
Conduit & Fittings
22%
Armored Cable &
Fittings
34%
Other
12%
Metal Electrical
Conduit & Fittings
32%
2017 net sales by product category
Adjusted EBITDA evolution ($mm)
Products that deploy, isolate and protect a structure’s electrical
circuitry from the original power source to the final outlet
■ Must-stock products for over 13,000 U.S. electrical distributor
branches
■ Range of solutions offers customers convenient and efficient
purchasing
■ Unique ability to co-load and bundle Electrical Raceway
products provides substantial competitive advantage
■ Industry leading quality, availability, delivery and innovation
Core products and market positions2
Principal brands:
Armored CablePVC ConduitSteel Conduit
#2 #2#1
Flexible and
Liquidtight Conduit
Cable Tray, Cable
Ladder & Fittings
#3 #3
1
1 Other represents total Electrical Raceway net sales for FY 2017 ($1,095mm) less Armored Cable & Fittings ($368mm), Metal Electrical Conduit & Fittings ($356mm) and
PVC Electrical Conduit & Fittings ($266mm).
FY 2017 net sales: $1,095mm
2 Management estimates based on market data and industry knowledge. Market share is based on U.S.
net sales relative to the estimated U.S. addressable market size, as of FY 2017.
12
Metal Framing
and Fittings
24%
Mechanical
Pipe
51%
Other
25%
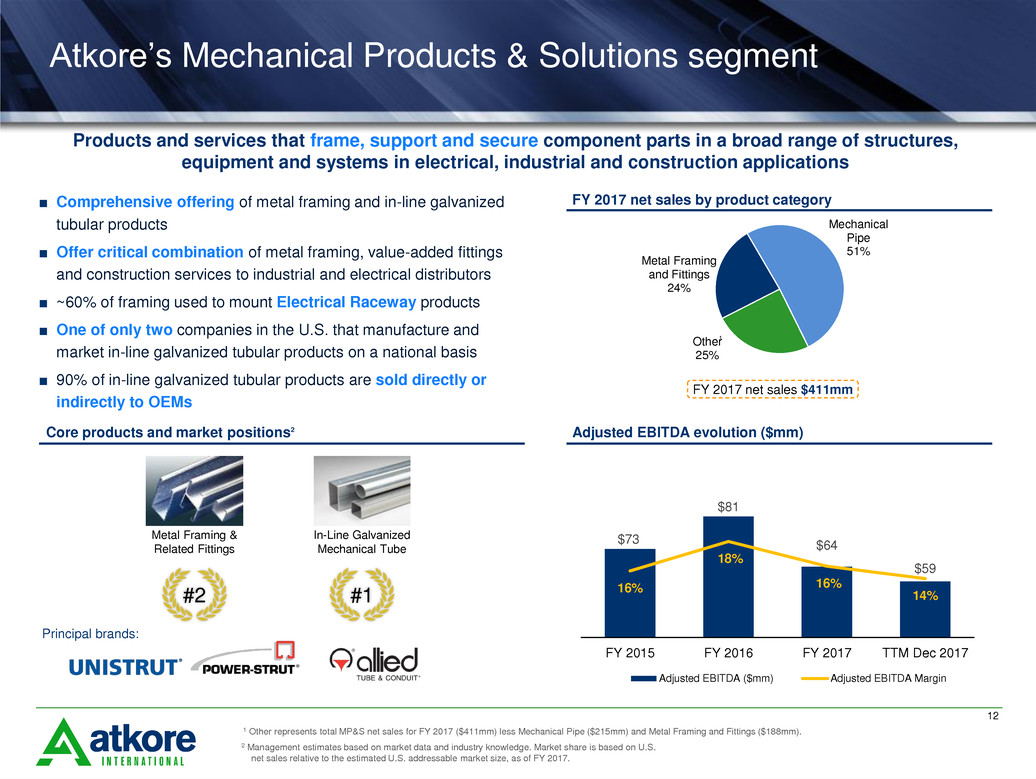
■ Comprehensive offering of metal framing and in-line galvanized
tubular products
■ Offer critical combination of metal framing, value-added fittings
and construction services to industrial and electrical distributors
■ ~60% of framing used to mount Electrical Raceway products
■ One of only two companies in the U.S. that manufacture and
market in-line galvanized tubular products on a national basis
■ 90% of in-line galvanized tubular products are sold directly or
indirectly to OEMs
FY 2017 net sales by product category
Products and services that frame, support and secure component parts in a broad range of structures,
equipment and systems in electrical, industrial and construction applications
Core products and market positions2
Principal brands:
Metal Framing &
Related Fittings
In-Line Galvanized
Mechanical Tube
#1#2
Adjusted EBITDA evolution ($mm)
$73
$81
$64
$59
16%
18%
16%
14%
8%
10%
12%
14%
16%
18%
20%
22%
24%
26%
FY 2015 FY 2016 FY 2017 TTM Dec 2017
Adjusted EBITDA ($mm) Adjusted EBITDA Margin
1
1 Other represents total MP&S net sales for FY 2017 ($411mm) less Mechanical Pipe ($215mm) and Metal Framing and Fittings ($188mm).
FY 2017 net sales $411mm
Atkore’s Mechanical Products & Solutions segment
2 Management estimates based on market data and industry knowledge. Market share is based on U.S.
net sales relative to the estimated U.S. addressable market size, as of FY 2017.

13
1
2
4
3
Transaction overview
Atkore overview
Financial overview
Key credit highlights
5 Appendix

14
Key Credit highlights
Leading market positions and strong brands
Superior customer value proposition with a compelling portfolio
Significant scale providing barriers to entry
Capitalize on attractive end-market growth dynamics
Execute on strategic pricing and mix opportunities
Expand product offering through innovation
Strong profitability with clear runway for further improvement
Strong cash flow generation and long-term track record of deleveraging
Support from a team built to outperform
1
2
3
4
5
Momentum &
runway for results
6
7
8
9
15
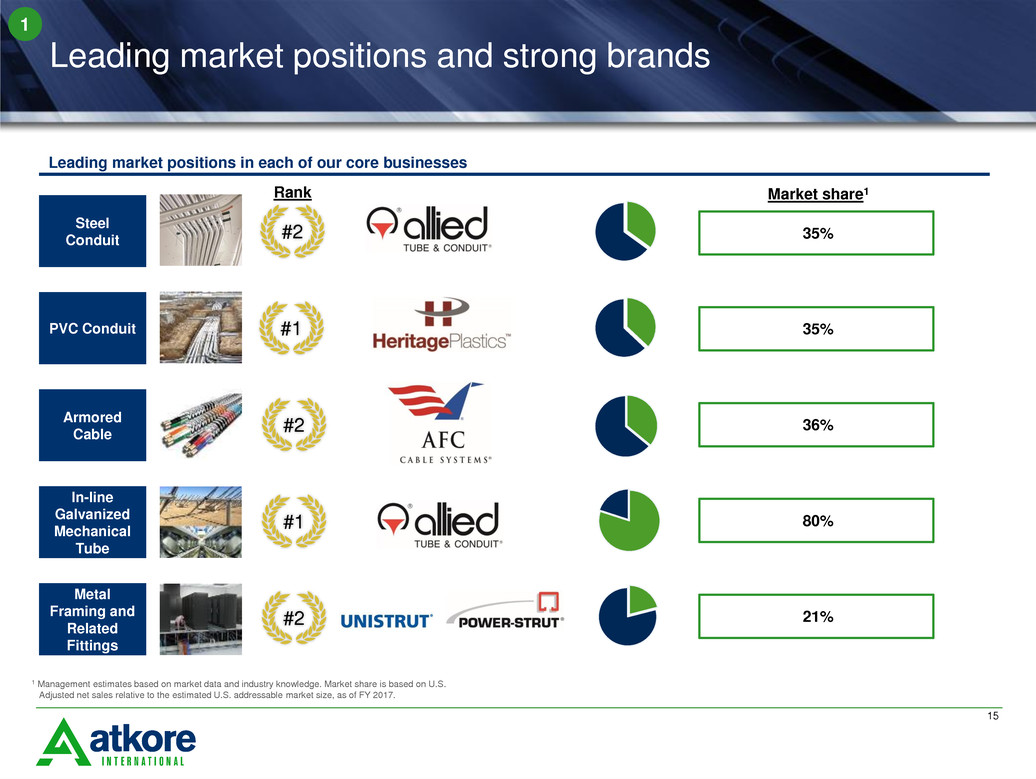
Leading market positions and strong brands
1
Leading market positions in each of our core businesses
#2
#1
#2
#1
#2
Rank
35%
35%
36%
80%
21%
Market share1
Steel
Conduit
PVC Conduit
Armored
Cable
In-line
Galvanized
Mechanical
Tube
Metal
Framing and
Related
Fittings
1 Management estimates based on market data and industry knowledge. Market share is based on U.S.
Adjusted net sales relative to the estimated U.S. addressable market size, as of FY 2017.

16
Superior customer value proposition with a compelling
portfolio
Global
Electrical
Distributors
Independent
Electrical
Distributors
Industrial
Distributors
& Big Box
Retail
■ Brands and reputation
■ Product breadth
■ Bundling, co-loading and value-add advantages
■ Quality, availability, delivery and service
2
Value proposition Blue chip customer base
17
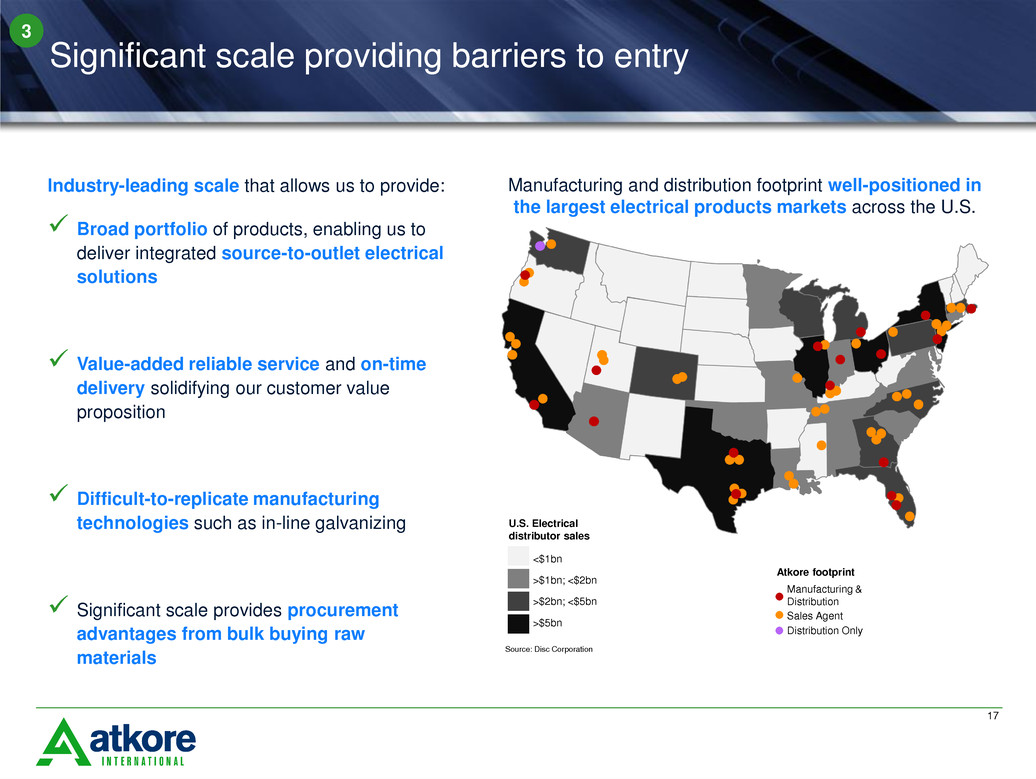
Significant scale providing barriers to entry
3
Industry-leading scale that allows us to provide:
Broad portfolio of products, enabling us to
deliver integrated source-to-outlet electrical
solutions
Value-added reliable service and on-time
delivery solidifying our customer value
proposition
Difficult-to-replicate manufacturing
technologies such as in-line galvanizing
Significant scale provides procurement
advantages from bulk buying raw
materials
Manufacturing and distribution footprint well-positioned in
the largest electrical products markets across the U.S.
Source: Disc Corporation
Manufacturing &
Distribution
Sales Agent
Distribution Only
Atkore footprint
>$5bn
>$1bn; <$2bn
>$2bn; <$5bn
<$1bn
U.S. Electrical
distributor sales
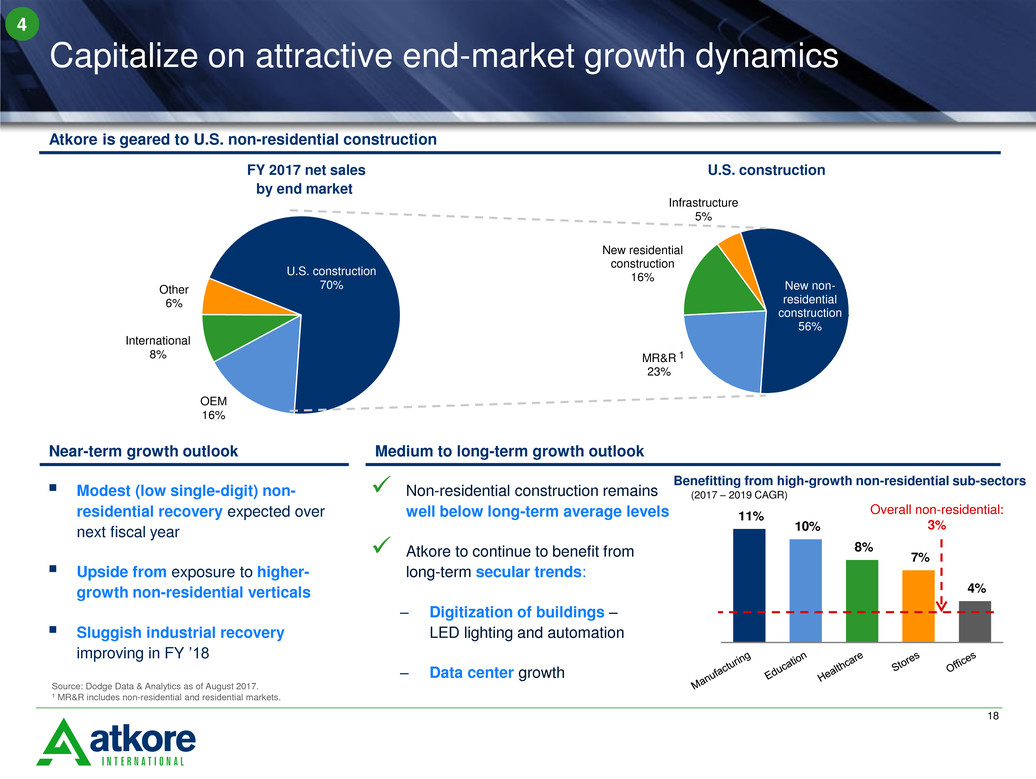
18
OEM
16%
International
8%
Other
6%
U.S. construction
70%
MR&R
23%
New residential
construction
16%
Infrastructure
5%
New non-
residential
construction
56%
Atkore is geared to U.S. non-residential construction
11%
10%
8%
7%
4%
Source: Dodge Data & Analytics as of August 2017.
1 MR&R includes non-residential and residential markets.
4
FY 2017 net sales
by end market
U.S. construction
1
Non-residential construction remains
well below long-term average levels
Atkore to continue to benefit from
long-term secular trends:
‒ Digitization of buildings –
LED lighting and automation
‒ Data center growth
Near-term growth outlook
Overall non-residential:
3%
Medium to long-term growth outlook
Modest (low single-digit) non-
residential recovery expected over
next fiscal year
Upside from exposure to higher-
growth non-residential verticals
Sluggish industrial recovery
improving in FY ’18
Benefitting from high-growth non-residential sub-sectors
(2017 – 2019 CAGR)
Capitalize on attractive end-market growth dynamics

19
5
Step 2:
Improve
performance
Step 1:
Develop
capabilities
Step 3:
Optimize
mix
Step 4:
Complete
roll-out
Developing mindset,
skillset and toolset on
how to price effectively
Better quality, delivery,
availability and ease of
doing business
Shifting sales to most
favorable products,
geographies and
customers
Leveraging pricing across
all business units and
applying lessons learned
to MP&S
P
ro
g
res
s
D
e
sc
ri
p
ti
o
n
(Launched in 2013)
(Launched in 2011; hit
critical level in 2015)
(Launched in 2014)
Situation: Underperforming
Raceway product category
Action: Purposefully shifted
mix to higher value products
(increased margin by 500bps in
some segments)
In
act
io
n
Situation: Created Raceway
pricing management tools
Action: Focused process
enabled margin improvement
of 1,000bps for some products
Situation: Lost Mechanical
Pipe business on price
Action: Re-won business at
higher margin and volume –
competitor couldn’t perform
900 bps of Adj. EBITDA margin improvement
(FY 2011 – FY 2017)
Opportunity to drive an
incremental 200 bps of
long-term Adj. EBITDA
margin improvement
(Launched in H2 2016)
Execute on strategic pricing and mix opportunities
20
Expand product offering through innovation
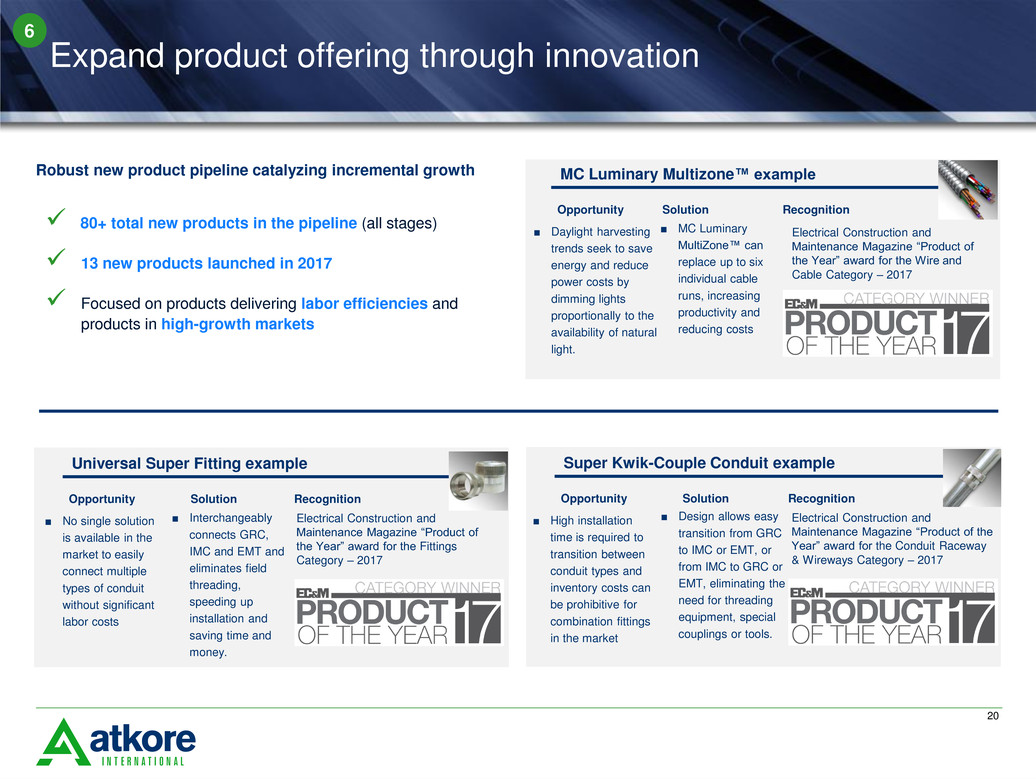
MC Luminary Multizone™ example
Opportunity RecognitionSolution
■ Daylight harvesting
trends seek to save
energy and reduce
power costs by
dimming lights
proportionally to the
availability of natural
light.
Electrical Construction and
Maintenance Magazine “Product of
the Year” award for the Wire and
Cable Category – 2017
■ MC Luminary
MultiZone™ can
replace up to six
individual cable
runs, increasing
productivity and
reducing costs
Robust new product pipeline catalyzing incremental growth
80+ total new products in the pipeline (all stages)
13 new products launched in 2017
Focused on products delivering labor efficiencies and
products in high-growth markets
6
Universal Super Fitting example
Opportunity RecognitionSolution
■ No single solution
is available in the
market to easily
connect multiple
types of conduit
without significant
labor costs
Electrical Construction and
Maintenance Magazine “Product of
the Year” award for the Fittings
Category – 2017
■ Interchangeably
connects GRC,
IMC and EMT and
eliminates field
threading,
speeding up
installation and
saving time and
money.
Super Kwik-Couple Conduit example
Opportunity RecognitionSolution
■ High installation
time is required to
transition between
conduit types and
inventory costs can
be prohibitive for
combination fittings
in the market
Electrical Construction and
Maintenance Magazine “Product of the
Year” award for the Conduit Raceway
& Wireways Category – 2017
■ Design allows easy
transition from GRC
to IMC or EMT, or
from IMC to GRC or
EMT, eliminating the
need for threading
equipment, special
couplings or tools.
21
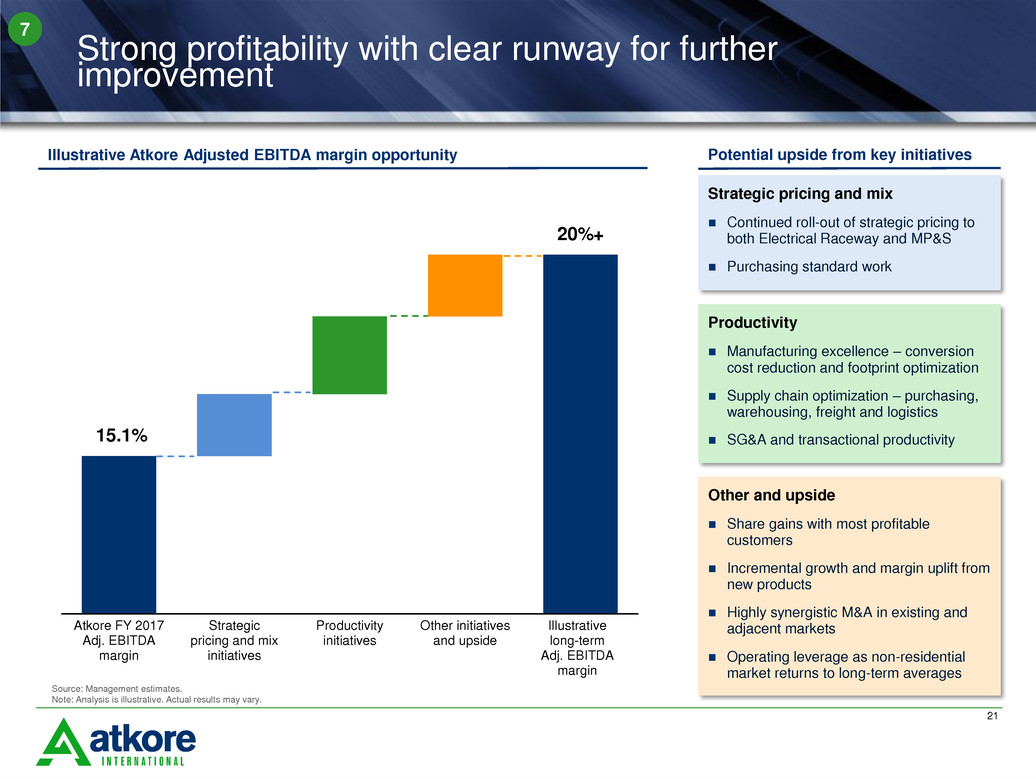
15.1%
20%+
Atkore FY 2017
Adj. EBITDA
margin
Strategic
pricing and mix
initiatives
Productivity
initiatives
Other initiatives
and upside
Illustrative
long-term
Adj. EBITDA
margin
Strategic pricing and mix
Continued roll-out of strategic pricing to
both Electrical Raceway and MP&S
Purchasing standard work
Illustrative Atkore Adjusted EBITDA margin opportunity Potential upside from key initiatives
Productivity
Manufacturing excellence – conversion
cost reduction and footprint optimization
Supply chain optimization – purchasing,
warehousing, freight and logistics
SG&A and transactional productivity
Other and upside
Share gains with most profitable
customers
Incremental growth and margin uplift from
new products
Highly synergistic M&A in existing and
adjacent markets
Operating leverage as non-residential
market returns to long-term averages
Source: Management estimates.
Note: Analysis is illustrative. Actual results may vary.
Strong profitability with clear runway for further
improvement
7

22
Strong cash flow generation and long-term track record of
deleveraging
1. See non-GAAP reconciliations in appendix. FY 2014, FY 2015, and FY 2016 utilize reported Adjusted EBITDA, FY 2017 and TTM Q1 2018 utilize Pro Forma Adjusted EBITDA
to calculate Net Debt / Adjusted EBITDA or Pro Forma Adjusted EBITDA
Adjusted EBITDA less CapEx ($mm)
Net Debt / Adjusted EBITDA or Pro Forma Adjusted
EBITDA
1
8
■Strong track record of deleveraging through
robust free cash flow generation and Adjusted
EBITDA growth
■Minimal maintenance capital expenditures
required to run the business
■Productivity-enhancing investments to expand
and update production capacity and improve
productivity have contributed significantly to
Adjusted EBITDA and Adjusted EBITDA margin
growth
(Adj. EBITDA – CapEx) / Adj. EBITDA
5.2x
3.5x
1.8x
2.1x
2.0x
FY 2014 FY 2015 FY 2016 FY 2017 TTM Q1 2018
$102
$137
$218
$203 $208
81% 84%
93% 89% 88%
FY 2014 FY 2015 FY 2016 FY 2017 TTM Q1 2018
’14 – TTMQ1’18
CAGR:
19%

23
Support from a team built to outperform
Name / Position
Relevant
Experience
Electrical Industry
Experience Experience Gained With
John P. Williamson
President & Chief Executive Officer
31 years 17 years
James A. Mallak
Chief Financial Officer
31 years 5 years
Peter Lariviere
President, Cable Solutions
26 years 11 years
Bill Waltz
Group President, Electrical Raceway
28 years 3 years
Mike Schulte
Group President, Mechanical Products & Solutions 21 years 3 years
Rodney Long
Senior Vice President of Sales 27 years 30 years
Gary Uren
Vice President,
Business Development & Strategy
30 years 36 years
Kevin Fitzpatrick
Vice President, Global Human Resources 26 years 6 years
Lisa Winter
Vice President, Corporate Communications 23 years 11 years
Dan Kelly
Vice President, General Counsel & Secretary 30 years 3 years
Steve Robins
Vice President, Strategic Sourcing 23 years 8 years
Keith Whisenand
Vice President, Investor Relations 21 years 1 year
9
24
1
2
4
3
Transaction overview
Atkore overview
Financial overview
Key credit highlights
5 Appendix

25
Impressive financial momentum
8.4%
10.6%
15.5% 15.1% 15.2%
FY
FY 2014 FY 2015 FY 2016 FY 2017 PF TTM 12/29/17
$127
$164
$235 $228
$251
FY
9.2%
7.1%
13.7% 14.8%
Q1
Adjusted EBITDA ($mm) and Y-o-Y growth rate1
-16%
Adjusted EBITDA margin and Y-o-Y margin improvement
-200
bps
Y-o-Y % growth / margin improvement
1 See non-GAAP reconciliations in appendix.
$32
$27
$48 $50
Q1
$27
$36
$58 $56
Q2
$30
$47
$67
$62
Q3
$37
$54
$61 $60
Q4
7.6%
9.3%
16.5%
15.0%
Q2
7.6%
12.1%
17.0%
15.6%
Q3
9.2%
13.6% 14.7% 15.2%
Q4
+77%
+4%
+32%
+62%
-3%
+57%
+44%
-7% +45%
+14%
-2%
+30%
+43%
-3%
+660
bps
+110
bps
+440
bps
+110
bps
+50
bps
+450
bps
+490
bps
-140
bps
+170
bps
+660
bps+
-150
bps
+220
bps
+490
bps
-40
bps
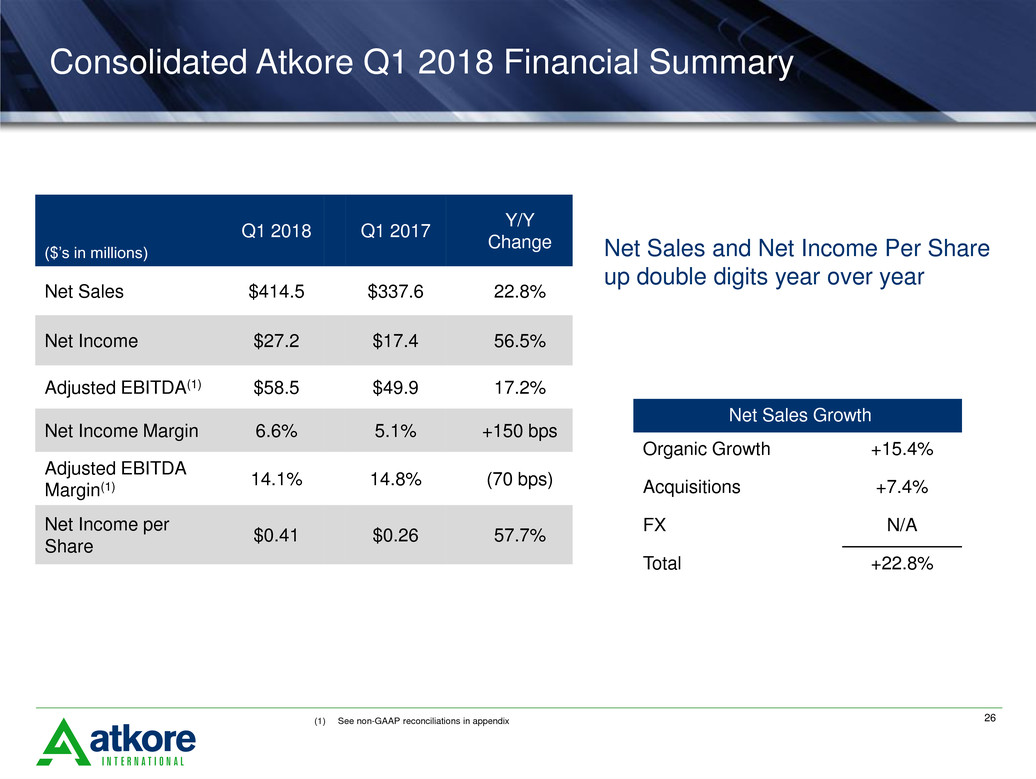
26
($’s in millions)
Q1 2018 Q1 2017
Y/Y
Change
Net Sales $414.5 $337.6 22.8%
Net Income $27.2 $17.4 56.5%
Adjusted EBITDA(1) $58.5 $49.9 17.2%
Net Income Margin 6.6% 5.1% +150 bps
Adjusted EBITDA
Margin(1)
14.1% 14.8% (70 bps)
Net Income per
Share
$0.41 $0.26 57.7%
(1) See non-GAAP reconciliations in appendix
Net Sales Growth
Organic Growth +15.4%
Acquisitions +7.4%
FX N/A
Total +22.8%
Net Sales and Net Income Per Share
up double digits year over year
26
Consolidated Atkore Q1 2018 Financial Summary

27
Consolidated Atkore Q1 2018 highlights
$59M
$1
$6
$50M
$8
$5
$3
2017 Volume Price vs. Cost M&A Productivity Other 2018
$415M
$338M
$32
$19
$25 $1
2017 Volume Price / Mix M&A FX 2018
Acquisitions and Organic Initiatives Driving Double
Digit Growth in Net Sales, Adjusted EBITDA, and
EPS
Volume growth of ~9%, excluding acquisitions,
reflects organic initiative traction and improving
market compared to a weak comparison period
Adjusted EBITDA margin increased ~10 basis
points excluding impact of the dollar for dollar pass-
through of raw material inflation
Passed through majority of material inflation;
Unfavorable product mix and timing of inflation were
small headwinds and impacted price
Repurchased ~350k shares at average price per
share of $19
Q1 Net Sales Bridge
Q1 Adjusted EBITDA Bridge
Inflation
($1.5M)
Variable
Comp ($1M)
Investments/
Other
Product Mix
&
Commodity
Timing
27

28Note: See non-GAAP reconciliation in appendix for Pro Forma Adjusted EBITDA and free cash flow.
1 FY15 and FY16 Adjusted Net Sales removing the impact of fence and sprinkler. See non-GAAP reconciliation in appendix
2 Free cash flow calculated as Adjusted EBITDA less changes in working capital and capital expenditures.
3 Free cash flow conversion is calculated as free cash flow / Adjusted EBITDA.
Historical financial results
As Reported Pro forma
$ millions, Fiscal Years ended September 25,
2015 and September 30, 2016 & 2017 2015 2016 2017
TTM
12/29/2017
TTM
12/29/2017
Adjusted Net Sales1 $ 1,551 $ 1,516 $ 1,504 $ 1,581 $ 1,653
% growth -2.3% -0.8% 5.2% 5.2%
Adjusted EBITDA $ 165 $ 235 $ 228 $ 236 $ 251
% margin1 10.6% 15.5% 15.2% 14.9% 15.2%
Capital expenditures $ 27 $ 17 $ 25 $ 29 $ 30
% of net sales 1.6% 1.1% 1.7% 1.8% 1.8%
Free cash flow2 $ 180 $ 233 $ 163 $ 186 $ 200
Free cash flow conversion3 109.4% 99.1% 71.5% 78.8% 79.6%

29
Historical financial detail by segment
Electric Raceway
$ millions, Fiscal Years ended September 25, 2015 and
September 30, 2016 & 2017 2015 2016 2017 TTM 12/29/2017
Adjusted Net Sales1 $ 1,080 $ 1,069 $ 1,095 $ 1,169
% growth -1.1% 2.4% 6.8%
Adjusted EBITDA $ 113 $ 182 $ 189 $ 203
% margin 10.4% 17.1% 17.3% 17.4%
Capital expenditures $ 13 $ 9 $ 13 $ 14
% net sales 1.2% 0.9% 1.2% 1.2%
Mechanical products & solutions
$ millions, Fiscal Years ended September 25, 2015 and
September 30, 2016 & 2017 2015 2016 2017 TTM 12/29/2017
Adjusted Net Sales1 $ 472 $ 449 $ 411 $ 413
% growth -4.8% -8.6% 0.6%
Adjusted EBITDA $ 73 $ 81 $ 64 $ 59
% margin 15.6% 18.0% 15.5% 14.3%
Capital expenditures $ 11 $ 6 $ 8 $ 9
% net sales 2.2% 1.4% 2.0% 2.2%
1 FY15 and FY16 Adjusted Net Sales, removing the impact of fence and sprinkler. See non-GAAP reconciliation in appendix

30
1
2
4
3
5
Transaction overview
Atkore overview
Financial overview
Key credit highlights
Appendix

31
Adjusted EBITDA reconciliation
Consolidated
$ millions, Fiscal Years ended September 26,
2014, September 25, 2015 and September 30,
2016 & 2017 2014 2015 2016 2017 TTM 12/29/17
Net income (loss) (74) (5) 59 85 94
Add:
Interest expense, net 44 45 42 27 23
Depreciation and amortization 59 59 55 55 58
Income tax expense (benefit) (33) (3) 28 41 38
EBITDA ($ 4) $ 96 $ 184 $ 207 $ 215
Adjustments to EBITDA:
Loss from discontinued operations (net of Income
taxes) 0 0 0 0 0
Loss (Gain) on extinguishment of debt 44 - (2) 10 0
Stock-based compensation 8 14 21 13 14
Gain on sale of joint venture - - - (6) (6)
Restructuring & impairments 47 33 4 1 1
Multi-employer pension withdrawal 2 1 0 -
Consulting fees 5 4 15 -
Certain legal matters - - 1 8 8
Transaction costs 5 6 8 5 4
Other items1 20 11 3 (10) 1
Adjusted EBITDA $ 127 $ 164 $ 235 $ 228 $ 236
Pro Forma Adjustments
Acquisitions add-back2 NA NA 17 19 15
Pro Forma Adjusted EBITDA $ 127 $ 164 $ 252 $ 247 $ 251
1
Represents other items, such as inventory reserves and adjustments, impact of Fence and sprinkler exit, realized or unrealized gain (loss) on foreign currency transactions and
release of certain indemnified uncertain tax positions.
2
Pro Forma adjustments add the Adjusted EBITDA for acquisitions completed in FY2017 not reported in the Adjusted EBITDA line due to acquisition date

32
Net Debt / Adjusted EBITDA reconciliation
$ millions, Fiscal Years ended September 25,
2015 and September 30, 2016 & 2017 2014 2015 2016 2017 TTM 12/29/17
Short-term debt and current maturities of long-
term debt 2.9 2.9 1.3 4.2 4.2
Long-term debt 690.0 649.3 629.0 571.9 527.8
Total Debt 692.9 652.2 630.3 576.1 532.0
Less Cash and Cash Equivalents (33.4) (80.6) (200.3) (45.7) (39.8)
Net Debt 659.5 571.6 430.0 530.4 492.3
Adjusted EBITDA $127 $164 $235 $ 228 $ 236
Pro Forma Adjustments
Acquisitions add-back1 19 15
Pro Forma Adjusted EBITDA $ 247 $ 251
Net Debt / Adjusted EBITDA 5.2x 3.5x 1.8x 2.3x 2.1x
Net Debt / Pro Forma1 Adjusted EBITDA 2.1x 2.0X
1
Pro Forma adjustments add the Adjusted EBITDA for acquisitions completed in FY2017 not reported in the Adjusted EBITDA line due to acquisition
date.
33
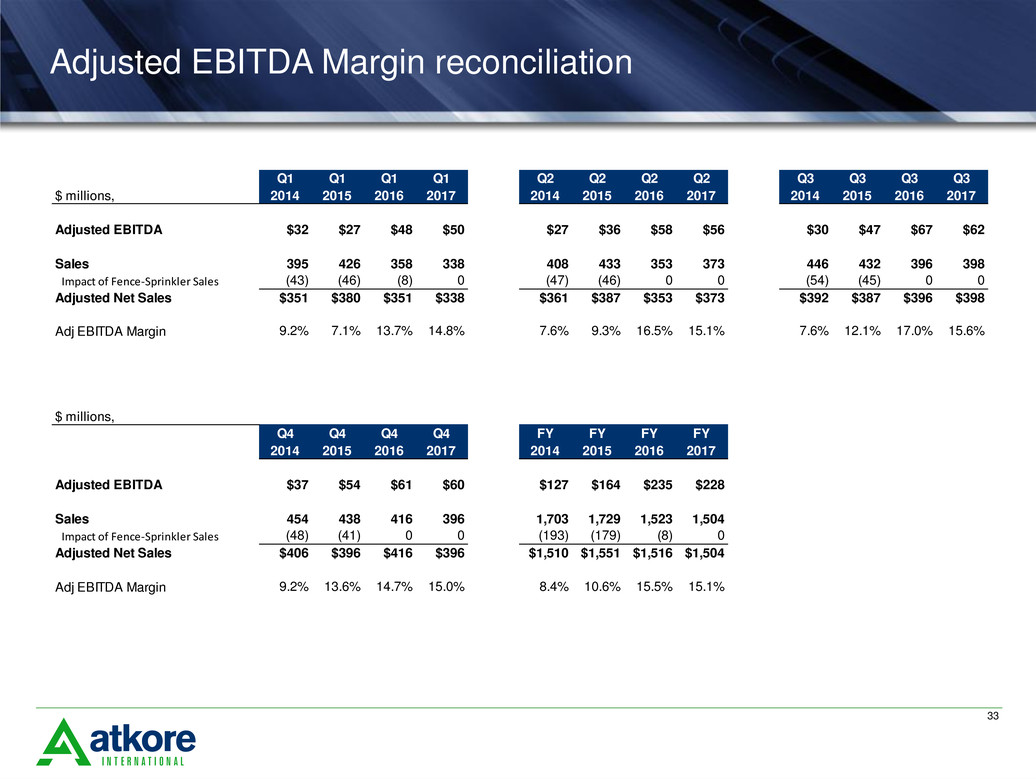
Adjusted EBITDA Margin reconciliation
Q1 Q1 Q1 Q1 Q2 Q2 Q2 Q2 Q3 Q3 Q3 Q3
$ millions, 2014 2015 2016 2017 2014 2015 2016 2017 2014 2015 2016 2017
Adjusted EBITDA $32 $27 $48 $50 $27 $36 $58 $56 $30 $47 $67 $62
Sales 395 426 358 338 408 433 353 373 446 432 396 398
Impact of Fence-Sprinkler Sales (43) (46) (8) 0 (47) (46) 0 0 (54) (45) 0 0
Adjusted Net Sales $351 $380 $351 $338 $361 $387 $353 $373 $392 $387 $396 $398
Adj EBITDA Margin 9.2% 7.1% 13.7% 14.8% 7.6% 9.3% 16.5% 15.1% 7.6% 12.1% 17.0% 15.6%
$ millions,
Q4 Q4 Q4 Q4 FY FY FY FY
2014 2015 2016 2017 2014 2015 2016 2017
Adjusted EBITDA $37 $54 $61 $60 $127 $164 $235 $228
Sales 454 438 416 396 1,703 1,729 1,523 1,504
Impact of Fence-Sprinkler Sales (48) (41) 0 0 (193) (179) (8) 0
Adjusted Net Sales $406 $396 $416 $396 $1,510 $1,551 $1,516 $1,504
Adj EBITDA Margin 9.2% 13.6% 14.7% 15.0% 8.4% 10.6% 15.5% 15.1%

34
Adjusted EBITDA reconciliation
Consolidated
1
Represents other items, such as inventory reserves and adjustments, impact of Fence and sprinkler exit, realized or unrealized gain (loss) on foreign
currency transactions and release of certain indemnified uncertain tax positions.
$ millions, Quarter End
Q1
FY2014
Q1
FY2015
Q1
FY2016
Q1
FY2017
Q2
FY2014
Q2
FY2015
Q2
FY2016
Q2
FY2017
Q3
FY2014
Q3
FY2015
Q3
FY2016
Q3
FY2017
Q4
FY2014
Q4
FY2015
Q4
FY2016
Q4
FY2017
Net income (loss) (6) (3) 9 17 (5) 6 14 19 (26) 19 21 27 (37) (27) 16 21
Add:
Interest expense, net 15 11 10 10 11 11 11 5 7 11 10 6 11 11 11 6
Depreciation and amortization 15 15 13 14 14 14 13 13 15 14 13 13 15 16 15 14
Income tax expense (benefit) (1) (0) 5 6 1 3 9 12 (16) (3) 11 11 (17) (3) 4 12
EBITDA $23 $23 $37 $46 $21 $34 $47 $50 ($20) $42 $55 $58 ($28) ($2) $46 $53
Adjustments to EBITDA:
Loss from discontinued operations (net
of Income taxes) 0 0 0 0 0 0 0 0 0 0 0 0 (0) 0 0 0
Loss (Gain) on extinguishment of debt 0 0 0 10 0 0 (2) 0 44 0 0 0 0 0 0 0
Stock-based compensation 1 1 2 3 1 0 10 4 1 1 5 3 6 11 4 3
Gain on sale of joint venture 0 0 0 0 0 0 0 (6) 0 0 0 0 0 0 0 0
Restructuring & impairments 0 0 1 0 0 0 1 0 1 0 0 (0) 46 32 2 1
Multi-employer pension withdrawal 0 0 0 0 0 0 0 0 0 0 0 0 0 0 0 0
Consulting fees 2 1 1 0 2 1 1 0 1 1 14 0 1 1 0 0
Certain legal matters 0 0 0 0 0 0 0 8 0 0 1 (0) 0 0 0 0
Transaction costs 2 1 1 2 1 1 3 0 0 3 2 1 1 2 2 2
Other items
1
4 2 7 (11) 3 (0) (1) 0 2 (0) (10) 0 11 10 7 0
Adjusted EBITDA $32 $27 $48 $50 $27 $36 $58 $56 $30 $47 $67 $62 $37 $54 $61 $60
35
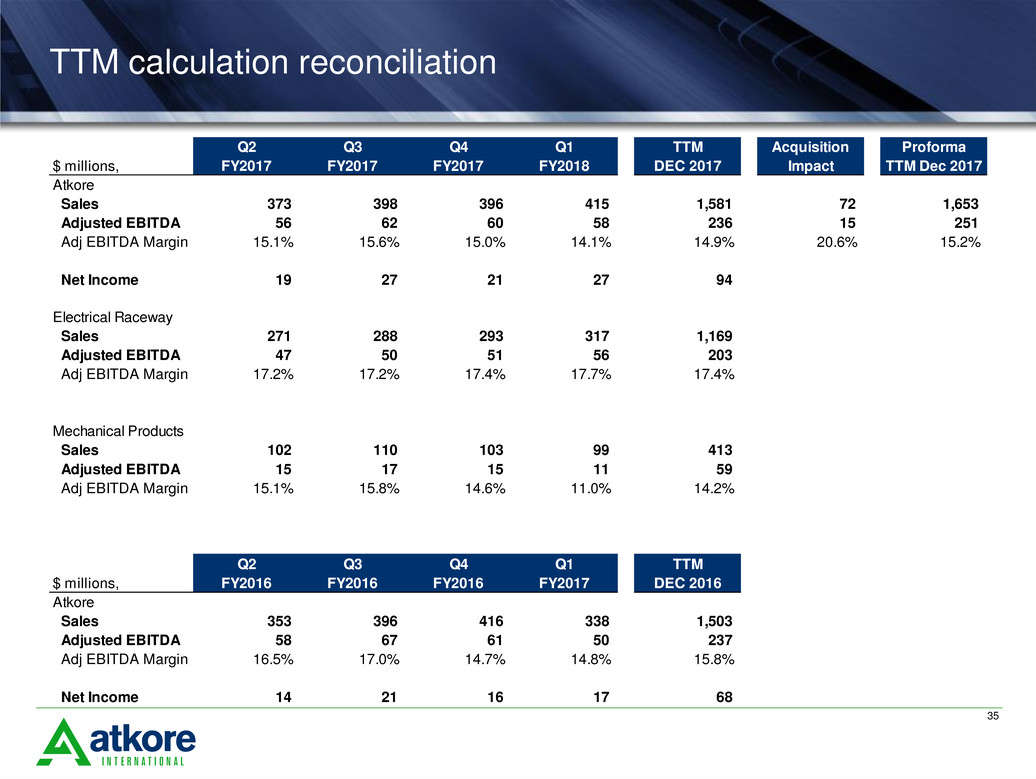
TTM calculation reconciliation
Q2 Q3 Q4 Q1 TTM Acquisition Proforma
$ millions, FY2017 FY2017 FY2017 FY2018 DEC 2017 Impact TTM Dec 2017
Atkore
Sales 373 398 396 415 1,581 72 1,653
Adjusted EBITDA 56 62 60 58 236 15 251
Adj EBITDA Margin 15.1% 15.6% 15.0% 14.1% 14.9% 20.6% 15.2%
Net Income 19 27 21 27 94
Electrical Raceway
Sales 271 288 293 317 1,169
Adjusted EBITDA 47 50 51 56 203
Adj EBITDA Margin 17.2% 17.2% 17.4% 17.7% 17.4%
Mechanical Products
Sales 102 110 103 99 413
Adjusted EBITDA 15 17 15 11 59
Adj EBITDA Margin 15.1% 15.8% 14.6% 11.0% 14.2%
Q2 Q3 Q4 Q1 TTM
$ millions, FY2016 FY2016 FY2016 FY2017 DEC 2016
Atkore
Sales 353 396 416 338 1,503
Adjusted EBITDA 58 67 61 50 237
Adj EBITDA Margin 16.5% 17.0% 14.7% 14.8% 15.8%
Net Income 14 21 16 17 68
36
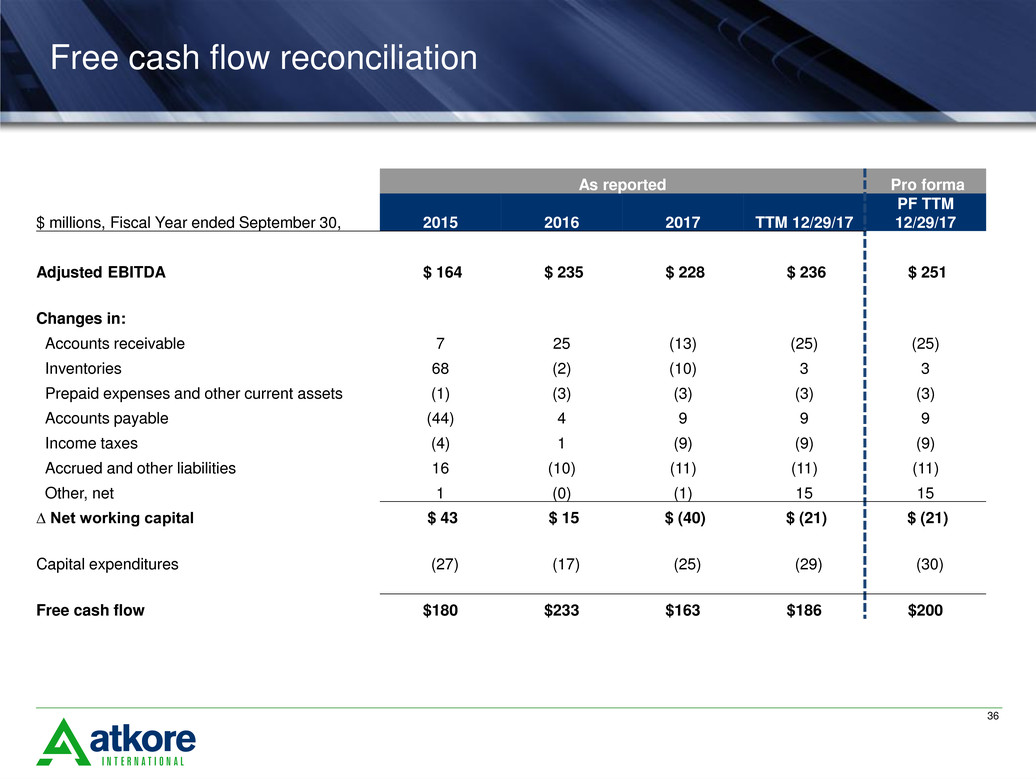
Free cash flow reconciliation
As reported Pro forma
$ millions, Fiscal Year ended September 30, 2015 2016 2017 TTM 12/29/17
PF TTM
12/29/17
Adjusted EBITDA $ 164 $ 235 $ 228 $ 236 $ 251
Changes in:
Accounts receivable 7 25 (13) (25) (25)
Inventories 68 (2) (10) 3 3
Prepaid expenses and other current assets (1) (3) (3) (3) (3)
Accounts payable (44) 4 9 9 9
Income taxes (4) 1 (9) (9) (9)
Accrued and other liabilities 16 (10) (11) (11) (11)
Other, net 1 (0) (1) 15 15
∆ Net working capital $ 43 $ 15 $ (40) $ (21) $ (21)
Capital expenditures (27) (17) (25) (29) (30)
Free cash flow $180 $233 $163 $186 $200

37
$1,504M$99
$1 $5
$1,523M
$87
2016 Volume Price / Mix M&A FX 2017
Working
Days
($29M)
Direct
Solar
($33M)
2017
Acquisitions
+$7M
Fence &
Sprinkler ($8M)
FY 2017 Net Sales Bridge
$228M
$26
$0
$235M
$18 $1
2016 Volume Price vs. Cost Productivity /
Other
M&A / FX 2017
Working
Days
($6M)
Direct
Solar
($14M)
FY 2017 Adjusted EBITDA Bridge
Net Income of $84.6M and Earnings per
share of $1.27 were up 44% and 35% year
over year, respectively
Passed through $87M raw material inflation
Over-delivered M&A capital allocation goal
Delivered $14M productivity savings
Expanded capabilities to bring innovations
to market
Improved ease of doing business with
Atkore (Agent Portal / Order to Cash System)
FY 2017 Highlights
Year ended September 30, 2017
