Attached files
| file | filename |
|---|---|
| 8-K - 8-K - ACCURAY INC | a18-2387_18k.htm |
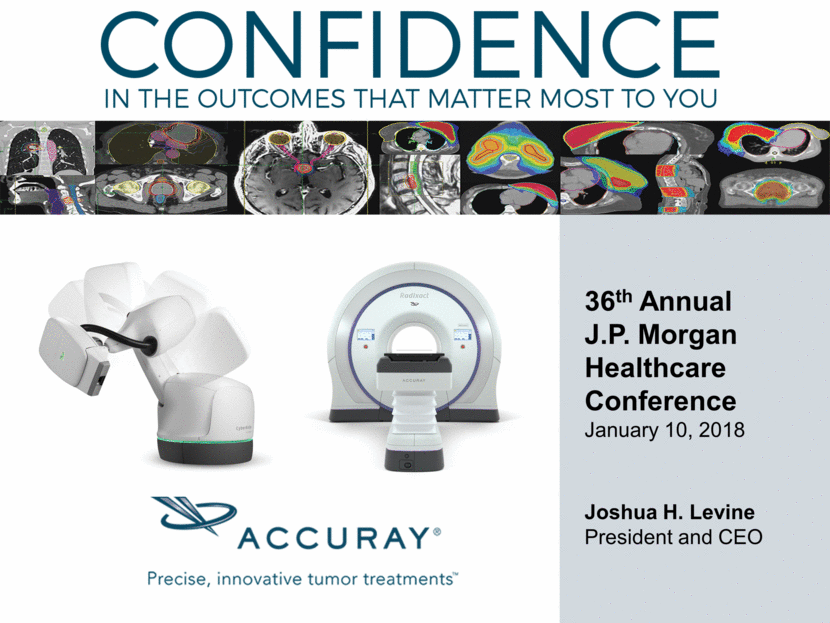
36th Annual J.P. Morgan Healthcare Conference January 10, 2018 Joshua H. Levine President and CEO
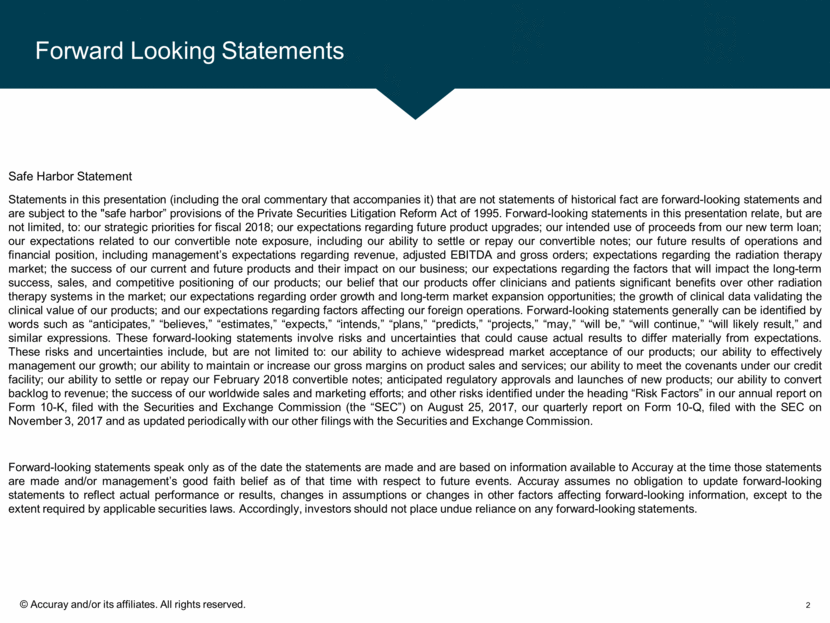
Safe Harbor Statement Statements in this presentation (including the oral commentary that accompanies it) that are not statements of historical fact are forward-looking statements and are subject to the "safe harbor” provisions of the Private Securities Litigation Reform Act of 1995. Forward-looking statements in this presentation relate, but are not limited, to: our strategic priorities for fiscal 2018; our expectations regarding future product upgrades; our intended use of proceeds from our new term loan; our expectations related to our convertible note exposure, including our ability to settle or repay our convertible notes; our future results of operations and financial position, including management’s expectations regarding revenue, adjusted EBITDA and gross orders; expectations regarding the radiation therapy market; the success of our current and future products and their impact on our business; our expectations regarding the factors that will impact the long-term success, sales, and competitive positioning of our products; our belief that our products offer clinicians and patients significant benefits over other radiation therapy systems in the market; our expectations regarding order growth and long-term market expansion opportunities; the growth of clinical data validating the clinical value of our products; and our expectations regarding factors affecting our foreign operations. Forward-looking statements generally can be identified by words such as “anticipates,” “believes,” “estimates,” “expects,” “intends,” “plans,” “predicts,” “projects,” “may,” “will be,” “will continue,” “will likely result,” and similar expressions. These forward-looking statements involve risks and uncertainties that could cause actual results to differ materially from expectations. These risks and uncertainties include, but are not limited to: our ability to achieve widespread market acceptance of our products; our ability to effectively management our growth; our ability to maintain or increase our gross margins on product sales and services; our ability to meet the covenants under our credit facility; our ability to settle or repay our February 2018 convertible notes; anticipated regulatory approvals and launches of new products; our ability to convert backlog to revenue; the success of our worldwide sales and marketing efforts; and other risks identified under the heading “Risk Factors” in our annual report on Form 10-K, filed with the Securities and Exchange Commission (the “SEC”) on August 25, 2017, our quarterly report on Form 10-Q, filed with the SEC on November 3, 2017 and as updated periodically with our other filings with the Securities and Exchange Commission. Forward-looking statements speak only as of the date the statements are made and are based on information available to Accuray at the time those statements are made and/or management’s good faith belief as of that time with respect to future events. Accuray assumes no obligation to update forward-looking statements to reflect actual performance or results, changes in assumptions or changes in other factors affecting forward-looking information, except to the extent required by applicable securities laws. Accordingly, investors should not place undue reliance on any forward-looking statements. Forward Looking Statements 2
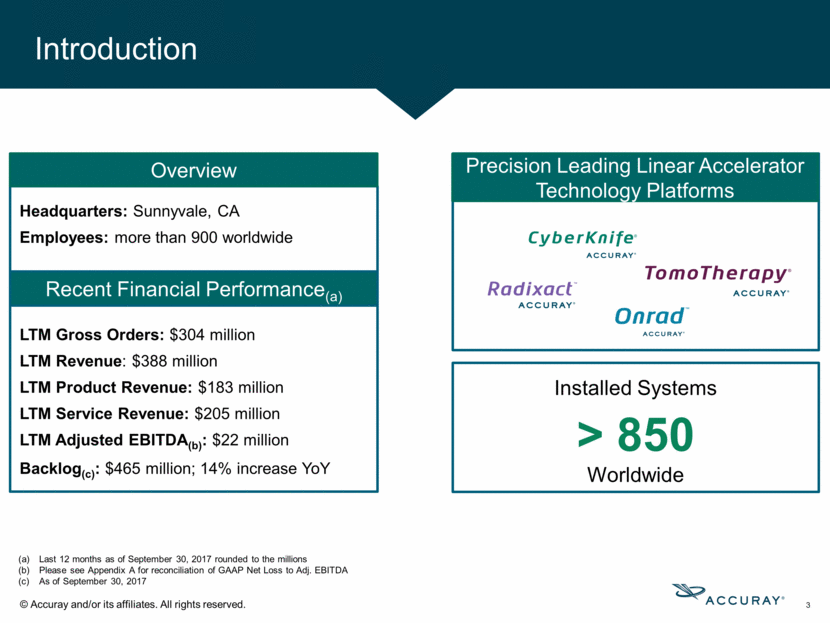
Introduction 3 Installed Systems > 850 Worldwide LTM Gross Orders: $304 million LTM Revenue: $388 million LTM Product Revenue: $183 million LTM Service Revenue: $205 million LTM Adjusted EBITDA(b): $22 million Backlog(c): $465 million; 14% increase YoY Recent Financial Performance(a) Headquarters: Sunnyvale, CA Employees: more than 900 worldwide Last 12 months as of September 30, 2017 rounded to the millions Please see Appendix A for reconciliation of GAAP Net Loss to Adj. EBITDA As of September 30, 2017 Overview Precision Leading Linear Accelerator Technology Platforms
Our Market Radiation Therapy Growth Opportunity* 4 * Source: “Expanding global access to radiotherapy,” published in The Lancet Oncology in September 2015 Radiation Therapy Comparative cost effectiveness 3x 5x 3x $2T Global Economic Burden in 2010 10% of patients have access to Radiation Therapy in low income countries 50-60% of cancer patients would benefit from Radiation Therapy 1x RT Surgery Chemo / Immuno
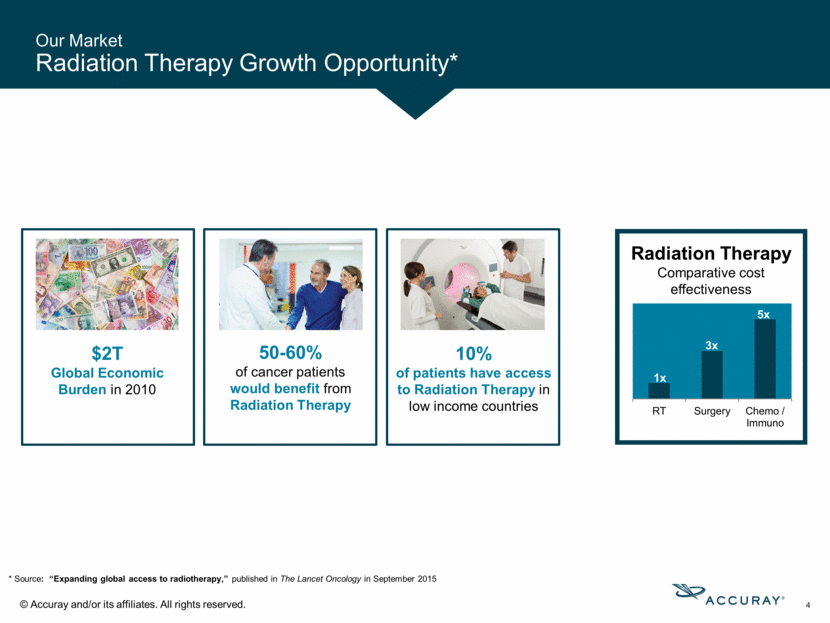
Radiation Therapy Capacity Gap Drives Global Demand 5 *Source: The Lancet Oncology Commission – “Expanding Global Access to Radiotherapy, Volume 16 September 2015 Edition. Linear Accelerators Needed by 2035 * Linear Accelerators 2015 13,100 Gap 8,700 2035: Needed 21,800 Existing Gap
Fiscal 2018 Key Priorities 6 Capitalize on improved product performance / reliability from our latest generation products Drive order / revenue growth that exceeds overall market growth rates Execute hardware upgrade and software roadmap Accelerate backlog conversion to revenue in distributor markets Continue to reduce overall debt as cash generation improves
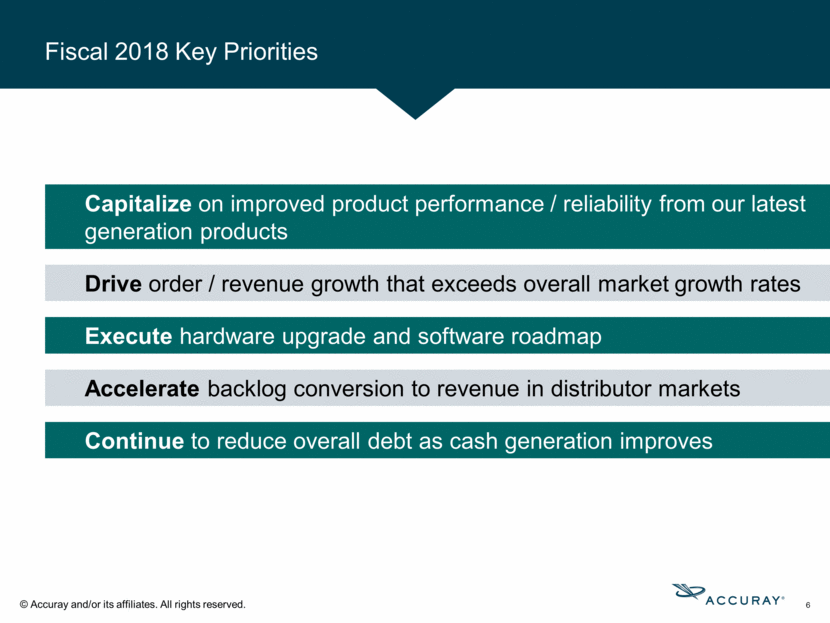
Strong Portfolio Alignment with Market Needs 7 IMRT 5-year market growth estimate 2015-2020: +40%* SBRT 5-year market growth estimate 2015-2020: +31%* *Source: U.S. data. The Advisory Board Company – Service Line Forecast Compendium, 2016 Edition. Robotic SBRT Sub-millimeter precision Spares healthy tissue Real-time motion management and beam correction Dose contouring ability due to unique helical treatment delivery Spares healthy tissue Radixact™ System designed for faster treatment; improved treatment planning system IG-IMRT
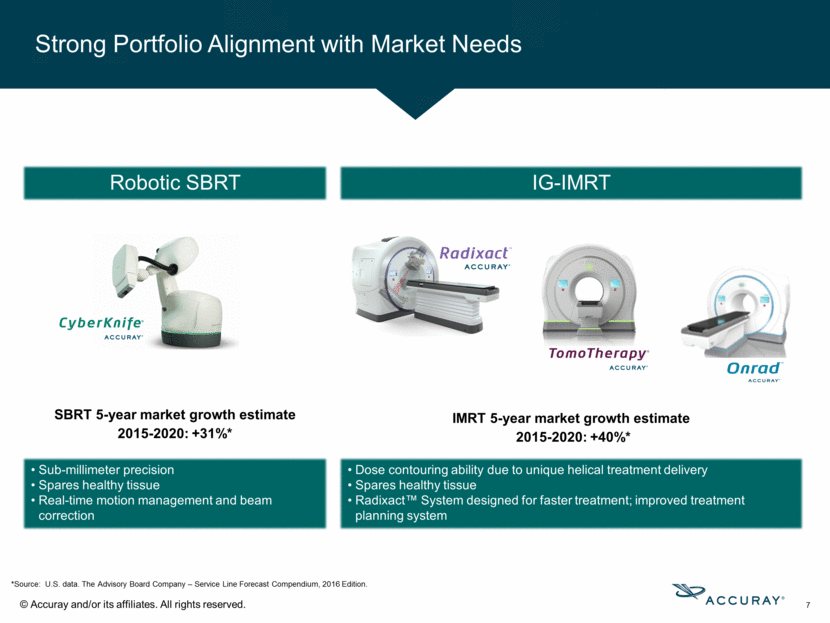
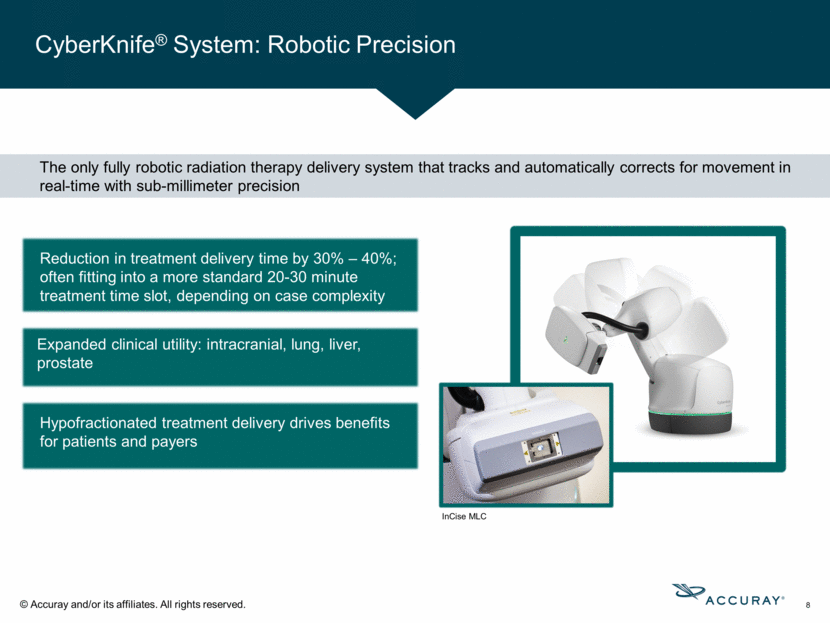
CyberKnife® System: Robotic Precision 8 Reduction in treatment delivery time by 30% – 40%; often fitting into a more standard 20-30 minute treatment time slot, depending on case complexity Hypofractionated treatment delivery drives benefits for patients and payers Expanded clinical utility: intracranial, lung, liver, prostate The only fully robotic radiation therapy delivery system that tracks and automatically corrects for movement in real-time with sub-millimeter precision InCise MLC
CyberKnife® SBRT Clinical Studies 9 Long-term Prostate Treatment Results * * Source: Meier et al. Five-Year Outcomes From a Multicenter Trial of Stereotactic Body Radiation Therapy for Low- and Intermediate-Risk Prostate Cancer. Int J Radiat Oncol Biol Phys. 2016 Oct 1;96(2S):S33-S34; abstract 74; Five-Year Outcomes from a Prospective Multi-Institutional Trial of Heterogeneous Dosing Stereotactic Body Radiotherapy (SBRT) for Low- and Intermediate-Risk Prostate Cancer, a study was presented at the American Society of Clinical Oncology Genitourinary Cancers Symposium (ASCO GU) in Orlando, Florida, February 16 – 18, 2017; and Stereotactic Body Radiotherapy for Low-Risk Prostate Cancer: A Ten-Year Analysis, Cureus, September 9, 2017. 97% of low-and intermediate-risk patients had excellent cancer control five years after treatment; serious side effects were rare (Dr. Meier Study – multi-center) 100% of low-risk and 89% of intermediate-risk patients had excellent cancer control five years after treatment; serious side effects were rare (Dr. Fuller Study – multi-center) 98% of low-risk patients had cancer control 10 years after treatment; serious side effects were rare (Dr. Katz Study)
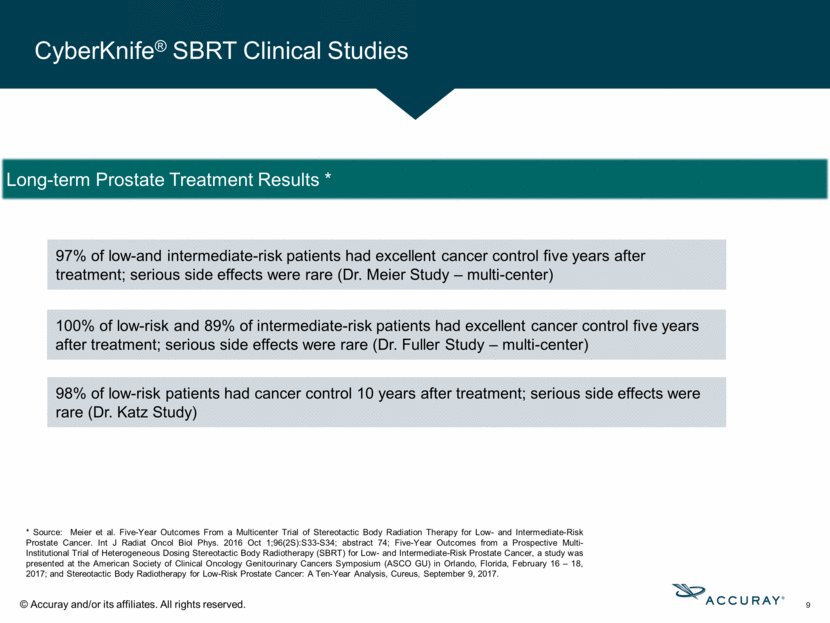
High Treatment Precision for Broader Case Mix Treatment of simple and complex cases Adaptive treatment and retreatment planning Radixact™ System: A Do-it-All Workhorse System Newest Generation TomoTherapy® System 10 Faster, More Efficient, Reliable Delivery Faster linear accelerator and improved imaging compared to prior generation Viable solution for single and dual vault facilities Accuray PrecisionTM Treatment Planning & iDMS Data Management System Differentiating Features Can be installed in rooms ~300 square feet Higher contrast Fanbeam CT imaging (superior to Conebeam) Helical IMRT delivery means fewer arcs to achieve acceptable dose quality and less treatment time Platform for Leading Edge Innovation Compatible with the system upgrade pathway to motion management functionality, currently under development
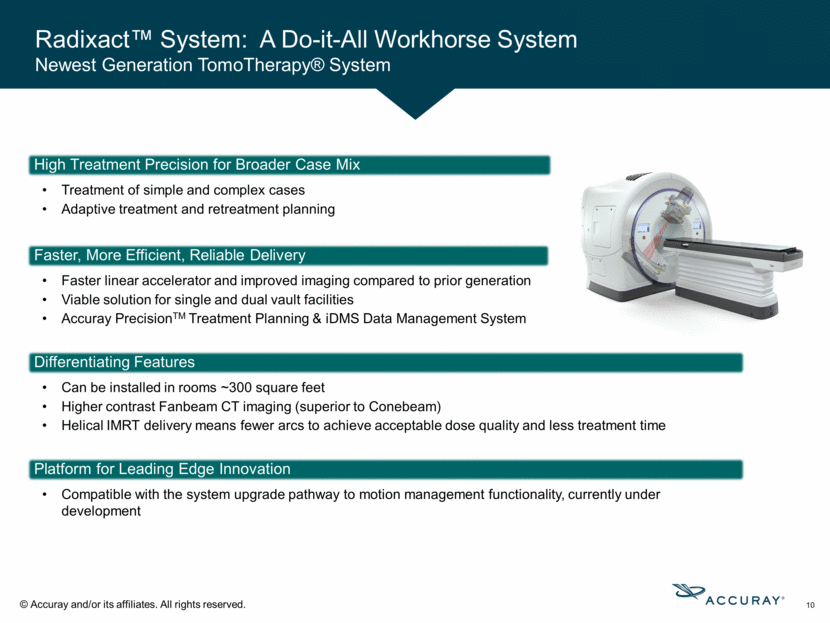
CyberKnife® & RadixactTM Platform Roadmaps * Clinical Quality, Speed, Ease of Use 11 Currently Under Development: Imaging Innovation Motion Compensation * Under Development - Not available for commercial sale CyberKnife Radixact Currently Under Development: Integrated High Definition Imaging Adaptive Therapy Next Generation Optimization Hardware: Imaging improvements across both platforms for more efficient workflows and patient set-up Software: Enhancing and improving treatment speed and device efficiency (speed and throughput)
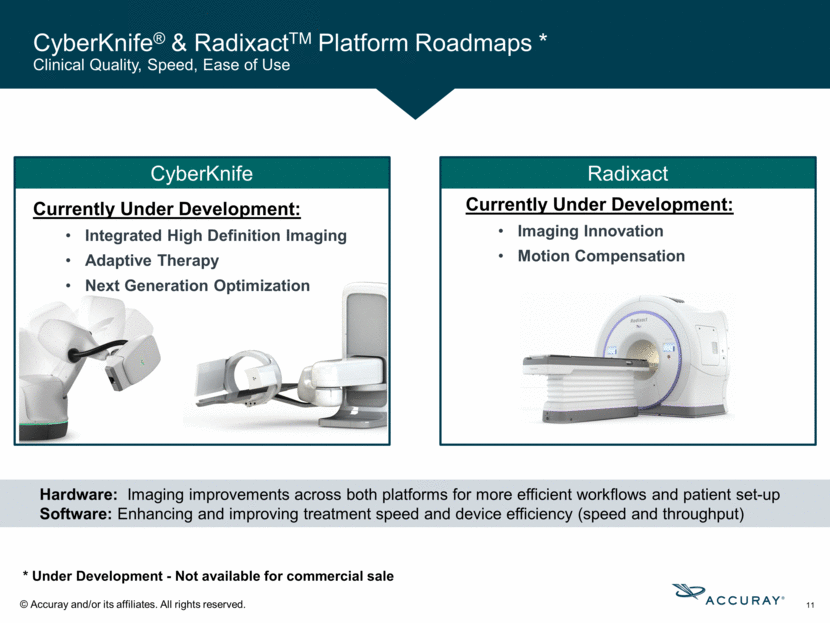
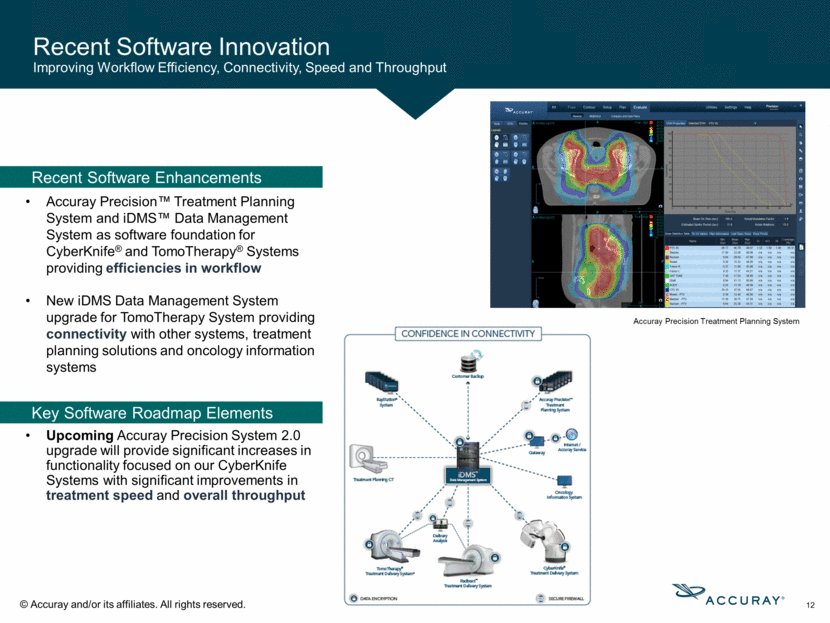
Accuray Precision™ Treatment Planning System and iDMS™ Data Management System as software foundation for CyberKnife® and TomoTherapy® Systems providing efficiencies in workflow New iDMS Data Management System upgrade for TomoTherapy System providing connectivity with other systems, treatment planning solutions and oncology information systems Recent Software Innovation Improving Workflow Efficiency, Connectivity, Speed and Throughput 12 Accuray Precision Treatment Planning System Upcoming Accuray Precision System 2.0 upgrade will provide significant increases in functionality focused on our CyberKnife Systems with significant improvements in treatment speed and overall throughput Recent Software Enhancements Key Software Roadmap Elements
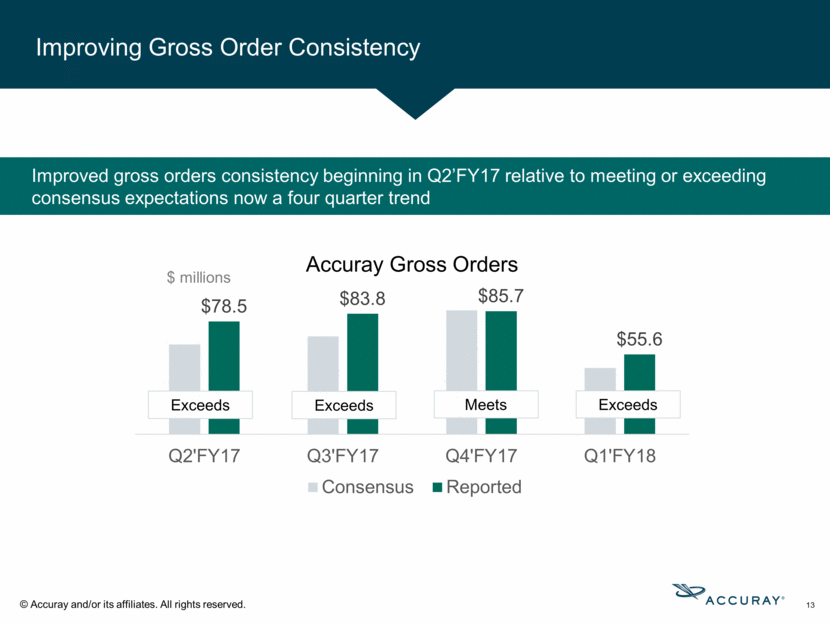
Improving Gross Order Consistency 13 $ millions Improved gross orders consistency beginning in Q2’FY17 relative to meeting or exceeding consensus expectations now a four quarter trend Exceeds Meets Exceeds Exceeds
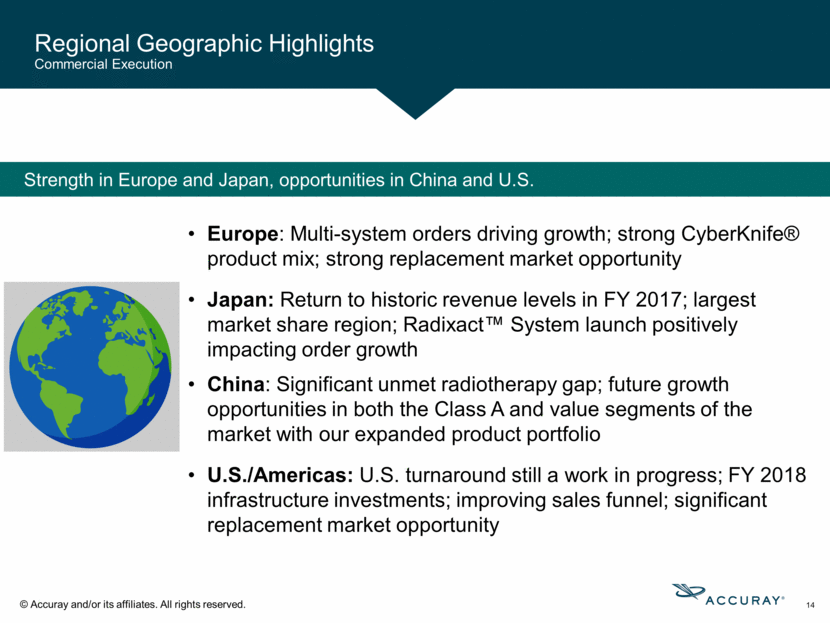
Regional Geographic Highlights Commercial Execution 14 Europe: Multi-system orders driving growth; strong CyberKnife® product mix; strong replacement market opportunity Japan: Return to historic revenue levels in FY 2017; largest market share region; Radixact™ System launch positively impacting order growth Strength in Europe and Japan, opportunities in China and U.S. China: Significant unmet radiotherapy gap; future growth opportunities in both the Class A and value segments of the market with our expanded product portfolio U.S./Americas: U.S. turnaround still a work in progress; FY 2018 infrastructure investments; improving sales funnel; significant replacement market opportunity
Driving Improved Revenue Conversion FY 2018 Initiatives – Optimize Revenue Conversion 15 Created VP of Revenue Management role in May 2017; reporting to CFO; increased accountability Investment in region-level project management resources to support distributor and revenue conversion Reported Q1 FY18 revenue of $91.0 million exceeding consensus; visible progress on this initiative enabling confidence to reaffirm full-year revenue guidance
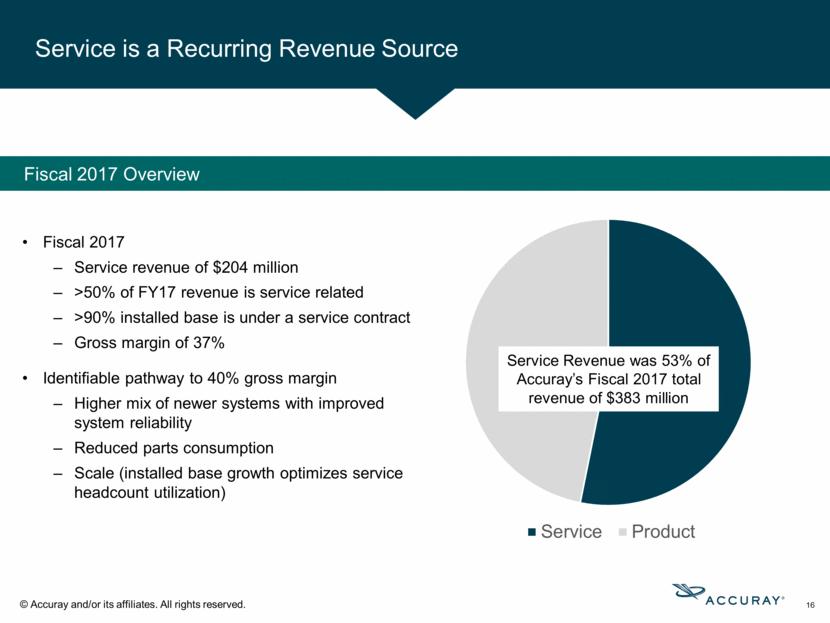
Fiscal 2017 Service revenue of $204 million >50% of FY17 revenue is service related >90% installed base is under a service contract Gross margin of 37% Identifiable pathway to 40% gross margin Higher mix of newer systems with improved system reliability Reduced parts consumption Scale (installed base growth optimizes service headcount utilization) 16 Service is a Recurring Revenue Source Service Revenue was 53% of Accuray’s Fiscal 2017 total revenue of $383 million Fiscal 2017 Overview
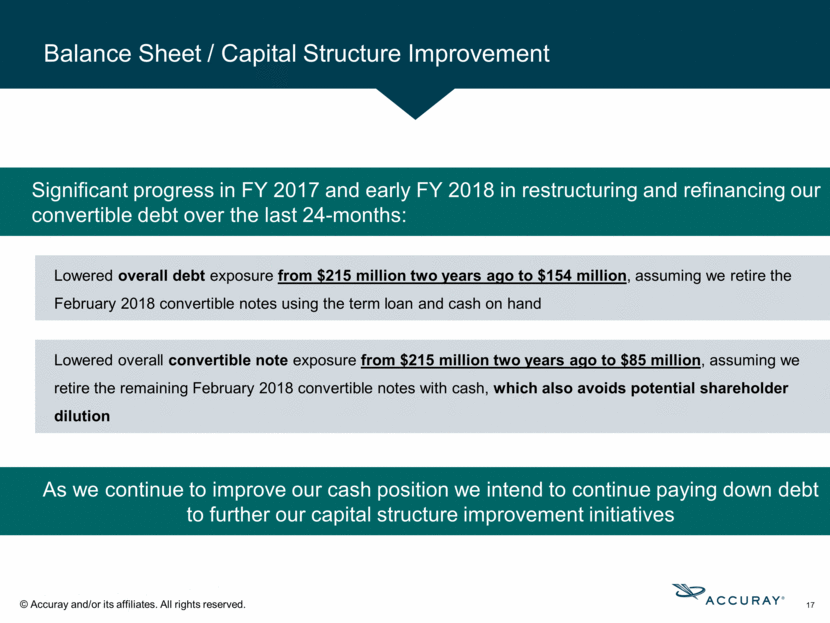
Balance Sheet / Capital Structure Improvement 17 Lowered overall debt exposure from $215 million two years ago to $154 million, assuming we retire the February 2018 convertible notes using the term loan and cash on hand Significant progress in FY 2017 and early FY 2018 in restructuring and refinancing our convertible debt over the last 24-months: Lowered overall convertible note exposure from $215 million two years ago to $85 million, assuming we retire the remaining February 2018 convertible notes with cash, which also avoids potential shareholder dilution As we continue to improve our cash position we intend to continue paying down debt to further our capital structure improvement initiatives
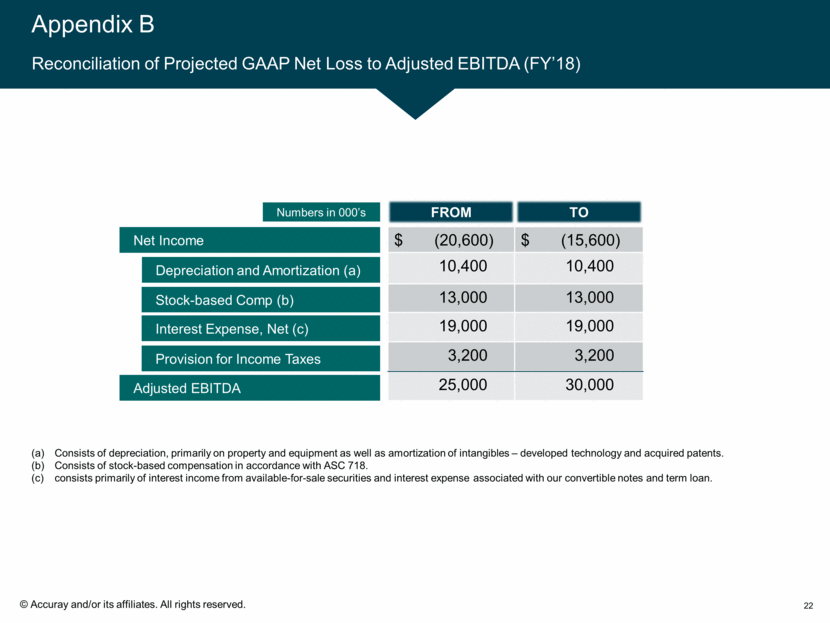
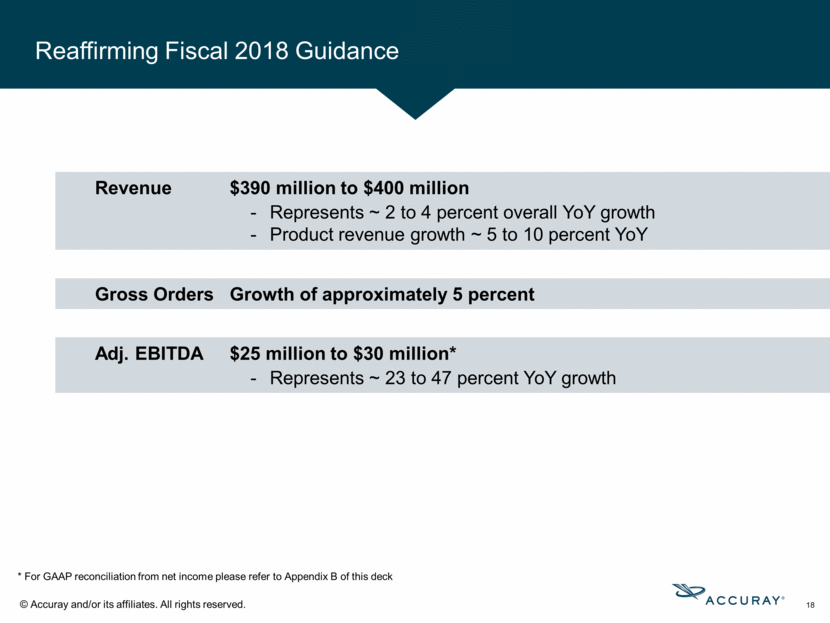
Reaffirming Fiscal 2018 Guidance 18 Revenue $390 million to $400 million Represents ~ 2 to 4 percent overall YoY growth Product revenue growth ~ 5 to 10 percent YoY Adj. EBITDA $25 million to $30 million* Represents ~ 23 to 47 percent YoY growth Gross Orders Growth of approximately 5 percent * For GAAP reconciliation from net income please refer to Appendix B of this deck
19

Appendix 20

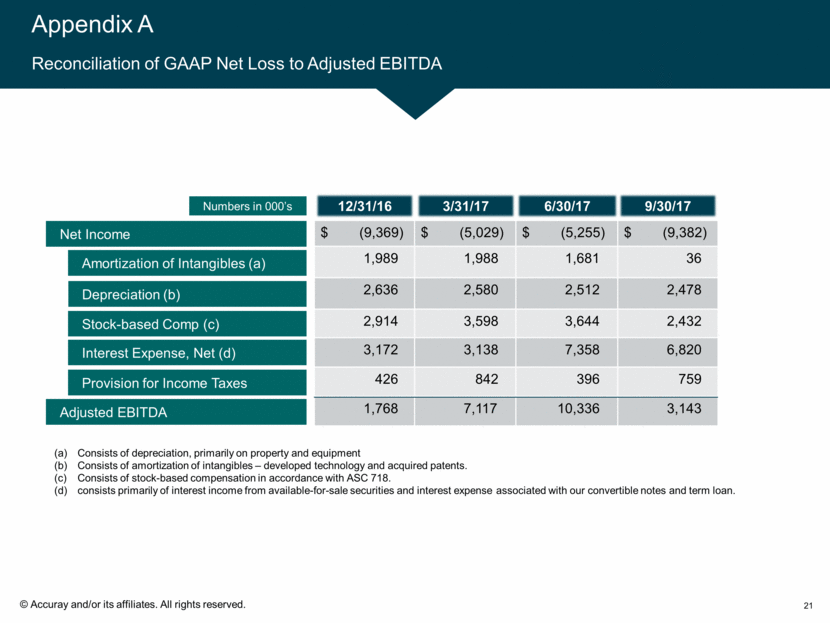
Appendix A Reconciliation of GAAP Net Loss to Adjusted EBITDA 21 $ (9,369) $ (5,029) $ (5,255) $ (9,382) 1,989 1,988 1,681 36 2,636 2,580 2,512 2,478 2,914 3,598 3,644 2,432 3,172 3,138 7,358 6,820 426 842 396 759 1,768 7,117 10,336 3,143 12/31/16 Consists of depreciation, primarily on property and equipment Consists of amortization of intangibles – developed technology and acquired patents. Consists of stock-based compensation in accordance with ASC 718. consists primarily of interest income from available-for-sale securities and interest expense associated with our convertible notes and term loan. Net Income Adjusted EBITDA Depreciation (b) Stock-based Comp (c) Interest Expense, Net (d) Provision for Income Taxes Numbers in 000’s Amortization of Intangibles (a) 3/31/17 6/30/17 9/30/17
Appendix B Reconciliation of Projected GAAP Net Loss to Adjusted EBITDA (FY’18) 22 $ (20,600) $ (15,600) 10,400 10,400 13,000 13,000 19,000 19,000 3,200 3,200 25,000 30,000 TO FROM Consists of depreciation, primarily on property and equipment as well as amortization of intangibles – developed technology and acquired patents. Consists of stock-based compensation in accordance with ASC 718. consists primarily of interest income from available-for-sale securities and interest expense associated with our convertible notes and term loan. Net Income Adjusted EBITDA Depreciation and Amortization (a) Stock-based Comp (b) Interest Expense, Net (c) Provision for Income Taxes Numbers in 000’s
