Attached files
| file | filename |
|---|---|
| 8-K - 8-K - GenOn Energy, Inc. | a18-2001_18k.htm |
CONFIDENTIAL WORKING DRAFT – SUBJECT TO ONGOING REVIEW & REVISION REMA projections November 2017
CONFIDENTIAL WORKING DRAFT – SUBJECT TO ONGOING REVIEW & REVISION Forward looking statements This presentation contains forward-looking statements, which are subject to various risks and uncertainties. Discussion of risks and uncertainties that could cause actual results to differ materially from management’s current projections, forecasts, estimates and expectations is contained in filings with the Securities and Exchange Commission (“SEC”) made by GenOn Energy, Inc. (“GenOn”), the indirect parent company of Reliant Energy Mid-Atlantic (“REMA”). We make specific reference to the section entitled “Risk Factors” in GenOn’s annual and quarterly reports. In addition to the risks and uncertainties set forth in GenOn’s public filings made with the SEC, the forward-looking statements in this presentation could be affected by, among other things: any impacts on REMA as a result of the bankruptcy proceedings involving GenOn and certain of its subsidiaries and the change in indirect ownership of REMA proposed in such proceedings; prevailing governmental policies and regulatory actions; legal and administrative proceedings and settlements; weather conditions and other natural phenomena; economic conditions, including the impact of a recessionary environment; unanticipated population growth or decline, or changes in market demand and demographic patterns; changes in business strategy, development plans or vendor relationships; unanticipated changes in interest rates or rates of inflation; unanticipated changes in operating expenses, liquidity needs and capital expenditures; inability of various counterparties to meet their financial obligations to REMA, including failure of counterparties to perform under certain agreements; hazards customary to the industry and the possibility that REMA may not have adequate insurance to cover losses resulting from such hazards; changes in technology used by and services offered by REMA; significant changes in REMA’s relationship with its employees; changes in assumptions used to estimate costs of providing employee benefits, including pension and other post-retirement employee benefits, and future funding requirements related thereto; significant changes in critical accounting policies material to REMA; commercial bank and financial market conditions, access to capital, the cost of such capital, and the results of financing and refinancing efforts, including availability of funds in the capital markets and the potential impact of disruptions in US credit markets; circumstances which may contribute to future impairment of goodwill, intangible or other long-lived assets; financial restrictions under REMA’s operating leases; and REMA’s ability to effectively execute its operational strategy. Any forward-looking statement speaks only as of the date on which it is made, and we undertake no obligation to update any forward-looking statement to reflect events or circumstances after the date on which it is made. Our forecast is a forward-looking statement and reflects our best estimate and judgment as of the date of this presentation of the conditions we expect to exist and the course of action we expect to take with respect to our business. The forecast does not include the effects of, and we have not included any adjustments with respect to, any acquisitions we may complete during the periods covered by our forecast. It should be read together with the historical combined financial statements and the accompanying notes thereto included in GenOn’s public filings made with the SEC. The assumptions and estimates underlying the forecast, as described herein, are inherently uncertain and, although we consider them reasonable as of the date of this presentation, they are subject to a wide variety of significant business, economic and competitive risks and uncertainties that could cause actual results to differ materially from forecasted results, including, among others, the risks and uncertainties described herein. For purposes of our forecast, we have assumed that no unexpected risks will materialize during the forecast periods. Any of the risks discussed in this presentation, to the extent they occur, could cause actual results of operations to vary significantly. We believe that we have a reasonable basis for these assumptions and that our actual results of operations will approximate those reflected in our forecast, but we can give no assurance that our forecasted results will be achieved. Accordingly, there can be no assurance that the forecast will be indicative of our future performance or that actual results will not differ materially from those presented in the forecast. This presentation and the accompanying forecast were not prepared with a view toward complying with generally accepted accounting principles (“GAAP”) with respect to prospective financial information. This presentation includes certain non-GAAP financial measures and comparable historical GAAP financials are not included herein. No independent accountants have compiled, examined or performed any procedures with respect to our forecast, nor have they expressed any opinion or any other form of assurance on our forecast or its achievability, and neither our independent auditors nor any other independent accountants assume responsibility for, and claim any association with, our forecast. We do not undertake any obligation to release publicly any revisions or updates that we may make to the forecast or the assum ptions used to prepare the forecast to reflect events or circumstances after the date of this presentation. Therefore, you are cautioned not to place undue reliance on this information. 1
CONFIDENTIAL WORKING DRAFT – SUBJECT TO ONGOING REVIEW & REVISION Definitions 1. “EBITDAR” is defined as revenue, less certain operating expenses (including (i) cost of energy, (ii) O&M, (iii) allocated shared services expense, and (iv) GenOn Energy Management (GEM) fees) excluding lease expense. 2. “Cash Available for Lease Payments” is defined as EBITDAR, less cash used for (i) net capital expenditures and (ii) changes in working capital, plus non-cash operating expenses (including (i) allocated shared services expense and (ii) GEM fees). 3. “Free Cash Flow” is defined as EBITDAR, less cash used for (i) net capital expenditures, (ii) changes in working capital, and (iii) cash lease expense, plus non-cash operating expenses (including (i) allocated shared services expense and (ii) GEM fees). 4. “Total Operating Receipts” is defined as total cash receipts from operations collected from revenue generated by REMA. 5. “Total Operating Disbursements” is defined as the total cash operating disbursements made by or on behalf of REMA (including (i) fuel cost, (ii) O&M / equipment costs, (iii) payroll & benefits, (iv) taxes and regulatory fees, (vi) environmental and pollution-related expenses, and (vii) cash lease payments). 6. “Net Operating Cash Flow” is defined as Total Operating Receipts less Total Operating Disbursements. These measures are non-GAAP financial measures and are not intended to represent net income (loss) and should not be used as alt ernatives to net income (loss) as an indicator of operating performance. We believe the presentation of EBITDAR, Cash Available for Lease Payments and Free Cash F low provide useful information to investors regarding our results of operations because they assist in analyzing and benchmarking the performance and value of our business. In addition, we believe EBITDAR, Cash Available for Lease Payments and Free Cash Flow are useful to investors because they help enable investors to e valuate our business in the same manner as our management evaluates our business. There are significant limitations to using EBITDAR, Cash Available for Lease Paymen ts and Free Cash Flow as measures of performance, including the inability to analyze the effect of certain recurring and non-recurring items that materially affect our net income or loss, the lack of comparability of results of operations of different companies and the different methods of calculating EBITDAR, Cash Available for Lease Payments and Free Cash Flow reported by different companies. These measures are not intended to represent net income (loss) and should not be used as an alternative to net inc ome (loss) or an indicator of operating performance. 2
CONFIDENTIAL WORKING DRAFT – SUBJECT TO ONGOING REVIEW & REVISION 1 REMA projections As of Q1 2017 3
CONFIDENTIAL WORKING DRAFT – SUBJECT TO ONGOING REVIEW & REVISION Financial forecast methodology The forecast herein was originally prepared in Q1 2017 utilizing key assumptions disclosed in the appendix. The forecast is based on Company input and third-party assumptions (adjusted where appropriate in order to reflect market and operating specific factors associated with the generation fleet). A multitude of factors were considered, with adjustments to plant configuration, age, equipment, number of units, service hour forecast and generation forecasts. In addition, plant leadership considered various other items including, but not limited to: (i) headcount to operate the facilities, (ii) Base O&M support for forecast generation, (iii) plant outage timing, and (iv) environmental and regulatory changes. Subsequent to the original preparation, the forecast since has been modified for the following assumptions: Actual May 2017 PJM capacity auction results, which impacts capacity revenue from June 2020 through May 2021 (however, only 2020 captured within the projection period); Reduced shared services charge to reflect the reduced rate paid to NRG during the pendency of GenOn’s bankruptcy proceeding (allocated share of $84m vs. $192.6m previously); Beginning cash balance updated based on latest estimate of 2017 year-end cash balance (~$68m); and Removal of effluent limitation guidelines (“ELG”) environmental-related capital expenditures, due to the staying and postponement of such guidelines by the EPA ($2m favorable impact in 2020). For the avoidance of doubt, the forecast has not been adjusted to reflect an updated view on energy pricing, input pricing or any other changes to REMA’s cost structure. Thus, unless otherwise noted herein, plant dispatch and operating assumptions remain unchanged from Q1 2017. Any changes to the facts or circumstances underlying the assumptions above could result in a material adverse change to the forecast and projections contained herein, therefore, you are cautioned not to place any undue reliance on such forecast or projections. 4
CONFIDENTIAL WORKING DRAFT – SUBJECT TO ONGOING REVIEW & REVISION Annual forecast summary (as of Q1 2017) (US$ in millions) 2018E 2019E 2020E $369 $400 $337 $314 Keystone Conemaugh Shawville Gilbert Sayreville Other plants Corporate & other $71 70 135 33 15 24 21 $65 67 120 32 14 18 21 $66 68 99 32 14 14 21 $300 $200 $100 $0 2018E 2019E 2020E $96 2018E 2019E 2020E $100 Keystone Conemaugh Shawville Gilbert Sayreville Other plants Corporate & other 1 $15 11 29 17 12 14 (3) $4 9 27 17 11 9 (2) $7 2 16 17 11 4 (2) $80 $60 $40 $20 $0 2018E 2019E 2020E ($20) $20 2018E 2019E 2020E $18 Keystone Conemaugh Shawville Gilbert Sayreville Other plants $3 6 – 8 0 0 $5 3 1 0 – 0 $3 2 – 1 – 0 $15 $10 $5 $0 2018E 2019E 2020E Note 1 Includes shared services expense of ~$16m, growing at 2% per annum 5 Keystone Conemaugh Shawville Gilbert Sayreville Other plants Total capex$18$10$6 $10 $6 CapEx Total EBITDAR$96$74$54 $74 $54 EBITDAR Total revenue$369$337$314 Revenue Build-up by operating entity
CONFIDENTIAL WORKING DRAFT – SUBJECT TO ONGOING REVIEW & REVISION Quarterly forecast summary (as of Q1 2017) (US$ in millions) 2018E 2019E 2018E 2019E 2018E 2019E Note 1 Includes shared services expense of ~$16m, growing at 2% per annum 6 Keystone Conemaugh Shawville Gilbert Sayreville Other plants Corporate & other Q1 Q2 Q3 Q4 Total Q1 Q2 Q3 Q4 Total 2020E $3 2 – 1 – 0 – $1 $1 $1 $1 2 2 2 2 – – – – 2 2 2 3 – 0 – – 0 0 0 0 – – – (0) $3 6 – 8 0 0 (0) $1 $1 $1 $1 1 1 1 1 – – – 1 – 0 – 0 – – – – 0 0 0 1 – – – (0) $5 3 1 0 – 1 (0) Total capex $4 $4 $4 $5 $18 $2 $2 $2 $4 $10 $6 CapEx Keystone Conemaugh Shawville Gilbert Sayreville Other plants Corporate & other 1 Q1 Q2 Q3 Q4 Total Q1 Q2 Q3 Q4 Total 2020E $7 2 16 17 11 4 (2) $5 $2 $5 $3 5 3 4 (1) 9 7 15 (0) 4 3 7 3 2 2 4 4 4 3 4 3 (1) (1) (1) (1) $15 11 29 17 12 14 (3) $3 ($0) $1 ($1) 5 1 3 1 9 6 11 2 7 4 4 2 4 3 3 2 3 3 2 1 (1) (1) (1) (1) $4 9 27 17 11 9 (2) Total EBITDAR $28 $19 $38 $10 $96 $30 $17 $22 $6 $74 $54 EBITDAR Keystone Conemaugh Shawville Gilbert Sayreville Other plants Corporate & other Q1 Q2 Q3 Q4 Total Q1 Q2 Q3 Q4 Total 2020E $66 68 99 32 14 14 21 $21 $15 $19 $16 20 17 18 14 35 29 40 31 8 6 11 8 2 3 5 4 6 6 6 6 5 5 5 5 $71 70 135 33 15 24 21 $20 $14 $17 $13 20 15 18 15 32 26 35 26 13 7 9 4 4 4 4 2 6 5 4 4 5 5 5 5 $65 67 120 32 14 18 21 Total revenue $98 $82 $105 $83 $369 $100 $76 $93 $69 $337 $314 Revenue Build-up by operating entity
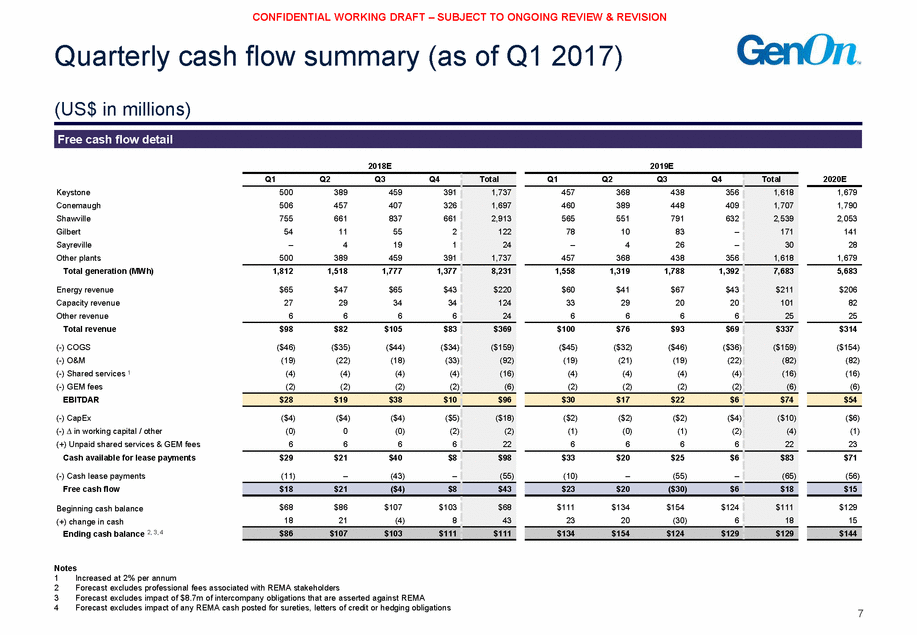
CONFIDENTIAL WORKING DRAFT – SUBJECT TO ONGOING REVIEW & REVISION Quarterly cash flow summary (as of Q1 2017) (US$ in millions) 2018E 2019E 2020E Keystone Conemaugh Shawville Gilbert Sayreville Other plants Total generation (MWh) 1,679 1,790 2,053 141 28 1,679 5,683 Energy revenue Capacity revenue Other revenue Total revenue $206 82 25 $314 (-) COGS (-) O&M (-) Shared services 1 (-) GEM fees EBITDAR ($154) (82) (16) (6) (-) CapEx (-) in working capital / other (+) Unpaid shared services & GEM fees Cash available for lease payments ($6) (1) 23 $71 (-) Cash lease payments Free cash flow (56) $129 15 Beginning cash balance (+) change in cash Ending cash balance 2, 3, 4 Notes 1 2 3 4 Increased at 2% per annum Forecast excludes professional fees associated with REMA stakeholders Forecast excludes impact of $8.7m of intercompany obligations that are asserted against REMA Forecast excludes impact of any REMA cash posted for sureties, letters of credit or hedging obligations 7 $144 $15 $54 Q1Q2Q3Q4 Total 457368438356 460389448409 565551791632 781083– –426– 457368438356 1,618 1,707 2,539 171 30 1,618 1,5581,3191,7881,392 $60$41$67$43 33292020 6666 7,683 $211 101 25 $100$76$93$69 ($45)($32)($46)($36) (19) (21) (19)(22) (4) (4) (4)(4) (2) (2) (2)(2) $337 ($159) (82) (16) (6) $30$17$22$6 $74 ($2)($2)($2)($4) (1)(0)(1)(2) 6666 ($10) (4) 22 $33$20$25$6 (10)–(55)– $83 (65) $23$20($30)$6 $18 $111$134$154$124 2320(30)6 $111 18 $134$154$124$129 $129 Q1Q2Q3Q4 Total 500389459391 506457407326 755661837661 5411552 –4191 500389459391 1,737 1,697 2,913 122 24 1,737 1,8121,5181,7771,377 $65$47$65$43 27293434 6666 8,231 $220 124 24 $98$82$105$83 ($46)($35)($44)($34) (19) (22) (18)(33) (4) (4) (4)(4) (2) (2) (2)(2) $369 ($159) (92) (16) (6) $28$19$38$10 $96 ($4)($4)($4)($5) (0)0(0)(2) 6666 ($18) (2) 22 $29$21$40$8 (11)–(43)– $98 (55) $18$21($4)$8 $43 $68$86$107$103 1821(4)8 $68 43 $86$107$103$111 $111 Free cash flow detail
A Forecast assumptions

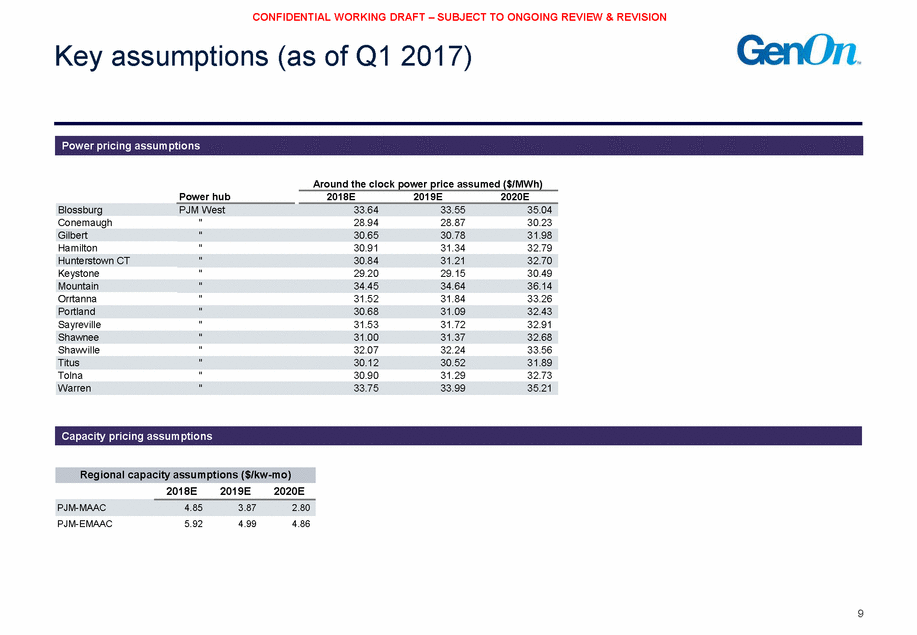
CONFIDENTIAL WORKING DRAFT – SUBJECT TO ONGOING REVIEW & REVISION Key assumptions (as of Q1 2017) Conemaugh " 28.94 28.87 30.23 Hamilton " 30.91 31.34 32.79 Keystone " 29.20 29.15 30.49 Orrtanna " 31.52 31.84 33.26 Sayreville " 31.53 31.72 32.91 Shawville " 32.07 32.24 33.56 Tolna " 30.90 31.29 32.73 2018E 2019E 2020E PJM-EMAAC 5.92 4.99 4.86 9 PJM-MAAC4.853.872.80 Regional capacity assumptions ($/kw-mo) Capacity pricing assumptions Warren"33.7533.9935.21 Titus"30.1230.5231.89 Shawnee"31.0031.3732.68 Portland"30.6831.0932.43 Mountain"34.4534.6436.14 Hunterstown CT"30.8431.2132.70 Gilbert"30.6530.7831.98 Power hub Around the clock power price assumed ($/MWh) 2018E2019E2020E BlossburgPJM West33.6433.5535.04 Power pricing assumptions
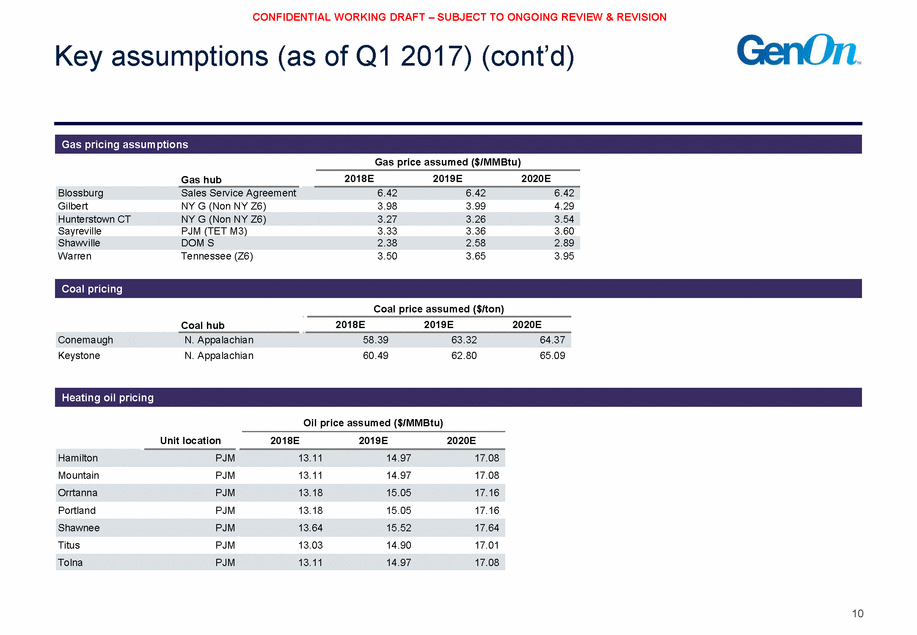
CONFIDENTIAL WORKING DRAFT – SUBJECT TO ONGOING REVIEW & REVISION Key assumptions (as of Q1 2017) (cont’d) Gas adder ($/MMBtu) GaGsapsrcicuervaess($u/mMMedB(t$u/)MMBtu) Gas adder ($/MMBtu) 2019E 2018E 2019E Gas hub 2020E 201280E18E 201290E19E 202200E20E 2018E 2020E 2018 – Blossburg – Sale–s Service Agreeme–nt 6–.42 6–.42 6–.42 – – – .26 Gilbert 0.98 N1Y.00G (Non NY Z6) 1.03 3.030.98 2.939.99 3.246.29 0.98 1.00 1.03 .26 Hunterst0o.w2n7 CT N0Y.27G (Non NY Z6) 0.29 3.030.27 2.939.26 3.236.54 0.27 0.27 0.29 .05 Sayrevill0e.52 P0J.5M3(TET M3) 0.55 2.830.33 2.832.36 3.035.60 0.52 0.53 0.55 .53 Shawville0.33 D0O.3M4 S 0.36 2.025.38 2.224.58 2.523.89 0.33 0.34 0.36 .27 Warren 1.60 T1e.6n4nessee (Z6) 1.68 1.930.50 2.031.65 2.237.95 1.60 1.64 1.68 Coal adder ($ 2019E Coal adder ($/ton) 2019E 2018E 2018E 2020E 2018 0 Cone1m4a.3u2gh 18.2N8. Appalachian 18.37 4548.0.379 4653.0.32 464.0.307 14.32 18.28 18.37 0 Keyst1o6n.e42 17.7N6. Appalachian 19.09 4640.0.479 4652.0.830 465.0.09 16.42 17.76 19.09 Heating oil adder ($/MMBtu) 2019E Oil price assumed 2018E 2020E 2018E 2019E 0.38Hamilton 0.38 0P.J3M9 1123..7131 1144..5997 1167..6098 0.38 0.38 0.39 13.11 1 0.38Mountain 0.38 0P.J3M9 13."11 14."97 17."08 0.38 0.38 0.39 13.11 1 0.45Orrtanna 0.46 0P.J4M7 13."18 15."05 17."16 0.45 0.46 0.47 13.18 1 0.45Portland 0.46 0P.J4M7 13."18 15."05 17."16 0.45 0.46 0.47 13.18 1 0.91Shawnee 0.93 0P.J9M5 13."64 15."52 17."64 0.91 0.93 0.95 13.64 1 0.30Titus 0.31 0P.J3M2 13."03 14."90 17."01 0.30 0.31 0.32 13.03 1 0.38Tolna 0.38 0P.J3M9 13."11 14."97 17."08 0.38 0.38 0.39 13.11 1 0.50Canal 0.51 NE0I.S5O2 89..5055 190..6178 1111..0680 0.50 0.51 0.52 9.05 1 10 Heating oil adder ($/MMBtu) OHeilaptirnicgeoaisl scurved($($/M/MMMBBtutu) ) 22001188EE 22001199EE 22002200EE 2018E 2019E Unit 2lo0c2a0tEion Heating oil pricing /ton) Coal hub 2020E CoaCl oparilcceuarsvseu(m$/teodn()$/ton) 22001188EE 22001199EE 22002200EE Coal pricing Gas pricing assumptions
CONFIDENTIAL WORKING DRAFT – SUBJECT TO ONGOING REVIEW & REVISION 2 REMA near-term cash flow projections 11
CONFIDENTIAL WORKING DRAFT – SUBJECT TO ONGOING REVIEW & REVISION Assumptions overview The following cash flow projection addresses the period through May 2018 and utilize the Company’s view of market pricing curves as of September 2017. The cash flow projection assumes the following: Business as usual – GenOn continues to provide shared services without payment from REMA. – Prior to the impact of any potential transaction. Receipts collected by GenOn Energy Management, net of disbursements, are remitted to REMA each month. – Receipts and certain fuel and other disbursements attributable to REMA accumulate each week, and are crystallized at the end of each month prior to payment. – The cash flow projection disaggregates the monthly net intercompany balance, allocating amounts to the appropriate line items. The assumptions and estimates underlying the cash flow projection, as described herein, are inherently uncertain and, although we consider them reasonable as of the date of this presentation, they are subject to a wide variety of significant business, economic and competitive risks and uncertainties that could cause actual results to differ materially from forecast results, including, among others, the risks and uncertainties described herein. Any changes to the facts or circumstances underlying the assumptions above could result in a material adverse change to the cash flow projection contained herein, therefore, you are cautioned to not place any undue reliance on the cash flow projection. 12
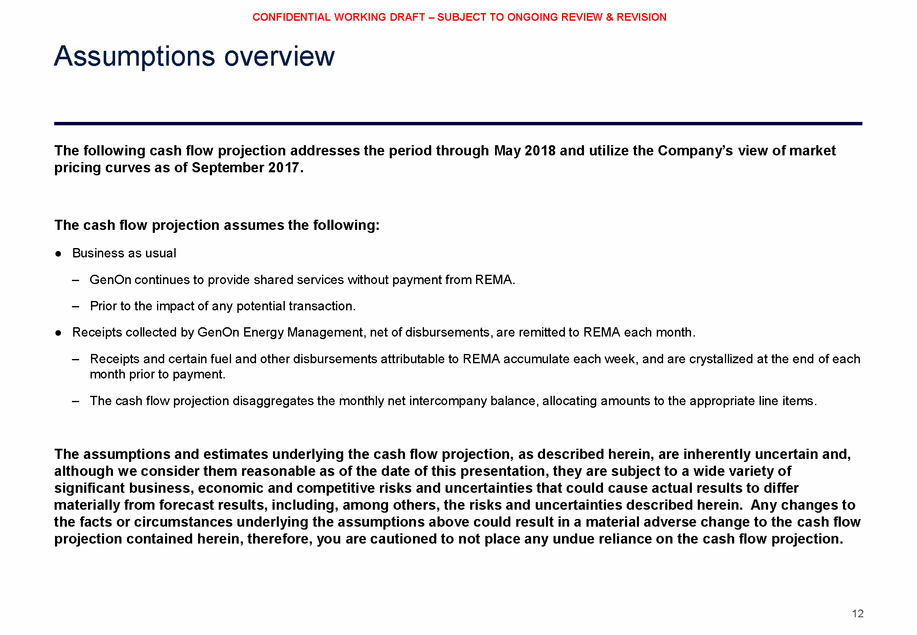
CONFIDENTIAL WORKING DRAFT – SUBJECT TO ONGOING REVIEW & REVISION REMA cash flow projections ($ in thousands) 2018 Operating receipts Energy / ISO receipts Total operating receipts Operating disbursements Fuel cost O&M / equipment Payroll & benefits Taxes and regulatory fees Environmental & pollution control Lease payments Total operating disbursements Net operating cash flow Cash balance Beginning balance Net operating cash flow Ending cash balance Cumulative est. restructuring fees 3 Adjusted ending cash balance Notes 1 2 3 Forecast excludes impact of $8.7m of intercompany obligations that are asserted against REMA Assumes no cash outflows or collateral posted related to LCs, sureties or hedging Estimated figures prior to costs related to REMA investigation 13 January February March April May Total $25,148 $41,776 $32,464 $27,444 $23,174 $150,005 $25,148 $41,776 $32,464 $27,444 $23,174 ($11,655) ($15,875) ($12,531) ($8,613) ($9,365) (4,620) (1,882) (3,599) (8,138) (5,429) (4,500) (4,500) (7,600) (4,500) (4,500) (1,491) (551) (551) (551) (462) (1,546) (1,280) (1,305) (1,043) (1,389) (11,356) - - - - $150,005 ($58,039) (23,668) (25,600) (3,607) (6,563) (11,356) ($35,167) ($24,088) ($25,587) ($22,844) ($21,146) ($128,833) ($10,019) $17,688 $6,877 $4,599 $2,028 $21,173 $67,815 $57,796 $75,484 $82,361 $86,960 (10,019) 17,688 6,877 4,599 2,028 $67,815 21,173 $57,796 $75,484 $82,361 $86,960 $88,988 ($7,189) ($7,902) ($8,614) ($9,327) ($10,039) $88,988 ($10,039) $50,607 $67,583 $73,747 $77,633 $78,949 $78,949 Cash flow projections1,2
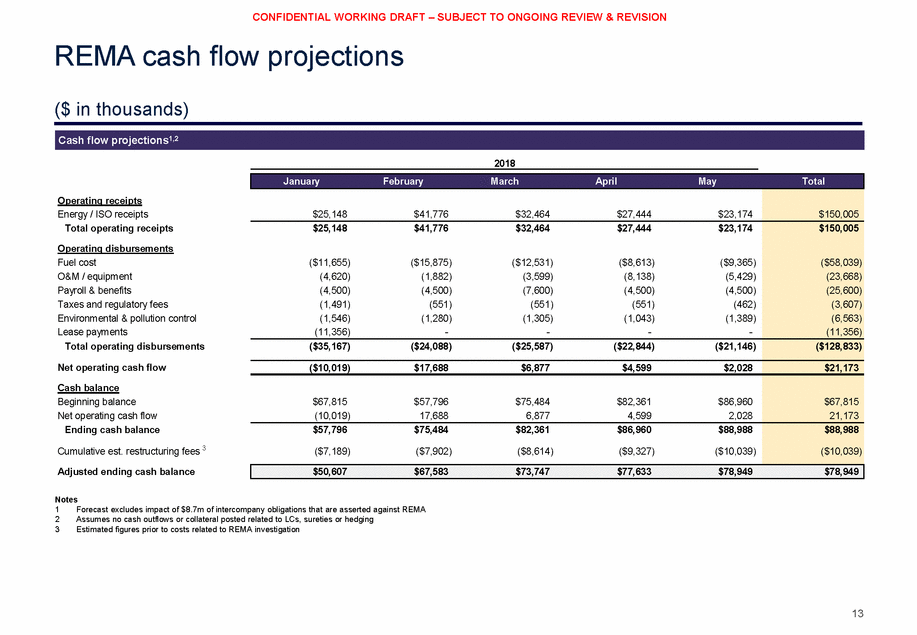
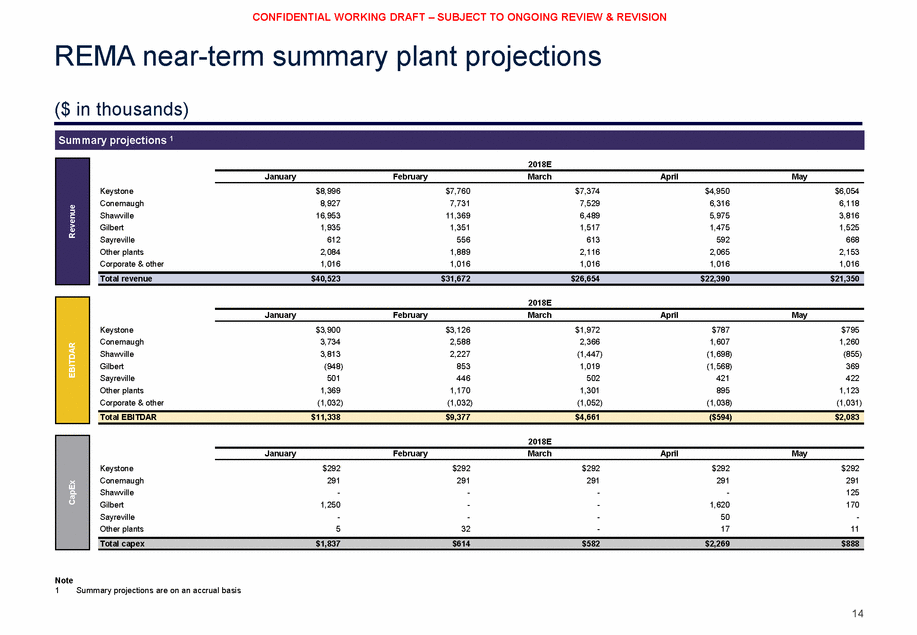
CONFIDENTIAL WORKING DRAFT – SUBJECT TO ONGOING REVIEW & REVISION REMA near-term summary plant projections ($ in thousands) 2018E January February March April May Keystone Conemaugh Shawville Gilbert Sayreville Other plants Corporate & other $8,996 8,927 16,953 1,935 612 2,084 1,016 $7,760 7,731 11,369 1,351 556 1,889 1,016 $7,374 7,529 6,489 1,517 613 2,116 1,016 $4,950 6,316 5,975 1,475 592 2,065 1,016 $6,054 6,118 3,816 1,525 668 2,153 1,016 2018E January February March April May Keystone Conemaugh Shawville Gilbert Sayreville Other plants Corporate & other $3,900 3,734 3,813 (948) 501 1,369 (1,032) $3,126 2,588 2,227 853 446 1,170 (1,032) $1,972 2,366 (1,447) 1,019 502 1,301 (1,052) $787 1,607 (1,698) (1,568) 421 895 (1,038) $795 1,260 (855) 369 422 1,123 (1,031) 2018E January February March April May Keystone Conemaugh Shawville Gilbert Sayreville Other plants $292 291 - 1,250 - 5 $292 291 - - - 32 $292 291 - - - - $292 291 - 1,620 50 17 $292 291 125 170 - 11 Note 1 Summary projections are on an accrual basis 14 Total capex $1,837 $614 $582 $2,269 $888 CapEx Total EBITDAR $11,338 $9,377 $4,661 ($594) $2,083 EBITDAR Total revenue $40,523 $31,672 $26,654 $22,390 $21,350 Revenue Summary projections 1
