Attached files
| file | filename |
|---|---|
| 8-K - 8-K - Strategic Storage Growth Trust, Inc. | ck0001575428-8k_20171222.htm |
Exhibit 99.1

December 22, 2017
Dear Shareholders:
This past year has been a very busy one for Strategic Storage Growth Trust, Inc., and we would like to take a moment to revisit some of the highlights.
Closedown of Public Offering
We had a very successful closedown of our initial public offering, raising approximately $170 million in early 2017. We believe the increased pace of our equity raise this year underscores investor appetite for growth-oriented real estate. After the closedown of our offering, we had approximately $120 million of cash on our balance sheet with approximately $5 million in debt. We have been prudent and patient, and will continue to wisely invest our available capital in self storage assets that have the potential to meet our growth-oriented investment strategy. We have reduced the cash balance on our balance sheet to approximately $55 million, and we expect to invest approximately $50 million of this balance by the end of the first quarter of 2018 in four additional properties that will continue to provide growth to the portfolio.
2017 Performance
During 2017, our portfolio has continued to perform well and grow.
Our same-store revenues and NOI grew 14.7% and 19.3%, respectively, for the three months ended September 30, 2017, as compared to the three months ended September 30, 2016. Additionally, same-store occupancy grew 3.6% and annualized rent per occupied square foot grew 11.0% during that same period.
For the nine months ended September 30, 2017, our same-store revenues and NOI grew 17.1% and 31.3%, respectively, as compared to the nine months ended September 30, 2016. Additionally, same-store occupancy grew 6.0% and annualized rent per occupied square foot grew 10.0% during that same period. The portfolio grew revenues by $2.8 million during the first nine months of 2017, and generated modified funds from operations (MFFO) of $2.2 million.
For additional information, please refer to our third quarter 2017 press release, dated November 16, 2017, accompanying this letter.
We are pleased with these strong operating results. The performance of the portfolio speaks to the execution of our strategy: acquire growth-oriented assets and recognize increased value and cash flow as the properties lease-up.
2017 Acquisitions
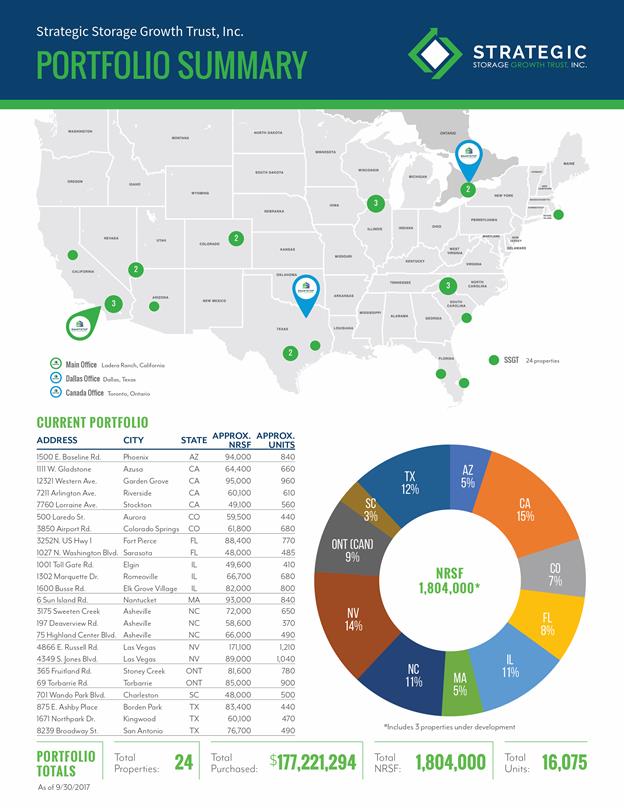
During 2017, we have acquired seven properties located in six different states. These properties were acquired for a combined purchase price of approximately $88.7 million, which was funded by the proceeds from our public offering.
Future Acquisitions
In addition to the seven properties acquired in 2017, and the four properties we expect to acquire by the end of the first quarter of 2018, we expect to acquire an additional two properties in the second half of 2018 for approximately $19.2 million. All of these assets are being acquired at certificate of occupancy, meeting the targeted focus of growth-oriented investments.
10 Terrace Road • Ladera Ranch • California 92694 • 949-429-6600
With this pipeline of acquisitions, we believe our current cash balance will be almost fully invested by the end of the first quarter of 2018. We anticipate that, for the foreseeable future, the portfolio will continue to have low leverage with good capacity to potentially make additional strategic acquisitions.
Quarterly Distributions
We have paid monthly distributions to shareholders at an annualized rate of $0.40 per share of common stock, and we continued that distribution rate with the fourth quarter distribution declaration by our board of directors.
We remain committed to unlocking the intrinsic value of our portfolio. While the strong equity raise through the closedown of our offering may extend the timeline for potential liquidity, we believe that the options for the portfolio remain strong. In the first quarter of 2018, we anticipate beginning the process of reviewing strategic alternatives so as to provide the best combination of shareholder value and potential liquidity. In the interim, we continue to be focused on the lease-up of our portfolio, thereby creating additional value for you, our shareholders.
Continued successes,
H. Michael Schwartz
Chairman and CEO
Enclosures
FOR IMMEDIATE RELEASE
November 16, 2017
Strategic Storage Growth Trust, Inc. Reports 2017 Third Quarter Results
LADERA RANCH, CA – November 16, 2017 – Strategic Storage Growth Trust, Inc. (“SSGT”) announced continued growth in total revenues, same-store revenues, net operating income (“NOI”), occupancy and annualized rent per occupied square footage as part of its overall operating results for the three and nine months ended September 30, 2017.
“Our same-store growth in revenue and NOI was largely driven by an increase in occupancy and rental rates over the past 12 months, while the portfolio grew with the acquisition of an existing operating property in Nantucket, Massachusetts and a lease-up property in Mount Pleasant, South Carolina,” said H. Michael Schwartz, chairman and chief executive officer of Strategic Storage Growth Trust. “The combination of same-store results and strategic acquisitions exemplifies the portfolio’s growth-oriented objectives.”
Third Quarter 2017 Highlights
|
|
• |
Increased total revenue by approximately $1.4 million, or 56%, when compared to the same period in 2016. |
|
|
• |
Increased same-store revenues and NOI by 14.7% and 19.3%, respectively, compared to the same period in 2016. |
|
|
• |
Increased same-store average physical occupancy by approximately 3.6% to 94.9% from 91.3% compared to the same period in 2016. |
|
|
• |
Increased same-store annualized rent per occupied square foot by approximately 11.0% to $12.69 from $11.43 compared to the same period in 2016. |
|
|
• |
Increased modified funds from operations to approximately $1.0 million from a loss of approximately $0.1 million compared to the same period in 2016. |
Nine Months Ended September 30, 2017 Highlights
|
|
• |
Increased total revenue by approximately $2.8 million, or 41%, when compared to the same period in 2016. |
|
|
• |
Increased same-store revenues and NOI by 17.1% and 31.3%, respectively, compared to the same period in 2016. |
|
|
• |
Increased same-store average physical occupancy by approximately 6.0% to 94.7% from 88.7% compared to the same period in 2016. |
|
|
• |
Increased same-store annualized rent per occupied square foot by approximately 10.0% to $11.85 from $10.77 compared to the same period in 2016. |
|
|
• |
Increased modified funds from operations to approximately $2.2 million from a loss of approximately $1.5 million compared to the same period in 2016. |
Mount Pleasant, South Carolina
On July 11, 2017, SSGT closed on a self storage facility located in Mount Pleasant, SC for a purchase price of approximately $5.7 million. The property has approximately 500 units and 48,000 rentable square feet.
Nantucket, Massachusetts
On August 22, 2017, SSGT closed on a self storage facility located in Nantucket, MA for a purchase price of approximately $37.5 million. The property has approximately 840 units and 93,000 rentable square feet.
Quarterly Distribution
On September 18, 2017, SSGT’s board of directors declared a daily distribution in the amount of $0.0010958904 per share on outstanding shares of common stock, payable to both Class A and Class T stockholders of record of such shares shown on its books as of the close of business each day during the period commencing October 1, 2017 and ending December 31, 2017. Such distributions payable to each stockholder of record during a month will be paid the following month.
Potential Acquisitions
Pembroke Pines, Florida
On February 8, 2016, a subsidiary of SSGT executed a purchase and sale agreement with an unaffiliated third party for the acquisition of property that is being developed into a self storage facility located in Pembroke Pines, FL (the “Pembroke Pines Property”). The purchase price for the Pembroke Pines Property is approximately $15.7 million. SSGT expects the acquisition of the Pembroke Pines Property to close in the fourth quarter of 2017 after construction is complete on the self storage facility and a certificate of occupancy has been issued.
Gilbert, Arizona
On April 5, 2017, a subsidiary of SSGT executed a purchase and sale agreement with an unaffiliated third party for the acquisition of property that is being developed into a self storage facility located in Gilbert, AZ (the “Riggs Road Property”). The purchase price for the Riggs Road Property is $10.0 million. SSGT expects the acquisition of the Riggs Road Property to close in the third quarter of 2018 after construction is complete on the self storage facility and a certificate of occupancy has been issued.
Las Vegas, Nevada
On May 9, 2017, a subsidiary of SSGT entered into an assignment with a subsidiary of its sponsor in which the subsidiary of its sponsor assigned SSGT a purchase and sale agreement with an unaffiliated third party for the acquisition of property that is being developed into a self storage facility located in Las Vegas, NV (the “Deer Springs Property”). The purchase price for the Deer Springs Property is approximately $9.2 million. SSGT expects the acquisition of the Deer Springs Property to close in the second quarter of 2018 after construction is complete on the self storage facility and a certificate of occupancy has been issued.
Eastlake, California
On June 5, 2017, a subsidiary of SSGT entered into an assignment with a subsidiary of its sponsor in which the subsidiary of its sponsor assigned SSGT a purchase and sale agreement with an unaffiliated third party for the acquisition of property that is being developed into a self storage facility located in Eastlake, CA (the “Eastlake Property”). The purchase price for the Eastlake Property is approximately $17.0 million. SSGT expects the acquisition of the Eastlake Property to close in the fourth quarter of 2017 or the first quarter 2018 after construction is complete on the self storage facility and a certificate of occupancy has been issued.
On June 9, 2017, a subsidiary of SSGT entered into an assignment with a subsidiary of its sponsor in which the subsidiary of its sponsor assigned SSGT a purchase and sale agreement with an unaffiliated third party for the acquisition of property that is being developed into a self storage facility located in Riverview, FL (the “Riverview Property”). The purchase price for the Riverview Property is approximately $7.8 million. SSGT expects the acquisition of the Riverview Property to close in the fourth quarter of 2017 after construction is complete on the self storage facility and a certificate of occupancy has been issued.
Subsequent Events
Riggs Road Preferred Equity
On November 9, 2017, a subsidiary of SSGT made a preferred equity investment of approximately $1.3 million in the developer of the Riggs Road Property. Such investment has a preferred return of 8% to be paid quarterly, with an additional 4% paid to SSGT upon the purchase of the completed property by a subsidiary of SSGT.
STRATEGIC STORAGE GROWTH TRUST, INC. AND SUBSIDIARIES
CONSOLIDATED BALANCE SHEETS
|
|
|
September 30, 2017 (Unaudited) |
|
|
December 31, 2016 |
|
||
|
ASSETS |
|
|
|
|
|
|
|
|
|
Real estate facilities: |
|
|
|
|
|
|
|
|
|
Land |
|
$ |
40,954,218 |
|
|
$ |
24,315,650 |
|
|
Buildings |
|
|
125,446,333 |
|
|
|
57,722,965 |
|
|
Site improvements |
|
|
9,525,161 |
|
|
|
5,542,989 |
|
|
|
|
|
175,925,712 |
|
|
|
87,581,604 |
|
|
Accumulated depreciation |
|
|
(5,852,214 |
) |
|
|
(3,300,523 |
) |
|
|
|
|
170,073,498 |
|
|
|
84,281,081 |
|
|
Construction in process |
|
|
7,670,177 |
|
|
|
2,174,191 |
|
|
Real estate facilities, net |
|
|
177,743,675 |
|
|
|
86,455,272 |
|
|
Cash and cash equivalents |
|
|
56,353,183 |
|
|
|
3,642,631 |
|
|
Other assets, net |
|
|
4,645,999 |
|
|
|
3,156,769 |
|
|
Debt issuance costs, net |
|
|
— |
|
|
|
292,160 |
|
|
Intangible assets, net |
|
|
1,070,499 |
|
|
|
391,143 |
|
|
Total assets |
|
$ |
239,813,356 |
|
|
$ |
93,937,975 |
|
|
LIABILITIES AND EQUITY |
|
|
|
|
|
|
|
|
|
Secured debt, net |
|
$ |
4,795,985 |
|
|
$ |
12,509,308 |
|
|
Accounts payable and accrued liabilities |
|
|
3,313,582 |
|
|
|
1,499,984 |
|
|
Due to affiliates |
|
|
3,557,655 |
|
|
|
963,535 |
|
|
Distributions payable |
|
|
802,925 |
|
|
|
305,764 |
|
|
Total liabilities |
|
|
12,470,147 |
|
|
|
15,278,591 |
|
|
Commitments and contingencies |
|
|
|
|
|
|
|
|
|
Redeemable common stock |
|
|
4,254,061 |
|
|
|
1,086,603 |
|
|
Equity: |
|
|
|
|
|
|
|
|
|
Strategic Storage Growth Trust, Inc. equity: |
|
|
|
|
|
|
|
|
|
Preferred Stock, $0.001 par value; 200,000,000 shares authorized; none issued and outstanding at September 30, 2017 and December 31, 2016 |
|
|
— |
|
|
|
— |
|
|
Class A Common stock, $0.001 par value; 350,000,000 shares authorized; 18,863,176 and 8,607,246 shares issued and outstanding at September 30, 2017 and December 31, 2016, respectively |
|
|
18,864 |
|
|
|
8,607 |
|
|
Class T Common stock, $0.001 par value; 350,000,000 shares authorized; 7,535,809 and 1,716,957 issued and outstanding at September 30, 2017 and December 31, 2016, respectively |
|
|
7,536 |
|
|
|
1,717 |
|
|
Additional paid-in capital |
|
|
247,547,637 |
|
|
|
92,442,198 |
|
|
Distributions |
|
|
(8,187,889 |
) |
|
|
(2,010,167 |
) |
|
Accumulated deficit |
|
|
(16,663,071 |
) |
|
|
(12,655,490 |
) |
|
Accumulated other comprehensive income (loss) |
|
|
436,721 |
|
|
|
(153,079 |
) |
|
Total Strategic Storage Growth Trust, Inc. equity |
|
|
223,159,798 |
|
|
|
77,633,786 |
|
|
Noncontrolling interests in our Operating Partnership |
|
|
(70,650 |
) |
|
|
(61,005 |
) |
|
Total equity |
|
|
223,089,148 |
|
|
|
77,572,781 |
|
|
Total liabilities and equity |
|
$ |
239,813,356 |
|
|
$ |
93,937,975 |
|
STRATEGIC STORAGE GROWTH TRUST, INC. AND SUBSIDIARIES
CONSOLIDATED STATEMENTS OF OPERATIONS
(Unaudited)
|
|
|
Three Months Ended September 30, |
|
|
Nine Months Ended September 30, |
|
||||||||||
|
|
|
2017 |
|
|
2016 |
|
|
2017 |
|
|
2016 |
|
||||
|
Revenues: |
|
|
|
|
|
|
|
|
|
|
|
|
|
|
|
|
|
Self storage rental revenue |
|
$ |
3,775,521 |
|
|
$ |
2,418,032 |
|
|
$ |
9,486,629 |
|
|
$ |
6,702,976 |
|
|
Ancillary operating revenue |
|
|
29,181 |
|
|
|
19,050 |
|
|
|
70,885 |
|
|
|
56,582 |
|
|
Total revenues |
|
|
3,804,702 |
|
|
|
2,437,082 |
|
|
|
9,557,514 |
|
|
|
6,759,558 |
|
|
Operating expenses: |
|
|
|
|
|
|
|
|
|
|
|
|
|
|
|
|
|
Property operating expenses |
|
|
1,862,731 |
|
|
|
993,269 |
|
|
|
4,350,934 |
|
|
|
2,996,316 |
|
|
Property operating expenses – affiliates |
|
|
605,275 |
|
|
|
255,957 |
|
|
|
1,265,058 |
|
|
|
720,069 |
|
|
General and administrative |
|
|
417,384 |
|
|
|
380,771 |
|
|
|
1,596,060 |
|
|
|
1,421,803 |
|
|
Depreciation |
|
|
1,182,706 |
|
|
|
534,244 |
|
|
|
2,716,371 |
|
|
|
1,525,208 |
|
|
Intangible amortization expense |
|
|
157,213 |
|
|
|
240,623 |
|
|
|
601,644 |
|
|
|
975,608 |
|
|
Acquisition expenses – affiliates |
|
|
925,570 |
|
|
|
51,298 |
|
|
|
1,998,058 |
|
|
|
601,534 |
|
|
Other property acquisition expenses |
|
|
542,548 |
|
|
|
30,797 |
|
|
|
882,454 |
|
|
|
180,012 |
|
|
Total operating expenses |
|
|
5,693,427 |
|
|
|
2,486,959 |
|
|
|
13,410,579 |
|
|
|
8,420,550 |
|
|
Operating loss |
|
|
(1,888,725 |
) |
|
|
(49,877 |
) |
|
|
(3,853,065 |
) |
|
|
(1,660,992 |
) |
|
Other income (expenses): |
|
|
|
|
|
|
|
|
|
|
|
|
|
|
|
|
|
Interest expense |
|
|
(24,992 |
) |
|
|
(347,362 |
) |
|
|
(64,147 |
) |
|
|
(1,189,240 |
) |
|
Interest expense – debt issuance costs |
|
|
(46,137 |
) |
|
|
(152,001 |
) |
|
|
(372,934 |
) |
|
|
(488,228 |
) |
|
Other |
|
|
168,284 |
|
|
|
(22,359 |
) |
|
|
278,934 |
|
|
|
(32,973 |
) |
|
Net loss |
|
|
(1,791,570 |
) |
|
|
(571,599 |
) |
|
|
(4,011,212 |
) |
|
|
(3,371,433 |
) |
|
Less: Distributions to preferred unitholders in our Operating Partnership |
|
|
— |
|
|
|
(379,232 |
) |
|
|
— |
|
|
|
(1,353,438 |
) |
|
Less: Accretion of preferred equity costs |
|
|
— |
|
|
|
(17,060 |
) |
|
|
— |
|
|
|
(68,578 |
) |
|
Net loss attributable to the noncontrolling interests in our Operating Partnership |
|
|
1,155 |
|
|
|
3,456 |
|
|
|
3,631 |
|
|
|
23,901 |
|
|
Net loss attributable to Strategic Storage Growth Trust, Inc. common stockholders |
|
$ |
(1,790,415 |
) |
|
$ |
(964,435 |
) |
|
$ |
(4,007,581 |
) |
|
$ |
(4,769,548 |
) |
|
Net loss per Class A share—basic and diluted |
|
$ |
(0.07 |
) |
|
$ |
(0.17 |
) |
|
$ |
(0.18 |
) |
|
$ |
(1.06 |
) |
|
Net loss per Class T share—basic and diluted |
|
$ |
(0.07 |
) |
|
$ |
(0.17 |
) |
|
$ |
(0.18 |
) |
|
$ |
(1.06 |
) |
|
Weighted average Class A shares outstanding—basic and diluted |
|
|
18,809,084 |
|
|
|
5,326,034 |
|
|
|
16,109,501 |
|
|
|
4,276,634 |
|
|
Weighted average Class T shares outstanding—basic and diluted |
|
|
7,520,457 |
|
|
|
404,319 |
|
|
|
5,962,771 |
|
|
|
219,139 |
|
STRATEGIC STORAGE GROWTH TRUST, INC. AND SUBSIDIARIES
NON-GAAP MEASURE – COMPUTATION OF FUNDS FROM OPERATIONS
(Unaudited)
|
|
|
Three Months Ended |
|
|
Nine Months Ended |
|
||||||||||
|
|
|
September 30, 2017 |
|
|
September 30, 2016 |
|
|
September 30, 2017 |
|
|
September 30, 2016 |
|
||||
|
Net loss (attributable to common stockholders) |
|
$ |
(1,790,415 |
) |
|
$ |
(964,435 |
) |
|
$ |
(4,007,581 |
) |
|
$ |
(4,769,548 |
) |
|
Add: |
|
|
|
|
|
|
|
|
|
|
|
|
|
|
|
|
|
Depreciation |
|
|
1,171,837 |
|
|
|
526,441 |
|
|
|
2,685,676 |
|
|
|
1,508,354 |
|
|
Amortization of intangible assets |
|
|
157,213 |
|
|
|
240,623 |
|
|
|
601,644 |
|
|
|
975,608 |
|
|
Deduct: |
|
|
|
|
|
|
|
|
|
|
|
|
|
|
|
|
|
Adjustment for noncontrolling interests |
|
|
(1,013 |
) |
|
|
(2,714 |
) |
|
|
(3,108 |
) |
|
|
(11,626 |
) |
|
FFO (attributable to common stockholders) |
|
|
(462,378 |
) |
|
|
(200,085 |
) |
|
|
(723,369 |
) |
|
|
(2,297,212 |
) |
|
Other Adjustments: |
|
|
|
|
|
|
|
|
|
|
|
|
|
|
|
|
|
Acquisition expenses(1) |
|
|
1,468,118 |
|
|
|
82,095 |
|
|
|
2,880,512 |
|
|
|
781,546 |
|
|
Adjustment for noncontrolling interests |
|
|
(1,119 |
) |
|
|
(277 |
) |
|
|
(2,640 |
) |
|
|
(4,197 |
) |
|
MFFO (attributable to common stockholders) |
|
$ |
1,004,621 |
|
|
$ |
(118,267 |
) |
|
$ |
2,154,503 |
|
|
$ |
(1,519,863 |
) |
SSGT’s results of operations for the three and nine months ended September 30, 2017 and 2016 have been significantly impacted by a favorable increase in same store operating income results of approximately $0.2 million and $0.9 million, respectively, a decrease in interest expense of approximately $0.3 million and $1.1 million, respectively, a decrease in distributions to preferred interest holders of approximately $0.4 million and $1.4 million, respectively, and an increase in interest income of $0.2 million and $0.3 million, respectively.
|
(1) |
In evaluating investments in real estate, SSGT differentiates the costs to acquire the investment from the operations derived from the investment. Such information would be comparable only for publicly registered, non-traded REITs that have generally completed their acquisition activity and have other similar operating characteristics. By excluding expensed acquisition related expenses, SSGT believes MFFO provides useful supplemental information that is comparable for each type of real estate investment and is consistent with management’s analysis of the investing and operating performance of our properties. Acquisition fees and expenses include payments to our Advisor and third parties. Acquisition related expenses under GAAP are considered operating expenses and as expenses included in the determination of net income (loss) and income (loss) from continuing operations, both of which are performance measures under GAAP. All paid and accrued acquisition fees and expenses will have negative effects on returns to investors, the potential for future distributions, and cash flows generated by us, unless earnings from operations or net sales proceeds from the disposition of other properties are generated to cover the purchase price of the property, these fees and expenses and other costs related to such property. |
Non-cash Items Included in Net Loss:
Provided below is additional information related to selected non-cash items included in net loss above, which may be helpful in assessing SSGT’s operating results:
|
|
• |
Debt issuance cost amortization of approximately $46,000 and $152,000 was recognized for the three months ended September 30, 2017 and 2016, respectively. Debt issuance cost amortization of approximately $373,000 and $488,000, was recognized for the nine months ended September 30, 2017 and 2016, respectively. |
STRATEGIC STORAGE GROWTH TRUST, INC. AND SUBSIDIARIES
NON-GAAP MEASURE – COMPUTATION OF SAME-STORE OPERATING RESULTS
(Unaudited)
The following table sets forth operating data for SSGT’s same-store facilities (those properties included in the consolidated results of operations since July 1, 2016, excluding two lease-up properties and two properties under development that SSGT owned as of July 1, 2016) for the three months ended September 30, 2017 and 2016. SSGT considers the following data to be meaningful as this allows for the comparison of results without the effects of acquisition or development activity.
|
|
|
Same-Store Facilities |
|
|
Non Same-Store Facilities |
|
Total |
|
||||||||||||||||||||||||||
|
|
|
2017 |
|
|
2016 |
|
|
% Change |
|
|
2017 |
|
|
2016 |
|
|
% Change |
|
2017 |
|
|
2016 |
|
|
% Change |
|
||||||||
|
Revenue(1) |
|
$ |
2,568,046 |
|
|
$ |
2,239,176 |
|
|
|
14.7 |
% |
|
$ |
1,236,656 |
|
|
$ |
197,906 |
|
|
N/M |
|
$ |
3,804,702 |
|
|
$ |
2,437,082 |
|
|
|
56.1 |
% |
|
Property operating expenses(2) |
|
|
1,068,138 |
|
|
|
982,168 |
|
|
|
8.8 |
% |
|
|
1,027,479 |
|
|
|
159,431 |
|
|
N/M |
|
|
2,095,617 |
|
|
|
1,141,599 |
|
|
|
83.6 |
% |
|
Net operating income |
|
$ |
1,499,908 |
|
|
$ |
1,257,008 |
|
|
|
19.3 |
% |
|
$ |
209,177 |
|
|
$ |
38,475 |
|
|
N/M |
|
$ |
1,709,085 |
|
|
$ |
1,295,483 |
|
|
|
31.9 |
% |
|
Number of facilities |
|
|
12 |
|
|
|
12 |
|
|
|
|
|
|
|
12 |
|
|
|
4 |
|
|
|
|
|
24 |
|
|
|
16 |
|
|
|
|
|
|
Rentable square feet(3) |
|
|
920,400 |
|
|
|
920,400 |
|
|
|
|
|
|
|
883,300 |
|
|
|
320,100 |
|
|
|
|
|
1,803,700 |
|
|
|
1,240,500 |
|
|
|
|
|
|
Average physical occupancy(4) |
|
|
94.9 |
% |
|
|
91.3 |
% |
|
|
|
|
|
N/M |
|
|
N/M |
|
|
|
|
84.2%(6) |
|
|
|
86.3 |
% |
|
|
|
|
|||
|
Annualized rent per occupied square foot(5) |
|
$ |
12.69 |
|
|
$ |
11.43 |
|
|
|
|
|
|
N/M |
|
|
N/M |
|
|
|
|
$ |
13.63 |
|
|
$ |
11.21 |
|
|
|
|
|
||
N/M Not meaningful
|
(1) |
Revenue includes rental revenue, ancillary revenue, and administrative and late fees. |
|
(2) |
Property operating expenses excludes corporate general and administrative expenses, asset management fees, interest expense, depreciation, amortization expense, acquisition expenses and costs incurred in connection with the property management changes, but includes property management fees. |
|
(3) |
Of the total rentable square feet, parking represented approximately 154,000 and approximately 117,000 as of September 30, 2017 and 2016, respectively. On a same-store basis, for the same periods, parking represented approximately 102,000 square feet. |
|
(4) |
Determined by dividing the sum of the month-end occupied square feet for the applicable group of facilities for each applicable period by the sum of their month-end rentable square feet for the period. Properties are included in the respective calculations in their first full month of operations, as appropriate. |
|
(5) |
Determined by dividing the aggregate realized revenue for each applicable period by the aggregate of the month-end occupied square feet for the period. Properties are included in the respective calculations in their first full month of operations, as appropriate. SSGT has excluded the realized revenue and occupied square feet related to parking herein for the purpose of calculating annualized rent per occupied square foot. |
|
(6) |
Decrease in average physical occupancy for the quarter ended September 30, 2017 as compared to September 30, 2016 is a result of SSGT’s acquisition of four lease-up properties subsequent to September 30, 2016. |
SSGT’s increase in same-store revenue of approximately $0.3 million was the result of increased average physical occupancy of approximately 4% and increased rent per occupied square foot of approximately 11% for the three months ended September 30, 2017 over the three months ended September 30, 2016.
The following table presents a reconciliation of net loss to net operating income as presented on SSGT’s consolidated statements of operations for the periods indicated:
|
|
|
For the Three Months Ended September 30, |
|
|||||
|
|
|
2017 |
|
|
2016 |
|
||
|
Net Loss |
|
$ |
(1,791,570 |
) |
|
$ |
(571,599 |
) |
|
Adjusted to exclude: |
|
|
|
|
|
|
|
|
|
Costs incurred in connection with the property management changes (1) |
|
|
167,532 |
|
|
|
— |
|
|
Asset management fees (2) |
|
|
204,857 |
|
|
|
107,627 |
|
|
General and administrative |
|
|
417,384 |
|
|
|
380,771 |
|
|
Depreciation |
|
|
1,182,706 |
|
|
|
534,244 |
|
|
Intangible amortization expense |
|
|
157,213 |
|
|
|
240,623 |
|
|
Acquisition expenses - affiliates |
|
|
925,570 |
|
|
|
51,298 |
|
|
Other property acquisition expenses |
|
|
542,548 |
|
|
|
30,797 |
|
|
Interest expense |
|
|
24,992 |
|
|
|
347,362 |
|
|
Interest expense - debt issuance costs |
|
|
46,137 |
|
|
|
152,001 |
|
|
Other |
|
|
(168,284 |
) |
|
|
22,359 |
|
|
Total net operating income |
|
$ |
1,709,085 |
|
|
$ |
1,295,483 |
|
|
(1) |
Costs incurred in connection with the property management changes are included in Property operating expenses – affiliates in the consolidated statements of operations. |
|
(2) |
Asset management fees are included in Property operating expenses – affiliates in the consolidated statements |
STRATEGIC STORAGE GROWTH TRUST, INC. AND SUBSIDIARIES
NON-GAAP MEASURE – COMPUTATION OF SAME-STORE OPERATING RESULTS
(Unaudited)
The following table sets forth operating data for SSGT’s same-store facilities (those properties included in the consolidated results of operations since January 1, 2016, excluding one lease-up property SSGT owned as of January 1, 2016) for the nine months ended September 30, 2017 and 2016. SSGT considers the following data to be meaningful as this allows for the comparison of results without the effects of acquisition or development activity.
|
|
|
Same-Store Facilities |
|
|
Non Same-Store Facilities |
|
Total |
|
||||||||||||||||||||||||||
|
|
|
2017 |
|
|
2016 |
|
|
% Change |
|
|
2017 |
|
|
2016 |
|
|
% Change |
|
2017 |
|
|
2016 |
|
|
% Change |
|
||||||||
|
Revenue(1) |
|
$ |
6,532,892 |
|
|
$ |
5,578,814 |
|
|
|
17.1 |
% |
|
$ |
3,024,622 |
|
|
$ |
1,180,744 |
|
|
N/M |
|
$ |
9,557,514 |
|
|
$ |
6,759,558 |
|
|
|
41.4 |
% |
|
Property operating expenses(2) |
|
|
2,554,856 |
|
|
|
2,548,766 |
|
|
|
0.2 |
% |
|
|
2,393,544 |
|
|
|
861,871 |
|
|
N/M |
|
|
4,948,400 |
|
|
|
3,410,637 |
|
|
|
45.1 |
% |
|
Net operating income |
|
$ |
3,978,036 |
|
|
$ |
3,030,048 |
|
|
|
31.3 |
% |
|
$ |
631,078 |
|
|
$ |
318,873 |
|
|
N/M |
|
$ |
4,609,114 |
|
|
$ |
3,348,921 |
|
|
|
37.6 |
% |
|
Number of facilities |
|
|
11 |
|
|
|
11 |
|
|
|
|
|
|
|
13 |
|
|
|
5 |
|
|
|
|
|
24 |
|
|
|
16 |
|
|
|
|
|
|
Rentable square feet(3) |
|
|
837,000 |
|
|
|
837,000 |
|
|
|
|
|
|
|
966,700 |
|
|
|
403,500 |
|
|
|
|
|
1,803,700 |
|
|
|
1,240,500 |
|
|
|
|
|
|
Average physical occupancy(4) |
|
|
94.7 |
% |
|
|
88.7 |
% |
|
|
|
|
|
N/M |
|
|
N/M |
|
|
|
|
82.0%(6) |
|
|
|
82.9 |
% |
|
|
|
|
|||
|
Annualized rent per occupied square foot(5) |
|
$ |
11.85 |
|
|
$ |
10.77 |
|
|
|
|
|
|
N/M |
|
|
N/M |
|
|
|
|
$ |
14.05 |
|
|
$ |
10.94 |
|
|
|
|
|
||
N/M Not meaningful
|
(1) |
Revenue includes rental revenue, ancillary revenue, and administrative and late fees. |
|
(2) |
Property operating expenses excludes corporate general and administrative expenses, asset management fees, interest expense, depreciation, amortization expense, acquisition expenses and costs incurred in connection with the property management changes, but includes property management fees. |
|
(3) |
Of the total rentable square feet, parking represented approximately 154,000 and approximately 117,000 as of September 30, 2017 and 2016, respectively. On a same-store basis, for the same periods, parking represented approximately 79,000 square feet. |
|
(4) |
Determined by dividing the sum of the month-end occupied square feet for the applicable group of facilities for each applicable period by the sum of their month-end rentable square feet for the period. Properties are included in the respective calculations in their first full month of operations, as appropriate. |
|
(5) |
Determined by dividing the aggregate realized revenue for each applicable period by the aggregate of the month-end occupied square feet for the period. Properties are included in the respective calculations in their first full month of operations, as appropriate. SSGT has excluded the realized revenue and occupied square feet related to parking herein for the purpose of calculating annualized rent per occupied square foot. |
|
(6) |
Decrease in average physical occupancy for the nine months ended September 30, 2017 as compared to September 30, 2016 is a result of SSGT’s acquisition of four lease-up properties subsequent to September 30, 2016. |
SSGT’s increase in same-store revenue of approximately $1.0 million was the result of increased average physical occupancy of approximately 6% and increased rent per occupied square foot of approximately 10% for the nine months ended September 30, 2017 over the nine months ended September 30, 2016.
The following table presents a reconciliation of net loss to net operating income as presented on SSGT’s consolidated statements of operations for the periods indicated:
|
|
|
For the Nine Months Ended September 30, |
|
|||||
|
|
|
2017 |
|
|
2016 |
|
||
|
Net Loss |
|
$ |
(4,011,212 |
) |
|
$ |
(3,371,433 |
) |
|
Adjusted to exclude: |
|
|
|
|
|
|
|
|
|
Costs incurred in connection with the property management changes (1) |
|
|
167,532 |
|
|
|
— |
|
|
Asset management fees (2) |
|
|
500,060 |
|
|
|
305,748 |
|
|
General and administrative |
|
|
1,596,060 |
|
|
|
1,421,803 |
|
|
Depreciation |
|
|
2,716,371 |
|
|
|
1,525,208 |
|
|
Intangible amortization expense |
|
|
601,644 |
|
|
|
975,608 |
|
|
Acquisition expenses—affiliates |
|
|
1,998,058 |
|
|
|
601,534 |
|
|
Other property acquisition expenses |
|
|
882,454 |
|
|
|
180,012 |
|
|
Interest expense |
|
|
64,147 |
|
|
|
1,189,240 |
|
|
Interest expense—debt issuance costs |
|
|
372,934 |
|
|
|
488,228 |
|
|
Other |
|
|
(278,934 |
) |
|
|
32,973 |
|
|
Total net operating income |
|
$ |
4,609,114 |
|
|
$ |
3,348,921 |
|
|
(1) |
Costs incurred in connection with the property management changes are included in Property operating expenses – affiliates in the consolidated statements of operations. |
|
(2) |
Asset management fees are included in Property operating expenses – affiliates in the consolidated statements |
ADDITIONAL INFORMATION REGARDING NOI, FFO, and MFFO
Net Operating Income (“NOI”)
NOI is a non-GAAP measure that SSGT defines as net income (loss), computed in accordance with GAAP, generated from properties before corporate general and administrative expenses, costs incurred in connection with the property management change, asset management fees, interest expense, depreciation, amortization, acquisition expenses and other non-property related expenses. SSGT believes that NOI is useful for investors as it provides a measure of the operating performance of its operating assets because NOI excludes certain items that are not associated with the ongoing operation of the properties. Additionally, SSGT believes that NOI is a widely accepted measure of comparative operating performance in the real estate community. However, SSGT’s use of the term NOI may not be comparable to that of other real estate companies as they may have different methodologies for computing this amount.
Funds from Operations (“FFO”) and Modified Funds from Operations (“MFFO”)
Due to certain unique operating characteristics of real estate companies, the National Association of Real Estate Investment Trusts, or NAREIT, an industry trade group, has promulgated a measure known as funds from operations, or FFO, which SSGT believes to be an appropriate supplemental measure to reflect the operating performance of a REIT. The use of FFO is recommended by the REIT industry as a supplemental performance measure. FFO is not equivalent to SSGT’s net income (loss) as determined under GAAP.
SSGT defines FFO, a non-GAAP measure, consistent with the standards established by the White Paper on FFO approved by the Board of Governors of NAREIT, as revised in February 2004, or the White Paper. The White Paper defines FFO as net income (loss) computed in accordance with GAAP, excluding gains or losses from sales of property and asset impairment write downs, plus depreciation and amortization, and after adjustments for unconsolidated partnerships and joint ventures. Adjustments for unconsolidated partnerships and joint ventures are calculated to reflect FFO on the same basis. SSGT’s FFO calculation complies with NAREIT’s policy described above.
The historical accounting convention used for real estate assets requires straight-line depreciation of buildings and improvements, which implies that the value of real estate assets diminishes predictably over time. Diminution in value may occur if such assets are not adequately maintained or repaired and renovated as required by relevant circumstances or other measures necessary to maintain the assets are not undertaken. However, SSGT believes that, since real estate values historically rise and fall with market conditions, including inflation, interest rates, the business cycle, unemployment and consumer spending, presentations of operating results for a REIT using historical accounting for depreciation may be less informative. In addition, in the determination of FFO, SSGT believes it is appropriate to disregard impairment charges, as this is a fair value adjustment that is largely based on market fluctuations and assessments regarding general market conditions which can change over time. An asset will only be evaluated for impairment if certain impairment indications exist and if the carrying value, or book value, exceeds the total estimated undiscounted future cash flows (including net rental revenues, net proceeds on the sale of the property, and any other ancillary cash flows at a property or group level under GAAP) from such asset. Testing for impairment is a continuous process and is analyzed on a quarterly basis. Investors should note, however, that determinations of whether impairment charges have been incurred are based partly on anticipated operating performance, because estimated undiscounted future cash flows from a property, including estimated future net rental revenues, net proceeds on the sale of the property, and certain other ancillary cash flows, are taken into account in determining whether an impairment charge has been incurred. While impairment charges are excluded from the calculation of FFO as described above, investors are cautioned that due to the fact that impairments are based on estimated future undiscounted cash flows and that SSGT intends to have a relatively limited term of its operations; it could be difficult to recover any impairment charges through the eventual sale of the property. To date, SSGT has not recognized any impairments.
Historical accounting for real estate involves the use of GAAP. Any other method of accounting for real estate such as the fair value method cannot be construed to be any more accurate or relevant than the comparable methodologies of real estate valuation found in GAAP. Nevertheless, SSGT believes that the use of FFO, which excludes the impact of real estate related depreciation and amortization and impairments, assists in providing a more complete understanding of its performance to investors and to its management, and when compared year over year, reflects the impact on SSGT’s operations from trends in occupancy rates, rental rates, operating costs, general and administrative expenses, and interest costs, which may not be immediately apparent from net income (loss).
However, FFO or modified funds from operations (“MFFO”), discussed below, should not be construed to be more relevant or accurate than the current GAAP methodology in calculating net income (loss) or in its applicability in evaluating SSGT’s operating performance. The method utilized to evaluate the value and performance of real estate under GAAP should be considered a more relevant measure of operational performance and is, therefore, given more prominence than the non-GAAP FFO and MFFO measures and the adjustments to GAAP in calculating FFO and MFFO.
Changes in the accounting and reporting rules under GAAP that were put into effect and other changes to GAAP accounting for real estate subsequent to the establishment of NAREIT’s definition of FFO have prompted an increase in cash-settled expenses, specifically acquisition fees and expenses, that are expensed as operating expenses under GAAP. SSGT believes these fees and expenses do not affect its overall long-term operating performance. Publicly registered, non-traded REITs typically have a significant amount of acquisition activity and are substantially more dynamic during their initial years of investment and operation. The purchase of properties, and the corresponding expenses associated with that process, is a key feature of SSGT’s business plan in order to generate operational income and cash flow in order to make distributions to investors. While other start-up entities may also experience significant acquisition activity during their initial years, SSGT believes that publicly registered, non-traded REITs are unique in that they typically have a limited life with targeted exit strategies within a relatively limited time frame after the acquisition activity ceases. As disclosed in the prospectus for SSGT’s offering, SSGT will use the proceeds raised in its offering, including under its distribution reinvestment plan, to acquire properties and SSGT expects to begin the process of achieving a liquidity event (i.e., listing of its shares of common stock on a national securities exchange, a merger or sale, the sale of all or substantially all of its assets, or another similar transaction) within three to five years after the completion of its offering, which is generally comparable to other publicly registered, non-traded REITs. Thus, SSGT does not intend to continuously purchase assets and intends to have a limited life. The decision whether to engage in any liquidity event is in the sole discretion of the board of directors of SSGT. Due to the above factors and other unique features of publicly registered, non-traded REITs, the Investment Program Association, or the IPA, an industry trade group, has standardized a measure known as MFFO, which the IPA has recommended as a supplemental measure for publicly registered, non-traded REITs and which SSGT believes to be another appropriate supplemental measure to reflect the operating performance of a publicly registered, non-traded REIT having the characteristics described above. MFFO is not equivalent to SSGT’s net income (loss) as determined under GAAP, and MFFO may not be a useful measure of the impact of long-term operating performance on value if SSGT does not ultimately engage in a liquidity event. SSGT believes that, because MFFO excludes acquisition fees and expenses that affect its operations only in periods in which properties are acquired and that SSGT considers more reflective of investing activities, as well as other non-operating items included in FFO, MFFO can provide, on a going-forward basis, an indication of the sustainability (that is, the capacity to continue to be maintained) of SSGT’s operating performance after the period in which it is acquiring properties and once its portfolio is in place. By providing MFFO, SSGT believes it is presenting useful information that assists investors and analysts to better assess the sustainability of its operating performance after its offering has been completed and its properties have been acquired. SSGT also believes that MFFO is a recognized measure of sustainable operating performance by the publicly registered, non-traded REIT industry. Further, SSGT believes MFFO is useful in comparing the sustainability of its operating performance after its offering and acquisitions are completed with the sustainability of the operating performance of other real estate companies that are not as involved in acquisition activities. Investors are cautioned that MFFO should only be used to assess the sustainability of SSGT’s operating performance after its offering has been completed and properties have been acquired, as it excludes acquisition fees and expenses that have a negative effect on SSGT’s operating performance during the periods in which properties are acquired.
SSGT defines MFFO, a non-GAAP measure, consistent with the IPA’s Guideline 2010-01, Supplemental Performance Measure for Publicly Registered, Non-Listed REITs: Modified Funds From Operations (the “Practice Guideline”) issued by the IPA in November 2010. The Practice Guideline defines MFFO as FFO further adjusted for the following items included in the determination of GAAP net income (loss): acquisition fees and expenses; amounts relating to straight line rents and amortization of above or below intangible lease assets and liabilities; accretion of discounts and amortization of premiums on debt investments; non-recurring impairments of real estate related investments; mark-to-market adjustments included in net income; non-recurring gains or losses included in net income from the extinguishment or sale of debt, hedges, foreign exchange, derivatives or securities holdings where trading of such holdings is not a fundamental attribute of the business plan, unrealized gains or losses resulting from consolidation from, or deconsolidation to, equity accounting, adjustments relating to contingent
purchase price obligations included in net income, and after adjustments for consolidated and unconsolidated partnerships and joint ventures, with such adjustments calculated to reflect MFFO on the same basis. The accretion of discounts and amortization of premiums on debt investments, unrealized gains and losses on hedges, foreign exchange, derivatives or securities holdings, unrealized gains and losses resulting from consolidations, as well as other listed cash flow adjustments are adjustments made to net income (loss) in calculating cash flows from operations and, in some cases, reflect gains or losses which are unrealized and may not ultimately be realized.
SSGT’s MFFO calculation complies with the IPA’s Practice Guideline described above. In calculating MFFO, SSGT excludes acquisition related expenses. The other adjustments included in the IPA’s Practice Guideline are not applicable to SSGT for the periods presented. Acquisition fees and expenses are paid in cash by SSGT, and it has not set aside or put into escrow any specific amount of proceeds from its offering to be used to fund acquisition fees and expenses. SSGT does not intend to fund acquisition fees and expenses in the future from operating revenues and cash flows, nor from the sale of properties and subsequent re-deployment of capital and concurrent incurring of acquisition fees and expenses. Acquisition fees and expenses include payments to SSGT’s advisor and third parties. Acquisition related expenses under GAAP are considered operating expenses and as expenses included in the determination of net income (loss) and income (loss) from continuing operations, both of which are performance measures under GAAP. All paid and accrued acquisition fees and expenses will have negative effects on returns to investors, the potential for future distributions, and cash flows generated by SSGT, unless earnings from operations or net sales proceeds from the disposition of other properties are generated to cover the purchase price of the property, these fees and expenses and other costs related to such property. In the future, if SSGT is not able to raise additional proceeds from its offering, this could result in SSGT paying acquisition fees or reimbursing acquisition expenses due to its advisor, or a portion thereof, with net proceeds from borrowed funds, operational earnings or cash flows, net proceeds from the sale of properties, or ancillary cash flows. As a result, the amount of proceeds available for investment and operations would be reduced, or SSGT may incur additional interest expense as a result of borrowed funds.
Further, under GAAP, certain contemplated non-cash fair value and other non-cash adjustments are considered operating non-cash adjustments to net income (loss) in determining cash flows from operations. In addition, SSGT views fair value adjustments of derivatives and the amortization of fair value adjustments related to debt as items which are unrealized and may not ultimately be realized or as items which are not reflective of on-going operations and are therefore typically adjusted for when assessing operating performance.
SSGT uses MFFO and the adjustments used to calculate it in order to evaluate its performance against other publicly registered, non-traded REITs which intend to have limited lives with short and defined acquisition periods and targeted exit strategies shortly thereafter. As noted above, MFFO may not be a useful measure of the impact of long-term operating performance if SSGT does not continue to operate in this manner. SSGT believes that its use of MFFO and the adjustments used to calculate it allow it to present its performance in a manner that reflects certain characteristics that are unique to publicly registered, non-traded REITs, such as their limited life, limited and defined acquisition period and targeted exit strategy, and hence that the use of such measures may be useful to investors. For example, acquisition fees and expenses are intended to be funded from the proceeds of SSGT’s offering and other financing sources and not from operations. By excluding expensed acquisition fees and expenses, the use of MFFO provides information consistent with management’s analysis of the operating performance of the properties. Additionally, fair value adjustments, which are based on the impact of current market fluctuations and underlying assessments of general market conditions, but can also result from operational factors such as rental and occupancy rates, may not be directly related or attributable to SSGT’s current operating performance. By excluding such charges that may reflect anticipated and unrealized gains or losses, SSGT believes MFFO provides useful supplemental information.
Presentation of this information is intended to provide useful information to investors as they compare the operating performance of different REITs, although it should be noted that not all REITs calculate FFO and MFFO the same way, so comparisons with other REITs may not be meaningful. Furthermore, FFO and MFFO are not necessarily indicative of cash flow available to fund cash needs and should not be considered as an alternative to net income (loss) or income (loss) from continuing operations as an indication of SSGT’s performance, as an alternative to cash flows from operations, which is an indication of SSGT’s liquidity, or indicative of funds available to fund SSGT’s cash needs including its ability to make distributions to its stockholders. FFO and MFFO should be reviewed in conjunction with other measurements as an indication of SSGT’s performance. MFFO may be useful in
assisting management and investors in assessing the sustainability of operating performance in future operating periods, and in particular, after the offering and acquisition stages are complete.
Neither the SEC, NAREIT, nor any other regulatory body has passed judgment on the acceptability of the adjustments that SSGT uses to calculate FFO or MFFO. In the future, the SEC, NAREIT or another regulatory body may decide to standardize the allowable adjustments across the publicly registered, non-traded REIT industry and SSGT would have to adjust its calculation and characterization of FFO or MFFO.
About Strategic Storage Growth Trust, Inc. (“SSGT”):
SSGT is a public non-traded REIT that focuses on the acquisition, development, redevelopment and lease-up of self storage properties. The SSGT portfolio currently consists of 21 operating self storage facilities located in ten states comprising approximately 13,700 self storage units and approximately 1.6 million net rentable square feet of storage space. Additionally, SSGT owns two development properties in the Greater Toronto Area which will be comprised of approximately 1,700 self storage units and 170,000 net rental square feet of storage space once completed, and one development property in Asheville, North Carolina which will be comprised of approximately 650 self storage units and 72,000 net rental square feet of storage space once completed.
About SmartStop Asset Management, LLC (“SmartStop”):
SmartStop is a diversified real estate company focused on self storage assets, along with student and senior housing. SmartStop has a managed portfolio that currently includes approximately 68,000 self storage units, 7.9 million rentable square feet, and $1.3 billion of real estate assets under management. SmartStop is the asset and property manager for 108 self storage facilities located throughout the United States and Toronto, Canada and the asset manager of three student housing facilities. SmartStop is the sponsor of Strategic Storage Trust II, Inc., SSGT and Strategic Storage Trust IV, Inc., all public non-traded REITs focusing on self storage assets. The self storage facilities offer affordable and accessible storage units for residential and commercial customers. In addition, they offer secure interior and exterior storage units as well as outside storage areas for vehicles, RVs and boats. Additional information is available at www.smartstopassetmanagement.com.
This press release may contain certain forward-looking statements within the meaning of Section 27A of the Securities Act of 1933, as amended, and Section 21E of the Securities Exchange Act of 1934, as amended. Such forward-looking statements can generally be identified by our use of forward-looking terminology such as “may,” “will,” “expect,” “intend,” “anticipate,” “estimate,” “believe,” “continue,” or other similar words. Because such statements include risks, uncertainties and contingencies, actual results may differ materially from the expectations, intentions, beliefs, plans or predictions of the future expressed or implied by such forward-looking statements. These risks, uncertainties and contingencies include, but are not limited to: uncertainties relating to changes in general economic and real estate conditions; uncertainties relating to the implementation of our real estate investment strategy; uncertainties relating to financing availability and capital proceeds; uncertainties relating to the closing of property acquisitions; uncertainties related to the timing and availability of distributions; and other risk factors as outlined in the Company’s public filings with the Securities and Exchange Commission. This is neither an offer nor a solicitation to purchase securities.