Attached files
| file | filename |
|---|---|
| EX-32.2 - EXHIBIT 32.2 - HEICO CORP | fy201710kexhibit322.htm |
| EX-32.1 - EXHIBIT 32.1 - HEICO CORP | fy201710kexhibit321.htm |
| EX-31.2 - EXHIBIT 31.2 - HEICO CORP | fy201710kexhibit312.htm |
| EX-31.1 - EXHIBIT 31.1 - HEICO CORP | fy201710kexhibit311.htm |
| EX-23 - EXHIBIT 23 - HEICO CORP | fy201710kexhibit23.htm |
| EX-21 - EXHIBIT 21 - HEICO CORP | fy201710kexhibit21.htm |
UNITED STATES
SECURITIES AND EXCHANGE COMMISSION
Washington, D.C. 20549
FORM 10-K
ý | ANNUAL REPORT PURSUANT TO SECTION 13 OR 15(d) OF | |
THE SECURITIES EXCHANGE ACT OF 1934 | ||
For the fiscal year ended October 31, 2017 or | ||
¨ | TRANSITION REPORT PURSUANT TO SECTION 13 OR 15(d) OF | |
THE SECURITIES EXCHANGE ACT OF 1934 | ||
For the transition period from ___________________to__________________ | ||
Commission file number 001-04604
HEICO CORPORATION
(Exact name of registrant as specified in its charter)
Florida | 65-0341002 |
(State or other jurisdiction of incorporation or organization) | (I.R.S. Employer Identification No.) |
3000 Taft Street, Hollywood, Florida | 33021 |
(Address of principal executive offices) | (Zip Code) |
Registrant’s telephone number, including area code: (954) 987-4000
Securities registered pursuant to Section 12(b) of the Act:
Title of each class | Name of each exchange on which registered | |||
Common Stock, $.01 par value per share | New York Stock Exchange | |||
Class A Common Stock, $.01 par value per share | New York Stock Exchange | |||
Securities registered pursuant to Section 12(g) of the Act:
None
Indicate by check mark if the registrant is a well-known seasoned issuer, as defined in Rule 405 of the Securities Act. Yes ý No o
Indicate by check mark if the registrant is not required to file reports pursuant to Section 13 or Section 15(d) of the Act. Yes o No ý
Indicate by check mark whether the registrant (1) has filed all reports required to be filed by Section 13 or 15(d) of the Securities Exchange Act of 1934 during the preceding 12 months (or for such shorter period that the registrant was required to file such reports), and (2) has been subject to such filing requirements for the past 90 days. Yes ý No o
Indicate by check mark whether the registrant has submitted electronically and posted on its corporate Web site, if any, every Interactive Data File required to be submitted and posted pursuant to Rule 405 of Regulation S-T (§232.405 of this chapter) during the preceding 12 months (or for such shorter period that the registrant was required to submit and post such files). Yes ý No o
Indicate by check mark if disclosure of delinquent filers pursuant to Item 405 of Regulation S-K (§229.405 of this chapter) is not contained herein, and will not be contained, to the best of the registrant's knowledge, in definitive proxy or information statements incorporated by reference in Part III of this Form 10-K or any amendment to this Form 10-K. ý
Indicate by check mark whether the registrant is a large accelerated filer, an accelerated filer, a non-accelerated filer, a smaller reporting company, or an emerging growth company. See the definitions of “large accelerated filer,” “accelerated filer,” “smaller reporting company,” and "emerging growth company" in Rule 12b-2 of the Exchange Act.
Large accelerated filer ý Accelerated filer o Non-accelerated filer o Smaller reporting company o Emerging growth company o
If an emerging growth company, indicate by check mark if the registrant has elected not to use the extended transition period for complying with any new or revised financial accounting standards provided pursuant to Section 13(a) of the Exchange Act. o
Indicate by check mark whether the registrant is a shell company (as defined in Rule 12b-2 of the Act). Yes o No ý
The aggregate market value of the voting and non-voting common equity held by non-affiliates of the registrant was $5,092,102,000 based on the closing price of HEICO Common Stock and Class A Common Stock as of April 30, 2017 as reported by the New York Stock Exchange.
The number of shares outstanding of each of the registrant’s classes of common stock as of December 19, 2017
Common Stock, $.01 par value | 33,776,523 shares |
Class A Common Stock, $.01 par value | 50,728,853 shares |
DOCUMENTS INCORPORATED BY REFERENCE
Portions of the registrant's definitive proxy statement for the 2018 Annual Meeting of Shareholders are incorporated by reference into Part III of this Annual Report on Form 10-K.
HEICO CORPORATION
INDEX TO ANNUAL REPORT ON FORM 10-K
FOR THE FISCAL YEAR ENDED OCTOBER 31, 2017
Page | |||
PART I | |||
Item 1. | |||
Item 1A. | |||
Item 1B. | |||
Item 2. | |||
Item 3. | |||
Item 4. | |||
PART II | |||
Item 5. | |||
Item 6. | |||
Item 7. | |||
Item 7A. | |||
Item 8. | |||
Item 9. | |||
Item 9A. | |||
Item 9B. | |||
PART III | |||
Item 10. | |||
Item 11. | |||
Item 12. | |||
Item 13. | |||
Item 14. | |||
PART IV | |||
Item 15. | |||
Item 16. | |||
SIGNATURES | |||
PART I
Item 1. BUSINESS
The Company
HEICO Corporation through its subsidiaries (collectively, “HEICO,” “we,” “us,” “our” or the “Company”) believes it is the world’s largest manufacturer of Federal Aviation Administration (“FAA”)-approved jet engine and aircraft component replacement parts, other than the original equipment manufacturers (“OEMs”) and their subcontractors. HEICO also believes it is a leading manufacturer of various types of electronic equipment for the aviation, defense, space, medical, telecommunications and electronics industries.
The Company was originally organized in 1957 as a holding company known as HEICO Corporation. As part of a reorganization completed in 1993, the original holding company (formerly known as HEICO Corporation) was renamed as HEICO Aerospace Corporation and a new holding corporation known as HEICO Corporation was created. The reorganization did not result in any change in the business of the Company, its consolidated assets or liabilities or the relative interests of its shareholders.
Our business is comprised of two operating segments:
The Flight Support Group. Our Flight Support Group (“FSG”), consisting of HEICO Aerospace Holdings Corp. and HEICO Flight Support Corp. and their collective subsidiaries, accounted for 63%, 64% and 68% of our net sales in fiscal 2017, 2016 and 2015, respectively. The Flight Support Group uses proprietary technology to design and manufacture jet engine and aircraft component replacement parts for sale at lower prices than those manufactured by OEMs. These parts are approved by the FAA and are the functional equivalent of parts sold by OEMs. In addition, the Flight Support Group repairs, overhauls and distributes jet engine and aircraft components, avionics and instruments for domestic and foreign commercial air carriers and aircraft repair companies as well as military and business aircraft operators; and manufactures thermal insulation products, complex composite assemblies and other component parts primarily for aerospace, defense, industrial and commercial applications.
The Electronic Technologies Group. Our Electronic Technologies Group (“ETG”), consisting of HEICO Electronic Technologies Corp. and its subsidiaries, accounted for 37%, 36% and 32% of our net sales in fiscal 2017, 2016 and 2015, respectively. Through our Electronic Technologies Group, which derived approximately 64%, 65% and 56% of its net sales in fiscal 2017, 2016 and 2015, respectively, from the sale of products and services to United States ("U.S.") and foreign military agencies, prime defense contractors and both commercial and defense satellite and spacecraft manufacturers, we design, manufacture and sell various types of electronic, microwave and electro-optical products, including infrared simulation and test equipment, laser rangefinder receivers, electrical power supplies, back-up power supplies, power conversion products, underwater locator beacons, electromagnetic interference and radio frequency interference shielding, high power capacitor charging power supplies, amplifiers,
1
traveling wave tube amplifiers, photodetectors, amplifier modules, microwave power modules, flash lamp drivers, laser diode drivers, arc lamp power supplies, custom power supply designs, cable assemblies, high voltage power supplies, high voltage interconnection devices and wire, high voltage energy generators, high frequency power delivery systems, three-dimensional microelectronic and stacked memory products, harsh environment electronic connectors and other interconnect products, radio frequency ("RF") and microwave amplifiers, transmitters and receivers, wireless cabin control systems, solid state power distribution and management systems, crashworthy and ballistically self-sealing auxiliary fuel systems, communications and electronic intercept receivers and tuners, fuel level sensing systems, high-speed interface products that link devices such as telemetry receivers, digital cameras, high resolution scanners, simulation systems and test systems to almost any computer and high performance active antenna systems for commercial aircraft, precision guided munitions, other defense applications and commercial uses.
HEICO has continuously operated in the aerospace industry for over 60 years. Since assuming control in 1990, our current management has achieved significant sales and profit growth through a broadened line of product offerings, an expanded customer base, increased research and development expenditures and the completion of a number of acquisitions. As a result of internal growth and acquisitions, our net sales from continuing operations have grown from $26.2 million in fiscal 1990 to $1,524.8 million in fiscal 2017, representing a compound annual growth rate of approximately 16%. During the same period, we improved our net income from $2.0 million to $186.0 million, representing a compound annual growth rate of approximately 18%.
Disciplined Acquisition Strategy
Acquisitions have been an important element of our growth strategy over the past twenty-seven years, supplementing our organic growth. Since 1990, we have completed approximately 66 acquisitions complementing the niche segments of the aviation, defense, space, medical, telecommunications and electronics industries in which we operate. We typically target acquisition opportunities that allow us to broaden our product offerings, services and technologies while expanding our customer base and geographic presence. Even though we have historically pursued an active acquisition policy, our disciplined acquisition strategy involves limiting acquisition candidates to businesses that we believe will continue to grow, offer strong cash flow and earnings potential, and are available at fair prices. See Note 2, Acquisitions, of the Notes to Consolidated Financial Statements for further information regarding our recent acquisitions.
Flight Support Group
The Flight Support Group, headquartered in Hollywood, Florida, serves a broad spectrum of the aviation industry, including (i) commercial airlines and air cargo carriers; (ii) repair and overhaul facilities; (iii) OEMs; and (iv) U.S. and foreign governments.
2
The Flight Support Group competes with the leading industry OEMs and, to a lesser extent, with a number of smaller, independent parts distributors. Historically, the three principal jet engine OEMs, General Electric (including CFM International), Pratt & Whitney and Rolls Royce, have been the sole source of substantially all jet engine replacement parts for their jet engines. Other OEMs have been the sole source of replacement parts for their aircraft component parts. While we believe that we currently supply approximately 2% of the market for jet engine and aircraft component replacement parts, we have in recent years been adding new products to our line at a rate of approximately 300 to 500 Parts Manufacturer Approvals (“PMA” or “PMAs”) per year. We have developed for our customers approximately 10,000 parts for which PMAs have been received from the FAA.
Jet engine and aircraft component replacement parts can be categorized by their ongoing ability to be repaired and returned to service. The general categories in which we participate are as follows: (i) rotable; (ii) repairable; and (iii) expendable. A rotable is a part which is removed periodically as dictated by an operator’s maintenance procedures or on an as needed basis and is typically repaired or overhauled and re-used an indefinite number of times. An important subset of rotables is “life limited” parts. A life limited rotable has a designated number of allowable flight hours and/or cycles (one take-off and landing generally constitutes one cycle) after which it is rendered unusable. A repairable is similar to a rotable except that it can only be repaired a limited number of times before it must be discarded. An expendable is generally a part which is used and not thereafter repaired for further use.
Jet engine and aircraft component replacement parts are classified within the industry as (i) factory-new; (ii) new surplus; (iii) overhauled; (iv) repairable; and (v) as removed. A factory-new or new surplus part is one that has never been installed or used. Factory-new parts are purchased from FAA-approved manufacturers (such as HEICO or OEMs) or their authorized distributors. New surplus parts are purchased from excess stock of airlines, repair facilities or other redistributors. An overhauled part is one that has been completely repaired and inspected by a licensed repair facility such as ours. An aircraft spare part is classified as “repairable” if it can be repaired by a licensed repair facility under applicable regulations. A part may also be classified as “repairable” if it can be removed by the operator from an aircraft or jet engine while operating under an approved maintenance program and is airworthy and meets any manufacturer or time and cycle restrictions applicable to the part. A “factory-new,” “new surplus” or “overhauled” part designation indicates that the part can be immediately utilized on an aircraft. A part in “as removed” or “repairable” condition requires inspection and possibly functional testing, repair or overhaul by a licensed facility prior to being returned to service in an aircraft.
Factory-New Jet Engine and Aircraft Component Replacement Parts. The Flight Support Group engages in the research and development, design, manufacture and sale of FAA-approved replacement parts that are sold to domestic and foreign commercial air carriers and aircraft repair and overhaul companies. Our principal competitors are aircraft engine and aircraft component manufacturers. The Flight Support Group’s factory-new replacement parts include various jet engine and aircraft component replacement parts. A key element of our growth strategy is the continued design and development of an increasing number of PMA replacement parts in order
3
to further penetrate our existing customer base and obtain new customers. We select the jet engine and aircraft component replacement parts to design and manufacture through a selection process which analyzes industry information to determine which replacement parts are suitable candidates.
Repair and Overhaul Services. The Flight Support Group provides repair and overhaul services on selected jet engine and aircraft component parts, as well as on avionics, instruments, composites and flight surfaces of commercial aircraft operated by domestic and foreign commercial airlines. The Flight Support Group also provides repair and overhaul services including avionics and navigation systems as well as subcomponents and other instruments utilized on military aircraft operated by the U.S. government and foreign military agencies and for aircraft repair and overhaul companies. Our repair and overhaul operations require a high level of expertise, advanced technology and sophisticated equipment. Services include the repair, refurbishment and overhaul of numerous accessories and parts mounted on gas turbine engines and airframes. Components overhauled include fuel pumps, generators, fuel controls, pneumatic valves, starters and actuators, turbo compressors and constant speed drives, hydraulic pumps, valves and actuators, wheels and brakes, composite flight controls, electro-mechanical equipment, auxiliary power unit accessories and thrust reverse actuation systems. Some of the repair and overhaul services provided by the Flight Support Group are proprietary repairs approved by an FAA-qualified designated engineering representative (“DER”). Such FAA-approved repairs (DER-approved repairs) typically create cost savings or provide engineering flexibility. The Flight Support Group also provides commercial airlines, regional operators, asset management companies and Maintenance, Repair and Overhaul (“MRO”) providers with high quality and cost effective niche accessory component exchange services as an alternative to OEMs’ spares services.
Distribution. The Flight Support Group distributes FAA-approved parts including hydraulic, pneumatic, structural, interconnect, mechanical and electro-mechanical components for the commercial, regional and general aviation markets. The Flight Support Group also is a leading supplier, distributor, and integrator of military aircraft parts and support services primarily to foreign military organizations allied with the U.S. Further, we believe the Flight Support Group is a leading provider of products and services necessary to maintain up-to-date F-16 fighter aircraft operational capabilities.
Manufacture of Specialty Aircraft/Defense Related Parts and Subcontracting for OEMs. The Flight Support Group engineers, designs and manufactures thermal insulation blankets and parts as well as renewable/reusable insulation systems primarily for aerospace, defense, commercial and industrial applications. The Flight Support Group also manufactures specialty components for sale as a subcontractor for aerospace and industrial original equipment manufacturers and the U.S. government. Additionally, the Flight Support Group manufactures advanced niche components and complex composite assemblies for commercial aviation, defense and space applications and manufactures expanded foil mesh, which is integrated into composite aerospace structures for lightning strike protection in fixed and rotary wing aircraft.
4
FAA Approvals and Product Design. Non-OEM manufacturers of jet engine and aircraft component replacement parts must receive a PMA from the FAA to sell the replacement part. The PMA approval process includes the submission of sample parts, drawings and testing data to one of the FAA’s Aircraft Certification Offices where the submitted data are analyzed. We believe that an applicant’s ability to successfully complete the PMA process is limited by several factors, including (i) the agency’s confidence level in the applicant; (ii) the complexity of the part; (iii) the volume of PMAs being filed; and (iv) the resources available to the FAA. We also believe that companies such as HEICO that have demonstrated their advanced design engineering and manufacturing capabilities, including an established favorable track record with the FAA, generally receive a faster turnaround time in the processing of PMA applications. Finally, we believe that the PMA process creates a significant barrier to entry in this market niche through both its technical demands and its limits on the rate at which competitors can bring products to market.
As part of our growth strategy, we have continued to increase our research and development activities. Research and development expenditures by the Flight Support Group, which were approximately $.3 million in fiscal 1991, increased to approximately $17.9 million in fiscal 2017, $17.4 million in fiscal 2016 and $17.7 million in fiscal 2015. We believe that our Flight Support Group’s research and development capabilities are a significant component of our historical success and an integral part of our growth strategy. In recent years, the FAA granted us PMAs for approximately 300 to 500 new parts and approximately 300 to 400 new DER-approved repairs per year; however, no assurance can be given that the FAA will continue to grant PMAs or DER-approved repairs or that we will achieve acceptable levels of net sales and gross profits on such parts or repairs in the future.
We benefit from our proprietary rights relating to certain design, engineering and manufacturing processes and repair and overhaul procedures. Customers often rely on us to provide initial and additional components, as well as to redesign, re-engineer, replace or repair and provide overhaul services on such aircraft components at every stage of their useful lives. In addition, for some products, our unique manufacturing capabilities are required by the customer’s specifications or designs, thereby necessitating reliance on us for production of such designed products.
We have no material patents for the proprietary techniques, including software and manufacturing expertise, we have developed to manufacture jet engine and aircraft component replacement parts and instead, we primarily rely on trade secret protection. Although our proprietary techniques and software and manufacturing expertise are subject to misappropriation or obsolescence, we believe that we take appropriate measures to prevent misappropriation or obsolescence from occurring by developing new techniques and improving existing methods and processes, which we will continue on an ongoing basis as dictated by the technological needs of our business.
We believe that, based on our competitive pricing, reputation for high quality, short lead time requirements, strong relationships with domestic and foreign commercial air carriers and repair stations (companies that overhaul aircraft engines and/or components), and successful
5
track record of receiving PMAs and DER-approved repairs from the FAA, we are uniquely positioned to continue to increase the products and services offered and gain market share.
Electronic Technologies Group
Our Electronic Technologies Group’s strategy is to design and produce mission-critical subcomponents for smaller, niche markets, but which are utilized in larger systems – systems like power, targeting, tracking, identification, simulation, testing, communications, lighting, surgical, medical imaging, baggage scanning, telecom and computer systems. These systems are, in turn, often located on another platform, such as aircraft, rotorcraft, satellites, ships, spacecraft, land vehicles, handheld devices and other platforms.
Electro-Optical Infrared Simulation and Test Equipment. The Electronic Technologies Group believes it is a leading international designer and manufacturer of niche state-of-the-art simulation, testing and calibration equipment used in the development of missile seeking technology, airborne targeting and reconnaissance systems, shipboard targeting and reconnaissance systems, space-based sensors as well as ground vehicle-based systems. These products include infrared scene projector equipment, such as our MIRAGE IR Scene Simulator, high precision blackbody sources, software and integrated calibration systems.
Simulation equipment allows the U.S. government and allied foreign military to save money on missile testing as it allows infrared-based missiles to be tested on a multi-axis, rotating table instead of requiring the launch of a complete missile. In addition, several large military prime contractors have elected to purchase such equipment from us instead of maintaining internal staff to do so because we can offer a more cost-effective solution. Our customers include major U.S. Department of Defense weapons laboratories and defense prime contractors.
Electro-Optical Laser Products. The Electronic Technologies Group believes it is a leading designer and maker of Laser Rangefinder Receivers and other photodetectors used in airborne, vehicular and handheld targeting systems manufactured by major prime military contractors. Most of our Rangefinder Receiver product offering consists of complex and patented products which detect reflected light from laser targeting systems and allow the systems to confirm target accuracy and calculate target distances prior to discharging a weapon system. Some of these products are also used in laser eye surgery systems for tracking ocular movement.
Electro-Optical, Microwave and Other Power Equipment. The Electronic Technologies Group produces power supplies, amplifiers and flash lamp drivers used in laser systems for military, medical and other applications that are sometimes utilized with our rangefinder receivers. We also produce emergency back-up power supplies and batteries used on commercial aircraft and business jets for services such as emergency exit lighting, emergency fuel shut-off, power door assists, cockpit voice recorders and flight computers. We also design and manufacture next generation wireless cabin control systems, solid state power distribution and management systems and fuel level sensing systems for business jets and for general aviation, as well as for the military/defense market. We offer custom or standard designs that solve
6
challenging OEM requirements and meet stringent safety and emissions requirements. Our power electronics products include capacitor charger power supplies, laser diode drivers, arc lamp power supplies and custom power supply designs.
Our microwave products are used in both commercial and military satellites, spacecraft and in electronic warfare systems. These products, which include isolators, bias tees, circulators, latching ferrite switches and waveguide adapters are used in satellites and spacecraft to control or direct energy according to operator needs. As satellites are frequently used as sensors for stand-off warfare, we believe this product line further supports our goal of increasing our activity in the stand-off market. Additionally, our microwave products include converters, receivers, transmitters, amplifiers, frequency sources and related sub-systems that address the majority of major satellite frequencies. We believe we are a leading supplier of the niche products which we design and manufacture for this market, a market that includes commercial satellites. Our customers for these products include satellite and spacecraft manufacturers.
Electromagnetic and Radio Interference Shielding. The Electronic Technologies Group designs and manufactures shielding used to prevent electromagnetic energy and radio frequencies from interfering with other devices, such as computers, telecommunication devices, avionics, weapons systems and other electronic equipment. Our products include a patented line of shielding applied directly to circuit boards and a line of gasket-type shielding applied to computers and other electronic equipment. Our customers consist essentially of medical, electronics, telecommunications and defense equipment producers.
High-Speed Interface Products. The Electronic Technologies Group designs and manufactures advanced high-technology, high-speed interface products utilized in homeland security, defense, medical research, astronomical and other applications across numerous industries.
High Voltage Interconnection Devices. The Electronic Technologies Group designs and manufactures high and very high voltage interconnection devices, cable assemblies and wire for the medical equipment, defense and other industrial markets. Among others, our products are utilized in aircraft missile defense, fighter pilot helmet displays, avionic systems, medical applications, wireless communications, and industrial applications including high voltage test equipment and underwater monitoring systems.
High Voltage Advanced Power Electronics. The Electronic Technologies Group designs and manufactures a patented line of high voltage energy generators for medical, baggage inspection and industrial imaging systems. We also produce high voltage power supplies found in satellite communications, CT scanners and in medical and industrial x-ray systems.
Power Conversion Products. The Electronic Technologies Group designs and provides innovative power conversion products principally serving the high-reliability military, space and commercial avionics end-markets. These high density, low profile and lightweight DC-to-DC converters and electromagnetic interference filters, which include thick film hermetically sealed hybrids, military commercial-off-the-shelf and custom designed and assembled products, have
7
become the primary specified components of their kind on a generation of complex military, space and avionics equipment.
Underwater Locator Beacons. The Electronic Technologies Group designs and manufactures Underwater Locator Beacons (“ULBs”) used to locate aircraft Cockpit Voice Recorders and Flight Data Recorders, marine ship Voyage Recorders and various other devices which have been submerged under water. ULBs are required equipment on all U.S. FAA and European Aviation Safety Agency (“EASA”) approved Flight Data and Cockpit Voice Recorders used in aircraft and on similar systems utilized on large marine shipping vessels.
Traveling Wave Tube Amplifiers (“TWTAs”) and Microwave Power Modules (“MPMs”). The Electronic Technologies Group designs and manufactures TWTAs and MPMs predominately used in radar, electronic warfare, on-board jamming and countermeasure systems in aircraft, ships and detection platforms deployed by U.S. and allied non-U.S. military forces.
Three-Dimensional Microelectronic and Stacked Memory Products. The Electronic Technologies Group designs, manufactures and markets three-dimensional microelectronic and stacked memory products including memories, Point of Load (“POL”) voltage converters and peripherals, industrial memories, and complex System-in-Package (“SiP”) solutions. The products’ patented designs provide high reliability memory and circuitry in a unique and stacked form which saves space and weight. These products are principally integrated into larger subsystems equipping satellites and spacecraft and are also utilized in medical equipment.
Harsh Environment Connectivity Products and Custom Molded Cable Assemblies. The Electronic Technologies Group designs and manufactures high performance, high reliability and harsh environment electronic connectors and other interconnect products. These products include connectors, jacks and plugs, cables, patch panels and switches utilized in aviation, broadcast/audio, defense, industrial, medical and other equipment.
RF and Microwave Amplifiers, Transmitters and Receivers. The Electronic Technologies Group designs and manufactures RF and microwave amplifiers, transmitters and receivers to support military communications on unmanned aerial systems, other aircraft, helicopters and ground-based data/communications systems.
High Performance Communications and Electronic Intercept Receivers and Tuners. The Electronic Technologies Group designs and manufactures innovative, high performance receiver and radio frequency digitizer products for military and intelligence applications.
Crashworthy and Ballistically Self-Sealing Auxiliary Fuel Systems. The Electronic Technologies Group designs and manufactures mission-extending, crashworthy and ballistically self-sealing auxiliary fuel systems for military rotorcraft.
High Performance Active Antenna Systems. The Electronic Technologies Group designs and produces high performance active antenna systems for commercial aircraft, precision guided munitions, other defense applications and commercial uses.
8
As part of our growth strategy, we have continued to invest in our research and development activities. Research and development expenditures by the Electronic Technologies Group were $28.6 million in fiscal 2017, $27.3 million in fiscal 2016 and $21.0 million in fiscal 2015. We believe that our Electronic Technologies Group’s research and development capabilities are a significant component of our historical success and an integral part of our growth strategy.
Financial Information About Operating Segments and Geographic Areas
See Note 14, Operating Segments, of the Notes to Consolidated Financial Statements for financial information by operating segment and by geographic areas.
Distribution, Sales, Marketing and Customers
Each of our operating segments independently conducts distribution, sales and marketing efforts directed at their respective customers and industries and, in some cases, collaborates with other operating divisions and subsidiaries within its group for cross-marketing efforts. Sales and marketing efforts are conducted primarily by in-house personnel and, to a lesser extent, by independent manufacturers’ representatives. Generally, the in-house sales personnel receive a base salary plus commission and manufacturers’ representatives receive a commission on sales.
We believe that direct relationships are crucial to establishing and maintaining a strong customer base and, accordingly, our senior management is actively involved in our marketing activities, particularly with established customers. We are also a member of various trade and business organizations related to the commercial aviation industry, such as the Aerospace Industries Association, which we refer to as AIA, the leading trade association representing the nation’s manufacturers of commercial, military and business aircraft, aircraft engines and related components and equipment. Due in large part to our established industry presence, we enjoy strong customer relations, name recognition and repeat business.
We sell our products to a broad customer base consisting of domestic and foreign commercial and cargo airlines, repair and overhaul facilities, other aftermarket suppliers of aircraft engine and airframe materials, OEMs, domestic and foreign military units, electronic manufacturing services companies, manufacturers for the defense industry as well as medical, telecommunications, scientific, and industrial companies. No one customer accounted for sales of 10% or more of total consolidated sales from continuing operations during any of the last three fiscal years. Net sales to our five largest customers accounted for approximately 18%, 21% and 17% of total net sales in fiscal 2017, 2016 and 2015, respectively.
Competition
The aerospace product and service industry is characterized by intense competition. Some of our competitors have substantially greater name recognition, inventories, complementary product and service offerings, financial, marketing and other resources than we do. As a result, such competitors may be able to respond more quickly to customer requirements
9
than we can. Moreover, smaller competitors may be in a position to offer more attractive pricing as a result of lower labor costs and other factors.
Our jet engine and aircraft component replacement parts business competes primarily with aircraft engine and aircraft component manufacturers. The competition is principally based on price and service to the extent that our parts are interchangeable. With respect to other aerospace products and services sold by the Flight Support Group, we compete with both the leading jet engine and aircraft component OEMs and a large number of machining, fabrication, distribution and repair companies, some of which have greater financial and other resources than we do. Competition is based mainly on price, product performance, service and technical capability.
Competition for the repair and overhaul of jet engine and aircraft components comes from three principal sources: OEMs, major commercial airlines and other independent service companies. Some of these competitors have greater financial and other resources than we do. Some major commercial airlines own and operate their own service centers and sell repair and overhaul services to other aircraft operators. Foreign airlines that provide repair and overhaul services typically provide these services for their own aircraft components and for third parties. OEMs also maintain service centers that provide repair and overhaul services for the components they manufacture. Other independent service organizations also compete for the repair and overhaul business of other users of aircraft components. We believe that the principal competitive factors in the repair and overhaul market are quality, turnaround time, overall customer service and price.
Our Electronic Technologies Group competes with several large and small domestic and foreign competitors, some of which have greater financial and other resources than we do. The markets for our electronic products are niche markets with several competitors where competition is based mainly on design, technology, quality, price, service and customer satisfaction.
Raw Materials
We purchase a variety of raw materials, primarily consisting of high temperature alloy sheet metal and castings, forgings, pre-plated metals and electrical components from various vendors. The materials used by our operations are generally available from a number of sources and in sufficient quantities to meet current requirements subject to normal lead times. We are subject to rules promulgated by the Securities Exchange Commission pursuant to the Dodd-Frank Wall Street Reform and Consumer Protection Act regarding the use of certain materials (tantalum, tin, gold and tungsten), known as conflict minerals, which are mined from the Democratic Republic of the Congo and adjoining countries. These rules may impose additional costs and may introduce new risks related to our ability to verify the origin of any conflict minerals used in our products.
10
Backlog
Our total backlog of unshipped orders was $654 million as of October 31, 2017 as compared to $497 million as of October 31, 2016. The majority of our backlog of orders as of October 31, 2017 is expected to be delivered during fiscal 2018. The Flight Support Group’s backlog of unshipped orders was $236 million as of October 31, 2017 as compared to $212 million as of October 31, 2016. This backlog excludes forecasted shipments for certain contracts of the Flight Support Group pursuant to which customers provide only estimated annual usage and not firm purchase orders. Our backlogs within the Flight Support Group are typically short-lead in nature with many product orders being received within the month of shipment. The increase in the Flight Support Group's backlog is principally related to the backlog of the businesses acquired during fiscal 2017. Additionally, the Flight Support Group's increase reflects increased orders at one of our businesses that manufactures advanced niche components and complex composite assemblies for commercial aviation, defense and space applications. The Electronic Technologies Group’s backlog of unshipped orders was $418 million as of October 31, 2017 as compared to $285 million as of October 31, 2016. The increase in the Electronic Technologies Group's backlog is principally related to the backlog of a business acquired during fiscal 2017. Additionally, the Electronic Technologies Group's increase reflects increased orders at one of our businesses that designs and produces mission-extending, crashworthy and ballistically self-sealing auxiliary fuel systems for military rotorcraft and at a subsidiary that designs and provides power conversion products principally serving the defense, space and aviation industries. See Note 2, Acquisitions, of the Notes to Consolidated Financial Statements for additional information regarding our fiscal 2017 acquisitions.
Government Regulation
The FAA regulates the manufacture, repair and operation of all aircraft and aircraft parts operated in the United States. Its regulations are designed to ensure that all aircraft and aviation equipment are continuously maintained in proper condition to ensure safe operation of the aircraft. Similar rules apply in other countries. All aircraft must be maintained under a continuous condition monitoring program and must periodically undergo thorough inspection and maintenance. The inspection, maintenance and repair procedures for the various types of aircraft and equipment are prescribed by regulatory authorities and can be performed only by certified repair facilities utilizing certified technicians. Certification and conformance is required prior to installation of a part on an aircraft. Aircraft operators must maintain logs concerning the utilization and condition of aircraft engines, life-limited engine parts and airframes. In addition, the FAA requires that various maintenance routines be performed on aircraft engines, some engine parts, and airframes at regular intervals based on cycles or flight time. Engine maintenance must also be performed upon the occurrence of certain events, such as foreign object damage in an aircraft engine or the replacement of life-limited engine parts. Such maintenance usually requires that an aircraft engine be taken out of service. Our operations may in the future be subject to new and more stringent regulatory requirements. In that regard, we closely monitor the FAA and industry trade groups in an attempt to understand how possible future regulations might impact us. Our businesses which sell defense products directly to the U.S. Government or for use in systems delivered to the U.S. Government can be subject to
11
various laws and regulations governing pricing and other factors.
There has been no material adverse effect to our consolidated financial statements as a result of these government regulations.
Environmental Regulation
Our operations are subject to extensive, and frequently changing, federal, state and local environmental laws and substantial related regulation by government agencies, including the Environmental Protection Agency. Among other matters, these regulatory authorities impose requirements that regulate the operation, handling, transportation and disposal of hazardous materials; protect the health and safety of workers; and require us to obtain and maintain licenses and permits in connection with our operations. This extensive regulatory framework imposes significant compliance burdens and risks on us. Notwithstanding these burdens, we believe that we are in material compliance with all federal, state and local environmental laws and regulations governing our operations.
There has been no material adverse effect to our consolidated financial statements as a result of these environmental regulations.
Other Regulation
We are also subject to a variety of other regulations including work-related and community safety laws. The Occupational Safety and Health Act of 1970 mandates general requirements for safe workplaces for all employees and established the Occupational Safety and Health Administration (“OSHA”) in the Department of Labor. In particular, OSHA provides special procedures and measures for the handling of certain hazardous and toxic substances. In addition, specific safety standards have been promulgated for workplaces engaged in the treatment, disposal or storage of hazardous waste. Requirements under state law, in some circumstances, may mandate additional measures for facilities handling materials specified as extremely dangerous. We believe that our operations are in material compliance with OSHA’s health and safety requirements.
Insurance
We are a named insured under policies which include the following coverage: (i) product liability, including grounding; (ii) personal property, inventory and business interruption at our facilities; (iii) general liability coverage; (iv) employee benefit liability; (v) international liability and automobile liability; (vi) umbrella liability coverage; and (vii) various other activities or items, each subject to certain limits and deductibles. We believe that our insurance coverage is adequate to insure against the various liability risks of our business.
12
Employees
As of October 31, 2017, we had approximately 5,100 full-time and part-time employees including approximately 3,100 in the Flight Support Group and approximately 2,000 in the Electronic Technologies Group. None of our employees are represented by a U.S. domestic union. Our management believes that we have good relations with our employees.
Available Information
Our Internet website address is http://www.heico.com. We make available free of charge, through the Investors section of our website, our annual reports on Form 10-K, quarterly reports on Form 10-Q, current reports on Form 8-K, specialized disclosure reports on Form SD and amendments to those reports filed or furnished pursuant to Section 13(a) or 15(d) of the Securities Exchange Act of 1934 as soon as reasonably practicable after we electronically file such material with, or furnish it to, the Securities and Exchange Commission (“SEC”). These materials are also available free of charge on the SEC’s website at http://www.sec.gov. The information on or obtainable through our website is not incorporated into this annual report on Form 10-K.
We have adopted a code of ethics that applies to our principal executive officer, principal financial officer, principal accounting officer or controller and other persons performing similar functions. Our Code of Ethics for Senior Financial Officers and Other Officers is part of our Code of Business Conduct, which is located on our website at http://www.heico.com. Any amendments to or waivers from a provision of this code of ethics will be posted on the website. Also located on the website are our Corporate Governance Guidelines, Finance/Audit Committee Charter, Nominating & Corporate Governance Committee Charter, and Compensation Committee Charter.
Copies of the above referenced materials will be made available, free of charge, upon written request to the Corporate Secretary at the Company’s headquarters.
13
Executive Officers of the Registrant
Our executive officers are appointed by the Board of Directors and serve at the discretion of the Board. The following table sets forth the names, ages of, and positions and offices held by our executive officers as of December 19, 2017:
Name | Age | Position(s) | Director Since | |||
Laurans A. Mendelson | 79 | Chairman of the Board; Chief Executive Officer; and Director | 1989 | |||
Eric A. Mendelson | 52 | Co-President and Director; President and Chief Executive Officer of the HEICO Flight Support Group | 1992 | |||
Victor H. Mendelson | 50 | Co-President and Director; President and Chief Executive Officer of the HEICO Electronic Technologies Group | 1996 | |||
Thomas S. Irwin | 71 | Senior Executive Vice President | — | |||
Carlos L. Macau, Jr. | 50 | Executive Vice President - Chief Financial Officer and Treasurer | — | |||
Steven M. Walker | 53 | Chief Accounting Officer and Assistant Treasurer | — | |||
Laurans A. Mendelson has served as our Chairman of the Board since December 1990. He has also served as our Chief Executive Officer since February 1990 and served as our President from September 1991 through September 2009. Mr. Mendelson is a member of the Board of Governors of the Aerospace Industries Association (“AIA”) in Washington, D.C., of which HEICO is a member. He is the former Chairman of the Board of Trustees, former Chairman of the Executive Committee and a current member of the Society of Mount Sinai Founders of Mount Sinai Medical Center in Miami Beach, Florida. In addition, Mr. Mendelson is a Trustee Emeritus of Columbia University in The City of New York, where he previously served as Trustee and Chairman of the Trustees’ Audit Committee. Laurans Mendelson is the father of Eric Mendelson and Victor Mendelson.
Eric A. Mendelson has served as our Co-President since October 2009 and served as our Executive Vice President from 2001 through September 2009. Mr. Mendelson has also served as President and Chief Executive Officer of the HEICO Flight Support Group since its formation in 1993, as well as President of various Flight Support Group subsidiaries. Mr. Mendelson is a co-founder, and, since 1987, has been Managing Director of Mendelson International Corporation, a private investment company, which is a shareholder of HEICO. In addition, Mr. Mendelson is a member of the Advisory Board of Trustees of Mount Sinai Medical Center in Miami Beach, Florida and Immediate Past Chairman of the Board of Trustees of Ransom Everglades School in Coconut Grove, Florida, as well as a member of the Board of Visitors of Columbia College in New York City. Eric Mendelson is the son of Laurans Mendelson and the brother of Victor Mendelson.
Victor H. Mendelson has served as our Co-President since October 2009 and served as our Executive Vice President from 2001 through September 2009. Mr. Mendelson has also served as President and Chief Executive Officer of the HEICO Electronic Technologies Group since its formation in September 1996. He served as our General Counsel from 1993 to 2008
14
and our Vice President from 1996 to 2001. In addition, Mr. Mendelson was the Chief Operating Officer of our former MediTek Health Corporation subsidiary from 1995 until its profitable sale in 1996. Mr. Mendelson is a co-founder, and, since 1987, has been President of Mendelson International Corporation, a private investment company, which is a shareholder of HEICO. Mr. Mendelson is a former Director and Audit Committee member of NASDAQ-listed Terrapin 3 Acquisition Corp. Mr. Mendelson is Chairman of the Board of Visitors of Columbia College in New York City, a Trustee of St. Thomas University in Miami Gardens, Florida, a Director of Boys & Girls Clubs of Miami-Dade and is a Director and Past President of the Board of Directors of the Florida Grand Opera. Victor Mendelson is the son of Laurans Mendelson and the brother of Eric Mendelson.
Thomas S. Irwin has served as our Senior Executive Vice President since June 2012; our Executive Vice President, Chief Financial Officer and Treasurer from September 1991 through May 2012; Senior Vice President and Treasurer from 1986 to 1991; and our Vice President and Treasurer from 1982 to 1986. Mr. Irwin is a Certified Public Accountant. He is a Trustee of the Greater Hollywood Chamber of Commerce and a member of Financial Executives International.
Carlos L. Macau, Jr. has served as our Executive Vice President - Chief Financial Officer and Treasurer since June 2012. Mr. Macau joined HEICO from the international public accounting firm of Deloitte & Touche LLP where he worked from 2000 to 2012 as an Audit Partner. Prior to joining HEICO, Mr. Macau accumulated 22 years of financial and accounting experience serving a number of public and private manufacturing and service clients in a broad range of industries. His client responsibilities included serving as HEICO's lead client services partner for five years (2006 to 2010). Mr. Macau is a current member of the Mount Sinai Founders of Mount Sinai Medical Center in Miami Beach, Florida. Mr. Macau is a Certified Public Accountant, a Chartered Global Management Accountant, and a member of the American and Florida Institutes of Certified Public Accountants.
Steven M. Walker has served as our Chief Accounting Officer since June 2012 and served as our Corporate Controller from 2002 through May 2012. He has also served as our Assistant Treasurer since 2002. Mr. Walker is a Certified Public Accountant and a member of the American Institute of Certified Public Accountants.
15
Item 1A. RISK FACTORS
Our business, financial condition, operating results and cash flows may be impacted by a number of factors, many of which are beyond our control, including those set forth below and elsewhere in this Annual Report on Form 10-K, any one of which may cause our actual results to differ materially from anticipated results:
Our success is highly dependent on the performance of the aviation industry, which could be impacted by lower demand for commercial air travel or airline fleet changes causing lower demand for our goods and services.
General global industry and economic conditions that affect the aviation industry also affect our business. We are subject to macroeconomic cycles and when recessions occur, we may experience reduced orders, payment delays, supply chain disruptions or other factors as a result of the economic challenges faced by our customers, prospective customers and suppliers. Further, the aviation industry has historically been subject to downward cycles from time to time which reduce the overall demand for jet engine and aircraft component replacement parts and repair and overhaul services, and such downward cycles result in lower sales and greater credit risk. Demand for commercial air travel can be influenced by airline industry profitability, world trade policies, government-to-government relations, terrorism, disease outbreaks, environmental constraints imposed upon aircraft operations, technological changes, price and other competitive factors. These global industry and economic conditions may have a material adverse effect on our business, financial condition and results of operations.
We are subject to governmental regulation and our failure to comply with these regulations could cause the government to withdraw or revoke our authorizations and approvals to do business and could subject us to penalties and sanctions that could harm our business.
Governmental agencies throughout the world, including the FAA, highly regulate the manufacture, repair and overhaul of aircraft parts and accessories. We include, with the replacement parts that we sell to our customers, documentation certifying that each part complies with applicable regulatory requirements and meets applicable standards of airworthiness established by the FAA or the equivalent regulatory agencies in other countries. In addition, our repair and overhaul operations are subject to certification pursuant to regulations established by the FAA. Specific regulations vary from country to country, although compliance with FAA requirements generally satisfies regulatory requirements in other countries. The revocation or suspension of any of our material authorizations or approvals would have an adverse effect on our business, financial condition and results of operations. New and more stringent government regulations, if adopted and enacted, could have an adverse effect on our business, financial condition and results of operations. In addition, certain product sales to foreign countries of our Electronic Technologies Group and Flight Support Group require approval or licensing from the United States ("U.S.") government. Denial of export licenses could reduce our sales to those countries and could have a material adverse effect on our business.
16
Pursuant to the Dodd-Frank Wall Street Reform and Consumer Protection Act, the Securities and Exchange Commission promulgated disclosure requirements regarding the use of certain minerals (tantalum, tin, gold and tungsten), known as conflict minerals, which are mined from the Democratic Republic of the Congo or one of its adjoining countries. There are costs associated with complying with the disclosure requirements, such as costs related to determining the source of certain minerals used in our products, as well as costs of possible changes to products, processes, or sources of supply as a consequence of such verification activities. Given the complexity of our supply chain, we may not be able to ascertain the origin of these minerals used in our products in a timely manner, which could cause some of our customers to disqualify us as a supplier to the extent we are unable to certify our products are conflict mineral free. Additionally, the rule could affect sourcing at competitive prices and availability in sufficient quantities of such minerals used in our manufacturing processes for certain products.
The retirement of commercial aircraft could reduce our revenues.
Our Flight Support Group designs and manufactures jet engine and aircraft component replacement parts and also repairs, overhauls and distributes jet engine and aircraft components. If aircraft or engines for which we offer replacement parts or supply repair and overhaul services are retired and there are fewer aircraft that require these parts or services, our revenues may decline.
Reductions in defense, space or homeland security spending by U.S. and/or foreign customers could reduce our revenues.
In fiscal 2017, approximately 64% of the net sales of our Electronic Technologies Group were derived from the sale of defense, commercial and defense satellite and spacecraft components, and homeland security products. A decline in defense, space or homeland security budgets or additional restrictions imposed by the U.S. government on sales of products or services to foreign military agencies could lower sales of our products and services.
We are subject to the risks associated with sales to foreign customers, which could harm our business.
We market our products and services to approximately 110 countries, with approximately 34% of our consolidated net sales in fiscal 2017 derived from sales to foreign customers. We expect that sales to foreign customers will continue to account for a significant portion of our revenues in the foreseeable future. As a result, we are subject to risks of doing business internationally, including the following:
• | Fluctuations in currency exchange rates; |
• | Volatility in foreign political, regulatory, and economic environments; |
• | Ability to obtain required export licenses or approvals; |
• | Uncertainty of the ability of foreign customers to finance purchases; |
• | Uncertainties and restrictions concerning the availability of funding credit or guarantees; |
• | Imposition of taxes, export controls, tariffs, embargoes and other trade restrictions; and |
17
• | Compliance with a variety of international laws, as well as U.S. laws affecting the activities of U.S. companies abroad such as the U.S. Foreign Corrupt Practices Act. |
While the impact of these factors is difficult to predict, any one or more of these factors may have a material adverse effect on our business, financial condition and results of operations.
Intense competition from existing and new competitors may harm our business.
We face significant competition in each of our businesses.
Flight Support Group
• | For jet engine and aircraft component replacement parts, we compete with the industry’s leading jet engine and aircraft component OEMs. |
• | For the distribution, overhaul and repair of jet engine and aircraft components as well as avionics and navigation systems, we compete with: |
- | major commercial airlines, many of which operate their own maintenance and overhaul units; |
- | OEMs, which manufacture, distribute, repair and overhaul their own and other OEM parts; and |
- | other independent service companies. |
Electronic Technologies Group
• | For the design and manufacture of various types of electronic and electro-optical equipment as well as high voltage interconnection devices and high speed interface products, we compete in a fragmented marketplace with a number of companies, some of which are well capitalized. |
The aviation aftermarket supply industry is highly fragmented, has several highly visible leading companies, and is characterized by intense competition. Some of our OEM competitors have greater name recognition than HEICO, as well as complementary lines of business and financial, marketing and other resources that HEICO does not have. In addition, OEMs, aircraft maintenance providers, leasing companies and FAA-certificated repair facilities may attempt to bundle their services and product offerings in the supply industry, thereby significantly increasing industry competition. Moreover, our smaller competitors may be able to offer more attractive pricing of parts as a result of lower labor costs or other factors. A variety of potential actions by any of our competitors, including a reduction of product prices or the establishment by competitors of long-term relationships with new or existing customers, could have a material adverse effect on our business, financial condition and results of operations. Competition typically intensifies during cyclical downturns in the aviation industry, when supply may exceed demand. We may not be able to continue to compete effectively against present or future competitors, and competitive pressures may have a material adverse effect on our business, financial condition and results of operations.
18
Our success is dependent on the development and manufacture of new products, equipment and services. Our inability to develop, manufacture and introduce new products and services at profitable pricing levels could reduce our sales or sales growth.
The aviation, defense, space, medical, telecommunications and electronics industries are constantly undergoing development and change and, accordingly, new products, equipment and methods of repair and overhaul service are likely to be introduced in the future. In addition to manufacturing electronic and electro-optical equipment and selected aerospace and defense components for OEMs and the U.S. government and repairing jet engine and aircraft components, we re-design sophisticated aircraft replacement parts originally developed by OEMs so that we can offer the replacement parts for sale at substantially lower prices than those manufactured by the OEMs. Consequently, we devote substantial resources to research and product development. Technological development poses a number of challenges and risks, including the following:
• | We may not be able to successfully protect the proprietary interests we have in various aircraft parts, electronic and electro-optical equipment and our repair processes; |
• | As OEMs continue to develop and improve jet engines and aircraft components, we may not be able to re-design and manufacture replacement parts that perform as well as those offered by OEMs or we may not be able to profitably sell our replacement parts at lower prices than the OEMs; |
• | We may need to expend significant capital to: |
- | purchase new equipment and machines, |
- | train employees in new methods of production and service, and |
- | fund the research and development of new products; and |
• | Development by our competitors of patents or methodologies that preclude us from the design and manufacture of aircraft replacement parts or electrical and electro-optical equipment could adversely affect our business, financial condition and results of operations. |
In addition, we may not be able to successfully develop new products, equipment or methods of repair and overhaul service, and the failure to do so could have a material adverse effect on our business, financial condition and results of operations.
We may not be able to effectively execute our acquisition strategy, which could slow our growth.
A key element of our strategy is growth through the acquisition of additional companies. Our acquisition strategy is affected by and poses a number of challenges and risks, including the following:
• | Availability of suitable acquisition candidates; |
19
• | Availability of capital; |
• | Diversion of management’s attention; |
• | Effective integration of the operations and personnel of acquired companies; |
• | Potential write downs of acquired intangible assets; |
• | Potential loss of key employees of acquired companies; |
• | Use of a significant portion of our available cash; |
• | Significant dilution to our shareholders for acquisitions made utilizing our securities; and |
• | Consummation of acquisitions on satisfactory terms. |
We may not be able to successfully execute our acquisition strategy, and the failure to do so could have a material adverse effect on our business, financial condition and results of operations.
Goodwill and other intangible assets represent a significant portion of our total assets, and we may never realize the full value of our intangible assets.
As a result of our acquisitions, goodwill and intangible assets represent a significant portion of our total assets. As of October 31, 2017 and 2016, goodwill and intangible assets, net of amortization, accounted for approximately 64% and 62% of our total assets, respectively. We test our goodwill and intangible assets for impairment on an annual basis, or more frequently if events or changes in circumstances indicate that the carrying amount of such assets may not be fully recoverable. We may not realize the full value of our goodwill and intangible assets, and to the extent that impairment has occurred, we would be required to recognize the impaired portion of such assets in our earnings. An impairment of a significant portion of such assets could have a material adverse effect on our business, financial condition and results of operations.
The inability to obtain certain components and raw materials from suppliers could harm our business.
Our business is affected by the availability and price of the raw materials and component parts that we use to manufacture our products. Our ability to manage inventory and meet delivery requirements may be constrained by our suppliers’ ability to adjust delivery of long-lead time products during times of volatile demand. The supply chains for our business could also be disrupted by external events such as natural disasters, extreme weather events, labor disputes, governmental actions and legislative or regulatory changes. As a result, our suppliers may fail to perform according to specifications when required and we may be unable to identify alternate suppliers or to otherwise mitigate the consequences of their non-performance. Transitions to new suppliers may result in significant costs and delays, including those related to the required recertification of parts obtained from new suppliers with our customers and/or regulatory agencies. Our inability to fill our supply needs could jeopardize our ability to fulfill obligations under customer contracts, which could result in reduced revenues and profits, contract penalties or terminations, and damage to customer relationships. Further, increased costs of such raw materials or components could reduce our profits if we were unable to pass along such price increases to our customers.
20
Product specification costs and requirements could cause an increase to our costs to complete contracts.
The costs to meet customer specifications and requirements could result in us having to spend more to design or manufacture products and this could reduce our profit margins on current contracts or those we obtain in the future.
We may incur product liability claims that are not fully insured and such insurance may not be available at commercially reasonable rates.
Our jet engine and aircraft component replacement parts and repair and overhaul services expose our business to potential liabilities for personal injury or death as a result of the failure of an aircraft component that we have designed, manufactured or serviced. While we maintain liability insurance to protect us from future product liability claims, an uninsured or partially insured claim, or a claim for which third-party indemnification is not available, could have a material adverse effect on our business, financial condition and results of operations. Additionally, our customers typically require us to maintain substantial insurance coverage at commercially reasonable rates and our inability to obtain insurance coverage at commercially reasonable rates could have a material adverse effect on our business.
We may incur environmental liabilities and these liabilities may not be covered by insurance.
Our operations and facilities are subject to a number of federal, state and local environmental laws and regulations, which govern, among other things, the discharge of hazardous materials into the air and water as well as the handling, storage and disposal of hazardous materials. Pursuant to various environmental laws, a current or previous owner or operator of real property may be liable for the costs of removal or remediation of hazardous materials. Environmental laws typically impose liability whether or not the owner or operator knew of, or was responsible for, the presence of hazardous materials. Although management believes that our operations and facilities are in material compliance with environmental laws and regulations, future changes in them or interpretations thereof or the nature of our operations may require us to make significant additional capital expenditures to ensure compliance in the future.
We carry limited specific environmental insurance, thus, losses could occur for uninsurable or uninsured risks or in amounts in excess of existing insurance coverage. The occurrence of an event that is not covered in full or in part by insurance could have a material adverse effect on our business, financial condition and results of operations.
We may incur damages or disruption to our business caused by natural disasters and other factors that may not be covered by insurance.
Several of our facilities, as a result of their locations, could be subject to a catastrophic loss caused by hurricanes, tornadoes, earthquakes, floods, fire, power loss, telecommunication and information systems failure, political unrest or similar events. Our corporate headquarters
21
and facilities located in Florida are particularly susceptible to hurricanes, storms, tornadoes or other natural disasters that could disrupt our operations, delay production and shipments, and result in large expenses to repair or replace the facility or facilities. Should insurance or other risk transfer mechanisms, such as our existing disaster recovery and business continuity plans, be insufficient to recover all costs, we could experience a material adverse effect on our business, financial condition and results of operations.
We rely on information technology systems, some of which are managed by third parties, to process, transmit and store electronic information, and to manage or support a variety of critical business processes and activities. We also collect and store sensitive data, including confidential business information and personal data. These systems may be susceptible to damage, disruptions or shutdowns due to attacks by computer hackers, computer viruses, employee error or malfeasance, power outages, hardware failures, telecommunication or utility failures, catastrophes or other unforeseen events. In addition, security breaches of our systems could result in the misappropriation or unauthorized disclosure of confidential information or personal data belonging to us or to our employees, partners, customers or suppliers. Any such events could disrupt our operations, delay production and shipments, result in defective products or services, damage customer relationships and our reputation and result in legal claims or proceedings that could have a material adverse effect on our business, financial condition and results of operations.
Tax changes could affect our effective tax rate and future profitability.
We file income tax returns in the U.S. federal jurisdiction, multiple state jurisdictions and certain jurisdictions outside the U.S. In fiscal 2017, our effective tax rate was 30.3%. Our future effective tax rate may be adversely affected by a number of factors, including the following:
• | Changes in available tax credits or tax deductions; |
• | Changes in tax laws or the interpretation of such tax laws and changes in generally accepted accounting principles; |
• | The amount of net income attributable to noncontrolling interests in our subsidiaries structured as partnerships; |
• | Changes in the mix of earnings in jurisdictions with differing statutory tax rates; |
• | Adjustments to estimated taxes upon finalization of various tax returns; |
• | Resolution of issues arising from tax audits with various tax authorities; |
• | Changes in statutory tax rates in any of the various jurisdictions where we file tax returns; and |
• | The reversal of any previously experienced tax-exempt unrealized gains in the cash surrender values of life insurance policies related to the HEICO Corporation Leadership Compensation Plan, a nonqualified deferred compensation plan. |
Any significant increase in our future effective tax rates could have a material adverse effect on net income for future periods.
22
Congress has recently proposed comprehensive tax reform legislation which could materially affect the tax aspects of our business and the industries in which we compete.
Recently, U.S. Congress has proposed comprehensive tax reform legislation that could materially affect the tax aspects of our business and the industries in which we compete. Such tax reform may be substantially revised through the legislative process, or may never be enacted. To the extent that tax reforms, if any, have a negative effect on us or the industries we serve, these changes may have a material adverse effect on our business, financial condition and results of operations.
We may not have the administrative, operational or financial resources to continue to grow the company.
We have experienced rapid growth in recent periods and intend to continue to pursue an aggressive growth strategy, both through acquisitions and internal expansion of products and services. Our growth to date has placed, and could continue to place, significant demands on our administrative, operational and financial resources. We may not be able to grow effectively or manage our growth successfully, and the failure to do so could have a material adverse effect on our business, financial condition and results of operations.
We are dependent on key personnel and the loss of these key personnel could have a material adverse effect on our success.
Our success substantially depends on the performance, contributions and expertise of our senior management team led by Laurans A. Mendelson, our Chairman and Chief Executive Officer, and Eric A. Mendelson and Victor H. Mendelson, our Co-Presidents. Technical employees are also critical to our research and product development, as well as our ability to continue to re-design sophisticated products of OEMs in order to sell competing replacement parts at substantially lower prices than those manufactured by the OEMs. The loss of the services of any of our executive officers or other key employees or our inability to continue to attract or retain the necessary personnel could have a material adverse effect on our business, financial condition and results of operations.
Our executive officers and directors have significant influence over our management and direction.
As of December 19, 2017, collectively our executive officers and entities controlled by them, the HEICO Savings and Investment Plan (our 401(k) Plan) and members of the Board of Directors beneficially owned approximately 22% of our outstanding Common Stock and approximately 6% of our outstanding Class A Common Stock. Accordingly, they will be able to substantially influence the election of the Board of Directors and control our business, policies and affairs, including our position with respect to proposed business combinations and attempted takeovers.
23
Item 1B. UNRESOLVED STAFF COMMENTS
None.
Item 2. PROPERTIES
We own or lease a number of facilities, which are utilized by our Flight Support Group (“FSG”), Electronic Technologies Group (“ETG”) and corporate offices. As of October 31, 2017, all of the facilities listed below were in good operating condition, well maintained and in regular use. We believe that our existing facilities are sufficient to meet our operational needs for the foreseeable future. Summary information on the facilities utilized within the FSG, ETG and our corporate offices to support their principal operating activities is as follows:
Flight Support Group
Square Footage | ||||||||
Location | Leased | Owned | Description | |||||
United States facilities (13 states) | 718,000 | 242,000 | Manufacturing, engineering and distribution facilities, and corporate headquarters | |||||
United States facilities (6 states) | 209,000 | 127,000 | Repair and overhaul facilities | |||||
International facilities (10 countries) - China, France, Germany, India, Laos, Netherlands, Singapore, Thailand, United Arab Emirates and United Kingdom | 149,000 | 166,000 | Manufacturing, engineering and distribution facilities | |||||
Electronic Technologies Group
Square Footage | ||||||||
Location | Leased | Owned | Description | |||||
United States facilities (12 states) | 581,000 | 309,000 | Manufacturing and engineering facilities | |||||
International facilities (4 countries) - Canada, France, South Korea and United Kingdom | 64,000 | 35,000 | Manufacturing and engineering facilities | |||||
Corporate
Square Footage | ||||||||
Location | Leased | Owned (1) | Description | |||||
United States facilities (1 state) | — | 7,000 | Administrative offices | |||||
(1) | Represents the square footage of our corporate offices in Miami, Florida. The square footage of our corporate headquarters in Hollywood, Florida is included within the square footage under the caption “United States facilities (13 states)” under Flight Support Group. |
24
Item 3. LEGAL PROCEEDINGS
We are involved in various legal actions arising in the normal course of business. Based upon the Company’s and our legal counsel’s evaluations of any claims or assessments, management is of the opinion that the outcome of these matters will not have a material effect on our results of operations, financial position or cash flows.
Item 4. MINE SAFETY DISCLOSURES
Not applicable.
25
PART II
Item 5. | MARKET FOR REGISTRANT’S COMMON EQUITY, RELATED STOCKHOLDER MATTERS AND ISSUER PURCHASES OF EQUITY SECURITIES |
Market Information
Our Class A Common Stock and Common Stock are listed and traded on the New York Stock Exchange (“NYSE”) under the symbols “HEI.A” and “HEI,” respectively. The following tables set forth, for the periods indicated, the high and low share prices for our Class A Common Stock and our Common Stock as reported on the NYSE, as well as the amount of cash dividends paid per share during such periods.
In March 2017, the Company's Board of Directors declared a 5-for-4 stock split on both classes of the Company's common stock. The stock split was effected as of April 19, 2017 in the form of a 25% stock dividend distributed to shareholders of record as of April 7, 2017. All applicable share and per share information has been adjusted retrospectively to give effect to the fiscal 2017 5-for-4 stock split.
Class A Common Stock | Common Stock | Cash Dividends | ||||||||||||||||||
High | Low | High | Low | Per Share | ||||||||||||||||
Fiscal 2016: | ||||||||||||||||||||
First Quarter | $40.06 | $34.25 | $45.42 | $38.29 | $.064 | |||||||||||||||
Second Quarter | 41.18 | 32.08 | 50.15 | 41.41 | — | |||||||||||||||
Third Quarter | 46.26 | 39.94 | 55.98 | 48.27 | .064 | |||||||||||||||
Fourth Quarter | 48.82 | 45.07 | 60.01 | 52.56 | — | |||||||||||||||
Fiscal 2017: | ||||||||||||||||||||
First Quarter | $56.20 | $47.36 | $65.90 | $53.08 | $.072 | |||||||||||||||
Second Quarter | 61.35 | 51.92 | 71.62 | 60.00 | — | |||||||||||||||
Third Quarter | 71.85 | 58.75 | 81.69 | 70.59 | .080 | |||||||||||||||
Fourth Quarter | 78.70 | 69.75 | 93.00 | 80.29 | — | |||||||||||||||
As of December 19, 2017, there were 340 holders of record of our Class A Common Stock and 330 holders of record of our Common Stock.
26
Performance Graphs
The following graph and table compare the total return on $100 invested in HEICO Common Stock and HEICO Class A Common Stock with the total return on $100 invested in the NYSE Composite Index and the Dow Jones U.S. Aerospace Index for the five-year period from October 31, 2012 through October 31, 2017. The NYSE Composite Index measures the performance of all common stocks listed on the NYSE. The Dow Jones U.S. Aerospace Index is comprised of large companies which make aircraft, major weapons, radar and other defense equipment and systems as well as providers of satellites and spacecraft used for defense purposes. The total returns include the reinvestment of cash dividends.
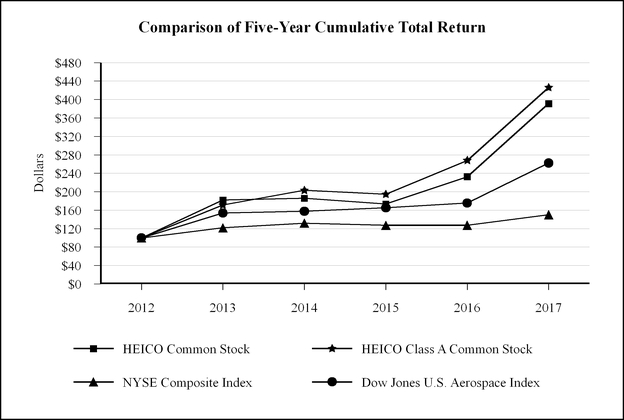
Cumulative Total Return as of October 31, | ||||||||||||||||||||||||
2012 | 2013 | 2014 | 2015 | 2016 | 2017 | |||||||||||||||||||
HEICO Common Stock | $100.00 | $182.13 | $185.88 | $173.27 | $232.72 | $391.31 | ||||||||||||||||||
HEICO Class A Common Stock | 100.00 | 171.07 | 203.08 | 194.47 | 268.01 | 426.00 | ||||||||||||||||||
NYSE Composite Index | 100.00 | 121.75 | 131.91 | 127.24 | 127.50 | 150.11 | ||||||||||||||||||
Dow Jones U.S. Aerospace Index | 100.00 | 153.74 | 157.68 | 165.11 | 175.50 | 262.34 | ||||||||||||||||||
The following graph and table compare the total return on $100 invested in HEICO Common Stock since October 31, 1990 using the same indices shown on the five-year performance graph above. October 31, 1990 was the end of the first fiscal year following the
27
date the current executive management team assumed leadership of the Company. No Class A Common Stock was outstanding as of October 31, 1990. As with the five-year performance graph, the total returns include the reinvestment of cash dividends.
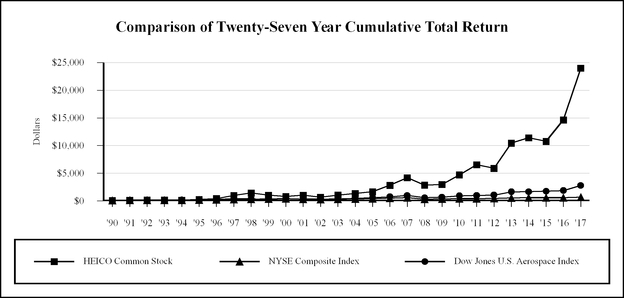
Cumulative Total Return as of October 31, | ||||||||||||||||||||||||
1990 | 1991 | 1992 | 1993 | 1994 | 1995 | |||||||||||||||||||
HEICO Common Stock | $100.00 | $141.49 | $158.35 | $173.88 | $123.41 | $263.25 | ||||||||||||||||||
NYSE Composite Index | 100.00 | 130.31 | 138.76 | 156.09 | 155.68 | 186.32 | ||||||||||||||||||
Dow Jones U.S. Aerospace Index | 100.00 | 130.67 | 122.00 | 158.36 | 176.11 | 252.00 | ||||||||||||||||||
1996 | 1997 | 1998 | 1999 | 2000 | 2001 | |||||||||||||||||||
HEICO Common Stock | $430.02 | $1,008.31 | $1,448.99 | $1,051.61 | $809.50 | $1,045.86 | ||||||||||||||||||
NYSE Composite Index | 225.37 | 289.55 | 326.98 | 376.40 | 400.81 | 328.78 | ||||||||||||||||||
Dow Jones U.S. Aerospace Index | 341.65 | 376.36 | 378.66 | 295.99 | 418.32 | 333.32 | ||||||||||||||||||
2002 | 2003 | 2004 | 2005 | 2006 | 2007 | |||||||||||||||||||
HEICO Common Stock | $670.39 | $1,067.42 | $1,366.57 | $1,674.40 | $2,846.48 | $4,208.54 | ||||||||||||||||||
NYSE Composite Index | 284.59 | 339.15 | 380.91 | 423.05 | 499.42 | 586.87 | ||||||||||||||||||
Dow Jones U.S. Aerospace Index | 343.88 | 393.19 | 478.49 | 579.77 | 757.97 | 1,000.84 | ||||||||||||||||||
2008 | 2009 | 2010 | 2011 | 2012 | 2013 | |||||||||||||||||||
HEICO Common Stock | $2,872.01 | $2,984.13 | $4,722.20 | $6,557.88 | $5,900.20 | $10,457.14 | ||||||||||||||||||
NYSE Composite Index | 344.96 | 383.57 | 427.61 | 430.46 | 467.91 | 569.69 | ||||||||||||||||||
Dow Jones U.S. Aerospace Index | 602.66 | 678.00 | 926.75 | 995.11 | 1,070.15 | 1,645.24 | ||||||||||||||||||
2014 | 2015 | 2016 | 2017 | |||||||||||||
HEICO Common Stock | $11,416.51 | $10,776.88 | $14,652.37 | $23,994.03 | ||||||||||||
NYSE Composite Index | 617.23 | 595.37 | 596.57 | 702.38 | ||||||||||||
Dow Jones U.S. Aerospace Index | 1,687.41 | 1,766.94 | 1,878.10 | 2,807.42 | ||||||||||||
28
Dividend Policy
We have historically paid semi-annual cash dividends on both our Class A Common Stock and Common Stock. In July 2017, we paid our 78th consecutive semi-annual cash dividend since 1979 of $.08 per share, which represented an 11% increase over the prior semi-annual cash dividend of $.072 per share paid in January 2017. Additionally, our 77th consecutive semi-annual cash dividend paid in January 2017 represented a 13% increase over the $.064 per share semi-annual cash dividend paid in July 2016. Our Board of Directors will continue to review our dividend policy and will regularly evaluate whether dividends should be paid in cash or stock, as well as what amounts should be paid. Our ability to pay dividends could be affected by future business performance, liquidity, capital needs, alternative investment opportunities and loan covenants under our revolving credit facility.
In December 2017, our Board of Directors declared a regular semi-annual cash dividend of $.0875 per share payable in January 2018. This cash dividend represents a 9% increase over the prior semi-annual per share amount of $.08. Further, in December 2017, our Board of Directors declared a 5-for-4 stock split on both classes of our common stock. We expect to distribute the additional shares to shareholders in January 2018. None of the applicable share and per share information in this annual report on Form 10-K has been adjusted retrospectively to give effect to the pending 5-for-4 stock split. See Note 17, Subsequent Events, of the Notes to Consolidated Financial Statements for further information regarding our pending fiscal 2018 stock split.
Issuer Purchases of Equity Securities
There were no purchases of our equity securities during the fourth quarter of fiscal 2017.
Recent Sales of Unregistered Securities
There were no unregistered sales of our equity securities during fiscal 2017.
29
Item 6. SELECTED FINANCIAL DATA
Year ended October 31, (1) | ||||||||||||||||||||
2017 | 2016 | 2015 | 2014 | 2013 | ||||||||||||||||
(in thousands, except per share data) | ||||||||||||||||||||
Operating Data: | ||||||||||||||||||||
Net sales | $1,524,813 | $1,376,258 | $1,188,648 | $1,132,311 | $1,008,757 | |||||||||||||||
Gross profit | 574,725 | 515,492 | 434,179 | 398,312 | 371,181 | |||||||||||||||
Selling, general and administrative expenses | 268,067 | 250,147 | 204,523 | 194,924 | 187,591 | |||||||||||||||
Operating income | 306,658 | 265,345 | (4) | 229,656 | 203,388 | (7) | 183,590 | |||||||||||||
Interest expense | 9,790 | 8,272 | 4,626 | 5,441 | 3,717 | |||||||||||||||
Other income (expense) | 1,092 | (23 | ) | (66 | ) | 625 | 888 | |||||||||||||
Net income attributable to HEICO | 185,985 | (3) | 156,192 | (4)(5) | 133,364 | (6) | 121,293 | (7) | 102,396 | (8) | ||||||||||
Weighted average number of common shares outstanding: (2) | ||||||||||||||||||||
Basic | 84,290 | 83,807 | 83,425 | 83,079 | 82,873 | |||||||||||||||
Diluted | 86,776 | 85,213 | 84,764 | 84,316 | 83,727 | |||||||||||||||
Per Share Data: (2) | ||||||||||||||||||||
Net income per share attributable to HEICO shareholders: | ||||||||||||||||||||
Basic | $2.21 | (3) | $1.86 | (4)(5) | $1.60 | (6) | $1.46 | (7) | $1.24 | (8) | ||||||||||
Diluted | 2.14 | (3) | 1.83 | (4)(5) | 1.57 | (6) | 1.44 | (7) | 1.22 | (8) | ||||||||||
Cash dividends per share | .152 | .128 | .112 | .376 | 1.453 | |||||||||||||||
Balance Sheet Data (as of October 31): | ||||||||||||||||||||
Cash and cash equivalents | $52,066 | $42,955 | $33,603 | $20,229 | $15,499 | |||||||||||||||
Total assets (9) | 2,512,431 | 1,998,412 | 1,700,857 | 1,454,729 | 1,499,979 | |||||||||||||||
Total debt (including current portion) | 673,979 | 458,225 | 367,598 | 329,109 | 377,515 | |||||||||||||||
Redeemable noncontrolling interests | 131,123 | 99,512 | 91,282 | 39,966 | 59,218 | |||||||||||||||
Total shareholders’ equity | 1,248,292 | 1,047,705 | 893,271 | 774,619 | 723,235 | |||||||||||||||
__________________
(1) | Results include the results of acquisitions from each respective effective date. See Note 2, Acquisitions, of the Notes to Consolidated Financial Statements for more information. |
(2) | All share and per share information has been adjusted retrospectively to reflect the 5-for-4 stock split effected in April 2017. |
(3) | During fiscal 2017, we adopted Accounting Standards Update ("ASU") 2016-09, "Improvements to Employee Share-Based Payment Accounting," resulting in the recognition of a $3.1 million discrete income tax benefit and a 781,000 increase in our weighted average number of diluted common shares outstanding, which, net of noncontrolling interests, increased net income attributable to HEICO by $2.6 million, or $.03 per basic and $.01 per diluted share. See Note 1, Summary of Significant Accounting Policies - New Accounting Pronouncements, of the Notes to Consolidated Financial Statements for more information. |
30
(4) | Includes $3.1 million of acquisition costs incurred in connection with a fiscal 2016 acquisition within the Electronic Technologies Group ("ETG"). These expenses, net of tax, decreased net income attributable to HEICO by $2.0 million, or $.02 per basic and diluted share. |
(5) | Includes additional income tax credits for qualified research and development (“R&D”) activities related to the last ten months of fiscal 2015 recognized in fiscal 2016 upon the retroactive and permanent extension of the United States (“U.S.”) federal R&D tax credit in December 2015, which, net of expenses, increased net income attributable to HEICO by $1.7 million, or $.02 per basic and diluted share. |
(6) | Includes additional income tax credits for qualified R&D activities related to the last ten months of fiscal 2014 recognized in fiscal 2015 upon the retroactive extension of the U.S. federal R&D tax credit in December 2014 to cover calendar year 2014, which, net of expenses, increased net income attributable to HEICO by $1.8 million, or $.02 per basic and diluted share. |
(7) | Operating income was increased by a $28.1 million reduction in accrued contingent consideration related to a fiscal 2013 and a fiscal 2012 acquisition within the ETG, partially offset by $15.0 million in impairment losses related to the write-down of certain intangible assets of the fiscal 2013 and fiscal 2012 acquisitions to their estimated fair values as well as lower than expected operating income at the fiscal 2013 acquired business, which in aggregate increased net income attributable to HEICO by $10.2 million, or $.12 per basic and diluted share. The reduction in accrued contingent consideration and $13.1 million of the impairment losses were recorded as a component of selling, general and administrative expenses, while the remaining impairment losses of $1.9 million were recorded as a component of cost of sales. |
(8) | Includes additional income tax credits for qualified R&D activities related to the last ten months of fiscal 2012 recognized in fiscal 2013 upon the retroactive extension of the U.S. federal R&D tax credit in January 2013 and higher R&D tax credits recognized upon the filing of HEICO's fiscal 2012 U.S. federal and state tax returns, which, net of expenses, increased net income attributable to HEICO by $1.8 million, or $.02 per basic and diluted share. |
(9) | During fiscal 2017, we adopted ASU 2015-17, “Balance Sheet Classification of Deferred Taxes," on a retrospective basis resulting in a reclassification of $41.1 million, $35.5 million, $34.5 million and $33.0 million in current deferred tax assets to noncurrent deferred tax liabilities in our Consolidated Balance Sheet as of October 31, 2016, 2015, 2014 and 2013, respectively. See Note 1, Summary of Significant Accounting Policies - New Accounting Pronouncements, of the Notes to Consolidated Financial Statements for more information. |
31
Item 7. | MANAGEMENT’S DISCUSSION AND ANALYSIS OF FINANCIAL CONDITION AND RESULTS OF OPERATIONS |
Overview
Our business is comprised of two operating segments, the Flight Support Group (“FSG”) and the Electronic Technologies Group (“ETG”).
The Flight Support Group consists of HEICO Aerospace Holdings Corp. (“HEICO Aerospace”), which is 80% owned, and HEICO Flight Support Corp., which is wholly owned, and their collective subsidiaries, which primarily:
• | Designs, Manufactures, Repairs, Overhauls and Distributes Jet Engine and Aircraft Component Replacement Parts. The Flight Support Group designs, manufactures, repairs, overhauls and distributes jet engine and aircraft component replacement parts. The parts and services are approved by the Federal Aviation Administration (“FAA”). The Flight Support Group also manufactures and sells specialty parts as a subcontractor for aerospace and industrial original equipment manufacturers and the United States ("U.S.") government. Additionally, the Flight Support Group is a leading supplier, distributor, and integrator of military aircraft parts and support services primarily to foreign military organizations allied with the U.S. and a leading manufacturer of advanced niche components and complex composite assemblies for commercial aviation, defense and space applications. Further, the Flight Support Group engineers, designs and manufactures thermal insulation blankets and parts as well as removable/reusable insulation systems for aerospace, defense, commercial and industrial applications, manufactures expanded foil mesh for lightning strike protection in fixed and rotary wing aircraft and is a leading distributor of aviation electrical interconnect products and electromechanical parts. |
The Electronic Technologies Group consists of HEICO Electronic Technologies Corp. (“HEICO Electronic”) and its subsidiaries, which primarily:
• | Designs and Manufactures Electronic, Microwave and Electro-Optical Equipment, High-Speed Interface Products, High Voltage Interconnection Devices and High Voltage Advanced Power Electronics. The Electronic Technologies Group designs, manufactures and sells various types of electronic, microwave and electro-optical equipment and components, including power supplies, laser rangefinder receivers, infrared simulation, calibration and testing equipment; power conversion products serving the high-reliability military, space and commercial avionics end-markets; underwater locator beacons used to locate data and voice recorders utilized on aircraft and marine vessels; electromagnetic interference shielding for commercial and military aircraft operators, electronics companies and telecommunication equipment suppliers; traveling wave tube amplifiers and microwave power modules used in radar, electronic warfare and on-board jamming and countermeasure systems; advanced high-technology interface products that link devices such as telemetry receivers, digital cameras, high resolution scanners, simulation systems and test systems to computers; high voltage energy generators, high voltage |
32
interconnection devices, cable assemblies and wire for the medical equipment, defense and other industrial markets; high voltage power supplies found in satellite communications, CT scanners and in medical and industrial x-ray systems; three-dimensional microelectronic and stacked memory products that are principally integrated into larger subsystems equipping satellites and spacecraft; harsh environment connectivity products and custom molded cable assemblies; radio frequency (RF) and microwave amplifiers, transmitters and receivers used to support military communications on unmanned aerial systems, other aircraft, helicopters and ground-based data/communications systems; communications and electronic intercept receivers and tuners for military and intelligence applications; wireless cabin control systems, solid state power distribution and management systems and fuel level sensing systems for business jets and for general aviation, as well as for the military/defense market; microwave modules, units and integrated sub-systems for commercial and military satellites; crashworthy and ballistically self-sealing auxiliary fuel systems for military rotorcraft; and high performance active antenna systems for commercial aircraft, precision guided munitions, other defense applications and commercial uses.
Our results of operations during each of the past three fiscal years have been affected by a number of transactions. This discussion of our financial condition and results of operations should be read in conjunction with the Consolidated Financial Statements and Notes thereto included herein. For further information regarding the acquisitions discussed below, see Note 2, Acquisitions, of the Notes to Consolidated Financial Statements. Each acquisition was included in our results of operations from the effective acquisition date.
In September 2017, we acquired, through HEICO Electronic, all of the outstanding stock of AeroAntenna Technology, Inc. ("AAT"). AAT designs and produces high performance active antenna systems for commercial aircraft, precision guided munitions, other defense applications and commercial uses.
In June 2017, we acquired, through a subsidiary of the HEICO Flight Support Corp., all of the ownership interests of Carbon by Design ("CBD"). CBD is a manufacturer of composite components for UAVs, rockets, spacecraft and other specialized applications. The purchase price of CBD was paid using cash provided by operating activities.
In April 2017, we acquired, through a subsidiary of HEICO Flight Support Corp., 80.1% of the equity interests of LLP Enterprises, LLC, which owns all of the outstanding equity interests of the operating units of Air Cost Control ("A2C"). A2C is a leading aviation electrical interconnect product distributor of items such as connectors, wire, cable, protection and fastening systems, in addition to distributing a wide range of electromechanical parts. The remaining 19.9% interest continues to be owned by certain members of A2C's management team.
In January 2016, we acquired, through HEICO Electronic, all of the limited liability company interests of Robertson Fuel Systems, LLC ("Robertson"). Robertson designs and produces mission-extending, crashworthy and ballistically self-sealing auxiliary fuel systems for military rotorcraft.
33
In December 2015, we acquired, through a subsidiary of HEICO Electronic, certain assets of a company that designs and manufactures underwater locator beacons used to locate aircraft cockpit voice recorders, flight data recorders, marine ship voyage recorders and other devices which have been submerged under water. The purchase price of this acquisition was paid using cash provided by operating activities.
In August 2015, we acquired, through HEICO Flight Support Corp., all of the stock of Astroseal Products Mfg. Corporation (“Astroseal”). Astroseal manufactures expanded foil mesh, which is integrated into composite aerospace structures for lightning strike protection in fixed and rotary wing aircraft.
In August 2015, we acquired, through HEICO Electronic, 80.1% of the equity of Midwest Microwave Solutions, Inc. (“MMS”). MMS designs, manufactures and sells unique Size, Weight, Power and Cost (SWAP-C) optimized Communications and Electronic Intercept Receivers and Tuners for military and intelligence applications. The remaining 19.9% continues to be owned by certain members of MMS’ management team.
In August 2015, we acquired, through HEICO Flight Support Corp., 80.1% of the assets and assumed certain liabilities of Aerospace & Commercial Technologies, LLC (“ACT”). ACT is a provider of products and services necessary to maintain up-to-date F-16 fighter aircraft operational capabilities. The remaining 19.9% continues to be owned by certain members of ACT’s management team.
In May 2015, we acquired, through a subsidiary of HEICO Flight Support Corp., all of the stock of Thermal Energy Products, Inc. (“TEP”). TEP engineers, designs and manufactures removable/reusable insulation systems for industrial, commercial, aerospace and defense applications.
In January 2015, we acquired, through HEICO Flight Support Corp., 80.1% of the equity of Harter Aerospace, LLC ("Harter"). Harter is a globally recognized component and accessory maintenance, repair, and overhaul (MRO) station specializing in commercial aircraft accessories, including thrust reverse actuation systems and pneumatics, and electromechanical components. The remaining 19.9% interest continues to be owned by certain members of Harter's management team.
In January 2015, we acquired, through HEICO Flight Support Corp., 80% of the equity of Aeroworks International Holding B.V. (“Aeroworks”). Aeroworks, which is headquartered in the Netherlands and maintains a significant portion of its production facilities in Thailand and Laos, is a manufacturer of both composite and metal parts used primarily in aircraft interior applications, including seating, galleys, lavatories, doors, and overhead bins. The remaining 20% interest continues to be owned by a certain member of Aeroworks' management team.
Unless otherwise noted, the purchase price of each of the above referenced acquisitions was paid in cash, principally using proceeds from our revolving credit facility. The aggregate
34
amount paid in cash for acquisitions was $418.3 million, $263.8 million and $166.8 million in fiscal 2017, 2016 and 2015, respectively.
Critical Accounting Policies
We believe that the following are our most critical accounting policies, which require management to make judgments about matters that are inherently uncertain.
Assumptions utilized to determine fair value in connection with business combinations, contingent consideration arrangements and in goodwill and intangible assets impairment tests are highly judgmental. If there is a material change in such assumptions or if there is a material change in the conditions or circumstances influencing fair value, we could be required to recognize a material impairment charge. See Item 1A., Risk Factors, for a list of factors which may cause our actual results to differ materially from anticipated results.
Revenue Recognition
Revenue from the sale of products and the rendering of services is recognized when title and risk of loss passes to the customer, which is generally at the time of shipment. Revenue from certain fixed price contracts for which costs can be dependably estimated is recognized on the percentage-of-completion method, measured by the percentage of costs incurred to date to estimated total costs for each contract. This method is used because management considers costs incurred to be the best available measure of progress on these contracts. Revisions in cost estimates as contracts progress have the effect of increasing or decreasing profits in the period of revision. Revisions in cost estimates may be caused by factors such as the price or availability of raw materials and component parts or variations in the amount of labor required and/or the materials necessary to meet customer specifications and requirements. Provisions for estimated losses on uncompleted contracts are made in the period in which such losses are determined. The percentage of our net sales recognized under the percentage-of-completion method was approximately 3%, 3% and 4% in fiscal 2017, 2016 and 2015, respectively. Changes in estimates pertaining to percentage-of-completion contracts did not have a material or significant effect on net income or net income per share in fiscal 2017, 2016 and 2015.
For fixed price contracts in which costs cannot be dependably estimated, revenue is recognized on the completed-contract method. A contract is considered complete when all significant costs have been incurred or the item has been accepted by the customer. Progress billings and customer advances received on fixed price contracts accounted for under the completed-contract method are classified as a reduction to contract costs that are included in inventories, if any, and any remaining amount is included in accrued expenses and other current liabilities.
Valuation of Accounts Receivable
The valuation of accounts receivable requires that we set up an allowance for estimated uncollectible accounts and record a corresponding charge to bad debt expense. We estimate
35
uncollectible receivables based on such factors as our prior experience, our appraisal of a customer’s ability to pay, age of receivables outstanding and economic conditions within and outside of the aviation, defense, space, medical, telecommunications and electronics industries. Actual bad debt expense could differ from estimates made.
Valuation of Inventory
Inventory is stated at the lower of cost or market, with cost being determined on the first-in, first-out or the average cost basis. Losses, if any, are recognized fully in the period when identified.
We periodically evaluate the carrying value of inventory, giving consideration to factors such as its physical condition, sales patterns and expected future demand in order to estimate the amount necessary to write down any slow moving, obsolete or damaged inventory. These estimates could vary significantly from actual amounts based upon future economic conditions, customer inventory levels, or competitive factors that were not foreseen or did not exist when the estimated write-downs were made.
In accordance with industry practice, all inventories are classified as a current asset including portions with long production cycles, some of which may not be realized within one year.
Business Combinations
We allocate the purchase price of acquired entities to the underlying tangible and identifiable intangible assets acquired and liabilities and any noncontrolling interests assumed based on their estimated fair values, with any excess recorded as goodwill. Determining the fair value of assets acquired and liabilities and noncontrolling interests assumed requires management’s judgment and often involves the use of significant estimates and assumptions, including assumptions with respect to future cash inflows and outflows, discount rates, asset lives and market multiples, among other items. We determine the fair values of intangible assets acquired generally in consultation with third-party valuation advisors.
As part of the agreement to acquire certain subsidiaries, we may be obligated to pay contingent consideration should the acquired entity meet certain earnings objectives subsequent to the date of acquisition. As of the acquisition date, contingent consideration is recorded at fair value as determined through the use of a probability-based scenario analysis approach. Under this method, a set of discrete potential future subsidiary earnings is determined using internal estimates based on various revenue growth rate assumptions for each scenario. A probability of likelihood is then assigned to each discrete potential future earnings estimate and the resultant contingent consideration is calculated and discounted using a weighted average discount rate reflecting the credit risk of HEICO. Subsequent to the acquisition date, the fair value of such contingent consideration is measured each reporting period and any changes are recorded to selling, general and administrative ("SG&A") expenses within our Consolidated Statements of Operations. Changes in either the revenue growth rates, related earnings or the discount rate
36
could result in a material change to the amount of contingent consideration accrued. As of October 31, 2017, 2016 and 2015, $27.6 million, $18.9 million and $21.4 million of contingent consideration was accrued within our Consolidated Balance Sheets, respectively. During fiscal 2017, 2016 and 2015, such fair value measurement adjustments resulted in net increases to SG&A expenses of $1.1 million, $3.1 million and $.3 million, respectively. For further information regarding our contingent consideration arrangements, see Note 7, Fair Value Measurements, of the Notes to Consolidated Financial Statements.
Valuation of Goodwill and Other Intangible Assets
We test goodwill for impairment annually as of October 31, or more frequently if events or changes in circumstances indicate that the carrying amount of goodwill may not be fully recoverable. In evaluating the recoverability of goodwill, we compare the fair value of each of our reporting units to its carrying value to determine potential impairment. If the carrying value of a reporting unit exceeds its fair value, the implied fair value of that reporting unit’s goodwill is to be calculated and an impairment loss is recognized in the amount by which the carrying value of the reporting unit’s goodwill exceeds its implied fair value, if any. The fair values of our reporting units were determined using a weighted average of a market approach and an income approach. Under the market approach, fair values are estimated using published market multiples for comparable companies. We calculate fair values under the income approach by taking estimated future cash flows that are based on internal projections and other assumptions deemed reasonable by management and discounting them using an estimated weighted average cost of capital. Based on the annual goodwill impairment test as of October 31, 2017, 2016 and 2015, we determined there was no impairment of our goodwill. The fair value of each of our reporting units as of October 31, 2017 significantly exceeded its carrying value.
We test each non-amortizing intangible asset (principally trade names) for impairment annually as of October 31, or more frequently if events or changes in circumstances indicate that the asset might be impaired. To derive the fair value of our trade names, we utilize an income approach, which relies upon management's assumptions of royalty rates, projected revenues and discount rates. We also test each amortizing intangible asset for impairment if events or circumstances indicate that the asset might be impaired. The test consists of determining whether the carrying value of such assets will be recovered through undiscounted expected future cash flows. If the total of the undiscounted future cash flows is less than the carrying amount of those assets, we recognize an impairment loss based on the excess of the carrying amount over the fair value of the assets. The determination of fair value requires us to make a number of estimates, assumptions and judgments of underlying factors such as projected revenues and related earnings as well as discount rates. Based on the intangible impairment tests conducted, we did not recognize any impairment losses in fiscal 2017, 2016 and 2015.
37
Results of Operations
The following table sets forth the results of our operations, net sales and operating income by segment and the percentage of net sales represented by the respective items in our Consolidated Statements of Operations (in thousands):
Year ended October 31, | |||||||||||
2017 | 2016 | 2015 | |||||||||
Net sales | $1,524,813 | $1,376,258 | $1,188,648 | ||||||||
Cost of sales | 950,088 | 860,766 | 754,469 | ||||||||
Selling, general and administrative expenses | 268,067 | 250,147 | 204,523 | ||||||||
Total operating costs and expenses | 1,218,155 | 1,110,913 | 958,992 | ||||||||
Operating income | $306,658 | $265,345 | $229,656 | ||||||||
Net sales by segment: | |||||||||||
Flight Support Group | $967,540 | $875,870 | $809,700 | ||||||||
Electronic Technologies Group | 574,261 | 511,272 | 390,982 | ||||||||
Intersegment sales | (16,988 | ) | (10,884 | ) | (12,034 | ) | |||||
$1,524,813 | $1,376,258 | $1,188,648 | |||||||||
Operating income by segment: | |||||||||||
Flight Support Group | $179,278 | $163,427 | $149,798 | ||||||||
Electronic Technologies Group | 157,451 | 126,031 | 98,833 | ||||||||
Other, primarily corporate | (30,071 | ) | (24,113 | ) | (18,975 | ) | |||||
$306,658 | $265,345 | $229,656 | |||||||||
Net sales | 100.0 | % | 100.0 | % | 100.0 | % | |||||
Gross profit | 37.7 | % | 37.5 | % | 36.5 | % | |||||
Selling, general and administrative expenses | 17.6 | % | 18.2 | % | 17.2 | % | |||||
Operating income | 20.1 | % | 19.3 | % | 19.3 | % | |||||
Interest expense | .6 | % | .6 | % | .4 | % | |||||
Other income (expense) | .1 | % | — | % | — | % | |||||
Income tax expense | 5.9 | % | 5.9 | % | 6.0 | % | |||||
Net income attributable to noncontrolling interests | 1.4 | % | 1.5 | % | 1.7 | % | |||||
Net income attributable to HEICO | 12.2 | % | 11.3 | % | 11.2 | % | |||||
38
Comparison of Fiscal 2017 to Fiscal 2016
Net Sales
Our net sales in fiscal 2017 increased by 11% to a record $1,524.8 million, as compared to net sales of $1,376.3 million in fiscal 2016. The increase in consolidated net sales reflects an increase of $63.0 million (a 12% increase) to a record $574.3 million in net sales within the ETG as well as an increase of $91.7 million (a 10% increase) to a record $967.5 million in net sales within the FSG. The net sales increase in the ETG resulted from organic growth of 7% as well as net sales of $23.3 million contributed by our fiscal 2017 and 2016 acquisitions. The ETG's organic growth is mainly attributed to increased demand for our space, aerospace and other electronics products resulting in net sales increases of $14.7 million, $12.6 million and $9.3 million, respectively. The net sales increase in the FSG reflects net sales of $49.0 million contributed by our fiscal 2017 acquisitions as well as organic growth of 5%. The FSG's organic growth is principally attributed to increased demand and new product offerings within our aftermarket replacement parts and repair and overhaul parts and services product lines, resulting in net sales increases of $39.8 million and $19.1 million, respectively. These increases were partially offset by $16.2 million of lower organic net sales from our specialty products product line principally related to certain aerospace, industrial and defense products. Sales price changes were not a significant contributing factor to the FSG and ETG net sales growth in fiscal 2017.
Our net sales in fiscal 2017 and 2016 by market consisted of approximately 53% and 52%, respectively, from the commercial aviation industry, 34% in both periods from the defense and space industries, and 13% and 14%, respectively, from other industrial markets including medical, electronics and telecommunications.
Gross Profit and Operating Expenses
Our consolidated gross profit margin increased to 37.7% in fiscal 2017 as compared to 37.5% in fiscal 2016, principally reflecting an increase of .9% in the ETG's gross profit margin, partially offset by a .3% decrease in the FSG's gross profit margin. The increase in the ETG's gross profit margin is principally attributed to increased net sales and a more favorable product mix for certain aerospace products. The decrease in the FSG's gross profit margin is attributed to the previously mentioned decrease in net sales and a less favorable product mix within our specialty products product line partially offset by increased net sales and a more favorable product mix within our aftermarket replacement parts and repair and overhaul parts and services product lines. Total new product research and development ("R&D") expenses included within our consolidated cost of sales increased to $46.5 million in fiscal 2017 compared to $44.7 million in fiscal 2016.
Our consolidated SG&A expenses were $268.1 million and $250.1 million in fiscal 2017 and 2016, respectively. The increase in consolidated SG&A expenses principally reflects $13.6 million attributable to the fiscal 2017 acquisitions, $4.3 million of higher performance-based compensation expense and a $2.9 million impact from foreign currency transaction adjustments
39
on borrowings denominated in Euros under our revolving credit facility, partially offset by $3.1 million of acquisition costs recorded in fiscal 2016 associated with a fiscal 2016 acquisition.
Our consolidated SG&A expenses as a percentage of net sales decreased to 17.6% in fiscal 2017, down from 18.2% in fiscal 2016. The decrease in consolidated SG&A expenses as a percentage of net sales principally reflects an aggregate .8% impact from efficiencies realized from the benefit of our net sales growth on relatively consistent period-over-period SG&A expenses and the aforementioned decrease in acquisition costs, partially offset by a .2% impact from the previously mentioned foreign currency transaction adjustments.
Operating Income
Our consolidated operating income increased by 16% to a record $306.7 million in fiscal 2017, up from $265.3 million in fiscal 2016. The increase in consolidated operating income principally reflects a $31.4 million increase (a 25% increase) to a record $157.5 million in operating income of the ETG as well as a $15.9 million increase (a 10% increase) to a record $179.3 million in operating income of the FSG. Additionally, our consolidated operating income was unfavorably impacted by a $5.3 million increase in corporate expenses principally due to the previously mentioned foreign currency transaction adjustments as well as higher operating costs in line with and to support the growth of our overall business. The increase in operating income of the ETG is principally attributed to the previously mentioned net sales growth and improved gross profit margin as well as the aforementioned favorable impact of SG&A efficiencies and decrease in acquisition costs. The increase in operating income of the FSG is principally attributed to the previously mentioned net sales growth partially offset by an increase in performance-based compensation expense and the less favorable gross profit margin.
Our consolidated operating income as a percentage of net sales increased to 20.1% in fiscal 2017, up from 19.3% in fiscal 2016. The increase principally reflects an increase in the ETG’s operating income as a percentage of net sales to 27.4% in fiscal 2017, up from 24.7% in fiscal 2016, partially offset by a slight decrease in the FSG’s operating income as a percentage of net sales to 18.5% in fiscal 2017, down from 18.7% in fiscal 2016. Additionally, our consolidated operating income as a percentage of net sales was unfavorably impacted by a .2% impact from the previously mentioned foreign currency transaction adjustments. The increase in the ETG’s operating income as a percentage of net sales is principally attributed to the previously mentioned, SG&A efficiencies, improved gross profit margin, and decrease in acquisition costs.
Interest Expense
Interest expense increased to $9.8 million in fiscal 2017 from $8.3 million in fiscal 2016. The increase was principally due to higher interest rates partially offset by a lower weighted average balance outstanding under our revolving credit facility.
Other Income (Expense)
Other income (expense) in fiscal 2017 and 2016 was not material.
40
Income Tax Expense
Our effective tax rate in fiscal 2017 decreased to 30.3% from 31.5% in fiscal 2016. The decrease principally reflects the favorable impact of higher tax-exempt unrealized gains in the cash surrender values of life insurance policies related to the HEICO Corporation Leadership Compensation Plan and a $3.1 million discrete income tax benefit related to stock option exercises resulting from the adoption of Accounting Standards Update 2016-09, "Improvements to Employee Share-Based Payment Accounting," in the first quarter of fiscal 2017 (see New Accounting Pronouncements below). These decreases were partially offset by the benefit recognized in fiscal 2016 from the retroactive and permanent extension of the U.S. federal R&D tax credit that resulted in the recognition of additional income tax credits for qualified R&D activities related to the last ten months of fiscal 2015 and a less favorable benefit in fiscal 2017 from the foreign tax rate differential associated with the undistributed earnings of a fiscal 2015 acquisition.
Net Income Attributable to Noncontrolling Interests
Net income attributable to noncontrolling interests relates to the 20% noncontrolling interest held by Lufthansa Technik AG in HEICO Aerospace and the noncontrolling interests held by others in certain subsidiaries of the FSG and ETG. Net income attributable to noncontrolling interests was $21.7 million in fiscal 2017 compared to $20.0 million in fiscal 2016. The increase in fiscal 2017 reflects higher net income of certain subsidiaries of the FSG and ETG in which noncontrolling interests are held, inclusive of a fiscal 2017 acquisition.
Net Income Attributable to HEICO
Net income attributable to HEICO increased by 19% to a record $186.0 million, or $2.14 per diluted share, in fiscal 2017, up from $156.2 million, or $1.83 per diluted share, in fiscal 2016, principally reflecting the previously mentioned increased net sales and operating income.
Outlook
As we look ahead to fiscal 2018, we anticipate net sales growth within the FSG's commercial aviation and defense product lines. We also expect growth within the ETG, principally driven by demand for the majority of our products. During fiscal 2018, we will continue our commitments to developing new products and services, further market penetration, and an aggressive acquisition strategy while maintaining our financial strength and flexibility. Overall, we are targeting growth in fiscal 2018 full year net sales and net income over fiscal 2017 levels. This outlook excludes the impact of additional acquired businesses, if any.
41
Comparison of Fiscal 2016 to Fiscal 2015
Net Sales
Our net sales in fiscal 2016 increased by 16% to a record $1,376.3 million, as compared to net sales of $1,188.6 million in fiscal 2015. The increase in consolidated net sales reflects an increase of $120.3 million (a 31% increase) to a record $511.3 million in net sales within the ETG as well as an increase of $66.2 million (an 8% increase) to a record $875.9 million in net sales within the FSG. The net sales increase in the ETG reflects net sales of $107.3 million contributed by our fiscal 2016 and 2015 acquisitions as well as organic growth of 4%. The ETG's organic growth resulted mainly from an aggregate net sales increase of $17.2 million attributed to higher demand from certain space, medical and other electronics products, partially offset by a $3.2 million net sales decrease from lower demand for certain defense products. The net sales increase in the FSG reflects net sales of $40.6 million contributed by our fiscal 2015 acquisitions as well as organic growth of 3%. The FSG's organic growth is principally attributed to increased demand and new product offerings within our aftermarket replacement parts and specialty products lines, resulting in net sales increases of $22.6 million and $10.9 million, respectively. These increases were partially offset by $7.9 million of lower organic net sales from our repair and overhaul parts and services product line. Our repair and overhaul parts and services product line was adversely impacted by the mix of products repaired during fiscal 2016, which required less extensive repair and overhaul services, as well as softer demand from our South American market. The FSG experienced organic revenue growth of 6% in fiscal 2016 excluding our repair and overhaul parts and services product line. Sales price changes were not a significant contributing factor to the FSG and ETG net sales growth in fiscal 2016.
Our net sales in fiscal 2016 and 2015 by market consisted of approximately 52% and 57%, respectively, from the commercial aviation industry, 34% and 27%, respectively, from the defense and space industries, and 14% and 16%, respectively, from other industrial markets including medical, electronics and telecommunications.
Gross Profit and Operating Expenses
Our consolidated gross profit margin increased to 37.5% in fiscal 2016 as compared to 36.5% in fiscal 2015, principally reflecting an increase of .9% in the FSG's gross profit margin, partially offset by a .5% decrease in the ETG's gross profit margin. The increase in the FSG's gross profit margin is principally attributed to increased net sales and a more favorable product mix within our aftermarket replacement parts and specialty products product lines, partially offset by decreased net sales and a less favorable product mix within our repair and overhaul parts and services product line. The decrease in the ETG's gross profit margin is principally attributed to a less favorable product mix for certain space products. Total new product R&D expenses included within our consolidated cost of sales increased to $44.7 million in fiscal 2016 compared to $38.7 million in fiscal 2015.
Our consolidated SG&A expenses were $250.1 million and $204.5 million in fiscal 2016 and 2015, respectively. The increase in consolidated SG&A expenses principally reflects $21.8
42
million attributable to the fiscal 2016 and 2015 acquisitions, inclusive of $3.1 million of acquisition costs associated with a fiscal 2016 acquisition, $9.1 million of higher performance-based compensation expense, $3.1 million attributable to changes in the estimated fair value of accrued contingent consideration associated with a prior year acquisition, inclusive of foreign currency transaction adjustments, and a $2.4 million impact from foreign currency transaction adjustments on borrowings denominated in Euros under our revolving credit facility.
Our consolidated SG&A expenses as a percentage of net sales were 18.2% and 17.2% in fiscal 2016 and 2015, respectively. The increase in consolidated SG&A expenses as a percentage of net sales principally reflects a .5% impact from higher performance-based compensation expense and a .2%, .2% and .2% impact from the aforementioned changes in the estimated fair value of accrued contingent consideration, foreign currency transaction adjustments and acquisition costs, respectively.
Operating Income
Our consolidated operating income in fiscal 2016 increased by 16% to a record $265.3 million, up from $229.7 million in fiscal 2015. As a percentage of net sales, our consolidated operating income was 19.3% in both fiscal 2016 and 2015. The increase in consolidated operating income is primarily attributed to a $27.2 million increase (a 28% increase) to a record $126.0 million in operating income of the ETG as well as a $13.6 million increase (a 9% increase) to a record $163.4 million in operating income of the FSG, partially offset by a $5.1 million increase in corporate expenses principally reflecting higher performance-based compensation expense and the previously mentioned foreign currency transaction adjustments on borrowings denominated in Euros. The increase in operating income of the ETG is mainly attributed to the previously mentioned net sales growth, partially offset by a $6.4 million and $5.2 million increase in amortization expense of intangible assets and performance-based compensation expense, respectively, in addition to the impact from the previously mentioned acquisition costs. The increase in operating income of the FSG is mainly attributed to the previously mentioned net sales growth and improved gross profit margin, partially offset by a $4.4 million increase in performance-based compensation expense, the previously mentioned changes in the estimated fair value of accrued contingent consideration and a $3.0 million increase in amortization expense of intangible assets.
Interest Expense
Interest expense increased to $8.3 million in fiscal 2016 from $4.6 million in fiscal 2015. The increase was due to a higher weighted average balance outstanding under our revolving credit facility associated with our fiscal 2016 and 2015 acquisitions as well as higher interest rates.
Other Expense
Other expense in fiscal 2016 and 2015 was not material.
43
Income Tax Expense
Our effective tax rate in fiscal 2016 decreased to 31.5% from 31.7% in fiscal 2015. The decrease principally reflects the benefits recognized in fiscal 2016 of a larger income tax credit for qualified R&D activities resulting from the permanent extension of the U.S. federal R&D tax credit in December 2015 and a lower effective state tax rate driven by certain apportionment updates recognized upon the amendment of certain prior year tax returns in fiscal 2016. These decreases were partially offset by the benefits recognized in fiscal 2015 from a prior year tax return amendment for additional foreign tax credits related to R&D activities at one of our foreign subsidiaries and higher net income attributable to noncontrolling interests in subsidiaries structured as partnerships. See Note 6, Income Taxes, of the Notes to Consolidated Financial Statements for a detailed analysis of the provision for income taxes.
Net Income Attributable to Noncontrolling Interests
Net income attributable to noncontrolling interests relates to the 20% noncontrolling interest held by Lufthansa Technik AG in HEICO Aerospace and the noncontrolling interests held by others in certain subsidiaries of the FSG and ETG. Net income attributable to noncontrolling interests was $20.0 million in fiscal 2016 compared to $20.2 million in fiscal 2015.
Net Income Attributable to HEICO
Net income attributable to HEICO increased by 17% to a record $156.2 million, or $1.83 per diluted share, in fiscal 2016 from $133.4 million, or $1.57 per diluted share, in fiscal 2015, principally reflecting the previously mentioned increased net sales and operating income.
Inflation
We have generally experienced increases in our costs of labor, materials and services consistent with overall rates of inflation. The impact of such increases on net income attributable to HEICO has been generally minimized by efforts to lower costs through manufacturing efficiencies and cost reductions.
44
Liquidity and Capital Resources
Our capitalization was as follows (in thousands):
As of October 31, | ||||||
2017 | 2016 | |||||
Total debt (including current portion) | $673,979 | $458,225 | ||||
Less: Cash and cash equivalents | (52,066 | ) | (42,955) | |||
Net debt (total debt less cash and cash equivalents) | 621,913 | 415,270 | ||||
Shareholders’ equity | 1,248,292 | 1,047,705 | ||||
Total capitalization (debt plus equity) | 1,922,271 | 1,505,930 | ||||
Net debt to shareholders' equity | 50 | % | 40 | % | ||
Total debt to total capitalization | 35 | % | 30 | % | ||
Our principal uses of cash include acquisitions, capital expenditures, cash dividends, distributions to noncontrolling interests and working capital needs. Capital expenditures in fiscal 2018 are anticipated to approximate $50 million. We finance our activities primarily from our operating and financing activities, including borrowings under our revolving credit facility.
In November 2017, we entered into a new $1.3 billion Revolving Credit Facility Agreement ("New Credit Facility") with a bank syndicate, which matures in November 2022. Under certain circumstances, the maturity of the New Credit Facility may be extended for two one-year periods. The New Credit Facility also includes a feature that will allow us to increase revolving commitments under the New Credit Facility by $350 million to become a $1.65 billion facility, through increased commitments from existing lenders or the addition of new lenders. Borrowings under the New Credit Facility may be used to finance acquisitions and for working capital and other general corporate purposes, including capital expenditures. The New Credit Facility replaced the $670 million Revolving Credit Agreement (see Financing Activities below).
Borrowings under the New Credit Facility accrue interest at our election of the Base Rate or the Eurocurrency Rate, plus in each case, the Applicable Rate (based on our Total Leverage Ratio). The Base Rate for any day is a fluctuating rate per annum equal to the highest of (i) the Prime Rate; (ii) the Federal Funds Rate plus .50%; and (iii) the Eurocurrency Rate for an Interest Period of one month plus 100 basis points. The Eurocurrency Rate is the rate per annum obtained by dividing LIBOR for the applicable Interest Period by a percentage equal to 1.00 minus the daily average Eurocurrency Reserve Rate for such Interest Period, as such capitalized terms are defined in the New Credit Facility. The Applicable Rate for Eurocurrency Rate Loans ranges from 1.00% to 2.00%. The Applicable Rate for Base Rate Loans ranges from 0% to 1.00%. A fee is charged on the amount of the unused commitment ranging from .125% to .30% (depending on our Total Leverage Ratio). The New Credit Facility also includes $100 million sublimits for borrowings made in foreign currencies and for swingline borrowings, and a $50 million sublimit for letters of credit. Outstanding principal, accrued and unpaid interest and other amounts payable under the New Credit Facility may be accelerated upon an event of default, as such events are described in the New Credit Facility. The New Credit Facility is
45
unsecured and contains covenants that require, among other things, the maintenance of a Total Leverage Ratio and an Interest Coverage Ratio, as such capitalized terms are defined in the New Credit Facility. We were in compliance with all financial and nonfinancial covenants of the New Credit Facility as of October 31, 2017.
As of December 19, 2017, we had approximately $625 million of unused committed availability under the terms of our revolving credit facility. Based on our current outlook, we believe that net cash provided by operating activities and available borrowings under our revolving credit facility will be sufficient to fund our cash requirements for at least the next twelve months.
Operating Activities
Net cash provided by operating activities was $274.9 million in fiscal 2017 and consisted primarily of net income from consolidated operations of $207.7 million and depreciation and amortization expense of $64.8 million (a non-cash item). Net cash provided by operating activities increased by $25.7 million in fiscal 2017 from $249.2 million in fiscal 2016. The increase in net cash provided by operating activities in fiscal 2017 is principally due to a $31.5 million increase in net income from consolidated operations and a $4.5 million increase in depreciation and amortization expense (a non-cash item), partially offset by a $12.0 million increase in working capital (current assets minus current liabilities). The $12.0 million increase in working capital is principally attributed to a $33.5 million decrease in accrued expenses and other current liabilities, which mainly reflects a decrease in deferred revenue attributed to billings in excess of costs and estimated earnings on fixed price contracts for which revenue is being recognized on the percentage-of-completion method and customer deposits received in connection with both manufacturing and repair and overhaul services, partially offset by an $18.8 million decrease in accounts receivable.
Net cash provided by operating activities was $249.2 million in fiscal 2016 and consisted primarily of net income from consolidated operations of $176.2 million, depreciation and amortization expense of $60.3 million (a non-cash item) and an increase in working capital (current assets minus current liabilities) of $8.1 million. Net cash provided by operating activities increased by $76.3 million in fiscal 2016 from $172.9 million in fiscal 2015. The increase in net cash provided by operating activities in fiscal 2016 is principally due to a $36.7 million decrease in working capital, a $22.6 million increase in net income from consolidated operations and a $12.4 million increase in depreciation and amortization expense (a non-cash item). The $36.7 million decrease in working capital is principally attributed to a $36.2 million increase in accrued expenses and other current liabilities, which mainly reflects an increase in deferred revenue attributed to billings in excess of costs and estimated earnings on a fixed price contract for which revenue is being recognized on the percentage-of-completion method and customer deposits received in connection with a contract to provided repair and overhaul services, as well as a higher level of accrued performance-based compensation due to the improved consolidated operating results, and an increase in accrued customer rebates and credits.
46
Net cash provided by operating activities was $172.9 million in fiscal 2015 and consisted primarily of net income from consolidated operations of $153.6 million, depreciation and amortization expense of $47.9 million (a non-cash item) and a decrease in working capital (current assets minus current liabilities) of $28.7 million.
Investing Activities
Net cash used in investing activities during the three-year fiscal period ended October 31, 2017 primarily relates to several acquisitions aggregating $848.9 million, including $418.3 million in fiscal 2017, $263.8 million in fiscal 2016, and $166.8 million in fiscal 2015. Further details on acquisitions may be found at the beginning of this Item 7 under the caption “Overview” and Note 2, Acquisitions, of the Notes to Consolidated Financial Statements.
Capital expenditures aggregated $75.1 million over the last three fiscal years, primarily reflecting the expansion, replacement and betterment of existing production facilities and capabilities, which were generally funded using cash provided by operating activities.
Financing Activities
Net cash provided by financing activities was $175.9 million in fiscal 2017 as compared to $56.8 million in fiscal 2016 and $27.3 million in fiscal 2015. During the three-year fiscal period ended October 31, 2017, we borrowed an aggregate $837.7 million under our revolving credit facility including borrowings of $404.0 million in fiscal 2017, $260.0 million in fiscal 2016, and $173.7 million in fiscal 2015. The aforementioned borrowings were made principally to fund acquisitions. Further details on acquisitions may be found at the beginning of this Item 7 under the caption “Overview” and Note 2, Acquisitions, of the Notes to Consolidated Financial Statements. Payments on our revolving credit facility aggregated $492.9 million over the last three fiscal years, including $190.9 million in fiscal 2017, $170.0 million in fiscal 2016, and $132.0 million in fiscal 2015. For the three-year fiscal period ended October 31, 2017, we made distributions to noncontrolling interests aggregating $47.1 million and paid an aggregate $32.9 million in cash dividends.
Borrowings under our revolving credit facility in fiscal 2017, 2016 and 2015 were made under our $670 million Revolving Credit Agreement (“Prior Credit Facility”) with a bank syndicate, which was amended in November 2013 to become an $800 million facility and again in April 2017 to become a $1.0 billion facility. The Prior Credit Facility was available to finance acquisitions and for working capital and general corporate purposes, including capital expenditures.
Advances under the Prior Credit Facility accrued interest at our choice of the “Base Rate” or the London Interbank Offered Rate (“LIBOR”) plus the applicable margin (based on our ratio of total funded debt to earnings before interest, taxes, depreciation and amortization, noncontrolling interests and non-cash charges, or “leverage ratio”). The Base Rate was the highest of (i) the Prime Rate; (ii) the Federal Funds rate plus .50% per annum; and (iii) the Adjusted LIBO Rate determined on a daily basis for an Interest Period of one month plus 1.00% per annum, as such capitalized terms were defined in the Prior Credit Facility. The applicable
47
margin for a LIBOR-based borrowing ranged from .75% to 2.25%. The applicable margin for a Base Rate borrowing ranged from 0% to 1.25%. A fee was charged on the amount of the unused commitment ranging from .125% to .35% (depending on our leverage ratio). The Prior Credit Facility was unsecured and contained covenants that restricted the amount of certain payments, including dividends, and required, among other things, the maintenance of a total leverage ratio, a senior leverage ratio and a fixed charge coverage ratio. As of October 31, 2017, we were in compliance with all financial and nonfinancial covenants of the Prior Credit Facility. See Note 5, Long-Term Debt, of the Notes to Consolidated Financial Statements for further information regarding the Prior Credit Facility.
Contractual Obligations
The following table summarizes our contractual obligations as of October 31, 2017
(in thousands):
Payments due by fiscal period | |||||||||||||||||||
Total | 2018 | 2019 - 2020 | 2021 - 2022 | Thereafter | |||||||||||||||
Long-term debt obligations (1) | $671,115 | $— | $671,115 | $— | $— | ||||||||||||||
Capital lease obligations (2) | 3,325 | 575 | 1,100 | 1,028 | 622 | ||||||||||||||
Operating lease obligations (3) | 74,127 | 13,402 | 23,997 | 20,663 | 16,065 | ||||||||||||||
Purchase obligations (4) (5) (6) | 29,931 | 8,803 | 7,085 | 413 | 13,630 | ||||||||||||||
Other long-term liabilities (7) | 2,689 | 479 | 2,210 | — | — | ||||||||||||||
Total contractual obligations | $781,187 | $23,259 | $705,507 | $22,104 | $30,317 | ||||||||||||||
__________________
(1) | Excludes interest charges on borrowings and the fee on the amount of any unused commitment that we may be obligated to pay under our revolving credit facility as such amounts vary. See Note 5, Long-Term Debt, of the Notes to Consolidated Financial Statements and “Liquidity and Capital Resources,” above for additional information regarding our long-term debt obligations. As discussed in "Liquidity and Capital Resources," we entered into a New Credit Facility in November 2017 that matures in November 2022. Accordingly, the $671 million we had outstanding under our prior revolving credit facility as of October 31, 2017 and shown as due in fiscal 2019 is now due in fiscal 2023. |
(2) | Inclusive of $.5 million in interest charges. See Note 5, Long-Term Debt, of the Notes to Consolidated Financial Statements for additional information regarding our capital lease obligations. |
(3) | See Note 15, Commitments and Contingencies – Lease Commitments, of the Notes to Consolidated Financial Statements for additional information regarding our operating lease obligations. |
(4) | Includes contingent consideration aggregating $27.6 million related to a fiscal 2015, 2016 and 2017 acquisition. See Note 7, Fair Value Measurements, of the Notes to Consolidated Financial Statements for additional information. |
(5) | Also includes an aggregate $2.3 million of commitments principally for capital expenditures and inventory. All purchase obligations of inventory and supplies in the ordinary course of business (i.e., with deliveries scheduled within the next year) are excluded from the table. |
(6) | The holders of equity interests in certain of our subsidiaries have rights (“Put Rights”) that may be exercised on varying dates causing us to purchase their equity interests through fiscal 2025. The Put Rights provide that cash |
48
consideration be paid for their equity interests (the “Redemption Amount”). As of October 31, 2017, management’s estimate of the aggregate Redemption Amount of all Put Rights that we could be required to pay is approximately $131.1 million, which is reflected within redeemable noncontrolling interests in our Consolidated Balance Sheet. The amounts in the table do not include Put Right obligations as none of the noncontrolling interest holders have exercised their Put Rights as of October 31, 2017. See Note 11, Redeemable Noncontrolling Interests, of the Notes to Consolidated Financial Statements for further information.
(7) | The amounts in the table do not include liabilities related to the HEICO Corporation Leadership Compensation Plan or our other deferred compensation arrangement as they are each fully supported by assets held within irrevocable trusts. See Note 3, Selected Financial Statement Information - Other Long-Term Assets and Liabilities, of the Notes to Consolidated Financial Statements for further information about these two deferred compensation plans. |
Off-Balance Sheet Arrangements
Guarantees
As of October 31, 2017, we have arranged for standby letters of credit aggregating $4.2 million, which are supported by our revolving credit facility and pertain to payment guarantees related to potential workers' compensation claims and a facility lease as well as performance guarantees related to customer contracts entered into by certain of our subsidiaries.
New Accounting Pronouncements
In May 2014, the Financial Accounting Standards Board ("FASB") issued Accounting Standards Update ("ASU") 2014-09, “Revenue from Contracts with Customers,” which provides a comprehensive new revenue recognition model that will supersede nearly all existing revenue recognition guidance. Under ASU 2014-09, an entity will recognize revenue when it transfers promised goods or services to a customer at an amount that reflects the consideration it expects to receive in exchange for those goods or services. The guidance also requires additional disclosure about the nature, amount, timing and uncertainty of revenue and cash flows arising from customer contracts. ASU 2014-09, as amended, is effective for fiscal years and interim reporting periods within those years beginning after December 15, 2017, or in fiscal 2019 for HEICO. Early adoption in the year preceding the effective date is permitted. ASU 2014-09 shall be applied either retrospectively to each prior reporting period presented or retrospectively with the cumulative effect of initially applying ASU 2014-09 recognized at the date of initial application. We are currently evaluating which transition method we will elect. In addition, we are currently identifying our various revenue streams and reviewing certain underlying customer contracts to determine the effect the adoption of this guidance will have on our consolidated results of operations, financial position and cash flows.
In July 2015, the FASB issued ASU 2015-11, “Simplifying the Measurement of Inventory,” which requires entities to measure inventories at the lower of cost or net realizable value. Under current guidance, inventories are measured at the lower of cost or market. ASU 2015-11 must be applied prospectively and is effective for fiscal years and interim reporting periods within those years beginning after December 15, 2016, or in fiscal 2018 for HEICO. We
49
are currently evaluating the effect, if any, the adoption of this guidance will have on our consolidated results of operations, financial position and cash flows.
In November 2015, the FASB issued ASU 2015-17, “Balance Sheet Classification of Deferred Taxes," which requires that all deferred tax assets and liabilities be classified as noncurrent in the balance sheet. We adopted ASU 2015-17 on a retrospective basis in the fourth quarter of fiscal 2017, resulting in a reclassification of $41.1 million in current deferred tax assets to noncurrent deferred tax liabilities in our Consolidated Balance Sheet as of October 31, 2016.
In February 2016, the FASB issued ASU 2016-02, “Leases," which requires recognition of lease assets and lease liabilities on the balance sheet of lessees. ASU 2016-02 is effective for fiscal years and interim reporting periods within those years beginning after December 15, 2018, or in fiscal 2020 for HEICO. Early adoption is permitted. ASU 2016-02 requires a modified retrospective transition approach and provides certain optional transition relief. We are currently evaluating the effect the adoption of this guidance will have on our consolidated results of operations, financial position and cash flows.
In March 2016, the FASB issued ASU 2016-09, "Improvements to Employee Share-Based Payment Accounting," which simplifies several aspects related to accounting for share-based payment transactions. Under ASU 2016-09, all excess tax benefits and tax deficiencies are to be recognized in the statement of operations as a component of income tax expense rather than as capital in excess of par value. We adopted ASU 2016-09 in the first quarter of fiscal 2017 resulting in the recognition of a $3.1 million discrete income tax benefit, which, net of noncontrolling interests, increased net income attributable to HEICO by $2.6 million. Additionally, ASU 2016-09 requires excess tax benefits and deficiencies to be prospectively excluded from the assumed future proceeds in the calculation of diluted shares, which increased our weighted average number of diluted common shares outstanding by 781,000 for fiscal 2017. Further, ASU 2016-09 requires excess tax benefits be presented within the statement of cash flows as an operating activity rather than as a financing activity. We adopted this change on a prospective basis, which resulted in a $3.1 million increase in cash provided by operating activities and a $3.1 million decrease in cash provided by financing activities in fiscal 2017.
In August 2016, the FASB issued ASU 2016-15, "Classification of Certain Cash Receipts and Cash Payments," which clarifies how certain cash receipts and cash payments are to be presented and classified in the statement of cash flows. ASU 2016-15 provides guidance on eight specific cash flow classification issues including contingent consideration payments made after a business combination, proceeds from corporate-owned life insurance policies and distributions received from equity method investees. ASU 2016-15 is effective for fiscal years and interim reporting periods within those years beginning after December 15, 2017, or in fiscal 2019 for HEICO. Early adoption is permitted. ASU 2016-15 requires a retrospective transition approach for all periods presented. We are currently evaluating the effect the adoption of this guidance will have on its consolidated statement of cash flows.
50
In January 2017, the FASB issued ASU 2017-04, "Simplifying the Test for Goodwill Impairment," which is intended to simplify the current test for goodwill impairment by eliminating the second step in which the implied value of a reporting unit is calculated when the carrying value of the reporting unit exceeds its fair value. Under ASU 2017-04, goodwill impairment should be recognized for the amount by which a reporting unit’s carrying value exceeds its fair value, not to exceed the carrying amount of goodwill. ASU 2017-04 must be applied prospectively and is effective for any annual or interim goodwill impairment test in fiscal years beginning after December 15, 2019, or in fiscal 2021 for HEICO. Early adoption is permitted. We do not expect the adoption of this guidance to have a material impact on our consolidated results of operations, financial position and cash flows.
Forward-Looking Statements
Certain statements in this report constitute “forward-looking statements” within the meaning of the Private Securities Litigation Reform Act of 1995. All statements contained herein that are not clearly historical in nature may be forward-looking and the words “anticipate,” “believe,” “expect,” “estimate” and similar expressions are generally intended to identify forward-looking statements. Any forward-looking statement contained herein, in press releases, written statements or other documents filed with the Securities and Exchange Commission or in communications and discussions with investors and analysts in the normal course of business through meetings, phone calls and conference calls, concerning our operations, economic performance and financial condition are subject to risks, uncertainties and contingencies. We have based these forward-looking statements on our current expectations and projections about future events. All forward-looking statements involve risks and uncertainties, many of which are beyond our control, which may cause actual results, performance or achievements to differ materially from anticipated results, performance or achievements. Also, forward-looking statements are based upon management’s estimates of fair values and of future costs, using currently available information. Therefore, actual results may differ materially from those expressed in or implied by those forward-looking statements. Factors that could cause such differences include:
• | Lower demand for commercial air travel or airline fleet changes or airline purchasing decisions, which could cause lower demand for our goods and services; |
• | Product specification costs and requirements, which could cause an increase to our costs to complete contracts; |
• | Governmental and regulatory demands, export policies and restrictions, reductions in defense, space or homeland security spending by U.S. and/or foreign customers or competition from existing and new competitors, which could reduce our sales; |
• | Our ability to introduce new products and services at profitable pricing levels, which could reduce our sales or sales growth; |
51
• | Product development or manufacturing difficulties, which could increase our product development costs and delay sales; |
• | Our ability to make acquisitions and achieve operating synergies from acquired businesses; customer credit risk; interest, foreign currency exchange and income tax rates; economic conditions within and outside of the aviation, defense, space, medical, telecommunications and electronics industries, which could negatively impact our costs and revenues; and |
• | Defense budget cuts, which could reduce our defense-related revenue. |
For further information on these and other factors that potentially could materially affect our financial results, see Item 1A, Risk Factors. We undertake no obligation to publicly update or revise any forward-looking statement, whether as a result of new information, future events or otherwise, except to the extent required by applicable law.
Item 7A. QUANTITATIVE AND QUALITATIVE DISCLOSURES ABOUT MARKET RISK
Interest Rate Risk
We have exposure to interest rate risk, mainly related to our revolving credit facility, which has variable interest rates. Interest rate risk associated with our variable rate debt is the potential increase in interest expense from an increase in interest rates. Based on our aggregate outstanding variable rate debt balance of $671.0 million as of October 31, 2017, a hypothetical 10% increase in interest rates would not have a material effect on our results of operations, financial position or cash flows. We also maintain a portion of our cash and cash equivalents in financial instruments with original maturities of three months or less. These financial instruments are subject to interest rate risk and will decline in value if interest rates increase. Due to the short duration of these financial instruments, a hypothetical 10% increase in interest rates as of October 31, 2017 would not have a material effect on our results of operations, financial position or cash flows.
Foreign Currency Risk
We have a few foreign subsidiaries that conduct a portion of their operations in currencies other than the U.S. dollar, or principally in Euros, Canadian dollars and British pounds sterling. Accordingly, changes in exchange rates between such foreign currencies and the U.S. dollar will affect the translation of the financial results of our foreign subsidiaries into the U.S. dollar for purposes of reporting our consolidated financial results. A hypothetical 10% weakening in the exchange rate of the Euro, Canadian dollar or British pound sterling to the U.S. dollar as of October 31, 2017 would not have a material effect on our results of operations, financial position or cash flows.
52
Item 8. FINANCIAL STATEMENTS AND SUPPLEMENTARY DATA
HEICO CORPORATION AND SUBSIDIARIES
INDEX TO FINANCIAL STATEMENTS
Page | ||
Consolidated Balance Sheets as of October 31, 2017 and 2016 | ||
53
REPORT OF INDEPENDENT REGISTERED PUBLIC ACCOUNTING FIRM
To the Board of Directors and Shareholders of
HEICO Corporation
Hollywood, Florida
We have audited the accompanying consolidated balance sheets of HEICO Corporation and subsidiaries (the "Company") as of October 31, 2017 and 2016, and the related consolidated statements of operations, comprehensive income, shareholders’ equity, and cash flows for each of the three years in the period ended October 31, 2017. Our audits also included the financial statement schedule listed in the Index at Item 15. These financial statements and financial statement schedule are the responsibility of the Company's management. Our responsibility is to express an opinion on the financial statements and financial statement schedule based on our audits.
We conducted our audits in accordance with the standards of the Public Company Accounting Oversight Board (United States). Those standards require that we plan and perform the audit to obtain reasonable assurance about whether the financial statements are free of material misstatement. An audit includes examining, on a test basis, evidence supporting the amounts and disclosures in the financial statements. An audit also includes assessing the accounting principles used and significant estimates made by management, as well as evaluating the overall financial statement presentation. We believe that our audits provide a reasonable basis for our opinion.
In our opinion, such consolidated financial statements present fairly, in all material respects, the financial position of HEICO Corporation and subsidiaries as of October 31, 2017 and 2016, and the results of their operations and their cash flows for each of the three years in the period ended October 31, 2017, in conformity with accounting principles generally accepted in the United States of America. Also, in our opinion, such financial statement schedule, when considered in relation to the basic consolidated financial statements taken as a whole, presents fairly, in all material respects, the information set forth therein.
We have also audited, in accordance with the standards of the Public Company Accounting Oversight Board (United States), the Company's internal control over financial reporting as of October 31, 2017, based on the criteria established in Internal Control - Integrated Framework (2013) issued by the Committee of Sponsoring Organizations of the Treadway Commission and our report dated December 21, 2017 expressed an unqualified opinion on the Company's internal control over financial reporting.
/s/ DELOITTE & TOUCHE LLP
Certified Public Accountants
Miami, Florida
December 21, 2017
54
HEICO CORPORATION AND SUBSIDIARIES
CONSOLIDATED BALANCE SHEETS
(in thousands, except per share data)
As of October 31, | |||||||
2017 | 2016 | ||||||
ASSETS | |||||||
Current assets: | |||||||
Cash and cash equivalents | $52,066 | $42,955 | |||||
Accounts receivable, net | 222,456 | 202,227 | |||||
Inventories, net | 343,628 | 286,302 | |||||
Prepaid expenses and other current assets | 13,742 | 11,674 | |||||
Total current assets | 631,892 | 543,158 | |||||
Property, plant and equipment, net | 129,883 | 121,611 | |||||
Goodwill | 1,081,306 | 865,717 | |||||
Intangible assets, net | 538,081 | 366,863 | |||||
Deferred income taxes | — | 407 | |||||
Other assets | 131,269 | 100,656 | |||||
Total assets | $2,512,431 | $1,998,412 | |||||
LIABILITIES AND EQUITY | |||||||
Current liabilities: | |||||||
Current maturities of long-term debt | $451 | $411 | |||||
Trade accounts payable | 89,724 | 73,335 | |||||
Accrued expenses and other current liabilities | 147,612 | 136,053 | |||||
Income taxes payable | 11,650 | 4,622 | |||||
Total current liabilities | 249,437 | 214,421 | |||||
Long-term debt, net of current maturities | 673,528 | 457,814 | |||||
Deferred income taxes | 59,026 | 64,899 | |||||
Other long-term liabilities | 151,025 | 114,061 | |||||
Total liabilities | 1,133,016 | 851,195 | |||||
Commitments and contingencies (Note 15) | |||||||
Redeemable noncontrolling interests (Note 11) | 131,123 | 99,512 | |||||
Shareholders’ equity: | |||||||
Common Stock, $.01 par value per share; 75,000 shares authorized; 33,777 and 33,715 shares issued and outstanding | 338 | 270 | |||||
Class A Common Stock, $.01 par value per share; 75,000 shares authorized; 50,705 and 50,396 shares issued and outstanding | 507 | 403 | |||||
Capital in excess of par value | 326,544 | 306,328 | |||||
Deferred compensation obligation | 3,118 | 2,460 | |||||
HEICO stock held by irrevocable trust | (3,118 | ) | (2,460 | ) | |||
Accumulated other comprehensive loss | (10,556 | ) | (25,326 | ) | |||
Retained earnings | 844,247 | 681,704 | |||||
Total HEICO shareholders’ equity | 1,161,080 | 963,379 | |||||
Noncontrolling interests | 87,212 | 84,326 | |||||
Total shareholders’ equity | 1,248,292 | 1,047,705 | |||||
Total liabilities and equity | $2,512,431 | $1,998,412 | |||||
The accompanying notes are an integral part of these consolidated financial statements.
55
HEICO CORPORATION AND SUBSIDIARIES
CONSOLIDATED STATEMENTS OF OPERATIONS
(in thousands, except per share data)
Year ended October 31, | |||||||||||
2017 | 2016 | 2015 | |||||||||
Net sales | $1,524,813 | $1,376,258 | $1,188,648 | ||||||||
Operating costs and expenses: | |||||||||||
Cost of sales | 950,088 | 860,766 | 754,469 | ||||||||
Selling, general and administrative expenses | 268,067 | 250,147 | 204,523 | ||||||||
Total operating costs and expenses | 1,218,155 | 1,110,913 | 958,992 | ||||||||
Operating income | 306,658 | 265,345 | 229,656 | ||||||||
Interest expense | (9,790 | ) | (8,272 | ) | (4,626 | ) | |||||
Other income (expense) | 1,092 | (23 | ) | (66 | ) | ||||||
Income before income taxes and noncontrolling interests | 297,960 | 257,050 | 224,964 | ||||||||
Income tax expense | 90,300 | 80,900 | 71,400 | ||||||||
Net income from consolidated operations | 207,660 | 176,150 | 153,564 | ||||||||
Less: Net income attributable to noncontrolling interests | 21,675 | 19,958 | 20,200 | ||||||||
Net income attributable to HEICO | $185,985 | $156,192 | $133,364 | ||||||||
Net income per share attributable to HEICO shareholders (Note 17): | |||||||||||
Basic | $2.21 | $1.86 | $1.60 | ||||||||
Diluted | $2.14 | $1.83 | $1.57 | ||||||||
Weighted average number of common shares outstanding (Note 17): | |||||||||||
Basic | 84,290 | 83,807 | 83,425 | ||||||||
Diluted | 86,776 | 85,213 | 84,764 | ||||||||
The accompanying notes are an integral part of these consolidated financial statements.
56
HEICO CORPORATION AND SUBSIDIARIES
CONSOLIDATED STATEMENTS OF COMPREHENSIVE INCOME
(in thousands)
Year ended October 31, | |||||||||||
2017 | 2016 | 2015 | |||||||||
Net income from consolidated operations | $207,660 | $176,150 | $153,564 | ||||||||
Other comprehensive income (loss): | |||||||||||
Foreign currency translation adjustments | 15,346 | 353 | (16,880 | ) | |||||||
Unrealized gain (loss) on defined benefit pension plan, net of tax | 321 | (661 | ) | (771 | ) | ||||||
Amortization of unrealized loss on defined benefit pension plan, net of tax | 29 | — | — | ||||||||
Total other comprehensive income (loss) | 15,696 | (308 | ) | (17,651 | ) | ||||||
Comprehensive income from consolidated operations | 223,356 | 175,842 | 135,913 | ||||||||
Net income attributable to noncontrolling interests | 21,675 | 19,958 | 20,200 | ||||||||
Foreign currency translation adjustments attributable to noncontrolling interests | 926 | (62 | ) | (860 | ) | ||||||
Comprehensive income attributable to noncontrolling interests | 22,601 | 19,896 | 19,340 | ||||||||
Comprehensive income attributable to HEICO | $200,755 | $155,946 | $116,573 | ||||||||
The accompanying notes are an integral part of these consolidated financial statements.
57
HEICO CORPORATION AND SUBSIDIARIES
CONSOLIDATED STATEMENTS OF SHAREHOLDERS’ EQUITY
(in thousands, except per share data)
HEICO Shareholders' Equity | |||||||||||||||||||||||||||||||||||||||
Redeemable Noncontrolling Interests | Common Stock | Class A Common Stock | Capital in Excess of Par Value | Deferred Compensation Obligation | HEICO Stock Held by Irrevocable Trust | Accumulated Other Comprehensive Loss | Retained Earnings | Noncontrolling Interests | Total Shareholders' Equity | ||||||||||||||||||||||||||||||
Balances as of October 31, 2016 | $99,512 | $270 | $403 | $306,328 | $2,460 | ($2,460 | ) | ($25,326 | ) | $681,704 | $84,326 | $1,047,705 | |||||||||||||||||||||||||||
Comprehensive income | 11,637 | — | — | — | — | — | 14,770 | 185,985 | 10,964 | 211,719 | |||||||||||||||||||||||||||||
Cash dividends ($.152 per share) | — | — | — | — | — | — | — | (12,807 | ) | — | (12,807 | ) | |||||||||||||||||||||||||||
Five-for-four common stock split | — | 68 | 101 | (169 | ) | — | — | — | (23 | ) | — | (23 | ) | ||||||||||||||||||||||||||
Issuance of common stock to HEICO Savings and Investment Plan | — | — | — | 7,517 | — | — | — | — | — | 7,517 | |||||||||||||||||||||||||||||
Share-based compensation expense | — | — | — | 7,415 | — | — | — | — | — | 7,415 | |||||||||||||||||||||||||||||
Proceeds from stock option exercises | — | — | 3 | 5,656 | — | — | — | — | — | 5,659 | |||||||||||||||||||||||||||||
Noncontrolling interests assumed related to acquisitions | 23,339 | — | — | — | — | — | — | — | — | — | |||||||||||||||||||||||||||||
Distributions to noncontrolling interests | (10,323 | ) | — | — | — | — | — | — | — | (8,078 | ) | (8,078 | ) | ||||||||||||||||||||||||||
Acquisitions of noncontrolling interests | (3,848 | ) | — | — | — | — | — | — | 194 | — | 194 | ||||||||||||||||||||||||||||
Adjustments to redemption amount of redeemable noncontrolling interests | 10,806 | — | — | — | — | — | — | (10,806 | ) | — | (10,806 | ) | |||||||||||||||||||||||||||
Deferred compensation obligation | — | — | — | — | 658 | (658 | ) | — | — | — | — | ||||||||||||||||||||||||||||
Other | — | — | — | (203 | ) | — | — | — | — | — | (203 | ) | |||||||||||||||||||||||||||
Balances as of October 31, 2017 | $131,123 | $338 | $507 | $326,544 | $3,118 | ($3,118 | ) | ($10,556 | ) | $844,247 | $87,212 | $1,248,292 | |||||||||||||||||||||||||||
HEICO Shareholders' Equity | |||||||||||||||||||||||||||||||||||||||
Redeemable Noncontrolling Interests | Common Stock | Class A Common Stock | Capital in Excess of Par Value | Deferred Compensation Obligation | HEICO Stock Held by Irrevocable Trust | Accumulated Other Comprehensive Loss | Retained Earnings | Noncontrolling Interests | Total Shareholders' Equity | ||||||||||||||||||||||||||||||
Balances as of October 31, 2015 | $91,282 | $269 | $400 | $286,220 | $1,783 | ($1,783 | ) | ($25,080 | ) | $548,054 | $83,408 | $893,271 | |||||||||||||||||||||||||||
Comprehensive income (loss) | 9,968 | — | — | — | — | — | (246 | ) | 156,192 | 9,928 | 165,874 | ||||||||||||||||||||||||||||
Cash dividends ($.128 per share) | — | — | — | — | — | — | — | (10,724 | ) | — | (10,724 | ) | |||||||||||||||||||||||||||
Issuance of common stock to HEICO Savings and Investment Plan | — | 1 | 1 | 6,890 | — | — | — | — | — | 6,892 | |||||||||||||||||||||||||||||
Share-based compensation expense | — | — | — | 6,434 | — | — | — | — | — | 6,434 | |||||||||||||||||||||||||||||
Proceeds from stock option exercises | — | — | 2 | 5,922 | — | — | — | — | — | 5,924 | |||||||||||||||||||||||||||||
Tax benefit from stock option exercises | — | — | — | 868 | — | — | — | — | — | 868 | |||||||||||||||||||||||||||||
Distributions to noncontrolling interests | (9,957 | ) | — | — | — | — | — | — | — | (9,060 | ) | (9,060 | ) | ||||||||||||||||||||||||||
Acquisitions of noncontrolling interests | (3,599 | ) | — | — | — | — | — | — | — | — | — | ||||||||||||||||||||||||||||
Adjustments to redemption amount of redeemable noncontrolling interests | 11,818 | — | — | — | — | — | — | (11,818 | ) | — | (11,818 | ) | |||||||||||||||||||||||||||
Deferred compensation obligation | — | — | — | — | 677 | (677 | ) | — | — | — | — | ||||||||||||||||||||||||||||
Other | — | — | — | (6 | ) | — | — | — | — | 50 | 44 | ||||||||||||||||||||||||||||
Balances as of October 31, 2016 | $99,512 | $270 | $403 | $306,328 | $2,460 | ($2,460 | ) | ($25,326 | ) | $681,704 | $84,326 | $1,047,705 | |||||||||||||||||||||||||||
The accompanying notes are an integral part of these consolidated financial statements.
58
HEICO CORPORATION AND SUBSIDIARIES
CONSOLIDATED STATEMENTS OF SHAREHOLDERS’ EQUITY
(in thousands, except per share data)
HEICO Shareholders' Equity | |||||||||||||||||||||||||||||||||||||||
Redeemable Noncontrolling Interests | Common Stock | Class A Common Stock | Capital in Excess of Par Value | Deferred Compensation Obligation | HEICO Stock Held by Irrevocable Trust | Accumulated Other Comprehensive Loss | Retained Earnings | Noncontrolling Interests | Total Shareholders' Equity | ||||||||||||||||||||||||||||||
Balances as of October 31, 2014 | $39,966 | $268 | $397 | $269,351 | $1,138 | ($1,138 | ) | ($8,289 | ) | $437,757 | $75,135 | $774,619 | |||||||||||||||||||||||||||
Comprehensive income (loss) | 6,534 | — | — | — | — | — | (16,791 | ) | 133,364 | 12,806 | 129,379 | ||||||||||||||||||||||||||||
Cash dividends ($.112 per share) | — | — | — | — | — | — | — | (9,343 | ) | — | (9,343 | ) | |||||||||||||||||||||||||||
Issuance of common stock to HEICO Savings and Investment Plan | — | 1 | 1 | 5,752 | — | — | — | — | — | 5,754 | |||||||||||||||||||||||||||||
Share-based compensation expense | — | — | — | 6,048 | — | — | — | — | — | 6,048 | |||||||||||||||||||||||||||||
Proceeds from stock option exercises | — | — | 2 | 3,671 | — | — | — | — | — | 3,673 | |||||||||||||||||||||||||||||
Tax benefit from stock option exercises | — | — | — | 1,402 | — | — | — | — | — | 1,402 | |||||||||||||||||||||||||||||
Noncontrolling interests assumed related to acquisitions | 36,224 | — | — | — | — | — | — | — | — | — | |||||||||||||||||||||||||||||
Distributions to noncontrolling interests | (5,166 | ) | — | — | — | — | — | — | — | (4,533 | ) | (4,533 | ) | ||||||||||||||||||||||||||
Adjustments to redemption amount of redeemable noncontrolling interests | 13,724 | — | — | — | — | — | — | (13,724 | ) | — | (13,724 | ) | |||||||||||||||||||||||||||
Deferred compensation obligation | — | — | — | — | 645 | (645 | ) | — | — | — | — | ||||||||||||||||||||||||||||
Other | — | — | — | (4 | ) | — | — | — | — | — | (4 | ) | |||||||||||||||||||||||||||
Balances as of October 31, 2015 | $91,282 | $269 | $400 | $286,220 | $1,783 | ($1,783 | ) | ($25,080 | ) | $548,054 | $83,408 | $893,271 | |||||||||||||||||||||||||||
The accompanying notes are an integral part of these consolidated financial statements.
59
HEICO CORPORATION AND SUBSIDIARIES
CONSOLIDATED STATEMENTS OF CASH FLOWS
(in thousands)
Year ended October 31, | |||||||||||
2017 | 2016 | 2015 | |||||||||
Operating Activities: | |||||||||||
Net income from consolidated operations | $207,660 | $176,150 | $153,564 | ||||||||
Adjustments to reconcile net income from consolidated operations to net cash provided by operating activities: | |||||||||||
Depreciation and amortization | 64,823 | 60,277 | 47,907 | ||||||||
Employer contributions to HEICO Savings and Investment Plan | 7,768 | 7,020 | 6,125 | ||||||||
Share-based compensation expense | 7,415 | 6,434 | 6,048 | ||||||||
Increase in accrued contingent consideration, net | 1,100 | 3,063 | 293 | ||||||||
Foreign currency transaction adjustments, net | 3,347 | 13 | (3,704 | ) | |||||||
Deferred income tax benefit | (11,096 | ) | (9,194 | ) | (7,080 | ) | |||||
Tax benefit from stock option exercises | — | 868 | 1,402 | ||||||||
Excess tax benefit from stock option exercises | — | (881 | ) | (1,402 | ) | ||||||
Payment of contingent consideration | — | (631 | ) | — | |||||||
Changes in operating assets and liabilities, net of acquisitions: | |||||||||||
Decrease (increase) in accounts receivable | 2,846 | (15,955 | ) | (22,572 | ) | ||||||
Increase in inventories | (21,204 | ) | (14,421 | ) | (10,187 | ) | |||||
Decrease (increase) in prepaid expenses and other current assets | 134 | (2,356 | ) | 1,433 | |||||||
Increase in trade accounts payable | 6,386 | 4,074 | 3,169 | ||||||||
Increase (decrease) in accrued expenses and other current liabilities | 1,794 | 35,279 | (883 | ) | |||||||
Increase in income taxes payable | 6,071 | 1,443 | 373 | ||||||||
Other long-term assets and liabilities, net | (2,159 | ) | (1,999 | ) | (1,623 | ) | |||||
Net cash provided by operating activities | 274,885 | 249,184 | 172,863 | ||||||||
Investing Activities: | |||||||||||
Acquisitions, net of cash acquired | (418,265 | ) | (263,811 | ) | (166,784 | ) | |||||
Capital expenditures | (25,998 | ) | (30,863 | ) | (18,249 | ) | |||||
Other | (552 | ) | (2,942 | ) | (973 | ) | |||||
Net cash used in investing activities | (444,815 | ) | (297,616 | ) | (186,006 | ) | |||||
Financing Activities: | |||||||||||
Borrowings on revolving credit facility | 404,000 | 260,000 | 173,696 | ||||||||
Payments on revolving credit facility | (190,877 | ) | (170,000 | ) | (132,000 | ) | |||||
Distributions to noncontrolling interests | (18,401 | ) | (19,017 | ) | (9,699 | ) | |||||
Cash dividends paid | (12,807 | ) | (10,724 | ) | (9,343 | ) | |||||
Payment of contingent consideration | (7,039 | ) | (6,329 | ) | — | ||||||
Acquisitions of noncontrolling interests | (3,848 | ) | (3,599 | ) | — | ||||||
Proceeds from stock option exercises | 5,659 | 5,924 | 3,673 | ||||||||
Excess tax benefit from stock option exercises | — | 881 | 1,402 | ||||||||
Revolving credit facility issuance costs | (270 | ) | — | — | |||||||
Other | (545 | ) | (364 | ) | (393 | ) | |||||
Net cash provided by financing activities | 175,872 | 56,772 | 27,336 | ||||||||
Effect of exchange rate changes on cash | 3,169 | 1,012 | (819 | ) | |||||||
Net increase in cash and cash equivalents | 9,111 | 9,352 | 13,374 | ||||||||
Cash and cash equivalents at beginning of year | 42,955 | 33,603 | 20,229 | ||||||||
Cash and cash equivalents at end of year | $52,066 | $42,955 | $33,603 | ||||||||
The accompanying notes are an integral part of these consolidated financial statements.
60
HEICO CORPORATION AND SUBSIDIARIES
NOTES TO CONSOLIDATED FINANCIAL STATEMENTS
1. SUMMARY OF SIGNIFICANT ACCOUNTING POLICIES
Nature of Business
HEICO Corporation, through its principal subsidiaries consisting of HEICO Aerospace Holdings Corp. (“HEICO Aerospace”), HEICO Flight Support Corp. and HEICO Electronic Technologies Corp. (“HEICO Electronic”) and their respective subsidiaries (collectively, the “Company”), is principally engaged in the design, manufacture and sale of aerospace, defense and electronic related products and services throughout the United States ("U.S.") and internationally. The Company’s customer base is primarily the aviation, defense, space, medical, telecommunications and electronics industries.
Basis of Presentation
The Company has two operating segments: the Flight Support Group (“FSG”), consisting of HEICO Aerospace and HEICO Flight Support Corp. and their respective subsidiaries; and the Electronic Technologies Group (“ETG”), consisting of HEICO Electronic and its subsidiaries.
The consolidated financial statements include the financial accounts of HEICO Corporation and its subsidiaries, all of which are wholly owned except for HEICO Aerospace, which is 20% owned by Lufthansa Technik AG ("LHT"), the technical services subsidiary of Lufthansa German Airlines. In addition, HEICO Aerospace consolidates two subsidiaries which are 80.1% and 82.3% owned, respectively, and a joint venture, which is 84% owned. Also, HEICO Flight Support Corp. consolidates two subsidiaries which are 80% and 84% owned, respectively, and four subsidiaries that are each 80.1% owned. Furthermore, HEICO Electronic consolidates four subsidiaries, which are 80.1%, 80.1%, 82.5%, and 95.9% owned, respectively, and a wholly owned subsidiary of HEICO Electronic consolidates a subsidiary which is 78% owned. See Note 11, Redeemable Noncontrolling Interests. All intercompany balances and transactions are eliminated.
Stock Split
In March 2017, the Company's Board of Directors declared a 5-for-4 stock split on both classes of the Company's common stock. The stock split was effected as of April 19, 2017 in the form of a 25% stock dividend distributed to shareholders of record as of April 7, 2017. All applicable share and per share information has been adjusted retrospectively to give effect to the fiscal 2017 5-for-4 stock split.
61
Use of Estimates and Assumptions
The preparation of financial statements in conformity with accounting principles generally accepted in the United States of America requires management to make estimates and assumptions that affect the reported amounts of assets and liabilities and disclosure of contingent assets and liabilities as of the date of the financial statements and the reported amounts of revenue and expenses during the reporting period. Actual results could differ from those estimates.
Cash and Cash Equivalents
For purposes of the consolidated financial statements, the Company considers all highly liquid investments such as U.S. Treasury bills and money market funds, without liquidity fees or redemption gates, with an original maturity of three months or less at the time of purchase to be cash equivalents.
Accounts Receivable
Accounts receivable consist of amounts billed and currently due from customers and unbilled costs and estimated earnings related to revenue from certain fixed price contracts recognized on the percentage-of-completion method that have been recognized for accounting purposes, but not yet billed to customers. The valuation of accounts receivable requires that the Company set up an allowance for estimated uncollectible accounts and record a corresponding charge to bad debt expense. The Company estimates uncollectible receivables based on such factors as its prior experience, its appraisal of a customer’s ability to pay, age of receivables outstanding and economic conditions within and outside of the aviation, defense, space, medical, telecommunications and electronics industries.
Concentrations of Credit Risk
Financial instruments that potentially subject the Company to concentrations of credit risk consist principally of temporary cash investments and trade accounts receivable. The Company places its temporary cash investments with high credit quality financial institutions and limits the amount of credit exposure to any one financial institution. Concentrations of credit risk with respect to trade receivables are limited due to the large number of customers comprising the Company’s customer base and their dispersion across many different geographical regions. The Company performs ongoing credit evaluations of its customers, but does not generally require collateral to support customer receivables.
Inventory
Inventory is stated at the lower of cost or market, with cost being determined on the first-in, first-out or the average cost basis. Losses, if any, are recognized fully in the period when identified.
62
The Company periodically evaluates the carrying value of inventory, giving consideration to factors such as its physical condition, sales patterns and expected future demand in order to estimate the amount necessary to write down any slow moving, obsolete or damaged inventory.
These estimates could vary significantly from actual amounts based upon future economic conditions, customer inventory levels or competitive factors that were not foreseen or did not exist when the estimated write-downs were made. In accordance with industry practice, all inventories are classified as a current asset including portions with long production cycles, some of which may not be realized within one year.
Property, Plant and Equipment
Property, plant and equipment is recorded at cost. Depreciation and amortization is generally provided on the straight-line method over the estimated useful lives of the various assets. The Company’s property, plant and equipment is depreciated over the following estimated useful lives:
Buildings and improvements | 10 | to | 40 | years | ||
Leasehold improvements | 2 | to | 20 | years | ||
Machinery and equipment | 3 | to | 10 | years | ||
Tooling | 2 | to | 5 | years | ||
The costs of major additions and improvements are capitalized. Leasehold improvements are amortized over the shorter of the leasehold improvement’s useful life or the lease term.
Repairs and maintenance costs are expensed as incurred. Upon an asset's disposition, its cost and related accumulated depreciation are removed from the financial accounts and any resulting gain or loss is reflected within earnings.
Capital Leases
Assets acquired under capital leases are recorded at the lower of the asset's fair value or the present value of the future minimum lease payments, excluding any portion of the lease payments representing executory costs. The discount rate used in determining the present value of the minimum lease payments is the lower of the rate implicit in the lease or the Company's incremental borrowing rate. Assets under capital leases are included in property, plant and equipment and are depreciated over the shorter of the lease term or the useful life of the leased asset. Lease payments under capital leases are recognized as a reduction of the capital lease obligation and as interest expense.
Business Combinations
The Company allocates the purchase price of acquired entities to the underlying tangible and identifiable intangible assets acquired and liabilities and any noncontrolling interests assumed based on their estimated fair values, with any excess recorded as goodwill. The operating results of acquired businesses are included in the Company’s results of operations beginning as of their effective acquisition dates. Acquisition costs are generally expensed as
63
incurred, were not material in fiscal 2017 or 2015 and totaled $3.2 million in fiscal 2016. See Note 2, Acquisitions, for additional information regarding fiscal 2016 acquisition costs.
For contingent consideration arrangements, a liability is recognized at fair value as of the acquisition date with subsequent fair value adjustments recorded in operations. Additional information regarding the Company's contingent consideration arrangements may be found in Note 2, Acquisitions, and Note 7, Fair Value Measurements.
Goodwill and Other Intangible Assets
The Company tests goodwill for impairment annually as of October 31, or more frequently if events or changes in circumstances indicate that the carrying amount of goodwill may not be fully recoverable. In evaluating the recoverability of goodwill, the Company compares the fair value of each of its reporting units to its carrying value to determine potential impairment. If the carrying value of a reporting unit exceeds its fair value, the implied fair value of that reporting unit’s goodwill is to be calculated and an impairment loss is recognized in the amount by which the carrying value of the reporting unit’s goodwill exceeds its implied fair value, if any. The fair values of the Company's reporting units are determined by using a weighted average of a market approach and an income approach. Under the market approach, fair values are estimated using published market multiples for comparable companies. The Company calculates fair values under the income approach by taking estimated future cash flows that are based on internal projections and other assumptions deemed reasonable by management and discounting them using an estimated weighted average cost of capital.
The Company’s intangible assets not subject to amortization consist principally of its trade names. The Company’s intangible assets subject to amortization are amortized on the straight-line method (except for certain customer relationships amortized on an accelerated method) over the following estimated useful lives:
Customer relationships | 6 | to | 15 | years | ||
Intellectual property | 7 | to | 22 | years | ||
Licenses | 10 | to | 17 | years | ||
Patents | 5 | to | 20 | years | ||
Trade names | 8 | to | 15 | years | ||
Amortization expense of intellectual property, licenses and patents is recorded as a component of cost of sales, and amortization expense of customer relationships, non-compete agreements and trade names is recorded as a component of selling, general and administrative ("SG&A") expenses in the Company’s Consolidated Statements of Operations. The Company tests each non-amortizing intangible asset for impairment annually as of October 31, or more frequently if events or changes in circumstances indicate that the asset might be impaired. To derive the fair value of its trade names, the Company utilizes an income approach, which relies upon management's assumptions of royalty rates, projected revenues and discount rates. The Company also tests each amortizing intangible asset for impairment if events or circumstances
64
indicate that the asset might be impaired. The test consists of determining whether the carrying value of such assets will be recovered through undiscounted expected future cash flows. If the total of the undiscounted future cash flows is less than the carrying amount of those assets, the Company recognizes an impairment loss based on the excess of the carrying amount over the fair value of the assets. The determination of fair value requires management to make a number of estimates, assumptions and judgments of such factors as projected revenues and earnings and discount rates.
Investments
Investments are stated at fair value based on quoted market prices. Investments that are intended to be held for less than one year are included within prepaid expenses and other current assets in the Company’s Consolidated Balance Sheets, while those intended to be held for longer than one year are classified within other assets. Unrealized gains or losses associated with available-for-sale securities are reported net of tax within other comprehensive income or (loss) in shareholders’ equity. Unrealized gains or losses associated with trading securities are recorded as a component of other income in the Company’s Consolidated Statements of Operations.
Customer Rebates and Credits
The Company records accrued customer rebates and credits as a component of accrued expenses and other current liabilities in the Company’s Consolidated Balance Sheets. These amounts generally relate to discounts negotiated with customers as part of certain sales contracts that are usually tied to sales volume thresholds. The Company accrues customer rebates and credits as a reduction within net sales as the revenue is recognized based on the estimated level of discount rate expected to be earned by each customer over the life of the contractual rebate period (generally one year). Accrued customer rebates and credits are monitored by management and discount levels are updated at least quarterly.
Product Warranties
Product warranty liabilities are estimated at the time of shipment and recorded as a component of accrued expenses and other current liabilities in the Company’s Consolidated Balance Sheets. The amount recognized is based on historical claims experience.
Defined Benefit Pension Plan
In connection with a prior year acquisition, the Company assumed a frozen qualified defined benefit pension plan (the "Plan"). The Plan's benefits are based on employee compensation and years of service; however, the accrued benefit for Plan participants was fixed as of the date of acquisition. The Company uses an actuarial valuation to determine the projected benefit obligation of the Plan and records the difference between the fair value of the Plan's assets and the projected benefit obligation as of October 31 in its Consolidated Balance Sheets. Additionally, any actuarial gain or loss that arises during a fiscal year that is not recognized as a component of net periodic pension income or expense is recorded as a component of other
65
comprehensive income or (loss), net of tax. See Note 10, Employee Retirement Plans, for additional information and disclosures about the Plan.
Revenue Recognition
Revenue from the sale of products and the rendering of services is recognized when title and risk of loss passes to the customer, which is generally at the time of shipment. Revenue from the rendering of services represented less than 10% of consolidated net sales for all periods presented. Revenue from certain fixed price contracts for which costs can be dependably estimated is recognized on the percentage-of-completion method, measured by the percentage of costs incurred to date to estimated total costs for each contract. The percentage of the Company’s net sales recognized under the percentage-of-completion method was approximately 3%, 3% and 4% in fiscal 2017, 2016 and 2015, respectively. Contract costs include all direct material and labor costs and those indirect costs related to contract performance, such as indirect labor, supplies, tools, repairs and depreciation costs. SG&A costs are charged to expense as incurred.
Revisions in cost estimates as contracts progress have the effect of increasing or decreasing profits in the period of revision. Provisions for estimated losses on uncompleted contracts are made in the period in which such losses are determined. Variations in actual labor performance, changes to estimated profitability, and final contract settlements may result in revisions to cost estimates and are recognized in income in the period in which the revisions are determined. Changes in estimates pertaining to percentage-of-completion contracts did not have a material effect on net income from consolidated operations in fiscal 2017, 2016 or 2015.
The asset, “costs and estimated earnings in excess of billings” on uncompleted percentage-of-completion contracts, included in accounts receivable, represents revenue recognized in excess of amounts billed. The liability, “billings in excess of costs and estimated earnings,” included in accrued expenses and other current liabilities, represents billings in excess of revenue recognized on contracts accounted for under the percentage-of-completion method.
Billings are made based on the completion of certain milestones as provided for in the contracts.
For fixed price contracts in which costs cannot be dependably estimated, revenue is recognized on the completed-contract method. A contract is considered complete when all significant costs have been incurred or the item has been accepted by the customer. Progress billings and customer advances (“billings to date”) received on fixed price contracts accounted for under the completed-contract method are classified as a reduction to contracts in process (a component of inventories), if any, and any remaining amount is included in accrued expenses and other current liabilities.
Stock-Based Compensation
The Company records compensation expense associated with stock options in its Consolidated Statements of Operations based on the grant date fair value of those awards. The fair value of each stock option on the date of grant is estimated using the Black-Scholes pricing
66
model based on certain valuation assumptions. Expected stock price volatility is based on the Company’s historical stock prices over the contractual term of the option grant and other factors. The risk-free interest rate used is based on the published U.S. Treasury yield curve in effect at the time of the option grant for instruments with a similar life. The dividend yield reflects the Company’s expected dividend yield at the date of grant. The expected option life represents the period of time that the stock options are expected to be outstanding, taking into consideration the contractual term of the option grant and employee historical exercise behavior. The Company generally recognizes stock option compensation expense ratably over the award’s vesting period.
Income Taxes
Income tax expense includes U.S. and foreign income taxes, plus a provision for U.S. taxes on undistributed earnings of foreign subsidiaries not deemed to be permanently invested. Deferred income taxes are provided on elements of income that are recognized for financial accounting purposes in periods different from periods recognized for income tax purposes. The Company’s policy is to recognize interest and penalties related to income tax matters as a component of income tax expense. Further information regarding income taxes can be found in Note 6, Income Taxes.
Redeemable Noncontrolling Interests
As further detailed in Note 11, Redeemable Noncontrolling Interests, the holders of equity interests in certain of the Company’s subsidiaries have rights (“Put Rights”) that require the Company to provide cash consideration for their equity interests (the “Redemption Amount”) at fair value or at a formula that management intended to reasonably approximate fair value based solely on a multiple of future earnings over a measurement period. The Put Rights are embedded in the shares owned by the noncontrolling interest holders and are not freestanding.
The Company tracks the carrying cost of such redeemable noncontrolling interests at historical cost plus an allocation of subsidiary earnings based on ownership interest, less dividends paid to the noncontrolling interest holders. Redeemable noncontrolling interests are recorded outside of permanent equity at the higher of their carrying cost or management’s estimate of the Redemption Amount. The initial adjustment to record redeemable noncontrolling interests at the Redemption Amount results in a corresponding decrease to retained earnings. Subsequent adjustments to the Redemption Amount of redeemable noncontrolling interests may result in corresponding decreases or increases to retained earnings, provided any increases to retained earnings may only be recorded to the extent of decreases previously recorded. Adjustments to Redemption Amounts based on fair value will have no effect on net income per share attributable to HEICO shareholders whereas the portion of periodic adjustments to the carrying amount of redeemable noncontrolling interests based solely on a multiple of future earnings that reflect a redemption amount in excess of fair value will affect net income per share attributable to HEICO shareholders. Acquisitions of redeemable noncontrolling interests are treated as equity transactions.
67
Net Income per Share Attributable to HEICO Shareholders
Basic net income per share attributable to HEICO shareholders is computed by dividing net income attributable to HEICO by the weighted average number of common shares outstanding during the period. Diluted net income per share attributable to HEICO shareholders is computed by dividing net income attributable to HEICO by the weighted average number of common shares outstanding during the period plus potentially dilutive common shares arising from the assumed exercise of stock options, if dilutive. The dilutive impact of potentially dilutive common shares is determined by applying the treasury stock method.
Foreign Currency
All assets and liabilities of foreign subsidiaries that do not utilize the U.S. dollar as its functional currency are translated at period-end exchange rates, while revenue and expenses are translated using average exchange rates for the period. Unrealized translation gains or losses are reported as foreign currency translation adjustments through other comprehensive income or (loss) in shareholders’ equity. Transaction gains or losses related to balances denominated in a currency other than the functional currency are recorded in the Company's Consolidated Statements of Operations.
Contingencies
Losses for contingencies such as product warranties, litigation and environmental matters are recognized in income when they are probable and can be reasonably estimated. Gain contingencies are not recognized in income until they have been realized.
New Accounting Pronouncements
In May 2014, the Financial Accounting Standards Board ("FASB") issued Accounting Standards Update ("ASU") 2014-09, “Revenue from Contracts with Customers,” which provides a comprehensive new revenue recognition model that will supersede nearly all existing revenue recognition guidance. Under ASU 2014-09, an entity will recognize revenue when it transfers promised goods or services to a customer at an amount that reflects the consideration it expects to receive in exchange for those goods or services. The guidance also requires additional disclosure about the nature, amount, timing and uncertainty of revenue and cash flows arising from customer contracts. ASU 2014-09, as amended, is effective for fiscal years and interim reporting periods within those years beginning after December 15, 2017, or in fiscal 2019 for HEICO. Early adoption in the year preceding the effective date is permitted. ASU 2014-09 shall be applied either retrospectively to each prior reporting period presented or retrospectively with the cumulative effect of initially applying ASU 2014-09 recognized at the date of initial application. The Company is currently evaluating which transition method it will elect. In addition, the Company is currently identifying its various revenue streams and reviewing certain underlying customer contracts to determine the effect the adoption of this guidance will have on its consolidated results of operations, financial position and cash flows.
68
In July 2015, the FASB issued ASU 2015-11, "Simplifying the Measurement of Inventory,” which requires entities to measure inventories at the lower of cost or net realizable value. Under current guidance, inventories are measured at the lower of cost or market. ASU 2015-11 must be applied prospectively and is effective for fiscal years and interim reporting periods within those years beginning after December 15, 2016, or in fiscal 2018 for HEICO. The Company is currently evaluating the effect, if any, the adoption of this guidance will have on its consolidated results of operations, financial position and cash flows.
In November 2015, the FASB issued ASU 2015-17, "Balance Sheet Classification of Deferred Taxes," which requires that all deferred tax assets and liabilities be classified as noncurrent in the balance sheet. The Company adopted ASU 2015-17 on a retrospective basis in the fourth quarter of fiscal 2017, resulting in a reclassification of $41.1 million in current deferred tax assets to noncurrent deferred tax liabilities in the Company's Consolidated Balance Sheet as of October 31, 2016.
In February 2016, the FASB issued ASU 2016-02, “Leases," which requires recognition of lease assets and lease liabilities on the balance sheet of lessees. ASU 2016-02 is effective for fiscal years and interim reporting periods within those years beginning after December 15, 2018, or in fiscal 2020 for HEICO. Early adoption is permitted. ASU 2016-02 requires a modified retrospective transition approach and provides certain optional transition relief. The Company is currently evaluating the effect the adoption of this guidance will have on its consolidated results of operations, financial position and cash flows.
In March 2016, the FASB issued ASU 2016-09, "Improvements to Employee Share-Based Payment Accounting," which simplifies several aspects related to accounting for share-based payment transactions. Under ASU 2016-09, all excess tax benefits and tax deficiencies are to be recognized in the statement of operations as a component of income tax expense rather than as capital in excess of par value. The Company adopted ASU 2016-09 in the first quarter of fiscal 2017 resulting in the recognition of a $3.1 million discrete income tax benefit, which, net of noncontrolling interests, increased net income attributable to HEICO by $2.6 million. Additionally, ASU 2016-09 requires excess tax benefits and deficiencies to be prospectively excluded from the assumed future proceeds in the calculation of diluted shares, which increased the Company's weighted average number of diluted common shares outstanding by 781,000 for fiscal 2017. Further, ASU 2016-09 requires excess tax benefits be presented within the statement of cash flows as an operating activity rather than as a financing activity. The Company adopted this change on a prospective basis, which resulted in a $3.1 million increase in cash provided by operating activities and a $3.1 million decrease in cash provided by financing activities in fiscal 2017.
In August 2016, the FASB issued ASU 2016-15, "Classification of Certain Cash Receipts and Cash Payments," which clarifies how certain cash receipts and cash payments are to be presented and classified in the statement of cash flows. ASU 2016-15 provides guidance on eight specific cash flow classification issues including contingent consideration payments made after a business combination, proceeds from corporate-owned life insurance policies and distributions received from equity method investees. ASU 2016-15 is effective for fiscal years
69
and interim reporting periods within those years beginning after December 15, 2017, or in fiscal 2019 for HEICO. Early adoption is permitted. ASU 2016-15 requires a retrospective transition approach for all periods presented. The Company is currently evaluating the effect the adoption of this guidance will have on its consolidated statement of cash flows.
In January 2017, the FASB issued ASU 2017-04, "Simplifying the Test for Goodwill Impairment," which is intended to simplify the current test for goodwill impairment by eliminating the second step in which the implied value of a reporting unit is calculated when the carrying value of the reporting unit exceeds its fair value. Under ASU 2017-04, goodwill impairment should be recognized for the amount by which a reporting unit’s carrying value exceeds its fair value, not to exceed the carrying amount of goodwill. ASU 2017-04 must be applied prospectively and is effective for any annual or interim goodwill impairment test in fiscal years beginning after December 15, 2019, or in fiscal 2021 for HEICO. Early adoption is permitted. The Company does not expect the adoption of this guidance to have a material impact on its consolidated results of operations, financial position and cash flows.
2. ACQUISITIONS
AAT Acquisition
On September 15, 2017, the Company, through HEICO Electronic, acquired all of the outstanding stock of AeroAntenna Technology, Inc. ("AAT"). The purchase price of this acquisition was paid in cash using proceeds from the Company's revolving credit facility. AAT designs and produces high performance active antenna systems for commercial aircraft, precision guided munitions, other defense applications and commercial uses. The Company believes that this acquisition is consistent with HEICO’s practice of acquiring high quality niche designers and manufacturers who also focus on customer needs and will further enable the Company to broaden its product offerings, technologies and customer base.
The following table summarizes the total consideration for the acquisition of AAT (in thousands):
Cash paid | $317,500 | ||
Less: cash acquired | (868 | ) | |
Cash paid, net | 316,632 | ||
Contingent consideration | 13,797 | ||
Additional purchase consideration | 220 | ||
Total consideration | $330,649 | ||
As noted in the table above, the total consideration includes an accrual of $13.8 million representing the estimated fair value of contingent consideration the Company may be obligated to pay should AAT meet certain earnings objectives during the first six years following the acquisition. See Note 7, Fair Value Measurements, for additional information regarding the Company's contingent consideration obligation.
70
The following table summarizes the allocation of the total consideration for the acquisition of AAT to the estimated fair values of the tangible and identifiable intangible assets acquired and liabilities assumed (in thousands):
Assets acquired: | |||
Goodwill | $160,903 | ||
Customer relationships | 100,000 | ||
Intellectual property | 39,000 | ||
Trade name | 20,000 | ||
Accounts receivable | 6,115 | ||
Inventories | 5,923 | ||
Property, plant and equipment | 1,246 | ||
Other assets | 208 | ||
Total assets acquired, excluding cash | 333,395 | ||
Liabilities assumed: | |||
Accounts payable | 1,290 | ||
Accrued expenses | 1,456 | ||
Total liabilities assumed | 2,746 | ||
Net assets acquired, excluding cash | $330,649 | ||
The allocation of the total consideration to the tangible and identifiable intangible assets acquired and liabilities assumed is preliminary until the Company obtains final information regarding their fair values. However, the Company does not expect any adjustments to such allocations to be material to the Company's consolidated financial statements. The primary items that generated the goodwill recognized were the premiums paid by the Company for the future earnings potential of AAT and the value of its assembled workforce that do not qualify for separate recognition. The amortization period of the customer relationships, intellectual property and trade name acquired is 15 years, 15 years and indefinite, respectively. The operating results of AAT were included in the Company’s results of operations from the effective acquisition date.
The Company's consolidated net sales and net income attributable to HEICO for the fiscal year ended October 31, 2017 includes $10.2 million and $2.5 million, respectively from the acquisition of AAT.
71
The following table presents unaudited pro forma financial information for fiscal 2017 and fiscal 2016 as if the acquisition of AAT had occurred as of November 1, 2015 (in thousands, except per share data):
Year ended October 31, 2017 | Year ended October 31, 2016 | ||||||
Net sales | $1,582,653 | $1,428,336 | |||||
Net income from consolidated operations | $220,419 | $185,070 | |||||
Net income attributable to HEICO | $198,744 | $165,112 | |||||
Net income per share attributable to HEICO shareholders: | |||||||
Basic | $2.36 | $1.97 | |||||
Diluted | $2.29 | $1.94 | |||||
The pro forma financial information is presented for comparative purposes only and is not necessarily indicative of the results of operations that actually would have been achieved if the acquisition had taken place as of November 1, 2015. The unaudited pro forma financial information includes adjustments to historical amounts such as additional amortization expense related to intangible assets acquired, increased interest expense associated with borrowings to finance the acquisition and inventory purchase accounting adjustments charged to cost of sales as the inventory is sold.
Robertson Acquisition
On January 11, 2016, the Company, through HEICO Electronic, acquired all of the limited liability company interests of Robertson Fuel Systems, LLC ("Robertson"). The purchase price of this acquisition was paid in cash using proceeds from the Company’s revolving credit facility. Robertson designs and produces mission-extending, crashworthy and ballistically self-sealing auxiliary fuel systems for military rotorcraft. The Company believes that this acquisition is consistent with HEICO’s practice of acquiring outstanding niche designers and manufacturers of critical components in the defense industry and will further enable the Company to broaden its product offerings, technologies and customer base.
The following table summarizes the total consideration for the acquisition of Robertson (in thousands):
Cash paid | $256,293 | ||
Less: cash acquired | (3,271 | ) | |
Total consideration | $253,022 | ||
72
The following table summarizes the allocation of the total consideration for the acquisition of Robertson to the estimated fair values of the tangible and identifiable intangible assets acquired and liabilities assumed (in thousands):
Assets acquired: | |||
Goodwill | $93,425 | ||
Customer relationships | 55,100 | ||
Intellectual property | 39,600 | ||
Trade name | 28,400 | ||
Inventories | 27,417 | ||
Property, plant and equipment | 7,476 | ||
Accounts receivable | 4,973 | ||
Other assets | 1,884 | ||
Total assets acquired, excluding cash | 258,275 | ||
Liabilities assumed: | |||
Accounts payable | 4,606 | ||
Accrued expenses | 647 | ||
Total liabilities assumed | 5,253 | ||
Net assets acquired, excluding cash | $253,022 | ||
The primary items that generated the goodwill recognized were the premiums paid by the Company for the future earnings potential of Robertson and the value of its assembled workforce that do not qualify for separate recognition. The amortization period of the customer relationships, intellectual property and trade name acquired is 15 years, 22 years and indefinite, respectively. Acquisition costs associated with the purchase of Robertson totaled $3.1 million in fiscal 2016 and were recorded as a component of SG&A expenses in the Company's Consolidated Statements of Operations. The operating results of Robertson were included in the Company’s results of operations from the effective acquisition date. The Company's consolidated net sales and net income attributable to HEICO for the fiscal year ended October 31, 2016 includes $84.1 million and $12.3 million, respectively, from the acquisition of Robertson, exclusive of the aforementioned acquisition costs.
The following table presents unaudited pro forma financial information for fiscal 2015 as if the acquisition of Robertson had occurred as of November 1, 2014 (in thousands, except per share data):
Year ended October 31, 2015 | ||||
Net sales | $1,275,926 | |||
Net income from consolidated operations | $162,645 | |||
Net income attributable to HEICO | $142,445 | |||
Net income per share attributable to HEICO shareholders: | ||||
Basic | $1.71 | |||
Diluted | $1.68 | |||
73
The pro forma financial information is presented for comparative purposes only and is not necessarily indicative of the results of operations that actually would have been achieved if the acquisition had taken place as of November 1, 2014. The unaudited pro forma financial information includes adjustments to historical amounts such as additional amortization expense related to intangible assets acquired, increased interest expense associated with borrowings to finance the acquisition, the reclassification of acquisition costs associated with the purchase of Robertson from fiscal 2016 to fiscal 2015, and inventory purchase accounting adjustments charged to cost of sales as the inventory is sold. Had the acquisition of Robertson been consummated as of November 1, 2014, net sales, net income from consolidated operations, net income attributable to HEICO, and basic and diluted net income per share attributable to HEICO shareholders on a pro forma basis for fiscal 2016 would not have been materially different than the reported amounts.
Other Acquisitions
In June 2017, the Company, through a subsidiary of the HEICO Flight Support Corp., acquired all of the ownership interests of Carbon by Design ("CBD"). CBD is a manufacturer of composite components for UAVs, rockets, spacecraft and other specialized applications. The purchase price of CBD was paid using cash provided by operating activities.
In April 2017, the Company, through a subsidiary of HEICO Flight Support Corp., acquired 80.1% of the equity interests of LLP Enterprises, LLC, which owns all of the outstanding equity interests of the operating units of Air Cost Control ("A2C"). A2C is a leading aviation electrical interconnect product distributor of items such as connectors, wire, cable, protection and fastening systems, in addition to distributing a wide range of electromechanical parts. The remaining 19.9% interest continues to be owned by certain members of A2C's management team (see Note 11, Redeemable Noncontrolling Interests, for additional information).
In December 2015, the Company, through a subsidiary of HEICO Electronic, acquired certain assets of a company that designs and manufactures underwater locator beacons used to locate aircraft cockpit voice recorders, flight data recorders, marine ship voyage recorders and other devices which have been submerged under water. The total consideration includes an accrual representing the estimated fair value of contingent consideration the Company may be obligated to pay in aggregate during the first five years following the acquisition. See Note 7, Fair Value Measurements, for additional information regarding the Company's contingent consideration obligation. The purchase price of this acquisition was paid using cash provided by operating activities.
In August 2015, the Company, through HEICO Flight Support Corp., acquired all of the stock of Astroseal Products Mfg. Corporation (“Astroseal”). Astroseal manufactures expanded foil mesh, which is integrated into composite aerospace structures for lightning strike protection in fixed and rotary wing aircraft.
74
In August 2015, the Company, through HEICO Electronic, acquired 80.1% of the equity of Midwest Microwave Solutions, Inc. (“MMS”). MMS designs, manufactures and sells unique Size, Weight, Power and Cost (SWAP-C) optimized Communications and Electronic Intercept Receivers and Tuners for military and intelligence applications. The remaining 19.9% continues to be owned by certain members of MMS’ management team (see Note 11, Redeemable Noncontrolling Interests, for additional information).
In August 2015, the Company, through HEICO Flight Support Corp., acquired 80.1% of the assets and assumed certain liabilities of Aerospace & Commercial Technologies, LLC (“ACT”). ACT is a provider of products and services necessary to maintain up-to-date F-16 fighter aircraft operational capabilities. The remaining 19.9% continues to be owned by certain members of ACT’s management team (see Note 11, Redeemable Noncontrolling Interests, for additional information).
In May 2015, the Company, through a subsidiary of HEICO Flight Support Corp., acquired all of the stock of Thermal Energy Products, Inc. (“TEP”). TEP engineers, designs and manufactures removable/reusable insulation systems for industrial, commercial, aerospace and defense applications.
In January 2015, the Company, through HEICO Flight Support Corp., acquired 80.1% of the equity of Harter Aerospace, LLC ("Harter"). Harter is a globally recognized component and accessory maintenance, repair, and overhaul (MRO) station specializing in commercial aircraft accessories, including thrust reverse actuation systems and pneumatics, and electromechanical components. The remaining 19.9% interest continues to be owned by certain members of Harter's management team (see Note 11, Redeemable Noncontrolling Interests, for additional information).
In January 2015, the Company, through HEICO Flight Support Corp., acquired 80% of the equity of Aeroworks International Holding B.V. (“Aeroworks”). Aeroworks, which is headquartered in the Netherlands and maintains a significant portion of its production facilities in Thailand and Laos, is a manufacturer of both composite and metal parts used primarily in aircraft interior applications, including seating, galleys, lavatories, doors, and overhead bins. The remaining 20% interest continues to be owned by a certain member of Aeroworks' management team (see Note 11, Redeemable Noncontrolling Interests, for additional information). The total consideration includes an accrual representing the estimated fair value of contingent consideration that the Company may be obligated to pay should Aeroworks meet certain earnings objectives during each of the first four years following the acquisition. See Note 7, Fair Value Measurements, for additional information regarding the Company’s contingent consideration obligation.
Unless otherwise noted, the purchase price of each of the above referenced other acquisitions was paid in cash, principally using proceeds from the Company's revolving credit facility, and is not material or significant to the Company's consolidated financial statements.
75
The following table summarizes the aggregate total consideration for the Company's other acquisitions (in thousands):
Year ended October 31, | |||||||||||
2017 | 2016 | 2015 | |||||||||
Cash paid | $109,345 | $11,000 | $171,829 | ||||||||
Less: cash acquired | (7,712 | ) | — | (5,062 | ) | ||||||
Cash paid, net | 101,633 | 11,000 | 166,767 | ||||||||
Contingent consideration | — | 1,225 | 21,355 | ||||||||
Additional purchase consideration | — | — | (211 | ) | |||||||
Total consideration | $101,633 | $12,225 | $187,911 | ||||||||
The following table summarizes the allocation of the aggregate total consideration for the Company's other acquisitions to the estimated fair values of the tangible and identifiable intangible assets acquired and liabilities and noncontrolling interests assumed (in thousands):
Year ended October 31, | |||||||||||
2017 | 2016 | 2015 | |||||||||
Assets acquired: | |||||||||||
Goodwill | $48,960 | $6,876 | $88,602 | ||||||||
Customer relationships | 29,500 | 2,800 | 58,410 | ||||||||
Trade names | 16,750 | 300 | 14,094 | ||||||||
Intellectual property | 1,950 | 2,000 | 29,177 | ||||||||
Licenses | — | — | 1,300 | ||||||||
Inventories | 27,271 | 249 | 18,055 | ||||||||
Accounts receivable | 15,169 | — | 10,719 | ||||||||
Property, plant and equipment | 4,503 | — | 16,031 | ||||||||
Other assets | 976 | — | 2,547 | ||||||||
Total assets acquired, excluding cash | 145,079 | 12,225 | 238,935 | ||||||||
Liabilities assumed: | |||||||||||
Accounts payable | 7,696 | — | 4,845 | ||||||||
Accrued expenses | 6,016 | — | 2,570 | ||||||||
Deferred income taxes | 4,984 | — | 6,764 | ||||||||
Other liabilities | 1,411 | — | 621 | ||||||||
Total liabilities assumed | 20,107 | — | 14,800 | ||||||||
Noncontrolling interests in consolidated subsidiaries | 23,339 | — | 36,224 | ||||||||
Net assets acquired, excluding cash | $101,633 | $12,225 | $187,911 | ||||||||
76
The following table summarizes the weighted average amortization period of the definite-lived intangible assets acquired in connection with the Company's other fiscal 2017, 2016 and 2015 acquisitions (in years):
Year ended October 31, | |||||
2017 | 2016 | 2015 | |||
Customer relationships | 12 | 11 | 10 | ||
Trade names | — | 15 | — | ||
Intellectual property | 13 | 15 | 12 | ||
Licenses | — | — | 11 | ||
The allocation of the total consideration of the Company's other fiscal 2017 acquisitions to the tangible and identifiable intangible assets acquired and liabilities and noncontrolling interests assumed is preliminary until the Company obtains final information regarding their fair values. However, the Company does not expect any adjustments to such allocations to be material to the Company's consolidated financial statements. The primary items that generated the goodwill recognized were the premiums paid by the Company for the future earnings potential of the businesses acquired and the value of their assembled workforces that do not qualify for separate recognition, which, in the case of A2C, MMS, ACT, Harter and Aeroworks benefit both the Company and the noncontrolling interest holders. The fair value of the noncontrolling interests in A2C, MMS, ACT, Harter and Aeroworks was determined based on the consideration paid by the Company for its controlling ownership interest adjusted for a lack of control that a market participant would consider when estimating the fair value of the noncontrolling interest.
The operating results of the Company's other fiscal 2017 acquisitions were included in the Company's results of operations from each of the effective acquisition dates. The Company's consolidated net sales for the fiscal year ended October 31, 2017 includes $49.0 million from the other fiscal 2017 acquisitions. The amount of earnings of the other fiscal 2017 acquisitions included in the Company's results of operations for the fiscal year ended October 31, 2017 is not material. Had the acquisitions occurred as of November 1, 2015, net sales on a pro forma basis for fiscal 2017 would not have been materially different than the reported amounts and net sales on a pro forma basis for fiscal 2016 would have been $1,464.5 million. Net income from consolidated operations, net income attributable to HEICO, and basic and diluted net income per share attributable to HEICO shareholders on a pro forma basis for fiscal 2017 and 2016 would not have been materially different than the reported amounts. The pro forma financial information is presented for comparative purposes only and is not necessarily indicative of the results of operations that actually would have been achieved if the acquisitions had taken place as of November 1, 2015.
The operating results of the Company's other fiscal 2016 acquisition were included in the Company's results of operations from the effective acquisition date. The amount of net sales and earnings of the Company's other fiscal 2016 acquisition included in the Consolidated Statement of Operations is not material. Had the other fiscal 2016 acquisition occurred as of November 1, 2014, net sales, net income from consolidated operations, net income attributable to HEICO, and
77
basic and diluted net income per share attributable to HEICO shareholders on a pro forma basis for fiscal 2016 and 2015 would not have been materially different than the reported amounts.
The operating results of the Company’s fiscal 2015 acquisitions were included in the Company’s results of operations from each of the effective acquisition dates. The Company’s consolidated net sales and net income attributable to HEICO for fiscal 2015 includes approximately $62.9 million and $7.9 million, respectively, from the fiscal 2015 acquisitions.
The following table presents unaudited pro forma financial information for fiscal 2015 as if the Company's fiscal 2015 acquisitions had occurred as of November 1, 2013 (in thousands, except per share data):
Year ended October 31, 2015 | |||
Net sales | $1,244,911 | ||
Net income from consolidated operations | $163,012 | ||
Net income attributable to HEICO | $140,771 | ||
Net income per share attributable to HEICO shareholders: | |||
Basic | $1.69 | ||
Diluted | $1.66 | ||
The pro forma financial information is presented for comparative purposes only and is not necessarily indicative of the results of operations that actually would have been achieved if the fiscal 2015 acquisitions had taken place as of November 1, 2013. The unaudited pro forma financial information includes adjustments to historical amounts such as additional amortization expense related to intangible assets acquired, increased interest expense associated with borrowings to finance the acquisitions and inventory purchase accounting adjustments charged to cost of sales as the inventory is sold.
3. SELECTED FINANCIAL STATEMENT INFORMATION
Accounts Receivable
As of October 31, | ||||||||
(in thousands) | 2017 | 2016 | ||||||
Accounts receivable | $225,462 | $205,386 | ||||||
Less: Allowance for doubtful accounts | (3,006 | ) | (3,159 | ) | ||||
Accounts receivable, net | $222,456 | $202,227 | ||||||
78
Costs and Estimated Earnings on Uncompleted Percentage-of-Completion Contracts
As of October 31, | ||||||||
(in thousands) | 2017 | 2016 | ||||||
Costs incurred on uncompleted contracts | $29,491 | $19,086 | ||||||
Estimated earnings | 19,902 | 13,887 | ||||||
49,393 | 32,973 | |||||||
Less: Billings to date | (41,262 | ) | (39,142 | ) | ||||
$8,131 | ($6,169 | ) | ||||||
Included in the accompanying Consolidated Balance Sheets under the following captions: | ||||||||
Accounts receivable, net (costs and estimated earnings in excess of billings) | $9,377 | $4,839 | ||||||
Accrued expenses and other current liabilities (billings in excess of costs and estimated earnings) | (1,246 | ) | (11,008 | ) | ||||
$8,131 | ($6,169 | ) | ||||||
Changes in estimates pertaining to percentage-of-completion contracts did not have a material effect on net income from consolidated operations in fiscal 2017, 2016 or 2015.
Inventories
As of October 31, | ||||||||
(in thousands) | 2017 | 2016 | ||||||
Finished products | $173,559 | $131,008 | ||||||
Work in process | 39,986 | 36,076 | ||||||
Materials, parts, assemblies and supplies | 128,031 | 117,153 | ||||||
Contracts in process | 2,415 | 3,253 | ||||||
Less: Billings to date | (363 | ) | (1,188 | ) | ||||
Inventories, net of valuation reserves | $343,628 | $286,302 | ||||||
Contracts in process represents accumulated capitalized costs associated with fixed price contracts. Related progress billings and customer advances (“billings to date”) are classified as a reduction to contracts in process, if any, and any excess is included in accrued expenses and other liabilities.
79
Property, Plant and Equipment
As of October 31, | ||||||||
(in thousands) | 2017 | 2016 | ||||||
Land | $5,435 | $5,090 | ||||||
Buildings and improvements | 91,916 | 79,205 | ||||||
Machinery, equipment and tooling | 191,298 | 171,717 | ||||||
Construction in progress | 5,553 | 10,453 | ||||||
294,202 | 266,465 | |||||||
Less: Accumulated depreciation and amortization | (164,319 | ) | (144,854 | ) | ||||
Property, plant and equipment, net | $129,883 | $121,611 | ||||||
The amounts set forth above include tooling costs having a net book value of $7.6 million and $7.7 million as of October 31, 2017 and 2016, respectively. Amortization expense on capitalized tooling was $2.7 million, $2.9 million and $2.4 million in fiscal 2017, 2016 and 2015, respectively.
The amounts set forth above also include $4.8 million of assets under capital leases as of both October 31, 2017 and October 31, 2016. Accumulated depreciation associated with assets under capital leases was $1.0 million and $.9 million as of October 31, 2017 and October 31, 2016, respectively. See Note 5, Long-Term Debt, for additional information pertaining to capital lease obligations.
Depreciation and amortization expense, exclusive of tooling, on property, plant and equipment was $21.9 million, $20.4 million and $17.8 million in fiscal 2017, 2016 and 2015, respectively.
Accrued Expenses and Other Current Liabilities
As of October 31, | ||||||||
(in thousands) | 2017 | 2016 | ||||||
Accrued employee compensation and related payroll taxes | $78,058 | $67,660 | ||||||
Deferred revenue | 29,247 | 32,135 | ||||||
Accrued customer rebates and credits | 12,866 | 11,881 | ||||||
Contingent consideration and other accrued purchase consideration | 7,588 | 6,918 | ||||||
Other | 19,853 | 17,459 | ||||||
Accrued expenses and other current liabilities | $147,612 | $136,053 | ||||||
The increase in accrued employee compensation and related payroll taxes principally reflects a higher level of accrued performance-based compensation based on the improved consolidated operating results and the impact from our fiscal 2017 acquisitions. The total customer rebates and credits deducted within net sales in fiscal 2017, 2016 and 2015 was $11.0 million, $10.8 million and $4.7 million, respectively.
80
Other Long-Term Assets and Liabilities
The Company provides eligible employees, officers and directors of the Company the opportunity to voluntarily defer base salary, bonus payments, commissions, long-term incentive awards and directors fees, as applicable, on a pre-tax basis through the HEICO Corporation Leadership Compensation Plan (“LCP”), a nonqualified deferred compensation plan that conforms to Section 409A of the Internal Revenue Code. The Company matches 50% of the first 6% of base salary deferred by each participant. Director fees that would otherwise be payable in Company common stock may be deferred into the LCP, and, when distributable, are distributed in actual shares of Company common stock. The LCP does not provide for diversification of a director’s assets allocated to Company common stock. The deferred compensation obligation associated with Company common stock is recorded as a component of shareholders’ equity at cost and subsequent changes in fair value are not reflected in operations or shareholders’ equity of the Company. Further, while the Company has no obligation to do so, the LCP also provides the Company the opportunity to make discretionary contributions. The Company’s matching contributions and any discretionary contributions are subject to vesting and forfeiture provisions set forth in the LCP. Company contributions to the LCP charged to income in fiscal 2017, 2016 and 2015 totaled $4.6 million, $6.8 million and $5.7 million, respectively. The aggregate liabilities of the LCP were $116.0 million and $87.9 million as of October 31, 2017 and 2016, respectively, and are classified within other long-term liabilities in the Company’s Consolidated Balance Sheets. The assets of the LCP, totaling $117.2 million and $88.5 million as of October 31, 2017 and 2016, respectively, are classified within other assets and principally represent cash surrender values of life insurance policies that are held within an irrevocable trust that may be used to satisfy the obligations under the LCP.
Other long-term liabilities also includes deferred compensation of $5.7 million and $4.7 million as of October 31, 2017 and 2016, respectively, principally related to elective deferrals of salary and bonuses under a Company sponsored non-qualified deferred compensation plan formerly available to selected employees. The Company makes no contributions to this plan. The assets of this plan, which equaled the deferred compensation liability as of October 31, 2017 and 2016, respectively, are held within an irrevocable trust and classified within other assets in the Company’s Consolidated Balance Sheets. Additional information regarding the assets of this deferred compensation plan and the LCP may be found in Note 7, Fair Value Measurements.
Research and Development Expenses
The amount of new product research and development ("R&D") expenses included in cost of sales is as follows (in thousands):
Year ended October 31, | |||||||||||
2017 | 2016 | 2015 | |||||||||
R&D expenses | $46,473 | $44,726 | $38,747 | ||||||||
81
Accumulated Other Comprehensive Loss
Changes in the components of accumulated other comprehensive loss during fiscal 2017 and 2016 are as follows (in thousands):
Foreign Currency Translation | Pension Benefit Obligation | Accumulated Other Comprehensive Loss | |||||||||
Balances as of October 31, 2015 | ($24,368 | ) | ($712 | ) | ($25,080 | ) | |||||
Unrealized gain (loss) | 415 | (661 | ) | (246 | ) | ||||||
Balances as of October 31, 2016 | (23,953 | ) | (1,373 | ) | (25,326 | ) | |||||
Unrealized gain | 14,420 | 321 | 14,741 | ||||||||
Amortization of unrealized loss | — | 29 | 29 | ||||||||
Balances as of October 31, 2017 | ($9,533 | ) | ($1,023 | ) | ($10,556 | ) | |||||
4. GOODWILL AND OTHER INTANGIBLE ASSETS
Changes in the carrying amount of goodwill during fiscal 2017 and 2016 by operating segment are as follows (in thousands):
Segment | Consolidated | ||||||||||
FSG | ETG | Totals | |||||||||
Balances as of October 31, 2015 | $337,507 | $429,132 | $766,639 | ||||||||
Goodwill acquired | — | 100,301 | 100,301 | ||||||||
Foreign currency translation adjustments | (256 | ) | (425 | ) | (681 | ) | |||||
Adjustments to goodwill | (570 | ) | 28 | (542 | ) | ||||||
Balances as of October 31, 2016 | 336,681 | 529,036 | 865,717 | ||||||||
Goodwill acquired | 48,960 | 160,903 | 209,863 | ||||||||
Foreign currency translation adjustments | 2,965 | 2,761 | 5,726 | ||||||||
Balances as of October 31, 2017 | $388,606 | $692,700 | $1,081,306 | ||||||||
The goodwill acquired during fiscal 2017 and 2016 relates to the acquisitions consummated in those respective years as described in Note 2, Acquisitions, and represents the residual value after the allocation of the total consideration to the tangible and identifiable intangible assets acquired and liabilities and noncontrolling interests assumed. Foreign currency translation adjustments are included in other comprehensive income (loss) in the Company's Consolidated Statements of Comprehensive Income. The adjustments to goodwill represent immaterial measurement period adjustments to the purchase price allocation of certain fiscal 2015 acquisitions. The Company estimates that the majority of the goodwill acquired in fiscal 2017 and all of the goodwill acquired in fiscal 2016 is deductible for income tax purposes. Based on the annual test for goodwill impairment as of October 31, 2017, the Company determined there is no impairment of its goodwill and the fair value of each of the Company’s reporting units significantly exceeded their carrying value.
82
Identifiable intangible assets consist of the following (in thousands):
As of October 31, 2017 | As of October 31, 2016 | ||||||||||||||||||||||
Gross Carrying Amount | Accumulated Amortization | Net Carrying Amount | Gross Carrying Amount | Accumulated Amortization | Net Carrying Amount | ||||||||||||||||||
Amortizing Assets: | |||||||||||||||||||||||
Customer relationships | $379,966 | ($117,069 | ) | $262,897 | $248,271 | ($88,829 | ) | $159,442 | |||||||||||||||
Intellectual property | 181,811 | (44,861 | ) | 136,950 | 139,817 | (33,291 | ) | 106,526 | |||||||||||||||
Licenses | 6,559 | (2,928 | ) | 3,631 | 6,559 | (2,325 | ) | 4,234 | |||||||||||||||
Patents | 870 | (551 | ) | 319 | 779 | (480 | ) | 299 | |||||||||||||||
Non-compete agreements | 817 | (817 | ) | — | 811 | (811 | ) | — | |||||||||||||||
Trade names | 466 | (118 | ) | 348 | 466 | (77 | ) | 389 | |||||||||||||||
570,489 | (166,344 | ) | 404,145 | 396,703 | (125,813 | ) | 270,890 | ||||||||||||||||
Non-Amortizing Assets: | |||||||||||||||||||||||
Trade names | 133,936 | — | 133,936 | 95,973 | — | 95,973 | |||||||||||||||||
$704,425 | ($166,344 | ) | $538,081 | $492,676 | ($125,813 | ) | $366,863 | ||||||||||||||||
The increase in the gross carrying amount of customer relationships, intellectual property and non-amortizing trade names as of October 31, 2017 compared to October 31, 2016 principally relates to such intangible assets recognized in connection with the fiscal 2017 acquisitions (see Note 2, Acquisitions).
Amortization expense related to intangible assets was $39.5 million, $36.4 million and $27.0 million in fiscal 2017, 2016 and 2015, respectively. Amortization expense for each of the next five fiscal years and thereafter is estimated to be $48.3 million in fiscal 2018, $46.0 million in fiscal 2019, $43.2 million in fiscal 2020, $40.5 million in fiscal 2021, $35.1 million in fiscal 2022 and $191.0 million thereafter.
5. LONG-TERM DEBT
Long-term debt consists of the following (in thousands):
As of October 31, | |||||||
2017 | 2016 | ||||||
Borrowings under revolving credit facility | $671,000 | $455,083 | |||||
Capital leases and note payable | 2,979 | 3,142 | |||||
673,979 | 458,225 | ||||||
Less: Current maturities of long-term debt | (451 | ) | (411 | ) | |||
$673,528 | $457,814 | ||||||
As of October 31, 2017 and 2016, the weighted average interest rate on borrowings under the Company's revolving credit facility was 2.4% and 1.6%, respectively. The revolving credit facility contains both financial and non-financial covenants. As of October 31, 2017, the Company was in compliance with all such covenants.
83
As of October 31, 2017, the Company's borrowings under its revolving credit facility were to mature in fiscal 2019. In November 2017, the Company entered into a new $1.3 billion Revolving Credit Agreement with a bank syndicate, which matures in November 2022 and replaced the prior revolving credit facility (see Revolving Credit Facility below).
During fiscal 2015, the Company elected to borrow €32 million under its revolving credit facility to facilitate a fiscal 2015 acquisition. During fiscal 2017, the Company repaid the full amount of the Euro borrowing.
Revolving Credit Facility
On November 6, 2017, the Company entered into a new $1.3 billion Revolving Credit Facility Agreement ("New Credit Facility") with a bank syndicate, which matures in November 2022. Under certain circumstances, the maturity of the New Credit Facility may be extended for two one-year periods. The New Credit Facility also includes a feature that will allow the Company to increase revolving commitments under the New Credit Facility by $350 million, to become a $1.65 billion facility, through increased commitments from existing lenders or the addition of new lenders. Borrowings under the New Credit Facility may be used to finance acquisitions and for working capital and other general corporate purposes, including capital expenditures. The New Credit Facility replaced the $670 million Revolving Credit Agreement.
Borrowings under the New Credit Facility accrue interest at the Company’s election of the Base Rate or the Eurocurrency Rate, plus in each case, the Applicable Rate (based on the Company’s Total Leverage Ratio). The Base Rate for any day is a fluctuating rate per annum equal to the highest of (i) the Prime Rate; (ii) the Federal Funds Rate plus .50%; and (iii) the Eurocurrency Rate for an Interest Period of one month plus 100 basis points. The Eurocurrency Rate is the rate per annum obtained by dividing LIBOR for the applicable Interest Period by a percentage equal to 1.00 minus the daily average Eurocurrency Reserve Rate for such Interest Period, as such capitalized terms are defined in the New Credit Facility. The Applicable Rate for Eurocurrency Rate Loans ranges from 1.00% to 2.00%. The Applicable Rate for Base Rate Loans ranges from 0% to 1.00%. A fee is charged on the amount of the unused commitment ranging from .125% to .30% (depending on the Company’s Total Leverage Ratio). The New Credit Facility also includes $100 million sublimits for borrowings made in foreign currencies and for swingline borrowings, and a $50 million sublimit for letters of credit. Outstanding principal, accrued and unpaid interest and other amounts payable under the New Credit Facility may be accelerated upon an event of default, as such events are described in the New Credit Facility. The New Credit Facility is unsecured and contains covenants that require, among other things, the maintenance of a Total Leverage Ratio and an Interest Coverage Ratio, as such capitalized terms are defined in the New Credit Facility.
Borrowings under the Company's revolving credit facility as of October 31, 2017 were made under the Company's $670 million Revolving Credit Agreement (“Prior Credit Facility”) with a bank syndicate, which was amended in November 2013 to become an $800 million facility and again in April 2017 to become a $1.0 billion facility. The Prior Credit Facility was
84
available to finance acquisitions and for working capital and other general corporate purposes of the Company, including capital expenditures.
Advances under the Prior Credit Facility accrued interest at the Company’s choice of the “Base Rate” or the London Interbank Offered Rate (“LIBOR”) plus the applicable margin (based on the Company’s ratio of total funded debt to earnings before interest, taxes, depreciation and amortization, noncontrolling interests and non-cash charges, or “leverage ratio”). The Base Rate was the highest of (i) the Prime Rate; (ii) the Federal Funds rate plus .50% per annum; and (iii) the Adjusted LIBO Rate determined on a daily basis for an Interest Period of one month plus 1.00% per annum, as such capitalized terms were defined in the Prior Credit Facility. The applicable margin for a LIBOR-based borrowing ranged from .75% to 2.25%. The applicable margin for a Base Rate borrowing ranged from 0% to 1.25%. A fee was charged on the amount of the unused commitment ranging from .125% to .35% (depending on the Company’s leverage ratio). The Prior Credit Facility also included a $50 million sublimit for borrowings made in foreign currencies, letters of credit and swingline borrowings. Outstanding principal, accrued and unpaid interest and other amounts payable under the Prior Credit Facility may have been accelerated upon an event of default, as such events were described in the Prior Credit Facility. The Prior Credit Facility was unsecured and contained covenants that restricted the amount of certain payments, including dividends, and required, among other things, the maintenance of a total leverage ratio, a senior leverage ratio and a fixed charge coverage ratio. In the event the Company’s leverage ratio exceeded a specified level, the Prior Credit Facility would have become secured by the capital stock owned in substantially all of the Company’s subsidiaries.
Capital Lease Obligations
A subsidiary of HEICO Electronic is a party to a capital lease for a manufacturing facility and related property in France. The lease contains a bargain purchase option and has a twelve-year term, which began in fiscal 2011. Additionally, the subsidiary is a party to certain capital leases, principally for office equipment, with lease terms of approximately five years. Furthermore, a subsidiary of HEICO Flight Support Corp. entered into a ten-year capital lease for a manufacturing facility during fiscal 2016. The estimated future minimum lease payments of all capital leases for the next five fiscal years and thereafter are as follows (in thousands):
Year ending October 31, | |||
2018 | 575 | ||
2019 | 575 | ||
2020 | 525 | ||
2021 | 519 | ||
2022 | 509 | ||
Thereafter | 622 | ||
Total minimum lease payments | 3,325 | ||
Less: amount representing interest | (461 | ) | |
Present value of minimum lease payments | $2,864 | ||
85
6. INCOME TAXES
The components of income before income taxes and noncontrolling interests are as follows (in thousands):
Year ended October 31, | |||||||||||
2017 | 2016 | 2015 | |||||||||
Domestic | $264,420 | $227,927 | $206,612 | ||||||||
Foreign | 33,540 | 29,123 | 18,352 | ||||||||
Income before taxes and noncontrolling interests | $297,960 | $257,050 | $224,964 | ||||||||
The components of the provision for income taxes on income before income taxes and noncontrolling interests are as follows (in thousands):
Year ended October 31, | |||||||||||
2017 | 2016 | 2015 | |||||||||
Current: | |||||||||||
Federal | $85,047 | $75,261 | $65,857 | ||||||||
State | 6,820 | 7,463 | 8,559 | ||||||||
Foreign | 9,529 | 7,370 | 4,064 | ||||||||
101,396 | 90,094 | 78,480 | |||||||||
Deferred: | |||||||||||
Federal | (9,661 | ) | (5,979 | ) | (4,459 | ) | |||||
State | (499 | ) | (2,587 | ) | (1,907 | ) | |||||
Foreign | (936 | ) | (628 | ) | (714 | ) | |||||
(11,096 | ) | (9,194 | ) | (7,080 | ) | ||||||
Total income tax expense | $90,300 | $80,900 | $71,400 | ||||||||
A reconciliation of the federal statutory income tax rate to the Company’s effective tax rate is as follows:
Year ended October 31, | ||||||||
2017 | 2016 | 2015 | ||||||
Federal statutory income tax rate | 35.0 | % | 35.0 | % | 35.0 | % | ||
State taxes, net of federal income tax benefit | 1.9 | % | 1.7 | % | 2.4 | % | ||
Research and development tax credits | (1.8 | %) | (2.7 | %) | (1.9 | %) | ||
Tax-exempt (gains) losses on corporate-owned life insurance policies | (1.8 | %) | (.1 | %) | .1 | % | ||
Domestic production activities tax deduction | (1.1 | %) | (1.3 | %) | (1.2 | %) | ||
Tax benefit related to stock option exercises (ASU 2016-09 adoption) | (1.0 | %) | — | % | — | % | ||
Noncontrolling interests’ share of income | (.7 | %) | (.7 | %) | (1.3 | %) | ||
Foreign tax differential, where permanently reinvested outside of the U.S. | (.4 | %) | (.8 | %) | (.8 | %) | ||
Other, net | .2 | % | .4 | % | (.6 | %) | ||
Effective tax rate | 30.3 | % | 31.5 | % | 31.7 | % | ||
86
The Company’s effective tax rate in fiscal 2017 decreased to 30.3% from 31.5% in fiscal 2016. The decrease principally reflects the favorable impact of higher tax-exempt unrealized gains in the cash surrender values of life insurance policies related to the LCP and a $3.1 million discrete income tax benefit related to stock option exercises resulting from the adoption of ASU 2016-09 in the first quarter of fiscal 2017 (see Note 1, Summary of Significant Accounting Policies - New Accounting Pronouncements). These decreases were partially offset by the benefit recognized in fiscal 2016 from the retroactive and permanent extension of the U.S. federal R&D tax credit that resulted in the recognition of additional income tax credits for qualified R&D activities related to the last ten months of fiscal 2015 and a less favorable benefit in fiscal 2017 from the foreign tax rate differential associated with the undistributed earnings of a fiscal 2015 acquisition.
The Company's effective tax rate in fiscal 2016 decreased to 31.5% from 31.7% in fiscal 2015. The decrease principally reflects the benefits recognized in fiscal 2016 of a larger income tax credit for qualified R&D activities resulting from the retroactive and permanent extension of the U.S. federal R&D tax credit in December 2015 and a lower effective state tax rate driven by certain apportionment updates recognized upon the amendment of certain prior year tax returns in fiscal 2016. These decreases were partially offset by the benefits recognized in fiscal 2015 from a prior year tax return amendment for additional foreign tax credits related to R&D activities at one of our foreign subsidiaries and higher net income attributable to noncontrolling interests in subsidiaries structured as partnerships.
The Company files income tax returns in the U.S. federal jurisdiction and in multiple state jurisdictions. The Company is also subject to income taxes in certain jurisdictions outside the U.S., none of which are individually material to the accompanying consolidated financial statements. Generally, the Company is no longer subject to U.S. federal, state or foreign examinations by tax authorities for years prior to fiscal 2013.
The Company has not made a provision for U.S. income taxes on the undistributed
earnings of a fiscal 2015 foreign acquisition as such earnings are considered permanently
reinvested outside of the U.S. The amount of undistributed earnings is not material to the
Company's consolidated financial statements.
Deferred income taxes reflect the net tax effects of temporary differences between the carrying amounts of assets and liabilities for financial reporting purposes and the amounts used for income tax purposes. The Company believes that it is more likely than not that it will generate sufficient future taxable income to utilize all of its deferred tax assets and has therefore not recorded a valuation allowance on any such asset.
87
Significant components of the Company’s deferred tax assets and liabilities are as follows (in thousands):
As of October 31, | |||||||
2017 | 2016 | ||||||
Deferred tax assets: | |||||||
Deferred compensation liability | $47,093 | $36,134 | |||||
Inventories | 31,797 | 27,969 | |||||
Share-based compensation | 12,984 | 11,338 | |||||
Bonus accrual | 4,956 | 4,744 | |||||
Vacation accrual | 2,112 | 2,127 | |||||
Customer rebates accrual | 1,864 | 1,917 | |||||
Deferred revenue | 730 | 1,365 | |||||
R&D related carryforward | 645 | 2,057 | |||||
Other | 8,585 | 8,489 | |||||
Total deferred tax assets | 110,766 | 96,140 | |||||
Deferred tax liabilities: | |||||||
Goodwill and other intangible assets | (160,158 | ) | (150,185 | ) | |||
Property, plant and equipment | (7,887 | ) | (8,291 | ) | |||
Other | (1,747 | ) | (2,156 | ) | |||
Total deferred tax liabilities | (169,792 | ) | (160,632 | ) | |||
Net deferred tax liability | ($59,026 | ) | ($64,492 | ) | |||
The net deferred tax liability is classified in the Company’s Consolidated Balance Sheets as follows (in thousands) in accordance with ASU 2015-17, which the Company adopted in the fourth quarter of fiscal 2017 on a retrospective basis (see Note 1, Summary of Significant Accounting Policies - New Accounting Pronouncements):
As of October 31, | |||||||
2017 | 2016 | ||||||
Long-term liability | ($59,026 | ) | ($64,899 | ) | |||
Long-term asset | — | 407 | |||||
Net deferred tax liability | ($59,026 | ) | ($64,492 | ) | |||
88
As of October 31, 2017 and 2016, the Company’s liability for gross unrecognized tax benefits related to uncertain tax positions was $2.0 million and $1.6 million, respectively, of which $1.3 million and $1.0 million, respectively, would decrease the Company’s income tax expense and effective income tax rate if the tax benefits were recognized. A reconciliation of the activity related to the liability for gross unrecognized tax benefits during fiscal 2017 and 2016 is as follows (in thousands):
Year ended October 31, | |||||||
2017 | 2016 | ||||||
Balances as of beginning of year | $1,602 | $787 | |||||
Increases related to current year tax positions | 596 | 524 | |||||
Increases related to prior year tax positions | — | 521 | |||||
Decreases related to prior year tax positions | (24 | ) | (14 | ) | |||
Lapses of statutes of limitations | (134 | ) | (216 | ) | |||
Balances as of end of year | $2,040 | $1,602 | |||||
7. FAIR VALUE MEASUREMENTS
The Company's assets and liabilities that were measured at fair value on a recurring basis are set forth by level within the fair value hierarchy in the following tables (in thousands):
As of October 31, 2017 | ||||||||||||||||
Quoted Prices in Active Markets for Identical Assets (Level 1) | Significant Other Observable Inputs (Level 2) | Significant Unobservable Inputs (Level 3) | Total | |||||||||||||
Assets: | ||||||||||||||||
Deferred compensation plans: | ||||||||||||||||
Corporate owned life insurance | $— | $113,220 | $— | $113,220 | ||||||||||||
Money market funds | 3,972 | — | — | 3,972 | ||||||||||||
Equity securities | 2,895 | — | — | 2,895 | ||||||||||||
Mutual funds | 1,541 | — | — | 1,541 | ||||||||||||
Other | 1,246 | — | — | 1,246 | ||||||||||||
Total assets | $9,654 | $113,220 | $— | $122,874 | ||||||||||||
Liabilities: | ||||||||||||||||
Contingent consideration | $— | $— | $27,573 | $27,573 | ||||||||||||
89
As of October 31, 2016 | ||||||||||||||||
Quoted Prices in Active Markets for Identical Assets (Level 1) | Significant Other Observable Inputs (Level 2) | Significant Unobservable Inputs (Level 3) | Total | |||||||||||||
Assets: | ||||||||||||||||
Deferred compensation plans: | ||||||||||||||||
Corporate owned life insurance | $— | $86,004 | $— | $86,004 | ||||||||||||
Money market funds | 2,515 | — | — | 2,515 | ||||||||||||
Equity securities | 1,832 | — | — | 1,832 | ||||||||||||
Mutual funds | 1,758 | — | — | 1,758 | ||||||||||||
Other | 1,043 | 50 | — | 1,093 | ||||||||||||
Total assets | $7,148 | $86,054 | $— | $93,202 | ||||||||||||
Liabilities: | ||||||||||||||||
Contingent consideration | $— | $— | $18,881 | $18,881 | ||||||||||||
The Company maintains two non-qualified deferred compensation plans. The assets of the LCP principally represent cash surrender values of life insurance policies, which derive their fair values from investments in mutual funds that are managed by an insurance company and are classified within Level 2 and valued using a market approach. Certain other assets of the LCP represent investments in money market funds that are classified within Level 1. The assets of the Company's other deferred compensation plan are principally invested in equity securities and mutual funds that are classified within Level 1. The assets of both plans are held within irrevocable trusts and classified within other assets in the Company’s Consolidated Balance Sheets.
As part of the agreement to acquire certain assets of a company by the ETG in fiscal 2016, the Company may be obligated to pay contingent consideration of up to $2.0 million in aggregate during the five year period following the acquisition. During fiscal 2017, the Company paid $.3 million of contingent consideration based on the actual financial performance of the acquired entity during the first year following the acquisition. As of October 31, 2017, the estimated fair value of the remaining contingent consideration was $1.4 million.
As part of the agreement to acquire a subsidiary by the FSG in fiscal 2015, the Company may be obligated to pay contingent consideration of up to €6.1 million per year, or €18.3 million in aggregate, should the acquired entity meet certain earnings objectives during each of the first three years following the first anniversary of the acquisition. During fiscal 2017, the Company paid €6.1 million, or $6.8 million, of contingent consideration based on the actual earnings of the acquired entity during the second year following the acquisition. As of October 31, 2017, the estimated fair value of the remaining contingent consideration was €10.8 million, or $12.6 million.
As part of the agreement to acquire a subsidiary by the ETG in fiscal 2017, the Company may be obligated to pay contingent consideration of $20.0 million in fiscal 2023 should the
90
acquired entity meet certain earnings objectives during the first six years following the acquisition. As of October 31, 2017, the estimated fair value of the contingent consideration was $13.6 million.
The estimated fair value of the contingent consideration arrangements described above are classified within Level 3 and were determined using a probability-based scenario analysis approach. Under this method, a set of discrete potential future subsidiary earnings was determined using internal estimates based on various revenue growth rate assumptions for each scenario. A probability of likelihood was assigned to each discrete potential future earnings estimate and the resultant contingent consideration was calculated. The resulting probability-weighted contingent consideration amounts were discounted using a weighted average discount rate reflecting the credit risk of HEICO. Changes in either the revenue growth rates, related earnings or the discount rate could result in a material change to the amount of contingent consideration accrued and such changes will be recorded in the Company's consolidated statements of operations.
The Level 3 inputs used to derive the estimated fair value of the Company's contingent consideration liability as of October 31, 2017 are as follows:
Fiscal 2017 Acquisition | Fiscal 2016 Acquisition | Fiscal 2015 Acquisition | |||||||||||
Compound annual revenue growth rate range | (8%) | - | 4% | 4 | % | - | 12% | 8 | % | - | 13% | ||
Weighted average discount rate | 4.7% | 3.4% | .8% | ||||||||||
91
Changes in the Company’s contingent consideration liability measured at fair value on a recurring basis using unobservable inputs (Level 3) during fiscal 2017 and 2016 are as follows (in thousands):
Liabilities | |||
Balance as of October 31, 2015 | $21,405 | ||
Increase in accrued contingent consideration | 3,063 | ||
Contingent consideration related to acquisition | 1,225 | ||
Payment of contingent consideration | (6,960 | ) | |
Foreign currency transaction adjustments | 148 | ||
Balance as of October 31, 2016 | 18,881 | ||
Contingent consideration related to acquisition | 13,797 | ||
Increase in accrued contingent consideration, net | 1,100 | ||
Payment of contingent consideration | (7,039 | ) | |
Foreign currency transaction adjustments | 834 | ||
Balance as of October 31, 2017 | $27,573 | ||
Included in the accompanying Consolidated Balance Sheet under the following captions: | |||
Accrued expenses and other current liabilities | $7,368 | ||
Other long-term liabilities | 20,205 | ||
$27,573 | |||
The Company recorded the increase in accrued contingent consideration and foreign currency transaction adjustments set forth in the table above within SG&A expenses in the Company's Consolidated Statements of Operations.
The Company did not have any transfers between Level 1 and Level 2 fair value measurements during fiscal 2017 and 2016.
The carrying amounts of the Company’s cash and cash equivalents, accounts receivable, trade accounts payable and accrued expenses and other current liabilities approximate fair value as of October 31, 2017 due to the relatively short maturity of the respective instruments. The carrying amount of long-term debt approximates fair value due to its variable interest rates.
92
8. SHAREHOLDERS’ EQUITY
Common Stock and Class A Common Stock
The Company has two classes of common stock that are virtually identical in all economic respects except voting rights. Each share of Common Stock is entitled to one vote per share. Each share of Class A Common Stock is entitled to a 1/10 vote per share. Holders of the Company’s common stock are entitled to receive dividends and other distributions payable in cash, property, stock or otherwise, when and if declared by the Board of Directors. In the event of liquidation, after payment of debts and other liabilities of the Company, the remaining assets of the Company will be distributable ratably among the holders of both classes of common stock.
Share Repurchases
In 1990, the Company's Board of Directors authorized a share repurchase program, which allows the Company to repurchase shares of Company common stock in the open market or in privately negotiated transactions at the Company's discretion, subject to certain restrictions included in the Company's revolving credit agreement. As of October 31, 2017, the maximum number of shares that may yet be purchased under this program was 3,127,266 of either or both of the Company's Class A Common Stock and the Company's Common Stock. The repurchase program does not have a fixed termination date. During fiscal 2017, 2016 and 2015, the Company did not repurchase any shares of Company common stock under this program.
Stock Split
In March 2017, the Company's Board of Directors declared a 5-for-4 stock split on both classes of the Company's common stock. The stock split was effected as of April 19, 2017 in the form of a 25% stock dividend distributed to shareholders of record as of April 7, 2017. All applicable share and per share information has been adjusted retrospectively to give effect to the fiscal 2017 5-for-4 stock split.
93
9. SHARE-BASED COMPENSATION
The Company may grant various forms of share-based compensation awards including stock options, restricted stock, restricted stock awards and stock appreciation rights through the HEICO Corporation 2012 Incentive Compensation Plan (“2012 Plan”). The 2012 Plan became effective in fiscal 2012, the same time the Company's 2002 Stock Option Plan (“2002 Plan”) expired. Also, in fiscal 2012, the Company made a decision to no longer issue options under its Non-Qualified Stock Option Plan (“NQSOP”). Options outstanding under the 2002 Plan and NQSOP may be exercised pursuant to their terms. The total number of shares approved by the shareholders of the Company for the 2012 Plan is 3.3 million plus any options outstanding under the 2002 Plan and NQSOP as of the 2012 Plan's effective date that are subsequently forfeited or expire. A total of approximately 5.2 million shares of the Company's common stock are reserved for issuance to employees, directors, officers and consultants as of October 31, 2017, including 4.7 million shares currently under option and 0.5 million shares available for future grants.
Stock options granted pursuant to the 2012 Plan may be designated as Common Stock and/or Class A Common Stock in such proportions as shall be determined by the Board of Directors or the Stock Option Plan Committee at its sole discretion. The exercise price per share of a stock option granted under the 2012 Plan may not be less than the fair market value of the designated class of Company common stock as of the date of grant and stock option grants vest ratably over a period specified as of the date of grant (generally five years) and expire ten years after the date of grant. Options issued under the 2012 Plan may be designated as incentive stock options or non-qualified stock options, but only employees are eligible to receive incentive stock options and no incentive stock options were outstanding as of October 31, 2017. The 2012 Plan will terminate no later than the tenth anniversary of its effective date.
Information concerning share-based activity for each of the last three fiscal years ended October 31 is as follows (in thousands, except per share data):
Shares Under Option | |||||||||
Shares Available For Grant | Shares | Weighted Average Exercise Price | |||||||
Outstanding as of October 31, 2014 | 2,021 | 4,080 | $18.08 | ||||||
Granted | (363 | ) | 363 | $41.48 | |||||
Exercised | — | (274 | ) | $13.48 | |||||
Outstanding as of October 31, 2015 | 1,658 | 4,169 | $20.42 | ||||||
Granted | (375 | ) | 375 | $36.84 | |||||
Exercised | — | (364 | ) | $16.33 | |||||
Cancelled | 7 | (7 | ) | $29.10 | |||||
Outstanding as of October 31, 2016 | 1,290 | 4,173 | $22.23 | ||||||
Granted | (759 | ) | 759 | $64.63 | |||||
Exercised | — | (262 | ) | $23.85 | |||||
Outstanding as of October 31, 2017 | 531 | 4,670 | $29.04 | ||||||
94
Information concerning stock options outstanding (all of which are vested or expected to vest) and stock options exercisable by class of common stock as of October 31, 2017 is as follows (in thousands, except per share and contractual life data):
Options Outstanding | ||||||||||||
Number Outstanding | Weighted Average Exercise Price | Weighted Average Remaining Contractual Life (Years) | Aggregate Intrinsic Value | |||||||||
Common Stock | 2,343 | $25.44 | 4.0 | $152,858 | ||||||||
Class A Common Stock | 2,327 | $32.66 | 6.1 | 101,081 | ||||||||
4,670 | $29.04 | 5.1 | $253,939 | |||||||||
Options Exercisable | ||||||||||||
Number Outstanding | Weighted Average Exercise Price | Weighted Average Remaining Contractual Life (Years) | Aggregate Intrinsic Value | |||||||||
Common Stock | 1,887 | $17.82 | 2.9 | $137,469 | ||||||||
Class A Common Stock | 1,226 | $20.30 | 4.3 | 68,432 | ||||||||
3,113 | $18.80 | 3.5 | $205,901 | |||||||||
Information concerning stock options exercised is as follows (in thousands):
Year ended October 31, | |||||||||||
2017 | 2016 | 2015 | |||||||||
Cash proceeds from stock option exercises | $5,659 | $5,924 | $3,673 | ||||||||
Tax benefit realized from stock option exercises | 3,087 | 868 | 1,402 | ||||||||
Intrinsic value of stock option exercises | 10,376 | 9,751 | 6,958 | ||||||||
Net income attributable to HEICO for the fiscal years ended October 31, 2017, 2016 and 2015 includes compensation expense of $7.4 million, $6.4 million and $5.8 million, respectively, and an income tax benefit of $2.6 million, $2.4 million and $2.2 million, respectively, related to the Company’s stock options. Substantially all of the stock option compensation expense was recorded as a component of SG&A expenses in the Company’s Consolidated Statements of Operations. As of October 31, 2017, there was $25.5 million of pre-tax unrecognized compensation expense related to nonvested stock options, which is expected to be recognized over a weighted average period of approximately 3.7 years. The total fair value of stock options that vested in fiscal 2017, 2016 and 2015 was $5.3 million, $5.8 million and $5.5 million, respectively. If there were a change in control of the Company, all of the unvested options outstanding as of October 31, 2017 would become immediately exercisable.
As previously mentioned in Note 1, Summary of Significant Accounting Policies - New Accounting Pronouncements, the Company adopted ASU 2016-09 in fiscal 2017, resulting in the recognition of a $3.1 million discrete income tax benefit from stock option exercises in the Company's Consolidated Statement of Operations as a component of income tax expense. For the fiscal years ended October 31, 2016 and 2015, the excess tax benefit resulting from tax
95
deductions in excess of the cumulative compensation cost recognized for stock options exercised was $.9 million and $1.4 million, respectively, and is presented as a financing activity in the Company’s Consolidated Statements of Cash Flows.
The fair value of each stock option grant in fiscal 2017, 2016 and 2015 was estimated on the date of grant using the Black-Scholes option-pricing model based on the following weighted average assumptions:
Year ended October 31, | |||||||||||||||||
2017 | 2016 | 2015 | |||||||||||||||
Common Stock | Class A Common Stock | Common Stock | Class A Common Stock | Common Stock | Class A Common Stock | ||||||||||||
Expected stock price volatility | 37.89 | % | 28.18 | % | 39.63 | % | 32.52 | % | 39.96 | % | 36.51 | % | |||||
Risk-free interest rate | 2.44 | % | 2.06 | % | 2.16 | % | 1.82 | % | 2.30 | % | 2.12 | % | |||||
Dividend yield | .26 | % | .31 | % | .24 | % | .32 | % | .24 | % | .32 | % | |||||
Forfeiture rate | .00 | % | .00 | % | .00 | % | .00 | % | .00 | % | .00 | % | |||||
Expected option life (years) | 9 | 7 | 9 | 6 | 9 | 7 | |||||||||||
Weighted average fair value | $33.38 | $19.49 | $18.90 | $12.38 | $22.77 | $15.67 | |||||||||||
96
10. EMPLOYEE RETIREMENT PLANS
The HEICO Savings and Investment Plan (the “401(k) Plan”) is a qualified defined contribution retirement plan under which eligible employees of the Company and its participating subsidiaries may make Elective Deferral Contributions up to the limitations set forth in Section 402(g) of the Internal Revenue Code. The Company generally makes a 50% Employer Matching Contribution, as determined by the Board of Directors, based on a participant’s Elective Deferral Contribution up to 6% of the participant’s Compensation for the Elective Deferral Contribution period. The 401(k) Plan also provides that the Company may make additional Employer Contributions. Employer Contributions may be contributed in the form of the Company’s common stock or cash, as determined by the Company. Employer Contributions awarded in the form of Company common stock are valued based on the fair value of the underlying shares as of the effective date of contribution. Employer Contributions may be diversified by a participant into any of the participant-directed investment options of the 401(k) Plan; however, Employee Contributions may not be invested in Company common stock. Unless specified otherwise, all capitalized terms herein are defined in the 401(k) Plan document.
Participants receive 100% vesting in Employee Contributions and on cash dividends received on Company common stock. Vesting in Employer Contributions is based on a participant’s number of Years of Service. Employer Contributions to the 401(k) Plan charged to income in fiscal 2017, 2016 and 2015 totaled $7.8 million, $7.0 million and $6.1 million, respectively, and were made through the issuance of new shares of Company common stock and the use of forfeited shares within the 401(k) Plan.
Information concerning share-based activity pertaining to the 401(k) Plan for each of the last three fiscal years ended October 31 is as follows (in thousands):
Common Stock | Class A Common Stock | ||||
Shares available for issuance as of October 31, 2014 | 85 | 85 | |||
Issuance of common stock to 401(k) Plan | (67 | ) | (67 | ) | |
Shares available for issuance as of October 31, 2015 | 18 | 18 | |||
Shares registered for issuance to the 401(k) Plan | 375 | 375 | |||
Issuance of common stock to 401(k) Plan | (78 | ) | (78 | ) | |
Shares available for issuance as of October 31, 2016 | 315 | 315 | |||
Issuance of common stock to 401(k) Plan | (60 | ) | (60 | ) | |
Shares available for issuance as of October 31, 2017 | 255 | 255 | |||
As previously mentioned in Note 1, Summary of Significant Accounting Policies, the Company acquired a frozen qualified defined benefit pension plan in connection with a prior year acquisition.
97
Changes in the Plan's projected benefit obligation and plan assets during fiscal 2017 and 2016 are as follows (in thousands):
Change in projected benefit obligation: | |||
Projected benefit obligation as of October 31, 2015 | $14,168 | ||
Actuarial loss | 655 | ||
Interest cost | 613 | ||
Benefits paid | (925 | ) | |
Projected benefit obligation as of October 31, 2016 | 14,511 | ||
Actuarial gain | (156 | ) | |
Interest cost | 561 | ||
Benefits paid | (916 | ) | |
Projected benefit obligation as of October 31, 2017 | $14,000 | ||
Change in plan assets: | |||
Fair value of plan assets as of October 31, 2015 | $10,767 | ||
Actual return on plan assets | 263 | ||
Employer contributions | 405 | ||
Benefits paid | (925 | ) | |
Fair value of plan assets as of October 31, 2016 | 10,510 | ||
Actual return on plan assets | 1,048 | ||
Employer contributions | 428 | ||
Benefits paid | (916 | ) | |
Fair value of plan assets as of October 31, 2017 | $11,070 | ||
Funded status as of October 31, 2016 | ($4,001 | ) | |
Funded status as of October 31, 2017 | ($2,930 | ) | |
The $2.9 million and $4.0 million difference between the projected benefit obligation and fair value of plan assets as of October 31, 2017 and October 31, 2016, respectively, is included in other long-term liabilities within the Company's Consolidated Balance Sheets. Additionally, the Plan experienced a $.5 million unrealized gain and a $1.1 million unrealized loss during fiscal 2017 and 2016, respectively, that were recognized in other comprehensive income (loss) and reported net of $.2 million and ($.4) million of tax in fiscal 2017 and 2016, respectively. The total unrealized loss in accumulated other comprehensive loss that has yet to be recognized as a component of net periodic pension income (expense) as of October 31, 2017 is $1.7 million (pre-tax), of which the Company expects to recognize less than $.1 million during fiscal 2018.
98
Weighted average assumptions used to determine the projected benefit obligation are as follows:
As of October 31, | |||||
2017 | 2016 | ||||
Discount rate | 3.98 | % | 3.99 | % | |
Weighted average assumptions used to determine net pension income are as follows:
Year ended October 31, | ||||||||
2017 | 2016 | 2015 | ||||||
Discount rate | 3.99 | % | 4.47 | % | 4.20 | % | ||
Expected return on plan assets | 6.75 | % | 6.75 | % | 6.75 | % | ||
The discount rate used to determine the projected benefit obligation was determined using the results of a bond yield curve model based on a portfolio of high-quality bonds matching expected Plan benefit payments. The expected return on Plan assets was based upon the target asset allocation and investment return estimates for the Plan's equity and fixed income securities. In establishing this assumption, the Company considers many factors including both the historical rate of return and projected inflation-adjusted real rate of return on the Plan's various asset classes and the expected working lifetime for Plan participants.
Components of net pension income that were recorded within the Company's Consolidated Statements of Operations are as follows (in thousands):
Year ended October 31, | |||||||||||
2017 | 2016 | 2015 | |||||||||
Expected return on plan assets | $688 | $702 | $738 | ||||||||
Less: Interest cost | (561 | ) | (613 | ) | (561 | ) | |||||
Less: Amortization of unrealized loss | (46 | ) | — | — | |||||||
Net pension income | $81 | $89 | $177 | ||||||||
The Company anticipates making contributions of $.5 million to the Plan during fiscal 2018. Estimated future benefit payments to be made during each of the next five fiscal years and in aggregate during the succeeding five fiscal years are as follows (in thousands):
Year ending October 31, | |||
2018 | $895 | ||
2019 | 926 | ||
2020 | 928 | ||
2021 | 898 | ||
2022 | 878 | ||
2023-2027 | 4,378 | ||
99
The fair value of the Plan's assets are set forth by level within the fair value hierarchy in the following tables (in thousands):
As of October 31, 2017 | |||||||||||||||
Quoted Prices in Active Markets for Identical Assets (Level 1) | Significant Other Observable Inputs (Level 2) | Significant Unobservable Inputs (Level 3) | Total | ||||||||||||
Equity securities | $5,593 | $— | $— | $5,593 | |||||||||||
Fixed income securities | 5,382 | — | — | 5,382 | |||||||||||
Money market funds and cash | 95 | — | — | 95 | |||||||||||
$11,070 | $— | $— | $11,070 | ||||||||||||
As of October 31, 2016 | |||||||||||||||
Quoted Prices in Active Markets for Identical Assets (Level 1) | Significant Other Observable Inputs (Level 2) | Significant Unobservable Inputs (Level 3) | Total | ||||||||||||
Equity securities | $5,149 | $— | $— | $5,149 | |||||||||||
Fixed income securities | 5,219 | — | — | 5,219 | |||||||||||
Money market funds and cash | 142 | — | — | 142 | |||||||||||
$10,510 | $— | $— | $10,510 | ||||||||||||
Fixed income securities consist of investments in mutual funds. Equity securities consist of investments in common stocks, mutual funds and exchange traded funds.
The Plan's actual and targeted asset allocations by investment category are as follows:
As of October 31, | |||||||||||
2017 | 2016 | ||||||||||
Actual | Target | Actual | Target | ||||||||
Equity securities | 50 | % | 50 | % | 49 | % | 50 | % | |||
Fixed income securities | 49 | % | 50 | % | 50 | % | 50 | % | |||
Money market funds and cash | 1 | % | — | % | 1 | % | — | % | |||
100 | % | 100 | % | 100 | % | 100 | % | ||||
100
11. REDEEMABLE NONCONTROLLING INTERESTS
The holders of equity interests in certain of the Company’s subsidiaries have rights (“Put Rights”) that may be exercised on varying dates causing the Company to purchase their equity interests through fiscal 2025. The Put Rights, all of which relate either to common shares or membership interests in limited liability companies, provide that the cash consideration to be paid for their equity interests (the “Redemption Amount”) be at fair value or at a formula that management intended to reasonably approximate fair value based solely on a multiple of future earnings over a measurement period. As of October 31, 2017, management’s estimate of the aggregate Redemption Amount of all Put Rights that the Company could be required to pay is approximately $131.1 million. The actual Redemption Amount will likely be different. The aggregate Redemption Amount of all Put Rights was determined using probability adjusted internal estimates of future earnings of the Company’s subsidiaries with Put Rights while considering the earliest exercise date, the measurement period and any applicable fair value adjustments. The portion of the estimated Redemption Amount as of October 31, 2017 redeemable at fair value is approximately $82.1 million and the portion redeemable based solely on a multiple of future earnings is approximately $49.0 million.
A summary of the Put Rights associated with the redeemable noncontrolling interests in certain of the Company’s subsidiaries as of October 31, 2017 is as follows:
Subsidiary Acquisition Year | Operating Segment | Company Ownership Interest | Earliest Put Right Year | Purchase Period (Years) | ||||
2005 | ETG | 95.9% | 2018 (1) | 4 (2) | ||||
2006 | FSG | 80.1% | 2018 (1) | 4 | ||||
2008 | FSG | 82.3% | 2018 (1) | 5 | ||||
2009 | ETG | 82.5% | 2018 (1) | 1 | ||||
2012 | ETG | 78.0% | 2018 (1) | 2 | ||||
2012 | FSG | 84.0% | 2018 | 4 | ||||
2012 | FSG | 80.1% | 2019 | 4 | ||||
2015 | FSG | 80.0% | 2019 | 4 | ||||
2015 | FSG | 80.1% | 2020 | 4 | ||||
2015 | ETG | 80.1% | 2020 | 2 | ||||
2015 | FSG | 80.1% | 2022 | 4 | ||||
2017 | FSG | 80.1% | 2022 | 2 (3) | ||||
(1) Currently puttable | ||||||||
(2) A portion is to be purchased in a lump sum | ||||||||
(3) The second purchase is to be made two years after the first Put Right Year | ||||||||
The estimated aggregate Redemption Amount of the Put Rights that are currently puttable or becoming puttable during fiscal 2018 is approximately $40.4 million, of which approximately $21.0 million would be payable in fiscal 2018 should all of the eligible associated noncontrolling
101
interest holders elect to exercise their Put Rights during fiscal 2018. Additionally, the Company has call rights to purchase the equity interests of the noncontrolling holders over the same purchase period as the Put Rights.
During fiscal 2016, the holders of a 19.9% noncontrolling equity interest in a subsidiary of the FSG that was acquired in fiscal 2011 exercised their option to cause the Company to purchase their interests over a two-year period ending in fiscal 2017. Accordingly, the Company’s ownership interest in the subsidiary increased to 100% effective March 2017.
The $3.8 million and $3.6 million Redemption Amount for the redeemable noncontrolling interests acquired in fiscal 2017 and 2016, respectively, were paid using cash provided by operating activities.
12. NET INCOME PER SHARE ATTRIBUTABLE TO HEICO SHAREHOLDERS
The computation of basic and diluted net income per share attributable to HEICO shareholders is as follows (in thousands, except per share data):
Year ended October 31, | |||||||||||
2017 | 2016 | 2015 | |||||||||
Numerator: | |||||||||||
Net income attributable to HEICO | $185,985 | $156,192 | $133,364 | ||||||||
Denominator: | |||||||||||
Weighted average common shares outstanding - basic | 84,290 | 83,807 | 83,425 | ||||||||
Effect of dilutive stock options | 2,486 | 1,406 | 1,339 | ||||||||
Weighted average common shares outstanding - diluted | 86,776 | 85,213 | 84,764 | ||||||||
Net income per share attributable to HEICO shareholders: | |||||||||||
Basic | $2.21 | $1.86 | $1.60 | ||||||||
Diluted | $2.14 | $1.83 | $1.57 | ||||||||
Anti-dilutive stock options excluded | 511 | 725 | 515 | ||||||||
102
13. QUARTERLY FINANCIAL INFORMATION (UNAUDITED)
(in thousands, except per share data) | First Quarter | Second Quarter | Third Quarter | Fourth Quarter | ||||||||||||
Net sales: | ||||||||||||||||
2017 | $343,432 | $368,657 | $391,500 | $421,224 | ||||||||||||
2016 | $306,227 | $350,648 | $356,084 | $363,299 | ||||||||||||
Gross profit: | ||||||||||||||||
2017 | $125,417 | $140,382 | $148,897 | $160,029 | ||||||||||||
2016 | $112,196 | $134,029 | $133,583 | $135,684 | ||||||||||||
Net income from consolidated operations: | ||||||||||||||||
2017 | $46,265 | $50,833 | $51,475 | $59,087 | ||||||||||||
2016 | $35,924 | $43,729 | $46,976 | $49,521 | ||||||||||||
Net income attributable to HEICO: | ||||||||||||||||
2017 | $40,927 | $45,686 | $45,698 | $53,674 | ||||||||||||
2016 | $31,271 | $38,657 | $42,002 | $44,262 | ||||||||||||
Net income per share attributable to HEICO: | ||||||||||||||||
Basic: | ||||||||||||||||
2017 | $.49 | $.54 | $.54 | $.64 | ||||||||||||
2016 | $.37 | $.46 | $.50 | $.53 | ||||||||||||
Diluted: | ||||||||||||||||
2017 | $.47 | $.53 | $.53 | $.62 | ||||||||||||
2016 | $.37 | $.45 | $.49 | $.52 | ||||||||||||
During the first quarter of fiscal 2017, the Company adopted ASU 2016-09 (see Note 1, Summary of Significant Accounting Policies - New Accounting Pronouncements), resulting in the recognition of a $3.1 million discrete income tax benefit and a 679,000 increase in the Company's weighted average number of diluted common shares outstanding, which, net of noncontrolling interests, increased net income attributable to HEICO by $2.6 million, or $.03 per basic and diluted share.
During the first quarter of fiscal 2016, the Company incurred $3.1 million of acquisition costs in connection with a fiscal 2016 acquisition. These expenses, net of tax, decreased net income attributable to HEICO by $2.0 million, or $.02 per basic and diluted share.
During the first quarter of fiscal 2016, the Company recognized additional income tax credits for qualified R&D activities related to the last ten months of fiscal 2015 upon the retroactive and permanent extension of the U.S. federal R&D tax credit in December 2015, which, net of expenses, increased net income attributable to HEICO by $1.7 million, or $.02 per basic and per diluted share.
Due to changes in the average number of common shares outstanding, net income per share attributable to HEICO for the full fiscal year may not equal the sum of the four individual quarters.
103
14. OPERATING SEGMENTS
The Company has two operating segments: the Flight Support Group (“FSG”), consisting of HEICO Aerospace and HEICO Flight Support Corp. and their collective subsidiaries; and the Electronic Technologies Group (“ETG”), consisting of HEICO Electronic and its subsidiaries. The Company's operating segment reporting structure is consistent with how management reviews the business, makes investing and resource decisions and assesses operating performance. Additionally, characteristics such as similarity of products, customers, economic characteristics and various other factors are considered when identifying the Company's operating segments. The FSG designs, manufactures, repairs, overhauls and distributes jet engine and aircraft component replacement parts. The parts and services are approved by the FAA. The FSG also manufactures and sells specialty parts as a subcontractor for aerospace and industrial original equipment manufacturers and the U.S. government. Additionally, the FSG is a leading supplier, distributor, and integrator of military aircraft parts and support services primarily to foreign military organizations allied with the U.S. and is a leading manufacturer of advanced niche components and complex composite assemblies for commercial aviation, defense and space applications. Further, the FSG engineers, designs and manufactures thermal insulation blankets and parts and is a leading distributor of aviation electrical interconnect products and electromechanical parts. The ETG collectively designs and manufactures electronic, microwave, and electro-optical equipment and components, three-dimensional microelectronic and stacked memory products, high-speed interface products, high voltage interconnection devices, high voltage advanced power electronics products, power conversion products, underwater locator beacons, electromagnetic interference shielding, traveling wave tube amplifiers, harsh environment electronic connectors and other interconnect products, communications and electronic intercept receivers and tuners, crashworthy and ballistically self-sealing auxiliary fuel systems for military rotorcraft, radio frequency (RF) and microwave amplifiers, transmitters and receivers, satellite microwave modules and integrated subsystems and high performance active antenna systems primarily for the aviation, defense, space, medical, telecommunications and electronics industries.
The Company’s reportable operating segments offer distinctive products and services that are marketed through different channels. They are managed separately because of their unique technology and service requirements.
Segment Profit or Loss
The accounting policies of the Company’s operating segments are the same as those described in Note 1, Summary of Significant Accounting Policies. Management evaluates segment performance based on segment operating income.
104
Information on the Company’s two operating segments, the FSG and the ETG, for each of the last three fiscal years ended October 31 is as follows (in thousands):
Segment | Other, Primarily Corporate and Intersegment (1) | Consolidated Totals | ||||||||||||||
FSG | ETG | |||||||||||||||
Year ended October 31, 2017: | ||||||||||||||||
Net sales | $967,540 | $574,261 | ($16,988 | ) | $1,524,813 | |||||||||||
Depreciation | 13,042 | 8,609 | 227 | 21,878 | ||||||||||||
Amortization | 18,026 | 24,167 | 752 | 42,945 | ||||||||||||
Operating income | 179,278 | 157,451 | (30,071 | ) | 306,658 | |||||||||||
Capital expenditures | 15,665 | 10,100 | 233 | 25,998 | ||||||||||||
Total assets | 1,042,925 | 1,339,363 | 130,143 | 2,512,431 | ||||||||||||
Year ended October 31, 2016: | ||||||||||||||||
Net sales | $875,870 | $511,272 | ($10,884 | ) | $1,376,258 | |||||||||||
Depreciation | 12,113 | 8,030 | 218 | 20,361 | ||||||||||||
Amortization | 16,590 | 22,664 | 662 | 39,916 | ||||||||||||
Operating income | 163,427 | 126,031 | (24,113 | ) | 265,345 | |||||||||||
Capital expenditures | 18,434 | 11,962 | 467 | 30,863 | ||||||||||||
Total assets | 877,672 | 1,015,696 | 105,044 | 1,998,412 | ||||||||||||
Year ended October 31, 2015: | ||||||||||||||||
Net sales | $809,700 | $390,982 | ($12,034 | ) | $1,188,648 | |||||||||||
Depreciation | 10,859 | 6,803 | 168 | 17,830 | ||||||||||||
Amortization | 13,470 | 15,945 | 662 | 30,077 | ||||||||||||
Operating income | 149,798 | 98,833 | (18,975 | ) | 229,656 | |||||||||||
Capital expenditures | 11,737 | 6,201 | 311 | 18,249 | ||||||||||||
Total assets | 867,213 | 743,873 | 89,771 | 1,700,857 | ||||||||||||
(1) Intersegment activity principally consists of net sales from the ETG to the FSG. | ||||||||||||||||
105
The following table summarizes the Company’s net sales to external customers by product lines included in each operating segment (in thousands):
Year ended October 31, | ||||||||||||
2017 | 2016 | 2015 | ||||||||||
Flight Support Group: | ||||||||||||
Aftermarket replacement parts (1) | $489,644 | $405,108 | $356,070 | |||||||||
Repair and overhaul parts and services (2) | 270,482 | 251,357 | 258,952 | |||||||||
Specialty products (3) | 207,414 | 219,405 | 194,678 | |||||||||
Total net sales | 967,540 | 875,870 | 809,700 | |||||||||
Electronic Technologies Group: | ||||||||||||
Electronic component parts for defense, space and aerospace equipment (4) | 420,991 | 371,297 | 255,095 | |||||||||
Electronic component parts for equipment in various other industries (5) | 153,270 | 139,975 | 135,887 | |||||||||
Total net sales | 574,261 | 511,272 | 390,982 | |||||||||
Other, primarily corporate and intersegment | (16,988 | ) | (10,884 | ) | (12,034 | ) | ||||||
Total consolidated net sales | $1,524,813 | $1,376,258 | $1,188,648 | |||||||||
(1) | Includes various jet engine and aircraft component replacement parts. |
(2) | Includes primarily the sale of parts consumed in various repair and overhaul services on selected jet engine and aircraft components, avionics, instruments, composites and flight surfaces of commercial and military aircraft. |
(3) | Includes primarily the sale of specialty components such as thermal insulation blankets, renewable/reusable insulation systems, advanced niche components, complex composite assemblies, and expanded foil mesh. |
(4) | Includes various component parts such as electro-optical infrared simulation and test equipment, electro-optical laser products, electro-optical, microwave and other power equipment, high-speed interface products, power conversion products, underwater locator beacons, traveling wave tube amplifiers, microwave power modules, three-dimensional microelectronic and stacked memory products, crashworthy and ballistically self-sealing auxiliary fuel systems, radio frequency (RF) and microwave amplifiers, transmitters and receivers, high performance communications and electronic intercept receivers and tuners and high performance active antenna systems. |
(5) | Includes various component parts such as electromagnetic and radio interference shielding, high voltage interconnection devices, high voltage advanced power electronics, harsh environment connectivity products and custom molded cable assemblies. |
106
Major Customer and Geographic Information
The Company markets its products and services in approximately 110 countries. The following table summarizes the Company’s net sales to customers located in the United States and to those in other countries for each of the last three fiscal years ended October 31 (in thousands). Net sales are attributed to countries based on the location of the customer. Net sales to any one customer or originating from any one foreign country did not account for 10% or more of the Company’s consolidated net sales during any of the last three fiscal years. The following table also summarizes the Company’s long-lived assets held within and outside of the United States as of October 31 of the last three fiscal years (in thousands). Long-lived assets consist of net property, plant and equipment.
2017 | 2016 | 2015 | |||||||||
Net Sales: | |||||||||||
United States of America | $1,007,491 | $904,670 | $785,567 | ||||||||
Other countries | 517,322 | 471,588 | 403,081 | ||||||||
Total net sales | $1,524,813 | $1,376,258 | $1,188,648 | ||||||||
Long-lived assets: | |||||||||||
United States of America | $97,367 | $94,889 | $85,253 | ||||||||
Other countries | 32,516 | 26,722 | 20,417 | ||||||||
Total long-lived assets | $129,883 | $121,611 | $105,670 | ||||||||
107
15. COMMITMENTS AND CONTINGENCIES
Lease Commitments
The Company leases certain property and equipment, including manufacturing facilities and office equipment under operating leases. Some of these leases provide the Company with the option after the initial lease term either to purchase the property at the then fair market value or renew the lease at the then fair rental value. Generally, management expects that leases will be renewed or replaced by other leases in the normal course of business.
Future minimum payments under non-cancelable operating leases for the next five fiscal years and thereafter are estimated to be as follows (in thousands):
Year ending October 31, | |||
2018 | $13,402 | ||
2019 | 12,249 | ||
2020 | 11,748 | ||
2021 | 10,904 | ||
2022 | 9,759 | ||
Thereafter | 16,065 | ||
Total minimum lease commitments | $74,127 | ||
Total rent expense charged to operations for operating leases in fiscal 2017, 2016 and 2015 amounted to $15.6 million, $14.7 million and $11.9 million, respectively.
Guarantees
As of October 31, 2017, the Company has arranged for standby letters of credit aggregating $4.2 million, which are supported by its revolving credit facility and pertain to payment guarantees related to potential workers' compensation claims and a facility lease as well as performance guarantees related to customer contracts entered into by certain of the Company's subsidiaries.
Product Warranty
Changes in the Company’s product warranty liability in fiscal 2017 and 2016 are as follows (in thousands):
Year ended October 31, | |||||||
2017 | 2016 | ||||||
Balances as of beginning of year | $3,351 | $3,203 | |||||
Accruals for warranties | 2,254 | 3,025 | |||||
Warranty claims settled | (2,684 | ) | (2,877 | ) | |||
Balances as of end of year | $2,921 | $3,351 | |||||
108
Litigation
The Company is involved in various legal actions arising in the normal course of business. Based upon the Company’s and its legal counsel’s evaluations of any claims or assessments, management is of the opinion that the outcome of these matters will not have a material adverse effect on the Company’s results of operations, financial position or cash flows.
16. SUPPLEMENTAL DISCLOSURES OF CASH FLOW INFORMATION
The following table presents supplemental disclosures of cash flow information and non-cash investing activities for fiscal 2017, 2016 and 2015 (in thousands):
Year ended October 31, | |||||||||||
2017 | 2016 | 2015 | |||||||||
Cash paid for income taxes | $95,851 | $87,486 | $76,021 | ||||||||
Cash received from income tax refunds | (2,953 | ) | (1,906 | ) | (1,211 | ) | |||||
Cash paid for interest | 9,631 | 8,288 | 4,598 | ||||||||
Contingent consideration | 13,797 | 1,225 | 21,355 | ||||||||
Additional purchase consideration | 220 | — | (204 | ) | |||||||
Property, plant and equipment acquired through capital lease obligations | 37 | 1,111 | 59 | ||||||||
109
17. SUBSEQUENT EVENTS
In November 2017, the Company, through a subsidiary of HEICO Electronic, acquired all the stock of Interface Displays & Controls, Inc. ("IDC"). IDC designs and manufactures electronic products for aviation, marine, military, fighting vehicles, and embedded computing markets. The purchase price of this acquisition was paid using cash provided by operating activities and the total consideration for the acquisition is not material or significant to the Company’s consolidated financial statements.
On December 15, 2017, the Company’s Board of Directors declared a 5-for-4 stock split on both classes of the Company's common stock. The stock split is payable to shareholders of record as of January 3, 2018 and the Company expects to distribute the additional shares to shareholders on January 17, 2018. Accordingly, the prices of both the Company's Class A Common Stock and Common Stock are anticipated to begin trading on a post-split basis on January 18, 2018. None of the applicable share and per share information in these consolidated financial statements on Form 10-K has been adjusted retrospectively to give effect to the pending 5-for-4 stock split. Pro forma unaudited net income per share attributable to HEICO shareholders and the weighted average number of common shares outstanding for fiscal 2017, 2016 and 2015 giving retrospective effect to the pending fiscal 2018 stock split is as follows (in thousands, except per share data):
Year ended October 31, | |||||||||||
2017 | 2016 | 2015 | |||||||||
Net income per share attributable to HEICO shareholders: | |||||||||||
Basic | $1.77 | $1.49 | $1.28 | ||||||||
Diluted | $1.71 | $1.47 | $1.26 | ||||||||
Weighted average number of common shares outstanding: | |||||||||||
Basic | 105,363 | 104,758 | 104,281 | ||||||||
Diluted | 108,470 | 106,516 | 105,955 | ||||||||
110
Item 9. | CHANGES IN AND DISAGREEMENTS WITH ACCOUNTANTS ON ACCOUNTING AND FINANCIAL DISCLOSURE |
None.
Item 9A. CONTROLS AND PROCEDURES
Evaluation of Disclosure Controls and Procedures
The Company’s management, with the participation of the Company’s Chief Executive Officer and its Chief Financial Officer, evaluated the effectiveness of the Company’s disclosure controls and procedures (as defined in Exchange Act Rules 13a-15(e) and 15d-15(e)) as of the end of the period covered by this annual report. Based upon that evaluation, the Company’s Chief Executive Officer and its Chief Financial Officer concluded that the Company’s disclosure controls and procedures are effective as of the end of the period covered by this annual report.
Management’s Annual Report on Internal Control Over Financial Reporting
Management of HEICO Corporation is responsible for establishing and maintaining adequate internal control over financial reporting for the Company. Internal control over financial reporting is a process designed to provide reasonable assurance regarding the reliability of financial reporting and the preparation of financial statements for external purposes in accordance with generally accepted accounting principles. A company’s internal control over financial reporting includes those policies and procedures that (i) pertain to the maintenance of records that in reasonable detail accurately and fairly reflect the transactions and dispositions of the assets of the Company; (ii) provide reasonable assurance that transactions are recorded as necessary to permit preparation of financial statements in accordance with generally accepted accounting principles, and that receipts and expenditures of the Company are being made only in accordance with authorizations of management and directors of the Company; and (iii) provide reasonable assurance regarding prevention or timely detection of unauthorized acquisition, use or disposition of the Company’s assets that could have a material effect on the financial statements.
Because of inherent limitations, internal control over financial reporting may not prevent or detect misstatements. Projections of any evaluation of effectiveness to future periods are subject to the risks that controls may become inadequate because of changes in conditions, or that the degree of compliance with the policies or procedures may deteriorate.
Management, under the supervision of and with the participation of the Company’s Chief Executive Officer and the Chief Financial Officer, assessed the effectiveness of the Company’s internal control over financial reporting based on the criteria set forth by the Committee of Sponsoring Organizations of the Treadway Commission in Internal Control - Integrated Framework (2013). Based on its assessment, management concluded that the Company’s internal control over financial reporting is effective as of October 31, 2017.
111
In September 2017, the Company acquired all of the outstanding stock of AeroAntenna Technology, Inc., (“AAT”). In June 2017, the Company acquired all of the ownership interests of Carbon by Design ("CBD"). In April 2017, the Company acquired 80.1% of the equity interests of LLP Enterprises, LLC, which owns all of the outstanding equity interests of the operating units of Air Cost Control ("A2C"). See Note 2, Acquisitions, of the Notes to Consolidated Financial Statements for additional information. As permitted by the Securities and Exchange Commission, companies are allowed to exclude acquisitions from their assessment of internal control over financial reporting during the first year of an acquisition and management elected to exclude AAT, CBD, and A2C (collectively, the "Excluded Acquisitions") from its assessment of internal control over financial reporting as of October 31, 2017. The aggregate assets and net sales of the Excluded Acquisitions constituted 19.7% and 3.9% of the Company's consolidated total assets and net sales as of and for the year ended October 31, 2017, respectively.
Deloitte & Touche LLP, an independent registered public accounting firm, audited the Company’s consolidated financial statements and financial statement schedule included in this Annual Report on Form 10-K for the year ended October 31, 2017. A copy of their report is included in Item 8, Financial Statements and Supplementary Data, of this Annual Report on Form 10-K. Deloitte & Touche LLP has issued their attestation report on management’s internal control over financial reporting, which is set forth below.
Changes in Internal Control Over Financial Reporting
There have been no changes in the Company’s internal control over financial reporting during the fourth quarter ended October 31, 2017 that have materially affected, or are reasonably likely to materially affect, the Company’s internal control over financial reporting.
As described in Management's Annual Report on Internal Control Over Financial Reporting, the Company made several acquisitions during fiscal 2017 and is in the process of integrating each one into its overall internal control over financial reporting process.
Attestation Report of the Company's Independent Registered Public Accounting Firm
REPORT OF INDEPENDENT REGISTERED PUBLIC ACCOUNTING FIRM
To the Board of Directors and Shareholders of
HEICO Corporation
Hollywood, Florida
We have audited the internal control over financial reporting of HEICO Corporation and subsidiaries (the "Company") as of October 31, 2017, based on criteria established in Internal Control - Integrated Framework (2013) issued by the Committee of Sponsoring Organizations of the Treadway Commission. As described in Management's Annual Report on Internal Control Over Financial Reporting, management excluded from its assessment the internal control over financial reporting at AeroAntenna Technology, Inc., Carbon by Design and Air Cost Control,
112
(collectively, the "Excluded Acquisitions"), which were acquired during 2017 and whose financial statements constitute 19.7% of total assets and 3.9% of net sales of the Company's consolidated financial statement amounts as of and for the year ended October 31, 2017. Accordingly, our audit did not include the internal control over financial reporting of the Excluded Acquisitions. The Company's management is responsible for maintaining effective internal control over financial reporting and for its assessment of the effectiveness of internal control over financial reporting, included in the accompanying Management’s Annual Report on Internal Control Over Financial Reporting. Our responsibility is to express an opinion on the Company's internal control over financial reporting based on our audit.
We conducted our audit in accordance with the standards of the Public Company Accounting Oversight Board (United States). Those standards require that we plan and perform the audit to obtain reasonable assurance about whether effective internal control over financial reporting was maintained in all material respects. Our audit included obtaining an understanding of internal control over financial reporting, assessing the risk that a material weakness exists, testing and evaluating the design and operating effectiveness of internal control based on the assessed risk, and performing such other procedures as we considered necessary in the circumstances. We believe that our audit provides a reasonable basis for our opinion.
A company's internal control over financial reporting is a process designed by, or under the supervision of, the company's principal executive and principal financial officers, or persons performing similar functions, and effected by the company's board of directors, management, and other personnel to provide reasonable assurance regarding the reliability of financial reporting and the preparation of financial statements for external purposes in accordance with generally accepted accounting principles. A company's internal control over financial reporting includes those policies and procedures that (1) pertain to the maintenance of records that, in reasonable detail, accurately and fairly reflect the transactions and dispositions of the assets of the company; (2) provide reasonable assurance that transactions are recorded as necessary to permit preparation of financial statements in accordance with generally accepted accounting principles and that receipts and expenditures of the company are being made only in accordance with authorizations of management and directors of the company; and (3) provide reasonable assurance regarding prevention or timely detection of unauthorized acquisition, use, or disposition of the company's assets that could have a material effect on the financial statements.
Because of the inherent limitations of internal control over financial reporting, including the possibility of collusion or improper management override of controls, material misstatements due to error or fraud may not be prevented or detected on a timely basis. Also, projections of any evaluation of the effectiveness of the internal control over financial reporting to future periods are subject to the risk that the controls may become inadequate because of changes in conditions, or that the degree of compliance with the policies or procedures may deteriorate.
In our opinion, the Company maintained, in all material respects, effective internal control over financial reporting as of October 31, 2017, based on the criteria established in Internal Control -Integrated Framework (2013) issued by the Committee of Sponsoring Organizations of the Treadway Commission.
113
We have also audited, in accordance with the standards of the Public Company Accounting Oversight Board (United States), the consolidated financial statements and financial statement schedule as of and for the year ended October 31, 2017 of the Company and our report dated December 21, 2017 expressed an unqualified opinion on those financial statements and financial statement schedule.
/s/ DELOITTE & TOUCHE LLP
Certified Public Accountants
Miami, Florida
December 21, 2017
Item 9B. OTHER INFORMATION
None.
PART III
Item 10. DIRECTORS, EXECUTIVE OFFICERS AND CORPORATE GOVERNANCE
Information concerning the members of the Board of Directors of the Company, including the Finance/Audit Committee of the Board of Directors, the independence of its members and the "audit committee financial expert" as defined by the Securities and Exchange Commission ("Commission"), as well as information concerning other corporate governance matters and compliance with Section 16(a) of the Securities Exchange Act of 1934 is hereby incorporated by reference to the Company’s definitive proxy statement, which will be filed with the Commission within 120 days after the close of fiscal 2017.
Information concerning the Executive Officers of the Company is set forth in Item 1 of Part I hereof under the caption “Executive Officers of the Registrant.”
The Company has adopted a code of ethics that applies to its principal executive officer, principal financial officer, principal accounting officer or controller and persons performing similar functions. The code of ethics is located on the Company’s Internet website at http://www.heico.com. Any amendments to or waivers from a provision of this code of ethics will be posted on the Company’s website.
Item 11. EXECUTIVE COMPENSATION
Information concerning executive compensation is hereby incorporated by reference to the Company’s definitive proxy statement, which will be filed with the Commission within 120 days after the close of fiscal 2017.
114
Item 12. | SECURITY OWNERSHIP OF CERTAIN BENEFICIAL OWNERS AND MANAGEMENT AND RELATED STOCKHOLDER MATTERS |
Information concerning security ownership of certain beneficial owners and management is hereby incorporated by reference to the Company’s definitive proxy statement, which will be filed with the Commission within 120 days after the close of fiscal 2017.
Equity Compensation Plan Information
The following table summarizes information about our equity compensation plans as of October 31, 2017 (in thousands, except per share data):
Plan Category | Number of Securities to be Issued Upon Exercise of Outstanding Options, Warrants and Rights (a) | Weighted-Average Exercise Price of Outstanding Options, Warrants and Rights (b) | Number of Securities Remaining Available for Future Issuance Under Equity Compensation Plans (Excluding Securities Reflected in Column (a)) (c) (2) | |||||||
Equity compensation plans approved by security holders (1) | 4,670 | $29.04 | 531 | |||||||
Equity compensation plans not approved by security holders | — | — | — | |||||||
Total | 4,670 | $29.04 | 531 | |||||||
__________________
(1) | Represents aggregated information pertaining to our three equity compensation plans: the HEICO Corporation 2012 Incentive Compensation Plan, the 2002 Stock Option Plan and the Non-Qualified Stock Option Plan. See Note 9, Share-Based Compensation, of the Notes to Consolidated Financial Statements for further information regarding these plans. |
(2) | Shares are available for future grant in column (c) solely under the HEICO Corporation 2012 Incentive Compensation Plan, under a formula that counts one share against the available share reserve for each one share subject to a stock option or stock appreciation right, and counts 2.5 shares against the available share reserve for each one share subject to a restricted stock award, a restricted stock unit award, a free-standing dividend equivalent award, or any other stock-based award or a performance award denominated in shares. Additionally, the 531 remaining number of securities available for future issuance may be designated as Common Stock and/or Class A Common Stock in such proportions as shall be determined by the Board of Directors or the Stock Option Plan Committee at its sole discretion. |
Item 13. | CERTAIN RELATIONSHIPS AND RELATED TRANSACTIONS, AND DIRECTOR INDEPENDENCE |
Information concerning certain relationships and related transactions and director independence is hereby incorporated by reference to the Company’s definitive proxy statement, which will be filed with the Commission within 120 days after the close of fiscal 2017.
115
Item 14. PRINCIPAL ACCOUNTANT FEES AND SERVICES
Information concerning fees and services by the principal accountant is hereby incorporated by reference to the Company’s definitive proxy statement, which will be filed with the Commission within 120 days after the close of fiscal 2017.
PART IV
Item 15. EXHIBITS, FINANCIAL STATEMENT SCHEDULES
(a)(1) Financial Statements
The following consolidated financial statements of the Company and subsidiaries and report of independent registered public accounting firm are included in Part II, Item 8:
Page | |
(a)(2) Financial Statement Schedules
The following financial statement schedule of the Company and subsidiaries is included herein:
All other schedules have been omitted because the required information is not applicable or the information is included in the consolidated financial statements or notes thereto presented in Part II, Item 8.
116
(a)(3) Exhibits
Exhibit | Description | |
2.1 | — | Amended and Restated Agreement of Merger and Plan of Reorganization, dated as of March 22, 1993, by and among HEICO Corporation, HEICO Industries, Corp. and New HEICO, Inc. is incorporated by reference to Exhibit 2.1 to the Registrant’s Registration Statement on Form S-4 (Registration No. 33-57624) Amendment No. 1 filed on March 19, 1993. * |
3.1 | — | Articles of Incorporation of the Registrant are incorporated by reference to Exhibit 3.1 to the Company's Registration Statement on Form S-4 (Registration No. 33-57624) Amendment No. 1 filed on March 19, 1993. * |
3.2 | — | Articles of Amendment of the Articles of Incorporation of the Registrant, dated April 27, 1993, are incorporated by reference to Exhibit 3.2 to the Company's Registration Statement on Form 8-B dated April 29, 1993. * |
3.3 | — | Articles of Amendment of the Articles of Incorporation of the Registrant, dated November 3, 1993, are incorporated by reference to Exhibit 3.3 to the Form 10-K for the year ended October 31, 1993. * |
3.4 | — | |
3.5 | — | |
3.6 | — | |
3.7 | — | |
10.1# | — | |
10.2# | — | Non-Qualified Stock Option Agreement for Directors, Officers and Employees is incorporated by reference to Exhibit 10.8 to the Form 10-K for the year ended October 31, 1985. * |
10.3# | — | |
10.4# | — | |
117
Exhibit | Description | |
10.5# | — | HEICO Corporation Directors’ Retirement Plan, as amended, dated as of May 31, 1991, is incorporated by reference to Exhibit 10.19 to the Form 10-K for the year ended October 31, 1992. * |
10.6# | — | |
10.7# | — | |
10.8# | — | |
10.9 | — | |
10.10 | — | |
10.11 | — | |
10.12 | — | |
10.13 | — | |
10.14 | — | |
118
Exhibit | Description | |
10.15 | — | |
10.16 | — | |
10.17 | — | |
21 | — | |
23 | — | |
31.1 | — | |
31.2 | — | |
32.1 | — | |
32.2 | — | |
101.INS | — | XBRL Instance Document. ** |
101.SCH | — | XBRL Taxonomy Extension Schema Document. ** |
101.CAL | — | XBRL Taxonomy Extension Calculation Linkbase Document. ** |
101.DEF | — | XBRL Taxonomy Extension Definition Linkbase Document. ** |
101.LAB | — | XBRL Taxonomy Extension Labels Linkbase Document. ** |
101.PRE | — | XBRL Taxonomy Extension Presentation Linkbase Document. ** |
# | Management contract or compensatory plan or arrangement required to be filed as an exhibit. |
* | Previously filed. |
** | Filed herewith. |
*** | Furnished herewith. |
119
Item 16. FORM 10-K SUMMARY
None
HEICO CORPORATION AND SUBSIDIARIES
SCHEDULE II – VALUATION AND QUALIFYING ACCOUNTS
Year ended October 31, | ||||||||||||
2017 | 2016 | 2015 | ||||||||||
Allowance for doubtful accounts (in thousands): | ||||||||||||
Allowance as of beginning of year | $3,159 | $2,038 | $2,143 | |||||||||
Additions charged to costs and expenses | 7 | 390 | 248 | |||||||||
Additions charged to other accounts (a) | 298 | 973 | 55 | |||||||||
Deductions (b) | (458 | ) | (242 | ) | (408 | ) | ||||||
Allowance as of end of year | $3,006 | $3,159 | $2,038 | |||||||||
(a) | Principally additions from acquisitions and foreign currency translation adjustments. |
(b) | Principally write-offs of uncollectible accounts receivable, net of recoveries. |
Year ended October 31, | ||||||||||||
2017 | 2016 | 2015 | ||||||||||
Inventory valuation reserves (in thousands): | ||||||||||||
Reserves as of beginning of year | $81,449 | $69,654 | $60,608 | |||||||||
Additions charged to costs and expenses | 6,284 | 10,270 | 7,779 | |||||||||
Additions charged to other accounts (a) | 6,264 | 6,268 | 4,598 | |||||||||
Deductions (b) | (1,849 | ) | (4,743 | ) | (3,331 | ) | ||||||
Reserves as of end of year | $92,148 | $81,449 | $69,654 | |||||||||
(a) | Principally additions from acquisitions and foreign currency translation adjustments. |
(b) | Principally write-offs of slow-moving, obsolete or damaged inventory. |
120
SIGNATURES
Pursuant to the requirements of Section 13 or 15(d) of the Securities Exchange Act of 1934, the Registrant has duly caused this report to be signed on its behalf by the undersigned, thereunto duly authorized.
HEICO CORPORATION | |||
Date: | December 21, 2017 | By: | /s/ CARLOS L. MACAU, JR. |
Carlos L. Macau, Jr. Executive Vice President - Chief Financial Officer and Treasurer (Principal Financial Officer) | |||
By: | /s/ STEVEN M. WALKER | ||
Steven M. Walker Chief Accounting Officer and Assistant Treasurer (Principal Accounting Officer) | |||
Pursuant to the requirements of the Securities Exchange Act of 1934, this report has been signed below by the following persons on behalf of the Registrant and in the capacities and on the dates indicated.
Name | Position(s) | Date | ||
/s/ LAURANS A. MENDELSON | Chairman of the Board; Chief Executive Officer; and Director (Principal Executive Officer) | December 21, 2017 | ||
Laurans A. Mendelson | ||||
/s/ THOMAS M. CULLIGAN | Director | December 21, 2017 | ||
Thomas M. Culligan | ||||
/s/ ADOLFO HENRIQUES | Director | December 21, 2017 | ||
Adolfo Henriques | ||||
/s/ MARK H. HILDEBRANDT | Director | December 21, 2017 | ||
Mark H. Hildebrandt | ||||
/s/ WOLFGANG MAYRHUBER | Director | December 21, 2017 | ||
Wolfgang Mayrhuber | ||||
/s/ ERIC A. MENDELSON | Co-President and Director | December 21, 2017 | ||
Eric A. Mendelson | ||||
/s/ VICTOR H. MENDELSON | Co-President and Director | December 21, 2017 | ||
Victor H. Mendelson | ||||
/s/ JULIE NEITZEL | Director | December 21, 2017 | ||
Julie Neitzel | ||||
121
Name | Position(s) | Date | ||
/s/ ALAN SCHRIESHEIM | Director | December 21, 2017 | ||
Alan Schriesheim | ||||
/s/ FRANK J. SCHWITTER | Director | December 21, 2017 | ||
Frank J. Schwitter | ||||
122