Attached files
| file | filename |
|---|---|
| 8-K - 8-K - RGC RESOURCES INC | a8kinvestorpresentation-20.htm |

RGC Resources, Inc. | NASDAQ: RGCO
Investor Presentation
December 2017
1
Forward-Looking Statements:
The statements in this presentation by RGC Resources, Inc. (the "company") that are not historical facts constitute “forward-looking
statements” made pursuant to the safe harbor provision of the Private Securities Litigation Reform Act of 1995 that involve risks and
uncertainties. These statements include the company's expectations regarding earnings per share, EBITDA, future expansion opportunities,
natural gas reserves and potential discoverable natural gas reserves, technological advances in natural gas production, comparison of natural
gas consumption and natural gas production, cost of natural gas, including relativity to other fuel sources, demand for natural gas, possibility of
system expansion, general potential for customer growth, relationship of company with primary regulator, future capital expenditures, current
and future economic growth, estimated completion dates for Mountain Valley Pipeline ("MVP") milestones, potential of MVP to provide
additional source of natural gas, additional capacity to meet future demands, increased capital spending and area expansion opportunity,
potential new customers and rate growth in potential expansion area. Management cautions the reader that these forward-looking statements
are only predictions and are subject to a number of both known and unknown risks and uncertainties, and actual results may differ materially
from those expressed or implied by these forward-looking statements as a result of a number of factors. These factors include, without
limitation, financial challenges affecting expected earnings per share and EBITDA, technical, political or regulatory issues with natural gas
exploration, production or transportation, impact of increased natural gas demand on natural gas price, relative cost of alternative fuel
sources, lower demand for natural gas, regulatory, legal, technical, political or economic issues frustrating system or area expansion,
regulatory, legal, technical, political or economic issues that may affect MVP, delay in completion of MVP, increase in cost to complete MVP,
including by an increase in cost of raw materials or labor to due economic factors or regulatory issues such as tariffs, economic challenges that
may affect the service area generally and customer growth or demand and deterioration of relationship with primary regulator, and those risk
factors described in the company’s most recent Annual Report on Form 10-K filed with the Securities and Exchange Commission, which is
available at www.sec.gov and on the company’s website at www.rgcresources.com. The statements made in this presentation are based on
information available to the company as of the first day of the month set forth on the cover of this presentation and the company undertakes
no obligation to update any of the forward-looking statements after the date of this presentation.
Non-GAAP Measures: this presentation includes certain metrics that are based on LTM EBITDA, which is a non-GAAP financial measure. A
reconciliation of LTM EBITDA to the most directly comparable GAAP measure is available on page 12 of this presentation.
2
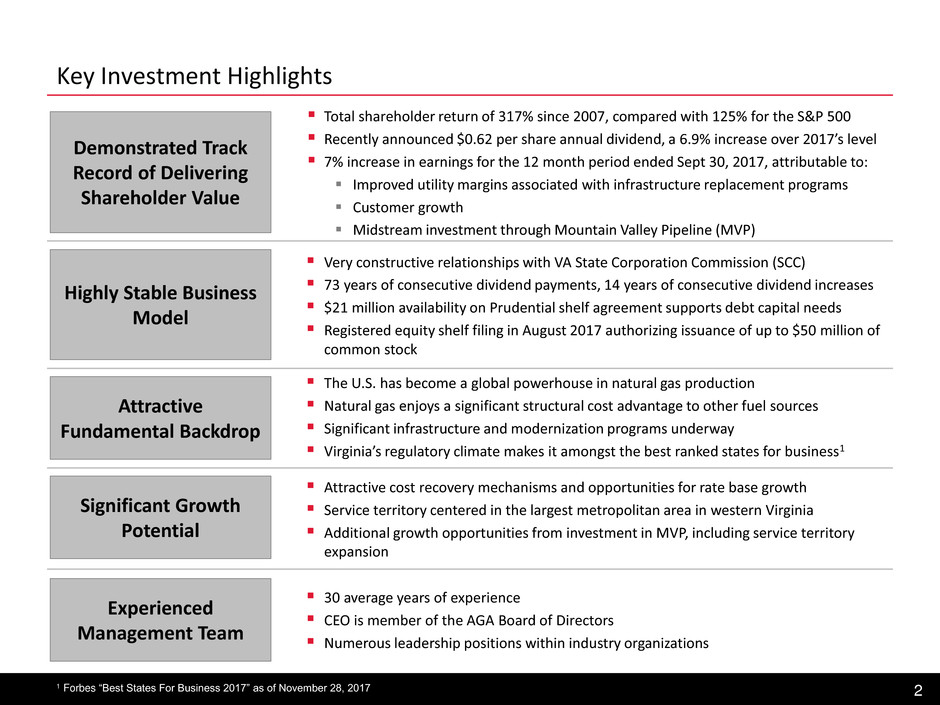
Key Investment Highlights
Demonstrated Track
Record of Delivering
Shareholder Value
Total shareholder return of 317% since 2007, compared with 125% for the S&P 500
Recently announced $0.62 per share annual dividend, a 6.9% increase over 2017’s level
7% increase in earnings for the 12 month period ended Sept 30, 2017, attributable to:
Improved utility margins associated with infrastructure replacement programs
Customer growth
Midstream investment through Mountain Valley Pipeline (MVP)
Significant Growth
Potential
Attractive cost recovery mechanisms and opportunities for rate base growth
Service territory centered in the largest metropolitan area in western Virginia
Additional growth opportunities from investment in MVP, including service territory
expansion
Highly Stable Business
Model
Very constructive relationships with VA State Corporation Commission (SCC)
73 years of consecutive dividend payments, 14 years of consecutive dividend increases
$21 million availability on Prudential shelf agreement supports debt capital needs
Registered equity shelf filing in August 2017 authorizing issuance of up to $50 million of
common stock
Experienced
Management Team
30 average years of experience
CEO is member of the AGA Board of Directors
Numerous leadership positions within industry organizations
Attractive
Fundamental Backdrop
The U.S. has become a global powerhouse in natural gas production
Natural gas enjoys a significant structural cost advantage to other fuel sources
Significant infrastructure and modernization programs underway
Virginia’s regulatory climate makes it amongst the best ranked states for business1
1 Forbes “Best States For Business 2017” as of November 28, 2017

Overview of RGC Resources and Roanoke Gas
Business Description
Local distribution company (LDC) located in Roanoke, VA,
founded in 1883, that transports natural gas to residential
and commercial/industrial end users
Publicly listed on Nasdaq in 1994
98% earnings FYE 2017 from Roanoke Gas– regulated
natural gas utility
60,338 customers in Virginia
‒ 60% industrial/commercial/other by volume
‒ 40% residential
110 full time employees
RGC Midstream – Est. $35 million investment committed to
Mountain Valley Pipeline – FERC regulated interstate
pipeline
Public Market Overview ($mm)
Organizational Chart & Trading Statistics Service Territory
Sources: Company filings as of 9/30/17. Bloomberg market data as of 12/1/17.
Notes: Total debt pro forma for $8mm 3.58% 2027 Sr. Notes issued October 2, 2017. Proceeds used to pay down line of credit. ‘18E EBITDA = $20.8mm represents company
provided estimate.
Current service territory
Future expansion
opportunity
RGC
Resources, Inc.
Roanoke Gas
Company
RGC Midstream,
LLC
Shares o/s (mm) 7.2
% insider owned 8.3%
Float (mm) 6.3
% short interest 2.2%
3
($mm, except where noted) 9/30/17
Share price (as of 12/1/17) $26.87
Fully diluted shares outstanding 7.3
Market cap $197.4
Plus: debt 61.6
Less: cash (0.7)
Enterprise value $258.3
% of 52-week high 84%
% off 52-week low 65%
Credit metrics
Total debt / 2018E EBITDA 3.0x
Total debt / book cap 51%
Total liquidity (cash and avail. RLOC) $39.6
Guidance
2018E EPS $0.92
2019E EPS $1.00

$20.7 $20.3
$18.0 $18.4
$18.9 $18.4
$0
$5
$10
$15
$20
$25
2017A 2018E 2019E 2020E 2021E 2022E
$ mi
llio
n
s
Utility Maintenance Customer Growth SAVE Rider & Station Replacement
Infrastructure riders Weather normalization Purchased gas adjustment System expansion
4
Stable Regulation Environment for Gas Utility Segment
Established, productive relationships with VA SCC
9.75% authorized ROE
100% cast iron and bare steel pipe replaced
System technology and mapping initiative
Roanoke Gas Capital Expenditure Plan (Exclusive of Midstream)
Forecast period (FYE)
SAVE Rider & Station Replacement $47.1 50%
Customer Growth $24.2 26%
Utility Maintenance $22.8 24%
Total $94.1 100%
Forecast totals through 2022
Infrastructure Replacement Rider - SAVE
Approved through 2021
First Generation Plastic: $38mm
3 interconnect stations: $3mm
Coated steel tubing: $6mm
St
ab
le
b
u
si
n
ess
m
o
d
el

5
RGC’s Service Area is Enjoying an Uptick in Economic Growth
Home to over 300,000 people and an economic hub for more than one million people throughout western Virginia
Ranked in the Top 100 Best Places for Business and Careers and Top 15 Most Affordable Places for Doing Business by Forbes.com
High concentration of higher education institutions, with 25 colleges and universities within a 60-mile radius
More than 70 trucking lines serve the region with local, state, and interstate freight service, considered a foreign trade zone
A
tt
rac
ti
ve
e
co
n
o
mic
b
ac
kd
ro
p
Focus on innovation: Virginia Tech and Carilion recently broke ground on their $90 million
research hub in Roanoke The Roanoke Times – 10.21.17
Recently converted operations from 66%
coal to 100% natural gas
Steel Dynamics to invest $28 million at the Roanoke
Bar Division The Roanoke Times – 2.2.17
Ballast Point’s industrial-scale brewery for its East Coast operations is up
and brewing in Roanoke, Va The Roanoke Times – 8.9.17
Humm Kombucha will build a $10 million production and
packaging facility in Roanoke The Roanoke Times – 10.31.17
AEP Transmission will invest $12.7 million to relocate to and expand
in downtown Roanoke The Roanoke Times – 11.14.17
Altec Industries announces $30 million expansion to increase its existing plant
by 65,000 square feet The Roanoke Times – 10.24.17

6
Mountain Valley Pipeline (MVP) – Project Overview & Timeline
RGCO is a 1% owner of the planned $3.5bn MVP
300 mile, 42” underground natural gas pipeline spanning from
northwestern West Virginia to southern Virginia
Will provide two billion cubic feet (2Bcf) of natural gas per day to
New York, Mid- and South- Atlantic markets
Secured firm commitments for the full capacity of the project
under 20-year contracts
The pipeline will deliver a third source of gas with two interconnects
MVP creates expansion opportunities into Franklin County
Milestone Estimated Completion
FERC approval Issued October 13, 2017
Construction begins Early 2018
Targeted in-service date End 2018
Project Partners (% ownership)
MVP Overview
45.5%
BBB-
10%
A
12.5%
A-
1%
31%
A-
G
ro
w
th
p
o
te
n
tia
l
$5
$25
$4
$0
$10
$20
$30
2017A 2018E 2019E
($
m
m
)
MVP capital expenditures
7
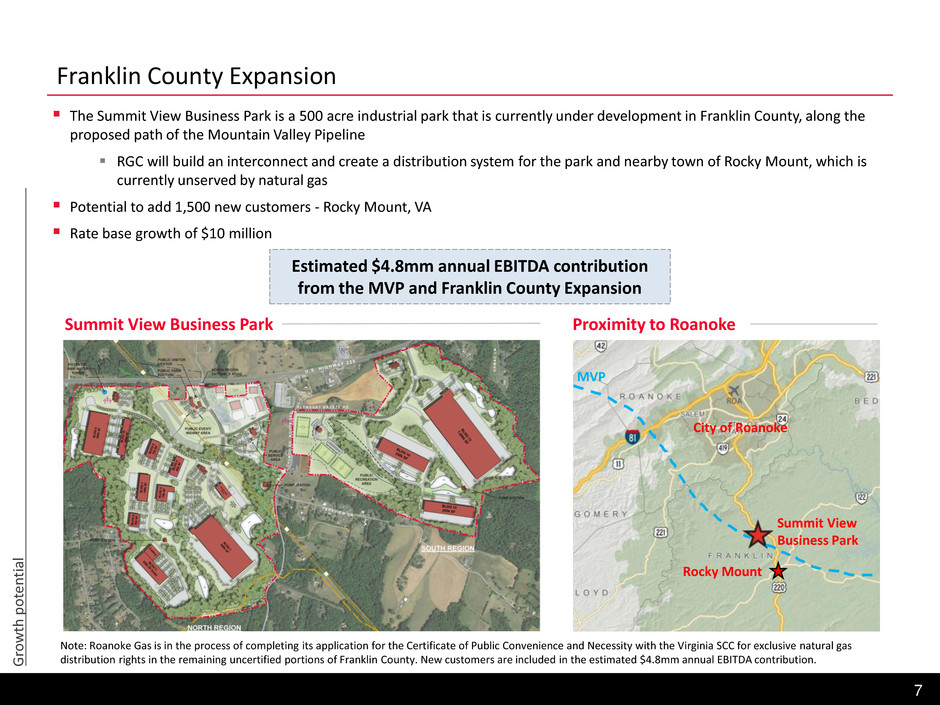
Franklin County Expansion
Estimated $4.8mm annual EBITDA contribution
from the MVP and Franklin County Expansion
Note: Roanoke Gas is in the process of completing its application for the Certificate of Public Convenience and Necessity with the Virginia SCC for exclusive natural gas
distribution rights in the remaining uncertified portions of Franklin County. New customers are included in the estimated $4.8mm annual EBITDA contribution. G
ro
w
th
p
o
te
n
tia
l
The Summit View Business Park is a 500 acre industrial park that is currently under development in Franklin County, along the
proposed path of the Mountain Valley Pipeline
RGC will build an interconnect and create a distribution system for the park and nearby town of Rocky Mount, which is
currently unserved by natural gas
Potential to add 1,500 new customers - Rocky Mount, VA
Rate base growth of $10 million
Summit View
Business Park
City of Roanoke
Summit View Business Park Proximity to Roanoke
Rocky Mount
MVP
8
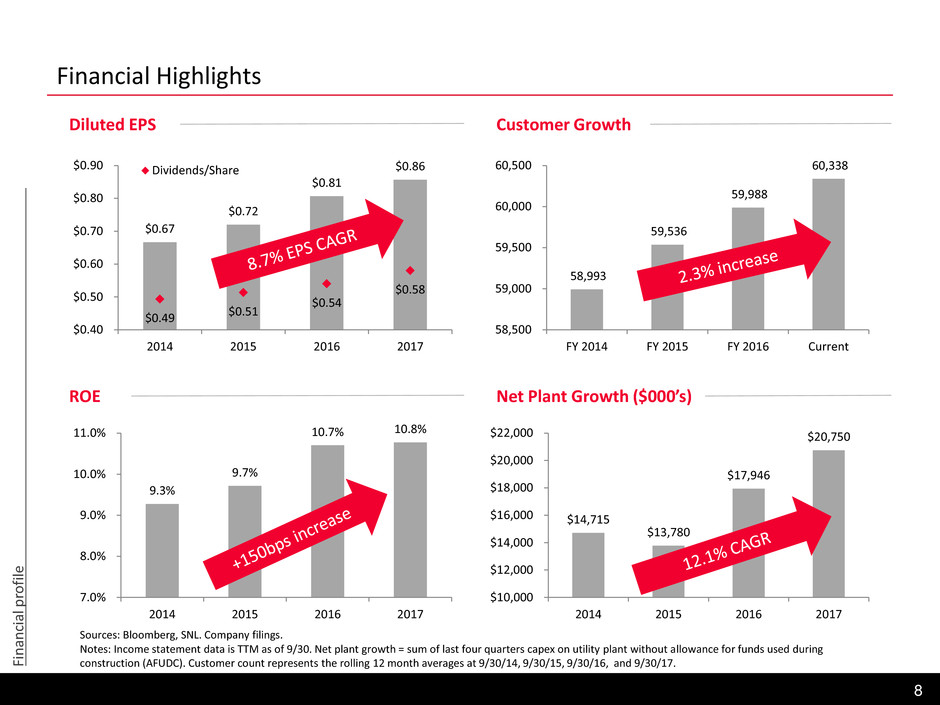
Financial Highlights
Diluted EPS Customer Growth
ROE Net Plant Growth ($000’s)
Sources: Bloomberg, SNL. Company filings.
Notes: Income statement data is TTM as of 9/30. Net plant growth = sum of last four quarters capex on utility plant without allowance for funds used during
construction (AFUDC). Customer count represents the rolling 12 month averages at 9/30/14, 9/30/15, 9/30/16, and 9/30/17. Fi
n
an
cial
p
ro
fil
e
$0.67
$0.72
$0.81
$0.86
$0.49
$0.51
$0.54
$0.58
$0.40
$0.50
$0.60
$0.70
$0.80
$0.90
2014 2015 2016 2017
Dividends/Share
58,993
59,536
59,988
60,338
58,500
59,000
59,500
60,000
60,500
FY 2014 FY 2015 FY 2016 Current
9.3%
9.7%
10.7% 10.8%
7.0%
8.0%
9.0%
10.0%
11.0%
2014 2015 2016 2017
$14,715
$13,780
$17,946
$20,750
$10,000
$12,000
$14,000
$16,000
$18,000
$20,000
$22,000
2014 2015 2016 2017
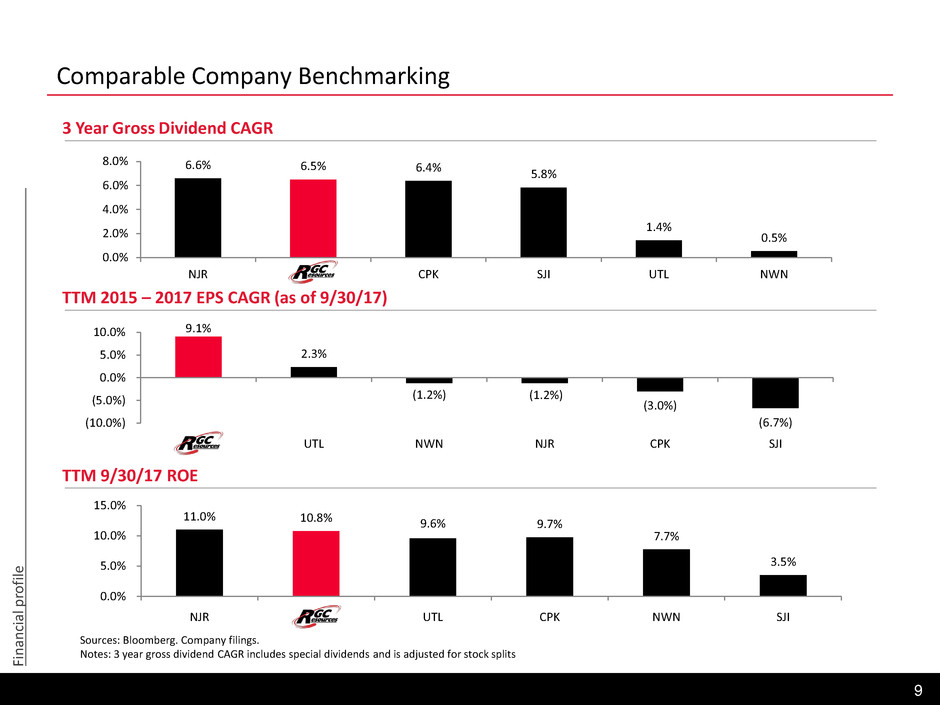
11.0% 10.8% 9.6% 9.7%
7.7%
3.5%
0.0%
5.0%
10.0%
15.0%
NJR RGCO UTL CPK NWN SJI
6.6% 6.5% 6.4%
5.8%
1.4%
0.5%
0.0%
2.0%
4.0%
6.0%
8.0%
NJR RGCO CPK SJI UTL NWN
9.1%
2.3%
(1.2%) (1.2%)
(3.0%)
(6.7%) (10.0%)
(5.0%)
0.0%
5.0%
10.0%
RGCO UTL NWN NJR CPK SJI
9
Comparable Company Benchmarking
3 Year Gross Dividend CAGR
Sources: Bloomberg. Company filings.
Notes: 3 year gross dividend CAGR includes special dividends and is adjusted for stock splits
TTM 2015 – 2017 EPS CAGR (as of 9/30/17)
TTM 9/30/17 ROE
Fi
n
an
cial
p
ro
fil
e
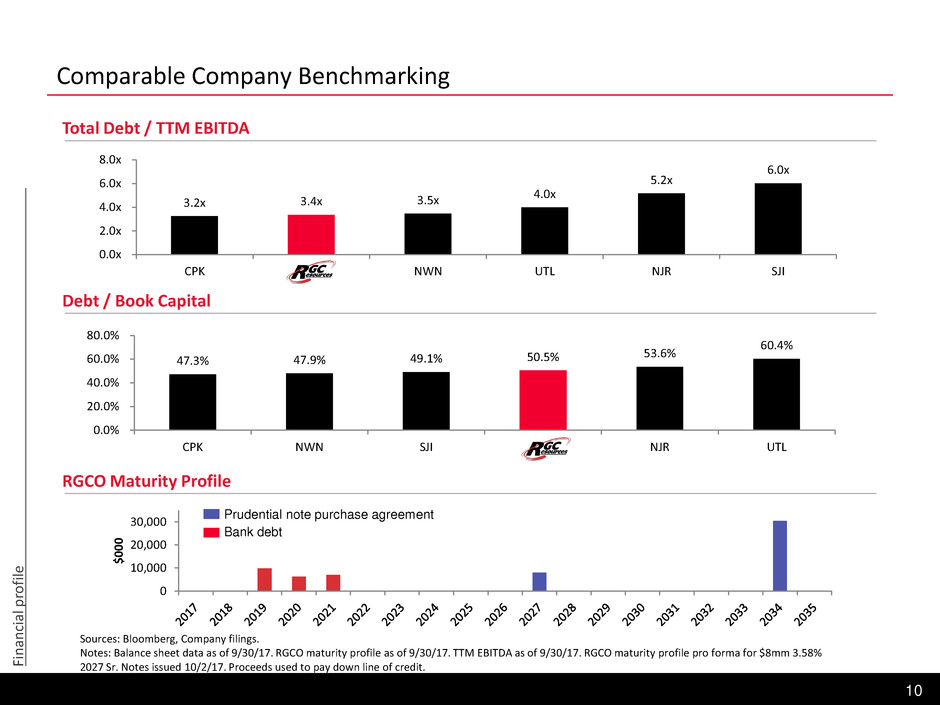
47.3% 47.9% 49.1% 50.5%
53.6%
60.4%
0.0%
20.0%
40.0%
60.0%
80.0%
CPK NWN SJI RGCO NJR UTL
3.2x 3.4x 3.5x
4.0x
5.2x
6.0x
0.0x
2.0x
4.0x
6.0x
8.0x
CPK RGCO NWN UTL NJR SJI
0
10,000
20,000
30,000
$
0
0
0
10
Comparable Company Benchmarking
Total Debt / TTM EBITDA
Debt / Book Capital
RGCO Maturity Profile
Sources: Bloomberg, Company filings.
Notes: Balance sheet data as of 9/30/17. RGCO maturity profile as of 9/30/17. TTM EBITDA as of 9/30/17. RGCO maturity profile pro forma for $8mm 3.58%
2027 Sr. Notes issued 10/2/17. Proceeds used to pay down line of credit.
Prudential note purchase agreement
Bank debt
Fi
n
an
cial
p
ro
fil
e

$0.40
$0.45
$0.50
$0.55
$0.60
$0.65
$0.70
$7.00
$9.00
$11.00
$13.00
$15.00
$17.00
$19.00
$21.00
$23.00
$25.00
$27.00
$29.00
$31.00
D
ivi
d
en
d
s
p
er
s
h
ar
e
($
)
Sh
are
p
rice
($
)
Share price Dividends/share
11
RGC Resources has Delivered Significant Shareholder Value
Source: Bloomberg data as of 12/1/17.
Note: Total returns include total dividends paid over the time period
RGCO total returns
6mo 9%
1yr 67%
3yr 106%
5yr 169%
10yr 317%
6/23/17: Added to
the Russell 3000
D
em
o
n
st
ra
te
d
t
rac
k
re
co
rd
11/27/17: Announced
6.9% dividend increase

12
EBITDA Reconciliation
EBITDA represents net income (loss) before interest expense, provision for income taxes, depreciation and amortization. EBITDA does not represent net income, as that
term is defined under GAAP, and should not be considered as an alternative to net income (loss) as an indicator of our operating performance.
Additionally, EBITDA and is not intended to be a measures of free cash flow available for management or discretionary use as such measures do not consider certain
cash requirements such as capital expenditures, tax payments and debt service requirements. EBITDA as presented herein is not necessarily comparable to similarly
titled measures.
Reconciliation of Net Income to EBITDA - Audited
Quarter ended
LTM 9/30/17 6/30/17 3/31/17 12/31/16
Net income $6,232,865 $159,886 $615,562 $3,225,199 $2,232,218
Add: Provision for income taxes 3,805,390 112,210 343,233 1,977,583 1,372,364
Add: Interest expense 1,917,254 516,953 472,300 469,480 458,521
Add: Depreciation and amortization expense 6,256,737 1,463,467 1,591,090 1,596,090 1,606,090
EBITDA $18,212,246 $2,252,516 $3,022,185 $7,268,352 $5,669,193
N
o
te
s
13
