Attached files
| file | filename |
|---|---|
| EX-23.1 - EXHIBIT 23.1 - Nexeo Solutions, Inc. | a09302017ex231.htm |
| EX-32.1 - EXHIBIT 32.1 - Nexeo Solutions, Inc. | a09302017ex321.htm |
| EX-31.2 - EXHIBIT 31.2 - Nexeo Solutions, Inc. | a09302017ex312.htm |
| EX-31.1 - EXHIBIT 31.1 - Nexeo Solutions, Inc. | a09302017ex311.htm |
| EX-21.1 - EXHIBIT 21.1 - Nexeo Solutions, Inc. | a09302017ex211.htm |
| EX-12.1 - EXHIBIT 12.1 - Nexeo Solutions, Inc. | a09302017ex121.htm |
| EX-10.12 - EXHIBIT 10.12 - Nexeo Solutions, Inc. | a09302017ex1012.htm |
| EX-10.7 - EXHIBIT 10.7 - Nexeo Solutions, Inc. | a09302017ex107.htm |
UNITED STATES
SECURITIES AND EXCHANGE COMMISSION
Washington, D.C. 20549
FORM 10-K |
(Mark One)
ý ANNUAL REPORT PURSUANT TO SECTION 13 OR 15(d) OF THE SECURITIES EXCHANGE ACT OF 1934
For the fiscal year ended September 30, 2017
or
o TRANSITION REPORT PURSUANT TO SECTION 13 OR 15(d) OF THE SECURITIES EXCHANGE ACT OF 1934
For the transition period from to
Commission File Number: 001-36477
NEXEO SOLUTIONS, INC.
(Exact name of registrant as specified in its charter)
Delaware | 46-5188282 | |
(State or other jurisdiction of incorporation or organization) | (I.R.S. Employer Identification No.) | |
3 Waterway Square Place, Suite 1000 The Woodlands, Texas | 77380 | |
(Address of principal executive offices) | (Zip Code) | |
(281) 297-0700
(Registrant’s telephone number, including area code)
Securities registered pursuant to Section 12(b) of the Act:
Title of each class | Name of each exchange on which registered | |
Units, each consisting of one share of Common Stock, | NASDAQ Capital Market | |
$0.0001 par value, and one Warrant to purchase Common Stock | ||
Common Stock, $0.0001 par value | NASDAQ Capital Market | |
Warrants to purchase Common Stock | NASDAQ Capital Market | |
Securities registered pursuant to Section 12(g) of the Act:
None.
Indicate by check mark if the registrant is a well-known seasoned issuer, as defined in Rule 405 of the Securities Act. o Yes ý No
Indicate by check mark if the registrant is not required to file reports pursuant to Section 13 or Section 15(d) of the Act. o Yes ý No
Indicate by check mark whether the registrant (1) has filed all reports required to be filed by Section 13 or 15(d) of the Securities Exchange Act of 1934 during the preceding 12 months (or for such shorter period that the registrant was required to file such reports), and (2) has been subject to such filing requirements for the past 90 days. ý Yes o No
Indicate by check mark whether the registrant has submitted electronically and posted on its corporate website, if any, every Interactive Data File required to be submitted and posted pursuant to Rule 405 of Regulation S-T (§ 232.405 of this Chapter) during the preceding 12 months (or for such shorter period that the registrant was required to submit and post such files). ý Yes o No
Indicate by check mark if disclosure of delinquent filers pursuant to Item 405 of Regulation S-K (§ 299.405 of this Chapter) is not contained herein, and will not be contained, to the best of registrant’s knowledge, in definitive proxy or information statements incorporated by reference in Part III of this Form 10-K or any amendment to this Form 10-K. o
Indicate by check mark whether the registrant is a large accelerated filer, an accelerated filer, a non-accelerated filer, or a smaller reporting company. See the definitions of "large accelerated filer," "accelerated filer" and "smaller reporting company" in Rule 12b-2 of the Exchange Act. (Check one):
Large accelerated filer o | Accelerated filer x | |
Non-accelerated filer o (Do not check if a smaller reporting company) | Smaller reporting company o | |
Emerging growth company o | ||
If an emerging growth company, indicate by check mark if the registrant has elected not to use the extended transition period for complying with any new or revised financial accounting standards provided pursuant to Section 13(a) of the Exchange Act. o | ||
Indicate by check mark whether the registrant is a shell company (as defined in Rule 12b-2 of the Exchange Act). Yes o No ý
The aggregate market value of the voting stock held by non-affiliates of Nexeo Solutions, Inc. was $294,545,118 as of March 31, 2017, using the definition of beneficial ownership contained in Rule 13d-3 promulgated pursuant to the Securities Exchange Act of 1934, as amended, and excluding shares held by directors and executive officers. As of December 5, 2017, there were 89,753,662 shares of the Company's common stock issued and 89,741,309 shares outstanding, par value $0.0001 per share.
DOCUMENTS INCORPORATED BY REFERENCE:
Portions of the definitive proxy statement relating to the 2018 Annual Meeting of Stockholders of Nexeo Solutions, Inc., which will be filed with the Securities and Exchange Commission within 120 days of September 30, 2017, are incorporated by reference in Item 10, Item 11, Item 12, Item 13 and Item 14 of Part III of this Form 10-K.
TABLE OF CONTENTS
i
GLOSSARY
The following terms and abbreviations appearing in the text of this Annual Report on Form 10-K have the meanings indicated below.
2016 LTIP | The Nexeo Solutions, Inc. 2016 Long Term Incentive Plan |
ABL Borrowers | Holdings, Sub Holding and Solutions together with Nexeo Solutions Canada Corporation |
ABL Facility | The asset-based credit facility pursuant to that certain asset-based credit agreement by and among the ABL Borrowers, Bank of America, N.A., as administrative agent and the lenders party thereto and the other parties thereto |
ADA Purchase Agreement | The Ashland Distribution Acquisition purchase agreement |
Archway Acquisition | The acquisition by the Predecessor of 100% of the outstanding shares of capital stock of Archway Sales, Inc. and substantially all of the assets of JACAAB, a related business of Archway Sales, Inc., that closed on April 1, 2014 |
ASC | The FASB Accounting Standards Codification |
Ashland | Ashland Inc. and its subsidiaries |
ASU | Accounting Standards Update issued by the FASB |
Blocker | TPG Accolade Delaware, L.P. |
Blocker Merger | The merger of Blocker Merger Sub into Blocker on June 9, 2016, immediately following the Company Merger, with Blocker continuing as the surviving entity |
Blocker Merger Sub | Neon Acquisition Company LLC, which was a wholly-owned subsidiary of WLRH at the time of the Blocker Merger |
Business Combination | The business combination between WLRH and Holdings pursuant to the Merger Agreement, which was consummated on the Closing Date |
CAA | U.S. Federal Clean Air Act |
CAD | Canadian dollar |
Canadian Tranche | Canadian tranche of the ABL Facility |
CERCLA | U.S. Comprehensive Environmental Response, Compensation and Liability Act |
CFATS | U.S. Chemical-Facility Anti-Terrorism Standards |
Closing Date | June 9, 2016 |
Company / Successor / Nexeo | Nexeo Solutions, Inc. (f/k/a WL Ross Holding Corp.) and its consolidated subsidiaries |
Company Merger | The merger of Company Merger Sub with and into Holdings consummated on June 9, 2016, with Holdings continuing as the surviving entity |
Company Merger Sub | Neon Holding Company LLC, which was a wholly-owned subsidiary of WLRH at the time of the Company Merger |
Company's 2018 Proxy Statement | The Company's proxy statement relating to its 2018 Annual Meeting of Stockholders |
Credit Facilities | The ABL Facility and the Term Loan Facility, collectively |
CWA | U.S. Clean Water Act |
Deferred Cash Consideration | The deferred payment to be made in cash to the Selling Equityholders pursuant to the Merger Agreement, where such deferred cash payments will generally be in an amount equal to the Company’s prevailing stock price at the time that the Company pays such deferred cash payments multiplied by the number of Excess Shares or as otherwise set forth in the Merger Agreement |
DHS | U.S. Department of Homeland Security |
Director Founder Shares | The 30,000 original Founders Shares transferred to the Company’s prior independent directors |
Distribution Business | The global distribution business purchased by the Predecessor from Ashland |
DTSC | California Department of Toxic Substances Control |
EBITDA | Earnings before interest, tax, depreciation and amortization |
EMEA | Europe, Middle East and Africa |
EPA | U. S. Environmental Protection Agency |
EPCRA | U.S. Emergency Planning and Community Right-To-Know Act |
ii
EPS | Earnings or loss per share |
ERP | Enterprise resource planning |
Excess Shares | The 5,178,642 shares of Company common stock used to calculate the Deferred Cash Consideration payable to the Selling Equityholders pursuant to the Merger Agreement |
Exchange Act | U.S. Securities Exchange Act of 1934, as amended |
FASB | Financial Accounting Standards Board |
FCPA | U.S. Foreign Corrupt Practices Act |
FHMTL | U.S. Federal Hazardous Material Transportation Law |
FILO Tranche | $30.0 million tranche within the ABL Facility for non-Canadian foreign subsidiaries to issue loans and letters of credit |
FPA | First Pacific Advisors, LLC |
Founder Shares | The 12,506,250 shares of Company common stock issued to the Sponsor at the time of the IPO |
GDP | Gross domestic product |
Holdings | Nexeo Solutions Holdings, LLC |
HMR | U.S. Hazardous Materials Regulations |
IPO | The initial public offering of WLRH, consummated on June 11, 2014 |
Merger Agreement | Agreement and Plan of Merger, as amended, by and among WLRH, Blocker Merger Sub, Company Merger Sub, Holdings, Blocker, and New Holdco dated as of March 21, 2016 |
Mergers | The Company Merger and the Blocker Merger, collectively |
Montgomery Lease | The Company’s leased facility in Montgomery, Illinois commencing in the first fiscal quarter of 2017 |
NASDAQ | NASDAQ Stock Market |
New Holdco | Nexeo Holdco, LLC |
Nexeo Plaschem | Nexeo Plaschem (Shanghai) Co., Ltd., a wholly-owned subsidiary of the Company |
NLRB | U.S. National Labor Relations Board |
Notes | 8.375% Senior Subordinated Notes of the Predecessor due 2018 |
OSH Act | U.S. Occupational Safety and Health Act of 1970 |
OSHA | U.S. Occupational Safety and Health Administration which administers the OSH Act |
Other Retained Remediation Liabilities | Under the ADA Purchase Agreement, Ashland agreed to retain environmental remediation liabilities unknown at the closing of the Ashland Distribution Acquisition related to the Distribution Business for which Ashland receives notice prior to the fifth anniversary of the closing of the ADA Purchase Agreement |
Performance-Based Units | Units within the Predecessor Equity Plan that vest in accordance with a performance-based schedule |
Peso | Mexican peso |
Predecessor | Holdings and its subsidiaries for the periods prior to the Closing Date |
Predecessor ABL Facility | Holdings asset-based credit facility which was terminated in connection with the Business Combination |
Predecessor Credit Facilities | Predecessor ABL Facility and Predecessor Term Loan Facility, collectively |
Predecessor Equity Plan | Predecessor restricted equity plan |
Predecessor Term Loan Facility | Holdings’ senior secured term loan credit facility which was terminated in connection with the Business Combination |
PSLRA | U.S. Private Securities Litigation Reform Act of 1995 |
PSU | Performance share unit issued under the 2016 LTIP |
RCRA | U.S. Resource Conservation and Recovery Act |
Retained Remediation Liabilities | Under the ADA Purchase Agreement, collectively, the Retained Specified Remediation Liabilities and the Other Retained Remediation Liabilities |
Retained Specified Remediation Liabilities | Under the ADA Purchase Agreement, Ashland agreed to retain all known environmental remediation liabilities as of the date of closing of the ADA Purchase Agreement |
RMB | Chinese renminbi |
iii
RSU | Restricted stock unit issued under the 2016 LTIP |
Ryder | Ryder Truck Rental, Inc. |
Ryder Lease | Lease Agreement entered into by and between the Predecessor and Ryder in May 2015 for certain transportation equipment with payments of approximately $35.0 million over seven year term. |
SAFE | People’s Republic of China State Administration of Foreign Exchange |
SEC | U.S. Securities and Exchange Commission |
Secured Net Leverage Ratio | The ratio of Consolidated Total Indebtedness divided by EBITDA (terms as defined in the Term Loan Facility agreement) |
Securities Act | U.S. Securities Act of 1933, as amended |
Selling Equityholders | The holders of equity interests in Holdings (other than Blocker) and the holders of equity interests in Blocker, in each case, as of the time immediately prior to the Business Combination |
Solutions | Nexeo Solutions, LLC |
Sponsor | WL Ross Sponsor LLC, the sponsor entity of WLRH prior to the Business Combination. |
Sub Holding | Nexeo Solutions Sub Holding Corp. |
Term Loan Facility | Term loan credit facility pursuant to that certain credit agreement by and among Holdings, Solutions, Sub Holding, Bank of America, N.A., as administrative and collateral agent, the other agents party thereto and the lenders party thereto |
Time-Based Units | Units within the Predecessor’s Equity Plan |
TLB Amendment No. 1 | The amendment to the Term Loan Facility dated March 22, 2017 |
TPG | TPG Capital, L.P. together with its affiliates, including TPG Accolade |
TPG Accolade | TPG Accolade, L.P. |
TPG Restricted Stock Grants | Restricted stock agreements entered into between TPG and certain of the Company’s officers and employees |
TRA | The Tax Receivable Agreement entered into in connection with the Business Combination, by and between the Company and the Selling Equityholders, dated as of June 9, 2016 |
TSCA | U.S. Toxic Substances Control Act |
U.K. | The United Kingdom |
Ultra Chem Acquisition | The April 3, 2017 acquisition of the equity interests of the Mexico City, Mexico based chemicals distribution business of the Ultra Chem Group pursuant to the Ultra Chem Stock Purchase Agreement |
Ultra Chem Closing Date | April 3, 2017 |
Ultra Chem Group | The Mexico City, Mexico based chemicals distribution business of Ultra Chem, S. de R.L. de C.V. and its related entities |
Ultra Chem Stock Purchase Agreement | The Stock Purchase Agreement dated March 9, 2017 related to the purchase of the equity interests of Ultra Chem Group |
U.S. | United States of America |
USD | U.S. Dollar |
U.S. GAAP | U.S. Generally accepted accounting principles |
U.S. Tranche | U.S. Tranche of the ABL Facility |
WLRH | WL Ross Holding Corp. |
iv
Unless the context otherwise requires, the financial information presented in this Annual Report on Form 10-K (this "Form 10-K") is the financial information of the Company on a consolidated basis together with its subsidiaries.
The terms "the Company," "us," "our" and "we" and similar terms in this Annual Report on Form 10-K refer to Nexeo Solutions, Inc. and its consolidated subsidiaries.
TRADEMARKS AND TRADE NAMES
We own or have rights to various trademarks, service marks, and trade names that we use in connection with the operation of our business. This Form 10-K may also contain trademarks, service marks and trade names of third parties, which are the property of their respective owners. Third party trademarks, services marks, trade names or products used or displayed in this Form 10-K belong to the holders and are not intended to, and do not imply a relationship with, or endorsement or sponsorship by us. Solely for convenience, the trademarks, service marks and trade names referred to in this Form 10-K may appear without the ®, TM or SM symbols, but omission of these references is not intended to indicate, in any way, that we will not assert, to the fullest extent under applicable law, our right or the right of the applicable licensor to these trademarks, service marks and trade names.
v
CAUTIONARY NOTE REGARDING FORWARD-LOOKING STATEMENTS
Certain information and statements contained in this Annual Report on Form 10-K are forward-looking statements within the meaning of the PSLRA codified in Section 27A of the Securities Act, and Section 21E of the Exchange Act, as amended. This statement is included for purposes of complying with the safe harbor provisions of the PSLRA. Forward-looking statements include statements regarding our expectations, beliefs, intentions, plans, objectives, goals, strategies, future events or performance and underlying assumptions and other statements that are other than statements of historical facts. These statements may be identified, without limitation, by the use of forward-looking terminology such as "anticipate," "assume," "believe," "estimate," "expect," "intend," "plan," "project," "may," "will," "could," "would" and similar expressions. Certain forward-looking statements are included in this Annual Report on Form 10-K, principally in the sections captioned "Item 7. Management’s Discussion and Analysis of Financial Condition and Results of Operations."
These forward-looking statements are based on our current expectations and beliefs concerning future developments and their potential effect on us. While management believes that these forward-looking statements are reasonable as and when made, there can be no assurance that future developments affecting us will be those that we anticipate. Unless otherwise indicated or the context otherwise requires, comments concerning our expectations for future revenues and operating results are based on our forecasts for our existing operations and do not include the potential impact of any future acquisitions. Our forward-looking statements involve significant risks and uncertainties (some of which are beyond our control) and assumptions that could cause actual results to differ materially from our and our Predecessor’s historical experience and our present expectations or projections.
Our future results will depend upon various other risks and uncertainties, including those described in "Item 1A. Risk Factors." Readers are cautioned not to place undue reliance on forward-looking statements, which speak only as of the date of this Annual Report on Form 10-K. We undertake no obligation to update or revise any forward-looking statements after the date they are made, whether as a result of new information, future events or otherwise. All forward-looking statements attributable to us are qualified in their entirety by this cautionary statement.
vi
PART I
Item 1. Business
Company Overview
We are a global chemicals distributor in North America and Asia and a global plastics distributor in North America, EMEA and Asia. In connection with the distribution of chemicals products, we provide value-added services such as custom blending, packaging and re-packaging, private-label manufacturing and product testing in the form of chemical analysis, product performance analysis and product development. We also provide on-site and off-site environmental services, including waste collection, recovery, disposal services and recycling in North America, primarily the U.S., through our Environmental Services line of business. During fiscal year 2017, we distributed over 24,000 products in more than 80 countries for approximately 1,400 suppliers to approximately 28,100 customers.
We have long-standing relationships with major chemicals and plastics producers and suppliers, a strong geographic presence and supply chain network and a balanced customer base that benefits from the service and distribution value we provide. The products we distribute are used in various end markets and customer segments within a broad cross section of manufacturing industries, including the household, industrial and institutional, lubricants, performance coatings (including architectural coatings, adhesives, sealants and elastomers), automotive, healthcare, personal care, oil and gas and construction end markets.
Our diverse array of product offerings allows us to provide many of our customers with a one-stop-shop resource for their chemicals and plastics needs. For customers with multiple locations, our centralized business model helps ensure consistency of product offerings and a single point of contact. Our services and broad product offerings allow for product customization, cost savings to customers on transaction and transportation costs and reliance on a single supplier to source all of a customer's diverse product requirements.
We believe we provide a compelling value proposition to suppliers as a single bulk buyer of their products and acting as an extension of their sales force by representing their brands and providing technical support to customers. Our deep understanding of key end markets presents suppliers with additional market reach and penetration opportunities, while our operating platform supports supplier visibility into the marketing and distribution of their products. We also believe we provide value to suppliers by distributing to larger customers through dedicated strategic accounts sales and marketing programs designed to solidify key relationships through enhanced customer service, efficient delivery and specialized value-added solutions. In addition to the value-added services mentioned above, we also provide dedicated stocking programs, vendor-managed inventory, quarterly customer demand forecasting, technical support and supply chain services.
We have an experienced management team with deep knowledge of the industry. We continue to implement strategies and invest to build upon our strengths by creating industry-leading marketing capabilities, including our focus on specific end markets, sales force effectiveness tools, market-based pricing and geographic expansion.
We distribute our product portfolio through a global supply chain consisting of approximately 180 owned, leased or third party warehouses, rail terminals and tank terminals with a private fleet of approximately 1,100 units, including tractors and trailers, primarily in North America. We currently employ approximately 2,640 employees globally. At September 30, 2017, we had approximately 500 sales professionals in North America, EMEA and Asia, including technical support, field managers and strategic account managers who assist our customers in the selection and application of commodity and specialty products for their end products and processes.
1
Company History
We were formed as a Delaware corporation on March 24, 2014, under the name WL Ross Holding Corp., as a special purpose acquisition company for the purpose of effecting a merger, capital stock exchange, asset acquisition, stock purchase, reorganization or similar business combination with one or more businesses. We completed our IPO in June 2014, raising approximately $500.0 million in cash proceeds. We neither engaged in any operations nor generated any revenue prior to the Business Combination.
We acquired the business of Nexeo Solutions Holdings, LLC on June 9, 2016 through the Business Combination. In connection with the closing of the Business Combination, we changed our name from "WL Ross Holding Corp." to "Nexeo Solutions, Inc." and changed our ticker symbol for our common stock on NASDAQ from "WLRH" to "NXEO".
See Note 3 to our consolidated financial statements for further discussion on the Business Combination.
Industry Overview
The global market for industrial materials encompasses the products we offer. This market contains both products distributed directly to customers by suppliers and indirectly by distribution channel partners. Indirect distribution channel partners, like us, serve as intermediaries between suppliers and customers representing an additional step in the distribution supply chain. Suppliers leverage their distribution partners to administer the complexity of servicing the small and mid-size customer base while providing needed technical product expertise. The total available market of distribution is driven by macroeconomic factors, as well as suppliers’ decisions to either serve markets or customers directly or use a distribution partner. By creating and executing superior distribution services and related capabilities, we hope to influence the decision of suppliers to increase the magnitude of business being served by us as a distribution partner in the global market.
The chemicals and plastics materials distribution industry is characterized by increasingly complex regulatory, environmental and safety landscapes, the need for market intelligence that requires time and effort to develop and, in some cases, significant capital investments for transportation and storage infrastructure. Adding to the complexity of this business environment is the increasing demand by end customers for individualized solutions. These solutions are generally comprised of essential products and value-added services including blending, packaging and other special handling and special logistics requirements such as 24/7 delivery. We believe our ability to serve these complex needs as a result of our capabilities and scale will encourage suppliers to further leverage distributors like us.
2
Company Operations
Business Strategy
We strive to become a brand extension partner for key suppliers, provide best-in-class service, and align our sales force expertise with our customers' needs. Our value proposition focuses on supplier needs and direct customer activities. We have established four main strategies that drive our formula for success.
Go-To-Market Strategy. We aspire to use our technical capabilities, expertise and experience to commercially align with supplier strategies to operate as a brand extension while leveraging tools and systems to drive long-term loyalty through trust and transparency. Our sales force drives our customer-focused growth by utilizing technical expertise. The customer's journey is enhanced with a customized interface tailored for each customer's individual needs.
Profitability Growth & Margin Expansion. We seek to form strategic partnerships by leveraging foundational capabilities to demonstrate value propositions. We plan to optimize our portfolio by eliminating low profit business, expanding specialty product mix and executing ongoing productivity initiatives. To supplement growth, we plan to pursue accretive bolt-on acquisitions of product lines and businesses complementary to our current offerings.
Operational Excellence. We are committed to continued operational excellence by broadening our value-added service capabilities and delivering best-in-class service through a culture of continuous improvement. We focus on pricing strategies to optimize profit and efficient cash utilization through fully integrated purchasing and global enterprise cash management. Our commitment to high quality service is demonstrated by dedicated customer service representatives, Company-owned warehouses, a private fleet having an on-time delivery percentage of 99.1% and sophisticated inventory management practices.
Driving Scale & Fostering Innovation. We benefit from data-driven decision making and focus on scalable, long-term growth drivers. We continuously drive synergies by leveraging our centralized platform.
Competitive Strengths
We operate in a competitive industry and strive to differentiate ourselves from our competition by providing true end-to-end solutions, which requires using the right combination of integrated services that have the capacity and sophistication to serve larger customers while maintaining enough versatility to serve smaller customers. We believe our strengths include the following:
• | Centralized, scalable technology platform that allows us to efficiently manage the inherent complexity of our business and supports value creation by unlocking scale and scope efficiencies from both organic growth and strategic acquisitions; |
• | Exceptional distribution network with strategically located facilities optimizing route density; and |
• | Extensive product knowledge and end market expertise allowing us to act as an extension of our suppliers while providing application-based, value-added services to our customers. |
Segment Overview
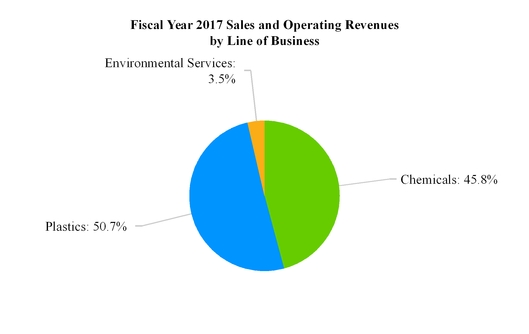
We operate through three lines of business, or operating segments: Chemicals, Plastics and Environmental Services. Our lines of business market to different sets of customers operating in an array of different industries, with various end markets and customer segments within those industries. For segment presentation and disclosure purposes, our Chemicals and Plastics lines of business constitute separate reportable segments, while our Environmental Services line of business, which does not meet the materiality threshold for separate disclosure, is included in an "Other" category.
Chemicals. Our Chemicals line of business distributes specialty and industrial chemicals, additives and solvents to industrial users via railcars, barges and bulk tanker trucks and as packaged goods in trucks. Our chemicals products are distributed in more than 50 countries worldwide, primarily in North America and Asia. In connection with the distribution of chemicals products, we provide value-added services such as custom blending, packaging and re-packaging, private-label manufacturing and product testing in the form of chemical analysis, product performance analysis and product development. While our Chemicals line of business serves multiple end markets, the key end markets within the industrial space are household, industrial and institutional, performance coatings (including architectural coatings, adhesives, sealants and elastomers), lubricants, oil and gas and personal care.
3
Plastics. Our Plastics line of business distributes a broad product line consisting of commodity polymer products and prime engineering resins to plastics processors engaged in blow molding, extrusion, injection molding and rotation molding via railcars, bulk trucks, truckload boxes and mixed truckloads, or less-than-truckload quantities. We distribute plastics products in more than 50 countries worldwide, primarily in North America, EMEA and Asia. Our Plastics line of business serves a broad cross section of industrial segments with a current focus on the automotive and healthcare end markets.
Environmental Services. Our Environmental Services line of business, in connection with certain waste disposal service companies, provides customers with comprehensive on-site and off-site hazardous and non-hazardous waste collection, recovery, disposal services or recycling in North America, primarily in the U.S. These environmental services are offered through our network of distribution facilities used as transfer facilities and through a staff of dedicated on-site waste professionals. Our Environmental Services line of business serves multiple end markets such as aerospace and defense, automotive, chemical manufacturing, industrial manufacturing and oil and gas.
The table below provides a summary by line of business of the approximate number of customers served and key product offerings as of September 30, 2017:
Chemicals | Plastics | Environmental Services | |||
Approximate Customers: 14,200(1) | Approximate Customers: 11,700(1) | Approximate Customers: 2,200(1) | |||
Key Products | ž Alcohols ž Blends ž Esters ž Glycols ž Hydrocarbons ž Ketones ž Resins ž Silicones ž Surfactants | ž Engineered Thermoplastics ž Polyolefins (including Polypropylene) ž Specialty Thermoplastics ž Styrenics | ž On-Site Services ž Non-Hazardous and Hazardous Waste Disposal ž Non-Hazardous Waste Treatment/Recycling | ||
(1) Customer duplication between lines of business is immaterial | |||||
In each of the past three fiscal years, polypropylene was the only product that accounted for over 10.0% of our consolidated net revenue. During the fiscal years ended September 30, 2017 and 2016, polypropylene accounted for 15.5% and 17.6%, respectively, of total consolidated net revenue. For the period from October 1, 2015 through June 8, 2016 and the fiscal year ended September 30, 2015, polypropylene accounted for 17.7% and 14.4%, respectively, of the Predecessor total consolidated net revenue.
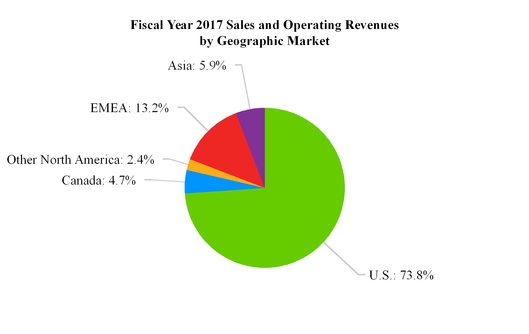
The charts below provide a summary of the proportional revenue contributions from our lines of business and our primary geographic markets during the fiscal year ended September 30, 2017, based on the jurisdiction of the subsidiary entity receiving revenue credit for the sale. It was not practical to provide a summary of the revenue contributions of our primary geographic markets based on external customer location. The substantial majority of our sales to customers in the geographic markets described below are made by entities located within the applicable geographic market.
4
Our lines of business generally leverage the same infrastructure, distribution networks, information technology and operational processes, but are differentiated by the products they distribute, their geographic footprints and their distinct customer and supplier relationships. See Note 16 to our consolidated financial statements for additional financial information with respect to our reportable segments.
5
Supplier Relationships
We source chemicals and plastics from a wide array of suppliers, including many leading global chemicals and plastics producers. We generally purchase and take possession of these products and then resell and deliver them to our customers. While our top ten suppliers generally fulfill approximately 50% of total product procured by value on an annual basis, we source products from approximately 1,400 suppliers. Two suppliers accounted for 12.1% and 9.9%, respectively, of consolidated purchases during the fiscal year ended September 30, 2017, and 11.9% and 10.4%, respectively, for the fiscal year ended September 30, 2016. Two suppliers accounted for 12.0% and 9.8%, respectively, for the period from October 1, 2015 through June 8, 2016 for the Predecessor consolidated purchases. During the fiscal year ended September 30, 2015 one of these suppliers accounted for 11.9% of the Predecessor consolidated purchases. Although this supplier serves both our Plastics and Chemicals lines of business, they primarily serve the Plastics line of business.
We maintain multiple sourcing options for most key products that we distribute to help ensure supply continuity and competitive pricing for our customers. We believe the depth of our supplier base ensures that we are able to satisfy the needs of all of our customers in all of our key geographic regions.
Our Chemicals and Plastics lines of business generally source products from distinct sets of suppliers.
• | Chemicals. We source chemicals from many suppliers, including several of the largest global chemical companies such as BASF, DowDuPont, Dow Corning, Eastman Chemical, LyondellBasell and Methanex. Our ten largest suppliers generally account for approximately 50% by value of the chemical products procured on an annual basis. |
• | Plastics. Our plastics suppliers include several of the largest global chemical companies and plastics producers, such as BASF, Borealis, ExxonMobil Chemical Co., LyondellBasell and SABIC. Our ten largest suppliers generally account for approximately 80% by value of the plastics products procured on an annual basis. |
In developing our supplier relationships, we evaluate prospective suppliers to determine the value they offer to the supply chain. We focus on suppliers that manufacture products utilized within the end markets we serve and provide opportunities that maintain healthy demand. Our key suppliers must also demonstrate a proven track record of reliability and commitment to invest in their businesses, as well as product price leadership.
We believe we provide value to suppliers in numerous ways, including the following:
• | We serve as an aggregator of customer demand, enabling us to act as a single bulk buyer of our suppliers’ products; |
• | We act as an extension of suppliers’ sales force by representing their brands and providing technical support to customers, particularly those that are small and mid-sized, as well as larger customers through our strategic accounts program; |
• | We develop compelling value propositions in various end markets by providing core commodity products, core specialty products and value-added services to target certain customer segments we believe can generate sustainable and profitable revenue growth; |
• | We provide quarterly customer demand forecasting and visibility into the marketing and distribution of the suppliers’ products; and |
• | We have leading pricing technology to capture maximum value for our suppliers' brands in the marketplace. |
Product Line Management and Purchasing
Our supplier relationships are managed by separate product management teams within our Chemicals and Plastics lines of business. These teams focus on developing and maintaining supplier relationships, monitoring existing product lines and trends, and analyzing potential new products. Product management teams work in close coordination with our sales and marketing teams, allowing them to quickly and effectively identify customer buying and demand trends.
Our purchasing department is generally responsible for executing purchase orders to suppliers through our ERP system. For the majority of our operations, this system provides a centralized control platform throughout the entire supply chain, enabling the purchasing department to optimize procurement decisions. See "—Proprietary Operating Systems" below.
6
Contracts
Our supply agreements allow flexibility, to help ensure product availability and our ability to set the specific terms of any purchase in accordance with prevailing market conditions. The agreements include commonly expected general terms and conditions such as volume expectations, pricing, price change mechanisms and guidelines for conflict resolution. Many of the agreements with key suppliers also provide for rebates upon achievement of specified volume purchase levels. Purchase prices are generally market-based and fluctuate in accordance with the costs of the relevant raw materials. We do not usually enter into contracts that are non-terminable, are "take or pay" or have other similar requirements.
Global Distribution Channels
We are organized around the philosophy that key operating processes, such as demand forecasting, purchasing and supplier selection, can be optimized for cost and efficiency when concentrated in a centralized business model. Accordingly, we operate our distribution network under a "hub-and-spoke" model by processing large volumes of inventory at our main regional hubs and shipping them to smaller local warehouses on a demand-driven basis from where they are delivered to customers. Products are transported to smaller customers in mixed truckloads or less-than-truckload quantities.
Facilities
Our facilities are strategically placed to optimize route density in an effort to balance high-quality customer service with execution costs. In North America, we operate several "hub-and-spoke" models as described above. We believe this model is beneficial, as it enables us to efficiently aggregate customer demand, and allows us to match a large number of suppliers and customers at a lower cost. This system also supports economies of scale, which is a key driver of our profitability, as the aggregation of inventory at the "hubs" reduces inventory procurement costs and permits fleet optimization and efficient route planning through shipment consolidation and frequent deliveries to the "spokes." During fiscal year 2017, these facilities served approximately 21,300 customers.
In EMEA, our international plastics business operates through 25 third party operated warehouses and eight sales offices. These warehouses are located across EMEA, and during fiscal year 2017 they served approximately 4,700 customers.
In Asia, our international chemicals and plastics businesses operate through 17 third party operated warehouses and eight sales offices. These warehouses are located in China and served approximately 1,900 customers during fiscal year 2017.
The following table lists each of the active distribution facilities we own or lease and does not include third party operated facilities. We classify a facility as a "bulk facility" if it is engaged in delivering goods in bulk to our customers.
Distribution Facilities as of September 30, 2017
North American Facilities | Facility Type | Owned/Leased | Line(s) of Business | |||
Birmingham, Alabama | Bulk/Warehouse | Owned | All | |||
Mobile, Alabama | Bulk/Warehouse | Owned | All | |||
Edmonton, Alberta | Bulk/Warehouse | Owned | All | |||
Chandler, Arizona | Bulk/Warehouse | Owned | All | |||
Richmond, British Columbia | Warehouse | Leased | All | |||
Carson, California (1) | Bulk/Warehouse | Leased | All | |||
Fairfield, California | Bulk/Warehouse | Owned/Leased | All | |||
Denver, Colorado | Bulk/Warehouse | Owned | All | |||
Miami, Florida | Bulk/Warehouse | Owned | Chemicals and Plastics | |||
Tampa, Florida | Bulk/Warehouse | Owned | Chemicals and Plastics | |||
Doraville, Georgia | Bulk/Warehouse | Owned | Chemicals and Plastics | |||
Cropa, Guatemala | Warehouse | Leased | Chemicals | |||
Montgomery, Illinois | Bulk/Warehouse | Leased | Chemicals and Plastics | |||
Willow Springs, Illinois | Bulk/Warehouse | Owned | All | |||
Kansas City, Kansas | Bulk/Warehouse | Owned | All | |||
Kansas City, Kansas | Bulk/Warehouse | Leased | Plastics | |||
7
Baton Rouge, Louisiana | Bulk/Warehouse | Owned | Chemicals and Plastics | |||
Baton Rouge, Louisiana | Warehouse | Owned | Chemicals and Plastics | |||
Winnipeg, Manitoba | Warehouse | Owned | All | |||
Tewksbury, Massachusetts | Warehouse | Owned | Chemicals and Plastics | |||
Guadalajara, Mexico | Warehouse | Leased | Chemicals | |||
Merida, Mexico | Warehouse | Leased | Chemicals | |||
Nuevo Leon, Mexico | Warehouse | Leased | Chemicals | |||
Tepotzotlán, Mexico | Warehouse | Leased | Chemicals and Plastics | |||
Tepotzotlán, Mexico | Warehouse | Leased | Chemicals | |||
Querétaro, Mexico | Warehouse | Leased | Chemicals | |||
Lansing, Michigan | Bulk/Warehouse | Owned | All | |||
Warren, Michigan | Bulk/Warehouse | Owned | Chemicals and Plastics | |||
Saint Paul, Minnesota | Bulk/Warehouse | Owned | Chemicals and Plastics | |||
Shakopee, Minnesota | Bulk/Warehouse | Owned | All | |||
St. Louis, Missouri | Bulk/Warehouse | Owned | All | |||
St. Louis, Missouri | Warehouse | Leased | Chemicals and Plastics | |||
Carteret, New Jersey | Bulk/Warehouse | Owned | Chemicals and Plastics | |||
Charlotte, North Carolina | Bulk/Warehouse | Owned | All | |||
Binghamton, New York | Warehouse | Owned | Plastics and Environmental Services | |||
Tonawanda, New York | Bulk/Warehouse | Owned | Chemicals and Plastics | |||
Columbus, Ohio | Bulk/Warehouse | Owned | Chemicals and Plastics | |||
Dayton, Ohio | Warehouse | Owned | Plastics and Environmental Services | |||
Evendale, Ohio | Bulk/Warehouse | Owned | Chemicals and Plastics | |||
Grove City, Ohio | Bulk/Warehouse | Owned | Plastics | |||
Twinsburg, Ohio | Bulk/Warehouse | Owned | Chemicals | |||
Twinsburg, Ohio | Warehouse | Leased | Chemicals and Plastics | |||
Tulsa, Oklahoma | Warehouse | Owned | Chemicals and Plastics | |||
Mississauga, Ontario | Bulk/Warehouse | Leased | All | |||
Morrisville, Pennsylvania | Bulk/Warehouse | Owned | All | |||
Catano, Puerto Rico | Warehouse | Owned | All | |||
Anderson, South Carolina | Bulk/Warehouse | Owned | Plastics | |||
Columbia, South Carolina | Bulk/Warehouse | Owned | All | |||
Knoxville, Tennessee | Bulk/Warehouse | Owned | All | |||
Memphis, Tennessee | Bulk/Warehouse | Owned | All | |||
Nashville, Tennessee | Bulk/Warehouse | Owned | Chemicals and Plastics | |||
Conroe, Texas | Bulk/Warehouse | Owned | Chemicals and Plastics | |||
Garland, Texas | Bulk/Warehouse | Owned | All | |||
Houston, Texas | Bulk/Warehouse | Owned | All | |||
Midland, Texas | Bulk/Warehouse | Owned | All | |||
Clearfield, Utah | Bulk/Warehouse | Leased | All | |||
(1) During fiscal year 2018, we plan to acquire the land currently being leased.
Our principal executive offices are located in The Woodlands, Texas. We believe that our facilities are adequate for our current operations.
8
Private Fleet
Transportation of products to and from customers and suppliers is a fundamental component of our business. During fiscal year 2017, our North American distribution service relied on our private fleet of trucks, tankers and trailers for 66% of volume delivered from our warehouses to our customers. We relied on common carriers for the remainder of our deliveries.
At September 30, 2017, our private fleet consisted of approximately 1,100 owned and leased units that carry solid, bulk and liquid materials.
Private Fleet Characteristics as of September 30, 2017
Vehicle Type | Number of Vehicles | Average Age (years) | Average Transport Capacity (lbs.) | ||||||
Tractors | 353 | 3 | 45,000 | ||||||
Bulk Liquid Tankers | 336 | 18 | 42,000 | ||||||
Van Trailers | 350 | 11 | 45,000 | ||||||
Straight Trucks | 10 | 5 | 6,500 | ||||||
Dry Bulk Trailers | 13 | 11 | 45,000 | ||||||
In addition, we currently lease approximately 400 railcars, which are primarily used for supplier shipments to our locations, stock transfers between our locations and occasional shipments to customers.
Our private fleet characteristics change constantly based on our market needs. We believe that we maintain an advantage over many of our competitors with our private fleet enterprise wide on-time delivery percentage of 99.1%. Our private fleet permits us to meet our customers’ demand and reduces their inventory risk through "just-in-time" delivery. Moreover, our ability to service our customers is less encumbered by the commercial transportation market providing reliability of service to customers, especially during periods of undersupply.
Direct Supply
In certain circumstances, we deliver full truckloads or large quantities of commodity products directly from a supplier to a customer, primarily via common carrier, and provide sourcing and supply chain support in connection with the delivery. Although the products move directly from supplier to customer, we remain the sole point of contact for both the customer and the supplier and generally take ownership of the products while in transit, bearing the risk of loss during transportation. Direct supply sales accounted for 15.9% of sales for the fiscal year ended September 30, 2017.
Sales and Marketing
For the fiscal year ended September 30, 2017, we served approximately 28,100 customers from a broad range of end markets resulting in approximately 480,000 orders for over 24,000 products. We have developed a sales and marketing organization with a broad scope of sales coverage to ensure we can service a diverse customer base.
As of September 30, 2017, our sales team consisted of approximately 500 sales professionals situated throughout North America, EMEA and Asia, including customer-facing personnel, such as technical support and corporate account managers, located in local markets. There are approximately 390 sales professionals based in North America, while approximately 60 sales professionals are based in EMEA and 50 sales professionals are based in Asia.
Our sales force compensation and incentive structure is designed to ensure alignment between the goals of the sales representatives and those of our overall business. All sales representatives earn a fixed base salary and variable rewards based on performance. We believe sales force compensation alignment is a key driver for the success of our business.
9
Customer Pricing Processes
We use data-driven pricing strategies, which enable our product managers to determine product pricing through the use of systems and tools that provide insight on relative market pricing across a number of factors including end markets, geography, packaging type and volume. Product managers, whose main responsibility is to cultivate and build supplier relationships, also develop a broad understanding of suppliers’ product offerings and the market’s needs. We have empowered these managers to make pricing decisions, working closely with our sales team to structure pricing for an optimal balance of price and volume to maximize profitability. The following is a description of our customers by line of business:
• | Chemicals. Our Chemicals customer base ranges from some of the largest global companies to smaller regional, private companies. Generally, no single Chemicals customer accounts for more than 5.0% of Chemicals sales, annually, while the five largest customers by value represent less than 10.0% of Chemicals sales on an annual basis. |
• | Plastics. Our Plastics customer base is diverse and serves a variety of end markets. Generally, no single Plastics customer accounts for more than 5.0% of Plastics sales, annually, while the five largest customers by value represent less than 5.0% of Plastics sales on an annual basis. |
• | Environmental Services. Our Environmental Services line of business includes customers who generate hazardous and non-hazardous waste in North America. One Environmental Services customer accounts for more than 5.0% but less than 10.0% of Environmental Services sales, annually, while the five largest customers generally account for less than 25.0% of Environmental Services sales on an annual basis. |
Contracts
Our customer contracts for the sale of chemicals and plastics products are generally framework agreements that do not contain an obligation to buy or sell. We use the agreements to define the general terms and conditions of sale and set volume expectations, pricing and price change mechanisms. The final terms of sale for each purchase are negotiated at the time of sale unless otherwise established by the terms of the contract. Consistent with industry standards, we may offer volume-based incentives to large customers if the customer purchases a specified volume with us over a specified time period. Our customer contracts for the provision of environmental services are generally framework agreements pursuant to which we provide environmental services from time to time, with fees agreed at the time the service is provided. These contracts are generally terminable by either party with or without cause upon 30 days’ notice. Additionally, our on-site environmental services contracts are typically term-based arrangements, with fee structures negotiated at the time of execution.
Value-Added Services
In addition to our products, we provide a range of value-added services, including mixing and blending to specific customer requirements, lab testing and analysis, formulating, repackaging from large to small quantities, vendor inventory management and technical support. We continue to seek opportunities to profitably expand our value-added services to differentiate our value proposition and create competitive advantages.
Three key services we offer are repackaging, custom blending and lab services. Our hub facilities handle large quantities of materials, usually receiving shipments by railcar or tank truck. Bulk deliveries are often repackaged into smaller containers, such as gaylords, totes and drums, which are in turn delivered to customers by truck. Our custom blending capabilities include buying in bulk from our large base of suppliers, lab testing for product customization and blending of numerous products to meet customer specifications. Our labs provide product testing services to our customers in the form of chemical analysis and product performance analysis. We employ a team of scientists and experienced formulation experts to help customers with product development, failure analysis and other technical support in a broad range of chemical and product applications.
10
Proprietary Operating Systems
We have developed a highly scalable technology platform with a centralized system and robust data analytics. These highly sophisticated systems enhance operational flexibility and facilitate the volume of customer orders, global sourcing, customer relations, distribution-related logistics, regulatory compliance, risk management controls and financial reporting. The operating platform consists of our transportation management system, pricing system, digital marketing, customer portal and ERP system. Our ERP system is used across the Company, with the exception of our subsidiary in China and the operations recently acquired in the Ultra Chem Acquisition, which will be integrated into our ERP system during fiscal year 2018. The advanced data gathering and analysis capabilities of our ERP system, and the efficiencies it provides, enable us to operate flexibly and create significant advantages across the supply chain. Our ERP system also provides advanced volume forecasting, enabling us to forecast rolling weekly volumes, anticipate demand shift fluctuations and quickly respond to rapidly changing customer needs. This capability helps our suppliers by providing reliable and accurate demand forecasts that result in improved efficiency, flexibility and faster execution. These daily forecasts also translate into better pricing as they allow for optimization of production schedules. We believe that continuous automation implementation drives operational excellence and productivity.
Seasonality
Seasonal changes may affect our business and results of operations. We serve a large number of customers in a broad range of end markets and our business trends follow the seasonality patterns exhibited by these end markets and customers. For example, we generally tend to realize lower sales across all of our lines of business in the fourth calendar quarter of each year (which is our first fiscal quarter) because industrial production tends to be seasonally lower during that period. Our business may also be affected by our suppliers’ decisions regarding seasonal capacity and production.
Competition
The chemicals and plastics distribution markets in which we operate are highly fragmented. The primary competitive factors affecting each of our lines of business are the diversity and quality of the product portfolio, service offerings, reliability of services and supply, technical support and price and delivery capabilities. In addition, producers represent another source of competition, as many elect to distribute products through direct sales as opposed to indirect distributors. For some of the markets in which we operate, if large chemical producers elect to limit or consolidate their outsourcing of distribution, partner with other distributors, or distribute their products directly to end-user customers, competition would increase. Additionally, competition could increase from producers reducing their level of distribution outsourcing to maintain profit margin during periods of poor macroeconomic factors and pricing weakness, particularly for commodity products that require nominal service complexity to the end-user customer. We believe that our reputation, our broad range of product offerings and our speed and responsiveness, coupled with our valued-added services and the breadth of our distribution network, allow us to compete effectively and achieve scale benefits.
Chemicals
Our principal Chemicals distribution competitors include Azelis, Brenntag AG, Helm, ICC Chemicals, IMCD and Univar Inc. Additionally, our Chemicals line of business competes with many regional and local companies throughout North America as well as a number of smaller companies in certain niche markets.
Plastics
Our primary Plastics distribution competitors in North America are Channel Prime Alliance, Entec Polymers, M. Holland Company and PolyOne Distribution. Our primary Plastics competitors in EMEA are A. Schulman, Albis, Biesterfeld, Distrupol and two divisions of Ravago: Resinex and Ultrapolymers. Our primary Plastics competitors in Asia are KDF, Nagase and Sinochem.
Environmental Services
The primary competitors of our Environmental Services line of business are Clean Harbors, Univar Inc. and Veolia.
11
Employees
At September 30, 2017, we had approximately 2,640 employees worldwide, with approximately 2,070 employees in the U.S., 100 employees in Canada, 180 employees in EMEA, 130 employees in Asia, and 160 employees in Latin America. In the U.S., approximately 140 of our employees are represented by unions in six locations representing seven bargaining units, five of which are affiliated with the International Brotherhood of Teamsters and two of which are affiliated with the United Steelworkers.
Regulatory Matters
We are subject to extensive regulation by federal, state and local governments and similar international agencies relating to the sale and distribution of our products. These regulations govern the use, labeling, packaging, transportation, storage and distribution of chemicals and hazardous substances. We are also subject to domestic and international import, export and customs regulations, and statutes and regulations relating to government contracting. In addition, we are subject to extensive environmental laws and other regulations concerning, among other things, emissions to the air, discharges to land, and water and the generation, handling, storage, transportation and disposal of non-hazardous and hazardous waste in various federal, state, local and foreign jurisdictions, including EMEA and Asia. We are also subject to other federal, state, local and foreign laws and regulations regarding health and safety matters. Below is a summary of certain of these regulations.
Environmental
We operate in a number of domestic and foreign jurisdictions and are subject to various types of governmental regulation relating to the protection of the environment. Such regulation comes in the form of federal, state, local and foreign laws and regulations concerning such issues as the handling, storage and transportation of chemicals, release of pollutants into the air, soil and water, disposal of hazardous and non-hazardous wastes, remediation of contaminated sites, protection of workers from exposure to hazardous substances and the public disclosure of information regarding environmental hazards. Some aspects of our businesses also require us to maintain various environmental permits and licenses. We believe that we are in substantial compliance with all applicable environmental laws, regulations and permits; however, environmental compliance costs in the form of compliance with regulations, remediation obligations, capital improvements, operating expenses and/or limitations on operations can be substantial.
Many of the environmental laws and regulations affecting our operations relate to the prevention and remediation of previous impacts to air, soil or water resulting from the release of regulated materials. Past operations at some of our facilities have resulted in the contamination of soil and groundwater, some of which require remediation. Under the ADA Purchase Agreement, Ashland retained liability for known remediation obligations related to its ownership and operation of the Distribution Business before the closing date of the Ashland Distribution Acquisition and all other environmental remediation liabilities arising prior to the closing date of the Ashland Distribution Acquisition for which Ashland received notice, other than for the Retained Remediation Liabilities. Subsequent to the closing date of the Ashland Distribution Acquisition, we assumed responsibility for all newly reported contamination and are required to indemnify Ashland should Ashland incur any expense related to such newly reported contamination. We may also discover new or previously unknown contamination for which we may not be indemnified by Ashland. In those cases, and in situations where Ashland does not fulfill its indemnification obligations to us, we may be responsible for substantial remediation costs at or associated with our facilities or with the Distribution Business. See also Item 3, "Legal Proceedings".
Comprehensive Environmental Response, Compensation, and Liability Act
In the U.S., CERCLA and analogous state laws regulate the remediation of certain contaminated sites and establish liability for the release of hazardous substances and related damages to natural resources from such sites. Under CERCLA, potentially responsible parties (including waste generators, waste transporters, and parties arranging for waste disposal) are subject to strict and, in certain circumstances, joint and several liability, for the cost of remediating contaminated sites. Our Chemicals and Environmental Services lines of business conduct waste disposal activities and handle products which could subject us to CERCLA liability.
In addition, we currently indemnify some of our Environmental Services customers for liabilities related to waste disposal activities that such customers may incur under certain environmental laws, including CERCLA.
12
Resource Conservation and Recovery Act
RCRA and analogous state laws regulate the generation, transportation, treatment, storage and disposal of hazardous waste. RCRA also establishes the regulatory framework for the management of certain non-hazardous wastes. RCRA requires owners and operators of hazardous waste treatment, storage and disposal facilities to obtain a RCRA permit. These permits may include both remedial actions and operational conditions. RCRA requires owners and operators of regulated facilities to investigate and remediate hazardous waste releases and to demonstrate compliance with financial assurance requirements. The financial assurance requirements are designed to ensure that adequate financial resources exist to respond to any releases of hazardous wastes at a permitted site and to perform any necessary corrective action and permanent site closure activities. Several of our facilities are subject to RCRA permits and some are undergoing corrective action to address previous releases of regulated materials as required under their permits. While we were required to assume responsibility for corrective action at a few sites in connection with the transfer of the business from Ashland to the Predecessor, Ashland agreed to continue to perform certain known ongoing corrective actions at these sites until they are completed and to indemnify the Predecessor for any costs necessary to complete these actions. However, we retain responsibility for any RCRA violations resulting from our own operations.
Clean Air Act
CAA and analogous state laws establish a variety of programs designed to regulate the discharge of pollutants into the air. Under these laws, permits may be required before construction can commence on any new or modified source that has the potential to emit a significant amount of any regulated pollutant, such as nitrogen oxides and volatile organic compounds. Additionally, we may be required to register with state environmental agencies, monitor and report emissions, and install new or improved emission control equipment in certain situations, including for existing sources of air emissions. Furthermore, CAA may require that we obtain federal operating permits for any major sources of air pollution, which incorporate applicable pollution control requirements and require reporting and certification obligations. CAA also requires owners and operators of facilities that produce, handle, process, distribute, or store threshold quantities of chemicals to implement and update detailed risk management plans, which must be filed with and approved by the EPA. We could be required to incur additional expenditures to comply with CAA, including costs to install and operate emissions control equipment at our facilities.
Clean Water Act
The EPA regulates discharges of pollutants into waters of the U.S. through the CWA. Pursuant to the CWA, the EPA establishes wastewater standards and water quality standards for contaminants discharged into surface waters such as streams, rivers and lakes. The discharge of any regulated pollutant from point sources (such as pipes and manmade ditches) into the waters of the U.S. is prohibited without a state or federally issued discharge permit. Several of our facilities are currently subject to and must comply with CWA permit limitations on the discharge of industrial wastewater and storm water.
Toxic Substances Control Act
The TSCA authorizes the EPA to require chemical manufacturers, importers, and exporters to comply with reporting, record keeping, testing, and other requirements relating to chemical substances or mixtures. The TSCA is primarily designed to ensure that certain chemicals do not pose an unreasonable risk to human health or the environment. The TSCA Chemical Substances Inventory, which is maintained by the EPA, lists approximately 85,000 covered chemical substances. Before a chemical substance can enter interstate commerce (either through manufacture or importation), the EPA must review and approve the substance’s pre-manufacture notice. As part of that review process, the EPA may identify conditions—up to and including a ban on production—limiting the use of a chemical substance before it enters commerce. The TSCA also requires the testing of chemicals by manufacturers, importers and processors and requires those importing or exporting chemicals to comply with certification reporting and recordkeeping requirements. The TSCA also requires that any chemical distributor having information reasonably suggesting a substantial risk of injury to health or the environment notify the EPA immediately. The TSCA reform legislation enacted in June 2016 expanded the EPA's authority to review and regulate new and existing chemicals. In addition, when we import chemicals into the U.S. or export chemicals out of the U.S., we must comply with the TSCA’s import certification and export notice requirements. We must also comply with the TSCA’s various recordkeeping requirements.
13
Emergency Planning and Community Right-To-Know Act
The EPCRA requires facilities manufacturing, processing, or storing designated hazardous chemicals to report certain information about their products to state and local officials and fire departments. These reporting obligations are intended to assist state and local governments in developing emergency response plans in the case of a chemical release and to provide information to the public regarding the type and amount of toxic or hazardous chemicals stored at a particular facility. In addition, facilities releasing toxic chemicals into the environment above certain thresholds must report such releases to the EPA as part of the facilities’ "Toxics Release Inventory." Because many of our chemical distribution facilities handle hazardous chemicals, we are subject to the reporting requirements under the EPCRA.
Chemical Facility Anti-Terrorism Standards
DHS regulates the security of certain high-risk chemicals facilities through CFATS. CFATS utilizes a Chemical Security Assessment Tool to identify those chemical facilities potentially deemed "high risk." The first step is user registration, followed by the completion of a top-screen evaluation. The top-screen evaluation analyzes whether a facility stores regulated chemicals above specified thresholds. If it does, the facility must complete a Security Vulnerability Assessment, which examines the likelihood that a threat against a facility will be successful. From there, the facility must develop a Site Security Plan to respond to any identified security vulnerabilities. The Site Security Plan must address such matters as access control, personnel credentialing, recordkeeping, employee training, emergency response, testing of security equipment, reporting of security incidents and suspicious activity, and deterring, detecting and delaying potential attacks. DHS must review and approve or deny all Security Vulnerability Assessments and Site Security Plans. CFATS also requires regulated facilities to keep detailed security records and allow DHS the right to enter, inspect, and audit the property, equipment, operations and records of such facilities. Our facilities handle a number of chemical substances subject to CFATS security requirements, and thus, some of our facilities must comply with its site security requirements. Other legislative and regulatory initiatives designed to minimize the vulnerability of chemical storage and transportation assets could result in increased regulation of our industry, potentially imposing additional limitations on our operations and causing us to incur higher operating and compliance costs.
Regulation of the Transportation of Hazardous Materials
The transportation of hazardous materials is a significant part of our business and is regulated by the Department of Transportation under the FHMTL and its implementing regulations, the HMR. The HMR regulate the handling of hazardous materials, hazardous wastes, hazardous substances, and marine pollutants, and establish rules applicable to myriad aspects of the transportation process, including employee training, incident notification, labeling and placarding of shipments, shipment preparation, carriage of hazardous materials, emergency response and the development of safety and security plans. Several Department of Transportation agencies, including the Pipeline and Hazardous Materials Safety Administration, the Federal Aviation Administration, the Federal Railroad Administration, the Federal Motor Carrier Safety Administration and the U.S. Coast Guard share responsibility for enforcing the FHMTL.
Certain international standards and regulations also govern the transportation of hazardous materials shipments within, to, and from the U.S. Such regulations include the International Civil Aviation Organization’s 132 Technical Instructions for the Safe Transport of Dangerous Goods by Air, the International Maritime Dangerous Goods Code, Transport Canada’s Transportation of Dangerous Goods Regulations and the International Atomic Energy Agency Regulations for the Safe Transport of Radioactive Materials. These standards and regulations prescribe, among other things, requirements for packaging, maximum weight and handling of hazardous materials. U.S. agencies have sought to harmonize their rules with international standards and regulations, but when hazardous materials are transported to, from, and within the U.S. in accordance with one or more of these international standards or regulations, U.S. HMR requirements must still be followed.
The majority of our logistics services, including transport of hazardous materials, involve highway transportation. The Transportation Security Administration requires any driver seeking to obtain, renew, or transfer a hazardous materials endorsement on a state-issued commercial driver’s license to undergo a security threat assessment. Additionally, under the Transportation Worker Identification Credential program, workers, including truckers, requiring unescorted access to maritime facilities must be issued tamper-resistant biometric credentials to access such facilities.
14
Like environmental regulations, the regulations governing the transportation of hazardous materials are often subject to modification. For example, the Pipeline and Hazardous Materials Safety Administration recently amended the HMR to remove the packing group II designation for certain organic peroxides, self-reactive substances and explosives and revised the requirements for the packaging of nitric acid and for the testing of pressure relief devices on cargo tanks. Hazardous Materials: Miscellaneous Amendments (RRR), 81 Fed. Reg. 35,484 (June 2, 2016). Portions of the rulemaking are subject to pending administrative appeals with the agency. In addition, the Federal Railroad Administration has strengthened regulations regarding security and control over railcars that transport certain classes of flammable, combustible, or explosive liquids and gases. Compliance with new regulations on the transportation of hazardous materials could adversely affect our business by raising our compliance and operational costs.
Occupational Safety and Health Regulations
We are subject to the OSH Act, which addresses safety and health in workplace environments. In addition to the OSH Act, we are subject to applicable state occupational safety and health regulations as well as the safety and health rules of applicable jurisdictions outside of the U.S, such as the Workplace Hazardous Materials Information System in Canada.
The OSH Act is administered by OSHA, which has established maximum workplace chemical exposure levels. Manufacturers and distributors of chemicals must employ a hazard communication program utilizing labels and other forms of warnings, as well as safety data sheets, setting forth safety and hazardous materials information to employees and customers. OSHA’s Hazard Communication Standard covers both physical hazards (such as flammability or the potential for explosions) and health hazards. Employers are required to provide a certain level of training to ensure that relevant employees are equipped to properly handle chemicals. OSHA has modified its Hazard Communication Standard to make it consistent with the United Nation’s Globally Harmonized System of Classification and Labeling of Chemicals. The new standards include more specific requirements for hazard classification, as well as standardized label components that provide consistent information and definitions for hazardous chemicals and a standard approach to conveying information on safety data sheets. Our Chemicals line of business has already completed its transition to the revised Hazard Communication Standard.
For our Chemicals and Plastics lines of business in Canada, we are in the process of transitioning to Health Canada's Globally Harmonized System - aligned Hazardous Products Regulations standard. In Canada, a phase-in period is currently underway, culminating in December 2018, during which companies can choose to comply with either the existing or the revised Hazardous Products Regulations, and we expect to complete this transition within the deadline.
Both the U.S. and Canada Hazard Communication Standards remain subject to periodic updates and revisions, and those changes, as well as other regulatory initiatives in occupational health and safety, could result in increased operation and compliance costs.
Product Control
We operate in a number of domestic and foreign jurisdictions and are subject to various types of governmental regulation relating to use, labeling, packaging, storage and distribution of chemicals and hazardous substances. Statutes and regulations governing the import, export and control of our products are enforced by government agencies such as the U.S. Customs and Border Protection, the Drug Enforcement Administration, the Department of Homeland Security, the Department of Commerce, the Department of Transportation, the Food and Drug Administration, the Department of Agriculture and similar international agencies.
We believe that we are in compliance in all material respects with federal, state and local regulations relating to the sale, distribution, import and export of our products. We have automated systems, processes and procedures in place to support compliance with these regulations, and because we have these automated systems, processes and procedures in place, we believe we conduct our global business in compliance in all material respects with applicable statutes and regulations as promulgated in the countries into which we sell our products. Although we believe we are in compliance in all material respects with such laws and regulations, any non-compliance could result in substantial fines or otherwise restrict our ability to conduct our business.
Intellectual Property
We are not substantially dependent upon patents, trademarks or licenses.
15
Insurance
Our operations are subject to significant hazards and risks inherent in the transportation, storage and disposal of chemicals and other potentially hazardous materials. We seek to mitigate these risks with effective industry-specific risk management techniques that include continuing and improving upon current loss prevention, claims management and training programs as well as a comprehensive insurance program. We have insurance coverage at levels that we consider adequate for our worldwide facilities and activities. Our insurance policies cover, among others, the following categories of risk: property damage and business interruption; marine cargo throughput, product and general liability; environmental liability; directors’ and officers’ liability and fraud and crime/theft.
Available Information
We electronically file reports with the SEC, including annual reports on Form 10-K, quarterly reports on Form 10-Q, current reports on Form 8-K and any amendments to such reports. The public may read and copy any materials that we file with the SEC at the SEC’s Public Reference Room at 100 F Street, N.E., Washington, D.C. 20549. The public may obtain information on the operation of the Public Reference Room by calling the SEC at 1-800-SEC-0330. The SEC also maintains an internet site that contains reports and information statements, and other information regarding issuers that file electronically with the SEC at www.sec.gov. Additionally, information about us, including our reports filed with the SEC, is available through our website at www.nexeosolutions.com. Such reports are accessible at no charge through our website and are made available as soon as reasonably practicable after such reports are filed with or furnished to the SEC. Our website and the information contained on that site, or connected to that site, are not incorporated by reference into this Annual Report on Form 10-K.
Item 1A. Risk Factors
We are subject to certain risks and hazards due to the nature of the business activities we conduct. Although it is not possible to identify all of the risks we encounter, we have identified the following significant risk factors that could materially adversely affect our business, financial condition, cash flows or results of operations.
Risks Related to Our Business and Industry
We face competition from other companies, which places downward pressure on prices and profitability.
We operate in highly competitive markets and compete against a large number of domestic and foreign companies. Competitiveness is based on several key criteria, including product performance and quality, product price, product availability, product handling and storage capabilities, the ability to understand customer product development processes and respond to their needs, delivery capabilities and customer service, including technical support. In addition, competitors’ pricing decisions could compel us to decrease our prices, which could negatively affect our profitability. Furthermore, producers sometimes elect to distribute their products directly to end-user customers, rather than rely on indirect distributors like us. While we do not believe that our results depend materially on access to any individual supplier's products, a significant increase in the number of suppliers electing to serve customers directly could result in less revenue and gross profit for us either due to competitive pressure from suppliers or products becoming unavailable to us or both.
Certain competitors are significantly larger than we are and may have greater financial resources. As a result, these competitors may be better able to withstand changes in market and industry conditions, including changes in the prices of raw materials and general economic conditions.
The prices of the products we purchase and sell are volatile.
Rising or otherwise volatile raw material prices for our suppliers, especially those of hydrocarbon derivatives, may cause costs to increase or may result in volatility in our profitability. Also, costs associated with the distribution of our products fluctuate in the same direction as fuel and other transport-related costs. Our ability to pass on increases in our costs to our customers is dependent upon market conditions, such as the presence of competitors in particular geographic and product markets and of the prevailing pricing mechanisms in customer contracts.
16
Many of our products are commodities or include significant commodity content; however, we have no control over the changing market value of the commodities. For example, excess supplies or changes in demand of crude oil-based and/or natural gas-based feedstocks may cause base commodity chemical product prices to fall. This could subsequently result in a drop in prices for propylene and ethylene-based plastics products. We also typically maintain significant inventories of the products we sell in order to meet our customers’ service level requirements. Declining prices, particularly rapid declines like those that occurred at times during fiscal year 2015 and 2016, typically cause customers to reduce inventories and wait for lower prices in anticipation of continued falling prices. Additionally, rapidly declining prices can cause our inventory value to be higher than market and subject us to impairment charges. As a result of these factors, we are subject to price risk with respect to our product inventories. Significant unanticipated changes in market conditions can affect future product demand, which could materially and adversely affect the value of our inventory. If we overestimate demand and purchase too much of a particular product when customers are reducing/minimizing their purchases, we face a risk that the price of that product will fall, leaving us with inventory that we cannot profitably sell. As a result, our sales volumes and gross profit may decline.
If we underestimate demand and do not purchase sufficient quantities of a particular product and prices of that product rise, we could be forced to purchase that product at a higher price in order to satisfy customer demand for that product, but we may not be able to increase pricing to our customers resulting in reduced profitability.
Volatility in product prices also affects our borrowing base under the ABL Facility. A decline in prices of our products reduces the value of our product inventory collateral, which, in turn, may reduce the amount available for us to borrow under the ABL Facility.
Many of our contracts with suppliers and customers are terminable upon notice.
Our revenue stream is variable because it is primarily generated as customers place orders and customers may change their requirements or cancel their orders. We generally enter into framework agreements with customers and suppliers that set out volume and other performance expectations over the term of the contract, but purchases and sales of products are usually made by placing individual purchase orders based on customer demand or forecasts. Since many of our contracts with both suppliers and customers do not include firm obligations to buy or sell products or are otherwise terminable upon notice, we might, in certain instances, be unable to meet our customers’ orders, which could harm our business relationships and reputation and result in reduced profitability. In circumstances where customers terminate contracts or cancel orders, we may be unable to find alternative buyers for the materials we purchased and may be forced to hold such materials in inventory. Our gross profit could be negatively affected if suppliers or customers renegotiate contractual terms to our disadvantage. Additionally, while some of our relationships for the distribution and sale of specialty chemicals have exclusivity or preference provisions, we may be unable to enforce these provisions effectively for legal or business reasons.
We are affected by demand fluctuations and other developments in the broader economy, including any prolonged economic crisis.
Our businesses mainly service clients in North America, EMEA and Asia, specifically China, making us vulnerable to downturns in those economies. Our sales and gross profits could decline as a result of economic recessions, changes in industrial production processes or consumer preferences, significant episodes of inflation, fluctuations in interest and currency exchange rates, and changes in the fiscal or monetary policies of governments in North America, EMEA and Asia, specifically China. See also "—We are exposed to fluctuations in foreign exchange rates" and "—Our substantial international operations subject us to risks of doing business in foreign countries."
General economic conditions and macroeconomic trends could also negatively affect the creditworthiness of our customers, which could increase our credit risk with respect to our trade receivables. Similarly, volatility and disruption in financial markets could limit our customers’ ability to obtain financing necessary to maintain or expand their own operations, thereby reducing demand for our products.
Disruptions in the supply of or an inability to supply the products that we distribute could result in a loss of customers or damage to our reputation.
Our business depends on access to adequate supplies of the products that our customers purchase from us. From time to time, we may be unable to access adequate quantities of certain products because of supply disruptions due to natural disasters, extreme weather, industrial accidents, scheduled and unscheduled production outages, high demand leading to allocation, port closures and other transportation disruptions and other circumstances beyond our control. These types of events could negatively affect our results of operations.
17
We purchase certain products and raw materials from suppliers, often pursuant to written supply contracts. If those suppliers are unable to fulfill our orders timely or choose to terminate or otherwise avoid contractual arrangements, we may not be able to obtain the products from alternate sources. The loss of one or more significant suppliers or a supplier of certain key products, or a significant change in the business strategies of our suppliers could disrupt our supply of the products our customers purchase from us. If we are unable to obtain and retain qualified suppliers under commercially acceptable terms, our ability to deliver products in a timely, competitive and profitable manner could be adversely affected.
Further, if our forecasts are below actual market demand, or if market demand increases significantly beyond our forecasts, then we may not be able to satisfy customer product needs, which may cause our customers to purchase their products from our competitors and could result in a loss of market share.
Additionally, domestic and global government regulations related to the manufacture or transport of certain products may impede our ability to obtain those products on commercially reasonable terms.
If for any reason we experience widespread, systemic difficulties in filling our customers’ orders, we face the risk of customer dissatisfaction, possible loss of customers, damage to our reputation, or paying a supplier a higher price in order to obtain the needed products on short notice, any of which could result in loss of revenues and lower profitability.
We are exposed to fluctuations in foreign exchange rates.
A portion of our sales and costs of sales are denominated in currencies other than the functional currency of our subsidiaries, exposing us to currency transaction risk. Additionally, because we report our consolidated results in USD, the results of operations and the financial position of our international operations, which are generally reported in the relevant local currencies, are then translated into USD at the applicable exchange rates for inclusion in our consolidated financial statements, exposing us to currency translation risk. Further, we have exposure to foreign exchange fluctuations arising from the remeasurement of certain foreign operations where the USD is the functional currency but accounting records are kept in local currency. Consequently, any change in exchange rates between our foreign subsidiaries' functional currencies and the USD will affect our consolidated statements of operations and balance sheets when the results of those operating companies are translated/remeasured into USD for reporting purposes. During fiscal year 2017, our most significant currency exposures were to the Euro, the CAD and the RMB and our results of operations were negatively impacted due to these exposures. The exchange rates between these and other foreign currencies and the USD may fluctuate substantially, and these fluctuations may have an adverse effect on our results of operations in future periods. See "Item 7A. Quantitative and Qualitative Disclosures about Market Risk."
We require significant working capital.
We have significant working capital needs, as the nature of our business requires us to purchase and maintain inventories that enable us to fulfill customer demand. In addition, we extend a significant amount of trade credit to our customers to purchase our products. Increases in the price of the products we purchase from suppliers or our selling prices to customers could result in increased working capital needs, as it is more expensive to maintain inventories and extend trade credit, which could adversely affect our liquidity and cash flows. We generally finance our working capital needs through cash flows from operations and borrowings under our ABL Facility. If we are unable to finance our working capital needs on the same or more favorable terms going forward, or if our working capital requirements increase and we are unable to finance the increase, we may not be able to purchase the products required by our customers or extend them the credit they require to purchase our products, which could result in a loss of sales.
The amount of borrowings permitted under the ABL Facility may fluctuate significantly, which may adversely affect our liquidity, results of operations and financial condition.
The amount of borrowings permitted at any time under the ABL Facility is limited by a borrowing base that is comprised of the value of our and certain of our subsidiaries' eligible inventories and accounts receivable. As a result, our access to credit under the ABL Facility is potentially subject to significant fluctuations depending on the value of the eligible assets in the borrowing base as of any valuation date. The inability to borrow under the ABL Facility may adversely affect our liquidity, results of operations and financial condition.
18
We may not be able to generate sufficient cash flows to service all of our indebtedness and may be forced to take other actions in order to satisfy our obligations under our indebtedness, which may not be successful.
Our ability to make scheduled payments on, or to refinance, our debt obligations will depend on our financial and operating performance, which is subject to prevailing economic and competitive conditions and certain financial, business and other factors beyond our control. There can be no assurance that our business will generate sufficient cash flows from operating activities or that future sources of capital will be available to us in an amount sufficient to permit us to service our indebtedness or to fund our other liquidity needs. If we are unable to generate sufficient cash flows to satisfy our debt obligations, we may have to undertake alternative financing plans, such as refinancing or restructuring some or all of our indebtedness, selling assets, reducing or delaying capital investments or seeking to raise additional capital. We cannot assure you that any refinancing would be possible, that any assets could be sold or, if sold, of the timing of the sales and the amount of proceeds that may be realized from these sales, or that additional financing could be obtained on acceptable terms, if at all. Our inability to generate sufficient cash flows to satisfy our debt obligations, or to refinance our indebtedness on commercially reasonable terms, would materially and adversely affect our financial condition and results of operations and our ability to satisfy our obligations under the Credit Facilities.
In addition, if we cannot make scheduled payments on our indebtedness, we will be in default and, as a result:
• | our debt holders could declare all outstanding principal and interest to be due and payable; |
• | the lenders under the ABL Facility could terminate their commitments to lend us money and foreclose against the assets securing their borrowings; |
• | the lenders under the Term Loan Facility and our other secured lenders could foreclose against the assets securing their borrowings; and |
• | we could be forced into bankruptcy or liquidation. |
Despite our current level of indebtedness, we may incur substantially more indebtedness in the future, which could further exacerbate the risks described above. At September 30, 2017, we had $864.5 million of principal amount of debt outstanding. In addition, we have $277.8 million of borrowings available under the ABL Facility, and under the terms of the Credit Facilities and subject to our continued compliance with specified ratios, we have the option:
• | under the ABL Facility, to raise up to $175.0 million of incremental or increased revolving credit commitments; and |
• | under the Term Loan Facility, to raise incremental term loans. |
If borrowed, these incremental commitments and loans would be senior secured indebtedness. Furthermore, we and our subsidiary guarantors are permitted to incur additional unsecured indebtedness under the Credit Facilities, which could intensify the related risks that we and our subsidiaries now face.
Our substantial indebtedness could adversely affect our results of operations and financial condition and prevent us from fulfilling our obligations under our indebtedness.
Our substantial indebtedness could have important consequences with respect to our business, including the following:
• | increasing our vulnerability to general adverse economic and industry conditions and limiting our ability to adjust rapidly to changing market conditions; |
• | requiring us to dedicate a substantial portion of our cash flows from operations to pay principal and interest on our indebtedness, which would reduce the availability of cash to fund working capital, capital expenditures, acquisitions or other future business opportunities that could affect the execution of our growth strategy; |
• | negatively impacting the terms on which customers or suppliers do business with us or alternatively requiring us to provide such customers or suppliers with credit support; |
• | placing us at a competitive disadvantage as compared to our competitors that have less debt; and |
19
• | exposing us to risks associated with interest rate fluctuations, which could result in increased interest expense if interest rates rise and we have to borrow additional funds under our variable interest rate Credit Facilities. |
In addition, there can be no assurance that our business will generate sufficient cash flows from our operations in the future to service our indebtedness and to meet our other cash needs.
Restrictive covenants in our financing documents may adversely affect our operations.
Our Credit Facilities contain a number of restrictive covenants that impose operating and financial restrictions on us and may limit our ability to engage in acts that may be in our long-term best interest, including our ability to:
• | incur or assume additional debt or provide guarantees in respect of obligations of other persons; |
• | issue redeemable stock and preferred stock; |
• | pay dividends or distributions or redeem or repurchase capital stock; |
• | prepay, redeem or repurchase debt; |
• | make loans, investments and capital expenditures; |
• | incur liens; |
• | engage in sale/leaseback transactions; |
• | restrict distributions from our subsidiaries; |
• | sell assets and capital stock of our subsidiaries; |
• | consolidate or merge with or into another entity, or sell substantially all of our assets; and |
• | enter into new lines of business. |
A breach of the covenants under the Credit Facilities could result in an event of default under the Credit Facilities and our other indebtedness. An event of default under the Credit Facilities would permit the lenders under the facilities to declare all amounts outstanding under the facilities to be immediately due and payable and terminate all commitments to extend further credit. If we were unable to repay those amounts, the lenders under the Credit Facilities could proceed against the collateral granted to them to secure the borrowings under the facilities.
We depend on transportation and storage assets, some of which we do not own, in order to store and deliver products to our customers.
Although we maintain a significant portfolio of owned and leased transportation assets in North America, including trucks, tankers, railcars, barges and trailers, we also rely on transportation provided by third parties, such as common carriers, to deliver products to our customers. For the fiscal year ended September 30, 2017, common carriers accounted for approximately 34% of deliveries from our North American warehouses. For the fiscal year ended September 30, 2017, we leased 16 of our 57 distribution facilities and operated through more than 100 third party operated warehouses. In addition, in EMEA and Asia, we operated through third party operated transportation assets and warehouses for the fiscal year ended September 30, 2017.
20
Our access to third party transportation and storage is not guaranteed, and we may be unable to transport or store products at economically attractive rates or at all in certain circumstances, particularly in cases of adverse market conditions, such as shortages in transportation or storage capacity or disruptions to transportation infrastructure. We could also be subject to increased costs associated with transportation and storage that we may not always be able to recover from our customers, including fluctuating fuel prices, labor shortages and unexpected increases in the charges imposed by common carriers and other third parties involved in transportation. Strikes or other service interruptions by third party transporters could also cause our operating expenses to rise and adversely affect our ability to deliver products on a timely basis. Any condition which results in our inability to store and deliver products to our customers for a prolonged period of time or our failure to deliver products in a timely manner, could harm our business relationships, reputation and brand and render portions of our business unprofitable.
We rely on the proper functioning of our computer and data processing systems and a large-scale malfunction could result in disruptions to our business.
We use an integrated ERP system to manage complexity across our supply chain by processing transactions and financial data in real-time, including ordering, purchasing, inventory management and delivery information. The proper functioning of our ERP platform and related IT systems is critical to the successful operation of our business and the implementation of our business strategies. Computer and data processing systems are susceptible to malfunctions and disruptions, including due to equipment damage, power outages, computer viruses and a range of other hardware, software and network problems. We cannot guarantee that we will not experience any malfunctions or disruptions in the future. A significant or large-scale malfunction or interruption of our computer or data processing systems could adversely affect our ability to keep our operations running effectively, including our ability to process orders, properly forecast customer demand, receive and ship products, maintain inventories, collect account receivables and pay expenses, which could materially adversely affect our business, financial condition, cash flows or results of operations. Any of these risks, if they materialize could significantly harm our reputation, expose us to substantial liabilities and have a material adverse effect on our business, financial condition and results of operations.
We may be unable to identify, purchase or integrate desirable acquisition targets. Future acquisitions may not be successful and we may not realize the anticipated cost savings, revenue enhancements or other synergies from any such acquisition.
We plan to investigate and acquire strategic businesses with the potential to be accretive to earnings, increase our market penetration, strengthen our market position or enhance our existing product offerings. There can be no assurance that we will identify or successfully complete transactions with suitable acquisition candidates in the future. A failure to identify and acquire desirable acquisition targets may slow our growth.
Additionally, if we were to undertake a substantial acquisition, the acquisition would likely need to be financed in part through additional financing from banks, through public offerings or private placements of debt or equity securities or through other arrangements. There can be no assurance that the necessary acquisition financing would be available to us on acceptable terms if and when required.
There also can be no assurance that any already completed acquisitions will be successful. We could have difficulty integrating the operations, systems, management and other personnel, technology and internal controls of a new acquisition with our own. These difficulties could disrupt our ongoing business, distract our management and employees, increase our expenses and adversely affect our results of operations. Matters related to integration may also delay and/or jeopardize strategic initiatives in place to enhance profitability. We may also experience an adverse impact on our operations and revenues if acquisition or integration activities disrupt key customer and supplier relationships or if we fail to retain, motivate and integrate key management and other employees of acquired businesses. Even if we are able to integrate successfully, we may not be able to realize the potential cost savings, synergies and revenue enhancements that were anticipated from any acquisition, either in the amount or within the time frame that we expected, and the costs of achieving these benefits may be higher than, and the timing may differ from, what we expected. Furthermore, the entities that we acquire in the future may not maintain effective systems of internal controls, or we may encounter difficulties integrating our system of internal controls with those of any acquired entities, which could prevent us from meeting our reporting obligations.
In connection with any acquisitions, we may acquire liabilities that may not adequately be covered by insurance or an enforceable indemnity or similar agreement from a creditworthy counterparty. As a result, we may be responsible for significant out-of-pocket expenditures and these liabilities, if they materialize, could have a material adverse effect on our business, financial condition, cash flows and results of operations.
21
The service of key employees or our inability to attract new key employees could adversely affect our business.
We may have difficulty locating, hiring and retaining qualified and experienced employees, including managerial, sales, sourcing and technical support personnel. This could have an adverse effect on our ability to operate and grow our business. Additionally, the loss of employees who manage key customer and supplier relationships or key products could negatively affect our ability to sell and support our business effectively, which could negatively impact our results of operations. This could be particularly true in certain foreign jurisdictions or with recent acquisitions where legacy relationships are important to the viability of the business.
We may fail to extend or renegotiate our collective bargaining agreements with our labor unions as they expire from time to time, and disputes with our labor unions may arise or our unionized employees may engage in a strike or other work stoppage.
As of September 30, 2017, approximately 140 of our 2,070 employees in the U.S. were represented by unions in six locations and seven separate bargaining units. Five of the local unions are affiliated with the International Brotherhood of Teamsters and two are affiliated with the United Steelworkers.
In April and November 2011, two local unions each filed an unfair labor practice charge against us with the NLRB, alleging that we should be considered a successor of Ashland and, as such, we were obligated to bargain to agreement or impasse with the unions before changing the employment terms that were in effect before commencing operations, including continuing to cover employees under the union-affiliated multi-employer pension plans in which the employees participated as employees of the Distribution Business. In November 2011, the NLRB filed a complaint against us with respect to both cases, and a consolidated hearing was held before an administrative law judge in April and May of 2012. On June 28, 2012, the NLRB administrative law judge found substantially in our favor, holding that we were not obligated to continue to cover employees in the multi-employer pension plans. We reached a settlement with one of the unions resulting in a collective bargaining agreement that keep the employees in our 401(K) plan. The NLRB approved that settlement and, in May 2014, dismissed the case with respect to that local union. We reached a settlement with the remaining union, which also resulted in a collective bargaining agreement keeping the employees in our 401(K) plan, which was approved by the NLRB on June 19, 2017.
If we fail to extend or renegotiate our collective bargaining agreements, if disputes with our unions arise or if our unionized workers engage in a strike or other work stoppage, we could incur higher operation and labor costs or experience a significant disruption of operations.
Our employees in EMEA are represented by works councils or other labor organizations appointed pursuant to local law consisting of employee representatives who have rights to negotiate working terms and to receive notice of significant actions. These arrangements grant protections to employees and subject us to employment terms that are similar to collective bargaining agreements which may limit operational flexibility and increase operational expenses and labor costs.
Our substantial international operations subject us to risks related to doing business in foreign countries.
For the fiscal year ended September 30, 2017, we sold products to customers located in over 80 countries and generated 26.3% of total sales outside the U.S. These sales may represent an even larger portion of our net sales in the future. Also, we currently operate through approximately 80 third party warehouses located outside the U.S. Accordingly, our business is subject to risks related to the differing legal, political, social and regulatory requirements and economic conditions of many jurisdictions.
Legal and political risks are inherent in the operation of a company with our global scope. For example, it may be more difficult for us to enforce our agreements or collect receivables through foreign legal systems. In addition, the global nature of our business presents difficulties in hiring and maintaining a workforce in some countries and managing and administering an internationally dispersed business. In particular, the management of our personnel across several countries can present logistical challenges, including difficulties related to operating under different business cultures and languages.
Foreign countries may also impose additional withholding taxes or otherwise tax our foreign income, or adopt other restrictions on foreign trade or investment, including currency exchange controls. The imposition of tariffs is also a risk that could impair our financial performance.
22
There is a risk that foreign governments may nationalize private enterprises in countries where we operate. In some countries or regions, terrorist activities and the response to these activities may threaten our operations more than those in the U.S. and may result in limited operations, especially in the event of activities which may threaten the health and safety of our employees. Also, changes in general economic and political conditions in countries where we operate, particularly in emerging markets, are a risk to our financial performance.
There can be no assurance that the consequences of these and other factors relating to our multinational operations will not have an adverse effect on us.
Changes in tax laws could have an adverse impact on our earnings.
Changes to tax laws, rules and regulations, including changes in the interpretation or implementation of tax laws, rules and regulations by the Internal Revenue Service or other domestic or foreign governmental bodies, could affect us in substantial and unpredictable ways. Such changes could subject us to additional compliance costs.
We have significant operations in China and the laws and regulations applicable to our operations there are sometimes vague and uncertain. Any changes in such laws and regulations could materially adversely affect our business, financial condition, operating results and cash flows.
Our operations in China contributed, in aggregate across all lines of business, $214.2 million and $58.8 million in revenue for the fiscal years ended September 30, 2017 and 2016, respectively, and $125.0 million from October 1, 2015 through June 8, 2016 for the Predecessor. China’s legal system is a civil law system based on written statutes, where decided legal cases have little value as precedents, unlike the common law system prevalent in the U.S. There are substantial uncertainties regarding the interpretation and application of China’s laws and regulations, including among others, the laws and regulations governing the conduct of business in China, or the enforcement and performance of arrangements with customers and suppliers in the event of death, bankruptcy or the imposition of statutory liens or criminal proceedings. The Chinese government has been developing a comprehensive system of commercial laws, and considerable progress has been made in introducing laws and regulations dealing with economic matters such as foreign investment, corporate organization and governance, commerce, taxation and trade. However, because the laws and regulations are relatively new, and because of the limited volume of published cases and judicial interpretation and their lack of force as precedents, interpretation and enforcement of these laws and regulations involve significant uncertainties. New laws and regulations that affect existing and proposed future businesses may also be applied retroactively. We cannot predict what effect the interpretation or enforcement of existing or new laws or regulations may have on our business in China. If the relevant authorities find that we are in violation of China’s laws or regulations, they would have broad discretion in dealing with such a violation, including levying fines or requiring that we discontinue any portion or all of our business in China.
The promulgation of new laws, changes to existing laws and the pre-emption of local regulations by national laws may adversely affect our business in China. There can be no assurance that a change in leadership, social or political disruption, or unforeseen circumstances affecting China’s political, economic or social life, will not affect China’s government’s ability to continue to support and pursue the promulgation of new laws and changes to existing laws, as described above. Such a shift in leadership, social or political disruption or unforeseen circumstances could have a material adverse effect on our business and prospects.
Our business could be negatively affected by security threats, including cybersecurity threats, and other disruptions.
We face various security threats, including cybersecurity threats to gain unauthorized access to sensitive information or to render data or systems unusable, threats to our facilities, threats from disgruntled employees and terrorist acts. The potential for such security threats subjects our operations to increased risks that could have a material adverse effect on our business. In particular, our implementation of various procedures and controls to monitor and mitigate security threats and to increase security for our information, facilities and infrastructure may result in increased capital and operating costs. Moreover, there can be no assurance that such procedures and controls will be sufficient to prevent security breaches from occurring. If any of these security breaches were to occur, they could lead to losses of sensitive information, critical infrastructure or capabilities essential to our operations and could have a material adverse effect on our reputation, financial position, results of operations or cash flows. Cybersecurity attacks in particular are becoming more sophisticated and include, but are not limited to, malicious software, attempts to gain unauthorized access to data (either directly or through our vendors) and other electronic security breaches that could lead to disruptions in critical systems, unauthorized release of confidential or otherwise protected information and corruption of data. These events could damage our reputation and lead to financial losses from expenses related to remediation actions, loss of business or potential liability.
23
Attempts to expand our distribution services into new geographic markets may not achieve profitability for a period of time or at all.
We plan to expand our distribution services into new geographic markets, which will require us to make capital investments to extend and develop our distribution infrastructure. If we do not successfully add new distribution centers and routes, if we experience unanticipated costs or delays or if we experience competition in such markets that is greater than we expect, we may not achieve profitability in new regions for a period of time or at all.
Consolidation of our competitors in the markets in which we operate could place us at a competitive disadvantage and reduce our profitability.
We operate in an industry which is highly fragmented on a global scale, but in which there has been a trend toward consolidation in recent years. Consolidation of our competitors may jeopardize the strength of our position in one or more of the markets in which we operate and any advantages we currently have due to the comparative scale of our operations. Losing some of those advantages could adversely affect our business, financial condition, cash flows and results of operations, as well as our growth potential.
Our business is subject to many operational risks that can result in injury or loss of life, environmental damage, exposure to hazardous materials and other events that could potentially lead to the interruption of our business operations and/or the incurrence of significant costs.
The operations in our Chemicals and Environmental Services lines of business inherently involve the risk that chemical products or hazardous substances could be released into the environment from our facilities or equipment, either through spills or other accidents. Many of the chemical products and waste we handle, or have handled in the past, are potentially dangerous, and could present the risk of fires, explosions, exposure to hazardous materials and other hazards that could cause property or environmental damage or personal injury to our employees and third parties. Responding to the occurrence of any such incidents could cause us to incur potentially material expenditures related to response actions, government penalties, natural resource damages, business interruption and third party injury or property damage claims.
While we utilize extensive safety procedures and protocols in the operation of our businesses, there are risks inherent to the chemical distribution and environmental services industries. These relate primarily to the storage, handling, transportation and disposal of chemicals, wastes and other hazardous substances, which are subject to operational hazards and unforeseen interruptions caused by events beyond our control. These risks include, but are not limited to, accidents, explosions, fires, breakdowns in equipment or processes, acts of terrorism and severe weather. These events can result in injury or loss of life, environmental damage, exposure to hazardous materials and other events that could potentially lead to the interruption of our business operations and/or the incurrence of significant costs. In addition, the handling of chemicals has the potential for serious impacts on human health and the environment from such events as chemical spills, exposures and unintentional discharges or releases of toxic or hazardous substances or gases.
Our insurance policies may not cover all losses, costs or liabilities that we may experience.
Although we cover our operational risks with insurance policies in certain instances and to the extent our management deems appropriate, these policies are subject to customary exclusions, deductibles and coverage limits that we believe are in accordance with industry standards and practices. We are not insured against all risks, however, and we cannot guarantee that we will not incur losses beyond the policy limits or outside the coverage of our insurance policies. Moreover, from time to time, various types of insurance for companies involved in chemical distribution and environmental services have not been available on commercially acceptable terms or, in some cases, available at all. There can be no assurance that we will be able to maintain adequate insurance coverage in the future, that premiums, which have increased significantly in the last several years, will not continue to increase in the future, or that we will not be subject to liabilities in excess of available insurance.
Although we maintain liability insurance, there can be no assurance that this type or the level of coverage is adequate or that we will be able to continue to maintain our existing insurance or obtain comparable insurance at a reasonable cost, if at all. A product recall or a partially or completely uninsured judgment against us could have a material adverse effect on our business, financial condition, cash flows or results of operations.
24
Accidents, environmental damage, misuse of our products, adverse health effects or other harm related to hazardous materials that we carry or store could result in damage to our reputation and substantial remediation obligations.
Our business depends to a significant extent on our customers’ and suppliers’ trust in our reputation for quality, safety, reliability and environmental responsibility. Actual or alleged instances of safety deficiencies, inferior product quality, exposure to hazardous materials resulting in illness, injury or other harm to persons or property, environmental damage caused by us or our products, as well as misuse or misappropriation of our products, such as for terrorist activities or in the processing of illegal drugs, could damage our reputation and result in the loss of customers or suppliers. There can be no assurance that we will not incur such problems in the course of our operations. Also, there may be safety, personal injury or other environmental risks related to our products which are not known today. Any of the foregoing events, outcomes or allegations could also subject us to legal claims, and we could incur substantial legal fees and other costs in defending such claims.
Accidents or other incidents alleged to have taken place at our facilities, while a product is in transit, in a product’s end use application or otherwise involving our personnel or operations could also expose us to substantial liabilities and have a material adverse effect on our business, financial condition, cash flows and results of operations. Because many of the products we handle are potentially dangerous, we face the ongoing risk of explosions, fires, unintended releases and other hazards that may cause property damage, physical injury, illness or death.
There can be no assurance that these types of events will not occur in the future. If these events occur, whether through our own fault, the fault of a third party, pre-existing conditions at our facilities or among our fleet, natural disaster or other event outside our control, our reputation could be significantly damaged. We could also become responsible, through the application of environmental or other laws or by court order, for substantial monetary damages, costly investigation or remediation obligations and various fines or penalties, which may include liabilities arising from third party lawsuits or environmental clean-up obligations. The amount of any costs we may incur under such circumstances could substantially exceed any insurance we have to cover those losses.
Our business exposes us to potential product liability claims and recalls, which could adversely affect our financial condition and performance.
We are a distributor of products that third party manufacturers produce. We also sell a limited number of products directly to retail stores. Accordingly, our business involves an inherent risk of exposure to product liability claims, product recalls, product seizures and related adverse publicity. A product liability claim or judgment against us could also result in substantial and unexpected expenditures, affect consumer or customer confidence in our products, and divert management’s attention from other responsibilities. We generally extend to our customers the warranties provided to us by our suppliers and, accordingly, the majority of our warranty obligations to customers are intended to be covered by corresponding supplier warranties. However, there can be no assurance that our suppliers will continue to provide such warranties to us in the future, that warranty obligations to our customers will be covered by corresponding warranties from our suppliers or that our suppliers will be able to financially provide protection.
We are relying upon the creditworthiness of Ashland, which is indemnifying Holdings for certain liabilities associated with the Distribution Business. To the extent Ashland is unable (or unwilling) to satisfy its obligations to us, we may have no recourse under the ADA Purchase Agreement and will bear the risk of the liabilities associated with the Distribution Business.
Under the ADA Purchase Agreement, Ashland agreed to retain the Retained Remediation Liabilities. Ashland’s obligation for these liabilities is not subject to any claim thresholds or deductibles other than expenses we incur arising out of the Other Retained Remediation Liabilities; if we incur expenses arising out of the Other Retained Remediation Liabilities, Ashland’s indemnification obligation is subject to an individual claim threshold of $0.2 million and an aggregate claim deductible of $5.0 million. Ashland’s indemnification obligations under the ADA Purchase Agreement as described above terminated as of March 31, 2016, other than for the Retained Remediation Liabilities. As a result, any environmental remediation liabilities reported to Ashland after March 31, 2016 and not arising out of a Retained Remediation Liability will be liabilities of the Company. In addition, the Company is obligated to indemnify Ashland for any remediation liabilities other than the Retained Remediation Liabilities.
25
Based on the indemnification discussed above, we do not currently have any environmental or remediation reserves for matters that are covered by the ADA Purchase Agreement. However, if we were to incur expenses related to the Other Retained Remediation Liabilities, we would be responsible for the first $5.0 million in aggregate expenses relating thereto prior to the receipt of any indemnification from Ashland. In addition, if any Retained Specified Remediation Liability ultimately exceeds the liability ceilings described above, we would be responsible for such excess amounts. In either of these scenarios, and for liabilities associated with our operation of the business, we would be required to take appropriate environmental or remediation reserves.
Several of our facilities are currently undergoing active remediation for previous impacts to soil and groundwater. Under the ADA Purchase Agreement, Ashland retained liability for all known remediation obligations related to its ownership and operation of the Distribution Business before the closing date of the Ashland Distribution Acquisition and agreed to indemnify us for any losses associated with these liabilities, subject to some limitations. To date, we have not incurred any such costs. We may also discover new or previously unknown contamination which may not be indemnified by Ashland. In those cases and in situations where Ashland is unable or unwilling to fulfill its indemnification obligations, we may be responsible for substantial remediation costs.
To the extent Ashland is unable or unwilling to satisfy its indemnification obligations, we may have no recourse under the ADA Purchase Agreement and will bear the risk of the pre-closing liabilities associated with the Distribution Business, including certain known environmental liabilities. See "Item 3. Legal Proceedings."
We may be subject to personal injury claims related to exposure to hazardous materials and asbestos.
Our Chemicals and Environmental Services lines of business involve the storage, transportation and handling of hazardous materials, including chemicals and wastes. The nature of these operations could subject us to personal injury claims from individuals or classes of individuals related to exposure to such materials. We may also be subject to personal injury claims related to exposure to asbestos. Although we do not manufacture or distribute any products containing asbestos, asbestos-containing building materials have been identified at some of our facilities; these materials could present an exposure risk if improperly handled. Under the ADA Purchase Agreement, Ashland retained liability for all personal injury claims related to its ownership and operation of the Distribution Business before the closing date of the Ashland Distribution Acquisition filed on or before March 31, 2016, and will indemnify us for certain losses associated with these liabilities, subject to some limitations. Ashland will not indemnify us, however, for any personal injury claims filed after March 31, 2016 and for any personal injury claims arising from our own ownership and operation of the Distribution Business assets after the closing date of the Ashland Distribution Acquisition, nor will Ashland indemnify Holdings for any claims related to the removal or abatement of asbestos-containing materials. There can be no assurance that we will not incur any of these claims that could result in a material impact on our business, financial condition, cash flows or results of operations in the future.
We are exposed to ongoing litigation and other legal and regulatory actions and risks in the course of our business, and we could incur significant liabilities and substantial legal fees.
We are subject to the risk of litigation, other legal claims and proceedings and regulatory enforcement actions in the ordinary course of our business. The outcomes of these proceedings cannot be predicted with certainty. In addition, we cannot guarantee that the results of current and future legal proceedings will not materially harm our business, reputation or brand, nor can we guarantee that we will not incur losses in connection with current or future legal proceedings that exceed any provisions we may have set aside in respect of such proceedings. Many of the products we sell can cause liabilities to arise many years after their sale and use. Insurance purchased at the time of sale may not be available when costs arise in the future, and suppliers may no longer be available to provide indemnification or stand behind their warranties. There can be no assurance that we will not incur legal or regulatory cost that could result in a material impact on our business, financial condition, cash flows or results of operations in the future.
26
Our international sales and operations require access to international markets and are subject to applicable laws relating to trade, export and import controls and economic sanctions, the violation of which could adversely affect our operations.
We must comply with foreign laws relating to trade, export and import controls and economic sanctions. We may not be aware of all of such laws for the markets in which we do business, which subjects us to the risk of potential violations. Non-compliance could result in the loss of authorizations and licenses to conduct business in these countries or civil or criminal penalties. We must also comply with all applicable export and import laws and regulations of the U.S. and other countries. Such laws and regulations include, but are not limited to, the Export Administration Act, the Export Administration Regulations, the Arms Export Control Act and the International Traffic in Arms Regulations. The applicability of such laws and regulations generally is limited to "U.S. persons" (i.e., U.S. companies organized or registered to do business in the U.S. and to U.S. citizens, U.S. lawful permanent residents and other protected classes of individuals). However, these laws and regulations have certain extraterritorial effect in some instances, particularly with respect to the reexport of U.S.-origin equipment. We must comply with U.S. sanctions laws and regulations, which are primarily administered by the U.S. Department of Treasury’s Office of Foreign Assets Controls, as well as other U.S. government agencies. Transactions involving sanctioned countries, entities and persons are prohibited without U.S. government authorization (which will rarely be granted). The applicability of such sanctions laws and regulations generally is limited to U.S. persons. However, these sanctions laws and regulations have certain extraterritorial effect in some instances, particularly with respect to the reexport of U.S.-origin equipment. Moreover, U.S. sanctions against Cuba are specifically designed to cover foreign companies owned and controlled by U.S. companies and certain U.S. sanctions against Iran are designed to target foreign companies.
There can be no assurance that compliance with these laws and regulations will not have a material impact on our results of operations or cash flows in the future. Furthermore, while we have not experienced penalties from the violation of these laws that have materially impacted our results of operations or cash flows in any of the periods presented in this Annual Report on Form 10-K, violations of U.S. laws and regulations relating to trade, export and import controls and economic sanctions could result in significant civil and/or criminal penalties for our U.S. and foreign operations, including fines, onerous compliance requirements, prohibitions on exporting and importing, prohibitions on receiving government contracts or other government assistance and other trade-related restrictions. It should be noted that U.S. enforcement of such laws and regulations continues to increase, along with penalties for violations.
If we do not comply with the U.S. Foreign Corrupt Practices Act, we may become subject to monetary or criminal penalties.
The FCPA generally prohibits companies and their intermediaries from bribing foreign officials for the purpose of obtaining or keeping business. We currently take precautions to comply with this law. However, these precautions may not protect us against liability, particularly as a result of actions that may be taken in the future by agents and other intermediaries through whom we have exposure under the FCPA even though we may have limited or no ability to control such persons. Additionally, we have operations in certain countries, including Mexico, Russia and China, where strict compliance with the FCPA may conflict with local customs and practices. There can be no assurance that we will not be subject to penalties that might materially impact our business, financial condition, cash flows or results of operations in the future. Our competitors include foreign entities not subject to the FCPA, and hence compliance with this law may put us at a competitive disadvantage.
Regulatory compliance may divert our management's attention from day-to-day management of our business, which could have a material adverse effect on our business.
Our management team may not successfully or efficiently manage our continued transition to a public company that is subject to significant regulatory oversight and reporting obligations under the federal securities laws and the regulations imposed by NASDAQ. These regulations continue to evolve with the ongoing implementation of requirements of the Dodd-Frank Wall Street Reform and Consumer Protection Act and other new SEC regulations. In particular, these new obligations will require substantial attention from our senior management and could divert their attention away from the day-to-day management of our business, which could materially and adversely impact our business operations.
27
Our balance sheet includes significant intangible assets, which could become impaired.
At September 30, 2017, our intangible assets totaled $934.5 million, including $703.0 million in goodwill resulting from the Business Combination and the Ultra Chem Acquisition. We may also recognize additional goodwill and intangible assets in connection with any future business or asset acquisitions. Under U.S. GAAP, we are required to evaluate goodwill for impairment at least annually. Although we have not had an impairment on these intangible assets, we cannot guarantee that no material impairment will occur, particularly in the event of a substantial deterioration in our future profitability prospects, either in our business as a whole or in a particular segment. If we determine that the carrying value of our long-lived assets, goodwill or intangible assets is less than their fair value, we may be required to record impairment charges in the future which may significantly impact our profitability. The determination of fair value is highly subjective and can produce significantly different results based on the assumptions used and methodologies employed.
Changes in accounting standards issued by the FASB or other standard-setting bodies may adversely affect our financial statements.
Our financial statements are subject to the application of U.S. GAAP, which is periodically revised and/or expanded. Accordingly, from time-to-time we are required to adopt new or revised accounting standards issued by recognized authoritative bodies, including the FASB and the SEC. It is possible that future accounting standards we are required to adopt could change the current accounting treatment that we apply to our consolidated financial statements and that such changes could have a material adverse effect on our results of operations and financial condition.
If we fail to maintain an effective system of internal controls, we may not be able to accurately report our financial results and risk our ability to have such controls attested to by our independent auditors.
We are required to comply with Section 404 of the Sarbanes Oxley Act, which requires, among other things, that companies maintain disclosure controls and procedures to ensure timely disclosure of material information, and that management review the effectiveness of those controls on a quarterly basis. Effective internal controls are necessary for us to provide reliable financial reports and to help prevent fraud, and our management and other personnel devote a substantial amount of time to these compliance requirements. Moreover, these rules and regulations increased our legal and financial compliance costs and make some activities more time-consuming and costly. We cannot be certain that we will be able to maintain adequate controls over our financial processes and reporting in the future or that we will be able to comply with our obligations under Section 404 of the Sarbanes Oxley Act. Section 404 of the Sarbanes-Oxley Act also requires us to evaluate annually the effectiveness of our internal controls over financial reporting as of the end of each fiscal year and to include a management report assessing the effectiveness of our internal controls over financial reporting in our Annual Report on Form 10-K. If we fail to maintain the adequacy of our internal controls, we cannot assure you that we will be able to conclude in the future that we have effective internal controls over financial reporting and/or we may encounter difficulties in implementing or improving our internal controls, which could harm our operating results or cause us to fail to meet our reporting obligations. We cannot assure that we will receive a positive attestation from our independent auditors with respect to our internal controls. In the event we identify significant deficiencies or material weaknesses in our internal control that we cannot remediate in a timely manner or if we are unable to receive a positive attestation from our independent auditors with respect to internal controls, we might be subject to additional scrutiny by regulatory authorities, such as the SEC. Any such action could adversely affect our financial results and may also result in delayed filings with the SEC which could cause investors and others to lose confidence in the reliability of our financial statements.
We may incur significant costs and liabilities in the future resulting from new or existing environmental or safety laws or regulations or an accidental release of wastes or other materials into the environment.
Our Chemicals line of business, as well as the Predecessor's Composites line of business, involve the storage and distribution of various chemicals, solvents, additives, resins and catalysts to various end markets. Our Environmental Services line of business involves the collection, recovery, recycling and disposal of hazardous and non-hazardous materials. All of these lines of business, and to a lesser extent our Plastics line of business, are subject to increasingly stringent federal, state, local and foreign laws and regulations associated with protection of the environment. These laws and regulations govern such matters as the handling, storage and transportation of chemicals and composites, releases of pollutants into the air, soil, and water disposal of hazardous and non-hazardous wastes, remediation of contaminated sites, protection of workers from exposure to hazardous substances, and public disclosure of information regarding environmental and safety hazards. Our failure to comply with any environmental and safety laws or regulations could result in the assessment of administrative, civil or criminal penalties the imposition of investigatory or remediation liabilities and the issuance of injunctive relief, which could subject us to additional operational costs and constraints. Each of these outcomes could have an adverse effect on our business, financial condition, cash flows or results of operations.
28
Environmental and safety laws and regulations are subject to frequent modification, and recent trends indicate a movement towards increasingly stringent environmental and safety requirements. As a result, we may be required to make substantial expenditures to comply with future environmental and safety laws and regulations, and such expenditures could have an adverse effect on our business, financial condition, cash flows or results of operations. For example, the EPA has recently increased its regulation of toxic substances under TSCA. New or increased governmental restrictions on the transportation, use or disposal of certain chemicals, both domestically and abroad, could also reduce demand for our products, adversely affecting our operations.
Risks Related to Our Securities
TPG and FPA, collectively, have significant influence over us, which could limit your ability to influence the outcome of key transactions, including a change of control.
TPG and FPA (and their affiliates), collectively, owned approximately 63.5% of our outstanding common stock as of September 30, 2017. Because of the degree of concentration of voting power, the ability to elect members of and representation on our board of directors (the "Board") and influence our business and affairs, including any determinations with respect to mergers or other business combinations, the acquisition or disposition of assets, the incurrence of indebtedness, the issuance of any additional shares of our common stock or other equity securities, the repurchase or redemption of shares of our common stock and the payment of dividends, may be diminished.
Our stock price could be extremely volatile, and, as a result, you may not be able to resell your shares at or above the price you paid for them.
In recent years the stock market in general has been highly volatile. As a result, the market price and trading volume of our common stock is likely to be similarly volatile, and investors in our common stock may experience a decrease, which could be substantial, in the value of their stock, including decreases unrelated to our results of operations or prospects, and could lose part or all of their investment. The price of our common stock could be subject to wide fluctuations in response to a number of factors, including those described elsewhere in this Annual Report on Form 10-K and our other filings with the SEC such as:
• | operating results could fluctuate on a quarterly basis as a result of a number of factors, including, among other things, the timing of contracts, orders, the delay or cancellation of a contract, and changes in government regulations; |
• | actual or anticipated fluctuations in our quarterly financial results or the quarterly financial results of companies perceived to be similar to us; |
• | changes in the market’s expectations about our operating results; |
• | our operating results failing to meet the expectation of securities analysts or investors in a particular period; |
• | changes in financial estimates and recommendations by securities analysts concerning us or the specialty chemicals industry in general; |
• | operating and stock price performance of other companies that investors deem comparable to us; |
• | low trading volume of our common stock may adversely affect its liquidity and reduce the number of market makers and/or large investors willing to trade in our common stock, making wider fluctuations in the quoted price of our common stock more likely to occur; |
• | our ability to market new and enhanced products on a timely basis; |
• | changes in laws and regulations affecting our business; |
• | our ability to meet compliance requirements; |
• | commencement of, or involvement in, litigation involving us; |
• | changes in our capital structure, such as future issuances of securities or the incurrence of additional debt; |
• | the volume of shares of our common stock available for public sale; |
29
• | any major change in the Board or management; |
• | sales of substantial amounts of common stock by our directors, executive officers or significant stockholders or the perception that such sales could occur; and |
• | general economic and political conditions such as recessions, interest rates, fuel prices, international currency fluctuations and acts of war or terrorism. |
Securities class action litigation has often been initiated against companies following periods of volatility in their stock price. This type of litigation could result in substantial costs and divert our management’s attention and resources, and could also require us to make substantial payments to satisfy judgments or to settle litigation.
There may be sales of a substantial amount of our common stock by our current stockholders, and these sales could cause the price of our common stock to fall.
As of December 5, 2017, there were 89,753,662 shares of common stock issued and 89,741,309 shares outstanding. Of our issued and outstanding shares that were issued prior to the Business Combination, all are freely transferable, except for any shares held by our "affiliates," as that term is defined in Rule 144 under the Securities Act. Future sales of our common stock may cause the market price of our common stock to drop significantly, even if our business is doing well.
We and certain of our current stockholders may sell large amounts of our common stock in the open market or in privately negotiated transactions, which could have the effect of increasing the volatility in our stock price or putting significant downward pressure on the price of our common stock.
Sales of substantial amounts of our common stock in the public market, or the perception that such sales will occur, could adversely affect the market price of our common stock and make it difficult for us to raise funds through securities offerings in the future.
Future issuances of capital stock could reduce your influence over matters on which stockholders vote.
The Board has the authority, without action or vote of our stockholders, to issue all or any part of our authorized but unissued shares of common stock, including shares issuable upon the exercise of options, or shares of our authorized but unissued preferred stock. Issuances of common stock or voting preferred stock would reduce your influence over matters on which our stockholders vote and, in the case of issuances of preferred stock, would likely result in your interest in us being subject to the prior rights of holders of that preferred stock.
Warrants are exercisable for our common stock, which, if exercised, would increase the number of shares eligible for future resale in the public market and result in dilution to our stockholders.
As of December 5, 2017, outstanding warrants to purchase an aggregate of 25,012,500 shares of our common stock became exercisable in accordance with the terms of the warrant agreement governing those securities. These warrants will expire at 5:00 p.m., New York time, on June 9, 2021 or earlier upon redemption or liquidation. The exercise price of these warrants is $5.75 per half share, or $11.50 per one full share, subject to certain adjustments. To the extent such warrants are exercised, additional shares of our common stock will be issued, which will result in dilution to the holders of our common stock and increase the number of shares eligible for resale in the public market. Sales of substantial numbers of such shares in the public market or the fact that such warrants may be exercised could adversely affect the market price of our common stock.
30
If securities or industry analysts do not publish or cease publishing research or reports about us, our business, or our market, or if they change their recommendations regarding our common stock adversely, the price and trading volume of our common stock could decline.
The trading market for our common stock will likely be influenced by the research and reports that industry or securities analysts may publish about us, our business, our market, or our competitors. Securities and industry analysts do not currently, and may never, publish research on us. If no securities or industry analysts commence coverage of us, our stock price and trading volume would likely be negatively impacted. If any of the analysts who may cover us change their recommendation regarding our stock adversely, or provide more favorable relative recommendations about our competitors, the price of our common stock would likely decline. If any analyst who may cover us were to cease coverage of us or fail to regularly publish reports on it, we could lose visibility in the financial markets, which in turn could cause our stock price or trading volume to decline.
Anti-takeover provisions contained in our certificate of incorporation and bylaws could impair a takeover attempt.
Our second amended and restated certificate of incorporation, or charter, and bylaws contain provisions that could have the effect of delaying or preventing changes in control or changes in our management without the consent of the Board. These provisions include:
• | a staggered board providing for three classes of directors, which limits the ability of a stockholder or group to gain control of the Board; |
• | no cumulative voting in the election of directors, which limits the ability of minority stockholders to elect director candidates; |
• | the right of the Board to elect a director to fill a vacancy created by the expansion of the Board or the resignation, death, or removal of a director in certain circumstances, which prevents stockholders from being able to fill vacancies on the Board; |
• | the ability of the Board to determine whether to issue shares of our preferred stock and to determine the price and other terms of those shares, including preferences and voting rights, without stockholder approval, which could be used to significantly dilute the ownership of a hostile acquirer; |
• | a prohibition on stockholder action by written consent upon and following the date when TPG and the Sponsor cease to own more than 30% of the outstanding shares of stock (the "Trigger Date"), which forces stockholder action to be taken at an annual or special meeting of our stockholders; |
• | a prohibition on stockholders calling a special meeting upon and following the Trigger Date, which forces stockholder action to be taken at an annual or special meeting of our stockholders; |
• | the requirement that a meeting of stockholders may be called only by the Board after the Trigger Date, which may delay the ability of our stockholders to force consideration of a proposal or to take action, including the removal of directors; |
• | providing that after the Trigger Date directors may be removed prior to the expiration of their terms by stockholders only for cause or upon the affirmative vote of 75% of the voting power of all of our outstanding shares of capital stock; |
• | a requirement that changes or amendments to the charter or the bylaws must be approved (i) before the Trigger Date, by a majority of the voting power of our outstanding common stock, which such majority shall include at least 65% of the shares then held by the Sponsor and TPG, and (ii) thereafter, certain changes or amendments must be approved by at least 75% of the voting power of our outstanding common stock; and |
• | advance notice procedures that stockholders must comply with in order to nominate candidates to the Board or to propose matters to be acted upon at a stockholders’ meeting, which may discourage or deter a potential acquirer from conducting a solicitation of proxies to elect the acquirer’s own slate of directors or otherwise attempting to obtain control of the Company. |
31
These provisions, alone or together, could delay hostile takeovers and changes in control of us or changes in our management. Any provision of the charter or bylaws that has the effect of delaying or deterring a change in control could limit the opportunity for our stockholders to receive a premium for their shares of our common stock, and could also affect the price that some investors are willing to pay for our common stock.
We have no current plans to pay cash dividends on our common stock for the foreseeable future.
We may retain future earnings, if any, for future operations, expansion and debt repayment and have no current plans to pay any cash dividends for the foreseeable future. Any decision to declare and pay dividends as a public company in the future will be made at the discretion of the Board and will depend on, among other things, our results of operations, financial condition, cash requirements, contractual restrictions and other factors that the Board may deem relevant. In addition, our ability to pay dividends may be limited by covenants of any existing and future outstanding indebtedness we or our subsidiaries incur, including the Credit Facilities. As a result, a stockholder may not receive any return on an investment in our common stock unless such stockholder sells our common stock for a price greater than that which it paid for it.
Our securities may be delisted from NASDAQ.
Our common stock and warrants are currently listed on NASDAQ. However, we cannot assure you that we will be able to comply with the continued listing standards of NASDAQ. If we fail to comply with the continued listing standards of NASDAQ, our securities may become subject to delisting. If NASDAQ delists our common stock or warrants from trading on its exchange for failure to meet the continued listing standards, we and our security holders could face significant material adverse consequences including:
• | a limited availability of market quotations for our securities; |
• | a limited amount of analyst coverage; and |
• | a decreased ability for us to issue additional securities or obtain additional financing in the future. |
Item 1B. Unresolved Staff Comments
Not applicable.
Item 2. Properties
See "Item 1. Business—Global Distribution Channels —Facilities" for a description of our principal properties.
Item 3. Legal Proceedings
We are not currently a party to any legal proceedings that, if determined adversely against us, individually or in the aggregate, would have a material adverse effect on our financial position, results of operations or cash flows.
In July 2014, Ashland filed a lawsuit -- Ashland Inc. v. Nexeo Solutions, LLC, Case No. N14C-07-243 JTV CCLD, in the Superior Court for the State of Delaware in and for New Castle County. In the suit, Ashland seeks a declaration that Holdings is obligated to indemnify Ashland for losses Ashland incurs pertaining to the Other Retained Remediation Liabilities, up to the amount of a $5.0 million deductible, which Ashland contends applies pursuant to the ADA Purchase Agreement. Ashland further alleges that Solutions has breached duties related to that agreement by not having so indemnified Ashland for amounts Ashland has incurred for the Other Retained Remediation Liabilities at sites where Ashland disposed of wastes prior to the Ashland Distribution Acquisition, and on that basis seeks unspecified compensatory damages, costs and attorney’s fees. On June 21, 2017 the Company's Motion for Summary Judgment in this lawsuit was granted. Ashland appealed the ruling on July 20, 2017. The Company will continue to vigorously defend the lawsuit on appeal.
32
In April and November 2011, two local unions each filed an unfair labor practice charge against us with the NLRB, alleging that we should be considered a successor of Ashland and, as such, we were obligated to bargain to agreement or impasse with the unions before changing the employment terms that were in effect before commencing operations, including continuing to cover employees under the union-affiliated multi-employer pension plans in which the employees participated as employees of the Distribution Business. In November 2011, the NLRB filed a complaint against us with respect to both cases, and a consolidated hearing was held before an administrative law judge in April and May of 2012. On June 28, 2012, the NLRB administrative law judge found substantially in our favor, holding that we were not obligated to continue to cover employees in the multi-employer pension plans. We reached a settlement with one of the unions resulting in a collective bargaining agreement that keep the employees in our 401(K) plan. The NLRB approved that settlement and, in May of 2014, dismissed the case with respect to that local union. We reached a settlement with the remaining union, which resulted in a collective bargaining agreement keeping the employees in our 401(K) plan, which was approved by the NLRB on June 19, 2017.
In June 2014, we self-disclosed to the DTSC that an inventory of our Fairfield facility had revealed potential violations of RCRA and the California Health and Safety Code. Although no formal proceeding has been initiated, we expect the DTSC to seek payment of fines or other penalties for non-compliance. We do not expect the amount of any such fine or penalty to have a material adverse effect on our business, financial position or results of operations.
We expect that, from time to time, we may be involved in lawsuits, investigations and claims arising out of our operations in the ordinary course of business.
Item 4. Mine Safety Disclosures
Not applicable.
33
PART II
Item 5. Market for Company’s Common Equity, Related Stockholder Matters and Issuer Purchases of Equity Securities
The Company's common stock, warrants and units are currently quoted on NASDAQ under the symbols "NXEO", "NXEOW" and "NXEOU", respectively. Through June 8, 2016, our common stock, warrants and units were quoted under the symbols "WLRH", "WLRHW", and "WLRHU", respectively.
Common Stock, Warrants and Units Prices
The following table sets forth, for the periods indicated, the reported high and low sales prices for our common stock, warrants and units.
Common Stock | Warrants | Units | ||||||||||||||||||||||
Prices | Prices | Prices | ||||||||||||||||||||||
Fiscal Year 2017: | High | Low | High | Low | High | Low | ||||||||||||||||||
First | $ | 9.33 | $ | 7.28 | $ | 0.70 | $ | 0.44 | $ | 10.12 | $ | 7.89 | ||||||||||||
Second | 9.79 | 8.78 | 0.78 | 0.62 | 10.44 | 9.05 | ||||||||||||||||||
Third | 9.23 | 8.16 | 0.72 | 0.50 | 9.85 | 7.50 | ||||||||||||||||||
Fourth | 8.45 | 7.02 | 0.57 | 0.44 | 8.94 | 6.76 | ||||||||||||||||||
Year | $ | 9.79 | $ | 7.02 | $ | 0.78 | $ | 0.44 | $ | 10.44 | $ | 6.76 | ||||||||||||
Fiscal Year 2016: | ||||||||||||||||||||||||
First | $ | 10.47 | $ | 9.93 | $ | 0.80 | $ | 0.25 | $ | 11.22 | $ | 10.00 | ||||||||||||
Second | 10.06 | 9.90 | 0.65 | 0.29 | 10.70 | 10.19 | ||||||||||||||||||
Third(1) | 10.07 | 8.98 | 0.94 | 0.34 | 10.88 | 9.89 | ||||||||||||||||||
Fourth | 9.49 | 7.88 | 0.83 | 0.58 | 10.10 | 8.58 | ||||||||||||||||||
Year | $ | 10.47 | $ | 7.88 | $ | 0.94 | $ | 0.25 | $ | 11.22 | $ | 8.58 | ||||||||||||
(1) WL Ross Holding Corp. changed its name to Nexeo Solutions, Inc. on June 9, 2016.
Holders
As of December 5, 2017, there were 35 holders of record of our common stock, one holder of record for our warrants and one holder of record of our units. Some of our securities are held in "street name" and held of record by banks, brokers and other financial institutions.
Dividends
We have not paid any cash dividends on shares of our common stock to date. The payment of cash dividends in the future will be dependent upon our revenues and earnings, capital requirements and general financial condition. In addition, our Credit Facilities currently limit our ability to pay dividends and our board of directors is not currently contemplating and does not anticipate declaring any dividends in the foreseeable future. Further, if we incur any additional indebtedness, our ability to declare dividends may be limited by restrictive covenants that we may agree to in connection therewith.
34
Issuer Purchases of Equity Securities
The table below provides information concerning our repurchase of shares of our common stock during the fiscal year ended September 30, 2017:
Total Number of Shares Purchased (1) | Average Price Paid per Share | Total Number of Shares Purchase as Part of Publicly Announced Plans or Programs | Maximum Dollar Value of Shares that May Yet be Purchased Under the Plans or Programs | |||||||||
June 9, 2017 | 9,576 | $ | 8.69 | — | — | |||||||
Total | 9,576 | $ | 8.69 | — | — | |||||||
(1) Shares transferred to the Company to satisfy the officers’ and employees’ tax withholding obligations in connection with the vesting
of the TPG Restricted Stock Grants.
35
Item 6. Selected Financial Data
The Company is the result of the Business Combination between WLRH and Holdings as of the Closing Date and referred to as the "Successor". The "Predecessor" financial information reflects the operations of Holdings prior to the Closing Date of the Business Combination.
This table should be read in conjunction with Item 1 "Business", Item 1A "Risk Factors", Item 7 "Management’s Discussion and Analysis of Financial Condition and Results of Operations" and our audited consolidated financial statements and the notes thereto included under Item 8 of this Annual Report on Form 10-K.
Successor | Predecessor | |||||||||||||||||||||||
Fiscal Year Ended September 30, | October 1, 2015 Through June 8, | Fiscal Year Ended September 30, | ||||||||||||||||||||||
2017 | 2016* | 2016 | 2015 | 2014 | 2013 | |||||||||||||||||||
Statement of Operations Data: | ||||||||||||||||||||||||
Sales and operating revenues | $ | 3,636.9 | $ | 1,065.7 | $ | 2,340.1 | $ | 3,949.1 | $ | 4,514.5 | $ | 4,101.4 | ||||||||||||
Gross profit | 398.4 | 108.4 | 271.9 | 408.0 | 401.7 | 358.1 | ||||||||||||||||||
Net income (loss) from continuing operations | 14.4 | (8.4 | ) | (13.9 | ) | 21.2 | (12.2 | ) | (4.6 | ) | ||||||||||||||
Net income (loss) attributable to Nexeo Solutions, Inc. | 14.4 | (8.4 | ) | (13.8 | ) | 20.4 | 4.9 | 7.4 | ||||||||||||||||
Net income (loss) per share available to common stockholders | ||||||||||||||||||||||||
Basic | $ | 0.19 | $ | (0.24 | ) | |||||||||||||||||||
Diluted | $ | 0.19 | $ | (0.24 | ) | |||||||||||||||||||
Weighted average number of common shares outstanding | ||||||||||||||||||||||||
Basic | 76,752,752 | 35,193,789 | ||||||||||||||||||||||
Diluted | 76,839,810 | 35,193,789 | ||||||||||||||||||||||
Statement of Cash Flow Data (1): | ||||||||||||||||||||||||
Net cash provided by (used in): | ||||||||||||||||||||||||
Operating activities | $ | 78.6 | $ | 3.2 | $ | 69.6 | $ | 154.1 | $ | 57.5 | $ | (35.9 | ) | |||||||||||
Investing activities | (84.2 | ) | 133.0 | (11.8 | ) | (31.5 | ) | (209.9 | ) | (93.9 | ) | |||||||||||||
Financing activities | 11.8 | (88.9 | ) | (121.5 | ) | (81.8 | ) | 166.5 | 71.2 | |||||||||||||||
Other Financial Data(2): | ||||||||||||||||||||||||
Capital expenditures, excluding acquisitions (3) | $ | 27.6 | $ | 12.7 | $ | 14.2 | $ | 35.6 | $ | 49.9 | $ | 38.1 | ||||||||||||
Depreciation, amortization and impairment loss | 74.6 | 20.6 | 37.7 | 52.6 | 53.4 | 38.7 | ||||||||||||||||||
*The fiscal year ended September 30, 2016 includes 114 days of the acquired business’ operating activities as a result of the consummation of the Business Combination on June 9, 2016.
(1) | Statement of Cash Flow Data for all periods represents total cash flow amounts for each respective line item. |
(2) | Other Financial Data for the Successor and Predecessor periods reflects amounts net of discontinued operations. |
(3) | Excludes non-cash capital expenditures. |
36
Successor | Predecessor | |||||||||||||||||||
September 30, | September 30, | |||||||||||||||||||
2017 | 2016 | 2015 | 2014 | 2013 | ||||||||||||||||
Balance Sheet Data (at period end): | ||||||||||||||||||||
Cash and cash equivalents | $ | 53.9 | $ | 47.5 | $ | 127.7 | $ | 88.2 | $ | 74.6 | ||||||||||
Working capital (1) | 528.7 | 464.8 | 507.2 | 582.9 | 541.2 | |||||||||||||||
Total assets | 2,253.5 | 2,078.9 | 1,708.9 | 1,906.1 | 1,613.1 | |||||||||||||||
Long term obligations(2) | 804.3 | 774.9 | 891.9 | 925.2 | 659.3 | |||||||||||||||
Total liabilities | 1,475.9 | 1,334.1 | 1,423.9 | 1,581.3 | 1,191.7 | |||||||||||||||
(1) | Working capital is defined as accounts receivable plus inventory less accounts payable. |
(2) | Long term obligations represent debt, including current portion (net of discount and debt issuance costs) and capital leases. It excludes short-term borrowings under line of credit agreements available to the Company's operations in China and the Contingent Consideration Obligations. See Notes 3, 7 and 9. |
37
Item 7. Management’s Discussion and Analysis of Financial Condition and Results of Operations
The following discussion and analysis of our financial condition and results of operations is designed to provide information to better understand, and should be read together with, our consolidated financial statements and related notes included in Part II Item 8 in this Annual Report on Form 10-K. To the extent this discussion and analysis contains forward-looking statements, these statements involve risks and uncertainties. While management believes that these forward-looking statements are reasonable, there can be no assurance that future developments will be those that are anticipated. Actual results may differ materially from those anticipated in these forward-looking statements. See "Item 1A. Risk Factors" and "Cautionary Note Regarding Forward Looking Statements".
Overview
The Company is the result of the Business Combination between WLRH and Holdings as of the Closing Date and referred to as the "Successor". The "Predecessor" financial information reflects the operations of Holdings prior to the Closing Date of the Business Combination.
We are a global chemicals distributor in North America and Asia, and a global plastics distributor in North America, EMEA and Asia. We also provide on-site and off-site environmental services, in North America, primarily within the U.S. During fiscal year 2017, we distributed over 24,000 products in more than 80 countries for approximately 1,400 suppliers to approximately 28,100 customers. Based on revenues for calendar year 2016, we were ranked by the Independent Chemical Information Service (ICIS), one of the largest petrochemical market information providers, third in North America and fifth globally among the Top 100 Chemicals Distributors.
We distribute our product portfolio through a global supply chain consisting of approximately 180 owned, leased or third party warehouses, rail terminals and tank terminals with a private fleet of approximately 1,100 units, including tractors and trailers, primarily in North America. We currently employ approximately 2,640 employees globally.
For a detailed overview of our business, refer to Item 1, "Business" of this Annual Report on Form 10-K.
Segment Overview
We are organized into three lines of business, or operating segments: Chemicals, Plastics and Environmental Services. Each line of business represents unique products and suppliers focusing on specific end markets. Factors emphasized within each end market include supplier or customer opportunities, expected growth and prevailing economic conditions. Across our Chemicals and Plastics lines of business there are numerous industry segments, end markets and sub markets that we may choose to focus on. These end markets may change from year to year depending on the underlying market economics, supplier focus, expected profitability and our strategic agenda.
See Note 16 to our consolidated financial statements for detailed information on individual segments.
Key Factors Affecting our Results of Operations and Financial Condition
General and regional economic conditions. Consumption of chemicals and plastics in the industries and markets we serve are generally affected by the global economy and amplified by regional conditions. Although we manage our cost structure in line with general economic conditions, our volumes and profitability are ultimately correlated with the underlying demand for the end-products of the industries we serve.
Price fluctuations. Selling prices of the products we distribute within our Chemicals and Plastics lines of business fluctuate with changes in the prices we pay for products. Product costs are largely driven by global and regional economic conditions affecting the prices of two primary raw materials of production: crude oil (primarily naphtha) and natural gas (primarily ethane). These two raw materials are used in the production of propylene and ethylene, the key feedstocks used in over 90% of organic-based commodity and specialty chemicals, as well as in the subsequent production of the intermediate plastics products we distribute. The prices of these feedstocks are also affected by other factors, including choices made by producers for uses of feedstocks (e.g., as an ingredient in gasoline versus a feedstock to the chemical industry) and the capacity devoted to production and other macroeconomic factors that impact the producers. As a distributor, the prices of these feedstocks are not in our control. We are generally able to adjust finished good prices in accordance with the fluctuations in our product costs and transportation-related costs (e.g., fuel costs). As a result, movements in our sales revenue and cost of sales tend to correspond with changes in our product prices. Through fiscal year 2017, we managed these price fluctuations through effective inventory management to mitigate short-term price fluctuation exposure.
38
As capacity or demand patterns change, there can be a corresponding change in the selling prices of the products we distribute. Gross profit margins generally decrease in deflationary price environments and increase during inflationary pricing environments, although the extent to which profitability increases or decreases depends on the rate at which selling prices adjust relative to inventory costs. As a logistics provider, oil prices affect our transportation and delivery costs, along with changes in driver regulation, supply of drivers and common carrier rates. Common carrier costs have been challenging for us in North America through fiscal year 2017 largely due to driver shortages, further compounded as a result of recent federal mandates causing longer lead times and higher delivery costs.
Volume-based pricing. We generally procure chemicals and plastics raw materials through purchase orders and avoid long-term contracts with firm commitments. Our typical arrangements with key producers and suppliers are framework supply agreements. We develop relationships with a select group of producers and suppliers who complement our strategy, based on several factors, including price, quality, breadth of product offering, market recognition, delivery terms and schedules, continuity of supply and each producer’s strategic positioning. Our framework supply agreements with producers and suppliers typically renew annually. While they generally do not provide for specific product pricing, some include volume-based financial incentives through supplier rebates, earned by meeting or exceeding target purchase volumes. Supplier rebates are recorded as a reduction of inventory costs and accrued as part of cost of sales for products sold based on its purchases to date and estimates of purchases for the remainder of the calendar year. For the fiscal year ended September 30, 2017, our supplier rebates were $9.0 million.
Inflation. Our average selling prices rise in inflationary environments as producers and suppliers raise the market prices of the products that we distribute. During inflationary periods our customers maximize the amount of inventory they carry in anticipation of higher prices. This environment of excess demand favorably impacts our volumes, revenues and gross profit, due to the lag between rising prices and our cost of goods sold. The reverse is true in deflationary price environments. Deflationary forces create an environment of overcapacity, driving market prices of products downward, and we must quickly adjust inventories and buying patterns in response to price declines. Our primary objective is to replace inventories at lower costs while maintaining or enhancing unit profitability. Fiscal year 2017 began in a deflationary environment causing lower sales prices and reduced volumes; however, the environment shifted to an inflationary environment through the year enabling higher prices and volumes.
Some of our assets and liabilities, primarily cash, receivables, inventories and accounts payable, are impacted by commodity price inflation because they are indirectly affected by market prices of the raw materials that are used to manufacture our products. We manage our working capital during periods of changing prices, so the overall impact of inflation on our net working capital is generally not significant.
Currency exchange rate fluctuations. We conduct our business on an international basis, in multiple currencies. A portion of our sales and costs of sales transactions are denominated in currencies other than the functional currency of our subsidiaries. Further, we have exposure to foreign exchange fluctuations arising from the remeasurement of certain foreign operations where the USD is the functional currency but accounting records are kept in local currency. Strengthening/weakening of our subsidiaries’ functional currency relative to the other currencies in which some transactions are denominated or recorded creates foreign currency gains/losses, which we include in Selling, general and administrative expenses. Additionally, we report our consolidated results in USD and the results of operations and the financial position of our local international operations are translated into USD at the applicable exchange rates for inclusion in our consolidated financial statements. Strengthening of the USD relative to our subsidiaries’ functional currencies causes a negative impact on sales but a positive impact on costs. During fiscal year 2017, the strengthening of the USD compared to the functional currencies where we operate caused a negative impact of $11.8 million on consolidated revenues and $1.0 million on consolidated gross profit when compared to fiscal year 2016.
For more information on how the above factors impact us see Item 1A, "Risk Factors" of this Annual Report on Form 10-K.
Outlook
General. We have operations in North America, EMEA and Asia and are subject to broad, global and regional macroeconomic factors. These factors include:
• | the general state of the economy, specifically inflationary or deflationary trends, GDP growth rates and commodities/feedstocks price movements; |
• | unemployment levels; |
39
• | government regulation and geopolitical changes; |
• | fiscal and monetary policies of governments, including import and export tariffs, duties and other taxes; |
• | general income growth and the consumption rates of products; and |
• | technological change in the industries we serve. |
We monitor these factors routinely for both strategic and operational impacts.
Our operations are most impacted by regional market price fluctuations of the primary feedstock materials, including crude oil and natural gas, and the downstream derivatives of these primary raw materials. Market price fluctuations of these primary raw materials directly impact the decisions of our suppliers, specifically the manufacturing capacity made available for production of the products we distribute. As capacity or demand patterns change, we may experience a corresponding change in the average selling prices of the products we distribute.
The global markets stabilized during the first half of fiscal year 2017 and have begun to show some growth in the second half of fiscal year 2017 as shown by the increases in GDP, oil prices and U.S. Industrial Production Index.
The following is a summary of GDP, oil price and U.S. Industrial Production Index fluctuations in our various regions of operations by fiscal quarter.
Year over Year Change | ||||||||||||
Q4 17 v Q4 16 | Q3 17 v Q3 16 | Q2 17 v Q2 16 | Q1 17 v Q1 16 | |||||||||
North America | ||||||||||||
U.S. GDP Growth | 2.3 | % | 2.2 | % | 2.0 | % | 1.8 | % | ||||
U.S. Industrial Production Index | 1.9 | % | 2.1 | % | 0.6 | % | (0.1 | )% | ||||
West Texas Intermediate Crude Oil Average Price Decrease | 7.2 | % | 5.5 | % | 54.0 | % | 16.9 | % | ||||
EMEA | ||||||||||||
Euro Area GDP Growth | 2.5 | % | 2.3 | % | 2.0 | % | 1.9 | % | ||||
Brent Crude Oil Average Price Increase | 11.0 | % | 8.0 | % | 55.1 | % | 14.3 | % | ||||
Asia | ||||||||||||
China GDP Growth (1) | 6.9 | % | 6.9 | % | 6.9 | % | 6.7 | % | ||||
(1) As reported by the Chinese government. | ||||||||||||
Overall GDP growth has increased in many of the countries in which we operate. As a result we have experienced an increase in sales volumes. In terms of currency, the USD has continued to strengthen over the prior fiscal year against most other currencies in which we transact. As a result of these factors, reported dollar revenues and gross profit have been negatively impacted in many of our regional operations.
North America
The North American economic environment continued to improve during fiscal year 2017. U.S. GDP has increased in fiscal year 2017 as compared to fiscal year 2016, and the inflation rate has increased to 2.2% for fiscal year 2017 over the prior fiscal year, driven primarily by higher energy prices.
In terms of currency, the CAD strengthened when compared against the USD for fiscal year 2017 following slight declines during fiscal year 2016. The Peso weakened in value against the USD through fiscal year 2017.
40
EMEA
In Europe, we conduct business primarily in the Western European countries. Economic growth in Europe is expected to increase through 2018 as the global recovery is expected to gain momentum.
In terms of currency, the Euro and the majority of other European currencies were relatively flat versus the USD when comparing fiscal year 2017 to fiscal year 2016, which had limited effect on, among other items, the reported dollar revenues and gross profit from our European operations.
The market prices for the products we sell in Europe are typically correlated to the cost of Brent Crude as these operations are primarily based on the distribution of commodity plastics products and most products are sourced in Europe. Consistent with the increase in oil prices through fiscal year 2017, we have begun to see an increase in pricing.
Asia
Our operations in Asia are concentrated mainly in China. Recent GDP growth in China, as reported by the Chinese government, has continued to increase through fiscal year 2017, primarily due to a rise in industrial output, retail sales and fixed-asset investment with an increase in fiscal spending.
In terms of currency, the RMB continued to decline against the USD during fiscal year 2017 which affected, among other items, the reported dollar revenues and gross profit from our operations in China.
Certain Factors Affecting Comparability to Prior Fiscal Year Financial Results
• | After the Business Combination (see Note 3 to our consolidated financial statements) our results of operations are not directly comparable to historical results of the operations for the periods presented, primarily due to: |
◦ | Certain assets and liabilities had fair value adjustments applied to the Predecessor's consolidated financial statements on the Closing Date. |
◦ | In connection with the Business Combination, we have recognized certain contingent liabilities. |
◦ | The fiscal year ended September 30, 2016 only includes 114 days of the acquired business' operating activities as a result of the consummation of the Business Combination. |
• | In April 2017, the Company completed the Ultra Chem Acquisition. Accordingly, the consolidated results of operations for the fiscal year ended September 30, 2017 includes the results of the acquired operations since the Ultra Chem Closing Date, as described further below under "Results of Operations". The acquired operations are primarily included in our Chemicals line of business. See Note 3 to our consolidated financial statements. |
41
Results of Operations
Fiscal Year Ended September 30, 2017 compared with Fiscal Year Ended September 30, 2016 and the period October 1 through June 8, 2016 (Predecessor)
Our fiscal year ended September 30, 2017 includes operating results for the full twelve months, and our fiscal year ended September 30, 2016 includes operating results from June 9, 2016 through September 30, 2016 for the "Successor". The "Predecessor" period includes the operating results from October 1, 2015 through June 8, 2016.
Successor | Predecessor | |||||||||||
Fiscal Year Ended September 30, 2017 | Fiscal Year Ended September 30, 2016* | October 1, 2015 through June 8, 2016 | ||||||||||
Sales and operating revenues | ||||||||||||
Chemicals | $ | 1,667.2 | $ | 478.1 | $ | 1,066.4 | ||||||
Plastics | 1,841.7 | 546.7 | 1,192.2 | |||||||||
Other | 128.0 | 40.9 | 81.5 | |||||||||
Total sales and operating revenues | $ | 3,636.9 | $ | 1,065.7 | $ | 2,340.1 | ||||||
Gross profit | ||||||||||||
Chemicals | 205.6 | 55.7 | 136.2 | |||||||||
Plastics | 167.2 | 43.6 | 117.6 | |||||||||
Other | 25.6 | 9.1 | 18.1 | |||||||||
Total gross profit | 398.4 | 108.4 | 271.9 | |||||||||
Selling, general and administrative expenses | 312.9 | 91.7 | 208.9 | |||||||||
Transaction related costs | 1.9 | 21.3 | 33.4 | |||||||||
Change in fair value of contingent consideration obligations | 16.2 | (11.2 | ) | — | ||||||||
Operating income | 67.4 | 6.6 | 29.6 | |||||||||
Other income | 8.3 | 0.5 | 2.9 | |||||||||
Interest expense, net | (50.8 | ) | (14.3 | ) | (42.2 | ) | ||||||
Income (loss) from continuing operations before income taxes | 24.9 | (7.2 | ) | (9.7 | ) | |||||||
Income tax expense | 10.5 | 1.2 | 4.2 | |||||||||
Net income (loss) from continuing operations | 14.4 | (8.4 | ) | (13.9 | ) | |||||||
Net income (loss) from discontinued operations, net of tax | — | — | 0.1 | |||||||||
Net Income (Loss) Attributable to Nexeo Solutions, Inc. | $ | 14.4 | $ | (8.4 | ) | $ | (13.8 | ) | ||||
*The fiscal year ended September 30, 2016 includes 114 days of the acquired business’ operating activities as a result of the consummation of the Business Combination on June 9, 2016.
42
Combined financial data:
Successor | Predecessor | Combined | |||||||||||||||||||||
Fiscal Year Ended September 30, 2017 | Fiscal Year Ended September 30, 2016* | October 1, 2015 through June 8, 2016 | Fiscal Year Ended September 30, 2016 | Difference | % Change | ||||||||||||||||||
Sales and operating revenues | |||||||||||||||||||||||
Chemicals | $ | 1,667.2 | $ | 478.1 | $ | 1,066.4 | $ | 1,544.5 | $ | 122.7 | 7.9 | % | |||||||||||
Plastics | 1,841.7 | 546.7 | 1,192.2 | 1,738.9 | 102.8 | 5.9 | % | ||||||||||||||||
Other | 128.0 | 40.9 | 81.5 | 122.4 | 5.6 | 4.6 | % | ||||||||||||||||
Total sales and operating revenues | $ | 3,636.9 | $ | 1,065.7 | $ | 2,340.1 | $ | 3,405.8 | $ | 231.1 | 6.8 | % | |||||||||||
Gross profit | |||||||||||||||||||||||
Chemicals | 205.6 | 55.7 | 136.2 | 191.9 | 13.7 | 7.1 | % | ||||||||||||||||
Plastics | 167.2 | 43.6 | 117.6 | 161.2 | 6.0 | 3.7 | % | ||||||||||||||||
Other | 25.6 | 9.1 | 18.1 | 27.2 | (1.6 | ) | (5.9 | )% | |||||||||||||||
Total gross profit | 398.4 | 108.4 | 271.9 | 380.3 | 18.1 | 4.8 | % | ||||||||||||||||
Selling, general and administrative expenses | 312.9 | 91.7 | 208.9 | 300.6 | 12.3 | 4.1 | % | ||||||||||||||||
Transaction related costs | 1.9 | 21.3 | 33.4 | 54.7 | (52.8 | ) | (96.5 | )% | |||||||||||||||
Change in fair value of contingent consideration obligations | 16.2 | (11.2 | ) | — | (11.2 | ) | 27.4 | (244.6 | )% | ||||||||||||||
Operating income | 67.4 | 6.6 | 29.6 | 36.2 | 31.2 | 86.2 | % | ||||||||||||||||
*The fiscal year ended September 30, 2016 includes 114 days of the acquired business’ operating activities as a result of the consummation of the Business Combination on June 9, 2016.
Sales and operating revenues
Sales and operating revenues were $3,636.9 million for the fiscal year ended September 30, 2017, an increase of $231.1 million, or 6.8%, compared to the prior period. Excluding the $37.2 million in revenues from Ultra Chem, the increase in revenues was driven by a 2.5% increase in average selling price resulting primarily from leveraging our centralized pricing platform to manage a volatile market primarily in our Chemicals specialties businesses, and an increase in volume of 3.1% due to growth in our Plastics line of business in the current fiscal year. The increase in revenues was partially offset by an approximately $11.8 million decline as a result of the weakening of the exchange rates of various currencies versus the USD as compared to the prior period.
Chemicals
Sales and operating revenues for the Chemicals line of business were $1,667.2 million for the fiscal year ended September 30, 2017, an increase of $122.7 million, or 7.9%, compared to the prior period. Excluding the $36.6 million in revenues from Ultra Chem, the increase in revenues was driven by a 5.0% increase in the average selling price primarily due to the use of our centralized pricing platform to leverage price execution and order management in response to supply disruptions primarily in our specialties businesses, despite flat volume in the current fiscal year. The increase in revenues was partially offset by a $0.7 million decline as a result of the weakening exchange rates of various currencies versus the USD as compared to the prior period.
Plastics
Sales and operating revenues for the Plastics line of business were $1,841.7 million for the fiscal year ended September 30, 2017, an increase of $102.8 million or 5.9%, compared to the prior period. The increase in revenue was driven by a 6.4% increase in volume driven primarily by strong regional demand in EMEA and Asia. Average selling prices were flat for the current fiscal year. The volume increase was partially offset by a decline of approximately $11.1 million as a result of the weakening exchange rates of various currencies versus the USD as compared to the prior fiscal year. North America revenues were negatively impacted due to a supplier disruption which limited the availability to us of certain products we distribute on a regular basis.
43
Other
Sales and operating revenues for the Other segment were $128.0 million for the fiscal year ended September 30, 2017, an increase of $5.6 million, or 4.6%, compared to the prior period. The increase in revenues was driven by a more effective pricing strategy.
Gross profit
Gross profit was $398.4 million for the fiscal year ended September 30, 2017, an increase from $380.3 million in the prior period. The $18.1 million increase in gross profit was primarily driven by the increase in average selling prices in our Chemicals line of business and Plastics volumes as discussed.
Gross profit was negatively affected in the current fiscal year by additional depreciation expense of approximately $6.8 million due to the step up in fair value of the property, plant and equipment as a result of the Business Combination, $1.0 million related to the inventory step up as a result of the Ultra Chem Acquisition and an impairment charge of $1.5 million recorded to Cost of sales and operating expenses in our consolidated income statement related to the three major hurricanes which adversely affected our facilities and inventory during the fourth quarter of fiscal year 2017. In addition, gross profit was negatively affected in the current fiscal year by the impact of weakening exchange rates of various currencies versus the USD of approximately $1.0 million and by an increase in common carrier transportation costs driven by driver shortages, and costs associated with recent federal mandates. Further, Plastics operations in North America were negatively impacted due to a supplier disruption which limited the availability to us during the current year of certain products we distribute on a regular basis. In the prior period, gross profit included a one-time $13.8 million charge related to the inventory step up associated with the Business Combination
Chemicals
Gross profit was $205.6 million for the fiscal year ended September 30, 2017, an increase from $191.9 million in the prior period. The $13.7 million increase in gross profit was primarily due to the increase in average selling price as discussed and an increase in total Chemicals volume of 1.6%.
Gross profit was negatively affected in the current fiscal year by additional depreciation expense of approximately $4.9 million due to the step up in fair value of property, plant and equipment as a result of the Business Combination, $1.0 million related to the inventory step up as a result of the Ultra Chem Acquisition and an impairment charge of $1.3 million recorded to Cost of sales and operating expenses in our consolidated income statement related to the three major hurricanes which adversely affected our facilities in the fourth quarter of fiscal year 2017. Additionally, gross profit was negatively affected during the current fiscal year by an increase in common carrier transportation costs driven by driver shortages, and costs associated with recent federal mandates. In the prior period, gross profit included a one-time $6.0 million charge related to the inventory step up in basis associated with the Business Combination.
Plastics
Gross profit was $167.2 million for the fiscal year ended September 30, 2017, an increase from $161.2 million in the prior period. The $6.0 million increase in gross profit was primarily due to the increase in volumes as discussed.
Gross profit was negatively affected in the current fiscal year by additional depreciation expense of approximately $1.9 million due to the step up in fair value of the property, plant and equipment as a result of the Business Combination and by the impact of weakening exchange rates of various currencies versus the USD of approximately $0.8 million. Additionally, our North America revenues were negatively impacted in the current fiscal year due to a supplier disruption which limited the availability to us of certain products we distribute on a regular basis and by an increase in common carrier transportation costs driven by driver shortages, and costs associated with recent federal mandates. In the prior period, gross profit included a one-time $7.8 million charge related to the inventory step up associated with the Business Combination.
Other
Gross profit was $25.6 million for the fiscal year ended September 30, 2017, a decrease from $27.2 million compared to the prior period. As compared to the prior fiscal period, gross profit was negatively affected during the current fiscal year by an increase in common carrier transportation costs driven by driver shortages, and costs associated with recent federal mandates and a shift in service mix through the third quarter of fiscal year 2017 toward on-site services.
44
Selling, general and administrative expenses
Selling, general and administrative expenses were $312.9 million for the fiscal year ended September 30, 2017, an increase of $12.3 million compared to the prior period. The increase was primarily attributable to higher depreciation and amortization expense of $8.1 million and higher employee costs of $10.5 million, partially offset by decreased foreign exchange losses of $2.1 million and a decrease in consulting costs of $3.2 million. The increase in depreciation and amortization expense was driven by the effect of the Business Combination of $5.2 million, as well as $2.0 million from the Ultra Chem Acquisition. The $10.5 million increase in employee costs was driven by an increase in stock compensation expense of $3.3 million, an increase in variable selling compensation of $3.0 million, certain reorganization expenses of approximately $1.7 million and additional employee cost of $1.6 million as a result of the Ultra Chem Acquisition, which were partially offset by cost management and productivity initiatives. Foreign exchange losses were primarily driven by fluctuations in the RMB to USD and Peso to USD.
Transaction related costs
We incurred transaction related costs of $1.9 million and $21.3 million for the fiscal years ended September 30, 2017 and 2016, respectively, and $33.4 million for the Predecessor period from October 1, 2015 through June 8, 2016. Transaction costs for the fiscal year ended September 30, 2017 were primarily due to the Ultra Chem Acquisition. The prior fiscal year costs were primarily related to the Business Combination.
Changes in fair value of contingent consideration
The net loss of $16.2 million and a net gain of $11.2 million for the fiscal years ended September 30, 2017 and 2016, respectively, was related to the contingent consideration associated with the Deferred Cash Consideration and TRA from the Business Combination. See Notes 3 and 9 to our consolidated financial statements.
Other income
Other income for the fiscal year ended September 30, 2017 was $8.3 million primarily due to the gain related to reimbursements of certain capital expenditures in connection with the relocation of certain operations. See Note 5 to our consolidated financial statements. Other income for the fiscal year ended September 30, 2016 was $0.5 million primarily related to a $0.8 million reimbursement of certain capital expenditures in connection with the relocation of certain operations offset by a $0.2 million loss related to sale of property and equipment. Other income for the Predecessor period from October 1, 2015 through June 8, 2016 was $2.9 million, primarily due to a gain of $2.0 million in the sale of old private fleet tractors under the Ryder Lease and a $0.6 million gain on the repurchase of $9.5 million of Notes.
Interest expense, net
Interest expense, net was $50.8 million and $14.3 million for the fiscal years ended September 30, 2017 and 2016, respectively, and $42.2 million for the Predecessor period from October 1, 2015 through June 8, 2016. Fiscal year 2017 interest expense is related to the Credit Facilities including the amortization of the costs associated with incurring the debt. Predecessor interest expense was related to the Predecessor Credit Facilities and the Notes, along with the amortization of the costs associated with issuing the debt. The decrease in the current fiscal year compared to the prior fiscal year was primarily due to the redemption of the Notes in connection with the Business Combination, which resulted in a decrease in debt balance and related weighted average interest rate.
Income tax expense
Income tax expense was $10.5 million and $1.2 million for the fiscal years ended September 30, 2017 and 2016, respectively. Fiscal year 2017 tax expense was largely attributable to profitable operations in Europe, Canada and the U.S as compared to profitable foreign operations in EMEA and Mexico in the prior fiscal year. Income tax expense of $4.2 million for the Predecessor period from October 1, 2015 through June 8, 2016 was due to profitable foreign operations primarily in Canada, EMEA, Puerto Rico and Mexico. Income taxes for the Company are generally not comparable to the Predecessor as the Predecessor was organized as a limited liability company and taxed as a partnership for U.S. income tax purposes.
45
Fiscal Year Ended September 30, 2016 and the period October 1, 2015 through June 8, 2016 (Predecessor) compared with Fiscal Year Ended September 30, 2015 (Predecessor)
Our fiscal year ended September 30, 2016 includes operating results from June 9, 2016 through September 30, 2016 for the "Successor"; whereas, the "Predecessor" period includes the operating results from October 1, 2015 through June 8, 2016. The Predecessor fiscal year ended September 30, 2015 includes operating results for the full twelve months.
Successor | Predecessor | ||||||||||||
Fiscal Year Ended September 30, 2016* | October 1, 2015 through June 8, 2016 | Fiscal Year Ended September 30, 2015 | |||||||||||
Sales and operating revenues | |||||||||||||
Chemicals | $ | 478.1 | $ | 1,066.4 | $ | 1,956.1 | |||||||
Plastics | 546.7 | 1,192.2 | 1,876.1 | ||||||||||
Other | 40.9 | 81.5 | 116.9 | ||||||||||
Total sales and operating revenues | $ | 1,065.7 | $ | 2,340.1 | $ | 3,949.1 | |||||||
Gross profit | |||||||||||||
Chemicals | 55.7 | 136.2 | 224.4 | ||||||||||
Plastics | 43.6 | 117.6 | 155.1 | ||||||||||
Other | 9.1 | 18.1 | 28.5 | ||||||||||
Total gross profit | 108.4 | 271.9 | 408.0 | ||||||||||
Selling, general and administrative expenses | 91.7 | 208.9 | 329.5 | ||||||||||
Transaction related costs | 21.3 | 33.4 | 0.1 | ||||||||||
Change in fair value of contingent consideration obligations | (11.2 | ) | — | — | |||||||||
Operating income | 6.6 | 29.6 | 78.4 | ||||||||||
Other income | 0.5 | 2.9 | 11.4 | ||||||||||
Interest expense, net | (14.3 | ) | (42.2 | ) | (64.7 | ) | |||||||
Income (loss) from continuing operations before income taxes | (7.2 | ) | (9.7 | ) | 25.1 | ||||||||
Income tax expense | 1.2 | 4.2 | 3.9 | ||||||||||
Net income (loss) from continuing operations | (8.4 | ) | (13.9 | ) | 21.2 | ||||||||
Net income (loss) from discontinued operations, net of tax | — | 0.1 | (0.8 | ) | |||||||||
Net Income (Loss) Attributable to Nexeo Solutions, Inc. | $ | (8.4 | ) | $ | (13.8 | ) | $ | 20.4 | |||||
*The fiscal year ended September 30, 2016 includes 114 days of the acquired business’ operating activities as a result of the consummation of the Business Combination on June 9, 2016.
46
Combined financial data:
Successor | Predecessor | Combined | Predecessor | ||||||||||||||||||||
Fiscal Year Ended September 30, 2016* | October 1, 2015 through June 8, 2016 | Fiscal Year Ended September 30, 2016 | Fiscal Year Ended September 30, 2015 | Difference | % Change | ||||||||||||||||||
Sales and operating revenues | |||||||||||||||||||||||
Chemicals | $ | 478.1 | $ | 1,066.4 | $ | 1,544.5 | $ | 1,956.1 | $ | (411.6 | ) | (21.0 | )% | ||||||||||
Plastics | 546.7 | 1,192.2 | 1,738.9 | 1,876.1 | (137.2 | ) | (7.3 | )% | |||||||||||||||
Other | 40.9 | 81.5 | 122.4 | 116.9 | 5.5 | 4.7 | % | ||||||||||||||||
Total sales and operating revenues | $ | 1,065.7 | $ | 2,340.1 | $ | 3,405.8 | $ | 3,949.1 | $ | (543.3 | ) | (13.8 | )% | ||||||||||
Gross profit | |||||||||||||||||||||||
Chemicals | 55.7 | 136.2 | 191.9 | 224.4 | (32.5 | ) | (14.5 | )% | |||||||||||||||
Plastics | 43.6 | 117.6 | 161.2 | 155.1 | 6.1 | 3.9 | % | ||||||||||||||||
Other | 9.1 | 18.1 | 27.2 | 28.5 | (1.3 | ) | (4.6 | )% | |||||||||||||||
Total gross profit | 108.4 | 271.9 | 380.3 | 408.0 | (27.7 | ) | (6.8 | )% | |||||||||||||||
Selling, general and administrative expenses | 91.7 | 208.9 | 300.6 | 329.5 | (28.9 | ) | (8.8 | )% | |||||||||||||||
Transaction related costs | 21.3 | 33.4 | 54.7 | 0.1 | 54.6 | ** | |||||||||||||||||
Change in fair value of contingent consideration obligations | (11.2 | ) | — | (11.2 | ) | — | (11.2 | ) | — | % | |||||||||||||
Operating income | 6.6 | 29.6 | 36.2 | 78.4 | (42.2 | ) | (53.8 | )% | |||||||||||||||
*The fiscal year ended September 30, 2016 includes 114 days of the acquired business’ operating activities as a result of the consummation of the Business Combination on June 9, 2016.
** Not meaningful
Sales and operating revenues
Sales and operating revenues for the combined fiscal year ended September 30, 2016 was $3,405.8 million, a decrease of $543.3 million or 13.8%, compared to the prior fiscal year ended September 30, 2015. The decrease in revenues was driven by lower volumes and average selling prices in both our Chemicals and Plastics businesses as a result of the decline in oil and other commodity prices during the fiscal year ended September 30, 2016, as well as, weaker industrial demand.
Chemicals
Sales and operating revenues for the Chemicals line of business for the combined fiscal year ended September 30, 2016 was $1,544.5 million, a decrease of $411.6 million or 21.0%. The decrease in revenues was driven by a decline in volumes as average selling prices declined as a result of lower oil and commodity prices. Additionally, certain suppliers elected to supply customers directly.
Plastics
Sales and operating revenues for the Plastics line of business for the combined fiscal year ended September 30, 2016 was $1,738.9 million, a decrease of $137.2 million or 7.3%. The decrease in revenues was driven by flat volumes as average selling prices declined as a result of lower oil and commodity prices, as well as, weaker industrial demand.
Other
Sales and operating revenues for the Other segment was $122.4 million for the combined fiscal year ended September 30, 2016, an increase of $5.5 million or 4.7%. The increase in revenues was primarily driven by new customer acquisitions, expanded operations with existing customers and a favorable shift in product mix.
47
Gross profit
Gross profit was $380.3 million, or 11.2% for the combined fiscal year ended September 30, 2016, a decrease of $27.7 million; however, gross profit increased as a percentage of revenue from 10.3% in the prior fiscal year. The decrease in gross profit was driven by the decline in volumes and average selling prices as discussed. Additionally, the decrease in gross profit was primarily attributable to the recognition of $13.8 million associated with the inventory step up, and approximately $2.1 million in additional depreciation expense from the step up in fair value of property, plant and equipment recorded as a result of the Business Combination. The increase in gross profit as a percentage of revenues was primarily the result of the continued impact of certain profitability initiatives that helped reduce the impact of price compression and volume declines we were experiencing, improved product mix and decreased operating expenses that resulted from the continued execution of cost saving efforts including better utilization of our private fleet, better management of certain warehouse costs and other operating improvements.
Chemicals
Gross profit was $191.9 million, or 12.4%, for the combined fiscal year ended September 30, 2016, a decrease of $32.5 million; however, gross profit increased as a percentage of revenue from 11.5% in the prior fiscal year. The decrease in gross profit was driven by the decline in volumes and average selling prices as discussed. Additionally, the decrease in gross profit was attributable to the recognition of $6.0 million of inventory step up, and approximately $1.6 million of additional depreciation expense from the step up in fair value of property, plant and equipment recorded as a result of the Business Combination. The increase in gross profit as a percentage of revenues was primarily the result of the continued impact of certain profitability initiatives that helped reduce the impact of price compression and volume declines we were experiencing, improved product mix and decreased operating expenses that resulted from the continued execution of cost saving efforts including better utilization of our private fleet, better management of certain warehouse costs and other operating improvements.
Plastics
Gross profit was $161.2 million, or 9.3%, for the combined fiscal year ended September 30, 2016, an increase of $6.1 million and increased as a percentage of revenue from 8.3% in the prior fiscal year. The increase in gross profit was primarily the result of the continued impact of certain profitability initiatives that helped reduce the impact of price compression and volume declines we were experiencing, improved product mix and decreased operating expenses that resulted from the continued execution of cost saving efforts including better utilization of our private fleet, better management of certain warehouse costs and other operating improvements. This was offset by a decrease attributable to the recognition of $7.8 million related to the inventory step up, and approximately $0.5 million of additional depreciation expense from the step up in fair value of property, plant and equipment recorded as a result of the Business Combination.
Other
Gross profit was $27.2 million, or 22.2%, for the combined fiscal year ended September 30, 2016, a decrease of $1.3 million, and a decrease as a percentage of revenue from 24.4% in the prior fiscal year. The decrease was primarily due to higher costs related to new and expanded operations coupled with lower margins on recycled materials as the result of a decline in market value of the materials and some price compression associated with a competitive market.
Selling, general and administrative expenses
Selling, general and administrative expenses were $300.6 million for the combined fiscal year ended September 30, 2016, a decrease of $28.9 million. The decrease was driven primarily by lower employee and consulting costs as a result of execution on key initiatives related to cost management and productivity and lower employee variable compensation costs. This decrease was partially offset by increased depreciation and amortization expense as a result of the fair value step up in assets associated with the Business Combination and increased audit fees as a result of the Business Combination's additional reporting requirements.
Transaction related costs
We incurred transaction related costs of $21.3 million for the fiscal year ended September 30, 2016 and $33.4 million for the Predecessor period from October 1, 2015 through June 8, 2016. The costs were primarily related to the Business Combination.
48
Changes in fair value of contingent consideration
We incurred a gain of $11.2 million for the fiscal year ended September 30, 2016 related to the contingent consideration associated with the Deferred Cash Consideration and TRA from the Business Combination. See Notes 3 and 9 to our consolidated financial statements.
Other income
Other income for the fiscal year ended September 30, 2016 was $0.5 million primarily related to a $0.8 million reimbursement of certain capital expenditures in connection with the relocation of certain operations, offset by a $0.2 million loss related to sale of property and equipment. Other income for the Predecessor period from October 1, 2015 through June 8, 2016 was $2.9 million, primarily due to a gain of $2.0 million in the sale of old private fleet tractors under the Ryder Lease and a $0.6 million gain on the repurchase of $9.5 million of Notes. Other income for the Predecessor fiscal year ended September 30, 2015 was $11.4 million, primarily due to a gain of $8.0 million recorded in connection with the release of escrow funds from a previous acquisition, a gain of $1.7 million on the sale of old private fleet trucks and a gain of $0.6 million on the repurchase of the Notes.
Interest expense, net
Interest expense, net was $14.3 million for the fiscal year ended September 30, 2016 and $42.2 million for the Predecessor period from October 1, 2015 through June 8, 2016 and $64.7 million for the fiscal year ended September 30, 2015. Interest expense in fiscal year 2016 was related to the Credit Facilities, including the amortization of the costs associated with incurring the debt. Predecessor interest expense was related to the Predecessor Credit Facilities and the Notes, along with the amortization of the costs associated with the issuing of the debt. The decrease was primarily due to the redemption of the Notes in connection with the Business Combination.
Income tax expense
Income tax expense was $1.2 million for the fiscal year ended September 30, 2016 primarily attributable to profitable foreign operations, primarily EMEA and Mexico. Income tax expense of $4.2 million for the Predecessor period from October 1, 2015 through June 8, 2016 was due to profitable foreign operations, primarily Canada, EMEA, Puerto Rico and Mexico. Income tax expense of $3.9 million for the fiscal year ended September 30, 2015 was largely attributable to foreign income tax expense on profitable operations, primarily Canada, Mexico, the U.K., and Spain. Income taxes for the Company are generally not comparable to the Predecessor as the Predecessor was organized as a limited liability company and taxed as a partnership for U.S. income tax purposes.
Liquidity and Capital Resources
Overview
Our primary sources of liquidity are cash flows generated from our operations and borrowing availability under the ABL Facility. Cash flows generated from operations are influenced by seasonal patterns of our business and other timing circumstances that can result in increases or decreases in working capital requirements for any given period during the course of our fiscal year. Our ability to generate sufficient cash flows from operating activities will continue to be primarily dependent on purchasing and distributing chemical and plastic materials. Additionally, our ability to generate cash flows in the normal course of business can be significantly influenced by changing global and regional macroeconomic conditions. Borrowing availability under the ABL Facility is subject to a borrowing base generally comprised of eligible inventory, accounts receivable and cash and cash equivalents held in certain accounts and certain subsidiaries. Our availability under the ABL Facility is, therefore, potentially subject to fluctuations, depending on the value of the eligible assets in the borrowing base on a given valuation date. An inability to borrow under the ABL Facility may adversely affect our liquidity, results of operations and financial condition.
Our operating cash requirements consist principally of inventory purchases, trade credit extended to customers, labor, occupancy costs and transportation and delivery costs. Non-operating cash requirements include debt service requirements, acquisition-related costs and capital expenditures.
49
Capital Expenditures
Cash capital expenditures were $27.6 million for fiscal year 2017 and $12.7 million for fiscal year 2016 and $14.2 million for the Predecessor period October 1 through June 8, 2016 related primarily to facility improvements and additional information technology investments. During the fiscal year ended September 30, 2017, we incurred capital expenditures in connection with the relocation of our leased facility in Montgomery, Illinois, however, reimbursements from the Illinois Tollway Authority resulted in net cash received of $8.4 million. We expect our aggregate capital expenditures for fiscal year 2018 (excluding acquisitions and any assets acquired via capital leases) to be approximately $35.0 million, including $10.8 million for a planned land acquisition at one of our facilities expected to close during the period. Capital expenditures are expected to be primarily related to fixed asset replacements, improvements to our information technology infrastructure and equipment and vehicles.
We entered into the Montgomery Lease in the first quarter of fiscal year 2017 which is accounted for as a capital lease with an initial cost of $13.2 million. The Montgomery Lease has a term of 15 years, with annual payments beginning at $1.1 million per year. Our total capital lease obligations balance was $37.5 million as of September 30, 2017 and is primarily associated with the Ryder Lease and the Montgomery Lease. See Note 7 to our consolidated financial statements.
Credit Facilities
ABL Facility
The ABL Facility provides for committed revolving credit financing including a U.S. Tranche of up to $505.0 million, a Canadian Tranche of up to the USD equivalent of $40.0 million, and a FILO Tranche up to $30.0 million. The ABL Facility matures on June 9, 2021. Provided no default or event of default, the ABL Borrowers have the option, at the beginning of each quarter, to request that the ABL Facility be increased by an aggregate amount, when included with any incremental borrowings issued under the Term Loan Facility, not to exceed $175.0 million.
The ABL Facility includes a letter of credit sub-facility, which permits up to $200.0 million of letters of credit under the U.S. Tranche (which may be denominated in USD, Euros or other currencies approved by the administrative agent and the issuing bank) and up to the USD equivalent of $10.0 million of letters of credit under the Canadian Tranche (which may be denominated in CAD only). The ABL Facility also contains a FILO Tranche which can be used by any non-Canadian foreign subsidiary for loans or letters of credit up to an aggregate amount not to exceed $30.0 million.
Obligations under the ABL Facility are secured by a first priority lien on all ABL Facility first lien collateral, including eligible inventory and accounts receivable of the ABL Borrowers, and a second priority lien on all Term Loan Facility first lien collateral including outstanding equity interests of the Borrower and certain of the other subsidiaries of Holdings, in each case, subject to certain limitations; provided, that no ABL Facility first lien collateral or Term Loan Facility first lien collateral owned by the Canadian Borrower secure the obligations owing under the U.S. tranche of the ABL Facility.
Fees paid to the lenders during the fiscal year ended September 30, 2016 in connection with the ABL Facility totaled $6.8 million and were recorded as debt issuance costs in Other non-current assets on the consolidated balance sheet to be amortized as interest expense over the remaining term of the ABL Facility.
At September 30, 2017, we had $139.3 million in borrowings outstanding under the ABL Facility. Outstanding borrowings on the ABL Facility included approximately $58.0 million drawn for the closing of the Ultra Chem Acquisition. Interest expense related to the ABL Facility, excluding amortization of debt issuance costs, was $6.7 million and $1.8 million for the fiscal years ended September 30, 2017 and 2016, respectively.
As of September 30, 2017, we were in compliance with the covenants of the ABL Facility.
Term Loan Facility
The Term Loan Facility provides secured debt financing in an aggregate principal amount of up to $655.0 million and the right, at our option, to request additional tranches of term loans in an aggregate principal amount, when included with any incremental borrowings issued under the ABL Facility, amount up to $175.0 million, plus unlimited additional amounts such that the aggregate principal amount of indebtedness outstanding at the time of incurrence does not cause the consolidated Secured Net Leverage Ratio, calculated on a pro forma basis, to exceed 4.1 to 1.0. Availability of such additional tranches of term loans is subject to the absence of any default, and among other things, the receipt of commitments by existing or additional financial institutions. The Term Loan Facility matures on June 9, 2023.
50
On March 22, 2017, the Company completed TLB Amendment No. 1 amending the Term Loan Facility. TLB Amendment No. 1 reduced the interest rate margin applicable to outstanding term loans by 50 basis points from 4.25% to 3.75% for LIBOR loans and from 3.25% to 2.75% for base rate loans. In addition, the 1% LIBOR floor was eliminated. TLB Amendment No.1 provides a prepayment premium equal to 1% of the amount of the term loan applicable to certain repricing transactions occurring on or prior to six months from the effective date of TLB Amendment No. 1. TLB Amendment No. 1 will result in an estimated $3.3 million reduction to the Company’s annual cash interest expense for each of the next six years, while all other terms of the Term Loan Facility remain unchanged. There were no changes to the total or secured leverage ratios.
Obligations under the Term Loan Facility are secured by a first priority lien on all Term Loan Facility first lien collateral, including outstanding equity interests of the Borrower and certain of the other subsidiaries of Holdings, and a second priority lien on all ABL Facility first lien collateral, including accounts receivable and inventory of the loan parties under the Term Loan Facility, subject to certain limitations.
At September 30, 2017, we had $646.9 million in borrowings outstanding under the Term Loan Facility. We are required to make mandatory principal payments on an annual basis, commencing with the fiscal year ending September 30, 2017, if cash flows for the year, as defined in the agreement, exceed certain levels specified in the agreement. We were not required to make such principal payment for fiscal year 2017. Interest expense related to the Term Loan Facility, excluding original issue discount amortization and amortization of debt issuance costs was $33.6 million and $10.9 million for the fiscal years ended September 30, 2017 and 2016, respectively.
As a result of TLB Amendment No. 1, the Company incurred debt issuance costs of $1.3 million during the fiscal year ended September 30, 2017, which will be amortized throughout the remaining life of the Term Loan Facility. Fees paid to the lenders during the fiscal year ended September 30, 2016 in connection with the Term Loan Facility totaled $18.5 million and were recorded as a reduction of the debt balance to be amortized as interest expense over the remaining term of the Term Loan Facility.
At September 30, 2017, we were in compliance with the covenants of the Term Loan Facility.
Predecessor Credit Facilities
In addition to cash flows generated from its operations, the Predecessor’s sources of liquidity included borrowings under the Predecessor Credit Facilities. The Predecessor’s ABL Facility was scheduled to mature on July 11, 2017 and the Predecessor Term Loan Facility was scheduled to mature on September 9, 2017. As of the Closing Date, the Predecessor was in compliance with the covenants of the Predecessor Credit Facilities. In connection with the completion of the Business Combination, a principal payment of $617.5 million was made and all of the Predecessor’s outstanding indebtedness and other obligations under the Predecessor Credit Facilities were fully discharged.
Predecessor Senior Subordinated Notes due 2018
The Notes were scheduled to mature on March 1, 2018. Effective as of the Closing Date, the Issuers redeemed all of the approximately $149.7 million principal amount of the Notes outstanding at a redemption price equal to 100% of the principal amount (plus accrued and unpaid interest up to, but not including the Closing Date). The Issuers and the guarantors under the Notes have been released from their respective obligations under the Notes and the Indenture governing the Notes, effective as of the Closing Date. As of the Closing Date, the Predecessor was in compliance with the covenants of the indenture governing the Notes.
Working Capital
Our Chemicals and Plastics lines of business generally require significant working capital to purchase products from suppliers and sell those materials to our customers. The primary components of our working capital accounts are accounts receivable, inventories, and accounts payable. Working capital balances were $528.7 million and $464.8 million as of September 30, 2017 and 2016, respectively. The Ultra Chem Acquisition comprised approximately $12.6 million of the total increase in working capital from September 30, 2016. The remainder of the variance was primarily driven by higher accounts receivable balances associated with higher volumes and higher average selling prices at the end of the fourth quarter of fiscal year 2017.
51
As discussed under "—Proprietary Operating Systems," we generally manage working capital by utilizing our ERP system, which enables us to forecast rolling weekly volumes, anticipate demand shift fluctuations and quickly respond to rapidly changing customer needs for the majority of our operations. This platform, combined with our product line management department as further described in "—Supplier Relationships—Product Line Management and Purchasing," enables us to efficiently manage working capital. We further manage working capital by focusing on terms of purchase and sale, evaluating the creditworthiness of customers when extending trade credit, utilizing systematic collection efforts and managing inventory to closely match demand and meet required customer service levels.
Liquidity
The following table summarizes our liquidity position as of September 30, 2017 and September 30, 2016:
September 30, 2017 | September 30, 2016 | ||||||
Cash and cash equivalents | $ | 53.9 | $ | 47.5 | |||
ABL Facility availability | 277.8 | 273.8 | |||||
Total liquidity | $ | 331.7 | $ | 321.3 | |||
Cash and Cash Equivalents
At September 30, 2017, we had $53.9 million in cash and cash equivalents of which $36.8 million was held by foreign subsidiaries, $31.1 million of which was denominated in currencies other than the USD, primarily in Euros, and $8.5 million in China denominated in RMB. While the RMB is convertible into USD, foreign exchange transactions are subject to approvals from the SAFE. We do not anticipate any significant adverse impact to overall liquidity from potential limitations on the transfer or conversion of cash and cash equivalents.
ABL Facility
Under the ABL Facility, if as of any date of determination when Trigger Event Excess Availability (as defined in the ABL Facility) is below certain thresholds or upon certain defaults, we will be required to deposit cash on a daily basis from certain depository accounts in a collection account maintained with the administrative agent, which will be used to repay outstanding loans and cash collateralized letters of credit. Such requirement will be deemed continuing until the Trigger Event Excess Availability exceeds such threshold amount for 20 consecutive days. At September 30, 2017, Trigger Event Excess Availability under the ABL Facility was $277.8 million, which was $46.3 million in excess of the $231.5 million threshold that would trigger the foregoing requirements.
Based on current and anticipated levels of operations, capital spending projections and conditions in our markets, we believe that cash on hand, together with cash flows from operations and borrowings available under the ABL Facility, are adequate to meet our working capital and capital expenditure needs as well as any debt service and other cash requirements for at least twelve months.
In addition to operating and non-operating cash requirements previously described, our longer-term liquidity needs are primarily related to our final maturity debt payments due in 2021 and 2023. Depending on market conditions and other factors, we may also consider alternative financing options, including, but not limited to, issuance of equity, issuance of debt or refinancing of our existing debt obligations.
52
Cash Flows
The following table sets forth the major categories of our cash flows for the fiscal years ended September 30, 2017 and 2016 and of the Predecessor for the period October 1, 2015 through June 8, 2016 and fiscal year ended September 30, 2015.
Major Categories of Cash Flows | Successor | Predecessor | ||||||||||||||
Fiscal Year Ended September 30, 2017 | Fiscal Year Ended September 30, 2016* | October 1, 2015 through June 8, 2016 | Fiscal Year Ended September 30, 2015 | |||||||||||||
(in millions) | ||||||||||||||||
Net cash provided by operating activities from continuing operations | $ | 78.6 | $ | 3.2 | $ | 69.5 | $ | 154.7 | ||||||||
Net cash provided by (used in) operating activities from discontinued operations | — | — | 0.1 | (0.6 | ) | |||||||||||
Net cash provided by operating activities | 78.6 | 3.2 | 69.6 | 154.1 | ||||||||||||
Net cash provided by (used in) investing activities | (84.2 | ) | 133.0 | (11.8 | ) | (31.5 | ) | |||||||||
Net cash provided by (used in) financing activities | 11.8 | (88.9 | ) | (121.5 | ) | (81.8 | ) | |||||||||
Effect of exchange rate changes on cash and cash equivalents | 0.2 | — | 0.3 | (1.3 | ) | |||||||||||
Increase (decrease) in cash and cash equivalents | 6.4 | 47.3 | (63.4 | ) | 39.5 | |||||||||||
Cash and cash equivalents at the beginning of the period | 47.5 | 0.2 | 127.7 | 88.2 | ||||||||||||
Cash and cash equivalents at the end of the period | $ | 53.9 | $ | 47.5 | $ | 64.3 | $ | 127.7 | ||||||||
*The fiscal year ended September 30, 2016 includes 114 days of the acquired business’ operating activities as a result of the consummation of the Business Combination on June 9, 2016.
Fiscal Year Ended September 30, 2017 Compared to Fiscal Year Ended September 30, 2016, Period October 1, 2015 through June 8, 2016 (Predecessor), and Fiscal Year Ended September 30, 2015 (Predecessor)
Cash flows from operating activities
Net cash provided by operating activities for the fiscal year ended September 30, 2017 was $78.6 million. Net income of $14.4 million, adjusted for the gain related to reimbursement for certain capital expenditures incurred in connection with the relocation of certain operations, and significant non-cash items such as depreciation and amortization expenses, amortization of debt issuance costs, impairment charge due to natural disasters, deferred income taxes, equity-based compensation expense, and changes relating to contingent consideration liabilities collectively totaling $94.5 million, resulted in $108.9 million of cash inflow during the fiscal year ended September 30, 2017. Net cash provided by operating activities was impacted by the items specified below:
• | Accounts and notes receivable increased $101.9 million, primarily driven by higher sales volumes and rising average selling prices experienced during the current fiscal year, as well as timing of collections at period end. There were no significant changes in billing terms or collection processes during the current fiscal year. |
• | Inventories decreased $14.4 million due to higher sales volumes in the fourth quarter of fiscal year 2017. |
• | Accounts payable increased $43.7 million, primarily driven by higher volumes and purchase prices during the period. |
• | Accrued expenses and other liabilities increased $6.1 million, which included the accrual of our annual employee incentive compensation, which was partially offset by a decrease in other current assets of $5.6 million. |
• | Other assets and liabilities contributed $1.8 million to net cash provided by operating activities. |
Net cash provided by operating activities for the fiscal year ended September 30, 2016 was $3.2 million, based on a 114 day operating period. Net loss of $8.4 million, adjusted for loss on sale of property and equipment and significant non-cash items such as depreciation and amortization expenses, debt issuance costs amortization, transaction costs paid in stock, equity-based compensation, and changes relating to contingent consideration liabilities, deferred income taxes, provision for bad debt and reimbursement for certain capital expenditures incurred in connection with eminent domain proceeding, collectively totaling $23.0 million, provided $14.6 million of cash inflow during the fiscal year ended September 30, 2016. Net cash provided by operating activities was impacted by the items specified below:
53
• | Accounts and notes receivable increased $5.0 million, primarily driven by the timing of collections on accounts receivable during the fiscal year ended September 30, 2016. There were no significant changes in billing terms or collection processes during the fiscal year ended September 30, 2016. |
• | Accounts payable and accrued expenses decreased $19.4 million, driven primarily by payment of approximately $29.4 million of transaction costs accrued by the Predecessor at the time of the closing of the Business Combination, partially offset by the timing of payments. |
• | Inventories decreased $12.5 million primarily due to $13.8 million of fair value adjustment to inventory as result of the Business Combination, partially offset by a shift in inventory mix towards higher value plastics products. |
Net cash provided by operating activities for the Predecessor period from October 1, 2015 through June 8, 2016 was $69.5 million, based on a 252 day operating period. Net loss of $13.9 million, adjusted for gain on sale of property and equipment and significant non-cash items such as depreciation and amortization expenses, debt issuance costs, bad debt, equity-based compensation, deferred income taxes and gain on debt extinguishment, collectively totaling $46.2 million, resulted in $32.3 million of cash inflow for the period from October 1, 2015 through June 8, 2016. Net cash provided by operating activities was impacted by the items specified below:
• | Accounts and notes receivable decreased $34.4 million. The decrease in accounts and notes receivable was driven primarily by lower sales volumes and falling selling prices experienced during the period from October 1, 2015 through June 8, 2016 as well as timing of collections at period end. There were no significant changes in billing terms or collection processes during the period from October 1, 2015 through June 8, 2016. |
• | Accounts payable, accrued expenses and other liabilities increased $3.7 million driven primarily by transaction costs for the Business Combination. |
• | Inventories decreased $8.4 million which reflected the impact of lower prices for inventory purchases as well as improved inventory management. |
• | Other current assets and other operating assets and liabilities were impacted by $9.0 million. |
Net cash provided by operating activities for the Predecessor fiscal year ended September 30, 2015, was $154.7 million. Net income of $21.2 million, adjusted for gains on sale of assets, gain from debt extinguishment and significant non-cash items such as depreciation and amortization expenses, debt issuance costs amortization, provision for bad debt, inventory impairment, deferred income taxes and equity-based compensation charges, collectively totaling $64.4 million, provided $85.6 million of cash inflow during the fiscal year ended September 30, 2015. Net cash provided by operating activities was impacted by the items specified below:
• | Accounts and notes receivable decreased $109.7 million, primarily driven by lower sales volumes experienced during the fiscal year ended September 30, 2015, falling average selling prices and timing of collections at year end. There were no significant changes in billing terms or collection processes during the fiscal year ended September 30, 2015. |
• | Accounts payable and accrued expenses decreased $98.9 million, primarily driven by lower inventory purchases due to lower volumes. |
• | Inventories decreased $50.5 million, reflecting the impact of lower prices for inventory purchases and improved inventory management. |
• | Other current assets decreased $8.2 million partially due to a reduction in inventory prepayments. |
Cash flows from investing activities
Investing activities used $84.2 million of cash during the fiscal year ended September 30, 2017, primarily due to $65.6 million paid to effect asset and business acquisitions, and $27.6 million for additions of property and equipment primarily related to facility improvements and additional information technology investments, partially offset by $8.4 million of cash proceeds related to the reimbursement for certain capital expenditures incurred in connection with the relocation of certain operations.
54
Investing activities provided $133.0 million of cash during the fiscal year ended September 30, 2016, primarily due to $501.1 million withdrawn from the trust account offset by $360.6 million, net of cash acquired, and the addition of property and equipment of $12.7 million, primarily related to facility improvements and information technology investments. These expenditures were partially offset by net proceeds from the sale of assets of $4.7 million and the reimbursement of $0.5 million received for certain equipment under an eminent domain proceeding related to one of our facilities.
Investing activities used $11.8 million of cash for the Predecessor period from October 1, 2015 through June 8, 2016, primarily due to capital expenditures of $14.2 million, related primarily to facility improvements, additional information technology investments and vehicle additions. These expenditures were partially offset by net proceeds from the sale of assets of $2.4 million.
Investing activities used $31.5 million of cash during the Predecessor fiscal year ended September 30, 2015, primarily due to capital expenditures of $35.6 million, primarily related to facility improvements, information technology investments and vehicle additions and replacements. These expenditures were partially offset by net proceeds from the sale of assets of $4.1 million.
Cash flows from financing activities
Financing activities provided $11.8 million of cash during the fiscal year ended September 30, 2017, primarily as a result of net borrowings on the ABL Facility of $21.1 million and net borrowings on short-term debt of $1.3 million, partially offset by payments on the Term Loan Facility of $6.5 million, capital lease payments of $2.8 million, and the payment of debt issuance costs of $1.3 million related to TLB Amendment No. 1. Net borrowings on the ABL Facility included approximately $58.0 million drawn for the closing of the Ultra Chem Acquisition at the Ultra Chem Closing Date.
Financing activities used $88.9 million of cash during the fiscal year ended September 30, 2016, primarily as a result of repaying Predecessor long-term debt of $767.3 million, repayment of long-term debt of $205.4 million and the payment of debt issuance costs of $25.3 million. These were offset by the issuance of long-term debt of $972.5 million and proceeds of short-term debt of $13.3 million. The Company also issued common stock as consideration for the Business Combination of $234.9 million and redeemed stock of $298.5 million.
Financing activities used $121.5 million of cash for the Predecessor period from October 1, 2015 through June 8, 2016, primarily as a result of repaying long-term debt and capital leases of $417.3 million and the repayment of short-term debt of $17.1 million. These were offset by the issuance of long-term debt of $292.1 million and proceeds of short-term debt of $20.9 million.
Financing activities used $81.8 million of cash for the Predecessor fiscal year ended September 30, 2015, primarily as a result of net payments on the Predecessor ABL Facility and the Notes of $13.8 million and $14.8 million, respectively, net payments of $12.1 million on short-term lines of credit available to the Company's operations in China and payments under the Predecessor Term Loan Facility of $6.7 million. In addition, financing activities included the purchase of the remaining equity interest in Nexeo Plaschem for $34.3 million.
55
Contractual Obligations and Commitments
At September 30, 2017, amounts due under our contractual commitments were as follows:
Payments Due by Period (in millions) | |||||||||||||||||||
Less than 1 Year | 1-3 Years | 4-5 Years | More than 5 Years | Total | |||||||||||||||
Short-term and long-term debt obligations (1) | $ | 47.3 | $ | 13.0 | $ | 152.3 | $ | 614.4 | $ | 827.0 | |||||||||
Estimated interest payments on long-term debt obligations (2) | 40.4 | 79.6 | 69.9 | 24.6 | 214.5 | ||||||||||||||
Capital lease obligations (3) | 8.3 | 14.8 | 17.4 | 32.0 | 72.5 | ||||||||||||||
Operating lease obligations (4) | 15.9 | 20.7 | 11.3 | 3.0 | 50.9 | ||||||||||||||
Employee benefit obligations | — | — | — | 2.9 | 2.9 | ||||||||||||||
Contingent consideration (5) | 13.4 | 48.5 | 63.9 | 119.6 | 245.4 | ||||||||||||||
Other obligations (6) | 5.0 | 3.1 | 1.4 | 1.3 | 10.8 | ||||||||||||||
Total | $ | 130.3 | $ | 179.7 | $ | 316.2 | $ | 797.8 | $ | 1,424.0 | |||||||||
(1) | Short-term obligations primarily include the payment of $40.8 million outstanding under credit facilities available to the Company's operations in China and $6.5 million in principal installment payments under our Term Loan Facility. Long-term debt obligations include (i) the payment of $139.3 million in outstanding principal (as of September 30, 2017) under our ABL Facility and (ii) the payment of $640.4 million in outstanding principal under our Term Loan Facility. See Note 7 to our consolidated financial statements. |
(2) | Estimated interest payments include cash interest payments and estimated commitment fees on long-term debt obligations. Variable rate interest payments were estimated using interest rates as of September 30, 2017 held constant to maturity. |
(3) | Capital lease obligations represent future payments on capital lease agreements, including lease payments on all tractors under the Ryder Lease and the Montgomery Lease. The amounts above include executory costs of $2.4 million per year, for aggregate executory costs totaling $17.4 million. Additionally, the amounts include decreasing annual interest payments ranging from $2.1 million to $0.1 million, for aggregate interest payments totaling $17.6 million on all capital leases. We are permitted to terminate the lease of an individual tractor under the Ryder Lease on the anniversary of its delivery date, provided that certain conditions are met. In the event we terminate the lease of an individual tractor in accordance with the terms of the Ryder Lease, we may elect to purchase the individual tractor at a predetermined residual value or return the tractor to Ryder, subject to an adjustment based on the then-current market value of the individual tractor. See Notes 5 and 7 to our consolidated financial statements. |
(4) | Operating lease obligations represent payments for a variety of facilities and equipment under non-cancellable operating lease agreements, including office buildings, transportation equipment, warehouses and storage facilities and other equipment. |
(5) | Liabilities for contingent consideration are related (i) to the TRA that we entered into in connection with the Business Combination and (ii) the Deferred Cash Consideration that will be paid to Selling Equityholders pursuant to the Merger Agreement. The amount included in the table above for the Deferred Cash Consideration is based on the undiscounted expected value of the payment and is currently included in the 4-5 Years column based on the final payment date of June 9, 2021 as defined in the Merger Agreement. However, as further defined in the Merger Agreement, payments could be required to be made by the Company prior to June 9, 2021. The timing of payments associated with the liability for the contingent consideration related to the TRA is based on expected undiscounted cash flows in future periods, and may change based on actual results. See Notes 3 and 9 to our consolidated financial statements. |
(6) | Other obligations are related to (i) non-cancellable equipment orders, (ii) certain IT-related contracts, (iii) estimated obligation costs to relocate employees or new hires in various U.S. locations, primarily to The Woodlands, Texas and (iv) remaining payments related to the asset acquisitions completed during the fiscal year ended September 30, 2017 (see Note 3 to our consolidated financial statements). The relocations are assumed to be completed within one year, although it is not practicable to establish definite completion dates for each employee’s relocation. |
Not included in the table above is $10.8 million for a planned land acquisition during fiscal year 2018. The consummation of this purchase agreement is subject to customary closing conditions.
56
Off Balance Sheet Arrangements
We had no off balance sheet arrangements as defined in Item 303(a)(4)(ii) of Regulation S-K at September 30, 2017.
Critical Accounting Policies and Estimates
Our consolidated financial statements reflect a number of significant estimates that impact the carrying values of assets and liabilities and reported amounts of revenue and expenses. We make these estimates based on historical experience and on other judgments and assumptions that we believe are reasonable under the circumstances. The results of these estimates, judgments and assumptions form the basis for our determinations as to the carrying values of assets and liabilities that are not readily apparent from other sources. Actual results may differ from these estimates under different assumptions or conditions.
We consider an accounting policy to be critical when it requires the most difficult, subjective and/or complex judgments by management regarding estimates about matters that are highly uncertain. We believe that the following critical accounting policies reflect our most significant estimates and assumptions used in the preparation of our consolidated financial statements.
Revenue Recognition
Revenues are recognized when persuasive evidence of an arrangement exists, products are shipped and title is transferred or services are provided to customers, the sales price is fixed or determinable and collectability is reasonably assured. Revenue for product sales is recognized at the time title and risk of loss transfer to the customer, based on the terms of the sale. For products delivered under our standard shipping terms, title and risk of loss transfer when the product is delivered to the customer’s delivery site. For sales transactions designated Freight on Board shipping point, the customer assumes risk of loss and title transfers at the time of shipment. Deferred revenues may result from (i) delivery delays for products delivered under our standard shipping terms or (ii) from bill and hold or other arrangements with our customers. Sales are reported net of tax assessed by qualifying governmental authorities.
We are generally the primary obligor in sales transactions with our customers, retain inventory risk during transit and assume credit risk for amounts billed to our customers. Accordingly, we recognize revenue primarily based on the gross amount billed to our customers. In sales transactions where we are not the primary obligor and do not retain inventory risk, we recognize revenue on a net basis by recognizing only the commission we retain from such sales and including that commission in sales and operating revenues in our consolidated statements of operations.
Consistent with industry standards, we may offer volume-based rebates to large customers if the customer purchases a specified volume with us over a specified time period. The determination of these rebates at interim dates involves management judgment. As a result, our revenues may be affected if a customer earns a rebate toward the end of a year that we had not expected or if our estimate of customer purchases are less than expected. We have the experience and the access to relevant information that we believe is necessary to reasonably estimate the amounts of such deductions from gross revenues. We regularly review information related to these estimates and adjust our reserves accordingly if and when actual experience differs from previous estimates. We recognize the rebate obligation as a reduction of revenue based on the estimate of the total volume of purchases from a given customer over the specified period of time.
Impairment of Long-lived Assets
Goodwill. Goodwill is tested for impairment annually as of March 31st and whenever events or circumstances indicate that it is more likely than not that an impairment may have occurred. Goodwill is reviewed for impairment at the reporting unit level, which is defined as operating segments or groupings of businesses one level below the operating segment level. Our operating segments are the same as the reporting units used in our goodwill impairment test. Relevant accounting guidance allows the consideration of qualitative factors to determine if it is more likely than not that an impairment of goodwill has occurred. In the absence of sufficient qualitative factors, goodwill is tested for impairment by comparing the fair value of a reporting unit (determined using a market approach if market prices are available, or alternatively, a discounted cash flow model) with its carrying value. If the fair value of the reporting unit exceeds its carrying value, the goodwill of the reporting unit is not considered impaired. If the fair value of the reporting unit is less than its carrying value, an impairment loss is recorded for the difference. The determination of the fair value of a reporting unit requires the use of key estimates about its future operating results, valuation multiples, discount rates and terminal growth rates. These key assumptions can change due to many factors and these changes can materially affect the fair value estimate and cause us to re-evaluate the carrying value of our goodwill. Once an impairment of goodwill has been recorded, it cannot be reversed.
57
Other Long-Lived Assets. Property, plant and equipment and other intangibles with definite lives are tested for impairment whenever events and circumstances indicate that the carrying value of an asset may not be recoverable. When an impairment test is performed and the undiscounted expected future cash flow is less than the carrying value, an impairment loss is recognized equal to an amount by which the carrying value exceeds the fair value of the asset. The factors considered by management in performing this assessment include current operating results, trends and prospects, as well as the effect of obsolescence, demand, competition and other economic factors.
Contingencies and Environmental Costs
Liabilities for loss contingencies arising from claims, assessments, litigation, fines and penalties and other sources are recorded when it is probable that a liability has been incurred and the amount of such liability can be reasonably estimated. Gain contingencies are not recorded until management determines it is certain that the future event will become or does become a reality.
Liabilities for environmental remediation costs are recognized when environmental assessments or remediation are probable and the associated costs can be reasonably estimated. Generally, the timing of these provisions coincides with the commitment to a formal plan of action or, if earlier, the divestment or closure of the relevant site. Environmental reserves are subject to numerous uncertainties that affect our ability to accurately estimate costs, or our share of costs if multiple parties are responsible. These uncertainties involve the legal, regulatory and enforcement parameters governing environmental assessment and remediation, the nature and extent of contamination at the site, the extent of required remediation efforts, the choice of remediation methodology, availability of insurance coverage and, in the case of a site with multiple responsible parties, the number and financial strength of other potentially responsible parties.
Under the ADA Purchase Agreement, Ashland agreed to retain the Retained Remediation Liabilities. Ashland’s obligation for these liabilities is not subject to any claim thresholds or deductibles other than expenses we incur arising out of the Other Retained Remediation Liabilities; if we incur expenses arising out of the Other Retained Remediation Liabilities, Ashland’s indemnification obligation is subject to an individual claim threshold of $0.2 million and an aggregate claim deductible of $5.0 million. Ashland’s indemnification obligations under the ADA Purchase Agreement as described above terminated as of March 31, 2016, other than for the Retained Remediation Liabilities. As a result, any environmental remediation liabilities reported to Ashland after March 31, 2016 and not arising out of a Retained Remediation Liability will be liabilities of the Company. In addition, the Company is obligated to indemnify Ashland for any remediation liabilities other than the Retained Remediation Liabilities.
Based on the indemnification discussed above, we do not currently have any environmental or remediation reserves for matters that are covered by the ADA Purchase Agreement. However, if we were to incur expenses related to the Other Retained Remediation Liabilities, we would be responsible for the first $5.0 million in aggregate expenses relating thereto prior to the receipt of any indemnification from Ashland. In addition, if any Retained Specified Remediation Liability ultimately exceeds the liability ceilings described above, we would be responsible for such excess amounts. In either of these scenarios, and for liabilities associated with our operation of the business, we would be required to take appropriate environmental or remediation reserves.
See Note 13 to our consolidated financial statements.
Business Combinations
In accounting for business combinations, the purchase price paid to acquire a business is allocated to its assets and liabilities based on the estimated fair values of the assets acquired and liabilities assumed as of the date of acquisition. These fair values are often estimated through the application of the income approach which requires us to estimate future cash inflows and outflows and apply an appropriate discount rate. The excess of the purchase price over the fair value of the net tangible and identifiable intangible assets acquired is recorded as goodwill. A significant amount of judgment is involved in estimating the individual fair values of property, plant and equipment and identifiable intangible assets. The estimated fair values assigned to the net assets acquired could have a significant effect on our results of operations in the future. The estimates used in determining fair values are based on assumptions believed to be reasonable but which are inherently uncertain. Accordingly, while we use all available information to make these fair value determinations and generally engage third party consultants for assistance, actual results may differ from the projected results used to determine fair value. During fiscal year 2016, we completed the Business Combination and during fiscal year 2017 we completed the Ultra Chem Acquisition. See Note 3 to our consolidated financial statements.
58
Contingent Consideration Obligations
As described in Note 3, as part of the consideration for the Business Combination, we entered into the TRA and agreed to pay the Deferred Cash Consideration pursuant to the Merger Agreement. Our obligation for these contingent consideration amounts was initially measured at fair value as of the Closing Date. Our contingent consideration liabilities are required to be recorded at fair value as of the end of each reporting period with any changes in fair value recorded in operating income.
Changes in the estimates and inputs used in determining the fair value of the contingent consideration could have a material impact on the amounts recognized. The calculation of the liability for contingent consideration related to the TRA uses a discounted cash flow model which is sensitive to current interest rates and other market components incorporated in the discount rate. Additionally, this cash flow model is sensitive to changes in prevailing tax rates. The liability for the contingent consideration related to the Deferred Cash Consideration is highly sensitive to the price of our common stock at each valuation date. See Item 7A. "Quantitative and Qualitative Disclosures about Market Risk" and Note 9 to our consolidated financial statements.
Share-Based Compensation
We account for share-based compensation expense for equity instruments granted in exchange for employee and director services. Share-based compensation cost is measured at the grant date, based on the fair value of the award, and is recognized as expense over the vesting period of the equity award grant.
Our PSU awards contain both market and performance-based conditions. At the grant date, market conditions are incorporated into the fair value measurement using a Monte Carlo simulation model under the assumptions that performance-based conditions are met and not met. We then determine the probability that performance-based conditions will be met and incorporate this into the grant date fair value of the award.
The compensation cost for the PSU awards is amortized over the vesting period on a straight-line basis, net of estimated forfeitures. Forfeiture rates are estimated based on consideration of historical forfeitures of our and the Predecessor’s actual forfeitures of share-based compensation awards and a peer group of companies.
Supplier Rebates
Certain of our vendor arrangements provide for purchase incentives based on us achieving a specified volume or dollar value of purchases. We record the incentives as a reduction of inventory costs (and related cost of sales) based on our purchases to date and our estimates of purchases for the remainder of the calendar year. The determination of these rebates at interim dates involves management judgment. As a result, our cost of sales may be affected if we earn an incentive toward the end of a year that we had not expected to earn in earlier periods or if we fail to earn an incentive that we had expected to earn and had recorded the incentive based on our prior estimates.
Deferred Taxes
We recognize deferred tax assets and liabilities for the expected tax consequences of temporary differences between the tax bases of assets and liabilities and their reported amounts using enacted tax rates in effect for the year differences are expected to reverse.
The recoverability of deferred tax assets and the recognition and measurement of uncertain tax positions are subject to various assumptions and judgment by us. If actual results differ from the estimates made by us in establishing or maintaining valuation allowances against deferred tax assets, the resulting change in the valuation allowance would generally impact earnings or other comprehensive income depending on the nature of the respective deferred tax asset. Additionally, the positions taken with regard to tax contingencies may be subject to audit and review by tax authorities, which may result in future taxes, interest and penalties.
In determining the recoverability of deferred tax assets, we give consideration to all available evidence on a jurisdiction by jurisdiction basis, and then increase or decrease our valuation allowance as appropriate.
Recent Accounting Pronouncements
See Note 2 to our consolidated financial statements.
59
Item 7A. Quantitative and Qualitative Disclosures about Market Risk
Commodity and Product Price Risk
Our business model is to buy and sell products at current market prices in quantities approximately equal to estimated customer demand. Energy costs are a significant component of raw materials included in our product costs. Rising or volatile raw material prices for our suppliers, especially those of hydrocarbon derivatives, may cause our costs to increase or may result in volatility in our profitability. Although we do not speculate on changes in the prices of the products we sell because we maintain inventories in order to serve the needs of our customers, we are subject to the risk of reductions in market prices for products we hold in inventory. We do not use derivatives to manage our commodity price risk because of the large number of products we sell and the large variety of raw materials used in the production of those products. Inventory management practices are focused on managing product price risk by generally purchasing our inventories via our ERP system which helps us forecast customer demand based on historical practices. Global inventory balances can fluctuate based on variations in regional customer demand forecasts. We collaborate directly with customers in all regions to enhance the ongoing accuracy of these forecasts in order to reduce the number of days sales held in inventories, as well as lower the amount of any slow moving and older inventories. In addition, we are generally able to pass on price increases to our customers, subject to market conditions, such as declining or otherwise volatile market prices for feedstocks, the presence of competitors in particular geographic and product markets and prevailing pricing mechanisms in customer contracts. We believe that these risk management practices reduce our exposure to changes in product selling prices or costs; however, significant unanticipated changes in market conditions or commodity prices could adversely affect our results of operations, financial condition and cash flows, as the prices of the products we purchase and sell are volatile.
Credit Risk
We are subject to the risk of loss arising from the credit risk related to the possible inability of our customers to pay for the products we resell and distribute to them. We attempt to limit our credit risk by monitoring the creditworthiness of our customers to whom we extend credit and establish credit limits in accordance with our credit policy. We perform credit evaluations on substantially all customers requesting credit and we will not extend credit to customers for whom we have substantial concerns and will deal with those customers on a cash basis. The Company's operations in China offers billing terms that allow certain customers to remit payment during a period of time ranging from 30 days to nine months. These notes receivable ($8.3 million at September 30, 2017) are supported by banknotes issued by large banks in China on behalf of these customers.
At September 30, 2017, no individual customer represented greater than 5.0% of the outstanding accounts receivable balance.
Interest Rate Risk
Interest rate risks can occur due to changes in market interest rates. This risk results from changes in the fair values of fixed-interest rate financial instruments or from changes in the cash flows of variable-interest rate financial instruments. The optimal structure of variable and fixed interest rates is determined as part of interest rate risk management. It is not possible to simultaneously minimize both kinds of interest rate risk. We take steps to mitigate interest rate risk in part by entering into interest rate swap agreements as described under “Fair Value Measurements” below. Also, see Note 8 to our consolidated financial statements.
Borrowings under the U.S. Tranche and the Canadian Tranche of the ABL Facility bear interest, at our option, at either an alternate base rate or Canadian prime rate, as applicable, plus an applicable margin (ranging from 0.25% to 0.75% pursuant to a grid based on average excess availability) or LIBOR or Canadian BA rate (as defined in the ABL Facility), as applicable, plus an applicable margin (ranging from 1.25% to 1.75% pursuant to a grid based on average excess availability). Loans under the FILO Tranche within the ABL Facility will bear interest, at an alternate base rate plus an applicable margin (ranging from 1.00% to 1.50% pursuant to a grid based on average excess availability) or LIBOR plus an applicable margin (ranging from 2.00% to 2.50% pursuant to a grid based on average excess availability).
Borrowings under the ABL Facility bear interest at a variable rate, which was a weighted average rate of 2.87% for the fiscal year ended September 30, 2017. For each $100.0 million drawn on the ABL Facility, a 100 basis point increase in the interest rate would result in a $1.0 million increase in annual interest expense.
60
On March 22, 2017, the Company completed TLB Amendment No. 1 amending the Term Loan Facility. TLB Amendment No. 1 reduced the interest rate margin applicable to outstanding term loans by 50 basis points from 4.25% to 3.75% for LIBOR loans and from 3.25% to 2.75% for base rate loans. In addition, the 1% LIBOR floor was eliminated. TLB Amendment No.1 provides a prepayment premium equal to 1% of the amount of the term loan applicable to certain repricing transactions occurring on or prior to six months from the effective date of TLB Amendment No. 1.
Changes in market interest rates will have an effect on the Term Loan Facility interest expense. A 100 basis point increase/decrease in the interest rate would result in an increase/decrease of $6.5 million in annual interest expense based on the Term Loan Facility balance.
Fair Value Measurements
Contingent Consideration
As a result of the Business Combination, we incurred liabilities related to contingent consideration payable to the Selling Equityholders, which are required to be adjusted to fair value at each reporting period. These measurements are considered Level 3 measurements within the fair value hierarchy. Projected taxable income, current interest rates, current tax rates and the market price of our common stock are key inputs used to estimate the fair value of these liabilities. As a result, any changes in these inputs will impact the fair value of these liabilities and could materially impact the amount of income or expense recorded each reporting period.
The fair value of the liability for the contingent consideration related to the TRA was $105.1 million as of September 30, 2017. The calculation of the liability for the contingent consideration related to the TRA uses a cash flow model which incorporates current interest rates in the discount rate used to discount the obligation to present value. A 100 basis point increase in the discount rate compared to the discount rate used at the September 30, 2017 valuation would have resulted in a decrease of approximately $0.9 million in the value of the liability for the contingent consideration related to the TRA. Additionally, this cash flow model is sensitive to changes in prevailing tax rates. A 100 basis point decrease in the tax rate compared to the tax rate used at the September 30, 2017 valuation would have resulted in a decrease of approximately $2.9 million in the value of the liability for the contingent consideration related to the TRA.
The fair value of the liability for the contingent consideration related to Deferred Cash Consideration was $35.1 million as of September 30, 2017. The liability for the contingent consideration related to the Deferred Cash Consideration is highly sensitive to the price of our common stock at each valuation date. A $1.00 increase/decrease in the price of our common stock from its September 30, 2017 price would have increased/decreased the fair value of the liability for the Deferred Cash Consideration by approximately $4.8 million.
Derivatives
During the three months ended March 31, 2017, the Company entered into four interest rate swap agreements with a combined notional amount of $300.0 million to help mitigate interest rate risk related to the variable-rate Term Loan Facility. The swap agreements expire at various dates from February 2020 through March 2022 and are accounted for as cash flow hedges. Gains or losses resulting from changes in the fair value of the swaps are recorded in other comprehensive income to the extent that the swaps are effective as hedges. Gains and losses resulting from changes in the fair value applicable to the ineffective portion, if any, are reflected in income. Gains and losses recorded in other comprehensive income are reclassified into and recognized in income when the interest expense on the Term Loan Facility is recognized. On June 29, 2017, the Company removed the interest rate floor component of the interest-rate swaps to align the swaps with the Term Loan Facility terms after the modification of the Term Loan Facility in March 2017 with TLB Amendment No. 1. During the fiscal year ended September 30, 2017, the Company recognized approximately $0.6 million of interest expense related to ineffectiveness of the interest-rate swaps prior to June 29, 2017. The interest rate swaps continue to be accounted for as cash flow hedges and there was no material ineffectiveness related to the swaps after the modification of the terms described above. At September 30, 2017, we recorded a net liability of $1.0 million in the consolidated balance sheet related to these instruments.
During the fiscal year ended September 30, 2017, we reclassified into income and recognized a realized loss on the interest rate swaps of $1.4 million, which was recorded in interest expense. During the fiscal year ended September 30, 2017, we recorded an immaterial unrealized loss on the interest rate swaps (net of taxes and reclassifications into income), which was recorded in other comprehensive income. As of September 30, 2017, $0.9 million in unrealized losses were expected to be realized and recognized in income within the next twelve months.
61
Changes in market interest rates will impact the amount we ultimately pay or receive related to these swap agreements. A 100 basis point increase or decrease in market interest rates would result in a $3.0 million annual change in the amount we receive or pay, respectively, in connection with these swap agreements.
Foreign Currency Risk
We may be adversely affected by foreign exchange rate fluctuations since we conduct our business on an international basis in multiple currencies. A portion of our sales and costs of sales are denominated in currencies other than the functional currency of our subsidiaries, exposing us to currency transaction risk. Additionally, because we report our consolidated results in USD, the results of operations and the financial position of our local international operations, which are generally reported in the relevant local currencies, are translated into USD at the applicable exchange rates for inclusion in our consolidated financial statements, exposing us to currency translation risk. Further, we have exposure to foreign exchange fluctuations arising from the remeasurement of certain foreign operations where the USD is the functional currency but accounting records are kept in local currency. In this respect, we are vulnerable to currency remeasurement gains and losses to the extent that monetary assets and liabilities denominated in local currency do not offset each other when remeasured into USD.
We currently do not utilize financial derivatives to manage our foreign currency risk, but we continue to monitor our exposure to foreign currency risk, employ operational strategies where practical and may consider utilizing financial derivatives in the future to mitigate losses associated with these foreign currency risks.
Included in our consolidated statement of operations for the fiscal year ended September 30, 2017 is a $0.6 million net loss related to foreign exchange rate fluctuations, including a $0.6 million net remeasurement gain. The most significant currency exposures during this period were to the RMB, CAD and Peso versus the USD. These currencies fluctuated to various degrees but such fluctuations did not exceed 5% from their respective values since September 30, 2016. Assuming the same directional fluctuations as occurred during the fiscal year ended September 30, 2017, a hypothetical 10.0% weakening/strengthening in the average exchange rates of these currencies from that date would have generated a net loss/gain of $6.1 million in our consolidated statement of operations for the fiscal year ended September 30, 2017.
62
Item 8. Financial Statements and Supplementary Data
Report of Independent Registered Public Accounting Firm
To the Board of Directors and Stockholders of Nexeo Solutions, Inc.
In our opinion, the accompanying consolidated balance sheets and the related consolidated statements of operations, comprehensive income (loss), equity and cash flows present fairly, in all material respects, the financial position of Nexeo Solutions, Inc. and its subsidiaries (Successor) as of September 30, 2017 and 2016, and the results of their operations and their cash flows for the years then ended in conformity with accounting principles generally accepted in the United States of America. In addition, in our opinion, the accompanying financial statement schedule, Schedule II-Valuation and Quantifying Accounts for the years ending September 30, 2017 and 2016, presents fairly, in all material respects, the information set forth therein when read in conjunction with the related consolidated financial statements. Also in our opinion, the Company maintained, in all material respects, effective internal control over financial reporting as of September 30, 2017, based on criteria established in Internal Control - Integrated Framework (2013) issued by the Committee of Sponsoring Organizations of the Treadway Commission (COSO). The Company's management is responsible for these financial statements and financial statement schedule, for maintaining effective internal control over financial reporting and for its assessment of the effectiveness of internal control over financial reporting, included in Management's Annual Report on Internal Control over Financial Reporting appearing under Item 9A. Our responsibility is to express opinions on these financial statements, on the financial statement schedule, and on the Company's internal control over financial reporting based on our audits (which was an integrated audit in 2017). We conducted our audits in accordance with the standards of the Public Company Accounting Oversight Board (United States). Those standards require that we plan and perform the audits to obtain reasonable assurance about whether the financial statements are free of material misstatement and whether effective internal control over financial reporting was maintained in all material respects. Our audits of the financial statements included examining, on a test basis, evidence supporting the amounts and disclosures in the financial statements, assessing the accounting principles used and significant estimates made by management, and evaluating the overall financial statement presentation. Our audit of internal control over financial reporting included obtaining an understanding of internal control over financial reporting, assessing the risk that a material weakness exists, and testing and evaluating the design and operating effectiveness of internal control based on the assessed risk. Our audits also included performing such other procedures as we considered necessary in the circumstances. We believe that our audits provide a reasonable basis for our opinions.
A company’s internal control over financial reporting is a process designed to provide reasonable assurance regarding the reliability of financial reporting and the preparation of financial statements for external purposes in accordance with generally accepted accounting principles. A company’s internal control over financial reporting includes those policies and procedures that (i) pertain to the maintenance of records that, in reasonable detail, accurately and fairly reflect the transactions and dispositions of the assets of the company; (ii) provide reasonable assurance that transactions are recorded as necessary to permit preparation of financial statements in accordance with generally accepted accounting principles, and that receipts and expenditures of the company are being made only in accordance with authorizations of management and directors of the company; and (iii) provide reasonable assurance regarding prevention or timely detection of unauthorized acquisition, use, or disposition of the company’s assets that could have a material effect on the financial statements.
Because of its inherent limitations, internal control over financial reporting may not prevent or detect misstatements. Also, projections of any evaluation of effectiveness to future periods are subject to the risk that controls may become inadequate because of changes in conditions, or that the degree of compliance with the policies or procedures may deteriorate.
As described in Management’s Annual Report on Internal Control over Financial Reporting, management has excluded Ultra Chem, S. de R.L. de C.V. and its related entities from its assessment of internal control over financial reporting as of September 30, 2017, because it was acquired by the Company in a purchase business combination during 2017. We have also excluded Ultra Chem, S. de R.L. de C.V. and its related entities from our audit of internal control over financial reporting. Ultra Chem, S. de R.L. de C.V. and its related entities are wholly-owned subsidiaries whose total assets and total revenues excluded from management’s assessment and our audit of internal control over financial reporting represent 3.8% and 1.0%, respectively, of the related consolidated financial statement amounts as of and for the year ended September 30, 2017.
/s/PricewaterhouseCoopers LLP
Houston, Texas
December 7, 2017
63
Report of Independent Registered Public Accounting Firm
To the Board of Directors and Members of Nexeo Solutions Holdings, LLC
In our opinion, the accompanying consolidated statements of operations, comprehensive income (loss) and cash flows present fairly, in all material respects, the results of operations and cash flows of Nexeo Solutions Holdings, LLC and its subsidiaries (Predecessor) for the period from October 1, 2015 through June 8, 2016 and for the year ended September 30, 2015, in conformity with accounting principles generally accepted in the United States of America. In addition, in our opinion, the accompanying financial statement schedule, Schedule II-Valuation and Qualifying Accounts, for the period from October 1, 2015 through June 8, 2016 and for the year ended September 30, 2015, presents fairly, in all material respects, the information set forth therein when read in conjunction with the related consolidated financial statements. These financial statements and financial statement schedule are the responsibility of the Company’s management. Our responsibility is to express an opinion on these financial statements and financial statement schedule based on our audits. We conducted our audits of these financial statements in accordance with the standards of the Public Company Accounting Oversight Board (United States). Those standards require that we plan and perform the audit to obtain reasonable assurance about whether the financial statements are free of material misstatement. An audit includes examining, on a test basis, evidence supporting the amounts and disclosures in the financial statements, assessing the accounting principles used and significant estimates made by management, and evaluating the overall financial statement presentation. We believe that our audits provide a reasonable basis for our opinion.
/s/ PricewaterhouseCoopers LLP
Houston, Texas
December 8, 2016
64
Nexeo Solutions, Inc. and Subsidiaries
Consolidated Balance Sheets
(in millions, except share amounts and par value)
September 30, 2017 | September 30, 2016 | ||||||
Current Assets | |||||||
Cash and cash equivalents | $ | 53.9 | $ | 47.5 | |||
Accounts and notes receivable (net of allowance for doubtful accounts of $2.2 million and $1.4 million, respectively) | 597.4 | 474.8 | |||||
Inventories | 315.5 | 315.8 | |||||
Income taxes receivable | 3.4 | 2.8 | |||||
Other current assets | 19.8 | 22.9 | |||||
Total current assets | 990.0 | 863.8 | |||||
Non-Current Assets | |||||||
Property, plant and equipment, net | 316.1 | 322.6 | |||||
Goodwill | 703.0 | 665.7 | |||||
Other intangible assets, net of amortization | 231.5 | 215.0 | |||||
Deferred income taxes | 2.3 | 1.1 | |||||
Other non-current assets | 10.6 | 10.7 | |||||
Total non-current assets | 1,263.5 | 1,215.1 | |||||
Total Assets | $ | 2,253.5 | $ | 2,078.9 | |||
Current Liabilities | |||||||
Short-term borrowings, current portion of long-term debt and capital lease obligations | $ | 51.1 | $ | 47.7 | |||
Accounts payable | 384.2 | 325.8 | |||||
Accrued expenses and other liabilities | 58.4 | 45.7 | |||||
Due to related party pursuant to contingent consideration obligations | 12.5 | — | |||||
Income taxes payable | 3.2 | 2.0 | |||||
Total current liabilities | 509.4 | 421.2 | |||||
Non-Current Liabilities | |||||||
Long-term debt and capital lease obligations, less current portion, net | 794.0 | 765.6 | |||||
Deferred income taxes | 34.9 | 23.1 | |||||
Due to related party pursuant to contingent consideration obligations | 127.7 | 118.4 | |||||
Other non-current liabilities | 9.9 | 5.8 | |||||
Total non-current liabilities | 966.5 | 912.9 | |||||
Total Liabilities | 1,475.9 | 1,334.1 | |||||
Commitments and Contingencies (see Note 13) | |||||||
Equity | |||||||
Preferred stock, $0.0001 par value (1,000,000 shares authorized, none issued and outstanding as of September 30, 2017 and September 30, 2016) | — | — | |||||
Common stock, $0.0001 par value (300,000,000 shares authorized, 89,353,641 shares issued and 89,344,065 shares outstanding as of September 30, 2017 and 89,286,936 shares issued and outstanding as of September 30, 2016) | — | — | |||||
Additional paid-in capital | 764.4 | 758.9 | |||||
Retained earnings (Accumulated deficit) | 4.8 | (9.6 | ) | ||||
Accumulated other comprehensive income (loss) | 8.5 | (4.5 | ) | ||||
Treasury stock, at cost: 9,576 shares as of September 30, 2017 and none as of September 30, 2016 | (0.1 | ) | — | ||||
Total equity | 777.6 | 744.8 | |||||
Total Liabilities and Equity | $ | 2,253.5 | $ | 2,078.9 | |||
The accompanying notes are an integral part of these Consolidated Financial Statements.
65
Nexeo Solutions, Inc. and Subsidiaries
Consolidated Statements of Operations
(in millions, except share and per share data)
Successor | Predecessor | |||||||||||||||
Fiscal Year Ended September 30, 2017 | Fiscal Year Ended September 30, 2016* | October 1, 2015 Through June 8, 2016 | Fiscal Year Ended September 30, 2015 | |||||||||||||
Sales and operating revenues | $ | 3,636.9 | $ | 1,065.7 | $ | 2,340.1 | $ | 3,949.1 | ||||||||
Cost of sales and operating expenses | 3,238.5 | 957.3 | 2,068.2 | 3,541.1 | ||||||||||||
Gross profit | 398.4 | 108.4 | 271.9 | 408.0 | ||||||||||||
Selling, general and administrative expenses | 312.9 | 91.7 | 208.9 | 329.5 | ||||||||||||
Transaction related costs | 1.9 | 21.3 | 33.4 | 0.1 | ||||||||||||
Change in fair value of contingent consideration obligations | 16.2 | (11.2 | ) | — | — | |||||||||||
Operating income | 67.4 | 6.6 | 29.6 | 78.4 | ||||||||||||
Other income | 8.3 | 0.5 | 2.9 | 11.4 | ||||||||||||
Interest income (expense) | ||||||||||||||||
Interest income | 0.3 | 0.8 | 0.1 | 0.1 | ||||||||||||
Interest expense | (51.1 | ) | (15.1 | ) | (42.3 | ) | (64.8 | ) | ||||||||
Income (loss) from continuing operations before income taxes | 24.9 | (7.2 | ) | (9.7 | ) | 25.1 | ||||||||||
Income tax expense | 10.5 | 1.2 | 4.2 | 3.9 | ||||||||||||
Net income (loss) from continuing operations | 14.4 | (8.4 | ) | (13.9 | ) | 21.2 | ||||||||||
Net income (loss) from discontinued operations, net of tax | — | — | 0.1 | (0.8 | ) | |||||||||||
Net Income (Loss) Attributable to Nexeo Solutions, Inc. | $ | 14.4 | $ | (8.4 | ) | $ | (13.8 | ) | $ | 20.4 | ||||||
Net income (loss) per share available to common stockholders | ||||||||||||||||
Basic | $ | 0.19 | $ | (0.24 | ) | |||||||||||
Diluted | $ | 0.19 | $ | (0.24 | ) | |||||||||||
Weighted average number of common shares outstanding | ||||||||||||||||
Basic | 76,752,752 | 35,193,789 | ||||||||||||||
Diluted | 76,839,810 | 35,193,789 | ||||||||||||||
*The fiscal year ended September 30, 2016 includes 114 days of the acquired business’ operating activities as a result of the consummation of the Business Combination on June 9, 2016.
The accompanying notes are an integral part of these Consolidated Financial Statements.
66
Nexeo Solutions, Inc. and Subsidiaries
Consolidated Statements of Comprehensive Income (Loss)
(in millions)
Successor | Predecessor | |||||||||||||||
Fiscal Year Ended September 30, 2017 | Fiscal Year Ended September 30, 2016* | October 1, 2015 Through June 8, 2016 | Fiscal Year Ended September 30, 2015 | |||||||||||||
Net income (loss) | $ | 14.4 | $ | (8.4 | ) | $ | (13.8 | ) | $ | 20.4 | ||||||
Unrealized foreign currency translation gain (loss), net of tax | 13.0 | (4.5 | ) | (4.0 | ) | (27.2 | ) | |||||||||
Unrealized gain on interest rate hedges, net of tax | — | — | 0.3 | 0.2 | ||||||||||||
Other comprehensive income (loss), net of tax | 13.0 | (4.5 | ) | (3.7 | ) | (27.0 | ) | |||||||||
Total comprehensive income (loss), net of tax | 27.4 | (12.9 | ) | (17.5 | ) | (6.6 | ) | |||||||||
Comprehensive loss attributable to noncontrolling interest, net of tax | — | — | — | 0.1 | ||||||||||||
Total comprehensive income (loss), net of tax attributable to Nexeo Solutions, Inc. (1) | $ | 27.4 | $ | (12.9 | ) | $ | (17.5 | ) | $ | (6.5 | ) | |||||
*The fiscal year ended September 30, 2016 includes 114 days of the acquired business’ operating activities as a result of the consummation of the Business Combination on June 9, 2016.
(1) The tax effects for each component presented are not material.
The accompanying notes are an integral part of these Consolidated Financial Statements.
67
Nexeo Solutions, Inc. and Subsidiaries
Consolidated Statements of Equity
(in millions, except share amounts)
Common Stock | Treasury Stock | Additional Paid-in Capital | Retained Earnings (Accumulated Deficit) | Accumulated Other Comprehensive Loss | Total | ||||||||||||||||||||||||
Shares | Amount | Shares | Amount | ||||||||||||||||||||||||||
Balance at September 30, 2015 | 14,853,927 | $ | — | — | $ | — | $ | 6.2 | $ | (1.2 | ) | $ | — | $ | 5.0 | ||||||||||||||
Reclassification of shares previously subject to redemption | 47,677,323 | — | — | — | 476.8 | — | — | 476.8 | |||||||||||||||||||||
Redeemed shares | (29,793,320 | ) | — | — | — | (298.5 | ) | — | — | (298.5 | ) | ||||||||||||||||||
Warrant conversion | 2,240,000 | — | — | — | — | — | — | — | |||||||||||||||||||||
Private placement shares issued May 23, 2016 | 23,492,306 | — | — | — | 234.9 | — | — | 234.9 | |||||||||||||||||||||
Shares issued to Selling Equityholders | 27,673,604 | — | — | — | 276.7 | — | — | 276.7 | |||||||||||||||||||||
Fair value equity contribution from Sponsor in the form of Founder Shares transferred to Selling Equityholders | — | — | — | — | 30.2 | — | — | 30.2 | |||||||||||||||||||||
Shares issued for advisory services and deferred underwriting fees | 3,078,578 | — | — | — | 30.8 | — | — | 30.8 | |||||||||||||||||||||
Fair value equity contribution from Sponsor in the form of Founder Shares transferred to directors for services rendered | — | — | — | — | 0.3 | — | — | 0.3 | |||||||||||||||||||||
Restricted stock awards | 64,518 | — | — | — | 0.1 | — | — | 0.1 | |||||||||||||||||||||
Equity-based compensation | — | — | — | — | 1.4 | — | — | 1.4 | |||||||||||||||||||||
Comprehensive loss: | |||||||||||||||||||||||||||||
Net loss | — | — | — | — | — | (8.4 | ) | — | (8.4 | ) | |||||||||||||||||||
Other comprehensive loss | — | — | — | — | — | — | (4.5 | ) | (4.5 | ) | |||||||||||||||||||
Balance September 30, 2016, Successor | 89,286,936 | $ | — | — | $ | — | $ | 758.9 | $ | (9.6 | ) | $ | (4.5 | ) | $ | 744.8 | |||||||||||||
Issuance of restricted stock | 77,458 | — | — | — | — | — | — | — | |||||||||||||||||||||
Forfeiture of restricted stock award | (10,753 | ) | — | — | — | — | — | — | — | ||||||||||||||||||||
Shares associated with employee tax withholding for vesting of certain equity awards | (9,576 | ) | — | 9,576 | (0.1 | ) | — | — | — | (0.1 | ) | ||||||||||||||||||
Equity-based compensation | — | — | — | — | 5.5 | — | — | 5.5 | |||||||||||||||||||||
Comprehensive income: | — | — | — | — | — | — | — | — | |||||||||||||||||||||
Net income | — | — | — | — | — | 14.4 | — | 14.4 | |||||||||||||||||||||
Other comprehensive income | — | — | — | — | — | — | 13.0 | 13.0 | |||||||||||||||||||||
Balance September 30, 2017, Successor | 89,344,065 | $ | — | 9,576 | $ | (0.1 | ) | $ | 764.4 | $ | 4.8 | $ | 8.5 | $ | 777.6 | ||||||||||||||
The accompanying notes are an integral part of these Consolidated Financial Statements.
68
Nexeo Solutions, Inc. and Subsidiaries
Consolidated Statements of Cash Flows
(in millions)
Successor | Predecessor | |||||||||||||||
Fiscal Year Ended September 30, 2017 | Fiscal Year Ended September 30, 2016* | October 1, 2015 through June 8, 2016 | Fiscal Year Ended September 30, 2015 | |||||||||||||
Cash flows from operations | ||||||||||||||||
Net income (loss) from continuing operations | $ | 14.4 | $ | (8.4 | ) | $ | (13.9 | ) | $ | 21.2 | ||||||
Adjustments to reconcile to cash flows from operations: | ||||||||||||||||
Depreciation and amortization | 73.1 | 20.6 | 37.7 | 52.6 | ||||||||||||
Debt issuance costs amortization, debt issuance costs write-offs and original issue discount amortization | 4.1 | 0.7 | 6.1 | 8.7 | ||||||||||||
Non-cash transaction costs | — | 12.8 | — | — | ||||||||||||
Provision for bad debt | (0.2 | ) | 0.3 | 1.2 | 0.6 | |||||||||||
Inventory impairment | — | — | — | 1.6 | ||||||||||||
Impairment charge due to natural disasters | 1.5 | — | — | — | ||||||||||||
Deferred income taxes | 2.2 | (1.1 | ) | 1.1 | 2.8 | |||||||||||
Equity-based compensation charges | 5.5 | 1.5 | 2.7 | 1.2 | ||||||||||||
Change in fair value of contingent consideration obligations | 16.2 | (11.2 | ) | — | — | |||||||||||
(Gain) loss from sales of property and equipment | 0.2 | 0.2 | (2.0 | ) | (2.5 | ) | ||||||||||
Gain related to reimbursements of certain capital expenditures incurred | (8.1 | ) | (0.8 | ) | — | — | ||||||||||
Gain from debt extinguishment, net | — | — | (0.6 | ) | (0.6 | ) | ||||||||||
Changes in assets and liabilities: | ||||||||||||||||
Accounts and notes receivable | (101.9 | ) | (5.0 | ) | 34.4 | 109.7 | ||||||||||
Inventories | 14.4 | 12.5 | 8.4 | 50.5 | ||||||||||||
Other current assets | 5.6 | 0.1 | (4.1 | ) | 8.2 | |||||||||||
Accounts payable | 43.7 | (14.5 | ) | 13.4 | (104.8 | ) | ||||||||||
Related party payable | — | (0.1 | ) | (0.3 | ) | (1.6 | ) | |||||||||
Accrued expenses and other liabilities | 6.1 | (4.9 | ) | (9.7 | ) | 5.9 | ||||||||||
Changes in other operating assets and liabilities, net | 1.8 | 0.5 | (4.9 | ) | 1.2 | |||||||||||
Net cash provided by operating activities from continuing operations | 78.6 | 3.2 | 69.5 | 154.7 | ||||||||||||
Net cash provided by (used in) operating activities from discontinued operations | — | — | 0.1 | (0.6 | ) | |||||||||||
Net cash provided by operating activities | 78.6 | 3.2 | 69.6 | 154.1 | ||||||||||||
Cash flows from investing activities | ||||||||||||||||
Additions to property and equipment | (27.6 | ) | (12.7 | ) | (14.2 | ) | (35.6 | ) | ||||||||
Proceeds from the disposal of property and equipment | 0.6 | 4.7 | 2.4 | 4.1 | ||||||||||||
Proceeds from reimbursement for certain capital expenditures incurred | 8.4 | 0.5 | — | — | ||||||||||||
Proceeds withdrawn from trust account | — | 501.1 | — | — | ||||||||||||
Cash paid for asset and business acquisitions | (65.6 | ) | (360.6 | ) | — | — | ||||||||||
Net cash provided by (used in) investing activities | (84.2 | ) | 133.0 | (11.8 | ) | (31.5 | ) | |||||||||
Cash flows from financing activities | ||||||||||||||||
Proceeds from issuance of common stock | — | 234.9 | — | — | ||||||||||||
Redemption of common stock | — | (298.5 | ) | — | — | |||||||||||
Proceeds from Sponsor convertible note and Sponsor promissory note | — | 0.7 | — | — | ||||||||||||
Repayment of Sponsor convertible note and Sponsor promissory note | — | (1.0 | ) | — | — | |||||||||||
Repurchases of membership units | — | — | (0.1 | ) | — | |||||||||||
Tax distributions associated with membership interests | — | — | — | (0.1 | ) | |||||||||||
Purchase of additional noncontrolling equity interest in Nexeo Plaschem | — | — | — | (34.3 | ) | |||||||||||
Proceeds from short-term debt | 40.6 | 13.3 | 20.9 | 39.6 | ||||||||||||
Repayments of short-term debt | (39.3 | ) | (12.8 | ) | (17.1 | ) | (51.7 | ) | ||||||||
Proceeds from issuance of long-term debt | 773.8 | 972.5 | 292.1 | 495.8 | ||||||||||||
Repayments of long-term debt and capital lease obligations | (762.0 | ) | (205.4 | ) | (417.3 | ) | (531.1 | ) | ||||||||
Repayment of Predecessor long-term debt | — | (767.3 | ) | — | — | |||||||||||
69
Payments of debt issuance costs | (1.3 | ) | (25.3 | ) | — | — | ||||||||||
Net cash provided by (used in) financing activities | 11.8 | (88.9 | ) | (121.5 | ) | (81.8 | ) | |||||||||
Effect of exchange rate changes on cash and cash equivalents | 0.2 | — | 0.3 | (1.3 | ) | |||||||||||
Increase (decrease) in cash and cash equivalents | 6.4 | 47.3 | (63.4 | ) | 39.5 | |||||||||||
Cash and cash equivalents at the beginning of the period | 47.5 | 0.2 | 127.7 | 88.2 | ||||||||||||
Cash and cash equivalents at the end of the period | $ | 53.9 | $ | 47.5 | $ | 64.3 | $ | 127.7 | ||||||||
Supplemental disclosure of cash flow information: | ||||||||||||||||
Cash paid during the period for interest | $ | 46.1 | $ | 16.9 | $ | 32.9 | $ | 56.3 | ||||||||
Cash paid during the period for taxes (net of refunds) | $ | 6.9 | $ | 2.9 | $ | 3.4 | $ | 4.4 | ||||||||
Supplemental disclosure of non-cash operating activities: | ||||||||||||||||
Non-cash payment of deferred underwriting fees | $ | — | $ | 18.3 | $ | — | $ | — | ||||||||
Supplemental disclosure of non-cash investing activities: | ||||||||||||||||
Non-cash capital expenditures | $ | 17.3 | $ | 3.2 | $ | 16.5 | $ | 15.3 | ||||||||
Non-cash intangible assets acquired | $ | 3.7 | $ | — | $ | — | $ | — | ||||||||
Supplemental disclosure of non-cash financing activities: | ||||||||||||||||
Non-cash capital lease obligations | $ | 15.3 | $ | 0.2 | $ | 14.3 | $ | 12.7 | ||||||||
*The fiscal year ended September 30, 2016 includes 114 days of the acquired business’ operating activities as a result of the consummation of the Business Combination on June 9, 2016.
The accompanying notes are an integral part of these Consolidated Financial Statements.
70
Nexeo Solutions, Inc. and Subsidiaries
Notes to Consolidated Financial Statements
(currencies in millions, except per share amounts)
1. Basis of Presentation and Nature of Operations
Basis of Presentation
Nexeo Solutions, Inc. (together with its subsidiaries, the "Company") is the result of the business combination between WL Ross Holding Corp.("WLRH") and Nexeo Solutions Holdings, LLC ("Holdings"). WLRH was incorporated in Delaware on March 24, 2014 and was formed for the purpose of effecting a merger, capital stock exchange, asset acquisition, stock purchase, reorganization or similar business combination with one or more businesses. WLRH completed its IPO in June 2014, raising approximately $500.0 million in cash proceeds. WLRH neither engaged in any operations nor generated any revenue prior to the Business Combination.
On the Closing Date, WLRH and Holdings and certain other parties consummated the Business Combination, pursuant to the Merger Agreement. In connection with the closing of the Business Combination, WLRH changed its name from "WL Ross Holding Corp." to "Nexeo Solutions, Inc." and changed the ticker symbol for its common stock on NASDAQ from "WLRH" to "NXEO."
The Company’s financial statement presentation distinguishes a “Successor” for the periods after the Closing Date and a “Predecessor” for the periods prior to the Closing Date. In the Business Combination, WLRH was subsequently renamed "Nexeo Solutions, Inc.", was identified as the acquirer and Successor and Holdings was identified as the acquiree and Predecessor. As a result of the application of the acquisition method of accounting as of the Closing Date, the consolidated financial statements for the Successor and Predecessor periods are presented on a different basis and are, therefore, not comparable. See Note 3 for further discussion of the Business Combination.
On the Closing Date, the Company’s Board of Directors approved a change in WLRH’s fiscal year end from December 31st to September 30th. The Successor period in the consolidated financial statements as of September 30, 2016 and for the fiscal year ended September 30, 2016, includes 114 days (June 9, 2016 through September 30, 2016) of the combined operating results, as well as WLRH’s operating results, which reflect its financial activity including transaction costs and equity structure changes in preparation of the consummation of the Business Combination. Operating results during the fiscal year ended September 30, 2015 for WLRH are not significant or meaningful and therefore are not presented in the consolidated statements of operations. Operating results for the Predecessor fiscal year ended September 30, 2015 are presented as they are reflective of the ongoing operations of the acquired business.
The Predecessor periods in the consolidated financial statements represent the operating results of Holdings and its subsidiaries prior to the Business Combination.
Nature of Operations
The Company is a global distributor of chemicals products in North America and Asia and a global distributor of plastics in North America, EMEA and Asia. The Company offers its customers products used in a broad cross-section of end markets including household, industrial and institutional, lubricants, performance coatings (including architectural coatings, adhesives, sealants and elastomers), automotive, healthcare, personal care, oil and gas and construction. In connection with the distribution of chemicals products, the Company provides value-added services such as custom blending, packaging and re-packaging, private-label manufacturing and product testing in the form of chemical analysis, product performance analysis and product development. The Company also provides on-site and off-site environmental services, including waste collection, recovery, disposal services and recycling in North America, primarily in the U.S., through its Environmental Services line of business.
2. Significant Accounting Policies and Recent Accounting Pronouncements
Significant Accounting Policies
Principles of Consolidation
The accompanying consolidated financial statements include all the accounts of the Company and all wholly-owned subsidiaries in which it maintains control. Significant intercompany transactions and balances have been eliminated in consolidation.
Use of Estimates, Risks, and Uncertainties
The preparation of consolidated financial statements requires management to make estimates and assumptions that affect the reported amounts of assets, liabilities, revenues, expenses and the disclosures of contingent assets and liabilities. Significant items that are subject to such estimates and assumptions include:
•the fair value of assets acquired and liabilities assumed in a business combination;
•the assessment of recoverability of long lived assets, including property and equipment, goodwill
and intangible assets, income taxes, reserves and environmental remediation;
•the estimated useful lives of intangible and depreciable assets;
•the grant date fair value of equity-based awards;
•the recognition, measurement and valuation of current and deferred income taxes;
•the recognition and measurement of contingent consideration related to the TRA liability; and
•the recognition and measurement of contingent consideration related to the Deferred Cash Consideration.
Although management bases its estimates on historical experience and various other assumptions that are believed to be reasonable under the circumstances, actual results could differ significantly from the estimates under different assumptions or conditions.
The Company's financial instruments exposed to concentration of credit risk consist primarily of cash and cash equivalents. Although the Company deposits cash with multiple banks, these deposits, including those held in foreign branches of global banks, may exceed the amount of insurance provided on such deposits. These deposits may generally be redeemed upon demand and bear minimal risks.
No single customer accounted for more than 10% of revenues for any line of business, or on a consolidated basis, and no individual customer represented greater than 5.0% of the outstanding accounts receivable balance for each of the periods reported. The Company had two suppliers that each accounted for approximately 12.1% and 9.9% of consolidated purchases during the fiscal year ended September 30, 2017 and 11.9% and 10.4% for the fiscal year ended September 30, 2016. For the period from October 1, 2015 through June 8, 2016 these two suppliers accounted for approximately 12.0% and 9.8% of consolidated purchases for the Predecessor. During the fiscal year ended September 30, 2015, one of these suppliers accounted for 11.9% of the Predecessor's consolidated purchases.
Cash and Cash Equivalents
All highly liquid temporary investments with original maturities of three months or less are considered to be cash equivalents. See Note 4.
Accounts and Notes Receivable and Allowance for Doubtful Accounts
Accounts receivable are recorded net of discounts and allowance for doubtful accounts. The Company performs ongoing credit evaluations of its customers and generally does not require collateral from its customers. The Company’s accounts receivable in the U.S. and Canada are collateral under the Credit Facilities.
71
The Company records an allowance for doubtful accounts as a best estimate of the amount of probable credit losses for accounts receivable. On a recurring basis, the Company reviews this allowance and considers factors such as customer credit, past transaction history with the customer and changes in customer payment terms when determining whether the collection of a receivable is reasonably assured. Past due balances over 90 days and over a specified amount are reviewed individually for collectability. Receivables are charged off against the allowance for doubtful accounts when it is probable a receivable will not be recovered. The allowance for doubtful accounts was $2.2 million and $1.4 million at September 30, 2017 and 2016, respectively, and $3.8 million at September 30, 2015 for the Predecessor. Bad debt expense, net of recoveries is a component of Selling, general and administrative expenses in the consolidated statements of operations. For the fiscal year ended September 30, 2017 net bad debt recovery was $0.2 million and for the fiscal year ended September 20, 2016 net bad debt expense was $0.3 million. Net bad debt expense for the Predecessor period from October 1, 2015 through June 8, 2016 and the fiscal year ended September 30, 2015 was $1.2 million and $0.6 million, respectively.
Certain customers of the Company's operations in China are allowed to remit payment during a period of time ranging from 30 days up to nine months. These notes receivables, which are supported by banknotes issued by large banks in China on behalf of these customers, are included in Accounts and Notes Receivable on the Company's consolidated balance sheets and totaled $8.3 million and $6.4 million at September 30, 2017 and 2016, respectively, and $4.5 million at September 30, 2015 for the Predecessor.
Inventories
Inventories are carried at the lower of cost or market using the weighted average cost method. The Company’s inventories in the U.S. and Canada are collateral under the Credit Facilities. See Note 4.
Goodwill and Intangibles
The Company had goodwill of $703.0 million and $665.7 million at September 30, 2017 and 2016, respectively, associated with the Business Combination and asset acquisitions. The purchase consideration of an acquisition is allocated to the underlying assets acquired and liabilities assumed based upon their estimated fair values at the date of acquisition. The estimated fair values are determined after review and consideration of relevant information including discounted cash flows, quoted market prices and estimates made by management. To the extent that the purchase consideration exceeds the fair value of the net identifiable tangible and intangible assets acquired, such excess is allocated to goodwill. See Note 6.
The Company had other intangible assets, net of amortization, of $231.5 million and $215.0 million at September 30, 2017 and 2016, respectively. These intangible assets, which are amortized on a straight-line basis over their estimated useful lives, consist of customer relationships, supplier relationships, trade names, below-market leases and non-compete agreements. See Note 6. The range of estimated useful lives used to amortize these intangible assets is as follows:
Estimated Useful Lives (years) | |
Customer-related | 5-13 |
Supplier-related | 10 |
Trade name | 2-10 |
Below-market leases | 1-7 |
Non-compete agreements | 3-10 |
72
Property, Plant and Equipment
Property, plant and equipment includes plants, buildings, machinery, equipment, software and computer equipment. Property, plant and equipment acquired or constructed in the normal course of business are initially recorded at cost. Property and equipment acquired in business combinations and asset acquisitions are initially recorded at their estimated fair value. Property, plant and equipment are depreciated by the straight-line method over the estimated useful lives of the assets. Leasehold improvements are amortized over the shorter of their economic useful life or their lease term. The range of useful lives used to depreciate property, plant and equipment is as follows:
Estimated Useful Lives (years) | |
Plants and buildings | 5-35 |
Machinery and equipment | 2-30 |
Software and computer equipment | 3-10 |
Repairs and maintenance expenditures that do not extend the useful life of the asset are charged to expense as incurred. Major expenditures for replacements and significant improvements that increase asset values or extend useful lives are capitalized. The carrying amounts of assets that are sold or retired and the related accumulated depreciation are removed from the accounts in the year of disposal and any resulting gain or loss is reflected in the consolidated statements of operations. See Note 5.
Leases
The Company leases certain property, plant and equipment in the ordinary course of business. The leases are classified as either capital leases or operating leases. Assets under capital leases are included in Property, plant and equipment, net in the consolidated balance sheets and are depreciated over the lesser of the lease term or the useful life of the assets. Capital lease obligations are included in Short-term borrowings, current portion of long-term debt and capital lease obligations and Long-term debt and capital lease obligations, less current portion, net in the consolidated balance sheets. Generally, lease payments under capital leases are recognized as interest expense and a reduction of the capital lease obligations. Lease payments under operating leases are recognized as an expense in the consolidated statements of operations on a straight-line basis over the lease term. See Note 13.
Impairment of Long-Lived Assets
Goodwill. Goodwill is tested for impairment annually as of March 31st and whenever events or circumstances make it more likely than not that an impairment may have occurred. Goodwill is reviewed for impairment at the reporting unit level, which is defined as operating segments or groupings of businesses one level below the operating segment level. The Company’s operating segments are the same as the reporting units used in its goodwill impairment test. Goodwill is tested for impairment by comparing the estimated fair value of a reporting unit, determined using a market approach, if market prices are available, or alternatively, a discounted cash flow model, with its carrying value. The annual evaluation of goodwill requires the use of estimates about future operating results, valuation multiples and discount rates of each reporting unit to determine their estimated fair value. Changes in these assumptions can materially affect these estimates. Once an impairment of goodwill has been recorded, it cannot be reversed. No goodwill impairment was recognized during any of the periods presented. See Note 6.
Other Long-Lived Assets. Property, plant and equipment and other intangible assets with definite lives are tested for impairment whenever events and circumstances indicate that the carrying value of an asset may not be recoverable. When an impairment test is performed and the undiscounted expected future cash flows are less than the carrying value, an impairment loss is recognized equal to an amount by which the carrying value exceeds the fair value of the asset. The factors considered by management in performing this assessment include current operating results, trends and prospects, as well as the effect of obsolescence, demand, competition and other economic factors.
Debt Issuance Costs
Costs associated with the ABL Facility are recorded as debt issuance costs, which are included in Other non-current assets in the consolidated balance sheets and are being amortized as interest expense over the contractual lives of the related agreements. Costs associated with non-revolving debt facilities are recorded as a reduction of the long-term debt, and are amortized as interest expense over the contractual lives of the related agreements. See Notes 4 and 7.
73
Commitments, Contingencies and Environmental Costs
Liabilities for loss contingencies arising from claims, assessments, litigation, fines, penalties and other sources are recorded when it is probable that a liability has been incurred and the amount of the assessment and/or remediation can be reasonably estimated. Gain contingencies are not recorded until management determines it is certain that the future event will become or is realized.
Liabilities for environmental remediation costs are recognized when environmental assessments or remediation are probable and the associated costs can be reasonably estimated. Generally, the timing of these provisions coincides with the commitment to a formal plan of action or, if earlier, the divestment or closure of the relevant sites. The amount recognized reflects management’s best estimate of the expenditures expected to be required. Actual environmental expenditures that relate to current or future revenues are expensed or capitalized as appropriate. Actual expenditures that relate to an existing condition caused by past operations and that do not impact future earnings are expensed.
Ashland agreed to retain known environmental remediation liabilities and other environmental remediation liabilities for releases of hazardous materials occurring prior to March 31, 2011, and of which Ashland received notice prior to March 31, 2016. See Note 13.
Earnings or Loss per Share
Basic EPS, which excludes dilution, is computed by dividing income or loss available to common stockholders by the weighted average number of common shares outstanding for the period. Diluted EPS reflects the potential dilution that could occur if securities or other contracts to issue common stock were exercised or converted into common shares and the proceeds from such activities, if any, were used to acquire shares of common stock at the average market price during the reporting period. During a net loss period, the assumed exercise of in-the-money stock options and unvested stock has an anti-dilutive effect and, therefore, such potential shares are excluded from the diluted EPS computation.
Per share information is based on the weighted average number of common shares outstanding during each period for the basic computation and, if dilutive, the weighted average number of potential common shares resulting from the assumed conversion of outstanding stock options, unvested stock and unvested stock units for the diluted computation. See Note 12.
Concentrations of Credit Risk
All of the Company’s financial instruments, consisting primarily of accounts and notes receivable and interest rate swaps, involve elements of credit and market risk. The most significant portion of this credit risk relates to non-performance by counterparties. To manage counterparty risk associated with financial instruments, the Company selects and monitors counterparties based on its assessment of their financial strength and on credit ratings, if available.
Foreign Currency
The reporting currency of the Company is the USD. With few exceptions, the local currency is the functional currency for the Company's foreign subsidiaries. In consolidating the results of operations, income and expense accounts are translated into USD at average exchange rates in effect during the period and asset and liability accounts are translated at period-end exchange rates. Translation gains or losses are recorded in the foreign currency translation component in Accumulated other comprehensive income (loss) in stockholders’ equity and are included in net earnings only upon sale or liquidation of the underlying foreign subsidiary or affiliated company.
Transactions undertaken in currencies other than the functional currency of the subsidiary are translated using the exchange rate in effect as of the transaction date and give rise to foreign currency transaction gains and losses, which the Company includes in Selling, general and administrative expenses in the consolidated statements of operations. Net foreign currency transaction losses from various currencies were $0.6 million and $1.1 million for the fiscal years ended September 30, 2017 and 2016, respectively. Net foreign currency transaction losses were $1.6 million and $2.2 million, respectively, for the period from October 1, 2015 through June 8, 2016 and the fiscal year ended September 30, 2015 for the Predecessor.
74
Revenue Recognition
Revenues are recognized when persuasive evidence of an arrangement exists, products are shipped and title is transferred or services are provided to customers, the sales price is fixed or determinable and collectability is reasonably assured. Revenue for product sales is recognized at the time title and risk of loss transfer to the customer, based on the terms of the sale. For products delivered under the Company’s standard shipping terms, title and risk of loss transfer when the product is delivered to the customer’s delivery site. For sales transactions designated Freight on Board shipping point, the customer assumes risk of loss and title transfers at the time of shipment. Deferred revenues may result from (i) delivery delays for products delivered under the Company’s standard shipping terms or (ii) from other arrangements with its customers. Sales are reported net of tax assessed by qualifying governmental authorities.
The Company is generally the primary obligor in sales transactions with its customers, retains inventory risk during transit and assumes credit risk for amounts billed to its customers. Accordingly, the Company recognizes revenue primarily based on the gross amount billed to its customers. In sales transactions where the Company is not the primary obligor and does not retain inventory risk, the Company recognizes revenue on a net basis by recognizing only the commission the Company retains from such sales and including that commission in sales and operating revenues in the consolidated statements of operations.
Consistent with industry standards, the Company may offer volume-based rebates to large customers if the customer purchases a specified volume with the Company over a specified time period. The determination of these rebates at an interim date involves management judgment. As a result, the Company’s revenues may be affected if a customer earns a rebate toward the end of a year that the Company had not expected or if its estimate of customer purchases are less than expected. The Company has the experience and access to relevant information that the Company believes are necessary to reasonably estimate the amounts of such deductions from gross revenues. The Company regularly reviews the information related to these estimates and adjusts its reserves accordingly if and when actual experience differs from previous estimates. The Company recognizes the rebate obligation as a reduction of revenue based on its estimate of the total volume of purchases from a given customer over the specified period of time. Customer rebates totaled $7.8 million and $2.1 million for the fiscal years ended September 30, 2017 and 2016, respectively. Customer rebates totaled $4.0 million and $5.8 million for the period from October 1, 2015 through June 8, 2016 and the fiscal year ended September 30, 2015, respectively, for the Predecessor. Rebates due to customers were $4.8 million and $4.2 million at September 30, 2017 and 2016, respectively, and $4.3 million at September 30, 2015 for the Predecessor. These payables are included in Accrued expenses and other liabilities in the consolidated balance sheets.
Supplier Rebates
Certain of the Company's vendor arrangements provide for purchase incentives based on the Company achieving a specified volume or dollar value of purchases. The Company records the incentives as a reduction of inventory costs (and related cost of sales) based on its purchases to date and its estimates of purchases for the remainder of the calendar year. The Company receives these incentives in the form of rebates that are payable only when the Company's purchases equal or exceed the relevant calendar year target. Supplier rebates totaled $9.0 million and $3.1 million for the fiscal years ended September 30, 2017 and 2016, respectively. Supplier rebates totaled $6.5 million and $13.9 million for the period from October 1, 2015 through June 8, 2016 and the fiscal year ended September 30, 2015, respectively, for the Predecessor. Supplier rebates due to the Company were $4.0 million and $4.3 million at September 30, 2017 and 2016, respectively and $3.4 million at fiscal year ended September 30, 2015 for the Predecessor. These receivables are included in Accounts and notes receivable in the consolidated balance sheets.
Shipping and Handling
All shipping and handling amounts billed to customers are included in revenues. Costs incurred related to the shipping and handling of products are included in cost of sales.
75
Expense Recognition
Cost of sales include material and production costs, as well as the costs of inbound and outbound freight, purchasing and receiving, inspection, warehousing, internal transfers and all other distribution network costs. The Company's products and services are generally sold without any extended warranties. Selling, general and administrative expenses include sales and marketing costs, advertising, research and development, customer support, environmental remediation and administrative costs. Advertising and research and development costs are expensed as incurred. Advertising expenses totaled $1.8 million and $0.3 million for the fiscal years ended September 30, 2017 and 2016, respectively. Advertising expenses totaled $1.3 million and $2.2 million for the period from October 1, 2015 through June 8, 2016 and the fiscal year ended September 30, 2015, respectively, for the Predecessor. There were no material research and development expenses incurred during any of the periods presented.
Income Taxes
The Company accounts for income taxes under the asset and liability method, which requires the recognition of deferred tax assets and liabilities for the expected future tax consequences of events that have been recognized in the financial statements. Under this method, the Company determines deferred tax assets and liabilities on the basis of the differences between the financial statement and tax bases of assets and liabilities by using enacted tax rates in effect for the year in which the differences are expected to reverse. The effect of a change in tax rates on deferred tax assets and liabilities is recognized in income in the period that includes the enactment date. The provision for income taxes includes income taxes paid, currently payable or receivable and those deferred.
The Company recognizes deferred tax assets to the extent that it believes that these assets are more likely than not to be realized. In making such a determination, the Company considers all available positive and negative evidence, including future reversals of existing taxable temporary differences, projected future taxable income, tax-planning strategies and results of recent operations. If the Company determines that it would be able to realize its deferred tax assets in the future in excess of the net recorded amount, it would make an adjustment to the deferred tax asset valuation allowance, which would reduce the provision for income taxes.
The Company records uncertain tax positions in accordance with ASC 740 on the basis of a two-step process in which (1) the Company determines whether it is more likely than not that the tax positions will be sustained and (2) for those tax positions that meet the more-likely-than-not recognition threshold, the Company recognizes the largest amount that is more than 50% likely to be realized upon ultimate settlement with the related tax authority.
The Predecessor was organized as a limited liability company and was taxed as a partnership for U.S. income tax purposes. As such, with the exception of a limited number of state and local jurisdictions, the Predecessor was not subject to U.S. income taxes. Accordingly, the members of the Predecessor reported their share of the Predecessor’s taxable income on their respective U.S. federal tax returns. The Predecessor’s sole active U.S. corporate subsidiary, Sub Holding, was subject to tax at the entity level in the U.S. The net earnings for financial statement purposes differed from taxable income reportable by the Predecessor to the members as a result of differences between the tax basis and financial reporting basis of certain assets and liabilities and other factors. The Predecessor was required to make quarterly distributions to its members to fund their tax obligations, if any, attributable to the Predecessor’s taxable income. In some jurisdictions, the Predecessor made such distributions in the form of tax payments paid directly to the taxing authority on behalf of its members. Controlled foreign corporations are subject to tax at the entity level in their respective jurisdictions. See Note 15.
Due to Related Party Pursuant to Contingent Consideration Obligations
As described in Note 3, as part of the consideration for the Business Combination, the Company entered into the TRA and agreed to pay the Deferred Cash Consideration pursuant to the Merger Agreement. The Company’s obligation for these contingent consideration amounts was initially measured at fair value as of the Closing Date. The Company’s contingent consideration liabilities are required to be recorded at fair value as of the end of each reporting period with any changes in fair value recorded in operating income. Changes in the estimates and inputs used in determining the fair value of the contingent consideration could have a material impact on the amounts recognized. See Note 9.
Share-Based Compensation
The Company accounts for share-based compensation expense for equity instruments granted in exchange for employee and director services. Share-based compensation cost is measured at the grant date, based on the fair value of the award, and is recognized as expense over the vesting period of the equity award grant.
76
The Company’s PSU awards contain both market and performance-based conditions. At the grant date, market conditions are incorporated into the fair value measurement using a Monte Carlo simulation model under the assumptions that performance-based conditions are met and not met. The Company then determines the probability that performance-based conditions will be met and incorporates this into the grant date fair value of the award.
The compensation cost for the PSU awards is amortized over the vesting period on a straight-line basis, net of estimated forfeitures. Forfeiture rates are estimated based on consideration of historical forfeitures of the Company's and Predecessor’s actual forfeitures of its share-based compensation awards and a peer group of companies. See Note 10.
Recent Accounting Pronouncements Adopted as of September 30, 2017
In October 2016, the FASB issued ASU 2016-16, Income Taxes (Topic 740): Intra-Entity Transfers of Assets Other than Inventory, which eliminates the exception that prohibits the recognition of current and deferred income tax effects for intra-entity transfers of assets other than inventory until the asset has been sold to an outside party. The application of the amendments will require the use of a modified retrospective basis through a cumulative-effect adjustment to retained earnings as of the beginning of the period of adoption. The Company adopted this standard during the three months ended December 31, 2016, and the adoption did not have a material impact on the Company’s financial position or results of operations for the periods presented.
In January 2017, the FASB issued ASU 2017-01, Business Combinations (Topic 805): Clarifying the Definition of a Business, which revises the definition of a business. The amendments in this ASU specify for an acquisition to be considered a business, it must include an input and a substantive process that together significantly contribute to the ability to create outputs. The amendments also further define outputs, and specify that an acquisition where the fair value of gross assets acquired is concentrated in a single asset or group of similar assets would not constitute a business. The Company adopted this standard during the three months ended December 31, 2016 on a prospective basis. See Note 3.
In January 2017, the FASB issued ASU 2017-04, Intangibles - Goodwill and Other (Topic 350): Simplifying the Test for Goodwill Impairment. The amendments in this ASU removed step two of the goodwill impairment test and specified that an entity will recognize an impairment loss for the amount by which a reporting unit’s carrying amount exceeds its fair value. The Company adopted this guidance during the three months ended March 31, 2017 as part of its annual impairment test and the adoption did not have a material impact on the Company’s financial position or results of operations for the periods presented.
In August 2014, the FASB issued ASU 2014–15, Presentation of Financial Statements — Going Concern (Subtopic 205 – 40): Disclosure of Uncertainties About an Entity’s Ability to Continue as a Going Concern. This standard requires management to evaluate whether there are conditions or events that raise substantial doubt about the entity’s ability to continue as a going concern, and to provide certain disclosures when it is probable that the entity will be unable to meet its obligations as they become due within one year after the date that the financial statements are issued. The Company adopted this standard during the three months ended September 30, 2017, and the adoption did not have a material impact on the Company’s financial position, results of operations, cash flows or disclosures.
In August 2017, the FASB issued ASU 2017-12, Derivatives and Hedging (Topic 815): Targeted Improvements to Accounting for Hedging Activities, which expand an entity's ability to hedge nonfinancial risk and financial risk components, and reduce complexity in fair value hedges of interest rate risk. This standard eliminates the requirement to separately measure and report hedge ineffectiveness and generally requires the entire change in fair value of a hedging instrument to be presented in the same income statement line item as the hedged item. The guidance also removes certain documentation and assessment requirements and modifies the accounting for components excluded from the assessment of hedge effectiveness. The Company adopted this standard during the three months ended September 30, 2017, and it did not have a material impact on the Company's financial position or results of operations.
77
New Accounting Pronouncements Not Yet Adopted as of September 30, 2017
In May 2014, the FASB issued ASU 2014-09, Revenue from Contracts with Customers (Topic 606). The amendments in this ASU will supersede the revenue recognition requirements in Topic 605, Revenue Recognition and require that revenue be recognized to depict the transfer of promised goods or services to customers in an amount that reflects the consideration to which the entity expects to be entitled in exchange for those goods or services. In August 2015, the FASB issued ASU 2015-14, which deferred the effective date of ASU 2014-09 for all entities by one year. These amendments will be effective in annual reporting periods beginning after December 15, 2017 including interim reporting periods within that reporting period. The Company is in the process of evaluating the provisions of this ASU and assessing the potential effect on the Company’s financial position or results of operations, and will adopt this standard on October 1, 2018.
In July 2015, the FASB issued ASU 2015-11, Inventory (Topic 330): Simplifying the Measurement of Inventory. The amendments in this ASU require an entity to measure inventory at the lower of cost or net realizable value, whereas guidance previously required an assessment of market value of inventory, with different possibilities for determining market value. This ASU is effective for fiscal years beginning after December 15, 2016 and interim periods within those years, and early adoption is permitted. The Company adopted this standard as of October 1, 2017, and does not expect it to have a material effect on the Company’s financial position or results of operations.
In January 2016, the FASB issued ASU 2016-01, Financial Instruments (Topic 825): Recognition and Measurement of Financial Assets and Financial Liabilities. This ASU (i) requires all equity investments in unconsolidated entities other than those measured using the equity method of accounting, to be measured at fair value through earnings; (ii) when the fair value option has been elected for financial liabilities, requires that changes in fair value due to instrument specific credit risk be recognized separately in other comprehensive income and accumulated gains and losses due to these changes and will be reclassified from accumulated other comprehensive income to earnings if the liability is settled before maturity; and (iii) amends certain fair value disclosure provisions related to financial instruments carried at amortized cost. This ASU is effective for fiscal years beginning after December 15, 2017, including interim periods within those fiscal years and early adoption is permitted. The Company is in the process of evaluating the provisions of the ASU and assessing the potential effect on the Company’s financial position or results of operations.
In February 2016, the FASB issued ASU 2016-02, Leases (Topic 842). This ASU requires all leases with terms greater than 12 months, whether finance or operating, to be recorded on the balance sheet, reflecting a liability to make lease payments and a right-to-use asset representing the right to use the underlying asset for the lease term. The recognition, measurement and presentation of expenses and cash flows arising from a lease by a lessee will not significantly change from current U.S. GAAP. These amendments are effective for the reporting periods beginning after December 15, 2018 with early adoption permitted. An entity will be required to recognize and measure leases at the beginning of the earliest period presented using a modified retrospective approach by recording a cumulative-effect adjustment to equity as of the beginning of the fiscal year of adoption. The Company is in the process of evaluating the potential effects of this standard and believes it may have a significant impact on its consolidated financial statements due, in part, to its substantial number of operating lease obligations that will be reflected on the consolidated balance sheet upon adoption of the new guidance.
In March 2016, the FASB issued ASU 2016-09, Compensation - Stock Compensation (Topic 718): Improvements to Employee Share-Based Payment Accounting. The updated guidance simplifies several aspects of accounting for certain aspects of share-based payment awards to employees, including the accounting for income taxes, forfeitures and statutory tax withholding requirements, as well as the classification of related matters in the statement of cash flows. This ASU is effective for annual reporting periods beginning after December 15, 2016 and interim periods within those annual periods. The Company adopted this standard as of October 1, 2017 and does not expect it to have a material effect on the Company’s financial position or results of operations.
In June 2016, the FASB issued ASU 2016-13, Financial Instruments-Credit Losses (Topic 326): Measurement of Credit Losses on Financial Instruments. This ASU requires an organization to measure all expected credit losses for financial assets held at the reporting date based on historical experience, current conditions and reasonable and supportable forecasts. Forward-looking information will now be used to better inform credit loss estimates. The amendments in this ASU are effective for fiscal years beginning December 15, 2020 including interim periods within those years with early adoption permitted. The Company is currently in the process of evaluating the provisions of this ASU and assessing the potential effect on the Company’s financial position or results of operations.
78
In August 2016 the FASB issued ASU 2016-15, Statement of Cash Flows (Topic 230): Classification of Certain Cash Receipts and Cash Payments. This ASU will make eight targeted changes to how cash receipts and cash payments are presented and classified in the statement of cash flows. The new standard is effective for fiscal years beginning after December 15, 2017. Early adoption is permitted. The new standard will require adoption on a retrospective basis unless it is impracticable to apply, in which case the Company would be required to apply the amendments prospectively as of the earliest date practicable. The Company is in the process of evaluating the provisions of the ASU, but does not expect it to have a material effect on the Company’s consolidated statements of cash flows.
In May 2017, the FASB issued ASU 2017-09, Compensation-Stock Compensation (Topic 718). This ASU clarifies when changes to the terms or conditions of a share-based payment award must be accounted for as a modified award. The new guidance will reduce diversity in practice and result in fewer changes to the terms of an award being accounted for as modifications. The amendments in this ASU will be applied prospectively to awards modified on or after the adoption date. The ASU is effective for annual periods and interim periods within those annual periods beginning after December 15, 2017, with early adoption permitted. The Company is currently in the process of evaluating the provisions of this ASU and assessing the potential effect on the Company’s financial position or results of operations.
3. Acquisitions
Ultra Chem Acquisition
On April 3, 2017, the Company completed the Ultra Chem Acquisition for $56.7 million, net of cash acquired of $0.5 million, pursuant to the Ultra Chem Stock Purchase Agreement. Of the purchase price, $10.7 million was initially placed in escrow. Of this amount, $1.0 million was designated for the settlement of the final net working capital adjustment, which was completed during the fourth fiscal quarter of September 30, 2017 and resulted in a reduction of the net purchase price of $0.1 million. The remaining balance of $9.7 million may remain in escrow for a period of up to five years and relates to indemnification obligations under the Ultra Chem Stock Purchase Agreement. The escrow amount will be released pursuant to the terms of the Ultra Chem Stock Purchase Agreement and related documentation. The Ultra Chem Acquisition was financed with approximately $58.0 million of borrowings under the ABL Facility. There is no contingent consideration related to the Ultra Chem Acquisition.
Preliminary Purchase Consideration Allocation
The Ultra Chem Acquisition is accounted for under the acquisition method, which requires the Company to perform an allocation of the preliminary purchase consideration to the assets acquired and liabilities assumed based on their estimated fair values at the date of acquisition. The excess of the preliminary purchase consideration over the estimated fair values is recorded as goodwill. The following table summarizes the Company’s preliminary allocation of the preliminary purchase consideration to assets acquired and liabilities assumed at the Ultra Chem Closing Date:
79
Preliminary Purchase Consideration Allocation | |||
Accounts receivable | $ | 13.7 | |
Inventory | 9.1 | ||
Other current assets | 2.4 | ||
Property and equipment | 0.4 | ||
Customer-related intangible | 24.0 | ||
Trade name | 0.3 | ||
Non-compete agreements | 3.9 | ||
Other non-current assets | 2.5 | ||
Goodwill | 28.0 | ||
Total assets acquired | 84.3 | ||
Short-term borrowings | 0.9 | ||
Accounts payable | 12.1 | ||
Other current liabilities | 4.1 | ||
Deferred tax liability — non-current | 8.4 | ||
Other non-current liabilities | 2.1 | ||
Total liabilities assumed | 27.6 | ||
Net assets acquired | $ | 56.7 | |
The total purchase consideration allocation above is preliminary as the Company has not yet completed the necessary fair value assessments, including the assessments of inventory, intangible assets, certain assets and liabilities and the related tax impacts associated with these items. Any changes within the measurement period may change the amount of the purchase consideration allocable to goodwill. The fair value and tax impact assessments are to be completed within twelve months of the Ultra Chem Closing Date and could have a material impact on the components of the total purchase consideration allocation. During the fourth quarter of fiscal year 2017, the Company recorded measurement period adjustments to the preliminary purchase price allocation including a decrease in accounts receivable of $0.7 million, a decrease in inventory of $1.4 million, an increase of $2.0 million to customer-related intangible, an increase of $0.2 million to non-compete agreements, an increase in deferred tax liabilities of $8.4 million and a decrease in accounts payable of $0.9 million. The Company also recognized indemnification receivables totaling $1.8 million related to certain tax-related contingent liabilities. As described above, the Company also decreased the consideration paid for the Ultra Chem Acquisition as a result of the final net working capital adjustment of $0.1 million. These adjustments resulted in a net increase in goodwill of $5.5 million. As a result of these adjustments, an additional $0.1 million of amortization expense related to the identified intangible assets and a reduction in the amount recognized in income for the inventory step up fair value of $0.2 million were recognized during the fourth quarter of fiscal year 2017.
Transaction costs incurred by the Company associated with the Ultra Chem Acquisition were $1.8 million during the fiscal year ended September 30, 2017. Of this amount, approximately $1.1 million were recorded in Transaction Costs and $0.7 million were recorded in Selling, general and administrative expenses in the consolidated statement of operations.
A summary and description of the acquired assets and assumed liabilities fair valued in conjunction with applying the acquisition method of accounting follows:
Accounts and Notes Receivable
Accounts and notes receivable consisted of receivables related to the customers of the acquired business, as well as various other miscellaneous receivables. The accounts receivable and other miscellaneous receivables were recorded at their approximate fair value based on expected collections of Ultra Chem Group. Accordingly, accounts receivable included an adjustment of $1.5 million to reduce gross receivables to their net value after consideration of expected uncollectable amounts at the Ultra Chem Closing Date.
80
Inventory
Inventory consisted primarily of finished products to be distributed to the acquired business’s customers. The fair value of inventory was established through application of the income approach, using estimates of selling prices and costs such as selling and marketing expenses to be incurred in order to dispose of the finished products and arriving at the future profitability expected to be generated once the inventory is sold (net realizable value). The inventory fair value step up of $1.0 million was recognized in income during the fiscal year ended September 30, 2017, which is included in Cost of sales and operating expenses in the consolidated statement of operations. The Company’s assessment of the fair value of inventory is preliminary, and will be completed within twelve months of the Ultra Chem Closing Date.
Other Current Assets
Other current assets consisted primarily of prepaid expenses and did not have a fair value adjustment as part of acquisition accounting since their carrying value approximated fair value. Other current assets also include indemnification assets recorded in connection with the recognition of tax-related contingent liabilities assumed. The indemnification assets represented the reimbursement the Company would reasonably expect to receive from funds initially held in escrow pursuant to the purchase agreement if the liabilities were asserted by the relevant tax authority.
Property and Equipment
Property and equipment acquired consists primarily of leasehold improvements, computer and office equipment as well as furniture and fixtures. The preliminary purchase price allocation for property, plant and equipment was based on the carrying value of such assets as it was determined to approximate fair value. The Company's assessment of fair value of the property and equipment is preliminary and will be completed within twelve months of the Ultra Chem Closing Date.
Customer-Related Intangible
Customer relationships were valued through the application of the income approach. Under this approach, revenue, operating expenses and other costs associated with existing customers were estimated in order to derive cash flows attributable to the existing customer relationships. The resulting estimated cash flows were then discounted to present value to arrive at the fair value of existing customer relationships as of the valuation date. The value associated with customer relationships will be amortized on a straight-line basis over a ten-year period, which represents the approximate point in the projection period in which a majority of the asset’s cash flows are expected to be realized based on assumed attrition rates. The Company recognized $24.0 million for these intangible assets as part of the preliminary allocation of the purchase consideration. The Company's assessment of the expected future cash flows related to the customer intangibles is preliminary, and will be completed within twelve months of the Ultra Chem Closing Date.
Trade Name
The "Ultra Chem" trade name was valued through application of the income approach, involving the estimation of likely future sales and an estimated royalty rate reflective of the rate that a market participant would pay to use the "Ultra Chem" name. The fair value of this asset will be amortized on a straight-line basis over a two-year period, estimated based on the period in which the Company would expect a market participant to use the name prior to rebranding. The Company recognized $0.3 million for this intangible asset as part of the preliminary allocation of the purchase consideration. The Company's assessment of the estimated future cash flows from the "Ultra Chem" trade name is preliminary and will be completed within twelve months of the Ultra Chem Closing Date.
Non-Compete Agreements
In connection with the Ultra Chem Acquisition, the former equityholders of the Ultra Chem Group agreed to non-compete agreements. The terms of the non-compete agreements prohibit the equityholders from competing in the chemical distribution space for three years after the Ultra Chem Closing Date. The income approach was used to value the non-compete agreements through a comparative discounted cash flow analysis based on the impact of competition absent these agreements. The Company recognized $3.9 million for this intangible asset as part of the preliminary allocation of the purchase consideration. This intangible is amortized on a straight-line basis over a three-year period. The Company's assessment of the comparative future cash flows associated with the non-compete agreements is preliminary and will be completed within twelve months of the Ultra Chem Closing Date.
81
Other Non-Current Assets
Other non-current assets acquired represented certain long-term deposits and other assets, which did not have a fair value adjustment as part of acquisition accounting since their carrying value approximated fair value. Other non-current assets also included indemnification assets recorded in connection with the recognition of tax-related contingent liabilities assumed, and the expected value of certain assets pledged as a guarantee to the Ultra Chem Group in connection with transactions with a particular customer. The indemnification assets represented the reimbursement the Company reasonably expected to receive from funds initially held in escrow pursuant to the purchase agreement if the related liabilities were asserted by the relevant tax authority.
Goodwill
Goodwill represents the excess of the total purchase price over the fair value of the underlying net assets, largely arising from synergies expected as a result of the Ultra Chem Acquisition. Goodwill is not amortized to earnings, but instead is reviewed for impairment at least annually, absent any indicators of impairment. The Company does not expect any goodwill from the Ultra Chem Acquisition to be deductible for tax purposes. As the fair value assessments of the acquired assets and liabilities are finalized within twelve months of the Ultra Chem Closing Date, the amount of goodwill recognized as of the Ultra Chem Closing Date is subject to change.
Short-Term Borrowings
Short-term borrowings included short-term borrowings of the Ultra Chem Group prior to the Ultra Chem Acquisition, which did not have a fair value adjustment as part of acquisition accounting as their carrying value approximated fair value. As reflected in "—Preliminary Purchase Consideration Allocation" above, the balance was paid off immediately after the closing of the Ultra Chem Acquisition.
Accounts Payable
Accounts payable represented short-term obligations owed to the vendors of the acquired business, which were assumed in the Ultra Chem Acquisition. These obligations did not have a fair value adjustment as part of acquisition accounting as their carrying value approximated fair value.
Other Current Liabilities
Other current liabilities represented primarily accrued expenses, including accrued payroll, certain accrued taxes, the current portion of assumed tax-related contingent liabilities and various other liabilities arising out of the normal operations of the acquired business. The majority of these liabilities did not have a fair value adjustment as their carrying value approximated fair value.
Other Non-Current Liabilities
Other non-current liabilities represent assumed tax-related contingent liabilities, and the expected value of certain assets pledged as a guarantee to the Ultra Chem Group which would have to be returned to the third party under certain circumstances. The Company's assessment of the fair value of these liabilities is preliminary, and will be completed within twelve months of the Ultra Chem Closing Date.
Deferred Taxes
Deferred tax assets and liabilities are attributable to the difference between the estimated fair values allocated to inventory, property and equipment and identified intangibles acquired for financial reporting purposes and the amounts determined for tax reporting purposes and give rise to temporary differences. The deferred tax assets and liabilities will reverse in future periods or have reversed as the related tangible and intangible assets are amortized, acquired inventory is sold, or if goodwill is impaired. The estimates of deferred taxes are preliminary as the fair value assessments of the acquired assets and liabilities have not been fully completed.
82
Impact of the Ultra Chem Acquisition on the Company’s Consolidated Financial Information
For the fiscal year ended September 30, 2017, the Company’s consolidated sales and operating revenues and net income include $37.2 million and $2.0 million, respectively, related to the operations of the acquired business since the Ultra Chem Closing Date.
Asset Acquisitions
In December 2016, the Company acquired customer contracts and a customer list. Additionally, in connection with this transaction, the Company entered into a supply agreement and a licensing agreement granting the Company the non-exclusive use of a certain trademark. The total consideration associated with this transaction was $8.5 million, of which $5.1 million was paid at closing. The remaining consideration will be paid in equal amounts on or before January 1, 2018 and January 1, 2019. The remaining consideration is included in Accrued expenses and other liabilities and Other non-current liabilities on the Company’s consolidated balance sheets. In connection with this transaction, the Company recognized intangible assets totaling $8.5 million which are included in Other intangible assets, net of amortization on the Company’s consolidated balance sheet. The acquired intangible assets will be fully amortized over estimated useful lives ranging between 10 and 13 years.
In April 2017, the Company acquired customer contracts, a customer list and inventory. The total consideration associated with this transaction was approximately $1.9 million, with $1.6 million paid at closing. The remaining consideration is included in Accrued expenses and other liabilities on the Company’s consolidated balance sheet and will be paid on or before April 3, 2018, provided certain conditions are met. In connection with this transaction, the Company recognized an intangible asset related to the customer list of approximately $1.1 million which is included in Other intangible assets, net of amortization on the Company’s consolidated balance sheet. The customer list will be amortized over an estimated useful life of five years.
In August 2017, the Company acquired customer contracts, a customer list and certain trademarks. As part of this transaction, the Company entered into a supply agreement. The total consideration associated with this transaction was $2.2 million, and the Company recognized intangible assets of the same amount which are included in Other intangible assets, net of amortization on the Company's consolidated balance sheet. The acquired intangible assets will be fully amortized over an estimated useful life of five years.
Business Combination
On June 9, 2016, the Company consummated the Business Combination pursuant to the Merger Agreement, whereby WLRH acquired Holdings (including the portion of Holdings held by Blocker) through a series of two mergers. As a result of the transactions contemplated by the Merger Agreement, Holdings and Blocker became wholly-owned subsidiaries of WLRH.
The purchase consideration for the Business Combination was as follows:
Cash | $ | 424.9 | |
Less: cash acquired | (64.3 | ) | |
Equity(1) | 276.7 | ||
Founder Shares transferred to Selling Equityholders(1) | 30.2 | ||
Contingent consideration - Fair value of Deferred Cash Consideration | 45.4 | ||
Contingent consideration - Fair value of TRA (2) | 89.8 | ||
Total purchase consideration(3) | $ | 802.7 | |
(1) See Note 11.
(2) During the fiscal year ended September 30, 2017, the Company recorded adjustments of $5.6 million. See below.
(3) In addition to the total purchase consideration above, the Company assumed the outstanding indebtedness of the Predecessor, including related accrued interest through the Closing Date, totaling $774.3 million. The proceeds of the Credit Facilities were used to repay such indebtedness and accrued interest immediately following the consummation of the Business Combination.
83
Contingent Consideration - Deferred Cash Consideration
The contingent consideration associated with the Deferred Cash Consideration will be an amount in cash equal to the prevailing price of the Company’s common stock at the time that the Company pays such deferred cash payment multiplied by the number of Excess Shares (5,178,642 Excess Shares as of September 30, 2017). Based on the terms of the Excess Shares, certain circumstances require the Company to pay all or a portion of the Deferred Cash Consideration to the Selling Equityholders, where such cash amount is calculated as set forth in the Merger Agreement, including (i) where the volume weighted average trading price of the Company’s common stock for any period of 20 trading days in any 30 trading day period exceeds $15.00 per share, and (ii) if any Excess Shares remain on June 30, 2021. If any Excess Shares remain on June 30, 2021, the Company must elect to either (i) within five business days of such date, pay the Selling Equityholders an amount in cash equal to the product of the number of remaining Excess Shares multiplied by the volume weighted-average trading price for the 20 trading day period immediately preceding such date or (ii) use reasonable best efforts to sell such shares to a third party in a primary offering and pay the gross proceeds thereof (less any underwriting discounts and commissions) to the Selling Equityholders. However, to the extent the number of shares issued in such offerings does not equal the full amount of Excess Shares remaining at the time of the offering, the Company’s obligations with respect to any remaining Excess Shares, including the obligation to continue to complete any necessary additional offerings, shall continue.
In order to estimate the fair value of the Deferred Cash Consideration, the Company estimates the value of the Excess Shares using a Monte Carlo simulation model. The estimated fair value of the Deferred Cash Consideration liability as of the Closing Date was $45.4 million. See Note 9.
Contingent Consideration - TRA
Concurrent with the completion of the Business Combination, the Company incurred the liability for contingent consideration related to the TRA, which reflects amounts owed to the Selling Equityholders. This liability generally provides for the payment by the Company to the Selling Equityholders of 85% of the net cash savings, if any, in U.S. federal, state and local income taxes that the Company actually realizes (or is deemed to realize in certain circumstances) in periods after the Closing Date as a result of (i) certain increases in tax basis resulting from the Company Merger, (ii) certain tax attributes of Holdings existing prior to the Mergers, (iii) net operating losses and certain other tax attributes of Blocker available to the Company as a result of the Blocker Merger and (iv) imputed interest deemed to be paid by the Company as a result of, and additional tax basis arising from, payments the Company makes under the TRA. The Company will retain the benefit of the remaining 15% of the net cash savings, if any. The Company estimated the fair value of the TRA liability based on a discounted cash flow model which incorporates assumptions of projected taxable income, projected income tax liabilities and an estimate of tax benefits expected to be realized as a result of the Business Combination. During the fiscal year ended September 30, 2017, the Company completed its fair value assessment of the TRA liability as of the Closing Date and recorded adjustments totaling $5.6 million to the estimated fair value of the TRA liability as of the Closing Date, related to the assessments of the tax attributes associated with certain entities. Including these adjustments, the estimated fair value of the TRA liability as of the Closing Date was $89.8 million and the undiscounted cash flows associated with the TRA liability were estimated to be approximately $215.0 million over the time period during which the tax benefits are expected to be realized, currently estimated at over 20 years.
The amount and timing of any payments due under the TRA will vary depending upon a number of factors, including the amount and timing of the taxable income the Company generates in the future and the U.S. federal, state and local income tax rates then applicable. In addition, payments made under the TRA will give rise to additional tax benefits for the Company and therefore additional potential payments due under the TRA. The term of the TRA commenced upon the consummation of the Mergers and will continue until all tax benefits that are subject to the TRA have been utilized or expired, unless the Company exercises its right to terminate the TRA early. If the Company elects to terminate the TRA early, its obligations under the TRA would accelerate and it generally would be required to make an immediate payment equal to the present value of the anticipated future payments to be made by it under the TRA, calculated in accordance with certain valuation assumptions set forth in the TRA.
The liabilities related to the Deferred Cash Consideration and the TRA are included in Due to related party pursuant to contingent consideration obligations on the Company’s consolidated balance sheets.
84
Purchase Consideration Allocation
The Business Combination is accounted for under the acquisition method, with WLRH determined to be the accounting acquirer of Holdings, which requires the Company to perform an allocation of the purchase consideration to the assets acquired and liabilities assumed based on their estimated fair values at the date of acquisition. The excess of the purchase consideration over the estimated fair values is recorded as goodwill. The following table summarizes the Company’s allocation of the purchase consideration to assets acquired and liabilities assumed at the Closing Date:
Purchase Price Allocation | |||
Accounts receivable | $ | 470.0 | |
Inventory | 327.9 | ||
Other current assets | 26.0 | ||
Property, plant and equipment | 328.2 | ||
Customer-related intangible | 201.0 | ||
Trade name | 21.0 | ||
Below-market leases | 0.7 | ||
Other non-current assets | 3.2 | ||
Deferred tax assets | 1.2 | ||
Goodwill | 673.4 | ||
Total assets acquired | 2,052.6 | ||
Short-term borrowings and current portion of capital leases | 40.6 | ||
Accounts payable | 335.9 | ||
Other current liabilities | 52.8 | ||
Long-term portion of capital leases | 23.0 | ||
Long-term debt | 767.3 | ||
Deferred tax liability | 24.8 | ||
Other non-current liabilities | 5.5 | ||
Total liabilities assumed | 1,249.9 | ||
Net assets acquired | $ | 802.7 | |
During the fiscal year ended September 30, 2017, the Company completed its assessment of the fair values of the assets acquired and liabilities assumed in the Business Combination. The Company recorded adjustments to decrease the fair value of inventory by $0.6 million, property, plant and equipment by $0.1 million, an adjustment to accounts payable of $2.1 million, an adjustment to increase the fair value of other current assets by $0.2 million, and adjustments to deferred tax liabilities of $0.4 million. Goodwill was impacted by these adjustments as well as by the $5.6 million adjustment to the fair value of the TRA described above which increased the purchase consideration.
Transaction costs incurred by the Company associated with the Business Combination were $0.9 million and $21.3 million during the fiscal years ended September 30, 2017 and 2016, respectively. The Company also incurred a total of $25.3 million of debt issuance costs related to the Credit Facilities in connection with the consummation of the Business Combination. Transaction costs incurred by the Predecessor associated with the Business Combination were $33.4 million for the period from October 1, 2015 through June 8, 2016.
A summary and description of the acquired assets and assumed liabilities fair valued in conjunction with applying the acquisition method of accounting follows:
85
Accounts Receivable
Accounts receivable consisted of receivables related to the customers of the acquired business, as well as various other miscellaneous receivables. The accounts receivable and other miscellaneous receivables were recorded at their approximate fair value based on expected collections of the Predecessor. Accordingly, accounts receivable included an adjustment of $4.1 million to reduce gross receivables to their net value after consideration of expected uncollectable amounts at the Closing Date.
Inventory
Inventory consisted primarily of finished products to be distributed to the acquired business’s customers. The fair value of inventory was established through application of the income approach, using estimates of selling prices and costs such as selling and marketing expenses to be incurred in order to dispose of the finished products and arriving at the future profitability that is expected to be generated once the inventory is sold (net realizable value). An inventory fair value step up of $13.8 million was recognized in income during the fiscal year ended September 30, 2016, which is included in Cost of sales and operating expenses in the consolidated statement of operations.
Other Current Assets
Other current assets consisted primarily of prepaid expenses, which did not have a fair value adjustment as part of acquisition accounting since their carrying value approximated fair value. Additionally, as a result of the Business Combination, the Company recognized $1.3 million for certain tax receivables.
Property, Plant and Equipment
Property, plant and equipment consisted primarily of: 42 owned distribution locations in the U.S., Puerto Rico and Canada; 11 leased locations in the U.S., Canada, Puerto Rico, Mexico, Europe and China (excluding third party operated warehouses); and office equipment and other similar assets used in the Predecessor's operations. The allocation of the purchase consideration for property, plant and equipment was based on the fair market value of such assets determined using the cost approach. The cost approach consisted of estimating the fixed assets’ replacement cost less all forms of depreciation. The fair value of land was determined using the comparable sales approach. The fair value adjustment to property, plant and equipment was $96.0 million.
Customer-Related Intangible
Customer relationships were valued through the application of the income approach. Under this approach, revenue, operating expenses and other costs associated with existing customers were estimated in order to derive cash flows attributable to the existing customer relationships. The resulting estimated cash flows were then discounted to present value to arrive at the fair value of existing customer relationships as of the valuation date. The value associated with customer relationships will be amortized on a straight-line basis over a 12-year period, which represents the approximate point in the projection period in which a majority of the asset’s cash flows are expected to be realized based on assumed attrition rates. The Company recognized $201.0 million for these intangible assets as part of the allocation of the purchase consideration.
Trade Name
The "Nexeo" trade name was valued through application of the income approach, involving the estimation of likely future sales and an estimated royalty rate reflective of the rate that a market participant would pay to use the Nexeo name. The fair value of this asset will be amortized on a straight-line basis over a four year period, estimated based on the period in which the Company expects a market participant would use the name prior to rebranding and the length of time the name would be expected to maintain recognition and value in the marketplace. The Company recognized $21.0 million for this intangible asset as part of the allocation of the purchase consideration.
Below-Market Leases
The Company recognized an intangible asset related to favorable lease terms of certain properties under operating leases where rental payments were determined to be less than current market rates. The intangible asset will be amortized over the remaining life of the operating leases, which ranges from one to seven years. The Company recognized $0.7 million for this intangible asset as part of the allocation of the purchase consideration.
86
Other Non-Current Assets
Other non-current assets acquired represented certain long-term deposits, which did not have a fair value adjustment as part of acquisition accounting since their carrying value approximated fair value.
Goodwill
Goodwill represents the excess of the total purchase consideration over the fair value of the underlying net assets acquired, largely arising from the workforce and extensive efficient distribution network that has been established by the acquired business. Of the total amount of goodwill recognized as part of the allocation of the purchase consideration above, the Company expects approximately $243.8 million to be deductible for tax purposes as of September 30, 2017.
Short-Term Borrowings and Current Portion of Capital Leases.
Short-term borrowings and current portion of capital leases includes short-term borrowings of the Company's operations in China and the current portion of capital leases, which did not have a fair value adjustment as part of acquisition accounting since their carrying value approximated fair value.
Accounts Payable
Accounts payable represented short-term obligations owed to the vendors of the acquired business, which were assumed in the Business Combination. These obligations did not have a fair value adjustment as part of acquisition accounting since their carrying value approximated fair value.
Other Current Liabilities
Other current liabilities represented primarily accrued expenses, including accrued payroll, accrued interest on long-term debt, certain accrued taxes and various other liabilities arising out of the normal operations of the acquired business. The majority of these liabilities did not have a fair value adjustment because their carrying value approximated fair value. However, no fair value was recognized for certain recorded liabilities that did not meet the definition of a liability under the acquisition method of accounting.
Long-Term Portion of Capital Leases
The long-term portion of capital leases included the non-current portion of capital leases for machinery and equipment, which did not have a fair value adjustment as part of acquisition accounting as their carrying value approximated fair value.
Long-term Debt
Long-term debt represented the outstanding principal balance at the Closing Date of the Predecessor Term Loan Facility and the Notes which did not have a fair value adjustment as part of acquisition accounting as the carrying value approximated fair value.
Deferred Taxes
Deferred tax assets and liabilities are attributable to the difference between the estimated fair values allocated to inventory, property, plant and equipment and identified intangibles acquired for financial reporting purposes and the amounts determined for tax reporting purposes and give rise to temporary differences. The deferred tax assets and liabilities will reverse in future periods or have reversed as the related tangible and intangible assets are amortized, acquired inventory is sold, or if goodwill is impaired. Additionally, the Company’s entity structure includes several partnerships. The amounts recorded for deferred taxes reflect the evaluation of the tax basis of each individual partner's interest in the partnerships.
87
Unaudited Consolidated Pro Forma Financial Information
The unaudited consolidated pro forma results presented below include the effects of the Business Combination as if it had occurred as of October 1, 2014, the beginning of the fiscal year the Business Combination was consummated, and the Ultra Chem Acquisition as if it had occurred as of October 1, 2015. The unaudited consolidated pro forma results reflect certain adjustments related to these acquisitions, primarily reflecting a full period of Ultra Chem Group’s results of operations for each period presented, the estimated changes in fair value of the contingent consideration liability from the Business Combination, amortization expense associated with estimates for the acquired intangible assets, depreciation expense based on the new fair value of property, plant and equipment, the effects of inventory step ups from the acquisitions, transaction costs, interest expense and income taxes.
The unaudited consolidated pro forma financial information below is not necessarily indicative of either future results of operations or results that might have been achieved had the Business Combination been completed on October 1, 2014 or the Ultra Chem Acquisition on October 1, 2015.
Fiscal Year Ended September 30, | |||||||||||
2017 | 2016 | 2015 | |||||||||
Sales and operating revenues | $ | 3,672.2 | $ | 3,466.3 | $ | 3,949.1 | |||||
Operating income | $ | 71.1 | $ | 96.6 | $ | 6.2 | |||||
Net income (loss) from continuing operations | $ | 16.4 | $ | 33.4 | $ | (19.5 | ) | ||||
Net income (loss) | $ | 16.4 | $ | 33.5 | $ | (20.2 | ) | ||||
Basic and diluted net income (loss) per share | $ | 0.21 | $ | 0.44 | $ | (0.25 | ) | ||||
Pro forma weighted average number of common shares outstanding | |||||||||||
Basic | 76,752,752 | 76,746,168 | 76,746,168 | ||||||||
Diluted | 76,839,810 | 76,799,052 | 76,746,168 | ||||||||
The unaudited consolidated pro forma information for the fiscal year ended September 30, 2016 above reflects the effect of recognizing the non-recurring inventory fair value step up of $1.0 million and the effect of transaction related costs of $1.8 million during that period from the Ultra Chem Acquisition. The unaudited consolidated pro forma information for the fiscal year ended September 30, 2015 above reflects the effect of recognizing the non-recurring inventory fair value step up of $13.8 million in income during that period from the Business Combination and the effect of recognizing transaction related costs of $54.7 million during that period.
There was no impact to the calculation of pro forma basic or diluted weighted average number of common shares outstanding as a result of the Ultra Chem Acquisition, as no shares were issued as consideration. For the fiscal years ended September 30, 2016 and 2015 presented above, the pro forma weighted average number of common shares outstanding were computed assuming all shares issued as a result of the Business Combination would have been issued on October 1, 2014. The impact of unvested restricted stock awards issued to directors shortly after the Business Combination was included in the diluted share calculations for the fiscal year ending September 30, 2016, but was not included in the fiscal year ending September 30, 2015 as the effect would have been antidilutive. There were 12,476,250 Founder Shares not included in the basic or diluted computations because market conditions are assumed to be not satisfied. Additionally, the outstanding PSU awards were not included in the computation of diluted shares outstanding because performance targets and/or market conditions are assumed not to have been met for these awards. Diluted shares outstanding also did not include 25,012,500 shares based on the exercise of 50,025,000 warrants because the warrants were out-of-the-money.
88
4. Certain Balance Sheet Information
Cash and Cash Equivalents
Cash and cash equivalents were $53.9 million as of September 30, 2017 and $47.5 million as of September 30, 2016. These amounts included the following:
September 30, 2017 | September 30, 2016 | ||||||
Cash held by foreign subsidiaries | $ | 36.8 | $ | 41.9 | |||
Non-USD denominated currency held by foreign subsidiaries | $ | 31.1 | $ | 36.9 | |||
Currency denominated in RMB | $ | 8.5 | $ | 6.5 | |||
Non-USD denominated currency held by foreign subsidiaries was primarily in Euros and RMB. While the RMB is convertible into USD, foreign exchange transactions are subject to approvals from SAFE. The Company does not anticipate any significant adverse impact to overall liquidity from potential limitations on the transfer or conversion of cash and cash equivalents.
Inventories
Inventories at September 30, 2017 and 2016 consisted of the following:
September 30, 2017 | September 30, 2016 | ||||||
Finished products | $ | 310.6 | $ | 311.7 | |||
Supplies | 4.9 | 4.1 | |||||
Total | $ | 315.5 | $ | 315.8 | |||
As reflected in the consolidated statement of cash flows for the fiscal year ended September 30, 2015, the Predecessor recorded a $1.6 million non-cash impairment charge related to inventory on hand for certain chemical products in Asia. The decline in the value of these products was associated with the decline of oil prices as the prices for these products are closely correlated to this feedstock price.
The Company’s inventories in the U.S. and Canada are collateral under the Credit Facilities.
Other Non-Current Assets
Other non-current assets at September 30, 2017 and 2016 consisted of the following:
September 30, 2017 | September 30, 2016 | ||||||
Debt issuance costs of revolving credit facilities | $ | 5.1 | $ | 6.4 | |||
Other | 5.5 | 4.3 | |||||
Total | $ | 10.6 | $ | 10.7 | |||
Other non-current assets as of September 30, 2017 includes approximately $2.1 million of assets related to indemnification assets associated with the recognition of tax-related contingent liabilities assumed, and the expected value of certain assets pledged as a guarantee to the Ultra Chem Group in connection with transactions with a particular customer. The purchase price allocation of the Ultra Chem Acquisition is preliminary and the initial fair value assessments of these items may change within the twelve month measurement period. See Note 3.
As a result of TLB Amendment No. 1, the Company incurred debt issuance costs of $1.3 million during the fiscal year ended September 30, 2017. During the fiscal year ended September 30, 2016, the Company incurred debt issuance costs of $25.3 million in connection with the Credit Facilities. Of these, $6.8 million related to the ABL Facility and were recorded in Other non-current assets on the consolidated balance sheet. The remaining $18.5 million of debt issuance costs related to the Term Loan Facility and were recorded as a reduction of the debt. See Note 7.
Amortization of debt issuance costs related to the ABL Facility recorded in Interest expense in the consolidated statements of operations was $1.3 million and $0.4 million for the fiscal years ended September 30, 2017 and 2016, respectively.
89
Amortization of debt issuance costs related to the Predecessor ABL Facility recorded in interest expense was $2.1 million for the period from October 1, 2015 through June 8, 2016 and $3.0 million for the fiscal year ended September 30, 2015 for the Predecessor.
Investments and Cash Previously Held in Trust
Prior to the Business Combination, the Company held in a trust account securities which the Company had the ability and intent to hold until maturity. Held-to-maturity treasury securities were recorded at amortized cost and adjusted for the amortization of the original discount. During the fiscal year ended September 30, 2016, the Company recognized $0.5 million of amortization related to the original discount, which was recorded in Interest income in the consolidated statement of operations. As part of the Business Combination, the Company withdrew all $501.1 million of proceeds from the trust account.
5. Property, Plant and Equipment
Property, plant and equipment at September 30, 2017 and 2016 consisted of the following:
September 30, 2017 | September 30, 2016 | ||||||
Land | $ | 51.0 | $ | 50.4 | |||
Plants and buildings (1) | 106.5 | 89.8 | |||||
Machinery and equipment (2) | 152.8 | 130.5 | |||||
Software and computer equipment | 63.3 | 49.0 | |||||
Construction in progress | 5.0 | 16.5 | |||||
Total | 378.6 | 336.2 | |||||
Less accumulated depreciation (3) | (62.5 | ) | (13.6 | ) | |||
Property, plant and equipment, net | $ | 316.1 | $ | 322.6 | |||
(1) Includes $13.7 million as of September 30, 2017 related to facilities acquired under capital leases.
(2) Includes $27.2 million and $25.2 million, respectively, related to equipment acquired under capital leases.
(3) Includes $4.9 million and $1.1 million, respectively, related to facilities and equipment acquired under capital leases.
Depreciation expense recognized on the property, plant and equipment described above was as follows:
Successor | Predecessor | |||||||||||||||
Fiscal Year Ended September 30, 2017 | Fiscal Year Ended September 30, 2016* | October 1, 2015 Through June 8, 2016 | Fiscal Year Ended September 30, 2015 | |||||||||||||
Depreciation expense | $ | 48.2 | $ | 13.6 | $ | 27.1 | $ | 36.8 | ||||||||
*The fiscal year ended September 30, 2016 includes 114 days of the acquired business’ operating activities as a result of the consummation of the Business Combination on June 9, 2016.
Included in the carrying value of property, plant and equipment in the Company's consolidated balance sheets are certain closed facilities located in the U.S., which collectively have a carrying value of $1.2 million as of September 30, 2017 and as of September 30, 2016. The facilities do not currently meet the criteria for held-for-sale classification; accordingly, they remain classified as held and used.
During the fourth quarter of fiscal year 2017, the Company's facilities were adversely effected by three major hurricanes. Hurricane Harvey caused extensive flooding and costly physical damage along the Texas Gulf Coast, while Puerto Rico suffered a direct hit from Hurricanes Irma and Maria. The Company has recorded an impairment charge of $1.4 million to Cost of sales and operating expenses in the Company’s consolidated income statement related to these natural disasters.
During the fourth quarter of fiscal year 2017, the Company entered into a purchase agreement to buy land currently leased at one of the Company's distribution centers. The purchase is expected to be finalized during fiscal year 2018 for approximately $10.8 million.
90
Facility Lease
The Company's sale of its Franklin Park facility to the Illinois Tollway Authority under an eminent domain proceeding was completed in September 2016 for $4.6 million, net of costs incurred.
As a result of the sale of this facility, the Company relocated operations to a new leased facility in Montgomery, Illinois. The Montgomery Lease has a term of 15 years, with annual payments beginning at $1.1 million per year, excluding executory costs, and annual escalations of 2.5% per year. The lease agreement includes three, five year renewal options. The Montgomery Lease is accounted for as a capital lease and began in the first quarter of fiscal year 2017 at an initial cost of $13.2 million.
During the fiscal years ended September 30, 2017 and 2016, the Company recorded a gain of $8.1 million and $0.8 million, respectively, related to capital expenditures incurred in connection with the relocation and reimbursed by the Illinois Tollway Authority, which is included in Other Income on the consolidated statements of operations.
6. Goodwill and Other Intangibles
Goodwill
The following is a progression of goodwill by reportable segment:
Chemicals | Plastics | Other | Total | ||||||||||||
Balance at September 30, 2015 | $ | — | $ | — | $ | — | $ | — | |||||||
Business Combination | 331.9 | 274.1 | 63.0 | 669.0 | |||||||||||
Foreign currency translation | (0.3 | ) | (3.0 | ) | — | (3.3 | ) | ||||||||
Balance at September 30, 2016 | $ | 331.6 | $ | 271.1 | $ | 63.0 | $ | 665.7 | |||||||
Measurement period adjustments | 2.7 | 1.2 | 0.5 | 4.4 | |||||||||||
Ultra Chem Acquisition | 28.0 | — | — | 28.0 | |||||||||||
Foreign currency translation | 0.5 | 4.4 | — | 4.9 | |||||||||||
Balance at September 30, 2017 | $ | 362.8 | $ | 276.7 | $ | 63.5 | $ | 703.0 | |||||||
Goodwill amounts by reportable segment at September 30, 2017 are based on the allocation of the purchase consideration of the Business Combination as of the Closing Date and the preliminary allocation of the purchase consideration of the Ultra Chem Acquisition as of the Ultra Chem Closing Date. Accordingly, the amounts allocated to goodwill from the Ultra Chem Acquisition are subject to adjustments to reflect the completion of the purchase price allocation, which will be completed within twelve months of the Ultra Chem Closing Date and could have a material impact on total goodwill and goodwill for the Chemicals reportable segment. See Note 3.
Goodwill Impairment Test
Goodwill is tested for impairment annually as of March 31 and whenever events or circumstances make it more likely than not that an impairment may have occurred. Goodwill is reviewed for impairment at the reporting unit level, or operating segment, for the Company. For purposes of the impairment testing of the Company's recognized goodwill, fair value measurements are determined using the income approach, based largely on inputs that are not observable to active markets, which would be deemed Level 3 fair value measurements as defined in Note 9. These inputs include management’s expectations about future revenue growth and profitability, working capital needs and capital expenditures. Inputs also include estimates of a market participant’s expectations for 1) a discount rate at which the cash flows should be discounted in order to determine the fair value of such expected cash flows, and 2) an estimated income tax rate. The Company also considers a market approach using the comparable company method to verify if is comparable to the income approach.
91
As of the Company’s annual impairment test performed as of March 31, 2017, the fair values of the Company’s reporting units were determined to exceed their respective carrying amount by more than 20%, with the exception of the Plastics line of business, for which the fair value of the reporting unit exceeded its carrying value by approximately 2%. In consideration of these thresholds and of circumstances occurring after March 31, 2017, including a recent decline in the Company’s stock price, the Company performed an additional goodwill impairment analysis as of September 30, 2017. The result of this analysis indicates the fair values of the Company's reporting units exceed their respective carrying amounts by more than 20%. The increase in the excess of fair value of the reporting units carrying amounts compared to the previous test was associated with various factors, including a slightly lower discount rate driven by certain market inputs, which increased the fair value of the reporting units, and lower leverage and working capital levels which reduced the carrying value of the reporting units as of September 30, 2017. In both tests, the Company also considered a market approach using the comparable company method, which resulted in a fair value estimate of each reporting unit that was comparable to the income approach. The Company’s valuations based on the income approach are considered to be an appropriate valuation methodology for the annual goodwill impairment test. The Company concluded that goodwill was not impaired as of March 31 2017 and September 30, 2017.
The evaluation of goodwill requires the use of estimates about future operating results of each reporting unit to determine its estimated fair value. Changes in forecasted operations can materially affect these estimates, which could materially affect the Company’s results of operations. The estimate of fair value requires significant judgment and is based on management’s fair value estimates on assumptions that are believed to be reasonable; but that are unpredictable and inherently uncertain, including: estimates of future growth rates, operating margins and assumptions about the overall economic climate as well as the competitive environment for the reporting units. There can be no assurance that these estimates and assumptions made for purposes of the goodwill testing as of the time of testing will prove to be accurate. If assumptions regarding business plans, competitive environments or anticipated growth rates are not correct, the Company may be required to record goodwill impairment charges in future periods, whether in connection with future annual impairment testing, or earlier, if an indicator of an impairment is present prior to the next annual evaluation.
Other Intangible Assets
Definite-lived intangible assets at September 30, 2017 and September 30, 2016 consisted of the following:
September 30, 2017 | September 30, 2016 | |||||||||||||||||||||||
Gross Carrying Amount | Accumulated Amortization | Net Carrying Amount | Gross Carrying Amount | Accumulated Amortization | Net Carrying Amount | |||||||||||||||||||
Customer-related | $ | 234.6 | $ | (23.7 | ) | $ | 210.9 | $ | 200.3 | $ | (5.2 | ) | $ | 195.1 | ||||||||||
Supplier-related | 1.5 | (0.1 | ) | 1.4 | — | — | — | |||||||||||||||||
Trade name | 22.3 | (7.0 | ) | 15.3 | 21.0 | (1.7 | ) | 19.3 | ||||||||||||||||
Below-market leases | 0.7 | (0.3 | ) | 0.4 | 0.7 | (0.1 | ) | 0.6 | ||||||||||||||||
Non-compete agreements | 4.2 | (0.7 | ) | 3.5 | — | — | — | |||||||||||||||||
Total | $ | 263.3 | $ | (31.8 | ) | $ | 231.5 | $ | 222.0 | $ | (7.0 | ) | $ | 215.0 | ||||||||||
Amortization expense recognized on the intangible assets described above was as follows:
Successor | Predecessor | |||||||||||||||
Fiscal Year Ended September 30, 2017 | Fiscal Year Ended September 30, 2016* | October 1, 2015 Through June 8, 2016 | Fiscal Year Ended September 30, 2015 | |||||||||||||
Amortization expense | $ | 24.9 | $ | 7.0 | $ | 10.6 | $ | 15.8 | ||||||||
*The fiscal year ended September 30, 2016 includes 114 days of the acquired business’ operating activities as a result of the consummation of the Business Combination on June 9, 2016.
92
Expected amortization expense for the next five years is as follows:
2018 | $ | 27.5 | |
2019 | 27.3 | ||
2020 | 24.9 | ||
2021 | 20.6 | ||
2022 | 20.4 | ||
7. Debt
Short-term borrowings outstanding and the current portion of long-term debt and capital lease obligations at September 30, 2017 and 2016 are summarized below:
September 30, 2017 | September 30, 2016 | ||||||
Short-term borrowings | $ | 40.8 | $ | 38.4 | |||
Current portion of long-term debt and capital lease obligations | 10.3 | 9.3 | |||||
Total short-term borrowings and current portion of long term debt and capital lease obligations, net | $ | 51.1 | $ | 47.7 | |||
Long-term debt outstanding at September 30, 2017 and 2016 is summarized below:
September 30, 2017 | September 30, 2016 | ||||||
ABL Facility | $ | 139.3 | $ | 117.7 | |||
Term Loan Facility | 646.9 | 653.4 | |||||
Capital lease obligations (1) | 37.5 | 24.8 | |||||
Total long-term debt | 823.7 | 795.9 | |||||
Less: unamortized debt discount (2) | (2.7 | ) | (3.2 | ) | |||
Less: debt issuance costs (3) | (16.7 | ) | (17.8 | ) | |||
Less: current portion of long-term debt and capital lease obligations | (10.3 | ) | (9.3 | ) | |||
Long-term debt and capital lease obligations, less current portion, net | $ | 794.0 | $ | 765.6 | |||
(1) | Capital lease obligations exclude executory costs and interest payments associated with the underlying leases. See “Capital Lease Obligations” below. |
(2) | The unamortized debt discount is related to the Term Loan Facility and amortized to interest expense over the life of the instrument using the effective interest rate method. |
(3) | See discussion below under Term Loan Facility and Debt Issuance Cost Amortization. |
93
Short-Term Borrowings
The Company's short-term borrowings are associated with the Company's operations in China and are summarized below:
Facility Limit | Outstanding Borrowings Balance | Weighted Average Interest Rate on Borrowings | Outstanding LOC and Bankers' Acceptance Bills | Remaining Availability | |||||||||||||||
September 30, 2017 | |||||||||||||||||||
Bank of America - China (1) | $ | 24.3 | $ | 23.8 | 4.3 | % | $ | — | $ | 0.5 | |||||||||
Bank of Communications - China (2) | 22.5 | 17.0 | 5.3 | % | 5.3 | 0.2 | |||||||||||||
Total | $ | 46.8 | $ | 40.8 | $ | 5.3 | $ | 0.7 | |||||||||||
September 30, 2016 | |||||||||||||||||||
Bank of America - China (1) | $ | 28.4 | $ | 27.3 | 4.0 | % | $ | — | $ | 1.1 | |||||||||
Bank of Communications - China (2) | 22.5 | 11.1 | 5.2 | % | 10.5 | 0.9 | |||||||||||||
Total | $ | 50.9 | $ | 38.4 | $ | 10.5 | $ | 2.0 | |||||||||||
(1) | The borrowing limit of this facility is denominated in USD. This line of credit is secured by a standby letter of credit drawn on the ABL Facility covering at least 110% of the facility's borrowing limit amount. Borrowings under the line of credit are payable in full within 12 months of the date of the advance. |
(2) | The borrowing limit of this facility is denominated in RMB. This line of credit is secured by a standby letter of credit drawn on the ABL Facility covering at least 100% of the facility's borrowing limit amount. Borrowings under the line of credit are payable in full within 12 months of the date of the advance. |
Long-Term Debt
ABL Facility
The ABL Facility provides for committed revolving credit financing including a U.S. Tranche of up to $505.0 million, a Canadian Tranche of up to the USD equivalent of $40.0 million, and a FILO Tranche up to $30.0 million. The ABL Facility matures on June 9, 2021. Provided no default or event of default, the ABL Borrowers have the option to request that the ABL Facility be increased by an aggregate amount, when included with any incremental borrowings issued under the Term Loan Facility, not to exceed $175.0 million.
The ABL Facility includes a letter of credit sub-facility, which permits up to $200.0 million of letters of credit under the U.S. Tranche (which may be denominated in USD, Euros or other currencies approved by the administrative agent and the issuing bank) and up to the USD equivalent of $10.0 million of letters of credit under the Canadian Tranche (which may be denominated in CAD only). The ABL Facility also contains a FILO Tranche which can be used by any non-Canadian foreign subsidiary for loans or letters of credit up to an aggregate amount not to exceed $30.0 million.
The amount of available credit changes every month, depending on the amount of eligible receivables and inventory the ABL Borrowers have available to serve as collateral. In general, the facility is limited to the lesser of (i) the aggregate commitment or (ii) the sum of (a) 90.0% of eligible accounts receivable, as defined therein, and (b) 85.0% of the orderly liquidation value of the eligible inventory and (c) 100.0% of cash and cash equivalents held in blocked accounts, as defined, maintained by the ABL Agent, for each ABL Borrower. Available credit for the U.S. and Canadian Tranches are calculated separately, and the borrowing base components are subject to customary reserves and eligibility criteria.
94
Borrowings under the U.S. Tranche and the Canadian Tranche of the ABL Facility bear interest, at the ABL Borrowers’ option, at either an alternate base rate or Canadian prime rate, as applicable, plus an applicable margin (ranging from 0.25% to 0.75% pursuant to a grid based on average excess availability) or LIBOR or Canadian BA rate (as defined therein), as applicable, plus an applicable margin (ranging from 1.25% to 1.75% pursuant to a grid based on average excess availability). Loans under the FILO Tranche, within the ABL Facility, bear interest at an alternate base rate plus an applicable margin (ranging from 1.00% to 1.50% pursuant to a grid based on average excess availability) or LIBOR plus an applicable margin (ranging from 2.00% to 2.50% pursuant to a grid based on average excess availability). In addition to paying interest on outstanding principal amounts under the ABL Facility, the ABL Borrowers are required to pay a commitment fee in respect of the unutilized commitments, which commitment fee is 0.250% or 0.375% per annum and is determined based on average utilization of the ABL Facility (increasing when utilization is low and decreasing when utilization is high). The ABL Borrowers are required to pay customary letters of credit fees.
The ABL Facility requires that if the sum of (i) excess availability, as defined (for the ABL Borrowers) and (ii) the amount by which the then-current borrowing base exceeds the aggregate commitments under the ABL Facility (for the ABL Borrowers) is less than the greater of (a) $40.25 million and (b) 10.0% of the Line Cap (as defined in the ABL Facility), the ABL Borrowers shall comply with a minimum fixed charge coverage ratio of at least 1.0 to 1.0. In addition, the ABL Facility contains negative covenants that restrict Holdings and its subsidiaries, including the ABL Borrowers from, among other things, incurring additional debt, granting liens, entering into guarantees, entering into certain mergers, making certain loans and investments, disposing of assets, prepaying certain debt, declaring dividends, modifying certain material agreements or changing the business it conducts.
The ABL Facility also contains certain customary representations and warranties, affirmative covenants and events of default, including, among other things, payment defaults, breach of representations and warranties, covenant defaults, cross-defaults and cross-acceleration to certain indebtedness, certain events of bankruptcy, certain events under the Employee Retirement Income Security Act of 1974, as amended from time to time, material judgments, actual or asserted failure of any guaranty or security document supporting the ABL Facility to be in full force and effect, and change of control. If such an event of default occurs, the lenders under the ABL Facility are entitled to take various actions, including the acceleration of amounts due under the ABL Facility and all actions permitted to be taken by a secured creditor.
The weighted average interest rate on borrowings under the ABL Facility was 2.87% at September 30, 2017. Solutions had the USD equivalent of $71.3 million in outstanding letters of credit under the ABL Facility at September 30, 2017. The collective credit availability under the U.S. and Canadian Tranches of the ABL Facility was the U.S. equivalent of $277.8 million at September 30, 2017. There was $5.0 million availability under the FILO Tranche at September 30, 2017.
Obligations under the ABL Facility are secured by a first priority lien on all ABL Facility first lien collateral, including eligible inventory and accounts receivable of the ABL Borrowers, and a second priority lien on all Term Loan Facility first lien collateral including outstanding equity interests of the Borrower and certain of the other subsidiaries of Holdings, in each case, subject to certain limitations; provided, that no ABL Facility first lien collateral or Term Loan Facility first lien collateral owned by the Canadian Borrower secure the obligations owing under the U.S. tranche of the ABL Facility. These accounts receivable and inventory totaled $667.2 million in the aggregate as of September 30, 2017.
Fees paid to the lenders during the fiscal year ended September 30, 2016 in connection with the ABL Facility totaled $6.8 million and were recorded as debt issuance costs in Other non-current assets on the consolidated balance sheet to be amortized as interest expense over the remaining term of the ABL Facility. See Note 4.
As of September 30, 2017, the ABL Borrowers were in compliance with the covenants of the ABL Facility.
95
Term Loan Facility
The Term Loan Facility provides secured debt financing in an aggregate principal amount of up to $655.0 million and the right, at Solutions’ option, to request additional tranches of term loans in an aggregate principal amount, when included with any incremental borrowings issued under the ABL Facility, of up to $175.0 million, plus unlimited additional amounts such that the aggregate principal amount of indebtedness outstanding at the time of incurrence does not cause the Secured Net Leverage Ratio, as defined therein and calculated on a pro forma basis, to exceed 4.1 to 1.0. Availability of such additional tranches of term loans is subject to the absence of any default and, among other things, the receipt of commitments by existing or additional financial institutions. Borrowings under the Term Loan Facility bear interest at the borrower’s option at either (i) the LIBOR rate determined by reference to the costs of funds for USD deposits for the interest period relevant to such borrowing adjusted for certain additional costs, which shall be no less than 1.0%, plus an applicable margin of 4.25% or (ii) a base rate determined by reference to the highest of (a) the prime commercial lending rate published by Bank of America, N.A. as its "prime rate," (b) the federal funds effective rate plus 0.50% and (c) a one-month LIBOR rate plus 1.0%, plus an applicable margin of 3.25%. Commencing with the quarter ended September 30, 2016, Solutions is required to make scheduled quarterly payments in an aggregate annual amount equal to 1.0% of the aggregate principal amount of the initial term loans made on the Closing Date of the Mergers, with the balance due at maturity. The Term Loan Facility matures on June 9, 2023. The interest rate for the Term Loan Facility was 5.02% at September 30, 2017. The Company amortized $0.5 million of debt discount to interest expense during the fiscal year ended September 30, 2017.
On March 22, 2017, the Company completed TLB Amendment No. 1 amending the Term Loan Facility. TLB Amendment No. 1 reduced the interest rate margin applicable to outstanding term loans by 50 basis points from 4.25% to 3.75% for LIBOR loans and from 3.25% to 2.75% for base rate loans. In addition, the 1% LIBOR floor was eliminated. TLB Amendment No.1 provides a prepayment premium equal to 1% of the amount of the term loan applicable to certain repricing transactions occurring on or prior to six months from the effective date of TLB Amendment No. 1.
Additionally, the Term Loan Facility requires Solutions to make mandatory principal payments on an annual basis, commencing with the fiscal year ending September 30, 2017, if cash flows for the year, as defined in the Term Loan Facility, exceed certain levels specified in the Term Loan Facility. The Company was not required to make such mandatory principal payment for the fiscal year ended September 30, 2017. Solutions generally has the right to prepay loans in whole or in-part, without incurring any penalties for early payment.
The Term Loan Facility contains a number of covenants that, among other things and subject to certain exceptions, restrict Holdings’ ability and the ability of its subsidiaries to incur additional indebtedness, pay dividends on its capital stock or redeem, repurchase or retire its capital stock or other indebtedness, make investments, loans and acquisitions, create restrictions on the payment of dividends or other amounts to the Company from its restricted subsidiaries, engage in transactions with its affiliates, sell assets, including capital stock of its subsidiaries, alter the business it conducts, consolidate or merge, incur liens. The Term Loan Facility does not require Solutions to comply with any financial maintenance covenants and contains certain customary representations and warranties, affirmative covenants and provisions relating to events of default.
Obligations under the Term Loan Facility are secured by a first priority lien on all Term Loan Facility first lien collateral, including outstanding equity interests of the Borrower and certain of the other subsidiaries of Holdings, and a second priority lien on all ABL Facility first lien collateral, including accounts receivable and inventory of the loan parties under the Term Loan Facility, subject to certain limitations.
Fees paid to the lenders during the fiscal year ended September 30, 2016 in connection with the Term Loan Facility totaled $18.5 million and were recorded as a reduction of the debt balance to be amortized as interest expense over the remaining term of the Term Loan Facility.
As of September 30, 2017, Solutions was in compliance with the covenants of the Term Loan Facility.
Debt Issuance Cost Amortization
Amortization expense included in interest expense related to debt issuance costs of the Term Loan Facility was $2.4 million and $0.7 million for the fiscal years ended September 30, 2017 and 2016, respectively. As a result of TLB Amendment No. 1, the Company incurred debt issuance costs of $1.3 million during the fiscal year ended September 30, 2017, which will be amortized throughout the remaining life of the Term Loan Facility.
Amortization expense included in interest expense related to debt issuance costs was $3.6 million for the period from October 1, 2015 through June 8, 2016 and $4.1 million for the fiscal year ended September 30, 2015 for the Predecessor.
96
Capital Lease Obligations
The capital lease obligation balance of $37.5 million as of September 30, 2017 is primarily associated with the Ryder Lease and the Montgomery Lease. The Ryder Lease obligation excludes decreasing annual interest payments ranging from $1.0 million to less than $0.1 million, for aggregate interest payments totaling $3.7 million. The Montgomery Lease obligation excludes decreasing annual interest payments ranging from $1.0 million to $0.1 million, for aggregate interest payments of $13.6 million. See Note 5.
Debt Obligations
The following table sets forth future principal payments on debt and capital lease obligations at September 30, 2017:
2018 | $ | 51.1 | |
2019 | 9.6 | ||
2020 | 9.6 | ||
2021 | 148.7 | ||
2022 | 13.2 | ||
Thereafter | 632.3 | ||
Total | $ | 864.5 | |
8. Derivatives
During the three months ended March 31, 2017, the Company entered into four interest rate swap agreements with a combined notional amount of $300.0 million to help mitigate interest rate risk related to the variable-rate Term Loan Facility. The swap agreements expire at various dates from February 2020 through March 2022 and are accounted for as cash flow hedges. Gains or losses resulting from changes in the fair value of the swaps are recorded in other comprehensive income to the extent that the swaps are effective as hedges. Gains and losses resulting from changes in the fair value applicable to the ineffective portion, if any, are reflected in income. Gains and losses recorded in other comprehensive income are reclassified into and recognized in income when the interest expense on the Term Loan Facility is recognized.
On June 29, 2017, the Company removed the interest rate floor component of the interest-rate swaps to align the swaps with the Term Loan Facility terms after the modification of the Term Loan Facility in March 2017 with TLB Amendment No. 1. In connection with the modification of the swaps’ terms, the Company received cash proceeds of $0.5 million. During the fiscal year ended September 30, 2017, the Company recognized approximately $0.6 million of interest expense related to ineffectiveness of the interest-rate swaps prior to June 29, 2017. The interest rate swaps continue to be accounted for as cash flow hedges and there was no material ineffectiveness related to the swaps after the modification of the terms described above.
Derivative assets and liabilities at September 30, 2017 and September 30, 2016 consisted of the following:
Recorded to | September 30, 2017 | September 30, 2016 | |||||||
Long-term derivative asset | Other non-current assets | $ | 0.3 | $ | — | ||||
Short-term derivative liability | Accrued expenses and other liabilities | $ | 1.1 | $ | — | ||||
Long-term derivative liability | Other non-current liabilities | $ | 0.2 | $ | — | ||||
Other Comprehensive Income(1) | Accumulated other comprehensive income | $ | — | $ | — | ||||
(1) Other Comprehensive Income for the fiscal year ended September 30, 2017 was less than $0.1 million
Prior to the Business Combination, the Predecessor was a party to interest rate swap agreements of varying expiration dates through March 2017, to mitigate the exposure to interest rate risk related to the variable-rate Predecessor Term Loan Facility. As a result of the Business Combination, the Predecessor Term Loan Facility was extinguished, the related swap agreements were terminated and an early termination payment penalty of $0.3 million was paid and recorded in Transaction related costs in the consolidated statement of operations.
97
Gains and losses (net of reclassifications into income, including any ineffective portion) related to the interest rate swaps of the Company and the Predecessor were as follows:
Successor | Predecessor | ||||||||||||
Recorded to | Fiscal Year Ended September 30, 2017 | October 1, 2015 through June 8, 2016 | Fiscal Year Ended September 30, 2015 | ||||||||||
Realized loss | Interest expense | $ | 2.0 | $ | 0.3 | $ | 0.6 | ||||||
Unrealized gain, net of tax | Other comprehensive income | $ | — | $ | 0.3 | $ | 0.2 | ||||||
Unrealized losses related to the interest-rate swaps for the fiscal year ended September 30, 2017 were net of a tax benefit impact of less than $0.1 million. There was no material tax impact for the Predecessor periods presented. At September 30, 2017, $0.9 million in unrealized losses were expected to be realized and recognized in income within the next twelve months.
See Note 9 for additional information on the fair value of the Company and Predecessor’s derivative instruments.
9. Fair Value Measurements
The accounting standard for fair value measurements establishes a framework for measuring fair value that is based on the inputs market participants use to determine the fair value of an asset or liability and establishes a fair value hierarchy to prioritize those inputs. The fair value hierarchy is as follows:
• | Level 1—Unadjusted quoted prices in active markets that are accessible at the measurement date for identical, unrestricted assets or liabilities. |
• | Level 2—Quoted prices in markets that are not active or inputs which are observable, either directly or indirectly, for substantially the full term of the asset or liability. |
• | Level 3—Prices or valuation models that require inputs that are both significant to the fair value measurement and less observable for objective sources (i.e., supported by little or no market activity). |
The fair value hierarchy requires an entity to maximize the use of observable inputs and minimize the use of unobservable inputs when measuring fair value. Observable inputs are obtained from independent sources and can be validated by a third party, whereas unobservable inputs reflect assumptions a third party would use in pricing an asset or liability based on the best information available under the circumstances. A financial instrument’s categorization within the fair value hierarchy is based upon the lowest level of input that is significant to the fair value measurement. The Company’s assessment of the significance of a particular input to the fair value measurement requires judgment, which may affect the valuation of the assets and liabilities and their placement within the fair value hierarchy levels. The Company considers active markets as those in which transactions for the assets or liabilities occur in sufficient frequency and volume to provide pricing information on an ongoing basis.
Fair value of financial instruments
The carrying values of cash and cash equivalents, accounts and notes receivable, accounts payable and short-term borrowings approximate fair value due to the short-term maturity of those instruments.
The carrying values of borrowings outstanding under the Credit Facilities approximate fair value at September 30, 2017 and 2016 primarily due to their variable interest rate. The estimated fair value of these instruments is classified by the Company as a Level 3 measurement within the fair value hierarchy due to the varying interest rate parameters as outlined in the respective loan agreements.
98
Assets and Liabilities Measured at Fair Value on a Non-recurring Basis
In addition to the financial instruments that are recorded at fair value on a recurring basis, the Company records assets and liabilities at fair value on a non-recurring basis as required by U.S. GAAP. Generally, assets are recorded at fair value on a non-recurring basis as a result of impairment charges or as part of a business combination. As discussed in Note 3, during the fiscal year ended September 30, 2017, the Company recorded non-recurring fair value measurements related to the Ultra Chem Acquisition and its asset acquisitions. In addition, in the fiscal year ended September 30, 2016, the Company recorded non-recurring fair value measurements related to the Business Combination. These fair value measurements were classified as Level 3 within the fair value hierarchy.
Assets and Liabilities Measured at Fair Value on a Recurring Basis
Contingent Consideration
The fair value of the contingent consideration related to the Deferred Cash Consideration as discussed in Note 3 was $35.1 million and $35.0 million as of September 30, 2017 and 2016, respectively. The measurement of the contingent consideration related to the Deferred Cash Consideration is classified by the Company as a Level 3 measurement within the fair value hierarchy. In order to estimate the fair value of the Deferred Cash Consideration, the Company estimates the value of the Excess Shares using a Monte Carlo simulation model with the market price of the Company’s common stock at each valuation date being a significant input to this model. Unobservable inputs to the valuation are the expected volatility during the applicable period as well as a marketability discount to reflect the illiquidity of the Excess Shares given their terms. An increase in the market price of the Company’s common stock has the same directional effect on the value of the liability related to the Deferred Cash Consideration. An increase in the volatility and marketability discount will lower the value of the liability related to the Deferred Cash Consideration.
The fair value of the liability for the contingent consideration related to the TRA as discussed in Note 3 was $105.1 million and $83.4 million as of September 30, 2017 and 2016, respectively. As of September 30, 2017, $12.5 million was classified in Current Liabilities in the consolidated balance sheets. The liability for the contingent consideration related to the TRA is classified by the Company as a Level 3 measurement within the fair value hierarchy. The Company estimates the fair value of the liability for the contingent consideration related to the TRA based on a discounted cash flow model which incorporates assumptions of projected taxable income, projected income tax liabilities and an estimate of tax benefits expected to be realized as a result of the Business Combination. Key inputs to the valuation are prevailing tax rates and market interest rates impacting the discount rate. A 100 basis point increase in the discount rate compared to the discount rate used at the September 30, 2017 valuation would have resulted in a decrease of approximately $0.9 million in the value of the liability for the contingent consideration related to the TRA. Additionally, this cash flow model is sensitive to changes in prevailing tax rates. A 100 basis point decrease in the tax rate compared to the tax rate used at the September 30, 2017 valuation would have resulted in a decrease of approximately $2.9 million in the value of the liability for the contingent consideration related to the TRA.
During the fiscal year ended September 30, 2017, the Company recorded a $5.6 million measurement period adjustment to the estimated fair value of the TRA liability as of the Closing Date, related to the assessments of the tax attributes associated with certain entities.
Changes in the fair value of the contingent consideration obligations for the fiscal years ended September 30, 2017 and 2016 were as follows:
TRA | Deferred Cash Consideration | Total Fair Value | ||||||||||
Contingent consideration as of September 30, 2015 | $ | — | $ | — | $ | — | ||||||
Acquisition date contingent consideration fair value | 84.2 | 45.4 | 129.6 | |||||||||
Change in fair value of contingent consideration(1) | (0.8 | ) | (10.4 | ) | (11.2 | ) | ||||||
Contingent consideration as of September 30, 2016 | $ | 83.4 | $ | 35.0 | $ | 118.4 | ||||||
Measurement period adjustment | 5.6 | — | 5.6 | |||||||||
Change in fair value of contingent consideration(1) | 16.1 | 0.1 | 16.2 | |||||||||
Contingent consideration as of September 30, 2017 | $ | 105.1 | $ | 35.1 | $ | 140.2 | ||||||
(1) Included in Operating income in the consolidated statements of operations.
99
Significant changes in the estimates and inputs used in determining the fair value of the contingent consideration could have a material impact on the amounts recognized as a component of Operating income (loss) in future periods.
Interest Rate Swaps
The Company classifies interest rate swaps within Level 2. During the three months ended March 31, 2017, the Company entered into four interest rate swap agreements to help mitigate interest rate risk related to the variable-rate Term Loan Facility. On June 29, 2017, the Company removed the interest rate floor component of the interest-rate swaps to align the swaps with the Term Loan Facility terms after the modification of the Term Loan Facility in March 2017 with TLB Amendment No. 1. The agreements expire at various dates through March 2022. At September 30, 2017, the Company recorded $0.3 million in Other non-current assets, $1.1 million in Accrued expenses and other liabilities and $0.2 million in Other non-current liabilities in the consolidated balance sheet related to these instruments.
Prior to the Business Combination, the Predecessor was a party to interest rate swap agreements of varying expiration dates through March 2017 to mitigate the exposure to interest rate risk related to the variable-rate Predecessor Term Loan Facility. As a result of the Business Combination, the Predecessor Term Loan Facility was extinguished, the related swap agreements were terminated and an early termination payment of $0.3 million was made and recorded during the Predecessor period of October 1, 2015 through June 8, 2016 in Transaction related costs in the consolidated statement of operations.
During the fiscal years ended September 30, 2017 and 2016, the Company did not have any transfers between Level 1, Level 2 or Level 3 fair value measurements.
10. Share-Based Compensation and Employee Benefit Plans
On June 8, 2016, the Company’s stockholders approved the 2016 LTIP, with an effective date of March 30, 2016, covering approximately a ten-year period. No awards may be granted under the 2016 LTIP after March 20, 2026. The 2016 LTIP permits the grant of up to 9,000,000 shares of the Company's common stock for various types of awards to employees, directors and consultants of the Company or its subsidiaries, including incentive and non-incentive stock options, stock appreciation rights, restricted stock, restricted stock units, dividend equivalents, stock awards, conversion awards and performance awards.
Vesting conditions of awards under the 2016 LTIP are determined by the Compensation Committee of the Board of Directors of the Company, including treatment upon the occurrence of a change of control of the Company. Upon a change of control, the Compensation Committee has the discretion to remove forfeiture restrictions, accelerate vesting, require recipients of awards to surrender the awards for cash consideration, cancel unvested awards without payment of consideration, cause any surviving entity to assume and continue any outstanding awards, or make other such adjustments as the Compensation Committee deems appropriate to reflect such change of control.
If any change is made to the Company’s capitalization, appropriate adjustments will be made by the Compensation Committee as to the number and price of shares awarded under the 2016 LTIP, the securities covered by such awards, the aggregate number of shares of common stock of the Company available for the issuance of awards under the 2016 LTIP and the maximum annual per person compensation limits on share-based awards under the 2016 LTIP.
Other than in connection with a change in capitalization or other transaction where an adjustment is permitted or required under the terms of the 2016 LTIP, the Compensation Committee is prohibited from making any adjustment or approving any amendment that reduces or would have the effect of reducing the exercise price of a stock option or stock appreciation right previously granted under the 2016 LTIP unless the Company’s stockholders have approved such adjustment or amendment.
In each calendar year during any part of which the 2016 LTIP is in effect, an employee may not receive awards under the plan in excess of 1,000,000 shares of common stock, or a value of greater than $12.0 million if an award is to be paid in cash or if settlement is not based on shares of common stock, in each case, multiplied by the number of full or partial calendar years in any performance period established with respect to an award, if applicable. A non-employee member of the Board may not be granted awards with a cumulative value of greater than $1.0 million during any calendar year for services rendered in their capacity as a director. This limit does not apply to grants made to a non-employee director for other reasons not related to their services as a director.
100
During the fiscal years ended September 30, 2017 and 2016, the Company granted 212,000 and 1,542,500 PSUs, respectively, to certain officers and employees. The performance aspect of the PSUs vest on June 30, 2019, entitling the recipient to receive a certain number of shares of the Company's common stock, based on the Company’s achievement of the performance goals included in the PSUs. Depending on the performance of common stock during the approximate three-year performance period, a recipient of the award is entitled to receive a number of shares of common stock equal to a percentage, ranging from 0% to 200%, of the initial award granted, with a 35% total stockholder return entitling the recipient to receive 100% of the award granted. If the Company’s total stockholder return for the performance period is negative, then the number of units ultimately awarded is based on the Company’s achievement of its cumulative Adjusted EBITDA target, as defined by the PSU agreement, during the performance period. If total stockholder return is between negative 15% and 0%, a recipient is entitled to receive a number of shares of common stock between 50% and 70% of the number of PSUs granted. If the cumulative Adjusted EBITDA target is not met, or the total stockholder return is less than negative 15%, no shares of the Company’s common stock will be issued. The Company used the Monte Carlo simulation model to estimate the fair value of the PSU awards at the grant date, considering the probability of satisfying the various performance criteria. The resulting grant date fair value is recognized as expense on a straight-line basis from the grant date through the end of the performance period. The assumptions used in the Monte Carlo simulation model for PSUs included an expected stock price volatility of 40% based on a peer group of similar companies, an expected dividend yield of 0%, an expected term of two to three years, and a risk-free interest rate of between 0.9% and 1.3%.
The following table summarizes PSU activity during the fiscal year ended September 30, 2017:
Units | Average Grant Date Fair Value Per Unit | |||||
Unvested PSUs at September 30, 2016 | 1,542,500 | $ | 9.12 | |||
Grants | 212,000 | 7.66 | ||||
Vested | — | — | ||||
Forfeited/Canceled | (230,500 | ) | 9.07 | |||
Unvested PSUs at September 30, 2017 | 1,524,000 | $ | 8.92 | |||
As of September 30, 2017, the Company may issue up to 3,048,000 shares of common stock related to the outstanding PSU awards described above under the 2016 LTIP. The PSU awards are accounted for as equity instruments, and the Company recognized compensation cost of $4.5 million and $1.3 million as a component of Selling, general and administrative expenses on the consolidated statements of operations for the fiscal years ended September 30, 2017 and 2016, respectively, related to the PSUs. As of September 30, 2017, the outstanding PSUs had a weighted-average remaining contract life of 1.7 years. As of September 30, 2017, there was $7.5 million of total unrecognized compensation cost related to non-vested PSUs.
During the fiscal years ended September 30, 2017 and 2016, the Company also granted 77,458 and 64,518 shares of restricted stock, respectively, to certain of the Company's non-employee directors under the 2016 LTIP. The restricted stock will vest on the anniversary of the grant date provided the director continues his services as a director of the Company. The fair value of the restricted stock was determined by the closing price of the Company's common stock on the date of grant.
The following table summarizes restricted stock activity during the fiscal year ended September 30, 2017:
Shares of Restricted Stock | Average Grant Date Fair Value Per Unit | |||||
Restricted stock at September 30, 2016 | 64,518 | $ | 9.27 | |||
Grants | 77,458 | 8.26 | ||||
Vested | (53,765 | ) | 9.27 | |||
Forfeited/Canceled | (10,753 | ) | 9.27 | |||
Restricted stock at September 30, 2017 | 77,458 | $ | 8.26 | |||
The restricted stock awards are accounted for as equity instruments, and the Company recognized compensation expense of $0.6 million and $0.1 million as a component of Selling, general and administrative expenses on the consolidated statements of operations for the fiscal years ended September 30, 2017 and 2016, respectively, related to the restricted stock. As of September 30, 2017, there was $0.5 million of total unrecognized compensation expense related to restricted stock, and a weighted average remaining life of 0.8 years.
101
During the fiscal year ended September 30, 2016, TPG Restricted Stock Grants were awarded with respect to 100,000 shares of Company common stock owned by TPG. These awards vest in equal amounts over a three-year period provided that the recipients of such grants continue their employment with the Company. During the fiscal year ended September 30, 2017, 33,333 shares of these awards vested and 9,576 shares were transferred to the Company (reflected as treasury stock) to satisfy the officers’ and employees’ tax withholding obligations in connection with the vesting. The Company recognized compensation cost of $0.3 million and $0.1 million as a component of Selling, general and administrative expenses on the consolidated statements of operations for the fiscal years ended September 30, 2017 and 2016, respectively, related to these awards. As of September 30, 2017, there was $0.4 million of total unrecognized compensation cost related to these awards, and a weighted average remaining life of 1.7 years. While these awards were not made pursuant to the 2016 LTIP, they constitute equity-based compensation and therefore will count against the 2016 LTIP's share reserve to the extent the awards vest.
During the fiscal year ended September 30, 2017, the Company granted certain employees a total of 28,000 RSUs that vest equally over a three-year period on the anniversary of the grant date provided the employee remains employed by the Company. Upon vesting, the recipients will receive a share of common stock in the Company for each RSU awarded. The fair value of these RSUs was determined based on the closing price of the Company’s stock on the grant date.
The following table summarizes RSU award activity during the fiscal year ended September 30, 2017:
RSUs | Average Grant Date Fair Value Per Unit | |||||
Unvested RSUs at September 30, 2016 | — | $ | — | |||
Grants | 28,000 | 7.28 | ||||
Vested | — | — | ||||
Forfeited/Canceled | (3,500 | ) | 7.28 | |||
Unvested RSUs at September 30, 2017 | 24,500 | $ | 7.28 | |||
The RSUs are accounted for as equity instruments, and the Company recognized compensation cost of $0.1 million as a component of Selling, general and administrative expenses on the consolidated statements of operations during the fiscal year ended September 30, 2017 related to the RSUs. As of September 30, 2017, there was $0.1 million of total unrecognized compensation cost related to the RSUs, and a weighted average remaining life of 2.1 years.
During the fiscal year ended September 30, 2017, the Company also awarded 10,500 phantom RSUs and 10,000 phantom PSUs to certain non-U.S. employees. The phantom RSUs vest equally over a three-year period on the anniversary of the grant date while the phantom PSUs vest under the same conditions as the PSU awards described above. During the fiscal year ended September 30, 2017, 3,500 of the phantom RSUs were forfeited and all of the phantom PSUs were forfeited. Upon vesting and provided the employee remains employed by the Company at that time, the awards will be settled in cash. In accordance with ASC 718, the remaining phantom RSU awards are accounted for as a liability, with the awards re-measured at the end of each reporting period based on the closing price of the Company’s common stock or using a Monte Carlo simulation model, as applicable. Compensation expense is recognized ratably on a straight-line basis over the requisite service period. An immaterial amount of compensation expense was recognized during the fiscal year ended September 30, 2017 related to these awards.
As of September 30, 2017, there were 7,274,042 shares of the Company’s common stock available for issuance under the 2016 LTIP.
Defined Contribution Plans
Qualifying employees of the Company are eligible to participate in the Solutions 401(k) Plan. The 401(k) Plan is a defined contribution plan which allows employees to make tax deferred contributions as well as company contributions, designed to assist employees of the Company and its affiliates in providing for their retirement. The Company matches 100% of employee contributions up to 4.0%. The Company makes an additional contribution to the 401(k) Plan of 1.5%, 3.0%, or 4.5%, based upon years of service of one to ten years, eleven to twenty years, and over twenty-one years of service, respectively. A version of the 401(k) Plan is also available for qualifying employees of the Company in its foreign subsidiaries.
102
The following summarizes contributions to the plans described above:
Successor | Predecessor | |||||||||||||||
Fiscal Year Ended September 30, 2017 | Fiscal Year Ended September 30, 2016* | October 1, 2015 through June 8, 2016 | Fiscal Year Ended September 30, 2015 | |||||||||||||
Contributions recorded as a component of cost of sales and operating expenses | $ | 4.0 | $ | 1.3 | $ | 2.7 | $ | 3.9 | ||||||||
Contributions recorded as a component of selling, general and administrative expenses | 6.4 | 2.2 | 4.5 | 6.8 | ||||||||||||
Total contributions | $ | 10.4 | $ | 3.5 | $ | 7.2 | $ | 10.7 | ||||||||
*The fiscal year ended September 30, 2016 includes 114 days of the acquired business’ operating activities as a result of the consummation of the Business Combination on June 9, 2016.
Predecessor Equity Plan
The Predecessor previously issued unregistered Series B units in Holdings to directors and certain officers and employees of the Predecessor. The units issued were initially unvested, and with respect to units issued to certain officers and employees, 50% of the Series B units would vest 20% annually over a five year period ("Time-Based Units") and 50% of the Series B units would vest in accordance with a performance-based schedule that was divided into five separate and equal twelve month periods ("Performance-Based Units"). The Board of Directors of the Predecessor established EBITDA-based performance targets for purposes of determining vesting of the Performance-Based Units. Further, all Performance-Based Units would automatically vest upon a liquidity event of the Predecessor, provided the award holder remained employed with the Predecessor or its subsidiaries through the date of the liquidity event.
Immediately prior to and in connection with the closing of the Business Combination, certain Series B units vested, including 368,136 units granted to directors of the Predecessor, and as a result, the Predecessor recognized $2.0 million of expense related to Performance-Based Units during the period from April 1, 2016 through June 8, 2016, which is included in Transaction related costs in the consolidated statement of operations. The Predecessor recognized an additional $0.7 million of compensation expense as a component of Selling, general and administrative expenses in the consolidated statement of operations related to the Time-Based Units during the period from October 1, 2015 through June 8, 2016.
The following table summarizes the Predecessor Equity Plan activity, including both vested and non-vested units, during the period from September 30, 2014 through June 8, 2016:
Units | Average Grant Date Fair Value Per Unit | |||||
Outstanding at September 30, 2014 | 33,098,768 | $ | 0.29 | |||
Granted | 5,747,856 | 0.23 | ||||
Forfeited/Canceled | (380,000 | ) | 0.29 | |||
Outstanding at September 30, 2015 | 38,466,624 | 0.28 | ||||
Granted | 1,028,571 | 0.16 | ||||
Forfeited/Canceled | (1,597,000 | ) | 0.25 | |||
Outstanding at June 8, 2016 | 37,898,195 | $ | 0.22 | |||
103
The following table summarizes the activity for the non-vested Predecessor Equity Plan units during the period from September 30, 2014 through June 8, 2016:
Units | Average Grant Date Fair Value Per Unit | |||||
Nonvested at September 30, 2014 | 21,520,715 | $ | 0.28 | |||
Granted | 5,747,856 | 0.23 | ||||
Vested | (3,809,946 | ) | 0.31 | |||
Forfeited | (342,000 | ) | 0.24 | |||
Nonvested at September 30, 2015 | 23,116,625 | 0.26 | ||||
Granted | 1,028,571 | 0.16 | ||||
Vested | (19,871,696 | ) | 0.16 | |||
Forfeited | (1,345,000 | ) | 0.23 | |||
Nonvested at June 8, 2016 | 2,928,500 | $ | 0.26 | |||
All outstanding Series B units of the Predecessor in existence as of the closing of the Business Combination were exchanged for equity interests of New Holdco, which received a portion of the consideration paid to the Selling Equityholders in the Company Merger in exchange for such Series B Units.
11. Equity
Common Stock
The authorized common stock of the Company consists of 300,000,000 shares. Holders of the Company’s common stock are entitled to one vote for each share of common stock. As of September 30, 2017, there were 89,353,641 shares of common stock issued and 89,344,065 shares of common stock outstanding and warrants to purchase 25,012,500 shares of common stock at a strike price of $11.50 per share. The Company has units outstanding which consist of one share of common stock and one warrant which are included in the totals above.
Prior to the completion of the Business Combination, the Company had 62,531,250 shares of common stock issued and outstanding, consisting of 50,025,000 shares originally sold as part of units issued in the Company’s IPO, consummated on June 11, 2014, and 12,506,250 shares of Founder Shares that were issued to the Sponsor prior to the IPO.
All of the 50,025,000 shares of common stock sold as part of the units in the IPO contained a redemption feature which allowed for the redemption of such shares. These redemption provisions generally required the Company to classify these shares outside of permanent equity, except for certain provisions related to ordinary liquidations involving the redemption and liquidation of all of the Company’s equity instruments that allowed the Company to classify a certain amount related to these shares as permanent equity at each reporting period. At March 31, 2016, 47,512,924 of the 50,025,000 public shares with a value of $475.2 million were classified outside of permanent equity at their redemption value.
104
On June 9, 2016, in connection with the completion of the Business Combination, 47,512,924 shares of common stock were reclassified into equity and 29,793,320 shares were redeemed at $10.02 per share. Additionally, the Company issued (i) 27,673,604 new shares of common stock at $10.00 per share to the Selling Equityholders as consideration, (ii) 23,492,306 new shares of common stock at a price of $10.00 per share in private placements with eligible purchasers, (iii) 3,078,578 new shares of common stock to settle the payment of an aggregate of $30.8 million in fees and disbursements outstanding and due to certain of WLRH’s advisors in connection with services and work performed by the advisors, including shares issued to pay the liability of $18.3 million for deferred underwriting fees due upon the completion of a Business Combination from the IPO and (iv) 2,240,000 new shares of common stock in exchange for 22,400,000 warrants to purchase shares of common stock privately placed to Sponsor at the time of the IPO. In connection with the completion of the Business Combination, the Sponsor (on behalf of the Company) transferred 30,000 original Founder Shares to the Company’s prior independent directors ("Director Founder Shares") in connection with services previously rendered to the Company and 3,554,240 Founder Shares with a fair value of $30.2 million to the Selling Equityholders. The fair value of the Founder Shares transferred to the Company’s prior independent directors was recorded as an equity contribution and a transaction related cost in the third quarter of fiscal year 2016. The fair value of the Founder Shares transferred to the directors and the Selling Equityholders was estimated using a Monte Carlo simulation model. The 3,554,240 of Founder Shares that were transferred to the Selling Equityholders was a component of the Business Combination purchase consideration and was recorded by the Company as an equity contribution and included in the purchase consideration. See Note 3.
In connection with the consummation of the Business Combination, the Founder Shares, other than the Director Founder Shares, became subject to forfeiture on the tenth anniversary of the Closing Date unless:
•with respect to 50% of such Founder Shares, the last sale price of the Company’s common stock as quoted on NASDAQ equals or exceeds $12.50 per share (as adjusted for stock splits, dividends, reorganizations, recapitalizations and the like) for any 20 trading days within any 30 trading day period; and
•with respect to the remaining 50% of such Founder Shares, the last sale price of the Company’s common stock equals or exceeds $15.00 per share (as adjusted for stock splits, dividends, reorganizations, recapitalizations and the like) for any 20 trading days within any 30 trading day period; or
•the post-combination company completes a liquidation, merger, stock exchange or other similar transaction that results in all or substantially all of its stockholders having the right to exchange their shares of common stock for consideration in cash, securities or other property or any transaction involving a consolidation, merger, proxy contest, tender offer or similar transaction in which the post-combination company is the surviving entity which results in a change in the majority of the Company’s board of directors or management team or the Company’s post-combination stockholders immediately prior to such transaction ceasing to own a majority of the surviving entity immediately after such transaction.
The Founder Shares will not participate in dividends or other distributions with respect to the shares prior to these targets being met, whereupon the Founder Shares shall be entitled to all dividends and distributions paid on the common stock after the Business Combination as if they had been holders of record entitled to receive distributions on the applicable record date.
Warrants
As of September 30, 2017 there were 50,025,000 warrants outstanding to purchase 25,012,500 shares of common stock at an exercise price of $11.50 per share.
Preferred Stock
The authorized preferred stock of the Company consists of 1,000,000 shares. As of September 30, 2017, there were no shares of preferred stock issued and outstanding.
The Company’s second amended and restated certificate of incorporation provides that shares of preferred stock may be issued from time to time in one or more series. The Board is authorized to fix the voting rights, if any, designations, powers, preferences, the relative, participating, optional or other special rights and any qualifications, limitations and restrictions thereof, applicable to the shares of each series. The Board is able, without stockholder approval, to issue preferred stock with voting and other rights that could adversely affect the voting power and other rights of the holders of the Company's common stock and could have anti-takeover effects. The ability of the Board to issue preferred stock without stockholder approval could have the effect of delaying, deferring or preventing a change of control of the Company.
105
Treasury Stock
During the fiscal year ended September 30, 2017, in connection with the vesting of one third of the TPG Restricted Stock Grants, 9,576 shares of common stock with an aggregate fair market value of $0.1 million were transferred to the Company to satisfy the officers’ and employees’ tax withholding obligations in connection with the vesting. Following the transfer, these shares were not canceled and are therefore classified as treasury stock.
12. Earnings Per Share
A reconciliation of the numerators and denominators of the basic and diluted per share computation follows.
Fiscal Year Ended September 30, 2017 | Fiscal Year Ended September 30, 2016* | |||||||
Basic: | ||||||||
Net income (loss) | $ | 14.4 | $ | (8.4 | ) | |||
Weighted average number of common shares outstanding during the period | 76,752,752 | 35,193,789 | ||||||
Net income (loss) per common share - basic | $ | 0.19 | $ | (0.24 | ) | |||
Diluted: | ||||||||
Net income (loss) | $ | 14.4 | $ | (8.4 | ) | |||
Denominator for diluted earnings per share: | ||||||||
Weighted average number of common shares attributable to the period | 76,752,752 | 35,193,789 | ||||||
Incremental common shares attributable to outstanding dilutive options and unvested restricted shares | 87,058 | — | ||||||
Denominator for diluted earnings per common share | 76,839,810 | 35,193,789 | ||||||
Net income (loss) per common share - diluted | $ | 0.19 | $ | (0.24 | ) | |||
*The fiscal year ended September 30, 2016 includes 114 days of the acquired business’ operating activities as a result of the consummation of the Business Combination on June 9, 2016.
Dilutive computations during the current period contain additional incremental common shares which are attributable to the outstanding unvested restricted stock awards issued to directors and restricted stock units awarded to employees. For the fiscal years ended September 30, 2017 and 2016, there were 12,476,250 Founder Shares excluded from the basic and diluted computations commencing on the Closing Date because such shares were subject to forfeiture, and PSU awards, which were not included in the computation of diluted shares outstanding because performance targets and/or market conditions were not yet met for these awards. Diluted shares outstanding also did not include 25,012,500 shares of common stock issuable on the exercise of 50,025,000 warrants because the warrants were out-of-the-money for the fiscal years ended September 30, 2017 and 2016. As of September 30, 2016, the shares of unvested restricted stock awards issued to directors were not included in the diluted share calculation as their impact on the Company's net loss would have been antidilutive. There were no restricted stock units outstanding as of September 30, 2016.
The calculation for weighted average number of common shares reflects shares outstanding over the reporting period based on the actual number of days the shares of common stock were outstanding. A large number of shares were issued in connection with the Business Combination on the Closing Date and the weighted average common shares outstanding only incorporates these shares from that date through September 30, 2016, or 114 days.
13. Commitments, Contingencies and Litigation
Operating Leases
The Company is a lessee of office buildings, transportation equipment, warehouses and storage facilities, other equipment, facilities and properties under operating lease agreements that expire at various dates. Rent expense (including rentals under short-term leases) was $25.0 million and $6.9 million for the fiscal years ended September 30, 2017 and 2016, respectively, and $17.1 million and $26.1 million for the period from October 1, 2015 through June 8, 2016 and for the fiscal year ended September 30, 2015, respectively, for the Predecessor.
106
Future minimum non-cancellable rental payments as of September 30, 2017 are as follows:
2018 | $ | 15.9 | |
2019 | 12.3 | ||
2020 | 8.4 | ||
2021 | 6.4 | ||
2022 | 4.9 | ||
Thereafter | 3.0 | ||
Total | $ | 50.9 | |
Capital Leases
The Company leases certain equipment and facilities under capital lease agreements. As of September 30, 2017 future minimum lease payments under capital leases were as follows:
2018 | $ | 8.3 | |
2019 | 7.4 | ||
2020 | 7.4 | ||
2021 | 6.9 | ||
2022 | 10.5 | ||
Thereafter | 32.0 | ||
Total minimum capital lease payments | 72.5 | ||
Less amount representing executory costs | (17.4 | ) | |
Less amount representing interest | (17.6 | ) | |
Present value of net minimum capital lease payments | $ | 37.5 | |
Environmental Remediation
Due to the nature of its business, the Company is subject to various laws and regulations pertaining to the environment and to the sale, handling, transportation and disposal of chemicals and hazardous materials. These laws pertain to air and water, the management of solid and hazardous wastes, transportation and human health and safety.
107
On March 31, 2011, the Predecessor purchased certain assets of the global distribution business (the "Distribution Business") from Ashland (the "Ashland Distribution Acquisition"), evidenced by the ADA Purchase Agreement. In the ADA Purchase Agreement, Ashland agreed to retain all known environmental remediation liabilities ("the Retained Specified Remediation Liabilities") and other environmental remediation liabilities unknown at the closing of the Ashland Distribution Acquisition related to the Distribution Business for which Ashland received notice prior to the fifth anniversary of the closing (the "Other Retained Remediation Liabilities") (collectively, the "Retained Remediation Liabilities"). Ashland’s liability for the Retained Remediation Liabilities is not subject to any claim thresholds or deductibles other than expenses the Predecessor incurs arising out of the Other Retained Remediation Liabilities. Had the Predecessor incurred expenses arising out of the Other Retained Remediation Liabilities, Ashland’s indemnification obligation would have been subject to an individual claim threshold of $0.2 million and an aggregate claim deductible of $5.0 million. Ashland’s indemnification obligation under the ADA Purchase Agreement as described above terminated as of March 31, 2016, other than for Retained Remediation Liabilities.
In July 2014, Ashland filed a lawsuit numbered Ashland Inc. v. Nexeo Solutions, LLC, Case No. N14C-07-243 JTV CCLD, in the Superior Court for the State of Delaware in and for New Castle County. In the suit, Ashland seeks a declaration that, pursuant to the ADA Purchase Agreement, Solutions is obligated to indemnify Ashland for losses Ashland incurs pertaining to the Other Retained Remediation Liabilities, up to the amount of the aggregate $5.0 million deductible applicable expenses incurred by Solutions, whether or not Solutions incurs any expenses or obtains any indemnity from Ashland. Ashland further alleges that Solutions has breached duties related to the ADA Purchase Agreement by not having so indemnified Ashland for amounts Ashland has incurred for Other Retained Remediation Liabilities at sites where Ashland disposed of wastes prior to the Ashland Distribution Acquisition, and on that basis seeks unspecified compensatory damages, costs and attorney’s fees. On June 21, 2017, the Company's Motion for Summary Judgment for this lawsuit was granted. Ashland appealed the ruling on July 20, 2017. The Company will continue to vigorously defend the lawsuit on appeal. The Company does not currently have any environmental or remediation reserves for matters covered under the ADA Purchase Agreement.
The Company’s reserves will be subject to numerous uncertainties that affect its ability to accurately estimate its costs, or its share of costs if multiple parties are responsible. These uncertainties involve the legal, regulatory and enforcement parameters governing environmental assessment and remediation, the nature and extent of contamination, the extent of required remediation efforts, the choice of remediation methodology, availability of insurance coverage and, in the case of sites with multiple responsible parties, the number and financial strength of other potentially responsible parties.
Other Legal Proceedings
The Company is subject to various claims and legal proceedings covering a wide range of matters that arise in the ordinary course of its business activities, including product liability claims. Management believes that any liability that may ultimately result from the resolution of these matters will not have a material adverse effect on the financial condition or results of operations of the Company.
Other Contingencies
In June 2014, the Predecessor self-disclosed to the DTSC that an inventory of its Fairfield facility had revealed potential violations of the RCRA and the California Health and Safety Code. Although no formal proceeding has been initiated, the Company expects the DTSC to seek payment of fines or other penalties for non-compliance. The Company does not expect the amount of any such fine or other penalty to have a material adverse effect on its business, financial position or results of operations.
108
14. Related Party Transactions
The table below summarizes activity recorded during the respective periods related to the items described above:
Successor | Predecessor | |||||||||||||||
Fiscal Year Ended September 30, 2017 | Fiscal Year Ended September 30, 2016* | October 1, 2015 Through June 8, 2016 | Fiscal Year Ended September 30, 2015 | |||||||||||||
Sales to related entities: | ||||||||||||||||
TPG | $ | 3.1 | $ | 1.7 | $ | 3.1 | $ | 8.8 | ||||||||
Entities related to members of the Board of Directors | $ | 0.1 | $ | — | $ | — | $ | — | ||||||||
Purchases from related entities: | ||||||||||||||||
Entities related to members of the Board of Directors | $ | 1.7 | $ | — | $ | — | $ | — | ||||||||
Amounts included in Selling, general and administrative expenses | ||||||||||||||||
Management fees to TPG | $ | — | $ | — | $ | 2.1 | $ | 3.3 | ||||||||
Consulting fees to TPG | $ | — | $ | 0.1 | $ | 0.4 | $ | 0.8 | ||||||||
Amounts included in Transaction related costs | ||||||||||||||||
Fee paid in connection with the Business Combination | $ | — | $ | — | $ | 9.9 | $ | — | ||||||||
*The fiscal year ended September 30, 2016 includes 114 days of the acquired business’ operating activities as a result of the consummation of the Business Combination on June 9, 2016.
There were no purchases from TPG related entities in the Successor or Predecessor periods.
TPG related entities owed the Company $0.7 million and $0.6 million at September 30, 2017 and 2016, respectively, for purchase of products, which were included in Accounts and notes receivable in the Company’s consolidated balance sheets. The Company owed $0.1 million at September 30, 2017 to entities related to members of the Board of Directors, which was included in Accounts payable in the Company’s consolidated balance sheet.
Contingent Consideration Obligations Pursuant to the TRA and the Merger Agreement
Subsequent to the Business Combination, TPG beneficially owns approximately 35% of the Company’s common stock, including Founder Shares, and is considered a related party of the Successor. In connection with the Business Combination, TPG became a party to the TRA and obtained the right to receive the Deferred Cash Consideration pursuant to the Merger Agreement. The fair value of these contingent consideration liabilities was $140.2 million as of September 30, 2017 of which $127.7 million was recorded in Due to related party pursuant to contingent consideration obligations in Non-current Liabilities and $12.5 million was recorded in Due to related party pursuant to contingent consideration obligations in Current Liabilities on the Company’s consolidated balance sheet. The fair value of these contingent consideration liabilities was $118.4 million as of September 30, 2016, and was recorded in Due to related party pursuant to contingent consideration obligations in Non-current Liabilities on the Company’s consolidated balance sheet. See Note 3 and Note 9.
Predecessor - Other Agreements with TPG
The Predecessor entered into agreements with TPG, including a management services agreement pursuant to which the Predecessor paid TPG management fees and also consulting fees for services provided. The fees incurred in connection with this agreement were recorded in Selling, general and administrative expenses in the consolidated statements of operations.
As a result of the Business Combination on the Closing Date, TPG and the Predecessor terminated the management services agreement and their rights and obligations thereunder. Pursuant to the management services agreement, the Predecessor paid TPG a success fee of $9.9 million relating to the closing of the Business Combination determined in accordance with the terms of the management services agreement. This fee was recorded in Transaction related costs in the consolidated statement of operations.
109
FPA Subscription Agreement
On May 23, 2016, the Company entered into a Subscription Agreement (the "FPA Subscription Agreement") with Sponsor and First Pacific Advisors, LLC ("FPA"), on behalf of certain clients pursuant to which FPA agreed to purchase 18,260,000 shares of common stock on a private placement basis in connection with the Business Combination.
Sponsor Subscription Agreement
On June 6, 2016, the Company entered into a Subscription Agreement with Sponsor, pursuant to which Sponsor agreed to purchase 1,000,000 shares of common stock on a private placement basis for $10 per share in connection with the Business Combination. Wilbur L. Ross, Jr. was the manager of Sponsor and a former Chairman of the Board of Nexeo Solutions, Inc.
PWPI and PWIMF Commitment Agreements
On June 6, 2016, the Company entered into a Commitment Agreement with Sponsor and Park West Investors Master Fund, Ltd. ("PWIMF") and a second Commitment Agreement with Sponsor and Park West Partners International, Ltd. ("PWPI") (such agreements collectively, the "PW Commitment Agreements"), pursuant to which PWIMF and PWPI agreed to purchase from redeeming stockholders and withdraw from redemption an aggregate of 3,000,000 public shares of common stock.
FPA Commitment Agreement
On June 6, 2016, the Company entered into a Commitment Agreement (the "FPA Commitment Agreement") with Sponsor and FPA, pursuant to which FPA agreed not to redeem 2,094,727 public shares of common stock then owned by FPA in connection with the closing of the Business Combination.
Sponsor Convertible Notes and Promissory Note
On March 31, 2016, the Company issued the March 2016 promissory note to Sponsor pursuant to which the Company could borrow up to $0.75 million. The March 2016 promissory note was interest bearing at 5% per annum and was due and payable on the first to occur of (1) the consummation of Business Combination or (2) June 11, 2016 (or such later date as would have been approved by the Company’s stockholders by amendment of the Company’s charter to complete the Business Combination). Sponsor loaned the Company $0.2 million to cover expenses related to daily operations. In connection with the consummation of the Business Combination, the March 2016 promissory note balance of $0.2 million, including unpaid interest, was paid in full.
On January 5, 2016, the Company issued a convertible promissory note, referred to as the "January 2016 convertible note" to Sponsor pursuant to which the Company borrowed $0.4 million from Sponsor for operating expenses. The January 2016 convertible note was interest bearing at 5% per annum and was due and payable on June 11, 2016. At the option of Sponsor, any amounts outstanding under the January 2016 convertible note could have been converted into warrants to purchase shares of common stock at a conversion price of $0.50 per warrant. Each warrant would have entitled Sponsor to purchase one-half of one share of common stock at an exercise price of $5.75 per half share ($11.50 per whole share). Each warrant would have contained other terms identical to the terms contained in the private placement warrants previously issued to Sponsor. Through March 31, 2016, the Company incurred an insignificant amount of interest expense which, under the terms of the January 2016 convertible note, was added to the principal amount. In connection with the consummation of the Business Combination, the January 2016 convertible note balance of $0.4 million, including unpaid interest, was paid in full.
On March 26, 2015, the Company issued a convertible promissory note, referred to as the "March 2015 convertible note," to Sponsor pursuant to which, on April 16, 2015, the Company borrowed $0.3 million from Sponsor for operating expenses. The March 2015 convertible note was interest bearing at 5% per annum and was due and payable on June 11, 2016. At the option of Sponsor, any amounts outstanding under the March 2015 convertible note could have been converted into warrants to purchase shares of common stock at a conversion price of $0.60 per warrant. Each warrant would have entitled Sponsor to purchase one-half of one share of common stock at an exercise price of $5.75 per half share ($11.50 per whole share). Each such warrant would have contained other terms identical to the terms contained in the private placement warrants previously issued to Sponsor. Through March 31, 2016, the Company incurred $14,000 of interest expense which under the terms of the March 2015 convertible note was added to the principal amount. In connection with the consummation of the Business Combination, the March 2015 convertible note balance of $0.3 million, including unpaid interest, was paid in full.
110
Predecessor - Letter Agreement for Chairman’s Services
On January 16, 2012, the Predecessor and Dan F. Smith, a member of the Predecessor Board of Directors, entered into a Letter Agreement for Chairman’s Services (together with subsequent extensions, the "Letter Agreement"). In connection with the closing of the Business Combination, the parties agreed to terminate the Letter Agreement and their rights and obligations thereunder. The termination of the Letter Agreement entitled Mr. Smith to a fee of $0.2 million in cash, which is included in Transaction related costs on the Company’s consolidated statement of operations.
Predecessor - Consulting Services Agreement
The Predecessor had a strategic consulting services agreement with Steven B. Schwarzwaelder, a member of the board of directors of the Predecessor, under which it paid an annual fee of $0.175 million. The Predecessor recorded $0.1 million from October 1, 2015 through June 8, 2016 and $0.2 million for the fiscal year ended September 30, 2015 related to this agreement. This fee was recorded in Selling, general and administrative expenses in the consolidated statements of operations. As a result of the Business Combination, the parties terminated the consulting services agreement and their rights and obligations thereunder.
15. Income Taxes
The Company provides for income taxes and the related accounts under the asset and liability method. Deferred tax assets and liabilities are determined based on the difference between the financial statement and tax basis of assets and liabilities using enacted tax rates expected to be in effect during the year in which the basis differences reverse. The Company has not recognized deferred taxes for temporary outside basis differences of $85.2 million as of September 30, 2017, related to investments in foreign subsidiaries that management considers to be permanent in duration. It is not practicable to estimate the amount of the unrecognized deferred income tax liabilities at this time due to the complexities associated with its hypothetical calculation.
The Company and its two active U.S. corporate subsidiaries, Blocker and Sub Holding, were both incorporated in the U.S. and as such are subject to U.S. income taxes. The Company and Blocker will file a consolidated U.S. Federal income tax return and both will file various state returns. Sub Holding will file a separate U.S. Federal income tax return and various state tax returns. The Company’s controlled foreign corporations are subject to taxation at the entity level in each of their respective jurisdictions.
Holdings is organized as a limited liability company and is taxed as a partnership for U.S. income tax purposes. With the exception of a limited number of state and local jurisdictions, Holdings is not subject to U.S. income taxes. Accordingly, Blocker and the Selling Equityholders (other than the holders of equity interests in Blocker) will report their share of Holdings’ taxable income earned prior to the Closing Date on their respective U.S. federal tax returns. Holdings and its subsidiaries made no tax distributions to, or on behalf of, the Selling Equityholders during the fiscal year ended September 30, 2016.
For all periods, the Company computed the provision for income taxes based on the actual year-to-date effective tax rate by applying the discrete method. Use of the annual effective tax rate, which relies on accurate projections by legal entity of income earned and taxed in foreign jurisdictions, as well as accurate projections by legal entity of permanent and temporary differences, was not considered a reliable estimate for purposes of calculating year-to-date income tax expense.
For financial reporting purposes, income (loss) before income taxes includes the following components:
Successor | Predecessor | |||||||||||||||
Fiscal Year Ended September 30, 2017 | Fiscal Year Ended September 30, 2016* | October 1, 2015 Through June 8, 2016 | Fiscal Year Ended September 30, 2015 | |||||||||||||
U.S. | $ | 7.9 | $ | (9.1 | ) | $ | (19.6 | ) | $ | 22.0 | ||||||
Foreign | 17.0 | 1.9 | 9.9 | 3.1 | ||||||||||||
Income (loss) before income taxes | $ | 24.9 | $ | (7.2 | ) | $ | (9.7 | ) | $ | 25.1 | ||||||
111
A summary of income tax expense (benefit) is as follows:
Successor | Predecessor | ||||||||||||||||
Fiscal Year Ended September 30, 2017 | Fiscal Year Ended September 30, 2016* | October 1, 2015 Through June 8, 2016 | Fiscal Year Ended September 30, 2015 | ||||||||||||||
Current tax expense (benefit): | |||||||||||||||||
U.S. - Federal | $ | 1.3 | $ | 0.5 | $ | — | $ | (1.8 | ) | ||||||||
U.S. - State | 0.5 | (0.2 | ) | (0.1 | ) | 0.1 | |||||||||||
Foreign | 6.5 | 2.0 | 3.2 | 2.8 | |||||||||||||
Total current tax expense | 8.3 | 2.3 | 3.1 | 1.1 | |||||||||||||
Deferred tax expense (benefit): | |||||||||||||||||
U.S. - Federal | 4.6 | (0.8 | ) | 0.4 | 2.2 | ||||||||||||
U.S. - State | 0.2 | 0.4 | 0.1 | — | |||||||||||||
Foreign | (2.6 | ) | (0.7 | ) | 0.6 | 0.6 | |||||||||||
Total deferred tax expense (benefit) | 2.2 | (1.1 | ) | 1.1 | 2.8 | ||||||||||||
Total income tax expense | $ | 10.5 | $ | 1.2 | $ | 4.2 | $ | 3.9 | |||||||||
*The fiscal year ended September 30, 2016 includes 114 days of the acquired business’ operating activities as a result of the consummation of the Business Combination on June 9, 2016.
The reconciliation of the U.S. statutory tax rate to the Company's effective tax rate is as follows:
Successor | Predecessor | |||||||||||||||
Fiscal Year Ended September 30, 2017 | Fiscal Year Ended September 30, 2016* | October 1, 2015 Through June 8, 2016 | Fiscal Year Ended September 30, 2015 | |||||||||||||
U.S. statutory rate | 34.0 | % | 34.0 | % | 0.0 | % | 0.0 | % | ||||||||
Pretax income (loss) at statutory rate | $ | 8.5 | $ | (2.5 | ) | $ | — | $ | — | |||||||
State income taxes | 0.9 | 0.2 | — | (0.1 | ) | |||||||||||
Statutory rate differential | (1.4 | ) | (0.2 | ) | 2.5 | 4.5 | ||||||||||
FIN 48 expense (benefit) | (0.5 | ) | — | 0.1 | (0.7 | ) | ||||||||||
Withholding and other taxes | 0.5 | — | 0.3 | 0.3 | ||||||||||||
Stock basis adjustment | — | — | — | (2.7 | ) | |||||||||||
Transaction costs | — | 5.0 | — | — | ||||||||||||
Contingent liability | 2.4 | (1.6 | ) | — | — | |||||||||||
Permanent differences and other items | (0.6 | ) | 0.3 | 0.6 | (0.7 | ) | ||||||||||
Statutory tax rate changes and differences | — | (0.2 | ) | (0.1 | ) | (0.1 | ) | |||||||||
True-up to prior year taxes | 0.6 | — | 0.2 | 2.1 | ||||||||||||
Other | — | — | — | 0.3 | ||||||||||||
Valuation allowance | 0.1 | 0.2 | 0.6 | 1.0 | ||||||||||||
Income tax expense | $ | 10.5 | $ | 1.2 | $ | 4.2 | $ | 3.9 | ||||||||
Effective tax rate | 42.2 | % | (16.7 | )% | (43.3 | )% | 15.5 | % | ||||||||
*The fiscal year ended September 30, 2016 includes 114 days of the acquired business’ operating activities as a result of the consummation of the Business Combination on June 9, 2016.
112
Temporary differences that result in significant deferred tax assets and liabilities are as follows:
September 30, 2017 | September 30, 2016 | ||||||
Deferred Tax Assets | |||||||
Foreign operating losses | $ | 6.3 | $ | 5.8 | |||
Federal and state operating losses | 27.6 | 14.1 | |||||
163J interest | — | 6.7 | |||||
Unrealized gains/losses | 0.2 | — | |||||
Fixed assets and intangibles | 0.9 | 0.6 | |||||
Compensation and other accruals | 2.4 | 1.0 | |||||
Other items | 0.9 | 0.4 | |||||
Valuation allowance | (3.1 | ) | (2.8 | ) | |||
Total deferred tax assets | $ | 35.2 | $ | 25.8 | |||
Deferred Tax Liabilities | |||||||
Fixed assets and intangibles | $ | 23.8 | $ | 16.1 | |||
Compensation and other accruals | 0.2 | 2.7 | |||||
Investment in partnerships | 43.2 | 28.9 | |||||
Other items | 0.6 | 0.1 | |||||
Total deferred tax liabilities | $ | 67.8 | $ | 47.8 | |||
Deferred income taxes reflect the net tax effects of temporary differences between the carrying amounts of assets and liabilities for financial reporting purposes and the amounts used for income tax purposes.
At September 30, 2017, the Company had foreign loss carryforwards of $6.3 million and U.S. loss carryforwards of $27.4 million. In those countries in which net operating losses are subject to an expiration period, the Company's loss carryforwards, if not utilized, will expire at various dates from 2018 through 2038. Based on historical performance, the Company believes that it is more likely than not that taxable income in future years will allow the Company to utilize the carryforwards that have not had a valuation allowance placed against them.
At September 30, 2017 and September 30, 2016, the valuation allowance was $3.1 million, $2.8 million, respectively and for the Predecessor as of September 30, 2015 the valuation allowance was $3.6 million, primarily relating to operations in Asia. In assessing the realizability of deferred tax assets, management considers whether it is more likely than not that some portion or all of the deferred tax assets will not be realized. The ultimate realization of deferred tax assets is dependent upon the generation of future taxable income during the periods in which those temporary differences become deductible. Based upon management’s expectations at September 30, 2017, management believes it is more likely than not that it will realize the majority of its deferred tax assets.
Uncertain Tax Positions
U.S. GAAP prescribes a recognition threshold and measurement attribute for the accounting and financial statement disclosure of tax positions taken or expected to be taken in a tax return. The evaluation of a tax position is a two-step process. The first step requires the Company to determine whether it is more likely than not that a tax position will be sustained upon examination based on the technical merits of the position. The second step requires the Company to recognize in the financial statements each tax position that meets the more likely than not criteria, measured as the amount of benefit that has a greater than 50% likelihood of being realized. Differences between the amount of tax benefits taken or expected to be taken in the income tax returns and the amount of tax benefits recognized in the financial statements represent the Company’s unrecognized income tax benefits, which are recorded as a liability, with the long-term portion included in Other non-current liabilities and the current portion included in Accrued expenses and other liabilities on the Company’s consolidated balance sheets.
113
During the fiscal year ended September 30, 2017, the Company added income tax-related uncertainties associated with the purchase of Ultra Chem. The initial reserve of $1.3 million, inclusive of interest and penalties, was added in connection with these uncertainties. Accordingly, the Company also recognized indemnification assets related to certain of these income tax-related uncertainties. The indemnification assets were initially included in Other current assets and other non-current assets in the consolidated balance sheets, representing the reimbursement the Company reasonably expected to receive from funds held in escrow pursuant to the purchase agreement. During the fiscal year ended September 30, 2015, the Predecessor completed its evaluation of income tax-related uncertainties associated with the Archway Acquisition, determined that the recognition threshold was met and recorded an initial reserve of $1.4 million associated with these uncertainties.
A reconciliation of the beginning and ending amount of unrecognized tax benefits is shown below:
Successor | Predecessor | |||||||||||||||
Fiscal Year Ended September 30, 2017 | Fiscal Year Ended September 30, 2016* | October 1, 2015 Through June 8, 2016 | Fiscal Year Ended September 30, 2015 | |||||||||||||
Balance at beginning of period | $ | 0.9 | $ | — | $ | 0.9 | $ | 0.4 | ||||||||
Increases related to positions taken on items from prior years | 0.1 | — | 0.2 | 1.2 | ||||||||||||
Unrecognized tax benefits assumed related to acquisitions | 0.8 | 0.9 | — | — | ||||||||||||
Lapse of statute of limitations | (0.6 | ) | — | (0.2 | ) | (0.7 | ) | |||||||||
Balance at end of period | $ | 1.2 | $ | 0.9 | $ | 0.9 | $ | 0.9 | ||||||||
*The fiscal year ended September 30, 2016 includes 114 days of the acquired business’ operating activities as a result of the consummation of the Business Combination on June 9, 2016.
The Company recognizes interest and penalties related to uncertain tax positions, if any, as a component of income tax expense in the consolidated statements of operations. There was an insignificant amount of interest and penalties recognized during all periods. At September 30, 2017 and September 30, 2016, there was $1.8 million and $1.2 million, respectively, related to uncertain tax positions and at September 30, 2015, there was $1.1 million related to uncertain tax positions, including related accrued interest and penalties for the Predecessor.
The Company believes it is reasonably possible that within the next 12 months unrecognized tax benefits may decrease by up to $0.3 million as a result of the expiration of certain statute of limitations periods and anticipated settlements.
The Company or one of its subsidiaries files income tax returns in various state and foreign jurisdictions. Within the U.S., the Company is subject to federal and state income tax examination by tax authorities for periods after December 2014. With respect to countries outside of the U.S., with certain exceptions, the Company’s foreign subsidiaries are subject to income tax audits for years after 2013.
16. Segment and Geographic Data
The Company operates through three lines of business, or operating segments: Chemicals, Plastics and Environmental Services, which market to different sets of customers operating in an array of industries, with various end markets and customer segments within those industries. For segment presentation and disclosure purposes, the Chemicals and Plastics lines of business constitute separate reportable segments, while the Environmental Services line of business, which does not meet the materiality threshold for separate disclosure, is included in an "Other" segment.
Each line of business represents unique products and suppliers, and each line of business focuses on specific end markets within its industry based on a variety of factors, including supplier or customer opportunities, expected growth and prevailing economic conditions. Across the Chemicals and Plastics lines of business there are numerous industry segments, end markets and sub markets that the Company may choose to focus on. These end markets may change from year to year depending on the underlying market economics, supplier focus, expected profitability and the Company’s strategic agenda.
114
The Chemicals, Plastics and Environmental Services lines of business compete with national, regional and local companies throughout North America. Additionally, the Chemicals and Plastics lines of business compete with other distribution companies in Asia. The Plastics line of business also competes with other distribution companies in EMEA. Competition within each line of business is based primarily on the diversity of the product portfolio, service offerings, reliability of services and supply, technical support, price and delivery capabilities. The accounting policies used to account for transactions in each of the lines of business are the same as those used to account for transactions at the corporate level.
The Chemicals and Plastics lines of business are distribution businesses, while the Environmental Services line of business provides hazardous and non-hazardous waste collection, recovery, recycling and disposal services.
A brief description of each segment follows:
Chemicals. The Chemicals line of business distributes specialty and industrial chemicals, additives and solvents to industrial users via railcars, barges, bulk tanker trucks and as packaged goods in trucks. The Company’s chemical products are distributed in more than 50 countries worldwide, primarily in North America and Asia. In connection with the distribution of chemicals products, the Company provides value-added services such as custom blending, packaging and re-packaging, private-label manufacturing and product testing in the form of chemical analysis, product performance analysis and product development. While the Chemicals line of business serves multiple end markets, the key end markets within the industrial space are household, industrial and institutional, performance coatings (including architectural coatings, adhesives, sealants and elastomers), lubricants, oil and gas and personal care.
Plastics. The Plastics line of business distributes a broad product line consisting of commodity polymer products and prime engineering resins to plastics processors engaged in blow molding, extrusion, injection molding and rotation molding via railcars, bulk trucks, truckload boxes and mixed truckloads, or less-than-truckload quantities. The Company's plastics products are distributed in more than 50 countries worldwide, primarily in North America, EMEA and Asia. The Plastics line of business serves a broad cross section of industrial segments with a current focus on the automotive and healthcare end markets.
Other. The Environmental Services line of business, in connection with certain waste disposal service companies, provides customers with comprehensive on-site and off-site hazardous and non-hazardous waste collection, recovery, disposal services or recycling in North America, primarily in the U.S. These environmental services are offered through the Company’s network of distribution facilities used as transfer facilities and through a staff of dedicated on-site waste professionals. The Environmental Services line of business serves multiple end markets such as aerospace and defense, automotive, chemical manufacturing, industrial manufacturing and oil and gas.
The Chief Executive Officer is the Chief Operating Decision Maker. The Chief Operating Decision Maker reviews operating results in order to make decisions, assess performance and allocate resources to each line of business. In order to maintain the focus on line of business performance, certain expenses are excluded from the line of business results utilized by the Company’s Chief Operating Decision Maker in evaluating line of business performance. These expenses include depreciation and amortization, selling, general and administrative expense and corporate items including transaction related costs, interest and income tax expense. These items are separately delineated to reconcile to reported net income. Intersegment revenues were insignificant.
No single customer accounted for more than 10.0% of revenues for any line of business for each of the fiscal years reported. In each of the past three fiscal years, polypropylene, a product offering in the Company’s Plastics line of business, was the only product that accounted for over 10.0% of the Company's consolidated net revenue. Polypropylene accounted for 15.5% and 17.6% during the fiscal years ended September 30, 2017 and 2016, respectively, of total consolidated net revenue. Polypropylene accounted for 17.7% and 14.4% for the period from October 1, 2015 through June 8, 2016 and the fiscal year ended September 30, 2015, respectively of Predecessor total consolidated net revenue. Two suppliers accounted for 12.1% and 9.9%, respectively, of the consolidated purchases during the fiscal year ended September 30, 2017, and 11.9% and 10.4%, respectively, for the fiscal year ended September 30, 2016. Two suppliers accounted for 12.0% and 9.8%, respectively, for the period from October 1, 2015 through June 8, 2016 for the Predecessor consolidated purchases. During the fiscal year ended September 30, 2015 one of these suppliers accounted for 11.9% of the Predecessor consolidated purchases. Although this supplier serves both the Plastics and Chemicals lines of business, the supplier serves primarily the Plastics line of business.
Certain assets are aggregated at the line of business level. The assets attributable to the Company’s lines of business, that are reviewed by the Chief Operating Decision Maker, consist of trade accounts receivable, inventories, goodwill and any specific assets that are otherwise directly associated with a line of business. The Company’s inventory of packaging materials and containers, as well as property, plant and equipment, are generally not allocated to a line of business and are included in unallocated assets.
115
Summarized financial information relating to the Company’s lines of business is as follows:
Successor | Predecessor | |||||||||||||||
Fiscal Year Ended September 30, 2017 | Fiscal Year Ended September 30, 2016* | October 1, 2015 through June 8, 2016 | Fiscal Year Ended September 30, 2015 | |||||||||||||
Sales and operating revenues | ||||||||||||||||
Chemicals | $ | 1,667.2 | $ | 478.1 | $ | 1,066.4 | $ | 1,956.1 | ||||||||
Plastics | 1,841.7 | 546.7 | 1,192.2 | 1,876.1 | ||||||||||||
Other | 128.0 | 40.9 | 81.5 | 116.9 | ||||||||||||
Total sales and operating revenues | $ | 3,636.9 | $ | 1,065.7 | $ | 2,340.1 | $ | 3,949.1 | ||||||||
Gross profit | ||||||||||||||||
Chemicals | 205.6 | 55.7 | 136.2 | 224.4 | ||||||||||||
Plastics | 167.2 | 43.6 | 117.6 | 155.1 | ||||||||||||
Other | 25.6 | 9.1 | 18.1 | 28.5 | ||||||||||||
Total gross profit | 398.4 | 108.4 | 271.9 | 408.0 | ||||||||||||
Selling, general and administrative expenses | 312.9 | 91.7 | 208.9 | 329.5 | ||||||||||||
Transaction related costs | 1.9 | 21.3 | 33.4 | 0.1 | ||||||||||||
Change in fair value of contingent consideration obligations | 16.2 | (11.2 | ) | — | — | |||||||||||
Operating income | 67.4 | 6.6 | 29.6 | 78.4 | ||||||||||||
Other income | 8.3 | 0.5 | 2.9 | 11.4 | ||||||||||||
Interest income (expense) | ||||||||||||||||
Interest income | 0.3 | 0.8 | 0.1 | 0.1 | ||||||||||||
Interest expense | (51.1 | ) | (15.1 | ) | (42.3 | ) | (64.8 | ) | ||||||||
Income (loss) from continuing operations before income taxes | $ | 24.9 | $ | (7.2 | ) | $ | (9.7 | ) | $ | 25.1 | ||||||
*The fiscal year ended September 30, 2016 includes 114 days of the acquired business’ operating activities as a result of the consummation of the Business Combination on June 9, 2016.
September 30, 2017 | September 30, 2016 | ||||||
IDENTIFIABLE ASSETS | |||||||
Chemicals | $ | 793.6 | $ | 656.8 | |||
Plastics | 762.7 | 708.7 | |||||
Other | 91.0 | 85.0 | |||||
Total identifiable assets by reportable segment | 1,647.3 | 1,450.5 | |||||
Unallocated assets | 606.2 | 628.4 | |||||
Total assets | $ | 2,253.5 | $ | 2,078.9 | |||
116
Revenues by geographic location, based on the jurisdiction of the subsidiary entity receiving revenue credit for the sale, are presented below:
Successor | Predecessor | |||||||||||||||
Fiscal Year Ended September 30, 2017 | Fiscal Year Ended September 30, 2016* | October 1, 2015 through June 8, 2016 | Fiscal Year Ended September 30, 2015 | |||||||||||||
U.S. | $ | 2,682.2 | $ | 808.2 | $ | 1,779.4 | $ | 3,029.0 | ||||||||
Canada | 171.6 | 46.5 | 102.4 | 196.3 | ||||||||||||
Other North America | 87.2 | 18.4 | 35.4 | 56.2 | ||||||||||||
Total North America Operations | 2,941.0 | 873.1 | 1,917.2 | 3,281.5 | ||||||||||||
EMEA | 481.7 | 130.6 | 291.9 | 486.3 | ||||||||||||
Asia | 214.2 | 62.0 | 131.0 | 181.3 | ||||||||||||
Total | $ | 3,636.9 | $ | 1,065.7 | $ | 2,340.1 | $ | 3,949.1 | ||||||||
*The fiscal year ended September 30, 2016 includes 114 days of the acquired business’ operating activities as a result of the consummation of the Business Combination on June 9, 2016.
17. Unaudited Quarterly Information
The following tables contain selected unaudited statement of operations information for each quarter of the fiscal years ended September 30, 2017 and 2016. All numbers are in millions except for per share amounts.
Fiscal Year Ended September 30, 2017 | |||||||||||||||
First Quarter | Second Quarter | Third Quarter | Fourth Quarter | ||||||||||||
Sales and operating revenues | $ | 794.8 | $ | 917.7 | $ | 942.7 | $ | 981.7 | |||||||
Gross profit | $ | 84.4 | $ | 102.2 | $ | 102.7 | $ | 109.1 | |||||||
Net income (loss) | $ | (8.3 | ) | $ | (1.1 | ) | $ | 10.2 | $ | 13.6 | |||||
Income (loss) per share:(1) | |||||||||||||||
Basic | $ | (0.11 | ) | $ | (0.01 | ) | $ | 0.13 | $ | 0.18 | |||||
Diluted | $ | (0.11 | ) | $ | (0.01 | ) | $ | 0.13 | $ | 0.18 | |||||
Weighted average number of common shares outstanding | |||||||||||||||
Basic | 76,746,168 | 76,746,168 | 76,743,853 | 76,774,578 | |||||||||||
Diluted | 76,746,168 | 76,746,168 | 76,828,868 | 76,852,267 | |||||||||||
(1) Per share amounts for the quarter and full year have been computed separately. The sum of the quarterly amounts may not equal the annual amounts presented because of differences in the average shares outstanding during each period.
117
Fiscal Year Ended September 30, 2016 | ||||||||||||||||||||||||||||
Successor | Predecessor | |||||||||||||||||||||||||||
First Quarter | Second Quarter | Third Quarter | Fourth Quarter | First Quarter | Second Quarter | April 1 through June 8 | ||||||||||||||||||||||
Sales and operating revenues | $ | — | $ | — | $ | 214.3 | $ | 851.4 | $ | 827.7 | $ | 862.2 | $ | 650.2 | ||||||||||||||
Gross profit | $ | — | $ | — | $ | 18.8 | $ | 89.6 | $ | 95.2 | $ | 101.3 | $ | 75.4 | ||||||||||||||
Net income (loss) | $ | (0.1 | ) | $ | (1.5 | ) | $ | (15.5 | ) | $ | 8.7 | $ | 4.3 | $ | 2.1 | $ | (20.2 | ) | ||||||||||
Income (loss) per share:(1) | ||||||||||||||||||||||||||||
Basic | $ | (0.01 | ) | $ | (0.10 | ) | $ | (0.45 | ) | $ | 0.11 | |||||||||||||||||
Diluted | $ | (0.01 | ) | $ | (0.10 | ) | $ | (0.45 | ) | $ | 0.11 | |||||||||||||||||
Weighted average number of common shares outstanding | ||||||||||||||||||||||||||||
Basic | 14,854,081 | 14,869,746 | 34,072,056 | 76,746,168 | ||||||||||||||||||||||||
Diluted | 14,854,081 | 14,869,746 | 34,072,056 | 76,793,154 | ||||||||||||||||||||||||
(1) Per share amounts for the quarter and full year have been computed separately. The sum of the quarterly amounts may not equal the annual amounts presented because of differences in the average shares outstanding during each period.
118
Nexeo Solutions, Inc. and Subsidiaries
Schedule II—Valuation and Qualifying Accounts
(in millions) | Balance Beginning of Period | Charged to Costs and Expenses | Charged to Other Accounts | Deductions | Balance End of Period | |||||||||||||||
Fiscal Year Ended September 30, 2017 | ||||||||||||||||||||
Allowance for doubtful accounts | $ | 1.4 | $ | (0.2 | ) | $ | 1.7 | $ | (0.7 | ) | (1) | $ | 2.2 | |||||||
Reserve for sales returns and allowances | 1.5 | — | (0.1 | ) | (2) | — | 1.4 | |||||||||||||
Fiscal Year Ended September 30, 2016 | ||||||||||||||||||||
Allowance for doubtful accounts | $ | — | $ | 0.3 | $ | 1.3 | $ | (0.2 | ) | (1) | $ | 1.4 | ||||||||
Reserve for sales returns and allowances | — | — | 1.5 | (2) | — | 1.5 | ||||||||||||||
October 1, 2015 through June 8, 2016 (Predecessor) | ||||||||||||||||||||
Allowance for doubtful accounts | $ | 3.8 | $ | 1.2 | $ | — | $ | (0.9 | ) | (1) | $ | 4.1 | ||||||||
Reserve for sales returns and allowances | 1.6 | — | (0.1 | ) | (2) | — | 1.5 | |||||||||||||
Fiscal Year Ended September 30, 2015 (Predecessor) | ||||||||||||||||||||
Allowance for doubtful accounts | $ | 6.3 | $ | 0.6 | $ | — | $ | (3.1 | ) | (1) | $ | 3.8 | ||||||||
Reserve for sales returns and allowances | 2.0 | — | (0.4 | ) | (2) | — | 1.6 | |||||||||||||
(1) | Accounts written off during the year, net of recoveries and foreign exchange impact. |
(2) | Amounts represent estimates for expected sales returns. |
119
Item 9. Changes in and Disagreements with Accountants on Accounting and Financial Disclosure
None.
Item 9A. Controls and Procedures
Evaluation of Disclosure Controls and Procedures
As required by Rule 13a-15(b) under the Exchange Act, management, under the supervision and with the participation of our principal executive officer and principal financial officer, evaluated the effectiveness of the design and operation of our disclosure controls and procedures (as defined in Rules 13a-15(e) and 15d-15(e) under the Exchange Act) as of the end of the fiscal year covered by this Annual Report on Form 10-K. Based on such evaluation, our principal executive officer and principal financial officer have concluded the Company's disclosure controls and procedures were effective at the reasonable assurance level as of September 30, 2017. Our disclosure controls and procedures are designed to provide reasonable assurance that the information required to be disclosed by us in reports that we file or submit under the Exchange Act is accumulated and communicated to our management, including our principal executive officer and principal financial officer, as appropriate, to allow timely decisions regarding required disclosure and is recorded, processed, summarized and reported within the time periods specified in the rules and forms of the SEC.
Management’s Annual Report on Internal Control over Financial Reporting
Management is responsible for establishing and maintaining adequate internal control over financial reporting, as such term is defined in Rules 13a-15(f) and 15d-15(f) under the Exchange Act. Internal control over financial reporting is a process designed to provide reasonable assurance regarding the reliability of financial reporting and the preparation of financial statements in accordance with generally accepted accounting principles. Because of its inherent limitations, internal control over financial reporting may not prevent or detect misstatements. Also, projections of any evaluation of effectiveness to future periods are subject to the risk that controls may become inadequate because of changes in conditions, or that the degree of compliance with the policies or procedures may deteriorate.
Management assessed the effectiveness of our internal control over financial reporting as of the end of the period covered by this Annual Report on Form 10-K. In making this assessment, management used the criteria set forth by the Committee of Sponsoring Organizations of the Treadway Commission (COSO) in Internal Control – Integrated Framework (2013). Based on management's assessment, management concluded that our internal control over financial reporting was effective as of September 30, 2017.
We excluded Ultra Chem, S. de R.L. de C.V. and its related entities from our assessment of internal control over financial reporting as of September 30, 2017 because they was acquired by the Company in a purchase business combination during 2017. The total assets and total revenues of Ultra Chem, S. de R.L. de C.V and its related entities are wholly-owned subsidiaries represent 3.8% and 1.0%, respectively, of the related consolidated financial statement amounts as of and for the fiscal year ended September 30, 2017.
The effectiveness of the Company's internal control over financial reporting as of September 30, 2017 has been audited by PricewaterhouseCoopers LLP, an independent registered public accounting firm, as stated in their report which appears herein.
Changes in Internal Control over Financial Reporting
During the fourth quarter ended September 30, 2017, there were no changes in our internal control over financial reporting (as such term is defined in Rules 13a-15(f) and 15d-15(f) under the Exchange Act) that materially affected, or are reasonably likely to materially affect, our internal control over financial reporting.
120
Item 9B. Other Information
None.
121
PART III
Item 10. Directors, Executive Officers and Corporate Governance
The information required by this Item is incorporated herein by reference to the Nexeo Solutions, Inc. proxy statement for our 2018 Annual Meeting of Stockholders.
Item 11. Executive Compensation
The information required by this Item is incorporated herein by reference to the Nexeo Solutions, Inc. proxy statement for our 2018 Annual Meeting of Stockholders.
Item 12. Security Ownership of Certain Beneficial Owners and Management and Related Stockholder Matters
The information required by this Item is incorporated herein by reference to the Nexeo Solutions, Inc. proxy statement for our 2018 Annual Meeting of Stockholders.
Item 13. Certain Relationships and Related Transactions, and Director Independence
The information required by this Item is incorporated herein by reference to the Nexeo Solutions, Inc. proxy statement for our 2018 Annual Meeting of Stockholders.
Item 14. Principal Accounting Fees and Services
The information required by this Item is incorporated herein by reference to the Nexeo Solutions, Inc. proxy statement for our 2018 Annual Meeting of Stockholders.
122
PART IV
Item 15. Exhibits
Exhibit Number | Description | |
2.1* | Agreement and Plan of Merger, dated March 21, 2016, by and among WL Ross Holding Corp., Neon Acquisition Company LLC, Neon Holding Company LLC, TPG Accolade Delaware, LP, Nexeo Solutions Holdings, LLC and Nexeo Holdco, LLC (incorporated by reference to Exhibit 2.1 to the Company's Current Report on Form 8-K dated March 21, 2016) | |
2.2* | Amendment No. 1 to the Agreement and Plan of Merger, dated June 6, 2016, by and among the WL Ross Holding Corp., Neon Acquisition Company, LLC, Neon Holding Company LLC, Nexeo Solutions Holdings, LLC, TPG Accolade Delaware, L.P. and Nexeo Holdco, LLC (incorporated by reference to Exhibit 2.1 to the Company's Current Report on Form 8-K dated June 6, 2016) | |
Stock Purchase Agreement, dated March 9, 2017, by and among Nexeo Solutions, LLC, Nexeo Solutions Mexico Holdings, LLC and the shareholders party thereto (incorporated by reference to Exhibit 2.1 to the Company's Current Report on Form 8-K dated April 3, 2017) | ||
Second Amended and Restated Certificate of Incorporation of Nexeo Solutions, Inc. (incorporated by reference to Exhibit 3.1 to the Company's Current Report on Form 8-K dated June 9, 2016) | ||
Amended and Restated Bylaws of Nexeo Solutions, Inc. (incorporated by reference to Exhibit 3.2 to the Company's Current Report on Form 8-K dated June 9, 2016) | ||
Specimen Unit Certificate (incorporated by reference to Exhibit 4.1 to the Company's S-1 Registration Statement (Commission File No. 333-195854) | ||
Specimen Common Stock Certificate (incorporated by reference to Exhibit 4.2 to the Company's S-1 Registration Statement (Commission File No. 333-195854) | ||
Specimen Warrant Certificate (incorporated by reference to Exhibit 4.3 to the Company's S-1 Registration Statement (Commission File No. 333-195854) | ||
Form of Warrant Agreement between Continental Stock Transfer & Trust Company and the Registrant (incorporated by reference to Exhibit 4.4 to the Company's S-1 Registration Statement (Commission File No. 333-195854) | ||
Shareholders' and Registration Rights Agreement, dated as of March 21, 2016, by and among TPG Capital LLC, WL Ross Sponsor LLC and WL Ross Holding Corp. (incorporated by reference to Exhibit 10.1 to the Company's Current Report on Form 8-K dated March 21, 2016) | ||
Amendment No. 1 to Shareholders' and Registration Rights Agreement, dated June 6, 2016, by and among WL Ross Holding Corp., WL Ross Sponsor LLC and Nexeo Holdco, LLC (incorporated by reference to Exhibit 10.5 to the Company's Current Report on Form 8-K dated June 6, 2016) | ||
Form of Joinder to Shareholders' and Registration Rights Agreement (incorporated by reference to Exhibit 10.10 to the Company's Current Report on Form 8-K dated June 9, 2016) | ||
Waiver and Consent Agreement made as of September 13, 2017 by and among Nexeo Solutions, Inc. and Nexeo Holdco, LLC (incorporated by reference to Exhibit 10.1 to the Company's Current Report on Form 8-K dated September 13, 2017) | ||
123
Exhibit Number | Description | |
Tax Receivable Agreement, dated June 9, 2016, by and between WL Ross Holding Corp. and the Selling Equityholders (incorporated by reference to Exhibit 10.1 to the Company's Current Report on Form 8-K dated June 9, 2016) | ||
Form of Joinder to Tax Receivable Agreement (incorporated by reference to Exhibit 10.2 to the Company's Current Report on Form 8-K dated June 9, 2016) | ||
10.3t | Form of Indemnification Agreement (incorporated by reference to Exhibit 10.7 to the Company's Current Report on Form 8-K dated June 9, 2016) | |
10.4t | Form of TPG Restricted Stock Agreement (incorporated by reference to Exhibit 10.27 to the Company's Annual Report on Form 10-K for the year ended September 30, 2016) | |
Credit Agreement, dated as of June 9, 2016, by and Nexeo Solutions, LLC, the other U.S Borrowers referred to therein, Nexeo Solutions Canada Corp., Nexeo Solutions Holdings, LLC, Nexeo Solutions Sub Holding Corp., Bank of America, N.A. as agent, the other agents party thereto and the others lenders party thereto (incorporated by reference to Exhibit 10.3 to the Company’s Current Report on Form 8-K dated June 9, 2016) | ||
Credit Agreement, dated as of June 9, 2016, by and among Nexeo Solutions, LLC, Nexeo Solutions Holdings, LLC, Nexeo Solutions Sub Holding Corp., Bank of America, N.A., as administrative agent and collateral agent, the other agents party thereto and the other lenders party thereto (incorporated by reference to Exhibit 10.4 to the Company’s Current Report on Form 8-K dated June 9, 2016) | ||
Amendment No. 1 to the ABL Credit Facility agreement, dated as of December 6, 2016 by Nexeo Solutions, LLC, the other U.S. Borrowers referred to therein, Nexeo Solutions Canada Corp., Nexeo Solutions Holdings, LLC, Nexeo Solutions Sub Holding Corp., Bank of America N.A. as agent, the other agents party thereto and the other lenders party thereto (incorporated by reference to Exhibit 10.28 to the Company’s Annual Report on Form 10-K for the year ended September 30, 2016) | ||
Amendment No. 1, dated March 22, 2017, among Nexeo Solutions Holdings, LLC, Nexeo Solutions, LLC, Nexeo Solutions Sub Holdings Corp., the other Loan Parties identified therein, Bank of America, N.A., as administrative agent and collateral agent, and the lenders party thereto (incorporated by reference to Exhibit 10.1 to the Company’s Current Report on Form 8-K dated March 22, 2017) | ||
10.9t | Nexeo Solutions, Inc. Severance Plan for U.S. Officers and Executives, as Amended and Restated, Effective as of June 9, 2016 (incorporated by reference to Exhibit 10.6 to the Company’s Current Report on Form 8-K dated June 9, 2016) | |
Nexeo Solutions, Inc. 2016 Long Term Incentive Plan (incorporated by reference to Exhibit 4.3 to the Company’s S-8 Registration Statement (Commission File No. 333-212199)) | ||
Form of Performance Share Unit Award Agreement under the Nexeo Solutions, Inc. 2016 Long Term Incentive Plan (incorporated by reference to Exhibit 10.14 to the Company’s Current Report on Form 8-K dated June 9, 2016) | ||
10.12† t | Nexeo Solutions, LLC Excess Benefit Plan | |
Employment Agreement, dated June 9, 2016, by and between Nexeo Solutions, Inc., Nexeo Solutions, LLC and David Bradley (incorporated by reference to Exhibit 10.5 to the Company’s Current Report on Form 8-K dated June 9, 2016) | ||
124
Exhibit Number | Description | |
Separation Agreement and Release of Claims dated effective April 11, 2016 by and among Nexeo Solutions, LLC, Nexeo Solutions Holdings, LLC and Henry E. Harrell (incorporated by reference to Exhibit 10.23 to the Company’s Quarterly Report on Form 10-Q for the period ended June 30, 2016) | ||
Registration Rights Agreement, dated May 23, 2016, by and between WL Ross Holding Corp., WL Ross Sponsor LLC and First Pacific Advisors, LLC, on behalf of one or more clients (incorporated by reference to Exhibit 10.2 to the Company’s Current Report on Form 8-K dated May 23, 2016) | ||
Registration Rights Agreement, dated June 9, 2016, by and among Nexeo Solutions, Inc., Merrill Lynch Pierce, Fenner & Smith Incorporated, Credit Suisse Securities (USA) LLC and Deutsche Bank Securities Inc. (incorporated by reference to Exhibit 10.12 to the Company’s Current Report on Form 8-K dated June 9, 2016) | ||
Founder Share Transfer Letter Agreement, dated March 21, 2016, by and among WL Ross Holding Corp, WL Ross Sponsor LLC and Nexeo Holdco, LLC (incorporated by reference to Exhibit 10.3 to the Company’s Current Report on Form 8-K dated March 21, 2016) | ||
Amendment No. 1 to Founder Share Transfer Letter Agreement, dated June 6, 2016, by and among WL Ross Holding Corp, WL Ross Sponsor LLC and Nexeo Holdco, LLC (incorporated by reference to Exhibit 10.6 to the Company’s Current Report on Form 8-K dated June 6, 2016) | ||
Private Placement Warrant Exchange Letter Agreement, dated as of March 21, 2016, by and among WL Ross Holding Corp., WL Ross Sponsor LLC and Nexeo Solutions Holdings, LLC (incorporated by reference to Exhibit 10.4 to the Company’s Current Report on Form 8-K dated March 21, 2016) | ||
Subscription Agreement, dated May 9, 2016, by and between WL Ross Holding Corp. and Fidelity Select Portfolios: Chemicals Portfolio, Fidelity Advisor Series I: Fidelity Advisor Value Fund, Fidelity Capital Trust: Fidelity Value Fund, Fidelity Select Portfolios: Materials Portfolio, Fidelity Central Investment Portfolios LLC: Fidelity Materials Central Fund and Variable Insurance Products Fund IV: Materials Portfolio (incorporated by reference to Exhibit 10.6 to the Company’s Quarterly Report on Form 10-Q for the period ended March 31, 2016) | ||
Subscription Agreement, dated May 6, 2016, by and between WL Ross Holding Corp. and MFS Series Trust XV on behalf of MFS Global Alternative Strategy Fund, MFS Series Trust I on behalf of MFS New Discovery Fund and MFS Variable Insurance Trust on behalf of MFS New Discovery Series (incorporated by reference to Exhibit 10.7 to the Company’s Quarterly Report on Form 10-Q for the period ended March 31, 2016) | ||
Subscription Agreement, dated May 23, 2016, by and among WL Ross Holding Corp., WL Ross Sponsor LLC and First Pacific Advisors, LLC, on behalf of one or more clients (incorporated by reference to Exhibit 10.1 to the Company’s Current Report on Form 8-K dated May 23, 2016) | ||
Subscription Agreement, dated June 6, 2016, by and among WL Ross Holding Corp. and WL Ross Sponsor LLC (incorporated by reference to Exhibit 10.4 to the Company’s Current Report on Form 8-K dated June 6, 2016) | ||
Commitment Agreement, dated June 6, 2016, by and among WL Ross Holding Corp., WL Ross Sponsor LLC and First Pacific Advisors, LLC, on behalf of one or more clients (incorporated by reference to Exhibit 10.1 to the Company’s Current Report on Form 8-K dated June 6, 2016) | ||
Commitment Agreement, dated June 6, 2016, by and among WL Ross Holding Corp., WL Ross Sponsor LLC and Park West Investors Master Fund, Limited (incorporated by reference to Exhibit 10.2 to the Company’s Current Report on Form 8-K dated June 6, 2016) | ||
125
Exhibit Number | Description | |
Commitment Agreement, dated June 6, 2016, by and among WL Ross Holding Corp., WL Ross Sponsor LLC and Park West Partners International, Limited (incorporated by reference to Exhibit 10.3 to the Company’s Current Report on Form 8-K dated June 6, 2016) | ||
Vehicle Operating and Service Agreement dated May 22, 2015 by and between Ryder Truck Rental, Inc. d/b/a Ryder Transportation Services, and Nexeo Solutions, LLC (incorporated by reference to Exhibit 10.21 to Company’s Quarterly Report on Form 10-Q for the period ended June 30, 2016) | ||
Amendment to Vehicle Operating and Service Agreement dated May 22, 2015 by and between Ryder Truck Rental, Inc., d/b/a Ryder Transportation Services, and Nexeo Solutions, LLC (incorporated by reference to Exhibit 10.22 to Company’s Quarterly Report on Form 10-Q for the period ended June 30, 2016) | ||
12.1† | Computation of Ratios of Earnings to Fixed Charges. | |
21.1† | List of Subsidiaries. | |
23.1† | Consent of PricewaterhouseCoopers LLP | |
31.1† | Certification of Principal Executive Officer Pursuant to Section 302 of the Sarbanes-Oxley Act of 2002. | |
31.2† | Certification of Principal Financial Officer Pursuant to Section 302 of the Sarbanes-Oxley Act of 2002. | |
32.1†† | Certifications of Principal Executive Officer and Principal Financial Officer Pursuant to Section 906 of the Sarbanes-Oxley Act of 2002. | |
101* | Interactive data files pursuant to Rule 405 of Regulation S-T. | |
† Filed herewith.
†† Furnished herewith.
t Management contract or compensatory plan or arrangement.
* Pursuant to Rule 406T of Regulation S-T, the interactive data files included in Exhibit 101 hereto are deemed not filed or part of a registration statement or prospectus for purposes of Sections 11 or 12 of the Securities Act are deemed not filed for purposes of Section 18 of the Exchange Act and otherwise are not subject to liability under those sections.
** Pursuant to Item 601(b)(2) of Regulation S-K, certain schedules and similar attachments to Exhibits 2.1 and 2.2 have not been filed herewith. The registrant agrees to furnish supplementally a copy of any omitted schedule to the SEC upon request.
126
Item 16. Form 10-K Summary
Not applicable.
127
SIGNATURES
Pursuant to the requirements of Section 13 or 15(d) of the Securities Exchange Act of 1934, the registrant has duly caused this report to be signed on its behalf by the undersigned, thereunto duly authorized on the 7th day of December, 2017.
NEXEO SOLUTIONS, INC. | ||
By: | /s/ David A. Bradley | |
David A. Bradley | ||
President, Chief Executive Officer and Director | ||
Pursuant to the requirements of the Securities Exchange Act of 1934, this report has been signed below by the following persons on behalf of the registrant in the capacities indicated on the 7th day of December, 2017.
Signature | Title | |
/s/ David A. Bradley | President, Chief Executive Officer and Director | |
David A. Bradley | (Principal Executive Officer) | |
/s/ Ross J. Crane | Executive Vice President, Chief Financial Officer | |
Ross J. Crane | (Principal Financial Officer) | |
/s/ Kristina A. Smith | Vice President, Controller and Chief Accounting Officer | |
Kristina A. Smith | (Principal Accounting Officer) | |
/s/ Dan F. Smith | Chairman | |
Dan F. Smith | ||
/s/ Kenneth M. Burke | Director | |
Kenneth M. Burke | ||
/s/ Brian A. Selmo | Director | |
Brian A. Selmo | ||
/s/ Nathan H. Wright | Director | |
Nathan H. Wright | ||
/s/ Christopher J. Yip | Director | |
Christopher J. Yip | ||
/s/ Thomas E. Zacharias | Director | |
Thomas E. Zacharias | ||
/s/ Robert J. Zatta | Director | |
Robert J. Zatta | ||
128