Attached files
| file | filename |
|---|---|
| EX-99.1 - EX-99.1 - Oaktree Strategic Income Corp | d485416dex991.htm |
| 8-K - 8-K - Oaktree Strategic Income Corp | d485416d8k.htm |
4th Quarter and Fiscal Year 2017 Earnings Presentation December 1, 2017 Nasdaq: OCSI Exhibit 99.2
Forward Looking Statements Some of the statements in this presentation constitute forward-looking statements because they relate to future events or our future performance or financial condition. The forward-looking statements contained in this presentation may include statements as to: our future operating results and distribution projections; the ability of our Investment Adviser to find lower-risk investments to reposition our portfolio and to implement our Investment Adviser’s future plans with respect to our business; our business prospects and the prospects of our portfolio companies; the impact of the investments that we expect to make; the ability of our portfolio companies to achieve their objectives; our expected financings and investments; the adequacy of our cash resources and working capital; the timing of cash flows, if any, from the operations of our portfolio companies; and the cost or potential outcome of any litigation to which we may be a party. In addition, words such as “anticipate,” “believe,” “expect,” “seek,” “plan,” “should,” “estimate,” “project” and “intend” indicate forward-looking statements, although not all forward-looking statements include these words. The forward-looking statements contained in this presentation involve risks and uncertainties. Our actual results could differ materially from those implied or expressed in the forward-looking statements for any reason, including the factors set forth in “Risk Factors” and elsewhere in our annual report on Form 10-K. Other factors that could cause actual results to differ materially include: changes in the economy, financial markets and political environment; risks associated with possible disruption in our operations or the economy generally due to terrorism or natural disasters; future changes in laws or regulations (including the interpretation of these laws and regulations by regulatory authorities) and conditions in our operating areas, particularly with respect to business development companies or regulated investment companies; and other considerations that may be disclosed from time to time in our publicly disseminated documents and filings. We have based the forward-looking statements included in this presentation on information available to us on the date of this presentation, and we assume no obligation to update any such forward-looking statements. Although we undertake no obligation to revise or update any forward-looking statements, whether as a result of new information, future events or otherwise, you are advised to consult any additional disclosures that we may make directly to you or through reports that we in the future may file with the SEC, including annual reports on Form 10-K, quarterly reports on Form 10-Q and current reports on Form 8-K. Unless otherwise indicated, data provided herein is dated as of September 30, 2017.
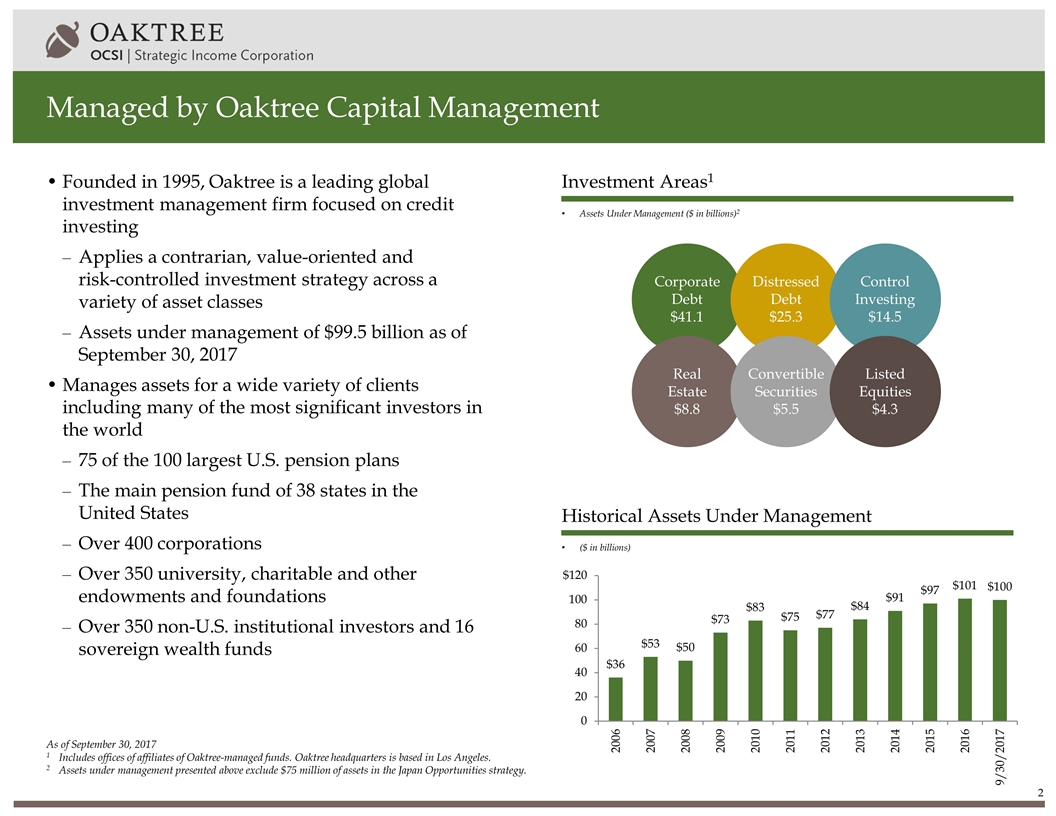
Managed by Oaktree Capital Management Assets Under Management ($ in billions)2 ($ in billions) Investment Areas1 Historical Assets Under Management Founded in 1995, Oaktree is a leading global investment management firm focused on credit investing Applies a contrarian, value-oriented and risk-controlled investment strategy across a variety of asset classes Assets under management of $99.5 billion as of September 30, 2017 Manages assets for a wide variety of clients including many of the most significant investors in the world 75 of the 100 largest U.S. pension plans The main pension fund of 38 states in the United States Over 400 corporations Over 350 university, charitable and other endowments and foundations Over 350 non-U.S. institutional investors and 16 sovereign wealth funds Corporate Debt $41.1 Distressed Debt $25.3 Control Investing $14.5 Real Estate $8.8 Convertible Securities $5.5 Listed Equities $4.3 As of September 30, 2017 1Includes offices of affiliates of Oaktree-managed funds. Oaktree headquarters is based in Los Angeles. 2Assets under management presented above exclude $75 million of assets in the Japan Opportunities strategy.
The Oaktree Advantage Scale Premier credit manager and leader among alternative investment managers for more than 20 years $99.5 billion in assets under management; 70% in credit strategies A team of more than 250 highly experienced investment professionals with significant origination, structuring and underwriting expertise Relationships Trusted partner to financial sponsors and management teams based on long-term commitment and focus on lending across economic cycles Strong market presence and established relationships with many sources of investment opportunities – private equity sponsors, capital raising advisers and borrowers Access to proprietary deal flow and first look at investment opportunities Track Record Disciplined portfolio management approach demonstrated across market cycles Long history of private credit investing $10 billion invested in over 200 directly originated loans since 2005 Flexibility Expertise to structure comprehensive, flexible and creative credit solutions for companies of all sizes across numerous industry sectors Capacity to invest in large deals and to sole underwrite transactions
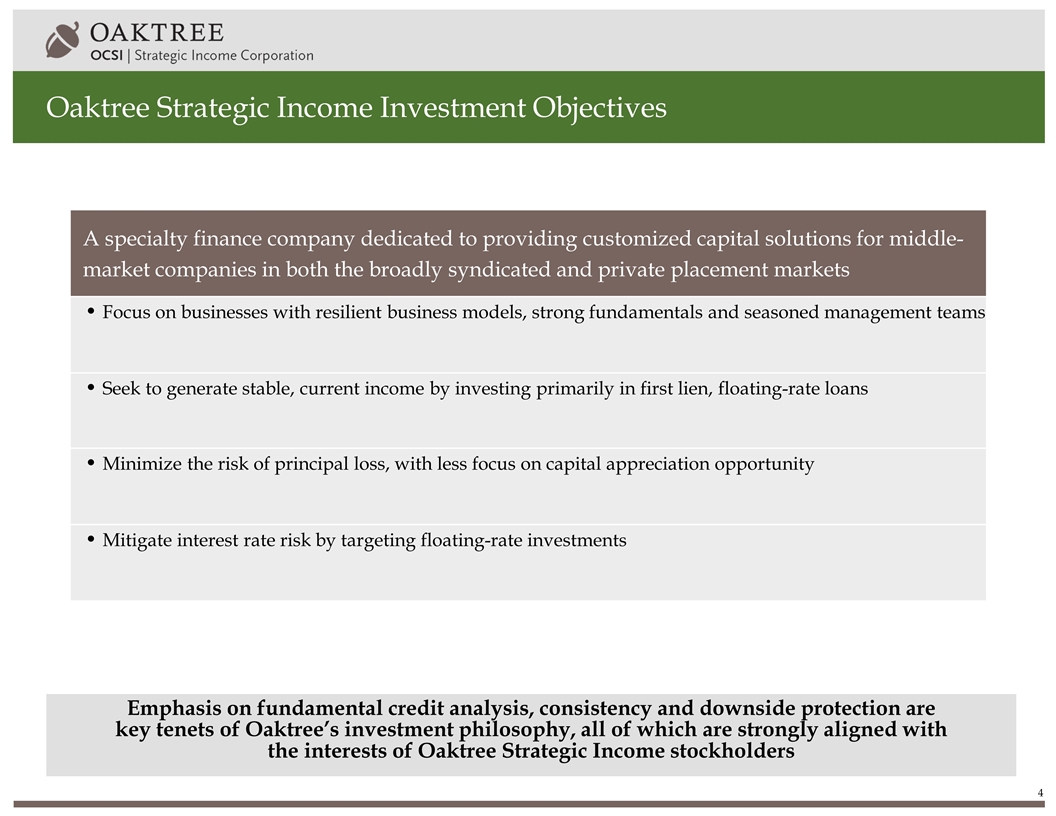
Oaktree Strategic Income Investment Objectives A specialty finance company dedicated to providing customized capital solutions for middle-market companies in both the broadly syndicated and private placement markets Focus on businesses with resilient business models, strong fundamentals and seasoned management teams Seek to generate stable, current income by investing primarily in first lien, floating-rate loans Minimize the risk of principal loss, with less focus on capital appreciation opportunity Mitigate interest rate risk by targeting floating-rate investments Emphasis on fundamental credit analysis, consistency and downside protection are key tenets of Oaktree’s investment philosophy, all of which are strongly aligned with the interests of Oaktree Strategic Income stockholders
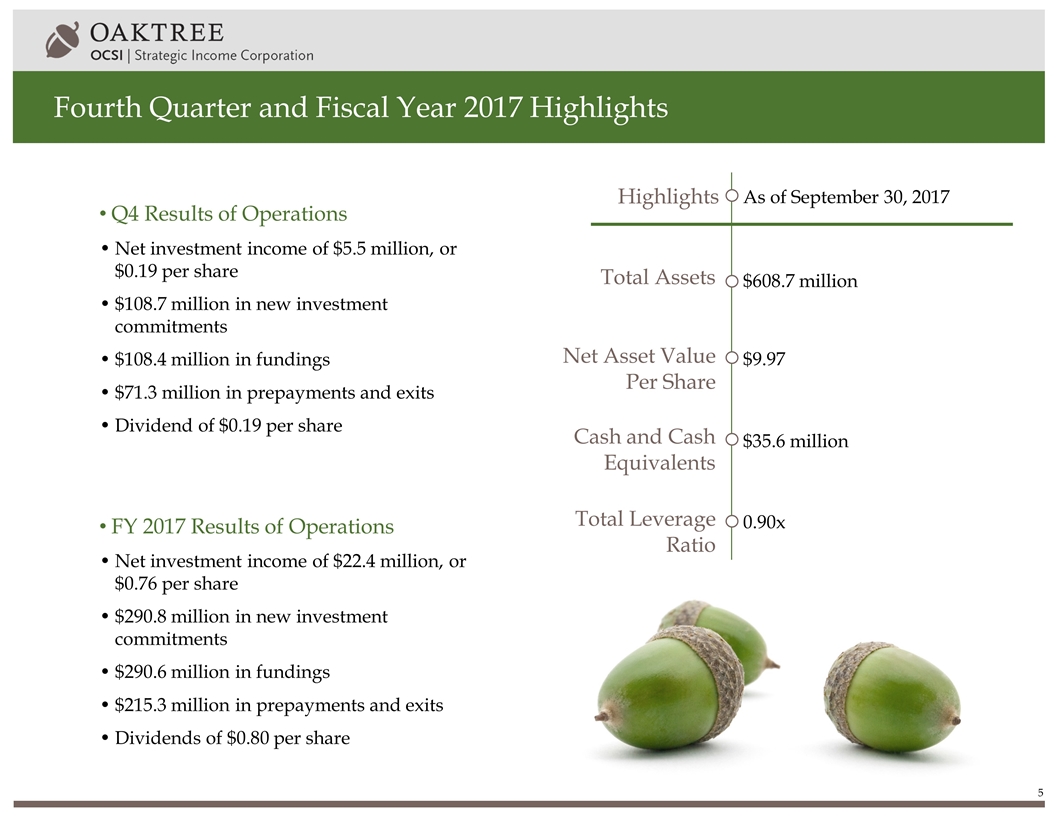
Fourth Quarter and Fiscal Year 2017 Highlights Highlights As of September 30, 2017 Total Assets $608.7 million Net Asset Value Per Share $9.97 Cash and Cash Equivalents $35.6 million Total Leverage Ratio 0.90x Q4 Results of Operations Net investment income of $5.5 million, or $0.19 per share $108.7 million in new investment commitments $108.4 million in fundings $71.3 million in prepayments and exits Dividend of $0.19 per share FY 2017 Results of Operations Net investment income of $22.4 million, or $0.76 per share $290.8 million in new investment commitments $290.6 million in fundings $215.3 million in prepayments and exits Dividends of $0.80 per share
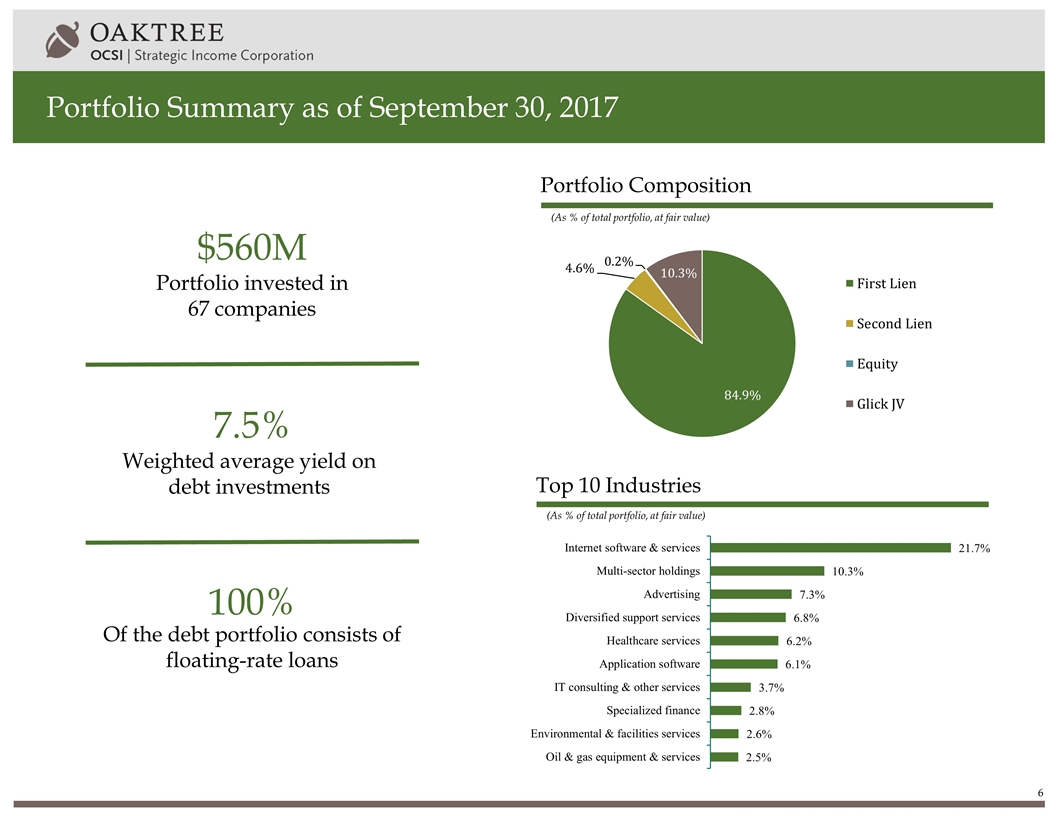
Portfolio Summary as of September 30, 2017 (As % of total portfolio, at fair value) Top 10 Industries (As % of total portfolio, at fair value) Portfolio Composition $560M Portfolio invested in 67 companies 7.5% Weighted average yield on debt investments 100% Of the debt portfolio consists of floating-rate loans
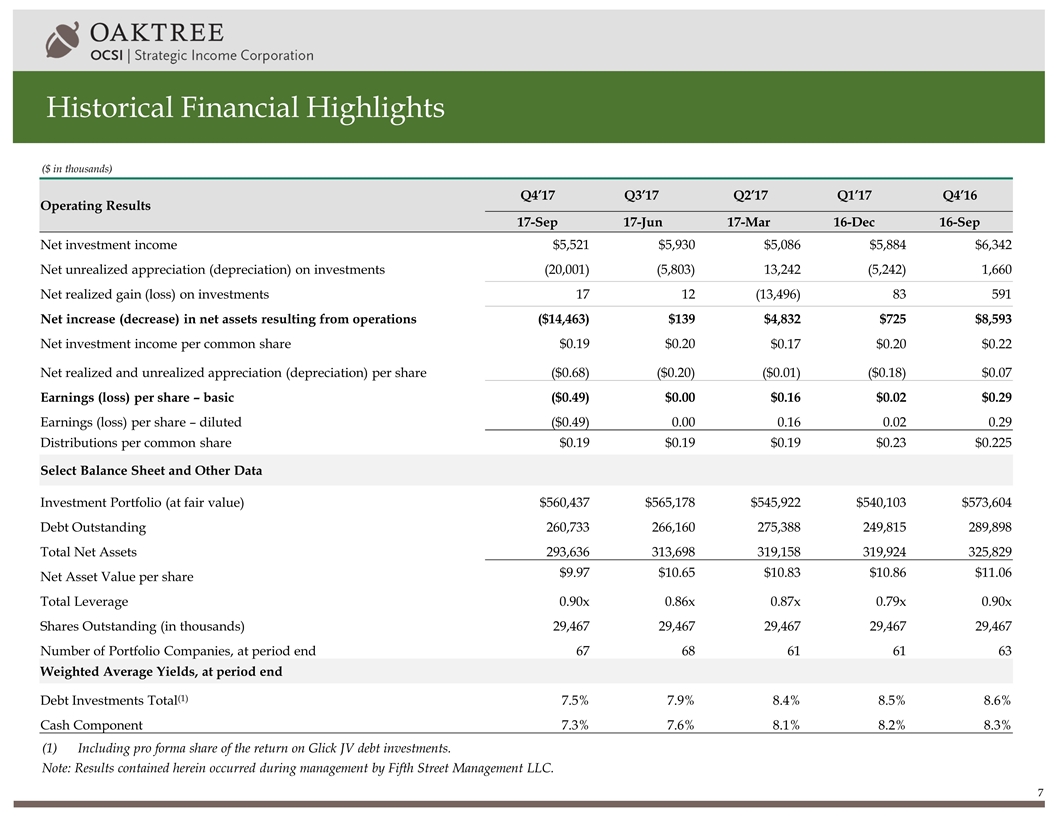
Historical Financial Highlights Including pro forma share of the return on Glick JV debt investments. ($ in thousands) Operating Results Q4’17 Q3’17 Q2’17 Q1’17 Q4’16 17-Sep 17-Jun 17-Mar 16-Dec 16-Sep Net investment income $5,521 $5,930 $5,086 $5,884 $6,342 Net unrealized appreciation (depreciation) on investments (20,001) (5,803) 13,242 (5,242) 1,660 Net realized gain (loss) on investments 17 12 (13,496) 83 591 Net increase (decrease) in net assets resulting from operations ($14,463) $139 $4,832 $725 $8,593 Net investment income per common share $0.19 $0.20 $0.17 $0.20 $0.22 Net realized and unrealized appreciation (depreciation) per share ($0.68) ($0.20) ($0.01) ($0.18) $0.07 Earnings (loss) per share – basic ($0.49) $0.00 $0.16 $0.02 $0.29 Earnings (loss) per share – diluted ($0.49) 0.00 0.16 0.02 0.29 Distributions per common share $0.19 $0.19 $0.19 $0.23 $0.225 Select Balance Sheet and Other Data Investment Portfolio (at fair value) $560,437 $565,178 $545,922 $540,103 $573,604 Debt Outstanding 260,733 266,160 275,388 249,815 289,898 Total Net Assets 293,636 313,698 319,158 319,924 325,829 Net Asset Value per share $9.97 $10.65 $10.83 $10.86 $11.06 Total Leverage 0.90x 0.86x 0.87x 0.79x 0.90x Shares Outstanding (in thousands) 29,467 29,467 29,467 29,467 29,467 Number of Portfolio Companies, at period end 67 68 61 61 63 Weighted Average Yields, at period end Debt Investments Total(1) 7.5% 7.9% 8.4% 8.5% 8.6% Cash Component 7.3% 7.6% 8.1% 8.2% 8.3% Note: Results contained herein occurred during management by Fifth Street Management LLC.
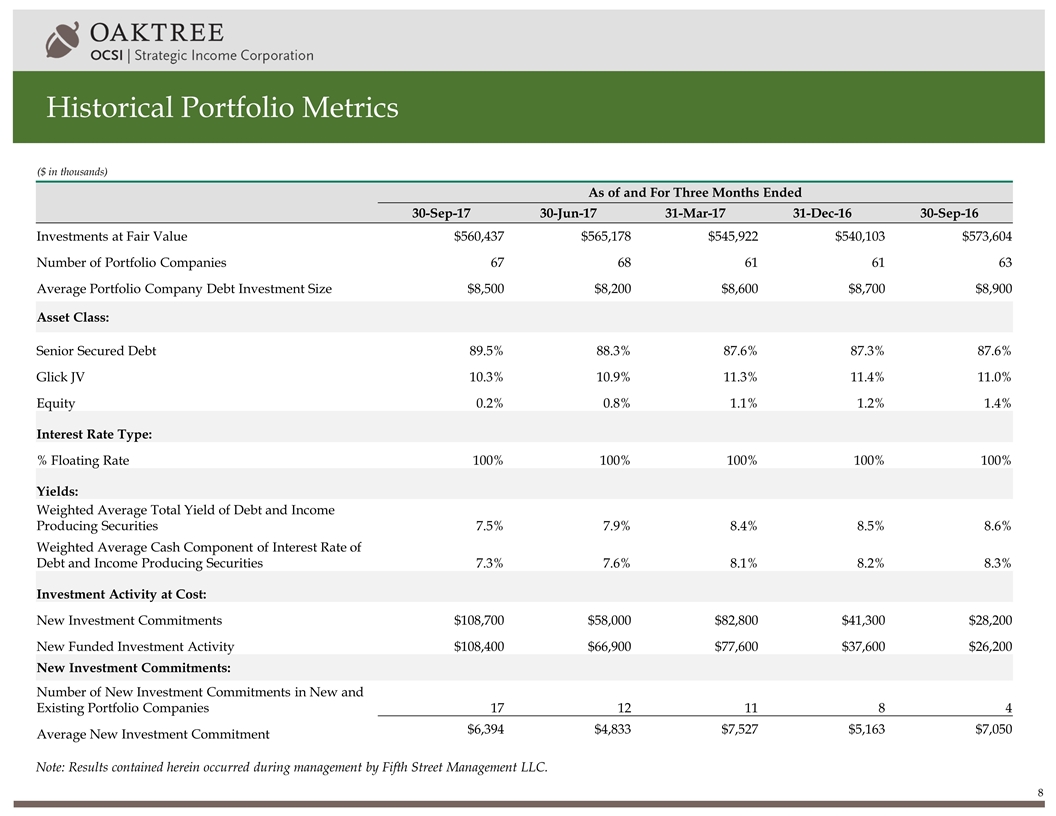
Historical Portfolio Metrics ($ in thousands) As of and For Three Months Ended 30-Sep-17 30-Jun-17 31-Mar-17 31-Dec-16 30-Sep-16 Investments at Fair Value $560,437 $565,178 $545,922 $540,103 $573,604 Number of Portfolio Companies 67 68 61 61 63 Average Portfolio Company Debt Investment Size $8,500 $8,200 $8,600 $8,700 $8,900 Asset Class: Senior Secured Debt 89.5% 88.3% 87.6% 87.3% 87.6% Glick JV 10.3% 10.9% 11.3% 11.4% 11.0% Equity 0.2% 0.8% 1.1% 1.2% 1.4% Interest Rate Type: % Floating Rate 100% 100% 100% 100% 100% Yields: Weighted Average Total Yield of Debt and Income Producing Securities 7.5% 7.9% 8.4% 8.5% 8.6% Weighted Average Cash Component of Interest Rate of Debt and Income Producing Securities 7.3% 7.6% 8.1% 8.2% 8.3% Investment Activity at Cost: New Investment Commitments $108,700 $58,000 $82,800 $41,300 $28,200 New Funded Investment Activity $108,400 $66,900 $77,600 $37,600 $26,200 New Investment Commitments: Number of New Investment Commitments in New and Existing Portfolio Companies 17 12 11 8 4 Average New Investment Commitment $6,394 $4,833 $7,527 $5,163 $7,050 Note: Results contained herein occurred during management by Fifth Street Management LLC.
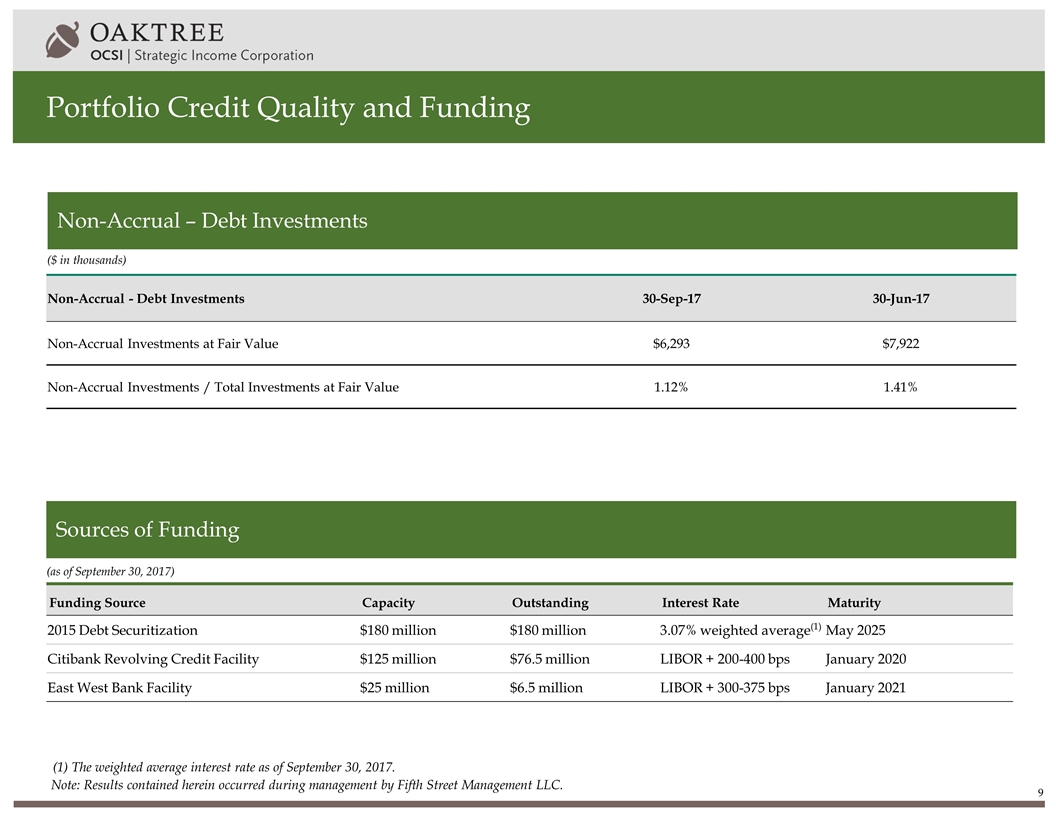
Portfolio Credit Quality and Funding ($ in thousands) Non-Accrual - Debt Investments 30-Sep-17 30-Jun-17 Non-Accrual Investments at Fair Value $6,293 $7,922 Non-Accrual Investments / Total Investments at Fair Value 1.12% 1.41% Note: Results contained herein occurred during management by Fifth Street Management LLC. Funding Source Capacity Outstanding Interest Rate Maturity 2015 Debt Securitization $180 million $180 million 3.07% weighted average(1) May 2025 Citibank Revolving Credit Facility $125 million $76.5 million LIBOR + 200-400 bps January 2020 East West Bank Facility $25 million $6.5 million LIBOR + 300-375 bps January 2021 Sources of Funding (as of September 30, 2017) Non-Accrual – Debt Investments (1) The weighted average interest rate as of September 30, 2017.
Contact: Michael Mosticchio, Investor Relations osci-ir@oaktreecapital.com
