Attached files
| file | filename |
|---|---|
| EX-99.1 - EX-99.1 - BYLINE BANCORP, INC. | d497341dex991.htm |
| 8-K - 8-K - BYLINE BANCORP, INC. | d497341d8k.htm |

Acquisition of First Evanston Bancorp, Inc. November 27, 2017 Exhibit 99.2
Forward Looking Statements This press release may contain forward-looking statements within the meaning of the Private Securities Litigation Reform Act of 1995 with respect to the financial condition, results of operations, plans, objectives, future performance and business of Byline and First Evanston. Forward-looking statements, which may be based upon beliefs, expectations and assumptions of Byline’s and First Evanston’s management, are generally identifiable by the use of words such as “believe,” “expect,” “anticipate,” “plan,” “intend,” “estimate,” “may,” “will,” “would,” “could,” “should” or other similar expressions. All statements in this press release speak only as of the date they are made, and neither Byline nor First Evanston undertakes any obligation to update any statement in light of new information or future events. A number of factors, many of which are beyond the ability of Byline and First Evanston to control or predict, could cause actual results to differ materially from those in such forward-looking statements. These factors include, among others: (1) the possibility that any of the anticipated benefits of the proposed transaction will not be realized or will not be realized within the expected time period; (2) the risk that integration of Byline’s and First Evanston’s operations will be materially delayed or will be more costly or difficult than expected; (3) the failure of the proposed transaction to close on the expected timeline or at all; (4) the effect of the announcement of the transaction on customer relationships and operating results; (5) the possibility that the transaction may be more expensive to complete than anticipated, including as a result of unexpected factors or events, and (6) other risks detailed from time to time in filings made by Byline with the SEC. These risks and uncertainties should be considered in evaluating forward-looking statements and undue reliance should not be placed on such statements. Additional information concerning factors that could materially affect Byline’s financial results are included in Byline’s filings with the SEC. Annualized, pro forma, projected and estimated numbers are used for illustrative purposes only, are not forecasts and may not reflect actual results. Additional Information The information included herein does not constitute an offer to sell or a solicitation of an offer to buy any securities or a solicitation of any vote or approval. Byline will file a registration statement on Form S-4 with the SEC in connection with the proposed transaction. The registration statement will include a joint proxy statement of Byline and First Evanston, which also will constitute a prospectus of Byline, that will be sent to the stockholders of Byline and the shareholders of First Evanston. INVESTORS, STOCKHOLDERS OF BYLINE AND SHAREHOLDERS OF FIRST EVANSTON ARE ADVISED TO READ THE JOINT PROXY STATEMENT/PROSPECTUS WHEN IT BECOMES AVAILABLE BECAUSE IT WILL CONTAIN IMPORTANT INFORMATION ABOUT BYLINE, FIRST EVANSTON AND THE PROPOSED TRANSACTION. When filed, the joint proxy statement/prospectus and other documents relating to the proposed transaction filed by Byline with the SEC can be obtained free of charge from the SEC’s website at www.sec.gov. These documents also can be obtained free of charge by accessing Byline’s website at www.bylinebancorp.com under the tab “About Us- Investor Relations.” Alternatively, these documents, when available, can be obtained free of charge from Byline upon written request to Byline Bancorp, Inc., Attn: Corporate Secretary, 180 North LaSalle Street, Suite 300, Chicago, Illinois 60601, or by calling (773) 244-7000, or from First Evanston upon written request to First Evanston Bancorp, Inc., Attn: Corporate Secretary, 820 Church Street, Evanston, Illinois 60201 or by calling (847) 733-7400. Participants in this Transaction Byline, First Evanston, their respective directors and executive officers and certain of their other members of management and employees may be deemed to be participants in the solicitation of proxies from Byline’s stockholders and First Evanston’s shareholders in connection with the proposed transaction. Information about the directors and executive officers of Byline may be found in the prospectus of Byline relating to its initial public offering of common stock filed with the SEC on July 3, 2017, a copy of which can be obtained free of charge from Byline or from the SEC’s website as indicated above. In addition, information about the directors and executive officers of Byline and First Evanston and other persons who may be deemed participants in the transaction will be included in the joint proxy statement/prospectus and other relevant materials when filed with the SEC.
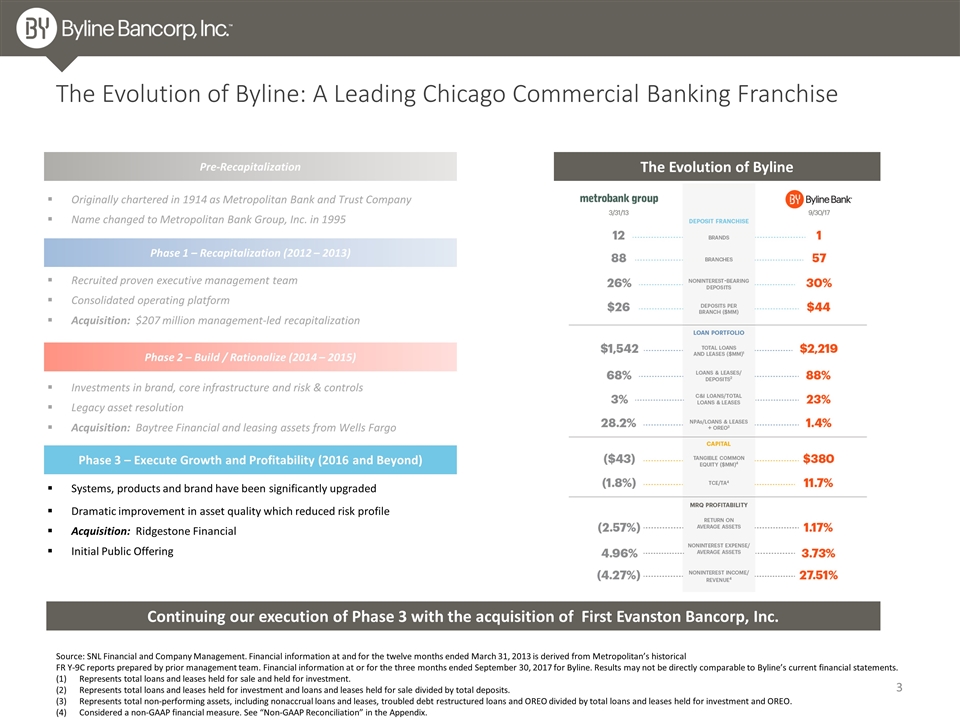
The Evolution of Byline Source: SNL Financial and Company Management. Financial information at and for the twelve months ended March 31, 2013 is derived from Metropolitan’s historical FR Y-9C reports prepared by prior management team. Financial information at or for the three months ended September 30, 2017 for Byline. Results may not be directly comparable to Byline’s current financial statements. Represents total loans and leases held for sale and held for investment. Represents total loans and leases held for investment and loans and leases held for sale divided by total deposits. Represents total non-performing assets, including nonaccrual loans and leases, troubled debt restructured loans and OREO divided by total loans and leases held for investment and OREO. Considered a non-GAAP financial measure. See “Non-GAAP Reconciliation” in the Appendix. The Evolution of Byline: A Leading Chicago Commercial Banking Franchise Investments in brand, core infrastructure and risk & controls Legacy asset resolution Acquisition: Baytree Financial and leasing assets from Wells Fargo Systems, products and brand have been significantly upgraded Dramatic improvement in asset quality which reduced risk profile Acquisition: Ridgestone Financial Initial Public Offering Recruited proven executive management team Consolidated operating platform Acquisition: $207 million management-led recapitalization Phase 1 – Recapitalization (2012 – 2013) Phase 2 – Build / Rationalize (2014 – 2015) Phase 3 – Execute Growth and Profitability (2016 and Beyond) Originally chartered in 1914 as Metropolitan Bank and Trust Company Name changed to Metropolitan Bank Group, Inc. in 1995 Pre-Recapitalization Continuing our execution of Phase 3 with the acquisition of First Evanston Bancorp, Inc.
Acquisition of First Evanston Bancorp, Inc. Building on our leading branch & deposit footprint in Chicago
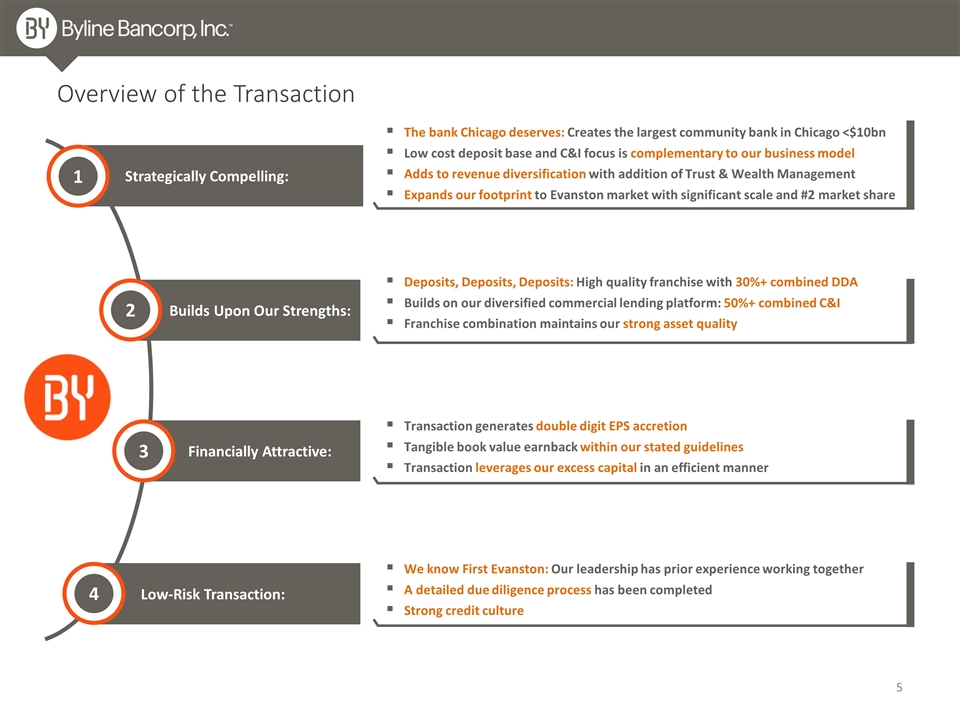
Low-Risk Transaction: Strategically Compelling: Financially Attractive: Builds Upon Our Strengths: Overview of the Transaction 1 2 3 4 The bank Chicago deserves: Creates the largest community bank in Chicago <$10bn Low cost deposit base and C&I focus is complementary to our business model Adds to revenue diversification with addition of Trust & Wealth Management Expands our footprint to Evanston market with significant scale and #2 market share Transaction generates double digit EPS accretion Tangible book value earnback within our stated guidelines Transaction leverages our excess capital in an efficient manner We know First Evanston: Our leadership has prior experience working together A detailed due diligence process has been completed Strong credit culture Deposits, Deposits, Deposits: High quality franchise with 30%+ combined DDA Builds on our diversified commercial lending platform: 50%+ combined C&I Franchise combination maintains our strong asset quality
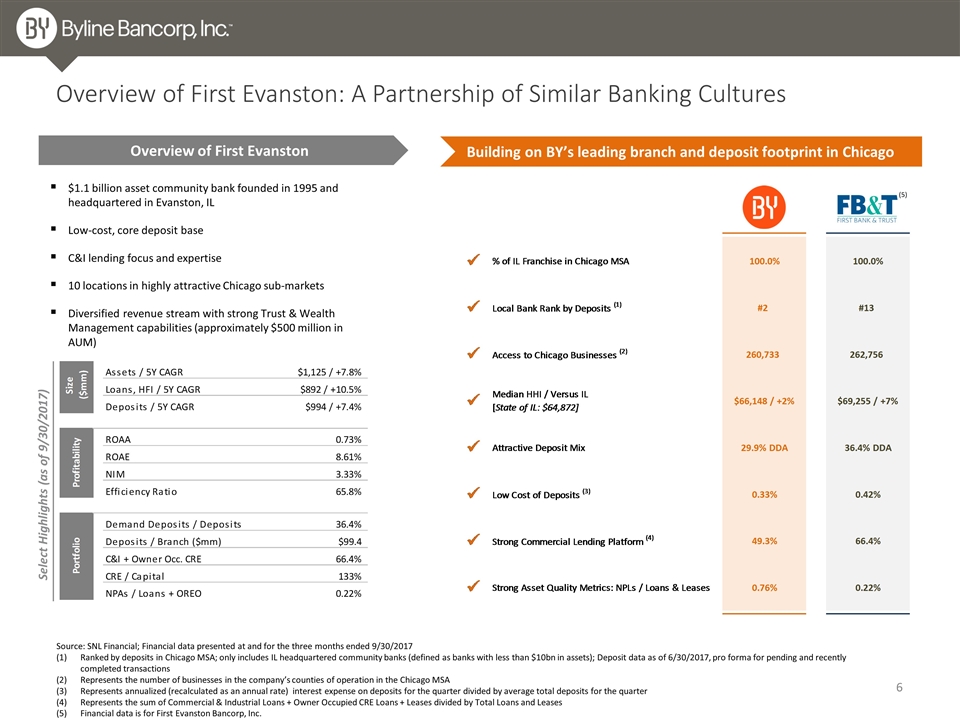
Source: SNL Financial; Financial data presented at and for the three months ended 9/30/2017 Ranked by deposits in Chicago MSA; only includes IL headquartered community banks (defined as banks with less than $10bn in assets); Deposit data as of 6/30/2017, pro forma for pending and recently completed transactions Represents the number of businesses in the company’s counties of operation in the Chicago MSA Represents annualized (recalculated as an annual rate) interest expense on deposits for the quarter divided by average total deposits for the quarter Represents the sum of Commercial & Industrial Loans + Owner Occupied CRE Loans + Leases divided by Total Loans and Leases Financial data is for First Evanston Bancorp, Inc. Overview of First Evanston: A Partnership of Similar Banking Cultures $1.1 billion asset community bank founded in 1995 and headquartered in Evanston, IL Low-cost, core deposit base C&I lending focus and expertise 10 locations in highly attractive Chicago sub-markets Diversified revenue stream with strong Trust & Wealth Management capabilities (approximately $500 million in AUM) Building on BY’s leading branch and deposit footprint in Chicago Select Highlights (as of 9/30/2017) Overview of First Evanston (5)
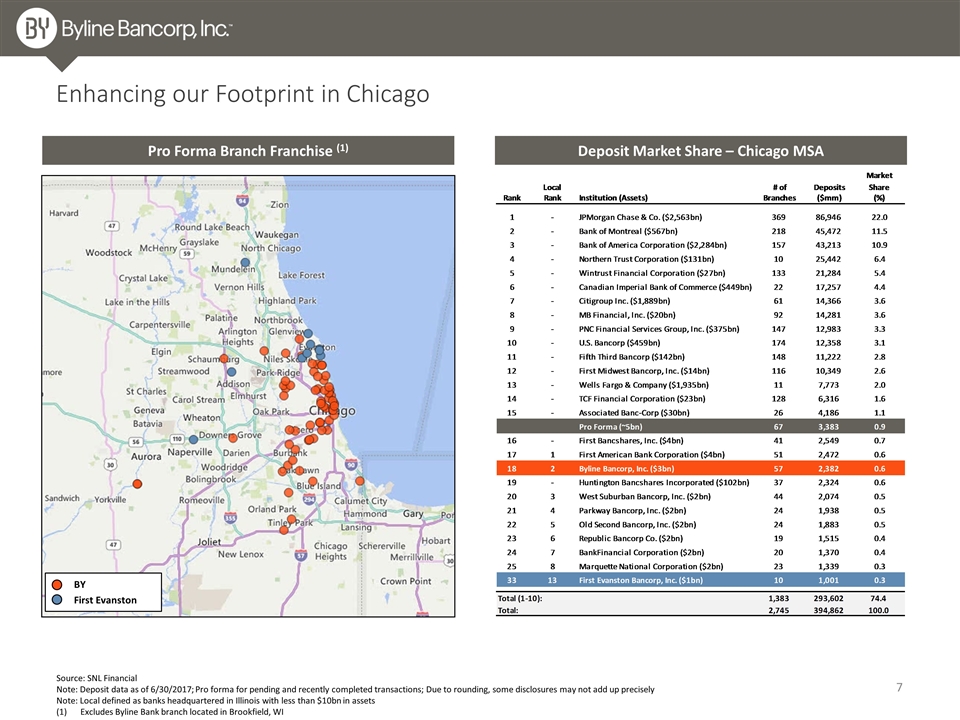
Source: SNL Financial Note: Deposit data as of 6/30/2017; Pro forma for pending and recently completed transactions; Due to rounding, some disclosures may not add up precisely Note: Local defined as banks headquartered in Illinois with less than $10bn in assets Excludes Byline Bank branch located in Brookfield, WI Enhancing our Footprint in Chicago Pro Forma Branch Franchise (1) Deposit Market Share – Chicago MSA BY First Evanston
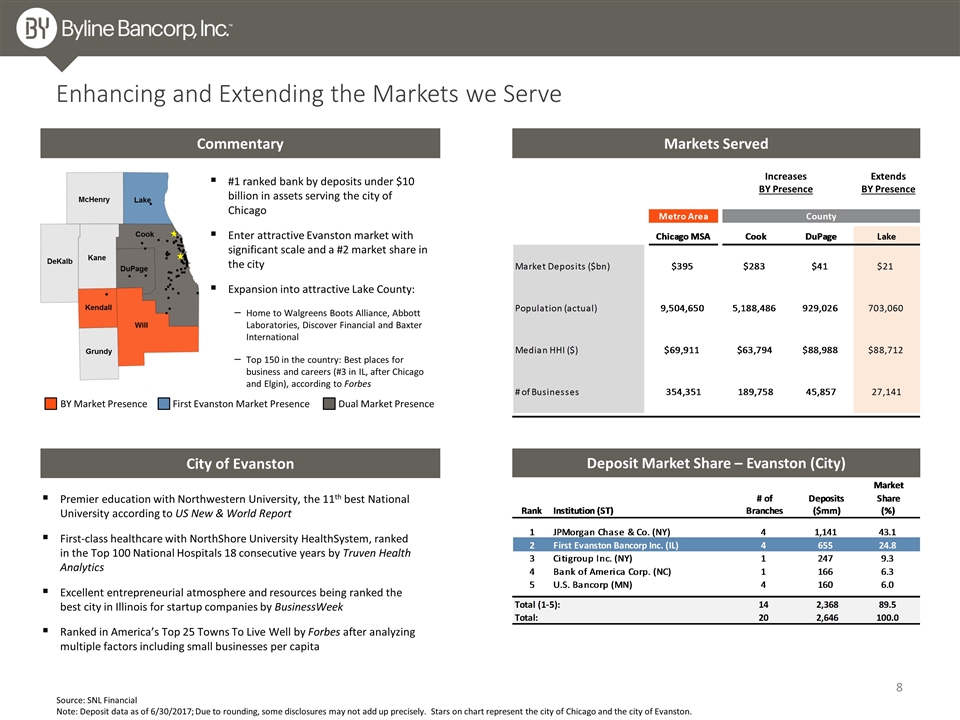
McHenry Lake DeKalb Kane DuPage Cook Will Kendall Grundy Source: SNL Financial Note: Deposit data as of 6/30/2017; Due to rounding, some disclosures may not add up precisely. Stars on chart represent the city of Chicago and the city of Evanston. Enhancing and Extending the Markets we Serve Extends BY Presence Commentary Markets Served Increases BY Presence Deposit Market Share – Evanston (City) Premier education with Northwestern University, the 11th best National University according to US New & World Report First-class healthcare with NorthShore University HealthSystem, ranked in the Top 100 National Hospitals 18 consecutive years by Truven Health Analytics Excellent entrepreneurial atmosphere and resources being ranked the best city in Illinois for startup companies by BusinessWeek Ranked in America’s Top 25 Towns To Live Well by Forbes after analyzing multiple factors including small businesses per capita BY Market Presence First Evanston Market Presence Dual Market Presence City of Evanston #1 ranked bank by deposits under $10 billion in assets serving the city of Chicago Enter attractive Evanston market with significant scale and a #2 market share in the city Expansion into attractive Lake County: Home to Walgreens Boots Alliance, Abbott Laboratories, Discover Financial and Baxter International Top 150 in the country: Best places for business and careers (#3 in IL, after Chicago and Elgin), according to Forbes
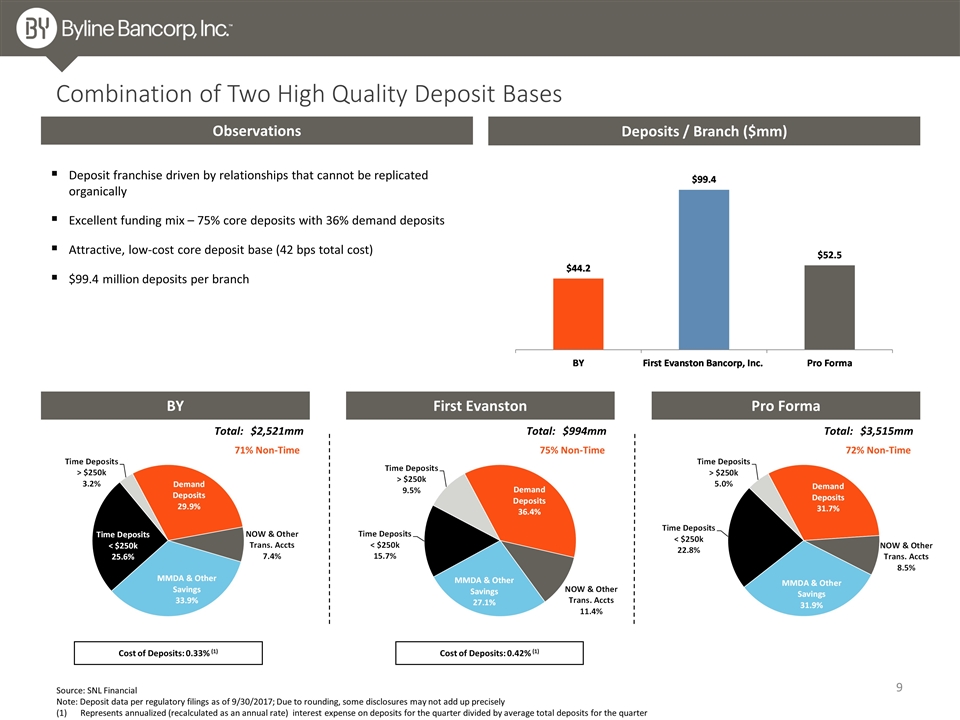
Source: SNL Financial Note: Deposit data per regulatory filings as of 9/30/2017; Due to rounding, some disclosures may not add up precisely Represents annualized (recalculated as an annual rate) interest expense on deposits for the quarter divided by average total deposits for the quarter Combination of Two High Quality Deposit Bases BY First Evanston Pro Forma Cost of Deposits: 0.33% (1) Cost of Deposits: 0.42% (1) Total: $2,521mm Total: $994mm Total: $3,515mm Deposits / Branch ($mm) 71% Non-Time 75% Non-Time 72% Non-Time Observations Deposit franchise driven by relationships that cannot be replicated organically Excellent funding mix – 75% core deposits with 36% demand deposits Attractive, low-cost core deposit base (42 bps total cost) $99.4 million deposits per branch
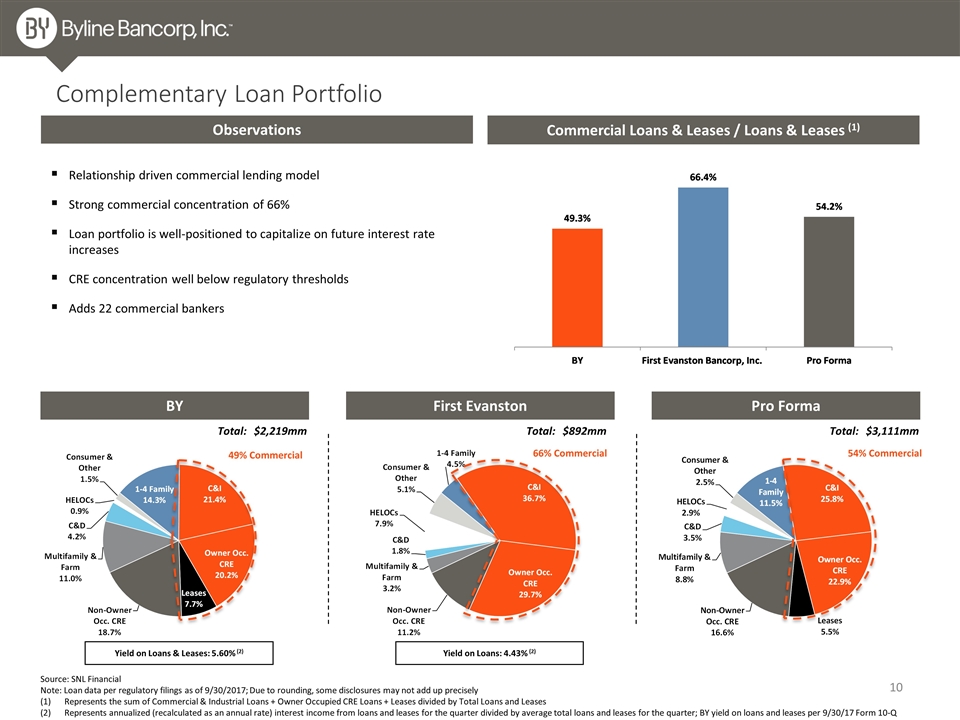
Source: SNL Financial Note: Loan data per regulatory filings as of 9/30/2017; Due to rounding, some disclosures may not add up precisely Represents the sum of Commercial & Industrial Loans + Owner Occupied CRE Loans + Leases divided by Total Loans and Leases Represents annualized (recalculated as an annual rate) interest income from loans and leases for the quarter divided by average total loans and leases for the quarter; BY yield on loans and leases per 9/30/17 Form 10-Q Complementary Loan Portfolio BY First Evanston Pro Forma Yield on Loans & Leases: 5.60% (2) Yield on Loans: 4.43% (2) Total: $2,219mm Total: $892mm Total: $3,111mm Commercial Loans & Leases / Loans & Leases (1) 49% Commercial 66% Commercial 54% Commercial Observations Relationship driven commercial lending model Strong commercial concentration of 66% Loan portfolio is well-positioned to capitalize on future interest rate increases CRE concentration well below regulatory thresholds Adds 22 commercial bankers
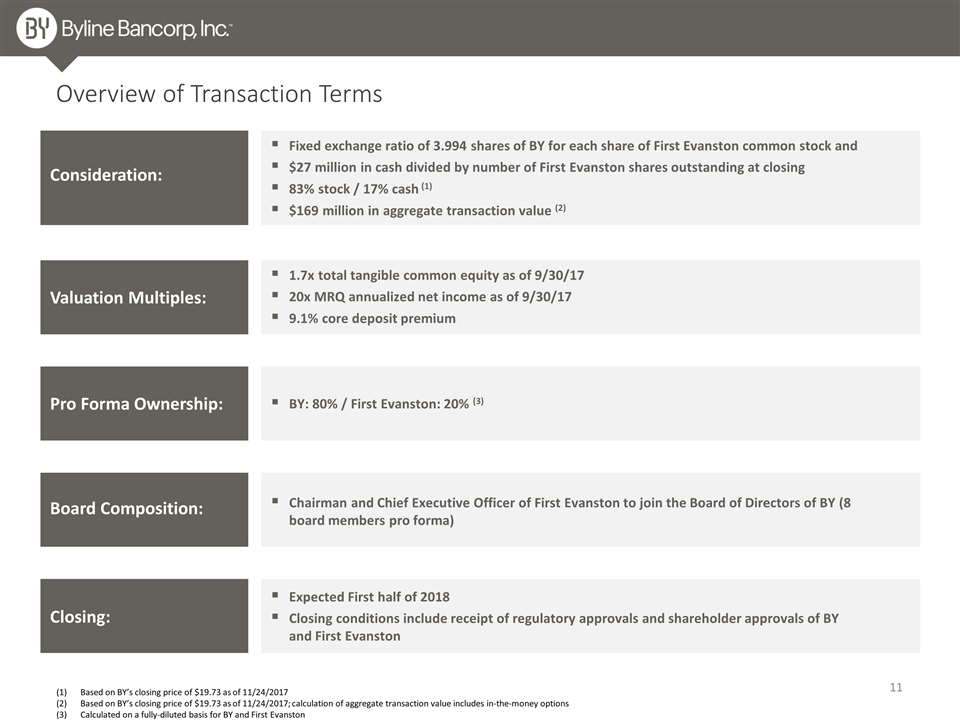
Based on BY’s closing price of $19.73 as of 11/24/2017 Based on BY’s closing price of $19.73 as of 11/24/2017; calculation of aggregate transaction value includes in-the-money options Calculated on a fully-diluted basis for BY and First Evanston Overview of Transaction Terms Consideration: Valuation Multiples: Board Composition: Closing: Fixed exchange ratio of 3.994 shares of BY for each share of First Evanston common stock and $27 million in cash divided by number of First Evanston shares outstanding at closing 83% stock / 17% cash (1) $169 million in aggregate transaction value (2) Expected First half of 2018 Closing conditions include receipt of regulatory approvals and shareholder approvals of BY and First Evanston Pro Forma Ownership: 1.7x total tangible common equity as of 9/30/17 20x MRQ annualized net income as of 9/30/17 9.1% core deposit premium BY: 80% / First Evanston: 20% (3) Chairman and Chief Executive Officer of First Evanston to join the Board of Directors of BY (8 board members pro forma)
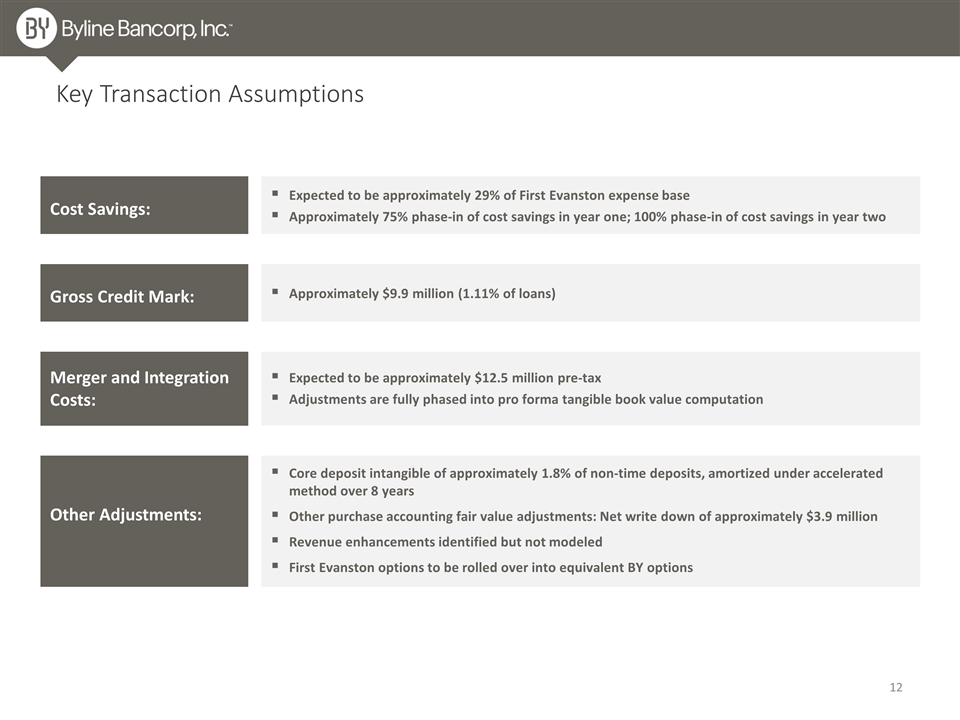
Key Transaction Assumptions Cost Savings: Merger and Integration Costs: Expected to be approximately 29% of First Evanston expense base Approximately 75% phase-in of cost savings in year one; 100% phase-in of cost savings in year two Other Adjustments: Expected to be approximately $12.5 million pre-tax Adjustments are fully phased into pro forma tangible book value computation Core deposit intangible of approximately 1.8% of non-time deposits, amortized under accelerated method over 8 years Other purchase accounting fair value adjustments: Net write down of approximately $3.9 million Revenue enhancements identified but not modeled First Evanston options to be rolled over into equivalent BY options Gross Credit Mark: Approximately $9.9 million (1.11% of loans)
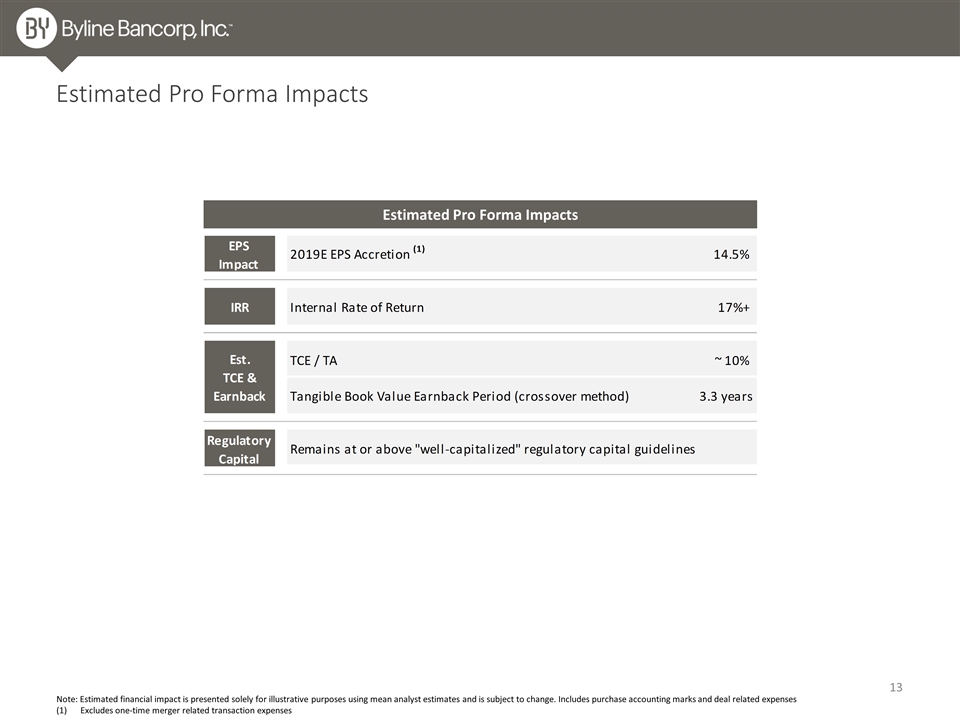
Estimated Pro Forma Impacts Estimated Pro Forma Impacts Note: Estimated financial impact is presented solely for illustrative purposes using mean analyst estimates and is subject to change. Includes purchase accounting marks and deal related expenses Excludes one-time merger related transaction expenses

Appendix
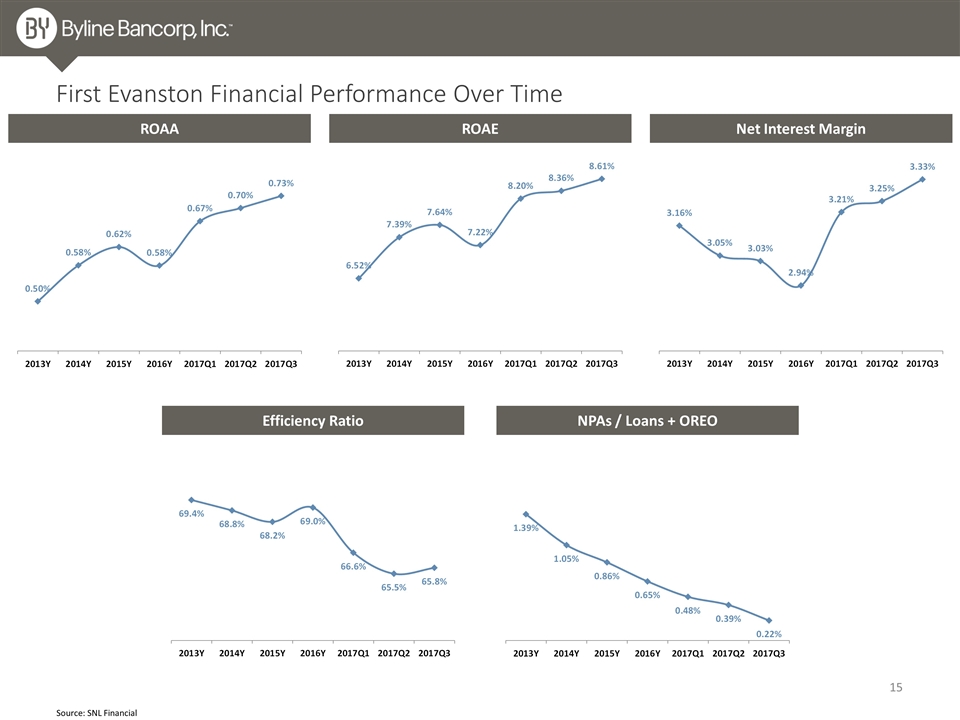
Source: SNL Financial First Evanston Financial Performance Over Time NPAs / Loans + OREO Net Interest Margin Efficiency Ratio ROAA ROAE
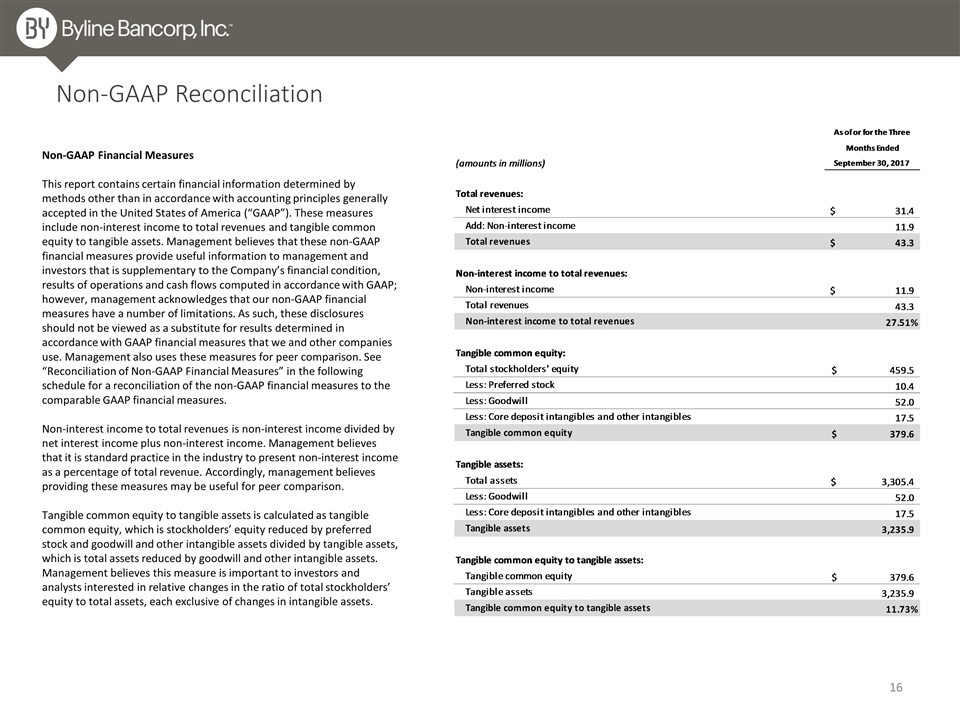
Non-GAAP Reconciliation Non-GAAP Financial Measures This report contains certain financial information determined by methods other than in accordance with accounting principles generally accepted in the United States of America (“GAAP”). These measures include non-interest income to total revenues and tangible common equity to tangible assets. Management believes that these non-GAAP financial measures provide useful information to management and investors that is supplementary to the Company’s financial condition, results of operations and cash flows computed in accordance with GAAP; however, management acknowledges that our non-GAAP financial measures have a number of limitations. As such, these disclosures should not be viewed as a substitute for results determined in accordance with GAAP financial measures that we and other companies use. Management also uses these measures for peer comparison. See “Reconciliation of Non-GAAP Financial Measures” in the following schedule for a reconciliation of the non-GAAP financial measures to the comparable GAAP financial measures. Non-interest income to total revenues is non-interest income divided by net interest income plus non-interest income. Management believes that it is standard practice in the industry to present non-interest income as a percentage of total revenue. Accordingly, management believes providing these measures may be useful for peer comparison. Tangible common equity to tangible assets is calculated as tangible common equity, which is stockholders’ equity reduced by preferred stock and goodwill and other intangible assets divided by tangible assets, which is total assets reduced by goodwill and other intangible assets. Management believes this measure is important to investors and analysts interested in relative changes in the ratio of total stockholders’ equity to total assets, each exclusive of changes in intangible assets.
