Attached files
| file | filename |
|---|---|
| EX-32.1 - EXHIBIT 32.1 - Terra Income Fund 6, Inc. | a93017exhibit32.htm |
| EX-31.2 - EXHIBIT 31.2 - Terra Income Fund 6, Inc. | a93017exhibit312.htm |
| EX-31.1 - EXHIBIT 31.1 - Terra Income Fund 6, Inc. | a93017exhibit311.htm |
| EX-10.3 - EXHIBIT 10.3 - Terra Income Fund 6, Inc. | a93017exhibit103.htm |
| EX-10.2 - EXHIBIT 10.2 - Terra Income Fund 6, Inc. | a93017exhibit102.htm |
| EX-10.1 - EXHIBIT 10.1 - Terra Income Fund 6, Inc. | a93017exhibit101.htm |
UNITED STATES
SECURITIES AND EXCHANGE COMMISSION
Washington, D.C. 20549
FORM 10-K
þ | ANNUAL REPORT PURSUANT TO SECTION 13 OR 15(d) OF THE SECURITIES EXCHANGE ACT OF 1934 |
For the Fiscal Year Ended September 30, 2017
o | TRANSITION REPORT PURSUANT TO SECTION 13 OR 15(d) OF THE SECURITIES EXCHANGE ACT OF 1934 |
Commission File Number 814-01136
Terra Income Fund 6, Inc.
(Exact name of registrant as specified in its charter)
Maryland | 46-2865244 | |
(State or other jurisdiction of incorporation or organization) | (I.R.S. Employer Identification No.) | |
805 Third Avenue, 8th Floor
New York, New York 10022
(Address of principal executive offices)
(212) 753-5100
(Registrant’s telephone number, including area code)
Indicate by check mark if the registrant is a well-known seasoned issuer, as defined in Rule 405 of the Securities Act of 1933.Yes o No þ
Indicate by check mark if the registrant is not required to file reports pursuant to Section 13 or Section 15(d) of the Securities Exchange Act of 1934.Yes o No þ
Indicate by check mark whether the registrant (1) has filed all reports required to be filed by Section 13 or 15(d) of the Securities Exchange Act of 1934 during the preceding 12 months (or for such shorter period that the registrant was required to file such reports), and (2) has been subject to such filing requirements for the past 90 days. Yes þ No o
Indicate by check mark whether the registrant has submitted electronically and posted on its corporate Web site, if any, every Interactive Data File required to be submitted and posted pursuant to Rule 405 of Regulation S-T during the preceding 12 months (or for such shorter period that the registrant was required to submit and post such files).Yes o No o
Indicate by check mark if disclosure of delinquent filers pursuant to Item 405 of Regulation S-K is not contained herein, and will not be contained, to the best of the registrant’s knowledge, in definitive proxy or information statements incorporated by reference in Part III of this Form 10-K or any amendment to this Form 10-K. þ
Indicate by check mark whether the registrant is a large accelerated filer, an accelerated filer, a non-accelerated filer, or a smaller reporting company. See definitions of “large accelerated filer,” “accelerated filer” and “smaller reporting company” in Rule 12b-2 of the Exchange Act.
Large accelerated filer o | Accelerated filer o | |
Non-accelerated filer þ (Do not check if a smaller reporting company) | Smaller reporting company o | |
Emerging growth company þ | ||
If an emerging growth company, indicate by check mark if the registrant has elected not to use the extended transition period for complying with any new or revised financial accounting standards provided pursuant to Section 13(a) of the Exchange Act. þ
Indicate by check mark whether the registrant is a shell company (as defined in Rule 12b-2 of the Exchange Act).Yes o No þ
As of November 20, 2017, the registrant had 7,936,167 shares of common stock, $0.001 par value, outstanding.
TABLE OF CONTENTS
Page | |
PART I | |
PART II | |
PART III | |
PART IV | |
i
CERTAIN DEFINITIONS
Except as otherwise specified in this Annual Report on Form 10-K, the terms:
• | “we,” “us,” “our” and the “Company” refer to Terra Income Fund 6, Inc.; |
• | “Terra Income Advisors” refers to Terra Income Advisors, LLC; |
• | “Terra Capital Markets” refers to Terra Capital Markets, LLC: |
• | “Terra Capital Partners” refers to Terra Capital Partners, LLC; and |
• | “Terra Income Funds” refers collectively to Terra Secured Income Fund, LLC, Terra Secured Income Fund 2, LLC, Terra Secured Income Fund 3, LLC, Terra Secured Income Fund 4, LLC, Terra Secured Income Fund 5, LLC, Terra Secured Income Fund 5 International, Terra Income Fund International and Terra Secured Income Fund 7, LLC. |
FORWARD-LOOKING STATEMENTS
Some of the statements in this Annual Report on Form 10-K constitute forward-looking statements because they relate to future events or our future performance or financial condition. The forward-looking statements contained in this Annual Report on Form 10-K may include, but are not limited to, statements as to:
• | our future operating results; |
• | our business prospects and the prospects of our portfolio companies; |
• | the impact of the investments that we expect to make; |
• | the ability of our portfolio companies to achieve their objectives; |
• | our current and expected financings and investments; |
• | the adequacy of our cash resources, financing sources and working capital; |
• | the timing and amount of cash flows, distributions and dividends, if any, from our portfolio companies; |
• | our contractual arrangements and relationships with third parties; |
• | actual and potential conflicts of interest with any of the following affiliated entities: Terra Income Advisors, LLC, our investment adviser; Terra Capital Partners, LLC, our sponsor; Terra Secured Income Fund, LLC; Terra Secured Income Fund 2, LLC; Terra Secured Income Fund 3, LLC; Terra Secured Income Fund 4, LLC; Terra Secured Income Fund 5, LLC; Terra Secured Income Fund 5 International; Terra Income Fund International; Terra Secured Income Fund 7, LLC; Terra Property Trust, Inc., a subsidiary of Terra Secured Income Fund 5, LLC; Terra Property Trust 2, Inc., a subsidiary of Terra Secured Income Fund 7, LLC; Terra Capital Advisors, LLC; Terra Capital Advisors 2, LLC; Terra Income Advisors 2, LLC; or any of their affiliates; |
• | the dependence of our future success on the general economy and its effect on our investments; |
• | our use of financial leverage; |
• | the ability of Terra Income Advisors, LLC to locate suitable investments for us and to monitor and administer our investments; |
• | the ability of Terra Income Advisors, LLC or its affiliates to attract and retain highly talented professionals; |
• | our ability to elect to be taxed as, and maintain thereafter, our qualification as a regulated investment company under the Internal Revenue Code of 1986, as amended and as a business development company under the Investment Company Act of 1940; |
• | the impact on our business of the Dodd-Frank Wall Street Reform and Consumer Protection Act of 2010 and the rules and regulations issued thereunder; |
• | the effect of changes to tax legislation and our tax position; and |
• | the tax status of the enterprises in which we invest. |
ii
In addition, words such as “anticipate,” “believe,” “expect” and “intend” indicate a forward-looking statement, although not all forward-looking statements include these words. The forward-looking statements contained in this Annual Report on Form 10-K involve risks and uncertainties. Our actual results could differ materially from those implied or expressed in the forward-looking statements for any reason, including the factors set forth in “Part I — Item 1A. Risk Factors” in this Annual Report. Other factors that could cause actual results to differ materially include:
• | changes in the economy; |
• | risks associated with possible disruption in our operations or the economy generally due to terrorism or natural disasters; and |
• | future changes in laws or regulations and conditions in our operating areas. |
We have based the forward-looking statements included in this Annual Report on Form 10-K on information available to us on the date of this Annual Report on Form 10-K. Except as required by the federal securities laws, we undertake no obligation to revise or update any forward-looking statements, whether as a result of new information, future events or otherwise. Stockholders are advised to consult any additional disclosures that we may make directly to stockholders or through reports that we may file in the future with the SEC, including annual reports on Form 10-K, quarterly reports on Form 10-Q and current reports on Form 8-K. The forward-looking statements and projections contained in this Annual Report on Form 10-K are excluded from the safe harbor protection provided by Section 27A of the Securities Act of 1933, as amended (the “Securities Act”), and Section 21E of the Securities Exchange Act of 1934, as amended (the “Exchange Act”).
iii
PART I
Item 1. Business.
Formation of Our Company
We are a Maryland corporation, formed on May 15, 2013 and commenced operations on June 24, 2015. We have elected to be regulated as a business development company (“BDC”) under the Investment Company Act of 1940, as amended (the “1940 Act”). We are an externally managed, non-diversified, closed-end management investment company that has elected to be taxed for federal income tax purposes beginning with our taxable year ended September 30, 2015, and to qualify annually thereafter, as a regulated investment company (“RIC”) under Subchapter M of the Internal Revenue Code of 1986, as amended (the “Code”).
We entered into a stock purchase agreement with Terra Capital Partners, LLC (“Terra Capital Partners”), our sponsor and an affiliate of our company. On September 19, 2014, pursuant to a private placement, Terra Capital Partners contributed cash consideration of $125,000 to purchase approximately 11,111 shares of our common stock at $11.25 per share. On October 20, 2014, pursuant to a private placement, Terra Capital Partners contributed an additional $50,000 in cash to purchase approximately 4,445 additional shares of our common stock at $11.25 per share.
On February 25, 2015, our board of directors (the “Board”) determined to change the initial offering price from $10.00 per share to $12.50 per share. As a result, on February 26, 2015, we effected a reverse stock split to account for the change in the offering price since the September and October, 2014 contributions from Terra Capital Partners. As such, all share references and equity transaction pricing elsewhere reflect this reverse stock split.
On March 2, 2015, we filed a public registration statement on Form N-2 (the “Registration Statement”) with the Securities and Exchange Commission (the “SEC”) to offer a minimum of $2.0 million of common stock and a maximum of $1.0 billion of common stock in a continuous, public offering (the “Offering”). The SEC declared the Registration Statement effective on April 20, 2015, and we retained Terra Capital Markets, LLC (“Terra Capital Markets”), an affiliate of Terra Income Advisors, to serve as the dealer manager of the Offering. As dealer manager, Terra Capital Markets is responsible for marketing our shares being offered pursuant to the Offering. We will file post-effective amendments to the Registration Statement that are subject to SEC review to allow us to continue the Offering for at least two years from the date of the effectiveness of the Registration Statement.
On May 1, 2015, Terra Capital Partners contributed cash of $275,000 to purchase approximately 24,444 additional shares from the Offering at a per share price of $11.25, which price represents the then-current public offering price of $12.50 per share, net of selling commissions, broker-dealer fees and dealer manager fees. This contribution, in addition to the initial capital contributions described above, fulfilled Terra Capital Partners’ commitment to contribute total seed capitalization of $450,000.
On June 24, 2015, we successfully reached our minimum escrow requirement and officially commenced our operations by receiving gross proceeds of $2,000,000 (the “Minimum Offering Requirement”). Since commencing operations, and through November 20, 2017, we have sold a total of 7,679,894 shares of common stock for total gross proceeds of $90.6 million, excluding shares pursuant to our distribution reinvestment plan (“DRIP”). The proceeds from the issuance of common stock are presented in our statements of changes in net assets and statements of cash flows.
On January 13, 2017, we decreased the public offering price of our common stock from $12.50 per share to $10.90 per share. The decrease in the public offering price was effective as of our January 17, 2017 bi-monthly closing and first applied to subscriptions received from January 1, 2017 through January 16, 2017.
Overview of Our Business
We do not currently have any employees and do not expect to have any employees. Services necessary for our business are provided by individuals who are employees of our advisor, Terra Income Advisors, LLC (“Terra Income Advisors” or the “Adviser”), or by individuals who were contracted by us or by Terra Income Advisors to work on behalf of us pursuant to the terms of the investment advisory and administrative services agreement between us and Terra Income Advisors (the “Investment Advisory Agreement”). Terra Income Advisors is responsible for sourcing potential investments, conducting due diligence on prospective investments, analyzing investment opportunities, structuring investments and monitoring our portfolio on an ongoing basis according to asset allocation and other guidelines set by our Board. Terra Income Advisors is registered as investment adviser with the SEC. We have elected to be taxed for federal income tax purposes for our taxable year in which we commence operations, and intend to qualify annually thereafter, as a RIC under Subchapter M of the Code.
The level of our investment activity depends on many factors, including the amount of debt and equity capital available to prospective borrowers, the level of refinancing activity for such companies, the availability of credit to finance transactions, the general economic environment and the competitive environment for the types of investments we make. The timing of investing the proceeds from our Offering depends on the availability of investment opportunities that are consistent with our investment objective and strategies and any restrictions imposed by the RIC diversification requirements. Any distributions we make prior to
1
the time that all capital raised has been deployed may be substantially lower than the distributions that we expect to pay when our portfolio is fully invested.
Our Investment Adviser
Our investment activities are externally managed by Terra Income Advisors, a private investment firm affiliated with us, pursuant to the Investment Advisory Agreement, under the oversight of the Board, a majority of whom are independent. Terra Income Advisors is registered as an investment adviser under the Investment Advisers Act of 1940, as amended (the “Advisers Act”).
Under the Investment Advisory Agreement, we have agreed to pay Terra Income Advisors a base management fee as well as an incentive fee based on our investment performance. Also, we have agreed to pay selling commissions, broker-dealer fees, a dealer manager fee and a servicing fee, and to reimburse Terra Income Advisors for our organization and offering expenses up to a maximum amount equal to 1.5% of the gross proceeds from the Offering. Terra Income Advisors will bear all organization and offering expenses in excess of this amount.
The management of our investment portfolio is the responsibility of Terra Income Advisors and its executive officers. The investment committee of Terra Income Advisors will approve each new investment that we make. Our Board, including a majority of independent directors, oversees and monitors our investment performance and, beginning with the second anniversary of the date of the Investment Advisory Agreement, our Board will annually review the compensation we pay to our Adviser and its performance during the preceding 12 months to determine if the compensation paid to our Adviser is reasonable in relation to the nature and quality of the services performed, and that the provisions of the Investment Advisory Agreement are carried out.
About Terra Capital Partners
Terra Capital Partners, the parent company of Terra Income Advisors, is a real estate finance and investment firm based in New York City that focuses primarily on the origination and management of mezzanine loans, as well as first mortgage loans, bridge loans and preferred equity investments in all major property types. Since its formation in 2001 and its commencement of operations in 2002, Terra Capital Partners has been engaged in providing financing on commercial properties of all major property types throughout the U.S. In the lead up to the global financial crisis in 2007, believing that the risks associated with commercial real estate markets had grown out of proportion to the potential returns from such markets, Terra Capital Partners sold 100% of its interest in its portfolio. It was not until mid-2009, after its assessment that commercial mortgage markets would begin a period of stabilization and growth, that Terra Capital Partners began to sponsor new investment vehicles, which included the Terra Income Funds, to again provide debt capital to commercial real estate markets. The financings provided by vehicles managed by Terra Capital Partners have been secured by approximately 11.0 million square feet of office properties, 5.5 million square feet of land, 3.4 million square feet of retail properties, 3.8 million square feet of industrial properties, 3,828 hotel rooms and 23,674 apartment units. The value of the properties underlying this capital was approximately $6.3 billion based on appraised values as of the closing dates. None of the financings extended by Terra Capital Partners and its affiliates have required foreclosure or suffered any loss of principal. In addition to its extensive experience originating and managing debt financings, Terra Capital Partners and its affiliates have owned and operated over six million square feet of office and industrial space between 2005 and 2007, and this operational experience further informs its robust origination and underwriting standards and would be beneficial should our Adviser need to foreclose on a property underlying a financing. As of the date of this Form 10-K, Terra Capital Partners and its affiliates employed 33 persons.
Terra Capital Partners, led by its Chief Executive Officer, Bruce D. Batkin, and its Chairman, Simon J. Mildé, is owned and operated by highly experienced real estate, finance and securities professionals. Members of the Terra Capital Partners management team have broad based, long-term relationships with major financial institutions, property owners and commercial real estate service providers. They have worked together as a team for 15 years, building on their prior experience in commercial real estate investment, finance, development and asset management. They have held leadership roles at many of the top international real estate and investment banking firms, including Jones Lang Wootton (formerly Jones Lang LaSalle Incorporated and now JLL), Merrill Lynch, Donaldson, Lufkin and Jenrette Securities Corporation (now Credit Suisse (USA) Inc.) and ABN Amro Bank N.V. We believe that the active and substantial ongoing participation of Terra Capital Partners in the real estate finance market, and the depth of experience and disciplined investment approach of its management team will allow Terra Income Advisors to successfully execute our investment strategy.
Investment Objectives and Strategy
Our primary investment objectives are to pay attractive and stable cash distributions and to preserve, protect and return capital contributions to stockholders. Our investment strategy is to use substantially all of the proceeds of the Offering to originate and manage a diversified portfolio consisting of (i) commercial real estate loans to U.S. companies qualifying as “eligible portfolio companies” under the 1940 Act, including mezzanine loans, first and second lien mortgage loans, subordinated mortgage loans, bridge loans and other commercial real estate-related loans related to or secured by high quality commercial real estate in the United States and (ii) preferred equity real estate investments in U.S. companies qualifying as “eligible portfolio companies” under
2
the 1940 Act. We may also purchase select commercial real estate-related debt securities, such as commercial mortgage-backed securities or collateralized debt obligations; provided, however, that we will select all investments after considering its ability to qualify to be taxed as a RIC.
We seek to structure, acquire and maintain a portfolio of investments that generate a stable income stream to enable us to pay attractive and consistent cash distributions to our stockholders. We directly structure, underwrite and originate most of our investments, as we believe that doing so will provide us with the best opportunity to invest in loans that satisfy our standards, establish a direct relationship with the borrower and optimize the terms of our investments; however, we may acquire existing loans from the originating lender should our adviser determine such an investment is in our best interest. We may hold our investments until their scheduled maturity dates or may sell them if we are able to command favorable terms for their disposition. We may also seek to realize growth in the value of our investments by timing their sale to maximize value. We believe that our investment strategy allows us to pay attractive and stable cash distributions to our stockholders and to preserve, protect and return our stockholders’ capital contributions, consistent with our investment objectives.
Terra Income Advisors’ management team has extensive experience in originating, acquiring, structuring, managing and disposing of real estate-related loans similar to the types of loans in which we intend to invest. In order to meet our investment objectives, we generally seek to follow the following investment criteria:
• | focus primarily on the origination of new loans; |
• | focus on loans backed by properties in the United States; |
• | invest primarily in fixed rate rather than floating rate loans, but we reserve the right to make debt investments that bear interest at a floating rate; |
• | invest in loans expected to be repaid within one to five years; |
• | maximize current income; |
• | lend to creditworthy borrowers; |
• | lend on properties that are expected to generate sustainable cash flow; |
• | maximize diversification by property type, geographic location, tenancy and borrower; |
• | source off-market transactions; and |
• | hold investments until maturity unless, in our adviser’s judgment, market conditions warrant earlier disposition. |
While the size of each of our investments generally ranges between $3 million and $20 million, our investments ultimately be at the discretion Terra Income Advisors, subject to oversight by our Board. Prior to raising substantial capital, we may make smaller investments and invest a larger portion of our capital base in cash and cash items (including receivables) and U.S. government securities to enable us to acquire assets that meet our desired investment profile and to meet certain RIC qualification requirements under the Code.
To enhance our returns, we intend to employ leverage as market conditions permit and at the discretion of our Terra Income Advisors, but in no event will leverage employed exceed 50% of the value of our assets, as required by the 1940 Act. See Item 1A “Risk Factors — Risks Related to Debt Financing” for a discussion of the risks inherent in employing leverage.
Business Strategy
In executing our business strategy, we believe that we benefit from Terra Income Advisors’ affiliation with Terra Capital Partners, given its strong track record and extensive experience and capabilities as real estate investment manager and sponsor of the Terra Income Funds. We believe the following core strengths will enable us to realize our investment objectives and provide us with significant competitive advantages in the marketplace, and attractive risk-adjusted returns to our stockholders:
Significant Experience of Our Management Team
Terra Income Advisors has a highly experienced management team with extensive expertise in originating, underwriting, structuring, financing and managing commercial real estate loans and related investments through a variety of credit and interest rate environments and economic cycles. Terra Income Advisors’ senior management team is led by Bruce D. Batkin and Simon J. Mildé, the co-founders of Terra Capital Partners, each of whom has over 35 years in the commercial real estate finance industry, including over 15 years working together at Terra Capital Partners. Messrs. Batkin and Mildé are supported by a team of 15 highly experienced real estate, finance and securities professionals. This team has extensive relationships across the commercial real estate industry, including long-term relationships with major financial institutions, property owners and commercial real estate service providers. We believe that we benefit from Terra Income Advisors’ strong track record and extensive experience and
3
capabilities originating, structuring, financing and managing commercial real estate loans and will continue to do so as we grow our portfolio over time.
Significant Experience of Terra Capital Partners
Terra Capital Partners provides our Terra Income Advisers with all of its key investment personnel. Terra Capital Partners has developed a reputation within the commercial real estate finance industry as a leading sophisticated real estate investment and asset management company with a 15 year track record in originating, underwriting and managing commercial real estate and real estate-related loans, preferred equity investments and investments with similar characteristics to the assets that we acquire. We believe we benefit from the depth and the disciplined approach Terra Capital Partners brings to its underwriting and investment management processes to structure and manage investments prudently. In addition to its extensive experience originating and managing debt financings, Terra Capital Partners and its affiliates have owned and operated over six million square feet of office and industrial space between 2005 and 2007, and this operational experience has further informed its robust origination and underwriting standards.
Disciplined Investment Process
We follow a disciplined investment origination, underwriting and selection process. We follow an investment approach focused on long-term credit performance and capital protection. This investment approach involves a multi-phase evaluation, structuring and monitoring process for each potential investment opportunity. After investment, our management team focuses on a thorough review of our investments for potential credit quality deterioration and potential proactive steps, including making available significant managerial assistance as required by the 1940 Act, to mitigate any losses to our invested capital. We believe this approach maximize current income and minimize capital loss. None of the loans originated by our Adviser and its affiliates have suffered a foreclosure or loss of principal, which we believe is attributable to our Adviser’s rigorous origination, underwriting and selection process.
Portfolio Construction
We construct a portfolio that is diversified by property type, geographic location and borrower. Although we expect to hold our assets for the duration of the expected five-year term of our company, we may decide to sell assets prior to the end of the term in order to maximize stockholder returns.
We construct our portfolio based on our evaluation of the impact of each potential investment on the risk/reward mix in our existing portfolio. By selecting those assets that we believe will maximize stockholder returns while minimizing investment-specific risk, we believe we can build and manage an investment portfolio that provides superior value to stockholders over time, both in absolute terms and relative to other commercial real estate loan and real estate-related investment vehicles.
Superior Analytical Tools
We believe that our management team possesses the superior analytical tools to evaluate each potential investment through the balanced use of qualitative and quantitative analysis, which helps us manage risk on an individual investment and portfolio basis. We rely on a variety of analytical tools and models to assess our investments and risk management. We also conduct an extensive evaluation of the numerous factors that affect our potential investments. These factors include:
• | Top-down review of both the current macroeconomic environment generally and the real estate and commercial real estate loan market specifically; |
• | Detailed evaluation of the real estate industry and its sectors; |
• | Bottom-up review of each individual investment’s attributes and risk/reward profile relative to the macroeconomic environment; |
• | Quantitative cash flow analysis and impact of the potential investment on our portfolio; and |
• | Ongoing management and monitoring of all investments to assess changing conditions on our original investment assumptions. |
Extensive Strategic Relationships
Our management team maintains extensive relationships within the real estate industry, including real estate developers, institutional real estate sponsors and investors, real estate funds, investment and commercial banks, private equity funds, asset originators and broker-dealers, as well as the capital and financing markets generally. We believe these relationships enhance our ability to source and finance our investments as well as mitigate their credit and interest rate risk. We leverage the many years of experience and well-established contacts of our management team, and to use these relationships for the benefit of our stockholders.
4
Market Opportunities
The opportunity for alternative commercial real estate lenders is the direct result of (i) limited supply of commercial real estate debt from banks and securitized lenders due to regulations implemented since the last recession and (ii) strong demand for commercial real estate financing. New regulations, particularly those imposed by or Basel III and the Dodd-Frank Act, have reduced the availability of commercial real estate debt capital from regulated institutions and the commercial mortgage-backed securities (“CMBS”) market. At the same time, demand for commercial real estate debt in the U.S. has been supported by strong economic fundamentals, including employment gains, low inflation and positive gross domestic product growth, while new construction of commercial real estate has been limited relative to historical averages. These fundamentals, as well as abundant domestic and international commercial real estate equity capital available for U.S. commercial real estate, create an opportunity for providers of commercial real estate debt to finance property acquisition, refinancing and development.
Traditional Providers of Commercial Real Estate Debt Have Reduced Availability of Capital
The turmoil in the U.S. mortgage market that commenced with the onset of the global financial crisis in 2008 has diminished the availability of credit for commercial real estate from traditional providers of capital to commercial real estate borrowers. Although credit availability has increased over the past several years, there is an opportunity for alternative commercial real estate debt providers like us to capitalize on the lack of supply created by a more risk-averse credit culture, tighter underwriting standards, a tepid recovery in the CMBS market and changes in the regulatory environment that continue to constrain the lending capacity of large commercial banks and traditional providers of capital.
Stricter Underwriting from a Reduced Number of Banks
Fallout from the 2008 recession has reduced the number of U.S. commercial banks by approximately 25% through a combination of consolidation, failure or overall balance sheet reduction.
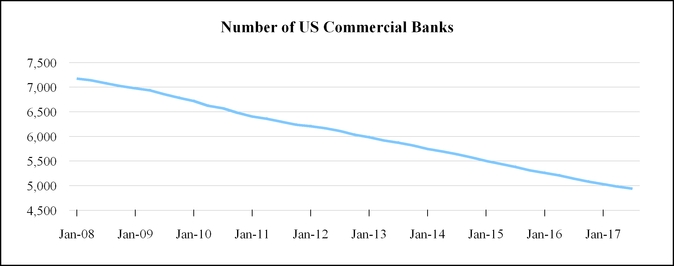
Source: Federal Reserve Bank of St. Louis, October 2017
Those lenders that remain are subject to increased regulations (Dodd-Frank Act and Basel III, the latter of which imposes requirements for higher bank capital charges on certain types of real estate loans) and adhere to mortgage lending practices that are more conservative than prior to the economic crisis. Therefore, those financial institutions still willing to provide capital may not provide sufficient proceeds to meet borrowers’ needs, and many loans that previously would have been provided by a single lender often will require multiple lenders. This provides us, as an alternative lender, with an immediate opportunity to augment loans provided by traditional lenders with subordinated debt and preferred equity, often at higher property valuations, lower loan-to-value ratios and higher returns than prior to the economic crisis. In particular, due to the nature of the underlying assets, there has been less availability of debt capital on transitional properties, as a result of increased capital requirements, which significantly impact the profitability of such loans for financial institutions. We believe this opportunity will continue for the foreseeable future.
According to a survey conducted by the Federal Reserve, in January 2017, despite positive fundamentals in commercial real estate property, the net percentage of domestic respondents reporting tightening standards for commercial real estate loans was the highest since 2009, indicating that the opportunity for alternative providers of commercial real estate debt capital will likely increase.
5
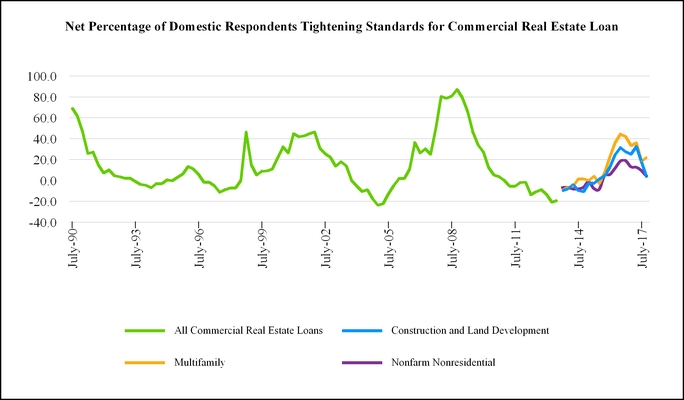
(1) | Data is YTD through October 2017 |
Source: The Federal Reserve Board, October 2017.
Overall CMBS Market Well Below Peak
In addition, enhanced risk-retention requirements for CMBS have increased securitization costs and limited competition from CMBS lenders. This has led to a decrease in CMBS securitizations and issuances that have failed to recover to previous levels, from a peak of $229 billion in 2007 to $76 billion in 2016. Risk retention requirements went into effect on December 24, 2016. A survey of industry professionals published in the market publication Commercial Mortgage Alert has predicted issuance of $75 billion for 2017, indicating an opportunity for additional providers of commercial real estate debt capital to continue to fill a supply gap.
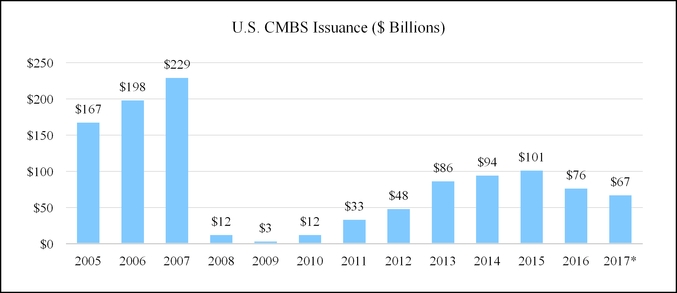
(1) | Data is YTD through September 2017 |
6
(*) Only numbers from the first nine months of 2017 have been reported.
Source: Commercial Mortgage Alert, September 2017.
Lack of Supply of CMBS Debt for Transitional Properties
As a result of the same regulatory constraints impacting the entire CMBS market, floating-rate CMBS effectively disappeared from the marketplace from a peak of $27 billion in 2006. These transactions have historically been secured by transitional properties, similar to many of the loan opportunities that we intend to pursue. With floating-rate CMBS issuance failing to break $2 billion in more than one year (2014), as illustrated by the following table, we believe there is a meaningful void for alternative commercial real estate debt capital providers to fill, a trend we expect to continue.
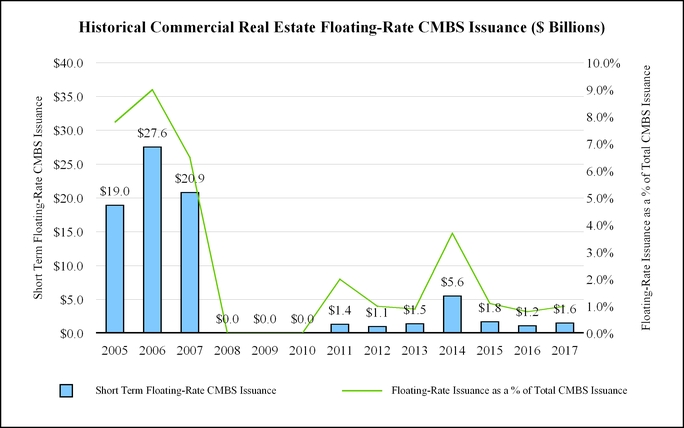
(1) | Data is YTD through September 2017 |
Source: Commercial Mortgage Alert, September 2017.
Supply of Debt Capital Constrained by Regulatory Environment
The Dodd-Frank Act and Basel III have specific provisions targeting commercial real estate debt that have implemented risk-retention requirements for CMBS (in the case of the Dodd-Frank Act) and required higher bank capital charges on certain types of commercial real estate loans (in the case of Basel III). The two primary consequences of these regulations, the goals of which are to reduce the risk from commercial real estate in the banking system, have been to reduce the scope of lending from banks and other regulated financial institutions and to increase the costs for those institutions to provide commercial real estate debt.
In December 2016, the risk-retention rules of the Dodd-Frank Act became effective, requiring that a sponsor of a CMBS transaction retain, directly or indirectly, at least 5% of the credit risk of the securitized assets collateralizing the CMBS. This risk retention requirement can be satisfied through either ‘‘horizontal’’ risk retention where the risk retainer retains a 5% interest representing the most junior tranche in the CMBS securitization or through “vertical” risk retention where the risk retainer ends up retaining a 5% cross section of the entire CMBS securitization or through a combination of horizontal and vertical risk retention. Historically, bank sponsors of CMBS transactions had sold, or attempted to sell, 100% of the securitized assets collateralizing the CMBS. We expect that the impact of this requirement will be a reduction in CMBS volume as transaction costs (and ultimately borrowing costs) increase as a result of regulatory compliance and that some CMBS participants will exit the market.
Basel III increases bank capital requirements while tightening the definition of what can be included in the calculation of capital and revising the methodology of calculating risk-weighted assets, making them more risk sensitive. The effect is a revision
7
to the regulatory capital framework for U.S. banks, requiring banks to increase regulatory capital and decrease risk-weighted assets to achieve compliance with new (higher) risk-based capital ratios. With Basel III, risk-weightings are now higher on certain assets,
specifically certain acquisition, development and construction loans classified as HVCRE which are less profitable under the current framework, incentivizing banks to either adjust pricing on or abandon HVCRE loans entirely. The final Basel III rule requires that banking organizations to assign a higher risk weight of 150% (previously 100%) for HVCRE loans which, due to the breadth of the language and general uncertainty as to the interpretation of the rule, typically includes most transitional commercial real estate loans. This has reduced the availability of commercial real estate debt capital and increased financing costs for borrowers, creating an opportunity for alternative lenders.
Although the regulatory environment will continue to evolve over time, we believe that much of the substantive components of Dodd-Frank and Basel III will continue, and adjustments, if any, will be implemented only over a period of many years (much like the current regulations themselves). We expect that banks and CMBS lenders will continue to predominantly focus on stabilized properties at lower leverage points. As a result, we do not expect the size and breadth of the market opportunity to have significant near-term legislative risk.
Increased Market Share for Alternative Lenders
Non-bank lenders have historically had the advantage of flexibility and execution speed over competing bank and CMBS lenders. With the addition of increased regulatory scrutiny and tightening underwriting standards, the competitive advantage of alternative providers of commercial real estate debt capital has further increased, particularly for non-stabilized properties and new property development, here borrowers increasingly focus on speed and certainty of execution.
This is evident in the fact that the market share of alternative lenders (financial and private/other companies, excluding banks, CMBS, insurance companies, and government agencies) has significantly increased. While alternative lenders made up approximately 5% of the market in 2009, that figure has doubled to approximately 10% in each of the last three years. With an estimated 2017 commercial real estate mortgage origination volume of $537 billion per the Mortgage Bankers Association, this would represent a market share of over $50 billion for alternative lenders.
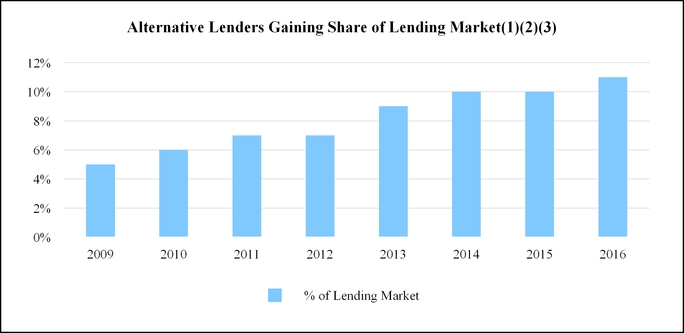
(1) | Alternative includes both financial and private/other companies |
(2) | Based on independent reports of properties and portfolios $2.5 million and greater |
(3) | Data is through December 2016 |
Source: Real Capital Analytics, December 2016
Stronger Real Estate Fundamentals Drive Transaction Volume
The post-crisis expansion of the economy is evident in most metropolitan areas across the county as shown in the chart below, with positive GDP growth and strong gains in employment driving demand for various asset classes within commercial real estate. The breadth of the recovery at this stage creates diverse opportunities for us across many different markets and various asset types. In addition to increases in demand driven by stronger economic growth, higher occupancy levels have been supported by a relative
8
lack of new supply of commercial real estate compared to historical averages, as measured by the amount of new completions as a percentage of existing stock. A relatively stable trend of supply additions allows the market to adjust to changes in demand with less volatility, which creates greater stability in property values over time.
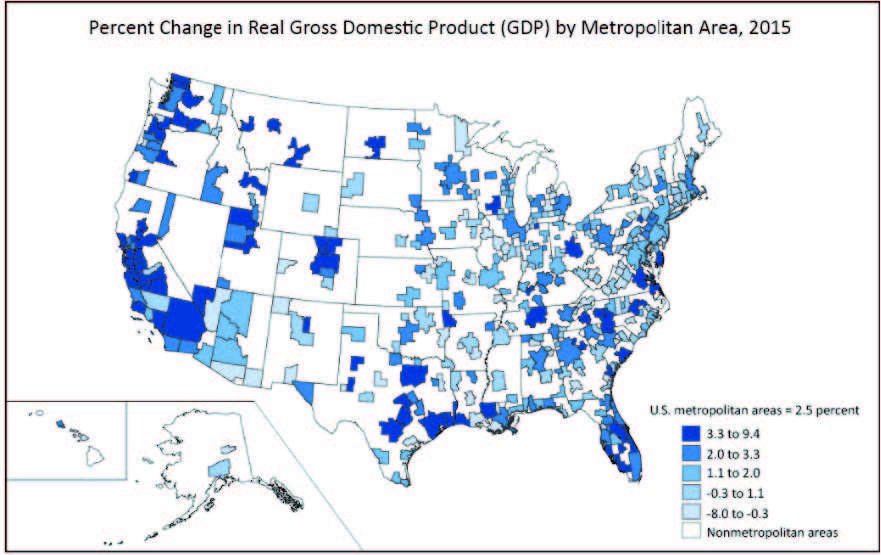
Source: U.S. Bureau of Economic Analysis
Historical commercial real estate transaction volume has increased to near pre-recession levels, driven by both the strength of commercial real estate fundamentals and the abundance of capital, particularly non-domestic, seeking commercial real estate investment opportunities. In fact, excluding entity purchases, the volume of portfolio and individual property transactions has already exceeded the pre-recession peak. Although the total volume decreased from 2015 to 2016, we believe this represents a return to equilibrium, and overall stability in property values, following several years of relative inactivity.
9
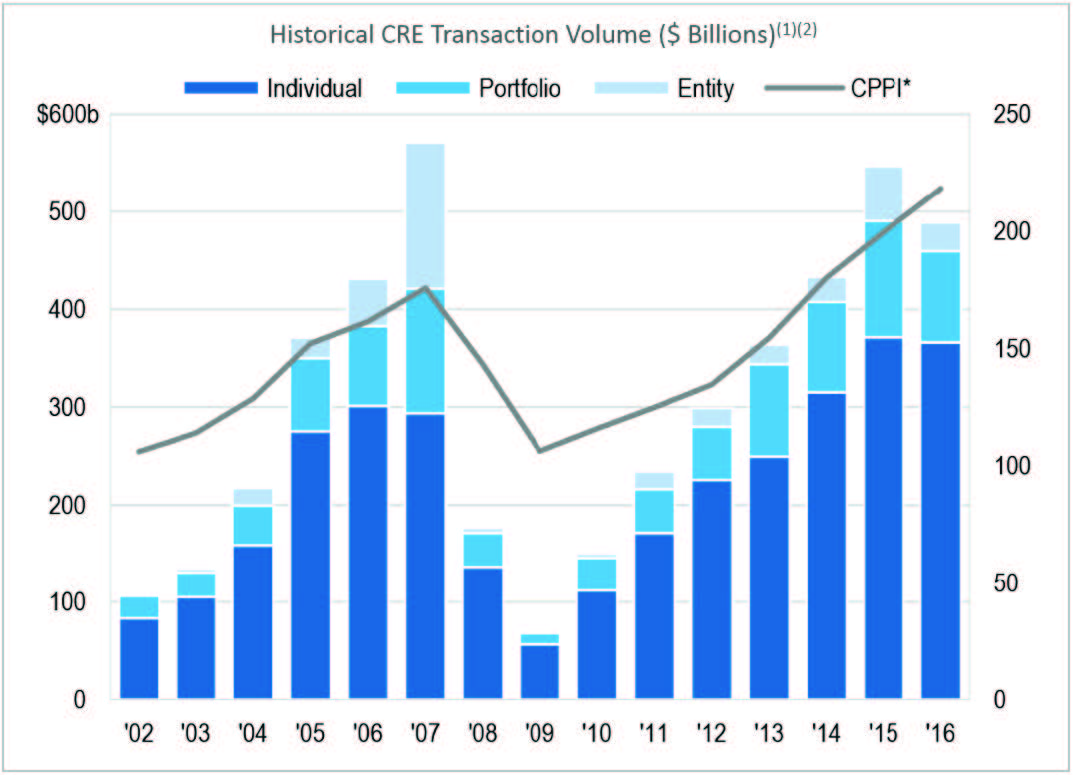
(1) | Based on independent reports of properties and portfolios $2.5 million and greater. Prior to 2005, Real Capital Analytics primarily captured sales valued at $5.0 million and above. |
(2) | Data is through December 2016. |
Source: Real Capital Analytics, December 2016
Unlike the years prior to the last recession, the abundant transaction volume has not eroded lender credit metrics. Comparing loan-to-value, debt yield, and debt service coverage ratio from 2008 to 2016 indicates stricter underwriting standards than at the peak of the previous cycle. This is a result of both increased conservatism on the part of regulated financial institutions and greater discipline on the part of non-bank alternative lenders.
Comparative Commercial Real Estate Loan Metrics (1) | ||||
Metric | 2008 Average | 2016 Average | ||
Loan-to-value | 67.0% | 63.0% | ||
Debt service coverage ratio | 1.29x | 1.66x | ||
Debt yield | 10.1% | 10.2% | ||
(1) | Based on independent reports of properties and portfolios $2.5 million and greater. Includes office, retail, industrial and hotel properties |
Source: Real Capital Analytics, December 2016
The combination of strong property fundamentals, stabilizing transaction volume, disciplined credit metrics and an overall lack of supply of commercial real estate debt should create significant opportunities for us to deploy capital.
10
Targeted Investments
Real Estate-Related Loans
We originate, acquire, fund and structure real estate-related loans, including first and second mortgage loans, mezzanine loans, bridge loans, convertible mortgages and other loans related to high-quality commercial real estate in the U.S. We also acquire some equity participations in the underlying collateral of such loans. We structure, underwrite and originate most if not all of our investments. We use what we consider to be conservative underwriting criteria, and our underwriting process involves comprehensive financial, structural, operational and legal due diligence to assess the risks of investments so that we can optimize pricing and structuring. By originating loans directly, we are able to structure and underwrite loans that satisfy our standards, establish a direct relationship with the borrower and utilize our own documentation. Described below are some of the types of loans we own and may originate.
Mezzanine Loans. These are loans secured by ownership interests in an entity that owns commercial real estate and generally finance the acquisition, refinancing, rehabilitation or construction of commercial real estate. Mezzanine loans may be either short-term (one-to-five year) or long-term (up to 10-year) and may be fixed or floating rate. We may originate mezzanine loans backed by high-quality properties in the U.S. that fit our investment strategy. We may own such mezzanine loans directly or we may hold a participation in a mezzanine loan or a sub-participation in a mezzanine loan. These loans are predominantly current-pay loans (although there may be a portion of the interest that accrues) and may provide for participation in the value or cash flow appreciation of the underlying property as described below. We invest in mezzanine loans with loan-to-value ratios ranging from 60% to 80%. With the credit market disruption and resulting dearth of capital available in this part of the capital structure, we believe that the opportunities to both directly originate and to buy mezzanine loans from third-parties on favorable terms will continue to be attractive.
Preferred Equity Investments. These are investments in preferred membership interests in an entity that owns commercial real estate and generally finance the acquisition, refinancing, rehabilitation or construction of commercial real estate. These investments are expected to have similar characteristics to and returns as mezzanine loans.
Subordinated Mortgage Loans (B-notes). B-notes include structurally subordinated first mortgage loans and junior participations in first mortgage loans or participations in these types of assets. Like first mortgage loans, these loans generally finance the acquisition, refinancing, rehabilitation or construction of commercial real estate. B-notes may be either short-term (one-to-five year) or long-term (up to 10-year), may be fixed or floating rate and are predominantly current-pay loans. We may originate current-pay B-notes backed by high-quality properties in the U.S. that fit our investment strategy. We may create B-notes by tranching our directly originated first mortgage loans generally through syndications of senior first mortgages, or buy such assets directly from third-party originators. Due to the current credit market disruption and resulting dearth of capital available in this part of the capital structure, we believe that the opportunities to both directly originate and to buy B-notes from third-parties on favorable terms will continue to be attractive.
Investors in B-notes are compensated for the increased risk of such assets from a pricing perspective but still benefit from a lien on the related property. Investors typically receive principal and interest payments at the same time as senior debt unless a default occurs, in which case these payments are made only after any senior debt is made whole. Rights of holders of B-notes are usually governed by participation and other agreements that, subject to certain limitations, typically provide the holders of subordinated positions of the mortgage loan with the ability to cure certain defaults and control certain decisions of holders of senior debt secured by the same properties (or otherwise exercise the right to purchase the senior debt), which provides for additional downside protection and higher recoveries.
Bridge Loans. We offer bridge financing products to borrowers who are typically seeking short-term capital to be used in an acquisition, development or refinancing of a given property. From the borrower’s perspective, shorter term bridge financing is advantageous because it allows time to improve the property value through repositioning without encumbering it with restrictive long-term debt. The terms of these loans generally do not exceed three years. Bridge loans may be structured as mezzanine loans, preferred equity or first mortgages.
First Mortgage Loans. These loans generally finance the acquisition, refinancing, rehabilitation or construction of commercial real estate. First mortgage loans may be either short-term (one-to-five year) or long-term (up to 10-year), may be fixed or floating rate and are predominantly current-pay loans. We originate current-pay first mortgage loans backed by high-quality properties in the U.S. that fit our investment strategy. We selectively syndicate portions of these loans, including senior or junior participations that will effectively provide permanent financing or optimize returns which may include retained origination fees.
First mortgages provide for a higher recovery rate and lower defaults than other debt positions due to the lender’s senior position. However, such loans typically generate lower returns than subordinate debt such as mezzanine loans or B-notes.
11
Convertible Mortgages. Convertible mortgages are similar to equity participations (as described below). We may invest in or originate a convertible mortgage if the Adviser concludes that we may benefit from the cash flow or any appreciation in the value of the subject property.
Equity Participations. In connection with our loan origination activities, we may pursue equity participation opportunities, or interests in the projects being financed, in instances when we believe that the risk-reward characteristics of the loan merit additional upside participation because of the possibility of appreciation in value of the underlying assets securing the loan. Equity participations can be paid in the form of additional interest, exit fees or warrants in the borrower. Equity participation can also take the form of a conversion feature, permitting the lender to convert a loan or preferred equity investment into equity in the borrower at a negotiated premium to the current net asset value of the borrower. We expect to be able to obtain equity participations in certain instances where the loan collateral consists of an asset that is being repositioned, expanded or improved in some fashion which is anticipated to improve future cash flow. In such case, the borrower may wish to defer some portion of the debt service or obtain higher leverage than might be merited by the pricing and leverage level based on historical performance of the underlying asset. We generate additional revenues from these equity participations as a result of excess cash flows being distributed or as appreciated properties are sold or refinanced.
Other Real Estate-Related Investments. The Adviser has the right to invest in other real estate-related investments, which may include CMBS or other real estate debt or equity securities, so long as such investments do not constitute more than 15% of our assets. Certain of our real estate-related loans require the borrower to make payments of principal on the fully committed principal amount of the loan regardless of whether the full loan amount is outstanding portfolio.
Regulation
We have elected to be regulated as a BDC under the 1940 Act. As with other companies regulated by the 1940 Act, a BDC must adhere to certain substantive regulatory requirements. The 1940 Act contains prohibitions and restrictions relating to transactions between BDCs and their affiliates (including any investment advisers or sub-advisers), principal underwriters and affiliates of those affiliates or underwriters and requires that a majority of the directors be persons other than “interested persons,” as that term is defined in the 1940 Act. In addition, the 1940 Act provides that we may not change the nature of our business so as to cease to be, or to withdraw our election as, a BDC unless approved by a majority of our outstanding voting securities.
“A majority of the outstanding voting securities” of a company is defined under the 1940 Act as the lesser of: (i) 67% or more of the voting securities of such company present at a meeting if the holders of more than 50% of the company’s outstanding voting securities are present or represented by proxy; or (ii) more than 50% of the outstanding voting securities of such company.
Qualifying Assets
Under the 1940 Act, a BDC may not acquire any asset other than assets of the type listed in Section 55(a) of the 1940 Act, which are referred to as qualifying assets, unless, at the time the acquisition is made, qualifying assets represent at least 70% of the company’s total assets. The principal categories of qualifying assets relevant to our business are the following:
1. | Securities purchased in transactions not involving any public offering from the issuer of such securities, which issuer (subject to certain limited exceptions) is an eligible portfolio company, or from any person who is, or has been during the preceding 13 months, an affiliated person of an eligible portfolio company, or from any other person, subject to such rules as may be prescribed by the SEC. An eligible portfolio company is defined in the 1940 Act as any issuer which: |
a. | is organized under the laws of, and has its principal place of business in, the United States; |
b. | is not an investment company (other than a small business investment company wholly owned by the BDC) or a company that would be an investment company but for certain exclusions under the 1940 Act; and |
c. | satisfies any of the following: |
i. | does not have any class of securities that is traded on a national securities exchange; |
ii. | has a class of securities listed on a national securities exchange, but has an aggregate market value of outstanding voting and non-voting common equity of less than $250 million; |
iii. | is controlled by a BDC or a group of companies including a BDC and the BDC has an affiliated person who is a director of the eligible portfolio company; |
iv. | is a small and solvent company having total assets of not more than $4 million and capital and surplus of not less than $2 million; or |
v. | meets such other criteria as may be established by the SEC. |
2. | Securities of any eligible portfolio company that we control. |
12
3. | Securities purchased in a private transaction from a U.S. issuer that is not an investment company or from an affiliated person of the issuer, or in transactions incident thereto, if the issuer is in bankruptcy and subject to reorganization or if the issuer, immediately prior to the purchase of its securities, was unable to meet its obligations as they came due without material assistance other than conventional lending or financing arrangements. |
4. | Securities of an eligible portfolio company purchased from any person in a private transaction if there is no ready market for such securities and we already own 60% of the outstanding equity of the eligible portfolio company. |
5. | Securities received in exchange for or distributed on or with respect to securities described in (1) through (4) above, or pursuant to the exercise of warrants or rights relating to such securities. |
6. | Cash, cash equivalents, U.S. government securities or high-quality debt securities maturing in one year or less from the time of investment. |
Control, as defined by the 1940 Act, is presumed to exist where a BDC beneficially owns more than 25% of the outstanding voting securities of the portfolio company.
In addition, a BDC must have been organized and have its principal place of business in the U.S. and must be operated for the purpose of making investments in the types of securities in eligible portfolio companies, or in other securities that are consistent with its purpose as a BDC.
Managerial Assistance to Portfolio Companies
In order to count portfolio securities as qualifying assets for the purpose of the 70% test, we must either control the issuer of the securities or must offer to make available to the issuer of the securities (other than small and solvent companies described above) significant managerial assistance; except that, where we purchase such securities in conjunction with one or more other persons acting together, one of the other persons in the group may make available such managerial assistance. Making available significant managerial assistance means, among other things, any arrangement whereby the BDC, through its directors, officers or employees, offers to provide, and, if accepted, does so provide, significant guidance and counsel concerning the management, operations or business objectives and policies of a portfolio company.
Terra Income Advisors or its affiliates may provide such managerial assistance on our behalf to portfolio companies that request this assistance, recognizing that our involvement with each investment will vary based on factors including the size of the company, the nature of our investment, the company’s overall stage of development and our relative position in the capital structure. We may receive fees for these services.
Temporary Investments
Pending investment in other types of “qualifying assets,” as described above, our investments may consist of cash, cash equivalents, U.S. government securities or high-quality debt securities maturing in one year or less from the time of investment, which we refer to, collectively, as temporary investments, so that 70% of our assets are qualifying assets. Typically, we will invest in U.S. Treasury bills or in repurchase agreements, provided that such agreements are fully collateralized by cash or securities issued by the U.S. government or its agencies. A repurchase agreement involves the purchase by an investor, such as us, of a specified security and the simultaneous agreement by the seller to repurchase it at an agreed-upon future date and at a price that is greater than the purchase price by an amount that reflects an agreed-upon interest rate. There is no percentage restriction on the proportion of our assets that may be invested in such repurchase agreements. However, if more than 25% of our total assets constitute repurchase agreements from a single counterparty, we would not meet the asset diversification requirements in order to qualify as a RIC for U.S. income tax purposes. Thus, we do not intend to enter into repurchase agreements with a single counterparty in excess of this limit. Terra Income Advisors will monitor the creditworthiness of the counterparties with which we enter into repurchase agreement transactions.
Indebtedness and Senior Securities
As a BDC, we are permitted, under specified conditions, to issue multiple classes of indebtedness and one class of stock senior to our common stock if our asset coverage, as defined in the 1940 Act, is at least equal to 200% immediately after each such issuance. In addition, while any senior securities remain outstanding, we must generally make provisions to prohibit any distribution to our stockholders or the repurchase of such securities or stock unless we meet the applicable asset coverage ratios at the time of the distribution or repurchase. We may also borrow amounts up to 5% of the value of our total assets for temporary or emergency purposes without regard to asset coverage. For a discussion of the risks associated with leverage, see Item 1A “Risk Factors — Risks Related to Debt Financing” and Item 1A “Risk Factors — Risks Related to Business Development Companies.”
Common Stock
We will generally not be able to issue and sell our common stock at a price per share, after deducting selling commissions, broker-dealer fees, and dealer manager fees, that is below our net asset value (“NAV”) per share. See Item 1A “Risk Factors — Risk
13
Related to Business Development Companies — Regulations governing our operation as a BDC and RIC will affect our ability to raise, and the way in which we raise, additional capital or borrow for investment purposes, which may have a negative effect on our growth.” We may, however, sell our common stock, or warrants, options or rights to acquire our common stock, at a price below the then-current NAV of our common stock if our Board determines that such sale is in our best interests and that of our stockholders, and our stockholders approve such sale. In any such case, the price at which our securities are to be issued and sold may not be less than a price which, in the determination of our Board, closely approximates the market value of such securities (less any distributing commission or discount). We may generally issue new shares of our common stock at a price below NAV per share in rights offerings to existing stockholders, in payment of dividends and in certain other limited circumstances, subject to applicable requirements of the 1940 Act.
Co-Investments
As a BDC, we are subject to certain regulatory restrictions in making our investments. For example, we may be prohibited under the 1940 Act from knowingly participating in certain transactions with our affiliates without the prior approval of our Board who are not interested persons and, in some cases, prior approval by the SEC. The SEC has granted us exemptive relief permitting us, subject to satisfaction of certain conditions, to co-invest in certain privately negotiated investment transactions with certain affiliates of Terra Income Advisors, including the Terra Income Funds, Terra Property Trust, Inc. (“TPT”), Terra Property Trust 2, Inc. (“TPT2”), and any future BDC or closed-end management investment company that is registered under the 1940 Act and is advised by Terra Income Advisors or its affiliated investment advisers (the “Co-Investment Affiliates”). However, we will be prohibited from engaging in certain transactions with our affiliates even under the terms of this exemptive order. We believe this relief will not only enhance our ability to further our investment objectives and strategy, but may also increase favorable investment opportunities for us, in part by allowing us to participate in larger investments, together with our Co-Investment Affiliates, than would be available to us if we had not obtained such relief.
Compliance Policies and Procedures
As a BDC, we and Terra Income Advisors have each adopted and implemented written policies and procedures reasonably designed to prevent violation of the federal securities laws and are required to review these compliance policies and procedures annually for their adequacy and the effectiveness of their implementation. Our chief compliance officer and the chief compliance officer of Terra Income Advisors are responsible for administering these policies and procedures.
Proxy Voting Policies and Procedures
We have delegated our proxy voting responsibility to Terra Income Advisors. The proxy voting policies and procedures of Terra Income Advisors are set forth below. The guidelines are reviewed periodically by Terra Income Advisors and our disinterested directors, and, accordingly, are subject to change. For purposes of these Proxy Voting Policies and Procedures described below, “we” “our” and “us” refers to Terra Income Advisors.
Proxy Policies
As an investment adviser registered under the Advisers Act, we have a fiduciary duty to act solely in the best interests of our clients. As part of this duty, we recognize that we must vote client securities in a timely manner free of conflicts of interest and in the best interests of our clients.
These policies and procedures for voting proxies for our investment advisory clients are intended to comply with Section 206 of, and Rule 206(4)-6 under, the Advisers Act.
We vote proxies relating to our portfolio securities in the best interests of our clients’ stockholders. We review on a case-by-case basis each proposal submitted to a stockholder vote to determine its impact on the portfolio securities held by our clients. Although we generally vote against proposals that may have a negative impact on our clients’ portfolio securities, we may vote for such a proposal if there exist compelling long-term reasons to do so.
Our proxy voting decisions are made by the senior officers who are responsible for monitoring each of our client’s investments. To ensure that our vote is not the product of a conflict of interest, we require that: (i) anyone involved in the decision making process disclose to our Chief Compliance Officer any potential conflict that he or she is aware of and any contact that he or she has had with any interested party regarding a proxy vote; and (ii) employees involved in the decision making process or vote administration are prohibited from revealing how we intend to vote on a proposal in order to reduce any attempted influence from interested parties.
Proxy Voting Records
Investors may obtain information, without charge, regarding how Terra Income Advisors voted proxies with respect to our portfolio securities by making a written request for proxy voting information to: Chief Compliance Officer, Michael S. Cardello.
14
Other
As a BDC, we will be periodically examined by the SEC for compliance with applicable securities laws and related regulations.
We are required to provide and maintain a bond issued by a reputable fidelity insurance company to protect us against larceny and embezzlement. Furthermore, as a BDC, we are prohibited from protecting any director or officer against any liability to us or our stockholders arising from willful misfeasance, bad faith, gross negligence or reckless disregard of the duties involved in the conduct of such person’s office.
Available Information
We are required to file with or submit to the SEC annual, quarterly and current reports, proxy statements and other information meeting the informational requirements of the Exchange Act. We maintain a website at http://www.terrafund6.com, on which we make available, free of charge, our annual report on Form 10-K, quarterly reports on Form 10-Q, current reports on Form 8-K and amendments to those reports as soon as reasonably practicable after we electronically file such material with, or furnish it to, the SEC. Information contained on our website is not incorporated by reference into this annual report on Form 10-K and investors should not consider information contained on our website to be part of this annual report on Form 10-K or any other report we file with the SEC. Investors may also inspect and copy these reports, proxy statements and other information, as well as our registration statement and related exhibits and schedules, at the Public Reference Room of the SEC at 100 F Street, N.E., Washington, D.C. 20549. Investors may obtain information on the operation of the Public Reference Room by calling the SEC at 1-800-732-0330. The SEC maintains an Internet site that contains reports, proxy and information statements and other information filed electronically by us with the SEC, which are available on the SEC’s website at www.sec.gov. Copies of these reports, proxy and information statements and other information may be obtained, after paying a duplicating fee, by electronic request at the following e-mail address: publicinfo@sec.gov, or by writing the SEC’s Public Reference Section, 100 F Street, N.E., Washington, D.C. 20549.
15
Item 1A. Risk Factors.
Investing in our common stock involves a number of significant risks. In addition to the other information contained in this Form 10-K, investors should consider carefully the following information before making an investment in our common stock. If any of the following events occur, our business, financial condition and results of operations could be materially and adversely affected. In such case, the NAV of our common stock could decline, and investors may lose all or part of their investment.
Risks Related to an Investment in Our Common Stock
Investors do not know the purchase price per share at the time they submit their subscription agreements and could receive fewer shares of common stock than anticipated if our Board determines to increase the offering price to comply with the requirement that we avoid selling shares below NAV per share.
The purchase price for our shares is determined at each semi-monthly closing date to ensure that the sales price, after deducting selling commissions, broker-dealer fees, and dealer manager fees, is equal to or greater than the NAV of our shares. As a result, in the event of an increase in our NAV per share, the purchase price may be higher than the prior semi-monthly closing price per share, and therefore an investor may receive a smaller number of shares than if he or she had subscribed at the prior semi-monthly closing price.
The Offering may be deemed to be a “blind pool” offering. An investor may not have the opportunity to evaluate historical data or assess future investments prior to purchasing our shares.
Investors are not able to evaluate the economic merits, transaction terms or other financial or operational data concerning future investments we make using the proceeds from the Offering prior to making a decision to purchase our shares. Investors must rely on Terra Income Advisors to implement our investment policies, to evaluate our investment opportunities and to structure the terms of our investments rather than evaluating our investments in advance of purchasing shares of our common stock. Because investors are not able to evaluate all of our investments in advance of purchasing our shares, the Offering may entail more risk than other types of offerings. This additional risk may hinder investors’ ability to achieve their own personal investment objectives related to portfolio diversification, risk-adjusted investment returns and other objectives.
The Offering is a “best efforts” offering, and if we are unable to raise substantial funds, we will be limited in the number and type of investments we may make, and the value of investors’ investment in us may be reduced in the event our assets under-perform.
The Offering is being made on a best efforts basis, whereby the dealer manager and broker-dealers participating in the Offering are only required to use their best efforts to sell our shares and have no firm commitment or obligation to purchase any of the shares. To the extent that less than the maximum number of shares is subscribed for, the opportunity for the allocation of our investments among various issuers may be decreased, and the returns achieved on those investments may be reduced as a result of allocating all of our expenses over a smaller capital base.
Our shares are not listed on an exchange or quoted through a quotation system, and will not be for the foreseeable future, if ever. Therefore, it is unlikely that investors will be able to sell them and, if they are able to do so, it is unlikely that they will receive a full return of their invested capital.
Our shares are illiquid, and as such there is no secondary market and it is not expected that any will develop in the foreseeable future. Our offering period may extend for an indefinite period, and during that time investors will have limited ability to sell their shares. Therefore, an investment in our shares is not suitable for investors who expect to require short-term liquidity from their investments.
Prior to the return of our stockholders’ capital contributions following repayment of our investments or, in the alternative, the completion of a liquidity event, our share repurchase program may provide a limited opportunity for investors, the return of our stockholders’ capital contributions, subject to certain restrictions and limitations, at a price which may reflect a discount from the purchase price paid for the shares being repurchased.
We are not obligated to provide liquidity to our stockholders by a finite date, either from the repayment to us of our debt investments within a reasonable period of time subsequent to the termination of the Offering or from a liquidity event; therefore, it will be difficult for an investor to sell his or her shares.
We are not obligated to provide liquidity to our stockholders by a finite date, either from the repayment to us of our debt investments within a reasonable period of time subsequent to the termination of the Offering, or from a liquidity event. A liquidity event could include (i) a listing of our shares on a national securities exchange, (ii) the sale of all or substantially all of our assets either on a complete portfolio basis or individually followed by a liquidation or (iii) a merger or another transaction approved by our Board in which our stockholders receive cash or shares of a publicly traded company. However, there can be no assurance that we will return our stockholders’ capital contributions by a specified date following either the repayment to us of our debt investments
16
or the completion of a liquidity event. In such event, the liquidity for an investor’s shares will be limited to our share repurchase program, which we have no obligation to maintain.
The dealer manager in the Offering may be unable to sell a sufficient number of shares for us to achieve our investment objectives.
The dealer manager for the Offering is Terra Capital Markets. There is no assurance that it will be able to sell a sufficient number of shares to allow us to have adequate funds to originate a portfolio of investments and generate income sufficient to cover our expenses. As a result, we may be unable to achieve our investment objectives and investors could lose some or all of the value of their investment.
Because the dealer manager is one of our affiliates, investors will not have the benefit of an independent due diligence review of us by our dealer manager, which is customarily performed in firm commitment offerings; the absence of an independent due diligence review increases the risks and uncertainty investors face as a stockholder.
The dealer manager is one of our affiliates. As a result, its due diligence review and investigation of us and this Form 10-K cannot be considered to be an independent review. Therefore, investors do not have the benefit of an independent review and investigation of the Offering of the type normally performed by an unaffiliated, independent underwriter in a firm commitment public securities offering.
Our ability to conduct the Offering successfully depends, in part, on the ability of the dealer manager to establish, operate and maintain a network of broker-dealers.
The success of the Offering, and correspondingly our ability to implement our business strategy, depends upon the ability of the dealer manager to establish, operate and maintain a network of licensed securities broker-dealers and other agents to sell our shares. If the dealer manager fails to perform, we may not be able to raise adequate proceeds through the Offering to implement our investment strategy. If we are unsuccessful in implementing our investment strategy, investors could lose all or a part of their investment.
The U.S. Department of Labor’s regulation expanding the definition of fiduciary investment advice under ERISA could adversely affect our financial condition and results of operations.
On April 6, 2016, the U.S. Department of Labor (the “DOL”) issued its final regulation redefining “investment advice fiduciary” under the Employee Retirement Income Security Act (“ERISA”) and the Internal Revenue Code. The final regulation significantly expands the class of advisers and the scope of investment advice that are subject to fiduciary standards, imposing the same fiduciary standards on advisers to individual retirement accounts that have historically only applied to plans covered by ERISA. The DOL also finalized certain prohibited transaction exemptions that allow investment advisers to receive compensation for providing investment advice under arrangements that would otherwise be prohibited due to conflicts of interest. The DOL regulations became effective on April 10, 2017, but financial institutions relying on the “Best Interest Contract Exemption” will be permitted to comply with only a limited set of requirements through July 1, 2019, and that deadline may be revised or extended further. Because the changes required by the DOL regulations are triggering significant changes in the operations of financial advisors and broker-dealers, the implementation of the regulations may impact our ability to raise funds and thereby may impact our financial condition and results of operations.
The implementation of changes to investor account statements described in Financial Industry Regulatory Authority Regulatory Notice 15-02 may impact our ability to raise funds.
The SEC has approved amendments to the rules of the Financial Industry Regulatory Authority, Inc. (“FINRA”) applicable to securities of direct participation programs and non-listed real estate investment trusts. The amendments, which became effective on April 11, 2016, provide, among other things, that (i) FINRA members must include in customer account statements the per share estimated value of the non-listed entity, which must be developed using a methodology reasonably designed to ensure the per share estimated value’s reliability; and (ii) per share estimated value disclosed from and after 150 days following the second anniversary of the admission of stockholders of the non-listed entity’s public offering must be based on an appraised valuation methodology developed by, or with the material assistance of, a third-party expert and updated on at least an annual basis. For direct participation programs subject to the 1940 Act, the appraised valuation methodology must be consistent with the valuation requirements of the 1940 Act, which is consistent with our current practice. The rule changes also provide that account statements must include additional disclosure regarding the sources of distributions to stockholders of unlisted entities. It is not practicable at this time to determine whether these rules will adversely affect market demand for shares of direct participation programs. We will continue to assess the potential impact of the rule changes on our business. There can be no assurances regarding the impact of these rule changes on our current offering and our ability to raise sufficient amounts of capital.
17
We intend to offer to repurchase shares on a quarterly basis pursuant to our share repurchase program. Only a limited number of shares may be repurchased, however, and, to the extent investors are able to sell their shares under our share repurchase program, they may not be able to recover the amount of their investment in those shares.
We intend to conduct tender offers to allow investors to tender their shares on a quarterly basis at a price equal to the most recently disclosed NAV per share immediately prior to the date of repurchase. The share repurchase program includes numerous restrictions that limit investors’ ability to sell their shares. We intend to limit the number of shares repurchased pursuant to our share repurchase program as follows: (i) we currently intend to limit the number of shares to be repurchased during any calendar year to the number of shares we can repurchase with the proceeds we receive from the sale of shares of our common stock under our distribution reinvestment plan, although at the discretion of our Board, we may also use cash on hand, cash available from borrowings and cash from liquidation of securities investments as of the end of the applicable period to repurchase shares; (ii) we intend to limit the number of shares to be repurchased in any calendar quarter to 2.5% of the weighted average number of shares outstanding in the prior calendar year, or 10% in each calendar year (though the actual number of shares that we offer to repurchase may be less in light of the limitations noted above); (iii) unless an investor tenders all of his or her shares, he or she must tender at least 25% of the number of shares he or she has purchased and must maintain a minimum balance of $5,000 subsequent to submitting a portion of his or her shares for repurchase by us; and (iv) to the extent that the number of shares tendered for repurchase exceeds the number of shares that we are able to purchase, we will repurchase shares on a pro rata basis, not on a first-come, first-served basis. Further, we will have no obligation to repurchase shares if the repurchase would violate the restrictions on distributions under federal law or Maryland law, which prohibits distributions that would cause a corporation to fail to meet statutory tests of solvency. Any of the foregoing limitations may prevent us from accommodating all repurchase requests made in any year.
In addition, our Board may amend, suspend or terminate the share repurchase program upon 30 days’ notice. We will notify each investor of such developments (i) in our quarterly reports or (ii) by means of a separate mailing to each investor, accompanied by disclosure in a current or periodic report under the Exchange Act. In addition, although we have adopted a share repurchase program, we have discretion to not repurchase any investor’s shares, to suspend the share repurchase program and to cease repurchases. This may occur, for example, if we are unable to raise a sufficient amount of capital in the Offering. Further, the share repurchase program has many limitations and should not be relied upon as a method to sell shares promptly or at a desired price.
The timing of our repurchase offers pursuant to our share repurchase program may be disadvantageous to our stockholders.
When we make quarterly repurchase offers pursuant to our share repurchase program, we may offer to repurchase shares at a price that is lower than the price that investors paid for shares in the Offering. As a result, to the extent investors have the ability to sell their shares to us as part of our share repurchase program, the price at which an investor may sell shares, which will be the most recently disclosed NAV per share immediately prior to the date of repurchase, may be lower than what an investor paid in connection with the purchase of shares in the Offering.
In addition, in the event an investor chooses to participate in our share repurchase program, the investor will be required to provide us with notice of intent to participate prior to knowing what the repurchase price will be on the repurchase date. Although an investor will have the ability to withdraw a repurchase request prior to the repurchase date, to the extent an investor seeks to sell shares to us as part of our share repurchase program, the investor will be required to do so without knowledge of what the repurchase price of our shares will be on the repurchase date.
We may be unable to invest a significant portion of the net proceeds of the Offering on acceptable terms in an acceptable timeframe.
Delays in investing the net proceeds of the Offering may impair our performance. We cannot assure investors that we will be able to identify any investments that meet our investment objectives or that any investment that we make will produce a positive return. We may be unable to invest the net proceeds of the Offering on acceptable terms within the time period that we anticipate or at all, which could harm our financial condition and operating results.
In addition, even if we are able to raise significant proceeds, we are not permitted to use such proceeds to co-invest with certain entities affiliated with Terra Income Advisors in transactions originated by it or its affiliates unless such co-investments are permitted by an exemptive order from the SEC, or unless we co-invest alongside Terra Income Advisors or its affiliates in accordance with existing regulatory guidance and the allocation policies of Terra Income Advisors and its affiliates, as applicable. The SEC has granted us exemptive relief from the provisions of Sections 17(d) and 57(a)(4) of the 1940 Act, thereby permitting us, subject to the satisfaction of certain conditions, to co-invest in certain privately negotiated investment transactions with our Co-Investment Affiliates. However, we will be prohibited from engaging in certain transactions with our affiliates even under the terms of this exemptive order.
We may pay distributions from offering proceeds, borrowings or the sale of assets to the extent our cash flows from operations, net investment income or earnings are not sufficient to fund declared distributions.
We may fund distributions from the uninvested proceeds of the Offering and borrowings, and we have not established limits on the amount of funds we may use from net offering proceeds or borrowings to make any such distributions. We may pay
18
distributions from the sale of assets to the extent distributions exceed our earnings or cash flows from operations. Distributions from the proceeds of the Offering or from borrowings could reduce the amount of capital we ultimately invest in our portfolio companies. As of September 30, 2017, a significant portion of the distributions paid to our stockholders constituted returns of capital.
A stockholder’s interest in us will be diluted if we issue additional shares, which could reduce the overall value of an investment in us.
Our investors do not have preemptive rights to any shares we issue in the future. Our charter authorizes us to issue 500,000,000 shares of stock, par value $0.001 per share, of which 450,000,000 shares are classified as common stock and 50,000,000 shares are classified as preferred stock. Pursuant to our charter, a majority of our entire Board may amend our charter from time to time to increase or decrease the aggregate number of authorized shares of stock or the number of authorized shares of stock of any class or series without stockholder approval. After an investor purchases shares, our Board may authorize us to sell additional shares in the future, issue equity interests in private offerings or issue share-based awards to our independent directors or employees of Terra Income Advisors. To the extent we issue additional equity interests after an investor purchases our shares, an investor’s percentage ownership interest in us will be diluted. In addition, depending upon the terms and pricing of any additional offerings and the value of our investments, an investor may also experience dilution in the book value and fair value of his or her shares.
Certain provisions of our charter and bylaws, as well as provisions of the Maryland General Corporation Law, could deter takeover attempts and have an adverse impact on the value of our common stock.
The Maryland General Corporation Law (the “MGCL”), and our charter and bylaws contain certain provisions that may have the effect of discouraging, delaying or making difficult a change in control of our company or the removal of our incumbent directors. We will be covered by the Business Combination Act of the MGCL, pursuant to which certain business combinations between us and an “interested stockholder” (defined generally to include any person who beneficially owns, directly or indirectly, 10% or more of the voting power of our outstanding voting stock) or an affiliate thereof are prohibited for five years and thereafter are subject to supermajority stockholder voting requirements, to the extent that such statute is not superseded by applicable requirements of the 1940 Act. However, our Board has adopted a resolution exempting from the Business Combination Act any business combination between us and any person to the extent that such business combination receives the prior approval of our Board, including a majority of our directors who are not interested persons as defined in the 1940 Act. Under the Control Share Acquisition Act of the MGCL, “control shares” acquired in a “control share acquisition” have no voting rights except to the extent approved by a vote of stockholders entitled to cast two-thirds of the votes entitled to be cast on the matter, excluding shares owned by the acquirer, by officers or by employees who are directors of the corporation. Our bylaws contain a provision exempting from the Control Share Acquisition Act any and all acquisitions by any person of shares of our common stock. The Business Combination Act (if our Board should repeal the resolution or fail to first approve a business combination) and the Control Share Acquisition Act (if we amend our bylaws to be subject to that Act) may discourage others from trying to acquire control of us and increase the difficulty of consummating any offer. We will not amend our bylaws to remove the current exemption from the Control Share Acquisition Act without a formal determination by our board of directors that doing so would be in the best interests of our stockholders, and without first notifying the SEC in writing.
In addition, at any time that we have a class of equity securities registered under the Exchange Act and we have at least three independent directors, certain provisions of the MGCL permit our Board, without stockholder approval and regardless of what is currently provided in our charter or bylaws, to implement certain takeover defenses, including increasing the vote required to remove a director.
Moreover, our Board may, without stockholder action, authorize the issuance of shares of stock in one or more classes or series, including preferred stock; and our Board may, without stockholder action, amend our charter from time to time to increase or decrease the aggregate number of shares of stock or the number of shares of stock of any class or series that we have authority to issue.
Our Board is also divided into three classes of directors serving staggered three-year terms, with the term of office of only one of the three classes expiring each year. The classified board provision could have the effect of making the replacement of incumbent directors more time-consuming and difficult. At least two annual meetings of stockholders, instead of one, will generally be required to effect a change in a majority of the Board. Thus, the classified board provision could increase the likelihood that incumbent directors will retain their positions.
These provisions may inhibit a change of control in circumstances that could give the holders of our common stock the opportunity to realize a premium over the value of our common stock.
19
Risks Related to Our Business and Structure
Our Board may change our operating policies, objectives or strategies without prior notice or stockholder approval, and the effects of such a change may be adverse.
Our Board has the authority to modify or waive our current operating policies, objectives or investment criteria and strategies without prior notice and without stockholder approval. We cannot predict the effect any changes to our current operating policies, investment criteria and strategies would have on our business, NAV, operating results and the value of our stock. However, the effects might be adverse, which could negatively impact our ability to pay distributions and cause investors to lose all or part of their investment. Moreover, we will have significant flexibility in investing the net proceeds of the Offering and may use the net proceeds from the Offering in ways with which investors may not agree or for purposes other than those contemplated at the time of the Offering. Finally, since our shares are not expected to be listed on a national securities exchange, investors will be limited in their ability to sell their shares in response to any changes in our investment policy, operating policies, investment criteria or strategies.
Economic activity in the United States was adversely impacted by the global financial crisis of 2008 and future recessions, downturns, disruptions or instability could have a materially adverse effect on our business.
From time to time, the global capital markets may experience periods of disruption and instability, which could cause disruptions in liquidity in the debt capital markets, significant write-offs in the financial services sector, the re-pricing of credit risk in the broadly syndicated credit market and the failure of major financial institutions. Despite actions of U.S. and foreign governments, these events could contribute to worsening general economic conditions that materially and adversely impact the broader financial and credit markets and reduce the availability of debt and equity capital for the market as a whole and financial services firms in particular.
Beginning in the third quarter of 2007, global credit and other financial markets suffered substantial stress, volatility, illiquidity and disruption. These forces reached extraordinary levels in late 2008, resulting in the bankruptcy of, the acquisition of, or government intervention in the affairs of several major domestic and international financial institutions. In particular, the financial services sector was negatively impacted by significant write-offs as the value of the assets held by financial firms declined, impairing their capital positions and abilities to lend and invest. We believe that such value declines were exacerbated by widespread forced liquidations as leveraged holders of financial assets, faced with declining prices, were compelled to sell to meet margin requirements and maintain compliance with applicable capital standards. Such forced liquidations also impaired or eliminated many investors and investment vehicles, leading to a decline in the supply of capital for investment and depressed pricing levels for many assets. These events significantly diminished overall confidence in the debt and equity markets, engendered unprecedented declines in the values of certain assets, and caused extreme economic uncertainty.
Deterioration of economic and market conditions in the future could negatively impact credit spreads as well as our ability to obtain financing, particularly from the debt markets.
Concerns over U.S. fiscal policy could have a material adverse effect on our business, financial condition and results of operations.
In prior years, financial markets were affected by significant uncertainty relating to the stability of U.S. fiscal and budgetary policy. Any continuing uncertainty, together with the continuing U.S. debt and budget deficit concerns, could contribute to a U.S. economic slowdown. The impact of U.S. fiscal uncertainty is inherently unpredictable and could adversely affect U.S. and global financial markets and economic conditions. These developments could cause interest rates and borrowing costs to rise, which may negatively impact our ability to access the debt markets on favorable terms. Continued adverse economic conditions could have a material adverse effect on our business, financial condition and results of operations.
Our ability to achieve our investment objectives depends on Terra Income Advisors’ ability to manage and support our investment process. If Terra Income Advisors were to lose any members of its senior management team, our ability to achieve our investment objectives could be significantly harmed.
Since we have no employees, we depend on the investment expertise, skill and network of business contacts of Terra Income Advisors, which evaluates, negotiates, structures, executes, monitors and services our investments. Our future success depends to a significant extent on the continued service and coordination of Terra Income Advisors and its senior management team. The departure of any members of Terra Income Advisors’ senior management team could have a material adverse effect on our ability to achieve our investment objectives.
Our ability to achieve our investment objectives depends on Terra Income Advisors’ ability to identify, analyze, invest in, finance and monitor companies that meet our investment criteria. Terra Income Advisors’ capabilities in structuring the investment process, providing competent, attentive and efficient services to us, and facilitating access to financing on acceptable terms depend on the employment of investment professionals in an adequate number and of adequate sophistication to match the corresponding flow of transactions. To achieve our investment objectives, Terra Income Advisors may need to hire, train, supervise and manage
20
new investment professionals to participate in our investment selection and monitoring process. Terra Income Advisors may not be able to find investment professionals in a timely manner or at all. Failure to support our investment process could have a material adverse effect on our business, financial condition and results of operations.
In addition, the Investment Advisory Agreement has termination provisions that allow the parties to terminate the agreements without penalty. The Investment Advisory Agreement may be terminated at any time, without penalty, by Terra Income Advisors, upon 120 days’ notice to us. The termination of this agreement may adversely impact the terms of any financing facility into which we may enter, which could have a material adverse effect on our business and financial condition.
Because our business model depends to a significant extent upon relationships with real estate and real estate-related industry participants, investment banks and commercial banks, the inability of Terra Income Advisors to maintain or develop these relationships, or the failure of these relationships to generate investment opportunities, could adversely affect our business.
We expect that Terra Income Advisors will depend on its relationships with real estate and real estate-related industry participants, investment banks and commercial banks, and we will rely to a significant extent upon these relationships, to provide us with potential investment opportunities. If Terra Income Advisors fails to maintain its existing relationships or develop new relationships or sources of investment opportunities, we may not be able to grow our investment portfolio. In addition, individuals with whom Terra Income Advisors has relationships are not obligated to provide us with investment opportunities, and therefore there is no assurance that such relationships will generate investment opportunities for us.
We may face increasing competition for investment opportunities, which could delay deployment of our capital, reduce returns and result in losses.
We compete for investments with other alternative investment funds (including real estate and real estate-related investment funds, mezzanine funds and collateralized loan obligation (“CLO”) funds), as well as traditional financial services companies such as commercial banks and other sources of funding. Moreover, alternative investment vehicles, such as hedge funds, have begun to invest in areas in which they have not traditionally invested, including assets of the type we intend to acquire. As a result of these new entrants, competition for investment opportunities in private real estate and real estate-related U.S. companies may intensify. Many of our competitors are substantially larger and have considerably greater financial, technical and marketing resources than we do. For example, some competitors may have a lower cost of capital and access to funding sources that are not available to us. In addition, some of our competitors may have higher risk tolerances or different risk assessments than we have. These characteristics could allow our competitors to consider a wider variety of investments, establish more relationships and demand more favorable investment terms and more flexible structuring than we are able to do. We may lose investment opportunities if we do not match our competitors’ pricing, terms and structure. If we are forced to match our competitors’ terms and structure, we may not be able to achieve acceptable returns on our investments or may bear substantial risk of capital loss.
A significant portion of our investment portfolio is and will be recorded at fair value as determined in good faith by our Board and, as a result, there is and will be uncertainty as to the value of our portfolio investments.
Under the 1940 Act, we are required to carry our portfolio investments at market value or, if there is no readily available market value, at fair value as determined by our Board. There is not a public market for the securities of the privately held real estate and real estate-related companies in which we invest. Many of our investments are not publicly traded or actively traded on a secondary market but are, instead, traded on a privately negotiated over-the-counter secondary market for institutional investors. As a result, we value these securities quarterly at fair value as determined in good faith by our Board.
Certain factors that may be considered in determining the fair value of our investments include dealer quotes for securities traded on the secondary market for institutional investors, the nature and realizable value of any collateral, the portfolio company’s earnings and its ability to make payments on its indebtedness, the markets in which the portfolio company does business, comparison to comparable publicly traded companies, discounted cash flow and other relevant factors. Because such valuations, and particularly valuations of private securities and private companies, are inherently uncertain, may fluctuate over short periods of time and may be based on estimates, our determinations of fair value may differ materially from the values that would have been used if a ready market for these non-traded securities existed. Due to this uncertainty, our fair value determinations may cause our NAV on a given date to materially understate or overstate the value that we may ultimately realize upon the sale of one or more of our investments.
There is a risk that investors in our common stock may not receive distributions or that our distributions will not grow over time.
We cannot assure investors that we will achieve investment results that will allow us to make a specified level of cash distributions or year-to-year increases in cash distributions. All distributions will be paid at the discretion of our Board and will depend on our earnings, our net investment income, our financial condition, maintenance of our RIC status, compliance with applicable BDC regulations and such other factors as our Board may deem relevant from time to time. In addition, due to the asset coverage test applicable to us as a BDC, we may be limited in our ability to make distributions.
21
Our distribution proceeds may exceed our earnings, particularly during the period before we have substantially invested the net proceeds from the Offering. Therefore, portions of the distributions that we make may represent a return of capital to investors for tax purposes, which will lower investors’ tax basis in their shares.
In the event that we encounter delays in locating suitable investment opportunities, we may pay all or a substantial portion of our distributions from the proceeds of the Offering or from borrowings in anticipation of future cash flow, which may constitute a return of stockholder capital and will lower investors’ tax basis in their shares. A return of capital generally is a return of each investor’s investment rather than a return of earnings or gains derived from our investment activities and will be made after deducting the fees and expenses payable in connection with the Offering, including any fees payable to Terra Income Advisors. As of September 30, 2017, a significant portion of the distributions paid to our stockholders constituted returns of capital.
Changes in laws or regulations governing our operations or the operations of our business partners may adversely affect our business or cause us to alter our business strategy.
We and our portfolio companies are subject to regulation at the local, state and federal level. New legislation may be enacted or new interpretations, rulings or regulations could be adopted, including those governing the types of investments we are permitted to make, any of which could harm us and our stockholders, potentially with retroactive effect. Changes in laws or regulations governing the operations of those with whom we do business, including selected broker-dealers selling our shares, could also have a material adverse effect on our business, financial condition and results of operations.
In addition, any changes to the laws and regulations governing our operations relating to permitted investments may cause us to alter our investment strategy to avail ourselves of new or different opportunities. Such changes could result in material differences to our strategies and plans as set forth in this Form 10-K and may result in our investment focus shifting from the areas of expertise of Terra Income Advisors to other types of investments in which Terra Income Advisors may have less expertise or little or no experience. Thus, any such changes, if they occur, could have a material adverse effect on our results of operations and the value of each investor’s investment.
We are an “emerging growth company” under the federal securities laws and will be subject to reduced public company reporting requirements.
We are an “emerging growth company,” as defined in the Jumpstart Our Business Startups Act (the “JOBS Act”), which was enacted on April 5, 2012. For as long as we continue to be an emerging growth company, we may take advantage of certain exemptions from, or reduced disclosure obligations relating to, various reporting requirements that are normally applicable to public companies.
We could remain an “emerging growth company” for up to five years from the date of commencement of the Offering, or until the earliest of (i) the last day of the first fiscal year in which we have total annual gross revenue of $1.07 billion or more, (ii) the date that we become a “large accelerated filer” as defined in Rule 12b-2 under the Exchange Act (which would occur if the market value of our common stock held by non-affiliates exceeds $700 million, measured as of the last business day of our most recently completed second fiscal quarter, and we have been publicly reporting for at least 12 months) or (iii) the date on which we have issued more than $1.07 billion in non-convertible debt during the preceding three-year period.
Under the JOBS Act, emerging growth companies are not required to (i) provide an auditor’s attestation report on management’s assessment of the effectiveness of internal control over financial reporting, pursuant to Section 404 of the Sarbanes-Oxley Act of 2002, (ii) comply with new requirements adopted by the Public Company Accounting Oversight Board (the “PCAOB”), which require mandatory audit firm rotation or a supplement to the auditor’s report in which the auditor must provide additional information about the audit and the issuer’s financial statements, (iii) comply with new audit rules adopted by the PCAOB after April 5, 2012 (unless the SEC determines otherwise), (iv) provide certain disclosures relating to executive compensation generally required for larger public companies or (v) hold stockholder advisory votes on executive compensation. We have not yet made a decision as to whether to take advantage of any or all of the JOBS Act exemptions that are applicable to us. If we do take advantage of any of these exemptions, we do not know if some investors will find our common stock less attractive as a result.
Additionally, the JOBS Act provides that an “emerging growth company” may take advantage of an extended transition period for complying with new or revised accounting standards that have different effective dates for public and private companies. This means that an emerging growth company can delay adopting certain accounting standards until such standards are otherwise applicable to private companies. However, we are electing to opt out of such extended transition period, and will therefore comply with new or revised accounting standards on the applicable dates on which the adoption of such standards is required for non-emerging growth companies. Section 107 of the JOBS Act provides that our decision to opt out of such extended transition period for compliance with new or revised accounting standards is irrevocable.
22
As a public company, we are subject to regulations not applicable to private companies, such as provisions of the Sarbanes-Oxley Act. Efforts to comply with such regulations involves significant expenditures, and non-compliance with such regulations may adversely affect us.
As a public company, we are subject to regulations not applicable to private companies, including provisions of the Sarbanes-Oxley Act and the related rules and regulations promulgated by the SEC. Beginning with our fiscal year ending September 30, 2017, our management will be required to report on our internal control over financial reporting pursuant to Section 404 of the Sarbanes-Oxley Act and rules and regulations of the SEC thereunder. We will be required to review on an annual basis our internal control over financial reporting, and on a quarterly and annual basis, to evaluate and disclose changes in our internal control over financial reporting. As a newly formed company, developing an effective system of internal controls may require significant expenditures, which may negatively impact our financial performance and our ability to make distributions. This process diverts management’s time and attention. We cannot be certain as to the timing of the completion of our evaluation, testing and remediation actions or the impact of the same on our operations, and we may not be able to ensure that the process is effective or that our internal control over financial reporting is or will be effective in a timely manner. In the event that we are unable to develop or maintain an effective system of internal controls and maintain or achieve compliance with the Sarbanes-Oxley Act and related rules, we may be adversely affected.
The impact of financial reform legislation and legislation promulgated thereunder on us is uncertain.
The Dodd-Frank Wall Street Reform and Consumer Protection Act (the “Dodd-Frank Act”), enacted in 2010, instituted a wide range of reforms that will have an impact on all financial institutions. Many of the requirements called for in the Dodd-Frank Act will be implemented over time, most of which will be subject to implementing regulations over the course of several years. Many of these regulations have yet to be promulgated or are only recently promulgated. In addition, President Donald J. Trump has promised and issued several executive orders in 2017 intended to relieve the financial burden created by the Dodd-Frank Act, although these executive orders only set forth several general principles to be followed by the federal agencies and do not mandate the wholesale repeal of the Dodd-Frank Act. Given the uncertainty associated with the manner in which the provisions of the Dodd-Frank Act will be implemented by the various regulatory agencies and through regulations, the full impact such requirements will have on our business, results of operations or financial condition is unclear. The changes resulting from the Dodd-Frank Act may require us to invest significant management attention and resources to evaluate and make necessary changes in order to comply with new statutory and regulatory requirements. Failure to comply with any such laws, regulations or principles, or changes thereto, may negatively impact our business, results of operations and financial condition. While we cannot predict what effect any changes in the laws or regulations or their interpretations would have on us, these changes could be materially adverse to us and our stockholders.
We may experience fluctuations in our quarterly results.
We could experience fluctuations in our quarterly operating results due to a number of factors, including our ability or inability to make investments in companies that meet our investment criteria, the interest rate payable on the debt securities we originate and acquire, the level of our expenses, variations in and the timing of the recognition of realized and unrealized gains or losses, the degree to which we encounter competition in our markets and general economic conditions. As a result of these factors, results for any previous period should not be relied upon as being indicative of performance in future periods.
Risks Related to Terra Income Advisors and its Affiliates
We were the first publicly registered investment program sponsored by Terra Capital Partners and its affiliates, and therefore investors should not assume that the prior performance of any Terra Income Funds will be indicative of our future performance, or that our officers’ experience in managing those Terra Income Funds will be indicative of their ability to manage a publicly registered company. In addition, Terra Income Advisors has no prior experience managing a BDC or a RIC. Therefore investors should not assume that their experience in managing private investment programs will be indicative of their ability to comply with BDC and RIC election requirements.
We were the first publicly registered investment program sponsored by Terra Capital Partners and its affiliates. Because previous programs and investments sponsored by Terra Capital Partners or its affiliates were not publicly registered, those previous programs, including the Terra Income Funds, were not subject to the same limitations, restrictions and regulations to which we will be subject. Our officers have never operated a publicly registered investment program before. Operation as a publicly registered program under the Securities Act and the Exchange Act imposes a number of disclosure requirements and obligations, including among other things:
• | compliance with reporting, record keeping, voting, proxy disclosure and other rules and regulations that would significantly change our operations from those of the Terra Income Funds; |
• | disclosure requirements with respect to investment activities, which are publicly available to our competitors; |
• | requirements with respect to implementation of disclosure controls and procedures over financial reporting; |
23
• | preparation of annual, quarterly and current reports in compliance with SEC requirements and to be filed with the SEC and made publicly available; and |
• | additional liabilities imposed on our directors and officers regarding certifications and disclosures made in periodic reports and filings made with the SEC. |
In addition, the costs associated with registration as a public company and compliance with such restrictions could be substantial. These costs will reduce the amount available for distribution to our investors. In addition, these requirements would require a substantial amount of time on the part of Terra Income Advisors and its affiliates, thereby decreasing the time they spend actively managing our investments. As a result, investors should not assume that the prior performance of those programs will be indicative of our future performance, or that our officers’ experience in managing those Terra Income Funds will be indicative of their ability to manage a publicly registered company.
Those private funds, including the Terra Income Funds, did not elect to be treated as BDCs or to be taxed as RICs, and were therefore not subject to the investment restrictions imposed by the 1940 Act or the Code, respectively. The 1940 Act and the Code impose numerous constraints on the operations of BDCs and RICs that do not apply to the other types of investment vehicles. For example, under the 1940 Act, BDCs are required to invest at least 70% of their total assets primarily in securities of qualifying U.S. private or thinly traded public companies. Moreover, qualification for RIC tax treatment under Subchapter M of the Code requires satisfaction of source-of-income, diversification and other requirements. The failure to comply with these provisions in a timely manner could prevent us from qualifying as a BDC or a RIC or could force us to pay unexpected taxes and penalties, which could be material. Terra Income Advisors’ limited experience in managing a portfolio of assets under such constraints may hinder its ability to take advantage of attractive investment opportunities and, as a result, achieve our investment objectives. The Terra Income Funds also were not subject to the distribution requirements imposed by the Code; thus, Terra Capital Advisors and Terra Capital Advisors 2, the managers of the Terra Income Funds, had greater flexibility in making investment and asset allocation decisions on behalf of the Terra Income Funds.
Terra Income Advisors’ management team consists of the same personnel that form the operations team of the managers of the Terra Income Funds. Terra Income Advisors has no prior experience managing a BDC or a RIC. Therefore, Terra Income Advisors may not be able to successfully operate our business or achieve our investment objectives. As a result, an investment in our shares of common stock may entail more risk than the shares of common stock of a comparable company with a substantial operating history.
Terra Income Advisors and its affiliates, including our officers and some of our directors, face conflicts of interest caused by compensation arrangements with us and our affiliates, which could result in actions that are not in the best interests of our stockholders.
Terra Income Advisors and its affiliates receive substantial fees from us in return for their services, and these fees could influence the advice provided to us. Among other matters, the compensation arrangements could affect their judgment with respect to public offerings of equity by us, which allow the dealer manager to earn additional selling commissions, dealer manager fees and servicing fees, and Terra Income Advisors to earn increased asset management fees. In addition, the decision to utilize leverage will increase our assets and, as a result, will increase the amount of management fees payable to Terra Income Advisors.
We may be obligated to pay Terra Income Advisors incentive compensation even if we incur a net loss due to a decline in the value of our portfolio.
Our Investment Advisory Agreement entitles Terra Income Advisors to receive incentive compensation on income regardless of any capital losses. In such case, we may be required to pay Terra Income Advisors incentive compensation for a fiscal quarter even if there is a decline in the value of our portfolio or if we incur a net loss for that quarter.
Any incentive fee payable by us that relates to our net investment income may be computed and paid on income that may include interest that has been accrued but not yet received. If a portfolio company defaults on a loan that is structured to provide accrued interest, it is possible that accrued interest previously included in the calculation of the incentive fee will become uncollectible. Terra Income Advisors is not under any obligation to reimburse us for any part of the incentive fee it received that was based on accrued income that we never received as a result of a default by an entity on the obligation that resulted in the accrual of such income, and such circumstances would result in our paying an incentive fee on income we never received.
24
There may be conflicts of interest related to obligations Terra Income Advisors has to our affiliates and to other clients.
Terra Income Advisors, our investment adviser, also serves as investment adviser or manager to the Terra Income Funds, TPT, a subsidiary of Terra Secured Income Fund 5, LLC (“TSIF5”), and TPT2, a subsidiary of Terra Secured Income Fund 7, LLC (“TSIF7”). As a result, the members of the senior management and investment teams of Terra Income Advisors serve as officers, directors or principals of entities that operate in the same or a related line of business as we do, or of investment funds managed by the same personnel. In serving in these multiple and other capacities, they may have obligations to other clients or investors in those entities, including the Terra Income Funds, the fulfillment of which may not be in our best interests or in the best interest of our stockholders. Our investment objectives may overlap with the investment objectives of such investment funds, accounts or other investment vehicles, including the Terra Income Funds. As a result, Terra Income Advisors, its employees and certain of its affiliates will have conflicts of interest in allocating their time between us and other activities in which they are or may become involved, including the Terra Income Funds. Terra Income Advisors and its employees will devote only as much of its or their time to our business as Terra Income Advisors and its employees, in their judgment, determine is reasonably required, which may be substantially less than their full time.
The time and resources that individuals employed by Terra Income Advisors devote to us may be diverted, and we may face additional competition due to the fact that individuals employed by Terra Income Advisors are not prohibited from raising money for or managing another entity that makes the same types of investments that we target.
Neither Terra Income Advisors nor individuals employed by it are prohibited from raising money for and managing another investment entity that makes the same types of investments as those we target. Terra Income Advisors also serves as investment adviser or manager for the Terra Income Funds, TPT and TPT2. As a result, the time and resources that these individuals may devote to us may be diverted. In addition, we may compete with any such investment entity for the same investors and investment opportunities. We also intend to co-invest with other affiliates that Terra Income Advisors manages or advise consistent with the conditions of the exemptive order granted to us.
Our incentive fee may induce Terra Income Advisors to make speculative investments.
The incentive fee payable by us to Terra Income Advisors may create an incentive for it to make investments on our behalf that are risky or more speculative than would be the case in the absence of such compensation arrangement. The way in which the incentive fee payable to Terra Income Advisors is determined may encourage it to use leverage to increase the return on our investments. In addition, the fact that our base management fee is payable based upon our gross assets, which would include any borrowings for investment purposes, may encourage Terra Income Advisors to use leverage to make additional investments. Under certain circumstances, the use of leverage may increase the likelihood of default, which would disfavor holders of our common stock. Such a practice could result in our investing in more speculative securities than would otherwise be in our best interests, which could result in higher investment losses, particularly during cyclical economic downturns.
Risks Related to Business Development Companies
The requirement that we invest a sufficient portion of our assets in qualifying assets could preclude us from investing in accordance with our current business strategy; conversely, the failure to invest a sufficient portion of our assets in qualifying assets could result in our failure to maintain our status as a BDC.
As a BDC, we may not acquire any assets other than “qualifying assets” unless, at the time of such acquisition, at least 70% of our total assets are qualifying assets. Therefore, we may be precluded from investing in what we believe are attractive investments if such investments are not qualifying assets. Conversely, if we fail to invest a sufficient portion of our assets in qualifying assets, we could lose our status as a BDC, which would have a material adverse effect on our business, financial condition and results of operations. Similarly, these rules could prevent us from making additional investments in existing portfolio companies, which could result in the dilution of our position, or could require us to dispose of investments at an inopportune time to comply with the 1940 Act. If we were forced to sell non-qualifying investments in the portfolio for compliance purposes, the proceeds from such sale could be significantly less than the current value of such investments.
Failure to maintain our status as a BDC would reduce our operating flexibility.
If we do not remain a BDC, we might be regulated as a closed-end investment company under the 1940 Act, which would subject us to substantially more regulatory restrictions under the 1940 Act and correspondingly decrease our operating flexibility.
Regulations governing our operation as a BDC and RIC will affect our ability to raise, and the way in which we raise, additional capital or borrow for investment purposes, which may have a negative effect on our growth.
Because we must distribute at least 90% of our “investment company taxable income” in order to satisfy the annual distribution requirement to maintain our qualification as a RIC, we will be unable to use those funds to make new investments. As a result, we will likely need to continually raise cash or borrow to fund new investments that we would otherwise acquire using the taxable income that we are required to distribute. At times, the sources and terms of funding may not be available to us on acceptable terms, if at all.
25
We may issue “senior securities,” as defined in the 1940 Act, including borrowing money from banks or other financial institutions only in amounts such that our asset coverage, as defined in the 1940 Act, equals at least 200% after such incurrence or issuance. Our ability to issue different types of securities is also limited. Compliance with these requirements may unfavorably limit our investment opportunities and reduce our ability in comparison to other companies to profit from favorable spreads between the rates at which we can borrow and the rates at which we can lend. As a BDC, therefore, we intend to issue equity continuously at a rate more frequent than our privately-owned competitors, which may lead to greater stockholder dilution.
We expect to borrow for investment purposes. If the value of our assets declines, we may be unable to satisfy the asset coverage test, which would prohibit us from paying distributions and could prevent us from maintaining our qualification as a RIC. If we cannot satisfy the asset coverage test, we may be required to sell a portion of our investments and, depending on the nature of our debt financing, repay a portion of our indebtedness at a time when such sales may be disadvantageous.
Under the 1940 Act, we generally are prohibited from issuing or selling our common stock at a price per share, after deducting selling commissions, broker-dealer fees, and dealer manager fees, that is below our NAV per share, which may be a disadvantage as compared with other public companies. We may, however, sell our common stock, or warrants, options or rights to acquire our common stock, at a price below the current NAV of the common stock if our Board and independent directors determine that such sale is in our best interests and the best interests of our stockholders, and our stockholders as well as those stockholders that are not affiliated with us approve such sale.
Our ability to enter into transactions with our affiliates is restricted.
We are prohibited under the 1940 Act from participating in certain transactions with certain of our affiliates without the prior approval of a majority of the independent members of our Board and, in some cases, the SEC. Any person that owns, directly or indirectly, 5% or more of our outstanding voting securities will be our affiliate for purposes of the 1940 Act, and we will generally be prohibited from buying or selling any securities from or to such affiliate, absent the prior approval of our Board. The 1940 Act also prohibits certain “joint” transactions with certain of our affiliates, which could include investments in the same portfolio company (whether at the same or different times), without prior approval of our Board and, in some cases, the SEC. If a person acquires more than 25% of our voting securities, we will be prohibited from buying or selling any security from or to such person or certain of that person’s affiliates, or entering into prohibited joint transactions with such persons, absent the prior approval of the SEC. Similar restrictions limit our ability to transact business with our officers or directors or their affiliates. As a result of these restrictions, we may be prohibited from buying or selling any security from or to any portfolio company of a private equity fund managed by Terra Income Advisors without the prior approval of the SEC, which may limit the scope of investment opportunities that would otherwise be available to us.
The SEC has granted us exemptive relief from the provisions of Sections 17(d) and 57(a)(4) of the 1940 Act, thereby permitting us, subject to the satisfaction of certain conditions, to co-invest in certain privately negotiated investment transactions with our Co-Investment Affiliates. However, we will be prohibited from engaging in certain transactions with our affiliates even under the terms of this exemptive order. We believe the relief granted to us under this exemptive order may not only enhance our ability to further our investment objectives and strategies, but may also increase favorable investment opportunities for us, in part by allowing us to participate in larger investments, together with our Co-Investment Affiliates, than would be available to us in the absence of such relief.
We are uncertain of our sources for funding our future capital needs; if we cannot obtain a sufficient amount of debt or equity financing on acceptable terms, our ability to acquire investments and to expand our operations will be adversely affected.
The net proceeds from the sale of shares will be used for our investment opportunities, operating expenses and for payment of various fees and expenses such as base management fees, incentive fees and other fees. Any working capital reserves we maintain may not be sufficient for investment purposes, and we may require additional debt or equity financing to operate. In the event that we develop a need for additional capital in the future for investments or for any other reason, these sources of funding may not be available to us. Consequently, if we cannot obtain debt or equity financing on acceptable terms, our ability to acquire investments and to expand our operations will be adversely affected. As a result, we would be less able to allocate our portfolio among various issuers and achieve our investment objectives, which may negatively impact our results of operations and reduce our ability to make distributions to our stockholders.
Risks Related to Our Investments
Economic recessions or downturns could impair our portfolio companies and harm our operating results.
Many of our portfolio companies may be susceptible to economic slowdowns or recessions and may be unable to repay our debt investments during these periods. Therefore, our non-performing assets are likely to increase, and the value of our portfolio is likely to decrease, during these periods. Adverse economic conditions may also decrease the value of any collateral securing our secured loans. A prolonged recession may further decrease the value of such collateral and result in losses of value in our portfolio and a decrease in our revenues, net income and NAV. Unfavorable economic conditions also could increase our funding
26
costs, limit our access to the capital markets or result in a decision by lenders not to extend credit to us on terms we deem acceptable. These events could prevent us from increasing investments and harm our operating results.
A covenant breach by any of our portfolio companies may harm our operating results.
A portfolio company’s failure to satisfy financial or operating covenants imposed by us or other lenders could lead to defaults and, potentially, termination of its loans and foreclosure on its secured assets, which could trigger cross-defaults under other agreements and jeopardize a portfolio company’s ability to meet its obligations under the debt or equity securities that we hold. We may incur expenses to the extent necessary to seek recovery upon default or to negotiate new terms, which may include the waiver of certain financial covenants, with a defaulting portfolio company.
We may not realize gains from our preferred equity investments.
The preferred equity investments we make may not appreciate in value and, in fact, may decline in value. Accordingly, we may not be able to realize gains from our preferred equity investments, and any gains that we do realize on the disposition of any preferred equity investments may not be sufficient to offset any other losses we experience.
A lack of liquidity in certain of our investments may adversely affect our business.
We invest in certain real estate and real estate-related companies whose securities are not publicly traded or actively traded on the secondary market and are, instead, traded on a privately negotiated over-the-counter secondary market for institutional investors and whose securities are subject to legal and other restrictions on resale or are otherwise less liquid than publicly traded securities. The illiquidity of certain of our investments may make it difficult for us to sell these investments when desired. In addition, if we are required to liquidate all or a portion of our portfolio quickly, we may realize significantly less than the value at which we had previously recorded these investments. The reduced liquidity of our investments may make it difficult for us to dispose of them at a favorable price, and, as a result, we may suffer losses.
We may not have the funds or ability to make additional investments in our portfolio companies.
We may not have the funds or ability to make additional investments in our portfolio companies. After our initial investment in a portfolio company, we may be called upon from time to time to provide additional funds to such company or have the opportunity to increase our investment. There is no assurance that we will make, or will have sufficient funds to make, follow-on investments. Any decisions not to make a follow-on investment or any inability on our part to make such an investment may have a negative impact on a portfolio company in need of such an investment, may result in a missed opportunity for us to increase our participation in a successful operation or may reduce the expected return on the investment.
Our real estate-related loans may be impacted by unfavorable real estate market conditions, which could decrease the value of our investments.
The real estate-related loans we make or invest in will be at risk of defaults caused by many conditions beyond our control, including local and other economic conditions affecting real estate values and interest rate levels. We do not know whether the values of the property securing the real estate-related loans will remain at the levels existing on the dates of origination of such loans. If the values of the underlying properties drop, our risk will increase and the value of our investments may decrease.
Our real estate-related loans will be subject to interest rate fluctuations that could reduce our returns as compared to market interest rates.
If we invest in fixed-rate, long-term real estate-related loans and interest rates rise, such loans could yield a return lower than then-current market rates. If interest rates decrease, we will be adversely affected to the extent that real estate-related loans are prepaid, because we may not be able to make new loans at the previously higher interest rate.
Delays in liquidating defaulted mortgage loans could reduce our investment returns.
If there are defaults under our mortgage loans, we may not be able to repossess and sell the underlying properties quickly. The resulting time delay could reduce the value of our investment in the defaulted mortgage loans. An action to foreclose on a property securing a mortgage loan is regulated by state statutes and rules and is subject to many of the delays and expenses of other lawsuits if the mortgagor raises defenses or counterclaims. In the event of default by a mortgagor, these restrictions, among other things, may impede our ability to foreclose on or sell the mortgaged property or to obtain proceeds sufficient to repay all amounts due to us on the mortgage loan.
Returns on our real estate-related loans may be limited by regulations.
Our loan investments may be subject to regulation by federal, state and local authorities and subject to various laws and judicial and administrative decisions. We may determine not to make or invest in real estate-related loans in any jurisdiction in which we believe we have not complied in all material respects with applicable requirements. If we decide not to make or invest in real estate-related loans in several jurisdictions, it could reduce the amount of income we would otherwise receive.
27
Foreclosures create additional ownership risks that could adversely impact our returns on mortgage investments.
If we acquire property by foreclosure following defaults under our mortgage loans, we will have the same economic and liability risks as the previous owner.
The mezzanine loans in which we may invest would involve greater risks of loss than senior loans secured by income-producing real properties.
We may invest in mezzanine loans that take the form of subordinated loans secured by second mortgages on the underlying real property or loans secured by a pledge of the ownership interests of the entity owning the real property. These types of investments involve a higher degree of risk than long-term senior mortgage lending secured by income-producing real property because the investment may become unsecured as a result of foreclosure by the senior lender. In the event of a bankruptcy of the entity providing the pledge of its ownership interests as security, we may not have full recourse to the assets of such entity, or the assets of the entity may not be sufficient to satisfy our mezzanine loan. If a borrower defaults on our mezzanine loan or debt senior to our loan, or in the event of a borrower bankruptcy, our mezzanine loan will be satisfied only after the senior debt. As a result, we may not recover some or all of our investment. In addition, mezzanine loans may have higher loan-to-value ratios than conventional mortgage loans, resulting in less equity in the real property and increasing the risk of loss of principal.
Our commercial real estate-related loans, commercial real estate-related debt securities and select commercial real estate equity investments will be subject to the risks typically associated with real estate.
Our commercial real estate-related loans, commercial real estate-related debt securities and select commercial real estate equity will generally be directly or indirectly secured by a lien on real property (or the equity interests in an entity that owns real property) that, upon the occurrence of a default on the loan, could result in our acquiring ownership of the property. We will not know whether the values of the properties ultimately securing our loans will remain at the levels existing on the dates of origination of those loans. If the values of the mortgaged properties drop, our risk will increase because of the lower value of the security associated with such loans. In this manner, real estate values could impact the values of our loan investments. Our investments in commercial real estate-related loans, commercial real estate-related debt securities and select commercial real estate equity investments (including potential investments in real property) may be similarly affected by real estate property values. Therefore, our investments will be subject to the risks typically associated with real estate.
The value of real estate may be adversely affected by a number of risks, including:
• | natural disasters such as hurricanes, earthquakes and floods; |
• | acts of war or terrorism, including the consequences of terrorist attacks, such as those that occurred on September 11, 2001; |
• | adverse changes in national and local economic and real estate conditions; |
• | an oversupply of (or a reduction in demand for) space in the areas where particular properties are located and the attractiveness of particular properties to prospective tenants; |
• | changes in governmental laws and regulations, fiscal policies and zoning ordinances and the related costs of compliance therewith and the potential for liability under applicable laws; |
• | costs of remediation and liabilities associated with environmental conditions affecting properties; and |
• | the potential for uninsured or underinsured property losses. |
The value of each property is affected significantly by its ability to generate cash flow and net income, which in turn depends on the amount of rental or other income that can be generated net of expenses required to be incurred with respect to the property. Many expenditures associated with properties (such as operating expenses and capital expenditures) cannot be reduced when there is a reduction in income from the properties. These factors may have a material adverse effect on the ability of our borrowers to pay their loans, as well as on the value that we can realize from assets we originate, own or acquire.
The B-Notes in which we may invest may be subject to additional risks relating to the privately negotiated structure and terms of the transaction, which may result in losses to us.
We may invest in B-notes. A B-note is a mortgage loan typically (i) secured by a first mortgage on a single large commercial property or group of related properties and (ii) subordinated to an A-Note secured by the same first mortgage on the same collateral. As a result, if a borrower defaults, there may not be sufficient funds remaining for B-note holders after payment to the A-Note holders. Since each transaction is privately negotiated, B-notes can vary in their structural characteristics and risks. For example, the rights of holders of B-notes to control the process following a borrower default may be limited in certain investments. We cannot predict the terms of each B-note investment. Further, B-notes typically are secured by a single property, and so reflect the increased risks associated with a single property compared to a pool of properties.
28
Risks of cost overruns and non-completion of the construction or renovation of the properties underlying loans we make or acquire may materially adversely affect our investment.
The renovation, refurbishment or expansion by a borrower under a mortgaged or leveraged property involves risks of cost overruns and non-completion. Costs of construction or improvements to bring a property up to standards established for the market position intended for that property may exceed original estimates, possibly making a project uneconomical. Other risks may include environmental risks and construction, rehabilitation and subsequent leasing of the property not being completed on schedule. If such construction or renovation is not completed in a timely manner, or if it costs more than expected, the borrower may experience a prolonged impairment of net operating income and may not be able to make payments on our investment.
Our investments in commercial real estate-related loans are subject to changes in credit spreads.
Our investments in commercial real estate-related loans are subject to changes in credit spreads. When credit spreads widen, the economic value of such investments decrease. Even though a loan may be performing in accordance with its loan agreement and the underlying collateral has not changed, the economic value of the loan may be negatively impacted by the incremental interest foregone from the widened credit spread.
Investments in non-conforming or non-investment grade rated loans or securities involve greater risk of loss.
Some of our investments may not conform to conventional loan standards applied by traditional lenders and either will not be rated or will be rated as non-investment grade by the rating agencies. In addition, we may invest in securities that are rated below investment grade by rating agencies or that would be likely rated below investment grade if they were rated. Below investment grade securities, which are often referred to as “junk,” have predominantly speculative characteristics with respect to the issuer’s capacity to pay interest and repay principal. They may also be difficult to value and illiquid. The non-investment grade ratings for these assets typically result from the overall leverage of the loans, the lack of a strong operating history for the properties underlying the loans, the borrowers’ credit history, the properties’ underlying cash flow or other factors. As a result, these investments may have a higher risk of default and loss than investment grade-rated assets. Any loss we incur may be significant and may reduce distributions to our stockholders and adversely affect the value of our common stock.
Investments that are not U.S. government insured involve risk of loss.
We may originate and acquire uninsured loans and assets as part of our investment strategy. Such loans and assets may include mortgage loans, mezzanine loans and bridge loans. While holding such interests, we are subject to risks of borrower defaults, bankruptcies, fraud, losses and special hazard losses that are not covered by standard hazard insurance. In the event of any default under loans, we bear the risk of loss of principal and nonpayment of interest and fees to the extent of any deficiency between the value of the collateral and the principal amount of the loan. To the extent we suffer such losses with respect to our investments in such loans, the value of our company and the value of our common stock may be adversely affected.
The mortgage-backed securities in which we may invest are subject to the risks of the mortgage securities market as a whole and risks of the securitization process.
The value of mortgage-backed securities may change due to shifts in the market’s perception of issuers and regulatory or tax changes adversely affecting the mortgage securities market as a whole. Mortgage-backed securities are also subject to several risks created through the securitization process. Subordinate mortgage-backed securities are paid interest only to the extent that there are funds available to make payments. To the extent the collateral pool includes delinquent loans, there is a risk that the interest payment on subordinate mortgage-backed securities will not be fully paid. Subordinate mortgage-backed securities are also subject to greater credit risk than those mortgage-backed securities that are more highly rated.
We may invest in CMBS, including subordinate securities, which entail certain risks.
CMBS are generally securities backed by obligations (including certificates of participation in obligations) that are principally secured by mortgages on real property or interests therein having a commercial or multi-family use, such as regional malls, other retail space, office buildings, industrial or warehouse properties, hotels, apartment buildings, nursing homes and senior living centers, and may include, without limitation, CMBS conduit securities, CMBS credit tenant lease securities and CMBS large loan securities. We may invest in a variety of CMBS, including CMBS which are subject to the first risk of loss if any losses are realized on the underlying mortgage loans. CMBS entitle the holders thereof to receive payments that depend primarily on the cash flow from a specified pool of commercial or multi-family mortgage loans. Consequently, CMBS will be affected by payments, defaults, delinquencies and losses on the underlying commercial real estate-related loans, which began to increase significantly toward the end of 2008 and are expected to continue to increase. Furthermore, a weakening rental market generally, including reduced occupancy rates and reduced market rental rates, could reduce cash flow from the loan pools underlying our CMBS investments.
Additionally, CMBS are subject to particular risks, including lack of standardized terms and payment of all or substantially all of the principal only at maturity rather than regular amortization of principal. Additional risks may be presented by the type and use of a particular commercial property. Special risks are presented by hospitals, nursing homes, hospitality properties and certain other property types. Commercial property values and net operating income are subject to volatility, which may result in
29
net operating income becoming insufficient to cover debt service on the related commercial real estate loan, particularly if the current economic environment continues to deteriorate. The repayment of loans secured by income-producing properties is typically dependent upon the successful operation of the related real estate project rather than upon the liquidation value of the underlying real estate. Furthermore, the net operating income from and value of any commercial property are subject to various risks. The exercise of remedies and successful realization of liquidation proceeds relating to CMBS may be highly dependent on the performance of the servicer or special servicer. Expenses of enforcing the underlying commercial real estate-related loans (including litigation expenses) and expenses of protecting the properties securing the commercial real estate-related loans may be substantial. Consequently, in the event of a default or loss on one or more commercial real estate-related loans contained in a securitization, we may not recover our investment.
We may invest in CDOs and such investments may involve significant risks.
We may invest in CDOs. CDOs are multiple class debt securities, or bonds, secured by pools of assets, such as mortgage-backed securities, B-notes, mezzanine loans and credit default swaps. Like typical securities structures, in a CDO, the assets are pledged to a trustee for the benefit of the holders of the bonds. Like CMBS, CDOs are affected by payments, defaults, delinquencies and losses on the underlying commercial real estate-related loans. CDOs often have reinvestment periods that typically last for five years during which proceeds from the sale of a collateral asset may be invested in substitute collateral. Upon termination of the reinvestment period, the static pool functions very similarly to a CMBS securitization where repayment of principal allows for redemption of bonds sequentially.
We have no established investment criteria limiting the geographic concentration of our investments in commercial real estate-related loans, commercial real estate-related debt securities and select commercial real estate equity investments. If our investments are concentrated in an area that experiences adverse economic conditions, our investments may lose value and we may experience losses.
Certain commercial real estate-related loans, commercial real estate-related debt securities and select commercial real estate equity investments in which we invest may be secured by a single property or properties in one geographic location. Further, we intend that our secured investments will be collateralized by properties located solely in the United States. These investments may carry the risks associated with significant geographical concentration. As a result, properties underlying our investments may be overly concentrated in certain geographic areas, and we may experience losses as a result. A worsening of economic conditions in the geographic area in which our investments may be concentrated could have an adverse effect on our business, including reducing the demand for new financings, limiting the ability of customers to pay financed amounts and impairing the value of our collateral.
We may invest in adjustable rate mortgage loans, which may entail greater risks of default to lenders than fixed rate mortgage loans.
Adjustable rate mortgage loans may contribute to higher delinquency rates. Borrowers with adjustable rate mortgage loans may be exposed to increased monthly payments if the related mortgage interest rate adjusts upward from the initial fixed rate or a low introductory rate, as applicable, in effect during the initial period of the mortgage loan to the rate computed in accordance with the applicable index and margin. This increase in borrowers’ monthly payments, together with any increase in prevailing market interest rates, after the initial fixed rate period, may result in significantly increased monthly payments for borrowers with adjustable rate mortgage loans, which may make it more difficult for the borrowers to repay the loan or could increase the risk of default of their obligations under the loan.
Prepayments can adversely affect the yields on our investments.
Prepayments on debt instruments, where permitted under the debt documents, are influenced by changes in current interest rates and a variety of economic, geographic and other factors beyond our control, and consequently, such prepayment rates cannot be predicted with certainty. If we are unable to invest the proceeds of such prepayments received, or are forced to invest at yields lower than those on the debt instrument that was prepaid, the yield on our portfolio will decline. In addition, we may acquire assets at a discount or premium and if the asset does not repay when expected, our anticipated yield may be impacted. Under certain interest rate and prepayment scenarios we may fail to recoup fully our cost of acquisition of certain investments.
Hedging against interest rate exposure may adversely affect our earnings, limit our gains or result in losses, which could adversely affect cash available for distribution to our stockholders.
We may enter into interest rate swap agreements or pursue other interest rate hedging strategies. Our hedging activity will vary in scope based on the level of interest rates, the type of portfolio investments held, and other changing market conditions. Interest rate hedging may fail to protect or could adversely affect us because, among other things:
• | interest rate hedging can be expensive, particularly during periods of rising and volatile interest rates; |
• | available interest rate hedging may not correspond directly with the interest rate risk for which protection is sought; |
30
• | the duration of the hedge may not match the duration of the related liability or asset; |
• | the credit quality of the party owing money on the hedge may be downgraded to such an extent that it impairs our ability to sell or assign our side of the hedging transaction; |
• | the party owing money in the hedging transaction may default on its obligation to pay; and |
• | we may purchase a hedge that turns out not to be necessary, i.e., a hedge that is out of the money. |
Any hedging activity we engage in may adversely affect our earnings, which could adversely affect cash available for distribution to our stockholders. Therefore, while we may enter into such transactions to seek to reduce interest rate risks, unanticipated changes in interest rates may result in poorer overall investment performance than if we had not engaged in any such hedging transactions. In addition, the degree of correlation between price movements of the instruments used in a hedging strategy and price movements in the portfolio positions being hedged or liabilities being hedged may vary materially. Moreover, for a variety of reasons, we may not seek to establish a perfect correlation between such hedging instruments and the portfolio holdings being hedged. Any such imperfect correlation may prevent us from achieving the intended hedge and expose us to risk of loss.
Hedging instruments often are not traded on regulated exchanges, guaranteed by an exchange or its clearing house, or regulated by any U.S. or foreign governmental authorities and involve risks and costs.
The cost of using hedging instruments increases as the period covered by the instrument increases and during periods of rising and volatile interest rates. We may increase our hedging activity and thus increase our hedging costs during periods when interest rates are volatile or rising and hedging costs have increased. In addition, hedging instruments involve risk since they often are not traded on regulated exchanges, guaranteed by an exchange or its clearing house, or regulated by any U.S. or foreign governmental authorities. Consequently, there are no requirements with respect to record keeping, financial responsibility or segregation of customer funds and positions. Furthermore, the enforceability of agreements underlying derivative transactions may depend on compliance with applicable statutory, commodity and other regulatory requirements and, depending on the identity of the counterparty, applicable international requirements. The business failure of a hedging counterparty with whom we enter into a hedging transaction will most likely result in a default. Default by a party with whom we enter into a hedging transaction may result in the loss of unrealized profits and force us to cover our resale commitments, if any, at the then current market price. It may not always be possible to dispose of or close out a hedging position without the consent of the hedging counterparty, and we may not be able to enter into an offsetting contract in order to cover our risk. We cannot assure investors that a liquid secondary market will exist for hedging instruments purchased or sold, and we may be required to maintain a position until exercise or expiration, which could result in losses.
Our investments in debt securities and preferred equity securities will be subject to the specific risks relating to the particular issuer of the securities and may involve greater risk of loss than secured debt financings.
Our investments in debt securities and preferred and common equity securities involve special risks relating to the particular issuer of the securities, including the financial condition and business outlook of the issuer. Real estate company issuers are subject to the inherent risks associated with real estate and real estate-related investments discussed in this Form 10-K. Issuers that are debt finance companies are subject to the inherent risks associated with structured financing investments also discussed in this Form 10-K. Furthermore, debt securities and preferred and common equity securities may involve greater risk of loss than secured debt financings due to a variety of factors, including that such investments are generally unsecured and may also be subordinated to other obligations of the issuer. As a result, investments in debt securities and preferred and common equity securities are subject to risks of (i) limited liquidity in the secondary trading market, (ii) substantial market price volatility resulting from changes in prevailing interest rates, (iii) subordination to the prior claims of banks and other senior lenders to the issuer, (iv) the operation of mandatory sinking fund or call or redemption provisions during periods of declining interest rates that could cause the issuer to reinvest redemption proceeds in lower yielding assets, (v) the possibility that earnings of the issuer may be insufficient to meet its debt service and distribution obligations and (vi) the declining creditworthiness and potential for insolvency of the issuer during periods of rising interest rates and economic downturn. These risks may adversely affect the value of outstanding debt securities and preferred and common equity securities and the ability of the issuers thereof to make principal, interest and distribution payments to us.
Declines in the market values of our investments may adversely affect periodic reported results of operations and credit availability, which may reduce earnings and, in turn, cash available for distribution to our stockholders.
A decline in the market value of our assets will reduce our earnings in the period recognized and may adversely affect us particularly in instances where we have borrowed money based on the market value of those assets. If the market value of those assets declines, the lender may require us to post additional collateral to support the loan. If we were unable to post the additional collateral, we may have to sell assets at a time when we might not otherwise choose to do so. A reduction in credit available may reduce our earnings and, in turn, cash available for distribution to stockholders.
31
Further, credit facility providers may require us to maintain a certain amount of cash reserves or to set aside unlevered assets sufficient to maintain a specified liquidity position, which would allow us to satisfy our collateral obligations. As a result, we may not be able to leverage our assets as fully as we would choose, which could reduce our return on equity. In the event that we are unable to meet these contractual obligations, our financial condition could deteriorate rapidly.
Market values of our investments may decline for a number of reasons, such as changes in prevailing market rates, increases in defaults, increases in voluntary prepayments for those investments that we have that are subject to prepayment risk, widening of credit spreads and downgrades of ratings of the securities by ratings agencies.
Insurance may not cover all potential losses on the mortgaged properties which may impair our security and harm the value of our assets.
We will require that each of the borrowers under our mortgage loan investments obtain comprehensive insurance covering the mortgaged property, including liability, fire and extended coverage. However, there are certain types of losses, generally of a catastrophic nature, such as earthquakes, floods and hurricanes, that may be uninsurable or not economically insurable. We may not require borrowers to obtain terrorism insurance if it is deemed commercially unreasonable. Inflation, changes in building codes and ordinances, environmental considerations, and other factors also might make it infeasible to use insurance proceeds to replace a property if it is damaged or destroyed. Under such circumstances, the insurance proceeds, if any, might not be adequate to restore the economic value of the mortgaged property, which might impair our security and decrease the value of the property.
With respect to mortgaged properties, options and other purchase rights may affect value or hinder recovery.
A borrower under certain mortgage loans may give its tenants or another person a right of first refusal or an option to purchase all or a portion of the related mortgaged property. These rights may impede the lender’s ability to sell the related mortgaged property at foreclosure or may adversely affect the value or marketability of the property.
If we overestimate the value or income-producing ability or incorrectly price the risks of our investments, we may experience losses.
Analysis of the value or income-producing ability of a commercial property is highly subjective and may be subject to error. We value our potential investments based on yields and risks, taking into account estimated future losses on the commercial real estate-related loans and the mortgaged property included in the securitization’s pools or select commercial real estate equity investments, and the estimated impact of these losses on expected future cash flows and returns. In the event that we underestimate the risks relative to the price we pay for a particular investment, we may experience losses with respect to such investment.
The leases on the properties underlying our investments may not be renewed on favorable terms.
The properties underlying our investments could be negatively impacted by the deteriorating economic conditions and weaker rental markets. Upon expiration or earlier termination of leases on these properties, the space may not be relet or, if relet, the terms of the renewal or reletting (including the cost of required renovations or concessions to tenants) may be less favorable than current lease terms. In addition, the poor economic conditions may reduce a tenants’ ability to make rent payments under their leases. Any of these situations may result in extended periods where there is a significant decline in revenues or no revenues generated by these properties. Additionally, if market rental rates are reduced, property-level cash flows would likely be negatively affected as existing leases renew at lower rates. If the leases for these properties cannot be renewed for all or substantially all of the space at these properties, or if the rental rates upon such renewal or reletting are significantly lower than expected, the value of our investments may be adversely affected.
A borrower’s form of entity may cause special risks or hinder our recovery.
Since most of the borrowers for our commercial real estate loan investments are legal entities rather than individuals, our risk of loss may be greater than those of mortgage loans made to individuals. Unlike individuals involved in bankruptcies, most of the entities generally do not have personal assets and creditworthiness at stake. The terms of the mortgage loans generally require that the borrowers covenant to be single-purpose entities, although in some instances the borrowers are not required to observe all covenants and conditions that typically are required in order for them to be viewed under standard rating agency criteria as “single-purpose entities.”
The bankruptcy of a borrower, or a general partner or managing member of a borrower, may impair the ability of the lender to enforce its rights and remedies under the related mortgage. Borrowers that are not single-purpose entities structured to limit the possibility of becoming insolvent or bankrupt, may be more likely to become insolvent or the subject of a voluntary or involuntary bankruptcy proceeding because the borrowers may be (i) operating entities with a business distinct from the operation of the mortgaged property with the associated liabilities and risks of operating an ongoing business or (ii) individuals that have personal liabilities unrelated to the property.
32
We may be exposed to environmental liabilities with respect to properties to which we take title.
In the course of our business, we may take title to real estate, and, if we do take title, we could be subject to environmental liabilities with respect to these properties. In such a circumstance, we may be held liable to a governmental entity or to third parties for property damage, personal injury, and investigation and clean-up costs incurred by these parties in connection with environmental contamination, or may be required to investigate or clean up hazardous or toxic substances, or chemical releases, at a property. The costs associated with investigation or remediation activities could be substantial. If we ever become subject to significant environmental liabilities, our business, financial condition, liquidity and results of operations could be materially and adversely affected.
Risks Related to Debt Financing
If we borrow money, the potential for gain or loss on amounts invested in us will be magnified and may increase the risk of investing in us.
The use of borrowings, also known as leverage, increases the volatility of investments by magnifying the potential for gain or loss on invested equity capital. If we use leverage to partially finance our investments, through borrowing from banks and other lenders, investors will experience increased risks of investing in our common stock. If the value of our assets increases, leverage would cause the NAV attributable to our common stock to increase more sharply than it would have had we not leveraged. Conversely, if the value of our assets decreases, leverage would cause NAV to decline more sharply than it otherwise would have had we not leveraged. Similarly, any increase in our income in excess of interest payable on the borrowed funds would cause our net income to increase more than it would without the leverage, while any decrease in our income would cause net income to decline more sharply than it would have had we not borrowed. Such a decline could negatively affect our ability to make common stock distribution payments. Leverage is generally considered a speculative investment technique. In addition, the decision to utilize leverage will increase our assets and, as a result, will increase the amount of management fees payable to Terra Income Advisors.
As a BDC, we generally are required to meet a coverage ratio of total assets to total borrowings and other senior securities, which include all of our borrowings and any preferred stock that we may issue in the future, of at least 200%. If this ratio declines below 200%, we cannot incur additional debt, declare any dividends, make any distributions or repurchase any stock, and could be required to sell a portion of our investments to repay some debt when it is disadvantageous to do so. This could have a material adverse effect on our operations, and may cause us to be unable to make distributions. The amount of leverage that we employ will depend on Terra Income Advisors’ and our Board’s assessment of market and other factors at the time of any proposed borrowing.
In addition, recent legislation under consideration by the U.S. Congress proposes to decrease this asset coverage amount such that we would be able to borrow amounts greater than that currently permitted. If this legislation is enacted, we would therefore be permitted to incur leverage beyond the current limitations of the 1940 Act, which would further increase the risks of loss in the event of a decline in the value of our assets. This legislation would also increase the risks of an investment in our common stock.
Changes in interest rates may affect our cost of capital and net investment income.
Since we intend to use debt to finance investments, our net investment income will depend, in part, upon the difference between the rate at which we borrow funds and the rate at which we invest those funds. As a result, we can offer no assurance that a significant change in market interest rates will not have a material adverse effect on our net investment income. In periods of rising interest rates when we have debt outstanding, our cost of funds will increase, which could reduce our net investment income. We expect that any long-term fixed rate investments we acquire will be financed primarily with equity and long-term debt. We may use interest rate risk management techniques in an effort to limit our exposure to interest rate fluctuations. These techniques may include various interest rate hedging activities to the extent permitted by the 1940 Act. These activities may limit our ability to participate in the benefits of lower interest rates with respect to the hedged portfolio. Adverse developments resulting from changes in interest rates or hedging transactions could have a material adverse effect on our business, financial condition and results of operations. Also, we have limited experience in entering into hedging transactions, and we will initially have to purchase or develop such expertise.
A rise in the general level of interest rates can be expected to lead to higher interest rates applicable to our debt investments. Accordingly, an increase in interest rates would make it easier for us to meet or exceed the incentive fee hurdle rate and may result in a substantial increase of the amount of incentive fees payable to Terra Income Advisors with respect to pre-incentive fee net investment income.
33
Federal Income Tax Risks
We will be subject to corporate-level income tax if we are unable to maintain our qualification as a RIC under Subchapter M of the Code.
To maintain our qualification for RIC tax treatment under Subchapter M of the Code, we must meet the following annual distribution, income source and asset diversification requirements.
• | The annual distribution requirement for a RIC will be satisfied if we distribute to our stockholders on an annual basis at least 90% of our net ordinary income and realized net short-term capital gains in excess of realized net long-term capital losses, if any. Because we may use debt financing, we are subject to an asset coverage ratio requirement under the 1940 Act and may in the future become subject to certain financial covenants under loan and credit agreements that could, under certain circumstances, restrict us from making distributions necessary to satisfy the distribution requirement. If we are unable to obtain cash from other sources, we could fail to maintain our qualification for RIC tax treatment and thus become subject to corporate-level income tax. |
• | The income source requirement will be satisfied if we derive at least 90% of our income for each year from dividends, interest, gains from the sale of stock or securities and certain other sources. |
• | The asset diversification requirement must be satisfied at the end of each quarter of our taxable year. At least 50% of the value of our assets must consist of cash, cash equivalents, U.S. government securities, securities of other RICs and other securities if such securities of any one issuer do not represent more than 5% of the value of our assets or more than 10% of the outstanding voting securities of such issuer. In addition, no more than 25% of the value of our assets can be invested in the securities, other than U.S. government securities or securities of other RICs, of one issuer, of two or more issuers that are controlled, as determined under applicable Code rules, by us and that are engaged in the same or similar or related trades or businesses or of certain “qualified publicly traded partnerships.” Failure to meet these requirements may result in our having to dispose of certain investments quickly in order to prevent the loss of RIC status. Because most of our investments will be relatively illiquid, any such dispositions could be made at disadvantageous prices and could result in substantial losses. |
If we make preferred equity investments in partnerships or limited liability companies, such investments and the income therefrom will not be qualifying assets or income for purposes of the RIC income and asset tests unless such preferred equity investments are properly treated as loans for U.S. federal income tax purposes.
If we fail to maintain our qualification for RIC tax treatment for any reason, we will be subject to corporate income tax on our taxable income, which will be determined without a dividends-paid deduction. The resulting corporate taxes could substantially reduce our net assets, the amount of income available for distribution and the amount of our distributions.
To qualify as a RIC in a subsequent year, we would be required to distribute to our stockholders our earnings and profits attributable to non-RIC years. In addition, if we failed to maintain our status as a RIC for a period greater than two taxable years, then we would be required to elect to recognize and pay tax on any net built-in gain (the excess of aggregate gain, including items of income, over aggregate loss that would have been realized if we had been liquidated) or, alternatively, be subject to taxation on such built-in gain recognized for a period of five years, in order to qualify as a RIC in a subsequent year.
The preferred equity investments we intend to make may make us unable to maintain our qualification as a RIC under subchapter M of the Code.
Part of our investment strategy involves investments in preferred limited liability company membership interests or partnership interests that own commercial real estate and generally finance the acquisition, rehabilitation, or construction of commercial real estate. In order to qualify as a RIC for U.S. federal income tax purposes, we must derive at least 90% of our gross income from dividends, interest, payment with respect to certain securities or foreign currencies, and certain other sources. Additionally, at least 50% of the value of our assets must consist of cash, cash equivalents, U.S. government securities, securities from other RICs, and other securities that do not represent 10% of the voting securities of any one issuer or more than 5% of the value of our assets. We intend to make preferred equity investments and treat them as loans for U.S. federal income tax purposes. If the preferred equity investments we make are in the form of an equity interest in a limited liability company or a partnership and such investments are treated as partnership interests for U.S. federal income tax purposes, rather than as loans, then any income derived from such investments will not be qualifying income for purposes of the RIC gross income test, and the investment will not be a qualifying asset for purposes of the RIC 50% asset test. If we are unable to maintain our qualification as a RIC for U.S. federal income tax purposes, we will be subject to corporate-level income tax, and each investor’s investment in us would be adversely impacted.
34
We may have difficulty paying our required distributions if we recognize income before or without receiving cash representing such income.
For U.S. federal income tax purposes, we may be required to recognize taxable income in circumstances in which we do not receive a corresponding payment in cash. For example, if we hold debt obligations that are treated under applicable tax rules as having original issue discount (such as debt instruments with payment-in-kind (“PIK”) interest or, in certain cases, increasing interest rates or debt instruments that were issued with warrants), we must include in income each year a portion of the original issue discount that accrues over the life of the obligation, regardless of whether cash representing such income is received by us in the same taxable year. We may also have to include in income other amounts that we have not yet received in cash, such as deferred loan origination fees that are paid after origination of the loan or are paid in non-cash compensation such as warrants or stock. We anticipate that a portion of our income may constitute original issue discount or other income required to be included in taxable income prior to receipt of cash. Further, we may elect to amortize market discounts and include such amounts in our taxable income in the current year, instead of upon disposition, as an election not to do so would limit our ability to deduct interest expenses for tax purposes. Because any original issue discount or other amounts accrued will be included in our investment company taxable income for the year of the accrual, we may be required to make a distribution to our stockholders in order to satisfy the annual distribution requirement, even though we will not have received any corresponding cash amount. As a result, we may have difficulty meeting the annual distribution requirement necessary to qualify for and maintain RIC tax treatment under Subchapter M of the Code. We may have to sell some of our investments at times or at prices we would not consider advantageous, raise additional debt or equity capital or forgo new investment opportunities for this purpose. If we are not able to obtain cash from other sources, we may fail to maintain our qualification for RIC tax treatment and thus become subject to corporate-level income tax.
Investors may have current tax liability on distributions they elect to reinvest in our common stock but would not receive cash from such distributions to pay such tax liability.
If investors participate in our distribution reinvestment plan, they will be deemed to have received, and for U.S. federal income tax purposes will be taxed on, the amount reinvested in our common stock to the extent the amount reinvested was not a tax-free return of capital. As a result, unless an investor is a tax-exempt entity, investors may have to use funds from other sources to pay their tax liability on the value of our common stock received from the distribution.
If we do not qualify as a “publicly offered regulated investment company,” as defined in the Code, certain investors will be taxed as though they received a distribution of some of our expenses.
A “publicly offered regulated investment company” is a regulated investment company whose shares are either (i) continuously offered pursuant to a public offering, (ii) regularly traded on an established securities market or (iii) held by at least 500 persons at all times during the taxable year. If we are not a publicly offered regulated investment company for any period, a non-corporate stockholder’s pro rata portion of our affected expenses, including our management fees, will be treated as an additional distribution to the stockholder and will be deductible by such stockholder only to the extent permitted under the limitations described below. For non-corporate stockholders, including individuals, trusts, and estates, significant limitations generally apply to the deductibility of certain expenses of a non-publicly offered regulated investment company, including advisory fees. In particular, these expenses, referred to as miscellaneous itemized deductions, are deductible to an individual only to the extent they exceed 2% of such a stockholder’s adjusted gross income, and are not deductible for alternative minimum tax purposes. While we anticipate that we will constitute a publicly offered regulated investment company after our first tax year, there can be no assurance that we will in fact so qualify for any of our taxable years.
We may choose to pay dividends in our own common stock, in which case our stockholders may be required to pay U.S. federal income taxes in excess of the cash dividends our stockholders receive.
We may distribute taxable dividends that are payable in cash and shares of our common stock at the election of each stockholder. Under IRS Revenue Procedure 2017-45, a publicly offered RIC may give stockholders a choice, subject to various limits and requirements, of receiving a dividend in cash or common stock. As long as at least 20% of the total dividend is available in cash, and certain other requirements are satisfied, the IRS will treat the stock distribution as a dividend (to the extent applicable rules treat such distribution as being made out of earnings and profits). Stockholders receiving such dividends will be required to include the full amount of the dividend (including the portion payable in stock) as ordinary income (or, in certain circumstances, long-term capital gain) to the extent of our current and accumulated earnings and profits for U.S. federal income tax purposes. As a result, stockholders may be required to pay income taxes with respect to such dividends in excess of the cash dividends received. If a U.S. stockholder sells the common stock that it receives as a dividend in order to pay this tax, the sales proceeds may be less than the amount included in income with respect to the dividend, depending on the market price of our common stock at the time of the sale. Furthermore, with respect to non-U.S. stockholders, we may be required to withhold U.S. tax with respect to such dividends, including in respect of all or a portion of such dividend that is payable in common stock. In addition, if a significant number of our stockholders determine to sell shares of our common stock in order to pay taxes owed on dividends, it may put downward pressure on the trading price of our common stock.
35
Item 1B. Unresolved Staff Comments.
None.
Item 2. Properties.
Our administrative and principal executive offices are located at 805 Third Avenue, 8th Floor, New York, New York 10022. We believe that our office facilities are suitable and adequate for our business as it is presently conducted.
Item 3. Legal Proceedings.
Neither we nor Terra Income Advisors is currently subject to any material legal proceedings, nor, to our knowledge, are material legal proceedings threatened against us or Terra Income Advisors. From time to time, we and individuals employed by Terra Income Advisors may be a party to certain legal proceedings in the ordinary course of business, including proceedings relating to the enforcement of our rights under contracts with our portfolio companies. While the outcome of these legal proceedings cannot be predicted with certainty, we do not expect that these proceedings will have a material effect upon our financial condition or results of operations.
Item 4. Mine Safety Disclosures.
Not applicable.
PART II
Item 5. Market for Registrant’s Common Equity, Related Stockholder Matters and Issuer Purchases of Equity Securities.
Market Information
There is currently no market for our common stock, and we do not expect that a market for our shares will develop in the foreseeable future. No stock has been authorized for issuance under any equity compensation plans. Under Maryland law, our stockholders generally will not be personally liable for our debts or obligations.
Set forth below is a chart describing the classes of our securities outstanding as of September 30, 2017:
(1) Title of Class | (2) Amount Authorized | (3) Amount Held by Us or for Our Account | (4) Amount Outstanding Exclusive of Amount Under Column(3) | ||||||
Common Stock | 450,000,000 | — | 7,530,130 | ||||||
As of September 30, 2017, we had issued 7,291,481 shares of common stock for gross proceeds of $86.3 million, excluding shares pursuant to our DRIP. As of September 30, 2017, we had 2,116 record holders of our common stock.
Distributions
We declared our first distribution on June 24, 2015 and have declared and paid cash distributions on a monthly basis since such time.
We have elected to be taxed as a RIC under Subchapter M of the Code. To maintain our RIC qualification, we must, among other things, distribute at least 90% of our net ordinary income and net short-term capital gain in excess of net long-term capital loss, if any, to our stockholders. In order to avoid certain excise taxes imposed on RICs, we currently intend to distribute, or be deemed to distribute, during each calendar year an amount at least equal to the sum of: (i) 98% of our net ordinary income for the calendar year; (ii) 98.2% of our capital gain in excess of capital loss for the calendar year; and (iii) any net ordinary income and net capital gain for preceding years that were not distributed during such years and on which we paid no U.S. federal income tax. We can offer no assurance that we will achieve results that will permit the payment of any distributions and, if we issue senior securities, we will be prohibited from paying distributions if doing so causes us to fail to maintain the asset coverage ratios stipulated by the 1940 Act or if distributions are limited by the terms of any of our borrowings.
We have adopted an “opt in” distribution reinvestment plan for our stockholders. As a result, if we make a cash distribution, our stockholders will receive distributions in cash unless they specifically “opt in” to the distribution reinvestment plan so as to have their cash distributions reinvested in additional shares of our common stock. However, certain state authorities or regulators may impose restrictions from time to time that may prevent or limit a stockholder’s ability to participate in the distribution reinvestment plan.
36
Dividends and distributions to our stockholders are recorded as of the record date. We declared our first distribution on June 24, 2015 and have declared and paid cash distributions on a monthly basis since such time. The following table lists the monthly distributions per share for the years ended September 30, 2017 and 2016:
Record Date | Payment Date | Per Share Per Day | Distributions Paid in Cash | Distributions Paid through the DRIP | Total Distributions Paid/Accrued | |||||||||||||
Year Ended September 30, 2017 | ||||||||||||||||||
October 20, 2016 | October 31, 2016 | $ | 0.002733 | $ | 237,090 | $ | 123,938 | $ | 361,028 | |||||||||
November 20, 2016 | November 30, 2016 | 0.002733 | 242,959 | 123,376 | 366,335 | |||||||||||||
December 20, 2016 | December 31, 2016 | 0.002733 | 264,315 | 132,250 | 396,565 | |||||||||||||
January 20, 2017 | January 31, 2017 | 0.002389 | 245,151 | 120,219 | 365,370 | |||||||||||||
February 20, 2017 | February 28, 2017 | 0.002389 | 229,907 | 113,350 | 343,257 | |||||||||||||
March 20, 2017 | March 31, 2017 | 0.002389 | 269,633 | 130,692 | 400,325 | |||||||||||||
April 20, 2017 | April 30, 2017 | 0.002389 | 274,065 | 136,743 | 410,808 | |||||||||||||
May 20, 2017 | May 31, 2017 | 0.002389 | 296,817 | 151,121 | 447,938 | |||||||||||||
June 20, 2017 | June 30, 2017 | 0.002389 | 311,708 | 153,637 | 465,345 | |||||||||||||
July 20, 2017 | July 31, 2017 | 0.002389 | 335,112 | 164,935 | 500,047 | |||||||||||||
August 20, 2017 | August 31, 2017 | 0.002389 | 346,753 | 172,852 | 519,605 | |||||||||||||
September 20, 2017 | September 30, 2017 | 0.002389 | 349,401 | 173,170 | 522,571 | |||||||||||||
$ | 3,402,911 | $ | 1,696,283 | $ | 5,099,194 | |||||||||||||
Record Date | Payment Date | Per Share Per Day | Distributions Paid in Cash | Distributions Paid through the DRIP | Total Distributions Paid/Accrued | |||||||||||||
Year Ended September 30, 2016 | ||||||||||||||||||
October 20, 2015 | October 31, 2015 | $ | 0.002740 | $ | 56,467 | $ | 27,330 | $ | 83,797 | |||||||||
November 20, 2015 | November 30, 2015 | 0.002740 | 66,042 | 37,026 | 103,068 | |||||||||||||
December 20, 2015 | December 31, 2015 | 0.002740 | 85,246 | 49,294 | 134,540 | |||||||||||||
January 20, 2016 | January 31, 2016 | 0.002733 | 104,209 | 61,892 | 166,101 | |||||||||||||
February 20, 2016 | February 29, 2016 | 0.002733 | 109,923 | 66,508 | 176,431 | |||||||||||||
March 20, 2016 | March 31, 2016 | 0.002733 | 122,410 | 74,913 | 197,323 | |||||||||||||
April 20, 2016 | April 30, 2016 | 0.002733 | 120,402 | 71,051 | 191,453 | |||||||||||||
May 20, 2016 | May 31, 2016 | 0.002733 | 137,203 | 80,646 | 217,849 | |||||||||||||
June 20, 2016 | June 30, 2016 | 0.002733 | 164,498 | 96,964 | 261,462 | |||||||||||||
July 20, 2016 | July 31, 2016 | 0.002733 | 186,208 | 112,114 | 298,322 | |||||||||||||
August 20, 2016 | August 31, 2016 | 0.002733 | 201,876 | 116,537 | 318,413 | |||||||||||||
September 20, 2016 | September 30, 2016 | 0.002733 | 209,254 | 116,629 | 325,883 | |||||||||||||
$ | 1,563,738 | $ | 910,904 | $ | 2,474,642 | |||||||||||||
Unregistered Sales of Equity Securities and Use of Proceeds
Sales of Unregistered Securities
On September 19, 2014, we sold approximately 11,111 shares of our common stock to Terra Capital Partners for aggregate gross proceeds of $125,000. These shares were purchased at $11.25 per share, which represents the initial public offering price of $12.50 per share, net of selling commissions and dealer manager fees, as well as the broker-dealer fees. The shares were sold pursuant to the exemption from registration found in Section 4(2) of the Securities Act.
On October 20, 2014, we sold approximately 4,445 shares of our common stock for aggregate gross proceeds of $50,000 to Terra Capital Partners. These shares were purchased at $11.25 per share, which represents the initial public offering price of $12.50 per share, net of selling commissions and dealer manager fees, as well as the broker-dealer fees. The shares were sold pursuant to the exemption from registration found in Section 4(2) of the Securities Act.
On February 25, 2015, the Board determined to change the initial offering price from $10.00 per share to $12.50 per share. As a result, on February 26, 2015, we effected a reverse stock split to account for the change in our offering price since the initial
37
investment by Terra Capital Partners. As such, all share references and equity transaction pricing elsewhere reflect this reverse stock split.
Issuer Purchases of Equity Securities
None.
Item 6. Selected Financial Data.
The selected financial and other data below should be read in conjunction with our “Management's Discussion and Analysis of Financial Condition and Results of Operations” and the financial statements and notes thereto. Financial information is presented for the fiscal years ended September 30, 2017, 2016, 2015 and 2014 which have been derived from our audited financial statements.
Years Ended September 30, | ||||||||||||||||
2017 | 2016 | 2015 | 2014 | |||||||||||||
Statement of operations data: | ||||||||||||||||
Total investment income | $ | 5,257,725 | $ | 3,016,699 | $ | 66,822 | $ | — | ||||||||
Base management fees | 1,202,568 | 552,011 | 30,058 | — | ||||||||||||
Incentive fees on capital gains (1) | 90,459 | 27,928 | — | — | ||||||||||||
All other expenses | 4,070,709 | 5,469,315 | 1,720,870 | 32,676 | ||||||||||||
Total operating expenses | 5,363,736 | 6,049,254 | 1,750,928 | 32,676 | ||||||||||||
Less: Expense reimbursement from Adviser | — | (576,755 | ) | (1,690,300 | ) | — | ||||||||||
Less: Reduction of offering costs | (944,248 | ) | — | — | — | |||||||||||
Net operating expenses | 4,419,488 | 5,472,499 | 60,628 | 32,676 | ||||||||||||
Net investment income (loss) | 838,237 | (2,455,800 | ) | 6,194 | (32,676 | ) | ||||||||||
Net change in unrealized appreciation on investments and obligations under participation agreements | 444,687 | 139,640 | — | — | ||||||||||||
Net increase (decrease) in net assets resulting from operations | $ | 1,282,924 | $ | (2,316,160 | ) | $ | 6,194 | $ | (32,676 | ) | ||||||
Per share data (2): | ||||||||||||||||
Net asset value | $ | 10.00 | $ | 10.06 | $ | 10.97 | N/A | |||||||||
Net investment income (loss) | $ | 0.15 | $ | (0.99 | ) | $ | 0.01 | N/A | ||||||||
Net increase (decrease) in net assets resulting from operations | $ | 0.23 | $ | (0.93 | ) | $ | 0.01 | N/A | ||||||||
Distributions declared | $ | 0.90 | $ | 1.00 | $ | 0.27 | N/A | |||||||||
Balance sheet data at period end: | ||||||||||||||||
Investments, at fair value | $ | 23,675,007 | $ | 26,723,922 | $ | — | $ | — | ||||||||
Investments through participation, at fair value | 22,121,382 | 2,022,814 | 2,000,000 | — | ||||||||||||
Cash and cash equivalents | 32,176,500 | 31,634,296 | 8,248,797 | 125,000 | ||||||||||||
Cash, restricted | 1,547,407 | 836,434 | — | — | ||||||||||||
Other assets | 546,977 | 914,757 | 1,090,355 | 573,193 | ||||||||||||
Total assets | 80,067,273 | 62,132,223 | 11,339,152 | 698,193 | ||||||||||||
Obligations under participation agreements, at fair value | 1,820,502 | 14,560,606 | — | — | ||||||||||||
Transaction charge payable (3) | — | 2,191,734 | — | — | ||||||||||||
Due to Adviser, net | 707,927 | 1,498,808 | 608,423 | — | ||||||||||||
Interest reserve and other deposits held on investments | 1,547,407 | 836,434 | — | — | ||||||||||||
Other liabilities | 657,144 | 569,893 | 569,657 | 605,869 | ||||||||||||
Total liabilities | 4,732,980 | 19,657,475 | 1,178,080 | 605,869 | ||||||||||||
Total net assets | $ | 75,334,293 | $ | 42,474,748 | $ | 10,161,072 | $ | 92,324 | ||||||||
38
Years Ended September 30, | ||||||||||||||
2017 | 2016 | 2015 | 2014 | |||||||||||
Weighted average annualized effective yield at year end (4) | 12.39 | % | 13.27 | % | 12.00 | % | N/A | |||||||
Number of investments at year end | 10 | 5 | 1 | N/A | ||||||||||
Purchases of investments for the year | $ | 44,777,167 | $ | 26,299,670 | $ | 2,000,000 | N/A | |||||||
Proceeds from obligations under participation agreements for the year | $ | — | $ | 14,300,000 | $ | — | N/A | |||||||
Principal payments and sales of investments for the year | $ | 28,508,960 | $ | — | $ | — | N/A | |||||||
Repayments of obligations under participation agreements for the year | $ | 12,863,770 | $ | — | $ | — | N/A | |||||||
_______________
(1) | Incentive fees on capital gains are based on 20% of net unrealized capital gains of $444,687 and $139,640 for the years ended September 30, 2017 and 2016, respectively. No incentive fees on capital gains are actually payable by us with respect to unrealized gains unless and until those gains are actually realized. |
(2) | Per share data is only presented for periods subsequent to June 24, 2015, the date the Minimum Offering Requirement was met. The per share data for the year ended September 30, 2015 is based on shares outstanding from June 24, 2015 through September 30, 2015. |
(3) | On September 30, 2017, we adopted the servicing plan and the second amended dealer manager agreement, which revised the terms of the servicing fee (which was previously referred to as a transaction charge). Pursuant to the servicing plan, Terra Capital Markets receives a servicing fee at an annual rate of 1.125% of the most recently published NAV per share of our common stock, excluding shares sold through the DRIP, in exchange for providing certain administrative support services. The servicing fee will be recorded as expense on the statements of operations in the period in which it incurred. In connection with the adoptions of the servicing plan and the second amended dealer manager agreement, we reduced the previously recorded transaction charges by $3.2 million, as reflected on the statements of changes in net assets. As of September 30, 2017, there was no transaction charge payable outstanding and we have not recorded any servicing fee. |
(4) | The weighted average annualized effective yield at period end is based upon the par value of our debt investments. |
N/A — not applicable
39
Item 7. Management’s Discussion and Analysis of Financial Condition and Results of Operations.
The information contained in this section should be read in conjunction with our audited financial statements and related notes thereto and other financial information included elsewhere in this Annual Report on Form 10-K. In this report, “we,” “us” and “our” refer to Terra Income Fund 6, Inc.
Please see Item 1A “Risk Factors” and “Forward-Looking Statements” for a discussion of the uncertainties, risks and assumptions associated with these statements.
Overview
We were incorporated under the general corporation laws of the State of Maryland on May 15, 2013 and commenced operations on June 24, 2015, upon the raising of gross proceeds in excess of the Minimum Offering Requirement. We are an externally managed, non-diversified, closed-end management investment company that has elected to be regulated as a BDC under the 1940 Act, and have elected to be taxed for federal income tax purposes, beginning with our taxable year ended September 30, 2015, and to qualify annually thereafter, as a RIC under Subchapter M of the Code. Prior to satisfying the Minimum Offering Requirement, we had no operations except for matters relating to our organization and registration.
Our investment activities are externally managed by Terra Income Advisors and supervised by the Board, a majority of whom are independent. Under the Investment Advisory Agreement, we have agreed to pay Terra Income Advisors an annual base management fee based on our average quarterly gross assets, as well as incentive fees based on our performance. See “— Related Party Transactions — Compensation of Terra Income Advisors and Terra Capital Markets” below.
Also, we have agreed to pay selling commissions, broker-dealer fees, a dealer manager fee and servicing fees, and to reimburse Terra Income Advisors for our organization and offering expenses up to a maximum amount equal to 1.5% of the gross proceeds from the Offering. Terra Income Advisors will bear all organization and offering expenses in excess of this amount.
Our primary investment objectives are to pay attractive and stable cash distributions and to preserve, protect and return capital contributions to stockholders. Our investment strategy is to use substantially all of the proceeds of the Offering to originate and manage a diversified portfolio consisting of (i) commercial real estate loans to U.S. companies qualifying as “eligible portfolio companies” under the 1940 Act, including mezzanine loans, first and second lien mortgage loans, subordinated mortgage loans, bridge loans and other commercial real estate-related loans related to or secured by high quality commercial real estate in the United States and (ii) preferred equity real estate investments in U.S. companies qualifying as “eligible portfolio companies” under the 1940 Act. We may also purchase select commercial real estate-related debt securities, such as commercial mortgage-backed securities or collateralized debt obligations; provided, however, that we will select all investments after considering our ability to continue to qualify to be taxed as a RIC.
The level of our investment activity depends on many factors, including the amount of debt and equity capital available to prospective borrowers, the level of refinancing activity for such companies, the availability of credit to finance transactions, the general economic environment and the competitive environment for the types of investments we make. The timing of investing the proceeds from our Offering depends on the availability of investment opportunities that are consistent with our investment objective and strategies and restrictions imposed by the RIC diversification requirements. Any distributions we make prior to the time that all capital raised has been deployed may be substantially lower than the distributions that we expect to pay when our portfolio is fully invested.
Our management is not aware of any material trends or uncertainties, favorable or unfavorable, which may reasonably be anticipated to have a material impact on the capital resources and the revenue or income to be derived from our assets.
Revenues
We generate revenue primarily in the form of interest on the debt securities that we hold. We make debt investments that bear interest at fixed and floating rates. Interest on debt securities is generally payable monthly. The principal amount of the debt securities and any accrued but unpaid interest generally become due at the maturity date. In addition, we may generate revenue in the form of exit fees payable upon repayment of the loans we hold, origination fees for loans we originate, commitment and other fees in connection with transactions, all of which are recorded as interest income. As prepayment(s), partial or full, occurs on an investment, prepayment income is recognized. Preferred returns earned on any preferred equity investments, if any, is recognized on an accrual basis to the extent that we expect to collect such amounts.
Expenses
Our primary operating expenses include interest expense from obligations under participation agreements, professional fees, marketing expenses, payment of adviser fees and reimbursement of expenses to Terra Income Advisors and other expenses necessary for our operations. We bear other expenses, which include, among other things:
• | corporate, organizational and offering expenses relating to offerings of our common stock, subject to limitations included in the Investment Advisory Agreement; |
40
• | the cost of calculating our NAV, including the related fees and cost of any third-party valuation services; |
• | the cost of effecting sales and repurchases of shares of our common stock and other securities; |
• | fees payable to third parties relating to, or associated with, monitoring our financial and legal affairs; |
• | making investments and valuing investments, including fees and expenses associated with performing due diligence reviews of prospective investments; |
• | interest payable on debt, if any, incurred to finance our investments; |
• | transfer agent and custodial fees; |
• | fees and expenses associated with marketing efforts; |
• | servicing fees; |
• | federal and state registration fees; |
• | federal, state and local taxes; |
• | independent directors’ fees and expenses, including travel expenses; |
• | costs of director and stockholder meetings, proxy statements, stockholders’ reports and notices; |
• | costs of fidelity bonds, directors and officers/errors and omissions liability insurance and other insurance premiums; |
• | direct costs, including those relating to printing of stockholder reports and advertising or sales materials, mailing and long distance telephone expenses; |
• | fees and expenses associated with independent audits and outside legal costs, including compliance with the Sarbanes-Oxley Act of 2002, the 1940 Act and applicable federal and state securities laws; |
• | costs associated with our chief compliance officer; |
• | brokerage commissions for our investments; and |
• | all other expenses incurred by us or Terra Income Advisors in connection with administering our investment portfolio, including expenses incurred by Terra Income Advisors in performing certain of its obligations under the Investment Advisory Agreement. |
We reimburse Terra Income Advisors for expenses necessary to perform services related to our administration and operation. The amount of this reimbursement is set at the lesser of (i) Terra Income Advisors’ actual costs incurred in providing such services and (ii) the amount that the Board, including a majority of our independent directors, estimates we would be required to pay alternative service providers for comparable services in the same geographic location. Terra Income Advisors is required to allocate the cost of such services to us based on objective factors, such as total assets, revenues, time allocations and/or other reasonable metrics. The Board then assesses the reasonableness of such reimbursements based on the breadth, depth and quality of such services as compared to the estimated cost to us of obtaining similar services from third-party providers known to be available. In addition, the Board considers whether any single third-party service provider would be capable of providing all such services at comparable cost and quality. Finally, the Board compares the total amount paid to Terra Income Advisors for such services as a percentage of our net assets to the same ratio as reported by other comparable BDCs. We do not reimburse Terra Income Advisors for any services for which it receives a separate fee, or for rent, depreciation, utilities, capital equipment or other administrative items allocated to a controlling person of Terra Income Advisors.
Net Investment Portfolio
The tables below present our investment portfolio on a net investment basis, which represents our proportionate share of the investments, based on our economic ownership of these investments. This measure is used in reports to our executive management and is used as a component to the asset base from which we calculate our base management fee. We believe that this measure provides useful information to investors because it represents our total assets under management and the financial exposure of each investment individually.
41
September 30, 2017 | |||||||||||||||||||||||
Gross Investments | Transfers Treated as Obligations Under Participation Agreements | Net Investments | |||||||||||||||||||||
Amortized Cost | Fair Value | Amortized Cost | Fair Value | Amortized Cost | Fair value | ||||||||||||||||||
OHM Atlanta Owner, LLC | $ | 9,955,647 | $ | 10,091,628 | $ | — | $ | — | $ | 9,955,647 | $ | 10,091,628 | |||||||||||
140 Schermerhorn Street Mezz, LLC | 7,468,766 | 7,565,359 | — | — | 7,468,766 | 7,565,359 | |||||||||||||||||
KOP Hotel XXXI Mezz, LP. | 5,786,133 | 5,866,063 | 1,795,696 | 1,820,502 | 3,990,437 | 4,045,561 | |||||||||||||||||
YIP Santa Maria, LLC | 4,481,473 | 4,538,492 | — | — | 4,481,473 | 4,538,492 | |||||||||||||||||
Residential X Mezz Concord, LLC and Center Associates Mezz, LLC | 4,175,118 | 4,315,751 | — | — | 4,175,118 | 4,315,751 | |||||||||||||||||
GAHC3 Lakeview IN Medical Plaza, LLC | 3,417,207 | 3,428,041 | — | — | 3,417,207 | 3,428,041 | |||||||||||||||||
Dwight Mezz II, LLC | 3,000,000 | 3,000,000 | — | — | 3,000,000 | 3,000,000 | |||||||||||||||||
NB Factory JV, LLC | 2,445,056 | 2,445,056 | — | — | 2,445,056 | 2,445,056 | |||||||||||||||||
Hertz Clinton One Mezzanine, LLC | 2,437,857 | 2,526,660 | — | — | 2,437,857 | 2,526,660 | |||||||||||||||||
TSG-Parcel 1, LLC | 2,020,000 | 2,019,339 | — | — | 2,020,000 | 2,019,339 | |||||||||||||||||
$ | 45,187,257 | $ | 45,796,389 | $ | 1,795,696 | $ | 1,820,502 | $ | 43,391,561 | $ | 43,975,887 | ||||||||||||
September 30, 2016 | |||||||||||||||||||||||
Gross Investments | Transfers Treated as Obligations Under Participation Agreements | Net Investments | |||||||||||||||||||||
Amortized Cost | Fair Value | Amortized Cost | Fair Value | Amortized Cost | Fair Value | ||||||||||||||||||
QPT 24th Street Mezz, LLC | $ | 15,250,567 | $ | 15,250,567 | $ | 12,708,034 | $ | 12,708,034 | $ | 2,542,533 | $ | 2,542,533 | |||||||||||
KOP Hotel XXXI Mezz, LP. | 5,800,000 | 5,969,398 | 1,800,000 | 1,852,572 | 4,000,000 | 4,116,826 | |||||||||||||||||
GAHC3 Lakeview IN Medical Plaza, LLC | 3,074,671 | 3,074,671 | — | — | 3,074,671 | 3,074,671 | |||||||||||||||||
Hertz Clinton One Mezzanine, LLC | 2,429,286 | 2,429,286 | — | — | 2,429,286 | 2,429,286 | |||||||||||||||||
TSG-Parcel 1, LLC | 2,000,000 | 2,022,814 | — | — | 2,000,000 | 2,022,814 | |||||||||||||||||
$ | 28,554,524 | $ | 28,746,736 | $ | 14,508,034 | $ | 14,560,606 | $ | 14,046,490 | $ | 14,186,130 | ||||||||||||
Years Ended September 30, | |||||||||||||||||
2017 | 2016 | 2015 (1) | |||||||||||||||
Weighted Average Principal Amount | Weighted Average Coupon Rate | Weighted Average Principal Amount | Weighted Average Coupon Rate | Weighted Average Principal Amount | Weighted Average Coupon Rate | ||||||||||||
Gross investments | $ | 46,172,594 | 13.1% | $ | 20,917,528 | 13.4% | $ | 1,714,286 | 12.0% | ||||||||
Obligations under participation agreements | (11,834,247 | ) | 13.8% | (11,272,951 | ) | 13.8% | — | — | |||||||||
Mortgage loan payable (2) | (465,753 | ) | 5.8% | — | — | — | — | ||||||||||
Net investments | $ | 33,872,594 | 12.9%(3) | $ | 9,644,577 | 12.8%(3) | $ | 1,714,286 | 12.0%(3) | ||||||||
(1) | Represents the period from June 24, 2015 (date the Minimum Offering Requirement was met) through September 30, 2015. |
(2) | The mortgage loan payable was repaid prior to September 30, 2017. |
(3) | Represents net interest income over the period calculated using the weighted average coupon rate and weighted average principal amount shown on the table (interest income on the investments less interest expense) divided by the weighted average principal amount of the net investments during the period. |
42
Portfolio Investment Activity
For the year ended September 30, 2017, we invested $44.8 million in new loans and had $28.5 million of repayments, resulting in net gross investments of $16.3 million.
Additionally, for the three months ended June 30, 2017, we suspended interest income accrual of $0.7 million on a senior loan and a mezzanine loan, and wrote off $0.5 million of past due interest receivables and $0.3 million of exit fee accruals because recovery of such income and fee was doubtful. As a result, we suspended interest expense accrual of $0.5 million on the mezzanine loan on which we had a participation liability, and wrote off $0.4 million of interest payable and $0.1 million of exit fee accruals. In July 2017, the principal balances of these two loans and the obligations under participation agreement were repaid in full.
For the year ended September 30, 2016, we invested $26.3 million in new loans and had no exits or repayments, resulting in a net gross investment of $26.3 million.
For the year ended September 30, 2015, we made a $2.0 million investment through a participation interest in a portfolio company and had no exits or repayments, resulting in a net gross investment of $2.0 million.
Our portfolio composition, based on fair value at September 30, 2017 and 2016, was as follows:
September 30, 2017 | September 30, 2016 | |||||||||||
Percentage of Total Portfolio | Weighted Average Yield (1) | Percentage of Total Portfolio | Weighted Average Yield (1) | |||||||||
Loans | 51.7 | % | 12.4 | % | 93.0 | % | 13.4 | % | ||||
Loans through participation interest | 48.3 | % | 12.3 | % | 7.0 | % | 12.0 | % | ||||
Total | 100.0 | % | 12.4 | % | 100.0 | % | 13.3 | % | ||||
_______________
(1) | Based upon the principal value of our debt investments. |
The following table shows the portfolio composition by property type grouping based on fair value at September 30, 2017 and 2016:
September 30, 2017 | September 30, 2016 | |||||||||||||
Investments at Fair Value | Percentage of Total Portfolio | Investments at Fair Value | Percentage of Total Portfolio | |||||||||||
Hotel | $ | 17,969,914 | 39.2 | % | $ | 5,969,398 | 20.8 | % | ||||||
Land | 12,110,967 | 26.5 | % | 17,273,381 | 60.1 | % | ||||||||
Office | 5,954,701 | 13.0 | % | 5,503,957 | 19.1 | % | ||||||||
Student housing | 5,445,056 | 11.9 | % | — | — | % | ||||||||
Multifamily | 4,315,751 | 9.4 | % | — | — | % | ||||||||
Total | $ | 45,796,389 | 100.0 | % | $ | 28,746,736 | 100.0 | % | ||||||
The following table presents the fair value measurements at September 30, 2017 and 2016:
September 30, 2017 | September 30, 2016 | |||||||||||||
Investments at Fair Value | Percentage of Total Portfolio | Investments at Fair Value | Percentage of Total Portfolio | |||||||||||
Loans | $ | 23,675,007 | 51.7 | % | $ | 26,723,922 | 93.0 | % | ||||||
Loans through participation interest | 22,121,382 | 48.3 | % | 2,022,814 | 7.0 | % | ||||||||
Total | $ | 45,796,389 | 100.0 | % | $ | 28,746,736 | 100.0 | % | ||||||
Obligations under Participation Agreements
We may enter into participation agreements with related and unrelated parties, primarily other affiliated funds of our sponsor. The participation agreements provide us with the opportunity to invest along the same terms, conditions, price, and rights in the specified investment. The purpose of the participation agreements is to allow us and an affiliate to originate a specified investment when, individually, we do not have the liquidity to do so or to achieve a certain level of portfolio diversification. We may transfer portions of our investments to other participants or we may be a participant to an investment held by another entity.
43
Certain partial loan sales do not qualify for sale accounting under Accounting Standard Codification (“ASC”) Topic 860 Transfers and Servicing (“ASC Topic 860”) because these sales do not meet the definition of a “participating interest,” as defined in the guidance, in order for sale treatment to be allowed. Participations or other partial loan sales which do not meet the definition of a participating interest remain as an investment on the accompanying statements of assets and liabilities and the portion transferred is recorded as obligations under participation agreements in the liabilities section of the statements of assets and liabilities.
As of September 30, 2017 and 2016, obligations under participation agreements at fair value totaled $1.8 million and $14.6 million, respectively, and the fair value of the loans that are associated with these obligations under participation agreements was $5.9 million and $21.2 million, respectively. For the year ended September 30, 2017, we made $12.9 million of repayments on obligations under participation agreements, including PIK interest of $0.4 million. For the year ended September 30, 2016, there were no repayments on obligations under participation agreements. The weighted average interest rate on our obligations under participation agreements was approximately 13.0% and 13.9% as of September 30, 2017 and 2016, respectively.
Results of Operations
We were formed on May 15, 2013, and commenced operations on June 24, 2015. Our management is not aware of any material trends or uncertainties, favorable or unfavorable, other than national economic conditions affecting our target portfolio, which may be reasonably anticipated to have a material impact of the capital resources and the revenue or income to be derived from the operations of our net assets.
Operating results for the years ended September 30, 2017, 2016 and 2015 were as follows:
Years Ended September 30, | ||||||||||||||||||||||||
2017 | 2016 | Change | 2016 | 2015 | Change | |||||||||||||||||||
Total investment income | $ | 5,257,725 | $ | 3,016,699 | $ | 2,241,026 | $ | 3,016,699 | $ | 66,822 | $ | 2,949,877 | ||||||||||||
Total operating expenses | 5,363,736 | 6,049,254 | (685,518 | ) | 6,049,254 | 1,750,928 | 4,298,326 | |||||||||||||||||
Less: Expense reimbursement from Adviser | — | (576,755 | ) | 576,755 | (576,755 | ) | (1,690,300 | ) | 1,113,545 | |||||||||||||||
Less: Reduction of offering costs | (944,248 | ) | — | (944,248 | ) | — | — | — | ||||||||||||||||
Net operating expenses | 4,419,488 | 5,472,499 | (1,053,011 | ) | 5,472,499 | 60,628 | 5,411,871 | |||||||||||||||||
Net investment income (loss) | 838,237 | (2,455,800 | ) | 3,294,037 | (2,455,800 | ) | 6,194 | (2,461,994 | ) | |||||||||||||||
Net change in unrealized appreciation on investments | 416,920 | 192,212 | 224,708 | 192,212 | — | 192,212 | ||||||||||||||||||
Net change in unrealized appreciation on obligations under participation agreements | 27,767 | (52,572 | ) | 80,339 | (52,572 | ) | — | (52,572 | ) | |||||||||||||||
Net increase (decrease) in net assets resulting from operations | $ | 1,282,924 | $ | (2,316,160 | ) | $ | 3,599,084 | $ | (2,316,160 | ) | $ | 6,194 | $ | (2,322,354 | ) | |||||||||
Investment Income
The composition of our investment income for the years ended September 30, 2017, 2016 and 2015 were as follows:
Years Ended September 30, | ||||||||||||||||||||||||
2017 | 2016 | Change | 2016 | 2015 | Change | |||||||||||||||||||
Interest income | $ | 4,916,169 | $ | 3,003,645 | $ | 1,912,524 | $ | 3,003,645 | $ | 65,341 | $ | 2,938,304 | ||||||||||||
Prepayment fee income | 63,960 | — | 63,960 | — | — | — | ||||||||||||||||||
Other fee income | 277,596 | 13,054 | 264,542 | 13,054 | 1,481 | 11,573 | ||||||||||||||||||
Total investment income | $ | 5,257,725 | $ | 3,016,699 | $ | 2,241,026 | $ | 3,016,699 | $ | 66,822 | $ | 2,949,877 | ||||||||||||
Interest Income
2017 vs. 2016 — For the year ended September 30, 2017 as compared to the same period in 2016, interest income increased by $1.9 million, primarily due to an increase in contractual interest income of $1.7 million, net of the non-collection of $1.2 million of interest income on two loans whose principal amounts were repaid in full in July 2017, and an increase in net amortization of origination fee, exit fee and purchase premium and discount of $0.3 million. The increase in contractual interest income was primarily due to a higher weighted average principal balance partially offset by a lower weighted average coupon rate on our investment portfolio. The decrease in weighted average coupon rate on our investment portfolio was due to a higher volume of investments in senior loans and subordinated loans with lower coupon rates in 2017 as compared to 2016.
44
2016 vs. 2015 — For the year ended September 30, 2016 as compared to the same period in 2015, total investment income increased by $2.9 million, primarily due to higher weighted average principal balance as well as higher weighted average coupon rate on our investment portfolio.
Prepayment Fee Income
Prepayment fee income represents prepayment fees charged to borrowers for the early repayment of loans.
2017 — For the year ended September 30, 2017, we received a prepayment fee of $0.1 million from the early repayment of a loan.
2016 — For the year ended September 30, 2016, we did not receive any prepayment fee income.
2015 — For the year ended September 30, 2015, we did not receive any prepayment fee income.
Other Fee Income
2017 vs. 2016 — For the year ended September 30, 2017 as compared to the same period in 2016, other fee income increased by $0.3 million, primarily due to a $0.2 million standby fee received from a borrower as compensation for the delay in closing the investment.
2016 vs. 2015 — For the year ended September 30, 2016 as compared to the same period in 2015, other fee income was substantially the same.
Operating Expenses
The composition of our operating expenses for the years ended September 30, 2017, 2016 and 2015 were as follows:
Years Ended September 30, | ||||||||||||||||||||||||
2017 | 2016 | Change | 2016 | 2015 | Change | |||||||||||||||||||
Base management fees | $ | 1,202,568 | $ | 552,011 | $ | 650,557 | $ | 552,011 | $ | 30,058 | $ | 521,953 | ||||||||||||
Incentive fees on capital gains | 90,459 | 27,928 | 62,531 | 27,928 | — | 27,928 | ||||||||||||||||||
Operating expense reimbursement to Adviser | 530,619 | 318,550 | 212,069 | 318,550 | 17,753 | 300,797 | ||||||||||||||||||
Professional fees | 1,071,089 | 981,038 | 90,051 | 981,038 | 378,192 | 602,846 | ||||||||||||||||||
Interest expense from obligations under participation agreements | 838,860 | 1,598,976 | (760,116 | ) | 1,598,976 | — | 1,598,976 | |||||||||||||||||
Marketing expenses | 777,058 | 876,877 | (99,819 | ) | 876,877 | 596,865 | 280,012 | |||||||||||||||||
Amortization of deferred offering costs | 375,748 | 1,312,811 | (937,063 | ) | 1,312,811 | 383,182 | 929,629 | |||||||||||||||||
Insurance expense | 213,870 | 219,715 | (5,845 | ) | 219,715 | 127,630 | 92,085 | |||||||||||||||||
General and administrative expenses | 114,491 | 38,223 | 76,268 | 38,223 | 12,534 | 25,689 | ||||||||||||||||||
Directors’ fees | 113,000 | 123,125 | (10,125 | ) | 123,125 | 74,250 | 48,875 | |||||||||||||||||
Interest expense on mortgage loan payable | 35,974 | — | 35,974 | — | — | — | ||||||||||||||||||
Organization expenses | — | — | — | — | 130,464 | (130,464 | ) | |||||||||||||||||
Total operating expenses | 5,363,736 | 6,049,254 | (685,518 | ) | 6,049,254 | 1,750,928 | 4,298,326 | |||||||||||||||||
Less: Expense reimbursement from Adviser | — | (576,755 | ) | 576,755 | (576,755 | ) | (1,690,300 | ) | 1,113,545 | |||||||||||||||
Less: Reduction of offering costs | (944,248 | ) | — | (944,248 | ) | — | — | — | ||||||||||||||||
Net operating expenses | $ | 4,419,488 | $ | 5,472,499 | $ | (1,053,011 | ) | $ | 5,472,499 | $ | 60,628 | $ | 5,411,871 | |||||||||||
For the year ended September 30, 2017 as compared to the same period in 2016, total operating expenses decreased by $0.7 million. For the year ended September 30, 2016 as compared to the same period in 2015, total operating expenses increased by$4.3 million. The reasons for the changes are stated below.
45
Base Management Fee
Under the Investment Advisory Agreement, we pay Terra Income Advisors a base management fee, which is calculated at an annual rate of 2.0% of our average gross assets.
2017 vs. 2016 — For the year ended September 30, 2017 as compared to the same period in 2016, base management fee increased by $0.7 million due to an increase in our gross assets. We expect our gross assets to continue to increase as we continue to raise funds in our Offering.
2016 vs. 2015 — For the year ended September 30, 2016 as compared to the same period in 2015, base management fee increased by $0.5 million due to an increase in our gross assets.
Operating Expense Reimbursement to Adviser
Under the Investment Advisory Agreement, we reimburse Terra Income Advisors for operating expenses incurred in connection with administrative services provided to us, including compensation to administrative personnel.
2017 vs. 2016 — For the year ended September 30, 2017 as compared to the same period in 2016, operating expense reimbursed to Terra Income Advisors increased by $0.2 million, primarily due to an increase in allocable costs from Terra Income Advisors, primarily related to compensation expense paid to Terra Income Advisors’ employees, as well as an increase in gross proceeds from the Offering, which was the basis for the costs allocated to us by Terra Income Advisors.
2016 vs. 2015 — For the year ended September 30, 2016 as compared to the same period in 2015, operating expense reimbursed to Terra Income Advisors increased by $0.3 million, primarily due to an increase in allocable costs, primarily related to compensation expense, as well as an increase in gross proceeds from the Offering, which was the basis for the costs allocated to us by Terra Income Advisors.
Professional Fees
2017 vs. 2016 — For the year ended September 30, 2017 as compared to the same period in 2016, professional fees were substantially the same. The increase in accounting fees due to the growth of our investment portfolio was substantially offset by a decrease in legal fees resulting from fees incurred in connection with the application for exemptive relief from the SEC for the year ended September 30, 2016.
2016 vs. 2015 — For the year ended September 30, 2016 as compared to the same period in 2015, professional fees increased by $0.6 million reflecting a full year of expense recognized for the year ended September 30, 2016 compared to six months of expense recognized for the period from June 24, 2015 (date the Minimum Offering Requirement was met) through
September 30, 2015. Additionally, professional fees for the year ended September 30, 2016 increased as a result additional legal fees incurred in connection with the application for exemptive relief from the SEC.
September 30, 2015. Additionally, professional fees for the year ended September 30, 2016 increased as a result additional legal fees incurred in connection with the application for exemptive relief from the SEC.
Interest Expense from Obligations under Participation Agreements
2017 vs. 2016 — For the year ended September 30, 2017 as compared to the same period in 2016, interest expense from obligations under participation agreements decreased by $0.8 million, primarily due to the non-payment of $0.9 million of interest expense on a loan on which we had a participation liability because we did not receive the related interest income payment from the borrower to make the interest expense payment. The loan was repaid in July 2017, at which time we repaid the obligation under participation agreement in full.
2016 vs. 2015 — For the year ended September 30, 2016, interest expense from obligations under participation agreements was $1.6 million, related to two loans which we transferred a portion of the loans to affiliates via participation agreements during the period. For the year ended September 30, 2015, there was no interest expense from obligations under participation agreements because we did not have any obligations under participation agreements during the period.
Amortization of Offering Costs
All offering costs incurred during the offering period are recorded as deferred charge and amortized over twelve months from the date the cost is incurred, with the exception of those costs that were incurred prior to the commencement of operations on June 24, 2015, which were amortized over a 12-month period from that date forward.
2017 vs. 2016 — For the year ended September 30, 2017 as compared to the same period in 2016, amortization of offering costs decreased by $0.9 million, primarily due to the offering costs incurred prior to the commencement of operations having been fully amortized on June 30, 2016.
2016 vs. 2015 — For the year ended September 30, 2016 as compared to the same period in 2015, amortization of offering costs increased by $0.9 million, primarily due to the amortization of offering costs incurred prior to the commencement of operations on June 24, 2015 as well as additional offering costs incurred in connection with our Offering.
46
Expense Reimbursement from Adviser
On June 30, 2015, we entered into an expense support agreement (the “Expense Support Agreement”) with Terra Income Advisors, whereby Terra Income Advisors may pay up to 100% of our costs and expenses for any period since inception, including all fees payable to Terra Income Advisors pursuant to the Investment Advisory Agreement, until we and Terra Income Advisors mutually agree otherwise. This payment (the “Expense Support Payment”) for any month shall be paid by Terra Income Advisors to us in any combination of cash or other immediately available funds, and/or offsets against amounts due from us to Terra Income Advisors. The purpose of the Expense Support Payment is to reduce offering and operating expenses until we have achieved economies of scale sufficient to ensure that we are able to bear a reasonable level of expense in relation to investment income. Operating expenses subject to the Expense Support Agreement include expenses as determined by U.S. generally accepted accounting principles (“U.S. GAAP”), including, without limitation, fees payable to Terra Income Advisors and interest on indebtedness for such period, if any.
Pursuant to the terms of the Expense Support Agreement, we have agreed to reimburse Terra Income Advisors for each Expense Support Payment within three years after such Expense Support Payment is made by Terra Income Advisors. Reimbursement shall be made as promptly as possible on a date mutually agreed to by us and Terra Income Advisors provided that (i) the operating expense ratio, defined as operating expenses excluding organization and offering expenses, base management fees, incentive fees and any interest expense attributable to indebtedness by us (“Net Operating Expenses”) expressed as a percentage of our net assets on the relevant measurement date, as of such reimbursement date is equal to or less than the operating expense ratio as of the Expense Support Payment date attributable to such specified Expense Support Payment, (ii) the annualized distribution rate as of such reimbursement date is equal to or greater than the annualized distribution rate as of the Expense Support Payment date attributable to such specified Expense Support Payment; (iii) such reimbursement date is not later than three years following such specified Expense Support Payment date; and (iv) the Expense Support Payment does not cause our Net Operating Expenses to exceed 1.5% of our net assets attributable to common shares, after taking such reimbursement into account. Terra Income Advisors is entitled to reimbursement of all previously unreimbursed Expense Support Payments in the event of termination of the Expense Support Agreement.
2017 — For the year ended September 30, 2017, there were no expenses reimbursed by Terra Income Advisors.
2016 — For the year ended September 30, 2016, we recognized expense reimbursements made by Terra Income Advisors of $0.6 million, which are included in the statements of operations.
2015 — For the year ended September 30, 2015, we recognized expense reimbursements made by Terra Income Advisors of $1.7 million, which are included in the statements of operations.
Reduction of Offering Costs
2017 — Subsequent to March 31, 2017 and in response to the general trend in capital raising for non-traded direct participation programs, we determined that it is highly unlikely that we will raise capital in an amount sufficient for all cumulative offering costs incurred by Terra Income Advisors to be reimbursed. Accordingly, we reduced the estimated amount payable to Terra Income Advisors for cumulative organization and offering costs incurred and reversed the amortization of offering costs previously recognized by $0.9 million for the year ended September 30, 2017.
2016 — For the year ended September 30, 2016, we did not record any reduction of offering costs.
2015 — For the year ended September 30, 2015, we did not record any reduction of offering costs.
Net Change in Unrealized Appreciation on Investments and Obligations under Participation Agreements
Net change in unrealized appreciation on investments and obligations under participation agreements reflects the change in our portfolio investment values during the reporting period, including any reversal of previously recorded unrealized gains or losses, when gains or losses are realized. Valuation of our portfolio investments and obligations under participation agreements fluctuates over time, reflecting changes in the market yields for loans and debt investments, and any associated premium or discount and origination or exit fee will be amortized down or accreted up to par value as each investment approaches maturity.
2017 vs. 2016 — For the year ended September 30, 2017 as compared to the same period in 2016, net change in unrealized appreciation on investments increased by $0.2 million, and net change in unrealized appreciation on obligations under participation agreements decreased by $0.1 million, reflecting a decrease in the fair value of two loans which were settled at par.
2016 vs. 2015 — For the year ended September 30, 2016, net change in unrealized appreciation on investments was $0.2 million, and net change in unrealized appreciation on obligations under participation agreements was $0.1 million. For the year ended September 30, 2015, there was no net change in unrealized appreciation investments and obligations under participation agreements as the only investment held by us was acquired close to year-end.
47
Net Increase (Decrease) in Net Assets Resulting from Operations
2017 — For the year ended September 30, 2017, we recorded a net increase in net assets resulting from operations of $1.3 million. Based on the weighted average shares of common stock outstanding, our per share net increase in net assets resulting from operations was $0.23.
2016 — For the year ended September 30, 2016, we recorded a net decrease in net assets resulting from operations of $2.3 million. Based on the weighted average shares of common stock outstanding, our per share net decrease in net assets resulting from operations was $0.93.
2015 — For the year ended September 30, 2015, we recorded a net increase in net assets resulting from operations of $0.01 million. Based on the weighted average shares of common stock outstanding, our per share net increase in net assets resulting from operations was $0.01.
Capital Contribution from Terra Capital Partners
Pursuant to an initial capitalization and subsequent private placement, Terra Capital Partners had purchased an aggregate of $175,000 of shares of our common stock at $11.25 per share, which price represented the initial public offering price of $12.50 per share, net of selling commissions, broker-dealer fees and dealer manager fees. On February 25, 2015, the Board determined to change the initial offering price from $10.00 per share to $12.50 per share. As a result, on February 26, 2015, we effected a reverse stock split to account for the change in our offering price since the initial investment by Terra Capital Partners. As such, all share references and equity transaction pricing elsewhere reflect this reverse stock split. On May 1, 2015, Terra Capital Partners also purchased an additional $275,000 of shares of our common stock from the Offering at $11.25 per share, also net of selling commissions, broker-dealer fees and dealer manager fees from the then-current offering price of $12.50 per share. As a result, gross offering proceeds of $450,000 were immediately available to us. The gross offering proceeds from Terra Capital Partners’ capital contributions have been included for purposes of determining our satisfaction of the Minimum Offering Requirement.
Financial Condition, Liquidity and Capital Resources
We currently generate cash primarily from the net proceeds of the Offering and from cash flows from interest, dividends and fees earned from our investments and principal repayments and proceeds from sales of our investments. Our primary use of cash is for our targeted investments, payments of our expenses and cash distributions to our stockholders. We sell our shares on a continuous basis at a current per share price of $10.90. However, to the extent that our NAV per share increases to an amount greater than our net proceeds as stated in our prospectus dated April 27, 2016, we will sell at a price necessary to ensure that our shares are not sold at a price, after deduction of selling commissions, broker-dealer fees and dealer manager fees, that is below NAV per share. On November 11, 2015, and effective as December 1, 2015, the Board approved a change to a certain aspect of our share pricing policy such that, once we have raised gross offering proceeds in excess of $125 million, or prior to then in the sole discretion of our Board, in the event of a material decline in our NAV per share, which we consider to be a 2.5% decrease below our then-current net offering price, we will reduce our offering price to establish a new net offering price not more than 2.5% above our NAV per share.
Prior to investing in securities of portfolio companies, we will invest the net proceeds from the Offering and from sales and paydowns of existing investments primarily in cash, cash equivalents, U.S. government securities, repurchase agreements and high-quality debt instruments maturing in one year or less from the time of investment, consistent with our intended BDC election and our election to be taxed as a RIC.
We may borrow funds to make investments, including before we have fully invested the proceeds of our continuous offering, to the extent we determine that leveraging our portfolio would be appropriate. We have not decided whether, and to what extent, we will finance portfolio investments using debt or the specific form that any such financing would take. Accordingly, we cannot predict with certainty what terms any such financing would have or the costs we would incur in connection with any such arrangement. We currently do not anticipate issuing any preferred stock; however, our charter authorizes us to do so.
Our principal demands for funds are for portfolio investments, either directly or through investment interests, for the payment of operating expenses, distributions to our investors and for the payment of principal and interest on any outstanding indebtedness we may acquire. Generally, cash needs for investment activities will be met through proceeds from the sale of shares of our common stock through the Offering. Management expects that in the future, as our investment portfolio grows, our investments will generate sufficient cash flow to cover operating expenses and the payment of a monthly distribution.
48
Cash Flows for the Year Ended September 30, 2017
Operating Activities — For the year ended September 30, 2017, net cash used in operating activities was $28.9 million. The level of cash flows used in or provided by operating activities is affected by the timing of purchases, repayments and sales of portfolio investments, among other factors. Cash flows used in operating activities for the year ended September 30, 2017 were primarily purchases of investments totaling $44.8 million, partially offset by repayments of investments of $28.5 million. Additionally, we made $12.9 million of repayments on obligations under participation agreements for the year ended September 30, 2017.
Financing Activities — For the year ended September 30, 2017, net cash provided by financing activities was $29.5 million, primarily related to proceeds from the issuance of common stock of $35.1 million, partially offset by payments of selling commissions and dealer manager fees of $2.2 million and distributions paid to stockholders of $3.4 million. We also received proceeds of $3.3 million from a mortgage financing which we repaid in June 2017.
Cash Flows for the Year Ended September 30, 2016
Operating Activities — For the year ended September 30, 2016, net cash used in operating activities was $13.4 million. The level of cash flows used in or provided by operating activities is affected by the timing of purchases, redemptions and sales of portfolio investments, among other factors. Cash flows used in operating activities for the year ended September 30, 2016 were primarily purchases of investments totaling $26.3 million, partially offset by net proceeds from obligations under participation agreements of $14.3 million.
Financing Activities — Net cash provided by financing activities was $36.8 million for the year ended September 30, 2016, primarily related to proceeds from the issuance of common stock of $39.9 million and reimbursement of $1.3 million from Terra Capital Markets for commissions and dealer manager fees we paid related to shares sold prior to February 20, 2016 (see “Contractual Obligations” below), partially offset by payments of selling commissions, dealer manager fees and transaction charges of $2.8 million and distributions paid to stockholders of $1.6 million.
Cash Flows for the Year Ended September 30, 2015
Operating Activities — For the year ended September 30, 2015, net cash used in operating activities was $2.0 million, primarily due to a purchase of an investment for $2.0 million. The level of cash flows used in or provided by operating activities is affected by the timing of purchases, redemptions and sales of portfolio investments, among other factors.
Financing Activities — Cash flows provided by financing activities was $10.1 million for the year ended September 30, 2015, primarily related to proceeds from issuance of common stock of $11.2 million, partially offset by payments of selling commissions and dealer manager fees of $0.9 million and distributions paid to stockholders of $0.1 million.
RIC Status and Distributions
We have elected to be treated for federal income tax purposes and to qualify annually thereafter, as a RIC under Subchapter M of the Code. In order to maintain our qualification to be taxed as a RIC, we must, among other things, distribute at least 90.0% of our “investment company taxable income,” as defined by the Code, each year. As long as the distributions are declared by the later of the fifteenth day of the ninth month following the close of the taxable year or the due date of the tax return, including extensions, distributions paid up to one year after the current tax year can be carried back to the prior tax year for determining the distributions paid in such tax year. We intend to make sufficient distributions to our stockholders to maintain our qualification to be taxed as a RIC each year. We are also subject to nondeductible federal excise taxes if we do not distribute at least 98.0% of net ordinary income, 98.2% of any capital gain net income, if any, and any recognized and undistributed income from prior years on which we paid no federal income taxes.
Distributions to our stockholders are recorded as of the record date. Subject to the discretion of the Board and applicable legal restrictions, we authorize and declare ordinary cash distributions on either a monthly or quarterly basis and pay such distributions on a monthly basis. We calculate each stockholder’s specific distribution amount for the period using daily record dates, and each stockholder’s distributions begin to accrue on the date we accept such stockholder’s subscription for shares of our common stock. From time to time at the discretion of the Board, we may also pay special interim distributions in the form of cash or shares of common stock.
During certain periods, our distributions may exceed our earnings, especially during the period before we have substantially invested the proceeds from the Offering of our common stock. As a result, it is possible that some or all of the distributions we make will represent a return of capital for tax purposes. A return of capital generally is a return of an investor’s investment rather than a return of earnings or gains derived from our investment activities and will be made after deducting the fees and expenses payable in connection with the Offering, including any fees payable to Terra Income Advisors. Each year a statement on Form 1099-DIV identifying the sources of the distributions will be mailed to our stockholders.
49
We intend to continue to make our ordinary distributions in the form of cash out of assets legally available for distribution, unless stockholders elect to receive their cash distributions in additional shares of our common stock under our distribution reinvestment plan. Any distributions reinvested under the plan will nevertheless remain taxable to a U.S. stockholder.
We have adopted an “opt in” distribution reinvestment plan for our stockholders. As a result, if we make a cash distribution, our stockholders will receive distributions in cash unless they specifically “opt in” to the distribution reinvestment plan so as to have their cash distributions reinvested in additional shares of our common stock. However, certain state authorities or regulators may impose restrictions from time to time that may prevent or limit a stockholder’s ability to participate in the distribution reinvestment plan.
We may fund our cash distributions to stockholders from any sources of funds available to us, including offering proceeds, borrowings, net investment income from operations, capital gains proceeds from the sale of assets, non-capital gains proceeds from the sale of assets, dividends or other distributions paid to us on account of preferred and common equity investments in portfolio companies. We have not established limits on the amount of funds we may use from available sources to make distributions.
Critical Accounting Policies
Our financial statements are prepared in conformity with U.S. GAAP, which requires us to make estimates and assumptions that affect the reported amounts of assets and liabilities at the date of the financial statements and the reported amounts of revenues and expenses during the reporting period. Critical accounting policies are those that require the application of management’s most difficult, subjective or complex judgments, often because of the need to make estimates about the effect of matters that are inherently uncertain and that may change in subsequent periods. In preparing the financial statements, management has made estimates and assumptions that affect the reported amounts of assets and liabilities at the date of the financial statements and the reported amounts of revenues and expenses during the reporting periods. In preparing the financial statements, management has utilized available information, including industry standards and the current economic environment, among other factors, in forming its estimates and judgments, giving due consideration to materiality. Actual results may differ from these estimates. In addition, other companies may utilize different estimates, which may impact the comparability of our results of operations to those of companies in similar businesses. As we execute our expected operating plans, we will describe additional critical accounting policies in the notes to our future financial statements in addition to those discussed below.
Valuation of Investments
We measure the value of our investments in accordance with fair value accounting guidance promulgated under U.S. GAAP, which establishes a hierarchical disclosure framework that prioritizes and ranks the level of market price observability used in measuring investments at fair value. Market price observability is affected by a number of factors, including the type of investment and the characteristics specific to the investment. Investments with readily available actively quoted prices or for which fair value can be measured from actively quoted prices, generally, will have a higher degree of market price observability and a lesser degree of judgment used in measuring fair value.
Investments measured and reported at fair value will be classified and disclosed in one of the following categories:
• | Level 1 — observable inputs, such as quoted prices in active markets. Publicly listed equities and publicly listed derivatives will be included in Level 1. In addition, securities sold, but not yet purchased, and call options will be included in Level 1. |
• | Level 2 — observable inputs such as for similar securities in active markets and quoted prices for identical securities in markets that are not active. In certain cases, debt and equity securities are valued on the basis of prices from an orderly transaction between market participants provided by reputable dealers or pricing services. In determining the value of a particular investment, pricing services may use certain information with respect to transactions in such investments, quotations from dealers, pricing matrices, market transactions in comparable investments and various relationships between investments. Investments which are generally expected to be included in this category include corporate bonds and loans, convertible debt indexed to publicly listed securities and certain over-the-counter derivatives. |
• | Level 3 — unobservable inputs for which little or no market data exists, therefore requiring an entity to develop its own assumptions. The inputs into the determination of fair value require significant judgment or estimation. |
In certain cases, the inputs used to measure fair value may fall into different levels of the fair value hierarchy. In such cases, an investment’s level within the fair value hierarchy is based on the lowest level of input that is significant to the fair value measurement. Our assessment of the significance of a particular input to the fair value measurement in its entirety requires judgment, and we consider factors specific to the investment. We expect most of the investments that will be held in the investment portfolio to fall into Level 3 of the fair value hierarchy.
50
Valuation of Obligations under Participation Agreements
We have elected the fair value option under ASC Topic 825 — Financial Instruments relating to accounting for debt obligations at their fair value for obligations under participation agreements which arose due to partial loan sales which did not meet the criteria for sale treatment under ASC Topic 860. We employ the yield approach valuation methodology used for the real-estate related loan investments on our obligations under participation agreements.
Federal Income Taxes
We have elected to be taxed for federal income tax purposes, and to qualify annually thereafter, as a RIC under Subchapter M of the Code. As a RIC, we generally will not have to pay corporate-level federal income taxes on any ordinary income or capital gains that we distribute to our stockholders from our earnings and profits as determined for federal income tax purposes. To maintain our RIC tax treatment, we must, among other things, meet specified source-of-income and asset diversification requirements and distribute annually at least 90.0% of our ordinary net income and realized net short-term capital gains in excess of realized net long-term capital losses, if any.
Recognition of a tax benefit or liability with respect to an uncertain tax position is required only when the position is “more likely than not” to be sustained assuming examination by taxing authorities. We recognize interest and penalties, if any, related to unrecognized tax liabilities as income tax expense in the statements of operations. For the years ended September 30, 2017, 2016 and 2015, we did not incur any interest or penalties.
Contractual Obligations
We have entered into certain contracts under which we have material future commitments. On April 20, 2015, we entered into the Investment Advisory Agreement with Terra Income Advisors in accordance with the 1940 Act. The Investment Advisory Agreement became effective on June 24, 2015, the date that we met the Minimum Offering Requirement. Terra Income Advisors serves as our investment adviser in accordance with the terms of the Investment Advisory Agreement. Payments under the Investment Advisory Agreement in each reporting period consist of (i) a base management fee equal to a percentage of the value of our average gross assets and (ii) an incentive fee based on our performance. Terra Income Advisors is also reimbursed for allocated administrative expenses incurred on our behalf. For the years ended September 30, 2017 and 2016, and for the period from our commencement of operations on June 24, 2015 through September 30, 2015, we incurred $1.2 million, $0.6 million, and $0.03 million in base management fee under the Investment Advisory Agreement, respectively. For the years ended September 30, 2017 and 2016, we accrued incentive fees on capital gains of $0.1 million and $0.03 million, respectively, based on net unrealized capital gains of $0.4 million and $0.1 million, respectively. No incentive fees on capital gains are actually payable by us with respect to unrealized gains unless and until those gains are actually realized. There were no such fees for the year ended September 30, 2015. For the years ended September 30, 2017 and 2016, and for the period from our commencement of operations on June 24, 2015 through September 30, 2015, we incurred $0.5 million, $0.3 million and $0.02 million in allocated administrative expenses reimbursable to Terra Income Advisors, respectively.
On April 20, 2015, we entered into a dealer manager agreement (the “Dealer Manager Agreement”) with Terra Capital Markets, an affiliate of Terra Income Advisors, to serve as the dealer manager of the Offering. As dealer manager, Terra Capital Markets is responsible for marketing our shares being offered pursuant to the Offering. In this role, it will manage a group of selling dealers, including other unaffiliated broker-dealers who enter into Selected Dealer Arrangements with Terra Capital Markets. Terra Capital Markets received selling commissions, dealer manager fees and broker-dealer fees of 6.0%, 3.0% and 1.0%, respectively, of gross proceeds from the Offering, all or a portion of which may be re-allowed to selected broker-dealers for marketing and expenses.
On April 27, 2016, we adopted an amended and restated dealer manager agreement (the “Amended Dealer Manager Agreement”). Under the terms of the Amended Dealer Manager Agreement, Terra Capital Markets receives selling commissions, dealer manager fees and broker-dealer fees of 3.0%, 1.5% and up to 1.0%, respectively, of gross proceeds from the Offering, all or a portion of which may be re-allowed to selected broker-dealers for marketing and expenses. In addition, Terra Capital Markets received a transaction charge at an annual rate of 1.125% of gross offering proceeds, excluding shares sold through the distribution reinvestment plan, all or a portion of which may be re-allowed to selected broker-dealers for services performed in connection with the distribution of our shares. The transaction charge was payable annually with respect to each share sold in the primary offering on the first, second, third, and fourth anniversaries of the month of purchase. In connection with the adoption of the Amended Dealer Manager Agreement, Terra Capital Markets reimbursed us $1.3 million for selling commissions and dealer manager fees we paid related to the shares sold on and prior to February 20, 2016, the last stockholder admittance date prior to the adoption of the Amended Dealer Manager Agreement. The reimbursement amount would be paid back to Terra Capital Markets on the first, second, third and fourth anniversaries of the months of purchase.
On September 30, 2017, we adopted the servicing plan (the “Servicing Plan”) and the second amended dealer manager agreement (the “Second Amended Dealer Manager Agreement”), which revised the terms of the servicing fee (which was previously referred to as a transaction charge). Pursuant to the Servicing Plan, Terra Capital Markets receives a servicing fee at an annual rate of 1.125% of the most recently published net asset value per share of our common stock, excluding shares sold through the DRIP,
51
in exchange for providing certain administrative support services. With respect to each share sold, the servicing fee will be payable annually on the anniversary of the applicable month of purchase. Terra Capital Markets, in its discretion, may re-allow a portion of such servicing fee to participating dealers for performing certain administrative support services. The Servicing Plan will remain in effect for so long as such continuance is approved quarterly by the Board, including a majority of our directors who are not “interested persons” as defined in the 1940 Act and who have no direct or indirect financial interest in the operation of the Servicing Plan or in any agreements entered into in connection therewith. In addition, the Boards will review all payments made pursuant to the Servicing Plan at least quarterly. We will no longer incur the annual servicing fee upon the earlier of (i) the aggregate underwriting compensation from all sources, including selling commissions, dealer manager fees, broker-dealer fees, and servicing fees would exceed 10% of the gross proceeds in the Offering, (ii) with respect to a specific share, the date that such share is redeemed or is no longer outstanding, and (iii) the date, if any, upon which a liquidity event occurs. In connection with the adoptions of the Servicing Plan and the Second Amended Dealer Manager Agreement, we reduced the previously recorded transaction charges by $3.2 million.
For the years ended September 30, 2017, 2016 and 2015, we incurred $3.3 million, $3.6 million and $1.0 million of broker-dealer commissions and fees, respectively, and, of this amount, $2.3 million, $2.5 million, and $0.7 million were re-allowed to selected broker-dealers, respectively.
Certain of our loans provide for commitment to fund the borrower at a future date. As of September 30, 2017, we had two loans with total funding commitments of $12.3 million, of which we funded $7.7 million. We expect the remaining $4.6 million will be funded in the next fiscal year.
Off-Balance Sheet Arrangements
Other than contractual commitments and other legal contingencies incurred in the normal course of our business, we do not have any off-balance sheet financings or liabilities.
Recently Issued Accounting Standards
In May 2014, the Financial Accounting Standards Board (“FASB”) issued Accounting Standards Update (“ASU”) 2014-09, Revenue from Contracts with Customers (Topic 606) (“ASU 2014-09”). The core principle of the revenue model is that an entity recognizes revenue to depict the transfer of promised goods or services to customers in an amount that reflects the consideration to which the entity expects to be entitled in exchange for the goods or services. We will adopt this standard on January 1, 2018 using either the retrospective or cumulative effect transition method. We do not expect the adoption of ASU 2014-09 to have a material impact on our financial statements and disclosures.
In January 2016, the FASB issued ASU 2016-01, Financial Instruments — Overall (Subtopic 825-10): Recognition and Measurement of Financial Assets and Financial Liabilities (“ASU 2016-01”). ASU 2016-01 retains many current requirements for the classification and measurement of financial instruments; however, it significantly revises an entity’s accounting related to (i) the classification and measurement of investments in equity securities and (ii) the presentation of certain fair value changes for financial liabilities measured at fair value. ASU 2016-01 also amends certain disclosure requirements associated with the fair value of financial instruments. This guidance is effective for annual and interim periods beginning after December 15, 2017, and early adoption is not permitted for public business entities. We are currently evaluating the impact these changes will have on our financial statements and disclosures.
In February 2016, the FASB issued ASU 2016-02, Leases (Topic 842) (“ASU 2016-02”). ASU 2016-02 outlines a new model for accounting by lessees, whereby their rights and obligations under substantially all leases, existing and new, would be capitalized and recorded on the balance sheet. For lessors, however, the accounting remains largely unchanged from the current model, with the distinction between operating and financing leases retained, but updated to align with certain changes to the lessee model and the new revenue recognition standard. The new standard also replaces existing sale-leaseback guidance with a new model applicable to both lessees and lessors. Additionally, the new standard requires extensive quantitative and qualitative disclosures. ASU 2016-02 is effective for U.S. GAAP public companies for fiscal years beginning after December 15, 2018, including interim periods within those fiscal years. Early application will be permitted for all entities. The new standard must be adopted using a modified retrospective transition of the new guidance and provides for certain practical expedients. Transition will require application of the new model at the beginning of the earliest comparative period presented. This ASU is not expected to have any impact on our financial statements as we do not have any lease arrangements.
In August 2016, the FASB issued ASU 2016-15, Statement of Cash Flows (Topic 230): Classification of Certain Cash Receipts and Cash Payments, a Consensus of the FASB’s Emerging Issues Task Force (“ASU 2016-15”). ASU 2016-15 provides guidance on how certain transactions are classified in the statement of cash flows. ASU 2016-15 is effective for annual and interim periods beginning after December 15, 2017. The guidance requires application using a retrospective transition method. We are currently evaluating the impact these changes will have on our financial statements and disclosures.
In October 2016, the SEC adopted new rules and amended rules (together, “Final Rules”) intended to modernize the reporting and disclosure of information by registered investment companies. In part, the Final Rules amend Regulation S-X and require
52
standardized, enhanced disclosure about derivatives in investment company financial statements, as well as other amendments. We adopted the Final Rules on August 1, 2017. The adoption did not have a material impact on our financial statements and disclosures.
In November 2016, the FASB issued ASU 2016-18, Statement of Cash Flows (Topic 230): Restricted Cash, a Consensus of the FASB’s Emerging Issues Task Force (“ASU 2016-18”). ASU 2016-18 requires that amounts generally described as restricted cash and restricted cash equivalents should be included with cash and cash equivalents when reconciling the beginning-of-period and end-of-period total amounts shown on the statement of cash flows. ASU 2016-18 does not provide a definition of restricted cash or restricted cash equivalents. ASU 2016-18 is effective for public business entities for annual and interim periods beginning after December 15, 2017. Early adoption is permitted, including adoption in an interim period, and should be applied using a retrospective transition method. We are currently evaluating the impact of this change will have on our financial statements and disclosures.
Item 7A. Quantitative and Qualitative Disclosures About Market Risk.
We may be subject to financial market risks, including changes in interest rates. To the extent that we borrow money to make investments, our net investment income will be dependent upon the difference between the rate at which we borrow funds and the rate at which we invest these funds. In periods of rising interest rates, our cost of funds would increase, which may reduce our net investment income. As a result, there can be no assurance that a significant change in market interest rates will not have a material adverse effect on our net investment income.
As of September 30, 2017, we had one investment with a principal balance of $3.4 million that provides for interest income indexed to London Interbank Offered Rate (“LIBOR”). A decrease or increase of 1% in LIBOR would decrease or increase, respectively, our annual interest income by $0.03 million.
We may hedge against interest rate and currency exchange rate fluctuations by using standard hedging instruments, such as futures, options and forward contracts, subject to the requirements of the 1940 Act. While hedging activities may insulate us against adverse changes in interest rates, they may also limit our ability to participate in benefits of lower interest rates with respect to our portfolio of investments with fixed interest rates. During the years ended September 30, 2017, 2016 and 2015, we did not engage in interest rate hedging activities.
In addition, we may have risks regarding portfolio valuation. See Item 7 “Management’s Discussion and Analysis of Financial Condition and Results of Operations — Critical Accounting Policies — Valuation of Investments.”
Item 8. Financial Statements and Supplementary Data.
Our financial statements are annexed to this Annual Report beginning on page F-1.
Item 9. Changes in and Disagreements with Accountants on Accounting and Financial Disclosure.
None.
Item 9A. Controls and Procedures.
Evaluation of Disclosure Controls and Procedures
As required by Rule 13a-15(b) under the Exchange Act, we carried out an evaluation, under the supervision and with the participation of our management, including our chief executive officer and chief financial officer, of the effectiveness of the design and operation of our disclosure controls and procedures as of September 30, 2017. Based on that evaluation, our chief executive officer and chief financial officer concluded that our disclosure controls and procedures were effective to provide reasonable assurance that we would meet our disclosure obligations.
Changes in Internal Control Over Financial Reporting
During the most recent fiscal quarter, there was no change in our internal controls over financial reporting, as defined under Rule 13a-15(f) under the Exchange Act, that has materially affected, or is reasonably likely to materially affect, our internal controls over financial reporting.
Item 9B. Other Information
None.
53
PART III
Item 10. Directors, Executive Officers and Corporate governance.
Set forth below is information concerning our directors and executive officers.
Board of Directors and Executive Officers
Our Board consists of five members, three of whom are not “interested persons” with respect to us or Terra Income Advisors as defined in Section 2(a)(19) of the 1940 Act. We refer to these individuals as our independent directors. Members of the Board will be elected annually at our annual meeting of stockholders. We are prohibited from making loans or extending credit, directly or indirectly, to our directors or executive officers under Section 402 of the Sarbanes‑Oxley Act.
Through its direct oversight role, and indirectly through its committees, the Board performs a risk oversight function for us consisting of, among other things, the following activities: (i) at regular and special Board meetings, and on an ad hoc basis, receiving and reviewing reports related to our performance and operations; (ii) reviewing and approving, as applicable, our compliance policies and procedures; (iii) meeting with the portfolio management team to review investment strategies, techniques and the processes used to manage related risks; (iv) meeting with, or reviewing reports prepared by, the representatives of key service providers, including our investment adviser, administrator, distributor, transfer agent, custodian and independent registered public accounting firm, to review and discuss our activities and to provide direction with respect thereto; (v) engaging the services of our chief compliance officer to test our compliance procedures and our service providers; and (vi) on a quarterly basis, approving the continuance of the Servicing Plan and the payments of service fees thereunder. Mr. Mildé, who is not an independent director, serves as Chairman of the Board. The Board feels that Mr. Mildé is the director with the most knowledge of our business strategy and is best situated to serve as Chairman of the Board. Our charter, as well as regulations governing BDCs generally, requires that a majority of the Board be independent directors. The Board does not currently have a lead independent director. The Board, after considering various factors, has concluded that this structure is appropriate given our current size and complexity.
Directors
Information regarding the Board is set forth below. We have divided the directors into two groups: interested directors and independent directors. The address for each director is c/o Terra Income Fund 6, Inc., 805 Third Avenue, 8th Floor, New York, NY 10022.
NAME | AGE | DIRECTOR SINCE | EXPIRATION OF TERM | |||
Interested Directors | ||||||
Simon J. Mildé | 72 | 2013 | 2019 | |||
Bruce D. Batkin | 65 | 2013 | 2020 | |||
Independent Directors | ||||||
Jeffrey M. Altman | 45 | 2016 | 2019 | |||
Michael L. Evans | 66 | 2015 | 2018 | |||
Robert E. Marks | 66 | 2015 | 2020 | |||
Interested Directors
Simon J. Mildé has served as Chairman of the Board and Chairman of the board of managers of Terra Income Advisors since May 2013. He has also served as the Chairman of each of Terra Capital Advisors, Terra Capital Advisors 2 and Terra Income Advisors 2, LLC (“Terra Income Advisors 2”), since April 2009, September 2012 and October 2016, respectively. Mr. Mildé co-founded Terra Capital Partners and has served as the Chairman of its board of directors since its formation in 2001 and its commencement of operations in 2002, and also serves as the Chairman of each of Terra Secured Income Fund (“TSIF”), Terra Secured Income Fund 2 (“TSIF 2”), Terra Secured Income Fund 3 (“TSIF 3”), Terra Secured Income Fund 4 (“TSIF 4”), TSIF 5, Terra Secured Income Fund 5 International (“Terra International”), Terra Income Fund International (“TIFI”), TSIF 7, TPT and TPT 2, since July 2009, May 2011, January 2012, September 2012, August 2013, June 2014, October 2016, October 2016, January 2016 and September 2016, respectively. He has over 40 years’ experience in global real estate finance, investment and management. Prior to founding Terra Capital Partners, Mr. Mildé was founder, CEO and Chairman of Jones Lang Wootton North America (formerly Jones Lang LaSalle Incorporated and now JLL), the second‑largest commercial real estate broker in the world, from 1977 to 1994. He was also one of the founders of JLW Realty Advisors, which has grown into a $50 billion global real estate investment management business. Today, its successor company ranks as one of the largest real estate investment managers in the world. Mr. Mildé has also served as the Chairman and CEO of The Greenwich Group International, a global real estate investment banking firm, and Capital District Properties, a commercial real estate development and investment company since 1995 and 2004, respectively. He was a former member of the Royal Institution of Chartered Surveyors and was a former Governor of the Real
54
Estate Board of New York and former member of the Advisory Board of the Real Estate Institute of New York University. Mr. Mildé attended Regent Street Tech College in London, England and the Royal Institution of Chartered Surveyors in England.
Bruce D. Batkin has served as one of our directors and our Chief Executive Officer, as well as the Chief Executive Officer of Terra Income Advisors, since May 2013. He has also has served as Chief Executive Officer of each of Terra Capital Advisors, Terra Capital Advisors 2 and Terra Income Advisors 2 since April 2009, September 2012 and October 2016, respectively. Mr. Batkin also has served as President of TSIF since July 2009 and as Chief Executive Officer of TSIF 2, TSIF 3, TSIF 4, TSIF 5, Terra International, TIFI, TSIF 7, TPT and TPT 2 since May 2011, January 2012, September 2012, August 2013, June 2014, October 2016, October 2016, January 2016 and September 2016, respectively. As a co‑founder of Terra Capital Partners, he has served as its President and Chief Executive Officer since its formation in 2001 and its commencement of operations in 2002, managing its real estate debt and equity investment programs. Mr. Batkin has over 35 years’ experience in real estate acquisition, finance, development, management and investment banking. Prior to founding Terra Capital Partners, he held senior management positions at Merrill Lynch & Co. Inc., Donaldson, Lufkin & Jenrette Securities Corporation (now Credit Suisse (USA) Inc.), ABN AMRO Bank N.V. and several private real estate development partnerships. Mr. Batkin has acquired major commercial properties throughout the United States and has acted as managing partner in over $5 billion of real estate investments for domestic and foreign investors. He is a member of the Urban Land Institute, the Real Estate Academic Initiative at Harvard University, the Cornell Real Estate Council and the Committee for Economic Development. He is also a participant in the Yale CEO Summit. Mr. Batkin received a B.Arch. from Cornell University and an M.B.A. from Harvard Business School.
Independent Directors
Jeffrey M. Altman has served as one of our independent directors since April 2016. Since July 2011, Mr. Altman has been the Managing Director of the real estate and lodging investment banking group of Houlihan Lokey, Inc., an investment bank. From December 1998 to May 2011, he served as Vice President and Director of Lazard Fréres & Co. LLC, where he led the firm’s global hospitality and leisure effort. Mr. Altman was an Associate in the Merger and Acquisition Advisory Group of Arthur Andersen LLP from June 1996 to June 1998, where he provided merger, acquisition and divestiture advisory services to clients across a broad array of industries. Mr. Altman has advised on over $100 billion of real estate transactions in his career and is a frequent speaker at real estate and lodging conferences. He is currently a member of the New York Hospitality Council, the National Association of Real Estate Investment Trusts, the International Council of Shopping Centers and the Samuel Zell and Robert Lurie Real Estate Center of the Wharton School of the University of Pennsylvania. Mr. Altman received a B.S., magna cum laude, with a concentration in accounting and finance, and an M.B.A., with a concentration in finance, from the John M. Olin School of Business at Washington University.
Michael L. Evans has served as one of our independent directors since March 2015. Since December 2012, Mr. Evans has been the Managing Director of Newport Board Group, a CEO and board advisory firm. From June 2010 to September 2011, Mr. Evans served as the Interim Country Manager and Advisory Board Member for Concern Worldwide U.S. Inc., a non‑profit humanitarian organization. From January 1977 until June 2010, Mr. Evans was with Ernst & Young, LLP, or Ernst & Young, and served as a partner since 1984. During his nearly 34 years with Ernst & Young, he served as a tax, audit and consulting services partner, specializing in real estate companies and publicly‑traded entities. Mr. Evans currently serves on the Advisory Board of Marcus & Millichap, Inc., the Independent Counsel Board of Prologis Targeted U.S. Logistics Fund and the board of directors of Newport Board Group, CyArk.org and InfinteSmile.org. Mr. Evans is a licensed attorney and a C.P.A. (inactive) in California. He is currently a contributing business writer for Forbes.com and Allbusiness.com. Mr. Evans received a B.S.B. in Accounting from the University of Minnesota, a J.D. from William Mitchell College of Law and an M.B.A. from Golden Gate University.
Robert E. Marks has served as one of our independent directors since March 2015. Since 1994, Mr. Marks has been the President of Marks Ventures, LLC, a private equity investment firm. From 1982 to 1994, he served in the capacities of both Managing Director and Vice President for Carl Marks & Co. Inc., where he was co‑head of the firm’s leveraged buyout investing activity. From 1978 to 1982, he was a corporate finance associate with Dillon, Read & Co. Inc., an investment banking firm. From 1974 to 1976, he worked for the Export‑Import Bank of the United States, performing research and analysis on the economic fundamentals underpinning particular loan proposals. Mr. Marks was Chairman of the Board of Directors of Denny’s Corporation (NASDAQ: DENN) from 2004 through 2006 and is currently a director, the Chair of the Audit and Finance Committee and a member of the Corporate Governance Committee. He is currently the Chair of the Audit Committee and a member of the Corporate Governance Committee of Trans World Entertainment Corporation (NASDAQ: TWMC). Until July 2014, he served as Chairman of the Compensation Committee and Nominating and Corporate Governance Committee for Emeritus Corporation (formerly NYSE: ESC). Mr. Marks also serves on the board of directors of two private companies, Harris Environmental Systems LLC and Pacific Tool Inc., and on the board of trustees for one charitable organization, the Greenwich, Connecticut Public Library. He served on the board of trustees of The International Rescue Committee until February 2015, and is currently an overseer. From 2005 to 2013 Mr. Marks was a member of the Board of Trustees of the Fisher House Foundation. Until January 2015, he also served on the board of trustees of one private club, The Field Club of Greenwich. From 2010 through 2015, Mr. Marks served on the Stanford University Alumni Committee on Trustee Nominations, which is responsible for selecting members to the university’s board of trustees. Mr. Marks received a B.A. and an M.A. in Economics, Phi Beta Kappa and with distinction and departmental
55
honors, from Stanford University in 1974 and an M.B.A. from Harvard Business School in 1978 with a concentration in Finance and General Management.
Executive Officers
The following persons serve as our executive officers in the following capacities:
NAME | AGE | POSITION(S) HELD | ||
Simon J. Mildé | 71 | Chairman of the Board | ||
Bruce D. Batkin | 64 | Chief Executive Officer | ||
Stephen H. Hamrick | 65 | President | ||
Gregory M. Pinkus | 53 | Chief Operating Officer, Chief Financial Officer, Treasurer and Secretary | ||
Daniel J. Cooperman | 43 | Chief Originations Officer | ||
Michael S. Cardello | 66 | Chief Compliance Officer | ||
The address for each executive officer is c/o Terra Income Fund 6, Inc., 805 Third Avenue, 8th Floor, New York, NY 10022.
Executive Officers Who are Directors
For information regarding the business experience of Messrs. Mildé and Batkin, see “- Interested Directors” above.
Executive Officers Who are Not Directors
Stephen H. Hamrick has served as our President since May 2013. He has also served as President of Terra Capital Advisors, Terra Capital Advisors 2 and Terra Income Advisors 2 since January 2011, September 2012 and October 2016, respectively. Mr. Hamrick has also served as President of TSIF 2, TSIF 3, TSIF 4, TSIF 5, Terra International, TIFI, TSIF 7, TPT and TPT 2 since May 2011, January 2012, September 2012, August 2013, June 2014, October 2016, October 2016, January 2016 and September 2016, respectively. Mr. Hamrick has over 35 years’ experience in the investment management business. Prior to joining Terra Capital Partners in January 2011, he served as President of Lightstone Value Plus REIT from 2006 to July 2010. From 2001 to 2006, he held various positions at W.P. Carey & Co., including Chairman of Carey Financial, LLC and Managing Director. From 1988 until 1994, Mr. Hamrick served as National Director of Private Investments for UBS PaineWebber, where he was also a member of that firm’s Management Council, and from 1975 until 1988, he held positions ranging from Account Executive to National Director of Private Placements at E.F. Hutton. In those roles, he was responsible for the creation and distribution of alternative investment funds comprising assets in excess of $15 billion. Mr. Hamrick also had management and offering experience with some of the earliest BDCs, public or private. In 1988, he became the first chairman of Mezzanine Capital Corporation, which served as the General Partner of Fiduciary Capital Partners, L.P. and Fiduciary Capital Pension Partners, L.P., or the Fiduciary Funds, funds that invested primarily in subordinated debt and related equity securities issued as the “mezzanine financing” for friendly leveraged buyouts, acquisitions and recapitalizations and, as the Administrative General Partner for Kagan Media Partners, L.P., a BDC that acquired subordinated debt instruments with equity participations in cable television systems and other media properties. Mr. Hamrick served as chairman of Mezzanine Capital Corporation, as a member of the Fiduciary Funds’ investment committee and as chairman of the General Partner of the Fiduciary Funds’ manager until 1994. Mr. Hamrick has been a Certified Financial Planner, a director of mutual fund families, a member of the NYSE MKT Listings Qualifications Panel and the Listings Panel for NASDAQ as well as Chairman of the Securities Industry Association’s Direct Investment Committee and of the Investment Program Association. Mr. Hamrick holds a B.S. in Economics and an A.B. in English from Duke University.
Gregory M. Pinkus has served as our Chief Financial Officer, Treasurer and Secretary since May 2013 and our Chief Operating Officer since July 2014. He has also served as Chief Financial Officer and Chief Operating Officer of Terra Income Advisors since February 2015 and July 2014, respectively. Mr. Pinkus has served as (i) the Chief Financial Officer of Terra Capital Advisors, Terra Capital Advisors 2 and Terra Income Advisors 2 since May 2012, September 2012 and October 2016, respectively; (ii) the Chief Operating Officer of each of Terra Capital Advisors, Terra Capital Advisors 2 and Terra Capital Partners since July 2014; (iii) the Chief Operating Officer of Terra Income Advisors 2 since October 2016; (iv) the Chief Financial Officer, and Secretary and Treasurer, of each of TSIF, TSIF 2, TSIF 3, TSIF 4 and TSIF 5 since May 2012 and July 2014, respectively; and (v) the Chief Financial Officer and Chief Operating Officer of Terra International, TIFI, TSIF 7, TPT and TPT 2 since June 2014, October 2016, October 2016, January 2016 and September 2016, respectively. Prior to joining Terra Capital Partners in May 2012, he served as Assistant Controller for W.P. Carey & Co. from 2006 to August 2010 and as Controller from August 2010 to May 2012. Mr. Pinkus also served as Controller and Vice President of Finance for several early‑stage technology companies during the period of 1999 to 2005. Additionally, he managed large‑scale information technology budgets at New York Life Insurance Company from 2003 to 2004 and oversaw an international reporting group at Bank of America from 1992 to 1996. Mr. Pinkus is a Certified Public Accountant and member of the American Institute of Certified Public Accountants. He holds a B.S. in Accounting from the Leonard N. Stern School of Business at New York University.
56
Daniel J. Cooperman has served as our Chief Originations Officer since February 2015, having previously served as our Managing Director of Originations from May 2013 until February 2015. He has also served as Chief Originations Officer of Terra Income Advisors since February 2015. Mr. Cooperman has served as Chief Originations Officer of (i) each of Terra Capital Advisors and Terra Capital Advisors 2 since January 2015, having previously served as Managing Director of Originations until January 2015 of Terra Capital Advisors and Terra Capital Advisors 2 since April 2009 and September 2012, respectively; (ii) each of TSIF 2, TSIF 3, TSIF 4, TSIF 5 and Terra International since January 2015, having previously served as Managing Director of Originations until January 2015 of TSIF, TSIF 2, TSIF 3, TSIF 4, TSIF 5 and Terra International since July 2009, May 2011, January 2012, September 2012, August 2013 and June 2014, respectively; (iii) TPT since January 2016; (iv) TPT2 since September 2016; and (v) each of Terra Income Advisors 2, TIFI, TSIF 7 since October 2016. Mr. Cooperman has 18 years’ experience in the acquisition, financing, leasing and asset management of commercial real estate with an aggregate value of over $5 billion. Prior to the formation of Terra Capital Partners in 2001 and its commencement of operations in 2002, Mr. Cooperman handled mortgage and mezzanine placement activities for The Greenwich Group International, LLC. Prior to joining The Greenwich Group, Mr. Cooperman worked in Chase Manhattan Bank’s Global Properties Group, where he was responsible for financial analysis and due diligence for the bank’s strategic real estate acquisitions and divestitures. Prior to that time, he was responsible for acquisitions and asset management for JGS, a Japanese conglomerate with global real estate holdings. Mr. Cooperman holds a B.S. in Finance from the University of Colorado at Boulder.
Michael S. Cardello has served as our Chief Compliance Officer since May 2013 and as the Chief Compliance Officer of Terra Income Advisors since February 2015. He also has served as the Chief Compliance Officer of Terra Capital Markets and Terra Income Advisors 2 since March 2011 and October 2016, respectively. He has also served as our Financial & Operations Principal of Terra Capital Markets since July 2011. Prior to joining Terra Capital Markets in March 2011, he served as Chief Compliance Officer from November 2006 to September 2011 and as Chief Financial Officer from August 2004 to September 2011 for Lightstone Securities LLC. Prior to his tenure at Lightstone Securities LLC, Mr. Cardello also served as Chief Financial Officer and Secretary at Spencer Trask Ventures from June 2004 to November 2006. Additionally, he served as an Adjunct Professor of Accounting at Farmingdale State University’s College of Technology from September 2004 to June 2005 and Senior Compliance Examiner at National Association of Securities Dealers, Inc., for New York District 12 (now FINRA District 10) from November 1989 to December 1990. Mr. Cardello holds a B.A. in History and an M.B.A. in Public Accounting and Taxation from the St. John’s University.
The officers of our company may also include one or more vice presidents and other officers in accordance with our bylaws. In addition, the Board may, from time to time, elect such other officers with such powers and duties as it shall deem necessary or desirable.
Section 16(a) Beneficial Ownership Reporting Compliance
Pursuant to Section 16(a) of the Exchange Act, our directors and executive officers, and any persons holding more than 10% of its common stock, are required to report their beneficial ownership and any changes therein to us and the SEC. Specific due dates for those reports have been established, and we are required to report herein any failure to file such reports by those due dates. Based solely on a review of the copies of such reports and written representations delivered to us by such persons, we believe that there were no violations of Section 16(a) by such persons during the year ended September 30, 2017.
Code of Ethics
We have adopted a Code of Business Conduct and Ethics (the “Code of Ethics”) pursuant to Rule 17j‑1 of the 1940 Act, which applies to, among others, our senior officers, including our Chief Executive Officer and our Chief Financial Officer, as well as every officer, director, employee and “access person” (as defined within the Code of Ethics) of the Company.
Audit Committee
We have established an audit committee of the Board (the “Audit Committee”) that operates pursuant to a charter and consists of three members. The audit committee is responsible for selecting, engaging and supervising our independent accountants, reviewing the plans, scope and results of the audit engagement with our independent accountants, approving professional services provided by our independent accountants (including compensation therefor), reviewing the independence of our independent accountants and reviewing the adequacy of our internal controls over financial reporting. The members of the audit committee are Messrs. Altman, Evans and Marks, each of whom is independent. Mr. Evans serves as the chairman of the audit committee. The Board has determined that Mr. Evans is an “audit committee financial expert” as defined under Item 407 of Regulation S-K promulgated under the Exchange Act. Mr. Evans meets the current independence and experience requirements of Rule 10A-3 of the Exchange Act.
57
Item 11. Executive Compensation.
Compensation Committee Interlocks and Insider Participation
We currently do not have a compensation committee of the Board because we do not pay any compensation to our officers. Our independent directors participate in the consideration of independent director compensation. There are no interlocks or insider participation as to compensation decisions required to be disclosed pursuant to SEC regulations.
Compensation of Directors
Our directors who do not also serve in an executive officer capacity for us or Terra Income Advisors are entitled to receive annual cash retainer fees, fees for attending board and committee meetings and annual fees for serving as a committee chairperson. These director nominees are Messrs. Altman, Evans and Marks. The above directors will receive an annual fee of $20,000, plus $2,500 for each board meeting attended in person, $1,000 for each board meeting attended via teleconference and $1,000 for each committee meeting attended. In addition, the chairman of the Audit Committee will receive an annual fee of $7,500 and the chairman of each of the Nominating and Corporate Governance Committee and the Valuation Committee, and any other committee, will receive an annual fee of $2,500 for their additional services. We will also reimburse each of the above directors for all reasonable and authorized business expenses in accordance with our policies as in effect from time to time, including reimbursement of reasonable out‑of‑pocket expenses incurred in connection with attending each board meeting and each committee meeting not held concurrently with a board meeting. We do not pay compensation to our directors who also serve in an executive officer capacity for us or Terra Income Advisors.
The following table sets forth compensation of our directors for the year ended September 30, 2017:
Name | Fees Earned or Paid in Cash | All Other Compensation | Total | |||||||||
Interested Directors | ||||||||||||
Simon J. Mildé | $ | — | $ | — | $ | — | ||||||
Bruce D. Batkin | $ | — | $ | — | $ | — | ||||||
Independent Directors | ||||||||||||
Jeffrey M. Altman | $ | 36,500 | $ | — | $ | 36,500 | ||||||
Michael L. Evans | $ | 40,000 | $ | — | $ | 40,000 | ||||||
Robert E. Marks | $ | 36,500 | $ | — | $ | 36,500 | ||||||
Compensation of Executive Officers
Our executive officers do not receive any direct compensation from us. We do not currently have any employees and do not expect to have any employees. Services necessary for our business are provided by individuals who are employees of Terra Income Advisors or by individuals who were contracted by us or by Terra Income Advisors to work on behalf of us pursuant to the terms of the Investment Advisory Agreement. Each of our executive officers is an employee of Terra Income Advisors, or one of its affiliates or an outside contractor, and the day-to-day investment operations and administration of our portfolio are managed by Terra Income Advisors. In addition, we reimburse Terra Income Advisors for our allocable portion of expenses incurred by Terra Income Advisors in performing its obligations under the Investment Advisory Agreement, including the allocable portion of the cost of our officers and their respective staffs determined under the Investment Advisory Agreement.
The Investment Advisory Agreement provides that Terra Income Advisors and its officers, managers, controlling persons and any other person or entity affiliated with it acting as our agent will not be entitled to indemnification (including reasonable attorneys’ fees and amounts reasonably paid in settlement) for any liability or loss suffered by Terra Income Advisors or such other person, nor will Terra Income Advisors or such other person be held harmless for any loss or liability suffered by us, unless: (i) Terra Income Advisors or such other person has determined, in good faith, that the course of conduct which caused the loss or liability was in our best interests; (ii) Terra Income Advisors or such other person was acting on behalf of or performing services for us; (iii) the liability or loss suffered was not the result of negligence or misconduct by Terra Income Advisors or such other person acting as our agent; and (iv) the indemnification or agreement to hold Terra Income Advisors or such other person harmless for any loss or liability is only recoverable out of our net assets and not from our stockholders.
58
Item 12. Security Ownership of Certain Beneficial Owners and Management and Related Stockholder Matters.
The following table sets forth, as of November 17, 2017, information with respect to the beneficial ownership of our common stock by:
• | any person known to us to beneficially own more than 5% of the outstanding shares of our common stock; |
• | each member of the Board and each executive officer; and |
• | all of the members of the Board and executive officers as a group. |
Beneficial ownership is determined in accordance with the rules of the SEC and includes voting or investment power with respect to the securities. There are no shares of our common stock subject to options that are currently exercisable or exercisable within 60 days of November 17, 2017. Ownership information for those persons who beneficially own 5% or more of our shares of common stock is based upon reports filed by such persons with the SEC and other information obtained from such persons, if available. Unless otherwise indicated, we believe that each beneficial owner set forth in the table below has sole voting and investment power. Our directors are divided into two groups: interested directors and independent directors. Interested directors are “interested persons” of the Company as defined in Section 2(a)(19) of the 1940 Act.
Shares Beneficially Owned as of November 20, 2017 | ||||||
Name(1) | Number of Shares | Percentage(2) | ||||
Interested Directors | ||||||
Simon J. Mildé | 12,308 | * | ||||
Bruce D. Batkin | 24,980 | * | ||||
Independent Directors | ||||||
Jeffrey M. Altman | — | — | ||||
Michael L. Evans | — | — | ||||
Robert E. Marks | — | — | ||||
Executive Officers | ||||||
Stephen H. Hamrick | — | — | ||||
Gregory M. Pinkus | — | — | ||||
Daniel J. Cooperman | 2,712 | * | ||||
Michael S. Cardello | — | — | ||||
All officers and directors as a group (9 persons) | 40,000 | * | ||||
* Less than one percent.
(1) | Unless otherwise indicated, the address of each beneficial owner is c/o Terra Capital Partners, LLC, 805 Third Avenue, 8th Floor, New York, New York 10022. |
(2) | Based on a total of 7,936,167 shares of common stock issued and outstanding as of November 20, 2017. |
Item 13. Certain Relationships and Related Transactions, and Director Independence.
We have procedures in place for the review, approval and monitoring of transactions involving the Company and certain persons related to us. For example, our Code of Ethics generally prohibits any employee, officer or director from engaging in any transaction where there is a conflict between such individual’s personal interest and the interests of the Company, and requires that those parties submit quarterly transactions reports and annual holdings reports to our Chief Compliance Officer. Our Chief Compliance Officer is required to review and approve all related-party transactions (as defined in Item 404 of Regulation S-K promulgated under the Exchange Act). Any amendment or waiver of the Code of Ethics for any executive officer or director must be approved by the Board and publicly disclosed as required by applicable law and regulations.
Compensation of Terra Income Advisors and Terra Capital Markets
Pursuant to the Investment Advisory Agreement, we pay Terra Income Advisors a base management fee and an incentive fee. We commenced accruing fees under the Investment Advisory Agreement on June 24, 2015, upon commencement of our operations.
The base management fee is calculated at an annual rate of 2% of our average gross assets. The base management fee is payable quarterly in arrears and is calculated based on the average value of our gross assets at the end of the two most recently completed calendar quarters. The base management fee may or may not be taken in whole or in part at the discretion of Terra
59
Income Advisors. All or any part of the base management fee not taken as to any quarter will be deferred without interest and may be taken in such other quarter as Terra Income Advisors shall determine. The base management fee for any partial month or quarter will be prorated for such partial period.
The incentive fee consists of two parts. The first part, which we refer to as the subordinated incentive fee on income, is calculated and payable quarterly in arrears based upon our “pre-incentive fee net investment income” for the immediately preceding quarter. The subordinated incentive fee on income is subject to a quarterly hurdle rate, expressed as a rate of return on adjusted capital at the beginning of the most recently completed calendar quarter, of 2% (8% annualized), subject to a “catch-up” feature. For this purpose, “pre-incentive fee net investment income” means interest income, dividend income and any other income (including any other fees, other than fees for providing managerial assistance, such as commitment, origination, structuring, diligence and consulting fees or other fees that we receive from portfolio companies) accrued during the calendar quarter, minus our operating expenses for the quarter (including the base management fee, expenses reimbursed to Terra Income Advisors under the Investment Advisory Agreement and any interest expense and dividends paid on any issued and outstanding preferred stock, but excluding the incentive fee). Pre-incentive fee net investment income includes, in the case of investments with a deferred interest feature (such as original issue discount, debt instruments with payment-in-kind interest and zero coupon securities), accrued income that we have not yet received in cash. Pre-incentive fee net investment income does not include any realized capital gains, realized capital losses or unrealized capital appreciation or depreciation. The calculation of the subordinated incentive fee on income for each quarter is as follows:
• | No incentive fee is payable to Terra Income Advisors in any calendar quarter in which our pre-incentive fee net investment income does not exceed the hurdle rate of 2% (8% annualized); |
• | 100% of our pre-incentive fee net investment income, if any, that exceeds the hurdle rate but is less than or equal to 2.5% in any calendar quarter (10% annualized) is payable to Terra Income Advisors, all or any portion of which may be waived or deferred in Terra Income Advisors’ discretion. We refer to this portion of our pre-incentive fee net investment income (which exceeds the hurdle rate but is less than or equal to 2.5%) as the “catch-up.” The catch-up provision is intended to provide Terra Income Advisors with an incentive fee of 20% on all of our pre-incentive fee net investment income when our pre-incentive fee net investment income reaches 2.5% in any calendar quarter; and |
• | 20% of the amount of our pre-incentive fee net investment income, if any, that exceeds 2.5% in any calendar quarter (10% annualized) is payable to Terra Income Advisors once the hurdle rate is reached and the catch-up is achieved. |
The second part of the incentive fee, which we refer to as the incentive fee on capital gains, is an incentive fee on capital gains earned on liquidated investments from the portfolio and is determined and payable in arrears as of the end of each calendar year (or upon termination of the Investment Advisory Agreement). This fee equals 20% of our incentive fee on capital gains, which equals our realized capital gains on a cumulative basis from inception, calculated as of the end of the applicable period, computed net of all realized capital losses and unrealized capital depreciation on a cumulative basis, less the aggregate amount of any previously paid capital gains incentive fees. On a quarterly basis, we accrue (but do not pay) for the capital gains incentive fee by calculating such fee as if it were due and payable as of the end of such period.
We reimburse Terra Income Advisors for expenses necessary to perform services related to our administration and operation. The amount of this reimbursement is set at the lesser of (i) Terra Income Advisors’ actual costs incurred in providing such services and (ii) the amount that the Board, including a majority of our independent directors, estimates we would be required to pay alternative service providers for comparable services in the same geographic location. Terra Income Advisors is required to allocate the cost of such services to us based on objective factors such as total assets, revenues, time allocations or other reasonable metrics. The Board then assesses the reasonableness of such reimbursements based on the breadth, depth and quality of such services as compared to the estimated cost to us of obtaining similar services from third-party providers known to be available. In addition, the Board considers whether any single third-party service provider would be capable of providing all such services at comparable cost and quality. Finally, the Board compares the total amount paid to Terra Income Advisors for such services as a percentage of our net assets to the same ratio as reported by other comparable BDCs. We do not reimburse Terra Income Advisors for any services for which it receives a separate fee, or for rent, depreciation, utilities, capital equipment or other administrative items allocated to a controlling person of Terra Income Advisors.
Terra Income Advisors has funded our offering costs and organization costs. Organization expenses are expensed on our statements of operations. All offering costs incurred during the offering period are recorded as deferred charge and amortized over twelve months from the date the cost is incurred, with the exception of those costs that were incurred prior to the commencement of operations on June 24, 2015, which are being amortized over a 12-month period from that date forward. Terra Income Advisors is responsible for the payment of our cumulative organization and offering expenses to the extent such expenses exceed 1.5% of the gross proceeds from the Offering, without recourse against or reimbursement by us. As a result, Terra Income Advisors will bear all organization and offering expenses in excess of 1.5% of the gross proceeds from the Offering. Subsequent to March 31, 2017 and in response to the general trend in capital raising for non-traded direct participation programs, we determined that it is highly unlikely that we will raise capital in an amount sufficient for all cumulative offering costs incurred by Terra Income Advisors
60
to be reimbursed. Accordingly, we reduced the estimated amount payable to Terra Income Advisors for cumulative organization and offering costs incurred by $1.4 million for the three months ended June 30, 2017. As of September 30, 2017 and 2016, Terra Income Advisors funded offering costs and organization costs in the amount of $3.2 million and $2.4 million, respectively. As of September 30, 2017, we expect to reimburse Terra Income Advisors $1.4 million of the cumulative offering costs and organizations incurred. The unreimbursed amount in excess of the 1.5% threshold was $0.1 million and $1.6 million as of September 30, 2017 and 2016, respectively, and is included in Due to Adviser, net on the statements of assets and liabilities. For the years ended September 30, 2017, 2016 and 2015, we made reimbursement payments of $1.0 million, $0.1 million and $0.2 million to Terra Income Advisors for offering costs incurred on our behalf, respectively.
Under the Dealer Manager Agreement, Terra Capital Markets is entitled to receive selling commissions, broker-dealer fees and dealer manager fees in connection with the sale of shares of common stock in the Offering, all or a portion of which may be re-allowed to selected broker-dealers. On April 27, 2016, we adopted the Amended Dealer Manager Agreement to change the terms of the underwriting compensation. On September 30, 2017, we adopted the Servicing Plan and the Second Amended Dealer Manager Agreement to revised the terms of the servicing fee (which was previously referred to as a transaction charge). For the years ended September 30, 2017, 2016 and 2015, we incurred $3.3 million, $3.6 million and $1.0 million of broker-dealer commissions and fees, respectively, and, of this amount, $2.3 million, $2.5 million and $0.7 million were re-allowed to selected broker-dealers, respectively.
Pursuant to the Expense Support Agreement, Terra Income Advisors has agreed to reimburse us for certain operating expenses for any period since inception, until we and Terra Income Advisors mutually agree otherwise. This payment for any month shall be paid by Terra Income Advisors to us in any combination of cash or other immediately available funds, and/or offsets against amounts due from us to Terra Income Advisors. Reimbursement shall be made as promptly as possible on a date mutually agreed to by us and Terra Income Advisors provided that (i) the operating expense ratio, defined as Net Operating Expenses expressed as a percentage of our net assets on the relevant measurement date, as of such reimbursement date is equal to or less than the operating expense ratio as of the Expense Support Payment date attributable to such specified Expense Support Payment, (ii) the annualized distribution rate as of such reimbursement date is equal to or greater than the annualized distribution rate as of the Expense Support Payment date attributable to such specified Expense Support Payment; (iii) such reimbursement date is not later than three years following such specified Expense Support Payment date; and (iv) the Expense Support Payment does not cause our Net Operating Expenses to exceed 1.5% of our net assets attributable to common shares, after taking such reimbursement into account. Terra Income Advisors is entitled to reimbursement of all previously unreimbursed Expense Support Payments in the event of termination of the Expense Support Agreement. For the year ended September 30, 2017, we did not record any Expense Support Payment. For the years ended September 30, 2016 and 2015, we recorded Expense Support Payment of $0.6 million and $1.7 million, respectively, which are included in the statements of operations.
Potential Conflicts of Interest
Terra Income Advisors, our investment adviser, currently serves as the investment manager to the Terra Income Funds. While Terra Income Advisors intends to allocate investment opportunities in a fair and equitable manner consistent with our investment objectives and strategies, if necessary, so that we will not be disadvantaged in relation to any other client of Terra Income Advisors, it is possible that some investment opportunities may be provided to the Terra Income Funds rather than to us.
Distributions
Distributions to our stockholders are recorded as of the applicable record date. Subject to the discretion of the Board and applicable legal restrictions, we intend to authorize and declare ordinary cash distributions on either a monthly or quarterly basis and pay such distributions on a monthly basis. Net realized capital gains, if any, will be distributed or deemed distributed at least annually.
Capital Gains Incentive Fee
Pursuant to the terms of the Investment Advisory Agreement, the incentive fee on capital gains earned on liquidated investments of our portfolio is determined and payable in arrears as of the end of each calendar year (or upon termination of the Investment Advisory Agreement). Such fee equals 20% of our incentive fee on capital gains (i.e., its realized capital gains on a cumulative basis from inception, calculated as of the end of the applicable period, net of all realized capital losses and unrealized capital depreciation on a cumulative basis), less the aggregate amount of any previously paid capital gains incentive fees. Once any amount of this fee has been earned, on a quarterly basis, we accrue (but do not pay) for the capital gains incentive fee by calculating such fee as if it were due and payable as of the end of such period.
Exemptive Relief
The SEC has granted us exemptive relief from the provisions of Sections 17(d) and 57(a)(4) of the 1940 Act, thereby permitting us, subject to the satisfaction of certain conditions, to co-invest in certain privately negotiated investment transactions with our Co-Investment Affiliates. However, we will be prohibited from engaging in certain transactions with our affiliates even under the
61
terms of this exemptive order. We believe the relief granted to us under this exemptive order may not only enhance our ability to further our investment objectives and strategies, but may also increase favorable investment opportunities for us, in part by allowing us to participate in larger investments, together with our Co-Investment Affiliates, than would be available to us in the absence of such relief.
On April 19, 2016, the Board approved the Amended Dealer Manager Agreement. Under the terms of the Amended Dealer Manager Agreement, Terra Capital Markets receives selling commissions, dealer manager fees and broker-dealer fees of 3.0%, 1.5% and 1.0%, respectively, of gross proceeds from the Offering, all or a portion of which may be re-allowed to selected broker-dealers for marketing and expenses. In addition, Terra Capital Markets received a transaction charge at an annual rate of 1.125% of gross offering proceeds, excluding shares sold through the distribution reinvestment plan. The transaction charge was payable annually with respect to each share sold in the primary offering on the first, second, third and fourth anniversaries of the month of purchase.
On September 30, 2017, the Board approved the Servicing Plan and the Second Amended Dealer Manager Agreement, which revised the terms of the servicing fee (which was previously referred to as a transaction charge). Pursuant to the Servicing Plan, Terra Capital Markets receives a servicing fee at an annual rate of 1.125% of the most recently published net asset value per share of our common stock, excluding shares sold through the DRIP, in exchange for providing certain administrative support services. With respect to each share sold, the servicing fee will be payable annually on the anniversary of the applicable month of purchase. Terra Capital Markets, in its discretion, may re-allow a portion of such servicing fee to participating dealers for performing certain administrative support services. In connection with the adoptions of the Second Amended Dealer Manager Agreement and the Servicing Plan, we reduced the previously recorded transaction charges and as of September 30, 2017, there was no transaction charge payable outstanding.
In connection with the approval of the Amended Dealer Manager Agreement, Terra Capital Markets reimbursed us an amount equal to the transaction charges expected to be paid on all outstanding shares of common stock as of April 27, 2016. Both Terra Capital Markets and Terra Income Advisors are subsidiaries of Terra Capital Partners, our sponsor. Therefore, the transaction charge reimbursement, the Amended Dealer Manager Agreement and the Second Amended Dealer Manager Agreement may be deemed a “joint enterprise or other joint arrangement” within the meaning of the 1940 Act and the rules promulgated thereunder. Accordingly, to eliminate any uncertainty, we applied for and were granted exemptive relief from the provisions of Section 57(a)(4) of the 1940 Act and Rule 17d-1 under the 1940 Act by the SEC, pursuant to an exemptive order permitting Terra Capital Markets, subject to the satisfaction of certain conditions, to effect the transaction charge reimbursement. We believe the transaction charge reimbursement, the changes to the selling commissions, dealer manager fees, and broker-dealer fees, and implementation of the transaction charge, is likely to lead to greater demand for our common stock in the Offering, which we believe will further benefit our investors by facilitating a lower operating expense ratio and greater diversification of its investment portfolio.
Director Independence
In accordance with our charter, the Board consists of a majority of independent directors. We do not consider a director independent unless the Board has determined that he or she has no material relationship with us and is therefore not an “interested person,” as defined by Section 2(a)(19) of the 1940 Act. We monitor the relationships of our directors and officers through the activities of the nominating and corporate governance committee of the Board (the “Nominating Committee”) and through a questionnaire each director completes no less frequently than annually and updates periodically as information provided in the most recent questionnaire changes. The Board limits membership on the Audit Committee and the Nominating Committee to independent directors, and requires that the valuation committee of the Board have at least two independent directors as members.
The Board has determined that each of the directors and the director nominees are independent and has no material relationship with the Company, except as a director and stockholder of the Company, with the exception of Bruce D. Batkin and Simon J. Mildé. Messrs. Batkin and Mildé are interested persons of the Company due to their positions as Chief Executive Officer and Chairman, respectively, of the Company and of Terra Income Advisors.
Item 14. Principal Accountant Fees and Services.
During the year ended September 30, 2017, KPMG LLP (“KPMG”) served as our independent auditor and provided certain tax and other services. KPMG has served as our independent auditor since August 18, 2016. The Audit Committee currently anticipates that it will engage KPMG as our independent auditor to audit our financial statements for the year ending September 30, 2018, subject to agreeing on fee estimates for the audit work. The Audit Committee reserves the right, however, to select a new auditor at any time in the future in its discretion if it deems such decision to be in the best interests of us and our stockholders. Any such decision would be disclosed to the stockholders in accordance with applicable securities laws.
62
Audit Fees
The following table displays fees for professional services by the Company’s predecessor auditor for the period from October 1, 2015 through August 18, 2016 and fiscal year ended September 30, 2017:
Period from October 1, 2015 through August 18, 2016 | Fiscal Year Ended September 30, 2017 | |||||||
Audit Fees | $ | 157,630 | $ | — | ||||
Audit-Related Fees | — | — | ||||||
Tax Fees | — | — | ||||||
All Other Fees (1) | — | 47,500 | ||||||
Total | $ | 157,630 | $ | 47,500 | ||||
(1) | Amount for the fiscal year ended September 30, 2017 represents fee paid to the predecessor auditor associated with communication with successor auditor. |
The following table displays fees for professional services by KPMG for the period from August 18, 2016 through September 30, 2016 and the fiscal year ended September 30, 2017:
Period from August 18, 2016 through September 30, 2016 | Fiscal Year Ended September 30, 2017 | |||||||
Audit Fees | $ | 122,500 | $ | 285,716 | ||||
Audit-Related Fees | — | — | ||||||
Tax Fees | 18,000 | 13,000 | ||||||
All Other Fees | — | — | ||||||
Total | $ | 140,500 | $ | 298,716 | ||||
Audit Fees. Audit fees include fees for services that normally would be provided by KPMG in connection with statutory and regulatory filings or engagements and that generally only an independent accountant can provide. In addition to fees for the audit of our annual financial statements and the review of our quarterly financial statements in accordance with generally accepted auditing standard, this category contains fees for comfort letters, statutory audits, consents, and assistance with and review of documents filed with the SEC.
Audit-Related Fees. Audit-related services consist of fees billed for assurance and related services that are reasonably related to the performance of the audit or review of our financial statements and are not reported under “Audit Fees.” These services include attest services that are not required by statute or regulation and consultations concerning financial accounting and reporting standards.
Tax Services Fees. Tax services fees consist of fees billed for professional tax services. These services also include assistance regarding federal, state, and local tax compliance.
All Other Fees. Other fees would include fees for products and services other than the services reported above.
Pre-Approval Policies
We have established a pre-approval policy that describes the permitted audit, audit-related, tax and other services to be provided by our independent auditor. Pursuant to this policy, the Audit Committee will pre-approve the audit and non-audit services performed by our independent auditor in order to assure that the provision of such services does not impair the auditor’s independence. Any requests for audit, audit-related, tax and other services that have not received general pre-approval must be submitted to the Audit Committee for specific pre-approval in accordance with the pre-approval policy, irrespective of the amount of fees associated with such services, and cannot commence until such approval has been granted. Normally, pre-approval is provided at the regularly scheduled meetings of the Audit Committee. However, the Audit Committee may delegate pre-approval authority to one or more of its members. The member or members to whom such authority is delegated must report any pre-approval decisions to the Audit Committee at its next scheduled meeting. The Audit Committee does not delegate its responsibilities to pre-approve services performed by our independent auditor to management. All services rendered by KPMG the fiscal year ended September 30, 2017 were pre-approved in accordance with the policies set forth above.
63
PART IV
Item 15. Exhibits and Financial Statement Schedules.
The following exhibits are included, or incorporated by reference, in this Annual Report on Form 10-K for the year ended September 30, 2017 (and are numbered in accordance with Item 601 of Regulation S-K).
a. Financial Statements
See the Index to Financial Statements at page F-1 of this report.
64
Index to Financial Statements
Page | ||
Financial Statements: | ||
F-1
Report of Independent Registered Public Accounting Firm
The Board of Directors
Terra Income Fund 6, Inc.:
We have audited the accompanying statements of assets and liabilities, including the schedules of investments, of Terra Income Fund 6, Inc. (the Company) as of September 30, 2017 and 2016, and the related statements of operations, changes in net assets, and cash flows for each of the years in the three-year period ended September 30, 2017. These financial statements are the responsibility of the Company’s management. Our responsibility is to express an opinion on these financial statements based on our audits.
We conducted our audits in accordance with the standards of the Public Company Accounting Oversight Board (United States). Those standards require that we plan and perform the audit to obtain reasonable assurance about whether the financial statements are free of material misstatement. An audit includes examining, on a test basis, evidence supporting the amounts and disclosures in the financial statements. Our procedures included confirmation of securities owned as of September 30, 2017 and 2016, by correspondence with the custodian, portfolio companies or agents. An audit also includes assessing the accounting principles used and significant estimates made by management, as well as evaluating the overall financial statement presentation. We believe that our audits provide a reasonable basis for our opinion.
In our opinion, the financial statements referred to above present fairly, in all material respects, the financial position of Terra Income Fund 6, Inc. as of September 30, 2017 and 2016, and the results of its operations, changes in net assets and its cash flows for each of the years in the three-year period ended September 30, 2017, in conformity with U.S. generally accepted accounting principles.
/s/ KPMG LLP
New York, New York
November 20, 2017
F-2
Terra Income Fund 6, Inc.
Statements of Assets and Liabilities
September 30, | ||||||||
2017 | 2016 | |||||||
Assets | ||||||||
Investments, at fair value — non-controlled (amortized cost of $23,297,788 and $26,554,524, respectively) | $ | 23,675,007 | $ | 26,723,922 | ||||
Investment through participation interest, at fair value — non-controlled (amortized cost of $21,889,469 and $2,000,000, respectively) (Note 4) | 22,121,382 | 2,022,814 | ||||||
Total investments | 45,796,389 | 28,746,736 | ||||||
Cash and cash equivalents | 32,176,500 | 31,634,296 | ||||||
Cash, restricted | 1,547,407 | 836,434 | ||||||
Deferred offering costs | — | 361,482 | ||||||
Interest receivable | 438,001 | 278,424 | ||||||
Prepaid expenses and other assets | 108,976 | 274,851 | ||||||
Total assets | 80,067,273 | 62,132,223 | ||||||
Liabilities | ||||||||
Obligations under participation agreements, at fair value (proceeds of $1,800,000 and $14,508,034, respectively) (Note 4) | 1,820,502 | 14,560,606 | ||||||
Transaction charge payable (Note 4) | — | 2,191,734 | ||||||
Due to Adviser, net | 707,927 | 1,498,808 | ||||||
Interest reserve and other deposits held on investments | 1,547,407 | 836,434 | ||||||
Accrued expenses | 245,948 | 218,360 | ||||||
Interest payable from obligations under participation agreements | 16,250 | 144,575 | ||||||
Directors’ fees payable | 5,625 | 5,625 | ||||||
Payable for unsettled stock subscriptions (Note 8) | 226,642 | — | ||||||
Other liabilities | 162,679 | 201,333 | ||||||
Total liabilities | 4,732,980 | 19,657,475 | ||||||
Net assets | $ | 75,334,293 | $ | 42,474,748 | ||||
Commitments and contingencies (See Note 5) | ||||||||
Components of net assets: | ||||||||
Common stock, $0.001 par value, 450,000,000 shares authorized, and 7,530,130 and 4,222,358 shares issued and outstanding, respectively | $ | 7,530 | $ | 4,222 | ||||
Capital in excess of par | 75,147,338 | 42,537,764 | ||||||
Accumulated (over-distributed) net investment income | (404,902 | ) | (206,878 | ) | ||||
Net change in unrealized appreciation on investments | 609,132 | 192,212 | ||||||
Net change in unrealized appreciation on obligations under participation agreements | (24,805 | ) | (52,572 | ) | ||||
Net assets | $ | 75,334,293 | $ | 42,474,748 | ||||
Net asset value per share | $ | 10.00 | $ | 10.06 | ||||
See notes to financial statements.
F-3
Terra Income Fund 6, Inc.
Statements of Operations
Years Ended September 30, | ||||||||||||
2017 | 2016 | 2015 | ||||||||||
Investment income | ||||||||||||
Interest income | $ | 4,916,169 | $ | 3,003,645 | $ | 65,341 | ||||||
Prepayment fee income | 63,960 | — | — | |||||||||
Other fee income | 277,596 | 13,054 | 1,481 | |||||||||
Total investment income | 5,257,725 | 3,016,699 | 66,822 | |||||||||
Operating expenses | ||||||||||||
Base management fees | 1,202,568 | 552,011 | 30,058 | |||||||||
Incentive fees on capital gains (1) | 90,459 | 27,928 | — | |||||||||
Operating expense reimbursement to Adviser (Note 4) | 530,619 | 318,550 | 17,753 | |||||||||
Professional fees | 1,071,089 | 981,038 | 378,192 | |||||||||
Interest expense from obligations under participation agreements | 838,860 | 1,598,976 | — | |||||||||
Marketing expenses | 777,058 | 876,877 | 596,865 | |||||||||
Amortization of deferred offering costs | 375,748 | 1,312,811 | 383,182 | |||||||||
Insurance expense | 213,870 | 219,715 | 127,630 | |||||||||
General and administrative expenses | 114,491 | 38,223 | 12,534 | |||||||||
Directors’ fees | 113,000 | 123,125 | 74,250 | |||||||||
Interest expense on mortgage loan payable | 35,974 | — | — | |||||||||
Organization expenses | — | — | 130,464 | |||||||||
Total operating expenses | 5,363,736 | 6,049,254 | 1,750,928 | |||||||||
Less: Expense reimbursement from Adviser | — | (576,755 | ) | (1,690,300 | ) | |||||||
Less: Reduction of offering costs | (944,248 | ) | — | — | ||||||||
Net operating expenses | 4,419,488 | 5,472,499 | 60,628 | |||||||||
Net investment income (loss) | 838,237 | (2,455,800 | ) | 6,194 | ||||||||
Net change in unrealized appreciation on investments | 416,920 | 192,212 | — | |||||||||
Net change in unrealized appreciation on obligations under participation agreements | 27,767 | (52,572 | ) | — | ||||||||
Net increase (decrease) in net assets resulting from operations | $ | 1,282,924 | $ | (2,316,160 | ) | $ | 6,194 | |||||
Per common share data: | ||||||||||||
Net investment income (loss) per share | $ | 0.15 | $ | (0.99 | ) | $ | 0.01 | |||||
Net increase (decrease) in net assets resulting from operations per share | $ | 0.23 | $ | (0.93 | ) | $ | 0.01 | |||||
Weighted average common shares outstanding (2) | 5,691,428 | 2,478,624 | 462,038 | |||||||||
(1) | Incentive fees on capital gains are based on 20% of net unrealized capital gains of $444,687 and $139,640 for the years ended September 30, 2017 and 2016, respectively. No incentive fees on capital gains are actually payable by the Company with respect to unrealized gains unless and until those gains are realized. |
(2) | For the year ended September 30, 2015, the weighted average shares is based on shares outstanding from June 24, 2015 (date that the Minimum Offering Requirement was met) through September 30, 2015. |
See notes to financial statements.
F-4
Terra Income Fund 6, Inc.
Statements of Changes in Net Assets
Years Ended September 30, | ||||||||||||
2017 | 2016 | 2015 | ||||||||||
Operations | ||||||||||||
Net investment income (loss) | $ | 838,237 | $ | (2,455,800 | ) | $ | 6,194 | |||||
Net change in unrealized appreciation on investments | 416,920 | 192,212 | — | |||||||||
Net change in unrealized appreciation on obligations under participation agreements | 27,767 | (52,572 | ) | — | ||||||||
Net increase (decrease) in net assets resulting from operations | 1,282,924 | (2,316,160 | ) | 6,194 | ||||||||
Stockholder distributions | ||||||||||||
Distributions from return of capital | (4,631,433 | ) | (2,474,642 | ) | (125,140 | ) | ||||||
Distributions from net investment income | (467,761 | ) | — | — | ||||||||
Net decrease in net assets resulting from stockholder distributions | (5,099,194 | ) | (2,474,642 | ) | (125,140 | ) | ||||||
Capital share transactions | ||||||||||||
Issuance of common stock | 35,108,677 | 39,878,132 | 11,234,309 | |||||||||
Reinvestment of stockholder distributions | 1,696,283 | 910,904 | 33,601 | |||||||||
Selling commissions and dealer manager fees | (3,324,658 | ) | (3,647,210 | ) | (968,547 | ) | ||||||
Reduction of transaction charge payable (Note 4) | 3,195,513 | — | — | |||||||||
Offering costs | — | (37,348 | ) | (111,669 | ) | |||||||
Net increase in net assets resulting from capital share transactions | 36,675,815 | 37,104,478 | 10,187,694 | |||||||||
Net increase in net assets | 32,859,545 | 32,313,676 | 10,068,748 | |||||||||
Net assets, at beginning of year | 42,474,748 | 10,161,072 | 92,324 | |||||||||
Net assets, at end of year | $ | 75,334,293 | $ | 42,474,748 | $ | 10,161,072 | ||||||
Accumulated (over-distributed) net investment income | $ | (404,902 | ) | $ | (206,878 | ) | $ | (26,482 | ) | |||
Capital share activity | ||||||||||||
Shares outstanding, at beginning of year | 4,222,358 | 926,357 | 11,111 | |||||||||
Shares issued from subscriptions | 3,148,661 | 3,219,293 | 912,416 | |||||||||
Shares issued from reinvestment of stockholder distributions | 159,111 | 76,708 | 2,830 | |||||||||
Shares outstanding, at end of year | 7,530,130 | 4,222,358 | 926,357 | |||||||||
See notes to financial statements.
F-5
Terra Income Fund 6, Inc.
Statements of Cash Flows
Years Ended September 30, | ||||||||||||
2017 | 2016 | 2015 | ||||||||||
Cash flows from operating activities: | ||||||||||||
Net increase (decrease) in net assets resulting from operations | $ | 1,282,924 | $ | (2,316,160 | ) | $ | 6,194 | |||||
Adjustments to reconcile net increase (decrease) in net assets resulting from operations to net cash used in operating activities: | ||||||||||||
Net change in unrealized appreciation on investments | (416,920 | ) | (192,212 | ) | — | |||||||
Net change in unrealized appreciation on obligations under participation agreements | (27,767 | ) | 52,572 | — | ||||||||
Amortization of deferred offering costs | 375,748 | 1,312,811 | 383,182 | |||||||||
Amortization and accretion of investment-related fees, net | (277,558 | ) | (4,286 | ) | — | |||||||
Amortization of discount and premium on investments | 96,846 | — | — | |||||||||
Paid-in-kind interest, net | (32,381 | ) | (42,534 | ) | — | |||||||
Purchases of investments | (44,777,167 | ) | (26,299,670 | ) | (2,000,000 | ) | ||||||
Repayments of investments | 28,508,960 | — | — | |||||||||
Proceeds from obligations under participation agreements | — | 14,300,000 | — | |||||||||
Repayments of obligations under participation agreements | (12,863,770 | ) | — | — | ||||||||
Changes in operating assets and liabilities: | ||||||||||||
Increase in cash, restricted | (710,973 | ) | (836,434 | ) | — | |||||||
Decrease (increase) in deferred offering costs | 361,482 | (635,342 | ) | (848,940 | ) | |||||||
Decrease (increase) in prepaid expenses and other assets | 165,875 | (243,447 | ) | (31,404 | ) | |||||||
Increase in interest receivable | (159,577 | ) | (258,424 | ) | (20,000 | ) | ||||||
(Decrease) increase in due to Adviser, net | (1,166,629 | ) | 890,385 | 2,554 | ||||||||
Increase in interest reserve and other deposits held on investments | 710,973 | 836,434 | — | |||||||||
Increase in accrued expenses | 27,588 | 45,767 | 172,593 | |||||||||
(Decrease) increase in interest payable from obligations under participation agreements | (128,325 | ) | 144,575 | — | ||||||||
Increase in directors' fees payable | — | 5,625 | — | |||||||||
Increase (decrease) in payable for unsettled stock subscriptions | 226,642 | (316,000 | ) | 316,000 | ||||||||
(Decrease) increase in other liabilities | (119,834 | ) | 120,269 | 17,336 | ||||||||
Net cash used in operating activities | (28,923,863 | ) | (13,436,071 | ) | (2,002,485 | ) | ||||||
Cash flows from financing activities: | ||||||||||||
Issuance of common stock | 35,108,677 | 39,878,132 | 11,234,309 | |||||||||
Payments of selling commissions, dealer manager fees and transaction charges | (2,239,699 | ) | (2,752,353 | ) | (904,819 | ) | ||||||
Proceeds from mortgage financing | 3,333,333 | — | — | |||||||||
Repayments of mortgage financing | (3,333,333 | ) | — | — | ||||||||
Payments of stockholder distributions | (3,402,911 | ) | (1,563,738 | ) | (91,539 | ) | ||||||
Reimbursement of selling commissions and dealer manager fees | — | 1,296,877 | — | |||||||||
Payments of offering costs | — | (37,348 | ) | (111,669 | ) | |||||||
Net cash provided by financing activities | 29,466,067 | 36,821,570 | 10,126,282 | |||||||||
Net increase in cash and cash equivalents | 542,204 | 23,385,499 | 8,123,797 | |||||||||
Cash and cash equivalents, at beginning of year | 31,634,296 | 8,248,797 | 125,000 | |||||||||
Cash and cash equivalents, at end of year | $ | 32,176,500 | $ | 31,634,296 | $ | 8,248,797 | ||||||
F-6
Terra Income Fund 6, Inc.
Statements of Cash Flows (Continued)
Years Ended September 30, | ||||||||||||
2017 | 2016 | 2015 | ||||||||||
Supplemental disclosure of cash flow information: | ||||||||||||
Interest paid on mortgage loan payable and obligations under participation agreements | $ | 748,907 | $ | 1,246,367 | $ | — | ||||||
Supplemental non-cash information: | ||||||||||||
Reinvestment of stockholder distributions | $ | 1,696,283 | $ | 910,904 | $ | 33,601 | ||||||
See notes to financial statements.
F-7
Terra Income Fund 6, Inc.
Schedule of Investments
September 30, 2017
Portfolio Company (1) | Structure | Collateral Location | Property Type | Interest Rate | Acquisition Date | Maturity Date | Principal | Amortized Cost | Fair Value (2) | % of Net Assets (3) | ||||||||||||||||||
Investments — non-controlled: | ||||||||||||||||||||||||||||
KOP Hotel XXXI Mezz, LP. (4) (5) | Mezzanine loan | US - PA | Hotel | 13.00 | % | 11/24/2015 | 12/6/2022 | $ | 5,800,000 | $ | 5,786,133 | $ | 5,866,063 | 7.8 | % | |||||||||||||
Hertz Clinton One Mezzanine, LLC | Mezzanine loan | US - MS | Office | 12.00 | % | 3/18/2016 | 1/1/2025 | 2,500,000 | 2,437,857 | 2,526,660 | 3.3 | % | ||||||||||||||||
GAHC3 Lakeview IN Medical Plaza, LLC (6) | B-note | US - IN | Office | 11.60% + LIBOR | 6/17/2016 | 1/21/2019 | 3,417,207 | 3,417,207 | 3,428,041 | 4.6 | % | |||||||||||||||||
YIP Santa Maria, LLC | Mezzanine loan | US - CA | Hotel | 13.00 | % | 11/15/2016 | 12/9/2019 | 4,500,000 | 4,481,473 | 4,538,492 | 6.0 | % | ||||||||||||||||
Dwight Mezz II, LLC | Mezzanine loan | US - CA | Student housing | 11.00 | % | 5/11/2017 | 5/6/2027 | 3,000,000 | 3,000,000 | 3,000,000 | 4.0 | % | ||||||||||||||||
Residential X Mezz Concord, LLC and Center Associates Mezz, LLC (7) | Mezzanine Loan | US - DE | Multifamily | 12.00 | % | 8/8/2017 | 9/5/2020 | 4,255,054 | 4,175,118 | 4,315,751 | 5.7 | % | ||||||||||||||||
Total investments — non-controlled | $ | 23,297,788 | $ | 23,675,007 | 31.4 | % | ||||||||||||||||||||||
Investments through participation interest — non-controlled (4)(8): | ||||||||||||||||||||||||||||
TSG-Parcel 1, LLC (9) | Participation in first mortgage | US - CA | Land | 12.00 | % | 7/10/2015 | 10/10/2017 | $ | 2,000,000 | $ | 2,020,000 | $ | 2,019,339 | 2.7 | % | |||||||||||||
140 Schermerhorn Street Mezz, LLC | Participation in mezzanine loan | US - NY | Hotel | 12.00 | % | 11/16/2016 | 12/1/2019 | 7,500,000 | 7,468,766 | 7,565,359 | 10.0 | % | ||||||||||||||||
OHM Atlanta Owner, LLC | Participation in first mortgage | US - GA | Land | 12.00 | % | 6/20/2017 | 6/20/2018 | 10,000,000 | 9,955,647 | 10,091,628 | 13.4 | % | ||||||||||||||||
NB Factory JV, LLC | Participation in preferred equity investment | US - UT | Student Housing | 15.00 | % | 6/29/2017 | 6/26/2020 | 2,445,056 | 2,445,056 | 2,445,056 | 3.3 | % | ||||||||||||||||
Total investments through participation interest — non-controlled | $ | 21,889,469 | $ | 22,121,382 | 29.4 | % | ||||||||||||||||||||||
Total Investments | $ | 45,187,257 | $ | 45,796,389 | 60.8 | % | ||||||||||||||||||||||
_______________
(1) | All of the Company’s investments are issued by an eligible U.S. portfolio company, as defined in the Investment Company Act of 1940. All of the Company’s borrowers are in the diversified real estate industry. |
(2) | Because there is no readily available market for these investments, the fair value of these investments are approved in good faith by the Company’s board of directors. |
(3) | Percentages are based on net assets of $75.3 million as of September 30, 2017. |
(4) | Participation interest is with Terra Property Trust, Inc., a related-party real estate investment trust managed by an affiliate of the Company’s sponsor. |
(5) | The loan participations from the Company do not qualify for sale accounting under Accounting Standards Codification (“ASC”) Topic 860 — Transfers and Servicing (“ASC Topic 860”), and therefore, these loans remain in the Schedule of Investments. See “Obligations under Participation Agreements” in Note 3 in the accompanying notes to the financial statements. |
(6) | The interest rate for this investment is indexed to London Interbank Offered Rate (“LIBOR”). At September 30, 2017, the effective interest rate on this investment was 12.84%. As of September 30, 2017, this investment had an unfunded commitment of $0.1 million. |
(7) | As of September 30, 2017, this investment had an unfunded commitment of $4.5 million. |
(8) | See “Participation Agreements” in Note 4 in the accompanying notes to the financial statements. |
(9) | The maturity of this loan has been extended to April 10, 2018 subsequent to September 30, 2017. |
See notes to financial statements.
F-8
Terra Income Fund 6, Inc.
Schedule of Investments
September 30, 2016
Portfolio Company (1) | Structure | Collateral Location | Property Type | Interest Rate | Acquisition Date | Maturity Date | Principal | Amortized Cost | Fair Value (2) | % of Net Assets (3) | ||||||||||||||||||
Investments — non-controlled: | ||||||||||||||||||||||||||||
KOP Hotel XXXI Mezz, LP. (4) (5) | Mezzanine loan | US - PA | Hotel | 13.00 | % | 11/24/2015 | 12/6/2022 | $ | 5,800,000 | $ | 5,800,000 | $ | 5,969,398 | 14.1 | % | |||||||||||||
QPT 24th Street Mezz, LLC (4) (5) (6) | Mezzanine loan | US - NY | Land | 12.00% Current/ 2% PIK | 12/15/2015 | 6/15/2017 | 15,250,567 | 15,250,567 | 15,250,567 | 35.9 | % | |||||||||||||||||
Hertz Clinton One Mezzanine, LLC | Mezzanine loan | US - MS | Office | 12.00 | % | 3/18/2016 | 1/1/2025 | 2,500,000 | 2,429,286 | 2,429,286 | 5.7 | % | ||||||||||||||||
GAHC3 Lakeview IN Medical Plaza, LLC (7) | B-note | US - IN | Office | 11.60% + LIBOR | 6/17/2016 | 1/21/2019 | 3,074,671 | 3,074,671 | 3,074,671 | 7.2 | % | |||||||||||||||||
Total investments — non-controlled | $ | 26,554,524 | $ | 26,723,922 | 62.9 | % | ||||||||||||||||||||||
Investment through participation interest — non-controlled: | ||||||||||||||||||||||||||||
TSG-Parcel 1, LLC (4) | Participation in first mortgage (8) | US - CA | Land | 12.00 | % | 7/10/2015 | 1/10/2017 | $ | 2,000,000 | $ | 2,000,000 | $ | 2,022,814 | 4.8 | % | |||||||||||||
Total investment through participation interest — non-controlled | $ | 2,000,000 | $ | 2,022,814 | 4.8 | % | ||||||||||||||||||||||
Total Investments | $ | 28,554,524 | $ | 28,746,736 | 67.7 | % | ||||||||||||||||||||||
(1) | All of the Company’s investments are issued by an eligible U.S. portfolio company, as defined in the Investment Company Act of 1940. All of the Company’s borrowers are in the diversified real estate industry. |
(2) | Because there is no readily available market for these investments, the fair value of these investments are approved in good faith by the Company’s board of directors. |
(3) | Percentages are based on net assets of $42.5 million as of September 30, 2016. |
(4) | Participation interest is with Terra Property Trust, Inc., a related-party real estate investment trust managed by an affiliate of the Company’s sponsor. |
(5) | The loan participations from the Company do not qualify for sale accounting under ASC Topic 860 and therefore, these loans remain in the Schedule of Investments. See “Obligations under Participation Agreements” in Note 3 in the accompanying notes to the financial statements. |
(6) | Principal amount includes PIK interest of $250,568. |
(7) | The interest rate for this investment is indexed to LIBOR. At September 30, 2016, the effective interest rate on this investment was 12.13%. As of September 30, 2016, this investment had an unfunded commitment of $425,329. |
(8) | See “Participation Agreements” in Note 4 in the accompanying notes to the financial statements. |
See notes to financial statements.
F-9
Terra Income Fund 6, Inc.
Notes to Financial Statements
Note 1. Principal Business and Organization
Terra Income Fund 6, Inc. (the “Company”) was incorporated under the general corporation laws of the State of Maryland on May 15, 2013. On March 2, 2015, the Company filed a public registration statement on Form N-2 (the “Registration Statement”) with the Securities and Exchange Commission (the “SEC”) to offer a minimum of $2.0 million of common stock and a maximum of $1.0 billion of common stock in a continuous public offering (the “Offering”). The Company formally commenced operations on June 24, 2015, upon raising gross proceeds in excess of $2.0 million (the “Minimum Offering Requirement”) from sales of shares of its common stock in the Offering, including sales to persons who are affiliated with the Company or its adviser, Terra Income Advisors, LLC (“Terra Income Advisors” or the “Adviser”). Since commencing the Offering and through September 30, 2017, the Company has sold 7,291,481 shares of common stock, including shares purchased by Terra Capital Partners, LLC, the Company’s sponsor, and excluding shares sold through the distribution reinvestment plan (“DRIP”), in both an initial private placement and from the Offering, for gross proceeds of $86.3 million. The Company has elected to be regulated as a business development company (“BDC”) under the Investment Company Act of 1940, as amended (the “1940 Act”). The Company is an externally managed, non-diversified, closed-end management investment company that has elected to be taxed for federal income tax purposes, and to qualify annually thereafter, as a regulated investment company (“RIC”) under Subchapter M of the Internal Revenue Code of 1986, as amended (the “Code”).The Company’s investment activities are externally managed by Terra Income Advisors, a private investment firm affiliated with the Company, pursuant to an investment advisory and administrative services agreement (the “Investment Advisory Agreement”), under the oversight of the Company’s board of directors (the “Board”), a majority of whom are independent directors. Terra Income Advisors is registered as an investment adviser under the Investment Advisers Act of 1940, as amended (see Note 4).
The Company has retained Terra Capital Markets, LLC (“Terra Capital Markets”), an affiliate of Terra Income Advisors, to serve as the dealer manager of the Offering. As dealer manager, Terra Capital Markets is responsible for marketing the Company’s shares being offered pursuant to the Offering. The Company intends to file post-effective amendments to the Registration Statement that are subject to SEC review to allow it to continue the Offering for at least two years from the initial effective date of the Registration Statement.
The Company’s primary investment objectives are to pay attractive and stable cash distributions and to preserve, protect and return capital contributions to stockholders. The Company’s investment strategy is to use substantially all of the proceeds of the Offering to originate and manage a diversified portfolio consisting of (i) commercial real estate loans to U.S. companies qualifying as “eligible portfolio companies” under the 1940 Act, including mezzanine loans, first and second lien mortgage loans, subordinated mortgage loans, bridge loans and other commercial real estate-related loans related to or secured by high quality commercial real estate in the United States and (ii) preferred equity real estate investments in U.S. companies qualifying as “eligible portfolio companies” under the 1940 Act. The Company may also purchase select commercial real estate-related debt securities, such as commercial mortgage-backed securities or collateralized debt obligations; provided, however, that the Company will select all investments after considering its ability to maintain its qualification to be taxed as a RIC. The Company intends to either directly or through an affiliate, structure, underwrite and originate most of its investments, as it believes that doing so will provide it with the best opportunity to invest in loans that satisfy its standards, establish a direct relationship with the borrower and optimize the terms of its investments. The Company may hold its investments until their scheduled maturity dates or may sell them if able to command favorable terms for their disposition.
Note 2. Summary of Significant Accounting Policies
Basis of Presentation: The accompanying financial statements have been prepared in accordance with United States generally accepted accounting principles (“U.S. GAAP”). The accompanying financial statements of the Company and related financial information have been prepared pursuant to the requirements for reporting on Form 10-K and Articles 6 or 10 of Regulation S-X. The Company is an investment company, as defined under U.S. GAAP, and applies accounting and reporting guidance in accordance with Financial Accounting Standards Board (“FASB”) ASC Topic 946, Financial Services — Investment Companies.
Cash and Cash Equivalents: The Company considers all highly liquid investments, with original maturities of ninety days or less when purchased, as cash equivalents. Cash and cash equivalents held at financial institutions, at times, may exceed the amount insured by the Federal Deposit Insurance Corporation (“FDIC”).
Restricted Cash: Restricted cash represents cash held as additional collateral by the Company on behalf of the borrowers related to the investments for the purpose of such borrowers making interest and property-related operating payments. There is a corresponding liability of the same amount on the statements of assets and liabilities called “Interest reserve and other deposits held on investments.”
F-10
Organization and Offering Expenses: Organization expenses are expensed on the Company’s statements of operations. All offering costs incurred during the offering period are recorded as deferred charge and amortized over twelve months from the date the cost is incurred, with the exception of those costs that were incurred prior to the commencement of operations on June 24, 2015, which were amortized over a 12-month period from that date forward.
Investment Transactions and Investment Income (Expense): The Company records investment transactions on the trade date. Realized gains or losses on dispositions of investments represent the difference between the amortized cost of the investment, based on the specific identification method, and the proceeds received from the sale or maturity (exclusive of any prepayment penalties). Realized gains and losses and changes in unrealized gains and losses are recognized in the statements of operations. Interest income is accrued based upon the outstanding principal amount and contractual terms of the debt instruments and preferred equity investments. Interest is accrued on a daily basis. Discounts and premiums on investments purchased are accreted or amortized over the expected life of the respective investment using the effective yield method, and are included in interest income in the statements of operations. Loan origination fees and exit fees are capitalized and the Company then amortizes such amounts using the effective interest method as interest income over the life of the investment. Income accrual is generally suspended for investments at the earlier of the date at which payments become 90 days past due or when, in the opinion of the Adviser, recovery of income and principal becomes doubtful. Interest is then recorded on the basis of cash received until accrual is resumed when the investment becomes contractually current and performance is demonstrated to be resumed. The amortized cost of investments represents the original cost adjusted for the accretion of discounts on investments and exit fees, and the amortizations of premiums on investments and origination fees. As prepayment(s), partial or full, occurs on an investment, prepayment income is recognized. All other income is recognized when earned.
The Company may hold debt investments in its portfolio that contain PIK interest provision. The PIK interest, which represents contractually deferred interest that is added to the principal balance that is due at maturity, is recorded on the accrual basis.
Participation Interests: The Company follows the guidance in ASC Topic 860 – Transfers and Servicing, when accounting for loan participations. Such guidance requires participations interests meet certain criteria in order for the interest transaction to be recorded as a sale. Loan participations from the Company which do not qualify for sale treatment remain on the Company’s statements of assets and liabilities and the proceeds are recorded as obligations under participation agreements. For the investments which participation has been granted, the interest earned on the entire loan balance is recorded within “interest income” and the interest related to the participation interest is recorded within “interest expense from obligations under participation agreements” in the accompanying statements of operations. Interest expense from obligations under participation agreement is reversed when recovery of interest income on the related loan becomes doubtful. See “Obligations under Participation Agreements” in Note 3 for additional information.
Valuation of Investments: The Company determines the value of its investments on a quarterly basis in accordance with fair value accounting guidance promulgated under U.S. GAAP, which establishes a three-tier hierarchical disclosure framework that prioritizes and ranks the level of market price observability used in measuring investments at fair value. These tiers include:
• | Level 1 — observable inputs, such as quoted prices in active markets. Publicly listed equities and publicly listed derivatives will be included in Level 1. |
• | Level 2 — observable inputs such as for similar securities in active markets and quoted prices for identical securities in markets that are not active. In certain cases, debt and equity securities are valued on the basis of prices from an orderly transaction between market participants provided by reputable dealers or pricing services. In determining the value of a particular investment, pricing services may use certain information with respect to transactions in such investments, quotations from dealers, pricing matrices, market transactions in comparable investments and various relationships between investments. Investments which are generally expected to be included in this category include corporate bonds and loans, convertible debt indexed to publicly listed securities and certain over-the-counter derivatives. |
• | Level 3 — unobservable inputs for which little or no market data exists, therefore requiring an entity to develop its own assumptions. The inputs into the determination of fair value require significant judgment or estimation. |
Market price observability is affected by a number of factors, including the type of investment and the characteristics specific to the investment. Investments with readily available actively quoted prices or for which fair value can be measured from actively quoted prices, generally, will have a higher degree of market price observability and a lesser degree of judgment used in measuring fair value. In certain cases, the inputs used to measure fair value may fall into different levels of the fair value hierarchy. In such cases, an investment’s level within the fair value hierarchy is based on the lowest level of input that is significant to the fair value measurement. The Company’s assessment of the significance of a particular input to the fair value measurement in its entirety requires subjective judgment and consideration of factors specific to the investment. The fair values of the Company’s investments are determined in good faith by the Board pursuant to the Company’s valuation policy and consistently applied valuation process. It is expected that the Company’s investments will primarily be classified as Level 3 investments.
F-11
Transaction Charge Payable: The Company paid Terra Capital Markets a total transaction charge (formerly referred to as distribution fee) of 4.5% of the gross proceeds from the sale of shares in the Offering, excluding shares sold through the DRIP. The transaction charge was recorded as a liability on the date of stockholder admittance with a corresponding reduction to equity and was payable annually at a rate of 1.125% of gross proceeds with respect to each share sold in the Offering on the first, second, third and fourth anniversaries of the month of purchase.
On September 30, 2017, the Company adopted the servicing plan (the “Servicing Plan”) and the second amended dealer manager agreement (the “Second Amended Dealer Manager Agreement”), which revised the terms of the servicing fee (which was previously referred to as a transaction charge) (Note 4). In connection with the adoptions of the Second Amended Dealer Manager Agreement and the Servicing Plan on September 30, 2017, the Company reduced the previously recorded transaction charges by $3.2 million, as reflected on the statements of changes in net assets.
Servicing Fee: The Company pays Terra Capital Markets a servicing fee at an annual rate of 1.125% of the most recently published net asset value per share, excluding shares sold through the DRIP, in exchange for providing certain administrative support services (Note 4). The servicing fee is recorded as expense on the statements of operations in the period in which it was incurred.
Stockholder Dividends and Distributions: Dividends and distributions to stockholders, which are determined in accordance with federal income tax regulations, are recorded on the record date. The amount to be paid out as a dividend or distribution is approved by the Board. Net realized capital gains, if any, are generally distributed or deemed distributed at least annually. The Company adopted an “opt in” distribution reinvestment plan pursuant to which stockholders may elect to have the full amount of stockholders cash distributions reinvested in additional shares of common stock. Participants in the DRIP are free to elect to participate or terminate participation in the plan within a reasonable time as specified in the plan. For stockholders who have opted in to the DRIP, they will have their cash distributions reinvested in additional shares of common stock, rather than receiving the cash distributions. The Company expects to coordinate distribution payment dates so that the same price that is used for the semi-monthly closing date immediately following such distribution payment date will be used to calculate the purchase price for purchasers under the DRIP. In such case, a stockholder’s reinvested distributions will be used to purchase shares at a price equal to 95% of the price that shares are sold in the offering at the semi-monthly closing immediately following the distribution payment date and such price may represent a premium to net asset value (“NAV”) per share.
Incentive Fee on Capital Gains: Pursuant to the terms of the Investment Advisory Agreement, the incentive fee on capital gains is determined and payable in arrears as of the end of each fiscal year (or upon termination of the Investment Advisory Agreement). This fee equals 20.0% of the Company’s incentive fee on capital gains, which equals the realized capital gains on a cumulative basis from inception, calculated as of the end of the applicable period, computed net of all realized capital losses and unrealized capital depreciation on a cumulative basis, less the aggregate amount of any previously paid capital gains incentive fees. On a quarterly basis, the Company accrues (but does not pay) for the capital gains incentive fee by calculating such fee as if it were due and payable as of the end of such period. While the Investment Advisory Agreement neither includes nor contemplates the inclusion of unrealized gains in the calculation of the capital gains incentive fee, pursuant to an interpretation of an American Institute of Certified Public Accountants Technical Practice Aid for investment companies, the Company accrues for this incentive fee to include unrealized gains in the calculation of the capital gains incentive fee expense and related accrued capital gains incentive fee. This accrual reflects the incentive fees that would be payable to Terra Income Advisors if the Company’s entire portfolio were liquidated at its fair value as of the balance sheet date even though Terra Income Advisors is not entitled to an incentive fee with respect to unrealized gains unless and until such gains are actually realized.
Income Taxes: The Company has elected to operate so as to qualify to be taxed as a RIC as defined under Subchapter M of the Code. Generally, a RIC is not required to pay corporate-level federal income tax on income and gains distributed to stockholders, provided that it distributes at least 90.0% of “investment company taxable income,” as defined in the Code, each year and meets specified source-of-income and asset diversification requirements. Dividends paid up to one year after the current tax year can be carried back to the prior tax year for determining the dividends paid in such tax year. The Company intends to distribute sufficient dividends to maintain its qualification to be taxed as a RIC each year. The Company will also be subject to nondeductible federal excise taxes of 4.0% on undistributed income if it does not distribute an amount at least equal to the sum of (i) 98.0% of its ordinary income for the calendar year; (ii) 98.2% of its capital gain net income for the one-year period ending on October 31 of the calendar year; and (iii) any ordinary income and capital gain net income for the preceding year that were not distributed during such year and on which it paid no federal income tax.
The Company did not have any uncertain tax positions that met the recognition or measurement criteria of ASC 740-10-25, Income Taxes, nor did the Company have any unrecognized tax benefits as of the periods presented herein. The Company recognizes interest and penalties, if any, related to unrecognized tax liabilities as income tax expense in its statements of operations. For the years ended September 30, 2017, 2016 and 2015, the Company did not incur any interest or penalties. Although the Company files federal and state tax returns, its major tax jurisdiction is federal. The Company’s inception-to-date federal tax years remain subject to examination by the Internal Revenue Service and the state department of revenue.
F-12
Use of Estimates: The preparation of the financial statements in conformity with U.S. GAAP requires management to make estimates and assumptions that affect the reported amounts of assets and liabilities, and disclosure of contingent assets and liabilities at the date of the financial statements, and reported amounts of income, expenses and gains and losses during the reporting period. Actual results could differ from those estimates, and those differences could be material.
The financial statements include investments at fair value of $45.8 million and $28.7 million at September 30, 2017 and 2016, respectively, and obligations under participation agreements at fair value of $1.8 million and $14.6 million at September 30, 2017 and 2016, respectively. These fair values have been determined in good faith by the Board. Because of the inherent uncertainty of valuation, the determined values may differ significantly from the values that would have been used had a ready market existed for the investments and obligations under participation agreements, and the differences could be material.
Recent Accounting Pronouncements: In May 2014, the FASB issued Accounting Standards Update (“ASU”) 2014-09, Revenue from Contracts with Customers (Topic 606) (“ASU 2014-09”). The core principle of the revenue model is that an entity recognizes revenue to depict the transfer of promised goods or services to customers in an amount that reflects the consideration to which the entity expects to be entitled in exchange for the goods or services. The Company will adopt this standard on January 1, 2018 using either the retrospective or cumulative effect transition method. The Company does not expect the adoption of ASU 2014-09 to have a material impact on its financial statements and disclosure.
In January 2016, the FASB issued ASU 2016-01, Financial Instruments — Overall (Subtopic 825-10): Recognition and Measurement of Financial Assets and Financial Liabilities (“ASU 2016-01”). ASU 2016-01 retains many current requirements for the classification and measurement of financial instruments; however, it significantly revises an entity’s accounting related to (i) the classification and measurement of investments in equity securities and (ii) the presentation of certain fair value changes for financial liabilities measured at fair value. ASU 2016-01 also amends certain disclosure requirements associated with the fair value of financial instruments. This guidance is effective for annual and interim periods beginning after December 15, 2017, and early adoption is not permitted for public business entities. Management is currently evaluating the impact these changes will have on the Company’s financial statements and disclosures.
In February 2016, the FASB issued ASU 2016-02, Leases (Topic 842) (“ASU 2016-02”). ASU 2016-02 outlines a new model for accounting by lessees, whereby their rights and obligations under substantially all leases, existing and new, would be capitalized and recorded on the balance sheet. For lessors, however, the accounting remains largely unchanged from the current model, with the distinction between operating and financing leases retained, but updated to align with certain changes to the lessee model and the new revenue recognition standard. The new standard also replaces existing sale-leaseback guidance with a new model applicable to both lessees and lessors. Additionally, the new standard requires extensive quantitative and qualitative disclosures. ASU 2016-02 is effective for U.S. GAAP public companies for fiscal years beginning after December 15, 2018, including interim periods within those fiscal years. Early application will be permitted for all entities. The new standard must be adopted using a modified retrospective transition of the new guidance and provides for certain practical expedients. Transition will require application of the new model at the beginning of the earliest comparative period presented. This ASU is not expected to have any impact on the Company’s financial statements as the Company does not have any lease arrangements.
In August 2016, the FASB issued ASU 2016-15, Statement of Cash Flows (Topic 230): Classification of Certain Cash Receipts and Cash Payments, a Consensus of the FASB’s Emerging Issues Task Force (“ASU 2016-15”). ASU 2016-15 provides guidance on how certain transactions are classified in the statement of cash flows. ASU 2016-15 is effective for annual and interim periods beginning after December 15, 2017. The guidance requires application using a retrospective transition method. The Company does not expect the adoption of ASU 2016-15 to have a material impact on its financial statements and disclosures.
In October 2016, the SEC adopted new rules and amended rules (together, “Final Rules”) intended to modernize the reporting and disclosure of information by registered investment companies. In part, the Final Rules amend Regulation S-X and require standardized, enhanced disclosure about derivatives in investment company financial statements, as well as other amendments. The Company adopted the Final Rules on August 1, 2017. The adoption did not have a material impact on the Company’s financial statements and disclosures.
In November 2016, the FASB issued ASU 2016-18, Statement of Cash Flows (Topic 230): Restricted Cash, a Consensus of the FASB’s Emerging Issues Task Force (“ASU 2016-18”). ASU 2016-18 requires that amounts generally described as restricted cash and restricted cash equivalents should be included with cash and cash equivalents when reconciling the beginning-of-period and end-of-period total amounts shown on the statement of cash flows. ASU 2016-18 does not provide a definition of restricted cash or restricted cash equivalents. ASU 2016-18 is effective for public business entities for annual and interim periods beginning after December 15, 2017. Early adoption is permitted, including adoption in an interim period, and should be applied using a retrospective transition method. Management is currently evaluating the impact of this change will have on the Company’s financial statements and disclosures.
F-13
Note 3. Investments
The following tables show the composition of the investment portfolio, at amortized cost and fair value at September 30, 2017 and 2016, respectively (with corresponding percentage of total portfolio investments):
September 30, 2017 | ||||||||||||||
Investments at Amortized Cost | Percentage of Amortized Cost | Investments at Fair Value | Percentage of Fair Value | |||||||||||
Loans | $ | 23,297,788 | 51.6 | % | $ | 23,675,007 | 51.7 | % | ||||||
Loans through participation interest (Note 4) | 21,889,469 | 48.4 | % | 22,121,382 | 48.3 | % | ||||||||
Total | $ | 45,187,257 | 100.0 | % | $ | 45,796,389 | 100.0 | % | ||||||
September 30, 2016 | ||||||||||||||
Investments at Amortized Cost | Percentage of Amortized Cost | Investments at Fair Value | Percentage of Fair Value | |||||||||||
Loans (1) | $ | 26,554,524 | 93.0 | % | $ | 26,723,922 | 93.0 | % | ||||||
Loans through participation interest (Note 4) | 2,000,000 | 7.0 | % | 2,022,814 | 7.0 | % | ||||||||
Total | $ | 28,554,524 | 100.0 | % | $ | 28,746,736 | 100.0 | % | ||||||
(1)Amortized cost includes PIK interest $250,568 as of September 30, 2016.
Obligations under Participation Agreements
The Company has elected the fair value option under ASC Topic 825 — Financial Instruments relating to accounting for debt obligations at their fair value for its obligations under participation agreements which arose due to partial loan sales which did not meet the criteria for sale treatment under ASC Topic 860. The Company employs the same yield approach valuation methodology used for the real estate-related loan investments on the Company’s obligations under participation agreements. As of September 30, 2017 and 2016, obligations under participation agreements at fair value totaled $1.8 million and $14.6 million, respectively, and the fair value of the loans that are associated with these obligations under participation agreements was $5.9 million and $21.2 million, respectively (See “Participation Agreements” in Note 4). For the year ended September 30, 2017, the Company made $12.9 million of repayments on obligations under participation agreements, including PIK interest of $0.4 million. For the year ended September 30, 2016, there were no repayments on obligations under participation agreements. The weighted average interest rate on the obligations under participation agreements was approximately 13.0% and 13.9% as of September 30, 2017 and 2016, respectively.
Mortgage Loan Payable
In May 2017, the Company obtained $3.3 million of mortgage financing for this investment. The mortgage financing carried interest at an annual rate of LIBOR plus 4.75% and had a maturity date of August 4, 2017. In June 2017, the mortgage financing was repaid in full.
Significant Risk Factors
In the normal course of business, the Company enters into transactions in various financial instruments. The Company’s financial instruments are subject to, but are not limited to, the following risks:
Market Risk
The Company’s investments are highly illiquid and there is no assurance that the Company will achieve its investment objectives, including targeted returns. Due to the illiquidity of the investments, valuation of the investments may be difficult, as there generally will be no established markets for these investments. As the Company’s investments are carried at fair value with fair value changes recognized in the statements of operations, all changes in market conditions will directly affect the Company’s net asset value.
Credit Risk
Credit risk represents the potential loss that the Company would incur if the borrowers failed to perform pursuant to the terms of their obligations to the Company. The Company minimizes its exposure to credit risk by limiting exposure to any one individual borrower and any one asset class. Additionally, the Company employs an asset management approach and monitors the portfolio of investments, through, at a minimum, quarterly financial review of property performance including net operating income, loan-to-value, debt service coverage ratio (“DSCR”) and the debt yield. The Company also requires certain borrowers to establish a
F-14
cash reserve, as a form of additional collateral, for the purpose of providing for future interest or property-related operating payments.
Mezzanine loans and preferred equity investments are subordinate to senior mortgage loans and, therefore, involve a higher degree of risk. In the event of a default, mezzanine loans and preferred equity investments will be satisfied only after the senior lender’s investment is fully recovered. As a result, in the event of a default, the Company may not recover any or all of its investment.
The Company maintains all of its cash at financial institutions which, at times, may exceed the amount insured by the FDIC.
Concentration Risk
The Company holds real estate related investments. Thus, the investment portfolio of the Company may be subject to a more rapid change in value than would be the case if the Company were required to maintain a wide diversification among industries, companies and types of investments. The result of such concentration in real estate assets is that a loss in such investments could materially reduce the Company’s capital.
Liquidity Risk
Liquidity risk represents the possibility that the Company may not be able to sell its positions at a reasonable price in times of low trading volume, high volatility and financial stress.
Interest Rate Risk
Interest rate risk represents the effect from a change in interest rates, which could result in an adverse change in the fair value of the Company’s interest-bearing financial instruments.
Prepayment Risk
Prepayments can either positively or adversely affect the yields on investments. Prepayments on debt instruments, where permitted under the debt documents, are influenced by changes in current interest rates and a variety of economic, geographic and other factors beyond the Company’s control, and consequently, such prepayment rates cannot be predicted with certainty. If the Company does not collect a prepayment fee in connection with a prepayment or is unable to invest the proceeds of such prepayments received, the yield on the portfolio will decline. In addition, the Company may acquire assets at a discount or premium and if the asset does not repay when expected, the anticipated yield may be impacted. Under certain interest rate and prepayment scenarios the Company may fail to recoup fully its cost of acquisition of certain investments.
Use of Leverage
As part of the Company’s investment strategy, the Company may borrow and utilize leverage. While borrowing and leverage present opportunities for increasing total return, they may have the effect of potentially creating or increasing losses. For purposes of calculating the asset coverage ratio per unit, the Company considers the obligations under the participation agreements to be senior security. As of September 30, 2017, the asset coverage per unit was $42,381. Asset coverage per unit is the ratio of the carrying value of the Company’s total assets, less all liabilities and indebtedness not represented by senior securities, to the aggregate amount of senior securities representing indebtedness. Asset coverage per unit is expressed in terms of dollar amounts per $1,000 of indebtedness.
Valuation Methodology
Market quotations are not readily available for the Company’s real estate-related loan investments, all of which are included in Level 3 of the fair value hierarchy, and therefore these investments are valued utilizing a yield approach, i.e. a discounted cash flow methodology to arrive at an estimate of the fair value of each respective investment in the portfolio using an estimated market yield. In following this methodology, investments are evaluated individually, and management takes into account, in determining the risk-adjusted discount rate for each of the Company’s investments, relevant factors, including available current market data on applicable yields of comparable debt/preferred equity instruments; market credit spreads and yield curves; the investment’s yield; covenants of the investment, including prepayment provisions; the portfolio company’s ability to make payments, net operating income and DSCR; the nature, quality and realizable value of any collateral (and loan-to-value ratio); the forces that influence the local markets in which the asset (the collateral) is purchased and sold, such as capitalization rates, occupancy rates, rental rates and replacement costs; and the anticipated duration of each real estate-related loan investment.
These valuation techniques are applied in a consistent and verifiable manner to all investments that are categorized within Level 3 of the fair value hierarchy and Terra Income Advisors provides the valuation committee of the Board (which is made up exclusively of independent directors) with portfolio security valuations that are based on this discounted cash flow methodology. Valuations are prepared quarterly, or more frequently as needed, with each asset in the portfolio subject to a valuation prepared by a third-party valuation service at a minimum of once during every 12-month period. The valuation committee reviews the preliminary valuation with Terra Income Advisors and, together with an independent valuation firm, if applicable, responds and
F-15
supplements the preliminary valuation to reflect any comments provided by the valuation committee. The Board discusses valuations and determines the fair value of each investment in the portfolio in good faith based on various statistical and other factors, including the input and recommendation provided by Terra Income Advisors, the valuation committee and any third-party valuation firm, if applicable.
The following tables present fair value measurements of investments, by major class, as of September 30, 2017 and 2016, according to the fair value hierarchy:
September 30, 2017 | ||||||||||||||||
Fair Value Measurements | ||||||||||||||||
Level 1 | Level 2 | Level 3 | Total | |||||||||||||
Investments: | ||||||||||||||||
Loans | $ | — | $ | — | $ | 23,675,007 | $ | 23,675,007 | ||||||||
Loans through participation interest | — | — | 22,121,382 | 22,121,382 | ||||||||||||
Total Investments | $ | — | $ | — | $ | 45,796,389 | $ | 45,796,389 | ||||||||
Obligations under participation agreements | $ | — | $ | — | $ | 1,820,502 | $ | 1,820,502 | ||||||||
September 30, 2016 | ||||||||||||||||
Fair Value Measurements | ||||||||||||||||
Level 1 | Level 2 | Level 3 | Total | |||||||||||||
Investments: | ||||||||||||||||
Loans | $ | — | $ | — | $ | 26,723,922 | $ | 26,723,922 | ||||||||
Loans through participation interest | — | — | 2,022,814 | 2,022,814 | ||||||||||||
Total Investments | $ | — | $ | — | $ | 28,746,736 | $ | 28,746,736 | ||||||||
Obligations under participation agreements | $ | — | $ | — | $ | 14,560,606 | $ | 14,560,606 | ||||||||
F-16
Changes in Level 3 investments for the years ended September 30, 2017, 2016 and 2015 were as follows:
Year Ended September 30, 2017 | ||||||||||||||||
Loans | Loans Through Participation | Total Investments | Obligations under Participation Agreements | |||||||||||||
Balance as of October 1, 2016 | $ | 26,723,922 | $ | 2,022,814 | $ | 28,746,736 | $ | 14,560,606 | ||||||||
Purchases of investments | 15,513,417 | 29,263,750 | 44,777,167 | — | ||||||||||||
Repayments of investments | (19,120,683 | ) | (9,388,277 | ) | (28,508,960 | ) | — | |||||||||
Net change in unrealized appreciation on investments | 207,821 | 209,099 | 416,920 | — | ||||||||||||
PIK interest income | 188,117 | — | 188,117 | — | ||||||||||||
Amortization and accretion of investment-related fees, net | 153,842 | 119,413 | 273,255 | (4,303 | ) | |||||||||||
Amortization of discount and premium on investments, net | 8,571 | (105,417 | ) | (96,846 | ) | — | ||||||||||
Net change in unrealized appreciation on obligations under participation agreements | — | — | — | (27,767 | ) | |||||||||||
Repayments of obligations under participation agreements | — | — | — | (12,863,770 | ) | |||||||||||
PIK interest expense | — | — | — | 155,736 | ||||||||||||
Balance as of September 30, 2017 | $ | 23,675,007 | $ | 22,121,382 | $ | 45,796,389 | $ | 1,820,502 | ||||||||
Net change in unrealized appreciation for the period relating to those Level 3 assets that were still held by the Company at the end of the period: | ||||||||||||||||
Net change in unrealized appreciation on investments and obligations under participation agreements | $ | 207,821 | $ | 209,099 | $ | 416,920 | $ | (27,767 | ) | |||||||
Year Ended September 30, 2016 | ||||||||||||||||
Loans | Loan Through Participation | Total Investments | Obligations under Participation Agreements | |||||||||||||
Balance as of October 1, 2015 | $ | — | $ | 2,000,000 | $ | 2,000,000 | $ | — | ||||||||
Purchases | 26,299,670 | — | 26,299,670 | — | ||||||||||||
Net increase in unrealized appreciation on investments | 169,398 | 22,814 | 192,212 | |||||||||||||
PIK interest income | 250,568 | — | 250,568 | — | ||||||||||||
Amortization of discount on investments | 4,286 | — | 4,286 | — | ||||||||||||
Net change in unrealized appreciation on obligations under participation agreements | — | — | — | 52,572 | ||||||||||||
Proceeds from obligations under participation agreements | — | — | — | 14,300,000 | ||||||||||||
PIK interest expense | — | — | — | 208,034 | ||||||||||||
Balance as of September 30, 2016 | $ | 26,723,922 | $ | 2,022,814 | $ | 28,746,736 | $ | 14,560,606 | ||||||||
Net change in unrealized appreciation for the period relating to those Level 3 assets that were still held by the Company at the end of the period: | ||||||||||||||||
Net change in unrealized appreciation on investments and obligations under participation agreements | $ | 169,398 | $ | 22,814 | $ | 192,212 | $ | 52,572 | ||||||||
Transfers between levels, if any, are recognized at the beginning of the period in which transfers occur. For the years ended September 30, 2017 and 2016, there were no transfers.
F-17
Significant Unobservable Inputs
The following table summarizes the significant unobservable inputs used by the Company to value the Level 3 investments as of September 30, 2017 and 2016. The table is not intended to be all-inclusive, but instead identifies the significant unobservable inputs relevant to the determination of fair values.
September 30, 2017 | |||||||||||||||||
Primary Valuation Technique | Unobservable Input | Range | Weighted | ||||||||||||||
Asset Category | Fair Value | Minimum | Maximum | Average | |||||||||||||
Assets: | |||||||||||||||||
Loans | $ | 23,675,007 | Discounted cash flow | Discount rate | 9.43 | % | 13.00 | % | 11.84 | % | |||||||
Loans through participation interest | 22,121,382 | Discounted cash flow | Discount rate | 12.00 | % | 15.00 | % | 12.39 | % | ||||||||
Total Level 3 Assets | $ | 45,796,389 | |||||||||||||||
Liabilities: | |||||||||||||||||
Obligations under Participation Agreements | $ | 1,820,502 | Discounted cash flow | Discount rate | 12.60 | % | 12.60 | % | 12.60 | % | |||||||
September 30, 2016 | |||||||||||||||||
Primary Valuation Technique | Unobservable Input | Range | Weighted | ||||||||||||||
Asset Category | Fair Value | Minimum | Maximum | Average | |||||||||||||
Assets: | |||||||||||||||||
Loans | $ | 26,723,922 | Discounted cash flow | Discount rate | 10.29 | % | 13.82 | % | 12.88 | % | |||||||
Loans through participation interest | 2,022,814 | Discounted cash flow | Discount rate | 9.09 | % | 9.09 | % | 9.09 | % | ||||||||
Total Level 3 Assets | $ | 28,746,736 | |||||||||||||||
Liabilities: | |||||||||||||||||
Obligations under Participation Agreements | $ | 14,560,606 | Discounted cash flow | Discount rate | 11.90 | % | 13.82 | % | 13.58 | % | |||||||
If the weighted average discount rate used to value the Company’s investments were to increase, the fair value of Company’s investments would decrease. Conversely, if the weighted average discount rate used to value the Company’s investments were to decrease, the fair value of Company’s investments would increase.
Note 4. Related Party Transactions
The Company entered into various agreements with Terra Income Advisors whereby the Company pays and reimburses Terra Income Advisors for certain fees and expenses, and Terra Income Advisors reimburses the Company for excess operating expenses. Additionally, the Company pays Terra Capital Markets certain fees in connection with its Offering. The following table presents a summary of such fees and reimbursements in accordance with the terms of the related agreements:
Years Ended September 30, | ||||||||||||
2017 | 2016 | 2015 | ||||||||||
Amounts Included in the Statements of Operations | ||||||||||||
Base management fees | $ | 1,202,568 | $ | 552,011 | $ | 30,058 | ||||||
Incentive fees on capital gains (1) | 90,459 | 27,928 | — | |||||||||
Operating expense reimbursement to Adviser (2) | 530,619 | 318,550 | 17,753 | |||||||||
Expense Support Payment from Adviser | — | (576,755 | ) | (1,690,300 | ) | |||||||
Commissions, dealer manager and transaction charges incurred | ||||||||||||
Commissions, dealer manager and transaction charges (3) | $ | 3,324,658 | $ | 3,647,210 | $ | 968,547 | ||||||
Reduction of transaction charge payable (4) | $ | (3,195,513 | ) | $ | — | $ | — | |||||
(1) | Incentive fees on capital gains are based on 20% of net unrealized capital gains of $0.4 million and $0.1 million for the years ended September 30, 2017 and 2016, respectively. No incentive fees on capital gains are actually payable by the Company with respect to unrealized gains unless and until those gains are realized. |
(2) | Amounts were primarily compensation for time spent supporting the Company’s day-to-day operations. |
F-18
(3) | Of the amounts, $2.3 million, $2.5 million and $0.7 million, respectively, were re-allowed to selected broker-dealers. Amounts were recorded as reductions to capital in excess of par on the statements of assets and liabilities. |
(4) | As discussed in “Dealer Manager Agreement” below, on September 30, 2017, the Company adopted the Servicing Plan and the Second Amended Dealer Manager Agreement to revise the terms of the servicing fee (which was previously referred to as a transaction charge). The servicing fee is recorded as expense on the statements of operations in the period in which it incurred. In connection with the adoptions of the Servicing Plan and the Second Amended Dealer Manager Agreement, the Company reduced the previously recorded transaction charges by $3.2 million, as reflected on the statements of changes in net assets. |
Due to / Due from Adviser
The Company determined that it has the right of offset on the amounts due to and due from Terra Income Advisors under the guidance in ASC Topic 210 — Balance Sheet. As such, the net amount is presented as Due to Adviser, net on the statements of assets and liabilities. The following table presents a summary of Due to Adviser, net as of September 30, 2017 and 2016:
September 30, 2017 | September 30, 2016 | |||||||
Due to Adviser: | ||||||||
Organization and offering costs (1) | $ | 119,936 | $ | 2,051,479 | ||||
Reimbursable costs - marketing and other operating expense | 9,920 | 863,012 | ||||||
Base management fee and expense reimbursement payable | 495,990 | 823,444 | ||||||
Incentive fees on capital gains | 118,387 | 27,928 | ||||||
744,233 | 3,765,863 | |||||||
Due from Adviser: | ||||||||
Expense support payments | — | 2,267,055 | ||||||
Offering costs paid by Terra Income Fund 6, Inc. | 36,306 | — | ||||||
Due to Adviser, net | $ | 707,927 | $ | 1,498,808 | ||||
(1) | During the year ended September 30, 2017 and in response to the general trend in capital raising for non-traded direct participation programs, the Company determined that it is highly unlikely that it will raise capital in an amount sufficient for all cumulative offering costs incurred by Terra Income Advisors to be reimbursed. Accordingly, the Company reduced the estimated amount payable to Terra Income Advisors for cumulative organization and offering costs incurred by $1.4 million. |
Management and Incentive Fee Compensation to Adviser
On April 20, 2015, the Company entered into the Investment Advisory Agreement with Terra Income Advisors, a subsidiary of Terra Capital Partners, the Company’s sponsor. Terra Income Advisors is responsible for the Company’s day-to-day operations. Pursuant to the Investment Advisory Agreement, Terra Income Advisors is paid for its services in two components — a base management fee and an incentive fee. The base management fee is calculated at an annual rate of 2.0% of the Company’s average gross assets. The base management fee is payable quarterly in arrears and calculated based on the average value of the Company’s gross assets at the end of the two most recently completed calendar quarters.
The incentive fee consists of two parts. The first part, which is referred to as the subordinated incentive fee on income, is calculated and payable quarterly in arrears based upon the Company’s “pre-incentive fee net investment income” for the immediately preceding quarter. The subordinated incentive fee on income is subject to a quarterly hurdle rate, expressed as a rate of return on adjusted capital at the beginning of the most recently completed calendar quarter, of 2.0% (8.0% annualized), subject to a “catch-up” feature. For this purpose, “pre-incentive fee net investment income” means interest income, dividend income and any other income (including any other fees, other than fees for providing managerial assistance, such as commitment, origination, structuring, diligence and consulting fees or other fees that the Company receives from portfolio companies) accrued during the calendar quarter, minus the Company’s operating expenses for the quarter (including the base management fee, expenses reimbursed to Terra Income Advisors under the Investment Advisory Agreement and any interest expense and dividends paid on any issued and outstanding preferred stock, but excluding the incentive fee). Pre-incentive fee net investment income includes, in the case of investments with a deferred interest feature (such as original issue discount, debt instruments with payment-in-kind interest and zero coupon securities), accrued income that the Company has not yet received in cash. Pre-incentive fee net investment income does not include any realized capital gains, realized capital losses or unrealized capital appreciation or depreciation. The calculation of the subordinated incentive fee on income for each quarter is as follows:
• | No incentive fee is payable to Terra Income Advisors in any calendar quarter in which the Company’s pre-incentive fee net investment income does not exceed the hurdle rate of 2.0% (8.0% annualized); |
F-19
• | 100% of the Company’s pre-incentive fee net investment income, if any, that exceeds the hurdle rate but is less than or equal to 2.5% in any calendar quarter (10.0% annualized) is payable to Terra Income Advisors, all or any portion of which may be waived or deferred in Terra Income Advisors’ discretion. This portion of the pre-incentive fee net investment income (which exceeds the hurdle rate but is less than or equal to 2.5%) is referred to as the “catch-up.” The catch-up provision is intended to provide Terra Income Advisors with an incentive fee of 20.0% on all of the Company’s pre-incentive fee net investment income when the Company’s pre-incentive fee net investment income reaches 2.5% in any calendar quarter; and |
• | 20.0% of the amount of the Company’s pre-incentive fee net investment income, if any, that exceeds 2.5% in any calendar quarter (10.0% annualized) is payable to Terra Income Advisors once the hurdle rate is reached and the catch-up is achieved. |
The second part of the incentive fee, which is referred to as the incentive fee on capital gains, is an incentive fee on capital gains earned on liquidated investments from the portfolio and is determined and payable in arrears as of the end of each calendar year (or upon termination of the Investment Advisory Agreement). This fee equals 20.0% of the Company’s incentive fee on capital gains, which equals the realized capital gains on a cumulative basis from inception, calculated as of the end of the applicable period, computed net of all realized capital losses and unrealized capital depreciation on a cumulative basis, less the aggregate amount of any previously paid capital gains incentive fees. On a quarterly basis, the Company accrues (but does not pay) for the capital gains incentive fee by calculating such fee as if it were due and payable as of the end of such period.
The services provided by Terra Income Advisors include, but are not limited to, accounting and administrative services. The Company is expected to reimburse Terra Income Advisors for the costs incurred by Terra Income Advisors to provide these services.
Operating Expenses
The Company reimburses Terra Income Advisors for operating expenses incurred in connection with administrative services provided to the Company, including compensation to administrative personnel. The Company does not reimburse Terra Income Advisors for personnel costs in connection with services for which Terra Income Advisors receives a separate fee. In addition, the Company does not reimburse the Terra Income Advisors for (i) rent or depreciation, capital equipment or other costs of its own administrative items, or (ii) salaries, fringe benefits, travel expenses and other administrative items incurred or allocated to any controlling person of Terra Income Advisors.
Organization and Offering Expenses
For the years ended September 30, 2017 and 2016, Terra Income Advisors did not incur organization costs on behalf of the Company. For the year ended 2015, Terra Income Advisors incurred organization costs of $0.1 million on behalf of the Company.
As of September 30, 2017 and 2016, Terra Income Advisors incurred cumulative organization costs of $0.2 million and $0.2 million, respectively, and cumulative offering costs of $3.0 million and $2.2 million, respectively, on behalf of the Company. Offering expenses consist of costs paid by Terra Income Advisors that are directly related to the registration and offering of the Company’s shares, including registration fees, legal fees and printing costs. Organization costs include those expenses paid by Terra Income Advisors for the legal organization, drafting and filing of the Company’s charter and other governance documents and include, but are not limited to, legal, accounting and filing fees.
Upon meeting the Minimum Offering Requirement, Terra Income Advisors is responsible for the payment of the Company’s cumulative organization and offering expenses to the extent such expenses exceed 1.5% of the gross proceeds from the Offering, without recourse against or reimbursement by the Company. As a result, Terra Income Advisors will bear all organization and offering expenses in excess of 1.5% of the gross proceeds from the Offering. During the year ended September 30, 2017 and in response to the general trend in capital raising for non-traded direct participation programs, the Company determined that it is highly unlikely that it will raise capital in an amount sufficient for all cumulative offering costs incurred by Terra Income Advisors to be reimbursed. Accordingly, the Company reduced the estimated amount payable to Terra Income Advisors for cumulative organization and offering costs incurred by $1.4 million. As of September 30, 2017, the Company is responsible for $1.4 million of the cumulative offering and organization costs incurred by Terra Income Advisors. As of September 30, 2017 and 2016, the amount due to Terra Income Advisors related to the offering and organization costs amounted to $0.1 million and $1.6 million, respectively, and is included in Due to Adviser, net on the statements of assets and liabilities. For the years ended September 30, 2017, 2016 and 2015, the Company made reimbursement payments of $1.0 million, $0.1 million and $0.2 million, respectively, to Terra Income Advisors for offering costs incurred on behalf of the Company.
F-20
Dealer Manager Agreement
On April 20, 2015, the Company entered into a dealer manager agreement (the “Dealer Manager Agreement”) with Terra Capital Markets, an affiliate of Terra Income Advisors, to serve as the dealer manager of the Offering. As dealer manager, Terra Capital Markets is responsible for marketing the Company’s shares being offered pursuant to the Offering. In this role, it manages a group of selling dealers, including other unaffiliated broker-dealers who enter into Selected Dealer Arrangements with Terra Capital Markets. Terra Capital Markets received selling commissions of 6.0% of gross proceeds from the Offering, dealer manager fees of up to 3.0% of gross proceeds from the Offering, and broker-dealer fees of up to 1.0% of gross proceeds from the Offering for reimbursement of marketing and expenses, in connection with the sale of shares of common stock in the Offering, all or a portion of which may be re-allowed to selected broker-dealers.
On April 27, 2016, the Company adopted an amended and restated dealer manager agreement (the “Amended Dealer Manager Agreement”). Under the terms of the Amended Dealer Manager Agreement, Terra Capital Markets receives selling commissions of 3.0% of gross proceeds from the Offering, dealer manager fees of up to 1.5% of the gross proceeds from the Offering, and broker-dealer fees of up to 1.0% of gross proceeds from the Offering for reimbursement of marketing and expenses, in connection with the sale of shares of the Company’s common stock in the Offering, all or a portion of which may be re-allowed to selected broker-dealers. In addition, Terra Capital Markets received a transaction charge at an annual rate of 1.125% of gross offering proceeds, excluding shares sold through the DRIP, all or a portion of which may be re-allowed to selected broker-dealers for services performed in connection with the distribution of the Company’s shares. The transaction charge was payable annually with respect to each share sold in the primary offering on the first, second, third and fourth anniversaries of the month of purchase. In connection with the adoption of the Amended Dealer Manager Agreement, Terra Capital Markets reimbursed the Company $1.3 million for commissions and dealer manager fees the Company paid related to the shares sold on and prior to February 20, 2016, the last stockholder admittance date prior to the adoption of the Amended Dealer Manager Agreement. The reimbursement amount would be paid back to Terra Capital Markets on the first, second, third and fourth anniversaries of the months of purchase.
On September 30, 2017, the Company adopted the Servicing Plan and the Second Amended Dealer Manager Agreement, which revised the terms of the servicing fee (which was previously referred to as a transaction charge). Pursuant to the Servicing Plan, Terra Capital Markets receives a servicing fee at an annual rate of 1.125% of the most recently published net asset value per share of the Company’s common stock, excluding shares sold through the DRIP, in exchange for providing certain administrative support services. With respect to each share sold, the servicing fee will be payable annually on the anniversary of the applicable month of purchase. Terra Capital Markets, in its discretion, may re-allow a portion of such servicing fee to participating dealers for performing certain administrative support services. The Servicing Plan will remain in effect for so long as such continuance is approved quarterly by the Board, including a majority of the directors who are not “interested persons” as defined in the 1940 Act and who have no direct or indirect financial interest in the operation of the Servicing Plan or in any agreements entered into in connection therewith. In addition, the Boards will review all payments made pursuant to the Servicing Plan at least quarterly. The Company will no longer incur the annual servicing fee upon the earlier of (i) the aggregate underwriting compensation from all sources, including selling commissions, dealer manager fees, broker-dealer fees, and servicing fees would exceed 10% of the gross proceeds in the Offering, (ii) with respect to a specific share, the date that such share is redeemed or is no longer outstanding, and (iii) the date, if any, upon which a liquidity event occurs. In connection with the adoptions of the Servicing Plan and the Second Amended Dealer Manager Agreement, the Company reduced the previously recorded transaction charges by $3.2 million, as reflected on the statements of changes in net assets.
Expense Support Agreement
On June 30, 2015, the Company entered into an expense support agreement (the “Expense Support Agreement”) with Terra Income Advisors, whereby Terra Income Advisors may pay up to 100% of the Company’s costs and expenses, including all fees payable to Terra Income Advisors pursuant to the Investment Advisory Agreement from inception until the Company and Terra Income Advisors mutually agree otherwise. This payment (the “Expense Support Payment”) for any month shall be paid by Terra Income Advisors to the Company in any combination of cash or other immediately available funds, and/or offsets against amounts due from the Company to Terra Income Advisors. The purpose of the Expense Support Payment is to reduce offering and operating expenses until the Company has achieved economies of scale sufficient to ensure that the Company is able to bear a reasonable level of expense in relation to investment income. Operating expenses subject to the Expense Support Agreement include expenses as defined by U.S. GAAP, including, without limitation, fees payable to Terra Income Advisors and interest on indebtedness for such period, if any.
Pursuant to the terms of the Expense Support Agreement, the Company has agreed to reimburse Terra Income Advisors for each Expense Support Payment within three years after such Expense Support Payment is made by Terra Income Advisors. Reimbursement shall be made as promptly as possible on a date mutually agreed to by the Company and Terra Income Advisors provided that (i) the operating expense ratio, defined as operating expenses excluding organization and offering expenses, base management fee, incentive fee and any interest expense attributable to indebtedness by the Company (“Net Operating Expenses”) expressed as a percentage of the Company’s net assets on the relevant measurement date, as of such Reimbursement Date is equal
F-21
to or less than the operating expense ratio as of the Expense Support Payment date attributable to such specified Expense Support Payment, (ii) the annualized distribution rate as of such Reimbursement Date is equal to or greater than the annualized distribution rate as of the Expense Support Payment date attributable to such specified Expense Support Payment; (iii) such Reimbursement Date is not later than three years following such specified Expense Support Payment date; and (iv) the Expense Support Payment does not cause the Company’s Net Operating Expenses to exceed 1.5% of the Company’s net assets attributable to common shares, after taking such reimbursement into account. Terra Income Advisors is entitled to reimbursement of all previously unreimbursed Expense Support Payments in the event of termination of the Expense Support Agreement.
The following table provides information regarding the expenses that the parties to the agreement determined would be incurred by Terra Income Advisors pursuant to the Expense Support Agreement:
Three months ended | Amount of Expense Reimbursement Payment | Annualized Operating Expense Ratio as of the Date of Expense Reimbursement Payment | Annualized Rate of Distributions Per Share (1) | Reimbursement Eligibility Expiration | ||||||||
June 30, 2015 | $ | 515,813 | 24.53 | % | 8.00 | % | June 30, 2018 | |||||
September 30, 2015 | 1,174,487 | 66.63 | % | 8.00 | % | September 30, 2018 | ||||||
December 31, 2015 (2) | 576,755 | 15.60 | % | 8.00 | % | November 30, 2018 | ||||||
(1) | The annualized rate of distributions per share is expressed as a percentage equal to the projected annualized distribution amount as of the date each payment was made (which is calculated by annualizing the regular daily cash distribution per share as of the date each payment was made without compounding), divided by the Company’s public offering price per share as of the date each payment was made. |
(2) | The expense reimbursement payment amount of $576,755 represents the total of the twice monthly expense reimbursement payments through November 30, 2015. The annualized operating expense ratio of 15.60% represents the ratio average of such twice monthly expense reimbursement payment dates. |
Participation Agreements
The Company may enter into participation agreements with related and unrelated parties, primarily other affiliated funds of Terra Income Advisors. The participation agreements provide the Company with the opportunity to invest along the same terms, conditions, price and rights in the specified investment. The purpose of the participation agreements is to allow the Company and an affiliate to originate a specified investment when, individually, the Company does not have the liquidity to do so or to achieve a certain level of portfolio diversification. The Company may transfer portions of its investments to other participants or it may be a participant to an investment held by another entity.
ASC Topic 860, Transfers and Servicing, establishes accounting and reporting standards for transfers of financial assets. ASC 860-10 provides consistent standards for distinguishing transfers of financial assets that are sales from transfers that are secured borrowings. The Company has determined that the participation agreements it enters into are accounted for as secured borrowings under ASC Topic 860 (see “Participation Interests” in Note 2 and “Obligations under Participation Agreements” in Note 3).
Participation interest purchased by the Company: The below tables list the investment interests participated by the Company via participation agreement (each, a “PA”) as of September 30, 2017 and 2016. In accordance with the terms of each PA, each Participant’s rights and obligations, including interest income and other income (e.g., exit fee and prepayment income) and related fees/expenses are based upon its respective pro-rata participation interest in such investments, as specified in the respective PA. The Company’s share of the investment is repayable only from the proceeds received from the related borrower/issuer of the investment, and therefore the Company is also subject to the credit risk (i.e., risk of default by the underlying borrower/issuer).
F-22
Pursuant to each PA, the affiliated fund receives and allocates the interest income and other related investment incomes in respect of the investment to the Company. The Company pays related expenses (i.e., the base management fee) directly to Terra Income Advisors.
Participating Interests at September 30, 2017 | September 30, 2017 | September 30, 2016 | |||||||||||||||||
Principal Balance | Fair Value | Principal Balance | Fair Value | ||||||||||||||||
TSG-Parcel 1, LLC (1) | 11.1 | % | $ | 2,000,000 | $ | 2,019,339 | $ | 2,000,000 | $ | 2,022,814 | |||||||||
140 Schermerhorn Street Mezz LLC (1)(2) | 50.0 | % | 7,500,000 | 7,565,359 | — | — | |||||||||||||
OHM Atlanta Owner, LLC (1)(3) | 40.8 | % | 10,000,000 | 10,091,628 | — | — | |||||||||||||
NB Factory JV, LLC (1)(3) | 68.0 | % | 2,445,056 | 2,445,056 | — | — | |||||||||||||
Total | $ | 21,945,056 | $ | 22,121,382 | $ | 2,000,000 | $ | 2,022,814 | |||||||||||
(1) | Participation is with Terra Property Trust, Inc., an affiliated fund managed by Terra Income Advisors. |
(2) | The Company acquired this investment in November 2016. |
(3) | The Company acquired this investment in June 2017. |
Transfers of participation interests by the Company: The following table summarizes the investments that were subject to PAs with investment partnerships affiliated with Terra Income Advisors as of September 30, 2017 and 2016:
September 30, 2017 | |||||||||||||||||||
Transfers treated as obligations under participation agreements | |||||||||||||||||||
Principal | Fair Value | % Transferred | Principal | Fair Value | |||||||||||||||
KOP Hotel XXXI Mezz, LP (1) | $ | 5,800,000 | $ | 5,866,063 | 31.0 | % | $ | 1,800,000 | $ | 1,820,502 | |||||||||
Total | $ | 5,800,000 | $ | 5,866,063 | $ | 1,800,000 | $ | 1,820,502 | |||||||||||
September 30, 2016 | |||||||||||||||||||
Transfers treated as obligations under participation agreements | |||||||||||||||||||
Principal | Fair Value | % Transferred | Principal | Fair Value | |||||||||||||||
KOP Hotel XXXI Mezz, LP. (1) | $ | 5,800,000 | $ | 5,969,398 | 31.0 | % | $ | 1,800,000 | $ | 1,852,572 | |||||||||
QPT 24th Street Mezz, LLC (1)(2) | 15,250,567 | 15,250,567 | 83.3 | % | 12,708,034 | 12,708,034 | |||||||||||||
Total | $ | 21,050,567 | $ | 21,219,965 | $ | 14,508,034 | $ | 14,560,606 | |||||||||||
_______________
(1) | Participation is with Terra Property Trust, Inc. |
(2) | The principal amount includes PIK interest of $250,567 as of September 30, 2016, of which $208,034 was treated as obligations under participation agreements. The principal amount of this investment was repaid in full in July 2017. |
As a BDC, the Company is subject to certain regulatory restrictions in making its investments. For example, the Company may be prohibited under the 1940 Act from knowingly participating in certain transactions with its affiliates without the prior approval of its Board who are not interested persons and, in some cases, prior approval by the SEC. The SEC has granted the Company exemptive relief permitting it, subject to satisfaction of certain conditions, to co-invest in certain privately negotiated investment transactions with certain affiliates of Terra Income Advisors, including the Terra Income Funds, Terra Property Trust, and any future BDC or closed-end management investment company that is registered under the 1940 Act and is advised by Terra Income Advisors or its affiliated investment advisers (the “Co-Investment Affiliates”). However, the Company will be prohibited from engaging in certain transactions with its affiliates even under the terms of this exemptive order. The Company believes this relief will not only enhance its ability to further its investment objectives and strategy, but may also increase favorable investment opportunities for the Company, in part by allowing the Company to participate in larger investments, together with its Co-Investment Affiliates, than would be available to the Company if it had not obtained such relief.
F-23
Note 5. Commitments and Contingencies
In the ordinary course of business, the Company may enter into future funding commitments, which are subject to the borrower meeting certain performance-related metrics that are monitored by the Company. As of September 30, 2017 and 2016, the Company had $4.6 million and $0.4 million of unfunded commitments, respectively. The Company expects to maintain sufficient cash on hand to fund such unfunded commitments.
The Company enters into contracts that contain a variety of indemnification provisions. The Company’s maximum exposure under these arrangements is unknown; however, the Company has not had prior claims or losses pursuant to these contracts. Management of Terra Income Advisors has reviewed the Company’s existing contracts and expects the risk of loss to the Company to be remote.
The Company is not currently subject to any material legal proceedings and, to the Company’s knowledge, no material legal proceedings are threatened against the Company. From time to time, the Company may be a party to certain legal proceedings in the ordinary course of business, including proceedings relating to the enforcement of the Company’s rights under contracts with its portfolio companies. While the outcome of any legal proceedings cannot be predicted with certainty, the Company does not expect that any such proceedings will have a material adverse effect upon its financial condition or results of operations.
See Note 4. “Related Party Transactions”, for a discussion of the Company’s commitments to Terra Income Advisors.
Note 6. Income Taxes
The Company has elected to operate so as to qualify to be taxed as a RIC under Subchapter M of the Code and, as such, is not subject to federal income tax on the portion of taxable income distributed to stockholders.
In order to maintain its qualification to be taxed as a RIC, the Company is required to meet certain income and asset diversification tests in addition to distributing at least 90% of its investment company taxable income, as defined by the Code, each year. Because federal income tax regulations differ from U.S. GAAP, distributions in accordance with tax regulations may differ from net investment for financial reporting purposes. Differences may be permanent or temporary in nature. Permanent differences are reclassified among capital accounts in the financial statements to reflect their tax character. Differences in classification may also result from the treatment of short-term gains as ordinary income for tax purposes.
Taxable income generally differs from net increase (decrease) in net assets resulting from operations for financial reporting purposes due to temporary and permanent differences in the recognition of income and expenses and generally excludes unrealized appreciation (depreciation) on investments as investment gains and losses are not included in taxable income until they are realized.
The following table reconciles net decrease in net assets resulting from operations to taxable income (loss):
Years Ended September 30, | ||||||||||||
2017 | 2016 | 2015 | ||||||||||
Net investment income (loss) | $ | 1,282,924 | $ | (2,316,160 | ) | $ | 6,194 | |||||
Net change in unrealized appreciation on investments | (416,920 | ) | (192,212 | ) | — | |||||||
Net change in unrealized appreciation on obligations under participation agreements | (27,767 | ) | 52,572 | — | ||||||||
Amortization of deferred offering costs | 375,748 | 1,312,811 | 383,182 | |||||||||
Reduction of offering costs | (944,248 | ) | — | — | ||||||||
Expense reimbursement from Adviser | — | (576,755 | ) | (1,690,300 | ) | |||||||
Incentive fees on capital gains | 90,459 | — | — | |||||||||
Other temporary differences (1) | 107,565 | 3,045 | 143,229 | |||||||||
Total taxable income (loss) | $ | 467,761 | $ | (1,716,699 | ) | $ | (1,157,695 | ) | ||||
(1) | Other temporary differences primarily related to deferred origination fee and amortization of organization fee and exit fee. |
F-24
The following table reflects, for tax purposes, the estimated sources of the cash distributions that the Company has paid on its common stock:
Years Ended September 30, | ||||||||||||||||||||
2017 | 2016 | 2015 | ||||||||||||||||||
Source of Distribution | Distribution Amount (1) | Percentage | Distribution Amount | Percentage | Distribution Amount | Percentage | ||||||||||||||
Return of capital | $ | 4,631,433 | 90.8 | % | $ | 2,474,642 | 100.0 | % | $ | 125,140 | 100.0 | % | ||||||||
Net investment income | 467,761 | 9.2 | % | — | — | — | — | % | ||||||||||||
Distributions on a tax basis: | $ | 5,099,194 | 100.0 | % | $ | 2,474,642 | 100.0 | % | $ | 125,140 | 100.0 | % | ||||||||
(1) | The Distribution Amount and Percentage reflected for the year ended September 30, 2017 are estimated figures. The actual source of distributions for the year ended September 30, 2017 will be calculated in connection with the Company’s year-end procedures. |
The Company makes certain adjustments to the classification of stockholders’ equity as a result of permanent book-to-tax differences, which include disallowed net operating loss carryforwards, amortization of deferred offering expenses and expense reimbursement from Adviser. To the extent these differences are permanent, they are charged or credited to capital in excess of par or accumulated net investment loss, as appropriate.
For the year ended September 30, 2017, permanent difference was related to $0.6 million of amortization of deferred offering expenses. For the year ended September 30, 2016, permanent differences were related $2.8 million of disallowed net operating loss carryforwards, $1.7 million of amortization of deferred offering expenses and $2.3 million of expense reimbursement from Adviser.
As of September 30, 2017 and 2016, the Company did not have differences between book basis and tax basis cost of investments.
Note 7. Directors’ Fees
The Company’s directors who do not serve in an executive officer capacity for the Company or Terra Income Advisors are entitled to receive annual cash retainer fees, fees for attending board and committee meetings and annual fees for serving as a committee chairperson. These directors receive an annual fee of $20,000, plus $2,500 for each board meeting attended in person, $1,000 for each board meeting attended via teleconference and $1,000 for each committee meeting attended. In addition, the chairman of the audit committee receives an annual fee of $7,500 and the chairman of each of the nominating and corporate governance and the valuation committees, and any other committee, receives an annual fee of $2,500 for their additional services. For the years ended September 30, 2017, 2016 and 2015, the Company recorded $0.1 million, $0.1 million and $0.1 million for directors’ fees expense, respectively.
The Company will also reimburse each of the above directors for all reasonable and authorized business expenses in accordance with the Company policies as in effect from time to time, including reimbursement of reasonable out-of-pocket expenses incurred in connection with attending each board meeting and each committee meeting not held concurrently with a board meeting.
The Company does not pay compensation to the directors who also serve in an executive officer capacity for the Company or Terra Income Advisors.
Note 8. Capital
The Company entered into a stock purchase agreement with Terra Capital Partners, the Company’s sponsor. On September 19, 2014, pursuant to a private placement, Terra Capital Partners contributed cash consideration of $125,000 to purchase approximately 11,111 shares of common stock at $11.25 per share. On October 20, 2014, pursuant to a private placement, Terra Capital Partners contributed an additional $50,000 in cash to purchase approximately 4,445 additional shares of common stock at $11.25 per share. As of September 30, 2017, the Company had 7,530,130 shares of common stock outstanding.
On February 25, 2015, the Board determined to change the initial offering price from $10.00 per share to $12.50 per share. As a result, on February 26, 2015, the Company effected a reverse stock split to account for the change in the Company’s offering price since the initial investment by Terra Capital Partners. As such, all share references reflect this reverse stock split.
On May 1, 2015, Terra Capital Partners contributed cash of $275,000 to purchase approximately 24,444 additional shares from the Offering at a per share price of $11.25, which price represents the public offering price of $12.50 per share, net of selling commissions, broker-dealer fees and dealer manager fees. This contribution, in addition to the initial capital contributions, fulfilled Terra Capital Partners’ commitment to contribute total seed capitalization of $450,000.
F-25
On November 11, 2015, and effective December 1, 2015, the Board approved a change to a certain aspect of the Company’s share pricing policy such that, once it raised gross offering proceeds in excess of $125 million, or prior to then in the sole discretion of the Board, in the event of a material decline in NAV per share, which the Company’s considers to be a 2.5% decrease below the then-current net offering price, the Company will reduce the offering price to establish a new net offering price not more than 2.5% above the NAV per share.
On January 13, 2017, the Company decreased the public offering price of its common stock from $12.50 per share to $10.90 per share. The decrease in the public offering price was effective as of the Company’s January 17, 2017 bi-monthly closing and first applied to subscriptions received from January 1, 2017 through January 16, 2017.
As of September 30, 2017, the Company had unsettled subscription proceeds of $0.2 million, which is reflected as payable for unsettled stock subscriptions on the Company’s statements of assets and liabilities.
Note 9. Net Increase (Decrease) in Net Assets
Income (loss) per share is computed by dividing income (loss) available to common stockholders by the weighted average number of shares outstanding during the period. Other potentially dilutive shares, and the related impact to earnings, are considered when calculating earnings per share on a diluted basis. As of September 30, 2017, 2016 and 2015, there were no dilutive shares.
The following information sets forth the computation of the weighted average net increase (decrease) in net assets per share from operations for the years ended September 30, 2017, 2016 and 2015:
Years Ended September 30, | ||||||||||||
Basic | 2017 | 2016 | 2015 | |||||||||
Net increase (decrease) in net assets resulting from operations | $ | 1,282,924 | $ | (2,316,160 | ) | $ | 6,194 | |||||
Weighted average common shares outstanding (1) | 5,691,428 | 2,478,624 | 462038 | |||||||||
Net increase (decrease) in net assets per share resulting from operations | $ | 0.23 | $ | (0.93 | ) | $ | 0.01 | |||||
(1) | Weighted average common shares outstanding for the year ended September 30, 2015 was based on shares outstanding from June 24, 2015 (date that the Minimum Offering Requirement was met) through September 30, 2015. |
Note 10. Distributions
Distributions from net investment income and capital gain distributions are determined in accordance with U.S. federal income tax regulations, which differ from U.S. GAAP.
The following table reflects the Company’s distributions for the years ended September 30, 2017, 2016 and 2015:
Record Date | Payment Date | Per Share Per Day | Distributions Paid in Cash | Distributions Paid through the DRIP | Total Distributions Paid/Accrued | |||||||||||||
Year Ended September 30, 2017 | ||||||||||||||||||
October 20, 2016 | October 31, 2016 | $ | 0.002733 | $ | 237,090 | $ | 123,938 | $ | 361,028 | |||||||||
November 20, 2016 | November 30, 2016 | 0.002733 | 242,959 | 123,376 | 366,335 | |||||||||||||
December 20, 2016 | December 31, 2016 | 0.002733 | 264,315 | 132,250 | 396,565 | |||||||||||||
January 20, 2017 | January 31, 2017 | 0.002389 | 245,151 | 120,219 | 365,370 | |||||||||||||
February 20, 2017 | February 28, 2017 | 0.002389 | 229,907 | 113,350 | 343,257 | |||||||||||||
March 20, 2017 | March 31, 2017 | 0.002389 | 269,633 | 130,692 | 400,325 | |||||||||||||
April 20, 2017 | April 30, 2017 | 0.002389 | 274,065 | 136,743 | 410,808 | |||||||||||||
May 20, 2017 | May 31, 2017 | 0.002389 | 296,817 | 151,121 | 447,938 | |||||||||||||
June 20, 2017 | June 30, 2017 | 0.002389 | 311,708 | 153,637 | 465,345 | |||||||||||||
July 20, 2017 | July 31, 2017 | 0.002389 | 335,112 | 164,935 | 500,047 | |||||||||||||
August 20, 2017 | August 31, 2017 | 0.002389 | 346,753 | 172,852 | 519,605 | |||||||||||||
September 20, 2017 | September 30, 2017 | 0.002389 | 349,401 | 173,170 | 522,571 | |||||||||||||
$ | 3,402,911 | $ | 1,696,283 | $ | 5,099,194 | |||||||||||||
F-26
Record Date | Payment Date | Per Share Per Day | Distributions Paid in Cash | Distributions Paid through the DRIP | Total Distributions Paid/Accrued | |||||||||||||
Year Ended September 30, 2016 | ||||||||||||||||||
October 20, 2015 | October 31, 2015 | $ | 0.002740 | $ | 56,467 | $ | 27,330 | $ | 83,797 | |||||||||
November 20, 2015 | November 30, 2015 | 0.002740 | 66,042 | 37,026 | 103,068 | |||||||||||||
December 20, 2015 | December 31, 2015 | 0.002740 | 85,246 | 49,294 | 134,540 | |||||||||||||
January 20, 2016 | January 31, 2016 | 0.002733 | 104,209 | 61,892 | 166,101 | |||||||||||||
February 20, 2016 | February 29, 2016 | 0.002733 | 109,923 | 66,508 | 176,431 | |||||||||||||
March 20, 2016 | March 31, 2016 | 0.002733 | 122,410 | 74,913 | 197,323 | |||||||||||||
April 20, 2016 | April 30, 2016 | 0.002733 | 120,402 | 71,051 | 191,453 | |||||||||||||
May 20, 2016 | May 31, 2016 | 0.002733 | 137,203 | 80,646 | 217,849 | |||||||||||||
June 20, 2016 | June 30, 2016 | 0.002733 | 164,498 | 96,964 | 261,462 | |||||||||||||
July 20, 2016 | July 31, 2016 | 0.002733 | 186,208 | 112,114 | 298,322 | |||||||||||||
August 20, 2016 | August 31, 2016 | 0.002733 | 201,876 | 116,537 | 318,413 | |||||||||||||
September 20, 2016 | September 30, 2016 | 0.002733 | 209,254 | 116,629 | 325,883 | |||||||||||||
$ | 1,563,738 | $ | 910,904 | $ | 2,474,642 | |||||||||||||
Record Date | Payment Date | Per Share Per Day | Distributions Paid in Cash | Distributions Paid through the DRIP | Total Distributions Paid/Accrued | |||||||||||||
Year Ended September 30, 2015 | ||||||||||||||||||
July 20, 2015 | July 31, 2015 | $ | 0.002740 | $ | 21,319 | $ | 4,764 | $ | 26,083 | |||||||||
August 24, 2015 | August 31, 2015 | 0.002740 | 27,463 | 8,554 | 36,017 | |||||||||||||
September 24, 2015 | September 30, 2015 | 0.002740 | 42,757 | 20,283 | 63,040 | |||||||||||||
$ | 91,539 | $ | 33,601 | $ | 125,140 | |||||||||||||
Note 12. Selected Quarterly Financial Data (unaudited)
Three Months Ended | ||||||||||||||||
September 30, 2017 | June 30, 2017 | March 31, 2017 | December 31, 2016 | |||||||||||||
Total investment income (1) | $ | 1,869,522 | $ | 313,120 | $ | 1,677,618 | $ | 1,397,465 | ||||||||
Total operating expenses (1) | 903,539 | 654,573 | 1,851,433 | 1,954,191 | ||||||||||||
Less: Expense Reimbursement from Adviser | — | — | — | — | ||||||||||||
Less: Reduction of offering costs (2) | — | (944,248 | ) | — | — | |||||||||||
Net operating expenses | 903,539 | (289,675 | ) | 1,851,433 | 1,954,191 | |||||||||||
Net investment income (loss) | 965,983 | 602,795 | (173,815 | ) | (556,726 | ) | ||||||||||
Net change in unrealized appreciation on investments | 58,838 | 37,569 | 32,601 | 287,912 | ||||||||||||
Net change unrealized appreciation on obligations under participation agreements | 4,376 | 55,080 | 44,276 | (75,965 | ) | |||||||||||
Net increase (decrease) in net assets resulting from operations | $ | 1,029,197 | $ | 695,444 | $ | (96,938 | ) | $ | (344,779 | ) | ||||||
Net investment income (loss) per share | $ | 0.14 | $ | 0.10 | $ | (0.03 | ) | $ | (0.12 | ) | ||||||
Net increase (decrease) in net assets resulting from operations per share | $ | 0.15 | $ | 0.11 | $ | (0.02 | ) | $ | (0.08 | ) | ||||||
Net asset value per share at period end | $ | 10.00 | $ | 9.62 | $ | 9.7 | $ | 9.92 | ||||||||
F-27
Three Months Ended | ||||||||||||||||
September 30, 2016 | June 30, 2016 | March 31, 2016 | December 31, 2015 | |||||||||||||
Total investment income | $ | 1,027,797 | $ | 915,997 | $ | 828,358 | $ | 244,547 | ||||||||
Total operating expenses | 1,415,041 | 1,774,705 | 1,612,647 | 1,246,861 | ||||||||||||
Less: Expense Reimbursement from Adviser | — | — | — | (576,755 | ) | |||||||||||
Net operating expenses | 1,415,041 | 1,774,705 | 1,612,647 | 670,106 | ||||||||||||
Net investment loss | (387,244 | ) | (858,708 | ) | (784,289 | ) | (425,559 | ) | ||||||||
Net change in unrealized appreciation on investments | (347,642 | ) | 539,854 | — | — | |||||||||||
Net change in unrealized appreciation on obligations under participation agreements | 275,872 | (328,444 | ) | — | — | |||||||||||
Net decrease in net assets resulting from operations | $ | (459,014 | ) | $ | (647,298 | ) | $ | (784,289 | ) | $ | (425,559 | ) | ||||
Net investment income per share | $ | (0.10 | ) | $ | (0.32 | ) | $ | (0.36 | ) | $ | (0.33 | ) | ||||
Net increase in net assets resulting from operations per share | $ | (0.12 | ) | $ | (0.24 | ) | $ | (0.36 | ) | $ | (0.33 | ) | ||||
Net asset value per share at period end | $ | 10.06 | $ | 10.19 | $ | 10.24 | $ | 10.71 | ||||||||
(1) | For the three months ended June 30, 2017, the Company suspended interest income accrual of $0.7 million on two loans, and wrote off $0.5 million of past due interest receivables and $0.3 million of exit fee accruals because recovery of such income and fee was doubtful. Under the terms of the participation agreements, the Company is not obligated to pay the participants their share of the interest income if the borrowers defaulted on their obligations. As a result, for the three months ended June 30, 2017, the Company suspended interest expense accrual of $0.5 million on this loan, and wrote off $0.4 million of interest payable and $0.1 million of exit fee accruals because it is highly unlikely that the Company would recover the interest income and exit fee from the borrower to make such payments. In July 2017, the loan was repaid in full, at which time the Company repaid the obligation under participation agreement in full. |
(2) | Subsequent to March 31, 2017 and in response to the general trend in capital raising for non-traded direct participation programs, the Company determined that it is highly unlikely that it will raise capital in an amount sufficient for all cumulative offering costs incurred by Terra Income Advisors to be reimbursed. Accordingly, the Company reduced the estimated amount payable to Terra Income Advisors for cumulative organization and offering costs incurred by $1.4 million for the three months ended June 30, 2017, of which $0.9 million was recorded as Reduction of offering costs on the statements of operations and $0.5 million was recorded as a reduction to Due to Adviser, net on the statements of assets and liabilities. |
F-28
Note 11. Financial Highlights
The following is a schedule of financial highlights for the years ended September 30, 2017 and 2016 and for the period from June 24, 2015 (date that the Minimum Offering Requirement was met) through September 30, 2015:
Year Ended September 30, 2017 | Year Ended September 30, 2016 | For the period from June 24, 2015 (date the Minimum Offering Requirement was met) through September 30, 2015 | ||||||||||
Per share data: | ||||||||||||
Net asset value at beginning of period | $ | 10.06 | $ | 10.97 | $ | 10.97 | ||||||
Results of operations (1): | ||||||||||||
Net investment income (loss) | 0.15 | (0.99 | ) | 0.05 | ||||||||
Net change in unrealized appreciation on investments | 0.08 | 0.08 | — | |||||||||
Net change in unrealized appreciation on obligations under participation agreements | — | (0.02 | ) | — | ||||||||
Net increase (decrease) in net assets resulting from operations | 0.23 | (0.93 | ) | 0.05 | ||||||||
Stockholder distributions (2): | ||||||||||||
Distributions from return of capital | (0.81 | ) | (1.00 | ) | (0.27 | ) | ||||||
Distributions from net investment income | (0.08 | ) | — | — | ||||||||
Net decrease in net assets resulting from stockholder distributions | (0.89 | ) | (1.00 | ) | (0.27 | ) | ||||||
Capital share transactions: | ||||||||||||
Reduction of transaction charges (Note 4) (3) | 0.42 | — | — | |||||||||
Other (4) | 0.18 | 1.02 | 0.22 | |||||||||
Net increase in net assets resulting from capital share transactions | 0.60 | 1.02 | 0.22 | |||||||||
Net asset value, end of period | $ | 10.00 | $ | 10.06 | $ | 10.97 | ||||||
Shares outstanding at end of period | 7,530,130 | 4,222,358 | 926,357 | |||||||||
Total return (5) | 8.10 | % | (0.26 | )% | (10.36 | )% | ||||||
Ratio/Supplemental data: | ||||||||||||
Net assets, end of period | $ | 75,334,293 | $ | 42,474,748 | $ | 10,161,072 | ||||||
Ratio of net investment income (loss) to average net assets (6) | 1.47 | % | (9.30 | )% | 1.33 | % | ||||||
Ratio of operating expenses to average net assets (6) | 7.73 | % | 20.73 | % | 2.81 | % | ||||||
Portfolio turnover | 33.06 | % | — | — | ||||||||
(1) | The per share data was derived by using the weighted average shares outstanding during the applicable period. |
(2) | The per share data for distributions reflects the actual amount of distributions declared per share during the period. |
(3) | Amount is calculated based on total shares outstanding as of September 30, 2017. |
(4) | The continuous issuance of shares of common stock in the Offering as well as pursuant to the DRIP may cause an incremental increase in net asset value per share due to the sale of shares at the then prevailing public offering price and the receipt of net proceeds per share by the Company in excess of the net asset value per share on each subscription closing date. In addition, the timing of the Company’s sales of shares during the year also impacted the net asset value per share. |
(5) | Total return is calculated assuming a purchase of shares of common stock at the current net asset value on the first day and a sale at the current net asset value on the last day of the periods reported. Distributions, if any, are assumed for purposes of this calculation to be reinvested at prices obtained under the DRIP. |
(6) | For the year ended September 30, 2017, excluding the reduction of offering costs, the ratios of net investment loss and operating expenses to average net assets are (0.19)% and 9.38%, respectively. For the year ended September 30, 2016 and the period ended September 30, 2015, excluding the expense support and conditional reimbursement, the ratio of net investment |
F-29
loss to average net assets was (11.49)% and (13.82)%, respectively, and the ratio of operating expenses to average net assets were 22.91% and 77.96%, respectively.
Note 13. Subsequent Events
The management of the Company has evaluated events and transactions through the date the financial statements were issued, and has determined that there are no material events that would require adjustment to or disclosure in the Company’s financial statements other than those listed below.
From October 1, 2017 through November 20, 2017, the Company has issued 406,037 shares of common stock including shares issued pursuant to the DRIP. Total gross proceeds from these issuances including proceeds from shares issued pursuant to the DRIP were $4.2 million.
F-30
Item 15. Exhibits and Financial Statement Schedules
The following documents are filed as part of this annual report on Form 10-K:
(1) Financial Statements
Terra Income Fund 6, Inc. Financial Statements:
Page | ||
Financial Statements: | ||
(2) Financial Statement Schedule
None
(3) Exhibits
Exhibit No. | Description and Method of Filing | |
3.1 | ||
3.2 | ||
4.1 | ||
4.2 | ||
10.1* | ||
10.2* | ||
10.3* | ||
31.1* | ||
31.2* | ||
32.1* | ||
* Filed herewith.
65
SIGNATURES
Pursuant to the requirements of Section 13 or 15(d) of the Securities Exchange Act of 1934, the registrant has duly caused this Annual Report on Form 10-K to be signed on its behalf by the undersigned, thereunto duly authorized.
Date: November 20, 2017
TERRA INCOME FUND 6, INC. | |
By: | /s/ Bruce D. Batkin |
Bruce D. Batkin | |
Chief Executive Officer | |
(Principal Executive Officer) | |
By: | /s/ Gregory M. Pinkus |
Gregory M. Pinkus | |
Chief Financial Officer, Chief Operating Officer, | |
Treasurer and Secretary | |
(Principal Financial and Accounting Officer) | |
Pursuant to the requirements of the Securities Exchange Act of 1934, this report has been signed below by the following persons on behalf of the registrant and in the capacities and on the dates indicated.
Signature | Title | Date | ||
/s/ Simon J. Mildé | Chairman and Director | November 20, 2017 | ||
Simon J. Mildé | ||||
/s/ Bruce D. Batkin | Director and Chief Executive Officer | November 20, 2017 | ||
Bruce D. Batkin | (Principal Executive Officer) | |||
/s/ Gregory M. Pinkus | Chief Financial Officer, Chief Operating Officer, Treasurer and Secretary (Principal Financial and Accounting Officer) | November 20, 2017 | ||
Gregory M. Pinkus | ||||
/s/ Jeffrey M. Altman | Director | November 20, 2017 | ||
Jeffrey M. Altman | ||||
/s/ Michael L. Evans | Director | November 20, 2017 | ||
Michael L. Evans | ||||
/s/ Robert E. Marks | Director | November 20, 2017 | ||
Robert E. Marks | ||||
66