Attached files
| file | filename |
|---|---|
| 8-K - 8-K - CUMULUS MEDIA INC | cmls09302017investorrelati.htm |

November 9, 2017
CUMULUS MEDIA INC.
2017 Third Quarter
Earnings Call Presentation

Safe Harbor Statement
Cautionary Note Regarding Forward-Looking Statements
Certain statements in this presentation may constitute “forward-looking” statements within the meaning of the Private Securities Litigation Reform
Act of 1995 and other federal securities laws. Such statements are statements other than historical fact and relate to our intent, belief or current
expectations, primarily with respect to our future operating, financial and strategic performance. Any such forward-looking statements are not
guarantees of future performance and involve risks and uncertainties. Actual results may differ from those contained in or implied by the forward-
looking statements as a result of various factors including, but not limited to, risks and uncertainties relating to the need for additional funds to
service our debt and to execute our business strategy; our need to restructure or refinance our debt and the terms on which any such restructuring
or refinancing may be completed, including through any court-approved restructuring; our ability to access borrowings under our revolving credit
facility; our ability from time to time to renew one or more of our broadcast licenses; changes in interest rates; changes in the fair value of our
investments; the timing of, and our ability to complete, any acquisitions or dispositions pending from time to time; costs and synergies resulting
from the integration of any completed acquisitions; our ability to effectively manage costs; our ability to effectively drive and manage growth; the
popularity of radio as a broadcasting and advertising medium; changing consumer tastes; the impact of general economic conditions in the United
States or in specific markets in which we currently do business; industry conditions, including existing competition and future competitive
technologies and cancellation, disruptions or postponements of advertising schedules in response to national or world events; our ability to
generate revenues from new sources, including local commerce and technology-based initiatives; the impact of regulatory rules or proceedings
that may affect our business or any acquisitions; our ability to successfully appeal the notice of delisting of our Class A common stock from the
NASDAQ stock market; the write-off of a material portion of the fair value of our FCC broadcast licenses and goodwill from time to time; or other
risk factors described from time to time in our filings with the Securities and Exchange Commission, including our Form 10-K for the year ended
December 31, 2016 (the “2016 Form 10-K”) and any subsequent filings. Many of these risks and uncertainties are beyond our control, and the
unexpected occurrence or failure to occur of any such events or matters could significantly alter the actual results of our operations or financial
condition. Cumulus Media Inc. assumes no responsibility to update any forward-looking statement as a result of new information, future events or
otherwise.

CUMULUS MEDIA INC.
2017 Third Quarter
Earnings Call Presentation

• Third quarter results reflect further positive
momentum
• Net revenue and Adjusted EBITDA
increased for the second quarter in a row
• Foundational initiatives continue to
contribute to outperformance
• New strategies and innovations setting up
longer-term growth opportunities
Key
Highlights

Three Months Ended September 30,
($ in millions) 2017 2016 % Change
Net revenue 287.2$ 286.1$ 0.4%
Net income (1) 1.3$ 46.3$ (97.2%)
Adjusted EBITDA (2),(3) 61.8$ 43.9$ 40.7%
(1) Three months ended September 30, 2016 was impacted positively by an approximately $94.0 million gain on
sale of assets, predominantly driven by the sale of Los Angeles real estate.
(2) Adjusted EBITDA is not a financial measure calculated or presented in accordance with accounting principles
generally accepted in the United States of America ("GAAP"). For additional information, see the Appendix to this
presentation.
(3) Three months ended September 30, 2016 includes the impact of $14.4 million of expenses incurred to resolve
previously disputed syndicated programming and network inventory relationships with CBS Radio Inc.
Excluding these amounts, Adjusted EBITDA for the three months ended September 30, 2017 would have increased
by 6.0% year-over-year.
Consolidated Financial Overview

Three Months Ended September 30,
($ in millions) 2017 2016 % Change
Net revenue 202.9$ 206.2$ (1.6%)
Net income (1) 42.7$ 134.1$ (68.2%)
Adjusted EBITDA (2) 54.7$ 56.2$ (2.8%)
(1) Three months ended September 30, 2016 was impacted positively by an approximately $94.0 million gain on
sale of assets, predominantly driven by the sale of Los Angeles real estate.
(2) Adjusted EBITDA is not a financial measure calculated or presented in accordance with GAAP. For additional
information, see the Appendix to this presentation.
Segment Performance - RSG
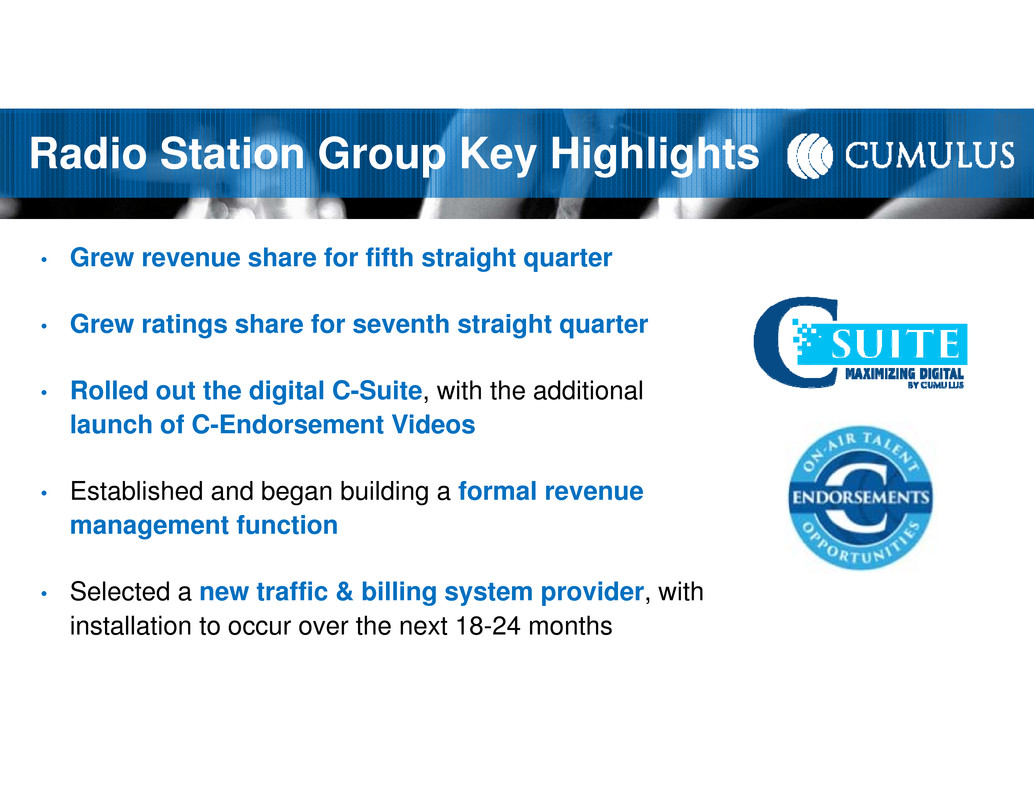
Radio Station Group Key Highlights
• Grew revenue share for fifth straight quarter
• Grew ratings share for seventh straight quarter
• Rolled out the digital C-Suite, with the additional
launch of C-Endorsement Videos
• Established and began building a formal revenue
management function
• Selected a new traffic & billing system provider, with
installation to occur over the next 18-24 months
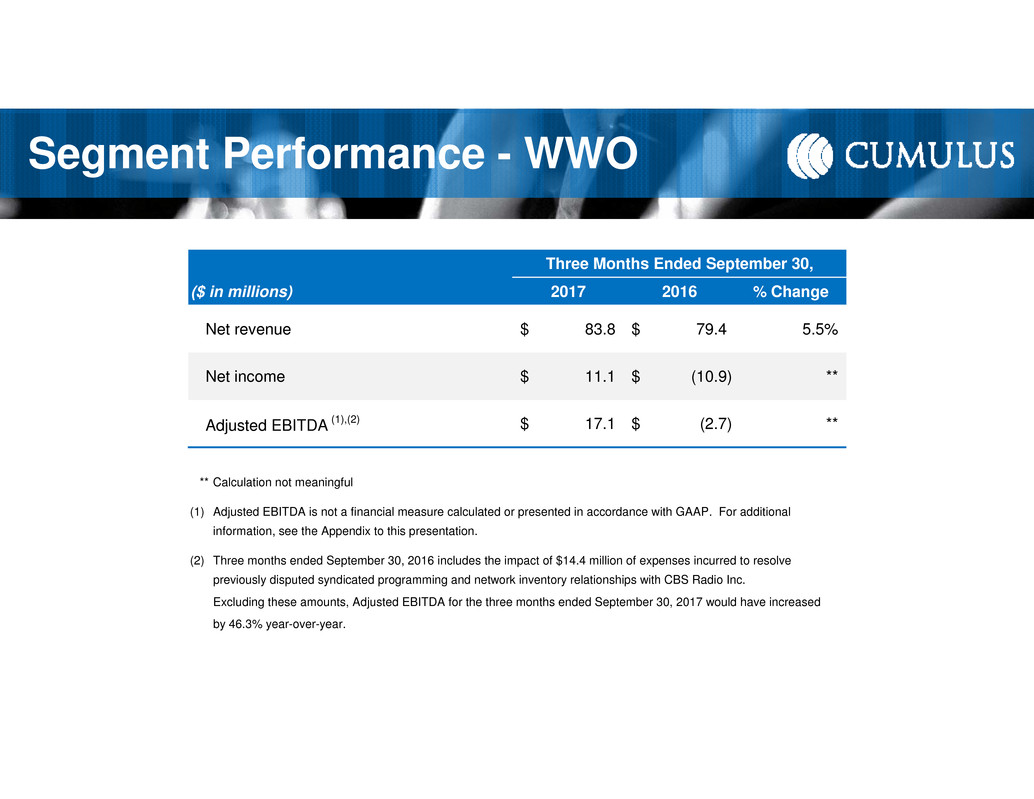
Three Months Ended September 30,
($ in millions) 2017 2016 % Change
Net revenue 83.8$ 79.4$ 5.5%
Net income 11.1$ (10.9)$ **
Adjusted EBITDA (1),(2) 17.1$ (2.7)$ **
** Calculation not meaningful
(1) Adjusted EBITDA is not a financial measure calculated or presented in accordance with GAAP. For additional
information, see the Appendix to this presentation.
(2) Three months ended September 30, 2016 includes the impact of $14.4 million of expenses incurred to resolve
previously disputed syndicated programming and network inventory relationships with CBS Radio Inc.
Excluding these amounts, Adjusted EBITDA for the three months ended September 30, 2017 would have increased
by 46.3% year-over-year.
Segment Performance - WWO

Westwood One Key Highlights
• Grew revenue share for third straight quarter
• Benefited from NASH Next and Next2Rock franchises,
which contributed to revenue and Adjusted EBITDA
• Announced industry-leading data partnerships,
under the OneWay brand, to increase targeting and
attribution measurement
• Launched the Westwood One ROI Guarantee, the
first ever ROI guarantee in the audio industry
• Continued to grow podcast portfolio, which is now a
multi-million dollar top-line business

Westwood One Key Highlights
NEWS/TALK
ENTERTAINMENT
SPORTS
• Grew revenue share for third straight quarter
• Benefited from NASH Next and Next2Rock franchises,
which contributed to revenue and Adjusted EBITDA
• Announced industry-leading data partnerships,
under the OneWay brand, to increase targeting and
attribution measurement
• Launched the Westwood One ROI Guarantee, the
first ever ROI guarantee in the audio industry
• Continued to grow podcast portfolio, which is now a
multi-million dollar top-line business

• Q4 2017 comparison will be negatively
impacted by ~$9 million of political revenue
in Q4 2016
• Company is currently pacing down low
single digits, impacted by the political
comparison; excluding political, pacing is
almost flat
Q4 2017
Outlook

Balance Sheet Update
• Continuing to focus on addressing our debt levels to achieve the full potential of
our assets over the long term
• Have been in private discussions with both of our creditor groups with
assistance of outside legal and financial advisors
• Chose to forgo the November 1st bond interest payment and enter into a 30-day
grace period in furtherance of this effort
• Exploring all available options with a focus on maintaining the momentum of the
turnaround effort

Third Quarter 2017
Financial Results
See Press Release and 10-Q for More Detail
www.cumulus.com/investors


APPENDIX:
Financial Summary &
Reconciliation to Non-GAAP Term

Non-GAAP Financial Measure
Definition of Adjusted EBITDA
Adjusted EBITDA is the financial metric utilized by management to analyze the cash flow generated by our business. This measure isolates the
amount of income generated by our core operations before the incurrence of corporate expenses. Management also uses this measure to
determine the contribution of our core operations to the funding of our corporate resources utilized to manage our operations and our non-operating
expenses including debt service. In addition, Adjusted EBITDA is a key metric for purposes of calculating and determining our compliance with
certain covenants contained in our credit facility. We define Adjusted EBITDA as net income (loss) before any non-operating expenses, including
depreciation and amortization, stock-based compensation expense, gain or loss on sale of assets or stations (if any), gain or loss on derivative
instruments (if any), impairment of assets (if any), acquisition-related and restructuring costs (if any) and franchise and state taxes. In deriving this
measure, management excludes depreciation, amortization, and stock-based compensation expense, as these do not represent cash payments for
activities directly related to our core operations. Management excludes any gain or loss on the exchange or sale of any assets or stations and any
gain or loss on derivative instruments as they do not represent cash transactions nor are they associated with core operations. Expenses relating
to acquisitions and restructuring costs are also excluded from the calculation of Adjusted EBITDA as they are not directly related to our core
operations. Management excludes any non-cash costs associated with impairment of assets as they do not require a cash outlay. Management
believes that Adjusted EBITDA, although not a measure that is calculated in accordance with GAAP, nevertheless is commonly employed by the
investment community as a measure for determining the market value of media companies. Management has also observed that Adjusted EBITDA
is routinely employed to evaluate and negotiate the potential purchase price for media companies and is a key metric for purposes of calculating
and determining compliance with certain covenants in our credit facility. Given the relevance to our overall value, management believes that
investors consider the metric to be extremely useful.
Adjusted EBITDA should not be considered in isolation or as a substitute for net income, operating income, cash flows from operating activities or
any other measure for determining the Company’s operating performance or liquidity that is calculated in accordance with GAAP. In addition,
Adjusted EBITDA may be defined or calculated differently by other companies and comparability may be limited.
3rd Quarter 2017 Adjusted EBITDA
Reconciliation Table
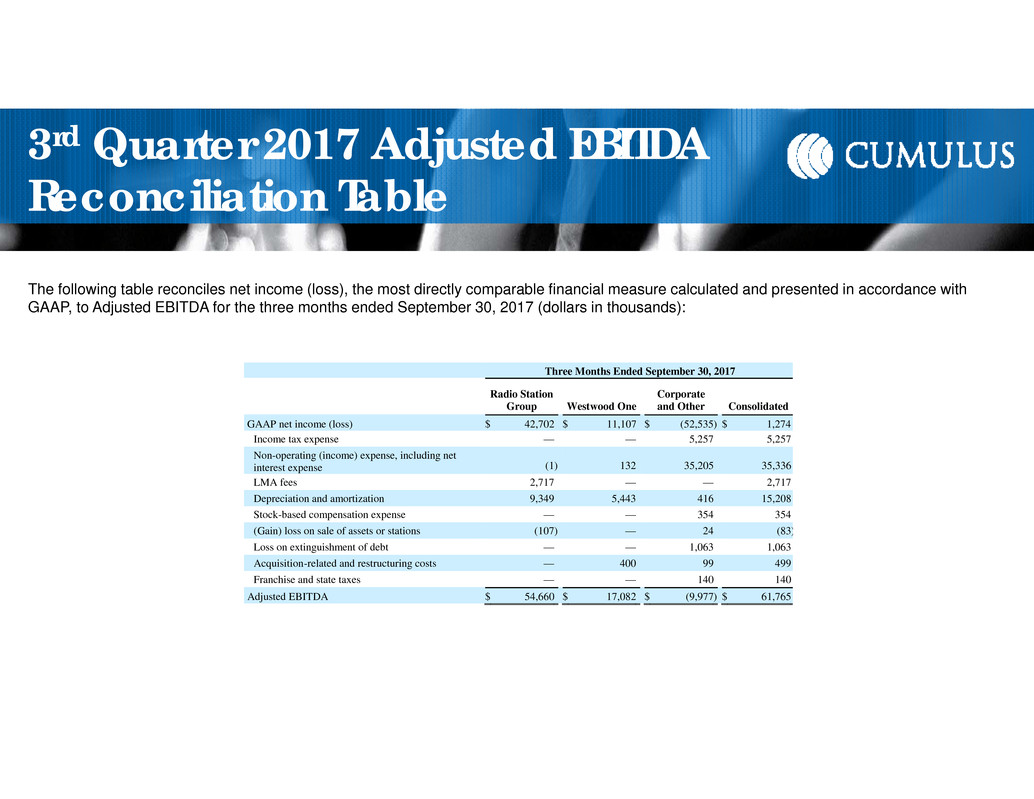
The following table reconciles net income (loss), the most directly comparable financial measure calculated and presented in accordance with
GAAP, to Adjusted EBITDA for the three months ended September 30, 2017 (dollars in thousands):
Three Months Ended September 30, 2017
Radio Station
Group Westwood One
Corporate
and Other Consolidated
GAAP net income (loss) $ 42,702 $ 11,107 $ (52,535) $ 1,274
Income tax expense — — 5,257 5,257
Non-operating (income) expense, including net
interest expense (1) 132
35,205 35,336
LMA fees 2,717 — — 2,717
Depreciation and amortization 9,349 5,443 416 15,208
Stock-based compensation expense — — 354 354
(Gain) loss on sale of assets or stations (107) — 24 (83)
Loss on extinguishment of debt — — 1,063 1,063
Acquisition-related and restructuring costs — 400 99 499
Franchise and state taxes — — 140 140
Adjusted EBITDA $ 54,660 $ 17,082 $ (9,977) $ 61,765
3rd Quarter 2016 Adjusted EBITDA
Reconciliation Table
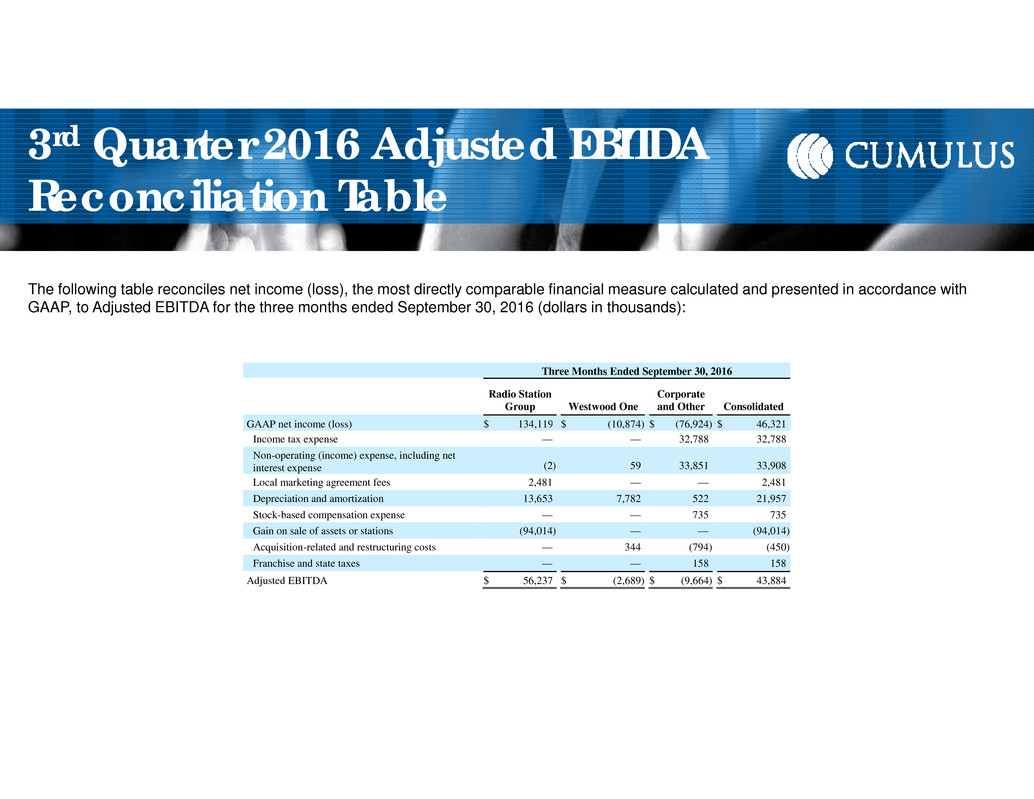
The following table reconciles net income (loss), the most directly comparable financial measure calculated and presented in accordance with
GAAP, to Adjusted EBITDA for the three months ended September 30, 2016 (dollars in thousands):
Three Months Ended September 30, 2016
Radio Station
Group Westwood One
Corporate
and Other Consolidated
GAAP net income (loss) $ 134,119 $ (10,874) $ (76,924) $ 46,321
Income tax expense — — 32,788 32,788
Non-operating (income) expense, including net
interest expense (2) 59
33,851 33,908
Local marketing agreement fees 2,481 — — 2,481
Depreciation and amortization 13,653 7,782 522 21,957
Stock-based compensation expense — — 735 735
Gain on sale of assets or stations (94,014) — — (94,014)
Acquisition-related and restructuring costs — 344 (794) (450)
Franchise and state taxes — — 158 158
Adjusted EBITDA $ 56,237 $ (2,689) $ (9,664) $ 43,884
