Attached files
| file | filename |
|---|---|
| EX-32.2 - EX-32.2 - CHASE CORP | ccf-20170831ex322d90466.htm |
| EX-32.1 - EX-32.1 - CHASE CORP | ccf-20170831ex321e9a85e.htm |
| EX-31.2 - EX-31.2 - CHASE CORP | ccf-20170831ex3120fb53f.htm |
| EX-31.1 - EX-31.1 - CHASE CORP | ccf-20170831ex311e5b00d.htm |
| EX-23.1 - EX-23.1 - CHASE CORP | ccf-20170831ex2310e7385.htm |
| EX-21 - EX-21 - CHASE CORP | ccf-20170831ex21f0f261a.htm |
| EX-10.10.8 - EX-10.10.8 - CHASE CORP | ccf-20170831ex10108b2b2.htm |
UNITED STATES
SECURITIES AND EXCHANGE COMMISSION
Washington, D.C. 20549
FORM 10‑K
ANNUAL REPORT PURSUANT TO SECTION 13 OR 15 (d)
OF THE SECURITIES EXCHANGE ACT OF 1934
For the fiscal year ended August 31, 2017
Commission File Number: 1‑9852
CHASE CORPORATION
(Exact name of registrant as specified in its charter)
|
Massachusetts |
11‑1797126 |
|
(State or other jurisdiction of incorporation of organization) |
(I.R.S. Employer Identification No.) |
295 University Avenue, Westwood, Massachusetts 02090
(Address of Principal Executive Offices, Including Zip Code)
(781) 332-0700
(Registrant’s Telephone Number, Including Area Code)
Securities registered pursuant to section 12(b) of the Act:
|
Title of Each Class: |
Name of Each Exchange on Which Registered |
|
Common Stock |
NYSE American |
Securities registered pursuant to section 12(g) of the Act: None
Indicate by check mark if the registrant is a well‑known seasoned issuer (as defined in Rule 405 of the Securities Act). YES ☐ NO ☒
Indicate by check mark if the registrant is not required to file reports pursuant to Section 13 or Section 15(d) of the Exchange Act. YES ☐ NO ☒
Indicate by check mark whether the registrant (1) has filed all reports required to be filed by Section 13 or 15(d) of the Securities Exchange Act of 1934 during the preceding 12 months, and (2) has been subject to such filing requirements for the past 90 days. YES ☒ NO ☐
Indicate by check mark whether the registrant has submitted electronically and posted on its corporate Web site, if any, every Interactive Data File required to be submitted and posted pursuant to Rule 405 of Regulation S‑T (§232.405 of this chapter) during the preceding 12 months (or for such shorter period that the registrant was required to submit and post such files). YES ☒ NO ☐
Indicate by check mark if disclosure of delinquent filers pursuant to Item 405 of Regulation S‑K is not contained herein, and will not be contained, to the best of registrant’s knowledge, in definitive proxy or information statements incorporated by reference in Part III of this Form 10‑K or any amendment to this Form 10‑K. ☒
Indicate by checkmark whether the registrant is a large accelerated filer, an accelerated filer, a non‑accelerated filer or a smaller reporting company. See the definitions of “large accelerated filer”, “accelerated filer”, “smaller reporting company” and "emerging growth company" in Rule 12b‑2 of the Exchange Act.
|
Large accelerated filer ☐ |
Accelerated filer ☒ |
||||
|
Non-accelerated filer ☐ (Do not check if a smaller reporting company) |
Smaller reporting company ☐ |
||||
|
Emerging growth company ☐ |
|
||||
If an emerging growth company, indicate by check mark if the registrant has elected not to use the extended transition period for complying with any new or revised financial accounting standards provided pursuant to Section 13(a) of the Exchange Act. ☐
Indicate by checkmark whether the registrant is a shell company (as defined in Rule 12b‑2 of the Exchange Act). YES ☐ NO ☒
The aggregate market value of the common stock held by non‑affiliates of the registrant, as of February 28, 2017 (the last business day of the registrant’s second quarter of fiscal 2017), was approximately $653,152,000.
As of October 31, 2017, the Company had outstanding 9,364,936 shares of common stock, $0.10 par value, which is its only class of common stock.
Documents Incorporated By Reference:
Portions of the registrant’s definitive proxy statement for the Annual Meeting of Shareholders, which is expected to be filed within 120 days after the registrant’s fiscal year ended August 31, 2017, are incorporated by reference into Part III hereof.
CHASE CORPORATION
INDEX TO ANNUAL REPORT ON FORM 10-K
For the Year Ended August 31, 2017
|
|
|
|
Page No. |
|
Cautionary Note Concerning Forward-Looking Statements |
|
2 | |
|
|
|
|
|
|
|
|
|
|
|
|
3 | ||
|
|
9 | ||
|
|
11 | ||
|
|
12 | ||
|
|
13 | ||
|
|
13 | ||
|
|
13 | ||
|
|
|
|
|
|
|
|
|
|
|
|
14 | ||
|
|
16 | ||
|
Management’s Discussion and Analysis of Financial Condition and Results of Operations |
|
17 | |
|
|
32 | ||
|
|
33 | ||
|
Changes in and Disagreements with Accountants on Accounting and Financial Disclosure |
|
86 | |
|
|
86 | ||
|
|
86 | ||
|
|
|
|
|
|
|
|
|
|
|
|
87 | ||
|
|
87 | ||
|
Security Ownership of Certain Beneficial Owners and Management and Related Stockholder Matters |
|
87 | |
|
Certain Relationships and Related Transactions, and Director Independence |
|
87 | |
|
|
87 | ||
|
|
|
|
|
|
|
|
|
|
|
|
88 | ||
|
|
91 | ||
|
|
|
|
|
|
|
92 | ||
1
Cautionary Note Concerning Forward-Looking Statements
This Annual Report on Form 10-K contains "forward-looking statements" within the meaning of Section 21E of the Securities Exchange Act of 1934, as amended. These forward-looking statements made by Chase Corporation (the “Company,” “Chase,” “we,” or “us”), including without limitation forward-looking statements made under the caption “Management’s Discussion and Analysis of Financial Condition and Results of Operations,” involve risks and uncertainties. Any statements contained in this Annual Report that are not statements of historical fact may be deemed to be forward-looking statements. Forward-looking statements include, without limitation, statements as to our future operating results; seasonality expectations; plans for the development, utilization or disposal of manufacturing facilities; future economic conditions; our expectations as to legal proceedings; the effect of our market and product development efforts; and expectations or plans relating to the implementation or realization of our strategic goals and future growth, including through potential future acquisitions. Forward-looking statements may include, among other things, statements relating to future sales, earnings, cash flow, results of operations, use of cash and other measures of financial performance, as well as statements relating to future dividend payments. Other forward-looking statements may be identified through the use of words such as “believes,” “anticipates,” “may,” “should,” “will,” “plans,” “projects,” “expects,” “expectations,” “estimates,” “predicts,” “targets,” “forecasts,” “strategy,” and other words of similar meaning in connection with the discussion of future operating or financial performance. These statements are based on current expectations, estimates and projections about the industries in which we operate, and the beliefs and assumptions made by management. Because forward-looking statements relate to the future, they are subject to inherent risks, uncertainties and changes in circumstances that are difficult to predict. Accordingly, the Company’s actual results may differ materially from those contemplated by the forward-looking statements. Investors, therefore, are cautioned against relying on any of these forward-looking statements, which speak only as of the date the statement was made. They are neither statements of historical fact nor guarantees or assurances of future performance. Readers should refer to the discussions under Item 1A “Risk Factors” of this Annual Report on Form 10-K.
2
Primary Operating Divisions and Facilities and Industry Segments
Chase Corporation, founded in 1946, is a leading manufacturer of protective materials for high-reliability applications. Our strategy is to maximize the performance of our core businesses and brands while seeking future opportunities through strategic acquisitions. We are organized into two operating segments, an Industrial Materials segment and a Construction Materials segment. The segments are distinguished by the nature of the products we manufacture and how they are delivered to their respective markets. The Industrial Materials segment includes specified products that are used in, or integrated into, another company’s product, with demand typically dependent upon general economic conditions. The Construction Materials segment is principally composed of project-oriented product offerings that are primarily sold and used as "Chase" branded products. Our manufacturing facilities are distinct to their respective segments with the exception of our O’Hara Township, PA and Blawnox, PA facilities, which produce products related to both operating segments. A summary of our operating structure as of August 31, 2017 is as follows:
|
INDUSTRIAL MATERIALS SEGMENT |
|
|
|
|
|
|
|
Primary |
|
|
|
|
|
Manufacturing |
|
|
|
Key Products |
|
Locations |
|
Background/History |
|
Specialty tapes and related products for the electronic and telecommunications industries using the brand name Chase & Sons®.
|
|
Oxford, MA |
|
In August 2011, we relocated our manufacturing processes that had been previously conducted at our Webster, MA facility to this location. |
|
|
|
|
|
|
|
|
|
|
|
|
|
Advanced adhesives, sealants, and coatings for automotive and industrial applications that require specialized bonding, encapsulating, environmental protection, or thermal management functionality.
|
|
Woburn, MA Newark, CA
|
|
In September 2016, we acquired certain assets and the operations of Resin Designs, LLC, and entered leases in their existing manufacturing facilities in Massachusetts and California.
|
|
Laminated film foils for the electronics and cable industries and cover tapes essential to delivering semiconductor components via tape and reel packaging. |
|
Pawtucket, RI |
|
In June 2012, we acquired all of the capital stock of NEPTCO Incorporated, which operated facilities in Rhode Island, North Carolina and China. |
3
|
|
|
|
|
|
|
Key Products & Services |
|
Primary |
|
Background/History |
|
Protective conformal coatings under the brand name HumiSeal®, moisture protective electronic coatings sold to the electronics industry including circuitry used in automobiles and home appliances. |
|
Winnersh, Wokingham, England |
|
In October 2005, we acquired all of the capital stock of Concoat Holdings Ltd. and its subsidiaries. In 2006 Concoat was renamed HumiSeal Europe. |
|
|
|
|
|
|
4
|
CONSTRUCTION MATERIALS SEGMENT |
|
|
|
|
|
|
|
Primary |
|
|
|
|
|
Manufacturing |
|
|
|
Key Products |
|
Locations |
|
Background/History |
|
Protective pipe coating tapes and other protectants for valves, regulators, casings, joints, metals, concrete, and wood which are sold under the brand name Royston®, to oil companies, gas utilities and pipeline companies.
Rosphalt50® is a polymer additive that provides long-term cost-effective solutions in many applications such as waterproofing of approaches and bridges, ramps, race tracks, airports and specialty road applications.
|
|
Blawnox, PA |
|
The Royston business was acquired in the early 1970's. |
|
|
|
|
|
|
|
Technologically advanced products, including the brand Tapecoat®, for demanding anti-corrosion applications in the gas, oil and marine pipeline market segments, as well as tapes and membranes for roofing and other construction-related applications.
|
|
|
|
|
|
|
|
|
|
|
|
Specialized high-performance coating and lining systems used worldwide in liquid storage and containment applications. |
|
Houston, TX |
|
In September 2009, we acquired all of the outstanding capital stock of C.I.M. Industries Inc. (“CIM”). |
|
|
|
|
|
|
|
Waterproofing and corrosion protection systems for oil, gas and water pipelines, and a supplier to Europe, the Middle East and Southeast Asia. This facility joins Chase's North American-based Tapecoat® and Royston® brands to broaden the protective pipeline coatings product line and better address global demand.
The ServiWrap® product offering complements the portfolio of our pipeline protection tapes, coatings and accessories to extend our global customer base.
|
|
Rye, East Sussex, England |
|
In September 2007, we purchased certain product lines and a related manufacturing facility in Rye, East Sussex, England through our wholly-owned subsidiary, Chase Protective Coatings Ltd.
In December 2009, we acquired the full range of ServiWrap® pipeline protection products (“ServiWrap”) from Grace Construction Products Limited, a UK-based unit of W.R. Grace & Co. |
Other Business Developments
On April 3, 2017, Chase executed an agreement with an unrelated party to sell all inventory, machinery and equipment and intangible assets of the Company’s fiber optic cable components product line for proceeds of $3,858,000 net of transaction costs and following certain working capital adjustments. The resulting pre-tax gain on sale of $2,013,000 was recognized in the third quarter of fiscal 2017 as gain on sale of businesses within the consolidated statement of operations. Further, the purchaser entered a multiyear lease for a portion of the manufacturing space at the Company’s Granite Falls, NC facility. Chase will provide ongoing manufacturing and administrative support to the purchaser for which the Company will receive additional consideration upon the performance of services. The Company’s fiber optic cable components product line was formerly a part of the Company’s Industrial Materials operating segment.
On September 30, 2016, the Company acquired certain assets of Resin Designs, LLC (“Resin Designs”), an advanced adhesives and sealants manufacturer, with locations in Woburn, MA and Newark, CA. The business was acquired for a purchase price of $30,270,000 after final working capital adjustments and excluding acquisition-related costs. As part of this transaction, Chase acquired all working capital and fixed assets of the business, and entered multiyear leases at both locations. The Company expensed $584,000 of acquisition-related costs during the first quarter of fiscal 2017 associated with this acquisition. The purchase was funded entirely with available cash on hand. Resin Designs is a formulator of customized adhesive and sealant systems used in high-reliability electronic applications. The acquisition broadens the Company’s adhesives and sealants product offering and manufacturing capabilities, and expands its market reach. Since
5
the effective date of the acquisition, the financial results of Resin Designs’ operations have been included in the Company’s financial statements within the electronic and industrial coatings product line, contained within the Industrial Materials operating segment.
On June 23, 2016 (the fourth quarter of fiscal 2016), the Company acquired all the capital stock of Spray Products (India) Private Limited for $1,161,000, net of cash acquired. This acquired business works closely with our HumiSeal® coating manufacturing operation in Winnersh, Wokingham, England. The acquisition in India enhances the Company’s ability to provide technical, sales, manufacturing, chemical handling, and packaging services in the region. Since the effective date for this acquisition, the financial results of the business have been included in the Company's financial statements within the Company’s Industrial Materials operating segment in the electronic and industrial coatings product line. Effective December 2016, Spray Products (India) Private Limited was renamed HumiSeal India Private Limited.
In November 2015 (the first quarter of fiscal 2016), the Company sold its RodPack® wind energy business, contained within its structural composites product line, to an otherwise unrelated party for proceeds of $2,186,000. The Company’s structural composites product line is a part of the Company’s Industrial Materials operating segment. The Company will provide ongoing development support to the Buyer for which it will receive additional consideration upon the completion of services.
Products and Markets
Our principal products are specialty tapes, laminates, adhesives, sealants, coatings and chemical intermediates which are sold by our salespeople, manufacturers' representatives and distributors. In our Industrial Materials segment, these products consist of:
|
(i) |
insulating and conducting materials for the manufacture of electrical and telephone wire and cable, electrical splicing, and terminating and repair tapes, which are marketed to wire and cable manufacturers; |
|
(ii) |
laminated film foils, including EMI/RFI shielding tapes used in communication and local area network (LAN) cables; |
|
(iii) |
moisture protective coatings, which are sold to the electronics industry for circuitry manufacturing, including circuitry used in automobiles and home appliances; |
|
(iv) |
laminated durable papers, including laminated paper with an inner security barrier used in personal and mail-stream privacy protection, which are sold primarily to the envelope converting and commercial printing industries; |
|
(v) |
pulling and detection tapes used in the installation, measurement and location of fiber optic cables, water and natural gas lines, and power, data, and video cables for commercial buildings; |
|
(vi) |
cover tapes with reliable adhesive and anti-static properties essential to delivering semiconductor components via tape and reel packaging; |
|
(vii) |
advanced adhesives, sealants, and coatings for automotive and industrial applications that require specialized bonding, encapsulating, environmental protection, or thermal management functionality; |
|
(viii) |
polymeric microspheres utilized by various industries to allow for weight and density reduction and sound dampening; |
|
(ix) |
water-based polyurethane dispersions utilized for various coating products; and |
|
(x) |
composite strength elements utilized in wind energy generation. |
6
In our Construction Materials segment, these products consist of:
|
(i) |
protective pipe coating tapes and other protectants for valves, regulators, casings, joints, metals, concrete and wood, which are sold to oil companies, gas utilities, and pipeline companies for utilization in both the construction and maintenance of oil and gas, water and wastewater pipelines; |
|
(ii) |
waterproofing membranes for highway bridge deck metal-supported surfaces, which are sold to municipal transportation authorities, and high-performance polymeric asphalt additives; |
|
(iii) |
fluid-applied coating and lining systems for use in the water and wastewater industry; and |
|
(iv) |
expansion and control joint systems designed for roads, bridges, stadiums and airport runways. |
There is some seasonality in selling products into the construction market. Higher demand is often experienced when temperatures are warmer in most of North America (April through October), with lower demand occurring when temperatures are colder (typically our second fiscal quarter). Other than the acquisition of the operations of Resin Designs, we did not introduce any new products requiring an investment of a material amount of our assets during fiscal year 2017.
Employees
As of October 31, 2017, we employed approximately 695 people (including union employees). We consider our employee relations to be good. In the U.S., we offer our employees a wide array of company-paid benefits, which we believe are competitive relative to others in our industry. In our operations outside the U.S., we offer benefits that may vary from those offered to our U.S. employees due to customary local practices and statutory requirements.
Backlog, Customers and Competition
As of October 31, 2017, the backlog of customer orders believed to be firm was approximately $19,719,000. This compared with a backlog of $17,583,000 as of October 31, 2016. The increase in backlog from the prior year amount is primarily due to current period increases in specialty chemical intermediates, pulling and detection and cable materials products. During fiscal 2017, 2016 and 2015, no customer accounted for more than 10% of sales. No material portion of our business is subject to renegotiation or termination of profits or contracts at the election of the United States Federal Government.
There are other companies that manufacture or sell products and services similar to those made and sold by us. Many of those companies are larger and have greater financial resources than we have. We compete principally on the basis of technical performance, service reliability, quality and price.
Raw Materials
We obtain raw materials from a wide variety of suppliers, with alternative sources of most essential materials available within reasonable lead times.
Patents, Trademarks, Licenses, Franchises and Concessions
We own the following trademarks that we believe are of material importance to our business: Chase Corporation®, C-Spray (Logo), a trademark used in conjunction with most of the Company’s business segment and product line marketing material and communications; HumiSeal®, a trademark for moisture protective coatings sold to the electronics industry; Chase & Sons®, a trademark for barrier and insulating tapes sold to the wire and cable industry; Chase BLH2OCK®, a trademark for a water-blocking compound sold to the wire and cable industry; Rosphalt50®, a trademark for an asphalt additive used predominantly on bridge decks for waterproofing protection; PaperTyger®, a trademark for laminated durable papers sold to the envelope converting and commercial printing industries; DuraDocument®, a trademark for durable, laminated papers sold to the digital print industry; Defender® a trademarked and patent-pending
7
RFID protective material sold to the personal accessories and paper industries; Tapecoat®, a trademark for corrosion preventive surface coatings and primers; Maflowrap®, a trademark for anti-corrosive tapes incorporating self-adhesive mastic or rubber-backed strips, made of plastic materials; Royston®, a trademark for a corrosion-inhibiting coating composition for use on pipes; Ceva®, a trademark for epoxy pastes/gels/mortars and elastomeric concrete used in the construction industry; CIM® trademarks for fluid-applied coating and lining systems used in the water and wastewater industry; ServiWrap® trademarks for pipeline protection tapes, coatings and accessories; NEPTCO®, a trademark used in conjunction with most of NEPTCO’s business and product line marketing material and communications; NEPTAPE®, a trademark for coated shielding and insulation materials used in the wire and cable industry; Muletape®, a trademark for pulling and installation tapes sold to the telecommunications industry; Trace-Safe®, a trademark for detection tapes sold to the water and gas industies; Dualite®, a trademark for polymeric microspheres utilized for density and weight reduction and sound dampening by various industries; 4EvaSeal®, a trademark for adhesive-backed tape utilized in various industries; Resin Designs®, a trademark for adhesives and sealants sold into the microelectronics and semiconductor industries; SlickTape®, a trademark for a lubricated shielding tape sold to the wire and cable industry; and HighDraw®, a trademark for a highly extensible shielding tape sold to the wire and cable industry. We do not have any other material trademarks, licenses, franchises, or concessions. While we do hold various patents, as well as other trademarks, we do not believe that they are material to the success of our business.
Working Capital
We fund our business operations through a combination of available cash and cash equivalents, short-term investments and cash flows generated from operations. In addition, our revolving credit facility is available for additional working capital needs or investment opportunities. We have historically funded acquisitions through both available cash on hand and additional borrowings and financing agreements with our bank lenders.
Research and Development
Approximately $3,696,000, $2,792,000 and $2,690,000 was expensed for Company-sponsored research and development during fiscal 2017, 2016 and 2015, respectively, and recorded within selling, general and administrative expenses. Research and development increased by $904,000 in fiscal 2017 due to continued focused development work on strategic product lines, and eleven months of operations related to the established research and development department of Resin Designs, acquired in the first quarter of fiscal 2017.
Available Information
Chase maintains a website at http://www.chasecorp.com. Our annual reports on Form 10-K, quarterly reports on Form 10-Q, current reports on Form 8-K and amendments to such reports filed or furnished pursuant to section 13(a) or 15(d) of the Securities Exchange Act of 1934, as well as section 16 reports on Form 3, 4, or 5, are available free of charge on this site as soon as is reasonably practicable after they are filed or furnished with the SEC. Our Code of Conduct and Ethics and the charters for the Audit Committee, the Nominating and Governance Committee and the Compensation and Management Development Committee of our Board of Directors are also available on our internet website. The Code of Conduct and Ethics and charters are also available in print to any shareholder upon request. Requests for such documents should be directed to Paula Myers, Shareholder and Investor Relations Department, at 295 University Avenue, Westwood, Massachusetts 02090. Our internet website and the information contained on it or connected to it are not part of nor incorporated by reference into this Form 10-K. Our filings with the SEC are also available on the SEC’s website at http://www.sec.gov and at the SEC’s Public Reference Room at 100 F Street, NE, Washington, DC 20549. The public may obtain information on the operations of the Public Reference Room by calling the SEC at 1-800-SEC-0330.
Financial Information regarding Segment and Geographic Areas
Please see Notes 11 and 12 to the Company’s Consolidated Financial Statements for financial information about the Company’s operating segments and domestic and foreign operations for each of the last three fiscal years.
8
The following risk factors should be read carefully in connection with evaluating our business and the forward-looking information contained in this Annual Report on Form 10-K. We feel that any of the following risks could materially adversely affect our business, operations, industry, financial position or our future financial performance. While we believe that we have identified and discussed below the key risk factors affecting our business, there may be additional risks and uncertainties that are not presently known or that are not currently believed to be significant that may adversely affect our business, operations, industry, financial position and financial performance in the future.
We currently operate in mature markets where increases or decreases in market share could be significant.
Our sales and net income are largely dependent on sales from a consistent and well-established customer base. Organic growth opportunities are minimal; however, we have used and will continue to use strategic acquisitions as a means to build and grow the business. In this business environment, increases or decreases in market share could have a material effect on our business condition or results of operation. We face intense competition from a diverse range of competitors, including operating divisions of companies much larger and with far greater resources than we have. If we are unable to maintain our market share, our business could suffer.
Our business strategy includes the pursuit of strategic acquisitions, which may not be successful if they happen at all.
From time to time, we engage in discussions with potential target companies concerning potential acquisitions. In executing our acquisition strategy, we may be unable to identify suitable acquisition candidates. In addition, we may face competition from other companies for acquisition candidates, making it more difficult to acquire suitable companies on favorable terms.
Even if we do identify a suitable acquisition target and are able to negotiate and close a transaction, the integration of an acquired business into our operations involves numerous risks, including potential difficulties in integrating an acquired company’s product line with ours; the diversion of our resources and management’s attention from other business concerns; the potential loss of key employees; limitations imposed by antitrust or merger control laws in the United States or other jurisdictions; risks associated with entering a new geographical or product market; and the day-to-day management of a larger and more diverse combined company.
We may not realize the synergies, operating efficiencies, market position or revenue growth we anticipate from acquisitions, and our failure to effectively manage the above risks could have a material adverse effect on our business, growth prospects and financial performance.
Our results of operations could be adversely affected by uncertain economic and political conditions and the effects of these conditions on our customers’ businesses and levels of business activity.
Global economic and political conditions can affect the businesses of our customers and the markets they serve. A severe or prolonged economic downturn or a negative or uncertain political climate could adversely affect, among others, the automotive, housing, construction, pipeline, energy, transportation infrastructure and electronics industries. This may reduce demand for our products or depress pricing of those products, either of which may have a material adverse effect on our results of operations. Changes in global economic conditions or foreign and domestic trade policy could also shift demand to products for which we do not have competitive advantages, and this could negatively affect the amount of business that we are able to obtain. In addition, if we are unable to successfully anticipate changing economic and political conditions, we may be unable to effectively plan for and respond to those changes and our business could be negatively affected.
9
General economic factors, domestically and internationally, may also adversely affect our financial performance through increased raw material costs or other expenses and by making access to capital more difficult.
The cumulative effect of higher interest rates, energy costs, inflation, levels of unemployment, healthcare costs, unsettled financial markets, and other economic factors (including changes in foreign currency exchange rates) could adversely affect our financial condition by increasing our manufacturing costs and other expenses at the same time that our customers may be scaling back demand for our products. Prices of certain commodity products, including oil and petroleum-based products, are historically volatile and are subject to fluctuations arising from changes in domestic and international supply and demand, labor costs, competition, weather events, market speculation, government regulations and periodic delays in delivery. Rapid and significant changes in commodity prices may affect our sales and profit margins. These factors can increase our cost of products and services sold and/or selling, general and administrative expenses, and otherwise adversely affect our operating results. Disruptions in the credit markets may limit our ability to access debt capital for use in acquisitions or other purposes on advantageous terms or at all. If we are unable to manage our expenses in response to general economic conditions and margin pressures, or if we are unable to obtain capital for strategic acquisitions or other needs, then our results of operations would be negatively affected.
Fluctuations in the supply and prices of raw materials may negatively impact our financial results.
We obtain raw materials needed to manufacture our products from a number of suppliers. Many of these raw materials are petroleum-based derivatives. Under normal market conditions, these materials are generally available on the open market and from a variety of producers. From time to time, however, the prices and availability of these raw materials fluctuate, which could impair our ability to procure necessary materials, or increase the cost of manufacturing our products. If the prices of raw materials increase, and we are unable to pass these increases on to our customers, we could experience reduced profit margins.
If our products fail to perform as expected, or if we experience product recalls, we could incur significant and unexpected costs and lose existing and future business.
Our products are complex and could have defects or errors presently unknown to us, which may give rise to claims against us, diminish our brands or divert our resources from other purposes. Despite testing, new and existing products could contain defects and errors and may in the future contain manufacturing or design defects, errors or performance problems when first introduced, or even after these products have been used by our customers for a period of time. These problems could result in expensive and time-consuming design modifications or warranty charges, changes to our manufacturing processes, product recalls, significant increases in our maintenance costs, or exposure to liability for damages, any of which may result in substantial and unexpected expenditures, require significant management attention, damage our reputation and customer relationships, and adversely affect our business, our operating results and our cash flow.
We are dependent on key personnel.
We depend significantly on our executive officers including our President and Chief Executive Officer, Adam P. Chase, and our Executive Chairman, Peter R. Chase, and on other key employees. The loss of the services of any of these key employees could have a material impact on our business and results of operations. In addition, our acquisition strategy will require that we attract, motivate and retain additional skilled and experienced personnel. The inability to satisfy such requirements could have a negative impact on our ability to remain competitive in the future.
If we cannot successfully manage the unique challenges presented by international markets, we may not be successful in expanding our international operations.
Our strategy includes expansion of our operations in existing and new international markets by selective acquisitions and strategic alliances. Our ability to successfully execute our strategy in international markets is affected by many of the same operational risks we face in expanding our U.S. operations. In addition, our international expansion may be adversely affected by our ability to identify and gain access to local suppliers as well as by local laws and customs, legal and regulatory constraints, political and economic conditions and currency regulations of the countries or regions in
10
which we currently operate or intend to operate in the future. Risks inherent in our international operations also include, among others, the costs and difficulties of managing international operations, adverse tax consequences and greater difficulty in enforcing intellectual property rights. Additionally, foreign currency exchange rates and fluctuations (such as those experienced following the June 23, 2016 “Brexit” referendum vote in the United Kingdom) may have an impact on future costs or on future cash flows from our international operations.
We may experience difficulties in the redesign and consolidation of our manufacturing facilities which could impact shipments to customers, product quality, and our ability to realize cost savings.
We currently have several ongoing projects to streamline our manufacturing operations, which include the redesign and consolidation of certain manufacturing facilities. We anticipate a reduction of overhead costs as a result of these projects, to the extent that we can effectively leverage assets, personnel, and business processes in the transition of production among manufacturing facilities. However, uncertainty is inherent within the facility redesign and consolidation process, and unforeseen circumstances could offset the anticipated benefits, disrupt service to customers, and impact product quality.
Financial market performance may have a material adverse effect on our pension plan assets and require additional funding requirements.
Significant and sustained declines in the financial markets may have a material adverse effect on the fair market value of the assets of our pension plans. While these pension plan assets are considered non-financial assets since they are not carried on our balance sheet, the fair market valuation of these assets could impact our funding requirements, funded status or net periodic pension cost. Any significant and sustained declines in the fair market value of these pension assets could require us to increase our funding requirements, which would have an impact on our cash flow, and could also lead to additional pension expense.
Failure or compromise of security with respect to an operating or information system or portable electronic device could adversely affect our results of operations and financial condition or the effectiveness of our internal controls over operations and financial reporting.
We are highly dependent on automated systems to record and process our daily transactions and certain other components of our financial statements. We could experience a failure of one or more of these systems, or a compromise of our security due to technical system flaws, data input or record keeping errors, or tampering or manipulation of our systems by employees or unauthorized third parties. Information security risks also exist with respect to the use of portable electronic devices, such as laptops and smartphones, which are particularly vulnerable to loss and theft. We may also be subject to disruptions of any of these systems arising from events that are wholly or partially beyond our control (for example, natural disasters, acts of terrorism, epidemics, computer viruses, cyber-attacks and electrical/telecommunications outages). All of these risks are also applicable wherever we rely on outside vendors to provide services. Operating system failures, disruptions, or the compromise of security with respect to operating systems or portable electronic devices could subject us to liability claims, harm our reputation, interrupt our operations, or adversely affect our business, results from operations, financial condition, cash flow or internal control over financial reporting.
Item 1B – Unresolved Staff Comments
Not applicable.
11
We own and lease office and manufacturing properties as outlined in the table below.
|
|
|
Square |
|
Owned / |
|
|
|
Location |
|
Feet |
|
Leased |
|
Principal Use |
|
Westwood, MA |
|
20,200 |
|
Leased |
|
Corporate headquarters, executive office and global operations center, including research and development, sales and administrative services |
|
Oxford, MA |
|
73,600 |
|
Owned |
|
Manufacture of tape and related products for the electronic and telecommunications industries, as well as laminated durable papers |
|
Blawnox, PA |
|
44,000 |
|
Owned |
|
Manufacture and sale of protective coatings and tape products |
|
O’Hara Township, PA |
|
109,000 |
|
Owned |
|
Manufacture and sale of protective electronic coatings, expansion joints and accessories |
|
Evanston, IL |
|
100,000 |
|
Owned |
|
Manufacture and sale of protective coatings and tape products |
|
Houston, TX |
|
45,000 |
|
Owned |
|
Manufacture of coating and lining systems for use in liquid storage and containment applications |
|
Pawtucket, RI |
|
70,400 |
|
Owned |
|
Manufacture and sale of laminated film foils for the electronics and cable industries, and offices for sales and administrative services |
|
Granite Falls, NC |
|
108,000 |
|
Owned |
|
Manufacture and sale of pulling and detection tapes and fiber optic strength elements, as well as research and development services |
|
Lenoir, NC |
|
110,000 |
|
Owned |
|
Manufacture and sale of laminated film foils and cover tapes |
|
Woburn, MA |
|
34,000 |
|
Leased |
|
Manufacture and sale of adhesive systems, as well as research and development |
|
Newark, CA |
|
32,500 |
|
Leased |
|
Manufacture and sale of sealant systems |
|
Greenville, SC |
|
34,600 |
|
Leased |
|
Manufacture and sale of polymeric microspheres, as well as research and development |
|
Winnersh, Wokingham, England |
|
18,800 |
|
Leased |
|
Manufacture and sale of protective electronic coatings, as well as research and development |
|
Rye, East Sussex, England |
|
36,600 |
|
Owned |
|
Manufacture and sale of protective coatings and tape products |
|
Paris, France |
|
1,900 |
|
Leased |
|
Sales/technical service office and warehouse allowing direct sales and service to the French market |
|
Mississauga, Canada |
|
2,500 |
|
Leased |
|
Distribution center |
|
Rotterdam, Netherlands |
|
2,500 |
|
Leased |
|
Distribution center |
|
Suzhou, China |
|
48,000 |
|
Leased |
|
Manufacture of packaging tape products for the electronics industries |
|
Pune, India |
|
4,650 |
|
Owned |
|
Packaging and sale of protective electronic coatings |
|
Randolph, MA |
|
- |
|
Owned |
|
Ceased manufacturing products at this location in 2012. During fiscal 2016, we demolished the building and classified the property as an asset held for sale |
The above facilities vary in age, are in good condition and, in the opinion of management, adequate and suitable for present operations. We also own equipment and machinery that is in good repair and, in the opinion of management, adequate and suitable for present operations. We believe that we could significantly add to our capacity by increasing shift operations. Availability of machine hours through additional shifts would provide expansion of current production volume without significant additional capital investment.
12
The Company is involved from time to time in litigation incidental to the conduct of its business. Although the Company does not expect that the outcome in any of these matters, individually or collectively, will have a material adverse effect on its financial condition, results of operations or cash flows, litigation is inherently unpredictable. Therefore, judgments could be rendered or settlements agreed to that could adversely affect the Company’s operating results or cash flows in a particular period. The Company routinely assesses all its litigation and threatened litigation as to the probability of ultimately incurring a liability, and records its best estimate of the ultimate loss in situations where we assess the likelihood of loss as probable.
item 4 – mine safety disclosures
Not applicable.
Item 4a – Executive Officers of the Registrant
The following table sets forth information concerning our Executive Officers as of October 31, 2017. Each of our Executive Officers is selected by our Board of Directors and holds office until his successor is elected and qualified.
|
Name |
|
Age |
|
Offices Held and Business Experience during the Past Five Years |
|
Adam P. Chase |
|
45 |
|
President of the Company since January 2008, Chief Executive Officer of the Company since February 2015. Adam Chase was the Chief Operating Officer of the Company from February 2007 to February 2015. |
|
Peter R. Chase |
|
69 |
|
Chairman of the Board of the Company since February 2007, and Executive Chairman of the Company since February 2015. Peter Chase was the Chief Executive Officer of the Company from September 1993 to February 2015. Peter Chase is the father of Adam Chase. |
|
Kenneth J. Feroldi |
|
62 |
|
Chief Financial Officer and Treasurer of the Company since September 2014. Previously Director of Finance for the Company, prior to which he served as Vice President – Finance, Chief Financial Officer and Treasurer of NEPTCO, Inc. from 1992 until 2012, when NEPTCO was acquired by the Company. |
13
Item 5 – Market for the Registrant's Common Equity, Related Stockholder Matters and Issuer Purchases of Equity Securities
Our common stock is traded on the NYSE American under the symbol CCF. As of October 31, 2017, there were 327 shareholders of record of our Common Stock and we believe there were approximately 5,010 beneficial shareholders who held shares in nominee name. On that date, the closing price of our common stock was $118.75 per share as reported by the NYSE American.
The following table sets forth the high and low daily sales prices for our common stock as reported by the NYSE American (formerly the NYSE MKT) for each quarter in the fiscal years ended August 31, 2017 and 2016:
|
|
|
Fiscal 2017 |
|
Fiscal 2016 |
|
||||||||
|
|
|
High |
|
Low |
|
High |
|
Low |
|
||||
|
First Quarter |
|
$ |
82.10 |
|
$ |
61.75 |
|
$ |
44.61 |
|
$ |
36.83 |
|
|
Second Quarter |
|
|
93.75 |
|
|
76.55 |
|
|
50.87 |
|
|
37.20 |
|
|
Third Quarter |
|
|
108.35 |
|
|
90.40 |
|
|
58.79 |
|
|
45.07 |
|
|
Fourth Quarter |
|
|
116.15 |
|
|
83.35 |
|
|
65.19 |
|
|
55.54 |
|
Single annual cash dividend payments were declared and scheduled to be paid subsequent to year end in the amounts of $0.80, $0.70, and $0.65 per common share, for the years ended August 31, 2017, 2016 and 2015, respectively. Certain of our borrowing facilities contain financial covenants which may have the effect of limiting the amount of dividends that we can pay.
14
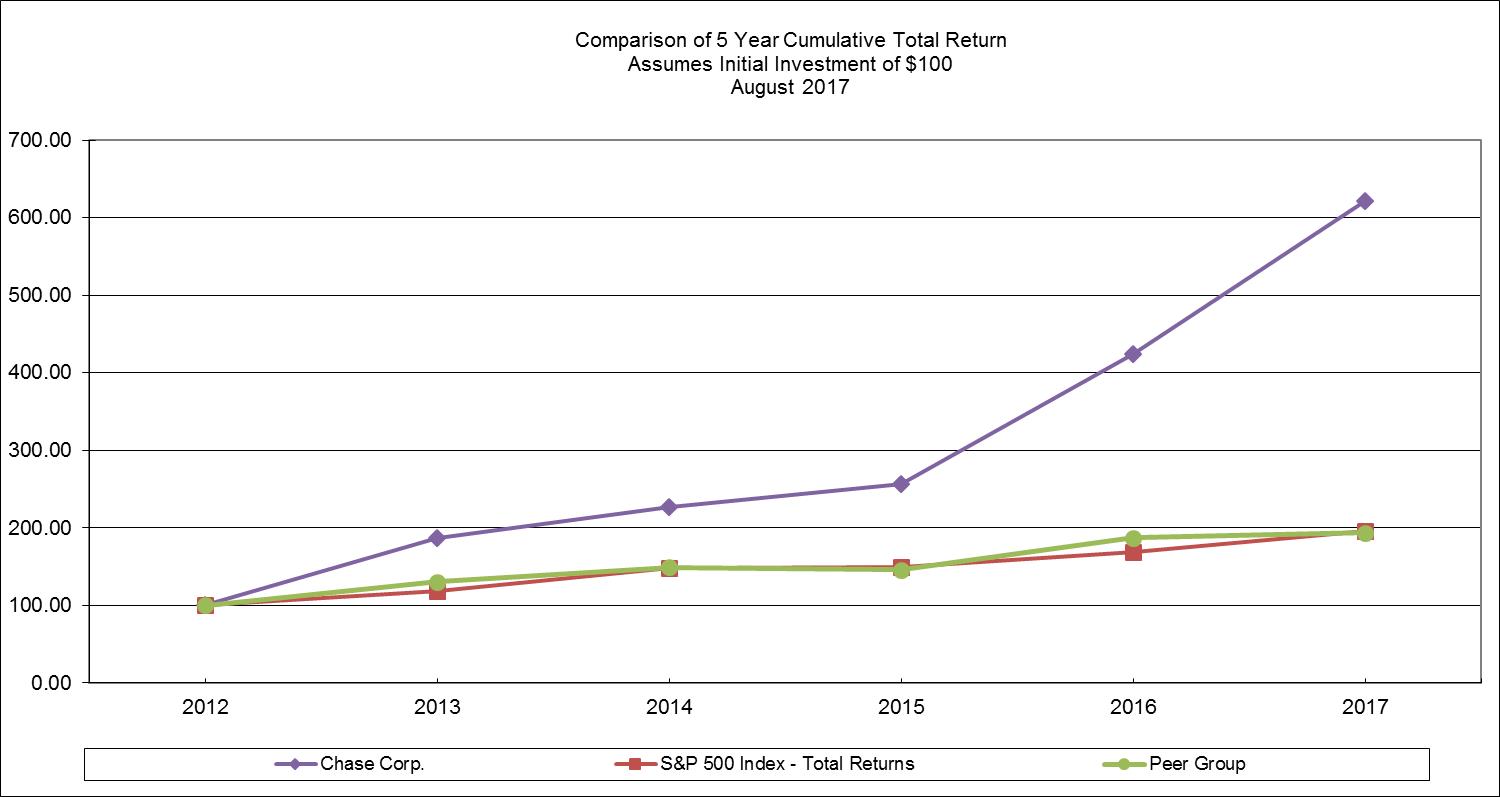
Comparative Stock Performance
The following line graph compares the yearly percentage change in our cumulative total shareholder return on the Common Stock for the last five fiscal years with the cumulative total return on the Standard & Poor's 500 Stock Index (the “S&P 500 Index”), and a composite peer index that is weighted by market equity capitalization (the “Peer Group Index”). The companies included in the Peer Group Index are Henkel AG & Co KGaA, H.B. Fuller Company, Intertape Polymer Group, Rogers Corporation and RPM International, Inc. Cumulative total returns are calculated assuming that $100 was invested on August 31, 2012 in each of the Common Stock, the S&P 500 Index and the Peer Group Index, and that all dividends were reinvested.
|
|
|
2012 |
|
2013 |
|
2014 |
|
2015 |
|
2016 |
|
2017 |
|
||||||
|
Chase Corp |
|
$ |
100 |
|
$ |
187 |
|
$ |
226 |
|
$ |
256 |
|
$ |
424 |
|
$ |
622 |
|
|
S&P 500 Index |
|
$ |
100 |
|
$ |
119 |
|
$ |
149 |
|
$ |
149 |
|
$ |
168 |
|
$ |
195 |
|
|
Peer Group Index |
|
$ |
100 |
|
$ |
131 |
|
$ |
149 |
|
$ |
146 |
|
$ |
187 |
|
$ |
194 |
|
The information under the caption “Comparative Stock Performance” above is not deemed to be “filed” as part of this Annual Report, and is not subject to the liability provisions of Section 18 of the Securities Exchange Act of 1934. Such information will not be deemed to be incorporated by reference into any filing we make under the Securities Act of 1933 unless we explicitly incorporate it into such a filing at the time.
15
Item 6 – Selected Financial Data
the following selected financial data should be read in conjunction with “Item 7 – Management’s Discussion and Analysis of Financial Condition and Results of Operations” and “Item 8 – Financial Statements and Supplementary Data.”
|
|
|
Fiscal Years Ended August 31, |
|
|||||||||||||
|
|
|
2017 |
|
2016 |
|
2015 |
|
2014 |
|
2013 |
|
|||||
|
|
|
(In thousands, except per share amounts) |
|
|||||||||||||
|
Statement of Operations Data |
|
|
|
|
|
|
|
|
|
|
|
|
|
|
|
|
|
Revenue from continuing operations |
|
$ |
252,560 |
|
$ |
238,094 |
|
$ |
238,046 |
|
$ |
224,006 |
|
$ |
216,062 |
|
|
Net income |
|
$ |
42,014 |
|
$ |
32,807 |
|
$ |
26,413 |
|
$ |
26,523 |
|
$ |
16,740 |
|
|
Add: net (gain) loss attributable to noncontrolling interest |
|
|
— |
|
|
— |
|
|
(95) |
|
|
108 |
|
|
474 |
|
|
Net income attributable to Chase Corporation |
|
$ |
42,014 |
|
$ |
32,807 |
|
$ |
26,318 |
|
$ |
26,631 |
|
$ |
17,214 |
|
|
Net income available to common shareholders, per common and common equivalent share: |
|
|
|
|
|
|
|
|
|
|
|
|
|
|
|
|
|
Basic: |
|
|
|
|
|
|
|
|
|
|
|
|
|
|
|
|
|
Net income per common and common equivalent share |
|
$ |
4.49 |
|
$ |
3.55 |
|
$ |
2.87 |
|
$ |
2.92 |
|
$ |
1.90 |
|
|
Diluted: |
|
|
|
|
|
|
|
|
|
|
|
|
|
|
|
|
|
Net income per common and common equivalent share |
|
$ |
4.44 |
|
$ |
3.50 |
|
$ |
2.82 |
|
$ |
2.86 |
|
$ |
1.87 |
|
|
Balance Sheet Data |
|
|
|
|
|
|
|
|
|
|
|
|
|
|
|
|
|
Total assets |
|
$ |
254,738 |
|
$ |
262,819 |
|
$ |
255,642 |
|
$ |
245,545 |
|
$ |
224,360 |
|
|
Long-term debt, including current portion |
|
|
— |
|
|
43,400 |
|
|
51,800 |
|
|
58,800 |
|
|
64,400 |
|
|
Total stockholders' equity |
|
|
210,929 |
|
|
174,089 |
|
|
154,342 |
|
|
137,490 |
|
|
113,860 |
|
|
Cash dividends paid per common and common equivalent share |
|
$ |
0.70 |
|
$ |
0.65 |
|
$ |
0.60 |
|
$ |
0.45 |
|
$ |
0.40 |
|
16
Item 7 – Management's Discussion and Analysis of Financial Condition and Results of Operations
The following discussion provides an analysis of our financial condition and results of operations and should be read in conjunction with the Consolidated Financial Statements and notes thereto included in Item 8 of this Annual Report on Form 10-K.
Selected Relationships within the Consolidated Statements of Operations
|
|
|
Years Ended August 31, |
|
|||||||
|
|
|
2017 |
|
2016 |
|
2015 |
|
|||
|
|
|
(Dollars in thousands) |
|
|||||||
|
Revenue |
|
$ |
252,560 |
|
$ |
238,094 |
|
$ |
238,046 |
|
|
Net income |
|
$ |
42,014 |
|
$ |
32,807 |
|
$ |
26,413 |
|
|
Add: net (gain) loss attributable to noncontrolling interest |
|
|
— |
|
|
— |
|
|
(95) |
|
|
Net income attributable to Chase Corporation |
|
$ |
42,014 |
|
$ |
32,807 |
|
$ |
26,318 |
|
|
Increase in revenue from prior year |
|
|
|
|
|
|
|
|
|
|
|
Amount |
|
$ |
14,466 |
|
$ |
48 |
|
$ |
14,040 |
|
|
Percentage |
|
|
6 |
% |
|
* |
% |
|
6 |
% |
|
Increase/(Decrease) in net income from prior year |
|
|
|
|
|
|
|
|
|
|
|
Amount |
|
$ |
9,207 |
|
$ |
6,394 |
|
$ |
(110) |
|
|
Percentage |
|
|
28 |
% |
|
24 |
% |
|
(*) |
% |
|
|
|
|
|
|
|
|
|
|
|
|
|
Percentage of revenue: |
|
|
|
|
|
|
|
|
|
|
|
Revenue |
|
|
100 |
% |
|
100 |
% |
|
100 |
% |
|
Cost of products and services sold |
|
|
58 |
|
|
61 |
|
|
63 |
|
|
Selling, general and administrative expenses |
|
|
19 |
|
|
19 |
|
|
19 |
|
|
Acquisition-related costs |
|
|
* |
(a) |
|
— |
|
|
* |
(d) |
|
Other (income) expense, net |
|
|
(1) |
(b) |
|
(*) |
(c) |
|
* |
|
|
Income before income taxes |
|
|
24 |
% |
|
21 |
% |
|
17 |
% |
|
Income taxes |
|
|
7 |
|
|
7 |
|
|
6 |
|
|
Net income |
|
|
17 |
% |
|
14 |
% |
|
11 |
% |
|
(a) |
Represents $584 in expenses related to the acquisition of the operations and certain assets of Resin Designs |
|
(b) |
Includes effects of $2,013 gain on sale of fiber optic cable components product line and a $860 gain related to the sale of real estate |
|
(c) |
Includes effects of $1,031 gain on sale of RodPack business |
|
(d) |
Represents $584 in expenses related to the acquisition of the specialty chemical intermediates product line |
* Denotes less than one percent
Overview
Continued strong demand for many of our product offerings, a significant acquisition and a favorable sales mix all contributed to increased revenue, operating income and net income over the prior year results. Our strategic diversification remained one of our core strengths, as several product lines in both of our segments exceeded prior year revenue, offsetting shortfalls from others.
In September 2016, we completed the acquisition of certain assets and the operations of Resin Designs, a formulator of customized adhesive and sealant systems used in high-reliability electronic applications. In November 2016 and December 2016, respectively, we sold our Paterson, NJ location and our former corporate headquarters in Bridgewater, MA. In April 2017, the Company divested its fiber optic cable components product line, after determining the low-margin business to not be part of Chase’s long-term strategy.
17
Revenue from the Industrial Materials segment increased over the prior year on greater demand for our electronic and industrial coatings, specialty products, structural composites, pulling and detection, electronic materials, cable materials and specialty chemical intermediates product lines. The segment’s organic increases in these legacy product lines were complemented by the September 2016 acquisition of the operations of Resin Designs, which is now included within the electronic and industrial coatings product line. The segment’s overall revenue increase was negatively impacted by the April 2017 sale of our fiber optic cable components product line.
Revenue from the Construction Materials segment fell short of the prior year primarily due to the decreased demand for our UK-produced pipeline coatings products, as well as our building envelope products. The overall decrease in sales experienced by the segment was lessened by increased sales of our bridge and highway, domestically-produced pipeline coatings and coating and lining systems products.
Through our active M&A program, our management of real estate and our marketing and product development efforts, the Company remains focused on its core strategies for sustainable growth. At August 31, 2017, the Company’s cash on hand was $47,354,000 and there was no outstanding balance under the Company’s $150,000,000 revolving debt facility.
The Company has two reportable segments summarized below:
|
Segment |
|
Product Lines |
|
Manufacturing Focus and Products |
|
Industrial Materials |
|
Cable Materials |
|
Protective coatings and tape products, including insulating and conducting materials for wire and cable manufacturers; moisture protective coatings and customized sealant and adhesive systems for electronics; laminated durable papers, packaging and industrial laminate products and custom manufacturing services; pulling and detection tapes used in the installation, measurement and location of fiber optic cables and water and natural gas lines; cover tapes essential to delivering semiconductor components via tape and reel packaging; composite materials elements; glass-based strength elements designed to allow fiber optic cables to withstand mechanical and environmental strain and stress; polyurethane dispersions and polymeric microspheres. |
|
|
|
|
|
|
|
Construction Materials |
|
Coating and Lining Systems |
|
Protective coatings and tape products, including coating and lining systems for use in liquid storage and containment applications; protective coatings for pipeline and general construction applications; adhesives and sealants used in architectural and building envelope waterproofing applications; high-performance polymeric asphalt additives and expansion and control joint systems for use in the transportation and architectural markets. |
|
(1) |
50% owned joint venture until October 31, 2014, when we purchased the remaining 50% noncontrolling interest. Results of product line included for period prior to its April 3, 2017 sale by the Company. |
18
Results of Operations
Revenue and Operating Profit by Segment are as follows:
|
|
|
|
|
|
Income Before |
|
% of |
|
|
|
|
|
Revenue |
|
Income Taxes |
|
Revenue |
|
||
|
|
|
(Dollars in thousands) |
|
|
|
||||
|
Fiscal 2017 |
|
|
|
|
|
|
|
|
|
|
Industrial Materials |
|
$ |
202,956 |
|
$ |
67,561 |
(a) |
33 |
% |
|
Construction Materials |
|
|
49,604 |
|
|
18,205 |
|
37 |
% |
|
|
|
$ |
252,560 |
|
|
85,766 |
|
34 |
% |
|
Less corporate and common costs |
|
|
|
|
|
(24,874) |
(b) |
|
|
|
Income before income taxes |
|
|
|
|
$ |
60,892 |
|
|
|
|
|
|
|
|
|
|
|
|
|
|
|
Fiscal 2016 |
|
|
|
|
|
|
|
|
|
|
Industrial Materials |
|
$ |
181,728 |
|
$ |
53,530 |
(c) |
29 |
% |
|
Construction Materials |
|
|
56,366 |
|
|
19,967 |
|
35 |
% |
|
|
|
$ |
238,094 |
|
|
73,497 |
|
31 |
% |
|
Less corporate and common costs |
|
|
|
|
|
(23,387) |
(d) |
|
|
|
Income before income taxes |
|
|
|
|
$ |
50,110 |
|
|
|
|
|
|
|
|
|
|
|
|
|
|
|
Fiscal 2015 |
|
|
|
|
|
|
|
|
|
|
Industrial Materials |
|
$ |
176,547 |
|
$ |
46,388 |
(e) |
26 |
% |
|
Construction Materials |
|
|
61,499 |
|
|
17,272 |
|
28 |
% |
|
|
|
$ |
238,046 |
|
|
63,660 |
|
27 |
% |
|
Less corporate and common costs |
|
|
|
|
|
(22,434) |
(f) |
|
|
|
Income before income taxes |
|
|
|
|
$ |
41,226 |
|
|
|
|
(a) |
Includes a $2,013 gain on sale of our fiber optic cable components business and $190 of expenses related to inventory step-up in fair value attributable to the September 2016 acquisition of certain assets of Resin Designs |
|
(b) |
Includes $584 in acquisition-related expenses attributable to the September 2016 acquisition of certain assets of Resin Designs, facility exit and demolition costs of $70 related to the Company’s Randolph, MA location, a $792 gain related to the November 2016 sale of the Company’s Paterson, NJ location, a $68 gain related to the December 2016 sale of the Company’s former corporate headquarters in Bridgewater, MA and $14 of pension-related settlement costs due to the timing of lump sum distributions |
|
(c) |
Includes a $1,031 gain on sale of our RodPack wind energy business contained within our structural composites product line and a $365 write-down on certain other structural composites assets based on usage constraints following the sale, both recognized in November 2015 |
|
(d) |
Includes $935 in Randolph, MA facility exit and demolition costs, a $877 gain on the write-down of an annuity and $13 of pension-related settlement costs due to the timing of lump sum distributions |
|
(e) |
Includes $65 of expense related to inventory step-up in fair value related to the January 2015 acquisition of the specialty chemical intermediates product line |
|
(f) |
Includes $584 in expenses related to the January 2015 acquisition of the specialty chemical intermediates product line and $188 of pension-related settlement costs due to the timing of lump sum distributions |
Total Revenue
Total revenue in fiscal 2017 increased $14,466,000 or 6% to $252,560,000 from $238,094,000 in the prior year.
Revenue in our Industrial Materials segment increased $21,228,000 or 12% to $202,956,000 for the year ended August 31, 2017 compared to $181,728,000 in fiscal 2016. The increase in revenue from our Industrial Materials segment in fiscal 2017 was primarily due to: (a) revenue from our electronic and industrial coatings product line, which included sales of $14,868,000 related to the acquired Resin Designs operations, had total increases in revenue of $20,108,000,
19
reflecting increased sales volume from the automotive and appliance manufacturing industries, along with an increased royalty received from our licensed manufacturer in Asia; (b) sales volume increase of $2,674,000 for our specialty products, which, subsequent to the sale of our fiber optic cable components business on April 3, 2017, includes revenue from the manufacturing services provided by the Company to the purchaser of the fiber optic cable components product line (totaling $740,000 for fiscal 2017); (c) sales volume increase of $2,072,000 from our structural composite products, on sales into the wind energy market; (d) sales volume increase of $1,056,000 from our pulling and detection products, as we continue to meet the utility and telecommunication industries’ high demand for our products; (e) a sales volume increase of $450,000 for our electronic materials; (f) sales growth of $321,000 for our cable materials products on strong demand from manufacturers of communication and server cables in the third and fourth quarters of fiscal 2017; and (g) our specialty chemical intermediates product line, which had $24,000 in increased sales volume. These increases were partially offset by decreased sales of $5,477,000 from our fiber optic cable components product line, which the Company sold in April. No revenue was recorded within the fiber optic cable components product line following its divestiture early in the third quarter.
Revenue from our Construction Materials segment decreased $6,762,000 or 12% to $49,604,000 for the year ended August 31, 2017 compared to $56,366,000 for fiscal 2016. The decreased sales from our Construction Materials segment in fiscal 2017 was primarily due to a net decrease in sales volume of $7,409,000 in pipeline coatings products. Delayed project work and general weakness in the region has continued to affect Middle East water infrastructure project demand for pipeline coatings products produced at our Rye, U.K. facility. Conversely, sales for our domestically produced pipeline products, which sell predominantly into the North American oil and gas markets, increased compared to the prior year. Our building envelope products saw a year-over-year sales volume decrease of $382,000. Partially offsetting the overall decrease in sales for the segment, were: (a) a $974,00 increase in our bridge and highway products sales volume, resulting from increased bridge work in the New York metro region; and (b) coating and lining systems products, whose sales volume increased by $55,000 over the prior year.
Royalties and commissions in the Industrial Materials segment were $4,683,000, $3,644,000 and $3,156,000 for the years ended August 31, 2017, 2016 and 2015, respectively. The increase in royalties and commissions in fiscal 2017 over both fiscal 2016 and 2015 was primarily due to increased sales of electronic and industrial coatings products by our licensed manufacturer in Asia.
Export sales from domestic operations to unaffiliated third parties were $36,719,000, $28,826,000 and $27,955,000 for the years ended August 31, 2017, 2016 and 2015, respectively. The increase in export sales in fiscal 2017 against both fiscal 2016 and 2015 resulted from increased export sales into China, and certain European countries.
In fiscal 2016, total revenue increased $48,000 or less than one percent to $238,094,000 from $238,046,000 in the prior year. Revenue in our Industrial Materials segment increased $5,181,000 or 3% to $181,728,000 for the year ended August 31, 2016 compared to $176,547,000 in fiscal 2015. The increase in revenue from our Industrial Materials segment in fiscal 2016 was primarily due to: (a) increased sales volume of specialty chemical intermediates products totaling $7,755,000, aided by a full year of operations in fiscal 2016; (b) increased sales volume of $3,356,000 from our pulling and detection products, which continued to experience increased demand in product volume by the utility and telecom industries; and (c) $574,000 in increased sales volume from our electronic and industrial coatings product line, primarily due to a higher rate of acceptance and use in the automotive and appliance industries. These increases were partially offset by decreased sales of $4,077,000 from our cable materials products, reflecting a decrease in demand for products with exposure to energy-related markets (inclusive of the oil exploration and mining markets), as well as lower sales volume of $1,744,000 from our fiber optic cable components product line. Revenue from our Construction Materials segment decreased $5,133,000 or 8% to $56,366,000 for the year ended August 31, 2016 compared to $61,499,000 for fiscal 2015. The decreased sales from our Construction Materials segment in fiscal 2016 was primarily due to a decrease in sales volume of $7,708,000 in pipeline coatings products. The anticipated slowdown in Middle East water infrastructure project demand, for products produced at our Rye, UK facility, drove the majority of this decrease, while domestic pipeline coatings sales, which have a largely repair and maintenance focus, had a more tempered year-over-year decease. Partially offsetting the overall decrease in sales for the segment, were: (a) a $1,793,000 year-over-year increase in our coating and lining systems products sales volume, resulting from increased market acceptance and project demand; and (b) bridge and highway products, which capitalized on the weather-lengthened road construction seasons to obtain a $1,193,000 year-over-year sales volume increase.
20
Cost of Products and Services Sold
Cost of products and services sold increased $1,598,000 or 1% to $146,036,000 for the fiscal year ended August 31, 2017 compared to $144,438,000 in fiscal 2016. As a percentage of revenue, cost of products and services sold decreased to 58% in fiscal 2017 compared to 61% for fiscal 2016.
The following table summarizes the relative percentages of cost of products and services sold to revenue for both of our operating segments:
|
|
|
|
|
|
|
Fiscal Years Ended August 31, |
|
||||
|
Cost of products and services sold |
|
|
|
|
|
2017 |
|
2016 |
|
2015 |
|
|
Industrial Materials |
|
|
|
|
|
59 |
% |
61 |
% |
63 |
% |
|
Construction Materials |
|
|
|
|
|
54 |
% |
59 |
% |
63 |
% |
|
Total |
|
|
|
|
|
58 |
% |
61 |
% |
63 |
% |
Cost of products and services sold in our Industrial Materials segment was $119,109,000 for the fiscal year ended August 31, 2017 compared to $111,424,000 in fiscal 2016. As a percentage of revenue, cost of products and services sold in this segment decreased to 59% for fiscal 2017 compared to 61% in fiscal 2016. Cost of products and services sold in our Construction Materials segment was $26,927,000 for the fiscal year ended August 31, 2017 compared to $33,014,000 in fiscal 2016. As a percentage of revenue, cost of products and services sold in this segment decreased to 54% in fiscal 2017 compared to 59% for fiscal 2016. As a percentage of revenue, cost of products and services sold in both segments decreased primarily due to product mix, as our lower margin products constituted a comparatively lower portion of total sales in the current year. We purchase a wide variety of commodity items, including petroleum-based solvents, films, yarns, and nonwovens, along with base metals (aluminum and copper), as well as many other substrates. To facilitate continued improvement in margins, we closely monitor the pricing of our commodities-based raw materials across all product lines, as their price volatility can have short and long-term effects on both our customers’ demand for our products and the margins at which we are able to sell them.
In fiscal 2016, cost of products and services sold in our Industrial Materials segment was $111,424,000 compared to $110,729,000 in fiscal 2015. As a percentage of revenue, cost of products and services sold in this segment decreased to 61% for fiscal 2016 compared to 63% in fiscal 2015. Cost of products and services sold in our Construction Materials segment was $33,014,000 for the fiscal year ended August 31, 2016 compared to $38,473,000 in fiscal 2015. As a percentage of revenue, cost of products and services sold in this segment decreased to 59% in fiscal 2016 compared to 63% for fiscal 2015. As a percentage of revenue, cost of products and services sold in both segments decreased primarily due to product mix as we had decreased sales volume from our lower margin products within the segments.
Selling, General and Administrative Expenses
Selling, general and administrative expenses increased $3,162,000 or 7% to $47,736,000 during fiscal 2017 compared to $44,574,000 in fiscal 2016. As a percentage of revenue, selling, general and administrative expenses were consistent at 19% of total revenue in both fiscal 2017 and fiscal 2016. The year-over-year increase in expenses is primarily attributable to: (a) increased amortization expense of $1,291,000, primarily related to intangible assets acquired in our September 30, 2016 acquisition of certain assets of Resin Designs; (b) increased research and development expense of $904,000, principally related to the current year addition of the established research and development department of Resin Designs; (c) increase of $879,000 in stock-based compensation expenses; and (d) the prior year $877,000 gain on the write-down of an annuity previously owed to a related party which did not recur in fiscal 2017. Partially offsetting these increases was a $1,200,000 reduction in cash incentive compensation expense, predominantly based on the current year change in our Executive Chairman’s compensation plan; our Executive Chairman continued in his role as a director and the Chairman of the Board of Directors in fiscal 2017. The Company continues to closely monitor spend with an emphasis on controlling costs, and leveraging existing resources.
During fiscal 2016, selling, general and administrative expenses decreased $1,411,000 or 3% to $44,574,000 compared to $46,015,000 in fiscal 2015. As a percentage of revenue, selling, general and administrative expenses were consistent at 19% of total revenue in both fiscal 2016 and fiscal 2015. The year-over-year decrease in expenses is primarily
21
attributable to: (a) decreased international sales commission expenses of $938,000 over the prior year, due to a commission structure change relating to sales in certain geographic regions in the current year; (b) a $877,000 gain on the write-down of an annuity previously owed to a related party; and (c) decreased pension costs of $228,000 in the current year against the prior year, given lower settlement loss charges recognized in the current year. These decreases in cost were partially offset by increased amortization expense on acquired intangible assets of $1,074,000 for the year, primarily attributable to the specialty chemical intermediates product line acquisition in the second quarter of fiscal 2015.
Exit Costs Related to Idle Facility
In fiscal 2017 and 2016, the Company recognized $70,000 and $935,000, respectively, in expenses to raze its Randolph, MA facility, which has been idle regarding production for several years. The Company began marketing the site for sale and reclassified the net book value of the facility to assets held for sale during the second quarter of fiscal 2016. These actions were taken as part of the Company’s on-going facility consolidation and rationalization initiative. The Company substantially completed the demolition of the structure in the fourth fiscal quarter of 2016, and completed other environmental aspects of the project during fiscal 2017. The sale of the property is anticipated to follow in a subsequent period, and any future expenses related to the project are not anticipated to be material.
Acquisition-Related Costs
In fiscal 2017, the Company incurred $584,000 of costs related to our acquisition of certain assets of Resin Designs. This acquisition was accounted for as a business combination in accordance with applicable accounting standards, and all related professional service fees (including banking, legal, accounting, and actuarial fees) were expensed as incurred during the year ended August 31, 2017.
In fiscal 2015, the Company incurred $584,000 of costs related to our acquisition of the specialty chemical intermediates product line. This acquisition was accounted for as a business combination in accordance with applicable accounting standards, and as such all related professional service fees (including banking, legal, accounting, and actuarial fees) were expensed as incurred during the year ended August 31, 2015.
Write-down of Certain Assets Under Construction
In fiscal 2016, the Company recorded a $365,000 charge related to the full write-down of certain structural composites tangible assets (construction in progress) located in its Granite Falls, NC facility. The fiscal 2016 sale of our RodPack wind energy business (and related intangible assets), contained within the structural composites product line, placed a limitation on the Company’s ability to sell certain other goods produced for the same product line, resulting in our determination to fully write-down certain assets under construction during the year.
Interest Expense
Interest expense decreased $215,000 or 20% to $839,000 in fiscal 2017 compared to $1,054,000 in fiscal 2016. Interest expense decreased $9,000 or 1% to $1,054,000 in fiscal 2016 compared to $1,063,000 in fiscal 2015. The continued decrease in interest expense is a result of the reduction in our overall average debt balance through principal payments prior to the Company’s refinancing in December 2016, and elective payments following the refinancing, made from cash provided by operations. As of August 31, 2017, there was no outstanding balance of the Company’s $150,000,000 revolving debt facility.
22
Gain on Sale of Real Estate
In November 2016, the Company finalized the sale of its Paterson, NJ property for proceeds of $1,382,000. This transaction resulted in a gain of $792,000 which was recorded during the year ended August 31, 2017. The Company had previously reclassified the related long-lived assets to assets held for sale after committing to a plan in February 2016 to actively market the property. The assets held for sale had previously been reported within Corporate and Common assets.
In October 2016, Chase entered an agreement to sell its former corporate headquarters and executive offices in Bridgewater, MA. In December 2016, the sale was finalized for gross proceeds of $740,000, resulting in a gain on sale of $68,000 recognized during the year ended August 31, 2017.
Gain on Sale of Businesses
On April 3, 2017, Chase executed an agreement with an unrelated party to sell all inventory, machinery and equipment and intangible assets of its fiber optic cable components product line for proceeds of $3,858,000, net of transaction costs and following certain working capital adjustments. The fiber optic cable components product line had been a part of our Industrial Materials segment. Given its low-growth and low-margin prospects, and a customer, supplier and equipment base separate from our other businesses, the product line was determined to not be part of Chase’s long-term strategy. The resulting pre-tax gain on sale of $2,013,000 was recognized during the year ended August 31, 2017. Further, the purchaser entered a multiyear lease for a portion of the manufacturing space at the Company’s Granite Falls, NC facility. Chase will provide ongoing manufacturing and administrative support to the purchaser for which the Company will receive additional consideration upon the performance of services.
In the first quarter of fiscal 2016, the Company sold the RodPack wind energy business formerly contained within its structural composites product line, part of the Industrial Materials segment. This transaction resulted in a pre-tax book gain of $1,031,000, which was recorded in fiscal 2016. The Company will provide ongoing development support to the buyer for which it will receive additional consideration upon the completion of services.
Other Income (Expense)
Other income was $724,000 in fiscal 2017 compared to other income of $2,351,000 in fiscal 2016, a decrease of $1,627,000. Other income (expense) primarily includes interest income, rental income, foreign exchange gains (losses) caused by changes in exchange rates on transactions or balances denominated in currencies other than the functional currency of our subsidiaries and other non-trade/non-royalty- and non-commission-related receipts. Other income (expense) in the current year was largely net foreign exchange gains resulting from sales made from our U.K.-based operations and denominated in U.S. dollars and euros. British Pound Sterling exchange volatility was lower in the current year than that observed in the prior year, ultimately resulting in lower net foreign exchange gains recognized. Also included in fiscal 2017 was a $300,000 gain on the settlement of a claim and the release of an escrow related to a prior acquisition.
Other income was $2,351,000 in fiscal 2016 compared to other income of $44,000 in fiscal 2015, an increase of $2,307,000. Other income in 2016 was primarily the result of sales made from our U.K.-based operations but denominated in either U.S. dollars or euros. This income was most predominantly observed in our fourth fiscal quarter of 2016, following the June 23, 2016 referendum by British voters to exit the European Union (“Brexit”), which impacted global currency markets and resulted in a decline in the value of the British pound, as compared to the U.S. dollar and euro.
23
Income Taxes
Our effective tax rate for fiscal 2017 was 31.0% as compared to 34.5% and 35.9% in fiscal 2016 and 2015, respectively. The current year effective tax rate was affected by the Company’s fiscal 2017 adoption of ASU No. 2016-09, “Compensation – Stock Compensation (Topic 718), Improvements to Employee Share-Based Payment Accounting.” During fiscal 2017, the Company recognized an excess tax benefit from stock-based compensation of $1,917,000, within income tax expense on the consolidated statements of operations (adopted prospectively). The Company anticipates the potential for increased periodic volatility in future effective tax rates based on the continued application of ASU No. 2016-09. Additionally, in all three years we have received the benefit of the domestic production deduction.
Noncontrolling Interest
The income from noncontrolling interest relates to a joint venture in which we had, prior to October 2014, a 50% controlling ownership interest. We acquired the 50% outstanding noncontrolling membership interest in October 2014 (the first quarter of fiscal 2015). The joint venture between the Company and its now-former joint venture partner (an otherwise unrelated party) was managed and operated on a day-to-day basis by the Company.
Net Income Attributable to Chase Corporation
Net income attributable to Chase Corporation in fiscal 2017 increased $9,207,000 or 28% to $42,014,000 compared to $32,807,000 in fiscal 2016. The increase in net income in 2017 was primarily due to: (a) an increased sales volume, including increases in revenue and earnings provided by the acquired operations of Resin Designs; (b) gains on the sales of our fiber optic cable components product line and our Paterson, NJ and Bridgewater, MA real estate; and (c) the recognition of excess tax benefit related to our early adoption of ASU No. 2016-09. These gains were partially offset by increased amortization expense recognized related to our September 30, 2016 acquisition of certain assets of Resin Designs.
Net income attributable to Chase Corporation in fiscal 2016 increased $6,489,000 or 25% to $32,807,000 compared to $26,318,000 in fiscal 2015. The increase in net income in 2016 was primarily due to: (a) an improved gross margin based on sales mix, including increases in revenue and earnings provided by the specialty chemical intermediates product line which we acquired in the second quarter of fiscal 2015; (b) foreign exchange transaction gains recognized in other income (expense); and (c) a gain on the sale of our RodPack wind energy business in November 2015.
Other Important Performance Measures
We believe that EBITDA, Adjusted EBITDA and Free Cash Flow are useful performance measures. They are used by our executive management team to measure operating performance, to allocate resources, to evaluate the effectiveness of our business strategies and to communicate with our Board of Directors and investors concerning our financial performance. The Company believes EBITDA, Adjusted EBITDA and Free Cash Flow are commonly used by financial analysts and others in the industries in which the Company operates and thus provide useful information to investors. EBITDA, Adjusted EBITDA and Free Cash Flow are non-GAAP financial measures.
We define EBITDA as net income attributable to Chase Corporation before interest expense from borrowings, income tax expense, depreciation expense from fixed assets, and amortization expense from intangible assets. We define Adjusted EBITDA as EBITDA excluding costs and (gains) losses related to our acquisitions and divestitures, costs of products sold related to inventory step-up to fair value, settlement (gains) losses resulting from lump sum distributions to participants from our defined benefit plans, and other significant items. We define Free Cash Flow as net cash provided by operating activities less purchases of property, plant and equipment.
24
The use of EBITDA, Adjusted EBITDA and Free Cash Flow has limitations and these performance measures should not be considered in isolation from, or as an alternative to, U.S. GAAP measures such as net income attributable to Chase Corporation and net cash provided by operating activities. None of these measures should be interpreted as representing the residual cash flow of the Company available for discretionary expenditures or to invest in the growth of our business, since we have certain non-discretionary expenditures that are not deducted from these measures, including scheduled principal and (in the case of Free Cash Flow) interest payments on outstanding debt. Our measurement of EBITDA, Adjusted EBITDA and Free Cash Flow may not be comparable to similarly-titled measures used by other companies.
The following table provides a reconciliation of net income attributable to Chase Corporation, the most directly comparable financial measure presented in accordance with U.S. GAAP, to EBITDA and Adjusted EBITDA for the periods presented (dollars in thousands):
|
|
|
|
|
Years Ended August 31, |
|
|||||||
|
|
|
|
|
2017 |
|
2016 |
|
2015 |
|
|||
|
Net income |
|
|
|
$ |
42,014 |
|
$ |
32,807 |
|
$ |
26,318 |
|
|
Interest expense |
|
|
|
|
839 |
|
|
1,054 |
|
|
1,063 |
|
|
Income taxes |
|
|
|
|
18,878 |
|
|
17,303 |
|
|
14,813 |
|
|
Depreciation expense |
|
|
|
|
5,130 |
|
|
5,606 |
|
|
5,810 |
|
|
Amortization expense |
|
|
|
|
9,127 |
|
|
7,836 |
|
|
6,762 |
|
|
EBITDA |
|
|
|
$ |
75,988 |
|
$ |
64,606 |
|
$ |
54,766 |
|
|
Gain on sale of businesses (a) |
|
|
|
|
(2,013) |
|
|
(1,031) |
|
|
— |
|
|
Exit costs related to idle facility (b) |
|
|
|
|
70 |
|
|
935 |
|
|
— |
|
|
Gain on sale of real estate (c) |
|
|
|
|
(860) |
|
|
— |
|
|
— |
|
|
Cost of sale of inventory step-up (d) |
|
|
|
|
190 |
|
|
— |
|
|
65 |
|
|
Acquisition-related costs (e) |
|
|
|
|
584 |
|
|
— |
|
|
584 |
|
|
Pension settlement costs (f) |
|
|
|
|
14 |
|
|
13 |
|
|
188 |
|
|
Annuity settlement (g) |
|
|
|
|
— |
|
|
(877) |
|
|
— |
|
|
Write-down of certain assets under construction (h) |
|
|
|
|
— |
|
|
365 |
|
|
— |
|
|
Adjusted EBITDA |
|
|
|
$ |
73,973 |
|
$ |
64,011 |
|
$ |
55,603 |
|
|
(a) |
Represents gain on sale of the fiber optic cable components product line that was completed April 2017 (fiscal 2017) and the RodPack wind energy business contained within the structural composites product line that was completed in November 2015 (fiscal 2016) |
|
(b) |
Represents Randolph, MA facility exit and demolition costs incurred |
|
(c) |
Represents gain on November 2016 sale of the Company’s Paterson, NJ location, and December 2016 sale of the Company’s former corporate headquarters in Bridgewater, MA |
|
(d) |
Represents expenses related to inventory step-up in fair value related to the September 2017 acquisition of certain assets of Resin Designs and the January 2015 acquisition of the specialty chemical intermediates product line |
|
(e) |
Represents costs related to the September 2017 acquisition of certain assets of Resin Designs and the January 2015 acquisition of the specialty chemical intermediates product line |
|
(f) |
Represents pension-related settlement costs due to the timing of lump sum distributions |
|
(g) |
Represents the gain recognized on write-down of an accrued annuity previously owed by the Company |
|
(h) |
Represents a write-down of certain structural composites assets under construction based on usage constraints recognized following the sale of the RodPack wind energy business in November 2015 |
The following table provides a reconciliation of net cash provided by operating activities, the most directly comparable financial measure presented in accordance with U.S. GAAP, to Free Cash Flow for the periods presented (dollars in thousands):
|
|
|
|
|
Years Ended August 31, |
|||||||
|
|
|
|
|
2017 |
|
2016 |
|
2015 |
|||
|
Net cash provided by operating activities |
|
|
|
$ |
51,932 |
|
$ |
48,833 |
|
$ |
40,959 |
|
Purchases of property, plant and equipment |
|
|
|
|
(3,199) |
|
|
(2,046) |
|
|
(2,642) |
|
Free Cash Flow |
|
|
|
$ |
48,733 |
|
$ |
46,787 |
|
$ |
38,317 |
|
|
|
|
|
|
|
|
|
|
|
|
|
25
The following table provides a summary of net cash used in investing activities and financing activities, presented in accordance with U.S. GAAP, for the periods presented (dollars in thousands):
|
|
|
|
|
Years Ended August 31, |
|||||||
|
|
|
|
|
2017 |
|
2016 |
|
2015 |
|||
|
Net cash used in investing activities |
|
|
|
$ |
(25,102) |
|
$ |
(612) |
|
$ |
(35,713) |
|
Net cash used in financing activities |
|
|
|
$ |
(52,796) |
|
$ |
(15,299) |
|
$ |
(13,498) |
Liquidity and Sources of Capital
Our cash balance decreased $26,057,000 to $47,354,000 at August 31, 2017 from $73,411,000 at August 31, 2016. The decreased cash balance is primarily attributable to: (a) the repayment of $43,400,000 of debt principal, (b) the $30,270,000 in net cash paid for the September 2016 acquisition of certain assets of Resin Designs, LLC; and (c) the payment of our annual dividend totaling $6,532,000. The overall decrease was positively impacted by: (a) cash from operations of $51,932,000; (b) cash proceeds from the sale of our fiber optic cable components product line of $3,458,000; (c) cash proceeds from the sale of our Paterson, NJ and Bridgewater, MA real estate totaling $2,122,000; and (d) cash reimbursement related to the release of claims to a life insurance policy of $1,504,000. Of the above noted amounts, $31,756,000 and $27,550,000 were held outside the U.S. by Chase Corporation and our foreign subsidiaries as of August 31, 2017 and 2016, respectively. Given our cash position and borrowing capability in the U.S. and the potential for increased investment and acquisitions in foreign jurisdictions, we do not have a history of repatriating a significant portion of our foreign cash. However, we do not currently take the position that undistributed foreign subsidiaries’ earnings are considered to be permanently reinvested. Accordingly, we recognize a deferred tax liability for the estimated future tax effects attributable to temporary differences due to these unremitted earnings. In the event that circumstances should change in the future and we decide to repatriate these foreign amounts to fund U.S. operations, the Company would pay the applicable U.S. taxes on these repatriated foreign amounts, less any tax credit offsets, to satisfy all previously recorded tax liabilities.
Our cash balance increased $29,592,000 to $73,411,000 at August 31, 2016 from $43,819,000 at August 31, 2015. The increased cash balance was primarily attributable to cash from operations, the sale of the RodPack wind energy business and proceeds from the cash surrender value of a life insurance policy. The overall increase was negatively impacted by: (a) principal payments made on our term debt; (b) payment of the annual dividend in December 2015; (c) cash paid for purchases of machinery and equipment at our manufacturing locations; and (d) cash paid for our acquisition of Spray Products (India) Private Limited (renamed HumiSeal India Private Limited in December 2016).
Cash provided by operations was $51,932,000 for the year ended August 31, 2017 compared to $48,833,000 in fiscal 2016. Cash provided by operations during fiscal 2017 was primarily due to operating income and increased accounts payable. Increased accounts payable resulted from the timing of payments. Partially offsetting the overall amount of cash provided by operations were increased accounts receivable (based on increased fourth quarter sales) and decreased accrued compensation and other expenses (based on certain payouts from the Company’s non-qualified deferred savings plan in fiscal 2017 totaling $1,131,000).
Cash provided by operations was $48,833,000 for the year ended August 31, 2016 compared to $40,959,000 in fiscal 2015. Cash provided by operations during fiscal 2016 was primarily due to operating income and decreased accounts receivable and inventories. Decreased accounts receivable resulted from lower international sales in the fourth quarter of fiscal 2016, which customarily have longer collection terms, while decreased inventory was a result of the enhanced inventory management control the Company is exercising through the use of its companywide ERP system, whose rollout was substantially completed in fiscal 2015. Partially offsetting the overall amount of cash provided by operations was a decrease in accounts payable, a direct result of the Company maintaining a lower inventory balance.
The ratio of current assets to current liabilities was 4.2 as of August 31, 2017 compared to 2.0 as of August 31, 2016. The increase in our current ratio in fiscal 2017 was primarily attributable to the classification of our debt as current at August 31, 2016 (total balance of $43,400,000) prior to our entry into the New Credit Agreement (defined below) in December 2016, which we eventually paid down during fiscal 2017. This was partially offset by the $26,057,000 decrease in cash and cash equivalents during fiscal 2017.
26
Cash used in investing activities was $25,102,000 for the year ended August 31, 2017 compared to $612,000 in fiscal 2016. During fiscal 2017, cash used in investing activities was primarily due to our acquisition of certain assets of Resin Designs, LLC in September 2016, in addition to cash paid for purchases of machinery and equipment at our manufacturing locations. These uses were partially offset by cash received from the sale of our fiber optic cable components business and both our Paterson, NJ location and our former corporate headquarters in Bridgewater, MA, as well as in relation to a life insurance policy.
During fiscal 2016, cash used in investing activities was $612,000 compared to $35,713,000 in fiscal 2015. During fiscal 2016, cash used in investing activities was primarily due to the acquisition of the Spray Products (India) Private Limited business (renamed HumiSeal India Private Limited in December 2016), in addition to cash paid for purchases of machinery and equipment at our manufacturing locations. These uses were partially offset by cash received from both the sale of our RodPack wind energy business and in relation to a life insurance policy.
Cash used in financing activities was $52,796,000 for the year ended August 31, 2017 compared to $15,299,000 in fiscal 2016 and $13,498,000 in fiscal 2015. During fiscal 2017, 2016 and 2015, cash used in financing activities was primarily due to our annual dividend payment, payments made on the term debt used to finance our fiscal 2012 acquisition of NEPTCO, described in more detail below, and, after December 15, 2016, payments made on the Company’s new revolving credit facility, described in more detail below
On October 30, 2017, we announced a cash dividend of $0.80 per share (totaling approximately $7,490,000) to shareholders of record on November 9, 2017 and payable on December 6, 2017.
On November 1, 2016, we announced a cash dividend of $0.70 per share (resulting in payment of $6,532,000) to shareholders of record on November 11, 2016 and payable on December 7, 2016.
On October 28, 2015, we announced a cash dividend of $0.65 per share (resulting in payment of $5,999,000) to shareholders of record on November 9, 2015 and paid on December 4, 2015.
In June 2012, in connection with our acquisition of NEPTCO, we borrowed $70,000,000 under a five-year term debt financing arrangement led and arranged by Bank of America, with participation from RBS Citizens (the “2012 Credit Facility”). The applicable interest rate was based on the effective LIBOR plus an additional amount in the range of 1.75% to 2.25%, depending on our consolidated leverage ratio. The 2012 Credit Facility required repayment of the principal amount of the term loan in quarterly installments. Installment payments of $1,400,000 began in September 2012 and continued through June 2014, increased to $1,750,000 per quarter thereafter through June 2015, and increased to $2,100,000 per quarter thereafter, and were scheduled to continue at this amount through March 2017. The 2012 Credit Facility had a scheduled maturity date of June 27, 2017, prior to the refinancing described below.
Under the 2012 Credit Facility, Chase also had a revolving line of credit with Bank of America (the “2012 Revolver”) totaling $15,000,000, which bore interest at LIBOR plus an additional amount in the range of 1.75% to 2.25%, depending on our consolidated leverage ratio, or, at our option, at the bank’s base lending rate. As of December 15, 2016 (the date on which the New Credit Agreement was entered into), the entire amount of $15,000,000 was available for use. The 2012 Revolver had a scheduled maturity date of June 27, 2017 prior to its refinancing.
The 2012 Credit Facility with Bank of America contained customary affirmative and negative covenants that, among other things, restricted our ability to incur additional indebtedness. It also required us to maintain a ratio of consolidated indebtedness to consolidated EBITDA (each as defined in the facility) of no more than 3.00 to 1.00, and to maintain a consolidated fixed charge coverage ratio (as calculated in the facility) of at least 1.25 to 1.00. We were in compliance with our debt covenants of the 2012 Credit Facility as of November 30, 2016 (the last measurement date for the 2012 Credit Facility).
On December 15, 2016, we entered an Amended and Restated Credit Agreement (the “New Credit Agreement”) with Bank of America, acting as administrative agent, and with participation from Citizens Bank and JPMorgan Chase Bank (collectively with Bank of America, the “Lenders”). The New Credit Agreement is initially an all-revolving credit
27
facility with a borrowing capacity of $150,000,000, which can be increased by an additional $50,000,000 at the request of the Company and the individual or collective option of any of the Lenders. The New Credit Agreement contains customary affirmative and negative covenants that, among other things, restrict our ability to incur additional indebtedness and require certain lender approval for acquisitions by us and our subsidiaries over a certain size. It also requires us to maintain certain financial ratios on a consolidated basis, including a consolidated net leverage ratio (as defined in the facility) of no more than 3.25 to 1.00, and a consolidated fixed charge coverage ratio (as defined in the facility) of at least 1.25 to 1.00. We were in compliance with our debt covenants as of August 31, 2017. The applicable interest rate for the New Credit Agreement is based on the effective LIBOR plus an additional amount in the range of 1.00% to 1.75%, depending on our consolidated net leverage ratio or, at our option, at the bank’s base lending rate. At August 31, 2017, there was no outstanding principal balance, and as such no applicable interest rate. The New Credit Agreement was used to refinance our previously existing term loan and revolving line of credit, and also provides for additional liquidity to finance potential acquisitions, working capital, capital expenditures, and other general corporate purposes.
We have several on-going capital projects, as well as our facility rationalization and consolidation initiative, which are important to our long-term strategic goals. Further, machinery and equipment will be added as needed to increase capacity or enhance operating efficiencies in our other manufacturing plants.
During fiscal 2017, we finalized the sale of both our Paterson, NJ and Bridgewater, MA real estate and entered the final stages of razing our location in Randolph, MA, in preparation for its eventual sale. All these actions were done as part of our continued facility rationalization and consolidation plan.
We may acquire companies or other assets in future periods which are complementary to our business. We believe that our existing resources, including cash on hand and the New Credit Agreement, together with cash generated from operations and additional bank borrowings, will be sufficient to fund our cash flow requirements through at least the next twelve months. However, there can be no assurance that additional financing, if needed, will be available on favorable terms, if at all.
To the extent that interest rates increase in future periods, we will assess the impact of these higher interest rates on the financial and cash flow projections of our potential acquisitions.
We have no material off-balance sheet arrangements.
Contractual Obligations
The following table summarizes our contractual cash obligations at August 31, 2017 and the effect such obligations are expected to have on our liquidity and cash flow in future periods (dollars in thousands):
|
|
|
|
|
|
Payments Due |
|
Payments Due |
|
Payments Due |
|
Payments After |
|
||||
|
Contractual Obligations |
|
Total |
|
Less than 1 Year |
|
1 - 3 Years |
|
3 - 5 Years |
|
5 Years |
|
|||||
|
Operating leases |
|
$ |
10,306 |
|
$ |
1,623 |
|
$ |
3,127 |
|
$ |
2,415 |
|
$ |
3,141 |
|
|
Purchase obligations |
|
|
10,344 |
|
|
10,344 |
|
|
— |
|
|
— |
|
|
— |
|
|
Total (1) (2) |
|
$ |
20,650 |
|
$ |
11,967 |
|
$ |
3,127 |
|
$ |
2,415 |
|
$ |
3,141 |
|
|
|
|
|
|
|
|
|
|
|
|
|
|
|
|
|
|
|
|
(1) |
We may be required to make payments related to our unrecognized tax benefits. However, due to the uncertainty of the timing of future cash flows associated with these unrecognized tax benefits, we are unable to make reasonably reliable estimates of the period of cash settlement, if any, with the respective taxing authorities. Accordingly, unrecognized tax benefits of $1,257,000 as of August 31, 2017 have been excluded from the contractual obligations table above. See Note 7 “Income Taxes” to the Consolidated Financial Statements for further information. |
|
(2) |
This table does not include the expected payments for our obligations for pension and other post-retirement benefit plans. As of August 31, 2017, we had recognized an accrued benefit plan liability of $14,236,000 representing the unfunded obligations of the pension benefit plans. See Note 9 “Benefits and Pension Plans” to the Consolidated Financial Statements for further information, including expected pension benefit payments for the next 10 years. |
28
Recently Issued Accounting Standards
For discussion of the newly issued accounting pronouncements see “Recently Issued Accounting Standards” and “Recently Adopted Accounting Standards” in Note 1— “Summary of Significant Accounting Policies” to the Consolidated Financial Statements included in this Report.
Critical Accounting Policies, Judgments, and Estimates
The U.S. Securities and Exchange Commission (“SEC”) requires companies to provide additional disclosure and commentary on their most critical accounting policies. The SEC has defined the most critical accounting policies as the ones that are most important to the portrayal of a company’s financial condition and operating results, and requires management to make its most significant estimates and judgments in the preparation of its consolidated financial statements. Our critical accounting policies are described below.
Accounts Receivable
We evaluate the collectability of accounts receivable balances based on a combination of factors. In cases where we are aware of circumstances that may impair a specific customer’s ability to meet its financial obligations to us, a specific allowance against amounts due to us is recorded, and thereby reduces the net recognized receivable to the amount we reasonably believe will be collected. For all other customers, we recognize allowances for doubtful accounts based on the length of time the receivables are past due, industry and geographic concentrations, the current business environment and our historical experience. If the financial condition of our customers deteriorates or if economic conditions worsen, additional allowances may be required in the future, which could have an adverse impact on our future operating results.
Inventory
We value inventory at the lower of cost or net realizable value using the first in, first out (FIFO) method. Management assesses the recoverability of inventory based on types and levels of inventory held, forecasted demand and changes in technology. These assessments require management judgments and estimates, and valuation adjustments for excess and obsolete inventory may be recorded based on these assessments. We estimate excess and obsolescence exposures based upon assumptions about future demand, product transitions, and market conditions, and record adjustments to reduce inventories to their estimated net realizable value. The failure to accurately forecast demand may lead to additional excess and obsolete inventory and future charges.
Business Combinations
We assign the value of the consideration transferred to acquire a business to the tangible assets and identifiable intangible assets acquired, and liabilities assumed on the basis of their fair values at the date of acquisition. We assess the fair value of assets, including intangible assets, using a variety of methods, and each asset is measured at fair value from the perspective of a market participant. The method used to estimate the fair values of intangible assets incorporates significant assumptions regarding the estimates a market participant would make in order to evaluate an asset, including a market participant’s use of the asset and the appropriate discount rates for a market participant. Assets recorded from the perspective of a market participant that are determined to not have economic use for us are expensed immediately. Any excess purchase price over the fair value of the net tangible and intangible assets acquired is allocated to goodwill. Transaction costs and restructuring costs associated with a transaction to acquire a business are expensed as incurred.
29
Goodwill, Intangible Assets, and Other Long-Lived Assets
Long-lived assets consist of goodwill, identifiable intangible assets, trademarks, patents and agreements and property, plant, and equipment. Intangible assets and property, plant, and equipment, excluding goodwill, are amortized over their estimated useful life. We review long-lived assets and all intangible assets for impairment whenever events or changes in circumstances indicate the carrying amount of such assets may not be recoverable.
Goodwill is also reviewed at least annually for impairment. We perform our annual goodwill impairment assessment during the fourth fiscal quarter of each year. In fiscal 2017, we early adopted ASU No. 2017-04 “Intangibles - Goodwill and Other Topics (Topic 350): Simplifying the Test for Goodwill Impairment.” We assess goodwill for impairment by comparing the fair value of the reporting unit to its carrying amount. If the fair value of a reporting unit is less than its carrying value, an impairment loss, limited to the amount of goodwill allocated to that reporting unit, is recorded. Fair values for reporting units are determined based on the income approach (discounted cash flow method).
Revenue
We recognize revenue when persuasive evidence of an arrangement exists, performance of our obligation is complete, our price to the buyer is fixed or determinable, and we are reasonably assured of collecting. These four transaction elements are typically met at the time of shipment or upon receipt by the customer based on contractual terms. If a loss is anticipated on any contract, a provision for the entire loss is made immediately. Revenue recognition involves judgments and assessments of expected returns, and the likelihood of nonpayment by customers. We analyze various factors, including a review of specific customer contracts and shipment terms, historical experience, creditworthiness of customers and current market and economic conditions in determining when to recognize revenue. Changes in judgments on these factors could impact the timing and amount of revenue recognized with a resulting impact on the timing and amount of operating income. For certain products, consigned inventory is maintained at customer locations, and revenue is typically recognized in the period that the consigned inventory is consumed. Royalty revenue is recognized based on licensee production statements received from the authorized manufacturers. Billed shipping and handling fees are recorded as sales revenue with the associated costs recorded within cost of products and services sold.
Uncertain Tax Positions
We are subject to routine income tax audits that occur periodically in the normal course of business. Our contingent income tax liabilities are estimated based on the methodology prescribed in the guidance for accounting for uncertain tax positions. The guidance prescribes a minimum recognition threshold a tax position is required to meet before being recognized in the financial statements. Our liabilities related to uncertain tax positions require an assessment of the probability of the income-tax-related exposures and settlements. Our assessment is based on our historical audit experiences with various state and federal taxing authorities, as well as by current income tax trends. If circumstances change, we may be required to record adjustments that could be material to our reported financial condition and results of operations. See Note 7 to the Consolidated Financial Statements included in this Report for more information on our accounting for uncertain tax positions.
Deferred Income Taxes
We evaluate the need for a valuation allowance to reduce our deferred tax assets to the amount that is more likely than not to be realized. We have considered future taxable income and ongoing prudent and feasible tax planning strategies in assessing the need for a valuation allowance. Should we determine that we would not be able to realize all or part of our net deferred tax asset in the future, an adjustment to the deferred tax asset would be charged to income in the period such determination was made.
30
Stock-Based Compensation
We measure compensation cost for share-based compensation at fair value and recognize the expense over the period that the recipient is required to provide service in exchange for the award, which generally is the vesting period. We use the Black-Scholes option pricing model to measure the fair value of stock options. This model requires significant estimates related to the award’s expected life and future stock price volatility of the underlying equity security. Historically, in determining the amount of expense to be recorded, we were required to estimate forfeiture rates for awards, based on the probability that employees will complete the required service period. We estimated the forfeiture rate based on historical experience. In fiscal 2017, we early adopted ASU No. 2016-09, “Compensation – Stock Compensation (Topic 718), Improvements to Employee Share-Based Payment Accounting.” Following the adoption of the new standard, the Company has elected to account for forfeitures as they occur.
Pension Benefits
We sponsor a non-contributory defined benefit pension plan covering employees of certain divisions of the Company. In calculating our retirement plan obligations and related expense, we make various assumptions and estimates. These assumptions include discount rates, benefits earned, expected return on plan assets, mortality rates, and other factors. While we believe that the assumptions used are appropriate, differences in actual experience or changes in assumptions may affect our pension obligations and future expense.
Effective December 1, 2008, the Chase defined benefit pension plan was amended to include a “soft freeze” whereby any employee hired after the effective date of December 1, 2008 will not be admitted to the plan. The only exception related to employees who are members of the International Association of Machinists and Aerospace Workers Union whose contract was amended to include a soft freeze whereby any employees hired after the effective date of July 15, 2012 will not be admitted to the plan. All eligible participants who were previously admitted to the plan prior to the applicable soft freeze dates will continue to accrue benefits as detailed in the plan agreements.
Through our wholly-owned subsidiary NEPTCO, we have another defined benefit pension plan covering substantially all of our union employees at our Pawtucket, RI plant. This plan was frozen effective October 31, 2006, and as a result, no new participants can enter the plan and the benefits of current participants were frozen as of that date. The benefits are based on years of service and the employee’s average compensation during the earlier of five years before retirement, or October 31, 2006.
We account for our pension plans following the requirements of ASC Topic 715, “Compensation – Retirement Benefits” (“ASC 715”). ASC 715 requires an employer to: (a) recognize in its statement of financial position the funded status of a benefit plan; (b) measure defined benefit plan assets and obligations as of the end of the employer’s fiscal year (with limited exceptions); and (c) recognize as a component of other comprehensive income, net of tax, the gains or losses and prior service costs or credits that arise but are not recognized as components of net periodic benefit costs pursuant to prior existing guidance.
Impact of Inflation
Inflation has not had a significant long-term impact on our earnings. In the event of significant inflation, our efforts to recover cost increases would be hampered as a result of the competitive nature of the industries in which we operate.
31
Item 7a – Quantitative and Qualitative Disclosures about Market Risk
We limit the amount of credit exposure to any one issuer. At August 31, 2017, other than our restricted investments (which are restricted for use in a non-qualified retirement savings plan for certain key employees and members of the Board of Directors), all of our funds were either in demand deposit accounts or investment instruments that meet high credit quality standards such as money market funds, government securities, or commercial paper.
Our domestic operations have limited currency exposure since substantially all transactions are denominated in U.S. dollars. However, our European and Asian operations are subject to currency exchange fluctuations. We continue to review our policies and procedures to control this exposure while maintaining the benefit from these operations and sales not denominated in U.S. dollars. The effect of an immediate hypothetical 10% change in the exchange rate between the British pound and the U.S. dollar would not have a material effect on the Company’s overall liquidity. As of August 31, 2017, the Company had cash balances in the following foreign currencies (with USD equivalents):
|
Currency Code |
|
Currency Name |
|
USD Equivalent at August 31, 2017 |
|
|
|
GBP |
|
British Pound |
|
$ |
22,124,000 |
|
|
EUR |
|
Euro |
|
$ |
3,996,000 |
|
|
CNY |
|
Chinese Yuan |
|
$ |
345,000 |
|
|
INR |
|
Indian Rupee |
|
$ |
96,000 |
|
|
CAD |
|
Canadian Dollar |
|
$ |
87,000 |
|
|
|
|
|
|
|
|
|
We will continue to review our current cash balances denominated in foreign currency in light of current tax guidelines and potential acquisitions.
We recognized a foreign currency translation gain for the year ended August 31, 2017 in the amount of $788,000 related to our European and Indian operations, which is recorded in accumulated other comprehensive income (loss) within our Statement of Equity. The functional currency for all our other operations is the U.S. Dollar. We do not have or utilize any derivative financial instruments.
We pay interest on our outstanding long-term debt at interest rates that fluctuate based upon changes in various base interest rates. The carrying value of our long-term debt, including the current portion, was $0 at August 31, 2017. See “Item 7 — Management’s Discussion and Analysis of Financial Condition and Results of Operations — Liquidity and Sources of Capital, ” Note 6 — “Long-Term Debt” and Note 16 — “Fair Value Measurements” to the Consolidated Financial Statements for additional information regarding our outstanding long-term debt. The effect of an immediate hypothetical 10% change in variable interest rates would not have a material effect on our Consolidated Financial Statements.
32
Item 8 – Financial Statements and Supplementary Data
The following Consolidated Financial Statements of Chase Corporation are filed as part of this Annual Report on Form 10-K:
Index to Consolidated Financial Statements:
|
|
|
Page No. |
|
|
|
|
|
|
34 | |
|
|
|
|
|
|
35 | |
|
|
|
|
|
|
36 | |
|
|
|
|
|
|
37 | |
|
|
|
|
|
|
38 | |
|
|
|
|
|
|
39 | |
|
|
|
|
|
|
40 |
33
Report of Independent Registered Public Accounting Firm
To the Board of Directors and Stockholders of Chase Corporation
In our opinion, the accompanying consolidated balance sheets and the related consolidated statements of operations, of comprehensive income, of equity and of cash flows present fairly, in all material respects, the financial position of Chase Corporation and its subsidiaries as of August 31, 2017 and 2016, and the results of their operations and their cash flows for each of the three years in the period ended August 31, 2017 in conformity with accounting principles generally accepted in the United States of America. Also in our opinion, the Company maintained, in all material respects, effective internal control over financial reporting as of August 31, 2017, based on criteria established in Internal Control - Integrated Framework (2013) issued by the Committee of Sponsoring Organizations of the Treadway Commission (COSO). The Company's management is responsible for these financial statements, for maintaining effective internal control over financial reporting and for its assessment of the effectiveness of internal control over financial reporting, included in Management’s Report on Internal Control Over Financial Reporting appearing under Item 9A. Our responsibility is to express opinions on these financial statements and on the Company's internal control over financial reporting based on our integrated audits. We conducted our audits in accordance with the standards of the Public Company Accounting Oversight Board (United States). Those standards require that we plan and perform the audits to obtain reasonable assurance about whether the financial statements are free of material misstatement and whether effective internal control over financial reporting was maintained in all material respects. Our audits of the financial statements included examining, on a test basis, evidence supporting the amounts and disclosures in the financial statements, assessing the accounting principles used and significant estimates made by management, and evaluating the overall financial statement presentation. Our audit of internal control over financial reporting included obtaining an understanding of internal control over financial reporting, assessing the risk that a material weakness exists, and testing and evaluating the design and operating effectiveness of internal control based on the assessed risk. Our audits also included performing such other procedures as we considered necessary in the circumstances. We believe that our audits provide a reasonable basis for our opinions.
As discussed in Note 1 to the consolidated financial statements, the Company changed the manner in which it accounts for stock-based compensation in 2017.
A company’s internal control over financial reporting is a process designed to provide reasonable assurance regarding the reliability of financial reporting and the preparation of financial statements for external purposes in accordance with generally accepted accounting principles. A company’s internal control over financial reporting includes those policies and procedures that (i) pertain to the maintenance of records that, in reasonable detail, accurately and fairly reflect the transactions and dispositions of the assets of the company; (ii) provide reasonable assurance that transactions are recorded as necessary to permit preparation of financial statements in accordance with generally accepted accounting principles, and that receipts and expenditures of the company are being made only in accordance with authorizations of management and directors of the company; and (iii) provide reasonable assurance regarding prevention or timely detection of unauthorized acquisition, use, or disposition of the company’s assets that could have a material effect on the financial statements.
Because of its inherent limitations, internal control over financial reporting may not prevent or detect misstatements. Also, projections of any evaluation of effectiveness to future periods are subject to the risk that controls may become inadequate because of changes in conditions, or that the degree of compliance with the policies or procedures may deteriorate.
/s/PricewaterhouseCoopers LLP
Boston, Massachusetts
November 9, 2017
34
CHASE CORPORATION
In thousands, except share and per share amounts
|
|
|
August 31, |
|
|
||||
|
|
|
2017 |
|
2016 |
|
|
||
|
ASSETS |
|
|
|
|
|
|
|
|
|
Current Assets |
|
|
|
|
|
|
|
|
|
Cash and cash equivalents |
|
$ |
47,354 |
|
$ |
73,411 |
|
|
|
Accounts receivable, less allowance for doubtful accounts of $456 and $830 |
|
|
38,051 |
|
|
34,835 |
|
|
|
Inventory |
|
|
25,618 |
|
|
25,814 |
|
|
|
Prepaid expenses and other current assets |
|
|
3,098 |
|
|
3,728 |
|
|
|
Due from sale of business |
|
|
— |
|
|
457 |
|
|
|
Assets held for sale |
|
|
14 |
|
|
604 |
|
|
|
Total current assets |
|
|
114,135 |
|
|
138,849 |
|
|
|
|
|
|
|
|
|
|
|
|
|
Property, plant and equipment, less accumulated depreciation of $44,277 and $41,409 |
|
|
34,760 |
|
|
36,742 |
|
|
|
|
|
|
|
|
|
|
|
|
|
Other Assets |
|
|
|
|
|
|
|
|
|
Goodwill |
|
|
50,784 |
|
|
43,576 |
|
|
|
Intangible assets, less accumulated amortization of $42,206 and $33,352 |
|
|
46,846 |
|
|
36,580 |
|
|
|
Cash surrender value of life insurance, less current portion |
|
|
4,530 |
|
|
4,530 |
|
|
|
Restricted investments |
|
|
964 |
|
|
1,637 |
|
|
|
Funded pension plan |
|
|
566 |
|
|
382 |
|
|
|
Deferred income taxes |
|
|
1,614 |
|
|
441 |
|
|
|
Other assets |
|
|
539 |
|
|
82 |
|
|
|
Total assets |
|
$ |
254,738 |
|
$ |
262,819 |
|
|
|
|
|
|
|
|
|
|
|
|
|
LIABILITIES AND EQUITY |
|
|
|
|
|
|
|
|
|
Current Liabilities |
|
|
|
|
|
|
|
|
|
Current portion of long-term debt |
|
$ |
— |
|
$ |
43,400 |
|
|
|
Accounts payable |
|
|
14,455 |
|
|
12,352 |
|
|
|
Accrued payroll and other compensation |
|
|
6,500 |
|
|
6,553 |
|
|
|
Accrued expenses |
|
|
4,052 |
|
|
3,892 |
|
|
|
Accrued income taxes |
|
|
2,333 |
|
|
2,317 |
|
|
|
Total current liabilities |
|
|
27,340 |
|
|
68,514 |
|
|
|
|
|
|
|
|
|
|
|
|
|
Deferred compensation |
|
|
979 |
|
|
1,649 |
|
|
|
Accumulated pension obligation |
|
|
12,666 |
|
|
15,563 |
|
|
|
Other liabilities |
|
|
1,567 |
|
|
328 |
|
|
|
Accrued income taxes |
|
|
1,257 |
|
|
1,229 |
|
|
|
Deferred income taxes |
|
|
— |
|
|
1,447 |
|
|
|
|
|
|
|
|
|
|
|
|
|
Commitments and Contingencies (Notes 6, 8, 22) |
|
|
|
|
|
|
|
|
|
|
|
|
|
|
|
|
|
|
|
Equity |
|
|
|
|
|
|
|
|
|
First Serial Preferred Stock, $1.00 par value: Authorized 100,000 shares; none issued |
|
|
— |
|
|
— |
|
|
|
Common stock, $.10 par value: Authorized 20,000,000 shares; 9,354,136 shares at August 31, 2017 and 9,278,486 shares at August 31, 2016 issued and outstanding |
|
|
935 |
|
|
928 |
|
|
|
Additional paid-in capital |
|
|
14,060 |
|
|
14,719 |
|
|
|
Accumulated other comprehensive loss |
|
|
(13,469) |
|
|
(15,479) |
|
|
|
Retained earnings |
|
|
209,403 |
|
|
173,921 |
|
|
|
Total equity |
|
|
210,929 |
|
|
174,089 |
|
|
|
Total liabilities and equity |
|
$ |
254,738 |
|
$ |
262,819 |
|
|
See accompanying notes to the Consolidated Financial Statements.
35
CHASE CORPORATION
CONSOLIDATED STATEMENTS OF OPERATIONS
In thousands, except share and per share amounts
|
|
|
|
|
Years Ended August 31, |
|
|||||||
|
|
|
|
|
2017 |
|
2016 |
|
2015 |
|
|||
|
|
|
|
|
|
|
|
|
|
|
|
|
|
|
Revenue |
|
|
|
|
|
|
|
|
|
|
|
|
|
Sales |
|
|
|
$ |
247,877 |
|
$ |
234,450 |
|
$ |
234,890 |
|
|
Royalties and commissions |
|
|
|
|
4,683 |
|
|
3,644 |
|
|
3,156 |
|
|
|
|
|
|
|
252,560 |
|
|
238,094 |
|
|
238,046 |
|
|
Costs and Expenses |
|
|
|
|
|
|
|
|
|
|
|
|
|
Cost of products and services sold |
|
|
|
|
146,036 |
|
|
144,438 |
|
|
149,202 |
|
|
Selling, general and administrative expenses |
|
|
|
|
47,736 |
|
|
44,574 |
|
|
46,015 |
|
|
Exit costs related to idle facility (Note 20) |
|
|
|
|
70 |
|
|
935 |
|
|
— |
|
|
Acquisition-related costs (Note 14) |
|
|
|
|
584 |
|
|
— |
|
|
584 |
|
|
Write-down of certain assets under construction (Note 18) |
|
|
|
|
— |
|
|
365 |
|
|
— |
|
|
|
|
|
|
|
|
|
|
|
|
|
|
|
|
Operating income |
|
|
|
|
58,134 |
|
|
47,782 |
|
|
42,245 |
|
|
|
|
|
|
|
|
|
|
|
|
|
|
|
|
Interest expense |
|
|
|
|
(839) |
|
|
(1,054) |
|
|
(1,063) |
|
|
Gain on sale of real estate (Note 19) |
|
|
|
|
860 |
|
|
— |
|
|
— |
|
|
Gain on sale of businesses (Note 18) |
|
|
|
|
2,013 |
|
|
1,031 |
|
|
— |
|
|
Other income (expense) |
|
|
|
|
724 |
|
|
2,351 |
|
|
44 |
|
|
|
|
|
|
|
|
|
|
|
|
|
|
|
|
Income before income taxes |
|
|
|
|
60,892 |
|
|
50,110 |
|
|
41,226 |
|
|
|
|
|
|
|
|
|
|
|
|
|
|
|
|
Income taxes |
|
|
|
|
18,878 |
|
|
17,303 |
|
|
14,813 |
|
|
|
|
|
|
|
|
|
|
|
|
|
|
|
|
Net income |
|
|
|
$ |
42,014 |
|
$ |
32,807 |
|
$ |
26,413 |
|
|
|
|
|
|
|
|
|
|
|
|
|
|
|
|
Add: net (income) loss attributable to noncontrolling interest |
|
|
|
|
— |
|
|
— |
|
|
(95) |
|
|
|
|
|
|
|
|
|
|
|
|
|
|
|
|
Net income |
|
|
|
$ |
42,014 |
|
$ |
32,807 |
|
$ |
26,318 |
|
|
|
|
|
|
|
|
|
|
|
|
|
|
|
|
|
|
|
|
|
|
|
|
|
|
|
|
|
|
Net income available to common shareholders, per common and common equivalent share (Note 17) |
|
|
|
|
|
|
|
|
|
|
|
|
|
|
|
|
|
|
|
|
|
|
|
|
|
|
|
Basic |
|
|
|
$ |
4.49 |
|
$ |
3.55 |
|
$ |
2.87 |
|
|
|
|
|
|
|
|
|
|
|
|
|
|
|
|
Diluted |
|
|
|
$ |
4.44 |
|
$ |
3.50 |
|
$ |
2.82 |
|
|
|
|
|
|
|
|
|
|
|
|
|
|
|
|
Weighted average shares outstanding |
|
|
|
|
|
|
|
|
|
|
|
|
|
Basic |
|
|
|
|
9,249,343 |
|
|
9,167,333 |
|
|
9,086,043 |
|
|
Diluted |
|
|
|
|
9,357,414 |
|
|
9,294,077 |
|
|
9,254,054 |
|
|
|
|
|
|
|
|
|
|
|
|
|
|
|
See accompanying notes to the Consolidated Financial Statements.
36
CHASE CORPORATION
CONSOLIDATED STATEMENTS OF COMPREHENSIVE INCOME
In thousands, except share and per share amounts
|
|
|
|
|
Years Ended August 31, |
|
|||||||
|
|
|
|
|
2017 |
|
2016 |
|
2015 |
|
|||
|
Net income |
|
|
|
$ |
42,014 |
|
$ |
32,807 |
|
$ |
26,413 |
|
|
|
|
|
|
|
|
|
|
|
|
|
|
|
|
Other comprehensive income: |
|
|
|
|
|
|
|
|
|
|
|
|
|
Net unrealized gain (loss) on restricted investments, net of tax of $30, $4 and ($77), respectively |
|
|
|
|
67 |
|
|
7 |
|
|
(162) |
|
|
Change in funded status of pension plans, net of tax of $519, ($738) and ($697), respectively |
|
|
|
|
1,155 |
|
|
(1,402) |
|
|
(1,149) |
|
|
Foreign currency translation adjustment |
|
|
|
|
788 |
|
|
(6,098) |
|
|
(2,425) |
|
|
Total other comprehensive income (loss) |
|
|
|
|
2,010 |
|
|
(7,493) |
|
|
(3,736) |
|
|
Comprehensive income |
|
|
|
|
44,024 |
|
|
25,314 |
|
|
22,677 |
|
|
|
|
|
|
|
|
|
|
|
|
|
|
|
|
Comprehensive net (income) loss attributable to noncontrolling interest |
|
|
|
|
— |
|
|
— |
|
|
(95) |
|
|
|
|
|
|
|
|
|
|
|
|
|
|
|
|
Comprehensive income |
|
|
|
$ |
44,024 |
|
$ |
25,314 |
|
$ |
22,582 |
|
See accompanying notes to the Consolidated Financial Statements.
37
CHASE CORPORATION
CONSOLIDATED STATEMENTS OF EQUITY
In thousands, except share and per share amounts
|
|
|
|
|
|
|
|
Additional |
|
Accumulated Other |
|
|
|
|
Chase |
|
|
|
|
Total |
|
||||
|
|
|
Common Stock |
|
Paid-In |
|
Comprehensive |
|
Retained |
|
Stockholders' |
|
|
Noncontrolling |
|
Stockholders' |
|
||||||||
|
|
|
Shares |
|
Amount |
|
Capital |
|
Income (Loss) |
|
Earnings |
|
Equity |
|
Interest |
|
Equity |
|
|||||||
|
Balance at August 31, 2014 |
|
9,103,292 |
|
$ |
910 |
|
$ |
13,620 |
|
$ |
(4,250) |
|
$ |
126,272 |
|
$ |
136,552 |
|
$ |
938 |
|
$ |
137,490 |
|
|
Restricted stock grants, net of forfeitures |
|
29,785 |
|
|
3 |
|
|
(3) |
|
|
|
|
|
|
|
|
— |
|
|
|
|
|
— |
|
|
Amortization of restricted stock grants |
|
|
|
|
|
|
|
866 |
|
|
|
|
|
|
|
|
866 |
|
|
|
|
|
866 |
|
|
Amortization of stock option grants |
|
|
|
|
|
|
|
254 |
|
|
|
|
|
|
|
|
254 |
|
|
|
|
|
254 |
|
|
Exercise of stock options |
|
169,038 |
|
|
17 |
|
|
2,554 |
|
|
|
|
|
|
|
|
2,571 |
|
|
|
|
|
2,571 |
|
|
Common stock received for payment of stock option exercises |
|
(58,332) |
|
|
(6) |
|
|
(2,174) |
|
|
|
|
|
|
|
|
(2,180) |
|
|
|
|
|
(2,180) |
|
|
Excess tax benefit (expense) from stock-based compensation |
|
|
|
|
|
|
|
1,088 |
|
|
|
|
|
|
|
|
1,088 |
|
|
|
|
|
1,088 |
|
|
Common stock retained to pay statutory minimum withholding taxes on common stock |
|
(51,825) |
|
|
(5) |
|
|
(1,995) |
|
|
|
|
|
|
|
|
(2,000) |
|
|
|
|
|
(2,000) |
|
|
Cash dividend paid, $0.60 per share |
|
|
|
|
|
|
|
|
|
|
|
|
|
(5,477) |
|
|
(5,477) |
|
|
|
|
|
(5,477) |
|
|
Purchase of outstanding noncontrolling interest |
|
|
|
|
|
|
|
86 |
|
|
|
|
|
|
|
|
86 |
|
|
(1,033) |
|
|
(947) |
|
|
Change in funded status of pension plan, net of tax $697 |
|
|
|
|
|
|
|
|
|
|
(1,149) |
|
|
|
|
|
(1,149) |
|
|
|
|
|
(1,149) |
|
|
Foreign currency translation adjustment |
|
|
|
|
|
|
|
|
|
|
(2,425) |
|
|
|
|
|
(2,425) |
|
|
|
|
|
(2,425) |
|
|
Net unrealized (loss) on restricted investments, net of tax $77 |
|
|
|
|
|
|
|
|
|
|
(162) |
|
|
|
|
|
(162) |
|
|
|
|
|
(162) |
|
|
Net income |
|
|
|
|
|
|
|
|
|
|
|
|
|
26,318 |
|
|
26,318 |
|
|
95 |
|
|
26,413 |
|
|
Balance at August 31, 2015 |
|
9,191,958 |
|
$ |
919 |
|
$ |
14,296 |
|
$ |
(7,986) |
|
$ |
147,113 |
|
$ |
154,342 |
|
$ |
— |
|
$ |
154,342 |
|
|
Restricted stock grants, net of forfeitures |
|
29,884 |
|
|
3 |
|
|
(3) |
|
|
|
|
|
|
|
|
— |
|
|
|
|
|
— |
|
|
Amortization of restricted stock grants |
|
|
|
|
|
|
|
1,049 |
|
|
|
|
|
|
|
|
1,049 |
|
|
|
|
|
1,049 |
|
|
Amortization of stock option grants |
|
|
|
|
|
|
|
283 |
|
|
|
|
|
|
|
|
283 |
|
|
|
|
|
283 |
|
|
Exercise of stock options |
|
140,113 |
|
|
14 |
|
|
2,125 |
|
|
|
|
|
|
|
|
2,139 |
|
|
|
|
|
2,139 |
|
|
Common stock received for payment of stock option exercises |
|
(35,932) |
|
|
(3) |
|
|
(2,012) |
|
|
|
|
|
|
|
|
(2,015) |
|
|
|
|
|
(2,015) |
|
|
Excess tax benefit from stock-based compensation |
|
|
|
|
|
|
|
1,784 |
|
|
|
|
|
|
|
|
1,784 |
|
|
|
|
|
1,784 |
|
|
Common stock retained to pay statutory minimum withholding taxes on common stock |
|
(47,537) |
|
|
(5) |
|
|
(2,803) |
|
|
|
|
|
|
|
|
(2,808) |
|
|
|
|
|
(2,808) |
|
|
Cash dividend paid, $0.65 per share |
|
|
|
|
|
|
|
|
|
|
|
|
|
(5,999) |
|
|
(5,999) |
|
|
|
|
|
(5,999) |
|
|
Change in funded status of pension plan, net of tax $738 |
|
|
|
|
|
|
|
|
|
|
(1,402) |
|
|
|
|
|
(1,402) |
|
|
|
|
|
(1,402) |
|
|
Foreign currency translation adjustment |
|
|
|
|
|
|
|
|
|
|
(6,098) |
|
|
|
|
|
(6,098) |
|
|
|
|
|
(6,098) |
|
|
Net unrealized gain on restricted investments, net of tax $4 |
|
|
|
|
|
|
|
|
|
|
7 |
|
|
|
|
|
7 |
|
|
|
|
|
7 |
|
|
Net income |
|
|
|
|
|
|
|
|
|
|
|
|
|
32,807 |
|
|
32,807 |
|
|
|
|
|
32,807 |
|
|
Balance at August 31, 2016 |
|
9,278,486 |
|
$ |
928 |
|
$ |
14,719 |
|
$ |
(15,479) |
|
$ |
173,921 |
|
$ |
174,089 |
|
$ |
— |
|
$ |
174,089 |
|
|
Restricted stock grants, net of forfeitures |
|
44,567 |
|
|
4 |
|
|
(4) |
|
|
|
|
|
|
|
|
— |
|
|
|
|
|
— |
|
|
Amortization of restricted stock grants |
|
|
|
|
|
|
|
1,712 |
|
|
|
|
|
|
|
|
1,712 |
|
|
|
|
|
1,712 |
|
|
Amortization of stock option grants |
|
|
|
|
|
|
|
500 |
|
|
|
|
|
|
|
|
500 |
|
|
|
|
|
500 |
|
|
Exercise of stock options |
|
80,168 |
|
|
8 |
|
|
1,245 |
|
|
|
|
|
|
|
|
1,253 |
|
|
|
|
|
1,253 |
|
|
Common stock received for payment of stock option exercises |
|
(15,079) |
|
|
(2) |
|
|
(1,156) |
|
|
|
|
|
|
|
|
(1,158) |
|
|
|
|
|
(1,158) |
|
|
Common stock retained to pay statutory minimum withholding taxes on common stock |
|
(34,006) |
|
|
(3) |
|
|
(2,956) |
|
|
|
|
|
|
|
|
(2,959) |
|
|
|
|
|
(2,959) |
|
|
Cash dividend paid, $0.70 per share |
|
|
|
|
|
|
|
|
|
|
|
|
|
(6,532) |
|
|
(6,532) |
|
|
|
|
|
(6,532) |
|
|
Change in funded status of pension plan, net of tax $519 |
|
|
|
|
|
|
|
|
|
|
1,155 |
|
|
|
|
|
1,155 |
|
|
|
|
|
1,155 |
|
|
Foreign currency translation adjustment |
|
|
|
|
|
|
|
|
|
|
788 |
|
|
|
|
|
788 |
|
|
|
|
|
788 |
|
|
Net unrealized gain on restricted investments, net of tax $30 |
|
|
|
|
|
|
|
|
|
|
67 |
|
|
|
|
|
67 |
|
|
|
|
|
67 |
|
|
Net income |
|
|
|
|
|
|
|
|
|
|
|
|
|
42,014 |
|
|
42,014 |
|
|
|
|
|
42,014 |
|
|
Balance at August 31, 2017 |
|
9,354,136 |
|
$ |
935 |
|
$ |
14,060 |
|
$ |
(13,469) |
|
$ |
209,403 |
|
$ |
210,929 |
|
$ |
— |
|
$ |
210,929 |
|
See accompanying notes to the Consolidated Financial Statements.
38
CHASE CORPORATION
NOTES TO CONSOLIDATED FINANCIAL STATEMENTS
In thousands, except share and per share amounts
CHASE CORPORATION
CONSOLIDATED STATEMENTS OF CASH FLOWS
Dollars in thousands
|
|
|
|
|
Years Ended August 31, |
|
|||||||
|
|
|
|
|
2017 |
|
2016 |
|
2015 |
|
|||
|
CASH FLOWS FROM OPERATING ACTIVITIES |
|
|
|
|
|
|
|
|
|
|
|
|
|
Net income |
|
|
|
$ |
42,014 |
|
$ |
32,807 |
|
$ |
26,413 |
|
|
Adjustments to reconcile net income to net cash provided by operating activities |
|
|
|
|
|
|
|
|
|
|
|
|
|
Gain on sale of real estate |
|
|
|
|
(860) |
|
|
— |
|
|
— |
|
|
Loss on write-down of certain assets under construction |
|
|
|
|
— |
|
|
365 |
|
|
— |
|
|
Gain on sale of businesses |
|
|
|
|
(2,013) |
|
|
(1,031) |
|
|
— |
|
|
Depreciation |
|
|
|
|
5,130 |
|
|
5,606 |
|
|
5,810 |
|
|
Amortization |
|
|
|
|
9,127 |
|
|
7,836 |
|
|
6,762 |
|
|
Cost of sale of inventory step-up |
|
|
|
|
190 |
|
|
— |
|
|
65 |
|
|
Provision for (recovery of) allowance for doubtful accounts |
|
|
|
|
(359) |
|
|
169 |
|
|
57 |
|
|
Stock-based compensation |
|
|
|
|
2,212 |
|
|
1,333 |
|
|
1,120 |
|
|
Realized gain on restricted investments |
|
|
|
|
(127) |
|
|
(67) |
|
|
(86) |
|
|
Decrease in cash surrender value of life insurance |
|
|
|
|
— |
|
|
103 |
|
|
326 |
|
|
Pension curtailment and settlement loss |
|
|
|
|
14 |
|
|
13 |
|
|
188 |
|
|
Excess tax expense from stock-based compensation |
|
|
|
|
— |
|
|
(1,784) |
|
|
(1,088) |
|
|
Deferred taxes |
|
|
|
|
(2,263) |
|
|
(2,590) |
|
|
(1,222) |
|
|
Increase (decrease) from changes in assets and liabilities |
|
|
|
|
|
|
|
|
|
|
|
|
|
Accounts receivable |
|
|
|
|
(1,003) |
|
|
3,312 |
|
|
(4,534) |
|
|
Inventory |
|
|
|
|
116 |
|
|
3,124 |
|
|
2,284 |
|
|
Prepaid expenses and other assets |
|
|
|
|
(878) |
|
|
(475) |
|
|
388 |
|
|
Accounts payable |
|
|
|
|
1,420 |
|
|
(2,821) |
|
|
687 |
|
|
Accrued compensation and other expenses |
|
|
|
|
(825) |
|
|
1,490 |
|
|
(87) |
|
|
Accrued income taxes |
|
|
|
|
37 |
|
|
1,443 |
|
|
3,876 |
|
|
Net cash provided by operating activities |
|
|
|
|
51,932 |
|
|
48,833 |
|
|
40,959 |
|
|
|
|
|
|
|
|
|
|
|
|
|
|
|
|
CASH FLOWS FROM INVESTING ACTIVITIES |
|
|
|
|
|
|
|
|
|
|
|
|
|
Purchases of property, plant and equipment |
|
|
|
|
(3,199) |
|
|
(2,046) |
|
|
(2,642) |
|
|
Cost to acquire intangible assets |
|
|
|
|
(71) |
|
|
(64) |
|
|
(34) |
|
|
Payments for acquisitions |
|
|
|
|
(30,270) |
|
|
(1,161) |
|
|
(33,285) |
|
|
Proceeds from sale of real estate |
|
|
|
|
2,122 |
|
|
— |
|
|
— |
|
|
Net proceeds from sale of businesses |
|
|
|
|
3,915 |
|
|
1,729 |
|
|
739 |
|
|
Decrease (increase) in restricted investments |
|
|
|
|
897 |
|
|
(149) |
|
|
(308) |
|
|
Proceeds from settlement of life insurance policies |
|
|
|
|
1,504 |
|
|
1,238 |
|
|
— |
|
|
Payments for cash surrender value life insurance |
|
|
|
|
— |
|
|
(159) |
|
|
(183) |
|
|
Net cash used in investing activities |
|
|
|
|
(25,102) |
|
|
(612) |
|
|
(35,713) |
|
|
|
|
|
|
|
|
|
|
|
|
|
|
|
|
CASH FLOWS FROM FINANCING ACTIVITIES |
|
|
|
|
|
|
|
|
|
|
|
|
|
Borrowings on debt |
|
|
|
|
— |
|
|
— |
|
|
2,000 |
|
|
Payments of principal on debt |
|
|
|
|
(43,400) |
|
|
(8,400) |
|
|
(9,000) |
|
|
Dividend paid |
|
|
|
|
(6,532) |
|
|
(5,999) |
|
|
(5,477) |
|
|
Proceeds from exercise of common stock options |
|
|
|
|
95 |
|
|
124 |
|
|
391 |
|
|
Payments of taxes on stock options and restricted stock |
|
|
|
|
(2,959) |
|
|
(2,808) |
|
|
(2,000) |
|
|
Excess tax benefit from stock-based compensation |
|
|
|
|
— |
|
|
1,784 |
|
|
1,088 |
|
|
Payment for acquisition of noncontrolling interest |
|
|
|
|
— |
|
|
— |
|
|
(500) |
|
|
Net cash used in financing activities |
|
|
|
|
(52,796) |
|
|
(15,299) |
|
|
(13,498) |
|
|
|
|
|
|
|
|
|
|
|
|
|
|
|
|
INCREASE (DECREASE) IN CASH & CASH EQUIVALENTS |
|
|
|
|
(25,966) |
|
|
32,922 |
|
|
(8,252) |
|
|
Effect of foreign exchange rates on cash |
|
|
|
|
(91) |
|
|
(3,330) |
|
|
(1,151) |
|
|
CASH AND CASH EQUIVALENTS, BEGINNING OF PERIOD |
|
|
|
|
73,411 |
|
|
43,819 |
|
|
53,222 |
|
|
CASH AND CASH EQUIVALENTS, END OF PERIOD |
|
|
|
$ |
47,354 |
|
$ |
73,411 |
|
$ |
43,819 |
|
See Note 13 for supplemental cash flow information including non-cash financing and investing activities
See accompanying notes to the Consolidated Financial Statements.
39
CHASE CORPORATION
NOTES TO CONSOLIDATED FINANCIAL STATEMENTS
In thousands, except share and per share amounts
Note 1—Summary of Significant Accounting Policies
The principal accounting policies of Chase Corporation (the “Company”) and its subsidiaries are as follows:
Products and Markets
Our principal products are specialty tapes, laminates, adhesives, sealants, coatings and chemical intermediates that are sold by our salespeople, manufacturers' representatives and distributors. In our Industrial Materials segment, these products consist of:
|
(i) |
insulating and conducting materials for the manufacture of electrical and telephone wire and cable, electrical splicing, and terminating and repair tapes, which are marketed to wire and cable manufacturers; |
|
(ii) |
laminated film foils, including EMI/RFI shielding tapes, used in communication and local area network (LAN) cables; |
|
(iii) |
moisture protective coatings, which are sold to the electronics industry for circuitry manufacturing, including circuitry used in automobiles and home appliances; |
|
(iv) |
laminated durable papers, including laminated paper with an inner security barrier used in personal and mail‑stream privacy protection, which are sold primarily to the envelope converting and commercial printing industries; |
|
(v) |
pulling and detection tapes used in the installation, measurement and location of fiber optic cables, water and natural gas lines, and power, data and video cables for commercial buildings; |
|
(vi) |
cover tapes with reliable adhesive and anti‑static properties essential to delivering semiconductor components via tape and reel packaging; |
|
(vii) |
Advanced adhesives, sealants, and coatings for automotive and industrial applications that require specialized bonding, encapsulating, environmental protection, or thermal management functionality; |
|
(viii) |
polymeric microspheres utilized by various industries to allow for weight and density reduction and sound dampening; |
|
(ix) |
water-based polyurethane dispersions utilized for various coating products; and |
|
(x) |
composite strength elements utilized in wind energy generation. |
In the Company’s Construction Materials segment, these products consist of:
|
(i) |
protective pipe coating tapes and other protectants for valves, regulators, casings, joints, metals, concrete and wood, which are sold to oil companies, gas utilities, and pipeline companies for utilization in both the construction and maintenance of oil and gas, water and wastewater pipelines; |
|
(ii) |
waterproofing membranes for highway bridge deck metal supported surfaces, which are sold to municipal transportation authorities, and high-performance polymeric asphalt additives; |
|
(iii) |
fluid applied coating and lining systems for use in the water and wastewater industry; and |
40
CHASE CORPORATION
NOTES TO CONSOLIDATED FINANCIAL STATEMENTS
In thousands, except share and per share amounts
|
(iv) |
expansion and control joint systems designed for roads, bridges, stadiums and airport runways. |
Basis of Presentation
The financial statements include the accounts of the Company and its wholly‑owned subsidiaries. Investments in unconsolidated companies which are at least 20% owned are carried under the equity method since acquisition or investment. All intercompany transactions and balances have been eliminated in consolidation. The Company uses the U.S. dollar as the functional currency for financial reporting. Certain reclassifications have been made to the prior year amounts to conform to the current year’s presentation.
On April 3, 2017, Chase executed an agreement with an unrelated party to sell all inventory, machinery and equipment and intangible assets of the Company’s fiber optic cable components product line for proceeds of $3,858 net of transaction costs and following certain working capital adjustments. The resulting pre-tax gain on sale of $2,013 was recognized in the third quarter of fiscal 2017 as gain on sale of businesses within the consolidated statement of operations. Further, the purchaser entered a multiyear lease for a portion of the manufacturing space at the Company’s Granite Falls, NC facility. Chase will provide ongoing manufacturing and administrative support to the purchaser for which the Company will receive additional consideration upon the performance of services. The Company’s fiber optic cable components product line was formerly a part of the Company’s Industrial Materials operating segment.
On September 30, 2016, the Company acquired certain assets of Resin Designs, LLC (“Resin Designs”), an advanced adhesives and sealants manufacturer, with locations in Woburn, MA and Newark, CA. The business was acquired for a purchase price of $30,270 after final working capital adjustments and excluding acquisition-related costs. As part of this transaction, Chase acquired all working capital and fixed assets of the business, and entered multiyear leases at both locations. The Company expensed $584 of acquisition-related costs during the first quarter of fiscal 2017 associated with this acquisition. The purchase was funded entirely with available cash on hand. Resin Designs is a formulator of customized adhesive and sealant systems used in high-reliability electronic applications. The acquisition broadens the Company’s adhesives and sealants product offering and manufacturing capabilities, and expands its market reach. Since the effective date of the acquisition, the financial results of Resin Designs’ operations have been included in the Company’s financial statements within the electronic and industrial coatings product line, contained within the Industrial Materials operating segment. Purchase accounting was completed in the fourth quarter of fiscal 2017 with no material adjustments made to the initial amounts recorded.
On June 23, 2016, the Company acquired all the capital stock of Spray Products (India) Private Limited for $1,161, net of cash acquired. The acquired business works closely with our HumiSeal manufacturing operation in Winnersh, Wokingham, England. The acquisition in India enhances the Company’s ability to provide technical, sales, manufacturing, chemical handling, and packaging services in the region. Since the effective date for this acquisition, the financial results of the business have been included in the Company's financial statements within the Company’s Industrial Materials operating segment in the electronic and industrial coatings product line. Purchase accounting was completed in the quarter ended August 31, 2016. Effective December 2016, Spray Products (India) Private Limited was renamed HumiSeal India Private Limited.
In November 2015, the Company sold its RodPack® wind energy business, contained within its structural composites product line, to an otherwise unrelated party for proceeds of $2,186. The Company’s structural composites product line is a part of the Company’s Industrial Materials operating segment. The Company will provide ongoing development support to the Buyer for which it will receive additional consideration upon the completion of services.
On January 30, 2015, the Company acquired two product lines from Henkel Corporation (the “Seller”) for a purchase price of $33,285, after working capital adjustments and excluding any acquisition-related costs. As part of this transaction, Chase acquired the Seller’s polymeric microspheres product line, sold under the Dualite® brand, located in
41
CHASE CORPORATION
NOTES TO CONSOLIDATED FINANCIAL STATEMENTS
In thousands, except share and per share amounts
Greenville, SC, and obtained exclusive distribution rights and intellectual property related to the Seller’s polyurethane dispersions product line, operating in Elgin, IL. We refer to these collectively as our specialty chemical intermediates product line. Under the agreement, Chase entered into a ten-year facility operating lease at the Seller’s Greenville, SC location. The Seller will perform certain manufacturing and application services for Chase at the Seller’s Elgin, IL location for three years following the acquisition. The purchase was funded entirely with available cash on hand. Since the effective date of this acquisition, the financial results of the specialty chemical intermediates product line have been included in the Company's financial statements within the Company’s Industrial Materials operating segment. Purchase accounting was completed in the third quarter of fiscal 2015 with no material adjustments made to the initial amounts recorded in the prior fiscal quarter.
As part of the Company’s purchase of NEPTCO in June 2012, it also acquired NEPTCO’s 50% ownership stake in its financially controlled joint venture, NEPTCO JV LLC (the “JV”). Because of the Company’s controlling financial interest, the JV’s assets, liabilities and results of operations have been consolidated within the Company’s Consolidated Financial Statements since the date of acquisition. An offsetting amount equal to 50% of net assets and net (income) loss of the JV was also recorded within the Company’s Consolidated Financial Statements to noncontrolling interest, representing the joint venture partner’s 50% ownership stake and pro rata share in the net results of the JV. On October 31, 2014, the Company purchased the 50% noncontrolling membership interest of the JV owned by its otherwise unrelated joint venture partner. The Company continues to fully consolidate the assets, liabilities and results of operations of the JV, but no longer records an offsetting amount for a noncontrolling interest after October 31, 2014. The ($95) recorded in the Consolidated Statement of Operations as Net (income) loss attributable to noncontrolling interest for the year ended August 31, 2015, represents the now-former joint venture partner’s share of the results of operations of the JV for the period from September 1, 2014 through October 31, 2014.
The Company has evaluated events and transactions subsequent to the balance sheet date. Based on this evaluation, and other than the cash dividend announced on October 30, 2017 of $0.80 per share to shareholders of record on November 9, 2017 payable on December 6, 2017, the Company is not aware of any other events or transactions that occurred subsequent to the balance sheet date, but prior to filing, that would require recognition or disclosure in its Consolidated Financial Statements.
Use of Estimates
The preparation of financial statements in conformity with accounting principles generally accepted in the United States of America (U.S. GAAP) requires management to make estimates and assumptions that affect the reported amounts of assets and liabilities and disclosure of contingent assets and liabilities at the date of the financial statements and the reported amounts of revenue and expenses during the reporting period. Actual results could differ from those estimates.
Cash and Cash Equivalents
Cash and cash equivalents consist primarily of demand deposit accounts or investment instruments that meet high credit quality standards such as money market funds, government securities, or commercial paper. The Company considers all highly liquid debt instruments purchased with a maturity of three months or less from date of purchase to be cash equivalents.
Accounts Receivable
The Company evaluates the collectability of accounts receivable balances based on a combination of factors. In cases where the Company is aware of circumstances that may impair a specific customer’s ability to meet its financial obligations to it, a specific allowance against amounts due to the Company is recorded, and thereby reduces the net recognized receivable to the amount the Company reasonably believes will be collected. For all other customers, the
42
CHASE CORPORATION
NOTES TO CONSOLIDATED FINANCIAL STATEMENTS
In thousands, except share and per share amounts
Company recognizes allowances for doubtful accounts based on the length of time the receivables are past due, industry and geographic factors, the current business environment and its historical experience. Receivables are written off against these reserves in the period they are determined to be uncollectable.
Inventory
The Company values inventory at the lower of cost or net realizable value using the first in, first out (FIFO) method. Management assesses the recoverability of inventory based on types and levels of inventory held, forecasted demand and changes in technology. These assessments require management judgments and estimates, and valuation adjustments for excess and obsolete inventory may be recorded based on these assessments. The Company estimates excess and obsolescence exposures based upon assumptions about future demand, product transitions and market conditions, and records reserves to reduce inventories to their estimated net realizable value. The failure to accurately forecast demand may lead to additional excess and obsolete inventory and future charges.
Goodwill
The Company accounts for goodwill in accordance with ASC Topic 350, “Intangibles — Goodwill and Other.” The Company identified several reporting units within each of its two operating segments. These are used to evaluate the possible impairment of goodwill annually each fourth quarter and whenever events or circumstances indicate the carrying value of goodwill may not be recoverable. In fiscal 2017, the Company early adopted ASU No. 2017-04 “Intangibles - Goodwill and Other Topics (Topic 350): Simplifying the Test for Goodwill Impairment.” We assess goodwill for impairment by comparing the fair value of the reporting unit to its carrying amount. If the fair value of a reporting unit is less than its carrying value, an impairment loss, limited to the amount of goodwill allocated to that reporting unit, is recorded. Fair values for reporting units are determined based on the income approach (discounted cash flow method).
Intangible Assets
Intangible assets consist of patents, agreements, formulas, trade names, customer relationships and trademarks. The Company capitalizes costs related to patent applications and technology agreements. The costs of these assets are amortized over the lesser of the useful life of the asset or its statutory life. Capitalized costs are periodically reviewed for impairment whenever events or changes in circumstances indicate that the carrying amount of the asset may not be recoverable.
Property, Plant and Equipment
Property, plant and equipment are stated at cost and depreciated using the straight‑line method over the assets’ estimated useful lives. Expenditures for maintenance repairs and minor renewals are charged to expense as incurred. Betterments and major renewals are capitalized. Upon retirement or other disposition of assets, related allowances for depreciation and amortization are eliminated from the accounts and any resulting gain or loss is included in the determination of income or loss. The estimated useful lives of property, plant and equipment are as follows:
|
Buildings and improvements |
|
15 |
to |
40 |
|
years |
|
Machinery and equipment |
|
3 |
to |
10 |
|
years |
Leasehold improvements are depreciated over the lesser of the useful life or the term of the lease.
43
CHASE CORPORATION
NOTES TO CONSOLIDATED FINANCIAL STATEMENTS
In thousands, except share and per share amounts
Restricted Investments and Deferred Compensation
The Company has a non-qualified deferred savings plan that covers its Board of Directors and a separate plan covering selected employees. Participants may elect to defer a portion of their compensation for payment in a future tax year. The plans are funded by trusteed assets that are restricted to the payment of deferred compensation or satisfaction of the Company’s general creditors. The Company’s restricted investments and corresponding deferred compensation liability under the plans were $964 and $1,637 at August 31, 2017 and 2016, respectively. The Company accounts for the restricted investments as available for sale by recording unrealized gains or losses in other comprehensive income as a component of stockholders’ equity.
Split-Dollar Life Insurance Arrangements
The liability related to these postretirement benefits was calculated as the present value of future premiums to be paid by the Company reduced by the present value of the expected proceeds to be returned to the Company upon the insured’s death. For August 31, 2017 and 2016, the Company did not recognize a liability related to these postretirement obligations as no future premium payments were anticipated.
Revenue
The Company recognizes revenue when persuasive evidence of an arrangement exists, performance of its obligation is complete, its price to the buyer is fixed or determinable, and the Company is reasonably assured of collecting. These four transaction elements are typically met at the time of shipment or upon receipt by the customer, based on contractual terms. If a loss is anticipated on any contract, a provision for the entire loss is made immediately. Revenue recognition involves judgments and assessments of expected returns, and the likelihood of nonpayment by customers. The Company analyzes various factors, including a review of specific customer contracts and shipment terms, historical experience, creditworthiness of customers and current market and economic conditions in determining when to recognize revenue. Changes in judgments on these factors could impact the timing and amount of revenue recognized with a resulting impact on the timing and amount of operating income. For certain products, consigned inventory is maintained at customer locations, and revenue is typically recognized in the period that the consigned inventory is consumed. Royalty revenue is recognized based on licensee production statements received from the authorized manufacturers. Billed shipping and handling fees are recorded as sales revenue with the associated costs recorded within cost of products and services sold.
The Company’s warranty policy provides that the products (or materials) delivered will meet its standard specifications for the products or any other specifications as may be expressly agreed to at time of purchase. All warranty claims must be received within 90 days from the date of delivery, unless some other period has been expressly agreed to within the terms of the sales agreement. The Company’s warranty costs have historically been insignificant. The Company records a current liability for estimated warranty claims with a corresponding charge to cost of products and services sold based upon current and historical experience and upon specific claims issues as they arise.
In addition, the Company offers certain sales incentives based on sales levels as they are earned.
Research and Product Development Costs
Research and product development costs are expensed as incurred and include primarily engineering salaries, overhead and materials used in connection with research and development projects. Research and development expense amounted to $3,696, $2,792 and $2,690 for the years ended August 31, 2017, 2016 and 2015, respectively, and was recorded within selling, general and administrative expenses.
44
CHASE CORPORATION
NOTES TO CONSOLIDATED FINANCIAL STATEMENTS
In thousands, except share and per share amounts
Pension Plan
The Company accounts for its pension plans following the requirements of ASC Topic 715, “Compensation —Retirement Benefits” (“ASC 715”). ASC 715 requires an employer to: (a) recognize in its statement of financial position the funded status of a benefit plan; (b) measure defined benefit plan assets and obligations as of the end of the employer’s fiscal year (with limited exceptions); and (c) recognize as a component of other comprehensive income, net of tax, the gains or losses and prior service costs or credits that arise but are not recognized as components of net periodic benefit costs pursuant to prior existing guidance.
Stock-Based Compensation
In accordance with the accounting for stock-based compensation guidance, ASC Topic 718 “Compensation – Stock Compensation” (“ASC 718”), the Company measures and recognizes compensation expense for all share‑based payment awards made to employees and directors based on estimated fair values. This includes restricted stock, restricted stock units and stock options. The guidance allows for the continued use of the simplified method as the Company has concluded that its historical share option exercise experience does not provide a reasonable basis for estimating expected term.
Stock‑based compensation expense recognized in fiscal years 2017, 2016 and 2015 was $2,212, $1,333 and $1,120, respectively.
The fair value of options granted was estimated on the date of grant using the Black‑Scholes option pricing model with the following weighted average assumptions for the years ending August 31, 2017, 2016 and 2015:
|
|
|
2017 |
|
|
2016 |
|
2015 |
||
|
Expected dividend yield |
|
1.5 |
% |
|
1.7 |
% |
|
1.8 |
% |
|
Expected life |
|
6.0 |
years |
|
6.0 |
years |
|
6.0 |
years |
|
Expected volatility |
|
38.7 |
% |
|
41.2 |
% |
|
39.0 |
% |
|
Risk-free interest rate |
|
1.3 |
% |
|
1.7 |
% |
|
2.5 |
% |
Expected volatility is determined by looking at a combination of historical volatility over the past six years as well as implied future volatility.
Translation of Foreign Currency
The financial position and results of operations of the Company’s HumiSeal Europe Ltd and Chase Protective Coatings Ltd businesses are measured using the British pound as the functional currency. The financial position and results of operations of the Company’s HumiSeal Europe SARL business in France are measured using euros as the functional currency. The financial position and results of the Company’s HumiSeal India Private Limited (formerly Spray Products (India) Private Limited) business in India are measured using the Indian rupee as the functional currency. The functional currency for all our other operations is the U.S. dollar. Revenue and expenses of these international businesses have been translated at average exchange rates. Foreign currency translation gains and losses are determined using current exchange rates for monetary items and historical exchange rates for other balance sheet items, and are recorded as a change in other comprehensive income (a component of shareholders’ equity). Transaction gains and losses generated from the remeasurement of assets and liabilities denominated in currencies other than the functional currency of these international operations are included in other income (expense) on the consolidated statements of operations and were $307, $2,152 and ($134) for the fiscal years ended August 31, 2017, 2016 and 2015, respectively.
45
CHASE CORPORATION
NOTES TO CONSOLIDATED FINANCIAL STATEMENTS
In thousands, except share and per share amounts
Income Taxes
The Company accounts for income taxes under the asset and liability method. Under this method, a deferred tax asset or liability is determined based upon the differences between the financial statement and tax bases of assets and liabilities as measured by the enacted tax rates that will be in effect when these differences reverse. Tax credits are recorded as a reduction in income taxes. Valuation allowances are provided if, based upon the weight of available evidence, it is more likely than not that some or all of the deferred tax assets will not be realized.
The Company estimates contingent income tax liabilities based on the guidance for accounting for uncertain tax positions as prescribed in ASC Topic 740, “Income Taxes.” See Note 7 for more information on the Company’s income taxes.
Net Income Per Share
The Company has unvested share‑based payment awards with a right to receive nonforfeitable dividends, which are considered participating securities under ASC Topic 260, “Earnings Per Share” (“ASC 260”). The Company allocates earnings to participating securities and computes earnings per share using the two-class method.
Comprehensive Income
Comprehensive income is defined as the change in equity of a business enterprise during a period from transactions and other events and circumstances from non‑owner sources, including foreign currency translation adjustments, unrealized gains and losses on marketable securities and adjustments related to the change in the funded status of the pension plans.
Noncontrolling Interest
A legal entity is subject to the consolidation rules of ASC Topic 810, “Consolidations” (“ASC 810”) if the total equity investment at risk is not sufficient to permit the legal entity to finance its activities without additional subordinated financial support or the equity investors lack certain specified characteristics of a controlling financial interest. Based on the criteria in ASC 810, the Company determined that its joint venture agreement qualified as a variable interest entity (“VIE”) prior to the purchase of its former joint venture partner’s 50% noncontrolling membership interest. The purpose of the joint venture was to combine the elements of NEPTCO’s and the otherwise unrelated joint venture partner’s fiber optic strength element businesses. Under ASC 810, a reporting entity shall consolidate a VIE when that reporting entity has a variable interest (or combination of variable interests) that provides the reporting entity with a controlling financial interest. The reporting entity shall be deemed to have a controlling financial interest in a VIE if it has both of the following characteristics: a) the power to direct the activities of a VIE that most significantly impact the VIE’s economic performance; and b) the obligation to absorb losses or right to receive benefits from the VIE that could potentially be significant to the VIE. The reporting entity that consolidates a VIE is called the “primary beneficiary” of that VIE. The Company determined that it was the primary beneficiary of the VIE primarily due to Chase directing the activities that most significantly impact the VIE’s economic performance, which is the actual management and operation of the joint venture and having the obligation to absorb losses and the right to receive benefits from the VIE that could potentially be significant to the VIE through our equity investment in the VIE. As a result, the Company has consolidated the operations of the joint venture in its Consolidated Financial Statements. On October 31, 2014 (the first quarter of fiscal 2015), the Company purchased the 50% noncontrolling membership interest of the JV owned by its joint venture partner, thus making the JV a wholly-owned entity.
46
CHASE CORPORATION
NOTES TO CONSOLIDATED FINANCIAL STATEMENTS
In thousands, except share and per share amounts
Segments
ASC Topic 280 “Segment Reporting” of the Financial Accounting Standards Board (“FASB”) codification establishes standards for reporting information about operating segments. The Company is organized into two operating segments, an Industrial Materials segment and a Construction Materials segment. The segments are distinguished by the nature of the products we manufacture and how they are delivered to their respective markets.
The Industrial Materials segment includes specified products that are used in, or integrated into, another company’s product, with demand typically dependent upon general economic conditions. Industrial Materials products include insulating and conducting materials for wire and cable manufacturers, moisture protective coatings for electronics, laminated durable papers, laminates for the packaging and industrial laminate markets, custom manufacturing services, pulling and detection tapes used in the installation, measurement and location of fiber optic cables and water and natural gas lines, cover tapes essential to delivering semiconductor components via tape and reel packaging, composite materials and elements, polymeric microspheres, and polyurethane dispersions. Beginning June 23, 2016, and September 30, 2016, respectively, the Industrial Materials segment includes the acquired operations of HumiSeal India Private Limited (formerly Spray Products (India) Private Limited) and of Resin Designs, LLC. Both were obtained through acquisition and included in the Company’s electronic and industrial coatings product line. Prior to the April 3, 2017 sale of the business, the segment’s products also included glass-based strength elements, designed to allow fiber optic cables to withstand mechanical and environmental strain and stress.
The Construction Materials segment is principally composed of project-oriented product offerings that are primarily sold and used as “Chase” branded products. Construction Materials products include protective coatings for pipeline applications, coating and lining systems for use in liquid storage and containment applications, adhesives and sealants used in architectural and building envelope waterproofing applications, high-performance polymeric asphalt additives, and expansion and control joint systems for use in the transportation and architectural markets.
Recently Issued Accounting Standards
In May 2014, the FASB issued Accounting Standards Update (“ASU”) No. 2014-09, “Revenue from Contracts with Customers,” which will replace most of the existing revenue recognition guidance under U.S. GAAP. The core principle of the ASU is that an entity should recognize revenue for the transfer of goods or services equal to the amount that it expects to be entitled to receive for those goods or services. The ASU requires additional disclosure about the nature, amount, timing and uncertainty of revenue and cash flows arising from customer contracts, including significant judgments and changes in judgments. In March, April and May 2016, the FASB issued ASU 2016-08 “Principal versus Agent Considerations (Reporting Revenue Gross versus Net),” ASU 2016-10 “Identifying Performance Obligations and Licensing,” and ASU 2016-12, “Revenue from Contracts with Customers (Topic 606), Narrow-Scope Improvements and Practical Expedients” all of which provide further clarification to be considered when implementing ASU 2014-09. The ASU will be effective for the Company beginning September 1, 2018 (fiscal 2019), including interim periods in its fiscal year 2019, and allows for either retrospective or modified retrospective methods of adoption. The Company, which is in the initial phase of its adoption plan, is in the process of determining the method of adoption and assessing the impact of this ASU on the Company’s consolidated financial position, results of operations and cash flows; preliminary indications are that Chase will utilize the modified retrospective method of adoption.
In February 2016, the FASB issued ASU No. 2016-02, “Leases (Topic 842).” Under the new guidance, lessees will be required to recognize the following for all leases (with the exception of short-term leases) at the commencement date: (a) a lease liability, which is a lessee’s obligation to make lease payments arising from a lease, measured on a discounted basis; and (b) a right-of-use asset, which represents the lessee’s right to use, or control the use of, a specified asset for the lease term. Changes were made to align lessor accounting with the lessee accounting model and ASU No. 2014-09, “Revenue from Contracts with Customers.” The ASU will be effective for the Company beginning September 1, 2019 (fiscal 2020). Early application is permitted. Lessees must apply a modified retrospective transition approach for leases
47
CHASE CORPORATION
NOTES TO CONSOLIDATED FINANCIAL STATEMENTS
In thousands, except share and per share amounts
existing at, or entered into after, the beginning of the earliest comparative period presented in the financial statements. The Company is currently evaluating the impact of the application of this ASU on our Consolidated Financial Statements and disclosures thereto.
In August 2016, the FASB issued ASU No. 2016-15, “Statement of Cash Flows (Topic 230).” This ASU provides guidance on the presentation and classification of specific cash flow items to improve consistency within the statement of cash flows. The effective date for adoption of this guidance will be our fiscal year beginning September 1, 2018 (fiscal 2019), with early adoption permitted. The Company is currently evaluating the effect that ASU No. 2016-15 will have on its financial statements and related disclosures.
In January 2017, the FASB issued ASU No. 2017-01, “Business Combinations (Topic 805): Clarifying the Definition of a Business.” The new guidance dictates that, when substantially all of the fair value of the gross assets acquired (or disposed of) is concentrated in a single identifiable asset or a group of similar identifiable assets, it should be treated as an acquisition or disposal of an asset. The guidance will be effective for the fiscal year beginning on September 1, 2018 (fiscal 2019), including interim periods within that year, with early adoption permitted. The effect ASU No. 2017-01 will have on the financial statements and related disclosures of the Company will be dependent on the nature of potential future acquisitions and divestitures.
In March 2017, the FASB issued ASU No. 2017-07, “Compensation — Retirement Benefits (Topic 715): Improving the Presentation of Net Periodic Pension Cost and Net Periodic Postretirement Benefit Cost.” This ASU applies to all employers that offer to their employees defined benefit pension plans, other postretirement benefit plans, or other types of benefits accounted for under Topic 715, Compensation — Retirement Benefits. The ASU requires that an employer report the service cost component in the same line item or items as other compensation costs arising from services rendered by the pertinent employees during the period. The other components of net benefit cost are required to be presented in the income statement separately from the service cost component and outside a subtotal of income from operations, if one is presented. If a separate line item or items are used to present the other components of net benefit cost, that line item or items must be appropriately described. If a separate line item or items are not used, the line item or items used in the income statement to present the other components of net benefit cost must be disclosed. The ASU also allows only the service cost component to be eligible for capitalization when applicable (e.g., as a cost of internally manufactured inventory or a self-constructed asset). The required effective date for adoption of this guidance for the Company will be our fiscal year beginning September 1, 2018 (fiscal 2019), including interim periods within that annual period. Early adoption is permitted as of the beginning of an annual period for which financial statements (interim or annual) have not been issued or made available for issuance. The Company is currently evaluating the effect that ASU No. 2017-07 will have on its financial statements and related disclosures.
In May 2017, the FASB issued ASU No. 2017-09, "Scope of Modification Accounting." This ASU provides guidance about which changes to the terms or conditions of a share-based payment award require an entity to apply modification accounting in Topic 718. ASU 2017-09 is effective for fiscal years beginning after December 15, 2017 (our fiscal year 2019), including interim periods within that reporting period. The Company is currently in the process of evaluating the impact of ASU 2017-09 on our financial position and result of operations.
Recently Adopted Accounting Standards
In August 2014, the FASB issued ASU No. 2014-15 “Presentation of Financial Statements: Going Concern (Subtopic 205-40)” which provides guidance on determining when and how to disclose going-concern uncertainties in the financial statements. The new standard requires management to perform interim and annual assessments of an entity’s ability to continue as a going concern within one year of the date the financial statements are issued. An entity must provide certain disclosures if “conditions or events raise substantial doubt about the entity’s ability to continue as a going concern.” The guidance applies to all entities and is effective for annual periods ending after December 15, 2016, and
48
CHASE CORPORATION
NOTES TO CONSOLIDATED FINANCIAL STATEMENTS
In thousands, except share and per share amounts
interim periods thereafter (fiscal year 2017 for the Company). The adoption of ASU 2014-15, which occurred in the first quarter of fiscal 2017, did not have a material effect on the Company’s Consolidated Financial Statements.
In April 2015, the FASB issued ASU No. 2015-03, "Simplifying the Presentation of Debt Issuance Costs," which requires that debt issue costs related to a recognized debt liability be presented on the balance sheet as a direct deduction from the amount of the debt liability, consistent with debt discounts and premiums. Amortization of such costs is still reported as interest expense. ASU 2015-03 is effective for fiscal years, and interim periods therein, beginning after December 15, 2015 (fiscal year 2017 for the Company). In August 2015, the FASB issued ASU 2015-15, "Presentation and Subsequent Measurement of Debt Issue Costs Associated with Line-of-Credit Arrangements." ASU 2015-15 supplements the requirements of ASU 2015-03 by allowing an entity to defer and present debt issue costs related to a line of credit arrangement as an asset and subsequently amortize the deferred costs ratably over the term of the line of credit arrangement. The adoption of ASU 2015-03 and ASU 2015-15, which occurred in the first quarter of fiscal 2017, did not have a material effect on the Company’s Consolidated Financial Statements.
In March 2016, the FASB issued ASU No. 2016-09, “Compensation – Stock Compensation (Topic 718), Improvements to Employee Share-Based Payment Accounting.” This ASU simplifies the accounting for stock-based payment transactions including the accounting for income taxes, forfeitures, statutory tax withholding requirements and classification in the statement of cash flows. The required effective date for adoption of this guidance will be our fiscal year beginning September 1, 2017 (fiscal 2018), with early adoption allowed. The updated standard no longer requires cash flows related to excess tax benefits to be presented as a financing activity separate from other income tax cash flows. The update also allows entities to repurchase more of an employee's shares for tax withholding purposes without triggering liability accounting, clarifies that all cash payments to taxing authorities made on an employee's behalf for withheld shares should be presented as a financing activity on the statement of cash flows, and provides for an accounting policy election to account for forfeitures as they occur. The Company early adopted this standard as of September 1, 2016 and during the year ended August 31, 2017 recognized an excess tax benefit from stock-based compensation of $1,917, within income tax expense on the consolidated statement of operations (adopted prospectively). The adoption did not impact the existing classification of the awards. Excess tax benefits from stock based compensation are now classified in net income in the statement of cash flows instead of being separately stated in financing activities for fiscal 2017 (adopted prospectively). Given the Company’s historical practice of including employee withholding taxes paid within financing activities in the statement of cash flows, no prior period reclassifications are required by the clarifications on classification provided by ASU No. 2016-09. Due primarily to the inclusion of the excess tax benefit, the effective tax rate for the year ended August 31, 2017 decreased to 31.0%, compared to effective tax rates of 34.5% and 35.9% recognized for fiscal 2016 and 2015, respectively; further, the Company anticipates the potential for increased periodic volatility in future effective tax rates based on the continued application of the ASU No. 2016-09. Following the adoption of the new standard, the Company has elected to account for forfeitures as they occur.
In January 2017, the FASB issued ASU No. 2017-04, “Intangibles - Goodwill and Other (Topic 350): Simplifying the Test for Goodwill Impairment.” This ASU simplifies the subsequent measurement of goodwill and eliminates Step 2 from the goodwill impairment test. Per ASU No. 2017-04, the annual, or interim, goodwill impairment test is performed by comparing the fair value of a reporting unit with its carrying amount, and an impairment charge should be recognized for the amount by which the carrying amount exceeds the reporting unit’s fair value; however, the loss recognized should not exceed the total amount of goodwill allocated to that reporting unit. In addition, income tax effects from any tax-deductible goodwill on the carrying amount of the reporting unit should be considered when measuring the goodwill impairment loss, if applicable. The amendments also eliminate the requirements for any reporting unit with a zero or negative carrying amount to perform a qualitative assessment and, if it fails that qualitative test, to perform Step 2 of the goodwill impairment test. An entity still has the option to perform the qualitative assessment for a reporting unit to determine if the quantitative impairment test is necessary. The amendments are to be applied on a prospective basis. The required effective date for adoption of this guidance for the Company will be our fiscal year beginning September 1, 2020 (fiscal 2021), with early adoption permitted for interim or annual goodwill impairment tests performed on testing
49
CHASE CORPORATION
NOTES TO CONSOLIDATED FINANCIAL STATEMENTS
In thousands, except share and per share amounts
dates after January 1, 2017. The Company early adopted this standard during the second quarter of fiscal 2017; the adoption did not have a material effect on the Company’s Consolidated Financial Statements or related disclosures.
Note 2—Inventories
Inventories consist of the following as of August 31, 2017 and 2016:
|
|
|
|
2017 |
|
2016 |
||
|
Raw materials |
|
|
$ |
11,636 |
|
$ |
12,879 |
|
Work in process |
|
|
|
6,877 |
|
|
6,019 |
|
Finished goods |
|
|
|
7,105 |
|
|
6,916 |
|
Total Inventory |
|
|
$ |
25,618 |
|
$ |
25,814 |
Note 3—Property, Plant and Equipment
Property, plant and equipment consist of the following as of August 31, 2017 and 2016:
|
|
|
|
2017 |
|
2016 |
||
|
Land and improvements |
|
|
$ |
6,478 |
|
$ |
6,561 |
|
Buildings |
|
|
|
19,447 |
|
|
20,364 |
|
Machinery and equipment |
|
|
|
49,211 |
|
|
48,374 |
|
Leasehold improvements |
|
|
|
1,049 |
|
|
945 |
|
Construction in progress |
|
|
|
2,852 |
|
|
1,907 |
|
|
|
|
|
79,037 |
|
|
78,151 |
|
Accumulated depreciation |
|
|
|
(44,277) |
|
|
(41,409) |
|
Property, plant and equipment, net |
|
|
$ |
34,760 |
|
$ |
36,742 |
Note 4—Goodwill and Intangible Assets
The changes in the carrying value of goodwill, by operating segment, are as follows:
|
|
|
Industrial |
|
Construction Materials |
|
Consolidated |
|
|||
|
Balance at August 31, 2015 |
|
$ |
33,390 |
|
$ |
10,733 |
|
$ |
44,123 |
|
|
Acquisition of Spray Products (India) Private Limited |
|
|
107 |
|
|
— |
|
|
107 |
|
|
Foreign currency translation adjustment |
|
|
(617) |
|
|
(37) |
|
|
(654) |
|
|
Balance at August 31, 2016 |
|
$ |
32,880 |
|
$ |
10,696 |
|
$ |
43,576 |
|
|
Acquisition of Resin Designs, LLC |
|
|
7,592 |
|
|
— |
|
|
7,592 |
|
|
Sale of the fiber optic cable components business |
|
|
(409) |
|
|
— |
|
|
(409) |
|
|
Foreign currency translation adjustment |
|
|
28 |
|
|
(3) |
|
|
25 |
|
|
Balance at August 31, 2017 |
|
$ |
40,091 |
|
$ |
10,693 |
|
$ |
50,784 |
|
|
|
|
|
|
|
|
|
|
|
|
|
The Company’s goodwill is allocated to each reporting unit based on the nature of the products manufactured by the respective business combinations that originally created the goodwill. The Company has identified eleven reporting units within its two operating segments that are used to evaluate the possible impairment of goodwill. Goodwill impairment exists when the carrying amount of goodwill exceeds its fair value. Assessments of possible impairment of goodwill are made when events or changes in circumstances indicate that the carrying value of the asset may not be
50
CHASE CORPORATION
NOTES TO CONSOLIDATED FINANCIAL STATEMENTS
In thousands, except share and per share amounts
recoverable through future operations. Additionally, testing for possible impairment of recorded goodwill and certain intangible asset balances is required annually. The amount and timing of any impairment charges based on these assessments require the estimation of future cash flows and the fair market value of the related assets based on management’s best estimates of certain key factors, including future selling prices and volumes; operating, raw material and energy costs; and various other projected operating and economic factors. When testing, fair values of the reporting units and the related implied fair values of their respective goodwill are established using discounted cash flows.
The Company performs impairment reviews annually each fourth quarter and whenever events or circumstances indicate the carrying value of goodwill may not be recoverable. For fiscal 2017, the Company’s review indicated no impairment of goodwill, or at-risk reporting units.
As of August 31, 2017, the Company had a total goodwill balance of $50,784 related to its acquisitions, of which $13,497 remains deductible for income taxes.
Intangible assets subject to amortization consist of the following as of August 31, 2017 and 2016:
|
|
|
Weighted Average |
|
Gross Carrying |
|
Accumulated |
|
Net Carrying |
|
|||
|
|
|
Amortization Period |
|
Value |
|
Amortization |
|
Value |
|
|||
|
August 31, 2017 |
|
|
|
|
|
|
|
|
|
|
|
|
|
Patents and agreements |
|
14.4 |
years |
$ |
1,845 |
|
$ |
1,671 |
|
$ |
174 |
|
|
Formulas and technology |
|
7.8 |
years |
|
9,318 |
|
|
5,387 |
|
|
3,931 |
|
|
Trade names |
|
6.0 |
years |
|
7,709 |
|
|
5,813 |
|
|
1,896 |
|
|
Customer lists and relationships |
|
9.6 |
years |
|
70,180 |
|
|
29,335 |
|
|
40,845 |
|
|
|
|
|
|
$ |
89,052 |
|
$ |
42,206 |
|
$ |
46,846 |
|
|
|
|
|
|
|
|
|
|
|
|
|
|
|
|
August 31, 2016 |
|
|
|
|
|
|
|
|
|
|
|
|
|
Patents and agreements |
|
14.5 |
years |
$ |
1,805 |
|
$ |
1,663 |
|
$ |
142 |
|
|
Formulas and technology |
|
8.4 |
years |
|
8,248 |
|
|
4,310 |
|
|
3,938 |
|
|
Trade names |
|
5.9 |
years |
|
7,137 |
|
|
4,909 |
|
|
2,228 |
|
|
Customer lists and relationships |
|
9.4 |
years |
|
52,742 |
|
|
22,470 |
|
|
30,272 |
|
|
|
|
|
|
$ |
69,932 |
|
$ |
33,352 |
|
$ |
36,580 |
|
Aggregate amortization expense related to intangible assets for the years ended August 31, 2017, 2016 and 2015 was $9,127, $7,836 and $6,762, respectively. As of August 31, 2017 estimated amortization expense for the next five fiscal years is as follows:
|
Years ending August 31, |
|
|
|
|
|
2018 |
|
|
9,110 |
|
|
2019 |
|
|
8,441 |
|
|
2020 |
|
|
7,574 |
|
|
2021 |
|
|
7,044 |
|
|
2022 |
|
|
6,164 |
|
51
CHASE CORPORATION
NOTES TO CONSOLIDATED FINANCIAL STATEMENTS
In thousands, except share and per share amounts
Note 5—Cash Surrender Value of Life Insurance
Life insurance is provided under split dollar life insurance agreements whereby the Company will recover the premiums paid from the proceeds of the policies.
The Company recognized cash surrender value of life insurance policies, net of loans of $5 at August 31, 2017 and 2016, secured by the policies, with the following carriers as of August 31, 2017 and 2016:
|
|
|
2017 |
|
2016 |
||
|
John Hancock |
|
$ |
4,450 |
|
$ |
4,450 |
|
Metropolitan Life Insurance |
|
|
— |
|
|
1,096 |
|
Other life insurance carriers |
|
|
80 |
|
|
80 |
|
|
|
$ |
4,530 |
|
$ |
5,626 |
|
Less portion classified as current |
|
|
— |
|
|
(1,096) |
|
Cash surrender value of life insurance policies, less current portion |
|
$ |
4,530 |
|
$ |
4,530 |
|
|
|
|
|
|
|
|
All policies are subject to periodic review. The Company settled the Metropolitan Life Insurance policy within the first quarter of fiscal 2017 and as such had classified this policy within current assets as of August 31, 2016 (included in prepaid expenses and other current assets). The Company currently intends to maintain all other policies through the lives or retirements of the insureds. Please see Note 23 to the Company’s Consolidated Financial Statements for related party information on the cash surrender value of certain life insurance policies held by the Company during fiscal 2017 and 2016.
Note 6—Long-Term Debt
Long‑term debt consists of the following at August 31, 2017 and 2016:
|
|
|
2017 |
|
2016 |
|
||
|
All-revolving credit facility with a borrowing capacity of $150,000 |
|
$ |
— |
|
$ |
— |
|
|
Term note |
|
|
— |
|
|
43,400 |
|
|
|
|
|
— |
|
|
43,400 |
|
|
Less portion payable within one year classified as current |
|
|
— |
|
|
(43,400) |
|
|
Long-term debt, less current portion |
|
$ |
— |
|
$ |
— |
|
On December 15, 2016, the Company entered an Amended and Restated Credit Agreement (the “New Credit Agreement”) with Bank of America, acting as administrative agent, and with participation from Citizens Bank and JPMorgan Chase Bank (collectively with Bank of America, the “Lenders”). The New Credit Agreement is initially an all-revolving credit facility with a borrowing capacity of $150,000, which can be increased by an additional $50,000 at the request of the Company and the individual or collective option of any of the Lenders. The New Credit Agreement contains customary affirmative and negative covenants that, among other things, restrict our ability to incur additional indebtedness and require certain lender approval for acquisitions by the Company and its subsidiaries over a certain size. It also requires us to maintain certain financial ratios on a consolidated basis, including a consolidated net leverage ratio (as defined in the facility) of no more than 3.25 to 1.00, and a consolidated fixed charge coverage ratio (as defined in the facility) of at least 1.25 to 1.00. We were in compliance with our debt covenants as of August 31, 2017. The New Credit Agreement is guaranteed by all of Chase’s direct and indirect domestic subsidiaries, including NEPTCO, which had a carrying value of $162,818 at August 31, 2017. The New Credit Agreement was entered both to refinance our
52
CHASE CORPORATION
NOTES TO CONSOLIDATED FINANCIAL STATEMENTS
In thousands, except share and per share amounts
previously existing term loan and revolving line of credit, and to provide for additional liquidity to finance potential acquisitions, working capital, capital expenditures, and for other general corporate purposes.
The applicable interest rate for the revolver portion of the New Credit Agreement (the “New Revolving Facility”) and any New Term Loan (defined below) is based on the effective London Interbank Offered Rate (LIBOR) plus an additional amount in the range of 1.00% to 1.75%, depending on the consolidated net leverage ratio of Chase and its subsidiaries. At August 31, 2017, there was no outstanding principal balance, and as such no applicable interest rate. The New Credit Agreement has a five-year term with interest payments due at the end of the applicable LIBOR period (but in no event less frequently than the three-month anniversary of the commencement of such LIBOR period) and principal payment due at the expiration of the agreement, December 15, 2021. In addition, the Company may elect a base rate option for all or a portion of the New Revolving Facility, in which case, interest payments shall be due with respect to such portion of the New Revolving Facility on the last business day of each quarter.
Subject to certain conditions set forth in the New Credit Agreement, the Company may elect to convert all or a portion of the outstanding New Revolving Facility into a term loan (each, a “New Term Loan”), which shall be payable quarterly in equal installments sufficient to amortize the original principal amount of such New Term Loan on a seven year amortization schedule; provided, however, that the final principal repayment installment shall be repaid on December 15, 2021 and in any event shall be in an amount equal to the aggregate principal amount of all Term Loans outstanding on such date. Prepayment is allowed by the New Credit Agreement at any time during the term of the agreement, subject to customary notice requirements.
In connection with entry into the New Credit Agreement, Chase applied proceeds to refinance in full the outstanding principal balance of its preexisting term debt, simultaneously terminating both our previously existing term loan agreement and the previously existing revolving line of credit, which was fully available as of December 15, 2016. The refinanced term loan had borne interest monthly at a rate of LIBOR plus an additional amount in the range of 1.75% to 2.25%, based upon the Company’s consolidated leverage ratio (effective interest rate of 2.27% at August 31, 2016), and required quarterly principal payments in installments of $1,400 beginning September 2012 through June 2014, $1,750 through June 2015, and $2,100 thereafter. The refinanced term loan had an original maturity date of June 27, 2017.
53
CHASE CORPORATION
NOTES TO CONSOLIDATED FINANCIAL STATEMENTS
In thousands, except share and per share amounts
Note 7—Income Taxes
Domestic and foreign pre‑tax income for the years ended August 31, 2017, 2016 and 2015 was:
|
|
|
Year Ended August 31, |
|
|||||||
|
|
|
2017 |
|
2016 |
|
2015 |
|
|||
|
United States |
|
$ |
52,723 |
|
$ |
40,928 |
|
$ |
31,168 |
|
|
Foreign |
|
|
8,169 |
|
|
9,182 |
|
|
10,058 |
|
|
|
|
$ |
60,892 |
|
$ |
50,110 |
|
$ |
41,226 |
|
The provision (benefit) for income taxes for the years ended August 31, 2017, 2016 and 2015 was:
|
|
|
Year Ended August 31, |
|
|||||||
|
|
|
2017 |
|
2016 |
|
2015 |
|
|||
|
Current: |
|
|
|
|
|
|
|
|
|
|
|
Federal |
|
$ |
17,714 |
|
$ |
14,777 |
|
$ |
11,831 |
|
|
State |
|
|
1,872 |
|
|
1,821 |
|
|
1,475 |
|
|
Foreign |
|
|
1,555 |
|
|
2,023 |
|
|
2,077 |
|
|
Total current income tax provision |
|
|
21,141 |
|
|
18,621 |
|
|
15,383 |
|
|
|
|
|
|
|
|
|
|
|
|
|
|
Deferred: |
|
|
|
|
|
|
|
|
|
|
|
Federal |
|
|
(1,984) |
|
|
(879) |
|
|
(405) |
|
|
State |
|
|
(453) |
|
|
(324) |
|
|
(188) |
|
|
Foreign |
|
|
174 |
|
|
(115) |
|
|
23 |
|
|
Total deferred income tax benefit |
|
|
(2,263) |
|
|
(1,318) |
|
|
(570) |
|
|
|
|
|
|
|
|
|
|
|
|
|
|
Total income tax provision |
|
$ |
18,878 |
|
$ |
17,303 |
|
$ |
14,813 |
|
54
CHASE CORPORATION
NOTES TO CONSOLIDATED FINANCIAL STATEMENTS
In thousands, except share and per share amounts
The provision (benefit) for income taxes differs from the amount computed by applying the federal statutory income tax rate to income before income taxes. The Company’s combined federal, state and foreign effective tax rate as a percentage of income before taxes for fiscal 2017, 2016 and 2015, net of offsets generated by federal, state and foreign tax benefits, was 31.0%, 34.5% and 35.9%, respectively. The following is a reconciliation of the effective income tax rate with the U.S. federal statutory income tax rate for the years ended August 31, 2017, 2016 and 2015:
|
|
|
Year Ended August 31, |
|
||||
|
|
|
2017 |
|
2016 |
|
2015 |
|
|
Federal statutory rates |
|
35.0 |
% |
35.0 |
% |
35.0 |
% |
|
Adjustment resulting from the tax effect of: |
|
|
|
|
|
|
|
|
State and local taxes, net of federal benefit |
|
1.5 |
% |
1.9 |
% |
2.0 |
% |
|
Domestic production deduction |
|
(2.5) |
% |
(2.9) |
% |
(2.0) |
% |
|
Foreign tax rate differential |
|
(1.4) |
% |
(2.5) |
% |
(3.2) |
% |
|
Adjustment to uncertain tax position |
|
0.0 |
% |
0.0 |
% |
0.5 |
% |
|
Research credit generated |
|
(0.3) |
% |
(0.3) |
% |
(0.3) |
% |
|
Stock Compensation |
|
(3.1) |
% |
0.0 |
% |
0.0 |
% |
|
Noncontrolling partnership interest |
|
0.0 |
% |
0.0 |
% |
(0.1) |
% |
|
Permanent items |
|
1.6 |
% |
0.0 |
% |
0.0 |
% |
|
Tax effect of undistributed earnings |
|
1.4 |
% |
2.7 |
% |
3.4 |
% |
|
Other |
|
(1.2) |
% |
0.6 |
% |
0.6 |
% |
|
Effective income tax rate |
|
31.0 |
% |
34.5 |
% |
35.9 |
% |
The following table summarizes the tax effect of temporary differences on the Company’s income tax provision:
|
|
|
Year Ended August 31, |
|
|||||||
|
|
|
2017 |
|
2016 |
|
2015 |
|
|||
|
Current income tax provision |
|
$ |
21,141 |
|
$ |
18,621 |
|
$ |
15,383 |
|
|
|
|
|
|
|
|
|
|
|
|
|
|
Deferred provision (benefit): |
|
|
|
|
|
|
|
|
|
|
|
|
|
|
|
|
|
|
|
|
|
|
|
Allowance for doubtful accounts |
|
|
8 |
|
|
34 |
|
|
3 |
|
|
Inventories |
|
|
139 |
|
|
(80) |
|
|
(88) |
|
|
Pension expense |
|
|
(39) |
|
|
(542) |
|
|
(190) |
|
|
Deferred compensation |
|
|
250 |
|
|
272 |
|
|
(68) |
|
|
Loan finance costs |
|
|
5 |
|
|
5 |
|
|
6 |
|
|
Accruals |
|
|
(270) |
|
|
(95) |
|
|
(90) |
|
|
Warranty reserve |
|
|
(89) |
|
|
19 |
|
|
37 |
|
|
Depreciation and amortization |
|
|
(2,714) |
|
|
(2,166) |
|
|
(1,794) |
|
|
Restricted stock grant |
|
|
(214) |
|
|
(8) |
|
|
222 |
|
|
Unrepatriated earnings |
|
|
832 |
|
|
1,338 |
|
|
1,401 |
|
|
Valuation allowance |
|
|
24 |
|
|
— |
|
|
— |
|
|
Foreign amortization |
|
|
(2) |
|
|
(21) |
|
|
(70) |
|
|
Other accrued expenses |
|
|
(193) |
|
|
(74) |
|
|
61 |
|
|
|
|
|
|
|
|
|
|
|
|
|
|
Total deferred income tax benefit |
|
|
(2,263) |
|
|
(1,318) |
|
|
(570) |
|
|
|
|
|
|
|
|
|
|
|
|
|
|
Total income tax provision |
|
$ |
18,878 |
|
$ |
17,303 |
|
$ |
14,813 |
|
55
CHASE CORPORATION
NOTES TO CONSOLIDATED FINANCIAL STATEMENTS
In thousands, except share and per share amounts
The following table summarizes the tax effects of temporary differences that give rise to significant portions of the deferred tax assets and liabilities:
|
|
|
As of August 31, |
|
||||
|
|
|
2017 |
|
2016 |
|
||
|
Deferred tax assets: |
|
|
|
|
|
|
|
|
Allowance for doubtful accounts |
|
$ |
228 |
|
$ |
236 |
|
|
Inventories |
|
|
1,462 |
|
|
1,623 |
|
|
Accruals |
|
|
800 |
|
|
531 |
|
|
Warranty reserve |
|
|
120 |
|
|
31 |
|
|
Pension accrual |
|
|
5,078 |
|
|
5,655 |
|
|
Deferred compensation |
|
|
358 |
|
|
608 |
|
|
Deferred revenue |
|
|
334 |
|
|
— |
|
|
Loan finance costs |
|
|
27 |
|
|
32 |
|
|
Restricted stock grants |
|
|
792 |
|
|
589 |
|
|
Non-qualified stock options |
|
|
26 |
|
|
15 |
|
|
Foreign other |
|
|
— |
|
|
428 |
|
|
Other |
|
|
280 |
|
|
11 |
|
|
|
|
|
9,505 |
|
|
9,759 |
|
|
Deferred tax liabilities: |
|
|
|
|
|
|
|
|
Prepaid liabilities |
|
|
(29) |
|
|
(44) |
|
|
Unrepatriated earnings |
|
|
(2,298) |
|
|
(2,486) |
|
|
Unrealized gain/loss on restricted investments |
|
|
(177) |
|
|
(141) |
|
|
Depreciation and amortization |
|
|
(5,362) |
|
|
(8,078) |
|
|
Other |
|
|
(25) |
|
|
(16) |
|
|
|
|
|
(7,891) |
|
|
(10,765) |
|
|
Net deferred tax assets (liabilities) |
|
$ |
1,614 |
|
$ |
(1,006) |
|
Given our cash position and borrowing capability in the U.S. and the potential for increased investment and acquisitions in foreign jurisdictions, we do not have a history of repatriating a significant portion of our foreign cash. However, we do not currently take the position that undistributed foreign subsidiaries’ earnings are considered to be permanently reinvested. Accordingly, we recognize a deferred tax liability for the estimated future tax effects attributable to temporary differences due to these unremitted earnings. In the event that circumstances should change in the future and we decide to repatriate these foreign amounts to fund U.S. operations, the Company would pay the applicable U.S. taxes on these repatriated foreign amounts, less any tax credit offsets, to satisfy all previously recorded tax liabilities.
A summary of the Company’s adjustments to its uncertain tax positions in fiscal years ended August 31, 2017, 2016 and 2015 are as follows:
|
|
|
2017 |
|
2016 |
|
2015 |
|
|||
|
Balance, at beginning of the year |
|
$ |
1,229 |
|
$ |
1,249 |
|
$ |
1,030 |
|
|
Increase for tax positions related to the current year |
|
|
65 |
|
|
37 |
|
|
75 |
|
|
Increase for tax positions related to prior years |
|
|
16 |
|
|
98 |
|
|
— |
|
|
Increase for interest and penalties |
|
|
6 |
|
|
102 |
|
|
144 |
|
|
Decreases for lapses of statute of limitations |
|
|
(59) |
|
|
(257) |
|
|
— |
|
|
Balance, at end of year |
|
$ |
1,257 |
|
$ |
1,229 |
|
$ |
1,249 |
|
The unrecognized tax benefits mentioned above include an aggregate of $647 of accrued interest and penalty balances related to uncertain tax positions. The Company recognizes interest and penalties related to uncertain tax
56
CHASE CORPORATION
NOTES TO CONSOLIDATED FINANCIAL STATEMENTS
In thousands, except share and per share amounts
positions in income tax expense. An increase in accrued interest and penalty charges of approximately $40, net of federal tax expense, was recorded as a tax expense during the current fiscal year. The Company does not anticipate that its accrual for uncertain tax positions will be reduced by a material amount over the next twelve-month period, as it does not expect to settle any potential disputed items with the appropriate taxing authorities nor does it expect the statute of limitations to expire for any items.
The Company is subject to U.S. federal income tax, as well as to income tax of multiple state, local and foreign tax jurisdictions. The statute of limitations for all material U.S. federal, state, and local tax filings remains open for fiscal years subsequent to 2013. For foreign jurisdictions, the statute of limitations remains open in the U.K. for fiscal years subsequent to 2013 and in France for fiscal years subsequent to 2016.
Note 8—Operating Leases
The Company is obligated under various operating leases, primarily for real property and equipment. Future minimum lease payments under noncancelable operating leases (with initial or remaining lease terms in excess of one year) as of August 31, 2017, are as follows:
|
|
|
Future Operating |
|
|
|
Year ending August 31, |
|
Lease Payments |
|
|
|
2018 |
|
$ |
1,623 |
|
|
2019 |
|
|
1,562 |
|
|
2020 |
|
|
1,565 |
|
|
2021 |
|
|
1,459 |
|
|
2022 |
|
|
956 |
|
|
2023 and thereafter |
|
|
3,141 |
|
|
Total future minimum lease payments |
|
$ |
10,306 |
|
Total rental expense for all operating leases amounted to $2,516, $1,631 and $1,541 for the years ended August 31, 2017, 2016 and 2015, respectively.
Note 9—Benefits and Pension Plans
401(k) Plans
The Company has a defined contribution plan adopted pursuant to section 401(k) of the Internal Revenue Code of 1986. Any qualified employee who has attained age 21 and has been employed by the Company for at least six months may contribute a portion of his or her salary to the plan and the Company will match 100% of the first one percent of salary contributed and 50% thereafter, up to an amount equal to three and one-half percent of such employee’s annual salary.
Through our wholly-owned subsidiary NEPTCO, the Company has two additional 401(k) savings plans, one for union employees and one for nonunion employees. Under these plans, substantially all employees of NEPTCO are eligible to participate by making pre‑tax contributions to these plans. Participants may elect to defer between 1% and 10% of their annual compensation. The Company may contribute $0.75 for each $1.00 of participant deferrals up to 6% of the non‑union participant’s compensation. The Company may match union employee contributions by $0.50 for each $1.00 of participant deferrals up to 6% of the participant’s compensation.
The Company’s contribution expense for all 401(k) plans was $519, $571 and $394 for the years ended August 31, 2017, 2016 and 2015, respectively.
57
CHASE CORPORATION
NOTES TO CONSOLIDATED FINANCIAL STATEMENTS
In thousands, except share and per share amounts
Non-Qualified Deferred Savings Plan
The Company has a non-qualified deferred savings plan covering the Board of Directors and a separate plan covering selected employees. Participants may elect to defer a portion of their compensation for future payment. The plans are funded by trusteed assets that are restricted to the payment of deferred compensation or satisfaction of the Company’s general creditors. The Company’s liability under the plans was $979 and $1,649 at August 31, 2017 and 2016, respectively.
Pension Plans
The Company has noncontributory defined benefit pension plans covering employees of certain divisions of the Company. The Company has a funded, qualified plan (“Qualified Plan”) and an unfunded supplemental plan (“Supplemental Plan”) designed to maintain benefits for certain employees at the plan formula level. The plans provide for pension benefits determined by a participant’s years of service and final average compensation. The Qualified Plan assets consist of separate pooled investment accounts with a trust company. The measurement date for the plans is August 31, 2017.
Effective December 1, 2008, a “soft freeze” in the Qualified Plan was adopted whereby no new employees hired will be admitted to the Qualified Plan, with the exception of employees who are members of the International Association of Machinists and Aerospace Workers Union whose contract was amended in June 2012 to include a soft freeze with an effective date of July 15, 2012. All eligible participants who were admitted to the plan prior to the applicable soft freeze dates will continue to accrue benefits as detailed in the plan agreements.
Through our wholly-owned subsidiary NEPTCO, the Company has a third defined benefit pension plan (“NEPTCO Pension Plan”) covering our union employees at our Pawtucket facility. This plan was frozen effective October 31, 2006, and as a result, no new participants can enter the plan and the benefits of current participants were frozen as of that date. The benefits are based on years of service and the employee’s average compensation during the earlier of five years before retirement, or October 31, 2006. The NEPTCO Pension Plan assets consist of separate pooled investment accounts with a trust company. The measurement date for the NEPTCO Pension Plan is August 31, 2017.
58
CHASE CORPORATION
NOTES TO CONSOLIDATED FINANCIAL STATEMENTS
In thousands, except share and per share amounts
The following tables reflect the status of the Company’s pension plans for the years ended August 31, 2017, 2016 and 2015:
|
|
|
|
Year Ended August 31, |
|
|||||||
|
|
|
|
2017 |
|
2016 |
|
2015 |
|
|||
|
Change in benefit obligation |
|
|
|
|
|
|
|
|
|
|
|
|
Projected benefit obligation at beginning of year |
|
|
$ |
23,636 |
|
$ |
20,401 |
|
$ |
18,279 |
|
|
Service cost |
|
|
|
288 |
|
|
295 |
|
|
349 |
|
|
Interest cost |
|
|
|
681 |
|
|
728 |
|
|
678 |
|
|
Assumption change |
|
|
|
— |
|
|
— |
|
|
40 |
|
|
Actuarial (gain) loss |
|
|
|
(533) |
|
|
2,636 |
|
|
1,762 |
|
|
Settlements |
|
|
|
(313) |
|
|
(376) |
|
|
(619) |
|
|
Benefits paid |
|
|
|
(1,086) |
|
|
(48) |
|
|
(89) |
|
|
Projected benefit obligation at end of year |
|
|
$ |
22,673 |
|
$ |
23,636 |
|
$ |
20,401 |
|
|
|
|
|
|
|
|
|
|
|
|
|
|
|
Change in plan assets |
|
|
|
|
|
|
|
|
|
|
|
|
Fair value of plan assets at beginning of year |
|
|
$ |
8,440 |
|
$ |
8,120 |
|
$ |
8,818 |
|
|
Actual return on plan assets |
|
|
|
757 |
|
|
422 |
|
|
(296) |
|
|
Employer contribution |
|
|
|
1,205 |
|
|
322 |
|
|
306 |
|
|
Settlements |
|
|
|
(313) |
|
|
(376) |
|
|
(619) |
|
|
Benefits paid |
|
|
|
(1,086) |
|
|
(48) |
|
|
(89) |
|
|
Fair value of plan assets at end of year |
|
|
$ |
9,003 |
|
$ |
8,440 |
|
$ |
8,120 |
|
|
|
|
|
|
|
|
|
|
|
|
|
|
|
Funded status at end of year |
|
|
$ |
(13,670) |
|
$ |
(15,196) |
|
$ |
(12,281) |
|
|
|
|
|
Year Ended August 31, |
|
|||||||
|
|
|
|
2017 |
|
2016 |
|
2015 |
|
|||
|
Amounts recognized in consolidated balance sheets |
|
|
|
|
|
|
|
|
|
|
|
|
Noncurrent assets |
|
|
$ |
566 |
|
$ |
382 |
|
$ |
634 |
|
|
Current liabilities |
|
|
|
(1,570) |
|
|
(15) |
|
|
(14) |
|
|
Noncurrent liabilities |
|
|
|
(12,666) |
|
|
(15,563) |
|
|
(12,901) |
|
|
Net amount recognized in consolidated balance sheets |
|
|
$ |
(13,670) |
|
$ |
(15,196) |
|
$ |
(12,281) |
|
|
|
|
|
|
|
|
|
|
|
|
|
|
|
Actuarial present value of benefit obligation and funded status |
|
|
|
|
|
|
|
|
|
|
|
|
Accumulated benefit obligations |
|
|
$ |
21,007 |
|
$ |
22,023 |
|
$ |
18,784 |
|
|
Projected benefit obligations |
|
|
$ |
22,673 |
|
$ |
23,636 |
|
$ |
20,401 |
|
|
Plan assets at fair value |
|
|
$ |
9,003 |
|
$ |
8,440 |
|
$ |
8,120 |
|
|
|
|
|
|
|
|
|
|
|
|
|
|
|
Amounts recognized in accumulated other comprehensive income |
|
|
|
|
|
|
|
|
|
|
|
|
Prior service cost |
|
|
$ |
54 |
|
$ |
57 |
|
$ |
61 |
|
|
Net actuarial loss |
|
|
|
9,890 |
|
|
11,561 |
|
|
9,417 |
|
|
Adjustment to pre-tax accumulated other comprehensive income |
|
|
$ |
9,944 |
|
$ |
11,618 |
|
$ |
9,478 |
|
59
CHASE CORPORATION
NOTES TO CONSOLIDATED FINANCIAL STATEMENTS
In thousands, except share and per share amounts
|
|
|
|
Year Ended August 31, |
|
|||||||
|
|
|
|
2017 |
|
2016 |
|
2015 |
|
|||
|
Other changes in plan assets and benefit obligations recognized in other comprehensive income |
|
|
|
|
|
|
|
|
|
|
|
|
Net loss |
|
|
$ |
1,277 |
|
$ |
511 |
|
$ |
4,371 |
|
|
Amortization of loss |
|
|
|
(895) |
|
|
(574) |
|
|
(667) |
|
|
Supplemental plan assumption change |
|
|
|
(2,038) |
|
|
2,219 |
|
|
(1,667) |
|
|
Amortization of prior service cost |
|
|
|
(3) |
|
|
(3) |
|
|
(3) |
|
|
Effect of settlement on accumulated other comprehensive income |
|
|
|
(14) |
|
|
(13) |
|
|
(188) |
|
|
Total recognized in other comprehensive income |
|
|
|
(1,673) |
|
|
2,140 |
|
|
1,846 |
|
|
|
|
|
|
|
|
|
|
|
|
|
|
|
Net periodic pension cost |
|
|
|
1,353 |
|
|
1,097 |
|
|
1,280 |
|
|
|
|
|
|
|
|
|
|
|
|
|
|
|
Total recognized in net periodic pension cost and other comprehensive income |
|
|
$ |
(320) |
|
$ |
3,237 |
|
$ |
3,126 |
|
|
|
|
|
|
|
|
|
|
|
|
|
|
|
Estimated amounts that will be amortized from accumulated comprehensive income over the next fiscal year |
|
|
|
|
|
|
|
|
|
|
|
|
Prior service cost |
|
|
$ |
3 |
|
$ |
3 |
|
$ |
3 |
|
|
Net actuarial loss |
|
|
|
485 |
|
|
895 |
|
|
574 |
|
Prior service cost arose from the amendment of the plan’s benefit schedules to comply with the Tax Reform Act of 1986 and adoption of the unfunded supplemental pension plan.
60
CHASE CORPORATION
NOTES TO CONSOLIDATED FINANCIAL STATEMENTS
In thousands, except share and per share amounts
Components of net periodic pension cost for the fiscal years ended August 31, 2017, 2016 and 2015 included the following:
|
|
|
|
|
|
|
|
|
|
|
|
|
|
|
|
|
|
|
|
|
2017 |
|
2016 |
|
2015 |
|
|||
|
Components of net periodic benefit cost |
|
|
|
|
|
|
|
|
|
|
|
|
|
|
Service cost |
|
|
|
|
$ |
288 |
|
$ |
295 |
|
$ |
349 |
|
|
Interest cost |
|
|
|
|
|
681 |
|
|
728 |
|
|
678 |
|
|
Expected return on plan assets |
|
|
|
|
|
(528) |
|
|
(516) |
|
|
(605) |
|
|
Amortization of prior service cost |
|
|
|
|
|
3 |
|
|
3 |
|
|
3 |
|
|
Amortization of accumulated loss |
|
|
|
|
|
895 |
|
|
574 |
|
|
667 |
|
|
Settlement and curtailment loss |
|
|
|
|
|
14 |
|
|
13 |
|
|
188 |
|
|
Net periodic benefit cost |
|
|
|
|
$ |
1,353 |
|
$ |
1,097 |
|
$ |
1,280 |
|
Weighted average assumptions used to determine benefit obligations as of August 31, 2017, 2016 and 2015 are as follows:
|
|
|
2017 |
|
2016 |
|
2015 |
|
|
Discount rate |
|
|
|
|
|
|
|
|
Qualified plan |
|
3.30 |
% |
2.90 |
% |
4.16 |
% |
|
Supplemental plan |
|
2.73 |
% |
2.97 |
% |
3.22 |
% |
|
NEPTCO plan |
|
2.95 |
% |
2.55 |
% |
4.30 |
% |
|
Rate of compensation increase |
|
|
|
|
|
|
|
|
Qualified and Supplemental plan |
|
3.50 |
% |
3.50 |
% |
3.50 |
% |
|
NEPTCO plan |
|
— |
% |
— |
% |
— |
% |
Weighted average assumptions used to determine net periodic benefit cost for the years ended August 31, 2017, 2016 and 2015 are as follows:
|
|
|
2017 |
|
2016 |
|
2015 |
|
|
Discount rate |
|
|
|
|
|
|
|
|
Qualified plan |
|
2.90 |
% |
4.16 |
% |
3.83 |
% |
|
Supplemental plan |
|
2.97 |
% |
3.22 |
% |
3.01 |
% |
|
NEPTCO plan |
|
2.55 |
% |
4.30 |
% |
4.06 |
% |
|
Expected long-term return on plan assets |
|
|
|
|
|
|
|
|
Qualified plan |
|
6.50 |
% |
6.50 |
% |
7.00 |
% |
|
Supplemental plan |
|
— |
% |
— |
% |
— |
% |
|
NEPTCO plan |
|
6.50 |
% |
6.50 |
% |
7.00 |
% |
|
Rate of compensation increase |
|
|
|
|
|
|
|
|
Qualified and Supplemental plan |
|
3.50 |
% |
3.50 |
% |
3.50 |
% |
|
NEPTCO plan |
|
— |
% |
— |
% |
— |
% |
It is the Company’s policy to evaluate, on an annual basis, the discount rate used to determine the projected benefit obligation to approximate rates on high quality, long-term obligations. The Moody’s Corporate Aa Bond index has generally been used as a benchmark for this purpose, with adjustments made if the duration of the index differed from that of the plan. For periods since August 31, 2008, the discount rate has been determined by matching the expected payouts from the respective plans to the spot rates inherent in the Citigroup Pension Discount Curve. A single rate is then developed, that when applied to the expected cash flows, results in the same present value as determined using the various spot rates. The Company believes that this approach produces the most appropriate approximation of the plan liability.
61
CHASE CORPORATION
NOTES TO CONSOLIDATED FINANCIAL STATEMENTS
In thousands, except share and per share amounts
The Company estimates that each 100-basis point reduction in the discount rate would result in additional net periodic pension cost, the Company’s primary pension obligation, of approximately $51 for the Qualified Plan and $39 for the Supplemental Plan. For the current fiscal year, the NEPTCO Pension Plan expense is insignificant so sensitivity disclosure is not presented. The expected return on plan assets is derived from a periodic study of long-term historical rates of return on the various asset classes included in the Company’s targeted pension plan asset allocation. The Company estimates that each 100-basis point reduction in the expected return on plan assets would result in additional net periodic pension cost of approximately $69 for the Qualified Plan. No rate of return is assumed for the Supplemental Plan since that plan is currently not funded. The rate of compensation increase is also evaluated and is adjusted by the Company, if necessary, periodically.
Qualified Plan Assets
The investment policy for the Qualified Plan is based on ERISA standards for prudent investing. The fundamental goal underlying the investment policy is to ensure that the assets of the plans are invested in a prudent manner to meet the obligations of the plans as these obligations come due. The primary investment objectives include providing a total return which will promote the goal of benefit security by attaining an appropriate ratio of plan assets to plan obligations, to provide for real asset growth while also tracking plan obligations, to diversify investments across and within asset classes, to reduce the impact of losses in single investments, and to follow investment practices that comply with applicable laws and regulations.
The primary policy objectives will be met by investing assets to achieve a reasonable tradeoff between return and risk relative to the plan’s obligations. This includes investing a portion of the assets in funds selected in part to hedge the interest rate sensitivity to plan obligations.
The Qualified Plan assets are invested in a diversified mix of both domestic and foreign equity investments and fixed income securities. Asset manager performance is reviewed at least annually and benchmarked against the peer universe for the given investment style. The Company’s expected return for the Qualified Plan is 6.5%. To determine the expected long‑term rate of return on the assets for the Qualified Plan, the Company considered the historical and expected return on the plan assets, as well as the current and expected allocation of the plan assets.
Asset allocation is monitored on an ongoing basis relative to the established asset class targets. The interaction between plan assets and benefit obligations is periodically studied to assist in the establishment of strategic asset allocation targets. The investment policy permits variances from the targets within certain parameters. Asset rebalancing occurs when the underlying asset class allocations move outside these parameters, at which time the asset allocation is rebalanced back to the policy target weight.
The Qualified Plan has the following target allocation and weighted average asset allocations as of August 31, 2017, 2016 and 2015:
|
|
|
Target |
|
|
|
|
|
|
|
|
|
|
Allocation |
|
Percentage of Plan Assets as of August 31, |
|
||||
|
Asset Category |
|
Range |
|
2017 |
|
2016 |
|
2015 |
|
|
Equity securities |
|
10-80 |
% |
39 |
% |
46 |
% |
44 |
% |
|
Debt securities |
|
20-70 |
% |
61 |
% |
54 |
% |
56 |
% |
|
Other |
|
0-100 |
% |
— |
% |
— |
% |
— |
% |
|
Total |
|
100 |
% |
100 |
% |
100 |
% |
100 |
% |
62
CHASE CORPORATION
NOTES TO CONSOLIDATED FINANCIAL STATEMENTS
In thousands, except share and per share amounts
NEPTCO Pension Plan Assets
The investment policy for the NEPTCO Pension Plan is based on ERISA standards for prudent investing. The fundamental goal underlying the investment policy is to ensure that the assets of the plans are invested in a prudent manner to meet the obligations of the plan as these obligations come due. The primary investment objectives include maximization of return within reasonable and prudent levels of risk, provision of returns comparable to returns for similar investment options, provision of exposure to a wide range of investment opportunities in various asset classes and vehicles, control administrative and management costs, provision of appropriate diversification within investment vehicles, and govern investment manager’s adherence to stated investment objectives and style.
The primary policy objectives will be met by investing assets to achieve a reasonable tradeoff between return and risk relative to the plan’s obligations. This includes investing a portion of the assets in funds selected in part to hedge the interest rate sensitivity to plan obligations.
The NEPTCO Pension Plan assets are invested in a diversified mix of fixed income, and both domestic and foreign equity investments. The ongoing monitoring of investments is a regular and disciplined process and confirms that the criteria remain satisfied. The process of monitoring investment performance relative to specified guidelines is consistently applied.
The Company’s expected return for the NEPTCO Pension Plan is 6.5%. To determine the expected long‑term rate of return on the assets for the NEPTCO Pension Plan, the Company considered the historical and expected return on the plan assets, as well as the current and expected allocation of the plan assets.
The NEPTCO Pension Plan has the following target allocation and weighted average asset allocations as of August 31, 2017, 2016 and 2015:
|
|
|
Target |
|
|
|
|
|
|
|
|
|
|
Allocation |
|
Percentage of Plan Assets as of August 31, |
|
||||
|
Asset Category |
|
Range |
|
2017 |
|
2016 |
|
2015 |
|
|
Equity securities |
|
10-80 |
% |
43 |
% |
43 |
% |
41 |
% |
|
Debt securities |
|
20-70 |
% |
51 |
% |
50 |
% |
53 |
% |
|
Other |
|
0-100 |
% |
6 |
% |
7 |
% |
6 |
% |
|
Total |
|
100 |
% |
100 |
% |
100 |
% |
100 |
% |
Fair Market Value of Pension Plan Assets
The Company is required to categorize pension plan assets using a three‑tier fair value hierarchy, which classifies the inputs used in measuring fair values. These tiers include: Level 1, defined as observable inputs such as quoted prices for identical instruments in active markets; Level 2, defined as inputs other than quoted prices in active markets that are either directly or indirectly observable; and Level 3, defined as unobservable inputs in which little or no market data exists, therefore requiring an entity to develop its own assumptions.
63
CHASE CORPORATION
NOTES TO CONSOLIDATED FINANCIAL STATEMENTS
In thousands, except share and per share amounts
The following table presents the Company’s pension plan assets at August 31, 2017 and 2016 by asset category:
|
|
|
|
|
|
Fair value measurements at |
|
|
|
|
Fair value measurements at |
|
||||||||||||||
|
|
|
|
|
|
August 31, 2017 |
|
|
|
|
August 31, 2016 |
|
||||||||||||||
|
|
|
|
|
|
|
|
|
Significant |
|
|
|
|
|
|
|
|
|
|
Significant |
|
|
|
|
||
|
|
|
|
|
|
Quoted prices |
|
other |
|
Significant |
|
|
|
|
Quoted prices |
|
other |
|
Significant |
|
||||||
|
|
|
|
|
|
in active |
|
observable |
|
unobservable |
|
|
|
|
in active |
|
observable |
|
unobservable |
|
||||||
|
|
|
August 31, |
|
markets |
|
inputs |
|
inputs |
|
August 31, |
|
markets |
|
inputs |
|
inputs |
|
||||||||
|
|
|
2017 |
|
(Level 1) |
|
(Level 2) |
|
(Level 3) |
|
2016 |
|
(Level 1) |
|
(Level 2) |
|
(Level 3) |
|
||||||||
|
Asset Category |
|
|
|
|
|
|
|
|
|
|
|
|
|
|
|
|
|
|
|
|
|
|
|
|
|
|
Equity securities |
|
$ |
3,589 |
|
$ |
3,589 |
|
$ |
— |
|
$ |
— |
|
$ |
3,866 |
|
$ |
3,866 |
|
$ |
— |
|
$ |
— |
|
|
Debt securities |
|
|
5,336 |
|
|
5,336 |
|
|
— |
|
|
— |
|
|
4,499 |
|
|
4,499 |
|
|
— |
|
|
— |
|
|
Other |
|
|
78 |
|
|
78 |
|
|
— |
|
|
— |
|
|
75 |
|
|
75 |
|
|
— |
|
|
— |
|
|
|
|
|
|
|
|
|
|
|
|
|
|
|
|
|
|
|
|
|
|
|
|
|
|
|
|
|
Total |
|
$ |
9,003 |
|
$ |
9,003 |
|
$ |
— |
|
$ |
— |
|
$ |
8,440 |
|
$ |
8,440 |
|
$ |
— |
|
$ |
— |
|
Level 1 Assets: The fair values of the common stocks, corporate bonds and U.S. Government securities included in this tier are based on the closing price reported on the active market where the individual securities are traded.
Estimated Future Benefit Payments
The following pension benefit payments (which include expected future service) are assumed to be paid in each of the following fiscal years based on the participants’ normal retirement age:
|
Year ending August 31, |
|
Pension Benefits |
|
|
|
2018 |
|
$ |
2,395 |
|
|
2019 |
|
|
1,970 |
|
|
2020 |
|
|
1,998 |
|
|
2021 |
|
|
1,916 |
|
|
2022 |
|
|
2,299 |
|
|
2023-2027 |
|
$ |
9,345 |
|
The Company contributed $1,205, $322 and $306 to fund its obligations under the pension plans for the years ended August 31, 2017, 2016 and 2015, respectively. The Company plans to make the necessary contributions during fiscal 2018 to ensure its pension plans continue to be adequately funded given the current market conditions, and estimates approximately $1,800 in contributions during fiscal 2018.
Note 10—Stockholders’ Equity
2013 Equity Incentive Plan
In October 2012, the Company adopted, and the stockholders subsequently approved, the 2013 Equity Incentive Plan (the “2013 Plan”). The 2013 Plan permits the grant of restricted stock, stock options, deferred stock, stock payments or other awards to employees, participating officers, directors, consultants and advisors who are linked directly to increases in shareholder value. The aggregate number of shares available for grant under the 2013 Plan was initially 1,200,000. Additional shares may become available in connection with share splits, share dividends or similar transactions. As of August 31, 2017, 1,078,015 shares remained available for future grant under the 2013 Plan.
64
CHASE CORPORATION
NOTES TO CONSOLIDATED FINANCIAL STATEMENTS
In thousands, except share and per share amounts
2005 Incentive Plan
In November 2005, the Company adopted, and the stockholders subsequently approved, the 2005 Incentive Plan (the “2005 Plan”). The 2005 Plan permits the grant of restricted stock, stock options, deferred stock, stock payments or other awards to employees, participating officers, directors, consultants and advisors who are linked directly to increases in shareholder value. The aggregate number of shares available for grant under the 2005 Plan was initially 1,000,000. The Company is no longer granting equity awards under the 2005 Plan.
2001 Senior Management Stock Plan and 2001 Non-Employee Director Stock Option Plan
In October 2002, the Company adopted, and the stockholders subsequently approved, the 2001 Senior Management Stock Plan and the 2001 Non‑Employee Director Stock Option Plan (the “2001 Plans”). The 2001 Plans reserved 1,500,000 and 180,000 shares of the Company’s common stock for grants related to the Senior Management Stock Plan and Non‑Employee Director Stock Option Plan, respectively. The Company is no longer granting equity awards under the 2001 Plans.
Restricted Stock
Employees and Executive Management
In October 2012, the Board of Directors of the Company approved the fiscal year 2013 Long Term Incentive Plan (“LTIP”) for the executive officers and other members of management. The 2013 LTIP was an equity-based plan with a grant date of October 22, 2012. In addition to the stock option component described below, the plan contained the following restricted stock components: (a) a performance and service-based restricted stock grant of 11,861 shares in the aggregate, subject to adjustment, with a vesting date of August 31, 2015, for which compensation expense was recognized on a ratable basis over the vesting period based on quarterly probability assessments; and (b) a time‑based restricted stock grant of 16,505 and 1,931 shares in the aggregate, with vesting dates of August 31, 2015 and August 31, 2013, respectively, for which compensation expense was recognized on a ratable basis over the vesting period.
Based on the fiscal year 2013 financial results, 11,861 additional shares of restricted stock (total of 23,722 shares) were earned and granted subsequent to the end of fiscal year 2013 in accordance with the performance measurement criteria. No further performance-based measurements apply to this award.
In September 2013, the Board of Directors of the Company approved the fiscal year 2014 LTIP for the executive officers and other members of management. The 2014 LTIP was an equity-based plan with a grant date of September 1, 2013. In addition to the stock option component described below, the plan contained the following restricted stock components: (a) performance and service-based restricted stock grant of 7,529 shares in the aggregate, subject to adjustment, with a vesting date of August 31, 2016, for which compensation expense is recognized on a ratable basis over the vesting period based on quarterly probability assessments; and (b) a time-based restricted stock grant of 8,323 and 1,040 shares in the aggregate, with vesting dates of August 31, 2016 and August 31, 2014, respectively, for which compensation expense was recognized on a ratable basis over the vesting period.
Based on the fiscal year 2014 financial results, 5,485 additional shares of restricted stock (total of 13,014 shares) were earned and granted subsequent to the end of fiscal year 2014 in accordance with the performance measurement criteria. No further performance-based measurements apply to this award.
In August 2014, the Board of Directors of the Company approved the fiscal year 2015 LTIP for the executive officers and other members of management. The 2015 LTIP was an equity-based plan with a grant date of September 1, 2014. In addition to the stock option component described below, the plan contained the following restricted stock components: (a) a performance and service-based restricted stock grant of 6,993 shares in the aggregate, subject to
65
CHASE CORPORATION
NOTES TO CONSOLIDATED FINANCIAL STATEMENTS
In thousands, except share and per share amounts
adjustment based on fiscal 2015 results, with a vesting date of August 31, 2017, for which compensation expense is recognized on a ratable basis over the vesting period based on quarterly probability assessments; and (b) a time-based restricted stock grant of 7,005 and 1,127 shares (total of 8,132 shares) in the aggregate, with vesting dates of August 31, 2017 and September 1, 2014, respectively. Compensation expense was being recognized on a ratable basis over the vesting period.
Based on the fiscal year 2015 financial results, 5,685 additional shares of restricted stock (total of 12,678 shares) were earned and granted subsequent to the end of fiscal year 2015 in accordance with the performance measurement criteria. No further performance-based measurements apply to this award.
During the third quarter of fiscal 2015, an additional 16,000 restricted shares were issued to non-executive members of management; 15,000 with a vesting date of April 16, 2020 and 1,000 with a vesting date of January 31, 2018. Compensation expense is being recognized on a ratable basis over the vesting period.
In August 2015, the Board of Directors of the Company approved the fiscal year 2016 LTIP for the executive officers and other members of management. The 2016 LTIP is an equity-based plan with a grant date of September 1, 2015. In addition to the stock option component described below, the plan contains the following restricted stock components: (a) a performance and service-based restricted stock grant of 6,962 shares in the aggregate, subject to adjustment based on fiscal 2016 results, with a vesting date of August 31, 2018 for which compensation expense is recognized on a ratable basis over the vesting period based on quarterly probability assessments; and (b) a time-based restricted stock grant of 7,683 shares in the aggregate, with a vesting date of August 31, 2018. Compensation expense is recognized on a ratable basis over the vesting period.
Based on the fiscal year 2016 financial results, 6,277 additional shares of restricted stock (total of 13,239 shares) were earned and granted subsequent to the end of fiscal year 2016 in accordance with the performance measurement criteria. No further performance-based measurements apply to this award.
During the first quarter of fiscal 2016, an additional grant of 5,000 restricted shares was made to a non-executive member of management with a vesting date of October 20, 2020. Compensation expense is being recognized on a ratable basis over the vesting period.
In August 2016, the Board of Directors of the Company approved the fiscal year 2017 LTIP for the executive officers and other members of management. The 2017 LTIP is an equity-based plan with a grant date of September 1, 2016. In addition to the stock option component described below, the plan contains the following restricted stock components: (a) a performance and service-based restricted stock grant of 5,399 shares in the aggregate, subject to adjustment based on fiscal 2017 results, with a vesting date of August 31, 2019, for which compensation expense being is recognized on a ratable basis over the vesting period based on quarterly probability assessments; and (b) a time-based restricted stock grant of 5,367 shares in the aggregate, with a vesting date of August 31, 2019. Compensation expense is being recognized on a ratable basis over the vesting period.
In August 2016, the Board of Directors of the Company approved equity retention agreements with certain executive officers. The equity-based retention agreements have a grant date of September 1, 2016. In addition to the stock option component described below, the equity retention agreements contain a time-based restricted stock grant of 16,312 shares in the aggregate, with 7,768 shares having a vesting date of August 31, 2019, and 8,544 shares, which had an original vesting date of August 31, 2021, amended in August 2017 to vest in five equal annual installments over the five-year period following the grant date. Compensation expense is being recognized on a ratable basis over the vesting period.
66
CHASE CORPORATION
NOTES TO CONSOLIDATED FINANCIAL STATEMENTS
In thousands, except share and per share amounts
During the first quarter of fiscal 2017, additional grants totaling 8,805 shares of restricted stock were issued to non-executive members of management with a vesting date of August 31, 2021. Compensation expense is being recognized on a ratable basis over the vesting period.
Non-employee Board of Directors
In February 2014, as part of their standard compensation for board service, non-employee members of the Board received a total grant of 4,878 shares of restricted stock for service for the period from January 31, 2014 through January 31, 2015. The shares of restricted stock vested at the conclusion of this service period. Compensation expense was recognized on a ratable basis over the twelve-month vesting period.
In February 2015, as part of their standard compensation for board service, non-employee members of the Board received a total grant of 5,361 shares of restricted stock for service for the period from January 31, 2015 through January 31, 2016. The shares of restricted stock vested at the conclusion of this service period. Compensation expense was recognized on a ratable basis over the twelve-month vesting period.
In February 2016, as part of their standard compensation for board service, non-employee members of the Board received a total grant of 4,554 shares of restricted stock for service for the period from January 31, 2016 through January 31, 2017. The shares of restricted stock will vest at the conclusion of this service period. Compensation expense was recognized on a ratable basis over the twelve-month vesting period.
In February 2017, as part of their standard compensation for board service, non-employee members of the Board received a total grant of 2,407 shares of restricted stock for service for the period from January 31, 2017 through January 31, 2018. The shares of restricted stock will vest at the conclusion of this service period. Compensation is recognized on a ratable basis over the twelve-month vesting period.
A summary of the transactions of the Company’s restricted stock plans for the years ended August 31, 2017, 2016 and 2015 is presented below:
|
|
|
Non Employee |
|
Weighted Average |
|
Officers |
|
Weighted Average |
||
|
Unvested restricted stock at August 31, 2014 |
|
4,878 |
|
$ |
29.52 |
|
56,079 |
|
$ |
18.83 |
|
Granted |
|
5,361 |
|
$ |
36.19 |
|
36,610 |
|
$ |
37.76 |
|
Vested |
|
(4,878) |
|
$ |
29.52 |
|
(32,234) |
|
$ |
16.68 |
|
Forfeited or cancelled |
|
— |
|
|
|
|
(12,186) |
|
$ |
14.63 |
|
Unvested restricted stock at August 31, 2015 |
|
5,361 |
|
$ |
36.19 |
|
48,269 |
|
$ |
35.68 |
|
Granted |
|
4,554 |
|
$ |
48.12 |
|
25,330 |
|
$ |
39.07 |
|
Vested |
|
(5,361) |
|
$ |
36.19 |
|
(18,271) |
|
$ |
29.72 |
|
Forfeited or cancelled |
|
— |
|
|
|
|
— |
|
|
|
|
Unvested restricted stock at August 31, 2016 |
|
4,554 |
|
$ |
48.12 |
|
55,328 |
|
$ |
39.20 |
|
Granted |
|
2,407 |
|
$ |
91.05 |
|
42,160 |
|
$ |
60.67 |
|
Vested |
|
(4,554) |
|
$ |
48.12 |
|
(23,516) |
|
$ |
38.81 |
|
Forfeited or cancelled |
|
— |
|
|
|
|
— |
|
|
|
|
Unvested restricted stock at August 31, 2017 |
|
2,407 |
|
$ |
91.05 |
|
73,972 |
|
$ |
51.56 |
|
|
|
|
|
|
|
|
|
|
|
|
67
CHASE CORPORATION
NOTES TO CONSOLIDATED FINANCIAL STATEMENTS
In thousands, except share and per share amounts
Stock Options
In March 2012, the Board of Directors of the Company authorized a grant of stock options to a non-executive officer employee to purchase 6,630 shares of common stock with an exercise price of $14.62 per share. The options vested in three equal annual allotments ending on March 8, 2015. The options will expire on March 8, 2022. Compensation expense was recognized over the period of the award on an annual basis consistent with the vesting terms.
In October 2012, the Board of Directors of the Company approved the fiscal year 2013 LTIP for the executive officers and other members of management. The 2013 LTIP was an equity-based plan with a grant date of October 22, 2012 and included options to purchase 43,964 shares of common stock in the aggregate with an exercise price of $16.00 per share. The options vested in three equal annual allotments ending on August 31, 2015. The options will expire on October 22, 2022. Compensation expense was recognized over the period of the award on an annual basis consistent with the vesting terms.
In September 2013, the Board of Directors of the Company approved the fiscal year 2014 LTIP for the executive officers and other members of management. The 2014 LTIP was an equity-based plan with a grant date of September 1, 2013 and included options to purchase 25,969 shares of common stock in the aggregate with an exercise price of $29.72 per share. The options vested in three equal annual allotments ending on August 31, 2016. The options will expire on August 31, 2023. Compensation expense was recognized over the period of the award on an annual basis consistent with the vesting terms.
In August 2014, the Board of Directors of the Company approved the fiscal year 2015 LTIP for the executive officers and other members of management. The 2015 LTIP is an equity-based plan with a grant date of September 1, 2014 and included options to purchase 22,750 shares of common stock in the aggregate with an exercise price of $35.50 per share. The options vested in three equal annual installments ending on August 31, 2017. Of the options granted, 7,438 will expire on August 31, 2024 and 15,312 will expire on September 1, 2024. Compensation expense was recognized over the period of the award on an annual basis consistent with the vesting terms.
In August 2015, the Board of Directors of the Company approved the fiscal year 2016 LTIP for the executive officers and other members of management. The 2016 LTIP is an equity-based plan with a grant date of September 1, 2015 and included options to purchase 21,275 shares of common stock in the aggregate with an exercise price of $39.50 per share. The options vest in three equal annual installments ending on August 31, 2018. The options granted will expire on September 1, 2025. Compensation expense is recognized over the period of the award consistent with the vesting terms.
In August 2016, the Board of Directors of the Company approved the fiscal year 2016 LTIP for the executive officers and other members of management. The 2016 LTIP is an equity-based plan with a grant date of September 1, 2016 and included options to purchase 15,028 shares of common stock in the aggregate with an exercise price of $64.37 per share. The options vest in three equal annual installments ending on August 31, 2019. Of the options granted, 5,596 options will expire on August 31, 2026, and 9,432 options will expire on September 1, 2026. Compensation expense is recognized over the period of the award consistent with the vesting terms.
In August 2016, the Board of Directors of the Company approved equity retention agreements with certain executive officers. The equity-based retention agreements have a grant date of September 1, 2016 and included options to purchase 23,563 shares of common stock in the aggregate with an exercise price of $64.37 per share. These options will cliff vest on August 31, 2019 and will expire on August 31, 2026. Compensation expense is recognized over the period of the award consistent with the vesting terms.
68
CHASE CORPORATION
NOTES TO CONSOLIDATED FINANCIAL STATEMENTS
In thousands, except share and per share amounts
The following table summarizes information about stock options outstanding as of August 31, 2017:
|
|
|
|
Options Outstanding |
|
Options Exercisable |
|
||||||||||||||
|
Exercise Prices |
|
Number |
|
Weighted Avg. |
|
Weighted |
|
Aggregate |
|
Number |
|
Weighted |
|
Aggregate |
|
|||||
|
$ |
12.70 |
|
15,105 |
|
3.0 |
|
$ |
12.70 |
|
$ |
1,220 |
|
15,105 |
|
$ |
12.70 |
|
$ |
1,220 |
|
|
$ |
12.77 |
|
16,953 |
|
4.0 |
|
$ |
12.77 |
|
$ |
1,369 |
|
16,953 |
|
$ |
12.77 |
|
$ |
1,369 |
|
|
$ |
16.00 |
|
25,087 |
|
5.1 |
|
$ |
16.00 |
|
$ |
1,944 |
|
25,087 |
|
$ |
16.00 |
|
$ |
1,944 |
|
|
$ |
16.53 |
|
3,926 |
|
3.7 |
|
$ |
16.53 |
|
$ |
302 |
|
3,926 |
|
$ |
16.53 |
|
$ |
302 |
|
|
$ |
29.72 |
|
16,246 |
|
6.0 |
|
$ |
29.72 |
|
$ |
1,036 |
|
16,246 |
|
$ |
29.72 |
|
$ |
1,036 |
|
|
$ |
35.50 |
|
17,965 |
|
7.0 |
|
$ |
35.50 |
|
$ |
1,042 |
|
17,965 |
|
$ |
35.50 |
|
$ |
1,042 |
|
|
$ |
39.50 |
|
19,101 |
|
8.0 |
|
$ |
39.50 |
|
$ |
1,032 |
|
13,264 |
|
$ |
39.50 |
|
$ |
716 |
|
|
$ |
64.37 |
|
38,591 |
|
9.0 |
|
$ |
64.37 |
|
$ |
1,124 |
|
6,641 |
|
$ |
64.37 |
|
$ |
194 |
|
|
|
|
|
152,974 |
|
6.4 |
|
$ |
34.21 |
|
$ |
9,069 |
|
115,187 |
|
$ |
25.58 |
|
$ |
7,823 |
|
All stock option plans have been approved by the Company’s stockholders. Options are granted with an exercise price that is equal to the closing market value of the Company’s common stock on the day preceding the grant date, which is determined not to be materially different from the opening market value on the date of grant.
A summary of the transactions of the Company’s stock option plans for the years ended August 31, 2017, 2016 and 2015 is presented below:
|
|
|
Officers |
|
Weighted |
|
|
Options outstanding at August 31, 2014 |
|
463,901 |
|
$ |
15.43 |
|
Granted |
|
22,750 |
|
$ |
35.50 |
|
Exercised |
|
(169,038) |
|
$ |
15.21 |
|
Forfeited or cancelled |
|
(4,224) |
|
$ |
22.25 |
|
Options outstanding at August 31, 2015 |
|
313,389 |
|
$ |
16.92 |
|
Granted |
|
21,275 |
|
$ |
39.50 |
|
Exercised |
|
(140,113) |
|
$ |
15.27 |
|
Forfeited or cancelled |
|
— |
|
|
|
|
Options outstanding at August 31, 2016 |
|
194,551 |
|
$ |
20.57 |
|
Granted |
|
38,591 |
|
$ |
64.37 |
|
Exercised |
|
(80,168) |
|
$ |
15.62 |
|
Forfeited or cancelled |
|
— |
|
|
|
|
Options outstanding at August 31, 2017 |
|
152,974 |
|
$ |
34.21 |
|
Options exercisable at August 31, 2017 |
|
115,187 |
|
$ |
25.58 |
The weighted average grant date fair value of options granted in the years ended August 31, 2017, 2016 and 2015 was $21.22, $13.80 and $12.10 per share, respectively.
The total pretax intrinsic value of stock options exercised was $6,243, $6,880 and $3,972 for the years ended August 31, 2017, 2016, and 2015, respectively.
69
CHASE CORPORATION
NOTES TO CONSOLIDATED FINANCIAL STATEMENTS
In thousands, except share and per share amounts
Excluding the common stock currently reserved for issuance upon exercise of the 152,974 outstanding options, there are 1,078,015 shares of common stock available for future issuance under the Company’s 2013 Equity Incentive Plan. Based on historic experience, management estimates all outstanding stock options will vest.
The income tax benefit realized from stock options exercised, vesting of restricted stock and issuance of stock pursuant to grants of restricted stock units was $1,917, $1,784 and $1,088 for the years ended August 31, 2017, 2016 and 2015, respectively.
As of August 31, 2017, unrecognized expense related to all stock-based compensation described above was $3,176 (including $2,713 for restricted stock and $463 for stock options), which will be recognized over the next four fiscal years.
Note 11—Segment Data
The Company is organized into two operating segments, an Industrial Materials segment and a Construction Materials segment. The segments are distinguished by the nature of the products we manufacture and how they are delivered to their respective markets.
The Industrial Materials segment includes specified products that are used in, or integrated into, another company’s product, with demand typically dependent upon general economic conditions. Industrial Materials products include insulating and conducting materials for wire and cable manufacturers, moisture protective coatings for electronics, laminated durable papers, laminates for the packaging and industrial laminate markets, custom manufacturing services, pulling and detection tapes used in the installation, measurement and location of fiber optic cables and water and natural gas lines, cover tapes essential to delivering semiconductor components via tape and reel packaging, composite materials and elements, polymeric microspheres, and polyurethane dispersions. Beginning June 23, 2016, and September 30, 2016, respectively, the Industrial Materials segment includes the acquired operations of HumiSeal India Private Limited (formerly Spray Products (India) Private Limited) and of Resin Designs, LLC. Both were obtained through acquisition and included in the Company’s electronic and industrial coatings product line. Prior to the April 3, 2017 sale of the business, the segment’s products also included glass-based strength elements, designed to allow fiber optic cables to withstand mechanical and environmental strain and stress.
The Construction Materials segment is principally composed of project-oriented product offerings that are primarily sold and used as “Chase” branded products. Construction Materials products include protective coatings for pipeline applications, coating and lining systems for use in liquid storage and containment applications, adhesives and sealants used in architectural and building envelope waterproofing applications, high-performance polymeric asphalt additives, and expansion and control joint systems for use in the transportation and architectural markets.
70
CHASE CORPORATION
NOTES TO CONSOLIDATED FINANCIAL STATEMENTS
In thousands, except share and per share amounts
The following tables summarize information about the Company’s segments:
|
|
|
|
|
Years Ended August 31, |
|
|||||||||
|
|
|
|
|
2017 |
|
|
2016 |
|
|
2015 |
|
|||
|
Revenue |
|
|
|
|
|
|
|
|
|
|
|
|
|
|
|
Industrial Materials |
|
|
|
$ |
202,956 |
|
|
$ |
181,728 |
|
|
$ |
176,547 |
|
|
Construction Materials |
|
|
|
|
49,604 |
|
|
|
56,366 |
|
|
|
61,499 |
|
|
Total |
|
|
|
$ |
252,560 |
|
|
$ |
238,094 |
|
|
$ |
238,046 |
|
|
|
|
|
|
|
|
|
|
|
|
|
|
|
|
|
|
Income before taxes |
|
|
|
|
|
|
|
|
|
|
|
|
|
|
|
Industrial Materials |
|
|
|
$ |
67,561 |
(a) |
|
$ |
53,530 |
(c) |
|
$ |
46,388 |
(e) |
|
Construction Materials |
|
|
|
|
18,205 |
|
|
|
19,967 |
|
|
|
17,272 |
|
|
Total for reportable segments |
|
|
|
|
85,766 |
|
|
|
73,497 |
|
|
|
63,660 |
|
|
Corporate and common costs |
|
|
|
|
(24,874) |
(b) |
|
|
(23,387) |
(d) |
|
|
(22,434) |
(f) |
|
Total |
|
|
|
$ |
60,892 |
|
|
$ |
50,110 |
|
|
$ |
41,226 |
|
|
|
|
|
|
|
|
|
|
|
|
|
|
|
|
|
|
Includes the following costs by segment: |
|
|
|
|
|
|
|
|
|
|
|
|
|
|
|
Industrial Materials |
|
|
|
|
|
|
|
|
|
|
|
|
|
|
|
Interest |
|
|
|
$ |
629 |
|
|
$ |
791 |
|
|
$ |
913 |
|
|
Depreciation |
|
|
|
|
3,423 |
|
|
|
3,918 |
|
|
|
4,050 |
|
|
Amortization |
|
|
|
|
7,839 |
|
|
|
6,427 |
|
|
|
5,178 |
|
|
|
|
|
|
|
|
|
|
|
|
|
|
|
|
|
|
Construction Materials |
|
|
|
|
|
|
|
|
|
|
|
|
|
|
|
Interest |
|
|
|
$ |
210 |
|
|
$ |
263 |
|
|
$ |
150 |
|
|
Depreciation |
|
|
|
|
718 |
|
|
|
761 |
|
|
|
1,123 |
|
|
Amortization |
|
|
|
|
1,288 |
|
|
|
1,409 |
|
|
|
1,584 |
|
|
a) |
Includes a $2,013 gain on sale of our fiber optic cable components business and $190 of expenses related to inventory step-up in fair value attributable to the September 2016 acquisition of certain assets of Resin Designs |
|
b) |
Includes $584 in acquisition-related expenses attributable to the September 2016 acquisition of certain assets of Resin Designs, facility exit and demolition costs of $70 related to the Company’s Randolph, MA location, a $792 gain related to the November 2016 sale of the Company’s Paterson, NJ location, a $68 gain related to the December 2016 sale of the Company’s former corporate headquarters in Bridgewater, MA and $14 of pension-related settlement costs due to the timing of lump sum distributions |
|
c) |
Includes a $1,031 gain on sale of our RodPack wind energy business contained within our structural composites product line and a $365 write-down on certain other structural composites assets based on usage constraints following the sale, both recognized in November 2015 |
|
d) |
Includes $935 in Randolph, MA facility exit and demolition costs, a $877 gain on the write-down of an annuity and $13 of pension-related settlement costs due to the timing of lump sum distributions |
|
e) |
Includes $65 of expense related to inventory step-up in fair value related to the January 2015 acquisition of the specialty chemical intermediates product line |
|
f) |
Includes $584 in expenses related to the January 2015 acquisition of the specialty chemical intermediates product line and $188 of pension-related settlement costs due to the timing of lump sum distributions |
71
CHASE CORPORATION
NOTES TO CONSOLIDATED FINANCIAL STATEMENTS
In thousands, except share and per share amounts
|
|
|
|
As of August 31, |
|
||||
|
|
|
|
2017 |
|
2016 |
|
||
|
Total Assets |
|
|
|
|
|
|
|
|
|
Industrial Materials |
|
|
$ |
156,263 |
|
$ |
136,003 |
|
|
Construction Materials |
|
|
|
38,162 |
|
|
38,983 |
|
|
Total for reportable segments |
|
|
|
194,425 |
|
|
174,986 |
|
|
Corporate and common assets |
|
|
|
60,313 |
|
|
87,833 |
|
|
Total |
|
|
$ |
254,738 |
|
$ |
262,819 |
|
Note 12—Export Sales and Foreign Operations
Export sales from continuing domestic operations to unaffiliated third parties were $36,719, $28,826 and $27,955 for the years ended August 31, 2017, 2016 and 2015, respectively. The increase in export sales in fiscal 2017 against both fiscal 2016 and 2015 resulted from increased export sales into China, and certain European countries.
The Company’s products are sold worldwide. Revenue for the years ended August 31, 2017, 2016 and 2015, are attributed to operations located in the following countries:
|
|
|
|
|
Years Ended August 31, |
|||||||||
|
|
|
|
|
2017 |
|
|
2016 |
|
|
2015 |
|||
|
Revenue |
|
|
|
|
|
|
|
|
|
|
|
|
|
|
United States |
|
|
|
$ |
217,745 |
|
|
$ |
197,776 |
|
|
$ |
189,398 |
|
United Kingdom |
|
|
|
|
16,691 |
|
|
|
24,048 |
|
|
|
32,006 |
|
All other foreign (1) |
|
|
|
|
18,124 |
|
|
|
16,270 |
|
|
|
16,642 |
|
Total |
|
|
|
$ |
252,560 |
|
|
$ |
238,094 |
|
|
$ |
238,046 |
|
|
|
|
|
|
|
|
|
|
|
|
|
|
|
|
(1) |
Inclusive of sales originated from our Paris, France location, royalty revenue attributable to our licensed manufacturer in Asia, and Chase foreign manufacturing operations. |
72
CHASE CORPORATION
NOTES TO CONSOLIDATED FINANCIAL STATEMENTS
In thousands, except share and per share amounts
As of August 31, 2017 and 2016, the Company had long‑lived assets (defined as tangible assets providing the Company with a future economic benefit beyond the current year or operating period, including buildings, equipment and leasehold improvements) and goodwill and intangible assets, less accumulated amortization in the following countries:
|
|
|
|
|
As of August 31, |
||||
|
|
|
|
|
2017 |
|
2016 |
||
|
Long-lived Assets |
|
|
|
|
|
|
|
|
|
United States |
|
|
|
|
|
|
|
|
|
Property, plant and equipment, net |
|
|
$ |
30,253 |
|
$ |
32,176 |
|
|
Goodwill and Intangible assets, less accumulated amortization |
|
|
|
90,673 |
|
|
72,653 |
|
|
|
|
|
|
|
|
|
|
|
|
United Kingdom |
|
|
|
|
|
|
|
|
|
Property, plant and equipment, net |
|
|
|
3,184 |
|
|
3,214 |
|
|
Goodwill and Intangible assets, less accumulated amortization |
|
|
|
5,685 |
|
|
6,270 |
|
|
|
|
|
|
|
|
|
|
|
|
All other foreign |
|
|
|
|
|
|
|
|
|
Property, plant and equipment, net |
|
|
|
1,323 |
|
|
1,352 |
|
|
Goodwill and Intangible assets, less accumulated amortization |
|
|
|
1,272 |
|
|
1,233 |
|
|
|
|
|
|
|
|
|
|
|
|
Total |
|
|
|
|
|
|
|
|
|
Property, plant and equipment, net |
|
|
$ |
34,760 |
|
$ |
36,742 |
|
|
Goodwill and Intangible assets, less accumulated amortization |
|
|
$ |
97,630 |
|
$ |
80,156 |
|
73
CHASE CORPORATION
NOTES TO CONSOLIDATED FINANCIAL STATEMENTS
In thousands, except share and per share amounts
Note 13—Supplemental Cash Flow Data
Supplemental cash flow information for the years ended August 31, 2017, 2016 and 2015 is as follows:
|
|
|
2017 |
|
2016 |
|
2015 |
|
|||
|
Income taxes paid |
|
$ |
21,025 |
|
$ |
17,550 |
|
$ |
11,987 |
|
|
Interest paid |
|
$ |
786 |
|
$ |
1,059 |
|
$ |
1,114 |
|
|
|
|
|
|
|
|
|
|
|
|
|
|
Noncash Investing and Financing Activities |
|
|
|
|
|
|
|
|
|
|
|
Common stock received for payment of stock option exercises |
|
$ |
1,158 |
|
$ |
2,015 |
|
$ |
2,180 |
|
|
Property, plant and equipment additions included in accounts payable |
|
$ |
220 |
|
$ |
22 |
|
$ |
53 |
|
|
Deferred tax assets and liabilities acquired from noncontrolling interest |
|
$ |
— |
|
$ |
— |
|
$ |
446 |
|
|
|
|
|
|
|
|
|
|
|
|
|
|
Acquisition of Resin Designs |
|
|
|
|
|
|
|
|
|
|
|
Current assets |
|
$ |
3,240 |
|
|
|
|
|
|
|
|
Property, plant & equipment |
|
|
623 |
|
|
|
|
|
|
|
|
Goodwill and Intangible assets |
|
|
27,042 |
|
|
|
|
|
|
|
|
Accounts payable and accrued liabilities |
|
|
(635) |
|
|
|
|
|
|
|
|
Payments for acquisitions |
|
|
(30,270) |
|
|
|
|
|
|
|
|
|
|
|
|
|
|
|
|
|
|
|
|
Sale of Fiber Optic Cable Components product line |
|
|
|
|
|
|
|
|
|
|
|
Inventory |
|
$ |
(1,167) |
|
|
|
|
|
|
|
|
Property, plant and equipment |
|
|
(166) |
|
|
|
|
|
|
|
|
Goodwill and Intangible assets |
|
|
(512) |
|
|
|
|
|
|
|
|
Gain on sale of business |
|
|
(2,013) |
|
|
|
|
|
|
|
|
Due from sale of business (recorded within Other assets) |
|
|
400 |
|
|
|
|
|
|
|
|
Cash received from sale of product line, net of transaction costs |
|
|
3,458 |
|
|
|
|
|
|
|
|
|
|
|
|
|
|
|
|
|
|
|
|
Acquisition of Spray Products (India) Private Limited |
|
|
|
|
|
|
|
|
|
|
|
Current assets (excluding cash) |
|
|
|
|
$ |
55 |
|
|
|
|
|
Property and equipment |
|
|
|
|
|
1,027 |
|
|
|
|
|
Goodwill |
|
|
|
|
|
107 |
|
|
|
|
|
Accounts payable and accrued liabilities |
|
|
|
|
|
(28) |
|
|
|
|
|
Payments for acquisitions, net of cash acquired |
|
|
|
|
|
(1,161) |
|
|
|
|
|
|
|
|
|
|
|
|
|
|
|
|
|
Sale of RodPack Business |
|
|
|
|
|
|
|
|
|
|
|
Property, plant and equipment |
|
|
|
|
$ |
(846) |
|
|
|
|
|
Intangible assets |
|
|
|
|
|
(309) |
|
|
|
|
|
Gain on sale of business |
|
|
|
|
|
(1,031) |
|
|
|
|
|
Due from sale of business |
|
$ |
(457) |
|
|
457 |
|
|
|
|
|
Cash received from sale of business |
|
|
457 |
|
|
1,729 |
|
|
|
|
|
|
|
|
|
|
|
|
|
|
|
|
|
Acquisition of specialty chemical intermediates product line |
|
|
|
|
|
|
|
|
|
|
|
Inventory |
|
|
|
|
|
|
|
$ |
610 |
|
|
Property, plant and equipment |
|
|
|
|
|
|
|
|
1,064 |
|
|
Goodwill and Intangible assets |
|
|
|
|
|
|
|
|
31,611 |
|
|
Payments for acquisitions |
|
|
|
|
|
|
|
|
(33,285) |
|
|
|
|
|
|
|
|
|
|
|
|
|
74
CHASE CORPORATION
NOTES TO CONSOLIDATED FINANCIAL STATEMENTS
In thousands, except share and per share amounts
Note 14—Acquisitions
Acquisition of Resin Designs, LLC
On September 30, 2016, the Company acquired certain assets of Resin Designs, LLC (“Resin Designs”), an advanced adhesives and sealants manufacturer, with locations in Woburn, MA and Newark, CA. This business was acquired for a purchase price of $30,270, after final working capital adjustments and excluding acquisition-related costs. As part of this transaction, Chase acquired all working capital and fixed assets of the business, and entered into multiyear leases at both locations. Resin Designs is a formulator of customized adhesive and sealant systems used in high-reliability electronic applications. The acquisition broadens the Company’s adhesives and sealants product offering and manufacturing capabilities, and expands its market reach. The purchase was funded entirely with available cash on hand.
Since the effective date for this acquisition, September 30, 2016, the financial results of the acquired business have been included in the Company’s financial statements within the Industrial Materials operating segment, within the electronic and industrial coatings product line. The acquisition was accounted for as a business combination under ASC Topic 805, “Business Combinations.” In accordance with this accounting standard, the Company expensed $584 of acquisition-related costs during the first fiscal quarter of 2017 to acquisition-related costs.
Purchase accounting was completed in the fourth quarter of fiscal 2017 with no material adjustments made to the initial amounts recorded. The purchase price has been allocated to the acquired tangible and identifiable intangible assets assumed, based on their fair values as of the date of the acquisition:
|
Assets & Liabilities |
|
Amount |
|
|
|
Accounts receivable |
|
$ |
1,877 |
|
|
Inventory |
|
|
1,300 |
|
|
Prepaid expenses and other current assets |
|
|
63 |
|
|
Property, plant & equipment |
|
|
623 |
|
|
Goodwill |
|
|
7,592 |
|
|
Intangible assets |
|
|
19,450 |
|
|
Accounts payable and accrued liabilities |
|
|
(635) |
|
|
Total purchase price |
|
$ |
30,270 |
|
The excess of the purchase price over the net tangible and intangible assets acquired resulted in goodwill of $7,592 that is largely attributable to the synergies and economies of scale from combining the operations, technologies and research and development capabilities of Resin Designs and Chase, particularly as it pertains to the expansion of the Company's product and service offerings, the established workforce and marketing efforts. This goodwill is deductible for income tax purposes.
All assets, including goodwill, acquired as part of the Resin Designs acquisition are included in the Industrial Materials operating segment. Identifiable intangible assets purchased with this transaction are as follows:
|
Intangible Asset |
|
Amount |
|
Useful life |
||
|
Customer relationships |
|
$ |
17,500 |
|
10 |
years |
|
Technology |
|
|
1,200 |
|
4 |
years |
|
Trade names |
|
|
750 |
|
7 |
years |
|
Total intangible assets |
|
$ |
19,450 |
|
|
|
75
CHASE CORPORATION
NOTES TO CONSOLIDATED FINANCIAL STATEMENTS
In thousands, except share and per share amounts
Supplemental Pro Forma Data (unaudited)
The following table presents the pro forma results of the Company for the years ended August 31, 2017 and 2016 as though the Resin Designs acquisition described above occurred on September 1, 2015 (the first day of fiscal 2016). The actual revenue and expenses for the acquired business are included in the Company’s fiscal 2017 consolidated results beginning on September 30, 2016. From the date of acquisition (September 30, 2016) through August 31, 2017, revenue and net income for the Resin Designs operations included in the consolidated statement of operations were $14,868 and $669, respectively, including the effects of $584 in acquisition-related costs, $190 in sale of inventory step-up cost, and additional amortization expense recognized related to intangible assets recorded as part of the transaction. The pro forma results include adjustments for the estimated amortization of intangibles, acquisition-related costs, sale of inventory step-up cost and the income tax impact of the pro forma adjustments at the statutory rate of 35%. The following pro forma information is not necessarily indicative of the results that would have been achieved if the acquisition had been effective on September 1, 2015.
|
|
Years Ended August 31, |
|||||
|
|
|
2017 |
|
2016 |
||
|
Revenue |
$ |
254,145 |
|
|
$ |
250,021 |
|
Net income |
|
42,685 |
|
|
|
32,228 |
|
Net income attributable to Chase Corporation |
|
42,685 |
|
|
|
32,228 |
|
|
|
|
|
|
|
|
|
Net income available to common shareholders, per common and common equivalent share |
|
|
|
|
|
|
|
Basic earnings per share |
$ |
4.56 |
|
|
$ |
3.49 |
|
Diluted earnings per share |
$ |
4.51 |
|
|
$ |
3.44 |
Acquisition of Spray Products (India) Private Limited
On June 23, 2016, the Company acquired all the capital stock of Spray Products (India) Private Limited for $1,161, net of cash acquired. This acquired business works closely with our HumiSeal manufacturing operation in Winnersh, Wokingham, England. The acquisition in India enhances the Company’s ability to provide technical, sales, manufacturing, chemical handling, and packaging services in the region. Since the effective date for this acquisition, the financial results of the business have been included in the Company's financial statements within the Company’s Industrial Materials operating segment in the electronic and industrial coatings product line. Purchase accounting was completed in the quarter ended August 31, 2016. Effective December 2016, Spray Products (India) Private Limited was renamed HumiSeal India Private Limited.
Acquisition of Specialty Chemical Intermediates Product Line
On January 30, 2015, the Company acquired two product lines from Henkel Corporation (the “Seller”) for a purchase price of $33,285, after working capital adjustments and excluding any acquisition-related costs. As part of this transaction, Chase acquired the Seller’s microspheres product line, sold under the Dualite brand, located in Greenville, SC, and obtained exclusive distribution rights and intellectual property related to the Seller’s polyurethane dispersions product line, operating in Elgin, IL. Under the agreement, Chase entered into a ten-year facility operating lease at the Seller’s Greenville, SC location. The Seller will perform certain manufacturing and application services for Chase at the Seller’s Elgin, IL location for three years following the acquisition. The purchase was funded entirely with available cash on hand.
Since the effective date for this acquisition, January 30, 2015, the financial results of the specialty chemical intermediates product line have been included in the Company’s financial statements within the Industrial Materials operating segment. The acquisition was accounted for as a business combination under ASC Topic 805, “Business
76
CHASE CORPORATION
NOTES TO CONSOLIDATED FINANCIAL STATEMENTS
In thousands, except share and per share amounts
Combinations.” In accordance with this accounting standard, the Company expensed $584 of acquisition related costs during the year ended August 31, 2015.
Purchase accounting was completed in the quarter ended May 31, 2015 with no material adjustments made to the initial amounts recorded at the end of the second fiscal quarter. The purchase price has been allocated to the acquired tangible and identifiable intangible assets assumed based on their fair values as of the date of the acquisition:
|
Assets & Liabilities |
|
Amount |
|
|
|
Inventory |
|
$ |
610 |
|
|
Property, plant & equipment |
|
|
1,064 |
|
|
Goodwill |
|
|
6,371 |
|
|
Intangible assets |
|
|
25,240 |
|
|
Total purchase price |
|
$ |
33,285 |
|
The excess of the purchase price over the net tangible and intangible assets acquired resulted in goodwill of $6,371 that is largely attributable to the synergies and economies of scale from combining the operations and technologies of Chase and the two product lines, particularly as it pertains to the expansion of the Company’s product and service offerings, the established workforce, and marketing efforts. This goodwill is deductible for income tax purposes.
All assets, including goodwill, acquired as part of the specialty chemical intermediates product line are included in the Industrial Materials operating segment. Identifiable intangible assets purchased with this transaction are as follows:
|
Intangible Asset |
|
Amount |
|
Useful life |
||
|
Customer relationships |
|
$ |
21,300 |
|
8 |
years |
|
Technology |
|
|
2,700 |
|
7 |
years |
|
Trade name |
|
|
910 |
|
7 |
years |
|
Backlog |
|
|
330 |
|
2 |
months |
|
Total intangible assets |
|
$ |
25,240 |
|
|
|
|
|
|
|
|
|
|
|
Acquisition of outstanding noncontrolling membership interest in NEPTCO JV LLC
On October 31, 2014, the Company purchased the 50% noncontrolling membership interest of NEPTCO JV LLC (the “JV”) that had been owned by its otherwise unrelated joint venture partner. The purchase consideration was subject to certain contingent adjustments based on certain future events related to the JV. The period during which these future events could occur lapsed in the third fiscal quarter of 2016 without being triggered. The purchase price was not material to the Company. The purchase was funded entirely with available cash on hand. Because of the Company’s controlling financial interest, the JV’s assets, liabilities and results of operations have been consolidated within the Company’s Consolidated Financial Statements since June 27, 2012, the date the Company acquired NEPTCO. Given the Company’s 100% ownership as of October 31, 2014, in subsequent periods the Company has continued to fully consolidate its assets, liabilities and results of operations, but no longer records an offsetting amount for a noncontrolling interest. See Note 15 for additional information on the JV.
77
CHASE CORPORATION
NOTES TO CONSOLIDATED FINANCIAL STATEMENTS
In thousands, except share and per share amounts
Note 15—Joint Venture
On October 31, 2014, the Company purchased the 50% noncontrolling membership interest of NEPTCO JV LLC (the “JV”) that had been owned by its otherwise unrelated joint venture partner. The purchase consideration was subject to certain contingent adjustments based on certain future events related to the JV. The period during which these future events could occur lapsed in the third fiscal quarter of 2016 without being triggered. The purchase price was not material to the Company. Because of the Company’s controlling financial interest, the JV’s assets, liabilities, and results of operations have been consolidated within the Company’s Consolidated Financial Statements since June 27, 2012, the date the Company acquired NEPTCO. The Company continues to fully consolidate the assets, liabilities and results of operations of the JV, but no longer records an offsetting amount for a noncontrolling interest. The ($95) recorded in the Consolidated Statement of Operations as Net (income) loss attributable to noncontrolling interest for the year ended August 31, 2015, represents the now-former joint venture partner’s share of the results of operations of the JV for the period from September 1, 2014 through October 31, 2014.
The Company accounted for the joint venture partner’s noncontrolling interest in the JV under ASC Topic 810 “Consolidations” (“ASC 810”). Based on the criteria in ASC 810, the Company had determined that the JV qualified as a variable interest entity.
Under the JV agreement, which terminated with the Company’s October 2014 acquisition of the 50% outstanding noncontrolling membership interest in the JV, the JV had agreed to purchase a minimum of 80% of its total glass fiber requirements from the joint venture partner. Additionally, the JV agreed to purchase private‑label products exclusively from an affiliate of the joint venture partner; however, the JV was not subject to a minimum purchase requirement on private‑label products. Purchases from the joint venture partner totaled $332 for the period from September 1, 2014 through October 31, 2014.
Note 16—Fair Value Measurements
The Company defines fair value as the price that would be received to sell an asset or paid to transfer a liability (exit price) in an orderly transaction between market participants at the measurement date. The Company uses a three‑tier fair value hierarchy, which classifies the inputs used in measuring fair values. These tiers include: Level 1, defined as observable inputs such as quoted prices for identical instruments in active markets; Level 2, defined as inputs other than quoted prices in active markets that are either directly or indirectly observable; and Level 3, defined as unobservable inputs in which little or no market data exists, therefore requiring an entity to develop its own assumptions.
Financial assets and liabilities are classified in their entirety based on the lowest level of input that is significant to the fair value measurement. The Company has determined that it does not have any financial liabilities measured at fair value other than long‑term debt and that its financial assets are currently all classified within Level 1 or Level 2 in the fair value hierarchy. The financial assets classified as Level 1 and Level 2 as of August 31, 2017 and 2016 represent investments which are restricted for use in non-qualified retirement savings plans for certain key employees and directors.
78
CHASE CORPORATION
NOTES TO CONSOLIDATED FINANCIAL STATEMENTS
In thousands, except share and per share amounts
The following table sets forth the Company’s financial assets that were accounted for at fair value on a recurring basis as of August 31, 2017 and 2016:
|
|
|
|
|
|
|
|
Fair value measurement category |
|
|||||
|
|
|
|
|
|
|
|
Quoted prices |
|
Significant other |
|
Significant |
|
|
|
|
|
Fair value |
|
|
|
|
in active markets |
|
observable inputs |
|
unobservable inputs |
|
|
|
|
|
measurement date |
|
Total |
|
(Level 1) |
|
(Level 2) |
|
(Level 3) |
|
||
|
Assets: |
|
|
|
|
|
|
|
|
|
|
|
|
|
|
Restricted investments |
|
August 31, 2017 |
|
$ |
964 |
|
$ |
926 |
|
38 |
|
— |
|
|
|
|
|
|
|
|
|
|
|
|
|
|
|
|
|
Restricted investments |
|
August 31, 2016 |
|
$ |
1,637 |
|
$ |
1,610 |
|
27 |
|
— |
|
The following table presents the fair values of the Company’s long‑term debt as of August 31, 2017 and 2016 which is recorded at its carrying amount:
|
|
|
|
|
|
|
|
Fair value measurement category |
|
|||||
|
|
|
|
|
|
|
|
Quoted prices |
|
Significant other |
|
Significant |
|
|
|
|
|
Fair value |
|
|
|
|
in active markets |
|
observable inputs |
|
unobservable inputs |
|
|
|
|
|
measurement date |
|
Total |
|
(Level 1) |
|
(Level 2) |
|
(Level 3) |
|
||
|
Liabilities: |
|
|
|
|
|
|
|
|
|
|
|
|
|
|
Long-term debt |
|
August 31, 2017 |
|
$ |
— |
|
$ |
— |
|
— |
|
— |
|
|
|
|
|
|
|
|
|
|
|
|
|
|
|
|
|
Long-term debt |
|
August 31, 2016 |
|
$ |
43,400 |
|
$ |
— |
|
43,400 |
|
— |
|
The carrying value of the long‑term debt approximates its fair value, as the interest rate is set based on the movement of the underlying market rates, and is consistent with the interest rate the Company believes it could currently obtain for a similar financing arrangement.
Note 17—Net Income Per Share
The determination of earnings per share under the two‑class method is as follows:
|
|
|
Years Ended August 31, |
|
|||||||
|
|
|
2017 |
|
2016 |
|
2015 |
|
|||
|
Net income attributable to Chase Corporation |
|
$ |
42,014 |
|
$ |
32,807 |
|
$ |
26,318 |
|
|
Less: Allocated to participating securities |
|
|
454 |
|
|
266 |
|
|
214 |
|
|
Available to common shareholders |
|
$ |
41,560 |
|
$ |
32,541 |
|
$ |
26,104 |
|
|
Basic weighted average shares outstanding |
|
|
9,249,343 |
|
|
9,167,333 |
|
|
9,086,043 |
|
|
Additional dilutive common stock equivalents |
|
|
108,071 |
|
|
126,744 |
|
|
168,011 |
|
|
Diluted weighted average shares outstanding |
|
|
9,357,414 |
|
|
9,294,077 |
|
|
9,254,054 |
|
|
Net income available to common shareholders, per common and common equivalent share |
|
|
|
|
|
|
|
|
|
|
|
Basic |
|
$ |
4.49 |
|
$ |
3.55 |
|
$ |
2.87 |
|
|
Diluted |
|
$ |
4.44 |
|
$ |
3.50 |
|
$ |
2.82 |
|
For the respective years ended August 31, 2016 and 2015, stock options to purchase 9,354 and 20,271 shares of common stock were outstanding, but were not included in the calculation of diluted net income per share because their inclusion would be antidilutive. No stock options were excluded from the calculation for the year ended August 31, 2017. Included in the calculation of dilutive common stock equivalents are the unvested portion of restricted stock and stock options.
79
CHASE CORPORATION
NOTES TO CONSOLIDATED FINANCIAL STATEMENTS
In thousands, except share and per share amounts
Note 18—Sale of Businesses
Sale of Fiber Optic Cable Components Product Line
On April 3, 2017, Chase executed an agreement with an unrelated party, to sell all inventory, machinery and equipment and intangible assets of the Company’s fiber optic cable components product line for proceeds of $3,858, net of transaction costs and following certain working capital adjustments. Given its low-growth and low-margin prospects, and a customer, supplier and equipment base separate from our other businesses, the fiber optic cable components product line, which was formerly part of the Company’s Industrial Materials segment, was determined to not be part of Chase’s long-term strategy. The divesture was accounted for under ASC Topic 360, “Disclosure - Impairment or Disposal of Long-Lived Assets.” In accordance with this accounting standard, the resulting pre-tax gain on sale of $2,013 was recognized in fiscal 2017 as gain on sale of businesses within the consolidated statement of operations. Chase received $3,458, net of transaction costs, in the third quarter of fiscal 2017, with the remaining $400 placed in escrow; the portion of the sale price held in escrow was recorded as a non-current asset within other assets as of August 31, 2017, and is available to resolve any submitted claims or adjustments up to 18 months from the closing date of the sale.
Subsequent to the sale, Chase will provide ongoing manufacturing and administrative support to the purchaser for which the Company will receive additional consideration upon the performance of services; this arrangement is anticipated to last for multiple years. Subsequent to the sale, Chase charged the purchaser $740 for manufacturing services, which the Company recognized as revenue within the Industrial Materials segment, and $100 for selling and administrative expenses, which the Company recognized as an offset to selling, general and administrative expenses. Further, the purchaser entered a multiyear lease for a portion of the manufacturing space at the Company’s Granite Falls, NC facility. Chase charged $54 in rental income subsequent to the sale related to this lease, which the Company recognized within other income (expense) on the consolidated statement of operations
Sale of RodPack Business
In November 2015, the Company sold its RodPack wind energy business, contained within its structural composites product line, to an otherwise unrelated party for proceeds of $2,186. The Company’s structural composites product line is a part of the Company’s Industrial Materials segment. The Company is not restricted in its use of the net proceeds from the sale.
The sale resulted in a pre-tax book gain of $1,031, which was recorded within the consolidated statement of operations as gain on sale of businesses in fiscal 2016. The Company received $1,500 of the proceeds in the first quarter of fiscal 2016, and received three additional payments each for $229 during the quarters ended May 31, 2016, November 30, 2016 and August 31, 2017. At August 31, 2016, the Company held the then receivable balance ($457) as a current asset (Due from sale of business). The Company will provide ongoing development support to the Buyer for which it will receive additional consideration upon the completion of services.
The sale of this business prompted the Company to perform a review of other long-lived assets within the structural composites product line, as the sale of the related intangible assets resulted in a limitation of the Company’s capacity to sell certain other goods produced by the product line. This review resulted in the identification of construction in progress assets with a net book value of $365, which the Company fully wrote down. This charge was recorded within the consolidated statement of operations as write-down of certain assets under construction during the first quarter of fiscal 2016.
80
CHASE CORPORATION
NOTES TO CONSOLIDATED FINANCIAL STATEMENTS
In thousands, except share and per share amounts
Note 19—Sale of Real Estate
Sale of Paterson, NJ Location
In November 2016, the Company finalized the sale of its Paterson, NJ property for cash proceeds in the amount of $1,382. This transaction resulted in a gain of $792, which was recorded in the Company’s consolidated statement of operations as a gain on sale of real estate during the fiscal quarter ended November 30, 2016.
During the second quarter of fiscal 2016, as part of its ongoing facility consolidation and rationalization initiative, the Company committed to a plan to actively market the Paterson, NJ property for sale. At that time, Chase owned the building and leased the land from the landowner. Prior to the sale in fiscal 2017, the building was being leased to a tenant and the land was being sub-leased. Upon commitment to a plan to sell the property, the Company reclassified the net book value of the related assets to assets held for sale. The assets held for sale had been reported within Corporate and Common assets as of August 31, 2016.
Sale of Former Corporate Headquarters in Bridgewater, MA
In October 2016, Chase entered into an agreement to sell its former corporate headquarters and executive offices in Bridgewater, MA. In December 2016, during the second fiscal quarter of 2017, the sale was finalized for gross cash proceeds in the amount of $740, resulting in a gain on sale of $68. See Note 23 to the Consolidated Financial Statements for additional information on the sale of the Bridgewater, MA location.
Note 20—Exit Costs Related to Idle Facility
In fiscal 2017 and 2016, the Company recognized $70 and $935, respectively, in expenses to raze its Randolph, MA facility, which has been idle regarding production for several years. The Company began marketing the site for sale and reclassified the net book value of the facility to assets held for sale during the second quarter of fiscal 2016. These actions were taken as part of the Company’s on-going facility consolidation and rationalization initiative. The Company substantially completed the demolition of the structure in the fourth fiscal quarter of 2016, and completed other environmental aspects of the project during fiscal 2017. The sale of the property is anticipated to follow in a subsequent period, and any future expenses related to the project are not anticipated to be material. See Note 21 to the Consolidated Financial Statements for additional information on assets held for sale.
81
CHASE CORPORATION
NOTES TO CONSOLIDATED FINANCIAL STATEMENTS
In thousands, except share and per share amounts
Note 21—Assets Held for Sale
The Company periodically reviews long-lived assets against its plans to retain or ultimately dispose of these assets. If the Company decides to dispose of an asset and commits to a plan to actively market and sell the asset, it will be moved to assets held for sale. The Company analyzes market conditions each reporting period and records additional impairments due to declines in market values of like assets. The fair value of the asset is determined by observable inputs such as appraisals and prices of comparable assets in active markets for assets like the Company's. Gains are not recognized until the assets are sold.
Net book value of assets held for sale as of August 31, 2017 and 2016 were:
|
|
August 31, 2017 |
|
August 31, 2016 |
|
||
|
Randolph, MA - Property (1) |
$ |
14 |
|
$ |
14 |
|
|
Paterson, NJ - Building and leasehold improvements (2) |
|
— |
|
|
590 |
|
|
Total |
$ |
14 |
|
$ |
604 |
|
|
(1) |
See Note 20 to the Consolidated Financial Statements for additional information on Randolph, MA location assets held for sale as of August 31, 2017 and 2016 |
|
(2) |
See Note 19 to the Consolidated Financial Statements for additional information on Paterson, NJ location assets held for sale as of August 31, 2016 |
Note 22—Commitments and Contingencies
The Company is involved from time to time in litigation incidental to the conduct of its business. Although the Company does not expect that the outcome in any of these matters, individually or collectively, will have a material adverse effect on its financial condition, results of operations or cash flows, litigation is inherently unpredictable. Therefore, judgments could be rendered or settlements agreed to that could adversely affect the Company’s operating results or cash flows in a particular period. The Company routinely assesses all its litigation and threatened litigation as to the probability of ultimately incurring a liability, and records its best estimate of the ultimate loss in situations where we assess the likelihood of loss as probable.
Note 23—Related Party Agreements
Reimbursements Related to Life Insurance Policies
The Edward L. Chase Trust (the “Trust”), owners of two insurance policies on the life of Claire E. Chase, reimbursed the Company for premiums paid on the policies in exchange for the Company’s release of any claims on them. In August 2016 (fiscal 2016), the Company received $1,238 related to the John Hancock (formerly Manufacturers’ Life Insurance Company) policy, the full value of premiums paid to date by the Company. In September 2016 (fiscal 2017), the Company received $1,504 related to the Metropolitan Life Insurance policy, its then cash surrender value, plus an additional prepaid related to the policy. Claire E. Chase is the spouse of a former executive of the Company, Edward L. Chase (deceased), and who in each case are the parents of Peter R. Chase (the Executive Chairman of the Company) and Mary Claire Chase (Director) and the grandparents of Adam P. Chase (the President and CEO of the Company). The Trust is the beneficial owner of more than 5% of the Company’s common stock. Terms and conditions of these transactions were reviewed and approved by the independent members of the Company's Board of Directors in advance. Please see Note 5 to the Company’s Consolidated Financial Statements for additional information on the cash surrender value of life insurance policies held by the Company at August 31, 2017 and 2016.
82
CHASE CORPORATION
NOTES TO CONSOLIDATED FINANCIAL STATEMENTS
In thousands, except share and per share amounts
Settlement of a Life Annuity
During the fourth quarter of fiscal 2016, the Company recognized a gain of $877 to selling, general and administrative expenses related to a life annuity payable to Barbara A. Chase (deceased). Upon Ms. Chase’s passing in August 2016, the Company’s payment obligation ceased, and the previously recorded liability was written down. Barbara A. Chase is the spouse of a former executive of the Company, Francis M. Chase (deceased) and who are in each case the respective aunt and uncle of Peter R. Chase and Mary Claire Chase and respective great-aunt and great-uncle of Adam P. Chase.
Sale of Former Corporate Headquarters in Bridgewater, MA
In October 2016, Chase entered an agreement to sell its former corporate headquarters and executive offices in Bridgewater, MA. In December 2016, the sale was finalized for gross proceeds of $740, resulting in a gain on sale of $68, which was recognized in the second quarter of fiscal 2017. The buyer, Bridgewater State University Foundation, Inc., was deemed a related party because of previously existing professional connections between it and two members of the Company’s Board of Directors, including Peter R. Chase and Dana Mohler-Faria (Director). The terms and conditions of the proposed transaction were reviewed and approved by all members of the Company's Board of Directors who were not parties related to the potential buyer, prior to entering the October 2016 agreement. They concluded that the sale price was appropriate, after considering a recent market appraisal of the land and building performed by an independent third-party valuation firm.
NEPTCO JV LLC Noncontrolling Membership Interest
As part of the Company’s purchase of NEPTCO in June 2012, it also acquired NEPTCO’s 50% ownership stake in its financially controlled joint venture, NEPTCO JV LLC (“JV”). The JV was originally formed by NEPTCO and a joint venture partner, Owens Corning, in 2003, whereby each member’s fiber optic strength elements businesses were combined. Prior to the Company’s October 31, 2014 purchase of the outstanding 50% noncontrolling membership interest from its joint venture partner, this venture, was managed and operated on a day‑to‑day basis by the Company. While operating under the joint ownership of the members, the JV had agreed to purchase a minimum of 80% of its total glass fiber requirements from Owens Corning. Additionally, the JV had agreed to purchase private‑label products exclusively from an affiliate of the joint venture partner; however, the JV was not subject to a minimum purchase requirement on private‑label products. These purchase agreements were terminated on October 31, 2014. Purchases from the joint venture partner totaled $332 for the period from September 1, 2014 through October 31, 2014. Please see Notes 14 and 15 to the Company’s Consolidated Financial Statements for additional information on the JV.
83
CHASE CORPORATION
NOTES TO CONSOLIDATED FINANCIAL STATEMENTS
In thousands, except share and per share amounts
Note 24—Selected Quarterly Financial Data (Unaudited)
The following table presents unaudited operating results for each of the Company’s quarters in the years ended August 31, 2017 and 2016:
|
|
|
Fiscal Year 2017 Quarters |
|
|||||||||||||
|
|
|
First |
|
Second |
|
Third |
|
Fourth |
|
Year |
|
|||||
|
Net Sales |
|
$ |
60,269 |
|
$ |
56,288 |
|
$ |
63,641 |
|
$ |
67,679 |
|
$ |
247,877 |
|
|
Gross Profit on Sales |
|
|
24,980 |
|
|
23,430 |
|
|
26,130 |
|
|
27,301 |
|
|
101,841 |
|
|
Net income attributable to Chase Corporation |
|
$ |
10,363 |
|
$ |
8,383 |
|
$ |
11,855 |
|
$ |
11,413 |
|
$ |
42,014 |
|
|
Net income available to common shareholders, per common and common equivalent share: |
|
|
|
|
|
|
|
|
|
|
|
|
|
|
|
|
|
Basic |
|
$ |
1.11 |
|
$ |
0.90 |
|
$ |
1.27 |
|
$ |
1.22 |
|
$ |
4.49 |
|
|
Diluted |
|
$ |
1.10 |
|
$ |
0.89 |
|
$ |
1.26 |
|
$ |
1.21 |
|
$ |
4.44 |
|
|
|
|
Fiscal Year 2016 Quarters |
|
|||||||||||||
|
|
|
First |
|
Second |
|
Third |
|
Fourth |
|
Year |
|
|||||
|
Net Sales |
|
$ |
56,746 |
|
$ |
53,706 |
|
$ |
63,480 |
|
$ |
60,518 |
|
$ |
234,450 |
|
|
Gross Profit on Sales |
|
|
22,029 |
|
|
18,811 |
|
|
24,938 |
|
|
24,234 |
|
|
90,012 |
|
|
Net income attributable to Chase Corporation |
|
$ |
7,449 |
|
$ |
6,972 |
|
$ |
7,531 |
|
$ |
10,855 |
|
$ |
32,807 |
|
|
Net income available to common shareholders, per common and common equivalent share: |
|
|
|
|
|
|
|
|
|
|
|
|
|
|
|
|
|
Basic |
|
$ |
0.81 |
|
$ |
0.75 |
|
$ |
0.81 |
|
$ |
1.17 |
|
$ |
3.55 |
|
|
Diluted |
|
$ |
0.80 |
|
$ |
0.74 |
|
$ |
0.80 |
|
$ |
1.16 |
|
$ |
3.50 |
|
Note: Quarterly earnings per share amounts may not sum to earnings per share for the year due to rounding.
Note 25—Valuation and Qualifying Accounts
The following table sets forth activity in the Company’s accounts receivable reserve:
|
Year ended |
|
Balance at |
|
Charges to |
|
Deductions to |
|
Balance at |
|
||||
|
August 31, 2017 |
|
$ |
830 |
|
$ |
197 |
|
$ |
(571) |
|
$ |
456 |
|
|
August 31, 2016 |
|
$ |
705 |
|
$ |
196 |
|
$ |
(71) |
|
$ |
830 |
|
|
August 31, 2015 |
|
$ |
670 |
|
$ |
83 |
|
$ |
(48) |
|
$ |
705 |
|
The following table sets forth activity in the Company’s warranty reserve:
|
Year ended |
|
Balance at |
|
Charges to |
|
Deductions to |
|
Balance at |
|
||||
|
August 31, 2017 |
|
$ |
— |
|
$ |
220 |
|
$ |
— |
|
$ |
220 |
|
|
August 31, 2016 |
|
$ |
230 |
|
$ |
143 |
|
$ |
(373) |
|
$ |
— |
|
|
August 31, 2015 |
|
$ |
270 |
|
$ |
44 |
|
$ |
(84) |
|
$ |
230 |
|
84
CHASE CORPORATION
NOTES TO CONSOLIDATED FINANCIAL STATEMENTS
In thousands, except share and per share amounts
Note 26—Accumulated Other Comprehensive Income
The changes in accumulated other comprehensive income (loss), net of tax, were as follows:
|
|
|
|
|
|
Change in Funded |
|
Foreign Currency |
|
|
|
|
||
|
|
|
Restricted |
|
Status of |
|
Translation |
|
|
|
|
|||
|
|
|
Investments |
|
Pension Plan |
|
Adjustment |
|
Total |
|
||||
|
Balance at August 31, 2015 |
|
$ |
47 |
|
$ |
(5,934) |
|
$ |
(2,099) |
|
$ |
(7,986) |
|
|
|
|
|
|
|
|
|
|
|
|
|
|
|
|
|
Other comprehensive gains (losses) before reclassifications |
|
|
51 |
|
|
(2,116) |
|
|
(6,098) |
|
|
(8,163) |
|
|
Reclassifications to net income of previously deferred (gains) losses |
|
|
(44) |
|
|
714 |
|
|
— |
|
|
670 |
|
|
Other comprehensive income (loss) |
|
|
7 |
|
|
(1,402) |
|
|
(6,098) |
|
|
(7,493) |
|
|
|
|
|
|
|
|
|
|
|
|
|
|
|
|
|
Balance at August 31, 2016 |
|
$ |
54 |
|
$ |
(7,336) |
|
$ |
(8,197) |
|
$ |
(15,479) |
|
|
Other comprehensive gains (losses) before reclassifications |
|
|
155 |
|
|
221 |
|
|
788 |
|
|
1,164 |
|
|
Reclassifications to net income of previously deferred (gains) losses |
|
|
(88) |
|
|
934 |
|
|
— |
|
|
846 |
|
|
Other comprehensive income (loss) |
|
|
67 |
|
|
1,155 |
|
|
788 |
|
|
2,010 |
|
|
|
|
|
|
|
|
|
|
|
|
|
|
|
|
|
Balance at August 31, 2017 |
|
$ |
121 |
|
$ |
(6,181) |
|
$ |
(7,409) |
|
$ |
(13,469) |
|
The following table summarizes the reclassifications from accumulated other comprehensive income (loss) to the consolidated statements of income:
|
|
|
Amount of Gain (Loss) Reclassified from |
|
|
|
|
|
||||
|
|
|
Accumulated Other Comprehensive Income |
|
|
|
|
|
||||
|
|
|
(Loss) into Income |
|
|
|
|
|
||||
|
|
|
Year Ended |
|
Year Ended |
|
|
|
Location of Gain (Loss) Reclassified from Accumulated |
|
||
|
|
|
August 31, 2017 |
|
August 31, 2016 |
|
|
|
Other Comprehensive Income (Loss) into Income |
|
||
|
Gains on Restricted Investments: |
|
|
|
|
|
|
|
|
|
|
|
|
Realized gain on sale of restricted investments |
|
$ |
(127) |
|
$ |
(67) |
|
|
|
Selling, general and administrative expenses |
|
|
Tax expense (benefit) |
|
|
39 |
|
|
23 |
|
|
|
|
|
|
Gain net of tax |
|
$ |
(88) |
|
$ |
(44) |
|
|
|
|
|
|
|
|
|
|
|
|
|
|
|
|
|
|
|
Loss on Funded Pension Plan adjustments: |
|
|
|
|
|
|
|
|
|
|
|
|
Change in funded status of pension plans |
|
$ |
98 |
|
$ |
106 |
|
|
|
Cost of products and services sold |
|
|
Change in funded status of pension plans |
|
$ |
1,255 |
|
$ |
991 |
|
|
|
Selling, general and administrative expenses |
|
|
Tax expense (benefit) |
|
|
(419) |
|
|
(383) |
|
|
|
|
|
|
Loss net of tax |
|
$ |
934 |
|
$ |
714 |
|
|
|
|
|
|
|
|
|
|
|
|
|
|
|
|
|
|
|
Total net loss reclassified for the period |
|
$ |
846 |
|
$ |
670 |
|
|
|
|
|
85
Item 9 - Changes in and Disagreements with Accountants on Accounting and Financial Disclosure
None.
Item 9a – Controls and Procedures
Disclosure Controls and Procedures
The Company maintains disclosure controls and procedures that are designed to ensure that information required to be disclosed in the Company’s reports under the Securities Exchange Act of 1934, as amended, is recorded, processed, summarized and reported within the time periods specified in the Commission’s rules and forms and that such information is accumulated and communicated to the Company’s management, including its Chief Executive Officer and Chief Financial Officer, as appropriate, to allow for timely decisions regarding required disclosure. In designing and evaluating the disclosure controls and procedures, management recognizes that any controls and procedures, no matter how well designed and operated, can provide only reasonable assurance of achieving the desired control objectives, and management is required to apply its judgment in evaluating the cost-benefit relationship of possible controls and procedures.
The Company carries out a variety of ongoing procedures, under the supervision and with the participation of the Company’s management, including the Company’s Chief Executive Officer and Chief Financial Officer, to evaluate the effectiveness of the design and operation of the Company’s disclosure controls and procedures. Based on the foregoing, the Company’s Chief Executive Officer and Chief Financial Officer concluded that the Company’s disclosure controls and procedures were effective at a reasonable assurance level as of the end of the period covered by this report.
Management’s report on internal control over financial reporting
Our management is responsible for establishing and maintaining adequate internal control over financial reporting. Internal control over financial reporting is defined in Rules 13a-15(f) and 15d-15(f) promulgated under the Exchange Act as a process designed by, or under the supervision of, our principal executive and principal financial officers, or persons performing similar functions, and effected by our Board of Directors, management and other personnel, to provide reasonable assurance regarding the reliability of financial reporting and the preparation of financial statements for external purposes in accordance with U.S. GAAP.
Because of its inherent limitations, internal control over financial reporting may not prevent or detect misstatements. Also, projections of any evaluation of effectiveness to future periods are subject to the risk that controls may become inadequate because of changes in conditions, or that the degree of compliance with the policies or procedures may deteriorate.
Under the supervision and with the participation of management, including the Chief Executive Officer and Chief Financial Officer, the Company conducted an evaluation of the effectiveness of the Company’s internal control over financial reporting based on the framework in “Internal Control — Integrated Framework (2013)” issued by the Committee of Sponsoring Organizations of the Treadway Commission (COSO). Based on this assessment, management has concluded that the internal control over financial reporting was effective as of August 31, 2017.
PricewaterhouseCoopers LLP, an independent registered public accounting firm, audited the effectiveness of our internal control over financial reporting as of August 31, 2017, and has issued an unqualified opinion thereon as stated in their report, which appears under Item 8
Changes in Internal Control Over Financial Reporting
During the quarter ended August 31, 2017, the Company completed the process of implementing its worldwide ERP computer system, and other applicable shared services, on operations associated with the Resin Designs, LLC assets acquired in September 2016.
Not applicable.
86
Item 10 – Directors, Executive Officers and Corporate Governance
The information required by Item 10 of Form 10-K, relating to Directors of the Company, compliance with the reporting obligations under Section 16(a) of the Exchange Act, the Company’s code of ethics applicable to senior management, procedures for shareholder nominations to the Company’s Board of Directors, and the Company’s Audit Committee is incorporated by reference from the information contained in the Definitive Proxy Statement for the Annual Meeting of Stockholders, which is expected to be filed within 120 days after the Company’s fiscal year ended August 31, 2017. Information regarding the Company’s executive officers found in the section captioned “Executive Officers of the Registrant” in Item 4A of Part I hereof is also incorporated by reference into this Item 10.
Item 11 – Executive Compensation
The information required by Item 11 of Form 10-K, relating to executive and director compensation and certain matters relating to the Company’s Compensation and Management Development Committee, is incorporated by reference from the information contained in the Definitive Proxy Statement for the Annual Meeting of Stockholders, which is expected to be filed within 120 days after the Company’s fiscal year ended August 31, 2017.
Item 12 – Security Ownership of Certain Beneficial Owners and Management and Related Stockholder Matters
The information required by Item 12 of Form 10-K, relating to the stock ownership of certain beneficial owners and management, is incorporated by reference from the information contained in the Definitive Proxy Statement for the Annual Meeting of Stockholders, which is expected to be filed within 120 days after the Company’s fiscal year ended August 31, 2017.
The following table summarizes the Company’s equity compensation plans as of August 31, 2017. Further details on the Company’s equity compensation plans are discussed in the notes to the Consolidated Financial Statements. The adoption of each of the Company’s equity compensation plans was approved by its shareholders.
|
|
|
Number of shares of |
|
Weighted |
|
|
|
|
|
|
|
Chase common |
|
average exercise |
|
Number of shares of |
|
|
|
|
|
stock to be issued |
|
price of |
|
Chase common stock |
|
|
|
|
|
upon the exercise of |
|
outstanding |
|
remaining available for |
|
|
|
|
|
outstanding options |
|
options |
|
future issuance |
|
|
|
|
|
|
|
|
|
|
|
|
|
2005 Incentive Plan |
|
102,528 |
|
$ |
22.25 |
|
— |
|
|
2013 Equity Incentive Plan |
|
50,446 |
|
|
58.53 |
|
1,078,015 |
|
|
Total |
|
152,974 |
|
$ |
34.21 |
|
1,078,015 |
|
Item 13 – Certain Relationships and Related Transactions, and director independence
The information required by Item 13 of Form 10-K, relating to transactions with related persons and the independence of members of the Company’s Board of Directors, is incorporated by reference from the information contained in the Definitive Proxy Statement for the Annual Meeting of Stockholders, which is expected to be filed within 120 days after the Company’s fiscal year ended August 31, 2017.
Item 14 – Principal Accountant Fees and Services
The information required by Item 14 of Form 10-K, relating to fees paid to the Company’s independent registered public accounting firm and pre-approval policies of the Company’s Audit Committee, is incorporated by reference from the information contained in the Definitive Proxy Statement for the Annual Meeting of Stockholders, which is expected to be filed within 120 days after the Company’s fiscal year ended August 31, 2017.
87
Item 15 – Exhibits and Financial Statement Schedules
(a)(1) and (2)Financial Statements and Schedules:
The financial statements are set forth under Item 8 of this Annual Report on Form 10-K. Financial statement schedules have been omitted since they are either not required, not applicable, or the information is otherwise included.
(a)(3)Exhibit Index:
|
Exhibit |
|
|
||
|
Number |
|
Description |
||
|
|
|
|
||
|
3.1.1 |
|
|||
|
|
|
|
||
|
3.1.2 |
|
|||
|
|
|
|
||
|
3.2 |
|
|||
|
10.1 |
|
|||
|
|
|
|
||
|
10.2 |
|
|||
|
|
|
|
||
|
10.3 |
|
|||
|
|
|
|
||
|
10.4 |
|
|||
|
|
|
|
||
|
10.5.1 |
|
|||
|
|
|
|
||
|
10.5.2 |
|
|||
|
10.5.3 |
|
|||
|
|
|
|
||
|
10.6.1 |
|
|||
|
|
|
|
||
88
|
10.6.2 |
|
|||
|
|
|
|
||
|
10.7.1 |
|
|||
|
|
|
|
||
|
10.7.2 |
|
|||
|
|
|
|
||
|
10.7.3 |
|
|||
|
|
|
|
||
|
10.7.4 |
|
|||
|
|
|
|
||
|
10.7.5 |
|
|||
|
|
|
|
||
|
10.7.6 |
|
|||
|
|
|
|
||
|
10.7.7 |
|
|||
|
10.9.1 |
|
|||
|
|
|
|
||
|
10.9.2 |
|
|||
|
|
|
|
||
|
10.10.1 |
|
|||
|
|
|
|
||
|
10.10.2 |
|
|||
|
|
|
|
||
|
10.10.3 |
|
|||
|
|
|
|
||
|
10.10.4 |
||||
|
|
|
|
||
|
10.10.5 |
|
|||
|
|
|
|
||
|
10.10.6 |
|
|||
|
|
|
|
||
89
|
10.10.7 |
||||
|
|
|
|
||
|
10.10.8 |
||||
|
|
|
|
||
|
10.11.1 |
|
|||
|
|
|
|
||
|
10.11.2 |
|
|||
|
|
|
|
||
|
10.12.1 |
|
|||
|
|
|
|
||
|
10.12.2 |
|
|||
|
|
|
|
||
|
10.13 |
|
|||
|
|
|
|
||
|
10.14 |
|
|||
|
|
|
|
||
|
21 |
|
|||
|
|
|
|
||
|
23.1 |
|
Consent of Independent Registered Public Accounting Firm – PricewaterhouseCoopers LLP |
||
|
|
|
|
||
|
31.1 |
|
|||
|
|
|
|
||
|
31.2 |
|
|||
|
|
|
|
||
|
32.1 |
|
|||
|
|
|
|
||
|
32.2 |
|
|||
|
|
|
|
||
|
101.INS |
|
XBRL Instance Document |
||
|
|
|
|
||
90
|
101.SCH |
|
XBRL Taxonomy Extension Schema Document |
||
|
|
|
|
||
|
101.CAL |
|
XBRL Taxonomy Extension Calculation Linkbase Document |
||
|
|
|
|
||
|
101.LAB |
|
XBRL Taxonomy Extension Label Linkbase Document |
||
|
|
|
|
||
|
101.PRE |
|
XBRL Taxonomy Extension Presentation Linkbase Document |
||
|
|
|
|
||
|
101.DEF |
|
XBRL Taxonomy Extension Definition Linkbase Document |
||
* Identifies management plan or compensatory plan or arrangement.
(b) See (a)(3) above.
(c) None.
None.
91
Pursuant to the requirements of Section 13 or 15(d) of the Securities Exchange Act of 1934, the Registrant has duly caused this report to be signed on its behalf by the undersigned thereunto duly authorized.
|
|
Chase Corporation |
|||
|
|
|
|
||
|
|
By: |
/s/ Adam P. Chase |
||
|
|
|
Adam P. Chase |
||
|
|
|
President and Chief Executive Officer |
||
|
|
|
November 9, 2017 |
||
|
|
|
|
||
|
|
|
|
||
|
|
By: |
/s/ Kenneth J. Feroldi |
||
|
|
|
Kenneth J. Feroldi |
||
|
|
|
Treasurer and Chief Financial Officer |
||
|
|
|
November 9, 2017 |
||
Pursuant to the requirements of the Securities Exchange Act of 1934, this report has been signed below by the following persons on behalf of the registrant and in the capacities and on the dates indicated.
|
Signature |
|
Title |
|
Date |
|
|
|
|
|
|
|
/s/ Peter R. Chase |
|
Executive Chairman |
|
November 9, 2017 |
|
Peter R. Chase |
||||
|
/s/ Adam P. Chase |
|
Director, President and Chief Executive Officer (Principal executive officer) |
|
November 9, 2017 |
|
Adam P. Chase |
||||
|
|
|
|
|
|
|
/s/ Kenneth J. Feroldi |
|
Treasurer and Chief Financial Officer |
|
November 9, 2017 |
|
Kenneth J. Feroldi |
||||
|
|
|
|
|
|
|
/s/ Mary Claire Chase |
|
Director |
|
November 9, 2017 |
|
Mary Claire Chase |
||||
|
|
|
|
|
|
|
/s/ Everett Chadwick, Jr |
|
Director |
|
November 9, 2017 |
|
Everett Chadwick, Jr |
||||
|
|
|
|
|
|
|
/s/ John H. Derby III |
|
Director |
|
November 9, 2017 |
|
John H. Derby III |
||||
|
|
|
|
|
|
|
/s/ Lewis P. Gack |
|
Director |
|
November 9, 2017 |
|
Lewis P. Gack |
||||
|
|
|
|
|
|
|
/s/ George M. Hughes |
|
Director |
|
November 9, 2017 |
|
George M. Hughes |
||||
|
|
|
|
|
|
|
/s/ Chad A. McDaniel |
|
Director |
|
November 9, 2017 |
|
Chad A. McDaniel |
||||
|
|
|
|
|
|
|
/s/ Dana Mohler-Faria |
|
Director |
|
November 9, 2017 |
|
Dana Mohler-Faria |
||||
|
|
|
|
|
|
|
/s/ Thomas Wroe, Jr |
|
Director |
|
November 9, 2017 |
|
Thomas Wroe, Jr |
92