Attached files
| file | filename |
|---|---|
| 8-K - FORM 8-K - Century Communities, Inc. | d490669d8k.htm |
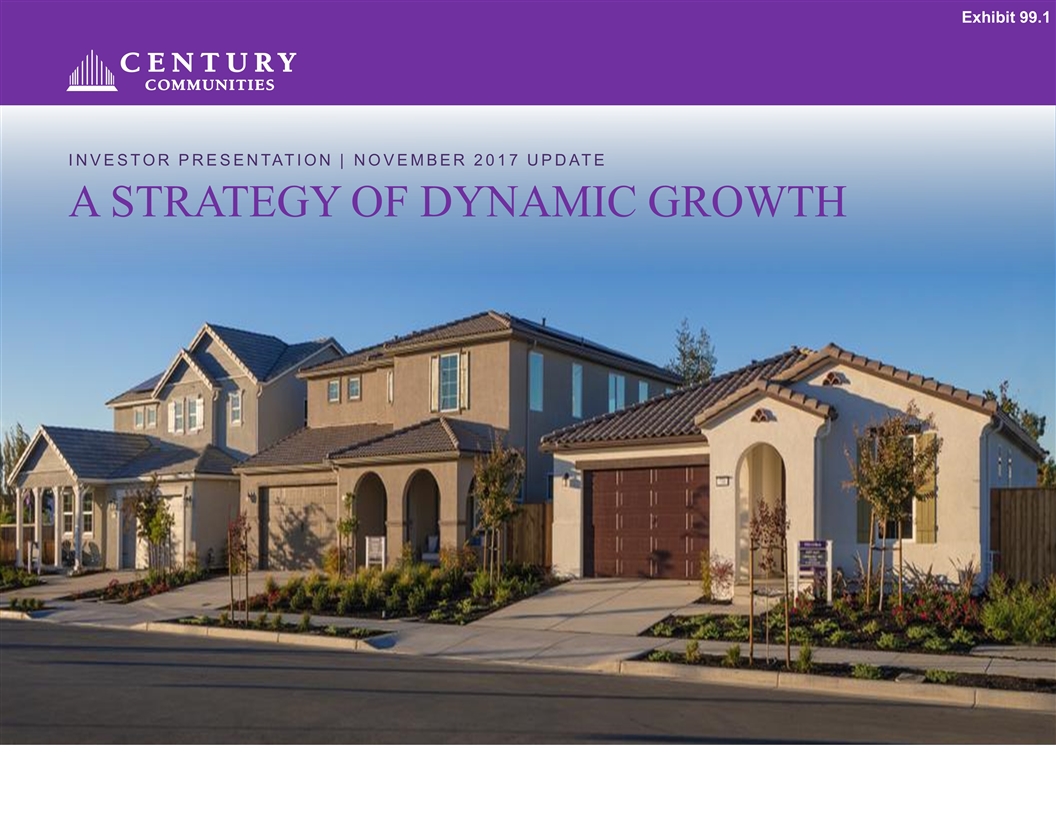
Investor Presentation | November 2017 Update A Strategy of Dynamic growth Exhibit 99.1
Certain statements in this Investor Presentation may be regarded as "forward-looking statements" within the meaning of the Private Securities Litigation Reform Act of 1995, as amended. Certain forward-looking statements discuss the Company’s plans, strategies and intentions, and may be identified by reference to a future period or periods or by the use of forward-looking terminology, such as “expects,” “may,” “will,” “believes,” “should,” “would,” “could,” “approximately,” “anticipates,” “estimates,” “targets,” “intends,” “likely,” “projects,” “positioned,” “strategy,” “future,” and “plans.” In addition, these words may use the positive or negative or other variations of those terms. All statements other than statements of historical fact are “forward–looking statements” for purposes of federal and state securities laws. There is no guarantee that any of the events anticipated by these forward-looking statements will occur. These statements involve known and unknown risks, uncertainties and other factors that may cause our actual results, levels of activity, performance or achievements to differ from those expressed or implied by the forward-looking statement. These forward-looking statements are based on various assumptions and the current expectations of the management of the Company, and may not be accurate because of risks and uncertainties surrounding these assumptions and expectations. Certain factors may cause actual results to differ significantly from these forward-looking statements. If any of the events occur, there is no guarantee what effect they will have on the operations or financial condition of the Company. Major risks, uncertainties and assumptions include, but are not limited to, risks relating to: the Company’s capital and financing needs and availability; any unforeseen changes to or effects on liabilities, future capital expenditures, revenues, expenses, earnings, synergies, indebtedness, financial condition, losses and future prospects; the Company’s ability to integrate and operate assets successfully after the closing of an acquisition; the effect of general economic conditions, including employment rates, housing starts, interest rate levels, availability of financing for home mortgages, and the strength of the U.S. dollar; and other factors. However, it is not possible to predict or identify all such factors. In addition, the Company has disclosed under the heading “Risk Factors” in its Annual Report on Form 10-K for the fiscal year ended December 31, 2016 (the “Annual Report”), filed with the U.S. Securities and Exchange Commission (the “SEC”) on February 15, 2017, the risk factors which materially affect its business, financial condition and operating results. Investors are encouraged to review the Annual Report for additional information regarding the risks and uncertainties that may cause actual results to differ materially from those expressed in any forward-looking statement. Forward-looking statements included herein are made as of the date hereof, and the Company undertakes no obligation to publicly update or revise any forward-looking statement to reflect future events, developments or otherwise, except as may be required by applicable law. Non-GAAP Financial Information This Investor Presentation includes certain non-GAAP financial measures as defined by SEC rules. Such non-GAAP financial measures are presented as a supplemental financial measurements in the evaluation of our business. We believe the presentation of these financial measures helps investors to assess our operating performance from period to period and enhances understanding of our financial performance and highlights operational trends. This measure is widely used by investors in the valuation, comparison, rating and investment recommendations of companies. However, such measurements may not be comparable to those of other companies in our industry, which limits their usefulness as a comparative measures. Such measures are not required by or calculated in accordance with GAAP and should not be considered as a substitutes for net income or any other measure of financial performance reported in accordance with GAAP or as a measure of operating cash flow or liquidity. Non-Solicitation The information in this Investor Presentation is for informational purposes only and is neither an offer to sell, nor a solicitation of an offer to subscribe for or buy any securities in any jurisdiction in contravention of applicable law. No offer of securities shall be made except by means of a prospectus meeting the requirements of Section 10 of the Securities Act of 1933, as amended, and otherwise in accordance with applicable law. Forward-Looking Statements
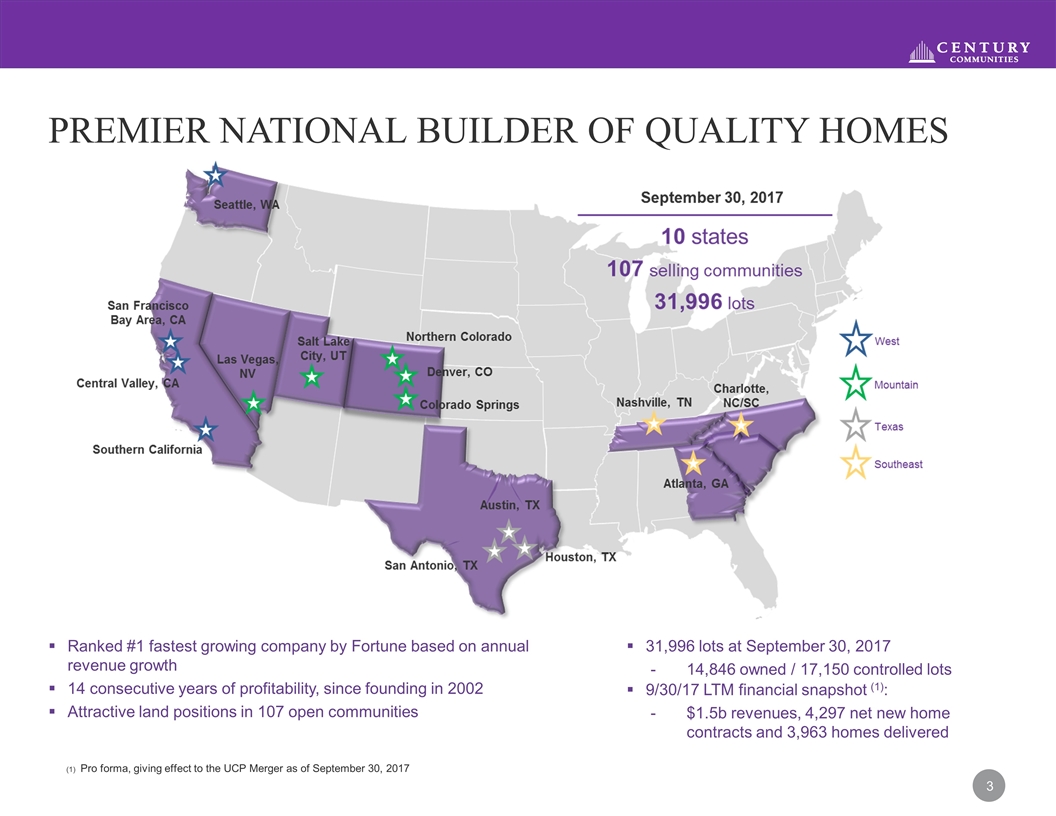
Ranked #1 fastest growing company by Fortune based on annual revenue growth 14 consecutive years of profitability, since founding in 2002 Attractive land positions in 107 open communities Pro forma, giving effect to the UCP Merger as of September 30, 2017 PREMIER NATIONAL BUILDER OF QUALITY HOMES 31,996 lots at September 30, 2017 14,846 owned / 17,150 controlled lots 9/30/17 LTM financial snapshot (1): $1.5b revenues, 4,297 net new home contracts and 3,963 homes delivered
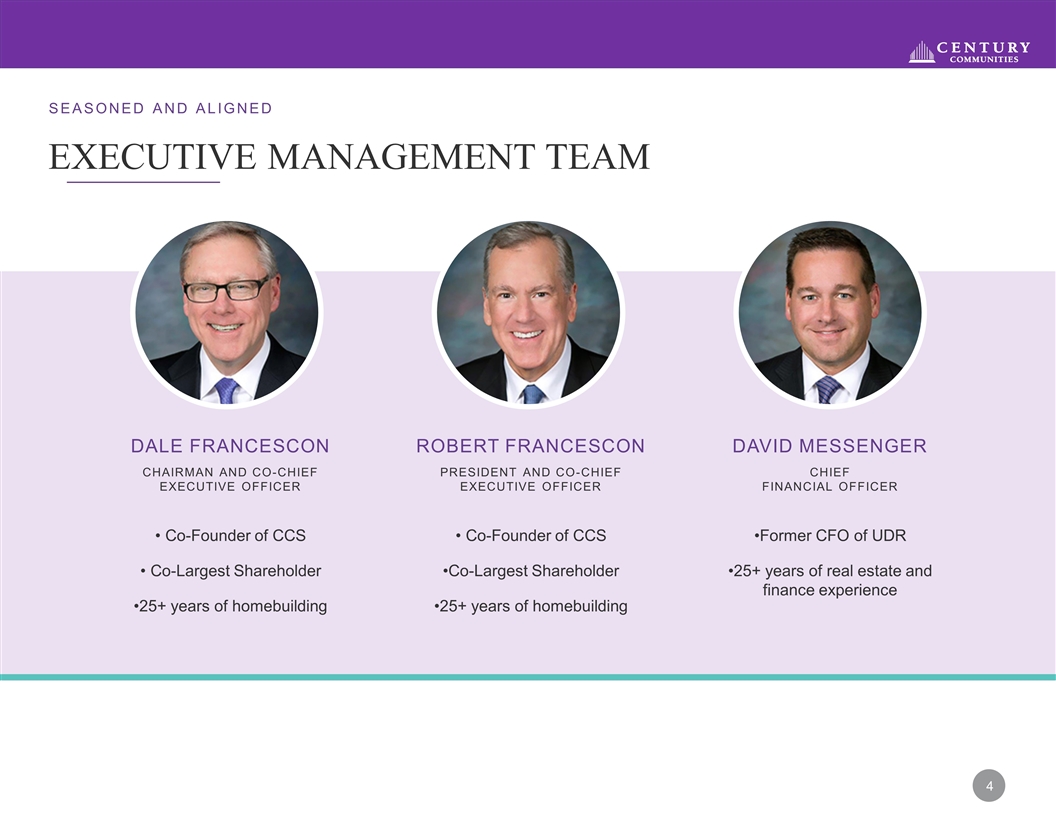
Executive Management team Seasoned and aligned DALE FRANCESCON CHAIRMAN AND CO-CHIEF EXECUTIVE OFFICER Co-Founder of CCS Co-Largest Shareholder 25+ years of homebuilding ROBERT FRANCESCON PRESIDENT AND CO-CHIEF EXECUTIVE OFFICER Co-Founder of CCS Co-Largest Shareholder 25+ years of homebuilding DAVID MESSENGER CHIEF FINANCIAL OFFICER Former CFO of UDR 25+ years of real estate and finance experience
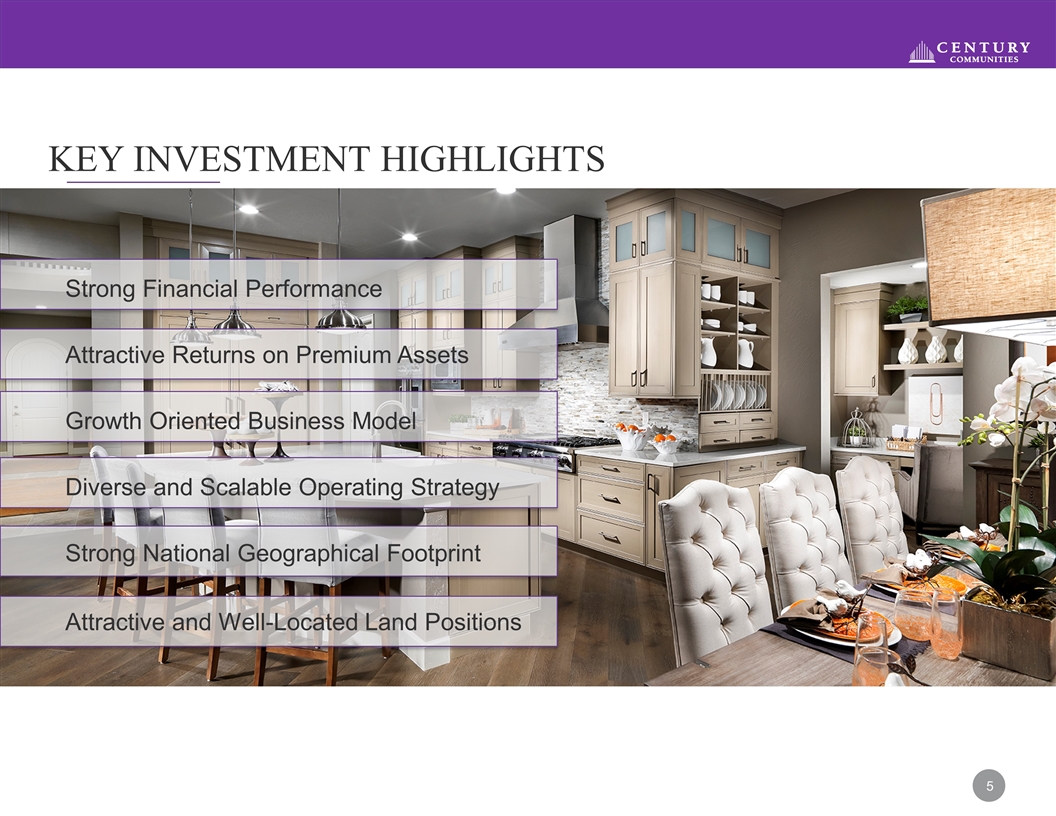
Key investment Highlights Strong Financial Performance Growth Oriented Business Model Diverse and Scalable Operating Strategy Attractive Returns on Premium Assets Strong National Geographical Footprint Attractive and Well-Located Land Positions
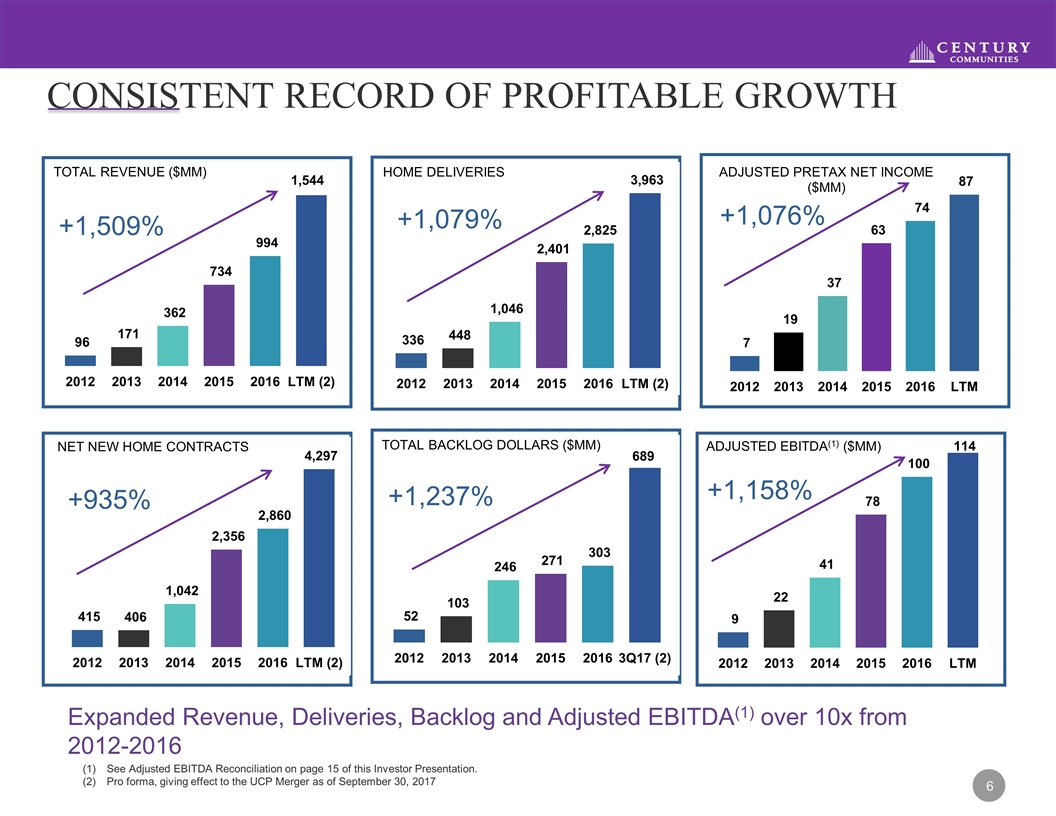
Consistent Record OF Profitable growth Expanded Revenue, Deliveries, Backlog and Adjusted EBITDA(1) over 10x from 2012-2016 See Adjusted EBITDA Reconciliation on page 15 of this Investor Presentation. Pro forma, giving effect to the UCP Merger as of September 30, 2017
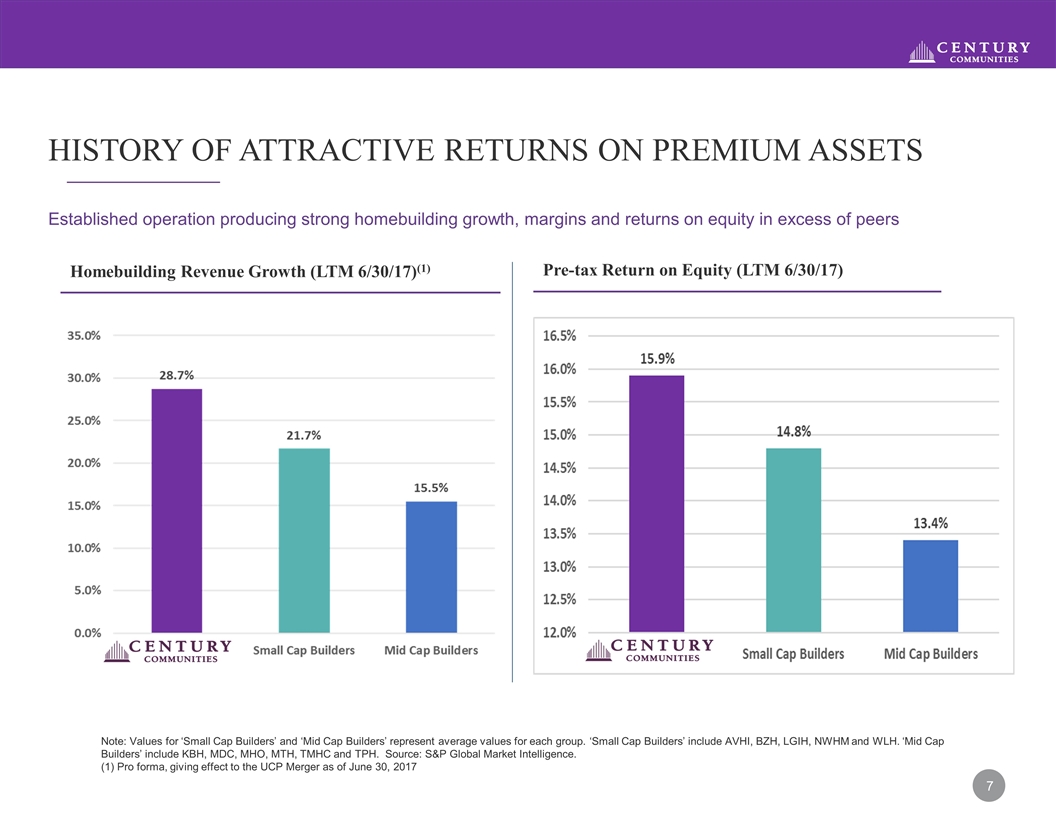
Established operation producing strong homebuilding growth, margins and returns on equity in excess of peers Note: Values for ‘Small Cap Builders’ and ‘Mid Cap Builders’ represent average values for each group. ‘Small Cap Builders’ include AVHI, BZH, LGIH, NWHM and WLH. ‘Mid Cap Builders’ include KBH, MDC, MHO, MTH, TMHC and TPH. Source: S&P Global Market Intelligence. (1) Pro forma, giving effect to the UCP Merger as of June 30, 2017 history of Attractive Returns ON PREMIUM ASSETS Homebuilding Revenue Growth (LTM 6/30/17)(1) Pre-tax Return on Equity (LTM 6/30/17)
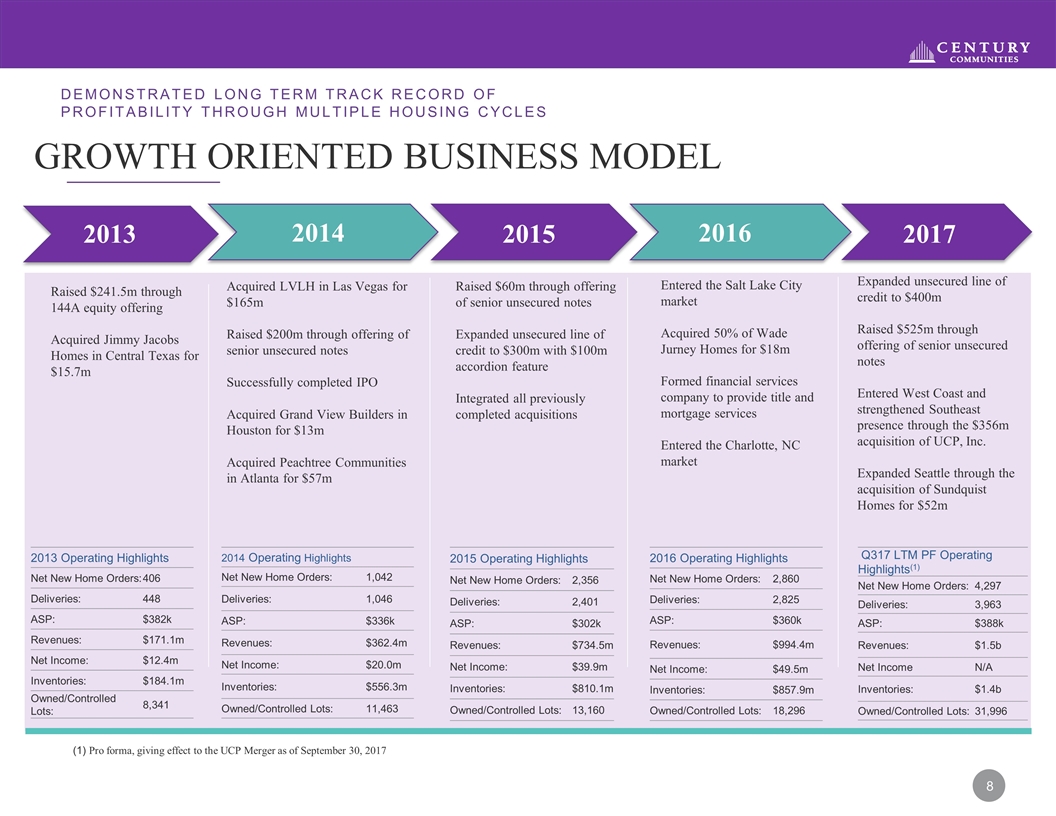
Growth oriented business model Demonstrated long term track record of profitability through multiple housing cycles 2013 Operating Highlights Net New Home Orders: 406 Deliveries: 448 ASP: $382k Revenues: $171.1m Net Income: $12.4m Inventories: $184.1m Owned/Controlled Lots: 8,341 2014 Operating Highlights Net New Home Orders: 1,042 Deliveries: 1,046 ASP: $336k Revenues: $362.4m Net Income: $20.0m Inventories: $556.3m Owned/Controlled Lots: 11,463 2015 Operating Highlights Net New Home Orders: 2,356 Deliveries: 2,401 ASP: $302k Revenues: $734.5m Net Income: $39.9m Inventories: $810.1m Owned/Controlled Lots: 13,160 2016 Operating Highlights Net New Home Orders: 2,860 Deliveries: 2,825 ASP: $360k Revenues: $994.4m Net Income: $49.5m Inventories: $857.9m Owned/Controlled Lots: 18,296 2013 2014 2015 2016 2017 Raised $241.5m through 144A equity offering Acquired Jimmy Jacobs Homes in Central Texas for $15.7m Acquired LVLH in Las Vegas for $165m Raised $200m through offering of senior unsecured notes Successfully completed IPO Acquired Grand View Builders in Houston for $13m Acquired Peachtree Communities in Atlanta for $57m Raised $60m through offering of senior unsecured notes Expanded unsecured line of credit to $300m with $100m accordion feature Integrated all previously completed acquisitions Entered the Salt Lake City market Acquired 50% of Wade Jurney Homes for $18m Formed financial services company to provide title and mortgage services Entered the Charlotte, NC market Q317 LTM PF Operating Highlights(1) Net New Home Orders: 4,297 Deliveries: 3,963 ASP: $388k Revenues: $1.5b Net Income N/A Inventories: $1.4b Owned/Controlled Lots: 31,996 Expanded unsecured line of credit to $400m Raised $525m through offering of senior unsecured notes Entered West Coast and strengthened Southeast presence through the $356m acquisition of UCP, Inc. Expanded Seattle through the acquisition of Sundquist Homes for $52m (1) Pro forma, giving effect to the UCP Merger as of September 30, 2017 2013 2017 2016 2015 2014
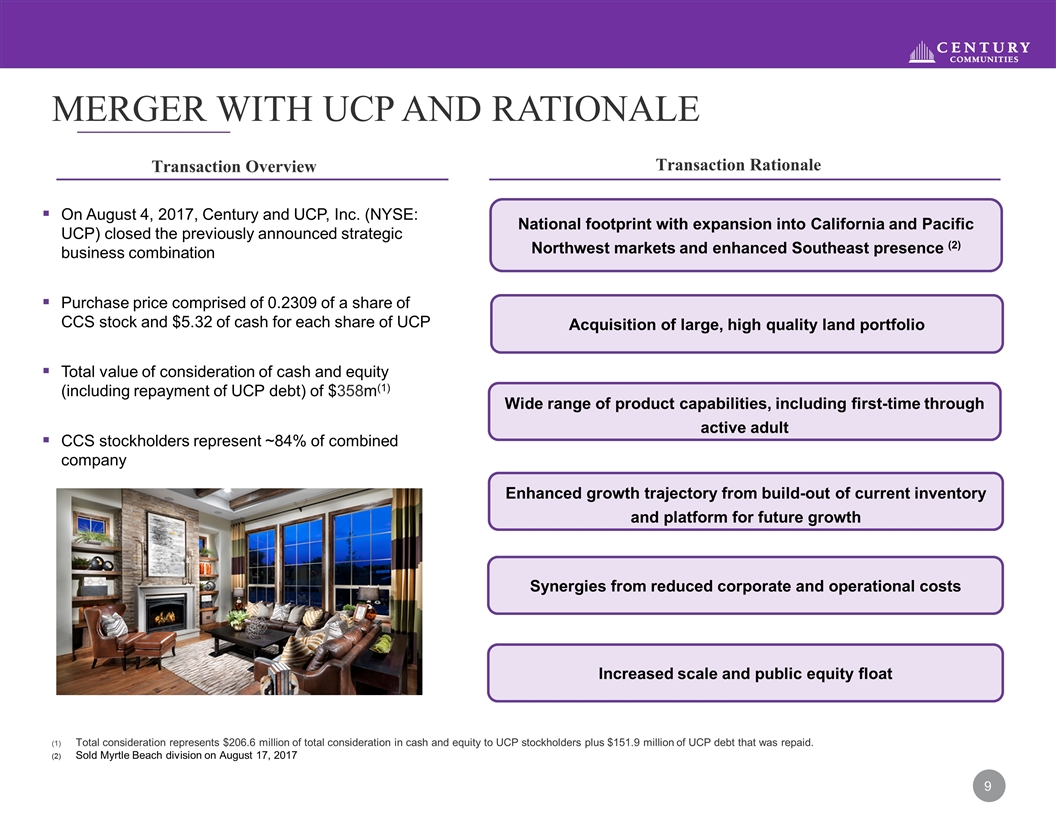
merger with ucp AND RATIONALE Transaction Overview Transaction Rationale On August 4, 2017, Century and UCP, Inc. (NYSE: UCP) closed the previously announced strategic business combination Purchase price comprised of 0.2309 of a share of CCS stock and $5.32 of cash for each share of UCP Total value of consideration of cash and equity (including repayment of UCP debt) of $358m(1) CCS stockholders represent ~84% of combined company Acquisition of large, high quality land portfolio National footprint with expansion into California and Pacific Northwest markets and enhanced Southeast presence (2) Wide range of product capabilities, including first-time through active adult Enhanced growth trajectory from build-out of current inventory and platform for future growth Synergies from reduced corporate and operational costs Increased scale and public equity float Total consideration represents $206.6 million of total consideration in cash and equity to UCP stockholders plus $151.9 million of UCP debt that was repaid. Sold Myrtle Beach division on August 17, 2017 9
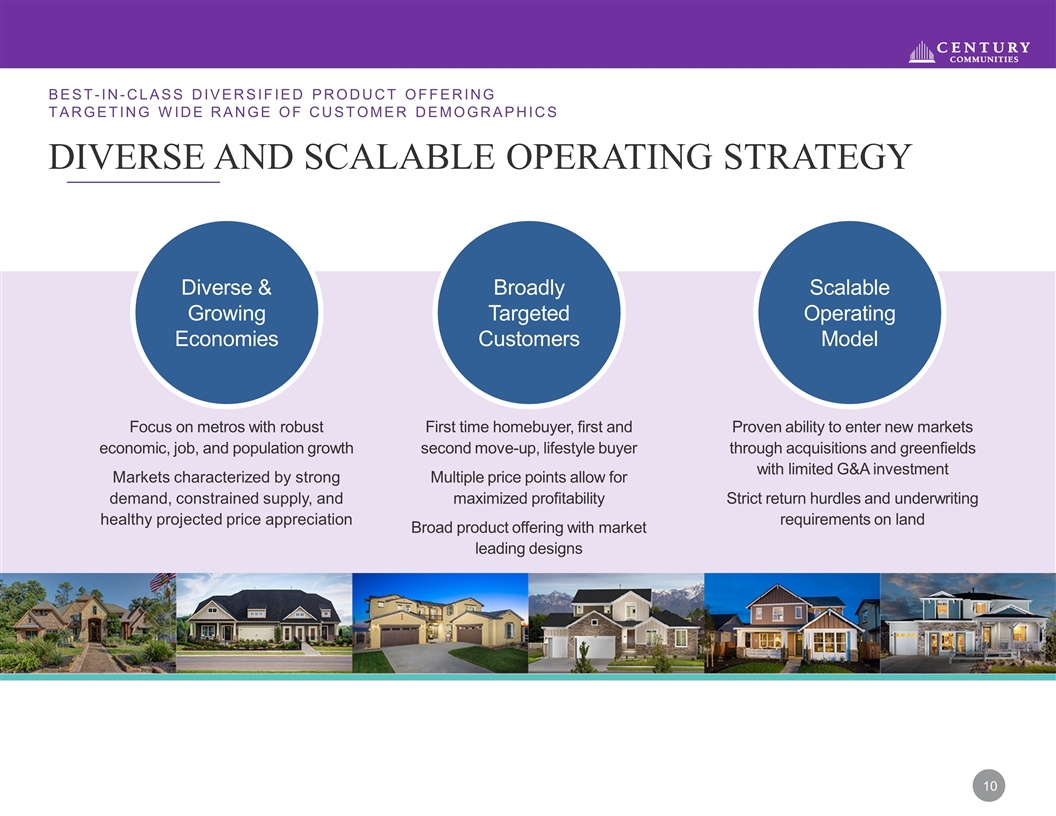
Diverse & Growing Economies Focus on metros with robust economic, job, and population growth Markets characterized by strong demand, constrained supply, and healthy projected price appreciation Broadly Targeted Customers First time homebuyer, first and second move-up, lifestyle buyer Multiple price points allow for maximized profitability Broad product offering with market leading designs Scalable Operating Model Proven ability to enter new markets through acquisitions and greenfields with limited G&A investment Strict return hurdles and underwriting requirements on land Diverse and scalable operating strategy Best-in-class diversified product offering targeting wide range of customer demographics
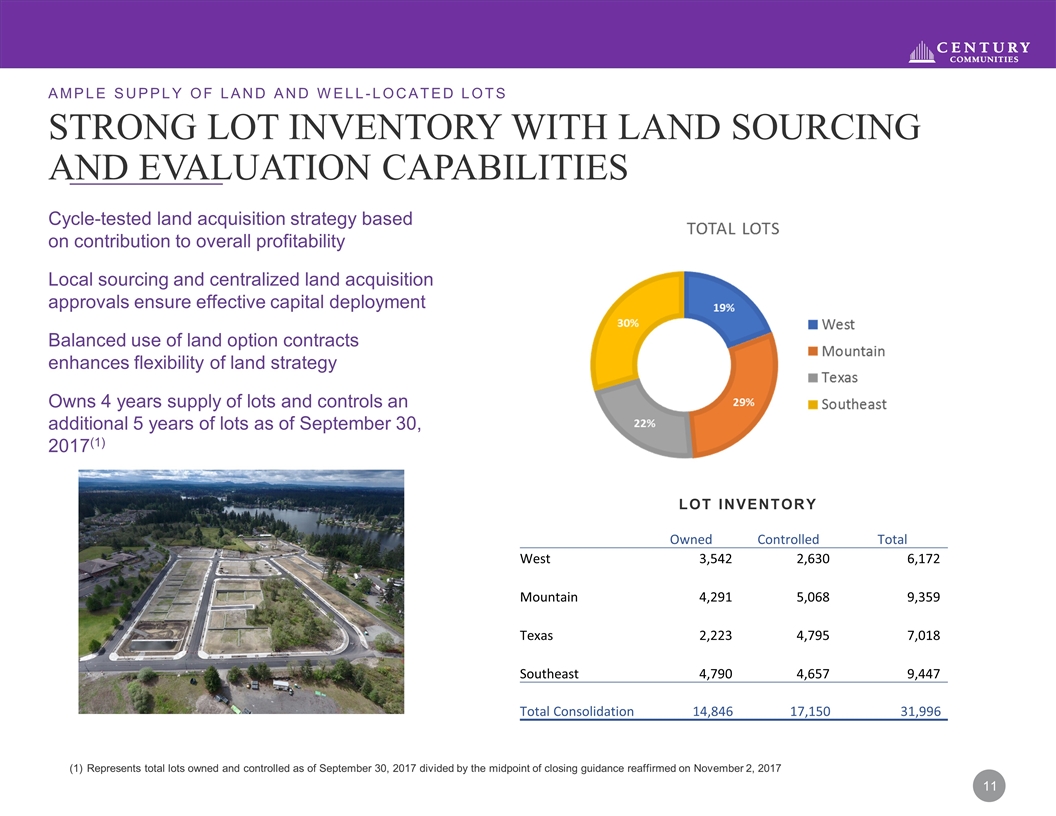
Strong Lot Inventory With Land Sourcing And Evaluation Capabilities Represents total lots owned and controlled as of September 30, 2017 divided by the midpoint of closing guidance reaffirmed on November 2, 2017 Cycle-tested land acquisition strategy based on contribution to overall profitability Local sourcing and centralized land acquisition approvals ensure effective capital deployment Balanced use of land option contracts enhances flexibility of land strategy Owns 4 years supply of lots and controls an additional 5 years of lots as of September 30, 2017(1) ample supply of land and Well-Located Lots LOT INVENTORY 23% Owned Controlled Total West 3,542 2,630 6,172 Mountain 4,291 5,068 9,359 Texas 2,223 4,795 7,018 Southeast 4,790 4,657 9,447 Total Consolidation 14,846 17,150 31,996
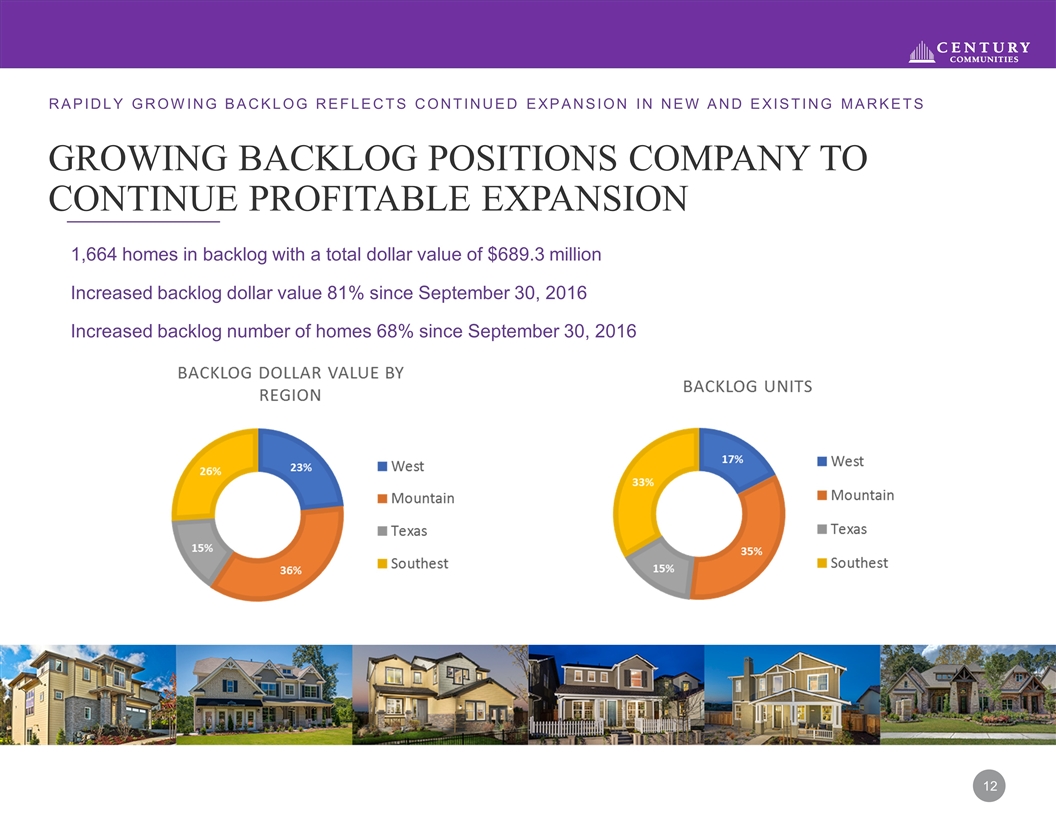
Growing Backlog Positions Company to CONTINUE profitable expansion 1,664 homes in backlog with a total dollar value of $689.3 million Increased backlog dollar value 81% since September 30, 2016 Increased backlog number of homes 68% since September 30, 2016 Rapidly growing backlog reflects continued EXPANSION in NEW AND existing markets
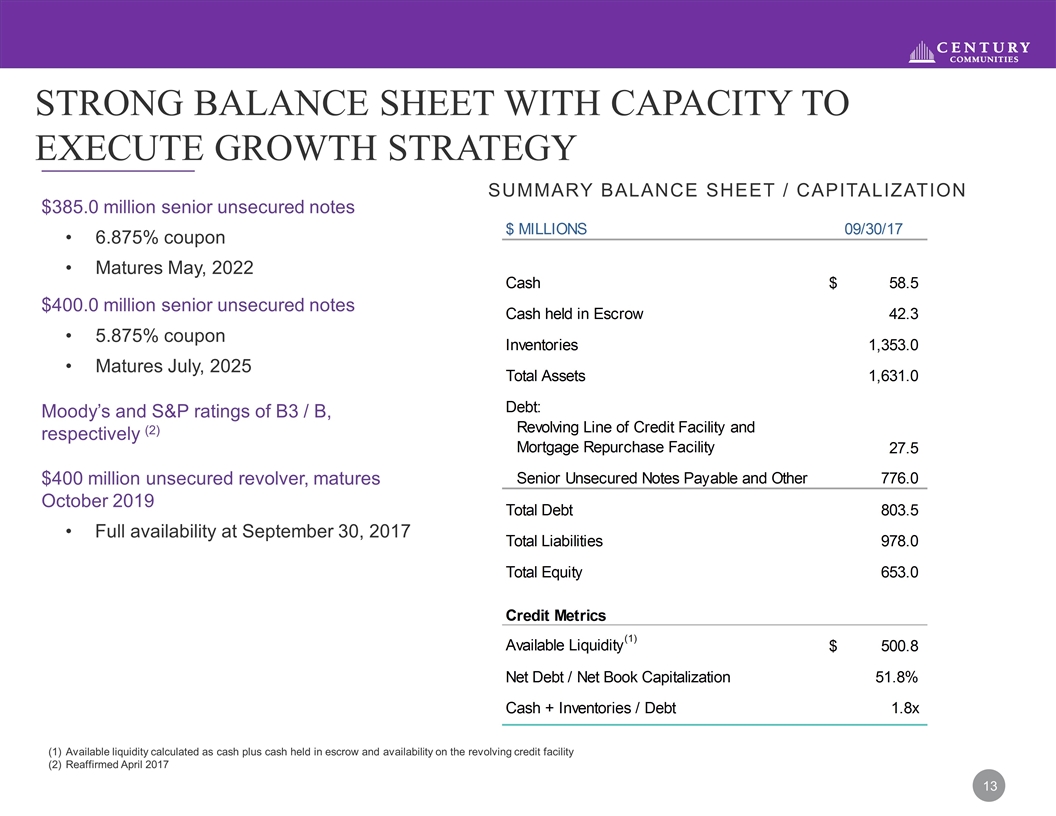
Strong balance sheet with Capacity to Execute Growth Strategy $385.0 million senior unsecured notes 6.875% coupon Matures May, 2022 $400.0 million senior unsecured notes 5.875% coupon Matures July, 2025 Moody’s and S&P ratings of B3 / B, respectively (2) $400 million unsecured revolver, matures October 2019 Full availability at September 30, 2017 Available liquidity calculated as cash plus cash held in escrow and availability on the revolving credit facility Reaffirmed April 2017 SUMMARY BALANCE SHEET / CAPITALIZATION
Historical Financial Performance
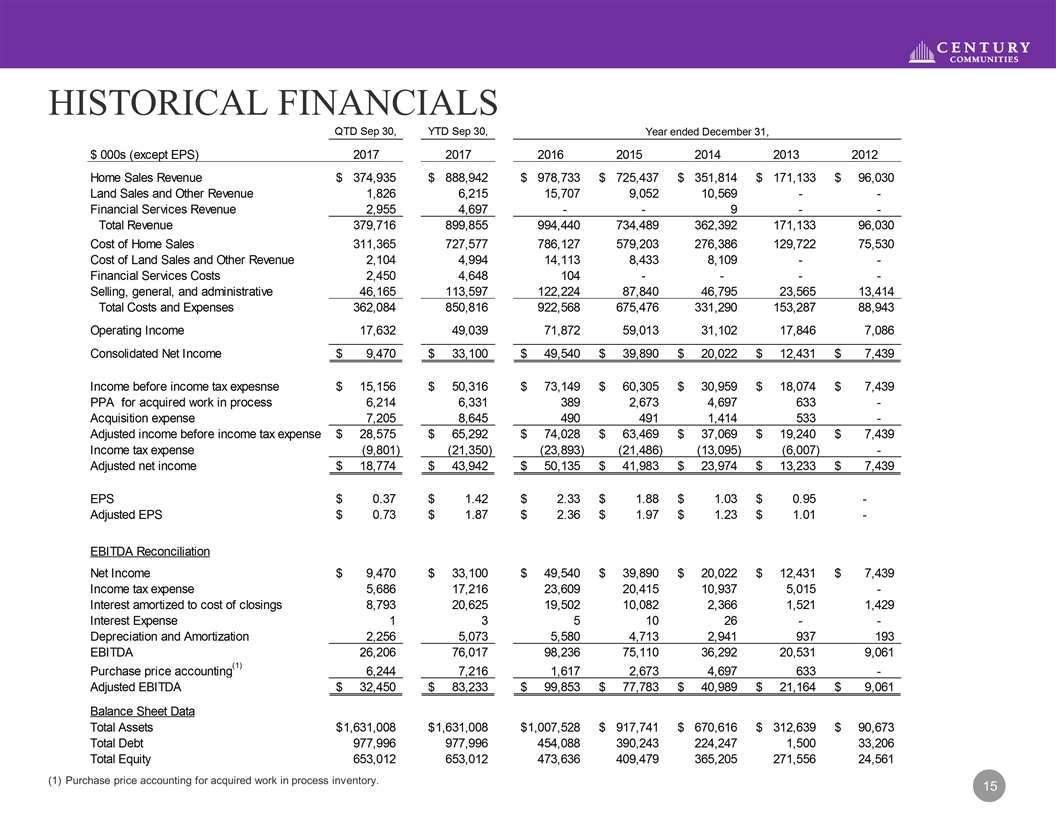
Historical Financials Purchase price accounting for acquired work in process inventory.
