Attached files
| file | filename |
|---|---|
| EX-99.1 - EX-99.1 - MYRIAD GENETICS INC | mygn-ex991_6.htm |
| 8-K - 8-K FY18Q1 EARNINGS RELEASE - MYRIAD GENETICS INC | mygn-8k_20171107.htm |

Myriad Genetics Fiscal First-Quarter 2018 Earnings Call 11/07/2017 Exhibit 99.2
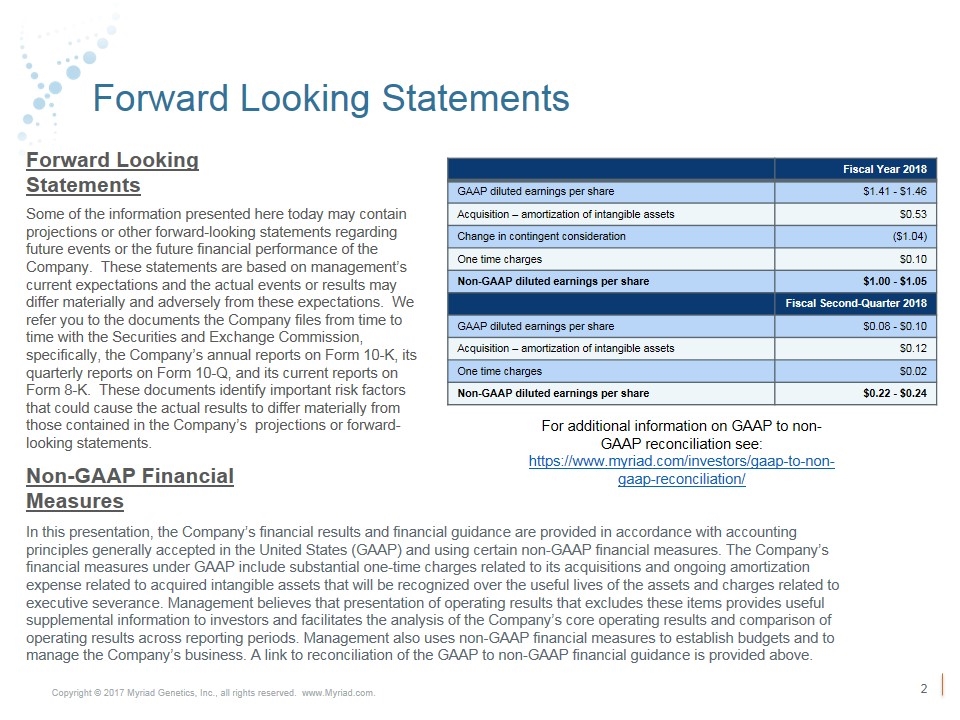
Forward Looking Statements Some of the information presented here today may contain projections or other forward-looking statements regarding future events or the future financial performance of the Company. These statements are based on management’s current expectations and the actual events or results may differ materially and adversely from these expectations. We refer you to the documents the Company files from time to time with the Securities and Exchange Commission, specifically, the Company’s annual reports on Form 10-K, its quarterly reports on Form 10-Q, and its current reports on Form 8-K. These documents identify important risk factors that could cause the actual results to differ materially from those contained in the Company’s projections or forward-looking statements. In this presentation, the Company’s financial results and financial guidance are provided in accordance with accounting principles generally accepted in the United States (GAAP) and using certain non-GAAP financial measures. The Company’s financial measures under GAAP include substantial one-time charges related to its acquisitions and ongoing amortization expense related to acquired intangible assets that will be recognized over the useful lives of the assets and charges related to executive severance. Management believes that presentation of operating results that excludes these items provides useful supplemental information to investors and facilitates the analysis of the Company’s core operating results and comparison of operating results across reporting periods. Management also uses non-GAAP financial measures to establish budgets and to manage the Company’s business. A link to reconciliation of the GAAP to non-GAAP financial guidance is provided above. Forward Looking Statements Non-GAAP Financial Measures Fiscal Year 2018 GAAP diluted earnings per share $1.41 - $1.46 Acquisition – amortization of intangible assets $0.53 Change in contingent consideration ($1.04) One time charges $0.10 Non-GAAP diluted earnings per share $1.00 - $1.05 Fiscal Second-Quarter 2018 GAAP diluted earnings per share $0.08 - $0.10 Acquisition – amortization of intangible assets $0.12 One time charges $0.02 Non-GAAP diluted earnings per share $0.22 - $0.24 For additional information on GAAP to non-GAAP reconciliation see: https://www.myriad.com/investors/gaap-to-non-gaap-reconciliation/
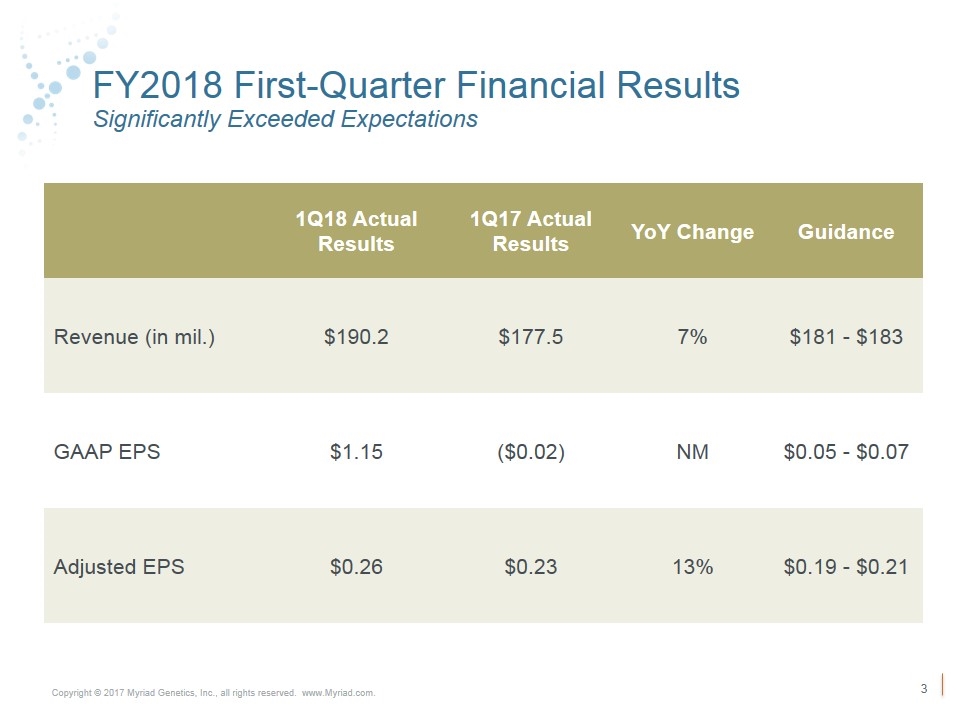
FY2018 First-Quarter Financial Results Significantly Exceeded Expectations 1Q18 Actual Results 1Q17 Actual Results YoY Change Guidance Revenue (in mil.) $190.2 $177.5 7% $181 - $183 GAAP EPS $1.15 ($0.02) NM $0.05 - $0.07 Adjusted EPS $0.26 $0.23 13% $0.19 - $0.21
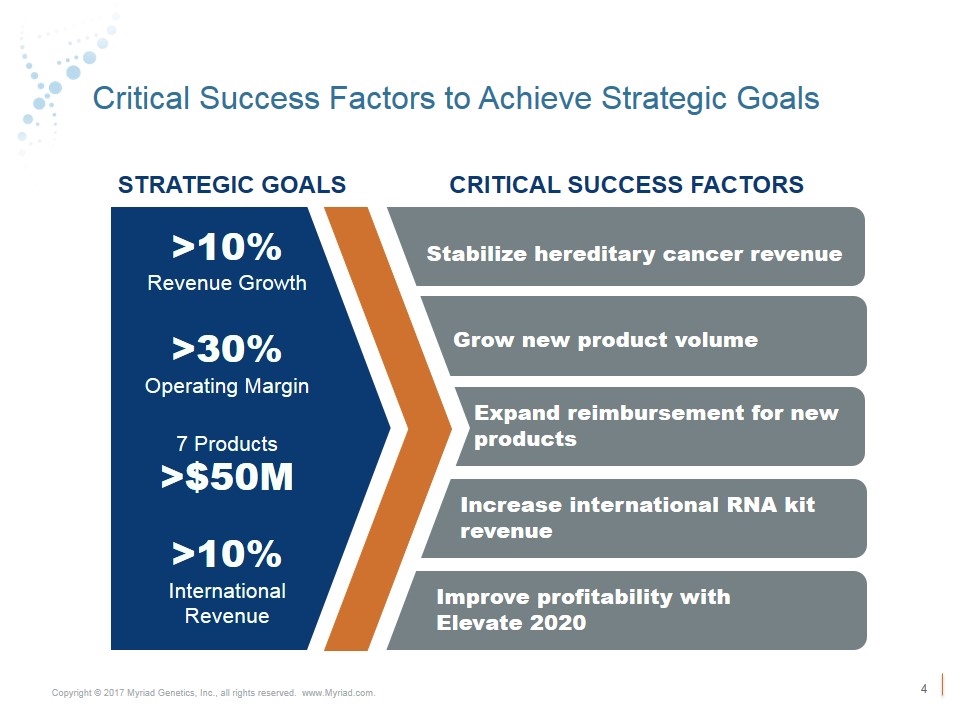
Critical Success Factors to Achieve Strategic Goals Stabilize hereditary cancer revenue Grow new product volume STRATEGIC GOALS CRITICAL SUCCESS FACTORS >10% Revenue Growth >30% Operating Margin 7 Products >$50M >10% International Revenue Expand reimbursement for new products Increase international RNA kit revenue Improve profitability with Elevate 2020
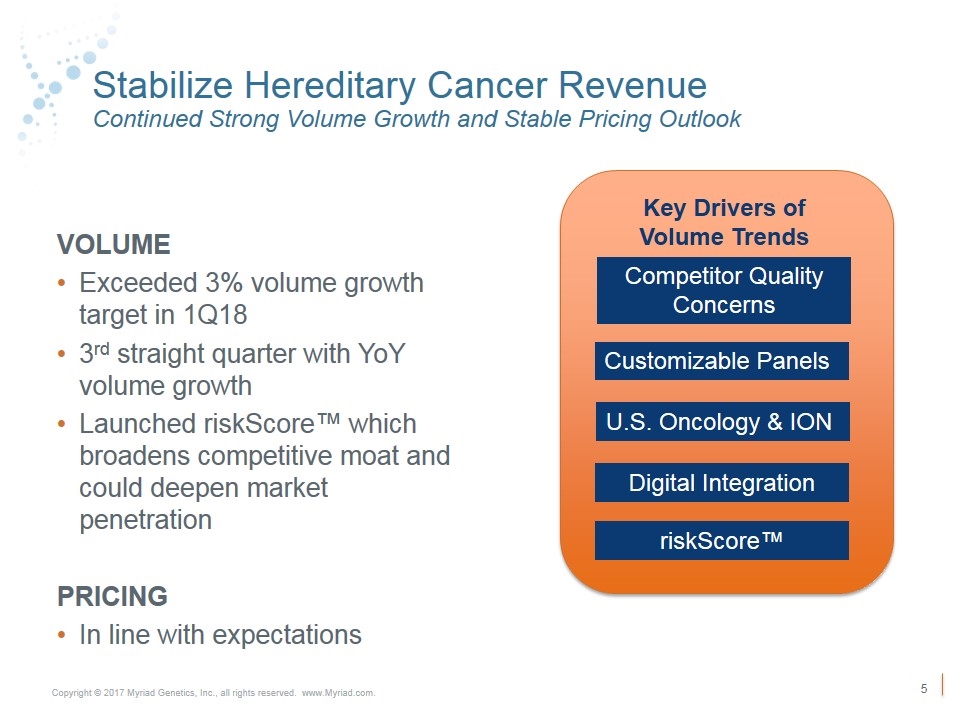
Stabilize Hereditary Cancer Revenue Continued Strong Volume Growth and Stable Pricing Outlook VOLUME Exceeded 3% volume growth target in 1Q18 3rd straight quarter with YoY volume growth Launched riskScore™ which broadens competitive moat and could deepen market penetration PRICING In line with expectations 3% U.S. Oncology & ION Customizable Panels Digital Integration riskScore™ Competitor Quality Concerns Key Drivers of Volume Trends
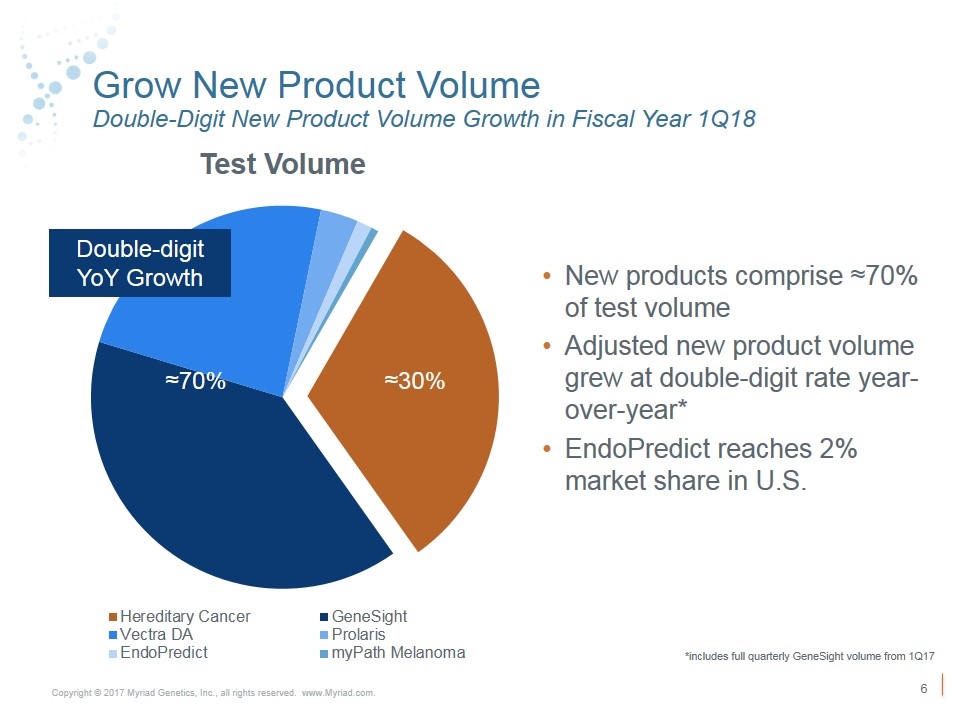
Grow New Product Volume Double-Digit New Product Volume Growth in Fiscal Year 1Q18 New products comprise ≈70% of test volume Adjusted new product volume grew at double-digit rate year-over-year* EndoPredict reaches 2% market share in U.S. Double-digit YoY Growth ≈30% ≈70% *includes full quarterly GeneSight volume from 1Q17
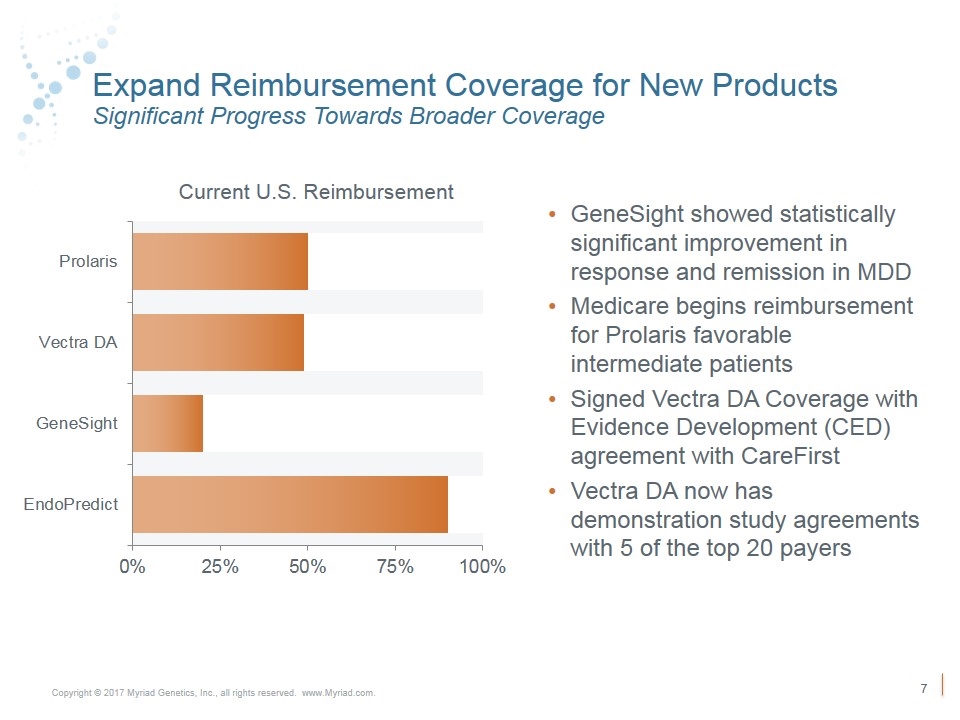
Expand Reimbursement Coverage for New Products Significant Progress Towards Broader Coverage Current U.S. Reimbursement GeneSight showed statistically significant improvement in response and remission in MDD Medicare begins reimbursement for Prolaris favorable intermediate patients Signed Vectra DA Coverage with Evidence Development (CED) agreement with CareFirst Vectra DA now has demonstration study agreements with 5 of the top 20 payers
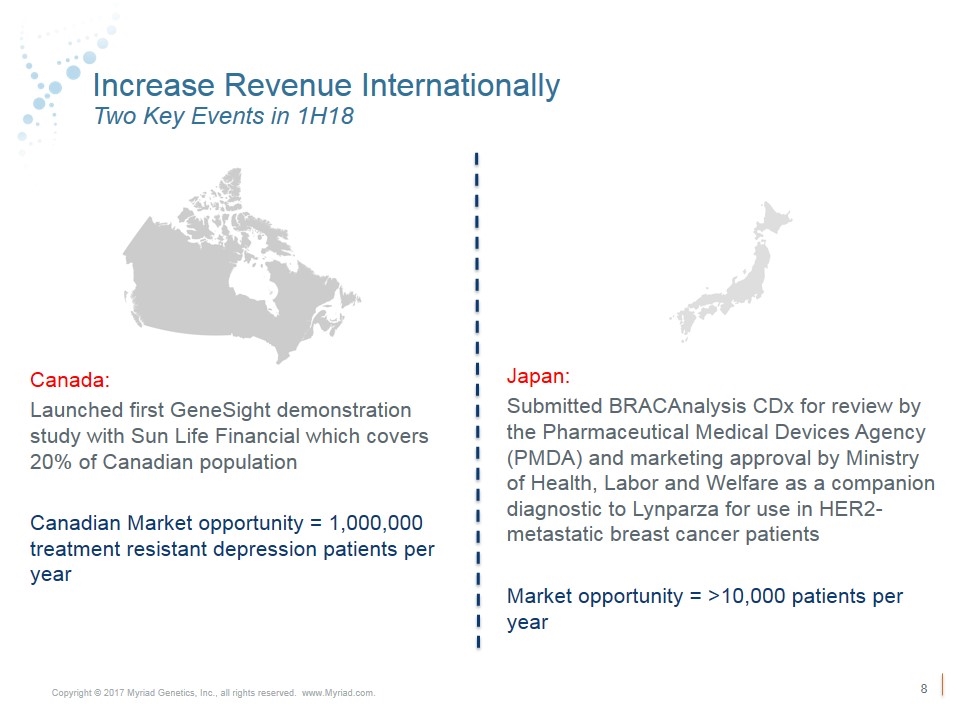
Increase Revenue Internationally Two Key Events in 1H18 Canada: Launched first GeneSight demonstration study with Sun Life Financial which covers 20% of Canadian population Canadian Market opportunity = 1,000,000 treatment resistant depression patients per year Japan: Submitted BRACAnalysis CDx for review by the Pharmaceutical Medical Devices Agency (PMDA) and marketing approval by Ministry of Health, Labor and Welfare as a companion diagnostic to Lynparza for use in HER2- metastatic breast cancer patients Market opportunity = >10,000 patients per year
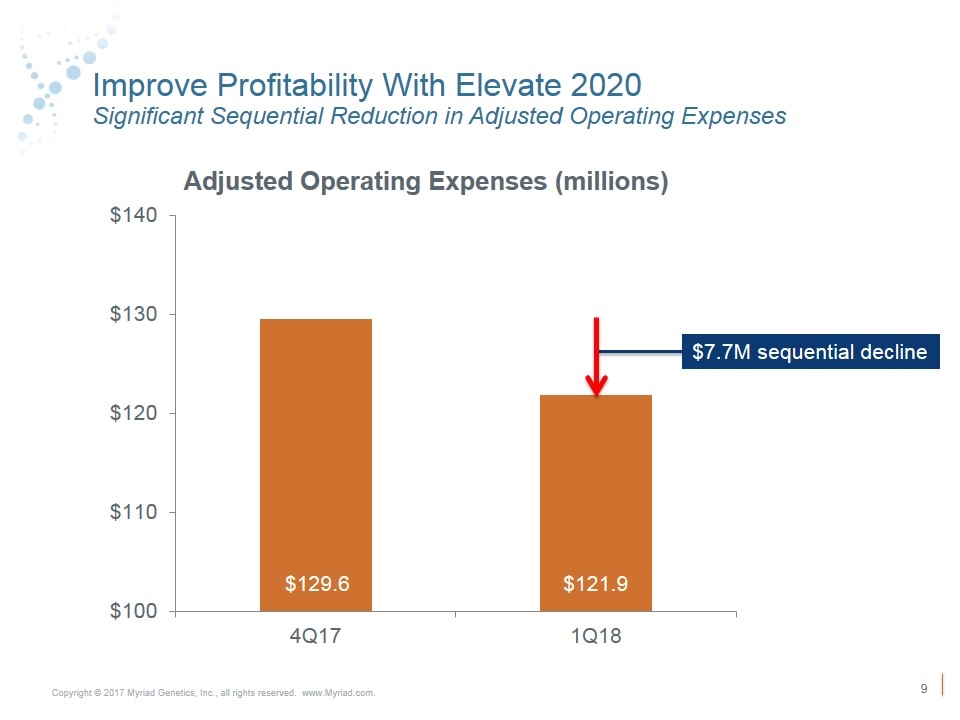
Improve Profitability With Elevate 2020 Significant Sequential Reduction in Adjusted Operating Expenses $129.6 $121.9 $7.7M sequential decline
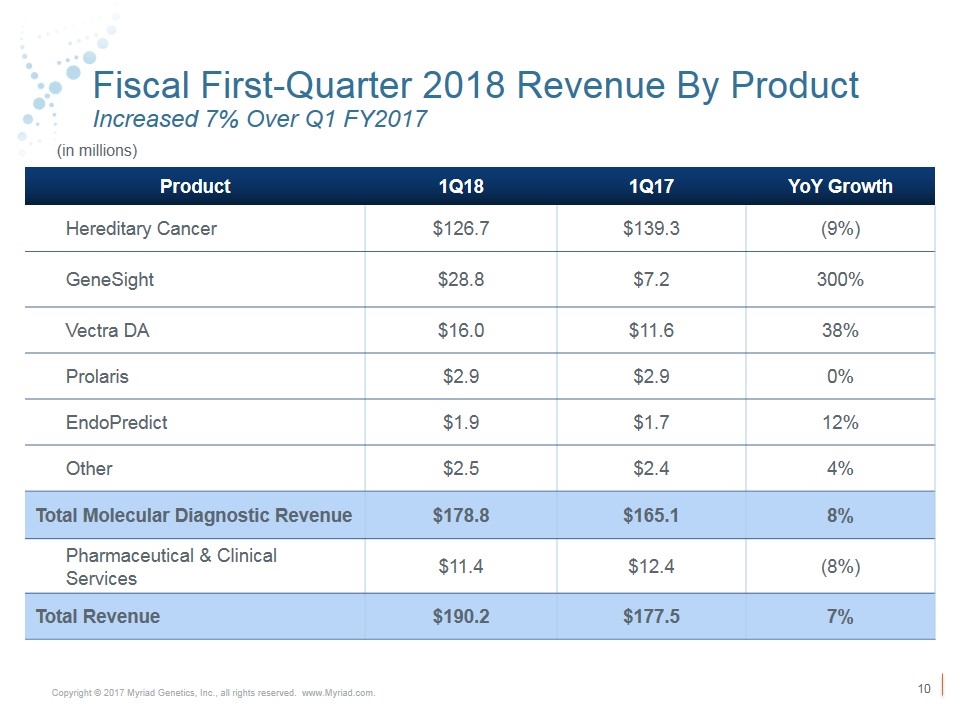
Fiscal First-Quarter 2018 Revenue By Product Increased 7% Over Q1 FY2017 Product 1Q18 1Q17 YoY Growth Hereditary Cancer $126.7 $139.3 (9%) GeneSight $28.8 $7.2 300% Vectra DA $16.0 $11.6 38% Prolaris $2.9 $2.9 0% EndoPredict $1.9 $1.7 12% Other $2.5 $2.4 4% Total Molecular Diagnostic Revenue $178.8 $165.1 8% Pharmaceutical & Clinical Services $11.4 $12.4 (8%) Total Revenue $190.2 $177.5 7% (in millions)
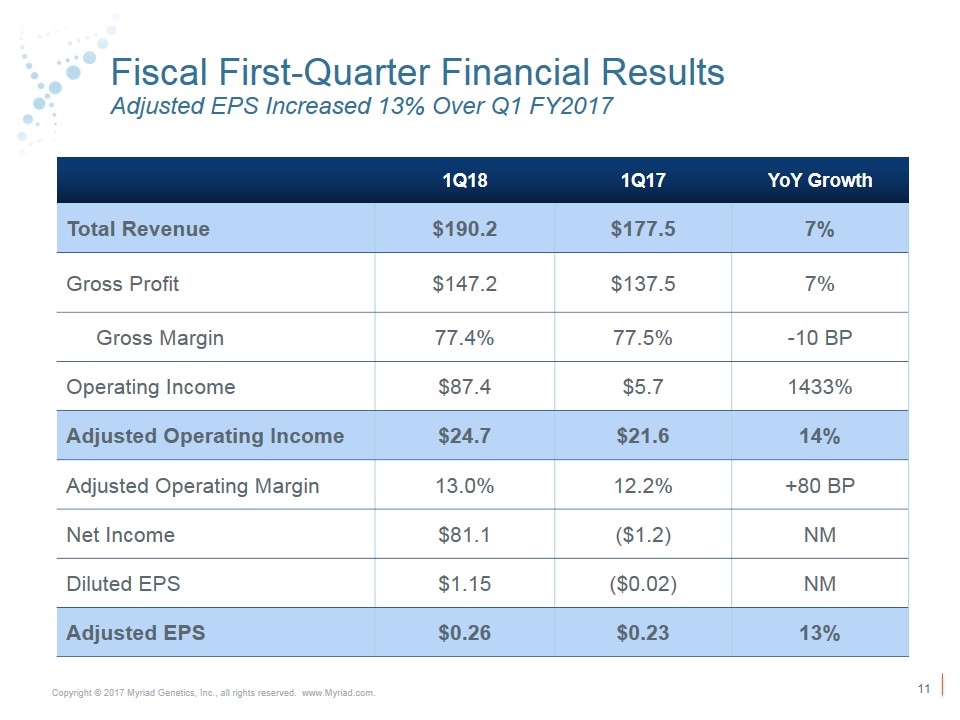
Fiscal First-Quarter Financial Results Adjusted EPS Increased 13% Over Q1 FY2017 (in millions except per share data) 1Q18 1Q17 YoY Growth Total Revenue $190.2 $177.5 7% Gross Profit $147.2 $137.5 7% Gross Margin 77.4% 77.5% -10 BP Operating Income $87.4 $5.7 1433% Adjusted Operating Income $24.7 $21.6 14% Adjusted Operating Margin 13.0% 12.2% +80 BP Net Income $81.1 ($1.2) NM Diluted EPS $1.15 ($0.02) NM Adjusted EPS $0.26 $0.23 13%
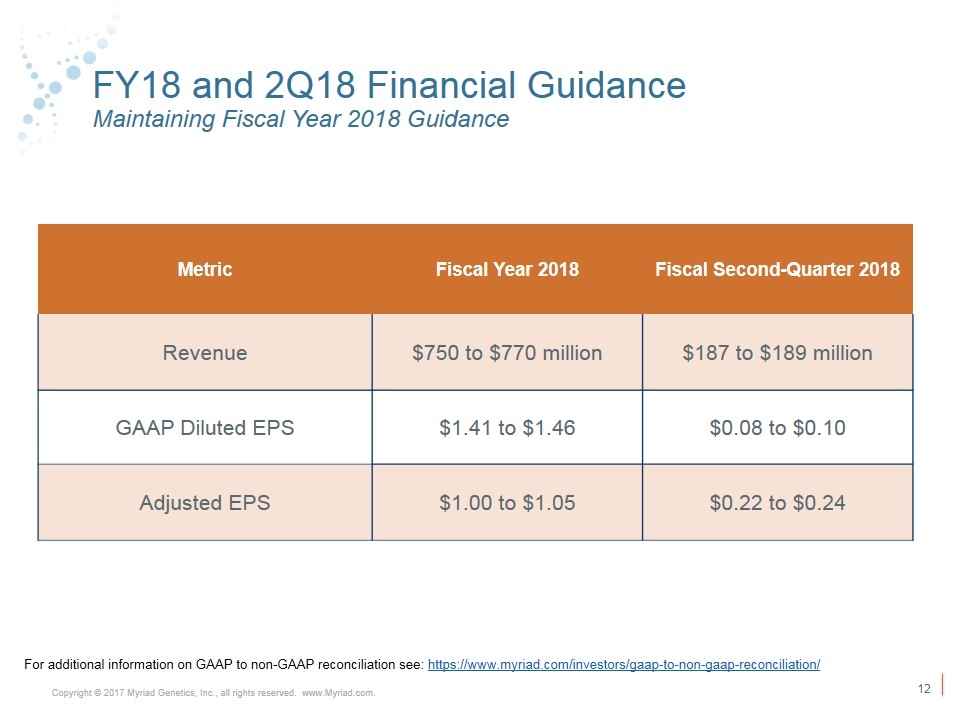
FY18 and 2Q18 Financial Guidance Maintaining Fiscal Year 2018 Guidance Metric Fiscal Year 2018 Fiscal Second-Quarter 2018 Revenue $750 to $770 million $187 to $189 million GAAP Diluted EPS $1.41 to $1.46 $0.08 to $0.10 Adjusted EPS $1.00 to $1.05 $0.22 to $0.24 For additional information on GAAP to non-GAAP reconciliation see: https://www.myriad.com/investors/gaap-to-non-gaap-reconciliation/
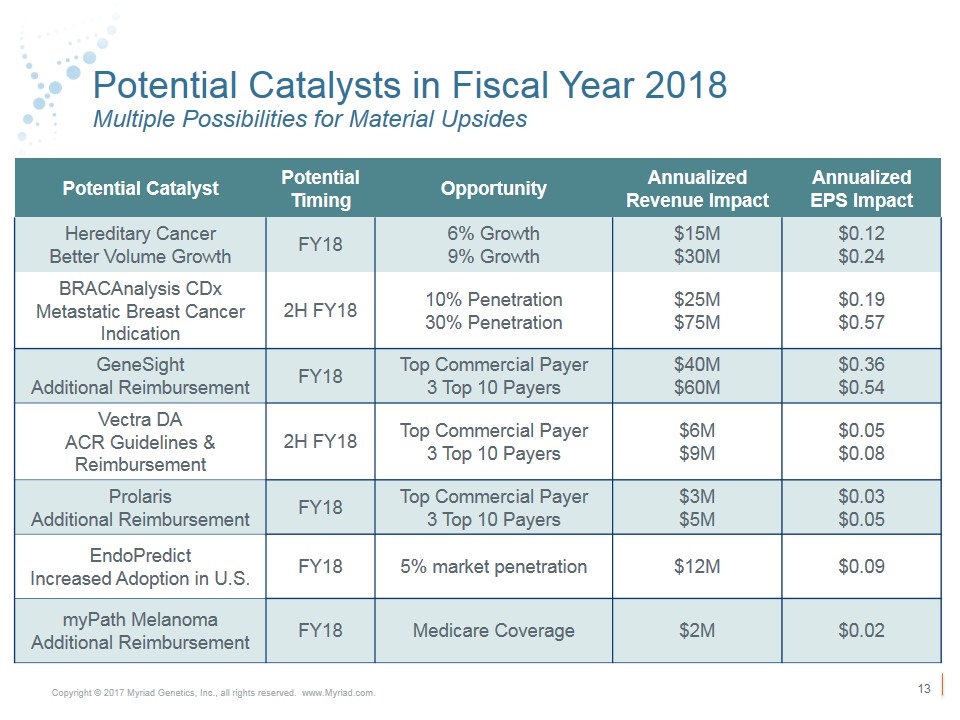
Potential Catalysts in Fiscal Year 2018 Multiple Possibilities for Material Upsides Potential Catalyst Potential Timing Opportunity Annualized Revenue Impact Annualized EPS Impact Hereditary Cancer Better Volume Growth FY18 6% Growth 9% Growth $15M $30M $0.12 $0.24 BRACAnalysis CDx Metastatic Breast Cancer Indication 2H FY18 10% Penetration 30% Penetration $25M $75M $0.19 $0.57 GeneSight Additional Reimbursement FY18 Top Commercial Payer 3 Top 10 Payers $40M $60M $0.36 $0.54 Vectra DA ACR Guidelines & Reimbursement 2H FY18 Top Commercial Payer 3 Top 10 Payers $6M $9M $0.05 $0.08 Prolaris Additional Reimbursement FY18 Top Commercial Payer 3 Top 10 Payers $3M $5M $0.03 $0.05 EndoPredict Increased Adoption in U.S. FY18 5% market penetration $12M $0.09 myPath Melanoma Additional Reimbursement FY18 Medicare Coverage $2M $0.02
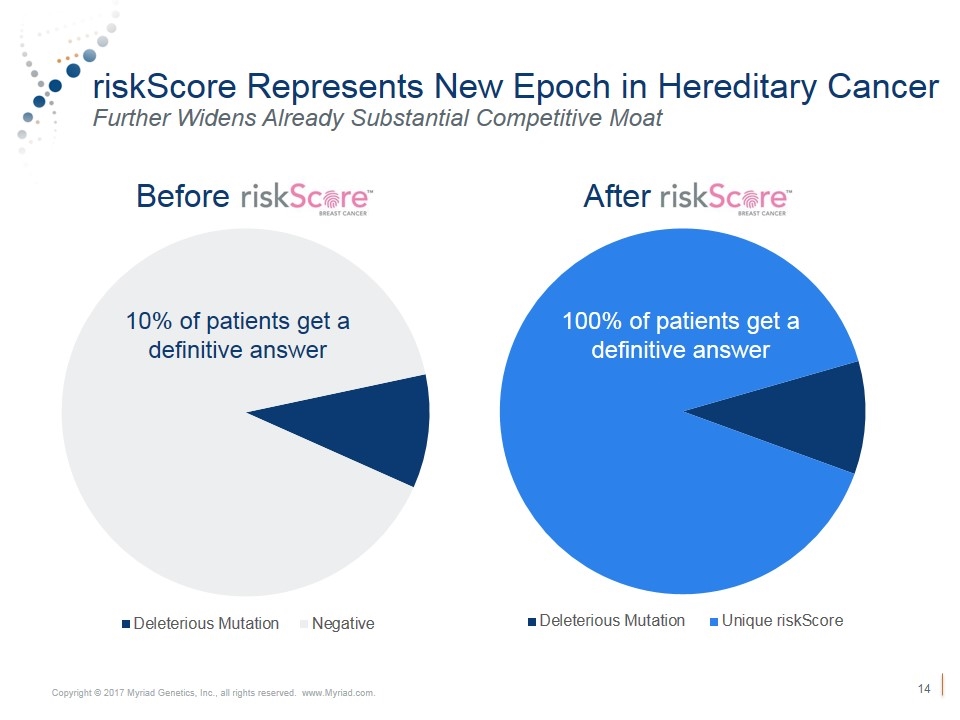
riskScore Represents New Epoch in Hereditary Cancer Further Widens Already Substantial Competitive Moat Before After 100% of patients get a definitive answer 100% of patients get a definitive answer 10% of patients get a definitive answer
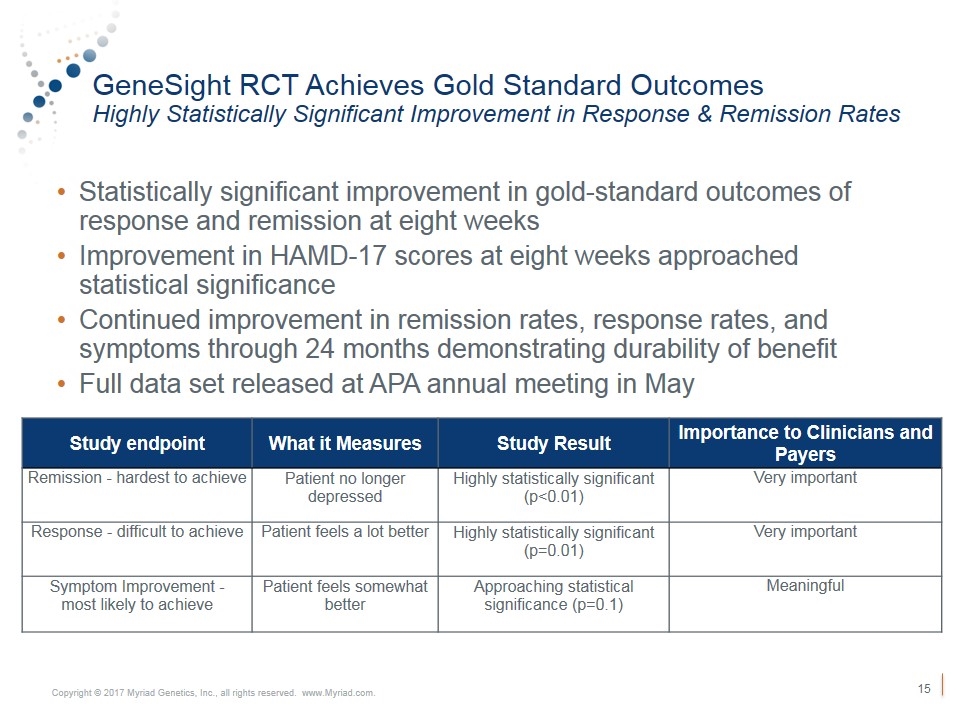
GeneSight RCT Achieves Gold Standard Outcomes Highly Statistically Significant Improvement in Response & Remission Rates Statistically significant improvement in gold-standard outcomes of response and remission at eight weeks Improvement in HAMD-17 scores at eight weeks approached statistical significance Continued improvement in remission rates, response rates, and symptoms through 24 months demonstrating durability of benefit Full data set released at APA annual meeting in May Study endpoint What it Measures Study Result Importance to Clinicians and Payers Remission - hardest to achieve Patient no longer depressed Highly statistically significant (p<0.01) Very important Response - difficult to achieve Patient feels a lot better Highly statistically significant (p=0.01) Very important Symptom Improvement - most likely to achieve Patient feels somewhat better Approaching statistical significance (p=0.1) Meaningful
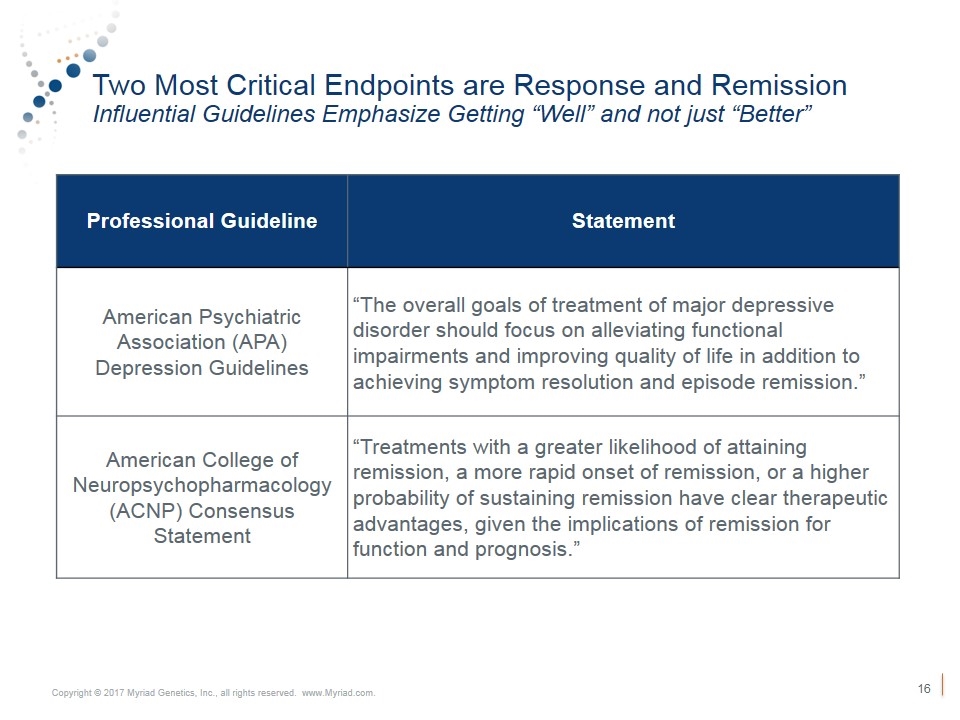
Two Most Critical Endpoints are Response and Remission Influential Guidelines Emphasize Getting “Well” and not just “Better” Professional Guideline Statement American Psychiatric Association (APA) Depression Guidelines “The overall goals of treatment of major depressive disorder should focus on alleviating functional impairments and improving quality of life in addition to achieving symptom resolution and episode remission.” American College of Neuropsychopharmacology (ACNP) Consensus Statement “Treatments with a greater likelihood of attaining remission, a more rapid onset of remission, or a higher probability of sustaining remission have clear therapeutic advantages, given the implications of remission for function and prognosis.”
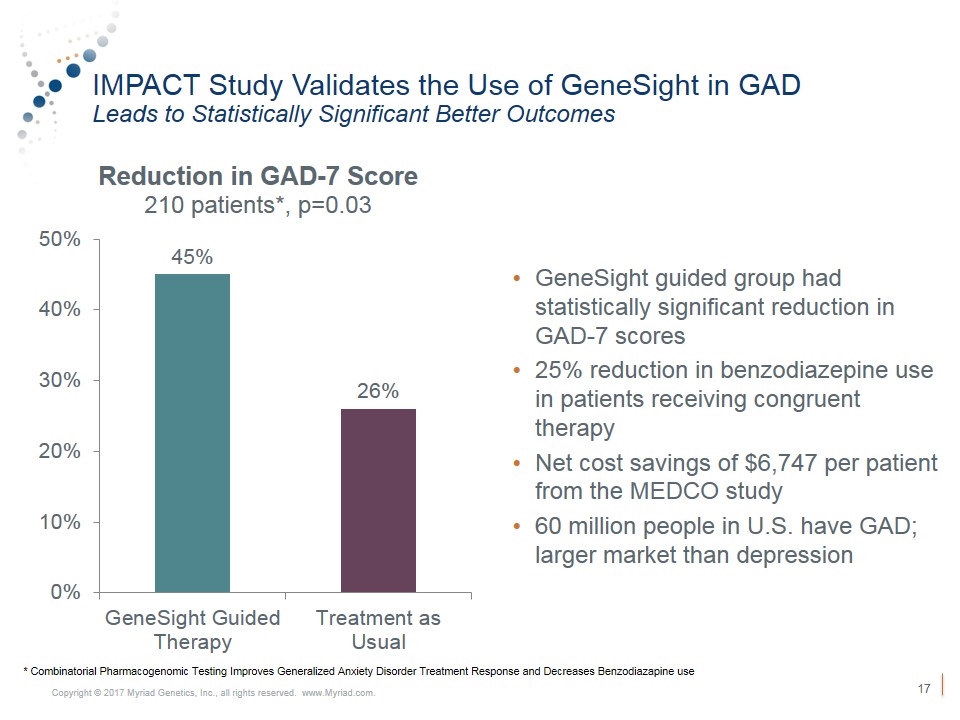
IMPACT Study Validates the Use of GeneSight in GAD Leads to Statistically Significant Better Outcomes GeneSight guided group had statistically significant reduction in GAD-7 scores 25% reduction in benzodiazepine use in patients receiving congruent therapy Net cost savings of $6,747 per patient from the MEDCO study 60 million people in U.S. have GAD; larger market than depression * Combinatorial Pharmacogenomic Testing Improves Generalized Anxiety Disorder Treatment Response and Decreases Benzodiazapine use
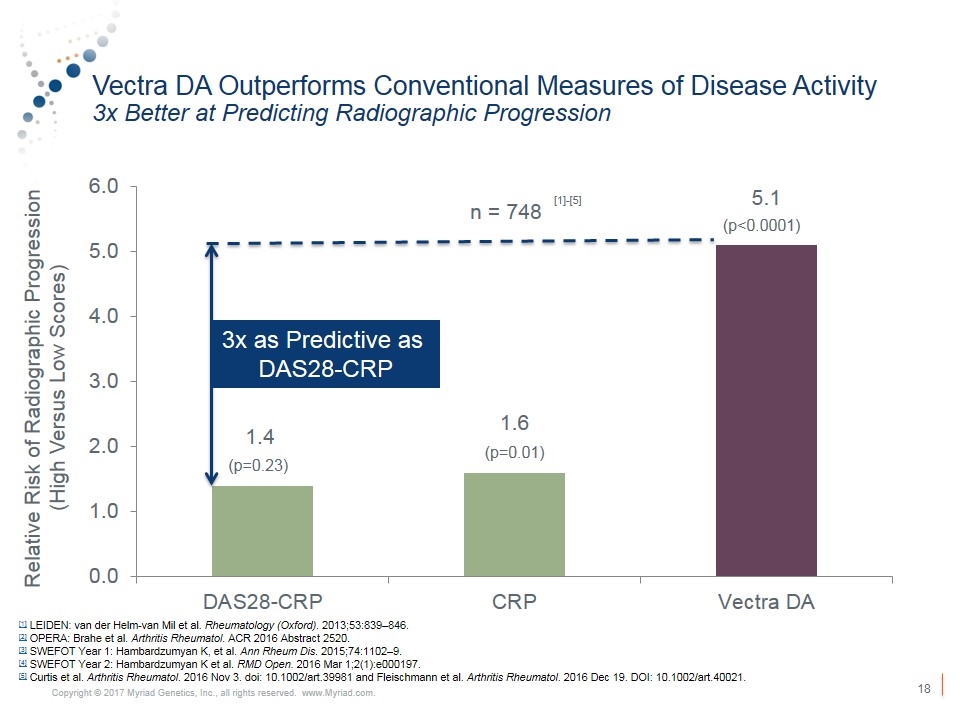
Vectra DA Outperforms Conventional Measures of Disease Activity 3x Better at Predicting Radiographic Progression Relative Risk of Radiographic Progression (High Versus Low Scores) n = 748 (p=0.23) (p=0.01) (p<0.0001) [1] LEIDEN: van der Helm-van Mil et al. Rheumatology (Oxford). 2013;53:839–846. [2] OPERA: Brahe et al. Arthritis Rheumatol. ACR 2016 Abstract 2520. [3] SWEFOT Year 1: Hambardzumyan K, et al. Ann Rheum Dis. 2015;74:1102–9. [4] SWEFOT Year 2: Hambardzumyan K et al. RMD Open. 2016 Mar 1;2(1):e000197. [5] Curtis et al. Arthritis Rheumatol. 2016 Nov 3. doi: 10.1002/art.39981 and Fleischmann et al. Arthritis Rheumatol. 2016 Dec 19. DOI: 10.1002/art.40021. 3x as Predictive as DAS28-CRP [1]-[5]
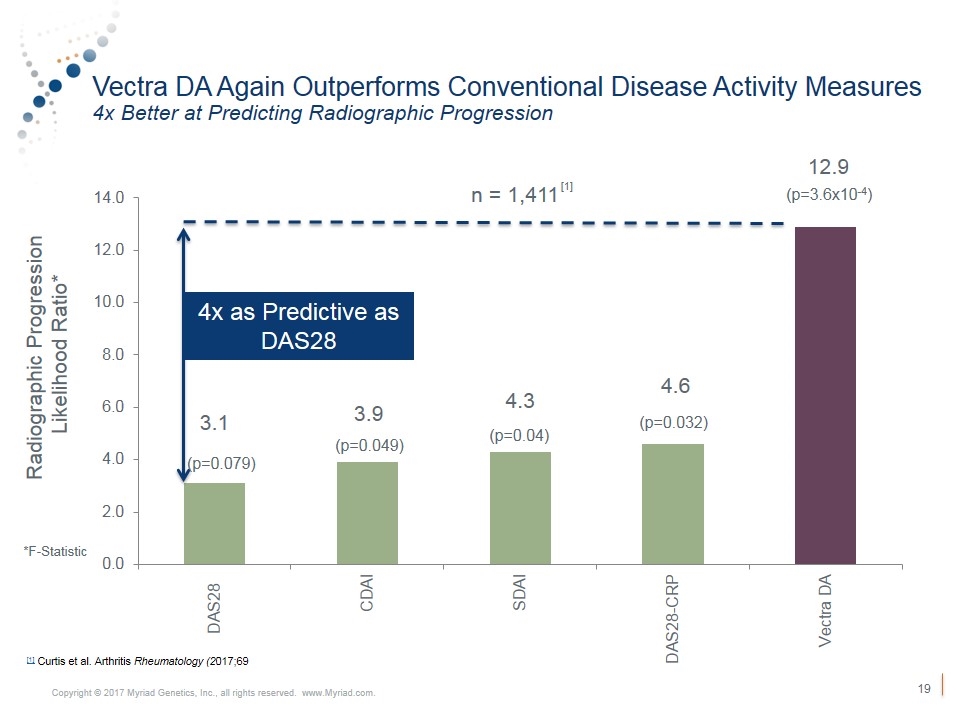
Vectra DA Again Outperforms Conventional Disease Activity Measures 4x Better at Predicting Radiographic Progression Radiographic Progression Likelihood Ratio* 4x as Predictive as DAS28 (p=0.079) (p=0.049) (p=0.04) (p=0.032) (p=3.6x10⁻⁴) n = 1,411 *F-Statistic [1] Curtis et al. Arthritis Rheumatology (2017;69 [1]
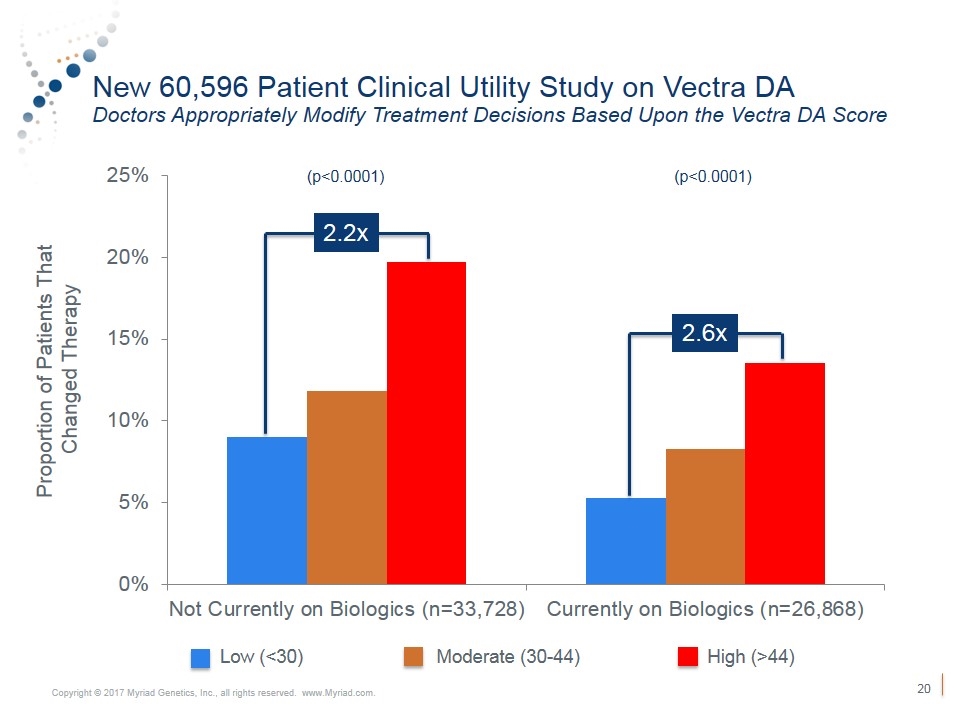
New 60,596 Patient Clinical Utility Study on Vectra DA Doctors Appropriately Modify Treatment Decisions Based Upon the Vectra DA Score (p<0.0001) (p<0.0001) Proportion of Patients That Changed Therapy Low (<30) Moderate (30-44) High (>44) 2.2x 2.6x
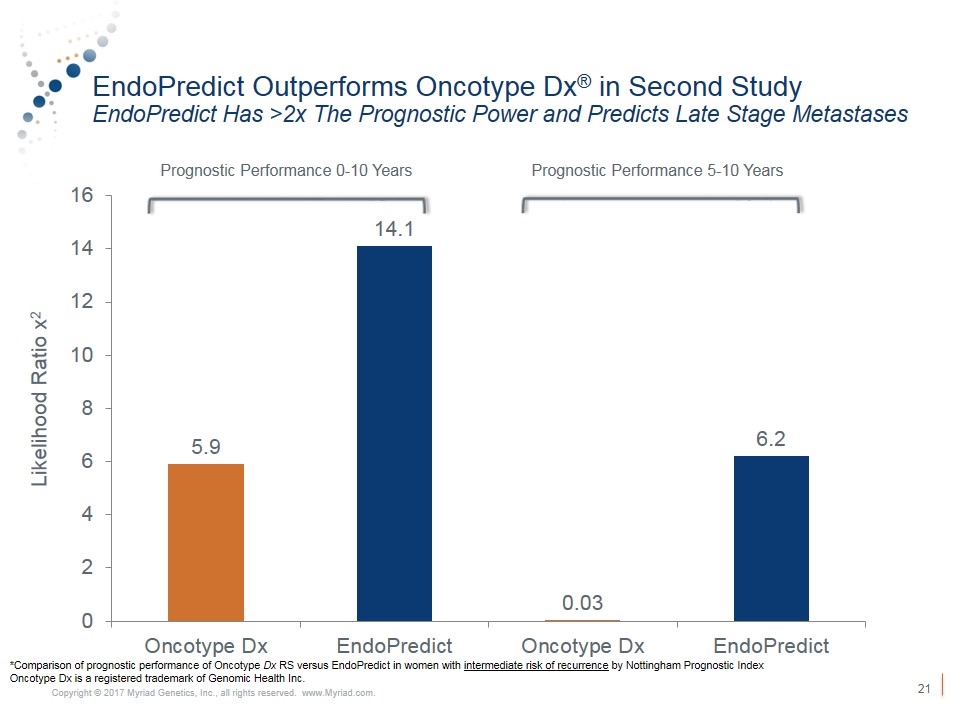
EndoPredict Outperforms Oncotype Dx® in Second Study EndoPredict Has >2x The Prognostic Power and Predicts Late Stage Metastases Prognostic Performance 0-10 Years Prognostic Performance 5-10 Years *Comparison of prognostic performance of Oncotype Dx RS versus EndoPredict in women with intermediate risk of recurrence by Nottingham Prognostic Index Oncotype Dx is a registered trademark of Genomic Health Inc. Likelihood Ratio x2
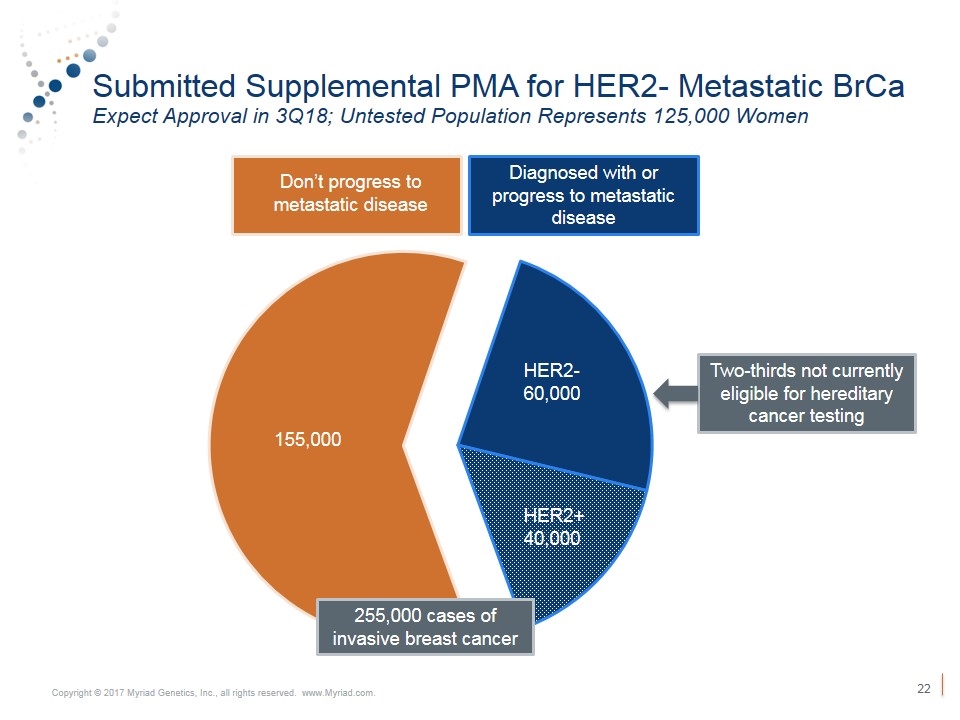
Submitted Supplemental PMA for HER2- Metastatic BrCa Expect Approval in 3Q18; Untested Population Represents 125,000 Women Diagnosed with or progress to metastatic disease HER2+ 40,000 HER2- 60,000 155,000 Two-thirds not currently eligible for hereditary cancer testing Don’t progress to metastatic disease 255,000 cases of invasive breast cancer
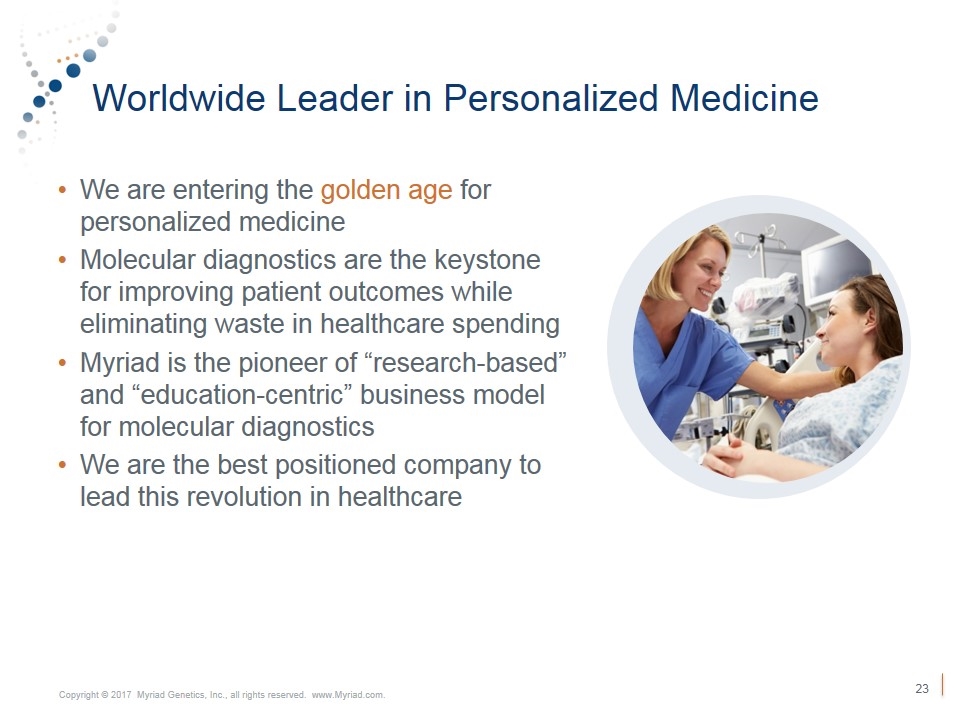
Worldwide Leader in Personalized Medicine We are entering the golden age for personalized medicine Molecular diagnostics are the keystone for improving patient outcomes while eliminating waste in healthcare spending Myriad is the pioneer of “research-based” and “education-centric” business model for molecular diagnostics We are the best positioned company to lead this revolution in healthcare Copyright © 2017 Myriad Genetics, Inc., all rights reserved. www.Myriad.com.
