Attached files
| file | filename |
|---|---|
| EX-99.3 - EXHIBIT 99.3 - Extended Stay America, Inc. | exhibit993-distributionann.htm |
| EX-99.1 - EXHIBIT 99.1 - Extended Stay America, Inc. | exhibit991-earningsrelease.htm |
| 8-K - 8-K - Extended Stay America, Inc. | stay-8xkannouncingq32017fo.htm |

November 7, 2017
Extended Stay America, Inc.
ESH Hospitality, Inc.
Q3 2017
Earnings Summary

2
important disclosure information
This presentation contains forward-looking statements within the meaning of the federal securities laws. Statements related to,
among other things, future financial performance, including our 2017 outlook, the expected timing, completion and effects of any
proposed asset disposals, expected performance, free cash flow, debt reduction, distribution growth, franchised new builds,
owned new builds and other growth opportunities, as such, involve known and unknown risks, uncertainties and other factors
that may cause Extended Stay America, Inc.’s (the “Corporation”) and ESH Hospitality, Inc.’s (“ESH REIT,” and together with the
Corporation, the “Company”) actual results or performance to differ from those projected in the forward-looking statements,
possibly materially. For a description of factors that may cause the Company’s actual results or performance to differ from
projected results or performance implied by forward-looking statements, please review the information under the headings
“Cautionary Note Regarding Forward-Looking Statements” and “Risk Factors” included in the Company’s combined annual report
on Form 10-K filed with the Securities and Exchange Commission (“SEC”) on February 28, 2017 and other documents of the
Company on file with or furnished to the SEC. Any forward-looking statements made in this presentation are qualified by these
cautionary statements, and there can be no assurance that the actual results or developments anticipated by the Company will be
realized or, even if substantially realized, will have the expected consequences to, or effects on, the Company, its business or
operations. Except as required by law, the Company undertakes no obligation to update publicly or revise any forward-looking
statement, whether as a result of new information, future developments or otherwise. We caution you that actual results may
differ materially from what is expressed, implied or forecasted by the Company’s forward-looking statements.
This presentation includes certain non-GAAP financial measures, including Hotel Operating Profit, Hotel Operating Margin,
EBITDA, Adjusted EBITDA, Funds From Operations (“FFO”), Adjusted Funds From Operations (“Adjusted FFO”), Adjusted FFO per
diluted Paired Share, Paired Share Income, Adjusted Paired Share Income and Adjusted Paired Share Income per diluted Paired
Share. These non-GAAP financial measures should be considered only as supplemental to, and not as superior to, financial
measures prepared in accordance with U.S. GAAP. Please refer to the appendix of this presentation for a reconciliation of these
non-GAAP financial measures to the most directly comparable financial measures prepared in accordance with U.S. GAAP, and to
the Company’s combined annual report on Form 10-K filed with the SEC on February 28, 2017 for definitions of these non-GAAP
measures.

3
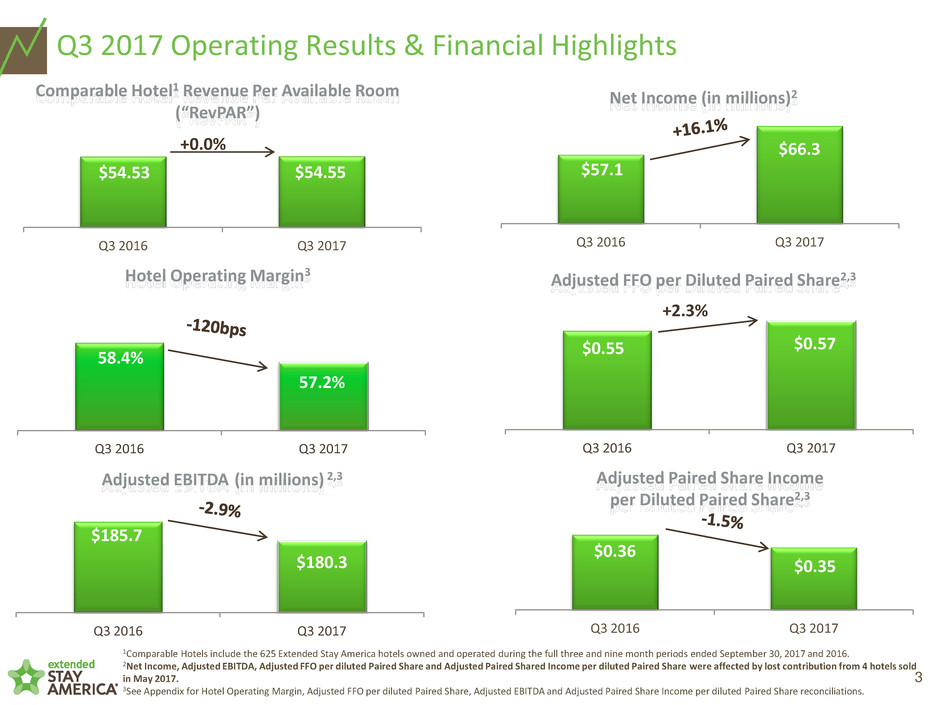
1Comparable Hotels include the 625 Extended Stay America hotels owned and operated during the full three and nine month periods ended September 30, 2017 and 2016.
2Net Income, Adjusted EBITDA, Adjusted FFO per diluted Paired Share and Adjusted Paired Shared Income per diluted Paired Share were affected by lost contribution from 4 hotels sold
in May 2017.
3See Appendix for Hotel Operating Margin, Adjusted FFO per diluted Paired Share, Adjusted EBITDA and Adjusted Paired Share Income per diluted Paired Share reconciliations.
Q3 2017 Operating Results & Financial Highlights
$54.53 $54.55
Q3 2016 Q3 2017
Comparable Hotel1 Revenue Per Available Room
(“RevPAR”)
$0.55 $0.57
Q3 2016 Q3 2017
Adjusted FFO per Diluted Paired Share2,3
+0.0%
+2.3%
$57.1
$66.3
Q3 2016 Q3 2017
Net Income (in millions)2
$185.7
$180.3
Q3 2016 Q3 2017
Hotel Operating Margin3
58.4%
57.2%
Q3 2016 Q3 2017
Adjusted EBITDA (in millions) 2,3
$0.36
$0.35
Q3 2016 Q3 2017
Adjusted Paired Share Income
per Diluted Paired Share2,3

4
1Comparable Hotels include the 625 Extended Stay America hotels owned and operated during the full three and nine month periods ended September 30, 2017 and 2016.
2Net Income, Adjusted EBITDA, Adjusted FFO per diluted Paired Share and Adjusted Paired Shared Income per diluted Paired Share were affected by lost contribution from 4 hotels sold in May
2017. Net Income, Adjusted FFO per diluted Paired Share and Paired Income per diluted Paired Share benefited from a one time non-cash decrease in income tax expense in 2016.
3See Appendix for Hotel Operating Margin, Adjusted FFO per diluted Paired Share, Adjusted EBITDA and Adjusted Paired Share Income per diluted Paired Share reconciliations.
First Nine Months 2017 Operating Results & Financial Highlights
$50.40
$51.16
Q1-Q3 2016 Q1-Q3 2017
Comparable Hotel1 Revenue Per Available Room
(“RevPAR”)
$1.38
$1.44
Q1-Q3 2016 Q1-Q3 2017
Adjusted FFO per Diluted Paired Share2,3
+4.6%
$133.2
$132.0
Q1-Q3 2016 Q1-Q3 2017
Net Income (in millions)2
$473.2 $482.7
Q1-Q3 2016 Q1-Q3 2017
Hotel Operating Margin3
55.1% 55.7%
Q1-Q3 2016 Q1-Q3 2017
Adjusted EBITDA (in millions) 2,3
-0.9%
$0.79
$0.81
Q1-Q3 2016 Q1-Q3 2017
Adjusted Paired Share Income
per Diluted Paired Share2,3

5
Other Highlights
Q3 Length of Stay Revenue Mix2
1-6 nights % 36% 36%
7-29 nights %
23% 22%
30+ nights %
41% 41%
Q3 2017 Q3 2016
Q1-Q3 2017 Capital
Expenditures3
(in millions)
1 Excludes dividends and repurchases related to Corporation preferred stock.
2 Totals may not add to 100% due to rounding.
3 Maintenance capital expenditures includes approximately $9.5 million in insurable event related capital expenditures.
Q1-Q3 2017 Capital Returned
to Stakeholders
1 1

6
Quarterly Distribution and Select Balance Sheet Amounts
Quarterly Distribution
per Paired Share1
$0.19
$0.21
Q3 2016 Q3 2017
+10.5%
Adjusted Net Debt / TTM Adjusted
EBITDA Ratio3
4.0X 3.9X
Q2 2017 Q3 2017
¹ Distribution dates of November 22, 2016 and December 5, 2017, respectively.
2 Includes unrestricted cash only.
3 Net debt calculation is (gross debt – total restricted and unrestricted cash).
4 Gross debt outstanding.
Cash Balance (in millions)2
$56.2
$116.7
Q2 2017 Q3 2017
Debt Outstanding (in millions)4
$2,597 $2,594
Q2 2017 Q3 2017

7
Q3 2017 Results, Q4 2017 and Full Year 2017 Guidance
1.5% to 3.5%
$161 $174
$620 $635
$233 $233
$130 $130
23% 24%
$150 $180
Previous 2017 Guidance1
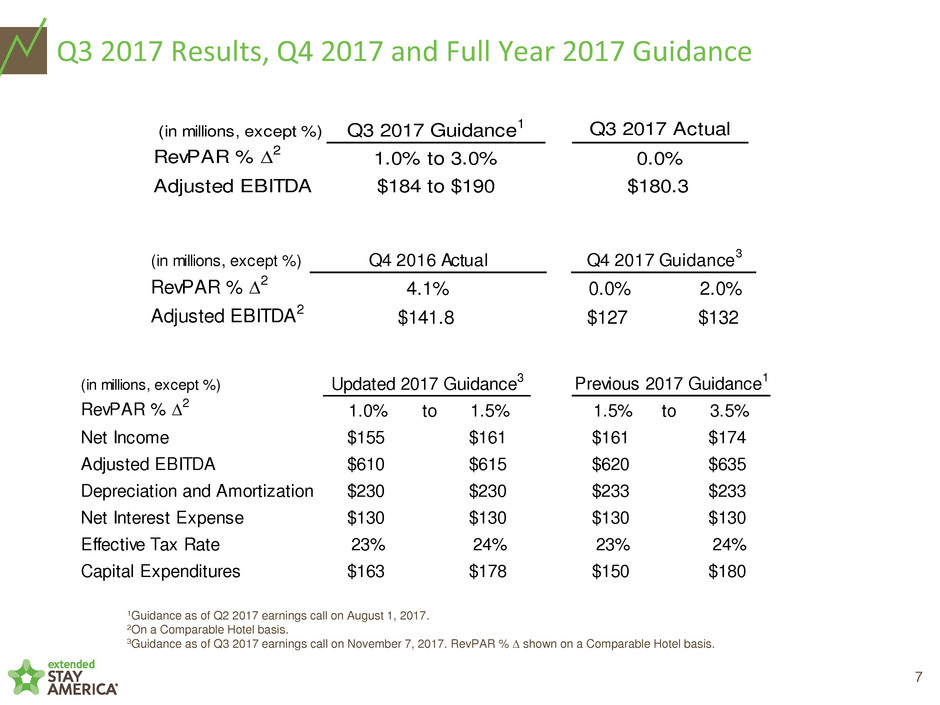
1Guidance as of Q2 2017 earnings call on August 1, 2017.
2On a Comparable Hotel basis.
3Guidance as of Q3 2017 earnings call on November 7, 2017. RevPAR % D shown on a Comparable Hotel basis.
(in millions, except %)
RevPAR % D2 1.0% to 1.5%
Net Income $155 $161
Adjusted EBITDA $610 $615
Depreciation and Amortization $230 $230
Net Interest Expense $130 $130
Effective Tax Rate 23% 24%
Capital Expenditures $163 $178
Updated 2017 Guidance3
(in millions, except %) Q3 2017 Guidance1 Q3 2017 Actual
RevPAR % D2 1.0% to 3.0% 0.0%
Adjusted EBITDA $184 to $190 $180.3
(in millions, except %) Q4 2016 Actual
RevPAR % D2 4.1% 0.0% 2.0%
Adjusted EBITDA2 $141.8 $127 $132
Q4 2017 Guidance
3

appendix

9
NON-GAAP RECONCILIATION OF NET INCOME TO EBITDA AND ADJUSTED EBITDA FOR THE THREE AND NINE
MONTHS ENDED SEPTEMBER 30, 2017 AND 2016
2017 2016 2017 2016
$ 66,250 $ 57,065 Net income $ 132,038 $ 133,204
31,651 48,713 Interest expense, net 96,958 131,462
20,295 15,867 Income tax expense 40,721 26,211
57,314 55,955 Depreciation and amortization 172,789 164,274
175,510 177,600 EBITDA 442,506 455,151
2,720 3,016 Equity-based compensation 9,049 8,635
(278) (1) (305) (2) Other non-operating income (426) (3) (1,069) (4)
- 2,756 Impairment of long-lived assets 20,357 2,756
- - Loss on sale of hotel properties 1,897 -
2,314 (5) 2,666 (6) Other expenses 9,333 (7) 7,718 (8)
$ 180,266 $ 185,733 Adjusted EBITDA $ 482,716 $ 473,191
(2.9)% % growth 2.0%
Nine Months Ended
(5)
Includes loss on disposal of assets of approximately $2.1 million, transaction costs of approximately $0.1 million due to the
revision of an estimate related to the sale of the three Canadian hotel properties in May 2017 and additonal costs incurred in
connection with the second quarter 2017 secondary offerings of approximately $0.1 million.
(6)
Includes loss on disposal of assets of approximately $2.2 million and costs incurred in connection with the October 2016
secondary offering of approximately $0.4 million.
(7)
Includes loss on disposal of assets of approximately $8.1 million, costs incurred in connection with the second quarter 2017
secondary offerings of approximately $1.1 million and transaction costs of approximately $0.1 million due to the revision of an
estimate related to the sale of the three Canadian hotel properties in May 2017.
September 30,
(8)
Includes loss on disposal of assets of approximately $7.2 million, costs incurred in connection with the October 2016
secondary offering of approximately $0.4 million and transaction costs of approximately $0.1 million due to the revision of an
estimate related to the sale of 53 hotel properties in December 2015.
Three Months Ended
September 30,
(4)
Includes foreign currency transaction gain of approximately $1.1 million.
(1)
Includes foreign currency transaction gain of approximately $0.4 million and loss related to interest rate swap of approximately
$0.1 million.
(2)
Includes foreign currency transaction gain of approximately $0.3 million.
(3)
Includes foreign currency transaction gain of approximately $0.8 million and loss related to interest rate swap of approximately
$0.4 million.
(In thousands)
(Unaudited)

10
NON-GAAP RECONCILIATION OF ROOM REVENUES, OTHER HOTEL REVENUES AND HOTEL OPERATING
EXPENSES TO HOTEL OPERATING PROFIT AND HOTEL OPERATING MARGIN FOR THE THREE AND NINE MONTHS
ENDED SEPTEMBER 30, 2017 AND 2016
2017 2016 Variance 2017 2016 Variance
345,089$ 349,076$ (1.1)% Room revenues 963,505$ 960,046$ 0.4%
5,777 5,445 6.1% Other hotel revenues 16,715 14,822 12.8%
350,866 354,521 (1.0)% Total hotel revenues 980,220 974,868 0.5%
150,108 147,605 1.7% Hotel operating expenses
(1)
434,661 437,242 (0.6)%
200,758$ 206,916$ (3.0)% Hotel Operating Profit 545,559$ 537,626$ 1.5%
57.2% 58.4% (120) bps Hotel Operating Margin 55.7% 55.1% 60 bps
Three Months Ended
September 30,
(In thousands)
(Unaudited)
(1)
Excludes loss on disposal of assets of approximately $2.1 million, $2.2 million, $8.1 million and $7.2 million, respectively.
September 30,
Nine Months Ended

11
NON-GAAP RECONCILIATION OF NET INCOME ATTRIBUTABLE TO EXTENDED STAY AMERICA, INC. COMMON SHAREHOLDERS TO
FUNDS FROM OPERATIONS, ADJUSTED FUNDS FROM OPERATIONS AND ADJUSTED FUNDS FROM OPERATIONS PER DILUTED
PAIRED SHARE FOR THE THREE AND NINE MONTHS ENDED SEPTEMBER 30, 2017 AND 2016
2017 2016 2017 2016
$ 0.28 $ 0.23
Net income per Extended Stay America, Inc. common
share - diluted $ 0.66 $ 0.61
$ 53,876 $ 46,556
Net income attributable to Extended Stay America, Inc.
common shareholders
$ 128,752 $ 124,331
12,370 10,505
Noncontrolling interests attributable to Class B
common shares of ESH REIT
3,274 8,861
56,145 54,894 Real estate depreciation and amortization 169,327 161,012
- 2,756 Impairment of long-lived assets 20,357 2,756
- - Loss on sale of hotel properties 1,897 -
(13,138) (14,355)
Tax effect of adjustments to net income attributable to
Extended Stay America, Inc. common shareholders
(44,835) (38,063)
109,253 100,356 Funds from Operations 278,772 258,897
- 14,058 Debt modification and extinguishment costs 1,168 26,161
103 - Loss on interest rate swap 356 -
(24) (3,500) Tax effect of adjustments to Funds from Operations (354) (6,272)
$ 109,332 $ 110,914 Adjusted Funds from Operations $ 279,942 $ 278,786
$ 0.57 $ 0.55
Adjusted Funds from Operations
per Paired Share – diluted $ 1.44 $ 1.38
193,331 200,696
Weighted average Paired Shares
outstanding – diluted 194,001 202,252
Three Months Ended Nine Months Ended
September 30, September 30,
(In thousands, expect per share and per Paired Share data)
(Unaudited)

12
NON-GAAP RECONCILIATION OF NET INCOME ATTRIBUTABLE TO EXTENDED STAY AMERICA, INC. COMMON SHAREHOLDERS TO
PAIRED SHARE INCOME, ADJUSTED PAIRED SHARE INCOME AND ADJUSTED PAIRED SHARE INCOME PER DILUTED PAIRED SHARE
FOR THE THREE AND NINE MONTHS ENDED SEPTEMBER 30, 2017 AND 2016
2017 2016 2017 2016
$ 0.28 $ 0.23
Net income per Extended Stay America, Inc. common
share - diluted $ 0.66 $ 0.61
53,876$ 46,556$
Net income attributable to Extended Stay America, Inc.
common shareholders 128,752$ 124,331$
12,370 10,505
Noncontrolling interests attributable to Class B
common shares of ESH REIT 3,274 8,861
66,246 57,061 Paired Share Income 132,026 133,192
- 14,058 Debt modification and extinguishment costs 1,168 26,161
(278) (1) (305) (2) Other non-operating income (426) (3) (1,069) (4)
- 2,756 Impairment of long-lived assets 20,357 2,756
- - Loss on sale of hotel properties 1,897 -
2,314 (5) 2,666 (6) Other expenses 9,333 (7) 7,718 (8)
(477) (4,775) Tax effect of adjustments to Paired Share Income (7,570) (8,505)
67,805$ 71,461$ Adjusted Paired Share Income 156,785$ 160,253$
0.35$ 0.36$ Adjusted Paired Share Income per Paired Share – diluted 0.81$ 0.79$
193,331 200,696 Weighted average Paired Shares outstanding – diluted 194,001 202,252
(3)
Includes foreign currency transaction gain of approximately $0.8 million and loss related to interest rate swap of
approximately $0.4 million.
(In thousands, expect per share and per Paired Share data)
(1)
Includes foreign currency transaction gain of approximately $0.4 million and loss related to interest rate swap of
approximately $0.1 million.
(Unaudited)
September 30,
Nine Months EndedThree Months Ended
September 30,
(2)
Includes foreign currency transaction gain of approximately $0.3 million.
(4)
Includes foreign currency transaction gain of approximately $1.1 million.
(5)
Includes loss on disposal of assets of approximately $2.1 million, transaction costs of approximately $0.1 million due to the
revision of an estimate related to the sale of the three Canadian hotel properties in May 2017 and additonal costs incurred in
connection with the second quarter 2017 secondary offerings of approximately $0.1 million.
(6)
Includes loss on disposal of assets of approximately $2.2 million and costs incurred in connection with the October 2016
secondary offering of approximately $0.4 million.
(7)
Includes loss on disposal of assets of approximately $8.1 million, costs incurred in connection with the second quarter 2017
secondary offerings of approximately $1.1 million and transaction costs of approximately $0.1 million due to the revision of an
estimate related to the sale of the three Canadian hotel properties in May 2017.
(8)
Includes loss on disposal of assets of approximately $7.2 million, costs incurred in connection with the October 2016
secondary offering of approximately $0.4 million and transaction costs of approximately $0.1 million due to the revision of an
estimate related to the sale of 53 hotel properties in December 2015.

13
TOTAL REVENUES AND NON-GAAP RECONCILIATION OF NET INCOME TO EBITDA AND ADJUSTED EBITDA FOR THE YEARS ENDED
DECEMBER 31, 2016 (ACTUAL) AND 2017 (OUTLOOK)
Year Ended
December 31, 2016
(Actual) Low High
$ 1,270,593 Total revenues 1,273,000$ 1,279,000$
$ 163,352 Net income 154,959$ 160,848$
164,537 Interest expense, net 130,000 130,000
34,351 Income tax expense 48,935 48,046
221,309 Depreciation and amortization 229,500 229,500
583,549 EBITDA 563,394 568,394
12,000 Equity-based compensation 12,000 12,000
(1,576) Other non-operating income (148) (148)
9,828 Impairment of long-lived assets 20,357 20,357
- Loss on sale of hotel properties 1,897 1,897
11,857 (1) Other expenses 12,500
(2)
12,500
(2)
$ 615,658 Adjusted EBITDA $ 610,000 $ 615,000
% growth -0.9% -0.1%
(1)
(2) Includes loss on disposal of assets and other non-operating transaction costs.
(Outlook)
Includes loss on disposal of assets of approximately $10.7 million, costs incurred in connection with the fourth quarter 2016
secondary offerings of approximately $1.1 million and transaction costs of approximately $0.1 million due to the revision of an
estimate related to the sale of 53 hotel properties in December 2015.
Year Ending December 31, 2017
(In thousands)
(Unaudited)
