Attached files
| file | filename |
|---|---|
| EX-32.1 - CERTIFICATION BY THE CHIEF EXECUTIVE OFFICER AND THE CHIEF FINANCIAL OFFICER - WPX ENERGY, INC. | exhibit32120170930.htm |
| EX-31.2 - CERTIFICATION BY THE CHIEF FINANCIAL OFFICER - WPX ENERGY, INC. | exhibit31220170930.htm |
| EX-31.1 - CERTIFICATION BY THE CHIEF EXECUTIVE OFFICER - WPX ENERGY, INC. | exhibit31120170930.htm |
| EX-12.1 - COMPUTATION OF RATIO OF EARNINGS TO FIXED CHARGES - WPX ENERGY, INC. | exhibit1220170930.htm |
UNITED STATES
SECURITIES AND EXCHANGE COMMISSION
Washington, D.C. 20549
Form 10-Q |
(Mark One)
þ | QUARTERLY REPORT PURSUANT TO SECTION 13 OR 15(d) OF THE SECURITIES EXCHANGE ACT OF 1934 |
For the quarterly period ended September 30, 2017
OR
¨ | TRANSITION REPORT PURSUANT TO SECTION 13 OR 15(d) OF THE SECURITIES EXCHANGE ACT OF 1934 |
For the transition period from to
Commission file number 1-35322

WPX Energy, Inc. |
(Exact Name of Registrant as Specified in Its Charter) |
Delaware | 45-1836028 | |
(State or Other Jurisdiction of Incorporation or Organization) | (IRS Employer Identification No.) | |
3500 One Williams Center, Tulsa, Oklahoma | 74172-0172 | |
(Address of Principal Executive Offices) | (Zip Code) | |
855-979-2012
(Registrant’s Telephone Number, Including Area Code)
Securities registered pursuant to Section 12(b) of the Act:
Title of Each Class | Name of Each Exchange on Which Registered | |
Common Stock, $0.01 par value | New York Stock Exchange | |
6.25% Series A Mandatory Convertible Preferred Stock, $0.01 par value | New York Stock Exchange | |
Securities registered pursuant to Section 12(g) of the Act: None |
Indicate by check mark whether the registrant: (1) has filed all reports required to be filed by Section 13 or 15(d) of the Securities Exchange Act of 1934 during the preceding 12 months (or for such shorter period that the registrant was required to file such reports), and (2) has been subject to such filing requirements for the past 90 days. Yes þ No ¨
Indicate by check mark whether the registrant has submitted electronically and posted on its corporate Web site, if any, every Interactive Data File required to be submitted and posted pursuant to Rule 405 of Regulation S-T (§232.405 of this chapter) during the preceding 12 months (or for such shorter period that the registrant was required to submit and post such files). Yes þ No ¨
Indicate by check mark whether the registrant is a large accelerated filer, an accelerated filer, a non-accelerated filer, or a smaller reporting company, or an emerging growth company. See the definitions of “large accelerated filer,” “accelerated filer,” “smaller reporting company” and “emerging growth company” in Rule 12b-2 of the Exchange Act. (Check one):
Large accelerated filer | þ | Accelerated filer | ¨ | |||
Non-accelerated filer | ¨ (Do not check if a smaller reporting company) | Smaller reporting company | ¨ | |||
Emerging growth company | ¨ | |||||
If an emerging growth company, indicate by check mark if the registrant has elected not to use the extended transition period for complying with any new or revised financial accounting standards provided pursuant to Section 13(a) of the Exchange Act. ¨
Indicate by check mark whether the registrant is a shell company (as defined in Rule 12b-2 of the Act). Yes ¨ No þ
The number of shares outstanding of the registrant’s common stock at November 1, 2017 were 398,156,921.
WPX Energy, Inc.
Index
Page | |||
Part I. | Financial Information | ||
Item 1. | Financial Statements (Unaudited) | ||
Consolidated Balance Sheets as of September 30, 2017 and December 31, 2016 | |||
Consolidated Statements of Operations for the three and nine months ended September 30, 2017 and 2016 | |||
Consolidated Statements of Changes in Equity for the nine months ended September 30, 2017 | |||
Consolidated Statements of Cash Flows for the nine months ended September 30, 2017 and 2016 | |||
Item 2. | |||
Item 3. | |||
Item 4. | |||
Part II. | Other Information | ||
Item 1. | |||
Item 1A. | |||
Item 2. | |||
Item 3. | |||
Item 4. | |||
Item 5. | |||
Item 6. | |||
Certain matters contained in this report include forward-looking statements that are subject to a number of risks and uncertainties, many of which are beyond our control. These forward-looking statements relate to anticipated financial performance, management’s plans and objectives for future operations, business prospects, outcome of regulatory proceedings, market conditions and other matters.
All statements, other than statements of historical facts, included in this report that address activities, events or developments that we expect, believe or anticipate will exist or may occur in the future, are forward-looking statements. Forward-looking statements can be identified by various forms of words such as “anticipates,” “believes,” “seeks,” “could,” “may,” “should,” “continues,” “estimates,” “expects,” “forecasts,” “intends,” “might,” “goals,” “objectives,” “targets,” “planned,” “potential,” “projects,” “scheduled,” “will” or other similar expressions. These forward-looking statements are based on management’s beliefs and assumptions and on information currently available to management and include, among others, statements regarding:
• | amounts and nature of future capital expenditures; |
• | crude oil, natural gas and NGL prices and demand; |
• | expansion and growth of our business and operations; |
• | financial condition and liquidity; |
• | business strategy; |
• | estimates of proved oil and natural gas reserves; |
• | reserve potential; |
• | development drilling potential; |
• | cash flow from operations or results of operations; |
• | acquisitions or divestitures; and |
2
• | seasonality of our business. |
Forward-looking statements are based on numerous assumptions, uncertainties and risks that could cause future events or results to be materially different from those stated or implied in this report. Many of the factors that will determine these results are beyond our ability to control or predict. Specific factors that could cause actual results to differ from results contemplated by the forward-looking statements include, among others, the following:
• | availability of supplies (including the uncertainties inherent in assessing, estimating, acquiring and developing future oil and natural gas reserves), market demand, volatility of prices and the availability and cost of capital; |
• | inflation, interest rates, fluctuation in foreign exchange and general economic conditions (including future disruptions and volatility in the global credit markets and the impact of these events on our customers and suppliers); |
• | the strength and financial resources of our competitors; |
• | development of alternative energy sources; |
• | the impact of operational and development hazards; |
• | costs of, changes in, or the results of laws, government regulations (including climate change regulation and/or potential additional regulation of drilling and completion of wells), environmental liabilities, litigation and rate proceedings; |
• | changes in maintenance and construction costs; |
• | changes in the current geopolitical situation; |
• | our exposure to the credit risk of our customers; |
• | risks related to strategy and financing, including restrictions stemming from our debt agreements, future changes in our credit ratings and the availability and cost of credit; |
• | risks associated with future weather conditions; |
• | acts of terrorism; |
• | other factors described in “Management’s Discussion and Analysis of Financial Condition and Results of Operations”; and |
• | additional risks described in our filings with the Securities and Exchange Commission (“SEC”). |
All forward-looking statements attributable to us or persons acting on our behalf are expressly qualified in their entirety by the cautionary statements set forth above. Given the uncertainties and risk factors that could cause our actual results to differ materially from those contained in any forward-looking statement, we caution investors not to unduly rely on our forward-looking statements. Forward-looking statements speak only as of the date they are made. We disclaim any obligation to and do not intend to update the above list or to announce publicly the result of any revisions to any of the forward-looking statements to reflect future events or developments, except to the extent required by applicable laws. If we update one or more forward-looking statements, no inference should be drawn that we will make additional updates with respect to those or other forward-looking statements.
In addition to causing our actual results to differ, the factors listed above and referred to below may cause our intentions to change from those statements of intention set forth in this report. Such changes in our intentions may also cause our results to differ. We may change our intentions, at any time and without notice, based upon changes in such factors, our assumptions or otherwise.
Because forward-looking statements involve risks and uncertainties, we caution that there are important factors, in addition to those listed above, that may cause actual results to differ materially from those contained in the forward-looking statements. For a detailed discussion of those factors, see Part I, Item 1A. Risk Factors in our Annual Report on Form 10-K for the year ended December 31, 2016.
3
WPX Energy, Inc.
Consolidated Balance Sheets
(Unaudited)
September 30, 2017 | December 31, 2016 | ||||||
(Millions) | |||||||
Assets | |||||||
Current assets: | |||||||
Cash and cash equivalents | $ | 10 | $ | 496 | |||
Accounts receivable, net of allowance of $1 million as of September 30, 2017 and $3 million as of December 31, 2016 | 268 | 168 | |||||
Derivative assets | 61 | 26 | |||||
Inventories | 42 | 32 | |||||
Assets classified as held for sale (Note 5) | 237 | 12 | |||||
Other | 30 | 20 | |||||
Total current assets | 648 | 754 | |||||
Properties and equipment (successful efforts method of accounting) | 9,675 | 7,986 | |||||
Less—accumulated depreciation, depletion and amortization | (2,291 | ) | (1,829 | ) | |||
Properties and equipment, net | 7,384 | 6,157 | |||||
Derivative assets | 34 | 12 | |||||
Assets classified as held for sale (Note 5) | — | 317 | |||||
Other noncurrent assets | 29 | 24 | |||||
Total assets | $ | 8,095 | $ | 7,264 | |||
Liabilities and Equity | |||||||
Current liabilities: | |||||||
Accounts payable | $ | 369 | $ | 222 | |||
Accrued and other current liabilities | 150 | 301 | |||||
Liabilities associated with assets held for sale (Note 5) | 62 | 2 | |||||
Derivative liabilities | 56 | 152 | |||||
Total current liabilities | 637 | 677 | |||||
Deferred income taxes | 276 | 251 | |||||
Long-term debt, net | 2,859 | 2,575 | |||||
Derivative liabilities | 26 | 63 | |||||
Asset retirement obligations | 37 | 38 | |||||
Liabilities associated with assets held for sale (Note 5) | — | 62 | |||||
Other noncurrent liabilities | 98 | 132 | |||||
Contingent liabilities and commitments (Note 9) | |||||||
Equity: | |||||||
Stockholders’ equity: | |||||||
Preferred stock (100 million shares authorized at $0.01 par value; 4.8 million shares outstanding at September 30, 2017 and December 31, 2016) | 232 | 232 | |||||
Common stock (2 billion shares authorized at $0.01 par value; 398.1 million and 344.7 million shares issued and outstanding at September 30, 2017 and December 31, 2016) | 4 | 3 | |||||
Additional paid-in-capital | 7,476 | 6,803 | |||||
Accumulated deficit | (3,550 | ) | (3,572 | ) | |||
Total stockholders’ equity | 4,162 | 3,466 | |||||
Total liabilities and equity | $ | 8,095 | $ | 7,264 | |||
4
WPX Energy, Inc.
Consolidated Statements of Operations
(Unaudited)
Three months ended September 30, | Nine months ended September 30, | ||||||||||||||
2017 | 2016 | 2017 | 2016 | ||||||||||||
Revenues: | (Millions, except per-share amounts) | ||||||||||||||
Product revenues: | |||||||||||||||
Oil sales | $ | 259 | $ | 139 | $ | 673 | $ | 378 | |||||||
Natural gas sales | 38 | 37 | 122 | 86 | |||||||||||
Natural gas liquid sales | 29 | 12 | 73 | 27 | |||||||||||
Total product revenues | 326 | 188 | 868 | 491 | |||||||||||
Net gain (loss) on derivatives | (106 | ) | 38 | 213 | (59 | ) | |||||||||
Gas management | 4 | 25 | 17 | 172 | |||||||||||
Other | — | — | — | 1 | |||||||||||
Total revenues | 224 | 251 | 1,098 | 605 | |||||||||||
Costs and expenses: | |||||||||||||||
Depreciation, depletion and amortization | 169 | 150 | 487 | 465 | |||||||||||
Lease and facility operating | 58 | 40 | 159 | 123 | |||||||||||
Gathering, processing and transportation | 25 | 19 | 67 | 55 | |||||||||||
Taxes other than income | 26 | 14 | 68 | 41 | |||||||||||
Exploration (Note 5) | 20 | 10 | 80 | 31 | |||||||||||
General and administrative (including equity-based compensation of $7 million, $10 million, $23 million and $25 million for the respective periods) | 42 | 51 | 131 | 159 | |||||||||||
Gas management | 4 | 31 | 17 | 202 | |||||||||||
Net (gain) loss—sales of assets, divestment of transportation contracts or impairment of producing properties (Note 5) | (56 | ) | 227 | (98 | ) | 25 | |||||||||
Other—net | 3 | 10 | 15 | 14 | |||||||||||
Total costs and expenses | 291 | 552 | 926 | 1,115 | |||||||||||
Operating income (loss) | (67 | ) | (301 | ) | 172 | (510 | ) | ||||||||
Interest expense | (48 | ) | (49 | ) | (141 | ) | (159 | ) | |||||||
Loss on extinguishment of debt | (17 | ) | — | (17 | ) | — | |||||||||
Investment income and other | 2 | — | 4 | 1 | |||||||||||
Income (loss) from continuing operations before income taxes | (130 | ) | (350 | ) | 18 | (668 | ) | ||||||||
Provision (benefit) for income taxes | 20 | (132 | ) | (2 | ) | (227 | ) | ||||||||
Income (loss) from continuing operations | (150 | ) | (218 | ) | 20 | (441 | ) | ||||||||
Income (loss) from discontinued operations | 4 | (1 | ) | 2 | 12 | ||||||||||
Net income (loss) | (146 | ) | (219 | ) | 22 | (429 | ) | ||||||||
Less: Dividends on preferred stock | 3 | 4 | 11 | 15 | |||||||||||
Less: Loss on induced conversion of preferred stock | — | 22 | — | 22 | |||||||||||
Net income (loss) available to WPX Energy, Inc. common stockholders | $ | (149 | ) | $ | (245 | ) | $ | 11 | $ | (466 | ) | ||||
Amounts available to WPX Energy, Inc. common stockholders: | |||||||||||||||
Income (loss) from continuing operations | $ | (153 | ) | $ | (244 | ) | $ | 9 | $ | (478 | ) | ||||
Income (loss) from discontinued operations | 4 | (1 | ) | 2 | 12 | ||||||||||
Net income (loss) | $ | (149 | ) | $ | (245 | ) | $ | 11 | $ | (466 | ) | ||||
Basic earnings (loss) per common share: | |||||||||||||||
Income (loss) from continuing operations | $ | (0.39 | ) | $ | (0.72 | ) | $ | 0.02 | $ | (1.58 | ) | ||||
Income (loss) from discontinued operations | 0.01 | — | 0.01 | 0.04 | |||||||||||
Net income (loss) | $ | (0.38 | ) | $ | (0.72 | ) | $ | 0.03 | $ | (1.54 | ) | ||||
Basic weighted-average shares | 398.1 | 341.5 | 394.1 | 302.8 | |||||||||||
Diluted earnings (loss) per common share: | |||||||||||||||
Income (loss) from continuing operations | $ | (0.39 | ) | $ | (0.72 | ) | $ | 0.02 | $ | (1.58 | ) | ||||
Income (loss) from discontinued operations | 0.01 | — | 0.01 | 0.04 | |||||||||||
Net income (loss) | $ | (0.38 | ) | $ | (0.72 | ) | $ | 0.03 | $ | (1.54 | ) | ||||
Diluted weighted-average shares | 398.1 | 341.5 | 396.2 | 302.8 | |||||||||||
5
WPX Energy, Inc.
Consolidated Statements of Changes in Equity
(Unaudited)
WPX Energy, Inc., Stockholders | |||||||||||||||||||
Preferred Stock | Common Stock | Additional Paid-In- Capital | Accumulated Deficit | Total Stockholders’ Equity | |||||||||||||||
Balance at December 31, 2016 | $ | 232 | $ | 3 | $ | 6,803 | $ | (3,572 | ) | $ | 3,466 | ||||||||
Net income | — | — | — | 22 | 22 | ||||||||||||||
Stock-based compensation | — | — | 15 | — | 15 | ||||||||||||||
Issuance of common stock to public, net of offering costs | — | 1 | 669 | — | 670 | ||||||||||||||
Dividends on preferred stock | — | — | (11 | ) | — | (11 | ) | ||||||||||||
Balance at September 30, 2017 | $ | 232 | $ | 4 | $ | 7,476 | $ | (3,550 | ) | $ | 4,162 | ||||||||
See accompanying notes.
6
WPX Energy, Inc.
Consolidated Statements of Cash Flows
(Unaudited)
Nine months ended September 30, | |||||||
2017 | 2016 | ||||||
Operating Activities(a) | (Millions) | ||||||
Net income (loss) | $ | 22 | $ | (429 | ) | ||
Adjustments to reconcile net income (loss) to net cash provided by operating activities: | |||||||
Depreciation, depletion and amortization | 487 | 474 | |||||
Deferred income tax provision (benefit) | 25 | (209 | ) | ||||
Provision for impairment of properties and equipment (including certain exploration expenses) | 138 | 29 | |||||
Net (gain) loss on derivatives in continuing operations | (213 | ) | 59 | ||||
Net settlements related to derivatives in continuing operations | 23 | 260 | |||||
Net loss on derivatives included in discontinued operations | — | 46 | |||||
Amortization of stock-based awards | 24 | 27 | |||||
Loss on extinguishment of debt | 17 | — | |||||
Net gain on sales of assets and divestment of transportation contracts | (157 | ) | (28 | ) | |||
Cash provided (used) by operating assets and liabilities: | |||||||
Accounts receivable | (112 | ) | 147 | ||||
Inventories | (6 | ) | 13 | ||||
Other current assets | (6 | ) | 6 | ||||
Accounts payable | 91 | (79 | ) | ||||
Federal income taxes receivable (payable) | 12 | (33 | ) | ||||
Accrued and other current liabilities | (86 | ) | (92 | ) | |||
Payments on liabilities accrued in 2015 for retained transportation and gathering contracts related to discontinued operations | (40 | ) | (42 | ) | |||
Other, including changes in other noncurrent assets and liabilities | 9 | (35 | ) | ||||
Net cash provided by operating activities(a) | 228 | 114 | |||||
Investing Activities(a) | |||||||
Capital expenditures(b) | (855 | ) | (440 | ) | |||
Proceeds from sales of assets | 34 | 1,140 | |||||
Payments related to divestment of transportation contracts | — | (238 | ) | ||||
Purchase of business | (798 | ) | — | ||||
Purchase of investment | (7 | ) | — | ||||
Other | (2 | ) | (2 | ) | |||
Net cash provided by (used in) investing activities(a) | (1,628 | ) | 460 | ||||
Financing Activities | |||||||
Proceeds from common stock | 671 | 540 | |||||
Dividends paid on preferred stock | (11 | ) | (15 | ) | |||
Payments related to induced conversion of preferred stock to common stock | — | (10 | ) | ||||
Borrowings on credit facility | 471 | 380 | |||||
Payments on credit facility | (186 | ) | (645 | ) | |||
Proceeds from long-term debt, net of discount | 148 | — | |||||
Payments for retirement of long-term debt, including premium | (165 | ) | (230 | ) | |||
Taxes paid for shares withheld | (11 | ) | (5 | ) | |||
Payments for debt issuance costs and credit facility amendment fees | (2 | ) | (3 | ) | |||
Other | (1 | ) | (1 | ) | |||
Net cash provided by financing activities | 914 | 11 | |||||
Net increase (decrease) in cash and cash equivalents | (486 | ) | 585 | ||||
Cash and cash equivalents at beginning of period | 496 | 38 | |||||
Cash and cash equivalents at end of period | $ | 10 | $ | 623 | |||
__________ | |||||||
(a) Amounts reflect continuing and discontinued operations unless otherwise noted. See Note 3 of Notes to Consolidated Financial Statements for discussion of discontinued operations. | |||||||
(b) Increase to properties and equipment | $ | (911 | ) | $ | (424 | ) | |
Changes in related accounts payable and accounts receivable | 56 | (16 | ) | ||||
Capital expenditures | $ | (855 | ) | $ | (440 | ) | |
See accompanying notes.
7
WPX Energy, Inc.
Notes to Consolidated Financial Statements
Note 1. Description of Business and Basis of Presentation
Description of Business
Operations of our company include oil, natural gas and NGL development and production primarily located in Texas, North Dakota, New Mexico and Colorado. We specialize in development and production from tight-sands and shale formations in the Delaware, Williston and San Juan Basins. Associated with our commodity production are sales and marketing activities, referred to as gas management activities, that include oil and natural gas purchased from third-party working interest owners in operated wells and the management of various commodity contracts, such as transportation and related derivatives.
In June 2017, we signed an agreement with Howard Energy Partners (“Howard”) to jointly develop oil gathering and natural gas processing infrastructure in the Stateline area of the Delaware Basin. Under the terms of the agreement, WPX and Howard will each have a 50 percent voting interest in the joint venture and Howard will serve as operator. At closing, WPX will contribute crude oil gathering and natural gas processing assets already in service and/or under construction, with a net book value of approximately $56 million as of September 30, 2017, and will receive a special cash distribution of $300 million plus capital expenditures in 2017. Howard will contribute $300 million in cash at closing and is obligated to fund the first $263 million of joint venture capital expenditures, including a $132 million carry for WPX. This transaction closed on October 18, 2017 and we received the $300 million special distribution plus $49 million for capital expenditures in 2017. We expect to account for this joint venture as an equity method investment. In connection with the joint venture, the company will dedicate its current and future leasehold interest in the Stateline area, representing 50,000 net acres in the Delaware Basin, pursuant to 20 year fixed-fee oil gathering and natural gas processing agreements. However, the agreements do not include any minimum volume commitments.
In addition, we have sold other operations which are reported as discontinued operations, as discussed below.
The consolidated businesses represented herein as WPX Energy, Inc. is also referred to as “WPX,” the “Company,” “we,” “us” or “our.”
Basis of Presentation
The accompanying interim consolidated financial statements do not include all the notes included in our annual financial statements and, therefore, should be read in conjunction with the consolidated financial statements and notes thereto for the year ended December 31, 2016 in the Company’s Annual Report on Form 10-K. The accompanying interim consolidated financial statements include all normal recurring adjustments that, in the opinion of management, are necessary to present fairly our financial position at September 30, 2017, results of operations for the three and nine months ended September 30, 2017 and 2016, changes in equity for the nine months ended September 30, 2017 and cash flows for the nine months ended September 30, 2017 and 2016. The Company has no elements of comprehensive income (loss) other than net income (loss).
The preparation of financial statements in conformity with accounting principles generally accepted in the United States requires management to make estimates and assumptions that affect the amounts reported in the consolidated financial statements and accompanying notes. Actual results could differ from those estimates.
Our continuing operations comprise a single business segment, which includes the development, production and gas management activities of oil, natural gas and NGLs in the United States.
Discontinued Operations
See Note 3 for a discussion of discontinued operations. Unless indicated otherwise, the information in the Notes to Consolidated Financial Statements relates to continuing operations. Additionally, see Note 9 for a discussion of contingencies related to the former power business of The Williams Companies, Inc. (“Williams”) (most of which was disposed of in 2007).
Recently Adopted Accounting Standards
In March 2016, the Financial Accounting Standards Board (“FASB”) issued Accounting Standards Update (“ASU”) 2016-09, Improvements to Employee Share-Based Payment Accounting, as part of the Simplification Initiative. The areas for simplification in ASU 2016-09 involve several aspects of the accounting for share-based payment transactions, including the income tax consequences, classification of awards as either equity or liabilities, and classification on the statement of cash flows. ASU 2016-09 is required for annual periods beginning after December 15, 2016. Under ASU 2016-09, on a prospective basis, companies will no longer record excess tax benefits and deficiencies in additional paid in capital. Instead, excess tax benefits and deficiencies will be recognized as income tax expense or benefit on the statement of operations. Other portions of the standard are adopted using either a prospective, retrospective, or modified retrospective approach depending on the topic covered in the standard. The Company adopted this guidance effective January 1, 2017 which impacted (a) our income tax
8
WPX Energy, Inc.
Notes to Consolidated Financial Statements — (Continued)
provision in 2017 due to the tax deficiency recognized for tax and (b) the operating and financing activities sections of our Consolidated Statement of Cash Flows to reflect tax payments related to shares withheld for taxes. Cash outflows of $11 million and $5 million for the nine months ended September 30, 2017 and 2016, respectively, would have been included in operating activities under previous guidance, but are now reflected in financing activities.
Accounting Standards Not Yet Adopted
In May 2014, the FASB issued ASU 2014-09, Revenue from Contracts with Customers, and has updated it with additional ASUs. The core principle of the guidance in ASU 2014-09 is that an entity should recognize revenue to depict the transfer of promised goods or services to customers in an amount that reflects the consideration to which the entity expects to be entitled in exchange for those goods or services. ASU 2014-09, as amended, is effective for annual reporting periods beginning after December 15, 2017, including interim periods within that reporting period. The FASB will permit companies to adopt the new standard early, but not before the original effective date of annual reporting periods beginning after December 15, 2016. ASU 2014-09 can be applied using either a full retrospective method, meaning the standard is applied to all of the periods presented, or a modified retrospective method, meaning the cumulative effect of initially applying the standard is recognized in the most current period presented in the financial statements.
In 2016, we performed an initial assessment of the impact of ASU 2014-09 with the assistance of an outside consultant. Our assessment was based on a bottoms-up approach, in which we analyzed our existing contracts and current accounting policies and practices to identify potential differences that would result from applying the requirements of the new standard to our contracts. In 2017, we further documented our conclusions around the impact of the standard to our business processes, systems or controls to support recognition and disclosure under the new standard. Our findings and progress toward implementation of the standard are periodically reported to management.
Currently, we do not expect the impact of adopting ASU 2014-09 to be material to our total net revenues and operating income (loss) or to our consolidated balance sheet because our performance obligations, which determine when and how revenue is recognized, are not materially changed under the new standard; thus, revenue associated with the majority of our contracts will continue to be recognized as control of products is transferred to the customer. We will adopt this standard on January 1, 2018 and, based on our evaluation to date, we anticipate using the modified retrospective method. We have finalized the majority of our documentation and assessment of the impact of the standard on our financial results and related disclosures and anticipate minimal adjustments to our disclosures in future filings from the adoption of this standard.
In February 2016, the FASB issued ASU 2016-02, Leases, to increase transparency and comparability among organizations by recognizing right-of-use assets and lease payment liabilities on the balance sheet and disclosing key information about leasing arrangements. Under ASU 2016-02, a determination is to be made at the inception of a contract as to whether the contract is, or contains, a lease. Leases convey the right to control the use of an identified asset in exchange for consideration. Only the lease components of a contract must be accounted for in accordance with this ASU. Non-lease components, such as activities that transfer a good or service to the customer, shall be accounted for under other applicable Topics. ASU 2016-02 permits lessees to make policy elections to not recognize lease assets and liabilities for leases with terms of less than twelve months and/or to not separate lease and non-lease components and account for the non-lease components together with the lease components as a single lease component. Based on an initial review of the new guidance and the Company’s current commitments, the Company anticipates it may be required to recognize right-of-use assets and lease payment liabilities related to drilling rig commitments, certain equipment leases, and potentially other arrangements, the effects of which cannot be estimated at this time. ASU 2016-02 is effective for fiscal years beginning after December 15, 2018, including interim periods within those fiscal years. Early adoption is permitted for any entity in any interim or annual period. The Company continues to evaluate the impact of ASU 2016-02 to the Company’s Consolidated Financial Statements or related disclosures.
In November 2016, the FASB issued ASU 2016-18, Statement of Cash Flows (Topic 230): Restricted Cash, which will require entities to show the changes in the total of cash, cash equivalents, restricted cash and restricted cash equivalents in the statement of cash flows. When cash, cash equivalents, restricted cash and restricted cash equivalents are presented in more than one line item on the balance sheet, the new guidance requires a reconciliation of the totals in the statement of cash flows to the related captions in the balance sheet. This reconciliation can be presented either on the face of the statement of cash flows or in the notes to the financial statements. ASU 2016-18 is effective for fiscal years beginning after December 15, 2017, and interim periods within those years. Early adoption in an interim period is permitted, but any adjustments must be reflected as of the beginning of the fiscal year that includes that interim period. Restricted cash was approximately $13 million and $10 million as of September 30, 2017 and December 31, 2016, respectively. The Company does not expect any significant impact on its consolidated statement of cash flows from the adoption of the standard.
In January 2017, FASB issued ASU 2017-01, Business Combinations, clarifying the definition of a business to assist entities with evaluating whether transactions should be accounted for as acquisitions (or disposals) of assets or businesses. ASU 2017-01 is effective for fiscal years beginning after December 15, 2017, and interim periods within those years.
9
WPX Energy, Inc.
Notes to Consolidated Financial Statements — (Continued)
In February 2017, the FASB issued ASU 2017-05, Other Income - Gains and Losses from the Derecognition of Nonfinancial Assets (Subtopic 610-20): Clarifying the Scope of Asset Derecognition Guidance and Accounting for Partial Sales of Nonfinancial Assets. This ASU clarifies the scope and application of ASC 610-20 on the sale or transfer of nonfinancial assets and in substance nonfinancial assets to noncustomers, including partial sales. The amendments are effective at the same time as the new revenue standard. For public entities, the amendments are effective for annual reporting periods beginning after December 15, 2017, including interim reporting periods within that reporting period. Early adoption is permitted. The Company does not expect any significant impact on its consolidated financial statements from the adoption of the standard.
In May 2017, the FASB issued ASU 2017-09, Compensation - Stock Compensation (Topic 718). The amendments in this Update provide guidance about which changes to the terms or conditions of a share-based payment award require an entity to apply modification accounting in Topic 718. The amendments in this Update are effective for all entities for annual periods, and interim periods within those annual periods, beginning after December 15, 2017. Early adoption is permitted, including adoption in any interim period. The Company does not expect any significant impact on its consolidated financial statements from the adoption of the standard.
In August 2017, the FASB issued ASU 2017-12, Derivatives and Hedging (Topic 815). This ASU provides guidance for various components of hedge accounting including hedge ineffectiveness, the expansion of types of permissible hedging strategies, reduced complexity in the application of the long-haul method for fair value hedges and reduced complexity in assessment of effectiveness. The amendments in this Update are effective for public entities for annual periods, and interim periods within those annual periods, beginning after December 15, 2018. Early adoption is permitted, including adoption in any interim period. The Company does not expect any significant impact on its consolidated financial statements from the adoption of this standard unless we apply hedge accounting in a future period.
Note 2. Acquisition
On January 12, 2017, we signed an agreement to acquire certain assets from Panther Energy Company II, LLC and Carrier Energy Partners, LLC (the “Panther Acquisition”) for $775 million, subject to post-closing adjustments. The transaction closed in March 2017 for $798 million including estimated closing adjustments. The assets, as of the closing date, include 25 producing wells (18 horizontals), three drilled but uncompleted horizontal laterals, approximately 18,000 net acres and more than 900 gross undeveloped locations in the Delaware Basin. As of September 30, 2017, we estimate that approximately $599 million of the purchase price is allocable to unproved properties and approximately $200 million is allocable to proved properties and facilities. This estimate is based on discounted cash flow models, which include estimates and assumptions such as future commodity prices, projections of estimated quantities of oil and natural gas reserves, expectations for timing and amount of future development and operating costs, projections of future rates of production, expected recovery rates, and risk adjusted discount rates. These assumptions represent Level 3 inputs. At the time of the acquisition closing, production was approximately 10,000 Boe per day. The impact of this acquisition to prior periods is not material to our results of operations for those periods.
Note 3. Discontinued Operations
On February 8, 2016, we signed an agreement with Terra Energy Partners LLC to sell WPX Energy Rocky Mountain, LLC that held our Piceance Basin operations. The parties closed this sale in April of 2016 for proceeds of $862 million. The amounts in the table below for 2016 primarily relate to the Piceance Basin. The income from discontinued operations for the three and nine months ended September 30, 2017 on the Consolidated Statement of Operations primarily relates to $10 million of Piceance Basin severance tax refunds for prior years that were received in third-quarter 2017. The refund was offset by continued accretion on retained transportation and gathering contracts related to Powder River Basin assets that were sold in 2015.
10
WPX Energy, Inc.
Notes to Consolidated Financial Statements — (Continued)
Summarized Results of Discontinued Operations
Three months ended September 30, 2016 | Nine months ended September 30, 2016 | ||||||
(Millions) | |||||||
Total revenues(a) | $ | — | $ | 64 | |||
Costs and expenses: | |||||||
Depreciation, depletion and amortization | $ | — | $ | 9 | |||
Lease and facility operating | — | 18 | |||||
Gathering, processing and transportation | 1 | 49 | |||||
Taxes other than income | 1 | 2 | |||||
General and administrative | 1 | 9 | |||||
Other—net | (2 | ) | 4 | ||||
Total costs and expenses | 1 | 91 | |||||
Operating loss | (1 | ) | (27 | ) | |||
Gain on sale of assets | 1 | 53 | |||||
Income from discontinued operations before income taxes | — | 26 | |||||
Income tax provision(b) | 1 | 14 | |||||
Income (loss) from discontinued operations | $ | (1 | ) | $ | 12 | ||
__________
(a) The nine months ended September 30, 2016 include $33 million net loss on derivatives.
(b) The nine months ended September 30, 2016 includes a valuation allowance on certain state tax carryovers.
Cash Flows Attributable to Discontinued Operations
Excluding income taxes and changes to working capital, total cash provided by discontinued operations was $28 million for the nine months ended September 30, 2016. In addition, cash outflows related to previous accruals for the Powder River Basin gathering and transportation contracts retained by WPX were $40 million and $42 million for the nine months ended September 30, 2017 and 2016, respectively. Total cash used in investing activities related to discontinued operations was $32 million for the nine months ended September 30, 2016.
11
WPX Energy, Inc.
Notes to Consolidated Financial Statements — (Continued)
Note 4. Earnings (Loss) Per Common Share from Continuing Operations
The following table summarizes the calculation of earnings per share.
Three months ended September 30, | Nine months ended September 30, | ||||||||||||||
2017 | 2016 | 2017 | 2016 | ||||||||||||
(Millions, except per-share amounts) | |||||||||||||||
Income (loss) from continuing operations | $ | (150 | ) | $ | (218 | ) | $ | 20 | $ | (441 | ) | ||||
Less: Dividends on preferred stock | 3 | 4 | 11 | 15 | |||||||||||
Less: Loss on induced conversion of preferred stock | — | 22 | — | 22 | |||||||||||
Income (loss) from continuing operations available to WPX Energy, Inc. common stockholders for basic and diluted earnings (loss) per common share | $ | (153 | ) | $ | (244 | ) | $ | 9 | $ | (478 | ) | ||||
Basic weighted-average shares | 398.1 | 341.5 | 394.1 | 302.8 | |||||||||||
Effect of dilutive securities(a): | |||||||||||||||
Nonvested restricted stock units and awards | — | — | 1.9 | — | |||||||||||
Stock options | — | — | 0.2 | — | |||||||||||
Diluted weighted-average shares | 398.1 | 341.5 | 396.2 | 302.8 | |||||||||||
Earnings (loss) per common share from continuing operations: | |||||||||||||||
Basic | $ | (0.39 | ) | $ | (0.72 | ) | $ | 0.02 | $ | (1.58 | ) | ||||
Diluted | $ | (0.39 | ) | $ | (0.72 | ) | $ | 0.02 | $ | (1.58 | ) | ||||
__________
(a) The following table includes amounts that have been excluded from the computation of diluted earnings (loss) per common share as their inclusion would be antidilutive due to our loss from continuing operations attributable to WPX Energy, Inc. available to common stockholders. Additionally, 23.8 million common shares issuable upon assumed conversion of 6.25% Series A mandatory convertible preferred stock have been excluded from the computation of diluted earnings per share for all periods presented as their inclusion would be antidilutive due to application of the if-converted method.
Three months ended September 30, | Nine months ended September 30, | ||||||||||
2017 | 2016 | 2017 | 2016 | ||||||||
(Millions) | |||||||||||
Weighted-average nonvested restricted stock units and awards | 1.6 | 2.4 | — | 1.8 | |||||||
Weighted-average stock options | 0.1 | — | — | — | |||||||
The table below includes information related to stock options that were outstanding at September 30, 2017 and 2016 but have been excluded from the computation of weighted-average stock options due to the option exercise price exceeding the third quarter weighted-average market price of our common shares.
September 30, | |||||||
2017 | 2016 | ||||||
Options excluded (millions) | 1.9 | 2.4 | |||||
Weighted-average exercise price of options excluded | $ | 16.69 | $ | 16.46 | |||
Exercise price range of options excluded | $11.75 - $21.81 | $11.75 - $21.81 | |||||
Third quarter weighted-average market price | $ | 10.23 | $ | 11.11 | |||
The diluted weighted-average shares excludes the effect of approximately 2.0 million and 0.1 million nonvested restricted stock units for the nine months ended September 30, 2017 and 2016, respectively. These restricted stock units were antidilutive under the treasury stock method.
12
WPX Energy, Inc.
Notes to Consolidated Financial Statements — (Continued)
Note 5. Asset Sales, Impairments and Exploration Expenses
Asset Sales and Impairments
2017
In the third quarter of 2017, we began a process to market our natural gas-producing properties in the San Juan Basin and our Board of Directors approved a divestment subject to a minimum price. These assets and liabilities were classified as held for sale on the Consolidated Balance Sheets at September 30, 2017 and December 31, 2016. Following the marketing process, we received several acceptable bids. As a result, we determined the estimated fair value, less costs to sell, based on the probability-weighted cash flows of expected proceeds and compared it to our net book value at September 30, 2017 which resulted in an impairment of $60 million recorded in third-quarter 2017. On October 26, 2017, we signed an agreement to sell the properties for $169 million, subject to closing adjustments, and expect to close by the end of 2017.
Net gain on sales of assets for the three and nine months ended September 30, 2017 includes gains from exchanges of leasehold acreage in the Permian Basin and $48 million and $56 million, respectively, from the recognition of deferred gains related to the completion of commitments from the sales of gathering systems in prior years. Net gain on sales of assets for the nine months ended September 30, 2017 also includes $8 million recognized on the sales of certain Green River Basin and Appalachian Basin assets.
In conjunction with exchanges of leasehold, we estimated the fair value of the leasehold through discounted cash flow models and consideration of market data. Our estimates and assumptions include future commodity prices, projection of estimated quantities of oil and natural gas reserves, expectations for future development and operating costs and risk adjusted discount rates, all of which are Level 3 inputs.
2016
During July 2016, we completed the divestment of the remaining transportation contracts primarily related to our Piceance Basin operations which eliminated certain pipeline capacity obligations held by our marketing company, which were not included in the Piceance Basin divestment to Terra. As a result of the divestments and net payment of $238 million, we recorded a net loss of $238 million in third-quarter 2016.
On March 9, 2016, we completed the sale of our San Juan Basin gathering system for consideration of approximately $309 million. The consideration reflected $285 million in cash, subject to closing adjustments, and a commitment estimated at $24 million in capital designated by the purchaser to expand the system to support WPX's development in the Gallup oil play. We were obligated to complete certain in-progress construction as of the closing which resulted in the deferral of a portion of the gain. As a result of this transaction, we recorded a gain of $199 million in first-quarter 2016 and additional gains of $5 million and $11 million in the second and third quarters of 2016, respectively, as certain in-progress construction was completed.
Exploration Expenses
The following table presents a summary of exploration expenses.
Three months ended September 30, | Nine months ended September 30, | ||||||||||||||
2017 | 2016 | 2017 | 2016 | ||||||||||||
(Millions) | |||||||||||||||
Unproved leasehold property impairment, amortization and expiration | $ | 20 | $ | 9 | $ | 78 | $ | 28 | |||||||
Geologic and geophysical costs | — | 1 | 2 | 2 | |||||||||||
Dry hole costs | — | — | — | 1 | |||||||||||
Total exploration expenses | $ | 20 | $ | 10 | $ | 80 | $ | 31 | |||||||
Unproved leasehold property impairment, amortization and expiration for the nine months ended September 30, 2017 includes costs in excess of the accumulated amortization balance associated with certain leases in the Permian Basin that expired during the first quarter of 2017. These leases were renewed in second-quarter 2017.
13
WPX Energy, Inc.
Notes to Consolidated Financial Statements — (Continued)
Note 6. Inventories
The following table presents a summary of our inventories as of the dates indicated below.
September 30, 2017 | December 31, 2016 | ||||||
(Millions) | |||||||
Material, supplies and other | $ | 39 | $ | 30 | |||
Crude oil production in transit | 3 | 2 | |||||
Total inventories | $ | 42 | $ | 32 | |||
During the third quarter of 2016, we recorded an impairment of material and supplies inventory of approximately $4 million.
Note 7. Debt and Banking Arrangements
The following table presents a summary of our debt as of the dates indicated below.
September 30, 2017 | December 31, 2016 | ||||||
(Millions) | |||||||
Credit facility agreement | $ | 285 | $ | — | |||
7.500% Senior Notes due 2020 | 350 | 500 | |||||
6.000% Senior Notes due 2022 | 1,100 | 1,100 | |||||
8.250% Senior Notes due 2023 | 500 | 500 | |||||
5.250% Senior Notes due 2024 | 650 | 500 | |||||
Other | — | 1 | |||||
Total long-term debt | $ | 2,885 | $ | 2,601 | |||
Less: Debt issuance costs on long-term debt(a) | 26 | 26 | |||||
Total long-term debt, net(a) | $ | 2,859 | $ | 2,575 | |||
__________
(a) Debt issuance costs related to our Credit Facility are recorded in other noncurrent assets on the Consolidated Balance Sheets.
Our $1.2 billion senior secured revolving credit facility (“Credit Facility”) has a maturity date of October 28, 2019. As of September 30, 2017, we had $285 million borrowed and $75 million of letters of credit issued under the Credit Facility and we were in compliance with our financial covenants with full access to the Credit Facility. Subsequent to September 30, 2017, we repaid all of the outstanding loans on our revolving credit facility with proceeds received from the closing of the Howard transaction.
During a Collateral Trigger Period, loans under the Credit Facility are subject to a Borrowing Base as calculated in accordance with the provisions of the Credit Facility. As of December 31, 2016, the Borrowing Base was $1.025 billion. The Borrowing Base was increased to $1.2 billion in April 2017. In October 2017, the Borrowing Base was increased to 1.5 billion which will remain in effect until the next Redetermination Date as set forth in the Credit Facility Agreement. At this time, the Credit Facility Agreement is limited by the total commitments on the Credit Facility which remained at $1.2 billion. The Borrowing Base is recalculated at least every six months per the terms of the Credit Facility.
During third-quarter 2017, we issued an additional $150 million of our 5.25% senior notes due 2024. The proceeds were used to fund the tender offer of $150 million of our 7.50% senior notes due 2020. As a result, we recorded a loss on extinguishment of debt of $17 million.
See our Annual Report on Form 10-K for the year ended December 31, 2016 for additional discussion related to our Credit Facility and our senior notes.
14
WPX Energy, Inc.
Notes to Consolidated Financial Statements — (Continued)
Note 8. Provision (Benefit) for Income Taxes
The following table presents the provision (benefit) for income taxes from continuing operations.
Three months ended September 30, | Nine months ended September 30, | ||||||||||||||
2017 | 2016 | 2017 | 2016 | ||||||||||||
(Millions) | |||||||||||||||
Current: | |||||||||||||||
Federal | $ | (27 | ) | $ | — | $ | (27 | ) | $ | — | |||||
State | — | (5 | ) | — | (5 | ) | |||||||||
(27 | ) | (5 | ) | (27 | ) | (5 | ) | ||||||||
Deferred: | |||||||||||||||
Federal | (12 | ) | (117 | ) | 39 | (236 | ) | ||||||||
State | 59 | (10 | ) | (14 | ) | 14 | |||||||||
47 | (127 | ) | 25 | (222 | ) | ||||||||||
Total provision (benefit) | $ | 20 | $ | (132 | ) | $ | (2 | ) | $ | (227 | ) | ||||
The effective income tax rate for the three months ended September 30, 2017, differs from the federal statutory rate due to the effect of state income taxes and other permanent items, as applied by ASC 740 interim period allocation methodology based on an estimated full year pre-tax loss.
The effective income tax rate for the nine months ended September 30, 2017, differs from the federal statutory rate due to the effect of state income taxes such as the decrease of the blended state income tax rate due to changes in state apportionment factors resulting from increased presence in the Delaware Basin operations in Texas following the Panther Acquisition (see Note 2), the impact of ASU 2016-09 (see Note 1), and other permanent items, as applied by ASC 740 interim period allocation methodology based on an estimated full year pre-tax loss.
The effective income tax rate for the three months ended September 30, 2016, differs from the federal statutory rate due to the effects of state income taxes.
The effective income tax rate for the nine months ended September 30, 2016, differs from the federal statutory rate due to state tax adjustments resulting from the sale of our Piceance Basin operations in Colorado. In 2016, we recorded $8 million of valuation allowances against Colorado state tax loss and credit carryovers generated in prior years. We also increased our blended state income tax rate by less than one half percent to reflect changes in our then expected future apportionment among the states where we operate which resulted in a $14 million increase of our deferred tax liability as of the beginning of the year.
We have recorded valuation allowances against deferred tax assets attributable primarily to certain state net operating loss (“NOL”) carryovers as well as our federal capital loss carryover. When assessing the need for a valuation allowance, we primarily consider future reversals of existing taxable temporary differences. To a lesser extent we may also consider future taxable income exclusive of reversing temporary differences and carryovers, and tax-planning strategies that would, if necessary, be implemented to accelerate taxable amounts to utilize expiring carryovers. The ultimate amount of deferred tax assets realized could be materially different from those recorded, as influenced by future operational performance, potential changes in jurisdictional income tax laws and other circumstances surrounding the actual realization of related tax assets. Valuation allowances that we have recorded are due to our expectation that we will not have sufficient income, or income of a sufficient character, in those jurisdictions to which the associated deferred tax asset applies. We have not recorded a valuation allowance against our federal NOL carryover, but a valuation allowance could be required in future periods if the federal NOL carryover continues to increase or circumstances change. When assessing the need for a valuation allowance for the federal NOL carryover, we primarily consider future reversals of existing taxable temporary differences.
The ability of WPX to utilize loss carryovers or minimum tax credits to reduce future federal taxable income and income tax could be subject to limitations under the Internal Revenue Code. The utilization of such carryovers may be limited upon the occurrence of certain ownership changes during any three-year period resulting in an aggregate change of more than 50 percent in beneficial ownership (an “Ownership Change”). As of September 30, 2017, we do not believe that an Ownership Change has occurred for WPX, but an Ownership Change did occur for RKI effective with the acquisition. Therefore, there is an annual limitation on the benefit that WPX can claim from RKI carryovers that arose prior to the acquisition.
Pursuant to our tax sharing agreement with Williams, we remain responsible for the tax from audit adjustments related to our business for periods prior to our spin-off from Williams on December 31, 2011. The 2011 consolidated tax filing by Williams is currently being audited by the IRS and is the only pre spin-off period for which we continue to have exposure to
15
WPX Energy, Inc.
Notes to Consolidated Financial Statements — (Continued)
audit adjustments as part of Williams. The IRS has recently proposed an adjustment related to our business for which a payment to Williams could be required. We are currently evaluating the issue and expect to protest the adjustment within the normal appeals process of the IRS. Based on the IRS position and underlying arguments available to us at this time, we do not believe reserve accruals are necessary. In addition, the alternative minimum tax credit deferred tax asset that was allocated to us by Williams at the time of the spin-off could change due to audit adjustments unrelated to our business. Any such adjustment to this deferred tax asset will not be known until the IRS examination is completed, but is not expected to result in a cash settlement.
As of September 30, 2017, the Company had no significant unrecognized tax benefits. During the next 12 months, we do not expect ultimate resolution of any uncertain tax position will result in a significant increase or decrease of an unrecognized tax benefit.
Note 9. Contingent Liabilities and Commitments
Royalty litigation
In October 2011, a potential class of royalty interest owners in New Mexico and Colorado filed a complaint against us in the County of Rio Arriba, New Mexico. The complaint presently alleges failure to pay royalty on hydrocarbons including drip condensate, breach of the duty of good faith and fair dealing, fraudulent concealment, conversion, misstatement of the value of gas and affiliated sales, breach of duty to market hydrocarbons in Colorado, breach of implied duty to market, violation of the New Mexico Oil and Gas Proceeds Payment Act, and bad faith breach of contract. Plaintiffs sought monetary damages and a declaratory judgment enjoining activities relating to production, payments and future reporting. This matter was removed to the United States District Court for New Mexico where the court denied plaintiffs’ motion for class certification. In March 2017, plaintiffs appealed the denial of class certification to the Tenth Circuit. In August 2012, a second potential class action was filed against us in the United States District Court for the District of New Mexico by mineral interest owners in New Mexico and Colorado. Plaintiffs claim breach of contract, breach of the covenant of good faith and fair dealing, breach of implied duty to market both in Colorado and New Mexico and violation of the New Mexico Oil and Gas Proceeds Payment Act, and seek declaratory judgment, accounting and injunctive relief. On August 16, 2016, the court denied plaintiffs’ motion for class certification. On September 15, 2016, plaintiffs filed their motion for reconsideration and filed a second motion for class certification, and on September 30, 2017, the Court issued its memorandum opinion and order denying the plaintiffs motion for reconsideration and their Second Motion for Class Certification. At this time, we believe that our royalty calculations have been properly determined in accordance with the appropriate contractual arrangements and applicable laws. We do not have sufficient information to calculate an estimated range of exposure related to these claims.
Other producers have been pursuing administrative appeals with a federal regulatory agency and have been in discussions with a state agency in New Mexico regarding certain deductions, comprised primarily of processing, treating and transportation costs, used in the calculation of royalties. Although we are not a party to those matters, we are monitoring them to evaluate whether their resolution might have the potential for unfavorable impact on our results of operations. Certain outstanding issues in those matters could be material to us. We received notice from the U.S. Department of Interior Office of Natural Resources Revenue (“ONRR”) in the fourth quarter of 2010, intending to clarify the guidelines for calculating federal royalties on conventional gas production applicable to many of our federal leases in New Mexico. The guidelines for New Mexico properties were revised slightly in September 2013 as a result of additional work performed by the ONRR. The revisions did not change the basic function of the original guidance. The ONRR’s guidance provides its view as to how much of a producer’s bundled fees for transportation and processing can be deducted from the royalty payment. We believe using these guidelines would not result in a material difference in determining our historical federal royalty payments for our leases in New Mexico. Similar guidelines were recently issued for certain leases in Colorado and, as in the case of the New Mexico guidelines, we do not believe that they will result in a material difference to our historical federal royalty payments. ONRR has asked producers to attempt to evaluate the deductibility of these fees directly with the midstream companies that transport and process gas.
Environmental matters
The Environmental Protection Agency (“EPA”), other federal agencies, and various state and local regulatory agencies and jurisdictions routinely promulgate and propose new rules, and issue updated guidance to existing rules. These new rules and rulemakings include, but are not limited to, new air quality standards for ground level ozone, methane, green completions, and hydraulic fracturing and water standards. We are unable to estimate the costs of asset additions or modifications necessary to comply with these new regulations due to uncertainty created by the various legal challenges to these regulations and the need for further specific regulatory guidance.
16
WPX Energy, Inc.
Notes to Consolidated Financial Statements — (Continued)
Matter related to Williams’ former power business
In connection with a Separation and Distribution Agreement between WPX and Williams, Williams is obligated to indemnify and hold us harmless from any losses arising out of liabilities assumed by us for the pending litigation described below relating to the reporting of certain natural gas-related information to trade publications.
Civil suits based on allegations of manipulating published gas price indices have been brought against us and others, seeking unspecified amounts of damages. We are currently a defendant in class action litigation and other litigation originally filed in state court in Colorado, Kansas, Missouri and Wisconsin and brought on behalf of direct and indirect purchasers of natural gas in those states. These cases were transferred to the federal court in Nevada. In 2008, the court granted summary judgment in the Colorado case in favor of us and most of the other defendants based on plaintiffs’ lack of standing. On January 8, 2009, the court denied the plaintiffs’ request for reconsideration of the Colorado dismissal and entered judgment in our favor.
In the other cases, on July 18, 2011, the Nevada district court granted our joint motions for summary judgment to preclude the plaintiffs’ state law claims because the federal Natural Gas Act gives the Federal Energy Regulatory Commission exclusive jurisdiction to resolve those issues. The court also denied the plaintiffs’ class certification motion as moot. The plaintiffs appealed to the United States Court of Appeals for the Ninth Circuit. On April 10, 2013, the United States Court of Appeals for the Ninth Circuit issued its opinion in the In re: Western States Wholesale Antitrust Litigation, holding that the Natural Gas Act does not preempt the plaintiffs’ state antitrust claims and reversing the summary judgment previously entered in favor of the defendants. The U.S. Supreme Court granted Defendants’ writ of certiorari. On April 21, 2015, the U.S. Supreme Court determined that the state antitrust claims are not preempted by the federal Natural Gas Act. On March 7, 2016, the putative class plaintiffs in several of the cases filed their motions for class certification. On March 30, 2017, the court denied the motions for class certification, which decision was appealed on June 20, 2017. On May 24, 2016, in Reorganized FLI Inc. v. Williams Companies, Inc., the Court granted Defendants’ Motion for Summary Judgment in its entirety, and an agreed amended judgment was entered by the court on January 4, 2017. The parties have filed numerous motions for summary judgment, reconsideration and remand, and there are currently two appeals before the Ninth Circuit. Because of the uncertainty around pending unresolved issues, including an insufficient description of the purported classes and other related matters, we cannot reasonably estimate a range of potential exposure at this time.
Other Indemnifications
Pursuant to various purchase and sale agreements relating to divested businesses and assets, including the agreement pursuant to which we divested our Piceance Basin operations, we have indemnified certain purchasers against liabilities that they may incur with respect to the businesses and assets acquired from us. The indemnities provided to the purchasers are customary in sale transactions and are contingent upon the purchasers incurring liabilities that are not otherwise recoverable from third parties. The indemnities generally relate to breaches of representations and warranties, tax liabilities, historic litigation, personal injury, environmental matters and rights-of-way. The indemnity provided to the purchaser of the entity that held our Piceance Basin operations relates in substantial part to liabilities arising in connection with litigation over the appropriate calculation of royalty payments. Plaintiffs in that litigation have asserted claims regarding, among other things, the method by which we took transportation costs into account when calculating royalty payments.
As of September 30, 2017, we have not received a claim against any of these indemnities and thus have no basis from which to estimate any reasonably possible loss beyond any amount already accrued. Further, we do not expect any of the indemnities provided pursuant to the sales agreements to have a material impact on our future financial position. However, if a claim for indemnity is brought against us in the future, it may have a material adverse effect on our results of operations in the period in which the claim is made.
In connection with the separation from Williams, we agreed to indemnify and hold Williams harmless from any losses resulting from the operation of our business or arising out of liabilities assumed by us. Similarly, Williams has agreed to indemnify and hold us harmless from any losses resulting from the operation of its business or arising out of liabilities assumed by it.
Summary
As of September 30, 2017 and December 31, 2016, respectively, the Company had accrued approximately $11 million and $13 million for loss contingencies associated with royalty litigation and other contingencies. In certain circumstances, we may be eligible for insurance recoveries, or reimbursement from others. Any such recoveries or reimbursements will be recognized only when realizable.
Management, including internal counsel, currently believes that the ultimate resolution of the foregoing matters, taken as a whole and after consideration of amounts accrued, insurance coverage, recovery from customers or other indemnification
17
WPX Energy, Inc.
Notes to Consolidated Financial Statements — (Continued)
arrangements, is not expected to have a materially adverse effect upon our future liquidity or financial position; however, it could be material to our results of operations in any given year.
Commitments
During the second quarter of 2017, we signed long-term transportation agreements that will ultimately provide 300,000 MMBtu per day (15 years) and 200,000 MMBtu per day (11 years) of natural gas capacity from our Delaware Basin properties in the Stateline area to markets in Texas. One of the agreements allows us the option to increase our capacity over time by 200,000 MMBtu per day to a total of 500,000 MMBtu per day. Total commitments related to these agreements, excluding the option, were approximately $337 million as of September 30, 2017.
Note 10. Stockholders’ Equity
On January 12, 2017, we completed an underwritten public offering of 51.675 million shares of our common stock, which included 6.675 million shares of common stock issued pursuant to an option granted to the underwriters to purchase additional shares. The stock was sold to the underwriters at $12.97 per share and we received proceeds of approximately $670 million from the sale of these shares of common stock, net of offering expenses and underwriting discounts and commissions.
On July 20, 2016, we entered into conversion agreements with certain owners of our preferred stock in which they agreed to convert shares of our preferred stock into shares of our common stock and, in addition, receive a $10 million cash payment from us in connection with the conversion. As a result of the cash payment and additional shares issued as an inducement to the holders of our preferred stock, we recorded a loss of $22 million in the third quarter of 2016.
Note 11. Fair Value Measurements
The following table presents, by level within the fair value hierarchy, our assets and liabilities that are measured at fair value on a recurring basis. The carrying amounts reported in the Consolidated Balance Sheets for cash and cash equivalents and restricted cash approximate fair value due to the nature of the instrument and/or the short-term maturity of these instruments.
September 30, 2017 | December 31, 2016 | ||||||||||||||||||||||||||||||
Level 1 | Level 2 | Level 3 | Total | Level 1 | Level 2 | Level 3 | Total | ||||||||||||||||||||||||
(Millions) | (Millions) | ||||||||||||||||||||||||||||||
Energy derivative assets | $ | — | $ | 95 | $ | — | $ | 95 | $ | — | $ | 38 | $ | — | $ | 38 | |||||||||||||||
Energy derivative liabilities | $ | — | $ | 82 | $ | — | $ | 82 | $ | — | $ | 215 | $ | — | $ | 215 | |||||||||||||||
Total debt(a) | $ | — | $ | 3,007 | $ | — | $ | 3,007 | $ | — | $ | 2,702 | $ | — | $ | 2,702 | |||||||||||||||
__________
(a) | The carrying value of total debt, excluding capital leases and debt issuance costs, was $2,885 million and $2,600 million as of September 30, 2017 and December 31, 2016, respectively. The fair value of our debt, which also excludes capital leases and debt issuance costs, is determined on market rates and the prices of similar securities with similar terms and credit ratings. |
Energy derivatives include commodity based exchange-traded contracts and over-the-counter (“OTC”) contracts. Exchange-traded contracts include futures, swaps and options. OTC contracts include forwards, swaps, options and swaptions. These are carried at fair value on the Consolidated Balance Sheets.
Many contracts have bid and ask prices that can be observed in the market. Our policy is to use a mid-market pricing (the mid-point price between bid and ask prices) convention to value individual positions and then adjust on a portfolio level to a point within the bid and ask range that represents our best estimate of fair value. For offsetting positions by location, the mid-market price is used to measure both the long and short positions.
The determination of fair value for our assets and liabilities also incorporates the time value of money and various credit risk factors which can include the credit standing of the counterparties involved, master netting arrangements, the impact of credit enhancements (such as cash collateral posted and letters of credit) and our nonperformance risk on our liabilities. The determination of the fair value of our liabilities does not consider noncash collateral credit enhancements.
Forward, swap, option and swaption contracts included in Level 2 are valued using an income approach including present value techniques and option pricing models. Option contracts, which hedge future sales of our production, are structured as costless collars, calls or swaptions and are financially settled. All of our financial options are valued using an industry standard Black-Scholes option pricing model. In connection with several crude oil and natural gas swaps entered into, we granted swaptions to the swap counterparties in exchange for receiving premium hedged prices on the crude oil and natural gas swaps. These swaptions grant the counterparty the option to enter into future swaps with us. Significant inputs into our
18
WPX Energy, Inc.
Notes to Consolidated Financial Statements — (Continued)
Level 2 valuations include commodity prices, implied volatility and interest rates, as well as considering executed transactions or broker quotes corroborated by other market data. These broker quotes are based on observable market prices at which transactions could currently be executed. In certain instances where these inputs are not observable for all periods, relationships of observable market data and historical observations are used as a means to estimate fair value. Also categorized as Level 2 is the fair value of our debt, which is determined on market rates and the prices of similar securities with similar terms and credit ratings. Where observable inputs are available for substantially the full term of the asset or liability, the instrument is categorized in Level 2.
Our energy derivatives portfolio is largely comprised of over-the-counter products or like products and the tenure of our derivatives portfolio extends through the end of 2020. Due to the nature of the products and tenure, we are consistently able to obtain market pricing. All pricing is reviewed on a daily basis and is formally validated with broker quotes or market indications and documented on a quarterly basis.
Certain instruments trade with lower availability of pricing information. These instruments are valued with a present value technique using inputs that may not be readily observable or corroborated by other market data. These instruments are classified within Level 3 when these inputs have a significant impact on the measurement of fair value. We did not have any instruments included in Level 3 as of September 30, 2017.
Reclassifications of fair value between Level 1, Level 2 and Level 3 of the fair value hierarchy, if applicable, are made at the end of each quarter. No significant transfers occurred during the periods ended September 30, 2017 and 2016.
There have been no material changes in the fair value of our net energy derivatives and other assets classified as Level 3 in the fair value hierarchy.
Note 12. Derivatives and Concentration of Credit Risk
Energy Commodity Derivatives
Risk Management Activities
We are exposed to market risk from changes in energy commodity prices within our operations. We utilize derivatives to manage exposure to the variability in expected future cash flows from forecasted sales of crude oil, natural gas and natural gas liquids attributable to commodity price risk.
We produce, buy and sell crude oil, natural gas and natural gas liquids at different locations throughout the United States. To reduce exposure to a decrease in revenues from fluctuations in commodity market prices, we enter into futures contracts, swap agreements and financial option contracts to mitigate the price risk on forecasted sales of crude oil, natural gas and natural gas liquids. We have also entered into basis swap agreements to reduce the locational price risk associated with our producing basins. Our financial option contracts are either purchased or sold options, or a combination of options that comprise a net purchased option, zero-cost collar or swaptions.
19
WPX Energy, Inc.
Notes to Consolidated Financial Statements — (Continued)
Derivatives related to production
The following table sets forth the derivative notional volumes of the net long (short) positions that are economic hedges of production volumes, which are included in our commodity derivatives portfolio as of September 30, 2017.
Commodity | Period | Contract Type (a) | Location | Notional Volume (b) | Weighted Average Price (c) | ||||||||
Crude Oil | |||||||||||||
Crude Oil | Oct - Dec 2017 | Fixed Price Swaps | WTI | (50,638 | ) | $ | 50.23 | ||||||
Crude Oil | Oct - Dec 2017 | Basis Swaps | Midland-Cushing | (15,000 | ) | $ | (0.62 | ) | |||||
Crude Oil | Oct - Dec 2017 | Fixed Price Calls | WTI | (4,500 | ) | $ | 56.47 | ||||||
Crude Oil | 2018 | Fixed Price Swaps | WTI | (55,500 | ) | $ | (52.69 | ) | |||||
Crude Oil | 2018 | Basis Swaps | Midland-Cushing | (17,521 | ) | $ | (0.91 | ) | |||||
Crude Oil | 2018 | Basis Swaps | Nymex CMA Roll | (16,000 | ) | $ | 0.03 | ||||||
Crude Oil | 2018 | Fixed Price Calls | WTI | (13,000 | ) | $ | 58.89 | ||||||
Crude Oil | 2019 | Fixed Price Swaps | WTI | (22,000 | ) | $ | 50.85 | ||||||
Crude Oil | 2019 | Basis Swaps | Midland-Cushing | (19,000 | ) | $ | (0.93 | ) | |||||
Crude Oil | 2019 | Basis Swaps | Nymex CMA Roll | (4,000 | ) | $ | 0.07 | ||||||
Crude Oil | 2019 | Fixed Price Calls | WTI | (5,000 | ) | $ | 54.08 | ||||||
Crude Oil | 2020 | Basis Swaps | Midland-Cushing | (5,000 | ) | $ | (1.16 | ) | |||||
Natural Gas | |||||||||||||
Natural Gas | Oct - Dec 2017 | Fixed Price Swaps | Henry Hub | (170 | ) | $ | 3.02 | ||||||
Natural Gas | Oct - Dec 2017 | Basis Swaps | Permian | (73 | ) | $ | (0.20 | ) | |||||
Natural Gas | Oct - Dec 2017 | Basis Swaps | San Juan | (98 | ) | $ | (0.18 | ) | |||||
Natural Gas | Oct - Dec 2017 | Fixed Price Calls | Henry Hub | (15 | ) | $ | 4.50 | ||||||
Natural Gas | 2018 | Fixed Price Swaps | Henry Hub | (185 | ) | $ | 2.98 | ||||||
Natural Gas | 2018 | Basis Swaps | Permian | (43 | ) | $ | (0.28 | ) | |||||
Natural Gas | 2018 | Basis Swaps | San Juan | (50 | ) | $ | (0.34 | ) | |||||
Natural Gas | 2018 | Basis Swaps | Waha | (40 | ) | $ | 0.02 | ||||||
Natural Gas | 2018 | Basis Swaps | Houston Ship | (23 | ) | $ | (0.08 | ) | |||||
Natural Gas | 2018 | Fixed Price Swaptions | Henry Hub | (20 | ) | $ | 3.33 | ||||||
Natural Gas | 2018 | Fixed Price Calls | Henry Hub | (16 | ) | $ | 4.75 | ||||||
Natural Gas | 2019 | Basis Swaps | Permian | (20 | ) | $ | (0.34 | ) | |||||
Natural Gas | 2019 | Basis Swaps | Waha | (70 | ) | $ | (0.15 | ) | |||||
Natural Gas | 2019 | Basis Swaps | Houston Ship | (10 | ) | $ | (0.09 | ) | |||||
__________
(a) | Derivatives related to crude oil production are fixed price swaps settled on the business day average, basis swaps, fixed price calls and swaptions. The derivatives related to natural gas production are fixed price swaps, basis swaps, fixed price calls and swaptions. In connection with several crude oil and natural gas swaps entered into, we granted swaptions to the swap counterparties in exchange for receiving premium hedged prices on the crude oil and natural gas swaps. These swaptions grant the counterparty the option to enter into future swaps with us. Basis swaps for the Nymex CMA (Calendar Monthly Average) Roll location are pricing adjustments to the trade month versus the delivery month for contract pricing. |
(b) | Crude oil volumes are reported in Bbl/day and natural gas volumes are reported in BBtu/day. |
(c) | The weighted average price for crude oil is reported in $/Bbl and natural gas is reported in $/MMBtu. |
20
WPX Energy, Inc.
Notes to Consolidated Financial Statements — (Continued)
Fair values and gains (losses)
Our derivatives are presented as separate line items in our Consolidated Balance Sheets as current and noncurrent derivative assets and liabilities. Derivatives are classified as current or noncurrent based on the contractual timing of expected future net cash flows of individual contracts. The expected future net cash flows for derivatives classified as current are expected to occur within the next 12 months. The fair value amounts are presented on a gross basis and do not reflect the netting of asset and liability positions permitted under the terms of our master netting arrangements. Further, the amounts below do not include cash held on deposit in margin accounts that we have received or remitted to collateralize certain derivative positions.
We enter into commodity derivative contracts that serve as economic hedges but are not designated as cash flow hedges for accounting purposes as we do not utilize this method of accounting for derivative instruments. Net gain (loss) on derivatives on the Consolidated Statements of Operations includes settlements to be received of $14 million and $59 million for the three months ended September 30, 2017 and 2016, respectively, and $23 million and $260 million for the nine months ended September 30, 2017 and 2016, respectively.
The cash flow impact of our derivative activities is presented as separate line items within the operating activities on the Consolidated Statements of Cash Flows.
Offsetting of derivative assets and liabilities
The following table presents our gross and net derivative assets and liabilities.
Gross Amount Presented on Balance Sheet | Netting Adjustments (a) | Net Amount | |||||||||
September 30, 2017 | (Millions) | ||||||||||
Derivative assets with right of offset or master netting agreements | $ | 95 | $ | (55 | ) | $ | 40 | ||||
Derivative liabilities with right of offset or master netting agreements | $ | (82 | ) | $ | 55 | $ | (27 | ) | |||
December 31, 2016 | |||||||||||
Derivative assets with right of offset or master netting agreements | $ | 38 | $ | (33 | ) | $ | 5 | ||||
Derivative liabilities with right of offset or master netting agreements | $ | (215 | ) | $ | 33 | $ | (182 | ) | |||
__________
(a) | With all of our financial trading counterparties, we have agreements in place that allow for the financial right of offset for derivative assets and derivative liabilities at settlement or in the event of a default under the agreements. Additionally, we have negotiated master netting agreements with some of our counterparties. These master netting agreements allow multiple entities that have multiple underlying agreements the ability to net derivative assets and derivative liabilities at settlement or in the event of a default or a termination under one or more of the underlying contracts. |
Credit-risk-related features
Certain of our derivative contracts contain credit-risk-related provisions that would require us, under certain events, to post additional collateral in support of our net derivative liability positions. These credit-risk-related provisions require us to post collateral in the form of cash or letters of credit when our net liability positions exceed an established credit threshold. The credit thresholds are typically based on our senior unsecured debt ratings from Standard and Poor’s and/or Moody’s Investment Services. Under these contracts, a credit ratings decline would lower our credit thresholds, thus requiring us to post additional collateral. We also have contracts that contain adequate assurance provisions giving the counterparty the right to request collateral in an amount that corresponds to the outstanding net liability.
As of September 30, 2017, we had no collateral posted to derivative counterparties, to support the aggregate fair value of our net $27 million derivative liability position (reflecting master netting arrangements in place with certain counterparties), which includes a reduction of $1 million to our liability balance for our own nonperformance risk. The additional collateral that we would have been required to post, assuming our credit thresholds were eliminated and a call for adequate assurance under the credit risk provisions in our derivative contracts was triggered, was $27 million at September 30, 2017.
Concentration of Credit Risk
Cash equivalents
Our cash equivalents are primarily invested in funds with high-quality, short-term securities and instruments that are issued or guaranteed by the U.S. government.
21
WPX Energy, Inc.
Notes to Consolidated Financial Statements — (Continued)
Accounts receivable
Accounts receivable are carried on a gross basis, with no discounting, less the allowance for doubtful accounts. We estimate the allowance for doubtful accounts based on existing economic conditions, the financial conditions of the customers and the amount and age of past due accounts. Receivables are considered past due if full payment is not received by the contractual due date. Past due accounts are generally written off against the allowance for doubtful accounts only after all collection attempts have been exhausted. A portion of our receivables are from joint interest owners of properties we operate. Thus, we may have the ability to withhold future revenue disbursements to recover any non-payment of joint interest billings.
Derivative assets and liabilities
We have a risk of loss from counterparties not performing pursuant to the terms of their contractual obligations. Counterparty performance can be influenced by changes in the economy and regulatory issues, among other factors. Risk of loss is impacted by several factors, including credit considerations and the regulatory environment in which a counterparty transacts. We attempt to minimize credit-risk exposure to derivative counterparties and brokers through formal credit policies, consideration of credit ratings from public ratings agencies, monitoring procedures, master netting agreements and collateral support under certain circumstances. Collateral support could include letters of credit, payment under margin agreements and guarantees of payment by credit worthy parties.
We also enter into master netting agreements to mitigate counterparty performance and credit risk. During 2017 and 2016, we did not incur any significant losses due to counterparty bankruptcy filings. We assess our credit exposure on a net basis to reflect master netting agreements in place with certain counterparties. We offset our credit exposure to each counterparty with amounts we owe the counterparty under derivative contracts.
Our gross and net credit exposure from our derivative contracts were $95 million and $40 million, respectively, as of September 30, 2017. One hundred percent of our credit exposure is with investment grade financial institutions. We determine investment grade primarily using publicly available credit ratings. We include counterparties with a minimum S&P’s rating of BBB- or Moody’s Investors Service rating of Baa3 to be investment grade.
Our five largest net counterparty positions represent approximately 97 percent of our net credit exposure. Under our marginless hedging agreements with key banks, neither party is required to provide collateral support related to hedging activities.
One of our senior officers is on the board of directors of NGL Energy Partners, LP ("NGL Energy"). In the normal course of business, we sell crude oil to NGL Energy. For the first nine months of 2017, sales to NGL Energy were approximately 10 percent of our total consolidated revenues adjusted for gain (loss) on derivatives.
Other
Collateral support for our commodity agreements could include margin deposits, letters of credit, surety bonds and guarantees of payment by credit worthy parties.
22
Item 2. Management’s Discussion and Analysis of Financial Condition and Results of Operations
General
The following discussion should be read in conjunction with the selected historical consolidated financial data and the consolidated financial statements and the related notes included elsewhere in this Form 10-Q and our 2016 Annual Report on Form 10-K. The matters discussed below may contain forward-looking statements that reflect our plans, estimates and beliefs. Our actual results could differ materially from those discussed in these forward-looking statements. Factors that could cause or contribute to these differences include, but are not limited to, those discussed below and elsewhere in this Form 10-Q and our 2016 Annual Report on Form 10-K.
Unless indicated otherwise, the following discussion relates to continuing operations. See Note 3 of Notes to Consolidated Financial Statements for a discussion of discontinued operations.
Overview
Production (based on MBoe)
Three months ended September 30, | Nine months ended September 30, |
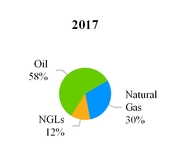
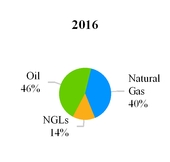
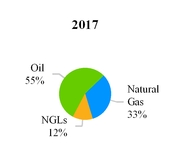
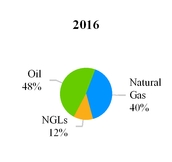
Product Revenues
Three months ended September 30, | Nine months ended September 30, |
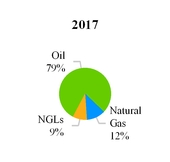
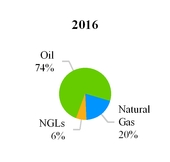
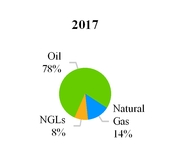
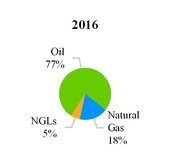
23
The following table presents our production volumes and financial highlights for the three and nine months ended September 30, 2017 and 2016:
Three months ended September 30, | Nine months ended September 30, | ||||||||||||||
2017 | 2016 | 2017 | 2016 | ||||||||||||
Production Sales Volume Data(a): | |||||||||||||||
Volumes: | |||||||||||||||
Oil (MBbls) | 5,960 | 3,576 | 15,440 | 11,069 | |||||||||||
Natural gas (MMcf) | 18,754 | 18,845 | 54,834 | 54,428 | |||||||||||
NGLs (MBbls) | 1,222 | 1,047 | 3,489 | 2,663 | |||||||||||
Combined equivalent volumes (MBoe)(b) | 10,308 | 7,764 | 28,068 | 22,804 | |||||||||||
Per day volumes: | |||||||||||||||
Oil (MBbls/d) | 64.8 | 38.9 | 56.6 | 40.4 | |||||||||||
Natural gas (MMcf/d) | 204 | 205 | 201 | 199 | |||||||||||
NGLs (MBbls/d) | 13.3 | 11.4 | 12.8 | 9.7 | |||||||||||
Per day combined equivalent volumes (MBoe/d)(b) | 112.0 | 84.4 | 102.8 | 83.2 | |||||||||||
Financial Data (millions): | |||||||||||||||
Total product revenues | $ | 326 | $ | 188 | $ | 868 | $ | 491 | |||||||
Total revenues | $ | 224 | $ | 251 | $ | 1,098 | $ | 605 | |||||||
Operating income (loss) | $ | (67 | ) | $ | (301 | ) | $ | 172 | $ | (510 | ) | ||||
Capital expenditure activity(c) | $ | 315 | $ | 160 | $ | 911 | $ | 424 | |||||||
__________
(a) | Excludes production from discontinued operations. |
(b) | MBoe are converted using the ratio of one barrel of oil, condensate or NGL to six thousand cubic feet of natural gas. |
(c) | Includes capital expenditures activity related to discontinued operations of $1 million and $27 million for the three and nine months ended September 30, 2016. |
Our third quarter 2017 operating results were $234 million favorable compared to third quarter 2016. The primary items impacting the three months ended September 30, 2017 compared to the same period in 2016 include:
• | $138 million increase in product revenues, primarily oil sales from $92 million related to higher oil volumes and $28 million related to higher oil prices; |
• | $56 million net gain on sales of assets and impairment of producing properties for 2017 compared to $227 million net loss on sales of assets and divestment of transportation contracts for 2016 (see Note 5 of Notes to Consolidated Financial Statements); and |
• | $9 million decrease in general and administrative expenses. |
Offset by
• | $144 million unfavorable change in net gain (loss) on derivatives; |
• | $55 million higher operating costs including depreciation, depletion and amortization, lease and facility, gathering, processing and transportation, and taxes other than income; and |
• | $10 million higher exploration costs (see Note 5 of Notes to Consolidated Financial Statements). |
Our year-to-date 2017 operating results were $682 million favorable compared to year to date 2016. The primary items impacting the nine months ended September 30, 2017 compared to the same period in 2016 include:
• | $377 million increase in product revenues, primarily oil sales from $149 million related to higher oil volumes and $146 million related to higher oil prices; |
• | $272 million favorable change in net gain (loss) on derivatives; |
• | $28 million decrease in general and administrative expenses; and |
• | $98 million net gain on sales of assets and impairment of producing properties for 2017 compared to $25 million net loss on sales of assets and divestment of transportation contracts for 2016 (see Note 5 of Notes to Consolidated Financial Statements). |
24
Offset by
• | $97 million higher operating costs including depreciation, depletion and amortization, lease and facility, gathering, processing and transportation, and taxes other than income; and |
• | $49 million higher exploration costs (see Note 5 of Notes to Consolidated Financial Statements). |
Outlook
The oil and gas industry is in a challenging environment. With the foundations of our a) assets in the Delaware, Williston and San Juan Basins; b) our current employees in place and c) our liquidity position including hedges into 2019, we believe we are well positioned for prudent growth assuming a commodity environment of approximately $40 to $60 per barrel. However, appropriate adjustments would be made if we foresee that future commodity prices will remain at or outside the boundaries of this range. Our growth plan through the end of 2018, both volumes and cash flow, is another important step in the transformation of the company in an effort to improve our leverage metrics along with other per Boe metrics.
Our 2017 drilling and completion capital program including facilities is expected to range from $940 million to $1,010 million. Approximately half of the capital is targeted for development in the Delaware Basin. This program funds a ten-rig program, with seven in the Delaware Basin, two in the Williston Basin and one in the San Juan Basin. In addition, we will expand our Delaware midstream infrastructure in 2017 with expected spending to range from $50 million to $60 million. Our capital budget for 2018 is $1,100 million to $1,200 million, including $60 million to $90 million for midstream related costs. The plan contemplates deploying a comparable rig count vs. 2017, completing an inventory of 35 DUCs expected at year-end 2017, adding a third frac crew in the Delaware Basin and drilling longer laterals in the Delaware. The 2018 budget is designed to fund an average of 9.5 rigs during the year ranging from 8-11 based on the timing of activity, including 6-7 in the Delaware Basin, 2-3 in the Williston Basin and 0-1 in the San Juan Gallup oil play.
In June 2017, we signed an agreement with Howard Energy Partners (“Howard”) to jointly develop midstream infrastructure in the Delaware Basin specifically focused on crude oil gathering and natural gas processing. The transaction with Howard closed subsequent to the third quarter of 2017 and we received $349 million in cash (see Note 1 of Notes to Consolidated Financial Statements). In the third quarter of 2017, we initiated a process to market our legacy natural gas position in the northern end of the San Juan Basin comprising both our operated and non-operated natural gas producing properties. In October 2017, we signed an agreement for the sale of these properties for $169 million, subject to closing adjustments. We anticipate this transaction to close by year-end 2017. Our oil operations in the San Juan Basin's Gallup play were not included in the sales process.
Our September 30, 2017 liquidity totaled approximately $850 million, reflecting amounts available under the Credit Facility and cash on hand. Subsequent to September 30, 2017, we use the proceeds received from the closing of the Howard transaction to repay all outstanding loans on the Credit Facility which increased the amount available under our Credit Facility to approximately $1,125 million. In the third quarter, we issued an additional $150 million of our 2024 notes and extinguished $150 million of our 2020 notes. Excluding any future borrowings on the Credit Facility, our next debt maturity of $350 million is not due until 2020. We believe our current liquidity position will provide the necessary capital to develop our assets or should sustain us if there is a downturn.
As we execute on our long-term strategy, we continue to operate with a focus on increasing shareholder value and investing in our businesses in a way that enhances our competitive position by:
• | continuing to grow our oil production and reserves through the development of our positions in the Delaware Basin, Williston Basin and Gallup Sandstone in the San Juan Basin; |
• | continuing to pursue cost improvements and efficiency gains; |
• | employing new technology and operating methods; |
• | continuing to invest in projects to assess resources and add new development opportunities to our portfolio; |
• | retaining the flexibility to make adjustments to our planned levels and allocation of capital investment expenditures in response to changes in economic conditions or business opportunities; and |
• | continuing to maintain an active economic hedging program around our commodity price risks. |
Potential risks or obstacles that could impact the execution of our plan include:
• | lower than anticipated energy commodity prices; |
• | increase in the cost of, or shortages or delays in the availability of, drilling rigs and equipment supplies, skilled labor or transportation; |
• | lower than expected results from acquisitions; |
25
• | higher capital costs of developing our properties, including the impact of inflation; |
• | lower than expected levels of cash flow from operations; |
• | counterparty credit and performance risk; |
• | general economic, financial markets or industry downturn; |
• | unavailability of capital either under our revolver or access to capital markets; |
• | changes in the political and regulatory environments; and |
• | decreased drilling success. |
With the exception of potential impairments, we continue to address certain of these risks through utilization of commodity hedging strategies, disciplined investment strategies and maintaining adequate liquidity. In addition, we use master netting agreements and collateral requirements with our counterparties to reduce credit risk and liquidity requirements. Further, we continue to monitor the long-term market outlooks and forecasts for potential indicators of needed changes to our forecasted oil and natural gas prices. Commodity prices are significantly volatile and prices for a barrel of oil ranged from over $100 per barrel to less than $30 per barrel for a brief time over the past five years. Our forecasted price assumptions reflect a long-term view of pricing but also consider current prices and are consistent with pricing assumptions generally used in evaluating our drilling decisions and acquisition plans. If forecasted oil and natural gas prices were to decline, we would need to review the producing properties net book value for possible impairment. Because of the uncertainty inherent in these factors, we cannot predict when or if future impairment charges will be recorded. If impairments were required, the charges could be significant. The net book value of our predominantly oil proved properties is $4.8 billion. A disposition of the previously discussed San Juan Basin legacy natural gas properties necessitated a review of these properties for impairment at September 30, 2017 based on probability weighted sales prices. This review resulted in a $60 million impairment recorded in the third-quarter of 2017. In addition, the net book value associated with unproved leasehold is approximately $2.6 billion and is primarily associated with our Delaware Basin properties. See our discussion in the Critical Accounting Estimates section of our Annual Report on Form 10-K for the year ended December 31, 2016.
Results of Operations
Three Month-Over-Three Month Results of Operations
Revenue analysis
Three months ended September 30, | Favorable (Unfavorable) $ Change | Favorable (Unfavorable) % Change | ||||||||||||
2017 | 2016 | |||||||||||||
(Millions) | ||||||||||||||
Revenues: | ||||||||||||||
Oil sales | $ | 259 | $ | 139 | $ | 120 | 86 | % | ||||||
Natural gas sales | 38 | 37 | 1 | 3 | % | |||||||||
Natural gas liquid sales | 29 | 12 | 17 | 142 | % | |||||||||
Total product revenues | 326 | 188 | 138 | 73 | % | |||||||||
Net gain (loss) on derivatives | (106 | ) | 38 | (144 | ) | NM | ||||||||
Gas management | 4 | 25 | (21 | ) | (84 | )% | ||||||||
Total revenues | $ | 224 | $ | 251 | $ | (27 | ) | (11 | )% | |||||
__________
NM: A percentage calculation is not meaningful due to change in signs, a zero-value denominator or a percentage change greater than 200.
26
Significant variances in the respective line items of revenues are comprised of the following:
• | $120 million increase in oil sales reflects $92 million related to higher production sales volumes and $28 million related to higher sales prices for the three months ended September 30, 2017 compared to 2016. The increase in production sales volumes primarily relates to our Williston and Delaware Basins. The Williston Basin volumes were 31.3 MBbls per day compared to 17.3 MBbls per day for the three months ended September 30, 2017 and 2016, respectively. The Delaware Basin volumes were 22.7 MBbls per day compared to 14.3 MBbls per day for the three months ended September 30, 2017 and 2016, respectively. The Delaware Basin increase also includes the impact of the Panther Acquisition in the first quarter of 2017. The following table reflects oil production prices and volumes for the three months ended September 30, 2017 and 2016: |
Three months ended September 30, | |||||||
2017 | 2016 | ||||||
Oil sales (per barrel) | 43.34 | $ | 38.71 | ||||
Impact of net cash received (paid) related to settlement of derivatives (per barrel)(a) | 1.70 | 12.15 | |||||
Oil net price including derivative settlements (per barrel) | $ | 45.04 | $ | 50.86 | |||
Oil production sales volumes (MBbls) | 5,960 | 3,576 | |||||
Per day oil production sales volumes (MBbls/d) | 64.8 | 38.9 | |||||
__________
(a) Included in net gain (loss) on derivatives on the Consolidated Statements of Operations.
• | $1 million increase in natural gas sales reflects higher sales prices for the three months ended September 30, 2017 compared to 2016. Natural gas revenues related to our properties in the San Juan Basin held for sale as of September 30, 2017 were $19 million for both the three months ended September 30, 2017 and 2016. The following table reflects natural gas production prices and volumes for the three months ended September 30, 2017 and 2016: |
Three months ended September 30, | |||||||
2017 | 2016 | ||||||
Natural gas sales (per Mcf) | $ | 2.06 | 1.97 | ||||
Impact of net cash received (paid) related to settlement of derivatives (per Mcf)(a) | 0.18 | 0.79 | |||||
Natural gas net price including derivative settlements (per Mcf) | $ | 2.24 | $ | 2.76 | |||
Natural gas production sales volumes (MMcf) | 18,754 | 18,845 | |||||
Per day natural gas production sales volumes (MMcf/d) | 204 | 205 | |||||
__________
(a) Included in net gain (loss) on derivatives on the Consolidated Statements of Operations.
• | $17 million increase in natural gas liquids sales primarily reflect higher sales prices for the three months ended September 30, 2017 compared to 2016. The increased production primarily relates to the Delaware Basin. The Delaware Basin volumes were 6.6 MBbls per day compared to 5.3 MBbls per day for the three months ended September 30, 2017 and 2016, respectively. The following table reflects NGL production prices and volumes for the three months ended September 30, 2017 and 2016: |
Three months ended September 30, | |||||||
2017 | 2016 | ||||||
NGL sales (per barrel) | $ | 23.57 | $ | 11.50 | |||
NGL production sales volumes (MBbls) | 1,222 | 1,047 | |||||
Per day NGL production sales volumes (MBbls/d) | 13.3 | 11.4 | |||||
• | $144 million unfavorable change in net gain (loss) on derivatives primarily reflects unfavorable change in gains (losses) on crude oil derivatives due to increases in 2017 of forward commodity prices relative to our hedge positions as opposed to decreases in 2016 of forward commodity prices relative to our hedge position at that time. Settlements to |
27
be received on derivatives totaled $14 million and $59 million three months ended September 30, 2017 and September 30, 2016, respectively.
• | $21 million decrease in gas management revenues is primarily due to lower natural gas sales volumes. The decrease in volumes is due in part to higher volumes in 2016 pursuant to the divestment of transportation contracts in the third quarter of 2016 that were related to our former Piceance Basin operations. A similar decrease is reflected in the $27 million decrease in related gas management costs and expenses, discussed below. |
Cost and operating expense and operating income (loss) analysis
Three months ended September 30, | Favorable (Unfavorable) $ Change | Favorable (Unfavorable) % Change | Per Boe Expense | |||||||||||||||
2017 | 2016 | 2017 | 2016 | |||||||||||||||
(Millions) | ||||||||||||||||||
Costs and expenses: | ||||||||||||||||||
Depreciation, depletion and amortization | $ | 169 | $ | 150 | $ | (19 | ) | (13 | )% | $16.39 | $19.30 | |||||||
Lease and facility operating | 58 | 40 | (18 | ) | (45 | )% | $5.66 | $5.07 | ||||||||||
Gathering, processing and transportation | 25 | 19 | (6 | ) | (32 | )% | $2.44 | $2.51 | ||||||||||
Taxes other than income | 26 | 14 | (12 | ) | (86 | )% | $2.48 | $1.84 | ||||||||||
Exploration | 20 | 10 | (10 | ) | (100 | )% | ||||||||||||
General and administrative: | ||||||||||||||||||
General and administrative expenses | 35 | 41 | 6 | 15 | % | $3.41 | $5.27 | |||||||||||
Equity-based compensation | 7 | 10 | 3 | 30 | % | $0.68 | $1.23 | |||||||||||
Total general and administrative | 42 | 51 | 9 | 18 | % | $4.09 | $6.50 | |||||||||||
Gas management | 4 | 31 | 27 | 87 | % | |||||||||||||
Net (gain) loss—sales of assets, divestment of transportation contracts or impairment of producing properties | (56 | ) | 227 | 283 | NM | |||||||||||||
Other—net | 3 | 10 | 7 | 70 | % | |||||||||||||
Total costs and expenses | $ | 291 | $ | 552 | $ | 261 | 47 | % | ||||||||||
Operating loss | $ | (67 | ) | $ | (301 | ) | $ | 234 | 78 | % | ||||||||
__________
NM: A percentage calculation is not meaningful due to change in signs, a zero-value denominator or a percentage change greater than 200.
Significant variances in our costs and expenses are comprised of the following:
• | $19 million increase in depreciation, depletion and amortization is primarily due to increased production volumes offset by a $2.91 per Boe decrease in rate which was impacted by an increase in the reserves due to an increase in the 12-month average price and the addition of new wells with lower relative cost per Boe. |
• | $18 million increase in lease and facility operating expenses primarily related to increased production volumes. |
• | $6 million increase in gathering, processing and transportation primarily due to higher costs in the San Juan Basin as a result of the sale of the gathering system in March of 2016, one-time adjustment for disallowed gathering and processing deductions for federal royalties in the San Juan Basin and higher volumes in the Delaware Basin. |
• | $12 million increase in taxes other than income relates to increased product revenues, previously discussed. |
• | $10 million increase in exploration expenses is primarily due to higher unproved leasehold property impairment, amortization and expiration in 2017 (see Note 5 of Notes to Consolidated Financial Statements). |
• | $9 million decrease in general and administrative expenses as the three months ended September 30, 2016 included $3 million for severance and relocation costs associated with workforce reductions and office consolidations. We will continually challenge our levels of general and administrative costs, however, we believe our organizational size is conducive for future growth. Excluding the severance and relocation costs, general and administrative expenses would have averaged $6.15 per Boe for the three months ended September 30, 2016. |
• | $27 million decrease in gas management expenses is primarily due to lower natural gas purchase volumes. The decrease in volumes is due in part to the divestment of transportation contracts in the third quarter of 2016 that were related to our former Piceance Basin operations. Also included in gas management expenses for the three months ended September 30, 2016, is $6 million for unutilized pipeline capacity related to divested transportation contracts. |
28
• | $56 million net gain on sales of assets and impairment to producing properties in 2017 compared to $227 million net loss on sales of assets and divestment of transportation contracts in 2016. See Note 5 of Notes to Consolidated Financial Statements. |
Results below operating income (loss)
Three months ended September 30, | Favorable (Unfavorable) $ Change | Favorable (Unfavorable) % Change | ||||||||||||
2017 | 2016 | |||||||||||||
(Millions) | ||||||||||||||
Operating loss | $ | (67 | ) | $ | (301 | ) | $ | 234 | 78 | % | ||||
Interest expense | (48 | ) | (49 | ) | 1 | 2 | % | |||||||
Loss on extinguishment of debt | (17 | ) | — | (17 | ) | NM | ||||||||
Investment income and other | 2 | — | 2 | NM | ||||||||||
Loss from continuing operations before income taxes | (130 | ) | (350 | ) | 220 | 63 | % | |||||||
Provision (benefit) for income taxes | 20 | (132 | ) | (152 | ) | NM | ||||||||
Loss from continuing operations | (150 | ) | (218 | ) | 68 | 31 | % | |||||||
Income (loss) from discontinued operations | 4 | (1 | ) | 5 | NM | |||||||||
Net loss | $ | (146 | ) | $ | (219 | ) | 73 | 33 | % | |||||
__________
NM: A percentage calculation is not meaningful due to change in signs, a zero-value denominator or a percentage change greater than 200.
In the third-quarter of 2017, we issued an additional $150 million of our 2024 Notes and extinguished $150 million of our 2020 Notes. As a result of the early retirement of the 2020 notes, we recorded a loss on extinguishment of debt of $17 million in third-quarter 2017.
Provision (benefit) for income taxes for the three months ended September 30, 2017 changed unfavorably compared to the same period for 2016. See Note 8 of Notes to Consolidated Financial Statements for a discussion of the effective tax rates compared to the federal statutory rate for both periods.
Income (loss) from discontinued operations in 2016 included activity from the Piceance Basin which was sold in the second quarter of 2016; therefore, we had minimal activity for both periods presented. See Note 3 of Notes to Consolidated Financial Statements for detail of amounts included in discontinued operations.
Nine Month-Over-Nine Month Results of Operations
Revenue analysis
Nine months ended September 30, | Favorable (Unfavorable) $ Change | Favorable (Unfavorable) % Change | ||||||||||||
2017 | 2016 | |||||||||||||
(Millions) | ||||||||||||||
Revenues: | ||||||||||||||
Oil sales | $ | 673 | $ | 378 | $ | 295 | 78 | % | ||||||
Natural gas sales | 122 | 86 | 36 | 42 | % | |||||||||
Natural gas liquid sales | 73 | 27 | 46 | 170 | % | |||||||||
Total product revenues | 868 | 491 | 377 | 77 | % | |||||||||
Net gain (loss) on derivatives | 213 | (59 | ) | 272 | NM | |||||||||
Gas management | 17 | 172 | (155 | ) | (90 | )% | ||||||||
Other | — | 1 | (1 | ) | (100 | )% | ||||||||
Total revenues | $ | 1,098 | $ | 605 | $ | 493 | 81 | % | ||||||
__________
NM: A percentage calculation is not meaningful due to change in signs, a zero-value denominator or a percentage change greater than 200.
29
Significant variances in the respective line items of revenues are comprised of the following:
• | $295 million increase in oil sales reflects $149 million related to higher production sales volumes and $146 million related to higher sales prices for the three months ended September 30, 2017 compared to 2016. The increase in production sales volumes relates to our Williston and Delaware Basins. The Williston Basin volumes were 29.0 MBbls per day compared to 19.7 MBbls per day for the nine months ended September 30, 2017 and 2016, respectively. The Delaware Basin volumes were 18.8 MBbls per day compared to 13.4 MBbls per day for the nine months ended September 30, 2017 and 2016, respectively. The following table reflects oil production prices and volumes for the nine months ended September 30, 2017 and 2016: |
Nine months ended September 30, | |||||||
2017 | 2016 | ||||||
Oil sales (per barrel) | $ | 43.56 | $ | 34.14 | |||
Impact of net cash received (paid) related to settlement of derivatives (per barrel)(a) | 1.21 | 14.42 | |||||
Oil net price including derivative settlements (per barrel) | $ | 44.77 | $ | 48.56 | |||
Oil production sales volumes (MBbls) | 15,440 | 11,069 | |||||
Per day oil production sales volumes (MBbls/d) | 56.6 | 40.4 | |||||
__________
(a) Included in net gain (loss) on derivatives on the Consolidated Statements of Operations.
• | $36 million increase in natural gas sales is primarily due to higher sales prices for the nine months ended September 30, 2017 compared to 2016. The increase in our production sales volumes relates to our Delaware Basin. In addition, 2016 natural gas volumes were negatively impacted by third-party processing constraints. Natural gas revenues related to our properties in the San Juan Basin held for sale as of September 30, 2017 were $58 million and $48 million for the nine months ended September 30, 2017 and 2016, respectively. The following table reflects natural gas production prices and volumes for the nine months ended September 30, 2017 and 2016: |
Nine months ended September 30, | |||||||
2017 | 2016 | ||||||
Natural gas sales (per Mcf) | $ | 2.23 | $ | 1.58 | |||
Impact of net cash received (paid) related to settlement of derivatives (per Mcf)(a) | 0.07 | 1.83 | |||||
Natural gas net price including derivative settlements (per Mcf) | $ | 2.30 | $ | 3.41 | |||
Natural gas production sales volumes (MMcf) | 54,834 | 54,428 | |||||
Per day natural gas production sales volumes (MMcf/d) | 201 | 199 | |||||
__________
(a) Included in net gain (loss) on derivatives on the Consolidated Statements of Operations.
• | $46 million increase in natural gas liquids sales primarily reflects $37 million related to higher sales prices and $9 million related to increased production sales volumes for the nine months ended September 30, 2017 compared to 2016. The following table reflects NGL production prices and volumes for the nine months ended September 30, 2017 and 2016: |
Nine months ended September 30, | |||||||
2017 | 2016 | ||||||
NGL sales (per barrel) | $ | 20.88 | $ | 10.24 | |||
NGL production sales volumes (MBbls) | 3,489 | 2,663 | |||||
Per day NGL production sales volumes (MBbls/d) | 12.8 | 9.7 | |||||
• | $272 million favorable change in net gain (loss) on derivatives primarily reflects favorable change in gains (losses) on crude oil and natural gas derivatives due to decreases in forward commodity prices in 2017 relative to our hedge |
30
positions. Settlements to be received on derivatives totaled $23 million and $260 million for the nine months ended September 30, 2017 and September 30, 2016, respectively.
• | $155 million decrease in gas management revenues is primarily due to lower natural gas sales volumes. The decrease in volumes is due in part to the sale of production volumes in 2016 pursuant to our purchase agreement with the buyer of the Piceance Basin operations and the divestment of transportation contracts in the third quarter of 2016 that were related to our former Piceance Basin operations. A similar decrease is reflected in the $185 million decrease in related gas management costs and expenses, discussed below. |
Cost and operating expense and operating income (loss) analysis
Nine months ended September 30, | Favorable (Unfavorable) $ Change | Favorable (Unfavorable) % Change | Per Boe Expense | |||||||||||||||
2017 | 2016 | 2017 | 2016 | |||||||||||||||
(Millions) | ||||||||||||||||||
Costs and expenses: | ||||||||||||||||||
Depreciation, depletion and amortization | $ | 487 | $ | 465 | $ | (22 | ) | (5 | )% | $17.36 | $20.40 | |||||||
Lease and facility operating | 159 | 123 | (36 | ) | (29 | )% | $5.68 | $5.37 | ||||||||||
Gathering, processing and transportation | 67 | 55 | (12 | ) | (22 | )% | $2.40 | $2.42 | ||||||||||
Taxes other than income | 68 | 41 | (27 | ) | (66 | )% | $2.41 | $1.79 | ||||||||||
Exploration | 80 | 31 | (49 | ) | (158 | )% | ||||||||||||
General and administrative: | ||||||||||||||||||
General and administrative expenses | 108 | 134 | 26 | 19 | % | $3.85 | $5.88 | |||||||||||
Equity-based compensation | 23 | 25 | 2 | 8 | % | $0.83 | $1.09 | |||||||||||
Total general and administrative | 131 | 159 | 28 | 18 | % | $4.68 | $6.97 | |||||||||||
Gas management | 17 | 202 | 185 | 92 | % | |||||||||||||
Net (gain) loss—sales of assets, divestment of transportation contracts or impairment of producing properties | (98 | ) | 25 | 123 | NM | |||||||||||||
Other—net | 15 | 14 | (1 | ) | (7 | )% | ||||||||||||
Total costs and expenses | $ | 926 | $ | 1,115 | $ | 189 | 17 | % | ||||||||||
Operating income (loss) | $ | 172 | $ | (510 | ) | $ | 682 | NM | ||||||||||
__________
NM: A percentage calculation is not meaningful due to change in signs, a zero-value denominator or a percentage change greater than 200.
Significant variances in our costs and expenses are comprised of the following:
• | $22 million increase in depreciation, depletion and amortization is primarily due increased production volumes offset by a $3.04 per Boe decrease in rate which was impacted by an increase in reserves due to an increase in the 12-month average price, new wells with lower relative cost per Boe. |
• | $36 million increase in lease and facility operating expenses primarily related to increased production volumes. |
• | $12 million increase in gathering, processing and transportation primarily due to higher costs in the San Juan Basin as a result of the sale of the gathering system in March of 2016, one-time adjustment for disallowed gathering and processing deduction for federal royalties in the San Juan Basin and higher volumes in the Delaware Basin. |
• | $27 million increase in taxes other than income primarily relates to increased product revenues. |
• | $49 million increase in exploration expenses is primarily due to unproved leasehold property impairment, amortization and expiration in 2017 which includes costs associated with certain expired leases in the Permian Basin in excess of the accumulated amortization balance recorded during first-quarter 2017. These leases were renewed in second-quarter 2017. See Note 5 of Notes to Consolidated Financial Statements. |
• | $28 million decrease in general and administrative expenses primarily due to workforce reductions. In addition, the nine months ended September 30, 2016 included $13 million for severance and relocation costs associated with workforce reductions and office consolidations. We will continually challenge our levels of general and administrative costs, however, we believe our organizational size is conducive for future growth. Excluding the severance and relocation costs, general and administrative expenses would have averaged $6.40 per Boe for 2016. |
31
• | $185 million decrease in gas management expenses is primarily due to lower natural gas purchase volumes. The decrease in volumes is due in part to the marketing of the volumes for the purchaser of our Piceance Basin operations and the divestment of transportation contracts in the third quarter of 2016 that were related to our former Piceance Basin operations. Also included in gas management expenses for the nine months ended September 30, 2016 is $27 million for unutilized pipeline capacity related to divested transportation contracts. |
• | $98 million net gain on sales of assets and impairment of producing properties in 2017 compared to $25 million net loss on sales of assets and divestment of transportation contracts in 2016. See Note 5 of Notes to Consolidated Financial Statements. |
Results below operating income (loss)
Nine months ended September 30, | Favorable (Unfavorable) $ Change | Favorable (Unfavorable) % Change | ||||||||||||
2017 | 2016 | |||||||||||||
(Millions) | ||||||||||||||
Operating income (loss) | $ | 172 | $ | (510 | ) | $ | 682 | NM | ||||||
Interest expense | (141 | ) | (159 | ) | 18 | 11 | % | |||||||
Loss on extinguishment of debt | (17 | ) | — | (17 | ) | NM | ||||||||
Investment income and other | 4 | 1 | 3 | NM | ||||||||||
Income (loss) from continuing operations before income taxes | 18 | (668 | ) | 686 | NM | |||||||||
Benefit for income taxes | (2 | ) | (227 | ) | (225 | ) | (99 | )% | ||||||
Income (loss) from continuing operations | 20 | (441 | ) | 461 | NM | |||||||||
Income from discontinued operations | 2 | 12 | (10 | ) | (83 | )% | ||||||||
Net income (loss) | $ | 22 | $ | (429 | ) | 451 | NM | |||||||
__________
NM: A percentage calculation is not meaningful due to change in signs, a zero-value denominator or a percentage change greater than 200.
The decrease in interest expense primarily relates to the lower level of debt outstanding in 2017 compared to 2016.
In the third-quarter of 2017 we issued $150 million of debt onto our 2024 Notes and extinguished $150 million of the 2020 Notes. As a result, we recorded a loss on extinguishment of debt of $17 million in third-quarter 2017.
Benefit for income taxes for 2017 changed unfavorably compared to 2016 due primarily to a pre-tax income from continuing operations in 2017 compared to pre-tax loss in 2016 partially offset by the impact of the effective tax rate in 2017. Provision for income taxes in 2016 included state tax changes resulting from the sale of our Piceance Basin operations including $14 million for a state effective tax rate change and an $8 million valuation allowance recorded on Colorado loss and credit carryovers generated in prior years. See Note 8 of Notes to Consolidated Financial Statements for a discussion of the effective tax rates compared to the federal statutory rate for both periods.
Income from discontinued operations in 2016 included activity from the Piceance Basin which was sold in the second quarter of 2016; therefore, we had minimal activity for 2017. See Note 3 of Notes to Consolidated Financial Statements for detail of amounts included in discontinued operations.
Management’s Discussion and Analysis of Financial Condition and Liquidity
Overview and Liquidity
We expect our capital structure will provide us financial flexibility to meet our requirements for working capital and capital expenditures while maintaining a sufficient level of liquidity. Our primary sources of liquidity in 2017 are cash on hand, expected cash flows from operations, proceeds from closing of the joint venture with Howard, proceeds from the issuance of equity securities in January 2017, anticipated proceeds from the sale of the natural gas-producing properties in the San Juan Basin, and, if necessary, borrowings on our credit facility. We anticipate that the combination of these sources should be sufficient to allow us to pursue our business strategy and goals through at least 2018. Additional sources of liquidity, if needed and if available, include proceeds from asset sales, bank financings and proceeds from the issuance of long-term debt and equity securities. In addition, we may further reduce debt and/or interest expense by seeking to retire, purchase or exchange our outstanding debt through cash purchases and/or exchanges for equity or debt securities, in open market purchases, privately negotiated transactions or otherwise. Such repurchases or exchanges, if any, will depend on prevailing market conditions, our liquidity requirements, contractual restrictions and other factors.
32
We note the following assumptions for the remainder of 2017 and 2018 capital expenditures:
• | our planned capital expenditures, excluding acquisitions, are estimated to be approximately $990 million to $1,070 million of which $940 million to $1,010 million relate to drilling and completions, including facilities. As of September 30, 2017, we have incurred $786 million of drilling and completion capital expenditures including facilities, approximately $65 million for land acquisitions and $60 million for infrastructure and other items not associated with drilling and completions. Planned total capital expenditures for 2018 are $1,100 million to $1,200 million; and |
• | we have hedged a portion of our anticipated 2017 and 2018 oil and gas production as disclosed in Commodity Price Risk Management following this section. |
Potential risks associated with our planned levels of liquidity and the planned capital and investment expenditures discussed above include:
• | lower than expected levels of cash flow from operations, primarily resulting from lower energy commodity prices or inflation on operating costs; |
• | significantly lower than expected capital expenditures could result in the loss of undeveloped leasehold; |
• | reduced access to our credit facility pursuant to our financial covenants; and |
• | higher than expected development costs, including the impact of inflation. |
Credit Facility
On March 18, 2016, the Company entered into a Second Amended and Restated Credit Agreement with Wells Fargo Bank, National Association, as Administrative Agent, Lender and Swingline Lender and the other lenders party thereto (the “Credit Facility”). The Credit Facility is a senior secured revolving credit facility with $1.2 billion in commitments and a maturity date of October 28, 2019. The Borrowing Base was increased to $1.5 billion in October 2017 and is in excess of commitments which remained at $1.2 billion. This Borrowing Base will remain in effect until the next Redetermination Date as set forth in the Credit Facility. The financial covenants in the Credit Facility may limit our ability to borrow money, depending on the applicable financial metrics at any given time. For additional information regarding the terms of our Credit Facility see our Annual Report on Form 10-K for the year ended December 31, 2016. As of September 30, 2017, we had $285 million borrowed and $75 million of letters of credit issued under the Credit Facility and we were in compliance with our financial covenants under the credit agreement. Our unused borrowing availability was approximately $840 million as of September 30, 2017. Subsequent to September 30, 2017, we repaid all of the outstanding loans on our revolving credit facility with proceeds received from the closing of the Howard transaction which increased our availability under the Credit Facility to approximately $1,125 million.
Commodity Price Risk Management
To manage the commodity price risk and volatility of owning producing oil and gas properties, we enter into derivative contracts for a portion of our future production (see Note 12 of Notes to Consolidated Financial Statements). We chose not to designate our derivative contracts associated with our future production as cash flow hedges for accounting purposes. For the remainder of 2017 and 2018, we have the following contracts as of the date of this filing shown at weighted average volumes and basin-level weighted average prices:
Crude Oil | Oct - Dec 2017 | 2018 | |||||||||||
Volume (Bbls/d) | Weighted Average Price ($/Bbl) | Volume (Bbls/d) | Weighted Average Price ($/Bbl) | ||||||||||
Fixed Price Swaps—WTI | 50,638 | $ | 50.23 | 55,500 | $ | 52.69 | |||||||
Fixed Price Calls—WTI | 4,500 | $ | 56.47 | 13,000 | $ | 58.89 | |||||||
Basis swaps—Midland | 15,000 | $ | (0.62 | ) | 17,521 | $ | (0.91 | ) | |||||
Basis swaps—Nymex Calendar Monthly Avg Roll | — | $ | — | 20,000 | $ | 0.03 | |||||||
33
Natural Gas | Oct - Dec 2017 | 2018 | |||||||||||
Volume (BBtu/d) | Weighted Average Price ($/MMBtu) | Volume (BBtu/d) | Weighted Average Price ($/MMBtu) | ||||||||||
Fixed Price Swaps—Henry Hub | 170 | $ | 3.02 | 140 | $ | 2.97 | |||||||
Swaptions—Henry Hub | — | $ | — | 20 | $ | 3.33 | |||||||
Fixed Price Calls—Henry Hub | 15 | $ | 4.50 | 16 | $ | 4.75 | |||||||
Basis swaps—Permian | 73 | $ | (0.20 | ) | 48 | $ | (0.31 | ) | |||||
Basis swaps—San Juan | 98 | $ | (0.18 | ) | 40 | $ | (0.30 | ) | |||||
Basis swaps—Waha | — | $ | — | 15 | $ | 0.93 | |||||||
Basis swaps—Houston Ship Channel | — | $ | — | 43 | $ | (0.08 | ) | ||||||
Sources (Uses) of Cash
Nine months ended September 30, | |||||||
2017 | 2016 | ||||||
(Millions) | |||||||
Net cash provided by (used in): | |||||||
Operating activities | $ | 228 | $ | 114 | |||
Investing activities | (1,628 | ) | 460 | ||||
Financing activities | 914 | 11 | |||||
Net increase (decrease) in cash and cash equivalents | $ | (486 | ) | $ | 585 | ||
Operating activities
Net cash provided by operating activities increased for the nine months ended September 30, 2017 compared to the same period in 2016 primarily due to higher commodity prices and higher production volumes in 2017, partially offset by lower realizations on our derivatives and higher operating costs. Excluding changes in working capital, total cash provided by operating activities related to discontinued operations was approximately $28 million for the nine months ended September 30, 2016. In addition, cash outflows related to Powder River Basin gathering and transportation contracts retained by WPX were $40 million and $42 million for the nine months ended September 30, 2017 and 2016, respectively.
Investing activities
The table below includes cash and incurred capital expenditures for drilling and completions and capital expenditures excluding facilities for land acquisitions.
Nine months ended September 30, | ||||||||
2017 | 2016 | |||||||
Cash capital expenditures for drilling and completions: | ||||||||
Continuing operations | $ | 690 | $ | 325 | ||||
Discontinued operations | — | 26 | ||||||
Total | $ | 690 | $ | 351 | ||||
Capital expenditures incurred for drilling and completions: | ||||||||
Continuing operations | $ | 742 | $ | 320 | ||||
Discontinued operations | — | 22 | ||||||
Total | $ | 742 | $ | 342 | ||||
Land acquisitions | $ | 65 | $ | — | ||||
34
Net cash used in investing activities for the nine months ended September 30, 2017 includes $798 million related to the closing of the Panther Acquisition (see Note 2 of Notes to Consolidated Financial Statements). Net cash provided by investing activities for the nine months ended September 30, 2016 includes $862 million for the sale of WPX Energy Rocky Mountain, LLC that held our Piceance Basin operations (see Note 3 of Notes to Consolidated Financial Statements) and $280 million for the sale of our San Juan Basin gathering system during the first quarter of 2016 (see Note 5 of Notes to Consolidated Financial Statements) partially offset by a $238 million divestment of certain transportation contracts (see Note 5 of Notes to Consolidated Financial Statements).
Financing activities
Net cash provided by financing activities for the nine months ended September 30, 2017 was primarily due to an equity offering of 51.675 million shares for net proceeds of approximately $670 million, net borrowings under the Credit Facility of $285 million and $148 million of net proceeds related to the issuance of additional notes due in 2024 partially offset by a payment of $165 million, including a premium, to repurchase some of our 2020 Senior Notes. Additionally, payment for shares withheld for taxes of $11 million and $5 million for the nine months ended September 30, 2017 and 2016, respectively, is included in financing activities due to the adoption of ASU 2016-09 (see Note 1 of Notes to Consolidated Financial Statements). Net cash provided by financing activities for the nine months ended September 30, 2016 was primarily due to an equity offering of 56.925 million shares for net proceeds of approximately $538 million partially offset by net repayments under the Credit Facility of $265 million, payments of $230 million to repurchase some of our 2017 Senior Notes and $10 million of cash paid as an inducement for the conversion of preferred stock to common stock.
Contractual Obligations
During the second quarter of 2017, we signed long-term transportation agreements that will ultimately provide 300,000 MMBtu per day (15 years) and 200,000 MMBtu per day (11 years) of natural gas capacity from our Delaware Basin properties in the Stateline area to markets in Texas. One of the agreements allows us the option to increase our capacity over time by 200,000 MMBtu per day to a total of 500,000 MMBtu per day. Total commitments related to these agreements, excluding the option, were approximately $337 million as of September 30, 2017.
Off-Balance Sheet Financing Arrangements
We had no guarantees of off-balance sheet debt to third parties or any other off-balance sheet arrangements at September 30, 2017 or at December 31, 2016.
Item 3. Quantitative and Qualitative Disclosures About Market Risk
Interest Rate Risk
Our current interest rate risk exposure is primarily related to our debt portfolio and has not materially changed during the first nine months of 2017.
Commodity Price Risk
We are exposed to the impact of fluctuations in the market price of oil, natural gas and natural gas liquids as well as other market factors, such as market volatility and energy commodity price correlations. We are exposed to these risks in connection with our owned energy-related assets, our long-term energy-related contracts and our marketing trading activities. We manage the risks associated with these market fluctuations using various derivatives and nonderivative energy-related contracts. The fair value of derivative contracts is subject to many factors, including changes in energy commodity market prices, the liquidity and volatility of the markets in which the contracts are transacted and changes in interest rates. See Notes 11 and 12 of Notes to Consolidated Financial Statements.
We measure the risk in our portfolios using a value-at-risk methodology to estimate the potential one-day loss from adverse changes in the fair value of the portfolios. Value at risk requires a number of key assumptions and is not necessarily representative of actual losses in fair value that could be incurred from the portfolios. Our value-at-risk model uses a Monte Carlo method to simulate hypothetical movements in future market prices and assumes that, as a result of changes in commodity prices, there is a 95 percent probability that the one-day loss in fair value of the portfolios will not exceed the value at risk. The simulation method uses historical correlations and market forward prices and volatilities. In applying the value-at-risk methodology, we do not consider that the simulated hypothetical movements affect the positions or would cause any potential liquidity issues, nor do we consider that changing the portfolios in response to market conditions could affect market prices and could take longer than a one-day holding period to execute. While a one-day holding period has historically been the industry standard, a longer holding period could more accurately represent the true market risk given market liquidity and our own credit and liquidity constraints.
35
We segregate our derivative contracts into trading and nontrading contracts, as defined in the following paragraphs. We calculate value at risk separately for these two categories. Contracts designated as normal purchases or sales and nonderivative energy contracts have been excluded from our estimation of value at risk.
We have policies and procedures that govern our trading and risk management activities. These policies cover authority and delegation thereof in addition to control requirements, authorized commodities and term and exposure limitations. Value-at-risk is limited in aggregate and calculated at a 95 percent confidence level.
Trading
Our trading portfolio consists of derivative contracts entered into for purposes other than economically hedging our commodity price-risk exposure. The fair value of our trading derivatives was zero at September 30, 2017 and December 31, 2016. The value at risk for contracts held for trading purposes was zero at September 30, 2017 and December 31, 2016.
Nontrading
Our nontrading portfolio consists of derivative contracts that hedge or could potentially hedge the price risk exposure from our energy commodity purchases and sales. The fair value of our derivatives not designated as hedging instruments was a net asset of $13 million and net liability of $177 million at September 30, 2017 and December 31, 2016, respectively.
The value at risk for derivative contracts held for nontrading purposes was $44 million at September 30, 2017 and $47 million at December 31, 2016. During the last 12 months, our value at risk for these contracts ranged from a high of $47 million to a low of $33 million.
Item 4. Controls and Procedures
Our management, including our Chief Executive Officer and Chief Financial Officer, does not expect that our disclosure controls and procedures (as defined in Rules 13a-15(e) and 15d-15(e) of the Securities Exchange Act) (“Disclosure Controls”) or our internal control over financial reporting (“Internal Controls”) will prevent all errors and all fraud. A control system, no matter how well conceived and operated, can provide only reasonable, not absolute, assurance that the objectives of the control system are met. Further, the design of a control system must reflect the fact that there are resource constraints, and the benefits of controls must be considered relative to their costs. Because of the inherent limitations in all control systems, no evaluation of controls can provide absolute assurance that all control issues and instances of fraud, if any, within the Company have been detected. These inherent limitations include the realities that judgments in decision-making can be faulty and that breakdowns can occur because of simple error or mistake. Additionally, controls can be circumvented by the individual acts of some persons, by collusion of two or more people or by management override of the control. The design of any system of controls is also based in part upon certain assumptions about the likelihood of future events, and there can be no assurance that any design will succeed in achieving its stated goals under all potential future conditions. Because of the inherent limitations in a cost-effective control system, misstatements due to error or fraud may occur and not be detected. We monitor our Disclosure Controls and Internal Controls and make modifications as necessary; our intent in this regard is that the Disclosure Controls and Internal Controls will be modified as systems change and conditions warrant.
Evaluation of Disclosure Controls and Procedures
An evaluation of the effectiveness of the design and operation of our Disclosure Controls was performed as of the end of the period covered by this report. This evaluation was performed under the supervision and with the participation of our management, including our Chief Executive Officer and Chief Financial Officer. Based upon that evaluation, our Chief Executive Officer and Chief Financial Officer concluded that these Disclosure Controls are effective at a reasonable assurance level.
Changes in Internal Control over Financial Reporting
There have been no changes during the third quarter of 2017 that have materially affected, or are reasonably likely to materially affect, our internal controls over financial reporting.
Part II. OTHER INFORMATION
Item 1. Legal Proceedings
See Note 9 of Notes to Consolidated Financial Statements included under Part I, Item 1. Financial Statements of this report, which information is incorporated by reference into this item.
36
Item 1A. Risk Factors
Part I, Item 1A. Risk Factors in our Annual Report on Form 10-K, for the year ended December 31, 2016, includes certain risk factors that could materially affect our business, financial condition or future results. Those risk factors have not materially changed as of September 30, 2017.
Item 2. Unregistered Sales of Equity Securities and Use of Proceeds
Not applicable.
Item 3. Defaults Upon Senior Securities
Not applicable.
Item 4. Mine Safety Disclosures
Not applicable.
Item 5. Other Information
Not applicable.
37
EXHIBITS
Exhibit No. | Description | |
Agreement and Plan of Merger, dated October 2, 2014, by and among Pluspetrol Resources Corporation, Pluspetrol Black River Corporation and Apco Oil and Gas International Inc. (incorporated herein by reference to Exhibit 2.1 to WPX Energy, Inc.’s Current Report on Form 8-K filed with the SEC on October 7, 2014) | ||
2.2** | Agreement and Plan of Merger, dated as of July 13, 2015, by and among RKI Exploration & Production, LLC, WPX Energy, Inc. and Thunder Merger Sub LLC (incorporated herein by reference to Exhibit 2.1 to WPX Energy, Inc.’s Current Report on Form 8-K filed with the SEC on July 14, 2015) | |
2.3** | Membership Interest Purchase Agreement by and Among WPX Energy Holdings, LLC, as Seller, WPX Energy, Inc., solely for purposes of Section 14.15, and Terra Energy Partners LLC, as Purchaser, dated February 8, 2016 (incorporated herein by reference to Exhibit 2.1 to WPX Energy, Inc.’s Current Report on Form 8-K filed with the SEC on February 9, 2016) | |
2.4** | Purchase and Sale Agreement, dated as of January 12, 2017, by and among RKI Exploration & Production, LLC, Panther Energy Company II, LLC and CP2 Operating, LLC (incorporated herein by reference to Exhibit 2.1 to WPX Energy, Inc.’s Current Report on Form 8-K filed with the SEC on March 13, 2017) | |
Restated Certificate of Incorporation of WPX Energy, Inc. (incorporated herein by reference to Exhibit 3.1 to WPX Energy, Inc.’s Current Report on Form 8-K filed with the SEC on January 6, 2012) | ||
Certificate of Amendment of Amended and Restated Certificate of Incorporation of WPX Energy, Inc. (incorporated herein by reference to Exhibit 3.1 to WPX Energy, Inc.’s Current Report on Form 8-K filed with the SEC on July 14, 2015) | ||
Amended and Restated Bylaws of WPX Energy, Inc. (incorporated herein by reference to Exhibit 3.1 to WPX Energy, Inc.’s Current Report on Form 8-K filed with the SEC on March 21, 2014) | ||
Certificate of Designations for 6.25% Series A Mandatory Convertible Preferred Stock (incorporated herein by reference to Exhibit 3.1 to WPX Energy, Inc.’s Current Report on Form 8-K filed with the SEC on July 22, 2015) | ||
Indenture, dated as of November 14, 2011, between WPX Energy, Inc. and The Bank of New York Mellon Trust Company, N.A., as trustee (incorporated herein by reference to Exhibit 4.1 to The Williams Companies, Inc.’s Current Report on Form 8-K (File No. 001-04174) filed with the SEC on November 15, 2011) | ||
Indenture, dated as of September 8, 2014, between WPX Energy, Inc. and The Bank of New York Mellon Trust Company, N.A., as trustee (incorporated herein by reference to Exhibit 4.1 to WPX Energy, Inc.’s Current Report on Form 8-K filed with the SEC on September 8, 2014) | ||
First Supplemental Indenture, dated as of September 8, 2014, between WPX Energy, Inc. and The Bank of New York Mellon Trust Company, N.A., as trustee (incorporated herein by reference to Exhibit 4.2 to WPX Energy, Inc.’s Current Report on Form 8-K filed with the SEC on September 8, 2014) | ||
Second Supplemental Indenture, dated as of July 22, 2015, between WPX Energy, Inc. and The Bank of New York Mellon Trust Company, N.A., as trustee (incorporated herein by reference to Exhibit 4.1 to WPX Energy, Inc.’s Current Report on Form 8-K filed with the SEC on July 22, 2015) | ||
Separation and Distribution Agreement, dated as of December 30, 2011, between The Williams Companies, Inc. and WPX Energy, Inc. (incorporated herein by reference to Exhibit 10.1 to WPX Energy, Inc.’s Annual Report on Form 10-K for the year ended December 31, 2011) | ||
Employee Matters Agreement, dated as of December 30, 2011, between The Williams Companies, Inc. and WPX Energy, Inc. (incorporated herein by reference to Exhibit 10.2 to WPX Energy, Inc.’s Current Report on Form 8-K filed with the SEC on January 6, 2012) | ||
Tax Sharing Agreement, dated as of December 30, 2011, between The Williams Companies, Inc. and WPX Energy, Inc. (incorporated herein by reference to Exhibit 10.3 to WPX Energy, Inc.’s Current Report on Form 8-K filed with the SEC on January 6, 2012) | ||
WPX Energy, Inc. 2013 Incentive Plan (incorporated herein by reference to Exhibit 4.1 to WPX Energy, Inc.’s Current Report on Form 8-K filed with the SEC on May 29, 2013) (1) | ||
WPX Energy, Inc. 2011 Employee Stock Purchase Plan (incorporated herein by reference to Exhibit 4.4 to WPX Energy, Inc.’s registration statement on Form S-8 (File No. 333-178388) filed with the SEC on December 8, 2011) (1) | ||
38
Exhibit No. | Description | |
Form of Restricted Stock Agreement between WPX Energy, Inc. and Non-Employee Directors (incorporated herein by reference to Exhibit 10.13 to WPX Energy, Inc.’s Annual Report on Form 10-K for the year ended December 31, 2011) (1) | ||
Form of Restricted Stock Agreement between WPX Energy, Inc. and Executive Officers (incorporated herein by reference to Exhibit 10.13 to WPX Energy, Inc.’s Annual Report on Form 10-K for the year ended December 31, 2014) (1) | ||
Form of Restricted Stock Unit Agreement between WPX Energy, Inc. and Executive Officers (incorporated herein by reference to Exhibit 10.14 to WPX Energy, Inc.’s Annual Report on Form 10-K for the year ended December 31, 2014) (1) | ||
Form of Performance-Based Restricted Stock Unit Agreement between WPX Energy, Inc. and Executive Officers (incorporated herein by reference to Exhibit 10.15 to WPX Energy, Inc.’s Quarterly Report on Form 10-Q for the quarter ended March 31, 2015) (1) | ||
Form of Stock Option Agreement between WPX Energy, Inc. and Section 16 Executive Officers (incorporated herein by reference to Exhibit 10.15 to WPX Energy, Inc.’s Quarterly Report on Form 10-Q for the quarter ended March 31, 2014) (1) | ||
WPX Energy Nonqualified Deferred Compensation Plan, effective January 1, 2013 (incorporated herein by reference to Exhibit 10.16 to WPX Energy, Inc.’s Annual Report on Form 10-K for the year ended December 31, 2012) (1) | ||
WPX Energy Board of Directors Nonqualified Deferred Compensation Plan, effective January 1, 2013 (incorporated herein by reference to Exhibit 10.17 to WPX Energy, Inc.’s Annual Report on Form 10-K for the year ended December 31, 2012) (1) | ||
Retirement Agreement, dated December 16, 2013, between WPX Energy, Inc. and Ralph A. Hill (incorporated herein by reference to Exhibit 10.1 to WPX Energy, Inc.’s Current Report on Form 8-K filed with the SEC on December 17, 2013) | ||
Employment Agreement, dated April 29, 2014, between WPX Energy, Inc. and Richard E. Muncrief (incorporated herein by reference to Exhibit 10.1 to WPX Energy, Inc.’s Current Report on Form 8-K filed with the SEC on May 2, 2014) (1) | ||
Form of Nonqualified Stock Option Agreement between WPX Energy, Inc. and Richard E. Muncrief (incorporated herein by reference to Exhibit 10.2 to WPX Energy, Inc.’s Current Report on Form 8-K filed with the SEC on May 2, 2014) (1) | ||
Form of 2014 Time-Based Restricted Stock Unit Agreement between WPX Energy, Inc. and Richard E. Muncrief (incorporated herein by reference to Exhibit 10.3 to WPX Energy, Inc.’s Current Report on Form 8-K filed with the SEC on May 2, 2014) (1) | ||
Form of 2014 Performance-Based Restricted Stock Unit Agreement between WPX Energy, Inc. and Richard E. Muncrief (incorporated herein by reference to Exhibit 10.4 to WPX Energy, Inc.’s Current Report on Form 8-K filed with the SEC on May 2, 2014) (1) | ||
Form of Time-Based Restricted Stock Unit Inducement Award Agreement between WPX Energy, Inc. and Richard E. Muncrief (incorporated herein by reference to Exhibit 10.5 to WPX Energy, Inc.’s Current Report on Form 8-K filed with the SEC on May 2, 2014) (1) | ||
Form of Performance-Based Restricted Stock Unit Inducement Award Agreement between WPX Energy, Inc. and Richard E. Muncrief (incorporated herein by reference to Exhibit 10.6 to WPX Energy, Inc.’s Current Report on Form 8-K filed with the SEC on May 2, 2014) (1) | ||
Form of Restricted Stock Unit Award between WPX Energy, Inc. and Non-Employee Directors (incorporated herein by reference to Exhibit 10.1 to WPX Energy, Inc.’s Current Report on Form 8-K filed with the SEC on September 3, 2014) (1) | ||
Separation and Release Agreement, dated July 28, 2014, between WPX Energy, Inc. and James J. Bender (incorporated herein by reference to Exhibit 10.2 to WPX Energy, Inc.’s Current Report on Form 8-K filed with the SEC on September 3, 2014) (1) | ||
39
Exhibit No. | Description | |
Amended and Restated Credit Agreement, dated as of October 28, 2014, by and among WPX Energy, Inc., the lenders party thereto, and Citibank, N.A., as Administrative Agent and Swingline Lender (incorporated herein by reference to Exhibit 10.1 to WPX Energy, Inc.’s Current Report on Form 8-K filed with the SEC on November 3, 2014) | ||
Form of Voting and Support Agreement, dated as of July 13, 2015, by and between WPX Energy, Inc. and the Member signatory thereto (incorporated herein by reference to Exhibit 10.1 to WPX Energy, Inc.’s Current Report on Form 8-K filed with the SEC on July 14, 2015) | ||
First Amendment to the Amended and Restated Credit Agreement, dated as of July 16, 2015, by and among WPX Energy, Inc., the lenders party thereto, and Citibank, N.A., as existing Administrative Agent and existing Swingline Lender, and Wells Fargo Bank, National Association, as successor Administrative Agent and successor Swingline Lender (incorporated herein by reference to Exhibit 10.1 to WPX Energy, Inc.’s Current Report on Form 8-K filed with the SEC on July 22, 2015) | ||
Commitment Increase Agreement for Amended and Restated Credit Agreement, dated as of July 31, 2015, among WPX Energy, Inc., the Lenders party thereto, Wells Fargo Bank, National Association, as Administrative Agent, and the Issuing Banks thereto (incorporated by reference to Exhibit 10.1 to WPX Energy, Inc.’s Current Report on Form 8-K filed with the SEC on August 6, 2015) | ||
Registration Rights Agreement dated August 17, 2015, among WPX Energy, Inc. and the signatures thereto (incorporated herein by reference to Exhibit 10.35 to WPX Energy, Inc.’s Quarterly Report on Form 10-Q for the quarter ended September 30, 2015) | ||
Second Amendment to the Amended and Restated Credit Agreement, dated as of March 18, 2016, by and among WPX Energy, Inc., as the borrower thereunder, the financial institutions party thereto from time to time, as lenders, and Wells Fargo Bank, National Association, as Administrative Agent and Swingline Lender (incorporated herein by reference to Exhibit 10.1 to WPX Energy, Inc.’s Current Report on Form 8-K filed with the SEC on March 22, 2016) | ||
Form of Performance-Based Restricted Stock Unit Agreement between WPX Energy, Inc. and Executive Officers (incorporated herein by reference to Exhibit 10.32 to WPX Energy, Inc.’s Quarterly Report on Form 10-Q for the quarter ended June 30, 2016) (1) | ||
Form of Severance and Restrictive Covenant Agreement between WPX Energy, Inc. and Marcia MacLeod (incorporated herein by reference to Exhibit 10.33 to WPX Energy, Inc.’s Quarterly Report on Form 10-Q for the quarter ended June 30, 2016) (1) | ||
Form of Severance and Restrictive Covenant Agreement between WPX Energy, Inc. and Michael Fiser (incorporated herein by reference to Exhibit 10.33 to WPX Energy, Inc.’s Quarterly Report on Form 10-Q for the quarter ended September 30, 2016) (1) | ||
Form of Amended and Restated Change in Control Agreement between WPX Energy, Inc. and CEO (incorporated herein by reference to Exhibit 10.1 to WPX Energy, Inc.’s Current Report on Form 8-K filed with the SEC on November 16, 2016) (1) | ||
Form of Amended and Restated Change in Control Agreement between WPX Energy, Inc. and Tier One Executives (incorporated herein by reference to Exhibit 10.2 to WPX Energy, Inc.’s Current Report on Form 8-K filed with the SEC on November 16, 2016) (1) | ||
Amended and Restated WPX Energy Executive Severance Pay Plan (incorporated herein by reference to Exhibit 10.1 to WPX Energy, Inc.’s Current Report on Form 8-K filed with the SEC on May 23, 2017) (1) | ||
12* | Computation of Ratio of Earnings to Fixed Charges | |
31.1* | Certification by the Chief Executive Officer Pursuant to Section 302 of the Sarbanes-Oxley Act of 2002 | |
31.2* | Certification by the Chief Financial Officer Pursuant to Section 302 of the Sarbanes-Oxley Act of 2002 | |
32.1* | Certification by the Chief Executive Officer and the Chief Financial Officer Pursuant to Section 906 of the Sarbanes-Oxley Act of 2002 | |
101.INS* | XBRL Instance Document | |
101.SCH* | XBRL Taxonomy Extension Schema | |
101.CAL* | XBRL Taxonomy Extension Calculation Linkbase | |
101.DEF* | XBRL Taxonomy Extension Definition Linkbase | |
40
Exhibit No. | Description | |
101.LAB* | XBRL Taxonomy Extension Label Linkbase | |
101.PRE* | XBRL Taxonomy Extension Presentation Linkbase | |
* | Filed herewith |
** | All schedules to the Agreement have been omitted pursuant to Item 601(b)(2) of Regulation S-K. A copy of any omitted schedule and/or exhibit will be furnished to the SEC upon request |
(1) | Management contract or compensatory plan or arrangement |
41
SIGNATURE
Pursuant to the requirements of the Securities Exchange Act of 1934, the registrant has duly caused this report to be signed on its behalf by the undersigned, thereunto duly authorized.
WPX Energy, Inc. (Registrant) | |||
By: | /s/ Stephen L. Faulkner | ||
Stephen L. Faulkner Controller (Principal Accounting Officer) | |||
Date: November 2, 2017
42