Attached files
| file | filename |
|---|---|
| 8-K - FORM 8-K - SYNOVUS FINANCIAL CORP | d483599d8k.htm |
Exhibit 99.1
Synovus Financial Corp.
BancAnalysts Association of Boston
Kessel Stelling, Chairman and CEO
November 2, 2017
1
Forward Looking Statements
This slide presentation and certain of our filings with the Securities and Exchange Commission contain statements that constitute “forward-looking
statements” within the meaning of, and subject to the protections of, Section 27A of the Securities Act of 1933, as amended, and Section 21E of the Securities Exchange Act of 1934, as amended. All statements other than statements of
historical fact are forward- looking statements. You can identify these forward-looking statements through Synovus’ use of words such as “believes,” “anticipates,” “expects,” “may,” “will,”
“assumes,” “should,” “predicts,” “could,” “should,” “would,” “intends,” “targets,” “estimates,” “projects,” “plans,” “potential”
and other similar words and expressions of the future or otherwise regarding the outlook for Synovus’ future business and financial performance and/or the performance of the banking industry and economy in general. These forward-looking
statements include, among others, statements on (1) future loan growth; (2) future deposit growth; (3) future net interest income and net interest margin; (4) future adjusted non-interest
income; (5) future non-interest expense levels and efficiency ratios; (6) future credit trends and key metrics; (7) future effective tax rates; (8) our strategy and initiatives for future
growth, capital management, strategic transactions, our brand initiative and financial planning; (9) our expectations related to the anticipated benefits of certain transactions and initiatives, including those related to the Cabela’s
transaction and debt redemption; and (10) our assumptions underlying these expectations. Prospective investors are cautioned that any such forward-looking statements are not guarantees of future performance and involve known and unknown risks
and uncertainties which may cause the actual results, performance or achievements of Synovus to be materially different from the future results, performance or achievements expressed or implied by such forward-looking statements. Forward-looking
statements are based on the information known to, and current beliefs and expectations of, Synovus’ management and are subject to significant risks and uncertainties. Actual results may differ materially from those contemplated by such
forward-looking statements. A number of factors could cause actual results to differ materially from those contemplated by the forward-looking statements in this presentation. Many of these factors are beyond Synovus’ ability to control or
predict. These forward-looking statements are based upon information presently known to Synovus’ management and are inherently subjective, uncertain and subject to change due to any number of risks and uncertainties, including, without
limitation, the risks and other factors set forth in Synovus’ filings with the Securities and Exchange Commission, including its Annual Report on Form 10-K for the year ended December 31, 2016 under
the captions “Cautionary Notice Regarding Forward-Looking Statements” and “Risk Factors” and in Synovus’ quarterly reports on Form 10-Q and current reports on Form 8-K. We believe these forward-looking statements are reasonable; however, undue reliance should not be placed on any forward-looking statements, which are based on current expectations and speak only as of the date
that they are made. We do not assume any obligation to update any forward- looking statements as a result of new information, future developments or otherwise, except as otherwise may be required by law. Use of
Non-GAAP Financial Measures This slide presentation contains certain non-GAAP financial measures determined by methods other than in accordance with generally accepted
accounting principles. Such non-GAAP financial measures include the following: adjusted diluted earnings per share; adjusted return on average assets; adjusted return on average common equity; adjusted return
on average tangible common equity; loan growth excluding transfers to held-for-sale; net charge-off ratio excluding charge-offs
on loans transferred to held-for-sale; average deposit growth excluding WFB deposits; average core transaction deposits; cost of interest bearing core deposits; total
adjusted revenues; adjusted non-interest income; adjusted non-interest expense; adjusted efficiency ratio; tangible common equity ratio; and common equity Tier 1 (CET1)
ratio (fully phased-in). The most comparable GAAP measures to these measures are diluted earnings per share; return on average assets; return on average common equity; loan growth; net charge-off ratio; total average deposits; effective cost of funds; total non-interest income; total non-interest expense; efficiency
ratio; total shareholders’ equity to total assets ratio; and CET1 ratio, respectively. Management uses these non- GAAP financial measures to assess the performance of Synovus’ business and the
strength of its capital position. Management believes that these non-GAAP financial measures provide meaningful additional information about Synovus to assist management, investors, and bank regulators in
evaluating Synovus’ operating results, financial strength, the performance of its business and the strength of its capital position. However, these non-GAAP financial measures have inherent limitations as
analytical tools and should not be considered in isolation or as a substitute for analyses of operating results or capital position as reported under GAAP. The non-GAAP financial measures should be considered
as additional views of the way our financial measures are affected by significant items and other factors, and since they are not required to be uniformly applied, they may not be comparable to other similarly titled measures at other companies.
Adjusted diluted earnings per share, adjusted return on average assets, and adjusted return on average common equity are measures used by management to evaluate operating results exclusive of items that are not indicative of ongoing operations and
impact period-to-period comparisons. Adjusted return on average tangible common equity is a measure used by management to compare Synovus’ performance with other
financial institutions because it calculates the return available to common shareholders without the impact of intangible assets and their related amortization, thereby allowing management to evaluate the performance of the business consistently.
Loan growth excluding transfers to held-for-sale is a measure used by management to evaluate organic loan growth exclusive of loans transferred to held-for-sale and the net charge-off ratio excluding charge-offs on loans transferred to held-for- sale is a measure used by management to evaluate charge-offs exclusive of charge-offs on loans transferred to
held-for-sale. Average core transaction deposits is a measure used by management to evaluate organic growth of deposits and the quality of deposits as a funding source.
The cost of interest bearing core deposits is a measure used to evaluate the cost of deposits as a funding source exclusive of brokered deposits and non-interest bearing deposits. Total adjusted revenues and
adjusted non-interest income are measures used by management to evaluate total revenue and non-interest income exclusive of net investment securities gains/losses and
changes in fair value of private equity investments, net, and the Cabela’s transaction fee. Adjusted non-interest expense and the adjusted efficiency ratio are measures utilized by management to measure
the success of expense management initiatives focused on reducing recurring controllable operating costs. The tangible common equity ratio and common equity Tier 1 (CET1) ratio (fully phased-in) are used by
management and bank regulators to assess the strength of our capital position. The computations of the non- GAAP financial measures used in this slide presentation are set forth in the Appendix to this slide
presentation. 2
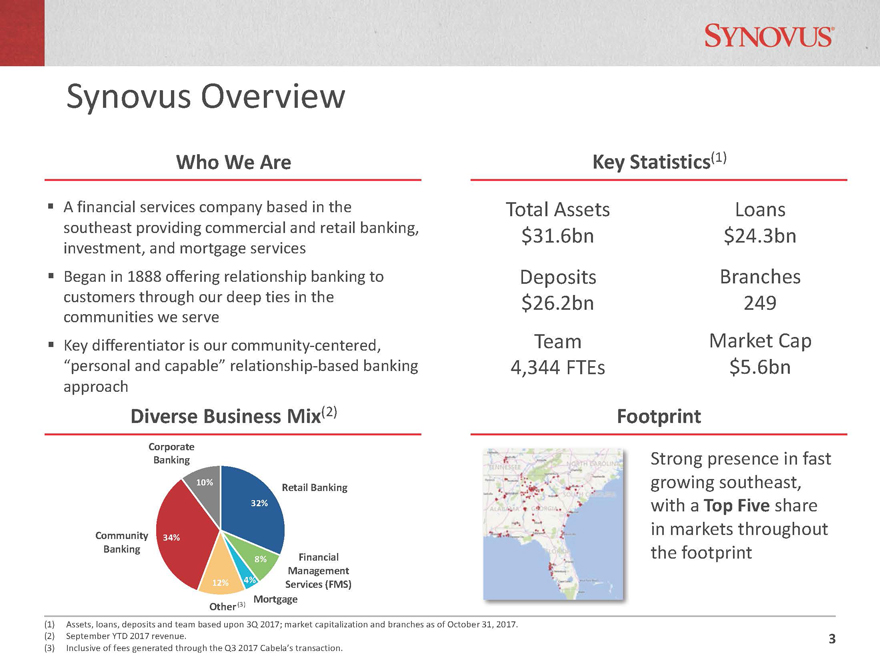
Retail Banking Financial Management Services (FMS)
Mortgage Other Community Banking Corporate Banking
32% 8% 12% 4% 34% 10%
Synovus Overview (1) Assets, loans, deposits and team based upon 3Q 2017; market capitalization and branches as of October 31, 2017. (2) September YTD 2017 revenue. (3)
Inclusive of fees generated through the Q3 2017 Cabela’s transaction.
A financial services company based in the southeast providing commercial and retail
banking, investment, and mortgage services
Began in 1888 offering relationship banking to customers through our deep ties in the communities we serve § Key
differentiator is our community-centered, “personal and capable” relationship-based banking approach Who We Are Key Statistics(1)
Total Assets $31.6bn
Loans $24.3bn Deposits $26.2bn Team 4,344 FTEs Branches 249 Market Cap $5.6bn
Diverse Business Mix(2) Footprint Strong presence in fast growing southeast, with a
Top Five share in markets throughout the footprint 3
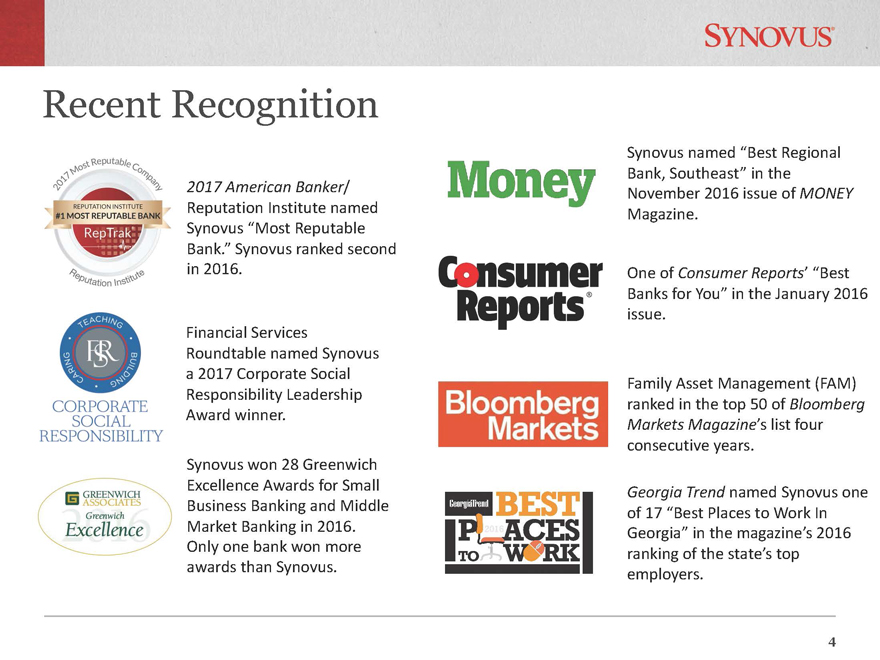
Recent Recognition
2017
American Banker/ Reputation Institute named Synovus “Most Reputable
Bank.” Synovus ranked second in 2016.
Synovus won 28 Greenwich Excellence Awards for Small Business Banking and Middle Market Banking in 2016.
Only one bank won more awards than Synovus. Synovus named “Best Regional Bank, Southeast” in the November 2016 issue of MONEY Magazine. Financial Services Roundtable
named Synovus a 2017 Corporate Social Responsibility Leadership Award winner. Family Asset Management (FAM) ranked in the top 50 of Bloomberg Markets Magazine’s list four consecutive years.
One of Consumer Reports’ “Best Banks for You” in the January 2016 issue. Georgia Trend named Synovus one of 17 “Best Places to Work In Georgia” in the
magazine’s 2016 ranking of the state’s top employers. 4
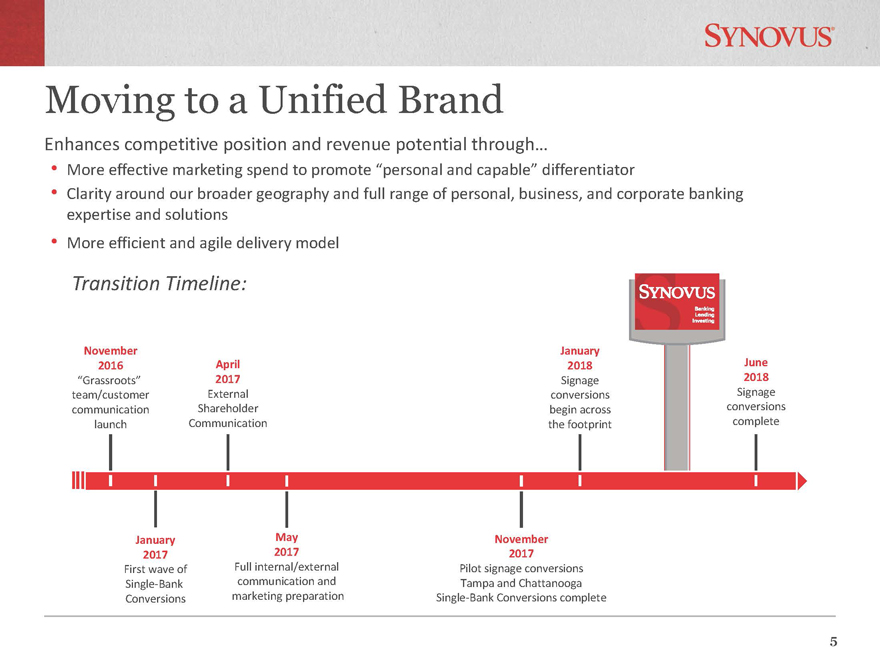
Transition Timeline:
November 2016
“Grassroots” team/customer Communication launch
April 2017 ExternalShareholder Communication May 2017
Full internal/external
communication and marketing preparation November 2017
Pilot signage conversions Tampa and Chattanooga Single-Bank Conversions complete January 2018 Signage
conversions begin across the footprint June 2018 Signage conversions complete Enhances competitive position and revenue potential through…
• More
effective marketing spend to promote “personal and capable” differentiator
• Clarity around our broader geography and full range of personal,
business, and corporate banking expertise and solutions
• More efficient and agile delivery model Moving to a Unified Brand January 2017
First wave of Single-Bank Conversions 5
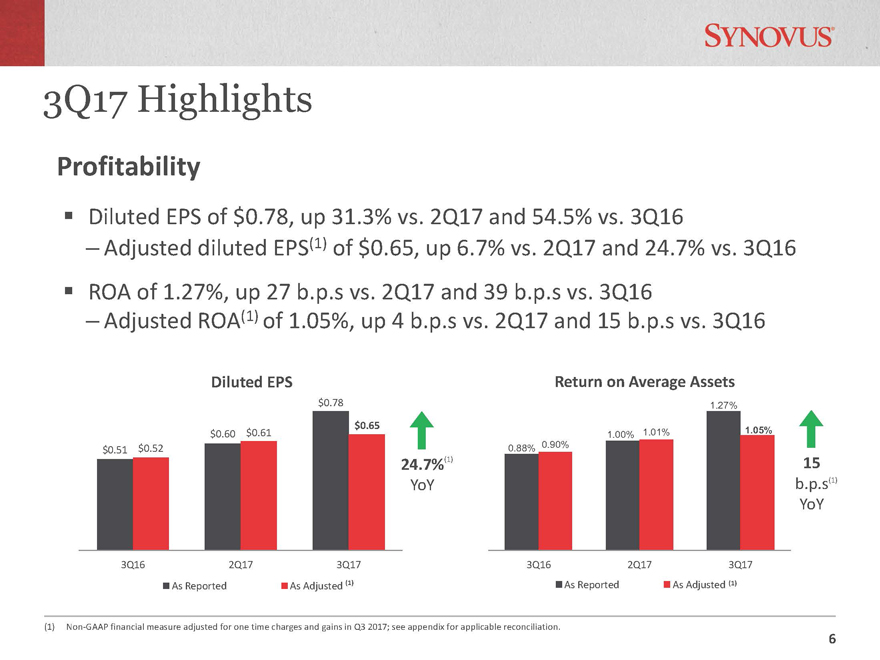
0.88%
1.00%
1.27%
0.90%
1.01% 1.05%
3Q16 2Q17 3Q17
As Reported As Adjusted $0.51 $0.60 $0.78 $0.52 $0.61 $0.65 3Q16 2Q17 3Q17 As Reported As Adjusted
(1) Non-GAAP financial measure adjusted for one time charges and gains in Q3 2017; see appendix for applicable reconciliation.
Return on Average Assets § Diluted EPS of $0.78, up 31.3% vs. 2Q17 and 54.5% vs. 3Q16
– Adjusted diluted EPS(1) of $0.65, up 6.7% vs. 2Q17 and 24.7% vs. 3Q16 § ROA of 1.27%, up 27 b.p.s vs. 2Q17 and 39 b.p.s vs. 3Q16 – Adjusted ROA(1)
of 1.05%, up 4 b.p.s vs. 2Q17 and 15 b.p.s vs. 3Q16 (1) (1)
Profitability 3Q17 Highlights Diluted EPS 24.7% YoY (1) 15 b.p.s YoY (1) 6
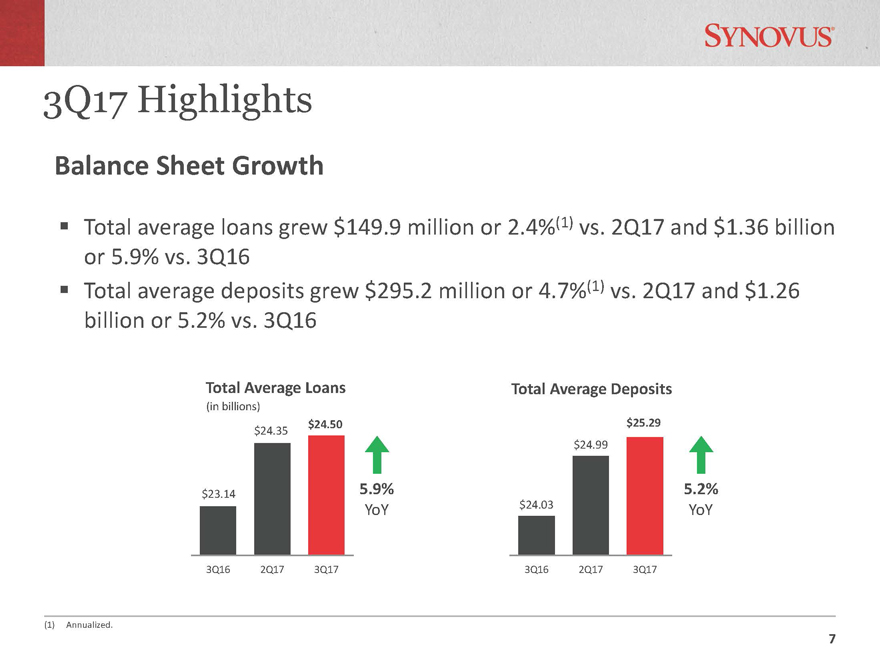
$24.03
$24.99
$25.29
3Q16 2Q17 3Q17
$23.14
$24.35 $24.50
3Q16 2Q17 3Q17
3Q17 Highlights
7
(1) Annualized.
Total average loans grew $149.9 million or 2.4%(1) vs. 2Q17 and $1.36 billion
or
5.9% vs. 3Q16
Total average deposits grew $295.2 million or 4.7%(1) vs. 2Q17 and $1.26
billion or 5.2% vs. 3Q16
Total Average Loans Total Average Deposits
(in billions)
Balance Sheet Growth
5.9%
YoY
5.2%
YoY
7
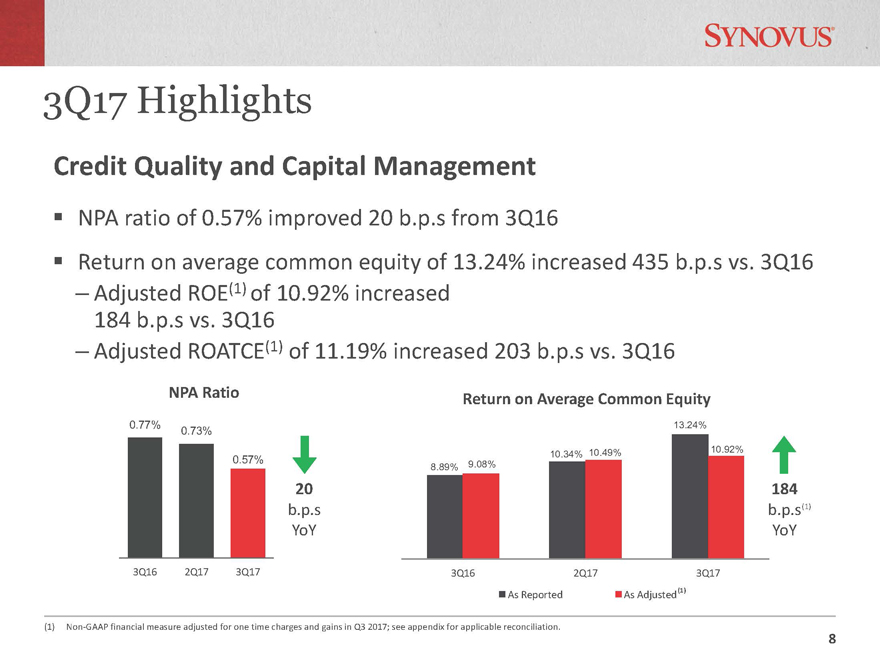
8.89% 10.34% 13.24% 9.08% 10.49% 10.92% 3Q16 2Q17 3Q17 As Reported As Adjusted 3Q17 Highlights 8
(1) Non-GAAP financial measure adjusted for one time charges and gains in Q3 2017; see appendix for applicable reconciliation.
NPA ratio of 0.57% improved 20 b.p.s from 3Q16 Return on average common equity of 13.24% increased 435 b.p.s vs. 3Q16
– Adjusted ROE(1) of 10.92% increased 184 b.p.s vs. 3Q16 – Adjusted ROATCE(1) of 11.19% increased 203 b.p.s vs. 3Q16 NPA Ratio Return on Average Common Equity 0.77% 0.73%
0.57% 3Q16 2Q17 3Q17
(1) Credit Quality and Capital Management 20 b.p.s YoY 184 b.p.s YoY (1) 8
Transaction with World’s Foremost Bank and Capital One
On September 25, 2017, Synovus Bank completed the acquisition of certain assets and
assumption of certain liabilities of World’s Foremost Bank (WFB), a wholly-owned subsidiary
of Cabela’s Incorporated.
Simultaneous with the above transaction, Synovus Bank sold the
credit card assets and
related liabilities to Capital One Bank (Capital One), while retaining WFB’s $1.1 billion
brokered time deposit portfolio.
– The acquired deposits have a weighted average
remaining maturity of approximately 2.53
years and a weighted average rate of 1.83%, which represented a discount to market rates
of approximately 14 b.p.s as of September 25, 2017.
3Q17
non-interest income includes a $75.0 million fee received from Cabela’s and Capital
One as part of the
transaction.
During the third quarter, concurrent with the transaction, Synovus initiated various balance
sheet restructuring actions which will continue into the fourth quarter. These actions are
expected to result in over 5% EPS accretion in 2018 through increased net interest income,
lower provision expense, and lower non-interest expense growth.
9
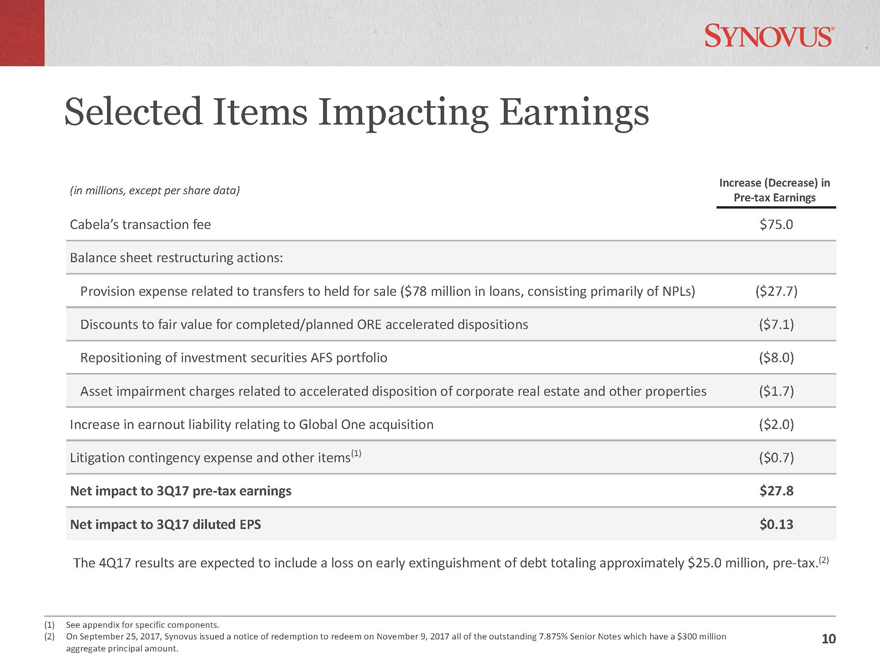
Selected Items Impacting Earnings
(1) See appendix for specific components.
(2) On September 25, 2017, Synovus issued a
notice of redemption to redeem on November 9, 2017 all of the outstanding 7.875% Senior Notes which have a $300 million aggregate principal amount.
(in
millions, except per share data) Increase (Decrease) in
Pre-tax Earnings
Cabela’s transaction fee $75.0
Balance sheet restructuring actions:
Provision expense related to transfers to held for sale ($78 million in loans, consisting primarily of NPLs) ($27.7)
Discounts to fair value for completed/planned ORE accelerated dispositions ($7.1)
Repositioning of investment securities AFS portfolio ($8.0)
Asset impairment
charges related to accelerated disposition of corporate real estate and other properties ($1.7)
Increase in earnout liability relating to Global One acquisition
($2.0)
Litigation contingency expense and other items(1) ($0.7)
Net impact to
3Q17 pre-tax earnings $27.8
Net impact to 3Q17 diluted EPS $0.13
The 4Q17 results are expected to include a loss on early extinguishment of debt totaling approximately $25.0 million, pre-tax.(2)
10
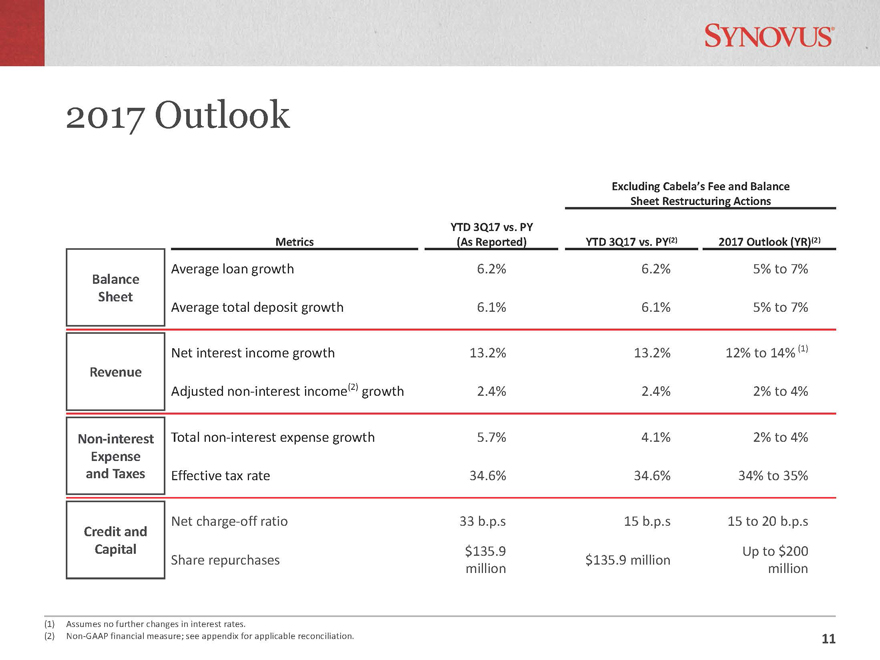
Excluding Cabela’s Fee and Balance
Sheet Restructuring Actions
Metrics
YTD 3Q17 vs. PY
(As Reported) YTD 3Q17 vs. PY(2) 2017 Outlook (YR)(2)
Balance
Sheet
Average loan growth 6.2% 6.2% 5% to 7%
Average total deposit growth 6.1% 6.1% 5% to 7%
Revenue
Net interest income growth 13.2% 13.2% 12% to 14% (1)
Adjusted non-interest income(2) growth 2.4% 2.4% 2% to 4%
Non-interest
Expense
and Taxes
Total non-interest expense growth 5.7% 4.1%
2% to 4%
Effective tax rate 34.6% 34.6% 34% to 35%
Credit and
Capital
Net charge-off ratio 33 b.p.s 15 b.p.s 15 to
20 b.p.s
Share repurchases $135.9
million $135.9 million Up to $200
million
2017 Outlook
(1) Assumes no further changes in interest rates.
(2)
Non-GAAP financial measure; see appendix for applicable reconciliation. 11
Financial and Strategic Objectives
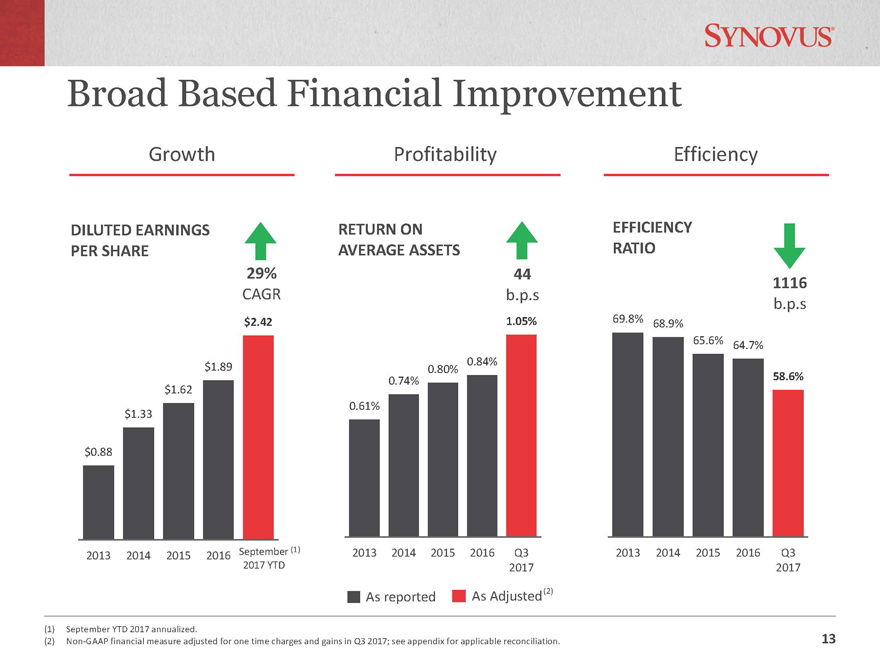
69.8% 68.9%
65.6% 64.7%
58.6%
2013 2014 2015 2016 Q3
2017
$0.88
$1.33
$1.62
$1.89
$2.42
2013 2014 2015 2016
Broad Based Financial Improvement
(1) September YTD 2017 annualized.
(2) Non-GAAP
financial measure adjusted for one time charges and gains in Q3 2017; see appendix for applicable reconciliation.
Growth Profitability Efficiency
DILUTED EARNINGS
PER SHARE
RETURN ON
AVERAGE ASSETS
EFFICIENCY
RATIO
29%
CAGR
44
b.p.s
1116
b.p.s
As reported As Adjusted(2)
September
2017 YTD
(1)
0.61%
0.74%
0.80% 0.84%
1.05%
2013 2014 2015 2016 Q3
2017
13
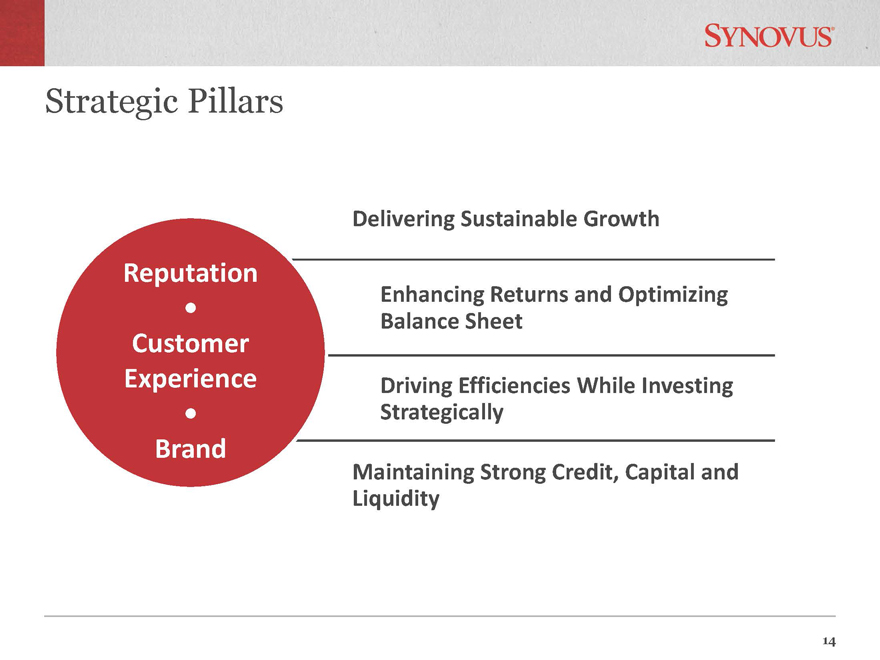
Strategic Pillars
Delivering Sustainable Growth
Enhancing Returns and Optimizing
Balance Sheet
Driving Efficiencies While Investing
Strategically
Maintaining Strong Credit, Capital and
Liquidity
Reputation
Customer
Experience
Brand
14
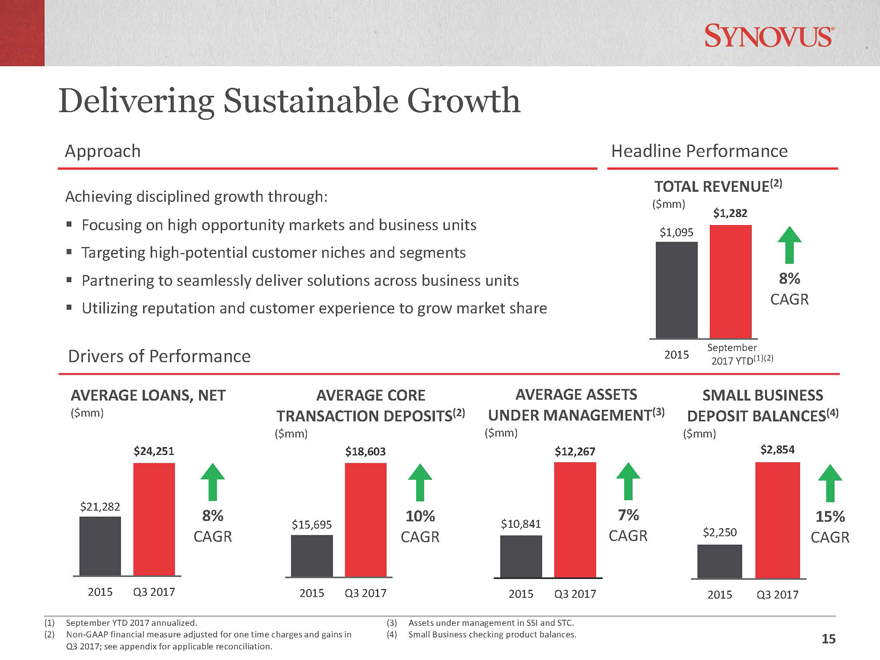
$1,095
$1,282
2015 September
2017 YTD Delivering Sustainable Growth
(1) September YTD 2017 annualized.
(2) Non-GAAP
financial measure adjusted for one time charges and gains in
Q3 2017; see appendix for applicable reconciliation.
AVERAGE LOANS, NET
($mm) AVERAGE CORE TRANSACTION DEPOSITS(2) ($mm)
(3) Assets under management in SSI and STC.
(4) Small Business checking product balances.
Approach Headline Performance Drivers of Performance
Achieving disciplined
growth through: Focusing on high opportunity markets and business units
Targeting high-potential customer niches and segments
Partnering to seamlessly deliver solutions across business units
Utilizing reputation and
customer experience to grow market share
8% CAGR AVERAGE ASSETS UNDER MANAGEMENT(3) ($mm) TOTAL REVENUE(2)
($mm) SMALL BUSINESS DEPOSIT BALANCES(4) ($mm) 8%
CAGR 10% CAGR 7% CAGR 15% CAGR
(1)(2) $21,282 $24,251 2015 Q3 2017 $15,695 $18,603 2015 Q3 2017 $10,841 $12,267
2015 Q3 2017
$2,250 $2,854 2015 Q3 2017 15
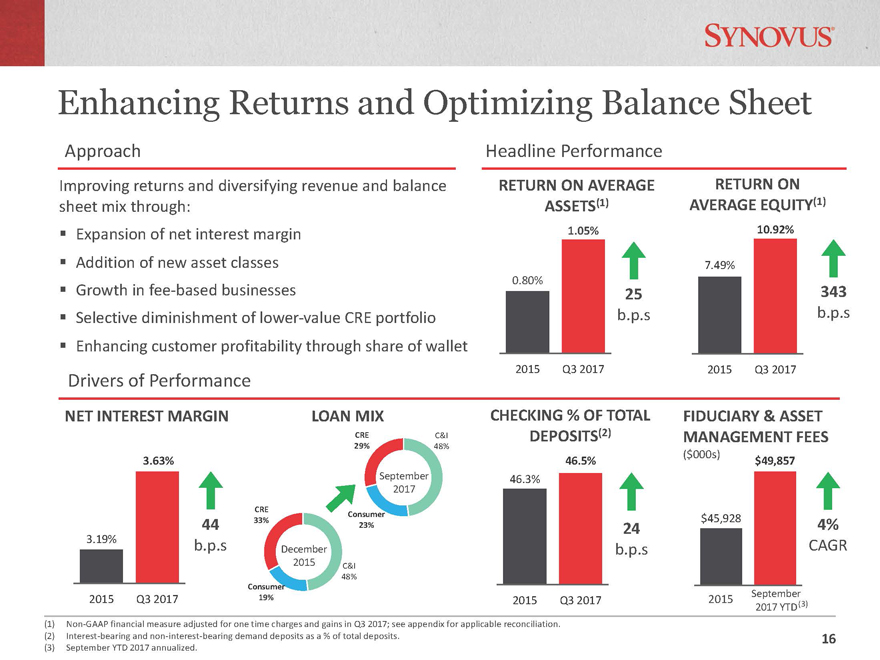
Enhancing Returns and Optimizing Balance Sheet 16
(1) Non-GAAP financial measure adjusted for one time charges and gains in Q3 2017; see appendix for applicable reconciliation.
(2) Interest-bearing and non-interest-bearing demand deposits as a % of total deposits.
(3) September YTD 2017 annualized.
NET INTEREST MARGIN LOAN MIX
Improving returns and diversifying revenue and balance sheet mix through:
§ Expansion of
net interest margin
§ Addition of new asset classes
§ Growth in fee-based businesses
§ Selective diminishment of lower-value CRE portfolio
§ Enhancing customer profitability through share of wallet
25 b.p.s 343 b.p.s
CHECKING % OF TOTAL DEPOSITS(2) FIDUCIARY & ASSET MANAGEMENT FEES ($000s)
RETURN ON
AVERAGE ASSETS(1)
24 b.p.s RETURN ON AVERAGE EQUITY(1) 44 b.p.s
4% CAGR
C&I 48% Consumer 19% CRE 33% C&I
48% Consumer 23% CRE 29% 0.80% 1.05% 2015 Q3 2017
7.49% 10.92% 2015 Q3 2017 3.19% 3.63% 2015 Q3 2017
46.3% 46.5% 2015 Q3 2017 $45,928 $49,857
Approach Headline Performance
Drivers of Performance December 2015 September 2017 YTD 2015 (3) September
2017 16
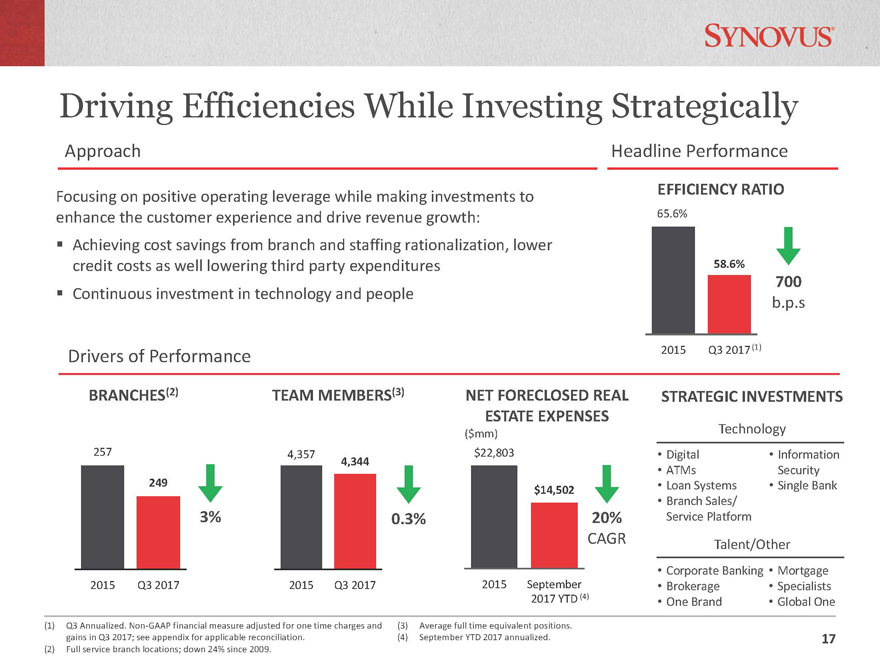
$22,803 $14,502 2015 September 2017 YTD 65.6% 58.6% 2015 Q3 2017
Driving Efficiencies While Investing Strategically
(1) Q3 Annualized. Non-GAAP financial measure adjusted for one time charges and gains in Q3 2017; see appendix for applicable reconciliation.
(2)
Full service branch locations; down 24% since 2009. BRANCHES(2) TEAM MEMBERS(3)
(3) Average full time equivalent positions.
(4) September YTD 2017 annualized. Focusing on positive operating leverage while making investments to
enhance the customer experience and drive revenue growth: Achieving cost savings from branch and staffing rationalization, lower credit costs as well lowering third party
expenditures Continuous investment in technology and people
700 b.p.s NET FORECLOSED REAL ESTATE EXPENSES ($mm) EFFICIENCY RATIO
3% 0.3% 20% CAGR
(1) STRATEGIC INVESTMENTS Technology Talent/Other • Digital • ATMs
• Loan Systems • Branch Sales/ Service Platform
• Information Security • Single Bank • Corporate Banking • Brokerage • One Brand
• Mortgage • Specialists (4) • Global One
257 249 2015 Q3 2017 4,357 4,344 2015 Q3 2017 Approach Headline Performance Drivers of Performance
17
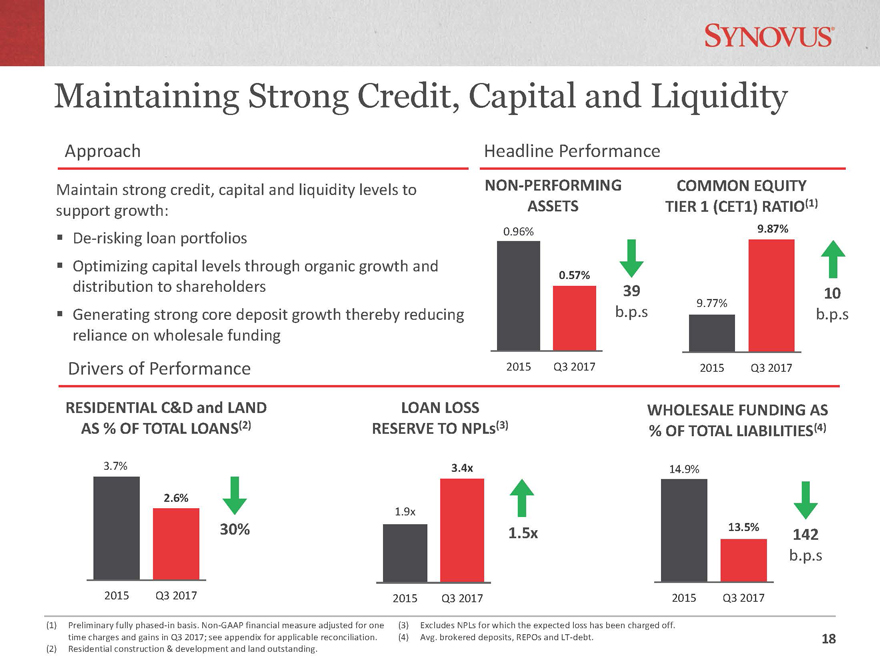
Maintaining Strong Credit, Capital and Liquidity
(1) Preliminary fully phased-in basis. Non-GAAP financial measure adjusted for one time charges and
gains in Q3 2017; see appendix for applicable reconciliation.
(2) Residential construction & development and land outstanding. Maintain strong credit,
capital and liquidity levels to support growth: De-risking loan portfolios Optimizing capital levels through organic growth and distribution to shareholders § Generating strong core deposit growth thereby
reducing reliance on wholesale funding 39
b.p.s
NON-PERFORMING ASSETS RESIDENTIAL C&D and LAND AS % OF TOTAL LOANS(2)
LOAN LOSS RESERVE TO NPLs(3) COMMON EQUITY TIER 1
(CET1) RATIO(1) WHOLESALE FUNDING AS % OF TOTAL LIABILITIES(4) 30% 1.5x 10 b.p.s 142 b.p.s (3) Excludes NPLs for which the expected loss has been charged off.
(4)
Avg. brokered deposits, REPOs and LT-debt. 0.96% 0.57% 2015 Q3 2017 9.77% 9.87% 2015 Q3 2017 3.7% 2.6%
2015 Q3 2017 1.9x
3.4x 2015 Q3 2017 14.9% 13.5% 2015 Q3 2017 Approach Headline Performance Drivers of Performance
18
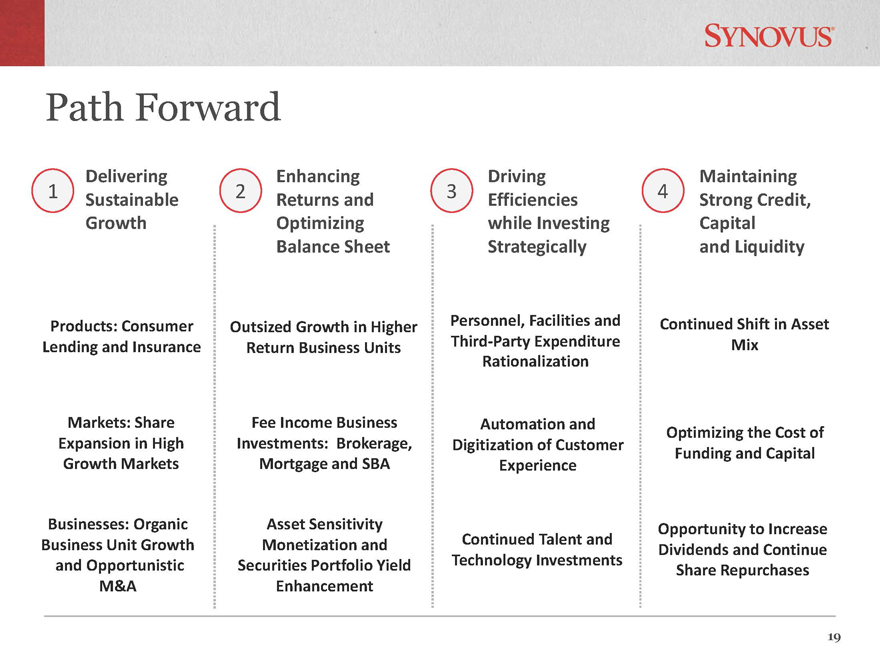
Path Forward 1 2 3 4 Products: Consumer Lending and Insurance
Markets: Share Expansion in High Growth Markets Businesses: Organic Business Unit Growth and Opportunistic M&A
Outsized Growth in Higher Return Business Units Fee Income Business Investments: Brokerage, Mortgage and SBA
Asset Sensitivity Monetization and Securities Portfolio Yield Enhancement Personnel, Facilities and Third-Party Expenditure Rationalization Automation and Digitization of Customer
Experience Continued Talent and Technology Investments
Continued Shift in Asset Mix Optimizing the Cost of Funding and Capital Opportunity to Increase Dividends
and Continue Share Repurchases
19 Enhancing Returns and Optimizing Balance Sheet Delivering Sustainable Growth Driving
Efficiencies while Investing Strategically Maintaining Strong Credit, Capital and Liquidity 19

Appendx
20
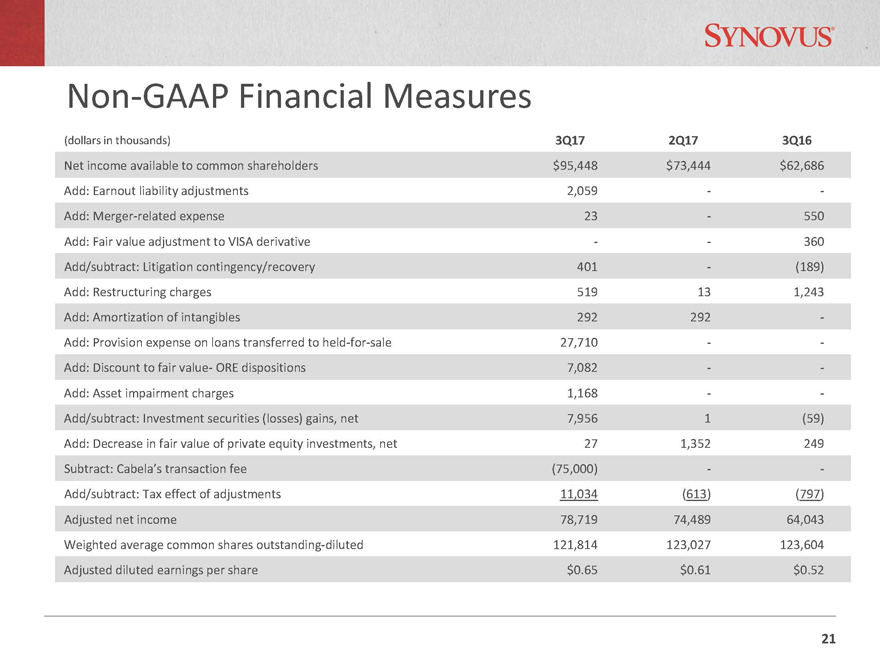
Non-GAAP Financial Measures
(dollars in thousands) 3Q17 2Q17 3Q16
Net income available to common shareholders $95,448
$73,444 $62,686
Add: Earnout liability adjustments 2,059 —
Add:
Merger-related expense 23—550
Add: Fair value adjustment to VISA derivative — 360
Add/subtract: Litigation contingency/recovery 401—(189)
Add: Restructuring charges 519 13
1,243
Add: Amortization of intangibles 292 292 -
Add: Provision expense on
loans transferred to held-for-sale 27,710 —
Add: Discount to fair value- ORE
dispositions 7,082 —
Add: Asset impairment charges 1,168 —
Add/subtract: Investment securities (losses) gains, net 7,956 1 (59)
Add:
Decrease in fair value of private equity investments, net 27 1,352 249
Subtract: Cabela’s transaction fee (75,000) —
Add/subtract: Tax effect of adjustments 11,034 (613) (797)
Adjusted net income 78,719 74,489
64,043
Weighted average common shares outstanding-diluted 121,814 123,027 123,604
Adjusted diluted earnings per share $0.65 $0.61 $0.52
21
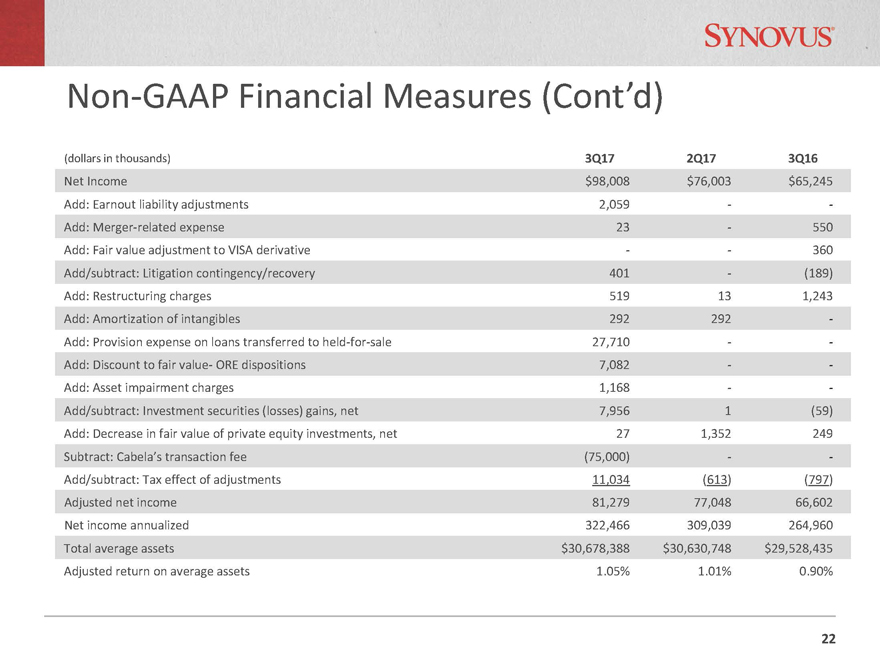
(dollars in thousands) 3Q17 2Q17 3Q16
Net Income $98,008 $76,003 $65,245
Add: Earnout liability adjustments 2,059 —
Add: Merger-related expense 23—550
Add: Fair value adjustment to VISA derivative —
360
Add/subtract: Litigation contingency/recovery 401—(189)
Add:
Restructuring charges 519 13 1,243
Add: Amortization of intangibles 292 292 -
Add: Provision expense on loans transferred to held-for-sale 27,710 —
Add: Discount to fair value- ORE dispositions 7,082 —
Add: Asset
impairment charges 1,168 —
Add/subtract: Investment securities (losses) gains, net 7,956 1 (59)
Add: Decrease in fair value of private equity investments, net 27 1,352 249
Subtract:
Cabela’s transaction fee (75,000) —
Add/subtract: Tax effect of adjustments 11,034 (613) (797)
Adjusted net income 81,279 77,048 66,602
Net income annualized 322,466 309,039 264,960
Total average assets $30,678,388 $30,630,748 $29,528,435
Adjusted return on
average assets 1.05% 1.01% 0.90%
Non-GAAP Financial Measures (Cont’d)
22
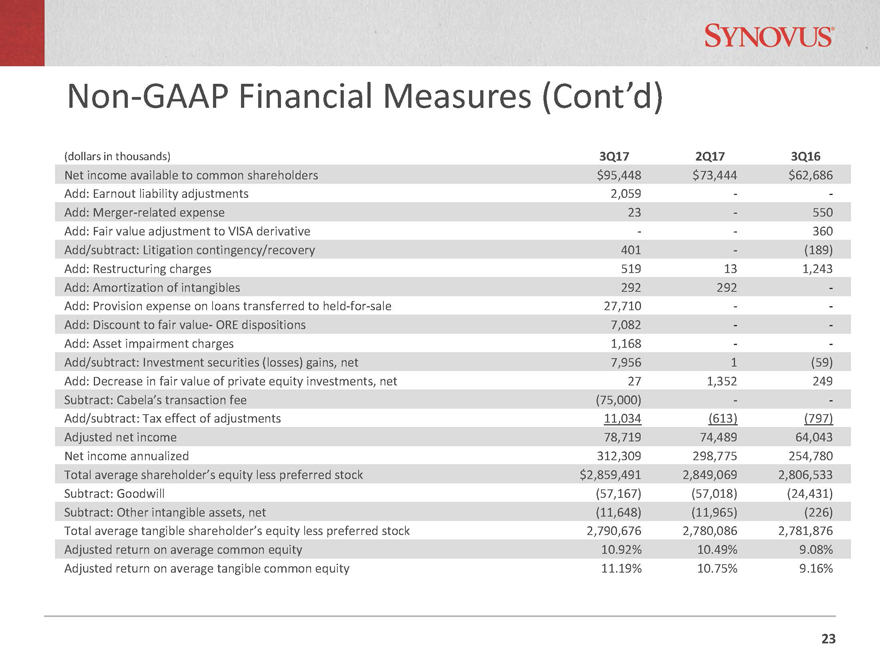
(dollars in thousands) 3Q17 2Q17 3Q16
Net income available to common shareholders $95,448 $73,444 $62,686
Add: Earnout liability
adjustments 2,059 —
Add: Merger-related expense 23—550
Add: Fair
value adjustment to VISA derivative — 360
Add/subtract: Litigation contingency/recovery 401—(189)
Add: Restructuring charges 519 13 1,243
Add: Amortization of intangibles 292 292 -
Add: Provision expense on loans transferred to held-for-sale 27,710 —
Add: Discount to fair value- ORE dispositions 7,082 —
Add: Asset impairment charges 1,168
—
Add/subtract: Investment securities (losses) gains, net 7,956 1 (59)
Add: Decrease in fair value of private equity investments, net 27 1,352 249
Subtract: Cabela’s transaction fee (75,000) —
Add/subtract: Tax
effect of adjustments 11,034 (613) (797)
Adjusted net income 78,719 74,489 64,043
Net income annualized 312,309 298,775 254,780
Total average shareholder’s equity less
preferred stock $2,859,491 2,849,069 2,806,533
Subtract: Goodwill (57,167) (57,018) (24,431)
Subtract: Other intangible assets, net (11,648) (11,965) (226)
Total average tangible
shareholder’s equity less preferred stock 2,790,676 2,780,086 2,781,876
Adjusted return on average common equity 10.92% 10.49% 9.08%
Adjusted return on average tangible common equity 11.19% 10.75% 9.16%
Non-GAAP Financial Measures (Cont’d)
23
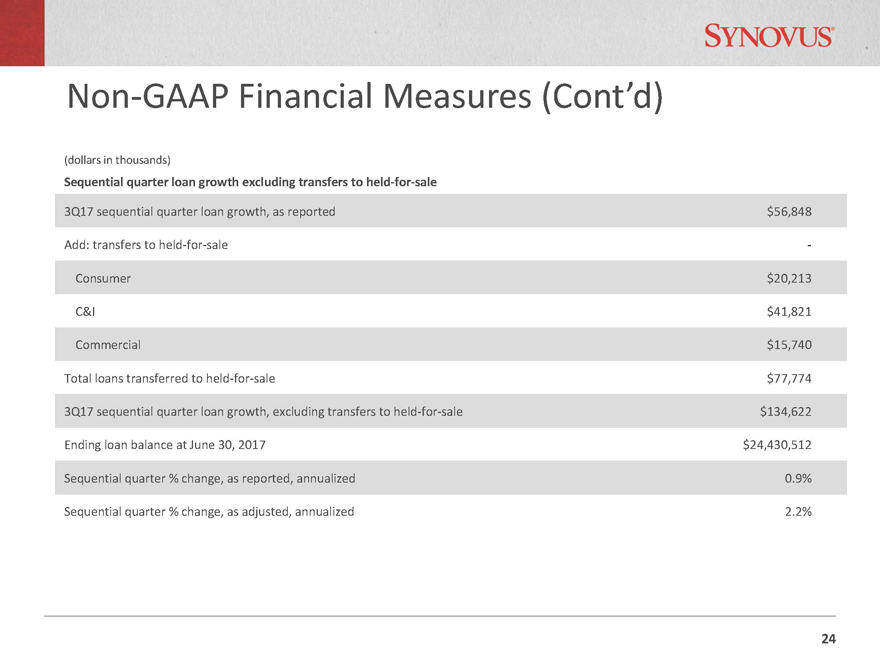
(dollars in thousands)
Sequential quarter loan growth excluding transfers to held-for-sale
3Q17 sequential quarter loan growth, as reported $56,848
Add: transfers to held-for-sale -
Consumer $20,213
C&I $41,821
Commercial $15,740
Total loans transferred to held-for-sale $77,774
3Q17 sequential quarter loan growth, excluding transfers to held-for-sale $134,622
Ending loan balance at June 30, 2017 $24,430,512
Sequential quarter % change, as
reported, annualized 0.9%
Sequential quarter % change, as adjusted, annualized 2.2%
Non-GAAP Financial Measures (Cont’d)
24
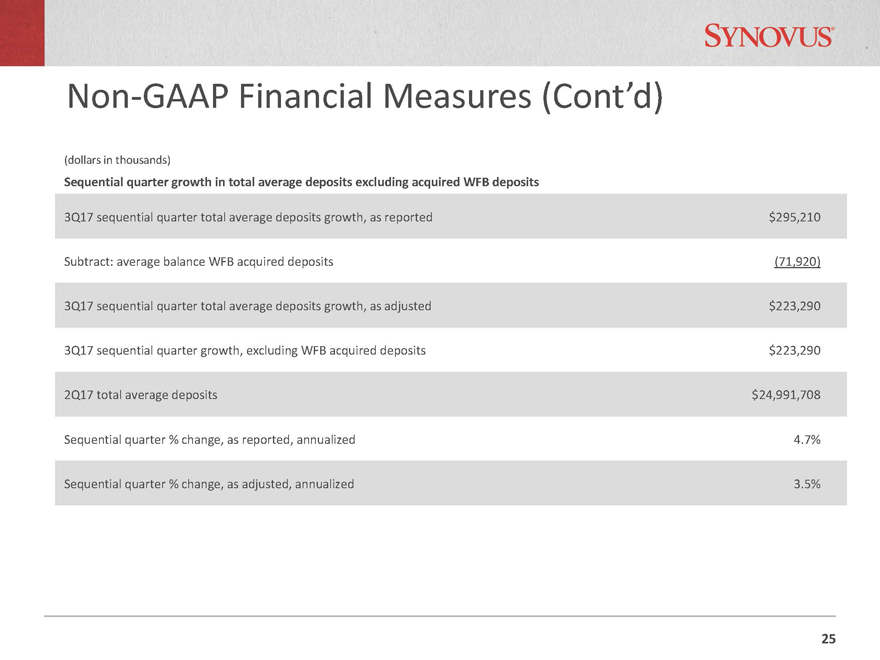
(dollars in thousands)
Sequential quarter growth in total average deposits excluding acquired WFB deposits
3Q17 sequential quarter total average deposits growth, as reported $295,210
Subtract: average
balance WFB acquired deposits (71,920)
3Q17 sequential quarter total average deposits growth, as adjusted $223,290
3Q17 sequential quarter growth, excluding WFB acquired deposits $223,290
2Q17 total average
deposits $24,991,708
Sequential quarter % change, as reported, annualized 4.7%
Sequential quarter % change, as adjusted, annualized 3.5%
Non-GAAP Financial Measures (Cont’d)
25
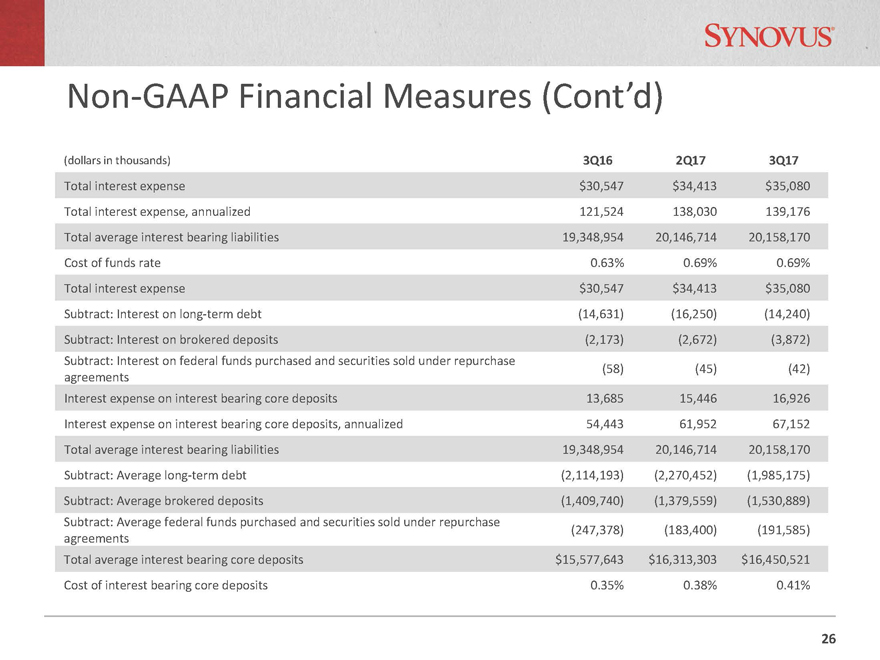
(dollars in thousands) 3Q16 2Q17 3Q17
Total interest expense $30,547 $34,413 $35,080
Total interest expense, annualized 121,524
138,030 139,176
Total average interest bearing liabilities 19,348,954 20,146,714 20,158,170
Cost of funds rate 0.63% 0.69% 0.69%
Total interest expense $30,547 $34,413 $35,080
Subtract: Interest on long-term debt (14,631) (16,250) (14,240)
Subtract:
Interest on brokered deposits (2,173) (2,672) (3,872)
Subtract: Interest on federal funds purchased and securities sold under repurchase
agreements (58) (45) (42)
Interest expense on interest bearing core deposits 13,685 15,446
16,926
Interest expense on interest bearing core deposits, annualized 54,443 61,952 67,152
Total average interest bearing liabilities 19,348,954 20,146,714 20,158,170
Subtract: Average
long-term debt (2,114,193) (2,270,452) (1,985,175)
Subtract: Average brokered deposits (1,409,740) (1,379,559) (1,530,889)
Subtract: Average federal funds purchased and securities sold under repurchase
agreements
(247,378) (183,400) (191,585)
Total average interest bearing core deposits $15,577,643 $16,313,303 $16,450,521
Cost of interest bearing core deposits 0.35% 0.38% 0.41%
Non-GAAP Financial Measures (Cont’d)
26
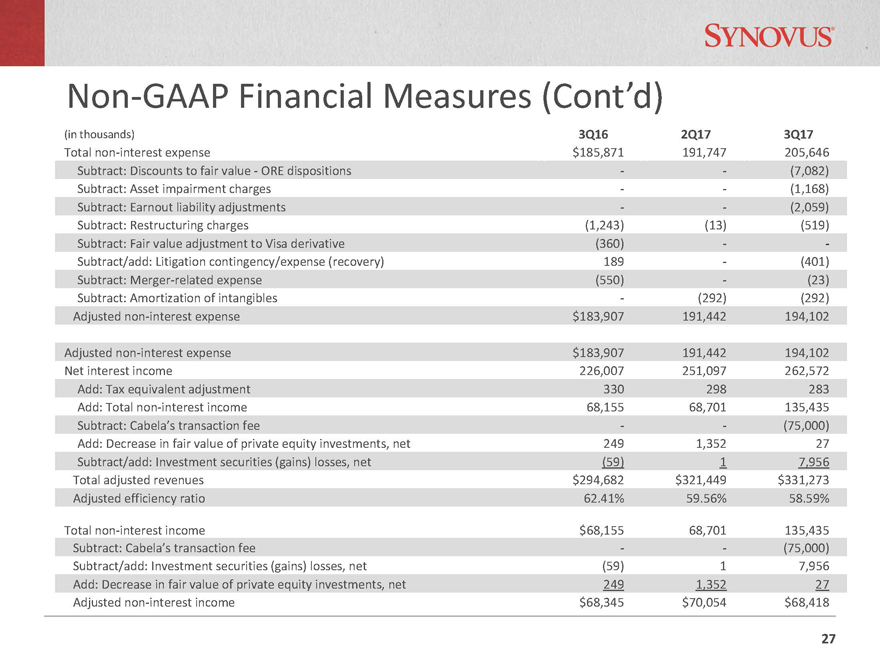
(in thousands) 3Q16 2Q17 3Q17
Total non-interest expense $185,871 191,747 205,646
Subtract: Discounts to fair value—ORE dispositions — (7,082)
Subtract: Asset impairment charges — (1,168)
Subtract: Earnout liability
adjustments — (2,059)
Subtract: Restructuring charges (1,243) (13) (519)
Subtract: Fair value adjustment to Visa derivative (360) —
Subtract/add:
Litigation contingency/expense (recovery) 189—(401)
Subtract: Merger-related expense (550)—(23)
Subtract: Amortization of intangibles—(292) (292)
Adjusted
non-interest expense $183,907 191,442 194,102
Adjusted non-interest expense
$183,907 191,442 194,102
Net interest income 226,007 251,097 262,572
Add: Tax
equivalent adjustment 330 298 283
Add: Total non-interest income 68,155 68,701 135,435
Subtract: Cabela’s transaction fee — (75,000)
Add: Decrease in fair value of private
equity investments, net 249 1,352 27
Subtract/add: Investment securities (gains) losses, net (59) 1 7,956
Total adjusted revenues $294,682 $321,449 $331,273
Adjusted efficiency ratio 62.41% 59.56%
58.59%
Total non-interest income $68,155 68,701 135,435
Subtract: Cabela’s transaction fee — (75,000)
Subtract/add: Investment securities
(gains) losses, net (59) 1 7,956
Add: Decrease in fair value of private equity investments, net 249 1,352 27
Adjusted non-interest income $68,345 $70,054 $68,418
Non-GAAP Financial Measures (Cont’d)
27
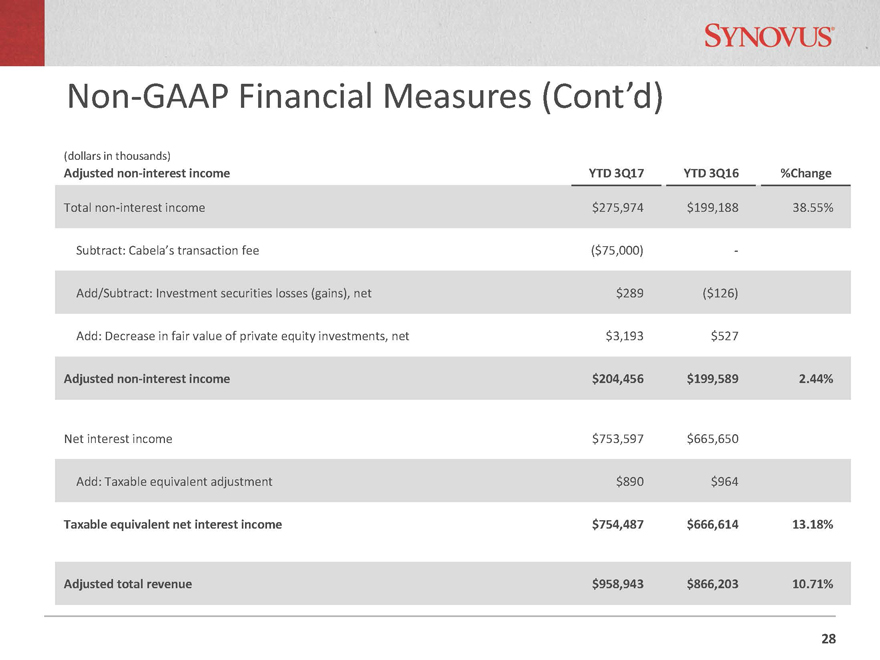
(dollars in thousands)
Adjusted non-interest income YTD 3Q17 YTD 3Q16 %Change
Total non-interest income $275,974 $199,188 38.55%
Subtract: Cabela’s transaction fee ($75,000) -
Add/Subtract: Investment
securities losses (gains), net $289 ($126)
Add: Decrease in fair value of private equity investments, net $3,193 $527
Adjusted non-interest income $204,456 $199,589 2.44%
Net interest income $753,597 $665,650
Add: Taxable equivalent adjustment $890
$964
Taxable equivalent net interest income $754,487 $666,614 13.18%
Adjusted
total revenue $958,943 $866,203 10.71%
Non-GAAP Financial Measures (Cont’d)
28
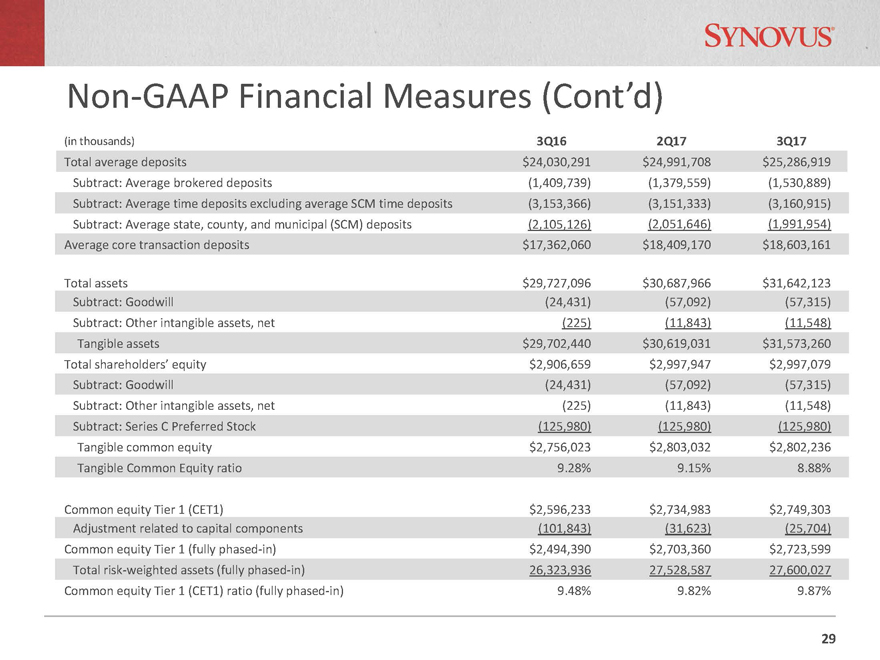
(in thousands) 3Q16 2Q17 3Q17
Total average deposits $24,030,291 $24,991,708 $25,286,919
Subtract: Average brokered deposits
(1,409,739) (1,379,559) (1,530,889)
Subtract: Average time deposits excluding average SCM time deposits (3,153,366) (3,151,333) (3,160,915)
Subtract: Average state, county, and municipal (SCM) deposits (2,105,126) (2,051,646) (1,991,954)
Average core transaction deposits $17,362,060 $18,409,170 $18,603,161
Total assets $29,727,096
$30,687,966 $31,642,123
Subtract: Goodwill (24,431) (57,092) (57,315)
Subtract: Other intangible assets, net (225) (11,843) (11,548)
Tangible
assets $29,702,440 $30,619,031 $31,573,260
Total shareholders’ equity $2,906,659 $2,997,947 $2,997,079
Subtract: Goodwill (24,431) (57,092) (57,315)
Subtract: Other intangible assets, net (225)
(11,843) (11,548)
Subtract: Series C Preferred Stock (125,980) (125,980) (125,980)
Tangible common equity $2,756,023 $2,803,032 $2,802,236
Tangible Common Equity ratio 9.28%
9.15% 8.88%
Common equity Tier 1 (CET1) $2,596,233 $2,734,983 $2,749,303
Adjustment related to capital components (101,843) (31,623) (25,704)
Common
equity Tier 1 (fully phased-in) $2,494,390 $2,703,360 $2,723,599
Total risk-weighted assets (fully phased-in) 26,323,936 27,528,587 27,600,027
Common equity Tier 1 (CET1) ratio (fully
phased-in) 9.48% 9.82% 9.87%
Non-GAAP Financial Measures (Cont’d)
29
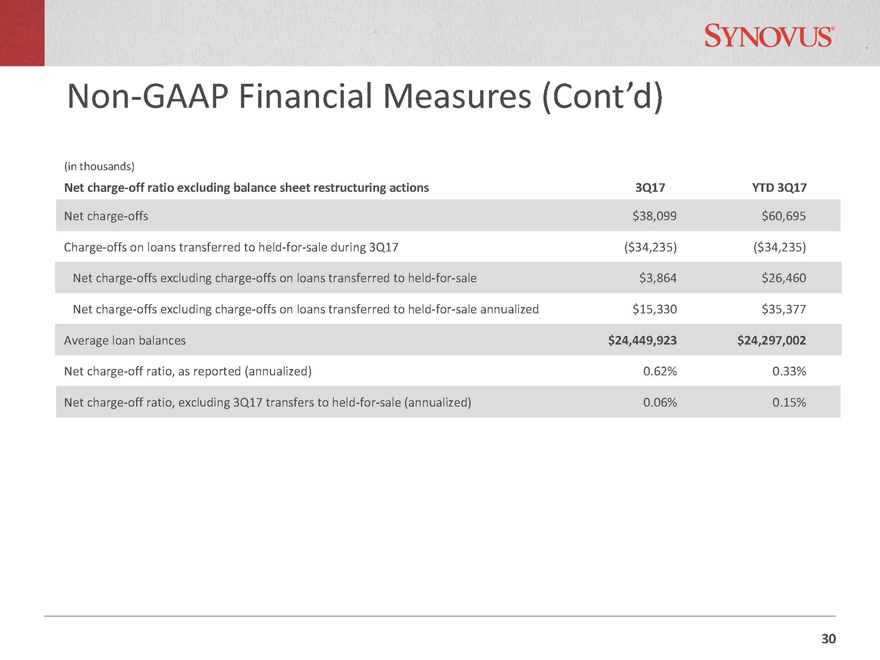
(in thousands)
Net charge-off ratio excluding balance sheet restructuring actions 3Q17 YTD 3Q17
Net charge-offs $38,099 $60,695
Charge-offs on loans transferred to held-for-sale during 3Q17 ($34,235) ($34,235)
Net charge-offs excluding charge-offs on loans transferred to held-for-sale $3,864 $26,460
Net charge-offs excluding charge-offs on loans transferred to held-for-sale
annualized $15,330 $35,377
Average loan balances $24,449,923 $24,297,002
Net charge-off ratio, as reported (annualized) 0.62% 0.33%
Net charge-off ratio, excluding
3Q17 transfers to held-for-sale (annualized) 0.06% 0.15%
Non-GAAP Financial Measures (Cont’d)
30