Attached files
| file | filename |
|---|---|
| EX-99.1 - EX-99.1 - PG&E Corp | d483381dex991.htm |
| 8-K - FORM 8-K - PG&E Corp | d483381d8k.htm |
Exhibit 99.2

PG&E Corporation THIRD QUARTER EARNINGS CALL November 2, 2017
Forward Looking Statements This slide presentation contains statements regarding management’s expectations and objectives for future periods as well as forecasts and estimates of PG&E Corporation’s 2017 financial results, 2017 items impacting comparability, 2017 equity issuance, 2017-2019 capital expenditures and rate base growth, dividend policy, and general earnings sensitivities. These forecasts and estimates are based on 2017 assumptions, including but not limited to those relating to capital expenditures, authorized rate base and rate base growth assumptions, authorized cost of capital, and certain other factors. These statements, forecasts, estimates and assumptions constitute forward-looking statements that are necessarily subject to various risks and uncertainties and actual results may differ materially. PG&E Corporation and the Utility are not able to predict all the factors that may affect future results. Factors that could cause actual results to differ materially include, but are not limited to: the impact of the Northern California wildfires, including the costs of restoration of service to customers and repairs to the Utility’s facilities, and whether the Utility is able to recover such costs through CEMA; the timing and outcome of the investigations by Cal Fire and the CPUC, including as to the causes of the wildfires, and whether the Utility may have liability associated with these fires; and, if liable for one or more fires, whether the Utility would be able to recover all or part of such costs through insurance or through regulatory mechanisms, to the extent insurance is not available or exhausted; as well as potential liabilities in connection with fines or penalties that could be imposed on the Utility if the CPUC or any other law enforcement agency brought an enforcement action and determined that the Utility failed to comply with applicable laws and regulations; the Utility’s ability to effectively manage capital expenditures and its operating and maintenance expenses within the authorized levels of spending and timely recover its costs through rates, and the extent to which the Utility incurs unrecoverable costs that are higher than the forecasts of such costs; the timing and outcomes of the two TO rate cases pending before the FERC, and other ratemaking and regulatory proceedings; the timing and outcome of the Butte fire litigation; the timing and outcome of any proceeding to recover costs in excess of insurance from customers, if any; the effect, if any, of the SED’s $8.3 million citations issued in connection with the Butte fire may have on the Butte fire litigation; and whether additional investigations and proceedings in connection with the Butte fire will be opened and any additional fines or penalties imposed on the Utility; the timing and outcomes of the ex parte OII and the safety culture OII; the outcome of the probation and the monitorship, the timing and outcomes of the debarment proceeding, the SED’s unresolved enforcement matters relating to the Utility’s compliance with natural gas-related laws and regulations, and other investigations that have been or may be commenced, and the ultimate amount of fines, penalties, and remedial and other costs that the Utility may incur as a result; the outcomes of current and future self-reports, investigations or other enforcement proceedings that could be commenced or notices of violation that could be issued relating to the Utility’s compliance with laws, rules, regulations, or orders applicable to its operations; and the timing and outcome of notices of violations in connection with the Yuba City incident; the ability of PG&E Corporation and the Utility to access capital markets and other sources of debt and equity financing in a timely manner on acceptable terms, and the amount and timing of additional common stock and debt issuances by PG&E Corporation; the impact that reductions in customer demand for electricity and natural gas have on the Utility’s ability to make and recover its investments through rates and earn its authorized return on equity; whether the Utility is successful in addressing the changing industry landscape, including the impact of growing distributed and renewable generation resources, changing customer demand for natural gas and electric services, and an increasing number of customers departing for community choice aggregators; the impact of the increased cost of natural gas regulations; the timing and outcomes of the “Ghost Ship” and Valero refinery outage lawsuits; whether the Utility can continue to obtain insurance and whether insurance coverage is adequate for future losses or claims; changes in estimated environmental remediation costs, including costs associated with the Utility’s natural gas compressor sites; the outcome of federal or state tax audits and the impact of any changes in federal or state tax laws, policies, regulations, or their interpretation, including as a result of the recent changes in the federal government; the impact of changes in GAAP, standards, rules, or policies, including those related to regulatory accounting, and the impact of changes in their interpretation or application; and the other factors disclosed in PG&E Corporation and the Utility’s joint annual report on Form 10-K for the year ended December 31, 2016, their joint quarterly reports on Form 10-Q for the quarters ended March 31, June 30, and September 30, 2017, and other reports filed with the Securities and Exchange Commission (SEC), which are available on PG&E Corporation’s website at www.pgecorp.com and on the SEC website at www.sec.gov. This presentation is not complete without the accompanying statements made by management during the webcast conference call held on November 2, 2017. The statements in this presentation are made as of November 2, 2017. PG&E Corporation undertakes no obligation to update information contained herein. This presentation, including Appendices, and the accompanying press release were attached to PG&E Corporation’s Current Report on Form 8-K that was furnished to the SEC on November 2, 2017 and, along with the replay of the conference call, is also available on PG&E Corporation’s website at www.pgecorp.com. 2
Northern California Wildfires Our thoughts and prayers are with the affected customers who experienced these extraordinary fires We conducted an unprecedented restoration effort and will continue helping our customers and communities as they rebuild We are committed to cooperating with Cal Fire and the CPUC as they conduct investigations 3
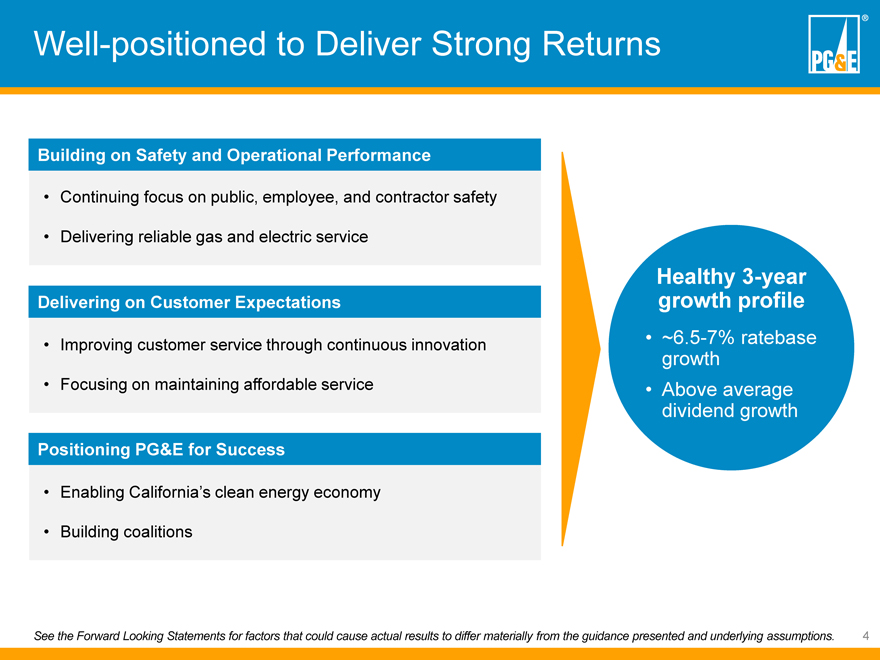
Well-positioned to Deliver Strong Returns 4 See the Forward Looking Statements for factors that could cause actual results to differ materially from the guidance presented and underlying assumptions. •Improving customer service through continuous innovation •Focusing on maintaining affordable service •Enabling California’s clean energy economy •Building coalitions •Continuing focus on public, employee, and contractor safety •Delivering reliable gas and electric service Healthy 3-year growth profile •~6.5-7% ratebase growth •Above average dividend growth Building on Safety and Operational Performance Delivering on Customer Expectations Positioning PG&E for Success
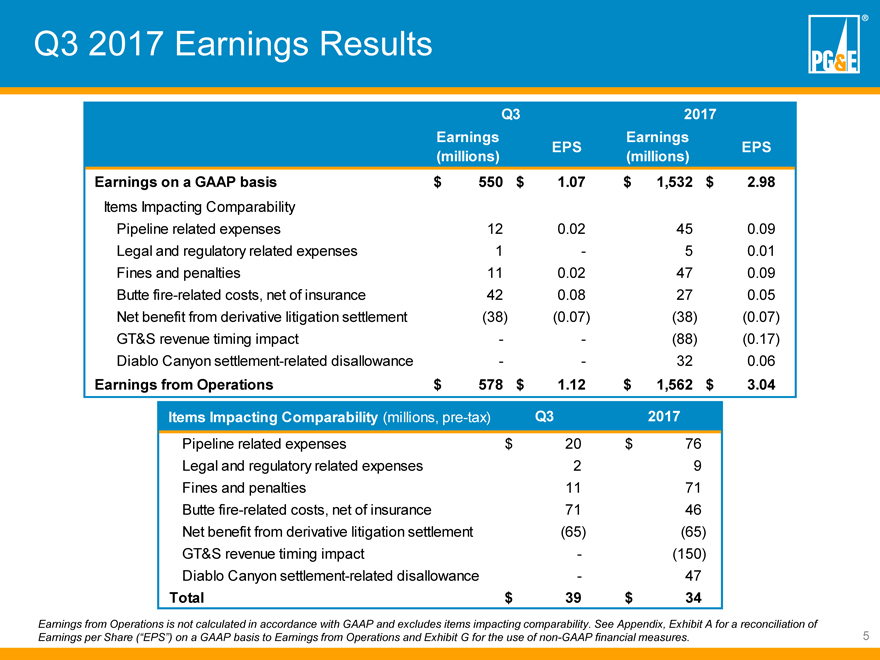
Q3 2017 Earnings Results Earnings from Operations is not calculated in accordance with GAAP and excludes items impacting comparability. See Appendix, Exhibit A for a reconciliation of Earnings per Share (“EPS”) on a GAAP basis to Earnings from Operations and Exhibit G for the use of non-GAAP financial measures. 5 Earnings on a GAAP basis $ 550 $ 1.07 $ 1,532 $ 2.98 Items Impacting Comparability Pipeline related expenses 12 0.02 45 0.09 Legal and regulatory related expenses 1—5 0.01 Fines and penalties 11 0.02 47 0.09 Butte fire-related costs, net of insurance 42 0.08 27 0.05 Net benefit from derivative litigation settlement (38) (0.07) (38) (0.07) GT&S revenue timing impact — (88) (0.17) Diablo Canyon settlement-related disallowance — 32 0.06 Earnings from Operations $ 578 $ 1.12 $ 1,562 $ 3.04 EPS 2017 Earnings (millions) EPS Q3 Earnings (millions) Items Impacting Comparability (millions, pre-tax) Pipeline related expenses $ 20 $ 76 Legal and regulatory related expenses 2 9 Fines and penalties 11 71 Butte fire-related costs, net of insurance 71 46 Net benefit from derivative litigation settlement (65) (65) GT&S revenue timing impact—(150) Diablo Canyon settlement-related disallowance—47 Total $ 39 $ 34 Q3 2017
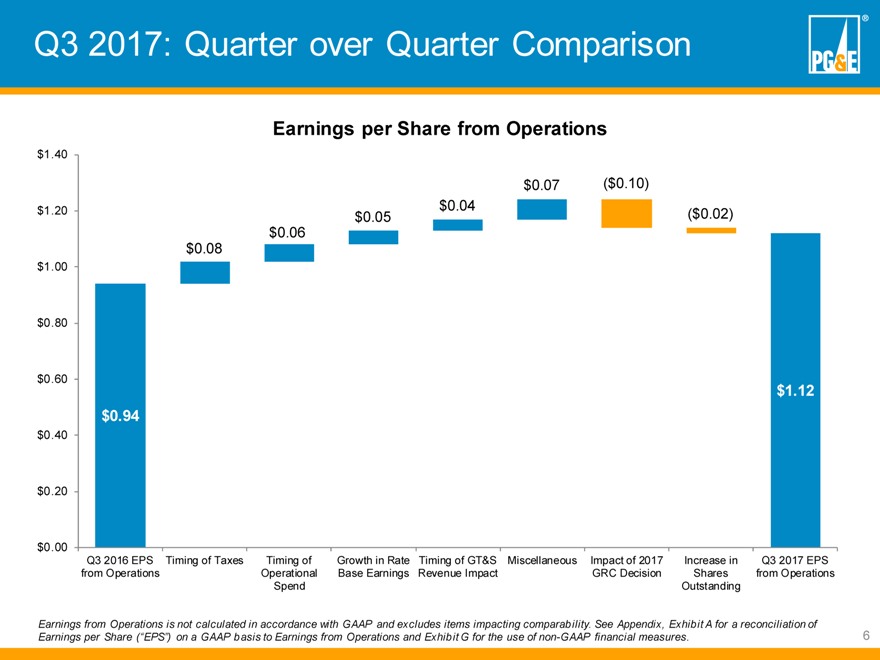
Q3 2017: Quarter over Quarter Comparison Earnings per Share from Operations$1.40$0.07 ($0.10)$1.20 $0.04 $0.05 ($0.02) $0.06 $0.08 $1.00$0.80$0.60$1.12 $0.94 $0.40$0.20$0.00Q3 2016 EPS Timing of Taxes Timing of Growth in Rate Timing of GT&S Miscellaneous Impact of 2017 Increase in Q3 2017 EPS from Operations Operational Base Earnings Revenue Impact GRC Decision Shares from Operations Spend Outstanding Earnings from Operations is not calculated in accordance with GAAP and excludes items impacting comparability. See Appendix, Exhibit A for a reconciliation of Earnings per Share (“EPS”) on a GAAP basis to Earnings from Operations and Exhibit G for the use of non-GAAP financial measures. 6
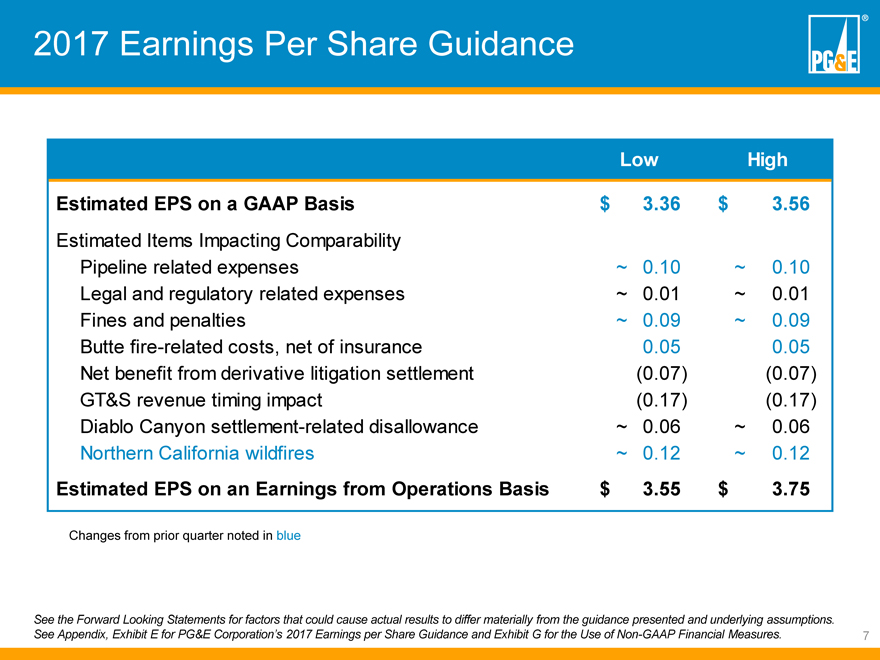
2017 Earnings Per Share Guidance 7 See the Forward Looking Statements for factors that could cause actual results to differ materially from the guidance presented and underlying assumptions. See Appendix, Exhibit E for PG&E Corporation’s 2017 Earnings per Share Guidance and Exhibit G for the Use of Non-GAAP Financial Measures. Changes from prior quarter noted in blue Estimated EPS on a GAAP Basis $3.36 $3.56 Estimated Items Impacting Comparability Pipeline related expenses~0.10 ~0.10 Legal and regulatory related expenses ~0.01 ~0.01 Fines and penalties ~0.09 ~0.09 Butte fire-related costs, net of insurance0.05 0.05 Net benefit from derivative litigation settlement (0.07) (0.07) GT&S revenue timing impact(0.17) (0.17) Diablo Canyon settlement-related disallowance~0.06 ~0.06 Northern California wildfires~0.12 ~0.12 Estimated EPS on an Earnings from Operations Basis$3.55 $3.75 Low High
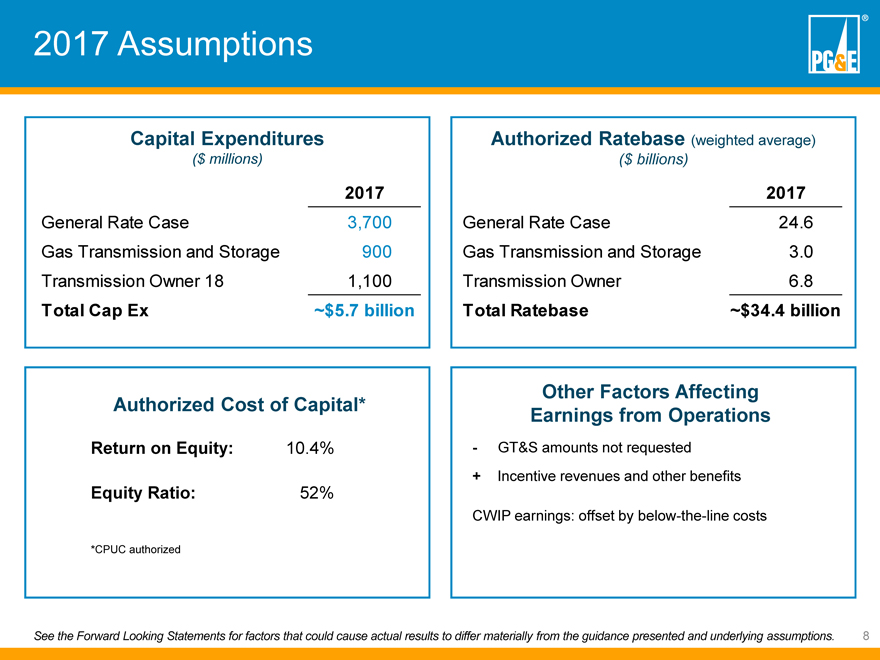
2017 Assumptions 8 Capital Expenditures ($ millions) Authorized Ratebase (weighted average) ($ billions) Return on Equity: 10.4% Equity Ratio: 52% Authorized Cost of Capital* Other Factors Affecting Earnings from Operations *CPUC authorized —GT&S amounts not requested + Incentive revenues and other benefits CWIP earnings: offset by below-the-line costs See the Forward Looking Statements for factors that could cause actual results to differ materially from the guidance presented and underlying assumptions. 2017 General Rate Case 3,700 Gas Transmission and Storage 900 Transmission Owner 18 1,100 Total Cap Ex ~$5.7 billion 2017 General Rate Case 24.6 Gas Transmission and Storage 3.0 Transmission Owner 6.8 Total Ratebase ~$34.4 billion
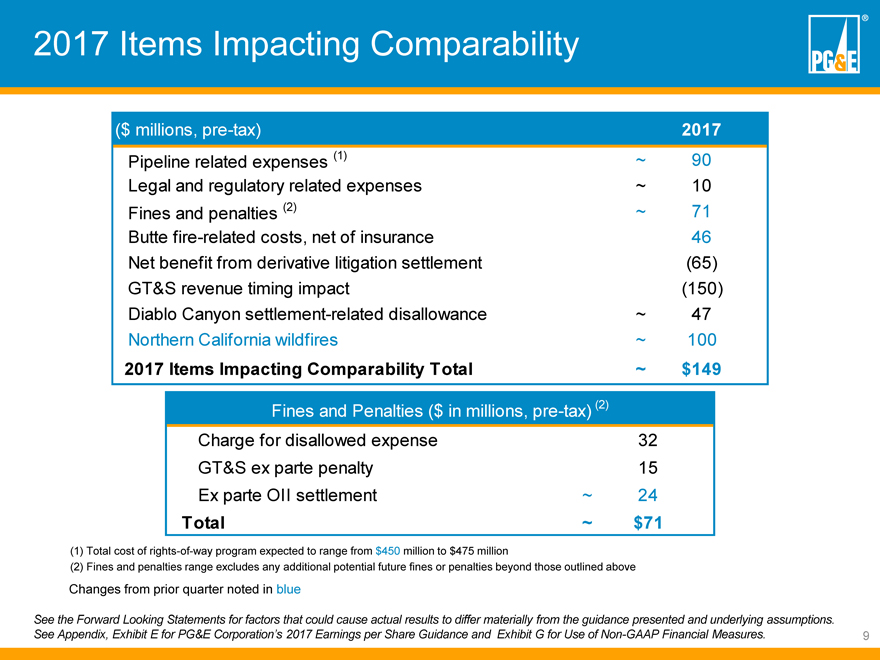
2017 Items Impacting Comparability 9 (1) Total cost of rights-of-way program expected to range from $450 million to $475 million (2) Fines and penalties range excludes any additional potential future fines or penalties beyond those outlined above See the Forward Looking Statements for factors that could cause actual results to differ materially from the guidance presented and underlying assumptions. See Appendix, Exhibit E for PG&E Corporation’s 2017 Earnings per Share Guidance and Exhibit G for Use of Non-GAAP Financial Measures. Changes from prior quarter noted in blue Charge for disallowed expense 32 GT&S ex parte penalty 15 Ex parte OII settlement ~ 24 Total ~ $71 Fines and Penalties ($ in millions, pre-tax) (2) ($ millions, pre-tax) 2017 Pipeline related expenses (1) ~ 90 Legal and regulatory related expenses ~ 10 Fines and penalties (2) ~ 71 Butte fire-related costs, net of insurance 46 Net benefit from derivative litigation settlement (65) GT&S revenue timing impact (150) Diablo Canyon settlement-related disallowance ~ 47 Northern California wildfires ~ 100 2017 Items Impacting Comparability Total ~ $149
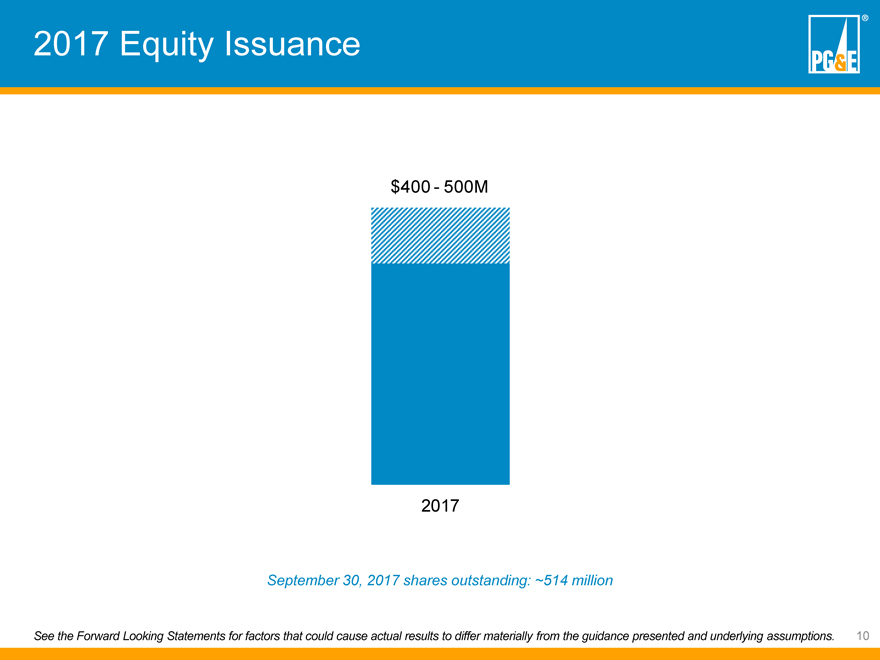
$400—500M 2017 2017 Equity Issuance 10 See the Forward Looking Statements for factors that could cause actual results to differ materially from the guidance presented and underlying assumptions. September 30, 2017 shares outstanding: ~514 million
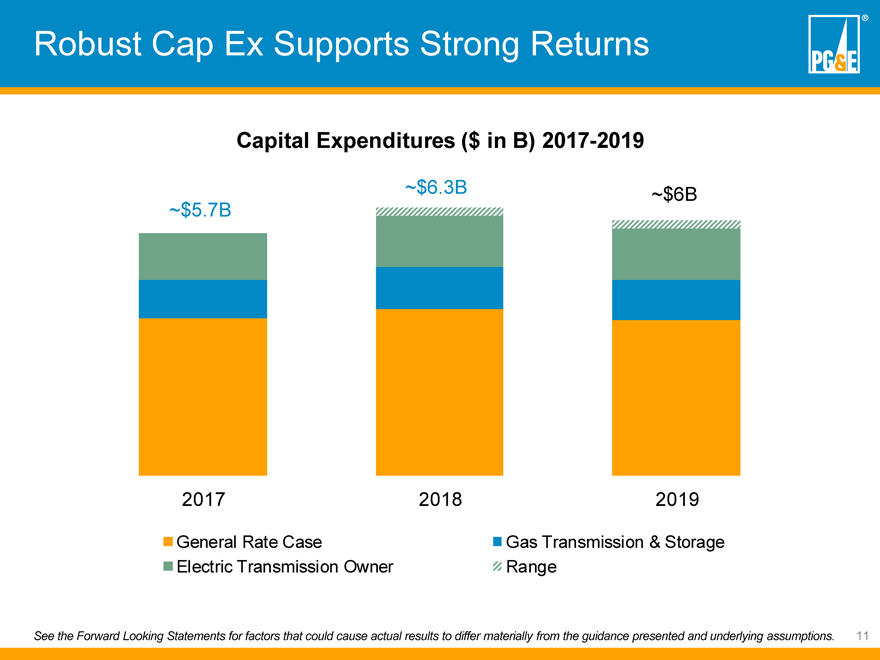
2017 2018 2019 Capital Expenditures ($ in B) 2017-2019 General Rate Case Gas Transmission & Storage Electric Transmission Owner Range Robust Cap Ex Supports Strong Returns 11 See the Forward Looking Statements for factors that could cause actual results to differ materially from the guidance presented and underlying assumptions.
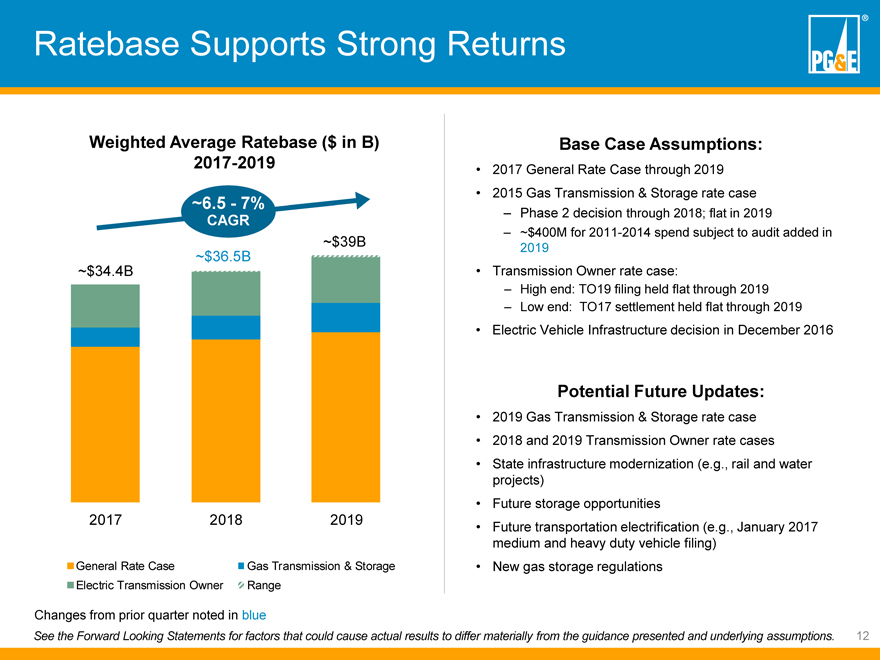
2017 2018 2019 General Rate Case Gas Transmission & Storage Electric Transmission Owner Range Ratebase Supports Strong Returns 12 See the Forward Looking Statements for factors that could cause actual results to differ materially from the guidance presented and underlying assumptions. Base Case Assumptions: • 2017 General Rate Case through 2019 • 2015 Gas Transmission & Storage rate case – Phase 2 decision through 2018; flat in 2019 – ~$400M for 2011-2014 spend subject to audit added in 2019 • Transmission Owner rate case: – High end: TO19 filing held flat through 2019 – Low end: TO17 settlement held flat through 2019 • Electric Vehicle Infrastructure decision in December 2016 Potential Future Updates: • 2019 Gas Transmission & Storage rate case • 2018 and 2019 Transmission Owner rate cases • State infrastructure modernization (e.g., rail and water projects) • Future storage opportunities • Future transportation electrification (e.g., January 2017 medium and heavy duty vehicle filing) • New gas storage regulations ~$34.4B ~$36.5B ~$39B ~6.5—7% CAGR Changes from prior quarter noted in blue Weighted Average Ratebase ($ in B) 2017-2019 ~$5.7B ~$6.3B ~$6B
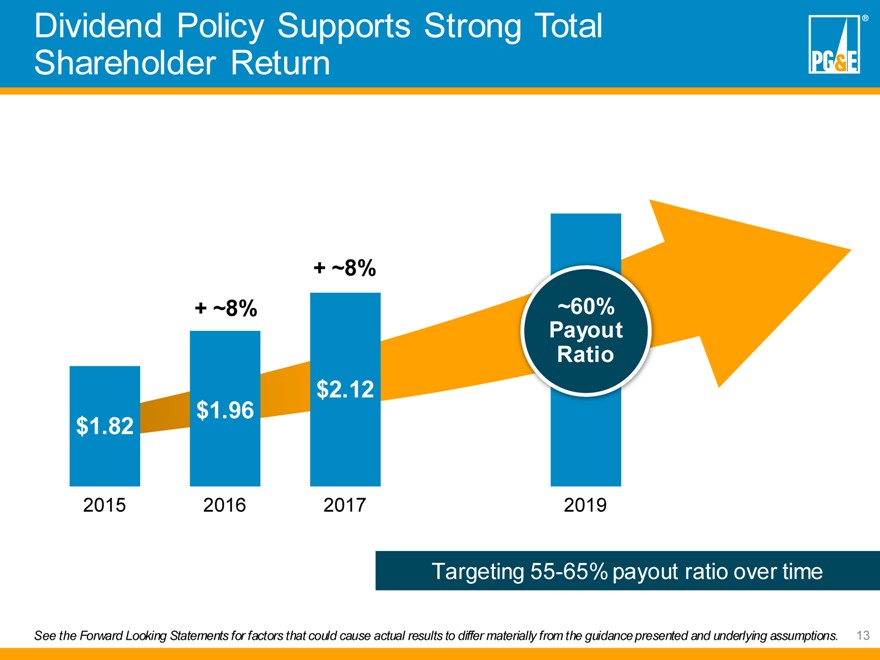
Dividend Policy Supports Strong Total Shareholder Return + ~8% + ~8% Payout ~60% Ratio $2.12 $1.96 $1.82 2015 2016 2017 2019Targeting 55-65% payout ratio over time See the Forward Looking Statements for factors that could cause actual results to differ materially from the guidance presented and underlying assumptions. 13

Appendix PG&E Corporation
Appendix – Supplemental Earnings Materials Exhibit A: Reconciliation of PG&E Corporation’s Consolidated Income Available for Common Shareholders in Accordance with Generally Accepted Accounting Principles to Earnings from Operations Slides 16-17 Exhibit B: Key Drivers of PG&E Corporation’s Earnings per Common Share from Operations Slide 18 Exhibit C: Operational Performance Metrics Slides 19-20 Exhibit D: Sales and Sources Summary Slide 21 Exhibit E: PG&E Corporation’s 2017 Earnings Per Share Guidance Slides 22-23 Exhibit F: 2017 General Earnings Sensitivities Slide 24 Exhibit G: Use of Non-GAAP Financial Measures Slide 25 Exhibit H: Expected Timelines of Selected Regulatory Cases Slides 26-30
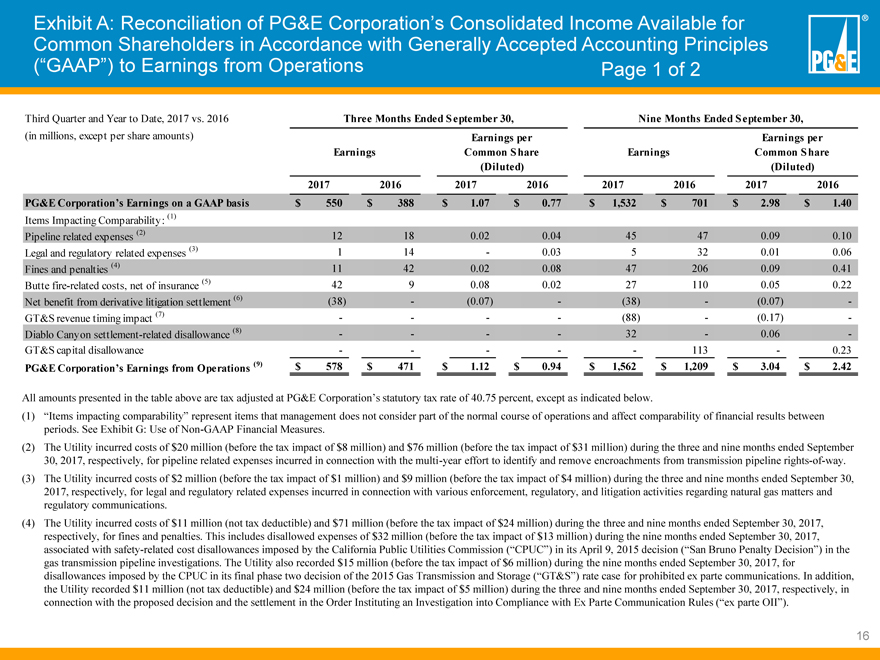
Third Quarter and Year to Date, 2017 vs. 2016 (in millions, except per share amounts) PG&E Corporation’s Earnings on a GAAP basis $ 550 $ 388 $ 1.07 $ 0.77 $ 1,532 $ 701 $ 2.98 $ 1.40 Items Impacting Comparability: (1) Pipeline related expenses (2) 12 18 0.02 0.04 45 47 0.09 0.10 Legal and regulatory related expenses (3) 1 14—0.03 5 32 0.01 0.06 Fines and penalties (4) 11 42 0.02 0.08 47 206 0.09 0.41 Butte fire-related costs, net of insurance (5) 42 9 0.08 0.02 27 110 0.05 0.22 Net benefit from derivative litigation settlement (6) (38)—(0.07)—(38)—(0.07)—GT&S revenue timing impact (7) — — (88)—(0.17)—Diablo Canyon settlement-related disallowance (8) — — 32—0.06—GT&S capital disallowance — ——113—0.23 PG&E Corporation’s Earnings from Operations (9) $ 578 $ 471 $ 1.12 $ 0.94 $ 1,562 $ 1,209 $ 3.04 $ 2.42 2017 2016 2017 2016 2017 2016 2017 2016 Three Months Ended September 30, Nine Months Ended September 30, Earnings Earnings per Common Share (Diluted) Earnings Earnings per Common Share (Diluted) Exhibit A: Reconciliation of PG&E Corporation’s Consolidated Income Available for Common Shareholders in Accordance with Generally Accepted Accounting Principles (“GAAP”) to Earnings from Operations 16 All amounts presented in the table above are tax adjusted at PG&E Corporation’s statutory tax rate of 40.75 percent, except as indicated below. (1) “Items impacting comparability” represent items that management does not consider part of the normal course of operations and affect comparability of financial results between periods. See Exhibit G: Use of Non-GAAP Financial Measures. (2) The Utility incurred costs of $20 million (before the tax impact of $8 million) and $76 million (before the tax impact of $31 million) during the three and nine months ended September 30, 2017, respectively, for pipeline related expenses incurred in connection with the multi-year effort to identify and remove encroachments from transmission pipeline rights-of-way. (3) The Utility incurred costs of $2 million (before the tax impact of $1 million) and $9 million (before the tax impact of $4 million) during the three and nine months ended September 30, 2017, respectively, for legal and regulatory related expenses incurred in connection with various enforcement, regulatory, and litigation activities regarding natural gas matters and regulatory communications. (4) The Utility incurred costs of $11 million (not tax deductible) and $71 million (before the tax impact of $24 million) during the three and nine months ended September 30, 2017, respectively, for fines and penalties. This includes disallowed expenses of $32 million (before the tax impact of $13 million) during the nine months ended September 30, 2017, associated with safety-related cost disallowances imposed by the California Public Utilities Commission (“CPUC”) in its April 9, 2015 decision (“San Bruno Penalty Decision”) in the gas transmission pipeline investigations. The Utility also recorded $15 million (before the tax impact of $6 million) during the nine months ended September 30, 2017, for disallowances imposed by the CPUC in its final phase two decision of the 2015 Gas Transmission and Storage (“GT&S”) rate case for prohibited ex parte communications. In addition, the Utility recorded $11 million (not tax deductible) and $24 million (before the tax impact of $5 million) during the three and nine months ended September 30, 2017, respectively, in connection with the proposed decision and the settlement in the Order Instituting an Investigation into Compliance with Ex Parte Communication Rules (“ex parte OII”). Page 1 of 2
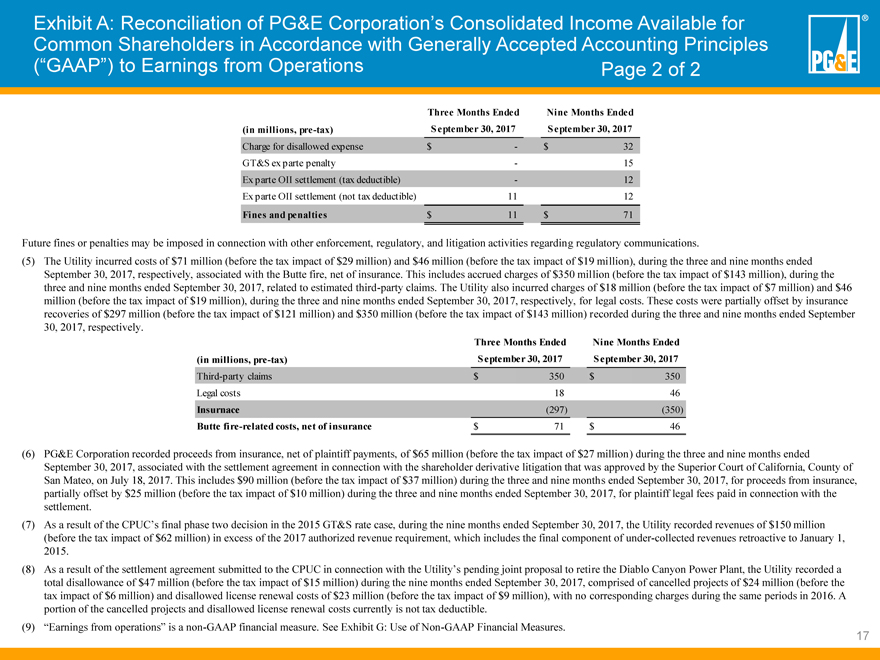
Exhibit A: Reconciliation of PG&E Corporation’s Consolidated Income Available for Common Shareholders in Accordance with Generally Accepted Accounting Principles (“GAAP”) to Earnings from Operations 17 Page 2 of 2 (in millions, pre-tax) Charge for disallowed expense $—$ 32 GT&S ex parte penalty—15 Ex parte OII settlement (tax deductible)—12 Ex parte OII settlement (not tax deductible) 11 12 Fines and penalties $ 11 $ 71 September 30, 2017 September 30, 2017 Three Months Ended Nine Months Ended Future fines or penalties may be imposed in connection with other enforcement, regulatory, and litigation activities regarding regulatory communications. (5) The Utility incurred costs of $71 million (before the tax impact of $29 million) and $46 million (before the tax impact of $19 million), during the three and nine months ended September 30, 2017, respectively, associated with the Butte fire, net of insurance. This includes accrued charges of $350 million (before the tax impact of $143 million), during the three and nine months ended September 30, 2017, related to estimated third-party claims. The Utility also incurred charges of $18 million (before the tax impact of $7 million) and $46 million (before the tax impact of $19 million), during the three and nine months ended September 30, 2017, respectively, for legal costs. These costs were partially offset by insurance recoveries of $297 million (before the tax impact of $121 million) and $350 million (before the tax impact of $143 million) recorded during the three and nine months ended September 30, 2017, respectively. (6) PG&E Corporation recorded proceeds from insurance, net of plaintiff payments, of $65 million (before the tax impact of $27 million) during the three and nine months ended September 30, 2017, associated with the settlement agreement in connection with the shareholder derivative litigation that was approved by the Superior Court of California, County of San Mateo, on July 18, 2017. This includes $90 million (before the tax impact of $37 million) during the three and nine months ended September 30, 2017, for proceeds from insurance, partially offset by $25 million (before the tax impact of $10 million) during the three and nine months ended September 30, 2017, for plaintiff legal fees paid in connection with the settlement. (7) As a result of the CPUC’s final phase two decision in the 2015 GT&S rate case, during the nine months ended September 30, 2017, the Utility recorded revenues of $150 million (before the tax impact of $62 million) in excess of the 2017 authorized revenue requirement, which includes the final component of under-collected revenues retroactive to January 1, 2015. (8) As a result of the settlement agreement submitted to the CPUC in connection with the Utility’s pending joint proposal to retire the Diablo Canyon Power Plant, the Utility recorded a total disallowance of $47 million (before the tax impact of $15 million) during the nine months ended September 30, 2017, comprised of cancelled projects of $24 million (before the tax impact of $6 million) and disallowed license renewal costs of $23 million (before the tax impact of $9 million), with no corresponding charges during the same periods in 2016. A portion of the cancelled projects and disallowed license renewal costs currently is not tax deductible. (9) “Earnings from operations” is a non-GAAP financial measure. See Exhibit G: Use of Non-GAAP Financial Measures. (in millions, pre-tax) Third-party claims $ 350 $ 350 Legal costs 18 46 Insurnace (297) (350) Butte fire-related costs, net of insurance $ 71 $ 46 Three Months Ended Nine Months Ended September 30, 2017 September 30, 2017
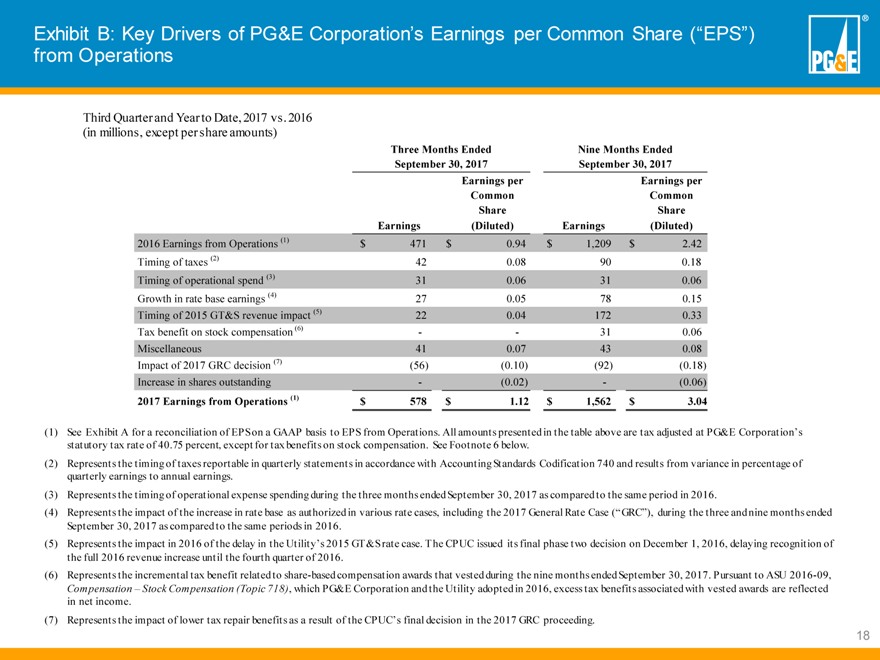
Exhibit B: Key Drivers of PG&E Corporation’s Earnings per Common Share (“EPS”) from Operations Third Quarter and Year to Date, 2017 vs. 2016 (in millions, except per share amounts) Three Months Ended Nine Months Ended September 30, 2017 September 30, 2017 Earnings per Earnings per Common, Common Share Share Earnings (Diluted) Earnings (Diluted) 2016 Earnings from Operations (1) $ 471 $ 0.94 $ 1,209 $ 2.42 Timing of taxes (2) 42 0.08 90 0.18 Timing of operational spend (3) 31 0.06 31 0.06 Growth in rate base earnings (4) 27 0.05 78 0.15 Timing of 2015 GT&S revenue impact (5) 22 0.04 172 0.33 Tax benefit on stock compensation (6) - - 31 0.06 Miscellaneous 41 0.07 43 0.08 Impact of 2017 GRC decision (7) (56) (0.10) (92) (0.18) Increase in shares outstanding - (0.02) - (0.06)2017 Earnings from Operations (1) $ 578 $ 1.12 $ 1,562 $ 3.04See Exhibit A for a reconciliation of EPS on a GAAP basis to EPS from Operations. All amounts presented in the table above are tax adjusted at PG&E Corporation’s statutory tax rate of 40.75 percent, except for tax benefits on stock compensation. See Footnote 6 below. Represents the timing of taxes reportable in quarterly statements in accordance with Accounting Standards Codification 740 and results from variance in percentage of quarterly earnings to annual earnings. Represents the timing of operational expense spending during the three months ended September 30, 2017 as compared to the same period in 2016.Represents the impact of the increase in rate base as authorized in various rate cases, including the 2017 General Rate Case (“GRC”), during the three and nine months ended September 30, 2017 as compared to the same periods in 2016.Represents the impact in 2016 of the delay in the Utility’s 2015 GT&S rate case. The CPUC issued its final phase two decision on December 1, 2016, delaying recognition of the full 2016 revenue increase until the fourth quarter of 2016.Represents the incremental tax benefit related to share-based compensation awards that vested during the nine months ended September 30, 2017. Pursuant to ASU 2016-09, Compensation - Stock Compensation (Topic 718), which PG&E Corporation and the Utility adopted in 2016, excess tax benefits associated with vested awards are reflected in net income. Represents the impact of lower tax repair benefits as a result of the CPUC’s final decision in the 2017 GRC proceeding. 18
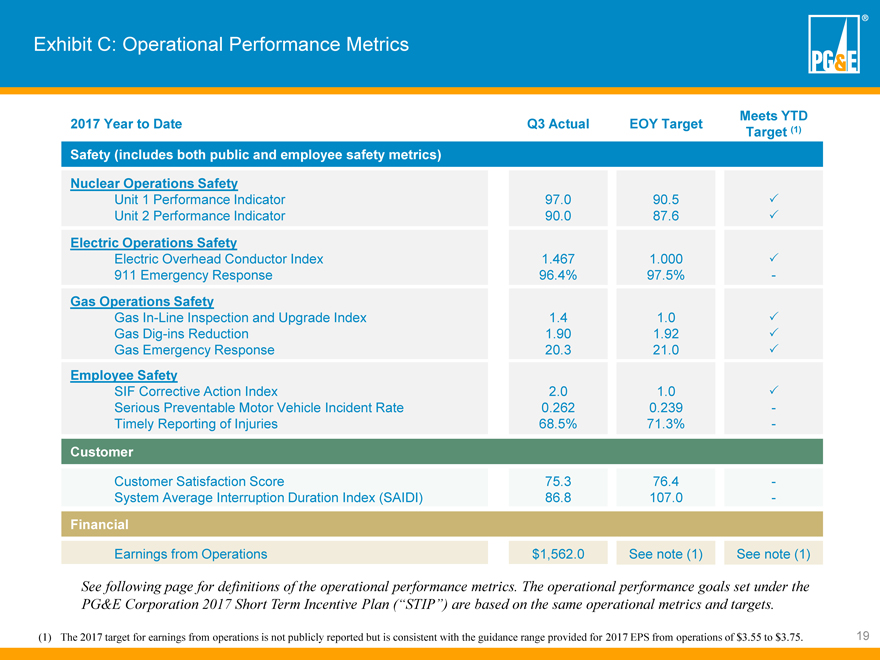
Exhibit C: Operational Performance Metrics 19 Q3 Actual EOY Target Meets YTD Target (1) Safety (includes both public and employee safety metrics) Nuclear Operations Safety Unit 1 Performance Indicator Unit 2 Performance Indicator 97.0 90.0 90.5 87.6 P P Electric Operations Safety Electric Overhead Conductor Index 911 Emergency Response 1.467 96.4% % 1.000 97.5% P —Gas Operations Safety Gas In-Line Inspection and Upgrade Index Gas Dig-ins Reduction Gas Emergency Response 1.4 1.90 20.3 1.0 1.92 21.0 P P P Employee Safety SIF Corrective Action Index Serious Preventable Motor Vehicle Incident Rate Timely Reporting of Injuries 2.0 0.262 68.5% 1.0 0.239 71.3% P — —Customer Customer Satisfaction Score System Average Interruption Duration Index (SAIDI) 75.3 86.8 76.4 107.0 — —2017 Year to Date Financial Earnings from Operations $1,562.0 See note (1) See note (1) See following page for definitions of the operational performance metrics. The operational performance goals set under the PG&E Corporation 2017 Short Term Incentive Plan (“STIP”) are based on the same operational metrics and targets. (1)The 2017 target for earnings from operations is not publicly reported but is consistent with the guidance range provided for 2017 EPS from operations of $3.55 to $3.75.
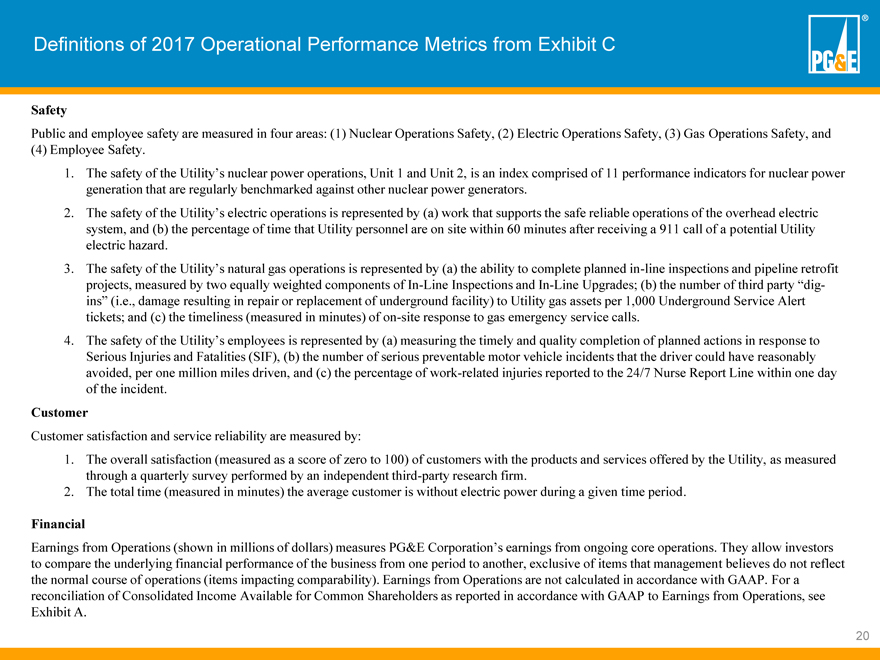
Definitions of 2017 Operational Performance Metrics from Exhibit C 20 Safety Public and employee safety are measured in four areas: (1) Nuclear Operations Safety, (2) Electric Operations Safety, (3) Gas Operations Safety, and (4) Employee Safety. 1.The safety of the Utility’s nuclear power operations, Unit 1 and Unit 2, is an index comprised of 11 performance indicators for nuclear power generation that are regularly benchmarked against other nuclear power generators. 2.The safety of the Utility’s electric operations is represented by (a) work that supports the safe reliable operations of the overhead electric system, and (b) the percentage of time that Utility personnel are on site within 60 minutes after receiving a 911 call of a potential Utility electric hazard. 3.The safety of the Utility’s natural gas operations is represented by (a) the ability to complete planned in-line inspections and pipeline retrofit projects, measured by two equally weighted components of In-Line Inspections and In-Line Upgrades; (b) the number of third party “dig-ins” (i.e., damage resulting in repair or replacement of underground facility) to Utility gas assets per 1,000 Underground Service Alert tickets; and (c) the timeliness (measured in minutes) of on-site response to gas emergency service calls. 4.The safety of the Utility’s employees is represented by (a) measuring the timely and quality completion of planned actions in response to Serious Injuries and Fatalities (SIF), (b) the number of serious preventable motor vehicle incidents that the driver could have reasonably avoided, per one million miles driven, and (c) the percentage of work-related injuries reported to the 24/7 Nurse Report Line within one day of the incident. Customer Customer satisfaction and service reliability are measured by: 1.The overall satisfaction (measured as a score of zero to 100) of customers with the products and services offered by the Utility, as measured through a quarterly survey performed by an independent third-party research firm. 2.The total time (measured in minutes) the average customer is without electric power during a given time period. Financial Earnings from Operations (shown in millions of dollars) measures PG&E Corporation’s earnings from ongoing core operations. They allow investors to compare the underlying financial performance of the business from one period to another, exclusive of items that management believes do not reflect the normal course of operations (items impacting comparability). Earnings from Operations are not calculated in accordance with GAAP. For a reconciliation of Consolidated Income Available for Common Shareholders as reported in accordance with GAAP to Earnings from Operations, see Exhibit A.
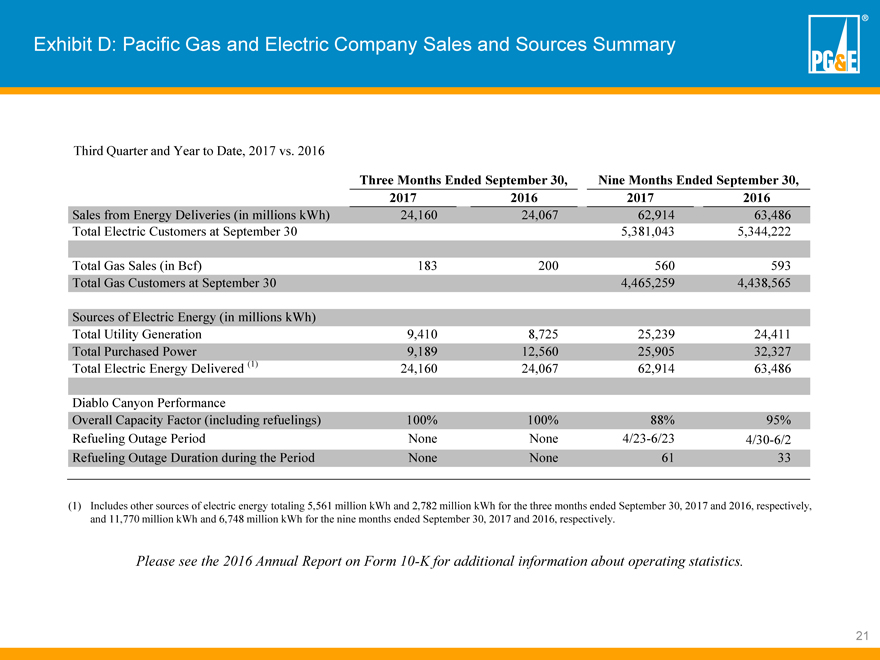
Exhibit D: Pacific Gas and Electric Company Sales and Sources Summary 21 Third Quarter and Year to Date, 2017 vs. 2016 (1)Includes other sources of electric energy totaling 5,561 million kWh and 2,782 million kWh for the three months ended September 30, 2017 and 2016, respectively, and 11,770 million kWh and 6,748 million kWh for the nine months ended September 30, 2017 and 2016, respectively. Please see the 2016 Annual Report on Form 10-K for additional information about operating statistics. Three Months Ended September 30, Nine Months Ended September 30, 2017 2016 2017 2016 Sales from Energy Deliveries (in millions kWh) 24,160 24,067 62,914 63,486 Total Electric Customers at September 30 5,381,043 5,344,222 Total Gas Sales (in Bcf) 183 200 560 593 Total Gas Customers at September 30 4,465,259 4,438,565 Sources of Electric Energy (in millions kWh) Total Utility Generation 9,410 8,725 25,239 24,411 Total Purchased Power 9,189 12,560 25,905 32,327 Total Electric Energy Delivered (1) 24,160 24,067 62,914 63,486 Diablo Canyon Performance Overall Capacity Factor (including refuelings) 100% 100% 88% 95% Refueling Outage Period None None 4/23-6/23 4/30-6/2 Refueling Outage Duration during the Period (days) None None 61 33
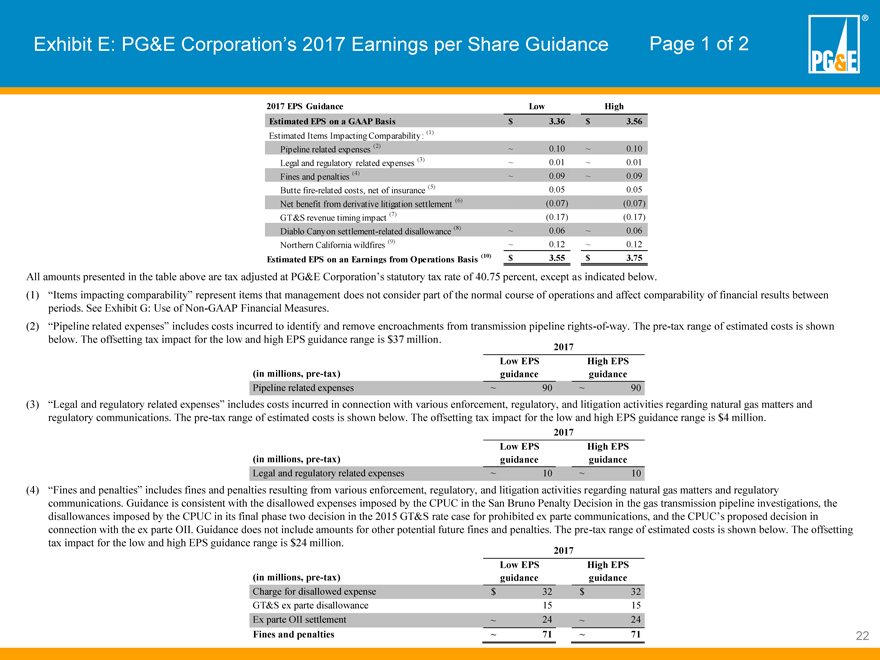
2017 EPS Guidance Estimated EPS on a GAAP Basis $ 3.36 $ 3.56 Estimated Items Impacting Comparability: (1) Pipeline related expenses (2) ~ 0.10 ~ 0.10 Legal and regulatory related expenses (3) ~ 0.01 ~ 0.01 Fines and penalties (4) ~ 0.09 ~ 0.09 Butte fire-related costs, net of insurance (5) 0.05 0.05 Net benefit from derivative litigation settlement (6) (0.07) (0.07) GT&S revenue timing impact (7) (0.17) (0.17) Diablo Canyon settlement-related disallowance (8) ~ 0.06 ~ 0.06 Northern California wildfires (9) ~ 0.12 ~ 0.12 Estimated EPS on an Earnings from Operations Basis (10) $ 3.55 $ 3.75 Low High Exhibit E: PG&E Corporation’s 2017 Earnings per Share Guidance 22 All amounts presented in the table above are tax adjusted at PG&E Corporation’s statutory tax rate of 40.75 percent, except as indicated below. (1) “Items impacting comparability” represent items that management does not consider part of the normal course of operations and affect comparability of financial results between periods. See Exhibit G: Use of Non-GAAP Financial Measures. (2) “Pipeline related expenses” includes costs incurred to identify and remove encroachments from transmission pipeline rights-of-way. The pre-tax range of estimated costs is shown below. The offsetting tax impact for the low and high EPS guidance range is $37 million. (3) “Legal and regulatory related expenses” includes costs incurred in connection with various enforcement, regulatory, and litigation activities regarding natural gas matters and regulatory communications. The pre-tax range of estimated costs is shown below. The offsetting tax impact for the low and high EPS guidance range is $4 million. (4) “Fines and penalties” includes fines and penalties resulting from various enforcement, regulatory, and litigation activities regarding natural gas matters and regulatory communications. Guidance is consistent with the disallowed expenses imposed by the CPUC in the San Bruno Penalty Decision in the gas transmission pipeline investigations, the disallowances imposed by the CPUC in its final phase two decision in the 2015 GT&S rate case for prohibited ex parte communications, and the CPUC’s proposed decision in connection with the ex parte OII. Guidance does not include amounts for other potential future fines and penalties. The pre-tax range of estimated costs is shown below. The offsetting tax impact for the low and high EPS guidance range is $24 million. Page 1 of 2 2017 Low EPS High EPS (in millions, pre-tax) guidance guidance Pipeline related expenses ~$ 90 ~$ 90 2017 Low EPS High EPS (in millions, pre-tax) guidance guidance Legal and regulatory related expenses ~$ 10 ~$ 10 2017 Low EPS High EPS (in millions, pre-tax) guidance guidance Charge for disallowed expense $ 32 $ 32 GT&S ex parte disallowance 15 15 Ex parte OII settlement ~ 24 ~ 24 Fines and penalties ~$ 71 ~$ 71
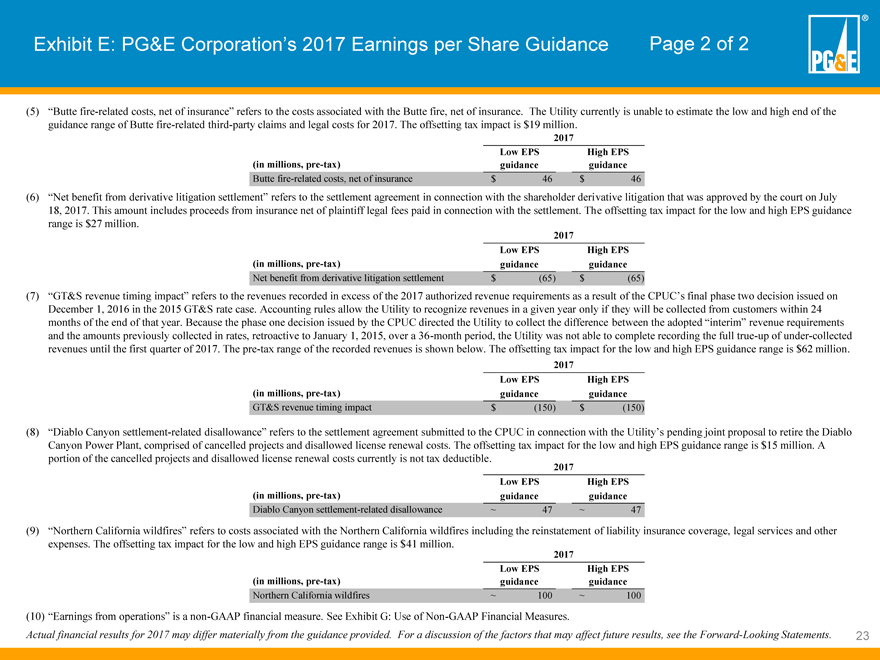
(5) “Butte fire-related costs, net of insurance” refers to the costs associated with the Butte fire, net of insurance. The Utility currently is unable to estimate the low and high end of the guidance range of Butte fire-related third-party claims and legal costs for 2017. The offsetting tax impact is $19 million. (6) “Net benefit from derivative litigation settlement” refers to the settlement agreement in connection with the shareholder derivative litigation that was approved by the court on July 18, 2017. This amount includes proceeds from insurance net of plaintiff legal fees paid in connection with the settlement. The offsetting tax impact for the low and high EPS guidance range is $27 million. (7) “GT&S revenue timing impact” refers to the revenues recorded in excess of the 2017 authorized revenue requirements as a result of the CPUC’s final phase two decision issued on December 1, 2016 in the 2015 GT&S rate case. Accounting rules allow the Utility to recognize revenues in a given year only if they will be collected from customers within 24 months of the end of that year. Because the phase one decision issued by the CPUC directed the Utility to collect the difference between the adopted “interim” revenue requirements and the amounts previously collected in rates, retroactive to January 1, 2015, over a 36-month period, the Utility was not able to complete recording the full true-up of under-collected revenues until the first quarter of 2017. The pre-tax range of the recorded revenues is shown below. The offsetting tax impact for the low and high EPS guidance range is $62 million. (8) “Diablo Canyon settlement-related disallowance” refers to the settlement agreement submitted to the CPUC in connection with the Utility’s pending joint proposal to retire the Diablo Canyon Power Plant, comprised of cancelled projects and disallowed license renewal costs. The offsetting tax impact for the low and high EPS guidance range is $15 million. A portion of the cancelled projects and disallowed license renewal costs currently is not tax deductible. (9) “Northern California wildfires” refers to costs associated with the Northern California wildfires including the reinstatement of liability insurance coverage, legal services and other expenses. The offsetting tax impact for the low and high EPS guidance range is $41 million. (10) “Earnings from operations” is a non-GAAP financial measure. See Exhibit G: Use of Non-GAAP Financial Measures. Exhibit E: PG&E Corporation’s 2017 Earnings per Share Guidance 23 Page 2 of 2 Actual financial results for 2017 may differ materially from the guidance provided. For a discussion of the factors that may affect future results, see the Forward-Looking Statements. 2017 Low EPS High EPS (in millions, pre-tax) guidance guidance Butte fire-related costs, net of insurance $ 46 $ 46 2017 Low EPS High EPS (in millions, pre-tax) guidance guidance Net benefit from derivative litigation settlement $ (65) $ (65) 2017 Low EPS High EPS (in millions, pre-tax) guidance guidance GT&S revenue timing impact $ (150) $ (150) 2017 Low EPS High EPS (in millions, pre-tax) guidance guidance Diablo Canyon settlement-related disallowance ~$ 47 ~$ 47 2017 Low EPS High EPS (in millions, pre-tax) guidance guidance Northern California wildfires ~$ 100 ~$ 100
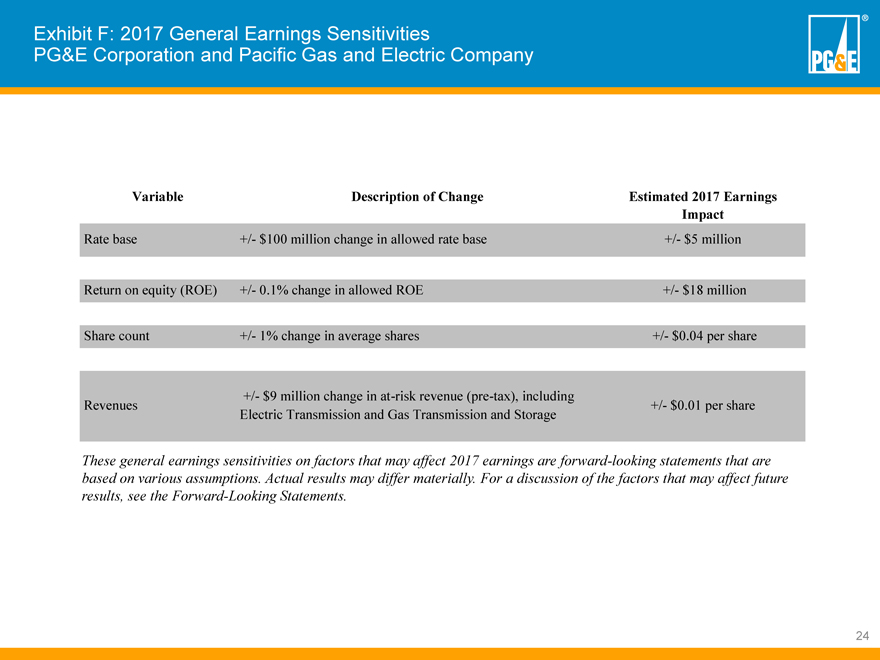
Exhibit F: 2017 General Earnings Sensitivities PG&E Corporation and Pacific Gas and Electric Company 24 These general earnings sensitivities on factors that may affect 2017 earnings are forward-looking statements that are based on various assumptions. Actual results may differ materially. For a discussion of the factors that may affect future results, see the Forward-Looking Statements. Variable Description of Change Estimated 2017 Earnings Impact Rate base +/- $100 million change in allowed rate base +/- $5 million Return on equity (ROE) +/- 0.1% change in allowed ROE +/- $18 million Share count +/- 1% change in average shares +/- $0.04 per share Revenues +/- $9 million change in at-risk revenue (pre-tax), including Electric Transmission and Gas Transmission and Storage +/- $0.01 per share
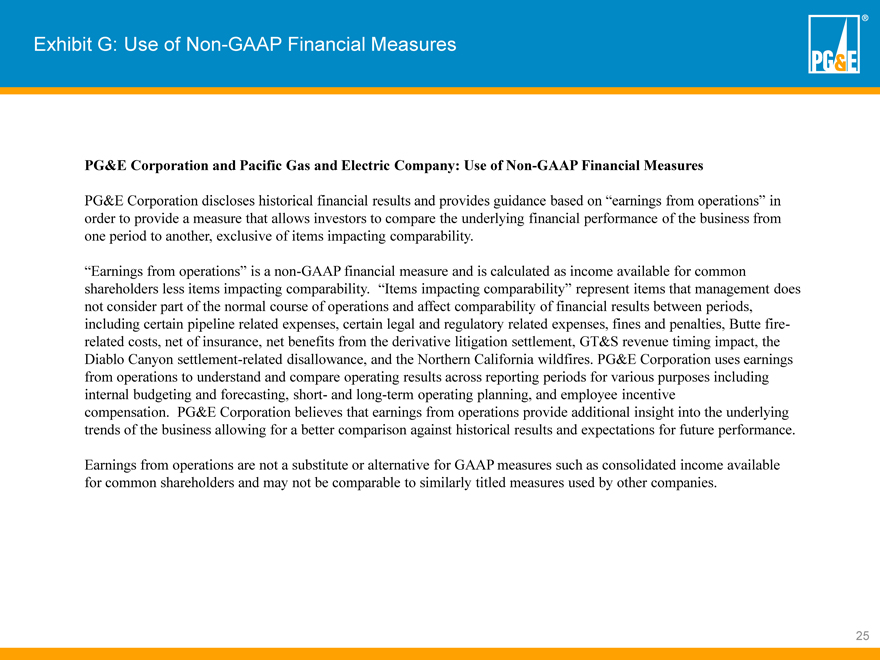
Exhibit G: Use of Non-GAAP Financial Measures 25 PG&E Corporation and Pacific Gas and Electric Company: Use of Non-GAAP Financial Measures PG&E Corporation discloses historical financial results and provides guidance based on “earnings from operations” in order to provide a measure that allows investors to compare the underlying financial performance of the business from one period to another, exclusive of items impacting comparability. “Earnings from operations” is a non-GAAP financial measure and is calculated as income available for common shareholders less items impacting comparability. “Items impacting comparability” represent items that management does not consider part of the normal course of operations and affect comparability of financial results between periods, including certain pipeline related expenses, certain legal and regulatory related expenses, fines and penalties, Butte fire-related costs, net of insurance, net benefits from the derivative litigation settlement, GT&S revenue timing impact, the Diablo Canyon settlement-related disallowance, and the Northern California wildfires. PG&E Corporation uses earnings from operations to understand and compare operating results across reporting periods for various purposes including internal budgeting and forecasting, short- and long-term operating planning, and employee incentive compensation. PG&E Corporation believes that earnings from operations provide additional insight into the underlying trends of the business allowing for a better comparison against historical results and expectations for future performance. Earnings from operations are not a substitute or alternative for GAAP measures such as consolidated income available for common shareholders and may not be comparable to similarly titled measures used by other companies.
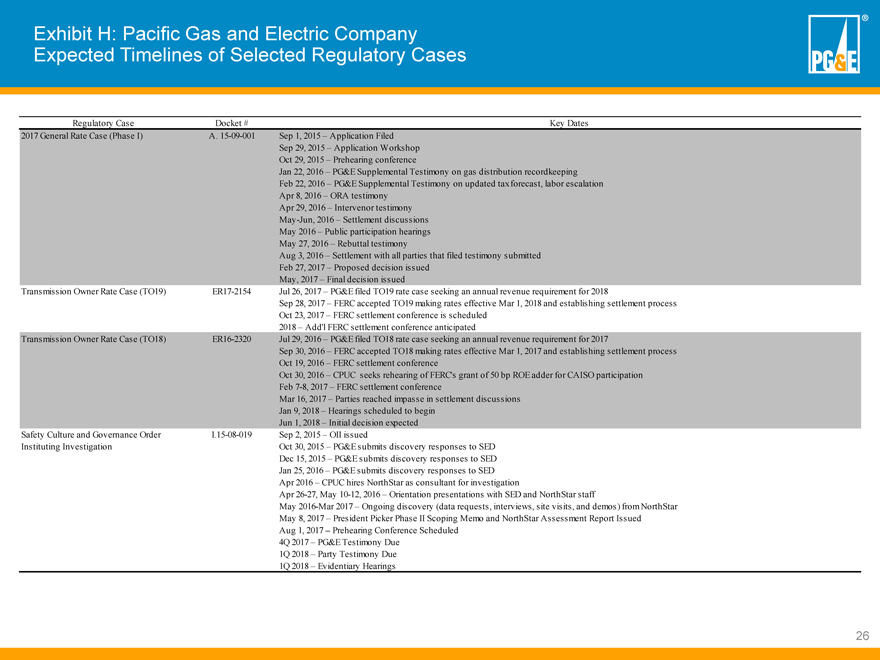
Exhibit H: Pacific Gas and Electric Company Expected Timelines of Selected Regulatory Cases 26 Regulatory Case Docket #Key Dates2017 General Rate Case (Phase I)A. 15-09-001Sep 1, 2015 – Application Filed Sep 29, 2015 – Application Workshop Oct 29, 2015 – Prehearing conference Jan 22, 2016 – PG&E Supplemental Testimony on gas distribution record keeping Feb 22, 2016 – PG&E Supplemental Testimony on updated tax forecast, labor escalation Apr 8, 2016 – ORA testimony Apr 29, 2016 – Intervenor testimony May-Jun, 2016 – Settlement discussions May 2016 – Public participation hearings May 27, 2016 – Rebuttal testimony Aug 3, 2016 – Settlement with all parties that filed testimony submitted Feb 27, 2017 – Proposed decision issued May, 2017 – Final decision issued Transmission Owner Rate Case (TO19)ER17-2154Jul 26, 2017 – PG&E filed TO19 rate case seeking an annual revenue requirement for 2018Sep 28, 2017 – FERC accepted TO19 making rates effective Mar 1, 2018 and establishing settlement process Oct 23, 2017 – FERC settlement conference is scheduled2018 – Add’l FERC settlement conference anticipated Transmission Owner Rate Case (TO18)ER16-2320Jul 29, 2016 – PG&E filed TO18 rate case seeking an annual revenue requirement for 2017Sep 30, 2016 – FERC accepted TO18 making rates effective Mar 1, 2017 and establishing settlement process Oct 19, 2016 – FERC settlement conference Oct 30, 2016 – CPUC seeks rehearing of FERC’s grant of 50 bp ROE adder for CAISO participation Feb 7-8, 2017 – FERC settlement conference Mar 16, 2017 – Parties reached impasse in settlement discussions Jan 9, 2018 – Hearings scheduled to begin Jun 1, 2018 – Initial decision expected Sep 2, 2015 – OII issued Oct 30, 2015 – PG&E submits discovery responses to SED Dec 15, 2015 – PG&E submits discovery responses to SED Jan 25, 2016 – PG&E submits discovery responses to SED Apr 2016 – CPUC hires NorthStar as consultant for investigation Apr 26-27, May 10-12, 2016 – Orientation presentations with SED and NorthStar staff May 2016-Mar 2017 – Ongoing discovery (data requests, interviews, site visits, and demos) from NorthStar May 8, 2017 – President Picker Phase II Scoping Memo and NorthStar Assessment Report Issued Aug 1, 2017 – Prehearing Conference Scheduled4Q 2017 – PG&E Testimony Due1Q 2018 – Party Testimony Due1Q 2018 – Evidentiary Hearings Safety Culture and Governance Order Instituting InvestigationI.15-08-019
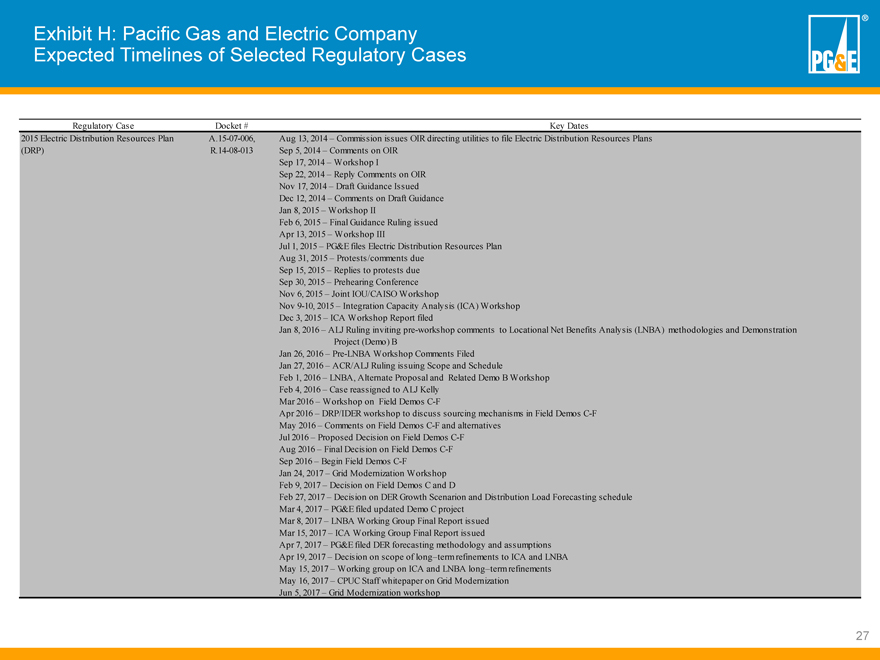
Exhibit H: Pacific Gas and Electric Company Expected Timelines of Selected Regulatory Cases 27 Regulatory Case Docket #Key Dates2015 Electric Distribution Resources Plan A.15-07-006,Aug 13, 2014 – Commission issues OIR directing utilities to file Electric Distribution Resources Plans (DRP)R.14-08-013Sep 5, 2014 – Comments on OIR Sep 17, 2014 – Workshop I Sep 22, 2014 – Reply Comments on OIR Nov 17, 2014 – Draft Guidance Issued Dec 12, 2014 – Comments on Draft Guidance Jan 8, 2015 – Workshop II Feb 6, 2015 – Final Guidance Ruling issued Apr 13, 2015 – Workshop III Jul 1, 2015 – PG&E files Electric Distribution Resources Plan Aug 31, 2015 – Protests/comments due Sep 15, 2015 – Replies to protests due Sep 30, 2015 – Prehearing Conference Nov 6, 2015 – Joint IOU/CAISO Workshop Nov 9-10, 2015 – Integration Capacity Analysis (ICA) Workshop Dec 3, 2015 – ICA Workshop Report filed Jan 8, 2016 – ALJ Ruling inviting pre-workshop comments to Locational Net Benefits Analysis (LNBA) methodologies and Demonstration Project (Demo) B Jan 26, 2016 – Pre-LNBA Workshop Comments Filed Jan 27, 2016 – ACR/ALJ Ruling issuing Scope and Schedule Feb 1, 2016 – LNBA, Alternate Proposal and Related Demo B Workshop Feb 4, 2016 – Case reassigned to ALJ Kelly Mar 2016 – Workshop on Field Demos C-F Apr 2016 – DRP/IDER workshop to discuss sourcing mechanisms in Field Demos C-F May 2016 – Comments on Field Demos C-F and alternatives Jul 2016 – Proposed Decision on Field Demos C-F Aug 2016 – Final Decision on Field Demos C-F Sep 2016 – Begin Field Demos C-F Jan 24, 2017 – Grid Modernization Workshop Feb 9, 2017 – Decision on Field Demos C and D Feb 27, 2017 – Decision on DER Growth Scenarion and Distribution Load Forecasting schedule Mar 4, 2017 – PG&E filed updated Demo C project Mar 8, 2017 – LNBA Working Group Final Report issued Mar 15, 2017 – ICA Working Group Final Report issued Apr 7, 2017 – PG&E filed DER forecasting methodology and assumptions Apr 19, 2017 – Decision on scope of long–term refinements to ICA and LNBA May 15, 2017 – Working group on ICA and LNBA long–term refinements May 16, 2017 – CPUC Staff whitepaper on Grid Modernization Jun 5, 2017 – Grid Modernization workshop
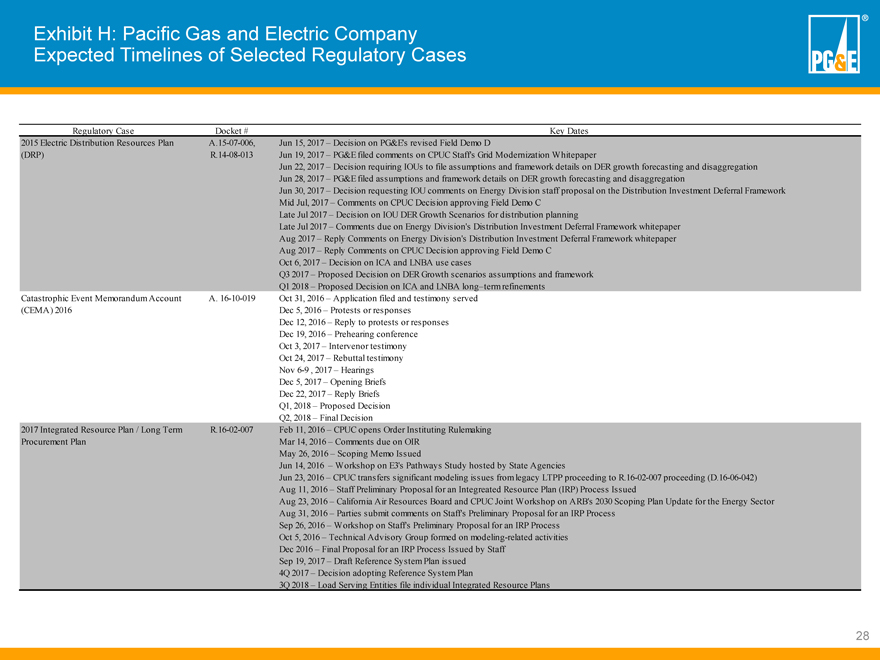
Exhibit H: Pacific Gas and Electric Company Expected Timelines of Selected Regulatory Cases 28 Regulatory Case Docket #Key Dates2015 Electric Distribution Resources Plan A.15-07-006,Jun 15, 2017 – Decision on PG&E’s revised Field Demo D (DRP)R.14-08-013Jun 19, 2017 – PG&E filed comments on CPUC Staff’s Grid Modernization Whitepaper Jun 22, 2017 – Decision requiring IOUs to file assumptions and framework details on DER growth forecasting and disaggregation Jun 28, 2017 – PG&E filed assumptions and framework details on DER growth forecasting and disaggregation Jun 30, 2017 – Decision requesting IOU comments on Energy Division staff proposal on the Distribution Investment Deferral Framework Mid Jul, 2017 – Comments on CPUC Decision approving Field Demo CL ate Jul 2017 – Decision on IOU DER Growth Scenarios for distribution planning Late Jul 2017 – Comments due on Energy Division’s Distribution Investment Deferral Framework whitepaper Aug 2017 – Reply Comments on Energy Division’s Distribution Investment Deferral Framework whitepaper Aug 2017 – Reply Comments on CPUC Decision approving Field Demo C Oct 6, 2017 – Decision on ICA and LNBA use casesQ3 2017 – Proposed Decision on DER Growth scenarios assumptions and frameworkQ1 2018 – Proposed Decision on ICA and LNBA long–term refinements A. 16-10-019Oct 31, 2016 – Application filed and testimony served Dec 5, 2016 – Protests or responses Dec 12, 2016 – Reply to protests or responses Dec 19, 2016 – Prehearing conference Oct 3, 2017 – Intervenor testimony Oct 24, 2017 – Rebuttal testimony Nov 6-9 , 2017 – Hearings Dec 5, 2017 – Opening Briefs Dec 22, 2017 – Reply BriefsQ1, 2018 – Proposed DecisionQ2, 2018 – Final Decision Feb 11, 2016 – CPUC opens Order Instituting Rulemaking Mar 14, 2016 – Comments due on OIR May 26, 2016 – Scoping Memo Issued Jun 14, 2016 – Workshop on E3’s Pathways Study hosted by State Agencies Jun 23, 2016 – CPUC transfers significant modeling issues from legacy LTPP proceeding to R.16-02-007 proceeding (D.16-06-042)Aug 11, 2016 – Staff Preliminary Proposal for an Integreated Resource Plan (IRP) Process Issued Aug 23, 2016 – California Air Resources Board and CPUC Joint Workshop on ARB’s 2030 Scoping Plan Update for the Energy Sector Aug 31, 2016 – Parties submit comments on Staff’s Preliminary Proposal for an IRP Process Sep 26, 2016 – Workshop on Staff’s Preliminary Proposal for an IRP Process Oct 5, 2016 – Technical Advisory Group formed on modeling-related activities Dec 2016 – Final Proposal for an IRP Process Issued by Staff Sep 19, 2017 – Draft Reference System Plan issued 4Q 2017 – Decision adopting Reference System Plan3Q 2018 – Load Serving Entities file individual Integrated Resource Plans Catastrophic Event Memorandum Account (CEMA) 20162017 Integrated Resource Plan / Long Term Procurement PlanR.16-02-007
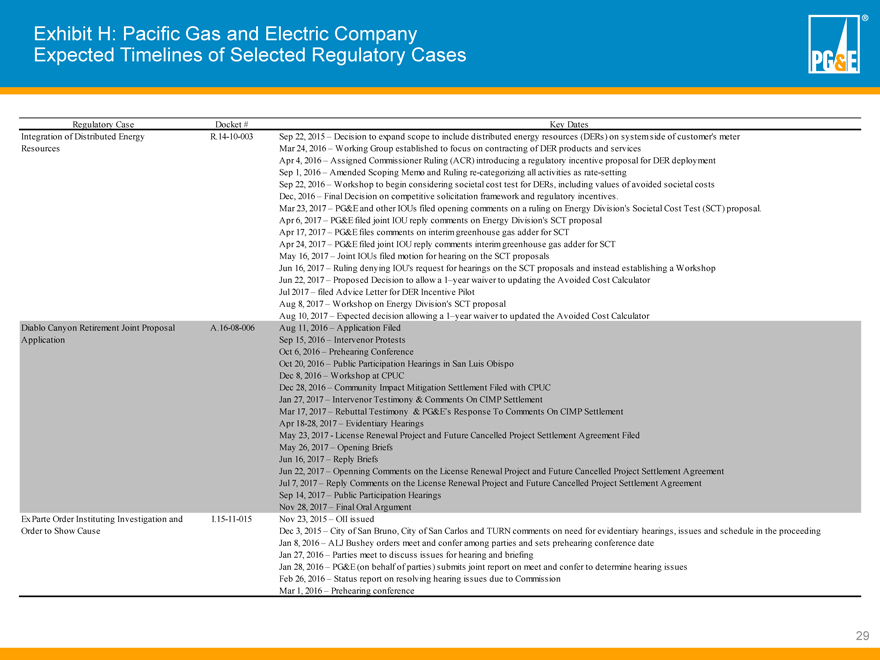
Exhibit H: Pacific Gas and Electric Company Expected Timelines of Selected Regulatory Cases 29 Regulatory Case Docket #Key DatesR.14-10-003Sep 22, 2015 – Decision to expand scope to include distributed energy resources (DERs) on system side of customer’s meter Mar 24, 2016 – Working Group established to focus on contracting of DER products and services Apr 4, 2016 – Assigned Commissioner Ruling (ACR) introducing a regulatory incentive proposal for DER deployment Sep 1, 2016 – Amended Scoping Memo and Ruling re-categorizing all activities as rate-setting Sep 22, 2016 – Workshop to begin considering societal cost test for DERs, including values of avoided societal costs Dec, 2016 – Final Decision on competitive solicitation framework and regulatory incentives. Mar 23, 2017 – PG&E and other IOUs filed opening comments on a ruling on Energy Division’s Societal Cost Test (SCT) proposal. Apr 6, 2017 – PG&E filed joint IOU reply comments on Energy Division’s SCT proposal Apr 17, 2017 – PG&E files comments on interim greenhouse gas adder for SCT Apr 24, 2017 – PG&E filed joint IOU reply comments interim greenhouse gas adder for SCT May 16, 2017 – Joint IOUs filed motion for hearing on the SCT proposals Jun 16, 2017 – Ruling denying IOU’s request for hearings on the SCT proposals and instead establishing a Workshop Jun 22, 2017 – Proposed Decision to allow a 1–year waiver to updating the Avoided Cost Calculator Jul 2017 – filed Advice Letter for DER Incentive Pilot Aug 8, 2017 – Workshop on Energy Division’s SCT proposal Aug 10, 2017 – Expected decision allowing a 1–year waiver to updated the Avoided Cost CalculatorA.16-08-006Aug 11, 2016 – Application Filed Sep 15, 2016 – Intervenor Protests Oct 6, 2016 – Prehearing Conference Oct 20, 2016 – Public Participation Hearings in San Luis Obispo Dec 8, 2016 – Workshop at CPUC Dec 28, 2016 – Community Impact Mitigation Settlement Filed with CPUC Jan 27, 2017 – Intervenor Testimony & Comments On CIMP Settlement Mar 17, 2017 – Rebuttal Testimony & PG&E’s Response To Comments On CIMP Settlement Apr 18-28, 2017 – Evidentiary Hearings May 23, 2017—License Renewal Project and Future Cancelled Project Settlement Agreement Filed May 26, 2017 – Opening Briefs Jun 16, 2017 – Reply Briefs Jun 22, 2017 – Openning Comments on the License Renewal Project and Future Cancelled Project Settlement Agreement Jul 7, 2017 – Reply Comments on the License Renewal Project and Future Cancelled Project Settlement Agreement Sep 14, 2017 – Public Participation Hearings Nov 28, 2017 – Final Oral Argument Nov 23, 2015 – OII issued Dec 3, 2015 – City of San Bruno, City of San Carlos and TURN comments on need for evidentiary hearings, issues and schedule in the proceeding Jan 8, 2016 – ALJ Bushey orders meet and confer among parties and sets prehearing conference date Jan 27, 2016 – Parties meet to discuss issues for hearing and briefing Jan 28, 2016 – PG&E (on behalf of parties) submits joint report on meet and confer to determine hearing issues Feb 26, 2016 – Status report on resolving hearing issues due to Commission Mar 1, 2016 – Prehearing conference Integration of Distributed Energy Resources Diablo Canyon Retirement Joint Proposal Application Ex Parte Order Instituting Investigation and Order to Show CauseI.15-11-015
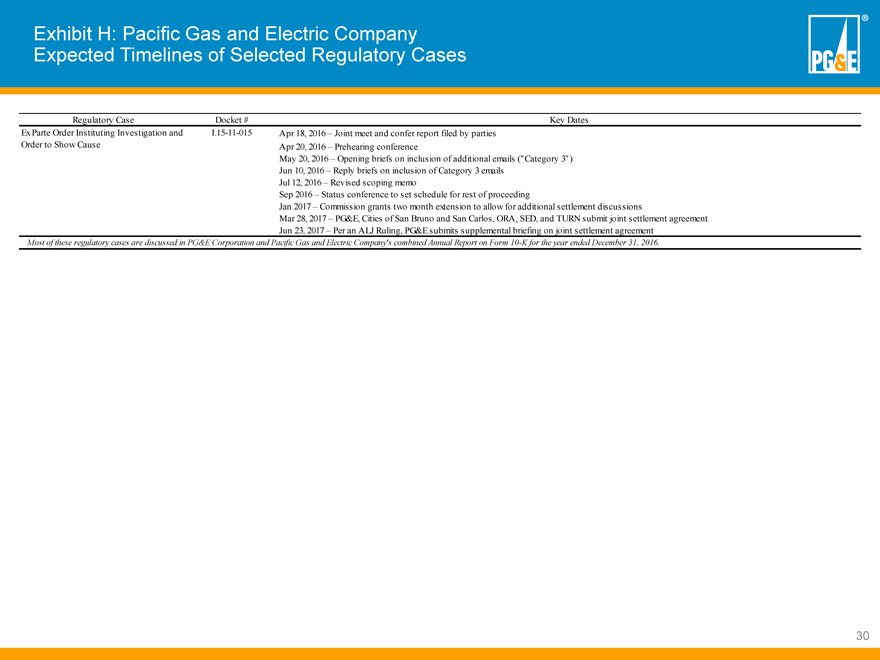
Exhibit H: Pacific Gas and Electric Company Expected Timelines of Selected Regulatory Cases 30 Regulatory Case Docket #Key DatesI.15-11-015Apr 18, 2016 – Joint meet and confer report filed by parties Apr 20, 2016 – Prehearing conference May 20, 2016 – Opening briefs on inclusion of additional emails (“Category 3”)Jun 10, 2016 – Reply briefs on inclusion of Category 3 emails Jul 12, 2016 – Revised scoping memo Sep 2016 – Status conference to set schedule for rest of proceeding Jan 2017 – Commission grants two month extension to allow for additional settlement discussions Mar 28, 2017 – PG&E, Cities of San Bruno and San Carlos, ORA, SED, and TURN submit joint settlement agreement Jun 23, 2017 – Per an ALJ Ruling, PG&E submits supplemental briefing on joint settlement agreement Most of these regulatory cases are discussed in PG&E Corporation and Pacific Gas and Electric Company’s combined Annual Report on Form 10-K for the year ended December 31, 2016.Ex Parte Order Instituting Investigation and Order to Show Cause