Attached files
| file | filename |
|---|---|
| 8-K - 8-K - GARTNER INC | it-09302017x8xk.htm |
| EX-99.1 - EXHIBIT 99.1 - GARTNER INC | it-09302017xex991.htm |

0 CONFIDENTIAL AND PROPRIETARY I © 2017 Gartner, Inc. and/or its affiliates. All rights reserved.
Third Quarter 2017 Results
November 2, 2017
1 CONFIDENTIAL AND PROPRIETARY I © 2017 Gartner, Inc. and/or its affiliates. All rights reserved.
Statements contained in this presentation regarding the growth and prospects of the business, the Company’s projected 2017 financial results, long-
term objectives and all other statements in this presentation other than recitation of historical facts are forward looking statements (as defined in the
Private Securities Litigation Reform Act of 1995). Such forward looking statements involve known and unknown risks, uncertainties and other
factors; consequently, actual results may differ materially from those expressed or implied thereby.
Factors that could cause actual results to differ materially include, but are not limited to, the ability to achieve and effectively manage growth,
including the ability to integrate the CEB acquisition, other acquisitions and consummate acquisitions in the future; the ability to pay Gartner’s debt
obligations, which have increased substantially with the CEB acquisition; the ability to maintain and expand Gartner’s products and services; the
ability to expand or retain Gartner’s customer base; the ability to grow or sustain revenue from individual customers; the ability to attract and retain a
professional staff of research analysts and consultants upon whom Gartner is dependent; the ability to achieve continued customer renewals and
achieve new contract value, backlog and deferred revenue growth in light of competitive pressures; the ability to carry out Gartner’s strategic
initiatives and manage associated costs; the ability to successfully compete with existing competitors and potential new competitors; the ability to
enforce and protect our intellectual property rights; additional risks associated with international operations including foreign currency fluctuations;
the impact of restructuring and other charges on Gartner’s businesses and operations; general economic conditions; risks associated with the credit
worthiness and budget cuts of governments and agencies; and other risks listed from time to time in Gartner’s reports filed with the Securities and
Exchange Commission, including Gartner’s most recent Annual Report on Form 10-K and Quarterly Reports on Form 10-Q.
The Company’s SEC filings can be found on Gartner’s website at investor.gartner.com and on the SEC’s website at www.sec.gov. Forward looking
statements included herein speak only as of November 2, 2017 and the Company disclaims any obligation to revise or update such statements to
reflect events or circumstances after this date or to reflect the occurrence of unanticipated events or circumstances.
In this presentation, we include “Combined” numbers that, for periods prior to our acquisition of CEB (unless expressly noted otherwise), reflect
numerical addition of the results of Gartner and CEB for each line item and do not include all the adjustments required with respect to the
presentation of pro forma financial information under GAAP and the rules and regulations of the SEC. Accordingly, these “Combined” numbers are
non-GAAP, but are provided because Gartner believes they are useful in comparing performance of Gartner following the CEB acquisition with
performance of Gartner and CEB independently prior to Gartner’s acquisition of CEB. These Combined numbers should be read together with the
historical financial statements of Gartner and CEB included in their respective quarterly reports on Form 10-Q and annual reports on Form 10-K, and
the pro forma financial statements included in Exhibit 99.1 to Gartner’s Current Report on Form 8-K filed with the SEC on April 6, 2017 and footnote
2 to Gartner’s Current Report on Form 10-Q for the period ended September 30, 2017.
References in this presentation to "Traditional Gartner" operating results and business measurements refer to Gartner excluding CEB.
Disclaimer & Explanatory Note

2 CONFIDENTIAL AND PROPRIETARY I © 2017 Gartner, Inc. and/or its affiliates. All rights reserved.
Third Quarter 2017: Highlights
Traditional Gartner Total FX Neutral CV
Growth of 15%
y/y improvements in both client and wallet
retention metrics with strong productivity growth
Adjusted EBITDA of $149M
Combined Free Cash Flow Conversion
Rate of 139%
on a comparable basis
Adjusted Earnings Per Share of $0.65
above the high end of guidance range
Total Combined Adjusted Revenue
Growth of 11%
15% y/y FX neutral growth for traditional
Gartner business
Combined Free Cash Flow Growth of 14%
3 CONFIDENTIAL AND PROPRIETARY I © 2017 Gartner, Inc. and/or its affiliates. All rights reserved.
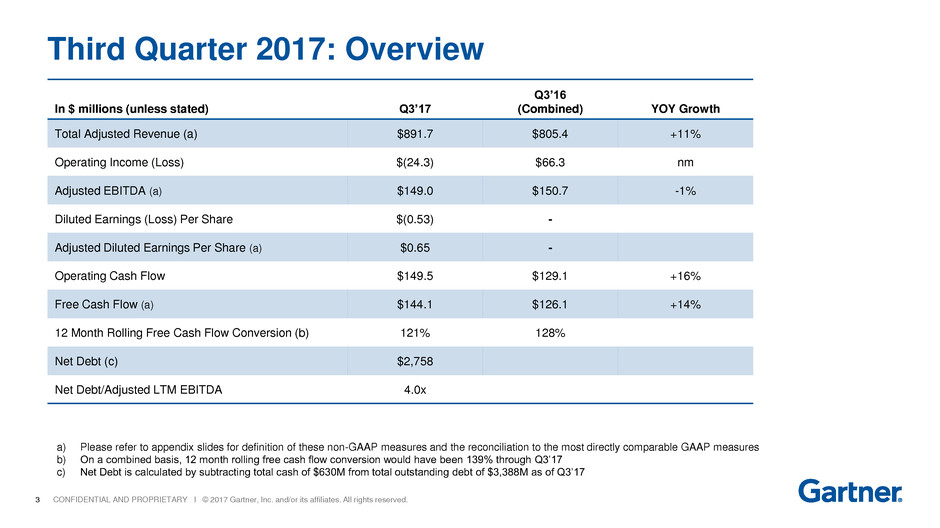
In $ millions (unless stated) Q3’17
Q3’16
(Combined) YOY Growth
Total Adjusted Revenue (a) $891.7 $805.4 +11%
Operating Income (Loss) $(24.3) $66.3 nm
Adjusted EBITDA (a) $149.0 $150.7 -1%
Diluted Earnings (Loss) Per Share $(0.53) -
Adjusted Diluted Earnings Per Share (a) $0.65 -
Operating Cash Flow $149.5 $129.1 +16%
Free Cash Flow (a) $144.1 $126.1 +14%
12 Month Rolling Free Cash Flow Conversion (b) 121% 128%
Net Debt (c) $2,758
Net Debt/Adjusted LTM EBITDA 4.0x
Third Quarter 2017: Overview
a) Please refer to appendix slides for definition of these non-GAAP measures and the reconciliation to the most directly comparable GAAP measures
b) On a combined basis, 12 month rolling free cash flow conversion would have been 139% through Q3’17
c) Net Debt is calculated by subtracting total cash of $630M from total outstanding debt of $3,388M as of Q3’17
4 CONFIDENTIAL AND PROPRIETARY I © 2017 Gartner, Inc. and/or its affiliates. All rights reserved.
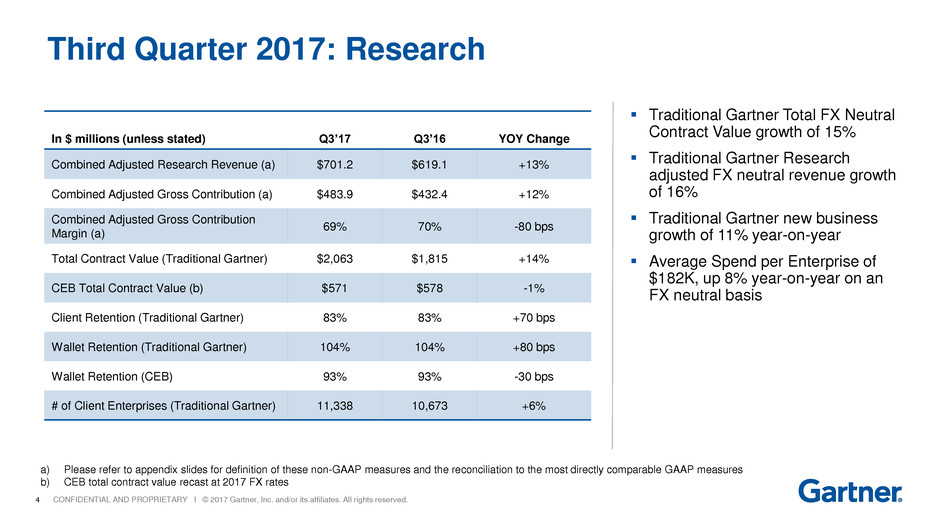
In $ millions (unless stated) Q3’17 Q3’16 YOY Change
Combined Adjusted Research Revenue (a) $701.2 $619.1 +13%
Combined Adjusted Gross Contribution (a) $483.9 $432.4 +12%
Combined Adjusted Gross Contribution
Margin (a)
69% 70% -80 bps
Total Contract Value (Traditional Gartner) $2,063 $1,815 +14%
CEB Total Contract Value (b) $571 $578 -1%
Client Retention (Traditional Gartner) 83% 83% +70 bps
Wallet Retention (Traditional Gartner) 104% 104% +80 bps
Wallet Retention (CEB) 93% 93% -30 bps
# of Client Enterprises (Traditional Gartner) 11,338 10,673 +6%
Third Quarter 2017: Research
Traditional Gartner Total FX Neutral
Contract Value growth of 15%
Traditional Gartner Research
adjusted FX neutral revenue growth
of 16%
Traditional Gartner new business
growth of 11% year-on-year
Average Spend per Enterprise of
$182K, up 8% year-on-year on an
FX neutral basis
a) Please refer to appendix slides for definition of these non-GAAP measures and the reconciliation to the most directly comparable GAAP measures
b) CEB total contract value recast at 2017 FX rates
5 CONFIDENTIAL AND PROPRIETARY I © 2017 Gartner, Inc. and/or its affiliates. All rights reserved.
Traditional Gartner Research Highlights
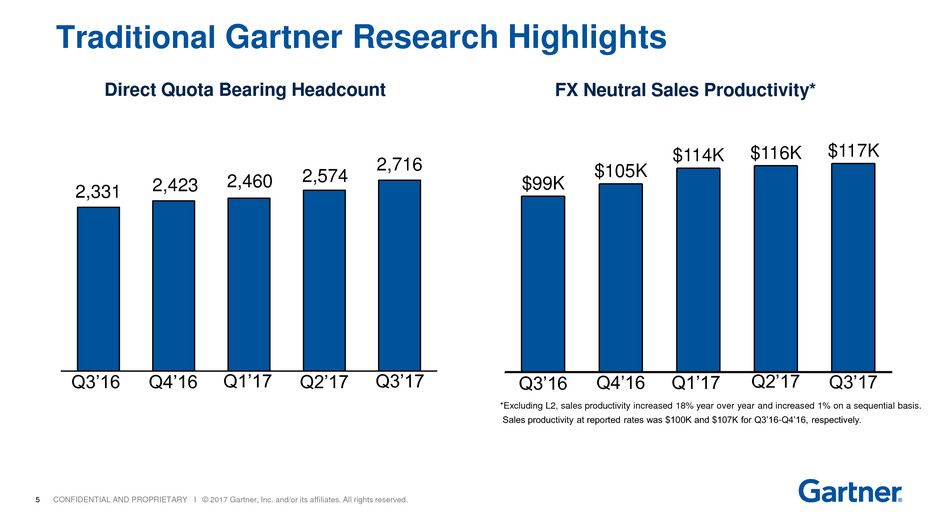
Direct Quota Bearing Headcount FX Neutral Sales Productivity*
*Excluding L2, sales productivity increased 18% year over year and increased 1% on a sequential basis.
Sales productivity at reported rates was $100K and $107K for Q3’16-Q4’16, respectively.
Q3’17Q3’16 Q4’16 Q2’17Q1’17
2,331 2,423
2,460 2,574
2,716
Q2’17Q1’17 Q3’17Q4’16Q3’16
$116K$114K
$105K
$99K
$117K

6 CONFIDENTIAL AND PROPRIETARY I © 2017 Gartner, Inc. and/or its affiliates. All rights reserved.
In $ millions (unless stated) Q3'17
Q3'16
(Combined) YOY Growth
Adjusted Events Revenue (a) $45.1 $36.2 +25%
Adjusted Gross Contribution (a) $16.2 $12.8 +27%
Adjusted Contribution Margin (a) 36% 35% +40 bps
Number of Events (b) 17 16 -
Events Attendees 10,640 8,198 +30%
Third Quarter 2017: Events
a) Please refer to appendix slides for definition of these non-GAAP measures and the reconciliation to the most directly comparable GAAP measures
b) Includes Traditional Gartner and CEB destination events
On a same-events basis, Traditional
Gartner Event business adjusted
revenues increased 18% and 15%
year-on-year in Q3 2017 on a
reported and FX neutral basis,
respectively
Traditional Gartner Events held 16
events in Q3 2017, with 21% year-
on-year increase in same event
attendees
CEB held one destination event in
Q3 2017 (ReimagineHR)

7 CONFIDENTIAL AND PROPRIETARY I © 2017 Gartner, Inc. and/or its affiliates. All rights reserved.
In $ millions (unless stated) Q3'17
Q3'16
(Combined) YOY Change
Adjusted Consulting Revenue (a) $72.1 $73.7 -2%
Adjusted Gross Contribution (a) $16.2 $18.2 -11%
Adjusted Contribution Margin (a) 22% 25% -230 bps
Quarterly Utilization Rate 61% 63% -150 bps
Billable Headcount 682 630 +8%
Avg. Annualized Rev. per Billable Headcount
($ Thousands)
$355 $368 -4%
Third Quarter 2017: Consulting
134128125123115
Q2’17Q1'17Q4'16Q3'16
+17%
Q3’17
9191898990
Q2’17Q1’17Q4’16Q3’16 Q3’17
+2%
Managing Partners Consulting Backlog* ($M)
* No longer includes backlog associated with Strategic Advisory Services (SAS)
Continued investment in Managing
Partners, up 17% compared to
Q3 2016
Backlog increased by 3% year-on-
year on an FX-neutral basis in Q3
2017
Backlog represents approximately
4 months of forward coverage, in
line with operational target
a) Please refer to appendix slides for definition of these non-GAAP measures and the reconciliation to the most directly comparable GAAP measures
8 CONFIDENTIAL AND PROPRIETARY I © 2017 Gartner, Inc. and/or its affiliates. All rights reserved.
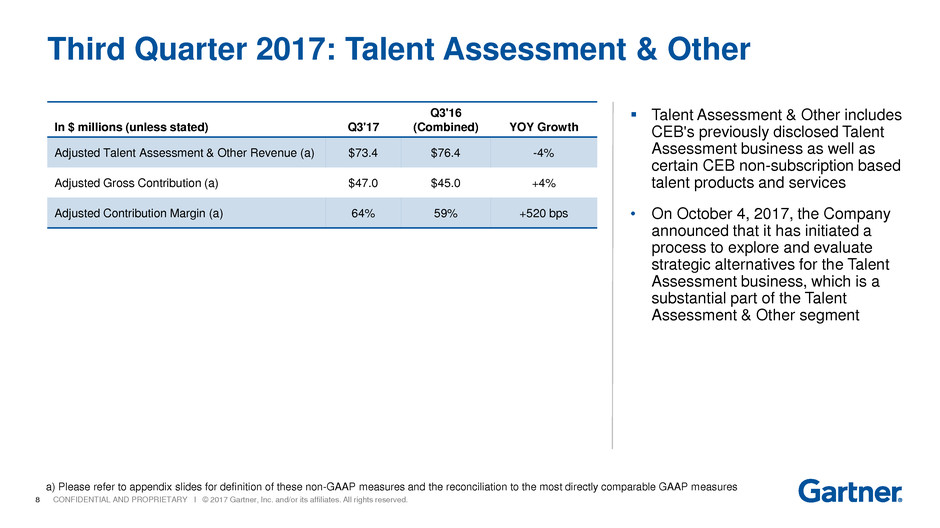
In $ millions (unless stated) Q3'17
Q3'16
(Combined) YOY Growth
Adjusted Talent Assessment & Other Revenue (a) $73.4 $76.4 -4%
Adjusted Gross Contribution (a) $47.0 $45.0 +4%
Adjusted Contribution Margin (a) 64% 59% +520 bps
Third Quarter 2017: Talent Assessment & Other
Talent Assessment & Other includes
CEB's previously disclosed Talent
Assessment business as well as
certain CEB non-subscription based
talent products and services
• On October 4, 2017, the Company
announced that it has initiated a
process to explore and evaluate
strategic alternatives for the Talent
Assessment business, which is a
substantial part of the Talent
Assessment & Other segment
a) Please refer to appendix slides for definition of these non-GAAP measures and the reconciliation to the most directly comparable GAAP measures

9 CONFIDENTIAL AND PROPRIETARY I © 2017 Gartner, Inc. and/or its affiliates. All rights reserved.
Third Quarter 2017: Adjusted Earnings Per Share(a)
In $ thousands, except per share amounts
Three Months Ended
September 30, 2017
Net Income (Loss) $(48,180)
Acquisition adjustments, net of tax effect:
Amortization of acquired intangibles (b) $51,130
Amortization of pre-acquisition deferred revenues (c) $63,655
Acquisition and integration charges and other nonrecurring items (d) (e) $31,282
Tax impact of adjustments (f) $(38,371)
Adjusted net income $59,516
Adjusted diluted earnings per share (g): $0.65
Weighted average shares outstanding:
Diluted (in millions) 92.0
a) Adjusted earnings per share represents GAAP diluted earnings per share adjusted for the per share impact of certain items directly-related to acquisitions and other items
b) Consists of non-cash amortization charges from acquired intangibles
c) Consists of the amortization of non-cash fair value adjustments on pre-acquisition deferred revenues. The majority of the pre-acquisition deferred revenue is recognized ratably over the remaining period of the underlying revenue
contract.
d) Consists of incremental and directly-related charges related to acquisitions and other non-recurring items
e) Includes the amortization and write-off of deferred financing fees for both the three and nine months ended September 30, 2017 which is recorded in Interest expense, net in the Consolidated Statement of Operations and in the
Adjusted EPS table presented above
f) The effective tax rate was 26% for the three months ended September 30, 2017
g) The adjusted diluted EPS is calculated based on 92.0 million shares for the three months ended September 30, 2017

10 CONFIDENTIAL AND PROPRIETARY I © 2017 Gartner, Inc. and/or its affiliates. All rights reserved.
In $ millions Q3'17
Q3'16
(Combined) YOY Change
Adjusted EBITDA $149.0 $150.7 -1%
Operating Cash Flow $149.5 $129.1 +16%
- Capital Expenditures $(34.0) $(16.0)
+ Cash Acquisition and
Integration Payments
$28.5 $13.0
= Free Cash Flow $144.1 $126.1 +14%
Free Cash Flow Conversion* 121% 128%
Third Quarter 2017: Cash Flow Highlights
*On a combined basis, 12 month rolling free cash flow conversion would have been 139% through Q3’17
On a comparable basis, Q3 2017
operating cash flow growth was 16%
year-on-year, driven by the strong
performance of traditional Gartner
research in Q3 2017
On a comparable basis, free cash
flow increased by 14% year-on-year
driven by higher operating cash flow
Our business model continues to
convert Free Cash Flow well in
excess of Adjusted Net Income

11 CONFIDENTIAL AND PROPRIETARY I © 2017 Gartner, Inc. and/or its affiliates. All rights reserved.
$745 $703 $1,658
$3,468 $3,388
$(466) $(474)
$(1,228)
$(589) $(630)
3Q16 4Q16 1Q17 2Q17 3Q17
Total Debt Cash
Net Debt ($M)
0.7x
0.5x
0.9x
4.1x 4.0x
3Q16 4Q16 1Q17 2Q17 3Q17
Net Debt* / EBITDA Ratio
Third Quarter 2017: Balance Sheet and Capital Structure
$279 $229
$430
*Q3’17 Net Debt Leverage Ratio calculated using LTM of Adjusted EBITDA of $692.7M
Revolver capacity was $534M as of the end of Q3’17
65% of gross debt has fixed interest rates
$2,758$2,879

12 CONFIDENTIAL AND PROPRIETARY I © 2017 Gartner, Inc. and/or its affiliates. All rights reserved.
Fiscal Year 2017
Outlook

13 CONFIDENTIAL AND PROPRIETARY I © 2017 Gartner, Inc. and/or its affiliates. All rights reserved.
Updated 2017 Guidance
In $ millions, except per share amounts Updated 2017 Guidance Range*
Research revenue $2,455 - $2,480
Consulting revenue $320 - $335
Events revenue $323 - $338
Talent Assessment & Other $159 - $174
Total Revenue (GAAP) $3,257 - $3,327
Deferred Revenue Fair Value Adjustment $203 - $203
Total Adjusted Revenue $3,460 - $3,530
Operating Income $14 - $39
Adjusted EBITDA $685 - $710
Diluted Earnings (Loss) Per Share (GAAP) $(0.85) - $(0.65)
Adjusted Diluted Earnings Per Share $3.39 - $3.50
Fully Diluted Number of Shares 89.9 - 90.5
Operating Cash Flow $335 - $345
Acquisition and Integration Payments $115 - $125
Capital Expenditures $(115) - $(125)
Free Cash Flow $335 - $345
*2017 guidance is based on 12 months of traditional Gartner results plus 9 months of CEB results
14 CONFIDENTIAL AND PROPRIETARY I © 2017 Gartner, Inc. and/or its affiliates. All rights reserved.
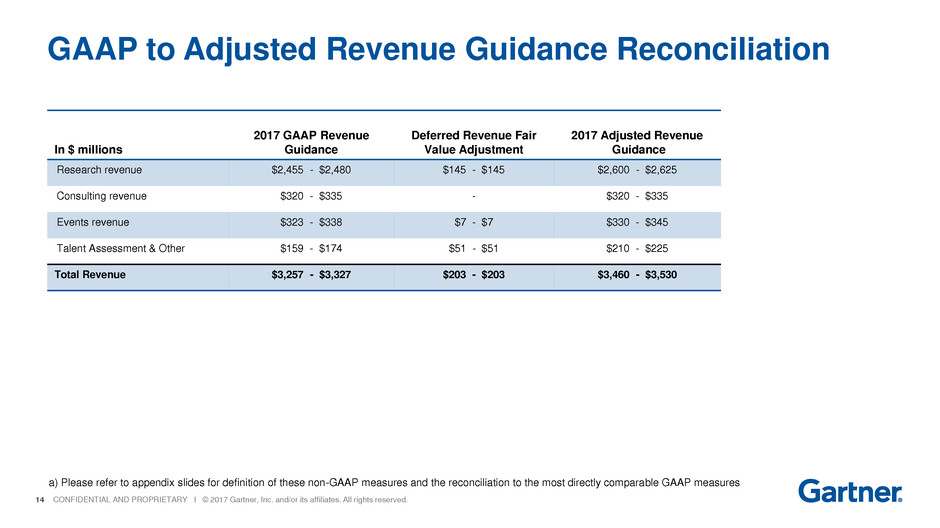
GAAP to Adjusted Revenue Guidance Reconciliation
In $ millions
2017 GAAP Revenue
Guidance
Deferred Revenue Fair
Value Adjustment
2017 Adjusted Revenue
Guidance
Research revenue $2,455 - $2,480 $145 - $145 $2,600 - $2,625
Consulting revenue $320 - $335 - $320 - $335
Events revenue $323 - $338 $7 - $7 $330 - $345
Talent Assessment & Other $159 - $174 $51 - $51 $210 - $225
Total Revenue $3,257 - $3,327 $203 - $203 $3,460 - $3,530
a) Please refer to appendix slides for definition of these non-GAAP measures and the reconciliation to the most directly comparable GAAP measures

15 CONFIDENTIAL AND PROPRIETARY I © 2017 Gartner, Inc. and/or its affiliates. All rights reserved.
$0.31
$(1.59)
$0.94
$1.49
Reconciliation of 2017 Adjusted to GAAP EPS Outlook
~$(1.29)
~$(1.38)
~$(1.53)
$3.39 – $3.50
**Adjusting items calculated at the midpoint of guidance range
Amortization of
Pre-Acquisition
Deferred Revenue
Adjusted EPS
Guidance
Range
Amortization
of Acquired
Intangibles Acquisition and
Integration and Other
Non-Recurring Items
$(0.85) – $(0.65)
GAAP EPS
Guidance Range

16 CONFIDENTIAL AND PROPRIETARY I © 2017 Gartner, Inc. and/or its affiliates. All rights reserved.
Appendix
17 CONFIDENTIAL AND PROPRIETARY I © 2017 Gartner, Inc. and/or its affiliates. All rights reserved.
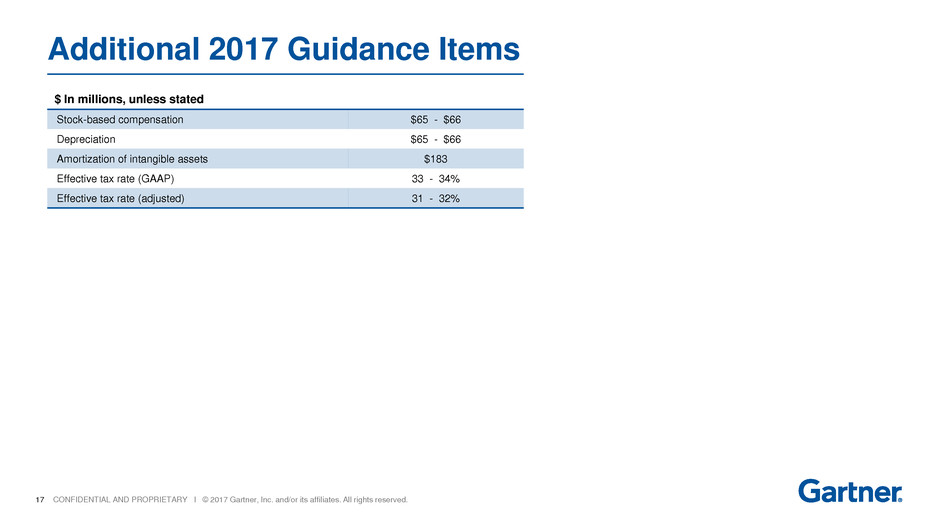
Additional 2017 Guidance Items
$ In millions, unless stated
Stock-based compensation $65 - $66
Depreciation $65 - $66
Amortization of intangible assets $183
Effective tax rate (GAAP) 33 - 34%
Effective tax rate (adjusted) 31 - 32%

18 CONFIDENTIAL AND PROPRIETARY I © 2017 Gartner, Inc. and/or its affiliates. All rights reserved.
Operating Income (Loss) to Adjusted EBITDA(a)
Reconciliation
In $ thousands
Q3’17
Q3’16
(Combined)(g)
Operating income (Loss) $(24,349) $66,288
Normalizing adjustments:
Stock-based compensation expense (b) $13,198 $14,413
Depreciation, accretion, and amortization (c) $68,960 $40,676
Amortization of pre-acquisition deferred revenues (d) $63,655 $1,535
Acquisition and integration charges and other nonrecurring items (e) $27,523 $17,396
Other charges (f) $10,368
Adjusted EBITDA $148,987 $150,676
a) Adjusted EBITDA is based on GAAP operating income adjusted for certain normalizing adjustments
b) Consists of charges for stock-based compensation awards
c) Includes depreciation expense, accretion on excess facilities accruals, and amortization of intangibles. The depreciation and amortization amounts do not include any fair value adjustments as a result of the acquisition
d) Consists of the amortization of non-cash fair value adjustments on pre-acquisition deferred revenues. The majority of the pre-acquisition deferred revenue is recognized ratably over the remaining period of the underlying revenue contract
e) Consists of incremental and directly-related charges related to acquisitions and other non-recurring items
f) Primarily consists of restructuring costs, real estate and business transformation costs, equity investment losses and non-operating foreign currency impact related to the acquired CEB business
g) Please refer to Exhibit 99.2 filed with Form 8-K on August 8, 2017 for a breakdown of the combined amounts into the Traditional Gartner and CEB components
19 CONFIDENTIAL AND PROPRIETARY I © 2017 Gartner, Inc. and/or its affiliates. All rights reserved.
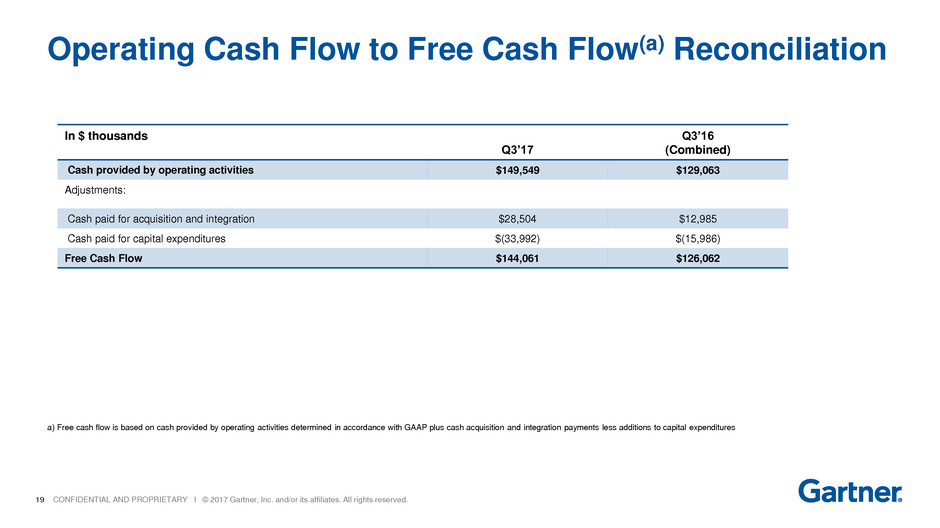
Operating Cash Flow to Free Cash Flow(a) Reconciliation
In $ thousands
Q3’17
Q3’16
(Combined)
Cash provided by operating activities $149,549 $129,063
Adjustments:
Cash paid for acquisition and integration $28,504 $12,985
Cash paid for capital expenditures $(33,992) $(15,986)
Free Cash Flow $144,061 $126,062
a) Free cash flow is based on cash provided by operating activities determined in accordance with GAAP plus cash acquisition and integration payments less additions to capital expenditures

20 CONFIDENTIAL AND PROPRIETARY I © 2017 Gartner, Inc. and/or its affiliates. All rights reserved.
Adjusted Segments
Three Months Ended
September 30, 2016
Combined(a)
In $ thousands GAAP Revenue
Deferred
Revenue Fair
Value
Adjustment
Adjusted
Revenue Direct Expense
Adjusted Gross
Contribution
Adjusted
Contribution
Margin
Adjusted
EBITDA
Research $653,443 $47,725 $701,168 $217,221 $483,947 69%
Consulting $72,117 $0 $72,117 $55,929 $16,188 22%
Events $44,953 $147 $45,100 $28,942 $16,158 36%
Talent Assessment &
Other
$57,572 $15,783 $73,355 $26,357 $46,997 64%
TOTAL $828,085 $63,655 $891,740 $328,449 $563,290 63% $148,987
Three Months Ended
September 30, 2017
As Reported
a) Please refer to Exhibit 99.2 filed with Form 8-K on August 8, 2017 for a breakdown of the combined amounts into the Traditional Gartner and CEB components
In $ thousands GAAP Revenue
Deferred
Revenue Fair
Value
Adjustment
Adjusted
Revenue Direct Expense
Adjusted Gross
Contribution
Adjusted
Contribution
Margin
Adjusted
EBITDA
Research $618,636 $429 $619,065 $186,660 $432,405 70%
Consulting $73,707 $0 $73,707 $55,492 $18,215 25%
Events $35,119 $1,106 $36,225 $23,392 $12,833 35%
Talent Assessment &
Other $76,441 $0 $76,441 $31,449 $44,992 59%
TOTAL $803,903 $1,535 $805,438 $296,993 $508,445 63% $150,676

21 CONFIDENTIAL AND PROPRIETARY I © 2017 Gartner, Inc. and/or its affiliates. All rights reserved.
Definitions
Adjusted Revenue: Represents GAAP revenue plus non-cash fair value adjustments on pre-acquisition deferred revenues. The majority
of the pre-acquisition deferred revenue is recognized ratably over the remaining period of the underlying revenue contract.
Adjusted EBITDA: Represents GAAP operating (loss) income excluding stock-based compensation expense; depreciation,
amortization, and accretion on obligations related to excess facilities; amortization of pre-acquisition deferred revenues; acquisition and
integration charges; and other non-recurring items.
Adjusted Net Income: Represents GAAP net (loss) income adjusted for the impact of certain items directly related to acquisitions and
other non-recurring items. These adjustments include the amortization of identifiable intangibles from acquisitions; incremental and
directly-related acquisition and integration charges related to the achievement of certain performance targets and employment
conditions, as well as legal, consulting, severance, and other costs; fair value adjustments on pre-acquisition deferred revenues; and
other non-recurring items.
Adjusted EPS: Represents Adjusted Net Income divided by the number of Non-GAAP diluted shares.
Free Cash Flow: Represents cash provided by operating activities determined in accordance with GAAP plus cash acquisition and
integration payments less payments for capital expenditures.
Adjusted Gross Contribution: Adjusted Revenue less Direct Expenses.
Adjusted Gross Margin: Adjusted Gross Contribution divided by Adjusted Revenue.

22 CONFIDENTIAL AND PROPRIETARY I © 2017 Gartner, Inc. and/or its affiliates. All rights reserved.
