Attached files
| file | filename |
|---|---|
| EX-32.2 - EX-32.2 - NovoCure Ltd | nvcr-ex322_7.htm |
| EX-32.1 - EX-32.1 - NovoCure Ltd | nvcr-ex321_8.htm |
| EX-31.2 - EX-31.2 - NovoCure Ltd | nvcr-ex312_9.htm |
| EX-31.1 - EX-31.1 - NovoCure Ltd | nvcr-ex311_6.htm |
UNITED STATES
SECURITIES AND EXCHANGE COMMISSION
(Mark One)
|
☒ |
QUARTERLY REPORT PURSUANT TO SECTION 13 OR 15(d) OF THE SECURITIES EXCHANGE ACT OF 1934 |
For the quarterly period ended September 30, 2017
or
|
☐ |
TRANSITION REPORT PURSUANT TO SECTION 13 OR 15(d) OF THE SECURITIES EXCHANGE ACT OF 1934 |
For the transition period from to
Commission File Number 001-37565
(Exact Name of Registrant as Specified in Its Charter)
|
Jersey |
|
98-1057807 |
|
(State or Other Jurisdiction of |
|
(I.R.S. Employer |
|
Incorporation or Organization) |
|
Identification No.) |
Le Masurier House
La Rue Le Masurier
St. Helier, Jersey JE2 4YE
(Address of principal executive offices)
+44 (0) 15 3475 6700
(Registrant’s Telephone Number, Including Area Code)
(Former Name, Former Address and Former Fiscal Year, If Changed Since Last Report)
Indicate by check mark whether the registrant (1) has filed all reports required to be filed by Section 13 or 15(d) of the Securities Exchange Act of 1934 during the preceding 12 months (or for such shorter period that the registrant was required to file such reports) and (2) has been subject to such filing requirements for the past 90 days. Yes ☒ No ☐.
Indicate by check mark whether the registrant has submitted electronically and posted on its corporate Web site, if any, every Interactive Data File required to be submitted and posted pursuant to Rule 405 of Regulation S-T (§232.405 of this chapter) during the preceding 12 months (or for such shorter period that the registrant was required to submit and post such files). Yes ☒ No ☐.
Indicate by check mark whether the registrant is a large accelerated filer, an accelerated filer, a non-accelerated filer, a smaller reporting company or an emerging growth company. See definitions of “large accelerated filer,” “accelerated filer,” “smaller reporting company” and “emerging growth company” in Rule 12b-2 of the Exchange Act. (Check one):
|
Large accelerated filer |
|
☐ |
|
Accelerated filer |
|
☒ |
|
|
|
|
|
|||
|
Non-accelerated filer |
|
☐ (Do not check if a smaller reporting company) |
|
Smaller reporting company |
|
☐ |
|
|
|
|
|
|
|
|
|
|
|
|
|
Emerging growth company |
|
☒ |
If an emerging growth company, indicate by check mark if the registrant has elected not to use the extended transition period for complying with any new or revised financial accounting standards provided pursuant to Section 13(a) of the Exchange Act. ☒
Indicate by check mark whether the registrant is a shell company (as defined in Rule 12b-2 of the Exchange Act). Yes ☐ No ☒.
Indicate the number of shares outstanding of each of the registrant’s classes of common stock, as of the latest practicable date.
|
Class |
|
Outstanding as of October 19, 2017 |
|
Ordinary shares, no par value |
|
89,363,835 Shares |
CAUTIONARY NOTE REGARDING FORWARD-LOOKING STATEMENTS
In addition to historical facts or statements of current condition, this report contains forward-looking statements within the meaning of Section 27A of the Securities Act of 1933, as amended, and Section 21E of the Securities Exchange Act of 1934, as amended. Forward-looking statements contained in this report are based on our current plans, expectations, hopes, beliefs, intentions or strategies concerning future developments and their impact on us. Forward-looking statements contained in this report constitute our expectations or forecasts of future events as of the date this report was filed with the Securities and Exchange Commission and are not statements of historical fact. You can identify these statements by the fact that they do not relate strictly to historical or current facts. Such statements may include words such as “anticipate,” “will,” “estimate,” “expect,” “project,” “intend,” “should,” “plan,” “believe,” “hope,” and other words and terms of similar meaning in connection with any discussion of, among other things, future operating or financial performance, strategic initiatives and business strategies, regulatory or competitive environments, our intellectual property and delivery system research and development. In particular, these forward-looking statements include, among others, statements about:
|
|
• |
our research and development, clinical trial and commercialization activities and projected expenditures; |
|
|
• |
the further commercialization of Optune®, our first Tumor Treating Fields (“TTFields”) delivery system, and our other TTFields delivery system candidates; |
|
|
• |
our business strategies and the expansion of our sales and marketing efforts in the United States and in other countries; |
|
|
• |
the market acceptance of Optune and our other TTFields delivery systems by patients, physicians, third-party payers and others in the healthcare and scientific community; |
|
|
• |
our plans to pursue the use of TTFields for the treatment of other solid tumor cancers; |
|
|
• |
our estimates regarding revenues, expenses, capital requirements and needs for additional financing; |
|
|
• |
our ability to obtain regulatory approvals for additional indications and any future TTFields delivery systems; |
|
|
• |
our ability to acquire the supplies needed to manufacture our TTFields delivery systems from third-party suppliers; |
|
|
• |
our ability to manufacture adequate supply; |
|
|
• |
our ability to secure adequate coverage from third-party payers to reimburse us for Optune or future TTFields delivery systems; |
|
|
• |
our ability to maintain and develop our intellectual property position; |
|
|
• |
our cash needs; |
|
|
• |
our ongoing legal proceedings and tax audits; and |
|
|
• |
our prospects, financial condition and results of operations. |
These forward-looking statements involve a number of risks and uncertainties (some of which are beyond our control) or other assumptions that may cause actual results or performance to be materially different from those expressed or implied by these forward-looking statements. Should one or more of these risks or uncertainties materialize, or should any of our assumptions prove incorrect, actual results may vary in material respects from those projected in these forward-looking statements. Factors which may cause such differences to occur include those risks and uncertainties set forth under Part I, Item 1A., “Risk Factors” of our Annual Report on Form 10-K for the fiscal year ended December 31, 2016, as well as other risks and uncertainties set forth from time to time in the reports we file with the U.S. Securities and Exchange Commission. We do not intend to update publicly any forward-looking statement, whether as a result of new information, future events or otherwise, except as required by law.
This Quarterly Report on Form 10-Q includes trademarks of NovoCure Limited and other persons. All trademarks or trade names referred to herein are the property of their respective owners.
ii
Quarterly Report on Form 10-Q
|
|
|
|
|
Page |
||
|
|
ii |
|||||
|
|
ii |
|||||
|
|
||||||
|
|
||||||
|
Item 1. |
|
|
2 |
|||
|
Item 2. |
|
Management’s Discussion and Analysis of Financial Condition and Results of Operations |
|
12 |
||
|
Item 3. |
|
|
20 |
|||
|
Item 4. |
|
|
20 |
|||
|
|
||||||
|
|
||||||
|
Item 1. |
|
|
21 |
|||
|
Item 1A. |
|
|
21 |
|||
|
Item 2. |
|
|
21 |
|||
|
Item 3. |
|
|
21 |
|||
|
Item 4. |
|
|
21 |
|||
|
Item 5. |
|
|
21 |
|||
|
Item 6. |
|
|
22 |
|||
|
|
||||||
|
|
|
|
23 |
|||
- 1 -
NOVOCURE LIMITED AND SUBSIDIARIES
U.S. dollars in thousands
|
|
|
September 30, |
|
|
December 31, |
|
||
|
|
|
2017 |
|
|
2016 |
|
||
|
|
|
Unaudited |
|
|
Audited |
|
||
|
ASSETS |
|
|
|
|
|
|
|
|
|
|
|
|
|
|
|
|
|
|
|
CURRENT ASSETS: |
|
|
|
|
|
|
|
|
|
Cash and cash equivalents |
|
$ |
82,104 |
|
|
$ |
99,780 |
|
|
Short-term investments |
|
|
104,453 |
|
|
|
119,854 |
|
|
Restricted cash |
|
|
2,129 |
|
|
|
267 |
|
|
Trade receivables |
|
|
23,000 |
|
|
|
6,339 |
|
|
Receivables and prepaid expenses |
|
|
5,559 |
|
|
|
10,084 |
|
|
Inventories |
|
|
24,642 |
|
|
|
25,549 |
|
|
Total current assets |
|
|
241,887 |
|
|
|
261,873 |
|
|
|
|
|
|
|
|
|
|
|
|
LONG-TERM ASSETS: |
|
|
|
|
|
|
|
|
|
Property and equipment, net |
|
|
9,361 |
|
|
|
9,812 |
|
|
Field equipment, net |
|
|
8,948 |
|
|
|
8,808 |
|
|
Severance pay fund |
|
|
104 |
|
|
|
88 |
|
|
Other long-term assets |
|
|
1,978 |
|
|
|
1,500 |
|
|
Total long-term assets |
|
|
20,391 |
|
|
|
20,208 |
|
|
|
|
|
|
|
|
|
|
|
|
TOTAL ASSETS |
|
$ |
262,278 |
|
|
$ |
282,081 |
|
The accompanying notes are an integral part of these unaudited consolidated financial statements.
- 2 -
NOVOCURE LIMITED AND SUBSIDIARIES
CONSOLIDATED BALANCE SHEETS
U.S. dollars in thousands (except share data)
|
|
|
September 30, |
|
|
December 31, |
|
||
|
|
|
2017 |
|
|
2016 |
|
||
|
|
|
Unaudited |
|
|
Audited |
|
||
|
LIABILITIES AND SHAREHOLDERS' EQUITY |
|
|
|
|
|
|
|
|
|
|
|
|
|
|
|
|
|
|
|
CURRENT LIABILITIES: |
|
|
|
|
|
|
|
|
|
Trade payables |
|
$ |
14,143 |
|
|
$ |
18,356 |
|
|
Other payables and accrued expenses |
|
|
26,842 |
|
|
|
18,526 |
|
|
Total current liabilities |
|
|
40,985 |
|
|
|
36,882 |
|
|
|
|
|
|
|
|
|
|
|
|
LONG-TERM LIABILITIES: |
|
|
|
|
|
|
|
|
|
Long-term loan, net of discount and issuance costs |
|
|
97,049 |
|
|
|
96,231 |
|
|
Employee benefit liabilities |
|
|
2,489 |
|
|
|
2,590 |
|
|
Other long-term liabilities |
|
|
5,070 |
|
|
|
4,033 |
|
|
Total long-term liabilities |
|
|
104,608 |
|
|
|
102,854 |
|
|
|
|
|
|
|
|
|
|
|
|
TOTAL LIABILITIES |
|
|
145,593 |
|
|
|
139,736 |
|
|
|
|
|
|
|
|
|
|
|
|
COMMITMENTS AND CONTINGENCIES |
|
|
|
|
|
|
|
|
|
|
|
|
|
|
|
|
|
|
|
SHAREHOLDERS' EQUITY: |
|
|
|
|
|
|
|
|
|
Share capital - |
|
|
- |
|
|
|
- |
|
|
Ordinary shares no par value, unlimited shares authorized; issued and outstanding: 89,355,679 shares and 87,066,446 shares at September 30, 2017 (unaudited) and December 31, 2016, respectively |
|
|
|
|
|
|
|
|
|
Additional paid-in capital |
|
|
689,460 |
|
|
|
664,154 |
|
|
Accumulated other comprehensive loss |
|
|
(1,462 |
) |
|
|
(1,883 |
) |
|
Accumulated deficit |
|
|
(571,313 |
) |
|
|
(519,926 |
) |
|
Total shareholders' equity |
|
|
116,685 |
|
|
|
142,345 |
|
|
|
|
|
|
|
|
|
|
|
|
TOTAL LIABILITIES AND SHAREHOLDERS' EQUITY |
|
$ |
262,278 |
|
|
$ |
282,081 |
|
The accompanying notes are an integral part of these unaudited consolidated financial statements.
- 3 -
NOVOCURE LIMITED AND SUBSIDIARIES
CONSOLIDATED STATEMENTS OF OPERATIONS
U.S. dollars in thousands (except share and per share data)
|
|
|
Three months ended September 30, |
|
|
Nine months ended September 30, |
|
|
Year ended December 31, |
|
|||||||||||
|
|
|
2017 |
|
|
2016 |
|
|
2017 |
|
|
2016 |
|
|
2016 |
|
|||||
|
|
|
Unaudited |
|
|
Unaudited |
|
|
Audited |
|
|||||||||||
|
Net revenues |
|
$ |
50,109 |
|
|
$ |
21,674 |
|
|
$ |
123,365 |
|
|
$ |
52,646 |
|
|
$ |
82,888 |
|
|
Cost of revenues |
|
|
15,153 |
|
|
|
11,118 |
|
|
|
39,969 |
|
|
|
28,897 |
|
|
|
39,870 |
|
|
Impairment of field equipment |
|
|
- |
|
|
|
- |
|
|
|
- |
|
|
|
6,412 |
|
|
|
6,412 |
|
|
|
|
|
|
|
|
|
|
|
|
|
|
|
|
|
|
|
|
|
|
|
|
Gross profit |
|
|
34,956 |
|
|
|
10,556 |
|
|
|
83,396 |
|
|
|
17,337 |
|
|
|
36,606 |
|
|
|
|
|
|
|
|
|
|
|
|
|
|
|
|
|
|
|
|
|
|
|
|
Operating costs and expenses: |
|
|
|
|
|
|
|
|
|
|
|
|
|
|
|
|
|
|
|
|
|
Research, development and clinical trials |
|
|
9,273 |
|
|
|
10,233 |
|
|
|
28,055 |
|
|
|
32,996 |
|
|
|
41,467 |
|
|
Sales and marketing |
|
|
16,387 |
|
|
|
15,865 |
|
|
|
47,503 |
|
|
|
43,771 |
|
|
|
59,449 |
|
|
General and administrative |
|
|
15,215 |
|
|
|
12,723 |
|
|
|
42,660 |
|
|
|
38,010 |
|
|
|
51,007 |
|
|
|
|
|
|
|
|
|
|
|
|
|
|
|
|
|
|
|
|
|
|
|
|
Total operating costs and expenses |
|
|
40,875 |
|
|
|
38,821 |
|
|
|
118,218 |
|
|
|
114,777 |
|
|
|
151,923 |
|
|
|
|
|
|
|
|
|
|
|
|
|
|
|
|
|
|
|
|
|
|
|
|
Operating loss |
|
|
(5,919 |
) |
|
|
(28,265 |
) |
|
|
(34,822 |
) |
|
|
(97,440 |
) |
|
|
(115,317 |
) |
|
Financial expenses, net |
|
|
2,156 |
|
|
|
2,189 |
|
|
|
6,785 |
|
|
|
3,293 |
|
|
|
6,147 |
|
|
|
|
|
|
|
|
|
|
|
|
|
|
|
|
|
|
|
|
|
|
|
|
Loss before income tax expense |
|
|
(8,075 |
) |
|
|
(30,454 |
) |
|
|
(41,607 |
) |
|
|
(100,733 |
) |
|
|
(121,464 |
) |
|
Income tax expense |
|
|
3,423 |
|
|
|
3,174 |
|
|
|
9,110 |
|
|
|
8,944 |
|
|
|
10,381 |
|
|
|
|
|
|
|
|
|
|
|
|
|
|
|
|
|
|
|
|
|
|
|
|
Net loss |
|
$ |
(11,498 |
) |
|
$ |
(33,628 |
) |
|
$ |
(50,717 |
) |
|
$ |
(109,677 |
) |
|
$ |
(131,845 |
) |
|
|
|
|
|
|
|
|
|
|
|
|
|
|
|
|
|
|
|
|
|
|
|
Basic and diluted net loss per ordinary share |
|
$ |
(0.13 |
) |
|
$ |
(0.39 |
) |
|
$ |
(0.57 |
) |
|
$ |
(1.29 |
) |
|
$ |
(1.54 |
) |
|
|
|
|
|
|
|
|
|
|
|
|
|
|
|
|
|
|
|
|
|
|
|
Weighted average number of ordinary shares used in computing basic and diluted net loss per share |
|
|
89,125,646 |
|
|
|
85,774,874 |
|
|
|
88,265,835 |
|
|
|
85,153,644 |
|
|
|
85,558,448 |
|
CONSOLIDATED STATEMENTS OF COMPREHENSIVE INCOME (LOSS)
U.S. dollars in thousands
|
|
|
Three months ended September 30, |
|
|
Nine months ended September 30, |
|
|
Year ended December 31, |
|
|||||||||||
|
|
|
2017 |
|
|
2016 |
|
|
2017 |
|
|
2016 |
|
|
2016 |
|
|||||
|
|
|
Unaudited |
|
|
Unaudited |
|
|
Audited |
|
|||||||||||
|
Net loss |
|
$ |
(11,498 |
) |
|
$ |
(33,628 |
) |
|
$ |
(50,717 |
) |
|
$ |
(109,677 |
) |
|
$ |
(131,845 |
) |
|
Other comprehensive income (loss), net of tax : |
|
|
|
|
|
|
|
|
|
|
|
|
|
|
|
|
|
|
|
|
|
Change in foreign currency translation adjustments |
|
|
(2 |
) |
|
|
8 |
|
|
|
8 |
|
|
|
64 |
|
|
|
10 |
|
|
Pension benefit plan |
|
|
279 |
|
|
|
(409 |
) |
|
|
413 |
|
|
|
(644 |
) |
|
|
(388 |
) |
|
Total comprehensive loss |
|
$ |
(11,221 |
) |
|
$ |
(34,029 |
) |
|
$ |
(50,296 |
) |
|
|
(110,257 |
) |
|
$ |
(132,223 |
) |
The accompanying notes are an integral part of these unaudited consolidated financial statements.
- 4 -
NOVOCURE LIMITED AND SUBSIDIARIES
CONSOLIDATED STATEMENTS OF CHANGES IN SHAREHOLDERS’ EQUITY
U.S. dollars in thousands (except share data)
|
|
|
Ordinary shares |
|
|
|
Additional paid-in |
|
|
Accumulated other comprehensive |
|
|
Accumulated |
|
|
Total shareholders' |
|
|||||
|
|
|
Shares |
|
|
|
capital |
|
|
loss |
|
|
deficit |
|
|
equity |
|
|||||
|
|
|
|
|
|
|
|
|
|
|
|
|
|
|
|
|
|
|
|
|
|
|
|
Balance as of December 31, 2015 (audited) |
|
|
83,778,581 |
|
|
|
$ |
640,406 |
|
|
$ |
(1,505 |
) |
|
$ |
(388,081 |
) |
|
$ |
250,820 |
|
|
Share-based compensation to employees |
|
|
- |
|
|
|
|
21,441 |
|
|
|
- |
|
|
|
- |
|
|
|
21,441 |
|
|
Exercise of options and warrants |
|
|
3,195,477 |
|
|
|
|
993 |
|
|
|
- |
|
|
|
- |
|
|
|
993 |
|
|
Issuance of shares in connection with employee stock purchase plan |
|
|
92,388 |
|
|
|
|
616 |
|
|
|
- |
|
|
|
- |
|
|
|
616 |
|
|
Tax benefit from share-based award activity |
|
|
- |
|
|
|
|
698 |
|
|
|
- |
|
|
|
- |
|
|
|
698 |
|
|
Other comprehensive loss, net of tax benefit of $38 |
|
|
- |
|
|
|
|
- |
|
|
|
(378 |
) |
|
|
- |
|
|
|
(378 |
) |
|
Net loss |
|
|
- |
|
|
|
|
- |
|
|
|
- |
|
|
|
(131,845 |
) |
|
|
(131,845 |
) |
|
Balance as of December 31, 2016 (audited) |
|
|
87,066,446 |
|
|
|
$ |
664,154 |
|
|
$ |
(1,883 |
) |
|
$ |
(519,926 |
) |
|
$ |
142,345 |
|
|
|
|
|
|
|
|
|
|
|
|
|
|
|
|
|
|
|
|
|
|
|
|
|
Share-based compensation to employees |
|
|
- |
|
|
|
|
20,760 |
|
|
|
- |
|
|
|
- |
|
|
|
20,760 |
|
|
Exercise of options and warrants |
|
|
2,172,266 |
|
|
|
|
3,095 |
|
|
|
- |
|
|
|
- |
|
|
|
3,095 |
|
|
Cumulative effect adjustment resulting from ASU 2016-09 adoption (see Note 1) |
|
|
- |
|
|
|
|
670 |
|
|
|
- |
|
|
|
(670 |
) |
|
|
- |
|
|
Issuance of shares in connection with employee stock purchase plan |
|
|
116,967 |
|
|
|
|
781 |
|
|
|
- |
|
|
|
- |
|
|
|
781 |
|
|
Other comprehensive income, net of tax benefit of $57 |
|
|
- |
|
|
|
|
- |
|
|
|
421 |
|
|
|
- |
|
|
|
421 |
|
|
Net loss |
|
|
- |
|
|
|
|
- |
|
|
|
- |
|
|
|
(50,717 |
) |
|
|
(50,717 |
) |
|
Balance as of September 30, 2017 (unaudited) |
|
|
89,355,679 |
|
|
|
$ |
689,460 |
|
|
$ |
(1,462 |
) |
|
$ |
(571,313 |
) |
|
$ |
116,685 |
|
The accompanying notes are an integral part of these unaudited consolidated financial statements.
- 5 -
NOVOCURE LIMITED AND SUBSIDIARIES
CONSOLIDATED STATEMENTS OF CASH FLOWS
U.S. dollars in thousands
|
|
|
Three months ended September 30, |
|
|
Nine months ended September 30, |
|
|
Year ended December 31, |
|
|||||||||||
|
|
|
2017 |
|
|
2016 |
|
|
2017 |
|
|
2016 |
|
|
2016 |
|
|||||
|
|
|
Unaudited |
|
|
Unaudited |
|
|
Audited |
|
|||||||||||
|
Cash flows from operating activities: |
|
|
|
|
|
|
|
|
|
|
|
|
|
|
|
|
|
|
|
|
|
Net loss |
|
$ |
(11,498 |
) |
|
$ |
(33,628 |
) |
|
$ |
(50,717 |
) |
|
$ |
(109,677 |
) |
|
$ |
(131,845 |
) |
|
Adjustments to reconcile net loss to net cash provided by (used in) operating activities: |
|
|
|
|
|
|
|
|
|
|
|
|
|
|
|
|
|
|
|
|
|
Depreciation and amortization |
|
|
2,053 |
|
|
|
1,553 |
|
|
|
5,524 |
|
|
|
4,063 |
|
|
|
5,652 |
|
|
Asset write-downs and impairment of field equipment |
|
|
72 |
|
|
|
10 |
|
|
|
206 |
|
|
|
6,440 |
|
|
|
6,446 |
|
|
Increase in accrued interest expense |
|
|
- |
|
|
|
222 |
|
|
|
- |
|
|
|
222 |
|
|
|
- |
|
|
Share-based compensation to employees |
|
|
8,629 |
|
|
|
5,626 |
|
|
|
20,760 |
|
|
|
16,719 |
|
|
|
22,139 |
|
|
Excess tax benefits from share-based award activity |
|
|
- |
|
|
|
- |
|
|
|
- |
|
|
|
- |
|
|
|
(698 |
) |
|
Increase in trade receivables |
|
|
(9,112 |
) |
|
|
- |
|
|
|
(16,661 |
) |
|
|
- |
|
|
|
(6,339 |
) |
|
Amortization of discount |
|
|
17 |
|
|
|
81 |
|
|
|
226 |
|
|
|
25 |
|
|
|
155 |
|
|
Decrease (increase) in receivables and prepaid expenses |
|
|
5,986 |
|
|
|
694 |
|
|
|
4,525 |
|
|
|
(1,514 |
) |
|
|
243 |
|
|
Decrease (increase) in inventories |
|
|
504 |
|
|
|
(2,757 |
) |
|
|
907 |
|
|
|
(10,378 |
) |
|
|
(11,955 |
) |
|
Increase in other long-term assets |
|
|
(238 |
) |
|
|
(526 |
) |
|
|
(532 |
) |
|
|
(804 |
) |
|
|
(692 |
) |
|
Increase (decrease) in trade payables |
|
|
983 |
|
|
|
(6,765 |
) |
|
|
(4,213 |
) |
|
|
(2,621 |
) |
|
|
1,601 |
|
|
Increase in other payables and accrued expenses |
|
|
4,830 |
|
|
|
1,651 |
|
|
|
8,308 |
|
|
|
2,407 |
|
|
|
6,647 |
|
|
Increase in employee benefit liabilities, net |
|
|
113 |
|
|
|
80 |
|
|
|
352 |
|
|
|
350 |
|
|
|
97 |
|
|
Increase in other long-term liabilities |
|
|
208 |
|
|
|
263 |
|
|
|
1,079 |
|
|
|
901 |
|
|
|
957 |
|
|
Net cash provided by (used in) operating activities |
|
$ |
2,547 |
|
|
$ |
(33,496 |
) |
|
$ |
(30,236 |
) |
|
$ |
(93,867 |
) |
|
$ |
(107,592 |
) |
|
|
|
|
|
|
|
|
|
|
|
|
|
|
|
|
|
|
|
|
|
|
|
Cash flows from investing activities: |
|
|
|
|
|
|
|
|
|
|
|
|
|
|
|
|
|
|
|
|
|
Purchase of property and equipment |
|
$ |
(544 |
) |
|
$ |
(1,715 |
) |
|
$ |
(1,951 |
) |
|
$ |
(5,055 |
) |
|
$ |
(5,674 |
) |
|
Purchase of field equipment |
|
|
(1,208 |
) |
|
|
(3,113 |
) |
|
|
(3,469 |
) |
|
|
(9,213 |
) |
|
|
(11,990 |
) |
|
Decrease (increase) in restricted cash |
|
|
(592 |
) |
|
|
27 |
|
|
|
(1,861 |
) |
|
|
15 |
|
|
|
(180 |
) |
|
Proceeds from maturity of short-term investments |
|
|
- |
|
|
|
120,000 |
|
|
|
120,000 |
|
|
|
270,000 |
|
|
|
270,000 |
|
|
Purchase of short-term investments |
|
|
- |
|
|
|
(119,613 |
) |
|
|
(104,006 |
) |
|
|
(239,341 |
) |
|
|
(239,341 |
) |
|
Net cash provided by (used in) investing activities |
|
$ |
(2,344 |
) |
|
$ |
(4,414 |
) |
|
$ |
8,713 |
|
|
$ |
16,406 |
|
|
$ |
12,815 |
|
|
|
|
|
|
|
|
|
|
|
|
|
|
|
|
|
|
|
|
|
|
|
|
Cash flows from financing activities: |
|
|
|
|
|
|
|
|
|
|
|
|
|
|
|
|
|
|
|
|
|
Proceeds from issuance of shares, net |
|
$ |
- |
|
|
$ |
- |
|
|
$ |
781 |
|
|
$ |
- |
|
|
$ |
616 |
|
|
Proceeds from long-term loan, net |
|
|
- |
|
|
|
72,870 |
|
|
|
19 |
|
|
|
72,887 |
|
|
|
72,887 |
|
|
Excess tax benefits from share-based award activity |
|
|
- |
|
|
|
- |
|
|
|
- |
|
|
|
- |
|
|
|
698 |
|
|
Repayment of other long-term loan |
|
|
(19 |
) |
|
|
(17 |
) |
|
|
(56 |
) |
|
|
(52 |
) |
|
|
(70 |
) |
|
Exercise of options and warrants |
|
|
1,732 |
|
|
|
- |
|
|
|
3,095 |
|
|
|
961 |
|
|
|
993 |
|
|
Net cash provided by financing activities |
|
$ |
1,713 |
|
|
$ |
72,853 |
|
|
$ |
3,839 |
|
|
$ |
73,796 |
|
|
$ |
75,124 |
|
|
|
|
|
|
|
|
|
|
|
|
|
|
|
|
|
|
|
|
|
|
|
|
Effect of exchange rate changes on cash and cash equivalents |
|
$ |
(2 |
) |
|
$ |
8 |
|
|
$ |
8 |
|
|
$ |
64 |
|
|
$ |
10 |
|
|
|
|
|
|
|
|
|
|
|
|
|
|
|
|
|
|
|
|
|
|
|
|
Increase (decrease) in cash and cash equivalents |
|
|
1,914 |
|
|
|
34,951 |
|
|
|
(17,676 |
) |
|
|
(3,601 |
) |
|
|
(19,643 |
) |
|
Cash and cash equivalents at the beginning of the period |
|
|
80,190 |
|
|
|
80,871 |
|
|
|
99,780 |
|
|
|
119,423 |
|
|
|
119,423 |
|
|
|
|
|
|
|
|
|
|
|
|
|
|
|
|
|
|
|
|
|
|
|
|
Cash and cash equivalents at the end of the period |
|
$ |
82,104 |
|
|
$ |
115,822 |
|
|
$ |
82,104 |
|
|
$ |
115,822 |
|
|
$ |
99,780 |
|
|
|
|
|
|
|
|
|
|
|
|
|
|
|
|
|
|
|
|
|
|
|
|
Supplemental cash flow activities: |
|
|
|
|
|
|
|
|
|
|
|
|
|
|
|
|
|
|
|
|
|
Cash paid during the period for: |
|
|
|
|
|
|
|
|
|
|
|
|
|
|
|
|
|
|
|
|
|
Income taxes |
|
$ |
2,335 |
|
|
$ |
4,624 |
|
|
$ |
7,237 |
|
|
$ |
7,793 |
|
|
$ |
9,447 |
|
|
Interest |
|
$ |
2,561 |
|
|
$ |
1,880 |
|
|
$ |
7,603 |
|
|
$ |
3,813 |
|
|
$ |
6,595 |
|
The accompanying notes are an integral part of these unaudited consolidated financial statements.
- 6 -
NOVOCURE LIMITED AND SUBSIDIARIES
NOTES TO UNAUDITED CONSOLIDATED FINANCIAL STATEMENTS
U.S. dollars in thousands (except share data)
NOTE 1: ORGANIZATION AND BASIS OF PRESENTATION
Organization. NovoCure Limited (including its consolidated subsidiaries, the “Company”) was incorporated in the Bailiwick of Jersey and is principally engaged in the development, manufacture and commercialization of Tumor Treating Fields (“TTFields”) for the treatment of solid tumors. The Company has regulatory approvals and clearances in certain countries for Optune, its first TTFields delivery system, to treat adult patients with glioblastoma (“GBM”).
Financial statement preparation. The accompanying consolidated financial statements include the accounts of the Company and its consolidated subsidiaries, and intercompany accounts and transactions have been eliminated. In the opinion of the Company’s management, the consolidated financial statements reflect all adjustments, which are normal and recurring in nature, necessary for fair financial statement presentation. The preparation of these consolidated financial statements in conformity with U.S. generally accepted accounting principles (“GAAP”) requires management to make estimates and assumptions that affect the amounts reported in these consolidated financial statements and accompanying notes. Actual results could differ materially from those estimates. These consolidated financial statements and accompanying notes should be read in conjunction with the Company’s annual consolidated financial statements and the notes thereto included in the Company’s Annual Report on Form 10-K for the fiscal year ended December 31, 2016 (the “2016 10-K”) filed with the Securities and Exchange Commission (the “SEC”) on February 23, 2017.
The significant accounting policies applied in the audited annual consolidated financial statements of the Company as disclosed in the 2016 10-K are applied consistently in these unaudited interim consolidated financial statements, except as noted below:
Recently Adopted Accounting Pronouncements. In March 2016, the Financial Accounting Standards Board (“FASB”) issued Accounting Standards Update (“ASU”) 2016-09, Compensation-Stock Compensation (Topic 718): Improvements to Employee Share-Based Payment Accounting. The amendments in ASU 2016-09 affect all entities that issue share-based payment awards to their employees and involve multiple aspects of the accounting for share-based payment transactions, including income tax consequences, classification of awards as either equity or liabilities, and classification on the statement of cash flows. ASU 2016-09 is effective for annual periods beginning after December 15, 2016, and interim periods within those annual periods. The Company adopted ASU 2016-09 during the quarter ended March 31, 2017, at which time it changed its accounting policy to account for forfeitures as they occur. The change was applied on a modified retrospective basis with a cumulative effect adjustment to accumulated deficit of $670 as of January 1, 2017. In addition, excess tax benefits for share-based payments are now presented as an operating activity in the statements of cash flows rather than financing activity. The changes have been applied prospectively in accordance with the ASU and prior periods have not been adjusted.
Recent Accounting Pronouncements. In May 2014, FASB issued ASU 2014-09, Revenue from Contracts with Customers (Topic 606) (ASU 2014-09), which amends the existing accounting standards for revenue recognition. In August 2015, the FASB issued ASU No. 2015-14, Revenue from Contracts with Customers (Topic 606): Deferral of the Effective Date, which delays the effective date of ASU 2014-09 by one year. The Company is currently evaluating the requirements of the new standard to insure that it has processes, systems and internal controls in place to collect the necessary information to implement the standard, which will be effective as of January 1, 2018. Currently, the Company anticipates using a portfolio approach to apply the standard to portfolios of contracts with similar characteristics and anticipates that it will apply the cumulative catch-up transition method which requires the application of the provisions of the new standard as of the date of adoption with the cumulative effect of the retrospective application of the provisions as an adjustment through retained earnings. While the Company is still in the process of completing its assessment on the impact this guidance will have on its consolidated financial statements and related disclosures, the Company does not anticipate that the adoption of this standard will have a material impact on its financial position, results of operations or cash flows.
In April 2016, FASB issued ASU 2016-10, Revenue from Contracts with Customers (Topic 606): Identifying Performance Obligations and Licensing. ASU 2016-10 covers two specific topics: performance obligations and licensing. This amendment includes guidance on immaterial promised goods or services, shipping or handling activities, separately identifiable performance obligations, functional or symbolic intellectual property licenses, sales-based and usage-based royalties, license restrictions (time, use, geographical) and licensing renewals. In addition, in May 2016, FASB issued ASU No. 2016-12, Revenue from Contracts with Customers (Topic 606): Narrow-Scope Improvements and Practical Expedients, which is intended to not change the core principle of the guidance in Topic 606, but rather affect only the narrow aspects of Topic 606 by reducing the potential for diversity in practice at initial application and by reducing the cost and complexity of applying Topic 606 both at transition and on an ongoing basis. The Company is currently evaluating the impact of the adoption of both revenue standards on its consolidated financial statements.
In February 2016, FASB issued ASU 2016-02-Leases (ASC 842), which sets out the principles for the recognition, measurement, presentation and disclosure of leases for both parties to a contract (i.e. lessees and lessors). The new standard requires lessees to apply
- 7 -
a dual approach, classifying leases as either finance or operating leases based on the principle of whether or not the lease is effectively a financed purchase by the lessee. This classification will determine whether lease expense is recognized based on an effective interest method or on a straight line basis over the term of the lease, respectively. A lessee is also required to record a right-of-use asset and a lease liability for all leases with a term of greater than twelve months regardless of their classification. Leases with a term of twelve months or less will be accounted for similar to existing guidance for operating leases. The new standard requires lessors to account for leases using an approach that is substantially equivalent to existing guidance for sales-type leases, direct financing leases and operating leases. ASC 842 supersedes the previous leases standard, ASC 840. The standard is effective on January 1, 2019, with early adoption permitted. The Company currently anticipates adopting the new standard effective January 1, 2019 and is evaluating the impact of the adoption of this standard on its consolidated financial statements.
In May 2017, FASB issued ASU 2017-09, Compensation-Stock Compensation (Topic 718) Scope of Modification Accounting. ASU 2017-09 provides clarification on when modification accounting should be used for changes to the terms or conditions of a share-based payment award. This ASU does not change the accounting for modifications but clarifies that modification accounting guidance should only be applied if there is a change to the value, vesting conditions, or award classification and would not be required if the changes are considered non-substantive. The Company is evaluating the impact of ASU 2017-09.
NOTE 2: SHORT-TERM INVESTMENTS
The Company invests in marketable U.S. Treasury Bills (“T-bills”) that are classified as held-to-maturity securities. The amortized cost and recorded basis of the T-bills are presented as short-term investments in the amount of $104,453 and $119,854 as of September 30, 2017 and December 31, 2016, respectively, and their estimated fair value as of September 30, 2017 and December 31, 2016 was $104,419 and $119,825, respectively.
NOTE 3: INVENTORIES
Inventories are stated at the lower of cost or market. The weighted average methodology is applied to determine cost. As of September 30, 2017 and December 31, 2016, the Company’s inventories were composed of:
|
|
|
September 30, |
|
|
December 31, |
|
||
|
|
|
2017 |
|
|
2016 |
|
||
|
|
|
Unaudited |
|
|
Audited |
|
||
|
Raw materials |
|
$ |
5,936 |
|
|
$ |
5,243 |
|
|
Work in progress |
|
|
10,621 |
|
|
|
8,292 |
|
|
Finished products |
|
|
8,085 |
|
|
|
12,014 |
|
|
Total |
|
$ |
24,642 |
|
|
$ |
25,549 |
|
NOTE 4: COMMITMENTS AND CONTINGENT LIABILITIES
The facilities of the Company are leased under various operating lease agreements for periods ending no later than 2024. The Company also leases motor vehicles under various operating leases, which expire on various dates, the latest of which is in 2020.
As of September 30, 2017 and December 31, 2016, the Company pledged bank deposits of $1,051 and $807, respectively, to cover bank guarantees in respect of its leases of operating facilities and obtained guarantees by the bank for the fulfillment of the Company’s lease and other contractual commitments of $1,212 and $955, respectively.
In January 2017, two putative class action lawsuits were filed against the Company, its directors and certain of its officers, as well as the underwriters in the Company’s October 2015 initial public offering. The complaints, which purport to be brought on behalf of a class of persons and/or entities who purchased or otherwise acquired ordinary shares of the Company pursuant and/or traceable to the registration statement and prospectus issued in connection with the Company’s initial public offering, allege material misstatements and/or omissions in the Company’s initial public offering materials in alleged violation of the federal securities laws and seek compensatory damages, among other remedies. The two actions have been consolidated and the plaintiffs filed a consolidated amended complaint on May 31, 2017. The court granted the defendants’ motion to bifurcate the motion to dismiss into two stages: a threshold motion to dismiss for lack of personal jurisdiction, lack of subject matter jurisdiction, and insufficient process and service of process; and, if the matter is not dismissed following that threshold motion, a subsequent merits motion to dismiss regarding whether the allegations in the amended complaint state a claim under the securities laws. The defendants filed the threshold motion to dismiss on July 31, 2017, and the plaintiffs filed an opposition to the threshold motion to dismiss on September 29, 2017. The Company believes that the amended complaint is without merit and plans to defend the consolidated lawsuits vigorously. The Company has not
- 8 -
accrued any amounts in respect of these lawsuits, as a liability is not probable and the amount of any potential liability cannot be reasonably estimated.
NOTE 5: SHARE CAPITAL
For the nine months ended September 30, 2017, warrants to purchase 1,418,711 ordinary shares with an exercise price of $3.59 per share were cashlessly exercised, resulting in the issuance of 803,138 ordinary shares. Also, warrants to purchase 6,498 ordinary shares with an exercise price of $3.59 per share were exercised for cash. For the nine months ended September 30, 2017, options to purchase 1,370,810 ordinary shares were exercised, resulting in the issuance of 1,364,645 ordinary shares.
NOTE 6: EQUITY INCENTIVE PLANS
In September 2015, the Company adopted the 2015 Omnibus Incentive Plan (the “2015 Plan”). Under the 2015 Plan, the Company can issue various types of equity compensation awards such as share options, restricted shares, performance shares, restricted stock units (“RSUs”), performance units, long-term cash awards and other share-based awards.
Options granted under the 2015 Plan generally have a four-year vesting period and expire ten years after the date of grant. Options granted under the 2015 Plan that are cancelled or forfeited before expiration become available for future grants. RSUs granted under the 2015 Plan vest in equal installments over a three-year period. As of September 30, 2017, 9,563,985 ordinary shares were available for grant under the 2015 Plan.
A summary of the status of the Company’s option plans as of September 30, 2017 and changes during the period then ended is presented below:
|
|
|
Nine months ended September 30, 2017 |
|
|||||
|
|
|
Unaudited |
|
|||||
|
|
|
Number of options |
|
|
Weighted average exercise price |
|
||
|
Outstanding at beginning of year |
|
|
11,377,354 |
|
|
$ |
9.76 |
|
|
Granted |
|
|
5,117,088 |
|
|
|
9.96 |
|
|
Exercised |
|
|
(1,370,810 |
) |
|
|
2.31 |
|
|
Forfeited and cancelled |
|
|
(310,693 |
) |
|
|
12.39 |
|
|
Outstanding as of September 30, 2017 |
|
|
14,812,939 |
|
|
|
10.46 |
|
|
|
|
|
|
|
|
|
|
|
|
Exercisable options |
|
|
6,119,710 |
|
|
|
8.17 |
|
|
|
|
|
|
|
|
|
|
|
|
Vested and expected to vest |
|
|
14,812,939 |
|
|
$ |
10.46 |
|
A summary of the status of the Company’s RSUs as of September 30, 2017 and changes during the period then ended is presented below:
|
|
|
Nine months ended September 30, 2017 |
|
|||||
|
|
|
Unaudited |
|
|||||
|
|
|
Number of RSUs |
|
|
Weighted average grant date fair value price |
|
||
|
Unvested at beginning of year |
|
|
- |
|
|
$ |
- |
|
|
Granted |
|
|
1,661,619 |
|
|
|
9.64 |
|
|
Vested |
|
|
- |
|
|
|
- |
|
|
Forfeited and cancelled |
|
|
(10,400 |
) |
|
|
7.15 |
|
|
Unvested as of September 30, 2017 |
|
|
1,651,219 |
|
|
$ |
9.66 |
|
- 9 -
In September 2015, the Company adopted an employee share purchase plan (“ESPP”) to encourage and enable eligible employees to acquire ownership of the Company’s ordinary shares purchased through accumulated payroll deductions on an after-tax basis. In the United States, the ESPP is intended to be an “employee stock purchase plan” within the meaning of Section 423 of the Internal Revenue Code and the provisions of the ESPP will be construed in a manner consistent with the requirements of such section. The Company began its offerings under the ESPP on August 1, 2016. As of September 30, 2017, 2,328,171 ordinary shares were available to be purchased by eligible employees under the ESPP and 209,355 shares had been issued under the ESPP.
The fair value of all equity-based awards was estimated using the Black-Scholes option-pricing model with the following underlying assumptions, excluding market condition awards for which fair value was estimated using the Monte Carlo option-pricing model:
|
|
|
Nine months ended September 30, |
|
|
Year ended December 31, |
|||
|
|
|
2017 |
|
2016 |
|
|
2016 |
|
|
|
|
Unaudited |
|
|
Audited |
|||
|
Stock Option Plans |
|
|
|
|
|
|
|
|
|
Expected term (years) |
|
5.5-6.25 |
|
6.25 |
|
|
6.25 |
|
|
Expected volatility |
|
56.74%-59.45% |
|
59.80%-61.65% |
|
|
58.40%-61.70% |
|
|
Risk-free interest rate |
|
1.97%-2.23% |
|
1.23%-1.88% |
|
|
1.23%-1.88% |
|
|
Dividend yield |
|
0.00% |
|
0.00% |
|
|
0.00% |
|
|
ESPP |
|
|
|
|
|
|
|
|
|
Expected term (years) |
|
0.50 |
|
|
0.42 |
|
|
0.42 |
|
Expected volatility |
|
76.37%-82.00% |
|
70.45% |
|
|
70.45% |
|
|
Risk-free interest rate |
|
0.62%-1.13% |
|
0.40% |
|
|
0.40% |
|
|
Dividend yield |
|
0.00% |
|
0.00% |
|
|
0.00% |
|
The total non-cash share-based compensation expense related to all of the Company’s equity-based awards recognized for the three and nine months ended September 30, 2017 and 2016 and the year ended December 31, 2016 was:
|
|
|
Three months ended September 30, |
|
|
Nine months ended September 30, |
|
|
Year ended December 31, |
|
|||||||||||
|
|
|
2017 |
|
|
2016 |
|
|
2017 |
|
|
2016 |
|
|
2016 |
|
|||||
|
|
|
Unaudited |
|
|
Unaudited |
|
|
Audited |
|
|||||||||||
|
Cost of revenues |
|
$ |
79 |
|
|
$ |
160 |
|
|
$ |
353 |
|
|
$ |
471 |
|
|
$ |
623 |
|
|
Research, development and clinical trials |
|
|
972 |
|
|
|
776 |
|
|
|
2,645 |
|
|
|
2,378 |
|
|
|
3,155 |
|
|
Sales and marketing |
|
|
1,874 |
|
|
|
1,249 |
|
|
|
4,264 |
|
|
|
3,888 |
|
|
|
5,111 |
|
|
General and administrative |
|
|
5,704 |
|
|
|
3,441 |
|
|
|
13,498 |
|
|
|
9,982 |
|
|
|
12,552 |
|
|
Total share-based compensation expense |
|
$ |
8,629 |
|
|
$ |
5,626 |
|
|
$ |
20,760 |
|
|
$ |
16,719 |
|
|
$ |
21,441 |
|
NOTE 7: SUPPLEMENTAL INFORMATION
The Company operates in a single reportable segment.
The following table presents long-lived assets by location:
|
|
|
September 30, |
|
|
December 31, |
|
||
|
|
|
2017 |
|
|
2016 |
|
||
|
|
|
Unaudited |
|
|
Audited |
|
||
|
United States |
|
$ |
10,942 |
|
|
$ |
11,981 |
|
|
Switzerland |
|
|
5,057 |
|
|
|
4,346 |
|
|
Israel |
|
|
1,884 |
|
|
|
1,915 |
|
|
Others |
|
426 |
|
|
|
378 |
|
|
|
Total |
|
$ |
18,309 |
|
|
$ |
18,620 |
|
- 10 -
The Company’s revenues by geographic region, based on the customer’s location, are summarized as follows:
|
|
|
Three months ended September 30, |
|
|
Nine months ended September 30, |
|
|
Year ended December 31, |
|
|||||||||||
|
|
|
2017 |
|
|
2016 |
|
|
2017 |
|
|
2016 |
|
|
2016 |
|
|||||
|
|
|
Unaudited |
|
|
Unaudited |
|
|
Audited |
|
|||||||||||
|
United States |
|
$ |
35,300 |
|
|
$ |
18,131 |
|
|
$ |
95,826 |
|
|
$ |
46,264 |
|
|
$ |
72,771 |
|
|
EMEA (*) |
|
|
14,757 |
|
|
|
3,519 |
|
|
|
27,316 |
|
|
|
6,296 |
|
|
|
10,028 |
|
|
Japan |
|
|
52 |
|
|
|
24 |
|
|
|
223 |
|
|
|
86 |
|
|
|
89 |
|
|
Total |
|
$ |
50,109 |
|
|
$ |
21,674 |
|
|
$ |
123,365 |
|
|
$ |
52,646 |
|
|
$ |
82,888 |
|
|
|
|
|
|
|
|
|
|
|
|
|
|
|
|
|
|
|
|
|
|
|
|
(*) including Germany |
|
$ |
14,664 |
|
|
$ |
1,766 |
|
|
|
26,880 |
|
|
|
2,659 |
|
|
$ |
9,799 |
|
- 11 -
Item 2. Management’s Discussion and Analysis of Financial Condition and Results of Operations
Management’s Discussion and Analysis of Financial Condition and Results of Operations (“MD&A”) is intended to provide information to assist you in better understanding and evaluating our financial condition and results of operations. We encourage you to read this MD&A in conjunction with our consolidated financial statements and the notes thereto for the period ended September 30, 2017 included in Part I, Item 1 of this Quarterly Report on Form 10-Q. This discussion contains forward-looking statements that involve risks and uncertainties. As a result of many factors, such as those set forth under Part I, Item 1A, “Risk Factors”, of our Annual Report on Form 10-K for the fiscal year ended December 31, 2016 (the “2016 10-K”), our actual results may differ materially from those anticipated in these forward-looking statements. References to the words “we,” “our,” “us,” and the “Company” in this report refer to NovoCure Limited, including its consolidated subsidiaries.
Overview
We are a commercial stage oncology company developing a profoundly different cancer treatment centered on a proprietary therapy called Tumor Treating Fields (“TTFields”), the use of electric fields tuned to specific frequencies to disrupt solid tumor cancer cell division. Our key priorities are to accelerate commercial adoption of Optune, our first commercial TTFields delivery system, for the treatment of glioblastoma (“GBM”) and to advance programs testing the efficacy and safety of TTFields in multiple solid tumor indications through our clinical pipeline.
We were founded in 2000 and operated as a development stage company through December 31, 2011. We initially received U.S. Food and Drug Administration (“FDA”) approval for Optune in 2011 for use as a monotherapy treatment for adult patients with GBM following confirmed recurrence after chemotherapy. In October 2015, we received FDA approval to market Optune for the treatment of adult patients with newly diagnosed GBM in combination with temozolomide, a chemotherapy drug. We have also received approval to market Optune in Germany, Austria, Switzerland, Israel, Japan and certain other countries. To date, we have focused on commercializing Optune in the United States, Germany, Austria, Switzerland, Israel and Japan, which we refer to collectively as our currently active markets.
In April 2017, we announced final analyses of the full 695 patient dataset with a median follow-up of 40 months from our phase 3 pivotal trial of Optune in combination with temozolomide for patients with newly diagnosed GBM. For patients treated with Optune in combination with temozolomide versus patients treated with temozolomide alone, the two-year survival rate increased from 30 percent to 43 percent and the five-year survival rate increased from five percent to 13 percent. In September 2017, we announced results from health-related quality of life analyses from this same phase 3 pivotal trial. Patients treated with Optune in combination with temozolomide were able to maintain quality of life for longer compared to patients treated with temozolomide alone. These data further support our belief that Optune plus temozolomide is an essential combination treatment for patients with newly diagnosed GBM.
We continue to work with payers to expand access to Optune for patients with newly diagnosed and recurrent GBM. As of September 30, 2017, more than 210 million Americans have available coverage for the use of Optune for newly diagnosed and/or recurrent GBM. Additionally, we have signed contracts to establish Optune as an in-network benefit for more than 178 million American lives. The percentage of our U.S. active patient population who are beneficiaries of the Medicare fee-for-service program, which has denied coverage for our claims to date, continues to range from 20 to 25 percent.
In Germany, we are able to bill healthcare payers for individual cases and each case is evaluated individually on its merits and under the payer’s specific rules for such cases. In the third quarter 2017, approximately half of German claims were approved for reimbursement. In September 2017, the German Federal Joint Committee, or G-BA, published its decision to support a clinical trial studying Optune for the treatment of newly diagnosed GBM. The proposed trial design will examine the benefit of starting Optune concurrent with radiation therapy and temozolomide prior to the initiation of maintenance temozolomide in accordance with Section 137e of the German Healthcare Provision Act. We anticipate that we will share the costs for the conduct of the clinical trial with the G-BA. The statutory health insurance funds will reimburse treatment costs, including the cost of Optune for clinical trial patients. The G-BA decision is an important first step in the process to secure national reimbursement for Optune in Germany.
In August 2017, we signed a contract with the Federation of Austrian Social Insurance Institutions to grant reimbursement for Optune. All 18 Austrian insurance funds have agreed to participate in the contract, marking our first national reimbursement decision. We are currently working to implement the contract and believe that our first payments for Austrian claims will begin in the fourth quarter 2017.
In April 2017, we submitted our applicate to the Federal Office of Public Health in Switzerland to secure a defined reimbursement rate for Optune based upon the long-term analysis of the EF-14 clinical trial data. We now believe a Swiss reimbursement decision will come no earlier than 2018. Until we secure a defined reimbursement rate, payment is not guaranteed.
- 12 -
In March 2017, we received Japanese Ministry of Health, Labour and Welfare (“MHLW”) approval for the second generation Optune. In March 2017, we filed an application to request a defined reimbursement rate for Optune based on the December 2016 regulatory approval of Optune to treat newly diagnosed GBM. We are currently in active reimbursement discussions with the MHLW and believe that a reimbursement decision will come before the end of 2017.
We have researched the biological effects of TTFields extensively. Because TTFields are delivered regionally, act only on dividing cells (a biological process known as mitosis) and are frequency-tuned to target cells of a specific size, we believe there is minimal damage to healthy cells. We believe our pre-clinical and clinical research demonstrates that TTFields’ mechanism of action affects fundamental aspects of cell division and may have broad applicability across a variety of solid tumors. We have demonstrated in pre-clinical studies that TTFields can offer additive or synergistic benefits in combination with radiation, chemotherapy and immunotherapy, which may lead to greater efficacy than radiation, chemotherapy and immunotherapy alone, without significantly increasing the side effects when used in combination with other cancer treatments.
We are currently planning or conducting clinical trials evaluating the use of TTFields in brain metastases, non-small-cell lung cancer (“NSCLC”), pancreatic cancer, ovarian cancer and mesothelioma. We anticipate expanding our clinical pipeline over time to study the safety and efficacy of TTFields for additional solid tumor indications. The table below presents the current status of our clinical pipeline and our expected next milestone for each.
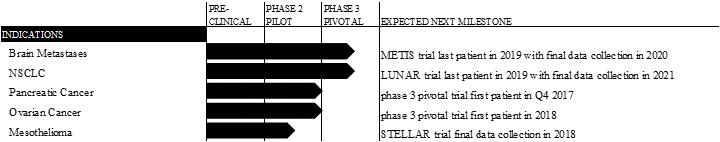
In May 2017, we received humanitarian use device (HUD) designation for the use of TTFields for the treatment of pleural mesothelioma. The HUD designation is the first step in obtaining a Humanitarian Device Exemption (HDE) for the treatment of pleural mesothelioma with TTFields. An approved HDE would allow us to market TTFields in combination with standard of care chemotherapy as a treatment for pleural mesothelioma in the United States.
In October 2016, we enrolled the first patient in our METIS trial, a phase 3 pivotal trial testing the effectiveness of stereotactic radiosurgery plus TTFields compared to stereotactic radiosurgery alone in patients with brain metastases resulting from NSCLC. In September 2017, the FDA approved an IDE supplement amending the protocol for the METIS trial. The protocol amendment is designed to accelerate the pace of enrollment by expanding the eligible patient population. Among other updates, the protocol now allows for the enrollment of patients with infratentorial brain metastases, based upon new scientific information to support a specialized array layout to treat infratentorial tumors.
We own all commercialization rights to TTFields in oncology. Our robust global patent and intellectual property portfolio consists of over 120 issued patents, with numerous additional patent applications pending worldwide. The patents have expected expiration dates between 2021 and 2035. We have also filed approximately 50 additional patent applications that, if issued, may protect aspects of our platform beyond 2035. We believe we will maintain exclusive rights to market TTFields for all solid tumor indications in our key markets through the life of our patents.
We were incorporated in the Bailiwick of Jersey in 2000. Our U.S. operations are located in Portsmouth, New Hampshire, Malvern, Pennsylvania, and New York City. Additionally, we have offices in Germany, Switzerland, Israel and Japan, and a research center in Israel. We completed our initial public offering of our ordinary shares in October 2015. Our ordinary shares are quoted on the NASDAQ Global Select Market under the symbol “NVCR.”
Financial Overview. We expect to continue to incur significant expenses and operating losses for at least the next several years. We expect our research, development and clinical trials expenses to increase in connection with our ongoing activities, and as additional indications enter late-stage clinical development. In addition, we expect to incur significant commercialization expenses for product sales, marketing, manufacturing and distribution. We may need additional funding to support the continuation of our operating activities. Until we can generate substantial revenues (which may not occur), we expect to finance our cash needs through our existing cash, cash equivalents, short-term investments, equity issuances or additional debt, and possibly also from collaborations, strategic alliances, licensing arrangements and other marketing and distribution arrangements. We will need to generate significant revenues to achieve profitability, and we may never do so.
- 13 -
Critical accounting policies and estimates
In accordance with U.S. GAAP, in preparing our financial statements, we must make estimates and assumptions that affect the reported amounts of assets and liabilities, the disclosure of contingent assets and liabilities as of the date of the financial statements and the reported amounts of net revenues and expenses during the reporting period. We develop and periodically change these estimates and assumptions based on historical experience and on various other factors that we believe are reasonable under the circumstances. Actual results may differ from these estimates.
The critical accounting policies requiring estimates, assumptions and judgments that we believe have the most significant impact on our consolidated financial statements can be found in our 2016 10-K. There have been no material changes to our critical accounting policies and estimates as compared to the critical accounting policies and estimates described in our 2016 10-K.
Results of Operations
We account for revenue when all revenue recognition criteria have been met or when cash is collected. Revenue recognized in a given period may include a mixture of accrued revenue, cash collections from amounts billed in prior periods and cash collections from amounts billed in the current period. We report certain operating statistics to provide additional insight into the commercial performance of Optune in our currently active markets.
The number of active patients on Optune is our principal revenue driver. Growth in the number of active patients is a factor of both treatment duration and new patient starts. Median treatment duration differs based upon the clinical diagnosis of the patient. For the three months ended September 30, 2017, more than 60% of prescriptions received were for patients with newly diagnosed GBM. The conversion of prescriptions to new patients is driven by the prescription fill rate and the time to fill. In the twelve months ended September 30, 2017, our prescription fill rate was between 70-75%.
The following table includes certain commercial operating statistics for and as of the end of the periods presented.
|
|
|
|
|
|
|
|
|
|
|
September 30, |
|
|||||
|
Operating statistics |
|
|
|
|
|
|
|
|
|
2017 |
|
|
2016 |
|
||
|
Active patients at period end (1) |
|
|
|
|
|
|
|
|
|
|
|
|
|
|
|
|
|
United States |
|
|
|
|
|
|
|
|
|
|
1,234 |
|
|
|
783 |
|
|
EMEA (2) (*) |
|
|
|
|
|
|
|
|
|
|
448 |
|
|
|
202 |
|
|
Japan (2) |
|
|
|
|
|
|
|
|
|
|
1 |
|
|
|
- |
|
|
|
|
|
|
|
|
|
|
|
|
|
1,683 |
|
|
|
985 |
|
|
|
|
|
|
|
|
|
|
|
|
|
|
|
|
|
|
|
|
(*) including Germany |
|
|
|
|
|
|
|
|
|
|
331 |
|
|
|
146 |
|
|
|
|
|
|
|
|
|
|
|
|
|
|
|
|
|
|
|
|
|
|
Three months ended September 30, |
|
|
Nine months ended September 30, |
|
||||||||||
|
|
|
2017 |
|
|
2016 |
|
|
2017 |
|
|
2016 |
|
||||
|
Prescriptions received in period (3) |
|
|
|
|
|
|
|
|
|
|
|
|
|
|
|
|
|
United States |
|
|
805 |
|
|
|
569 |
|
|
|
2,293 |
|
|
|
1,800 |
|
|
EMEA (2) (*) |
|
|
270 |
|
|
|
120 |
|
|
|
731 |
|
|
|
301 |
|
|
Japan (2) |
|
|
1 |
|
|
|
1 |
|
|
|
5 |
|
|
|
1 |
|
|
|
|
|
1,076 |
|
|
|
690 |
|
|
|
3,029 |
|
|
|
2,102 |
|
|
|
|
|
|
|
|
|
|
|
|
|
|
|
|
|
|
|
|
(*) including Germany |
|
|
202 |
|
|
|
87 |
|
|
|
553 |
|
|
|
221 |
|
|
(1) |
An “active patient” is a patient who is on Optune under a commercial prescription order as of the measurement date, including patients who may be on a temporary break from treatment and who plan to resume treatment in less than 60 days. |
|
(2) |
As we enter each new market, our commercial activities focus initially on establishing the required in-market infrastructure, certifying physicians to prescribe Optune and obtaining a defined reimbursement pathway. Once established, our commercial efforts turn to increasing adoption. |
|
(3) |
A “prescription received” is a commercial order for Optune that is received from a physician certified to treat patients with Optune for a patient not previously on Optune. Orders to renew or extend treatment are not included in this total. |
- 14 -
Net revenues. Substantially all of our revenues are derived from patients using our TTFields delivery system, marketed as Optune in our currently active markets. We charge patients or their third-party healthcare payers directly on a monthly basis and bear the financial risk of securing payment in the United States and Europe.
The following is a summary of gross billings and revenues recorded on an accrual basis and a cash basis by quarters (unaudited):
|
|
|
2017 |
|
|
2016 |
|
||||||||||||||||||||||
|
U.S. dollars in millions |
|
Q3 |
|
|
Q2 |
|
|
Q1 |
|
|
Q4 |
|
|
Q3 |
|
|
Q2 |
|
|
Q1 |
|
|||||||
|
Gross billings |
|
$ |
101.9 |
|
|
$ |
87.2 |
|
|
$ |
73.2 |
|
|
$ |
63.8 |
|
|
$ |
57.5 |
|
|
$ |
54.0 |
|
|
$ |
45.5 |
|
|
|
|
|
|
|
|
|
|
|
|
|
|
|
|
|
|
|
|
|
|
|
|
|
|
|
|
|
|
|
|
Accrual basis revenue |
|
$ |
35.7 |
|
|
$ |
19.1 |
|
|
$ |
14.7 |
|
|
$ |
8.5 |
|
|
$ |
0.0 |
|
|
$ |
0.0 |
|
|
$ |
0.0 |
|
|
Cash basis revenue for therapy provided in the period |
|
|
3.1 |
|
|
|
5.7 |
|
|
|
5.9 |
|
|
|
6.3 |
|
|
|
8.9 |
|
|
|
7.6 |
|
|
|
5.6 |
|
|
Cash basis revenue for therapy provided in previous periods |
|
|
11.3 |
|
|
|
13.6 |
|
|
|
14.3 |
|
|
|
15.5 |
|
|
|
12.7 |
|
|
|
10.3 |
|
|
|
7.4 |
|
|
Net revenues |
|
$ |
50.1 |
|
|
$ |
38.4 |
|
|
$ |
34.9 |
|
|
$ |
30.2 |
|
|
$ |
21.7 |
|
|
$ |
17.9 |
|
|
$ |
13.1 |
|
We began recognizing a portion of our net revenues on an accrual basis in the fourth quarter 2016. Prior to the third quarter 2017, all of the net revenues recognized on an accrual basis represent charges to certain U.S.-based third-party payers. Beginning in the third quarter 2017, net revenues recognized on an accrual basis represent charges to certain U.S.-based third-party payers and certain German payers. In the period of transition from cash-based to accrual-based revenue recognition, there is a one-time impact to net revenues as net revenues in the current period may also include revenues from gross billings from previous periods. In the table above, gross billings reflect the total charges for active patients on Optune without any deductions or adjustments for payer discounts, patient financial assistance, charitable care or other similar items. The subsequent table line items detail the three sources of net revenue in the applicable reporting period.
Cost of revenues. Our cost of revenues is comprised primarily of (i) cost of the disposable transducer arrays purchased from third-party manufacturers, (ii) depreciation expense for field equipment, including the electric field generator used by patients and (iii) personnel, warranty and overhead costs such as facilities, freight and depreciation of property, plant and equipment associated with managing our inventory, warehousing and order fulfillment functions.
Operating Expenses. Our operating expenses consist of research, development and clinical trials, sales and marketing and general and administrative expenses. Personnel costs are a significant component for each category of operating expenses and consist of wages, benefits and bonuses. Personnel costs also include share-based compensation.
Financial expenses, net. Financial expenses, net primarily consists of interest expense and related debt issuance costs under our Term Loan Credit Facility (as defined below), interest income from cash balances and short-term investments and gains (losses) from foreign currency transactions.
We view our operations and manage our business in one operating segment. For the three and nine months ended September 30, 2017, our net revenues were $50.1 million and $123.4 million, respectively, and our net loss was $11.5 million and $50.7 million, respectively. Our net loss for the three and nine months ended September 30, 2017 includes $8.6 million and $20.8 million, respectively, in non-cash share-based compensation expense. As of September 30, 2017, we had an accumulated deficit of $571.3 million.
Three months ended September 30, 2017 compared to three months ended September 30, 2016
(All dollar figures in tables are in thousands unless otherwise indicated)
|
|
|
Three months ended September 30, |
|
|
|
|
|
|
|
|
|
|||||
|
|
|
2017 |
|
|
2016 |
|
|
Change |
|
|
% Change |
|
||||
|
Net revenues |
|
$ |
50,109 |
|
|
$ |
21,674 |
|
|
$ |
28,435 |
|
|
|
131 |
% |
Net revenues. Net revenues increased $28.4 million, or 131%, to $50.1 million for the three months ended September 30, 2017 from $21.7 million for the three months ended September 30, 2016. This was primarily due to an increase of $17.2 million in commercial sales of Optune in the United States and an increase of $11.3 million in commercial sales of Optune in our other currently active markets, as well as the transition to accrual-based revenue recognition for a portion of our billings.
- 15 -
Cost of revenues. Our cost of revenues increased by $4.0 million, or 36%, to $15.2 million for the three months ended September 30, 2017 from $11.1 million for the three months ended September 30, 2016. The increase resulted primarily from the cost of shipping transducer arrays to a higher volume of commercial patients, as well as an increase in field equipment depreciation. Cost of revenues includes $0.1 million of non-cash share-based compensation.
Operating Expenses.
|
|
|
Three months ended September 30, |
|
|
|
|
|
|
|
|
|
|||||
|
|
|
2017 |
|
|
2016 |
|
|
Change |
|
|
% Change |
|
||||
|
Research, development and clinical trials |
|
$ |
9,273 |
|
|
$ |
10,233 |
|
|
$ |
(960 |
) |
|
|
(9 |
%) |
|
Sales and marketing |
|
|
16,387 |
|
|
|
15,865 |
|
|
|
522 |
|
|
|
3 |
% |
|
General and administrative |
|
|
15,215 |
|
|
|
12,723 |
|
|
|
2,492 |
|
|
|
20 |
% |
|
Total operating expenses |
|
$ |
40,875 |
|
|
$ |
38,821 |
|
|
$ |
2,054 |
|
|
|
5 |
% |
|
|
|
|
|
|
|
|
|
|
|
|
|
|
|
|
|
|
|
Non-cash expenses: |
|
|
|
|
|
|
|
|
|
|
|
|
|
|
|
|
|
Share-based compensation expense |
|
$ |
8,550 |
|
|
$ |
5,466 |
|
|
$ |
3,084 |
|
|
|
56 |
% |
|
Other non-cash expenses |
|
|
600 |
|
|
|
708 |
|
|
|
(108 |
) |
|
|
(15 |
%) |
|
Total non-cash expenses |
|
$ |
9,150 |
|
|
$ |
6,174 |
|
|
$ |
2,976 |
|
|
|
48 |
% |
|
|
|
|
|
|
|
|
|
|
|
|
|
|
|
|
|
|
|
Total operating expenses, net of non-cash expenses * |
|
$ |
31,725 |
|
|
$ |
32,647 |
|
|
$ |
(922 |
) |
|
|
(3 |
%) |
|
* |
This non-GAAP metric has been included because management believes that it provides for a more accurate year to year comparison of our operating expenses without the impact of non-cash items. |
Research, development and clinical trials expenses. Research, development and clinical trials expenses decreased $1.0 million, or 9%, to $9.3 million for the three months ended September 30, 2017 from $10.2 million for the three months ended September 30, 2016. The change is primarily due to a decrease in clinical trial expenses resulting from the conclusion of our EF-14 phase 3 pivotal trial in newly diagnosed GBM, a decrease in expenses related to the approval of our second generation Optune and a decrease in medical grants driven principally by timing, partially offset by an increase in clinical trial expenses for our LUNAR and METIS trials. These expenses include $1.0 million of non-cash share-based compensation.
Sales and marketing expenses. Sales and marketing expenses increased $0.5 million, or 3%, to $16.4 million for the three months ended September 30, 2017 from $15.9 million for the three months ended September 30, 2016. The change was primarily due to an increase of $1.7 million in personnel costs, including an increase of $0.7 million in non-cash share-based compensation, and an increase of $0.4 million in commercial shipping charges, reflecting our expanding commercial operations in the United States and Germany. This was partially offset by a decrease of $1.6 million in marketing expenses primarily related to advertising and professional services for the launch of our second generation Optune and the communication of our inclusion in the updated National Comprehensive Cancer Network (NCCN) Clinical Practice Guidelines in Oncology for Central Nervous System Cancer (“NCCN Guidelines”). These expenses include $1.9 million of non-cash share-based compensation.
General and administrative expenses. General and administrative expenses increased $2.5 million, or 20%, to $15.2 million for the three months ended September 30, 2017 from $12.7 million for the three months ended September 30, 2016. The change was primarily due to an increase of $2.5 million in personnel costs, including an increase of $2.3 million in share based compensation. Personnel costs included $5.7 million of non-cash share-based compensation expense, including equity awards granted to our executive chairman and expenses related to our employee share purchase plan (“ESPP”).
Financial expenses, net. Financial expenses remained consistent at $2.2 million for both the three months ended September 30, 2017 and the three months ended September 30, 2016.
|
|
|
Three months ended September 30, |
|
|
|
|
|
|
|
|
|
|||||
|
|
|
2017 |
|
|
2016 |
|
|
Change |
|
|
% Change |
|
||||
|
Income tax expenses |
|
$ |
3,423 |
|
|
$ |
3,174 |
|
|
$ |
249 |
|
|
|
8 |
% |
Income taxes. Income taxes increased $0.2 million, or 8%, to $3.4 million for the three months ended September 30, 2017 from $3.2 million for the three months ended September 30, 2016. The increase was primarily a result of a change in the mix of applicable statutory tax rates in certain non-US jurisdictions.
- 16 -
Nine months ended September 30, 2017 compared to nine months ended September 30, 2016
(All dollar figures in tables are in thousands unless otherwise indicated)
|
|
|
Nine months ended September 30, |
|
|
|
|
|
|
|
|
|
|||||
|
|
|
2017 |
|
|
2016 |
|
|
Change |
|
|
% Change |
|
||||
|
Net revenues |
|
$ |
123,365 |
|
|
$ |
52,646 |
|
|
$ |
70,719 |
|
|
|
134 |
% |
Net revenues. Net revenues increased by $70.7 million, or 134%, to $123.4 million for the nine months ended September 30, 2017 from $52.6 million for the nine months ended September 30, 2016. This was primarily due to an increase of $49.6 million in commercial sales of Optune in the United States and an increase of $21.2 million in commercial sales of Optune in our other currently active markets, as well as the transition to accrual-based revenue recognition for a portion of our billings.
Cost of revenues. Our cost of revenues (excluding the impairment of field equipment described below) increased by $11.1 million, or 38%, to $40.0 million for the nine months ended September 30, 2017 from $28.9 million for the nine months ended September 30, 2016. The increase resulted primarily from the cost of shipping transducer arrays to a higher volume of commercial patients, as well as an increase in field equipment depreciation. Cost of revenues include $0.4 million of non-cash share-based compensation.
We received FDA approval on our PMA supplement application to market our second generation Optune in the United States in July 2016. In the second quarter 2016, we recorded an impairment loss with respect to the write-off of first generation Optune field equipment (finished goods and production stage) in the amount of $6.4 million that was not recoverable and was presented in cost of revenues. We do not expect the conversion to our second generation Optune to result in an additional material impairment charge in the future.
Operating Expenses.
|
|
|
Nine months ended September 30, |
|
|
|
|
|
|
|
|
|
|||||
|
|
|
2017 |
|
|
2016 |
|
|
Change |
|
|
% Change |
|
||||
|
Research, development and clinical trials |
|
$ |
28,055 |
|
|
$ |
32,996 |
|
|
$ |
(4,941 |
) |
|
|
(15 |
%) |
|
Sales and marketing |
|
|
47,503 |
|
|
|
43,771 |
|
|
|
3,732 |
|
|
|
9 |
% |
|
General and administrative |
|
|
42,660 |
|
|
|
38,010 |
|
|
|
4,650 |
|
|
|
12 |
% |
|
Total operating expenses |
|
$ |
118,218 |
|
|
$ |
114,777 |
|
|
$ |
3,441 |
|
|
|
3 |
% |
|
|
|
|
|
|
|
|
|
|
|
|
|
|
|
|
|
|
|
Non-cash expenses: |
|
|
|
|
|
|
|
|
|
|
|
|
|
|
|
|
|
Share-based compensation expense |
|
$ |
20,407 |
|
|
$ |
16,248 |
|
|
$ |
4,159 |
|
|
|
26 |
% |
|
Other non-cash expenses |
|
|
1,749 |
|
|
|
2,023 |
|
|
|
(274 |
) |
|
|
(14 |
%) |
|
Total non-cash expenses |
|
$ |
22,156 |
|
|
$ |
18,271 |
|
|
$ |
3,885 |
|
|
|
21 |
% |
|
|
|
|
|
|
|
|
|
|
|
|
|
|
|
|
|
|
|
Total operating expenses, net of non-cash expenses |
|
$ |
96,062 |
|
|
$ |
96,506 |
|
|
$ |
(444 |
) |
|
|
(0 |
%) |
|
* |
This non-GAAP metric has been included because management believes that it provides for a more accurate year to year comparison of our operating expenses without the impact of non-cash items. |
Research, development and clinical trials expenses. Research, development and clinical trials expenses decreased $4.9 million, or 15%, to $28.1 million for the nine months ended September 30, 2017 from $33.0 million for the nine months ended September 30, 2016 . The change is primarily due to a decrease in clinical trial expenses resulting from the conclusion of our EF-14 phase 3 pivotal trial in newly diagnosed GBM, a decrease in expenses related to the approval of our second generation Optune and a decrease in medical grants driven principally by timing, partially offset by an increase in clinical trial expenses for our LUNAR and METIS trials. These expenses include $2.6 million of non-cash share-based compensation.
Sales and marketing expenses. Sales and marketing expenses increased $3.7 million, or 9%, to $47.5 million for the nine months ended September 30, 2017 from $43.8 million for the nine months ended September 30, 2016. The change was primarily due to an increase of $6.1 million in personnel costs, including $0.4 million of non-cash share-based compensation, and an increase of $1.2 million in commercial shipping charges, reflecting our expanding commercial operations in the United States and Germany. This was partially offset by a decrease of $1.6 million in marketing expenses primarily related to advertising and professional services for the launch of our second generation Optune and the communication of our inclusion in the updated NCCN Guidelines. These expenses include $4.3 million of non-cash share-based compensation.
- 17 -
General and administrative expenses. General and administrative expenses increased $4.7 million, or 12%, to $42.7 million for the nine months ended September 30, 2017 from $38.0 million for the nine months ended September 30, 2016. The change was primarily due to an increase of $5.6 million in personnel costs, including $3.5 million in share based compensation, partially offset by a decrease of $0.9 million in professional services and other expenses. Personnel costs included $13.5 million of non-cash share-based compensation expense, including equity awards granted to our executive chairman and expenses related to our ESPP.
Financial expenses, net. Financial expenses, net increased by $3.5 million, or 106%, to $6.8 million for the nine months ended September 30, 2017 from $3.3 million for the nine months ended September 30, 2016. The change was primarily due to an increase in interest expense, including amortization expense of the discount and deferred issuance costs, related to our July 2016 withdrawal of the remaining $75 million in available funds under the term loan credit facility that we, as borrower, entered into with BioPharma Secured Investments III Holdings Cayman LP, as lender, in January 2015, amended as of December 2016, February 2017 and September 2017 (collectively, the “Term Loan Credit Facility”).
|
|
|
Nine months ended September 30, |
|
|
|
|
|
|
|
|
|
|||||
|
|
|
2017 |
|
|
2016 |
|
|
Change |
|
|
% Change |
|
||||
|
Income tax expenses |
|
$ |
9,110 |
|
|
$ |
8,944 |
|
|
$ |
166 |
|
|
|
2 |
% |
Income taxes. Income taxes increased by $0.2 million to $9.1 million for the nine months ended September 30, 2017 from $8.9 million for the nine months ended September 30, 2016. The increase was primarily a result of a change in the mix of applicable statutory tax rates in certain non-US jurisdictions.
Liquidity and Capital Resources
Sources of Liquidity
Since inception, we have financed our operations primarily through the issuance and sale of equity and the proceeds from long-term loans. As of September 30, 2017, we had received a total of $715.9 million from these activities. As of September 30, 2017, we had an accumulated deficit of $571.3 million since inception.
Our net losses were $50.7 million for the nine months ended September 30, 2017 and $131.8 million for the year ended December 31, 2016. Our net losses primarily resulted from costs incurred in connection with our pre-clinical and clinical trial programs, costs incurred in our commercial launch efforts, and general and administrative costs necessary to operate as a multi-national oncology business.
As of September 30, 2017, we had $82.1 million of cash and cash equivalents and $104.5 million of short-term investments. We believe our cash and cash equivalents and short term investments as of September 30, 2017, are sufficient for our operations for at least the next twelve months, taking into consideration our existing business plan, our ability to control the timing of significant expense commitments and our upcoming milestone payment obligation discussed below.
In the first quarter of 2018, we anticipate making a milestone payment of $5.5 million (the “Milestone Payment”) to the Technion Research and Development Foundation (“Technion”) pursuant to the settlement agreement dated February 10, 2015 (the “Settlement Agreement”). Pursuant to the Settlement Agreement, we are obligated to pay the Milestone Payment to Technion in the quarter following the quarter in which we achieve $250.0 million of cumulative net sales (as defined in the Settlement Agreement) (the “Net Sales Milestone”). We anticipate achieving the Net Sales Milestone in the fourth quarter of 2017. We previously accrued for the anticipated Milestone Payment in the fourth quarter of 2016.
We also expect that our research, development and clinical trials expenses, sales and marketing expenses and general and administrative expenses will continue to increase over the next several years. As a result, we may need to raise additional capital in the future to fund our operations.
- 18 -
|
|
|
Nine months ended September 30, |
|
|||||
|
|
|
2017 |
|
|
2016 |
|
||
|
Net cash used in operating activities |
|
$ |
(30,236 |
) |
|
$ |
(93,867 |
) |
|
Net cash provided by investing activities |
|
|
8,713 |
|
|
|
16,406 |
|
|
Net cash provided by financing activities |
|
|
3,839 |
|
|
|
73,796 |
|
|
Net decrease in cash and cash equivalents |
|
|
(17,684 |
) |
|
|
(3,665 |
) |
|
Effect of exchange rates on cash and cash equivalents |
|
|
8 |
|
|
|
64 |
|
|
Changes in short-term investments |
|
|
(15,994 |
) |
|
|
(30,277 |
) |
|
Net decrease in cash, cash equivalents and short-term investments |
|
$ |
(33,670 |
) |
|
$ |
(33,878 |
) |
Operating activities
Net cash used in operating activities primarily represents our net loss for the periods presented. Adjustments to net loss for non-cash items include share-based compensation, depreciation and amortization, accrued interest and impairments. Operating cash flows are also impacted by changes in operating assets and liabilities, principally trade receivables, prepaid expenses, inventories, trade payables and accrued expenses.
Net cash used in operating activities was $30.2 million for the nine months ended September 30, 2017, as compared to $93.9 million for the nine months ended September 30, 2016, reflecting a net loss of $50.7 million and a change of $6.2 million in our net operating assets and liabilities, partially offset by non-cash charges of $26.7 million.
The change in our net operating assets and liabilities was primarily the result of an increase in other payables of $8.3 million, a decrease in other receivables of $4.5 million, an increase in other long-term liabilities and employee benefit liabilities, net of $1.4 million, and a decrease in inventories of $0.9 million offset by an increase in trade receivables of $16.7 million, a decrease in trade payables of $4.2 million, and an increase in other long-term assets of $0.5 million. Non-cash charges included $20.8 million of share-based compensation, $5.7 million of depreciation and amortization and $0.2 million in impairments.
Investing activities
Our investing activities consist primarily of capital expenditures to purchase property and equipment and field equipment, as well as investments in and redemptions of our short-term investments.
Net cash provided by investing activities was $8.7 million for the nine months ended September 30, 2017, compared to $16.4 million for the nine months ended September 30, 2016, reflecting an increase attributable to our receipt of $120.0 million from the maturity of short-term investments, partially offset by the purchase of $104.0 million of new short-term investments, purchases of $3.5 million of field equipment, purchases of $2.0 million of property and equipment, and a $1.9 million increase in restricted cash.
Financing activities
To date, our primary financing activities have been the sale of equity and the proceeds from long-term loans.
Net cash provided by financing activities was $3.8 million for the nine months ended September 30, 2017, as compared to $73.8 million for the nine months ended September 30, 2016, reflecting proceeds received from the exercise of warrants and options and our ESPP.
Our material outstanding indebtedness consists of our Term Loan Credit Facility. As of September 30, 2017, the aggregate principal balance of amounts outstanding under the Term Loan Credit Facility was $100.0 million. We may prepay the term loans, in whole, at any time, and must prepay in the event of a change of control, in each case, subject to a pay-down fee, prepayment premium and/or make-whole payment. Interest on the outstanding loan is 10% annually, payable quarterly in arrears. The pay-down fee on all principal payments to be paid on the date such payments are made is 0.75% and the pre-payment fee if we prepay outstanding loan amounts prior to the first, second or third year from the initial funding date is 3.0%, 2.0% or 1.0%, respectively.
- 19 -
All obligations under the Term Loan Credit Facility are guaranteed by certain of our current and future domestic direct and indirect subsidiaries. In addition, the obligations under the Term Loan Credit Facility are secured by a first-priority security interest in substantially all of the property and assets of, as well as the equity interests owned by, us and the other guarantors. On March 28, 2017, the Term Loan Credit Facility was amended as of February 21, 2017 to increase to $1.5 million the limit in the Company’s pledges and deposits security liability for reimbursement or indemnification obligations in respect of letters of credit or bank guarantees for the benefit of the Company’s landlords. On September 29, 2017, the Term Loan Credit Facility was amended as of September 27, 2017 to increase the limit on the Company’s cash held at any financial institution to secure one or more letters of credit issued by such financial institution in respect of leased premises to $1.5 million, to increase the limit on the aggregate balance in certain of the Company’s operating accounts to $2.5 million, and to add certain provisions enabling the Company’s use of storage facilities to facilitate distribution of products to patients.
The Term Loan Credit Facility has a minimum liquidity covenant, which is tested quarterly. In addition, we must meet certain pro forma net sales requirements. The Term Loan Credit Facility also contains other customary covenants.
Contractual Obligations and Commitments
There were no material changes in our commitments under contractual obligations during the three months ended September 30, 2017.
The total amount of unrecognized tax benefits for uncertain tax positions was $3.5 million and $2.4 million at September 30, 2017 and December 31, 2016, respectively. Payment of these obligations would result from settlements with taxing authorities. Discussions with the taxing authorities are ongoing and we cannot estimate with reasonable certainty the timing or amount of any such payments.
Off-Balance Sheet Arrangements
We did not have during the periods presented, and we do not currently have, any off-balance sheet arrangements as defined under SEC rules.
Item 3. Quantitative and Qualitative Disclosures About Market Risk
There have been no material changes from the information disclosed in our Annual Report on Form 10-K for the year ended December 31, 2016.
Item 4. Controls and Procedures
Evaluation of Disclosure Controls and Procedures
As required by Rule 13a-15(b) under the Securities Exchange Act of 1934, as amended (the “Exchange Act”), our management, under the supervision and with the participation of our Chief Executive Officer and Chief Financial Officer, has evaluated the effectiveness of the design and operation of our disclosure controls and procedures as of September 30, 2017. The term “disclosure controls and procedures,” as defined in Rules 13a-15(e) and 15d-15(e) under the Exchange Act, means controls and other procedures of a company that are designed to ensure that information required to be disclosed by a company in the reports that it files or submits under the Exchange Act is recorded, processed, summarized and reported within the time periods specified in the SEC’s rules and forms. Disclosure controls and procedures include, without limitation, controls and procedures designed to ensure that information required to be disclosed by a company in the reports that it files or submits under the Exchange Act is accumulated and communicated to the company’s management, including its principal executive and principal financial officers, as appropriate, to allow timely decisions regarding required disclosure. Management recognizes that any controls and procedures, no matter how well designed and operated, can provide only reasonable assurance of achieving their objectives and management necessarily applies its judgment in evaluating the cost-benefit relationship of possible controls and procedures. Based on the evaluation of our disclosure controls and procedures as of September 30, 2017, our Chief Executive Officer and Chief Financial Officer have concluded that, as of September 30, 2017, our disclosure controls and procedures were effective at the reasonable assurance level.
Changes in Internal Control over Financial Reporting
There has been no change in our internal control over financial reporting during the quarter ended September 30, 2017, that has materially affected, or is reasonably likely to materially affect, our internal control over financial reporting.
- 20 -
In January 2017, two putative class action lawsuits were filed against the Company, its directors and certain of its officers, as well as the underwriters in the Company’s October 2015 initial public offering. The complaints, which purport to be brought on behalf of a class of persons and/or entities who purchased or otherwise acquired ordinary shares of the Company pursuant and/or traceable to the registration statement and prospectus issued in connection with the Company’s initial public offering, allege material misstatements and/or omissions in the Company’s initial public offering materials in alleged violation of the federal securities laws and seek compensatory damages, among other remedies. The two actions have been consolidated and the plaintiffs filed a consolidated amended complaint on May 31, 2017. The court granted the defendants’ motion to bifurcate the motion to dismiss into two stages: a threshold motion to dismiss for lack of personal jurisdiction, lack of subject matter jurisdiction, and insufficient process and service of process; and, if the matter is not dismissed following that threshold motion, a subsequent merits motion to dismiss regarding whether the allegations in the amended complaint state a claim under the securities laws. The defendants filed the threshold motion to dismiss on July 31, 2017, and the plaintiffs filed an opposition to the threshold motion to dismiss on September 29, 2017. The Company believes that the amended complaint is without merit and plans to defend the consolidated lawsuits vigorously. The Company has not accrued any amounts in respect of these lawsuits, as a liability is not probable and the amount of any potential liability cannot be reasonably estimated.
There have been no material changes to our risk factors disclosed in our Annual Report on Form 10-K for the year ended December 31, 2016.
Item 2. Unregistered Sales of Equity Securities and Use of Proceeds
In July 2017, an investor in our 2007 Series E preferred shares offering exercised warrants to purchase 1,293 ordinary shares with an exercise price of $3.59 per share. We believe that this issuance was exempt from registration under the Securities Act of 1933, as amended (the “Securities Act”), in reliance on Section 4(a)(2) of the Securities Act regarding transactions not involving a public offering.
Item 3. Defaults Upon Senior Securities
None.
Item 4. Mine Safety Disclosures
Not applicable.
None.
- 21 -
EXHIBIT INDEX
|
Exhibit |
|
|
|
Incorporated by Reference |
|
Filed |
||||
|
Number |
|
Exhibit Description |
|
Form |
|
Date |
|
Number |
|
Herewith |
|
10.1 |
|
|
8-K |
|
10/5/17 |
|
10.1 |
|
|
|
|
31.1 |
|
|
|
|
|
|
|
|
X |
|
|
31.2 |
|
|
|
|
|
|
|
|
X |
|
|
32.1* |
|
|
|
|
|
|
|
|
X |
|
|
32.2* |
|
|
|
|
|
|
|
|
X |
|
|
99.1 |
|
NovoCure Limited Policy on Recoupment of Incentive Compensation |
|
8-K |
|
8/1/17 |
|
99.1 |
|
|
|
101.INS |
|
XBRL Instance Document |
|
|
|
|
|
|
|
X |
|
101.SCH |
|
XBRL Taxonomy Extension Schema Document |
|
|
|
|
|
|
|
X |
|
101.CAL |
|
XBRL Taxonomy Extension Calculation Linkbase Document |
|
|
|
|
|
|
|
X |
|
101.DEF |
|
XBRL Taxonomy Extension Definition Linkbase Document |
|
|
|
|
|
|
|
X |
|
101.LAB |
|
XBRL Taxonomy Extension Label Linkbase Document |
|
|
|
|
|
|
|
X |
|
101.PRE |
|
XBRL Extension Presentation Linkbase Document |
|
|
|
|
|
|
|
X |
|
* |
The certifications attached as Exhibits 32.1 and 32.2 that accompany this Quarterly Report on Form 10-Q are not deemed filed with the Securities and Exchange Commission and are not to be incorporated by reference into any filing of NovoCure Limited under the Securities Act of 1933, as amended, or the Securities Exchange Act of 1934, as amended, whether made before or after the date of this Form 10-Q, irrespective of any general incorporation language contained in such filing. |
- 22 -
Pursuant to the requirements of the Securities Exchange Act of 1934, the registrant has duly caused this report to be signed on its behalf by the undersigned thereunto duly authorized.
|
|
|
NovoCure Limited |
|
|
|
|
|
Date: October 26, 2017 |
|
/s/ Wilco Groenhuysen |
|
|
|
Wilco Groenhuysen |
|
|
|
Chief Financial Officer |
|
|
|
(principal financial and accounting officer and duly authorized officer) |
- 23 -