Attached files
| file | filename |
|---|---|
| EX-99.1 - EXHIBIT 99.1 - CURTISS WRIGHT CORP | a51705336ex99_1.htm |
| 8-K - CURTISS-WRIGHT CORPORATION 8-K - CURTISS WRIGHT CORP | a51705336.htm |

1 | October 26, 2017 | © 2017 Curtiss-Wright 3Q 2017 Earnings Conference Call October 26, 2017 NYSE: CW
2 | October 26, 2017 | © 2017 Curtiss-Wright Safe Harbor Statement Please note that the information provided in this presentation is accurate as of the date of the original presentation. The presentation will remain posted on this website from one to twelve months following the initial presentation, but content will not be updated to reflect new information that may become available after the original presentation posting. The presentation contains forward-looking statements including, among other things, management's estimates of future performance, revenue and earnings, our management's growth objectives and our management's ability to produce consistent operating improvements. These forward-looking statements are based on expectations as of the time the statements were made only, and are subject to a number of risks and uncertainties which could cause us to fail to achieve our then-current financial projections and other expectations. This presentation also includes certain non-GAAP financial measures with reconciliations being made available in the earnings release that is posted to our website and furnished with the SEC. We undertake no duty to update this information. More information about potential factors that could affect our business and financial results is included in our filings with the Securities and Exchange Commission, including our Annual Reports on Form 10-K and Quarterly Reports on Form 10-Q, including, among other sections, under the captions, "Risk Factors" and "Management's Discussion and Analysis of Financial Condition and Results of Operations," which is on file with the SEC and available at the SEC's website at www.sec.gov.
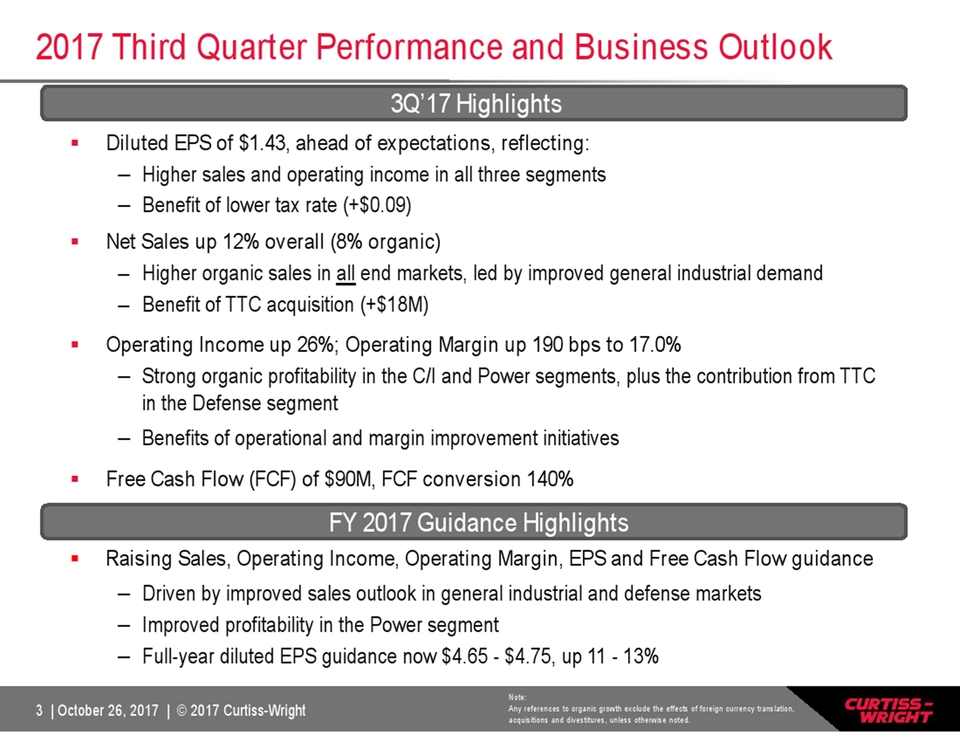
3 | October 26, 2017 | © 2017 Curtiss-Wright 2017 Third Quarter Performance and Business Outlook Diluted EPS of $1.43, ahead of expectations, reflecting: – Higher sales and operating income in all three segments – Benefit of lower tax rate (+$0.09) Net Sales up 12% overall (8% organic) – Higher organic sales in all end markets, led by improved general industrial demand – Benefit of TTC acquisition (+$18M) Operating Income up 26%; Operating Margin up 190 bps to 17.0% – Strong organic profitability in the C/I and Power segments, plus the contribution from TTC in the Defense segment – Benefits of operational and margin improvement initiatives Free Cash Flow (FCF) of $90M, FCF conversion 140% 3Q’17 Highlights FY 2017 Guidance Highlights Raising Sales, Operating Income, Operating Margin, EPS and Free Cash Flow guidance – Driven by improved sales outlook in general industrial and defense markets – Improved profitability in the Power segment – Full-year diluted EPS guidance now $4.65 - $4.75, up 11 - 13% Note: Any references to organic growth exclude the effects of foreign currency translation, acquisitions and divestitures, unless otherwise noted.
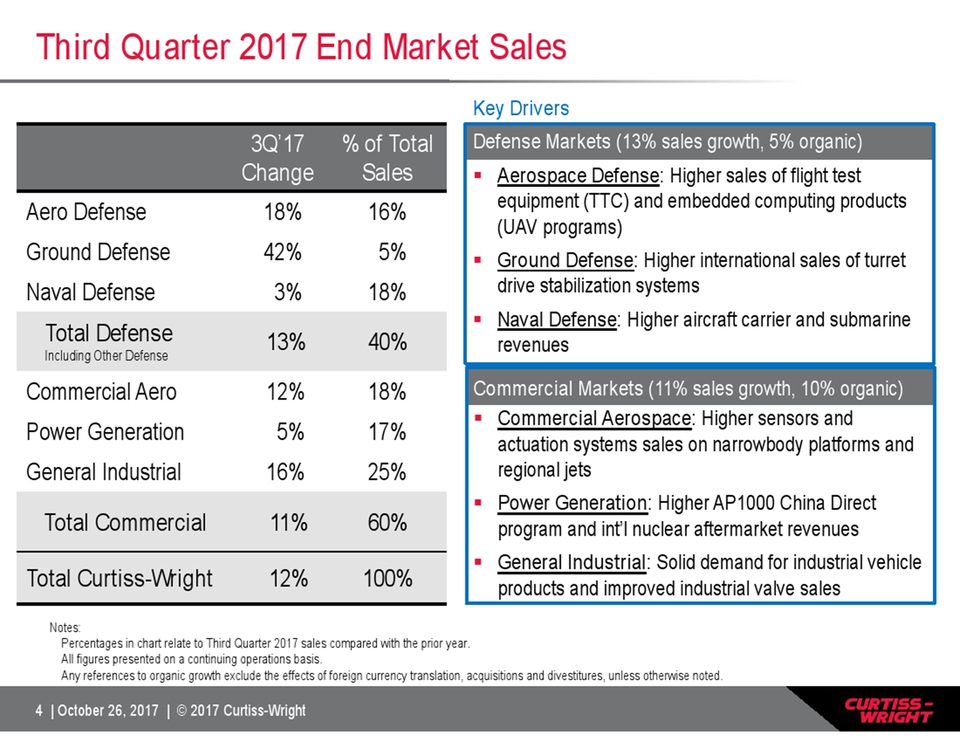
4 | October 26, 2017 | © 2017 Curtiss-Wright Key Drivers Defense Markets (13% sales growth, 5% organic) Aerospace Defense: Higher sales of flight test equipment (TTC) and embedded computing products (UAV programs) Ground Defense: Higher international sales of turret drive stabilization systems Naval Defense: Higher aircraft carrier and submarine revenues Third Quarter 2017 End Market Sales Notes: Percentages in chart relate to Third Quarter 2017 sales compared with the prior year. All figures presented on a continuing operations basis. Any references to organic growth exclude the effects of foreign currency translation, acquisitions and divestitures, unless otherwise noted. 3Q’17 Change % of Total Sales Aero Defense 18% 16% Ground Defense 42% 5% Naval Defense 3% 18% Total Defense Including Other Defense 13% 40% Commercial Aero 12% 18% Power Generation 5% 17% General Industrial 16% 25% Total Commercial 11% 60% Total Curtiss-Wright 12% 100% Commercial Markets (11% sales growth, 10% organic) Commercial Aerospace: Higher sensors and actuation systems sales on narrowbody platforms and regional jets Power Generation: Higher AP1000 China Direct program and int’l nuclear aftermarket revenues General Industrial: Solid demand for industrial vehicle products and improved industrial valve sales
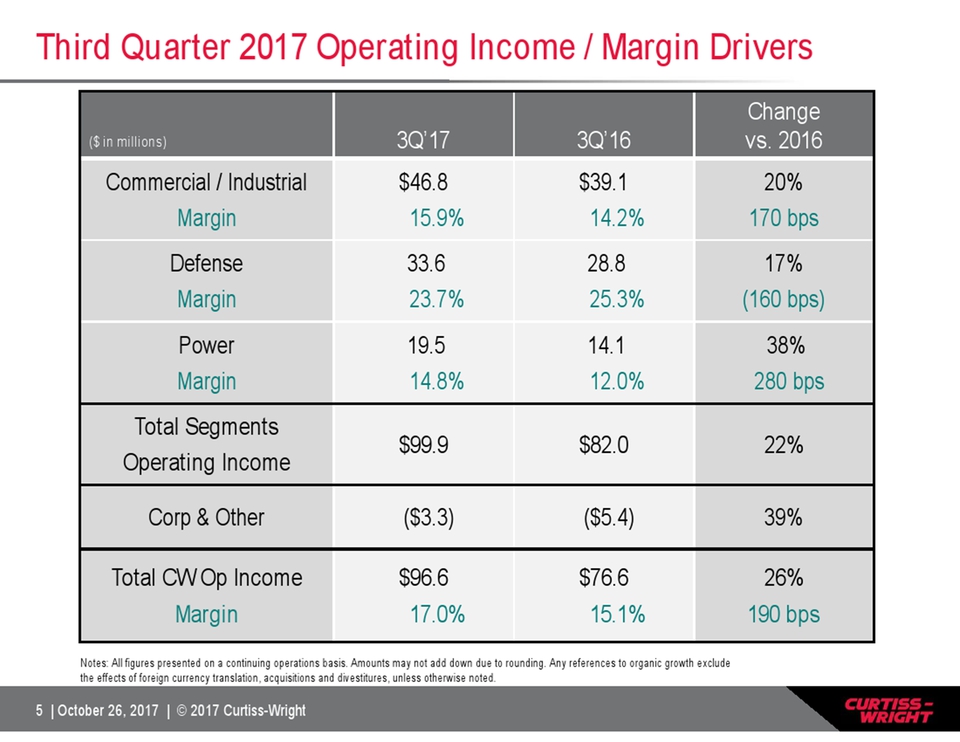
5 | October 26, 2017 | © 2017 Curtiss-Wright Third Quarter 2017 Operating Income / Margin Drivers Notes: All figures presented on a continuing operations basis. Amounts may not add down due to rounding. Any references to organic growth exclude the effects of foreign currency translation, acquisitions and divestitures, unless otherwise noted. ($ in millions) 3Q’17 3Q’16 Change vs. 2016 Commercial / Industrial Margin $46.8 15.9% $39.1 14.2% 20% 170 bps Defense Margin 33.6 23.7% 28.8 25.3% 17% (160 bps) Power Margin 19.5 14.8% 14.1 12.0% 38% 280 bps Total Segments Operating Income $99.9 $82.0 22% Corp & Other ($3.3) ($5.4) 39% Total CW Op Income Margin $96.6 17.0% $76.6 15.1% 26% 190 bps
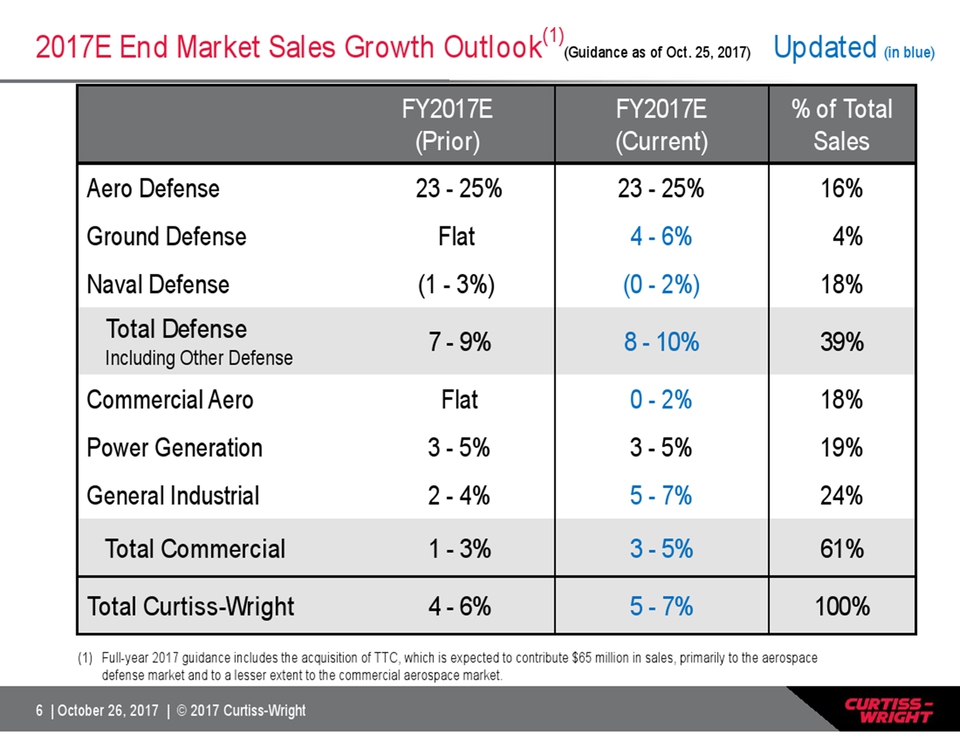
6 | October 26, 2017 | © 2017 Curtiss-Wright 2017E End Market Sales Growth Outlook(1) (Guidance as of Oct. 25, 2017) Updated (in blue) FY2017E (Prior) FY2017E (Current) % of Total Sales Aero Defense 23 - 25% 23 - 25% 16% Ground Defense Flat 4 - 6% 4% Naval Defense (1 - 3%) (0 - 2%) 18% Total Defense Including Other Defense 7 - 9% 8 - 10% 39% Commercial Aero Flat 0 - 2% 18% Power Generation 3 - 5% 3 - 5% 19% General Industrial 2 - 4% 5 - 7% 24% Total Commercial 1 - 3% 3 - 5% 61% Total Curtiss-Wright 4 - 6% 5 - 7% 100% (1) Full-year 2017 guidance includes the acquisition of TTC, which is expected to contribute $65 million in sales, primarily to the aerospace defense market and to a lesser extent to the commercial aerospace market.
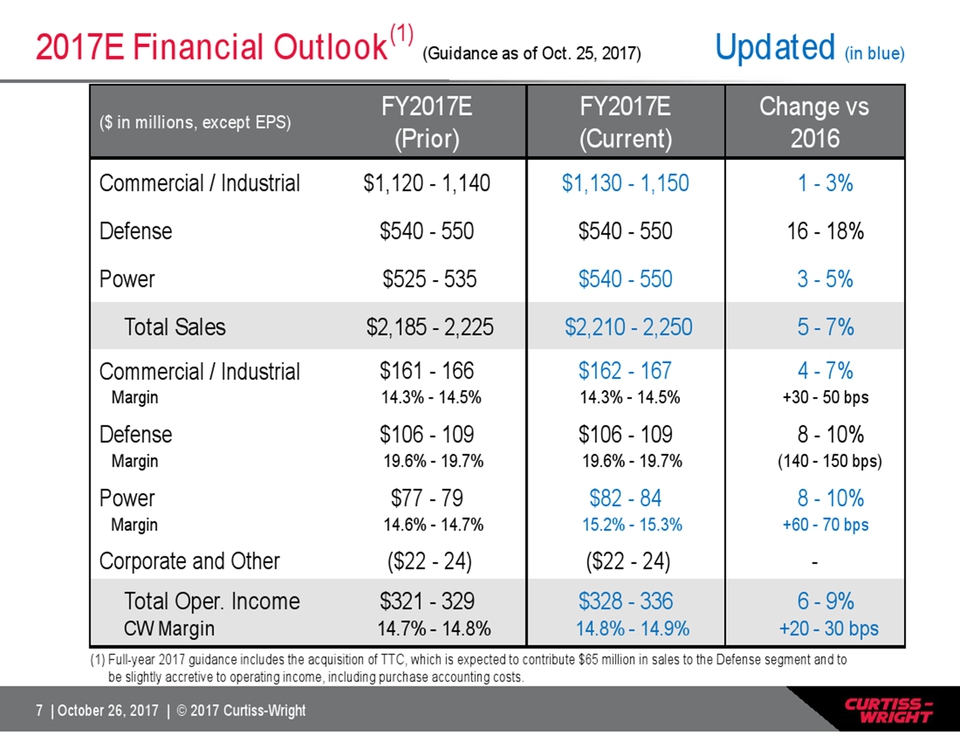
7 | October 26, 2017 | © 2017 Curtiss-Wright ($ in millions, except EPS) FY2017E (Prior) FY2017E (Current) Change vs 2016 Commercial / Industrial $1,120 - 1,140 $1,130 - 1,150 1 - 3% Defense $540 - 550 $540 - 550 16 - 18% Power $525 - 535 $540 - 550 3 - 5% Total Sales $2,185 - 2,225 $2,210 - 2,250 5 - 7% Commercial / Industrial Margin $161 – 166 14.3% - 14.5% $162 – 167 14.3% - 14.5% 4 - 7% +30 - 50 bps Defense Margin $106 – 109 19.6% - 19.7% $106 – 109 19.6% - 19.7% 8 - 10% (140 - 150 bps) Power Margin $77 – 79 14.6% - 14.7% $82 – 84 15.2% - 15.3% 8 - 10% +60 - 70 bps Corporate and Other ($22 - 24) ($22 - 24) - Total Oper. Income CW Margin $321 – 329 14.7% - 14.8% $328 – 336 14.8% - 14.9% 6 - 9% +20 - 30 bps2017E Financial Outlook(1) (Guidance as of Oct. 25, 2017) Updated (in blue) (1) Full-year 2017 guidance includes the acquisition of TTC, which is expected to contribute $65 million in sales to the Defense segment and to be slightly accretive to operating income, including purchase accounting costs.
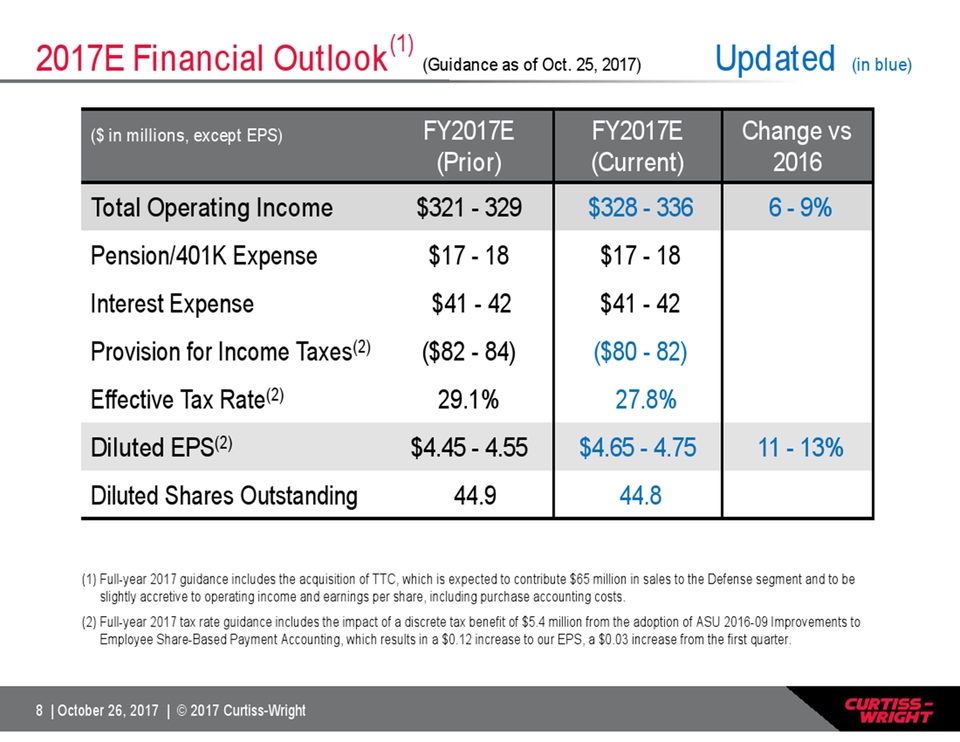
8 | October 26, 2017 | © 2017 Curtiss-Wright ($ in millions, except EPS) FY2017E (Prior) FY2017E (Current) Change vs 2016 Total Operating Income $321 - 329 $328 - 336 6 - 9% Pension/401K Expense $17 - 18 $17 – 18 Interest Expense $41 - 42 $41 – 42 Provision for Income Taxes(2) ($82 - 84) ($80 - 82) Effective Tax Rate(2) 29.1% 27.8% Diluted EPS(2) $4.45 - 4.55 $4.65 - 4.75 11 - 13% Diluted Shares Outstanding 44.9 44.8 2017E Financial Outlook(1) (Guidance as of Oct. 25, 2017) Updated (in blue) (1) Full-year 2017 guidance includes the acquisition of TTC, which is expected to contribute $65 million in sales to the Defense segment and to be slightly accretive to operating income and earnings per share, including purchase accounting costs. (2) Full-year 2017 tax rate guidance includes the impact of a discrete tax benefit of $5.4 million from the adoption of ASU 2016-09 Improvements to Employee Share-Based Payment Accounting, which results in a $0.12 increase to our EPS, a $0.03 increase from the first quarter.
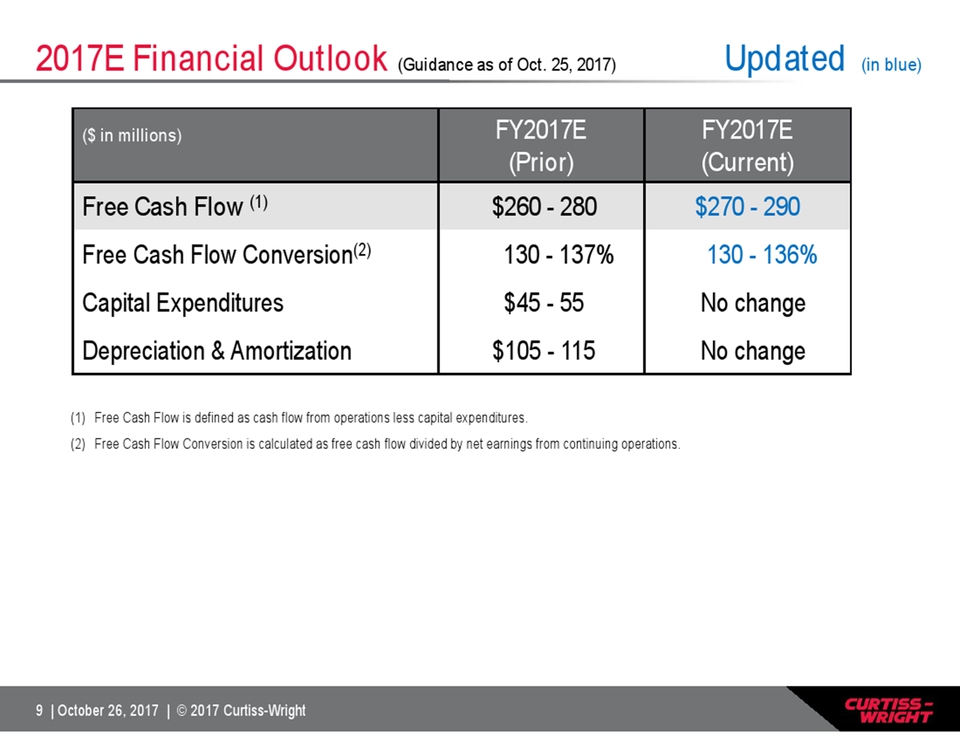
9 | October 26, 2017 | © 2017 Curtiss-Wright 2017E Financial Outlook (Guidance as of Oct. 25, 2017) Updated (in blue) ($ in millions) FY2017E (Prior) FY2017E (Current) Free Cash Flow (1) $260 - 280 $270 – 290 Free Cash Flow Conversion(2) 130 - 137% 130 - 136% Capital Expenditures $45 - 55 No change Depreciation & Amortization $105 - 115 No change (1) Free Cash Flow is defined as cash flow from operations less capital expenditures. (2) Free Cash Flow Conversion is calculated as free cash flow divided by net earnings from continuing operations.
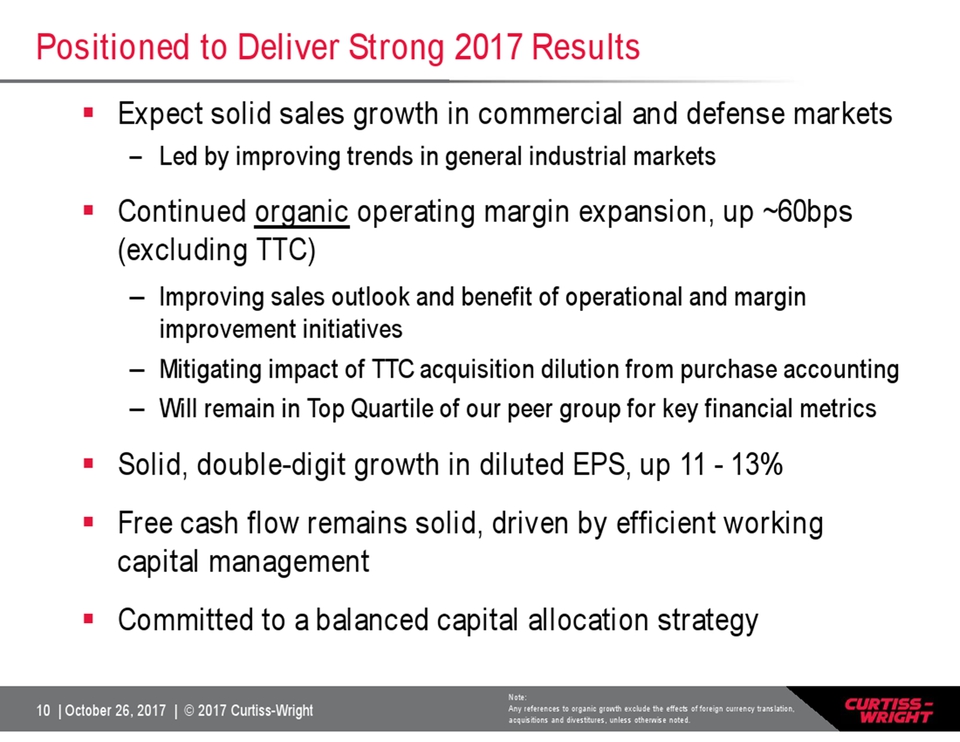
10 | October 26, 2017 | © 2017 Curtiss-Wright Positioned to Deliver Strong 2017 Results Expect solid sales growth in commercial and defense markets– Led by improving trends in general industrial markets Continued organic operating margin expansion, up ~60bps (excluding TTC) – Improving sales outlook and benefit of operational and margin improvement initiatives – Mitigating impact of TTC acquisition dilution from purchase accounting – Will remain in Top Quartile of our peer group for key financial metrics Solid, double-digit growth in diluted EPS, up 11 - 13% Free cash flow remains solid, driven by efficient working capital management Committed to a balanced capital allocation strategy Note: Any references to organic growth exclude the effects of foreign currency translation, acquisitions and divestitures, unless otherwise noted.
11 | October 26, 2017 | © 2017 Curtiss-Wright Appendix
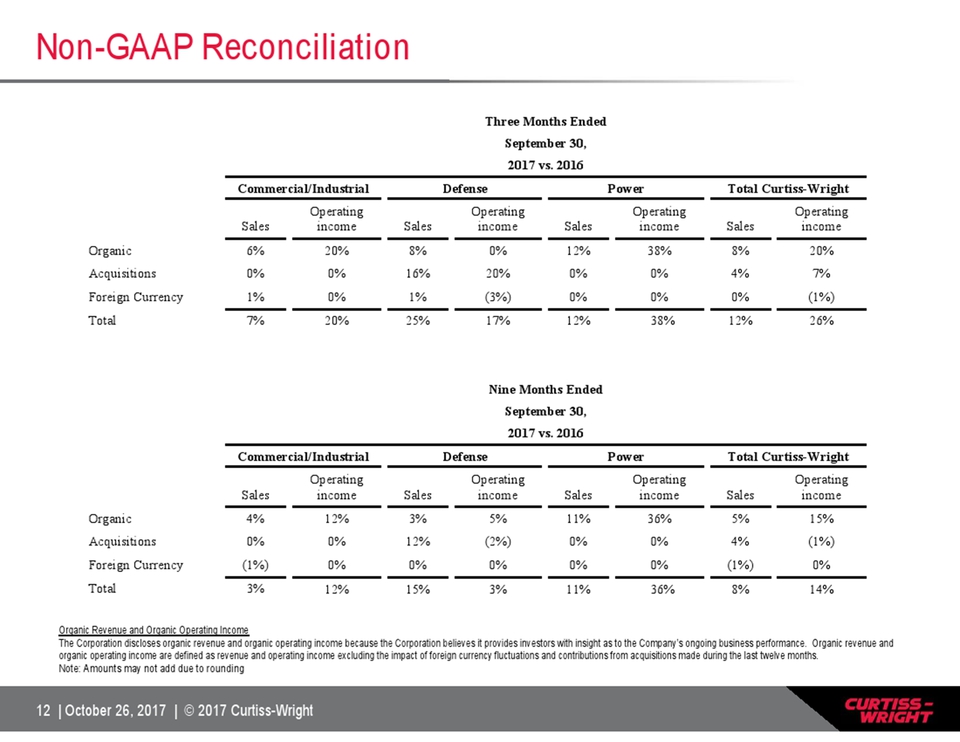
12 | October 26, 2017 | © 2017 Curtiss-Wright Non-GAAP Reconciliation Organic Revenue and Organic Operating Income The Corporation discloses organic revenue and organic operating income because the Corporation believes it provides investors with insight as to the Company’s ongoing business performance. Organic revenue and organic operating income are defined as revenue and operating income excluding the impact of foreign currency fluctuations and contributions from acquisitions made during the last twelve months. Note: Amounts may not add due to rounding Three Months Ended September 30, 2017 vs. 2016 Commercial/Industrial Defense Power Total Curtiss-Wright Sales Operating income Sales Operating income Sales Operating income Sales Operating income Organic 6% 20% 8% 0% 12% 38% 8% 20% Acquisitions 0% 0% 16% 20% 0% 0% 4% 7% Foreign Currency 1% 0% 1% (3%) 0% 0% 0% (1%) Total 7% 20% 25% 17% 12% 38% 12% 26% Nine Months Ended September 30, 2017 vs. 2016 Commercial/Industrial Defense Power Total Curtiss-Wright Sales Operating income Sales Operating income Sales Operating income Sales Operating income Organic 4% 12% 3% 5% 11% 36% 5% 15% Acquisitions 0% 0% 12% (2%) 0% 0% 4% (1%) Foreign Currency (1%) 0% 0% 0% 0% 0% (1%) 0% Total 3% 12% 15% 3% 11% 36% 8% 14%
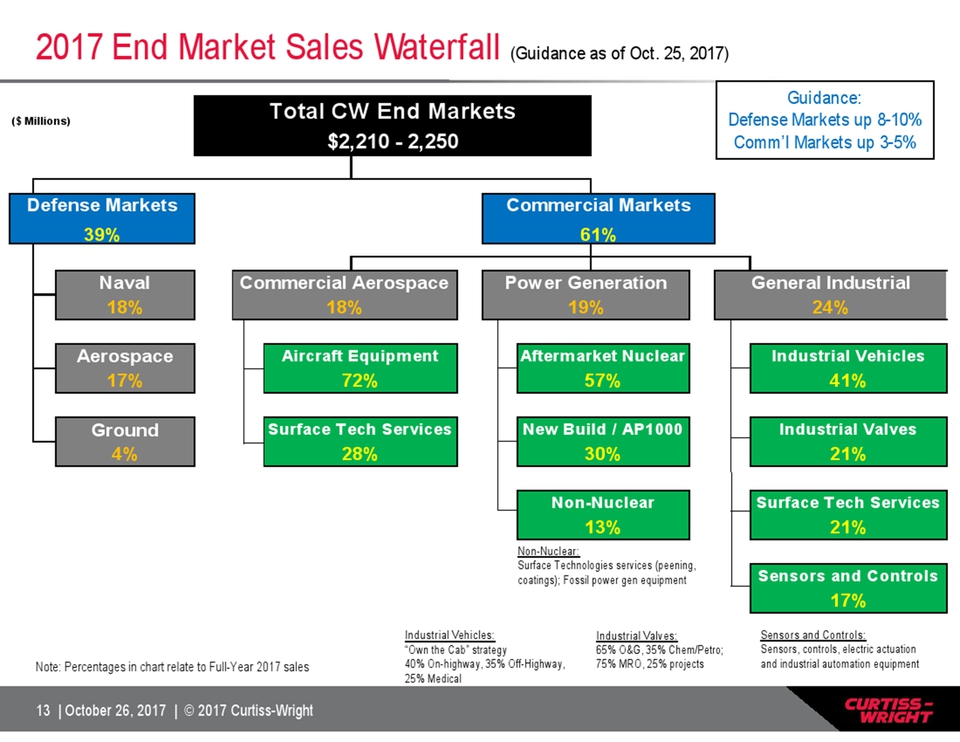
13 | October 26, 2017 | © 2017 Curtiss-Wright 2017 End Market Sales Waterfall (Guidance as of Oct. 25, 2017) Note: Percentages in chart relate to Full-Year 2017 sales ($ Millions) Naval Aerospace Industrial Vehicles Ground Industrial Valves Surface Tech Services Sensors and Controls 13% Commercial Markets Aftermarket Nuclear 57% New Build / AP1000 General Industrial 19% 24% 61% 30% Non-Nuclear 17% 21% 21% 17% Power Generation 4% 18% Aircraft Equipment 72% Surface Tech Services 28% 18% 39% Defense Markets Total CW End Markets $2,210 - 2,250 41% Commercial Aerospace Guidance: Defense Markets up 8-10% Comm’l Markets up 3-5% Sensors and Controls: Sensors, controls, electric actuation and industrial automation equipment Industrial Vehicles: “Own the Cab” strategy 40% On-highway, 35% Off-Highway, 25% Medical Industrial Valves: 65% O&G, 35% Chem/Petro; 75% MRO, 25% projects Non-Nuclear: Surface Technologies services (peening, coatings); Fossil power gen equipment