Attached files
| file | filename |
|---|---|
| EX-99.1 - EX-99.1 - CALIFORNIA WATER SERVICE GROUP | a17-24508_1ex99d1.htm |
| 8-K - 8-K - CALIFORNIA WATER SERVICE GROUP | a17-24508_18k.htm |
California Water Service Group Third Quarter 2017 Earnings Call Presentation October 26, 2017
Forward-Looking Statements This presentation contains forward-looking statements within the meaning established by the Private Securities Litigation Reform Act of 1995 ("Act"). The forward-looking statements are intended to qualify under provisions of the federal securities laws for "safe harbor" treatment established by the Act. Forward-looking statements are based on currently available information, expectations, estimates, assumptions and projections, and management's judgment. Words such as would, expects, intends, plans, believes, estimates, assumes, anticipates, projects, predicts, forecasts or variations of such words or similar expressions are intended to identify forward-looking statements. The forward-looking statements are not guarantees of future performance. They are subject to uncertainty and changes in circumstances. Actual results may vary materially from what is contained in a forward-looking statement. Factors that may cause a result different than expected or anticipated include, but are not limited to: governmental and regulatory commissions' decisions; changes in regulatory commissions' policies and procedures; the timeliness of regulatory commissions' actions concerning rate relief; eminent domain actions affecting our water systems; electric power interruptions; the ability to successfully implement conservation measures; changes in customer water use patterns; the impact of weather and climate on water sales and operating results; and, other risks and unforeseen events. When considering forward-looking statements, you should keep in mind the cautionary statements included in this paragraph, as well as the annual 10-K, Quarterly 10-Q, and other reports filed from time- to-time with the Securities and Exchange Commission (SEC). The Company assumes no obligation to provide public updates of forward-looking statements. 2
Marty Kropelnicki President & CEO 3 Today’s Participants Tom Smegal Vice President, CFO & Treasurer
Presentation Overview Financial Results Financial Highlights Q3 2017- Q3 2016 EPS Bridge YTD 2017- YTD 2016 EPS Bridge California Fire Emergency Response and Training Cost of Capital Update Other Regulatory Notes Water Quality Regulation Update Drought and effects on WRAM Receivable Cap Ex 2007 Recorded to 2018 Projected Rate Base 2014 recorded to 2019 projected Looking Toward Year End and 2018 Adopted Revenue by Month 2017 4
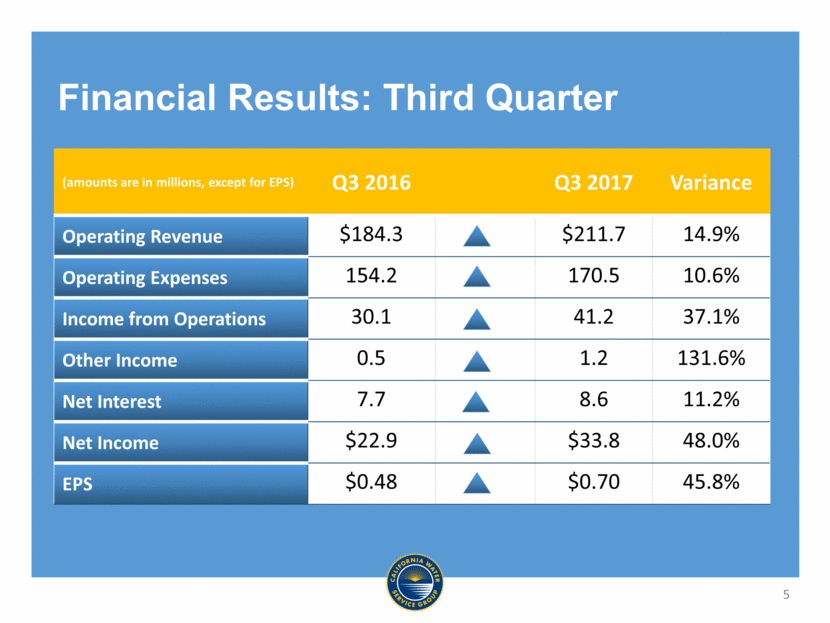
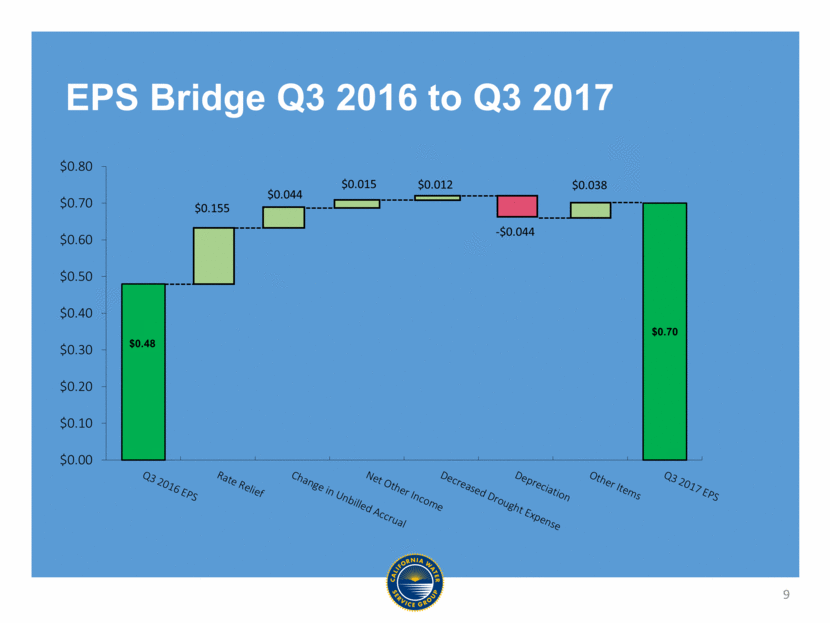
(amounts are in millions, except for EPS) Q3 2016 Q3 2017 Variance Operating Revenue $184.3 $211.7 14.9% Operating Expenses 154.2 170.5 10.6% Income from Operations 30.1 41.2 37.1% Other Income 0.5 1.2 131.6% Net Interest 7.7 8.6 11.2% Net Income $22.9 $33.8 48.0% EPS $0.48 $0.70 45.8% Financial Results: Third Quarter 5
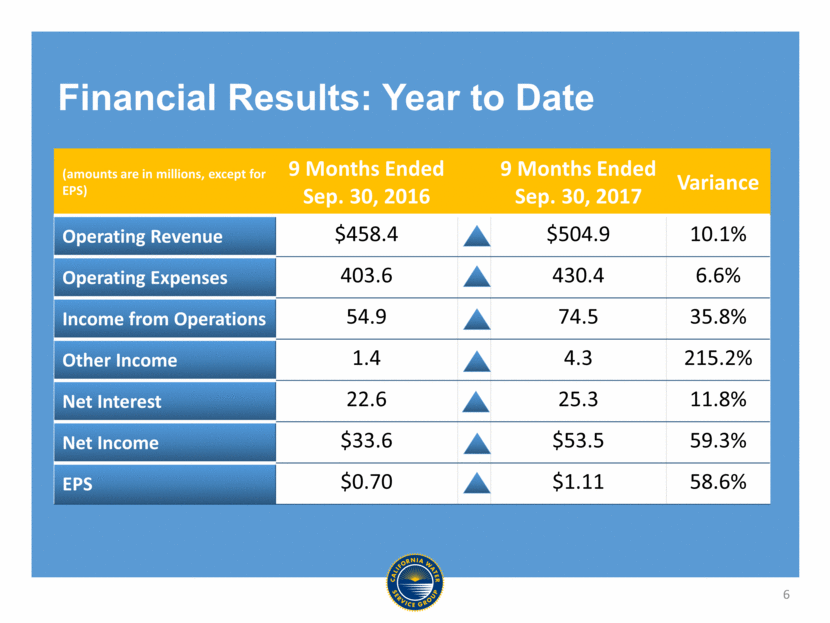
(amounts are in millions, except for EPS) 9 Months Ended Sep. 30, 2016 9 Months Ended Sep. 30, 2017 Variance Operating Revenue $458.4 $504.9 10.1% Operating Expenses 403.6 430.4 6.6% Income from Operations 54.9 74.5 35.8% Other Income 1.4 4.3 215.2% Net Interest 22.6 25.3 11.8% Net Income $33.6 $53.5 59.3% EPS $0.70 $1.11 58.6% Financial Results: Year to Date 6
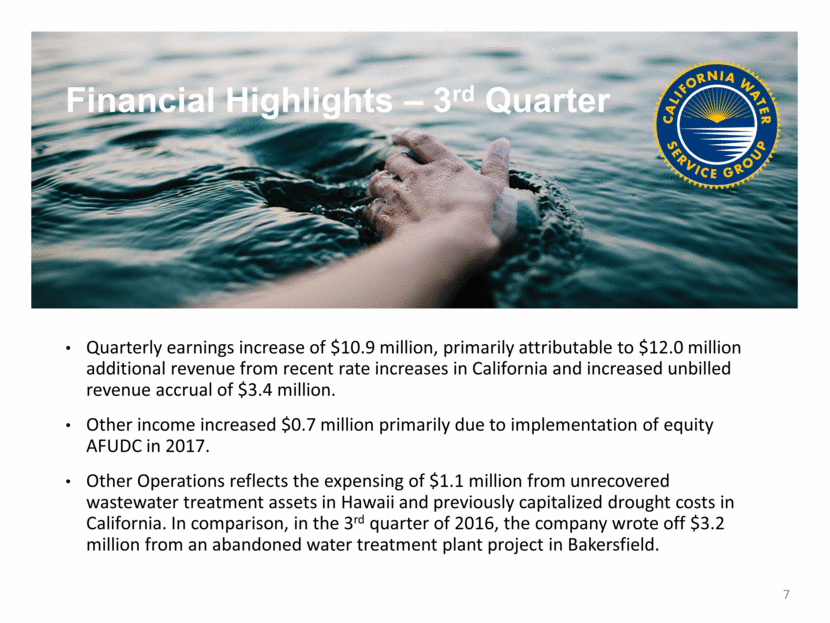
Financial Highlights – 3rd Quarter Quarterly earnings increase of $10.9 million, primarily attributable to $12.0 million additional revenue from recent rate increases in California and increased unbilled revenue accrual of $3.4 million. Other income increased $0.7 million primarily due to implementation of equity AFUDC in 2017. Other Operations reflects the expensing of $1.1 million from unrecovered wastewater treatment assets in Hawaii and previously capitalized drought costs in California. In comparison, in the 3rd quarter of 2016, the company wrote off $3.2 million from an abandoned water treatment plant project in Bakersfield. 7
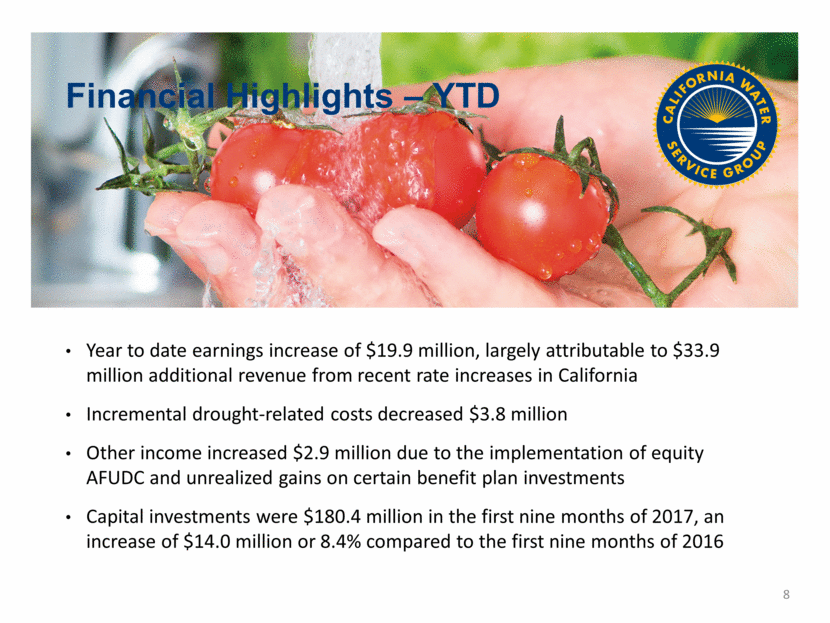
Financial Highlights – YTD Year to date earnings increase of $19.9 million, largely attributable to $33.9 million additional revenue from recent rate increases in California Incremental drought-related costs decreased $3.8 million Other income increased $2.9 million due to the implementation of equity AFUDC and unrealized gains on certain benefit plan investments Capital investments were $180.4 million in the first nine months of 2017, an increase of $14.0 million or 8.4% compared to the first nine months of 2016 8
EPS Bridge Q3 2016 to Q3 2017 9 $0.015
EPS Bridge YTD 2016 to YTD 2017 10
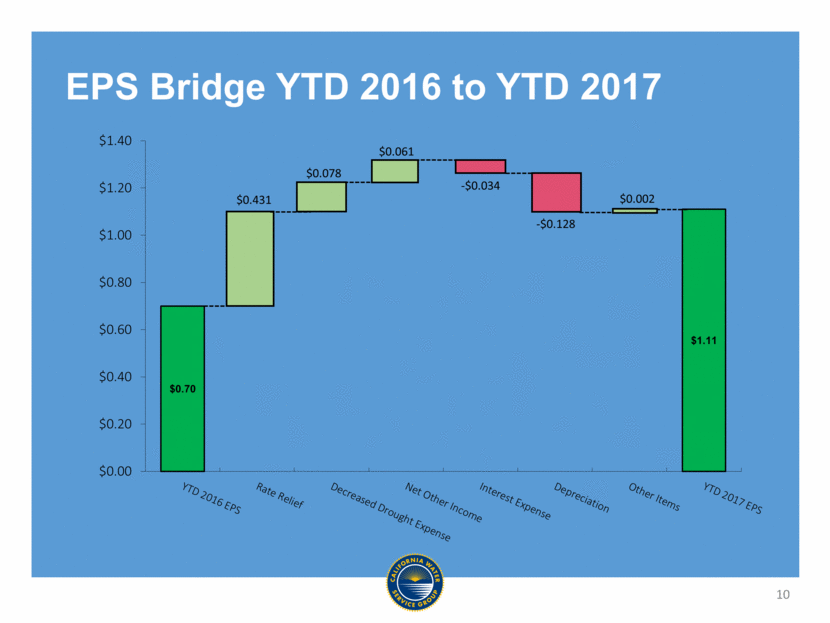
Notes on EPS Bridge Items Increased rate relief is consistent with the GRC decision Change in unbilled revenue accrual is seasonal and reflects consumption changes due to weather and other factors Increased depreciation is consistent with $230 million additional capital investment placed into service in 2016 Equity AFUDC is recorded in Other Income 11
California Fire Emergency Response and Training Minor damage in recent firestorms but fortunately no customer effects Flumes damaged on a raw water canal in Oroville serving irrigation customers Major incidents including Erskine Fire in 2016 and Oroville dam emergency in 2017 continue to teach lessons In 2015, company promoted retired fire chief Gerald Simon to Chief Safety and Emergency Preparedness Officer Since 2015, we have activated Emergency Operations Centers (EOCs) 14 times We run joint EOC training exercises with other community responders at least quarterly Chico and Marysville EOC training in Q3 with over 80 participants from local governments and other service providers 12
Cal Water filed its cost of capital application on April 2, 2017 to set ROE and capital weighting for 2018 Requested 10.75% ROE and 53.4% equity capital structure Ratepayer Advocate proposed 8.22% ROE and 54.4% equity Currently authorized 9.43% ROE and 53.4% equity Hearings were held in September Commission has adopted a schedule allowing for a decision by the end of 2017 Cost of Capital Update 13
Other Regulatory Notes California escalation rate increases of up to $17.2 million for 2018 will be requested in the fourth quarter Increase is subject to an earnings test which reviews capital investment performance Increase will also vary with recorded inflation 2018 rates will also incorporate Sales Reconciliation Mechanism (SRM) adjustments $30 million of aggregate California advice letter revenue will be included in rates after completion of specific projects through 2019 Through the third quarter, the CPUC has approved four advice letter projects totaling an additional $1.3 million annual revenue In May, Cal Water filed an application to incorporate Travis Air Force Base into its California service territory The application is still in process with hearings scheduled in the 4th quarter Decision by the Hawaii Commission authorized $0.8 million revenue increase in Pukalani wastewater division, phased in over four years, effective in October 2017 14
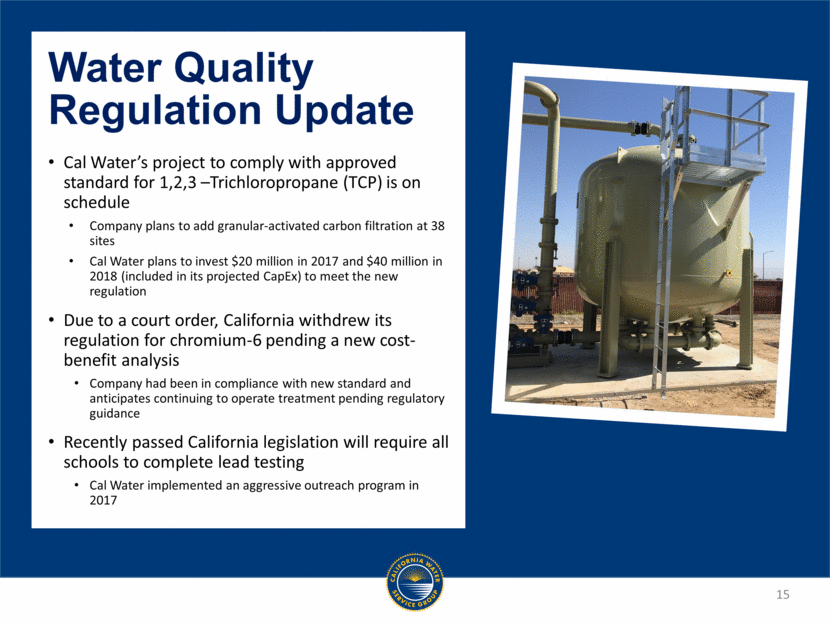
Cal Water’s project to comply with approved standard for 1,2,3 –Trichloropropane (TCP) is on schedule Company plans to add granular-activated carbon filtration at 38 sites Cal Water plans to invest $20 million in 2017 and $40 million in 2018 (included in its projected CapEx) to meet the new regulation Due to a court order, California withdrew its regulation for chromium-6 pending a new cost-benefit analysis Company had been in compliance with new standard and anticipates continuing to operate treatment pending regulatory guidance Recently passed California legislation will require all schools to complete lead testing Cal Water implemented an aggressive outreach program in 2017 Water Quality Regulation Update 15
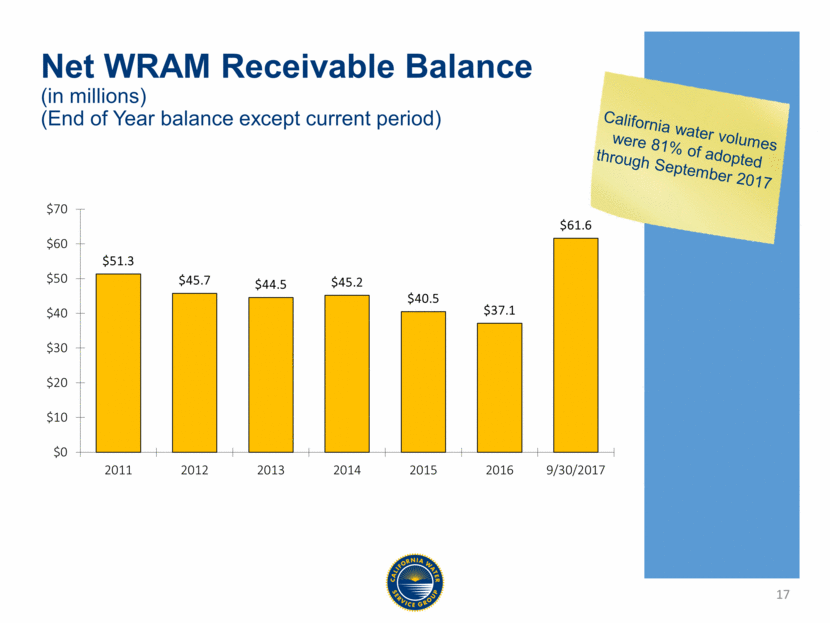
Cal Water’s decoupling mechanism (WRAM) and drought rate design combined to reduce impact of drought on financials Income statement insulated from most sales changes During the drought, the WRAM receivable balance declined due to drought surcharge In 2017, sales have increased 4.9% from the drought period but are still much lower than historical averages As a result, WRAM receivable has grown from $37.1 million at year end 2016 to $61.6 million at end of the third quarter WRAM balance may continue to grow if water use patterns persist CPUC mechanisms will help mitigate the receivable in 2018 Sales Reconciliation Mechanism (SRM) allows Cal Water to adjust rates to reflect lower sales volumes – customer rates will be set to collect more fixed costs in each unit All California Districts will trigger SRM for 2018 Ongoing WRAM surcharges are updated each Spring to reflect receivable from prior year 16 2017 Residual Effects of Drought
Net WRAM Receivable Balance (in millions) (End of Year balance except current period) California water volumes were 81% of adopted through September 2017 17
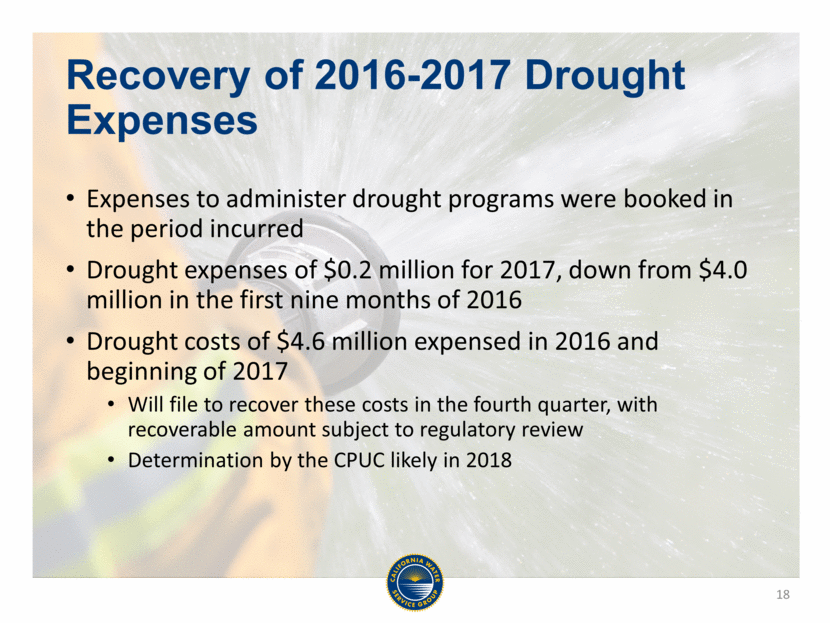
Recovery of 2016-2017 Drought Expenses Expenses to administer drought programs were booked in the period incurred Drought expenses of $0.2 million for 2017, down from $4.0 million in the first nine months of 2016 Drought costs of $4.6 million expensed in 2016 and beginning of 2017 Will file to recover these costs in the fourth quarter, with recoverable amount subject to regulatory review Determination by the CPUC likely in 2018 18
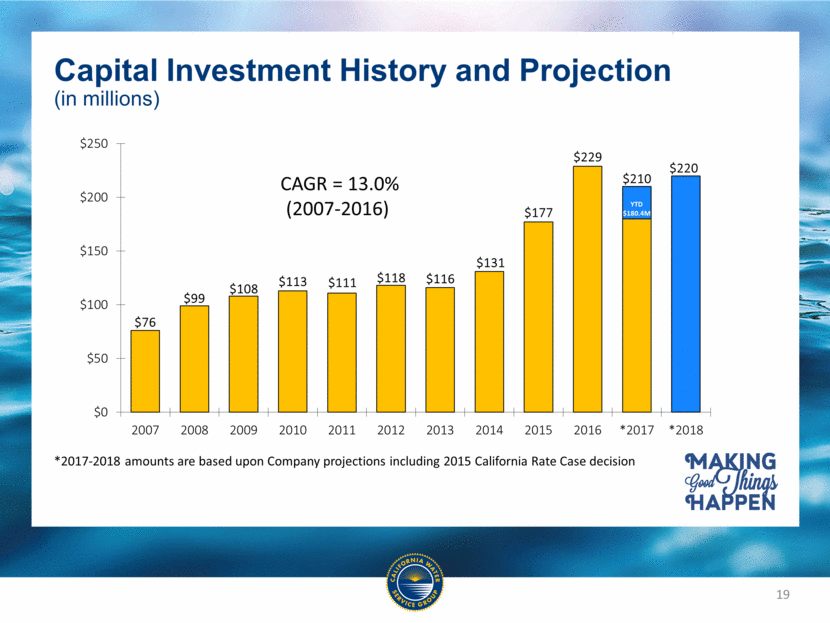
Capital Investment History and Projection (in millions) *2017-2018 amounts are based upon Company projections including 2015 California Rate Case decision CAGR = 13.0% (2007-2016) 19
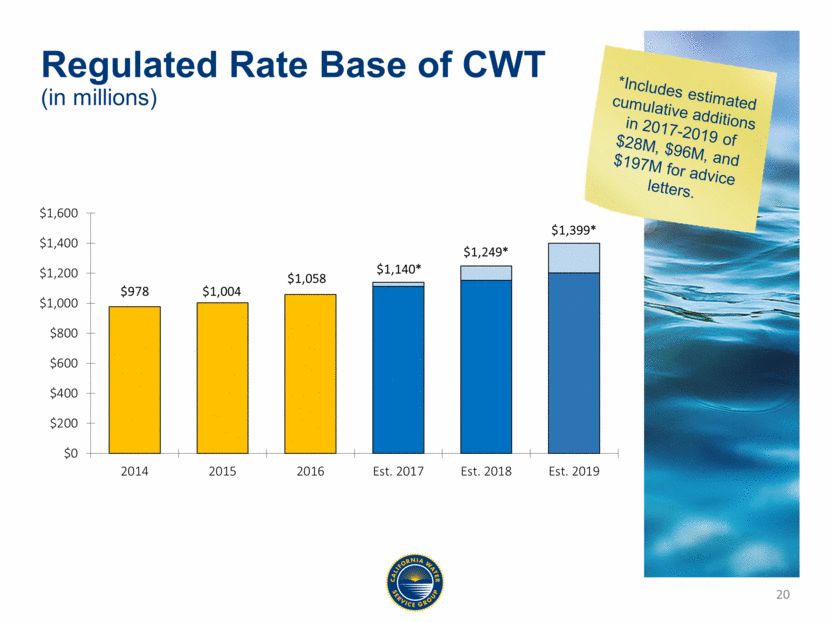
Regulated Rate Base of CWT Regulated Rate Base of CWT (in millions) *Includes estimated cumulative additions in 2017-2019 of $28M, $96M, and $197M for advice letters. 20
Looking Toward Year End and 2018 Company awaiting a decision in California cost of capital application We anticipate filing advice letters for escalation rate increases in California, along with a sales adjustment for all districts, in November, with new rates expected to be effective in January 2018 Anticipate filing for recovery of 2016-2017 drought costs in the 4th quarter Making good progress on capital projects in 2017 and likely to perform near the upper end of our $200 million to $220 million estimate Company continues to focus on capital investment to comply with California’s proposed 1,2,3-Trichlorpropane (TCP) regulation Company is fully engaged in preparation of 2018 General Rate Case 21
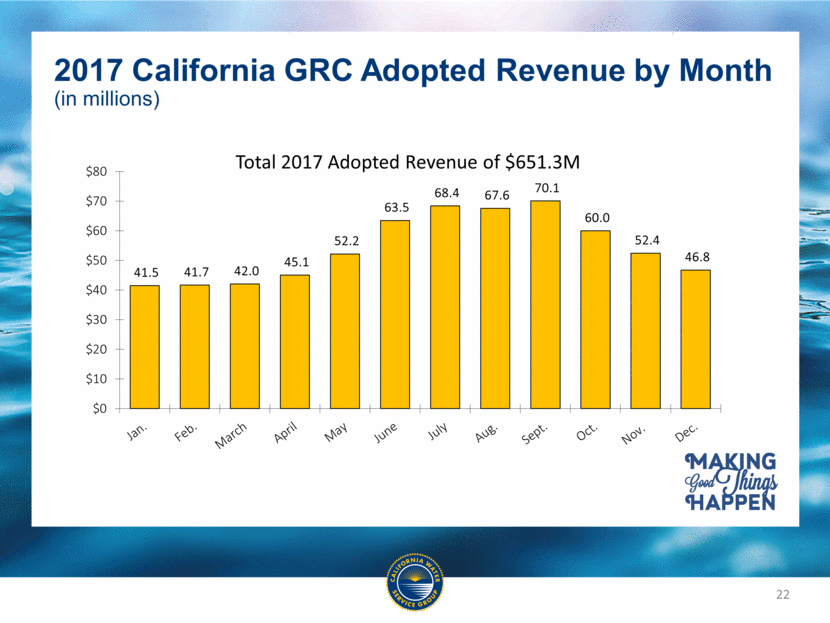
2017 California GRC Adopted Revenue by Month (in millions) Total 2017 Adopted Revenue of $651.3M 22
Discussion