Attached files
| file | filename |
|---|---|
| EX-99.1 - EXHIBIT 99.1 Q3 2017 EARNINGS RELEASE - TCF FINANCIAL CORP | exhibit9912017q3.htm |
| 8-K - 8-K CHFC Q3 2017 EARNINGS RELEASE - TCF FINANCIAL CORP | chfc8-k2017q3.htm |

2017 Third Quarter
Earnings Release David T. Provost
Chief Executive Officer
Thomas C. Shafer
Vice Chairman, Chief Executive
Officer of Chemical Bank
Dennis L. Klaeser
EVP and Chief Financial Officer
October 25, 2017

This presentation and the accompanying presentation by management may contain forward-looking statements that are based on
management's beliefs, assumptions, current expectations, estimates and projections about the financial services industry, the economy
and Chemical Financial Corporation ("Chemical"). Words and phrases such as "anticipates," "believes," "continue," "estimates,"
"expects," "forecasts," "future," "intends," "is likely," "judgment," "look ahead," "look forward," "on schedule," “on track,” "opinion,"
"opportunity," "plans," "potential," "predicts," "probable," "projects," "should," "strategic," "trend," "will," and variations of such words
and phrases or similar expressions are intended to identify such forward-looking statements. These statements include, among others,
statements related to our previously announced restructuring efforts and the effects of such efforts, including Chemical's expected
annualized cost savings, the expected use of a portion of such cost savings to hire commercial lenders, other bankers and support staff
to build market share and enhance revenue growth, the strength of our loans pipeline, our focus and expectations around building
shareholder value, including organic revenue growth and cost discipline, expanding our market presence and product lines and the
rationalization of our branch locations. All statements referencing future time periods are forward-looking.
Management's determination of the provision and allowance for loan losses; the carrying value of acquired loans, goodwill and mortgage
servicing rights; the fair value of investment securities (including whether any impairment on any investment security is temporary or
other-than-temporary and the amount of any impairment); and management's assumptions concerning pension and other postretirement
benefit plans involve judgments that are inherently forward-looking. There can be no assurance that future loan losses will be limited
to the amounts estimated. All of the information concerning interest rate sensitivity is forward-looking. The future effect of changes in
the financial and credit markets and the national and regional economies on the banking industry, generally, and on Chemical, specifically,
are also inherently uncertain.
Forward-looking are based upon current beliefs and expectations and involve substantial risks and uncertainties that could cause actual
results to differ materially from those expressed or implied by such forward-looking statements. Accordingly, such statements are not
guarantees of future performance and involve certain risks, uncertainties and assumptions ("risk factors") that are difficult to predict
with regard to timing, extent, likelihood and degree of occurrence. Therefore, actual results and outcomes may materially differ from
what may be expressed or forecasted in such forward-looking statements. Chemical undertakes no obligation to update, amend or clarify
forward-looking statements, whether as a result of new information, future events or otherwise.
Forward-Looking Statements & Other
Information
2
Risk factors include, without limitation:
• Chemical's ability to attract and retain new commercial lenders and other bankers as well as key operations staff in light of
competition for experienced employees in the banking industry;
• Chemical's ability to grow its deposits while reducing the number of physical branches that it operates;
• Negative reactions to the branch closures by Chemical Bank's customers, employees and other counterparties;
• Economic conditions (both generally and in our markets) may be less favorable than expected, which could result in, among
other things, a deterioration in credit quality, a reduction in demand for credit and a decline in real estate values;
• A general decline in the real estate and lending markets, particularly in our market areas, could negatively affect our financial
results;
• Increased cybersecurity risk, including potential network breaches, business disruptions, or financial losses;
• Restrictions or condition imposed by our regulators on our operations may make it more difficult for us to achieve our goals;
• Legislative or regulatory changes,including changes in accounting standards and compliance requirements, may adversely affect
us;
• Changes in the interest rate environment may reduce margins or the volumes or values of the loans we make or have acquired;
and
• Economic, governmental, or other factors may prevent the projected population, residential, and commercial growth in the
markets in which we operate.
In addition, risk factors include, but are not limited to, the risk factors described in Item 1A of Chemical’s Annual Report on Form 10-
K for the year ended December 31, 2016. These and other factors are representative of the risk factors that may emerge and could cause
a difference between an ultimate actual outcome and a preceding forward-looking statement.
Forward-Looking Statements & Other
Information (continued)
3

Non-GAAP Financial Measures
This presentation and the accompanying presentation by management contain certain non-GAAP financial disclosures that are not in
accordance with U.S. generally accepted accounting principles ("GAAP"). Such non-GAAP financial measures include Chemical’s
tangible shareholders' equity to tangible assets ratio, tangible book value per share, presentation of net interest income and net interest
margin on a fully taxable equivalent basis, operating expenses-core (which excludes merger and restructuring expenses and impairment
of income tax credits), operating expenses-efficiency ratio (which excludes merger and restructuring expenses, impairment of income
tax credits and amortization of intangibles), the adjusted efficiency ratio (which excludes significant items, impairment of income tax
credits, amortization of intangibles, net interest income FTE adjustments, gains from sale of investment securities and closed branch
locations) ant other information presented excluding significant items, including net income, diluted earnings per share, return on average
assets and return on average shareholders' equity. Chemical uses non-GAAP financial measures to provide meaningful, supplemental
information regarding its operational results and to enhance investors’ overall understanding of Chemical’s financial performance. The
limitations associated with non-GAAP financial measures include the risk that persons might disagree as to the appropriateness of items
comprising these measures and that different companies might calculate these measures differently. These disclosures should not be
considered an alternative to Chemical’s GAAP results. See the Appendix included with this presentation for a reconciliation of the non-
GAAP financial measures to the most directly comparable GAAP financial measures.
Forward-Looking Statements & Other
Information (continued)
4
Q3 2017 Highlights
q Diluted earnings per share of $0.56, compared to $0.73 in the 2nd qtr. 2017 and $0.23 in the 3rd qtr.
2016
q Diluted earnings per share, excluding significant items,(1)(2) of $0.79; up 5% from both 2nd qtr. 2017 and
3rd qtr. 2016
q Return on average assets and return on average shareholders' equity of 0.86% and 6.1%, respectively, in
3rd qtr. 2017 (1.21% and 8.6%, respectively, excluding significant items(1)(2))
q Return on average tangible shareholders' equity of 10.9% in 3rd qtr. 2017 (15.3%, excluding significant
items(1)(2))
q Loan Growth
▪ $166 million in 3rd qtr. 2017 (quarterly organic loan growth: 12.3% commercial real estate
construction, 4.0% consumer installment and 3.1% residential mortgage loans)
q Asset quality ratios
▪ Nonperforming loans/total loans of 0.39% at September 30, 2017; increased from 0.37% at
June 30, 2017, and from 0.32% at September 30, 2016
▪ Net loan charge-offs/average loans of 0.10%
(1)"Significant items" include merger and restructuring expenses and the change in fair value in loan servicing rights.
(2)Denotes a non-GAAP financial measure. Refer to the Appendix for a reconciliation of non-GAAP financial measures.
5

2017 2017 2016
(in thousands except per share data) 3rd Qtr. 2nd Qtr. 3rd Qtr.
Net interest income $ 143,628 $ 137,948 $ 96,809
Provision for loan losses 5,499 6,229 4,103
Noninterest income 32,122 41,568 27,770
Operating expenses 119,539 98,237 106,144
Operating expenses, excl. merger and restructuring
expenses and impairment of income tax credits(1) 95,241 97,772 68,674
Merger expenses 2,379 465 37,470
Restructuring expenses 18,824 — —
Impairment of income tax credits 3,095 — —
Net income 40,459 52,014 11,484
Net income, excl. significant items(1) 56,868 53,488 37,405
Diluted EPS 0.56 0.73 0.23
Diluted EPS, excl. significant items(1) 0.79 0.75 0.75
Return on Avg. Assets 0.86% 1.14% 0.37%
Return on Avg. Shareholders’ Equity 6.1% 8.0% 2.9%
Efficiency Ratio 68.0% 54.7% 85.2%
Efficiency Ratio - Adjusted(1) 51.2% 52.2% 52.7%
Equity/Total Assets 13.8% 14.1% 14.7%
Tangible Shareholders' Equity/Tangible Assets(1) 8.3% 8.4% 8.7%
Book Value/Share $ 37.57 $ 37.11 $ 36.37
Tangible Book Value/Share(1) $ 21.36 $ 20.89 $ 19.99
Prior Quarter Comparison
▪ Higher net interest income in Q3 compared
to Q2, due to organic loan growth, higher
average balance of investment securities and
an improvement in loan yields−partially
offset by higher average balances of
deposits and short-term borrowings
▪ Operating expenses increased primarily due
to restructuring expenses, consisting
primarily of severance and retirement
related expenses
▪ Decrease in noninterest income primarily
due to decreases in mortgage servicing
revenue and other charges and fees for
customer services
▪ Decrease in provision for loan losses, lower
net organic loan growth
Prior-Year Quarter Comparison
▪ Merger-related expenses incurred in Q3
2016
▪ Increase in net interest income, attributable
to increase in investment securities and
organic growth in total loans during the
twelve months ended September 30, 2017
and impact of the Talmer merger(1)Denotes a non-GAAP financial measure. Refer to the Appendix for a reconciliation of non-GAAP financial measures.
Financial Highlights
Income Statement Highlights
6
Financial Highlights
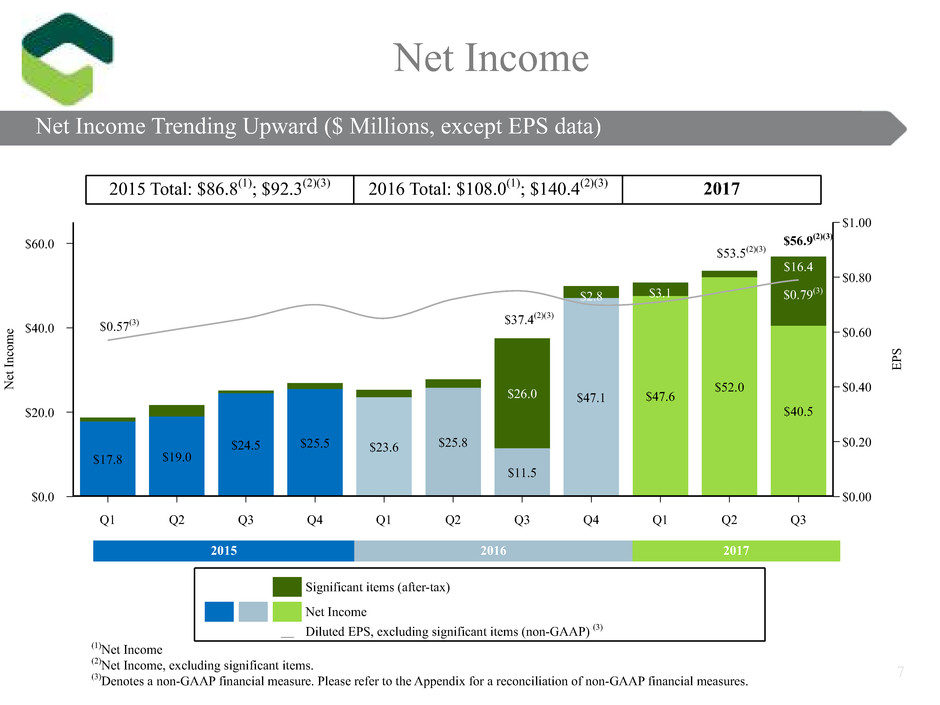
2015 Total: $86.8(1); $92.3(2)(3) 2016 Total: $108.0(1); $140.4(2)(3) 2017
(1)Net Income
(2)Net Income, excluding significant items.
(3)Denotes a non-GAAP financial measure. Please refer to the Appendix for a reconciliation of non-GAAP financial measures.
$56.9(2)(3)
Net Income Trending Upward ($ Millions, except EPS data)
Net Income
$0.57(3)
Net Income Trending Upward ($ Millions, except EPS data)
$60.0
$40.0
$20.0
$0.0
N
et
In
co
m
e
$1.00
$0.80
$0.60
$0.40
$0.20
$0.00
EP
S
Q1 Q2 Q3 Q4 Q1 Q2 Q3 Q4 Q1 Q2 Q3
$17.8 $19.0
$24.5 $25.5 $23.6 $25.8
$11.5
$47.1 $47.6
$52.0
$40.5
$26.0
$2.8 $3.1
$16.4
2015 2016 2017
$53.5(2)(3)
7
$37.4(2)(3)
Significant items (after-tax)
Net Income
__ Diluted EPS, excluding significant items (non-GAAP) (3)
$0.79(3)
Restructuring Announced Sept. 12, 2017
▪ Company-wide focus on efficient allocation of capital,
enhancing efficiency, improving customer service and
driving revenue growth
* 7.5 percent reduction in total employees in 3Q17
* 4Q17 planned consolidation of 25 branches, in addition to the 13 branches
consolidated in 3Q17
* Planned exiting of title insurance services and reducing resources allocated to
auto lending
* 3Q17 resulted in a pre-tax charge of $18.8 million as a result of retirement
costs, severance and charges associated with disposition of branch facilities
* Annualized cost savings expected to be about $20 million
▪ A portion of cost savings will be spent hiring commercial
lenders, other bankers and support staff with a goal of
building market share and further enhancing revenue growth
8

Loan Portfolio Composition ($ Millions)
$1,117
9
September 30, 2016 $12,716 September 30, 2017 $13,833
Total Loan Growth -
$3,200
$4,234
$3,047
$2,235
$3,320
$4,817
$3,221
$2,475
$120
$583
$174
$240
n Commercial n CRE/C&D n Residential n Consumer
Loan Growth - Twelve Months Ended
September 30, 2017

2015 - $476 2016 - $837 2017 - $843
$15
$224
$181
$280
$56
$843 $837
$96
$186
Quarterly Loan Growth Trends
Loan Growth* ($ Millions)
$275
*Excludes the impact of the $4.88 billion of loans acquired in the Talmer merger.
$283
10
n Commercial
n CRE/C&D
n Residential
n Consumer
$400
$300
$200
$100
$0
Q1 Q2 Q3 Q4 Q1 Q2 Q3 Q4 Q1 Q2 Q3
Quarterly Loan Growth Trends
Loan Growth - 2016 Total* Loan Growth - 2017 YTD
$88
$277
$125
$347
$103
$441
$134
$165
$166
$394
Quarterly Loan Growth Trends

Q3 2017 Q2 2017 Q1 2017 2016 Total*
Originated Loan Portfolio
Commercial $ 71 $ 195 $ 88 $ 380
CRE/C&D 139 313 239 594
Residential 197 89 119 258
Consumer 89 103 56 418
Total Originated Loan Portfolio Growth $ 496 $ 700 $ 502 $ 1,650
Acquired Loan Portfolio
Commercial $ (111) $ (88) $ (52) $ (292)
CRE/C&D (92) (94) (64) (317)
Residential (102) (97) (72) (133)
Consumer (25) (27) (31) (71)
Total Acquired Loan Portfolio Run-off $ (330) $ (306) $ (219) $ (813)
Total Loan Portfolio
Commercial $ (40) $ 107 $ 36 $ 88
CRE/C&D 47 219 175 277
Residential 95 (8) 47 125
Consumer 64 76 25 347
Total Loan Portfolio Growth $ 166 $ 394 $ 283 $ 837
Loan Growth (Run-off) ($ Millions)
Loan Growth* – Originated v. Acquired
*Excludes the impact of the $4.88 billion of loans acquired in the Talmer merger. 11
Loan Growth (Run-off) ($ Millions)

(1)Comprised of $874 million of growth in customer deposits offset by a $342 million decrease in brokered deposits.
(2)Cost of deposits based on period averages.
Total Deposits – September 30, 2016
$13.3
Total Deposits – September 30, 2017
$13.8
Organic
$0.5, 4.0%(1)
Total Deposits ($ Billions)
Deposit Composition
(2)
2016 2017
12
otal Deposits ($ Billions)
Average Deposits ($ Millions) & Cost of Deposits(2) (%)
$3.7
$3.0$4.0
$3.0
$0.1
n Noninterest-bearing Demand Deposits n Interest-bearing Demand Deposits n Savings Deposits n Time Deposits n Brokered Deposits
$0.4
$0.7
$0.1
$3.3
$3.3$3.3
$2.9
$0.5
Deposits Cost of Deposits
$14,000
$9,000
$4,000T
ot
al
Av
er
ag
e
D
ep
os
its 0.50%
0.25%
0.00%
In
te
re
st
R
at
e
Pa
id
Q1 Q2 Q3 Q4 Q1 Q2 Q3
$7,535 $7,528
$9,484
$13,003 $12,999 $13,022 $13,389
0.22% 0.23% 0.24%
0.27% 0.28%
0.33%
0.38%
$(0.4)
$(0.3)

Average Cost of Funds Q3 2017 – 0.53% Average Cost of Funds Q2 2017 – 0.44%
$16.0 billion $16.6 billion
Average cost of wholesale
borrowings – 1.35%
Average cost of wholesale
borrowings – 1.14%
Funding Breakdown ($ Billions)
13
June 30, 2017 September 30, 2017
n Deposits:
n Time Deposits
n Customer Repurchase
Agreements
n Wholesale borrowings (at
September 30, 2017: brokered
deposits - $0.1 billion, short
and long term borrowings -
$2.3 billion)
$10.2
$2.9
$0.3 $2.6
$10.8
$3.0
$0.4 $2.4
Interest and
noninterest-
bearing, demand,
savings, money
market

ALL
NPLs
2015 2016 2017
Originated Loans ($ billions) $3.3 $3.8 $4.3 $5.0 $5.8 $7.5 $9.2
Acquired Loans ($ billions) 0.5 0.4 0.3 0.7 1.5 5.5 4.7
Total Loans ($ billions) $3.8 $4.2 $4.6 $5.7 $7.3 $13.0 $13.9
Originated ALL $88 $84 $79 $76 $73 $78 $85
Acquired ALL — — — — — — 1
Total ALL $88 $84 $79 $76 $73 $78 $86
Originated ALL/ Originated Loans 2.60% 2.22% 1.81% 1.51% 1.26% 1.05% 0.93%
NPLs/ Total Loans 2.05% 1.71% 1.33% 0.89% 0.86% 0.34% 0.39%
Credit Mark as a % of Unpaid
Principal on Acquired Loans 6.6% 6.0% 7.8% 5.4% 4.4% 3.1% 2.7%
Provision for Loan Losses vs. Net Loan Losses
Credit Quality ($ Millions, unless otherwise noted)
Provision for Loan Losses vs. Net Loan Losses (Originated loan portfolio)
Nonperforming Loans (NPLs) and Allowance for Loan Losses (ALL)
Provision for Loan Losses Net Loan Losses
$7.0
$3.5
$0.0
Q1 Q2 Q3 Q4 Q1 Q2 Q3 Q4 Q1 Q2 Q3
$1.5 $1.5 $1.5 $2.0 $1.5
$3.0
$4.1
$6.3
$4.1
$6.2
$4.9$1.9 $1.8
$0.8
$4.3 $4.5
$1.8 $1.8 $1.8
$3.5
$1.2
$3.5
$120
$60
$0
YE 2011 YE 2012 YE 2013 YE 2014 YE 2015 YE 2016 Q3 2017
$78 $71 $62 $51 $62 $44 $54
$88 $84 $79 $76 $73 $78 $86
14
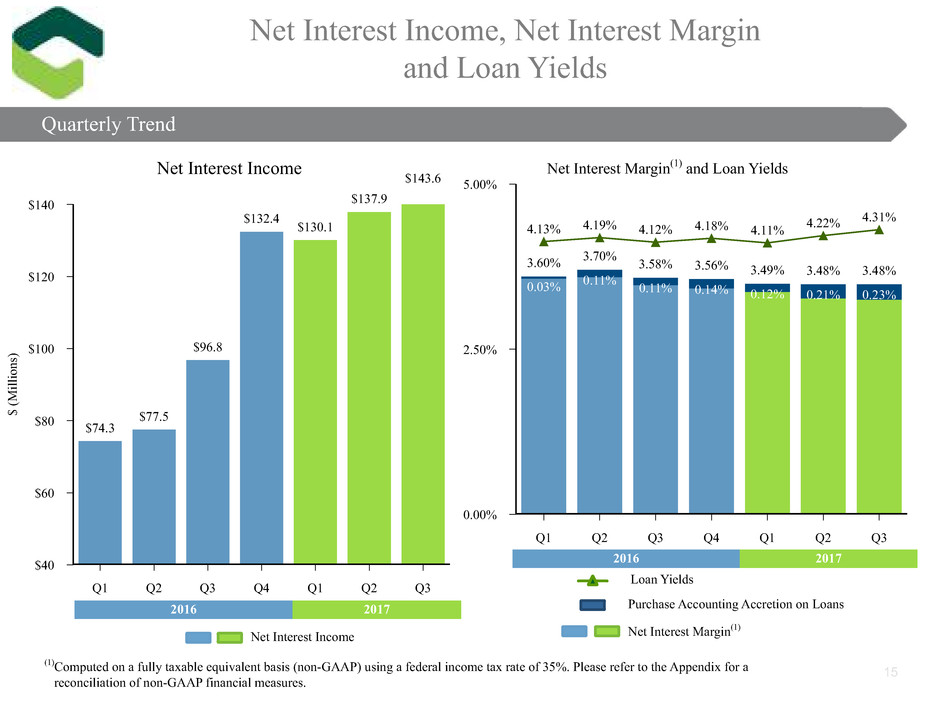
Net Interest Margin(1) and Loan Yields
Net Interest Margin(1)
Purchase Accounting Accretion on Loans
Loan Yields
Net Interest Income
(Quarterly Trend)
Net Interest Income, Net Interest Margin
and Loan Yields
(1)Computed on a fully taxable equivalent basis (non-GAAP) using a federal income tax rate of 35%. Please refer to the Appendix for a
reconciliation of non-GAAP financial measures.
15
Quarterly Trend
2016 2017
Net Interest Income
$140
$120
$100
$80
$60
$40
$
(M
ill
io
ns
)
Q1 Q2 Q3 Q4 Q1 Q2 Q3
$74.3
$77.5
$96.8
$132.4 $130.1
$137.9
$143.6
2016 2017
5.00%
2.50%
0.00%
Q1 Q2 Q3 Q4 Q1 Q2 Q3
4.13% 4.19% 4.12% 4.18% 4.11% 4.22%
4.31%
3.60% 3.70% 3.58% 3.56% 3.49% 3.48% 3.48%
0.03% 0.11% 0.11% 0.14% 0.12% 0.21% 0.23%

$20.9
$32.1*
Quarterly
Non-Interest Income
* Significant items: Changes in fair value in loan servicing rights were a $4.0 million detriment in Q3 2017, a $1.8 million
detriment in Q2 2017, a $0.5 million detriment in Q1 2017, a $6.3 million benefit in Q4 2016 and a $1.2 million detriment
in Q3 2016. Q4 2016 also included a $7.4 million gain on sales of branch offices.
$41.6*
$27.8*
$54.3*
16
Quarterly
2016 2017
Other Wealth Management
Service Charges Net Gain on Sale of Loans and other Mortgage Banking Revenue
$60.0
$30.0
$0.0
$
(M
ill
io
ns
)
Q1 Q2 Q3 Q4 Q1 Q2 Q3
$7.1 $7.2
$10.1
$25.4
$15.0 $15.9
$11.6
$5.2 $5.8
$5.6
$6.0
$5.8
$7.0
$6.2$5.7 $6.3
$7.7
$8.4
$8.0
$8.8
$9.1
$1.4 $1.6
$4.4
$14.4
$9.2
$9.9
$5.2
$38.0*
$19.4

$68.6(1)
$106.1
$56.0(1)
$59.1
$96.3(1)
$114.3
Quarterly
Operating Expenses
$98.2
$100.0(1)
17
Quarterly
2016 2017
$104.2
Other Compensation Occupancy
Equipment Impairment of Income Tax Credits Merger & Restructuring Expenses
$120.0
$60.0
$0.0
$
(M
ill
io
ns
)
Q1 Q2 Q3 Q4 Q1 Q2 Q3
$13.1 $12.5 $16.1
$22.3 $23.9
$28.3 $28.1
$33.9 $33.1
$40.6
$57.7
$60.2 $52.6 $52.6
$4.9 $5.5
$5.5
$7.6
$7.4 $8.7 $6.9
$4.4 $4.9
$6.4
$8.7
$8.5 $8.1 $7.6
$3.1
$2.6 $3.1
$37.5
$18.0
$4.2
$0.5
$21.2
$97.7(1)
$95.2(1)
$119.5
(1) Denotes a non-GAAP financial measure. Refer to the Appendix for a reconciliation of non-GAAP financial measures.
$56.3(1)
$58.9
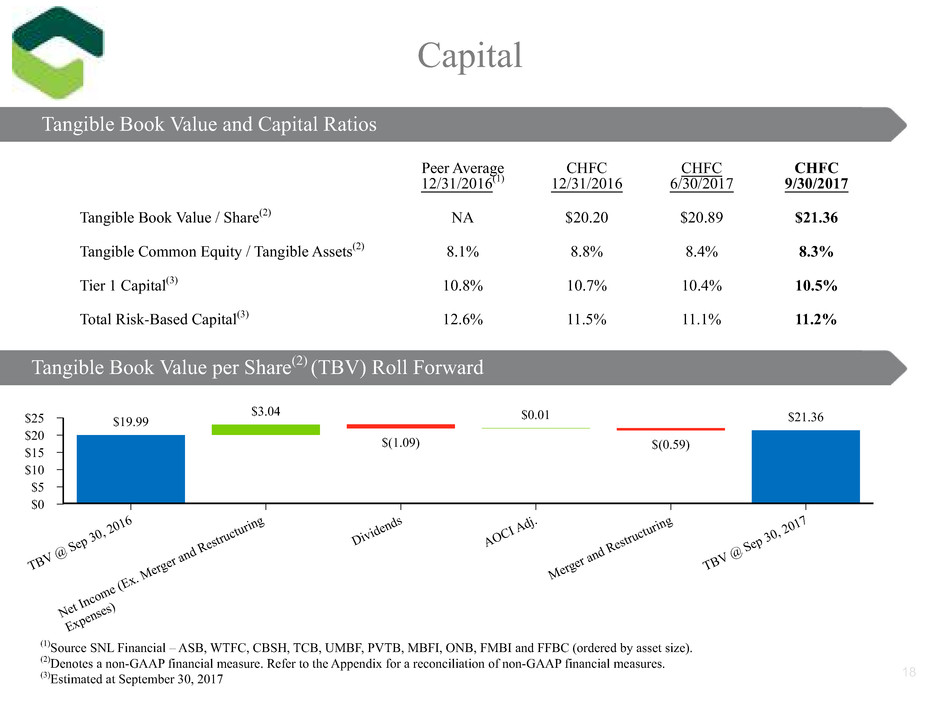
Peer Average
12/31/2016(1)
CHFC
12/31/2016
CHFC
6/30/2017
CHFC
9/30/2017
Tangible Book Value / Share(2) NA $20.20 $20.89 $21.36
Tangible Common Equity / Tangible Assets(2) 8.1% 8.8% 8.4% 8.3%
Tier 1 Capital(3) 10.8% 10.7% 10.4% 10.5%
Total Risk-Based Capital(3) 12.6% 11.5% 11.1% 11.2%
Capital
(1)Source SNL Financial – ASB, WTFC, CBSH, TCB, UMBF, PVTB, MBFI, ONB, FMBI and FFBC (ordered by asset size).
(2)Denotes a non-GAAP financial measure. Refer to the Appendix for a reconciliation of non-GAAP financial measures.
(3)Estimated at September 30, 2017
Tangible Book Value and Capital Ratios
Tangible Book Value per Share(2) (TBV) Roll Forward
$25
$20
$15
$10
$5
$0
TBV
@ S
ep 3
0, 20
16
Net
Inco
me (
Ex.
Mer
ger a
nd R
estru
cturi
ng
Exp
ense
s)
Divi
dend
s
AOC
I Ad
j.
Mer
ger a
nd R
estru
cturi
ng
TBV
@ S
ep 3
0, 20
17
$19.99
$3.04
$(1.09)
$0.01
$(0.59)
$21.36
18

q Emphasize our strategy of being the Premier Midwest Community
Bank
q Focus on what will build shareholder value
• Organic revenue growth and cost discipline
• Concentrate on achieving cost savings
• Expand our market presence and product lines where additional
value can be created
• Rationalization of branch locations
Closing Comments
19

Full Year
Q3 2017 Q2 2017 Q3 2016 2016 2015
Shareholders’ equity $ 2,673,089 $ 2,639,442 $ 2,563,666
Goodwill, CDI and non-compete agreements, net of tax (1,153,576) (1,153,595) (1,154,121)
Tangible shareholders’ equity $ 1,519,513 $ 1,485,847 $ 1,409,545
Common shares outstanding 71,152 71,131 70,497
Tangible book value per share $ 21.36 $ 20.89 $ 19.99
Total assets $ 19,354,308 $ 18,781,405 $ 17,383,637
Goodwill, CDI and non-compete agreements, net of tax (1,153,576) (1,153,595) (1,154,121)
Tangible assets $ 18,200,732 $ 17,627,810 $ 16,229,516
Tangible shareholders’ equity to tangible assets 8.3% 8.4% 8.7%
Net income $ 40,459 $ 52,014 $ 11,484 $ 108,032 $ 86,830
Significant items, net of tax 16,409 1,474 25,921 32,373 5,484
Net income, excl. significant items $ 56,868 $ 53,488 $ 37,405 $ 140,405 $ 92,314
Diluted earnings per share $ 0.56 $ 0.73 $ 0.23
Effect of significant items, net of tax 0.23 0.02 0.52
Diluted earnings per share, excl. significant items $ 0.79 $ 0.75 $ 0.75
Average assets $ 18,858,148 $ 18,264,699 $ 12,250,730
Return on average assets 0.86% 1.14% 0.37%
Effect of significant items, net of tax 0.35% 0.03% 0.85%
Return on average assets, excl. significant items 1.21% 1.17% 1.22%
Average shareholders’ equity $ 2,643,233 $ 2,606,517 $ 1,559,668
Return on average shareholders’ equity 6.1% 8.0% 2.9%
Effect of significant items, net of tax 2.5% 0.2% 6.7%
Return on average shareholders’ equity, excl. significant items 8.6% 8.2% 9.6%
(Dollars in thousands, except per share data)
Appendix: Non-GAAP Reconciliation
20
(Dollars in thousands, except per share data)

Q3 2017 Q2 2017 Q3 2016
Efficiency Ratio:
Total revenue – GAAP $ 175,750 $ 179,516 $ 124,579
Net interest income FTE adjustment 3,260 3,169 2,426
Significant items 4,040 1,725 935
Total revenue – Non-GAAP $ 183,050 $ 184,410 $ 127,940
Operating expenses – GAAP $ 119,539 $ 98,237 $ 106,144
Merger and restructuring expenses (21,203) (465) (37,470)
Impairment of income tax credits (3,095) — —
Operating expenses, core - Non-GAAP 95,241 97,772 68,674
Amortization of intangibles (1,526) (1,525) (1,292)
Operating expenses, efficiency ratio -excluding merger & restructuring
expenses, impairment of income tax credits and amortization of
intangibles - Non-GAAP $ 93,715 $ 96,247 $ 67,382
Efficiency ratio – GAAP 68.0% 54.7% 85.2%
Efficiency ratio – adjusted 51.2% 52.2% 52.7%
Net Interest Margin:
Net interest income – GAAP $ 143,628 $ 137,948 $ 96,809
Adjustments for tax equivalent interest:
Loans 824 814 777
Investment securities 2,436 2,355 1,649
Total taxable equivalent adjustments 3,260 3,169 2,426
Net interest income (on a tax equivalent basis) $ 146,888 $ 141,117 $ 99,235
Average interest-earning assets $ 16,815,240 $ 16,228,996 $ 11,058,143
Net interest margin – GAAP 3.40% 3.41% 3.49%
Net interest margin (on a tax-equivalent basis) 3.48% 3.48% 3.58%
(Dollars in thousands, except per share data)
Appendix: Non-GAAP Reconciliation
21
(Dollars in thousands, except per share data)

