Attached files
| file | filename |
|---|---|
| 8-K - 8-K - WESTERN ALLIANCE BANCORPORATION | coverpage-pressrelease9302.htm |
| EX-99.1 - EXHIBIT 99.1 - WESTERN ALLIANCE BANCORPORATION | pressrelease-9302017.htm |
Earnings Call
3rd Quarter 2017
October 20, 2017
2
Financial Highlights
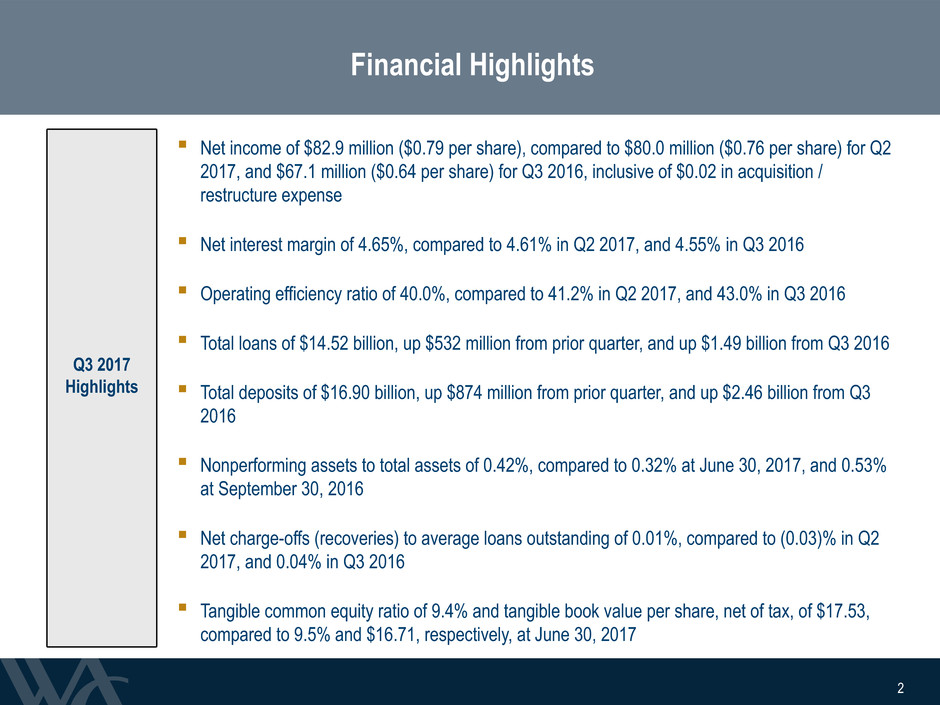
▪ Net income of $82.9 million ($0.79 per share), compared to $80.0 million ($0.76 per share) for Q2
2017, and $67.1 million ($0.64 per share) for Q3 2016, inclusive of $0.02 in acquisition /
restructure expense
▪ Net interest margin of 4.65%, compared to 4.61% in Q2 2017, and 4.55% in Q3 2016
▪ Operating efficiency ratio of 40.0%, compared to 41.2% in Q2 2017, and 43.0% in Q3 2016
▪ Total loans of $14.52 billion, up $532 million from prior quarter, and up $1.49 billion from Q3 2016
▪ Total deposits of $16.90 billion, up $874 million from prior quarter, and up $2.46 billion from Q3
2016
▪ Nonperforming assets to total assets of 0.42%, compared to 0.32% at June 30, 2017, and 0.53%
at September 30, 2016
▪ Net charge-offs (recoveries) to average loans outstanding of 0.01%, compared to (0.03)% in Q2
2017, and 0.04% in Q3 2016
▪ Tangible common equity ratio of 9.4% and tangible book value per share, net of tax, of $17.53,
compared to 9.5% and $16.71, respectively, at June 30, 2017
Q3 2017
Highlights
2

3
Quarterly Consolidated Financial Results
$ in millions, except EPS
Q3 2017 Highlights
▪ Net Interest Income increased
primarily as a result of higher yields on
loans from rising interest rates and
continued loan growth
▪ Operating Non-Interest Expense was
relatively flat from Q2 2017
▪ Provision for Credit Losses
commensurate with loan growth and
net charge-offs during the quarter
▪ Income Tax increased primarily as a
result of increased income in the
quarter
Q3-17 Q2-17 Q3-16
Net Interest Income $ 201.6 $ 192.7 $ 172.5
Operating Non-Interest Income 9.9 10.5 10.7
Net Operating Revenue $ 211.5 $ 203.2 $ 183.2
Operating Non-Interest Expense (88.8) (88.0) (82.4)
Operating Pre-Provision Net Revenue $ 122.7 $ 115.2 $ 100.8
Provision for Credit Losses (5.0) (3.0) (2.0)
(Losses) Gains on OREO and Other Assets (0.3) (0.2) 0.1
Acquisition / Restructure Expense — — (2.7)
Other 0.4 (0.1) —
Pre-tax Income $ 117.8 $ 111.9 $ 96.2
Income Tax (34.9) (32.0) (29.2)
Net Income $ 82.9 $ 80.0 $ 67.1
Average Diluted Shares Outstanding 104.9 105.0 104.6
Earnings Per Share $ 0.79 $ 0.76 $ 0.64
3
4
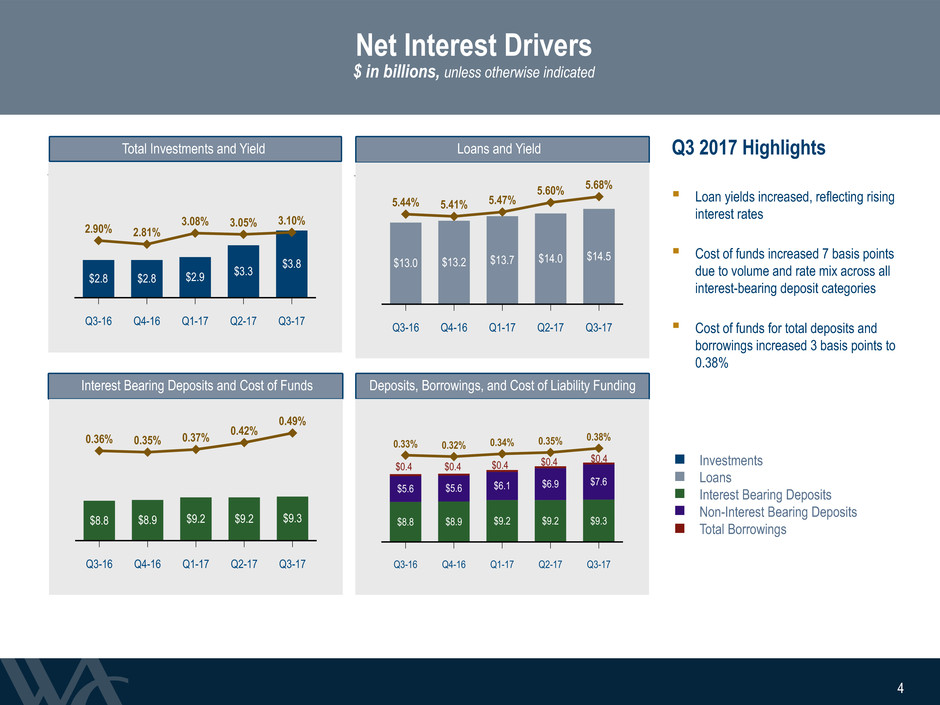
Net Interest Drivers
$ in billions, unless otherwise indicated
Interest Bearing Deposits and Cost of Funds
Loans and Yield
Deposits, Borrowings, and Cost of Liability Funding
Q3 2017 Highlights
▪ Loan yields increased, reflecting rising
interest rates
▪ Cost of funds increased 7 basis points
due to volume and rate mix across all
interest-bearing deposit categories
▪ Cost of funds for total deposits and
borrowings increased 3 basis points to
0.38%
Total Investments and Yield
Q3-16 Q4-16 Q1-17 Q2-17 Q3-17
2.90% 2.81%
3.08% 3.05% 3.10%
$2.8 $2.8 $2.9 $3.3
$3.8
Q3-16 Q4-16 Q1-17 Q2-17 Q3-17
5.44% 5.41% 5.47%
5.60% 5.68%
$13.0 $13.2 $13.7 $14.0 $14.5
Q3-16 Q4-16 Q1-17 Q2-17 Q3-17
0.36% 0.35% 0.37%
0.42%
0.49%
$8.8 $8.9 $9.2 $9.2 $9.3
Investments
Loans
Interest Bearing Deposits
Non-Interest Bearing Deposits
Total Borrowings
4
Q3-16 Q4-16 Q1-17 Q2-17 Q3-17
$8.8 $8.9 $9.2 $9.2 $9.3
$5.6 $5.6 $6.1 $6.9 $7.6
0.33% 0.32% 0.34% 0.35%
0.38%
$0.4 $0.4 $0.4 $0.4 $0.4
5
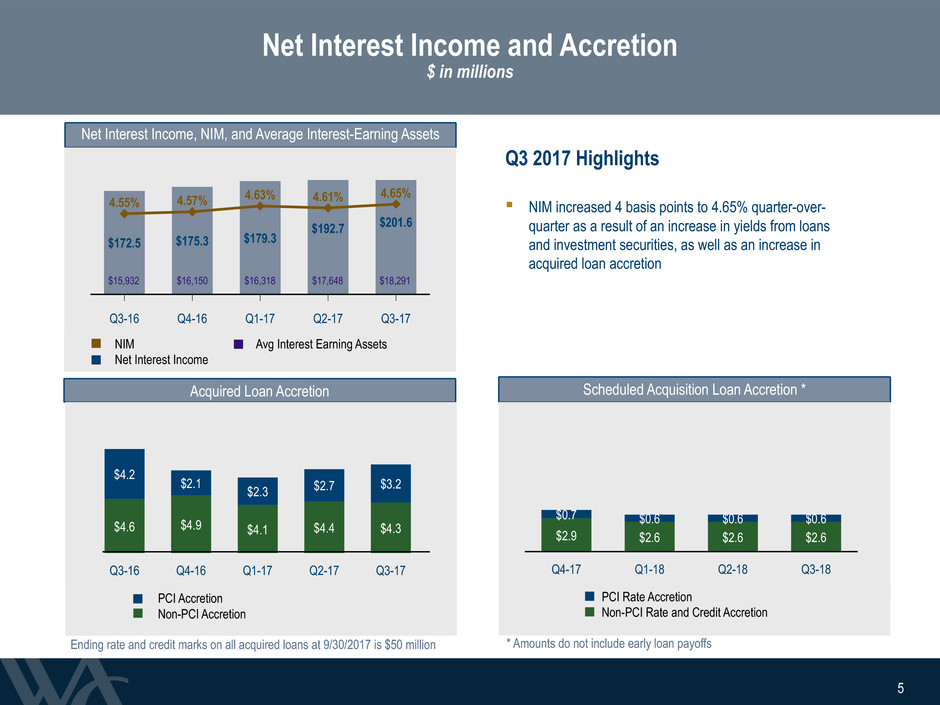
Net Interest Income and Accretion
$ in millions
Q3 2017 Highlights
▪ NIM increased 4 basis points to 4.65% quarter-over-
quarter as a result of an increase in yields from loans
and investment securities, as well as an increase in
acquired loan accretion
Net Interest Income, NIM, and Average Interest-Earning Assets
Acquired Loan Accretion
Q3-16 Q4-16 Q1-17 Q2-17 Q3-17
4.55% 4.57% 4.63% 4.61%
4.65%
$172.5 $175.3 $179.3
$192.7 $201.6
Non-PCI Accretion PCI Accretion
Q3-16 Q4-16 Q1-17 Q2-17 Q3-17
$4.6 $4.9 $4.1 $4.4 $4.3
$4.2 $2.1 $2.3 $2.7 $3.2
Scheduled Acquisition Loan Accretion *
Q4-17 Q1-18 Q2-18 Q3-18
$2.9 $2.6 $2.6 $2.6
$0.7 $0.6 $0.6 $0.6
* Amounts do not include early loan payoffsEnding rate and credit marks on all acquired loans at 9/30/2017 is $50 million
PCI Accretion
Non-PCI Accretion
PCI Rate Accretion
Non-PCI Rate and Credit Accretion
5
$18,291$17,648$16,318$16,150$15,932
NIM Avg Interest Earning Assets
Net Interest Income
6
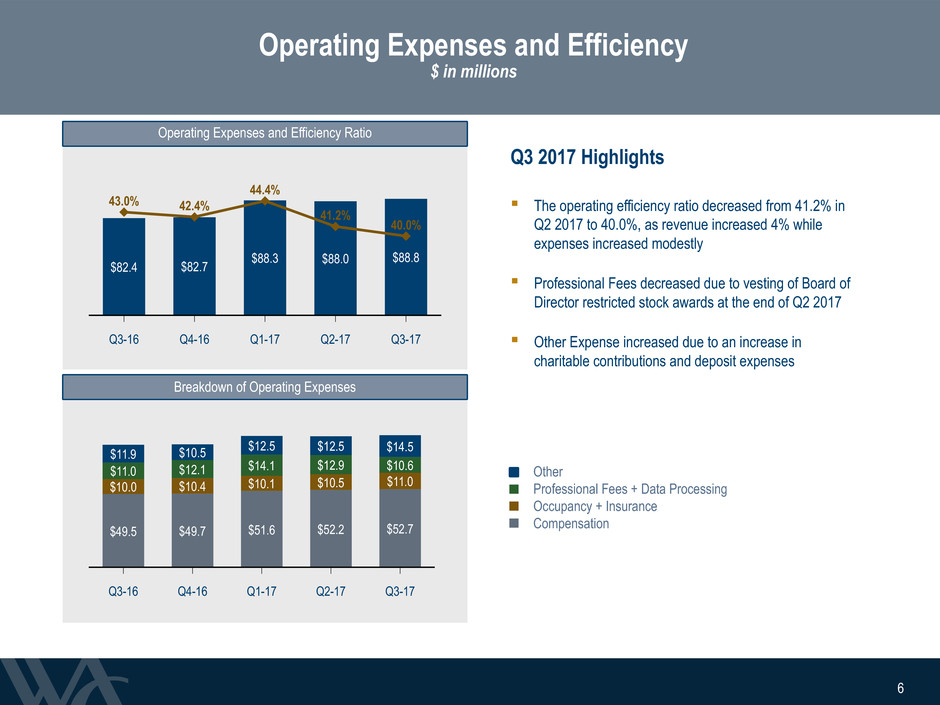
Q3-16 Q4-16 Q1-17 Q2-17 Q3-17
$49.5 $49.7 $51.6 $52.2 $52.7
$10.0 $10.4 $10.1 $10.5 $11.0
$11.0 $12.1 $14.1 $12.9 $10.6
$11.9 $10.5 $12.5 $12.5 $14.5
Operating Expenses and Efficiency
$ in millions
Q3 2017 Highlights
▪ The operating efficiency ratio decreased from 41.2% in
Q2 2017 to 40.0%, as revenue increased 4% while
expenses increased modestly
▪ Professional Fees decreased due to vesting of Board of
Director restricted stock awards at the end of Q2 2017
▪ Other Expense increased due to an increase in
charitable contributions and deposit expenses
Operating Expenses and Efficiency Ratio
Breakdown of Operating Expenses
Other
Professional Fees + Data Processing
Occupancy + Insurance
Compensation
Q3-16 Q4-16 Q1-17 Q2-17 Q3-17
43.0% 42.4%
44.4%
41.2%
40.0%
$82.4 $82.7 $88.3 $88.0
$88.8
6
7
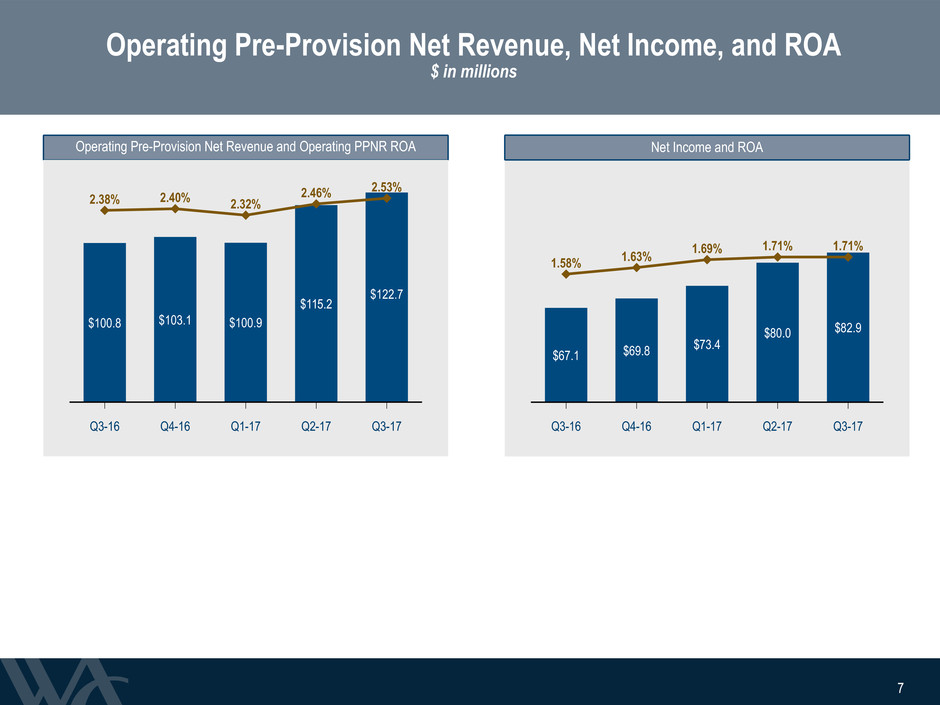
Q3-16 Q4-16 Q1-17 Q2-17 Q3-17
$67.1 $69.8
$73.4
$80.0 $82.9
1.58% 1.63%
1.69% 1.71% 1.71%
Operating Pre-Provision Net Revenue, Net Income, and ROA
$ in millions
Operating Pre-Provision Net Revenue and Operating PPNR ROA Net Income and ROA
Q3-16 Q4-16 Q1-17 Q2-17 Q3-17
$100.8 $103.1 $100.9
$115.2
$122.7
2.38% 2.40% 2.32%
2.46% 2.53%
7
8
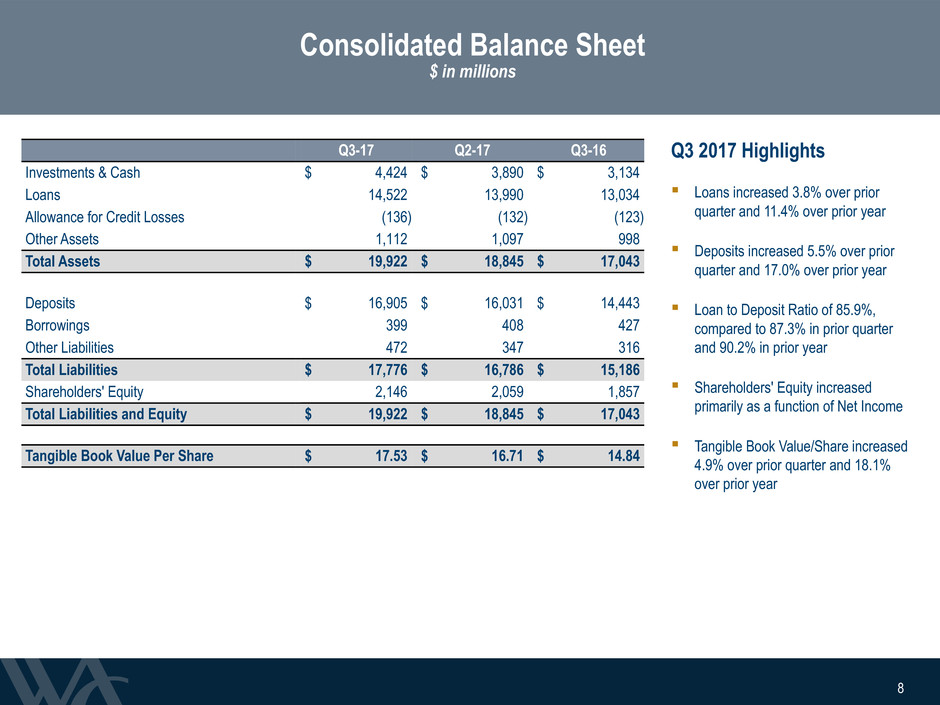
Consolidated Balance Sheet
$ in millions
▪ Loans increased 3.8% over prior
quarter and 11.4% over prior year
▪ Deposits increased 5.5% over prior
quarter and 17.0% over prior year
▪ Loan to Deposit Ratio of 85.9%,
compared to 87.3% in prior quarter
and 90.2% in prior year
▪ Shareholders' Equity increased
primarily as a function of Net Income
▪ Tangible Book Value/Share increased
4.9% over prior quarter and 18.1%
over prior year
Q3 2017 HighlightsQ3-17 Q2-17 Q3-16
Investments & Cash $ 4,424 $ 3,890 $ 3,134
Loans 14,522 13,990 13,034
Allowance for Credit Losses (136) (132) (123)
Other Assets 1,112 1,097 998
Total Assets $ 19,922 $ 18,845 $ 17,043
Deposits $ 16,905 $ 16,031 $ 14,443
Borrowings 399 408 427
Other Liabilities 472 347 316
Total Liabilities $ 17,776 $ 16,786 $ 15,186
Shareholders' Equity 2,146 2,059 1,857
Total Liabilities and Equity $ 19,922 $ 18,845 $ 17,043
Tangible Book Value Per Share $ 17.53 $ 16.71 $ 14.84
8
9
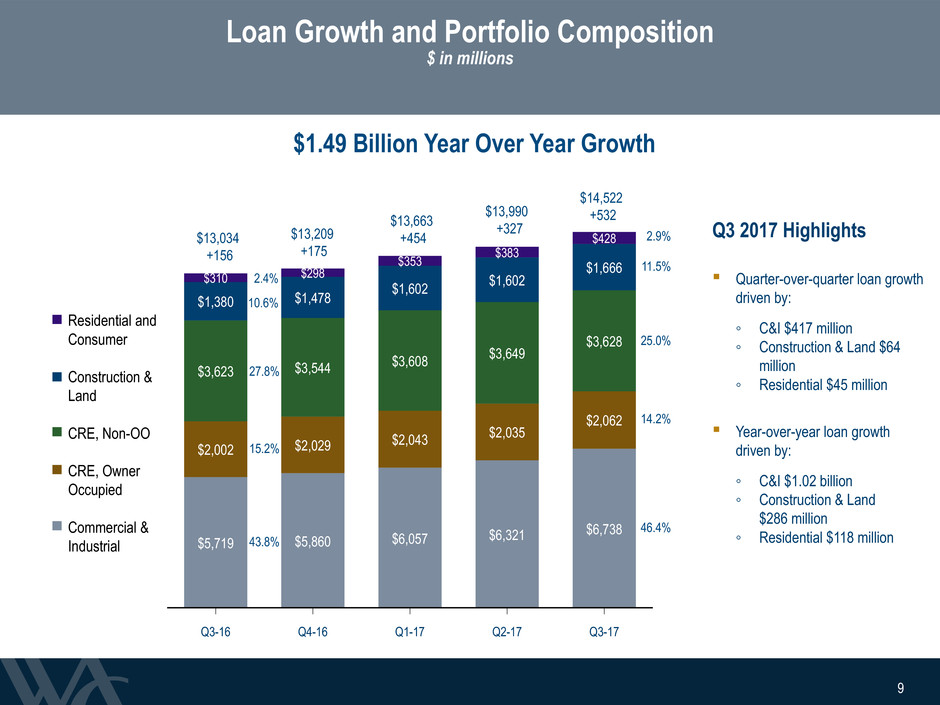
Loan Growth and Portfolio Composition
$ in millions
Q3 2017 Highlights
▪ Quarter-over-quarter loan growth
driven by:
◦ C&I $417 million
◦ Construction & Land $64
million
◦ Residential $45 million
▪ Year-over-year loan growth
driven by:
◦ C&I $1.02 billion
◦ Construction & Land
$286 million
◦ Residential $118 million
$1.49 Billion Year Over Year Growth
Q3-16 Q4-16 Q1-17 Q2-17 Q3-17
$5,719 $5,860 $6,057 $6,321
$6,738
$2,002 $2,029 $2,043
$2,035
$2,062
$3,623 $3,544 $3,608
$3,649
$3,628
$1,380 $1,478
$1,602 $1,602
$1,666
$310 $298
$353 $383
$428
2.4%
15.2%
27.8%
43.8%
10.6%
2.9%
14.2%
25.0%
46.4%
11.5%
Residential and
Consumer
Construction &
Land
CRE, Non-OO
CRE, Owner
Occupied
Commercial &
Industrial
$13,034
+156
$13,209
+175
$13,663
+454
$13,990
+327
$14,522
+532
9
10
Q3-16 Q4-16 Q1-17 Q2-17 Q3-17
$5,625 $5,633 $6,114
$6,859 $7,609
$1,257 $1,347
$1,449
$1,481
$1,406
$5,969 $6,121
$6,254
$6,104
$6,300
$1,592 $1,449
$1,539
$1,587
$1,590
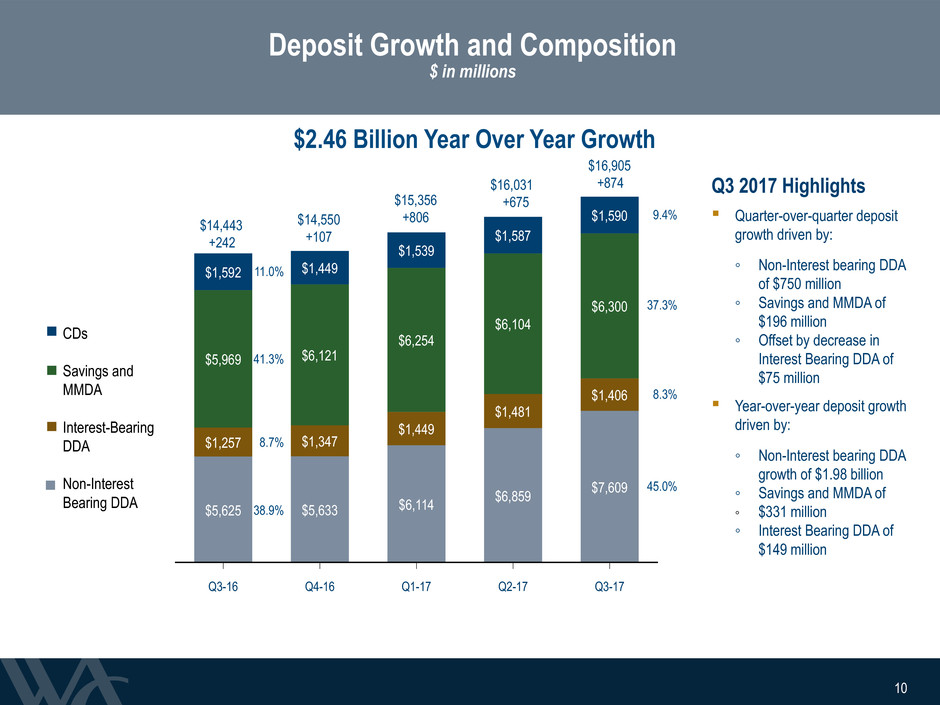
Deposit Growth and Composition
$ in millions
Q3 2017 Highlights
▪ Quarter-over-quarter deposit
growth driven by:
◦ Non-Interest bearing DDA
of $750 million
◦ Savings and MMDA of
$196 million
◦ Offset by decrease in
Interest Bearing DDA of
$75 million
▪ Year-over-year deposit growth
driven by:
◦ Non-Interest bearing DDA
growth of $1.98 billion
◦ Savings and MMDA of
◦ $331 million
◦ Interest Bearing DDA of
$149 million
8.7%
11.0%
38.9%
41.3%
8.3%
9.4%
45.0%
37.3%
$2.46 Billion Year Over Year Growth
CDs
Savings and
MMDA
Interest-Bearing
DDA
Non-Interest
Bearing DDA
$15,356
+806 $14,550
+107
$14,443
+242
$16,031
+675
$16,905
+874
10
11
Adversely Graded Assets to Total Assets
NPAs to Total Assets
Q3-16 Q4-16 Q1-17 Q2-17 Q3-17
2.03% 2.07%
2.25%
2.04% 2.12%
0.53% 0.51% 0.44% 0.32% 0.42%
OREO Non-Performing Loans
Classified Accruing Loans Special Mention Loans
Q3-16 Q4-16 Q1-17 Q2-17 Q3-17
$50 $48 $45 $31 $29
$41 $40 $34 $30 $55
$110 $107 $133 $166 $122
$134 $148
$175 $141 $200
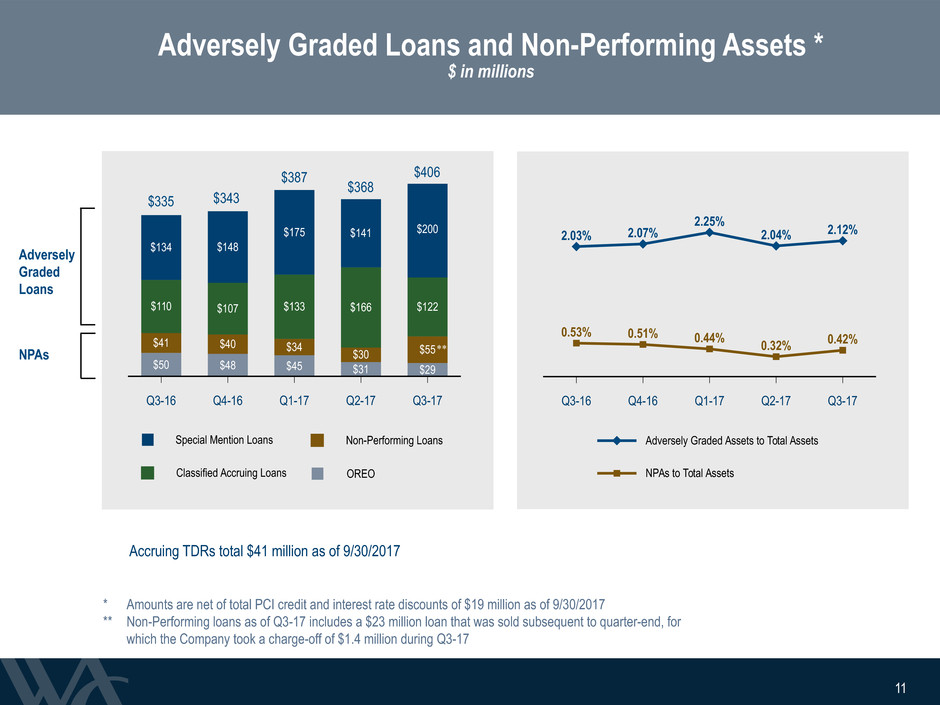
Adversely Graded Loans and Non-Performing Assets *
$ in millions
NPAs
Adversely
Graded
Loans
$368
Accruing TDRs total $41 million as of 9/30/2017
$335 $343
$387 $406
* Amounts are net of total PCI credit and interest rate discounts of $19 million as of 9/30/2017
** Non-Performing loans as of Q3-17 includes a $23 million loan that was sold subsequent to quarter-end, for
which the Company took a charge-off of $1.4 million during Q3-17
11
Special Mention Loans
OREO
**
12
Gross Charge-Offs Recoveries
Net Charge-Off (Recovery) Rate
Q3-16 Q4-16 Q1-17 Q2-17 Q3-17
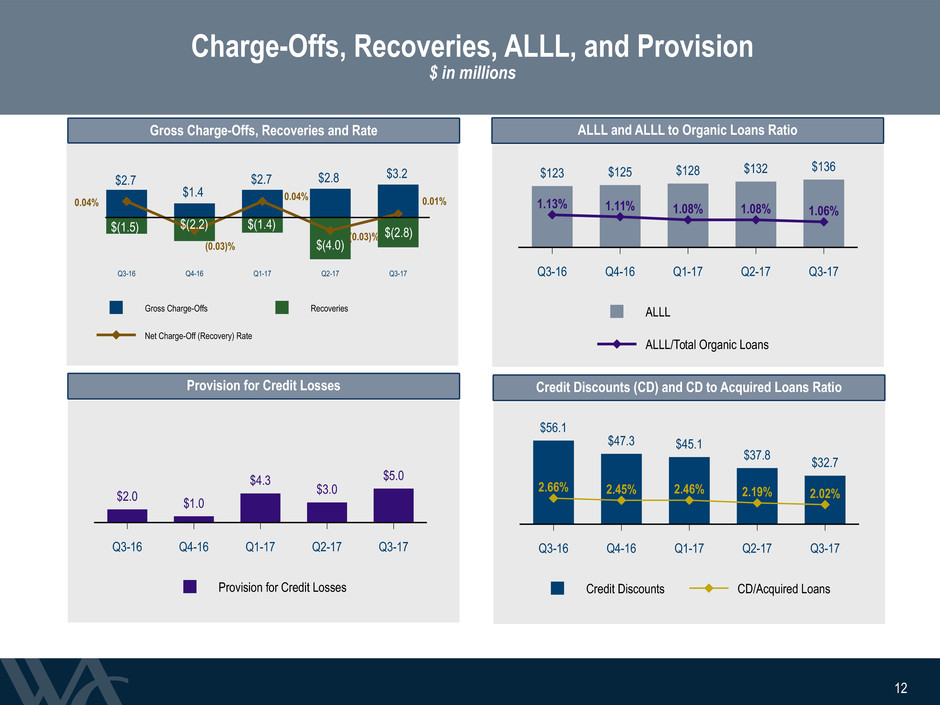
Charge-Offs, Recoveries, ALLL, and Provision
$ in millions
Gross Charge-Offs, Recoveries and Rate
Provision for Credit Losses
ALLL
ALLL/Total Organic Loans
Q3-16 Q4-16 Q1-17 Q2-17 Q3-17
$123 $125 $128 $132 $136
1.13% 1.11% 1.08% 1.08% 1.06%
ALLL and ALLL to Organic Loans Ratio
12
$1.4
$2.7
$(2.2)
$(4.0)
$(1.5) $(1.4)
$3.2
$(2.8)
(0.03)%
0.04% 0.04% 0.01%
(0.03)%
Credit Discounts CD/Acquired Loans
Q3-16 Q4-16 Q1-17 Q2-17 Q3-17
$56.1
$47.3 $45.1
$37.8 $32.7
2.66% 2.45% 2.46% 2.19% 2.02%
Credit Discounts (CD) and CD to Acquired Loans Ratio
$2.8 $2.7
Provision for Credit Losses
Q3-16 Q4-16 Q1-17 Q2-17 Q3-17
$2.0 $1.0
$4.3 $3.0
$5.0
13
ROTCE TBV/Share
Q3-16 Q4-16 Q1-17 Q2-17 Q3-17
17.5% 17.6%
17.8%
18.4%
18.2%
$14.84 $15.17
$15.86 $16.71
$17.53
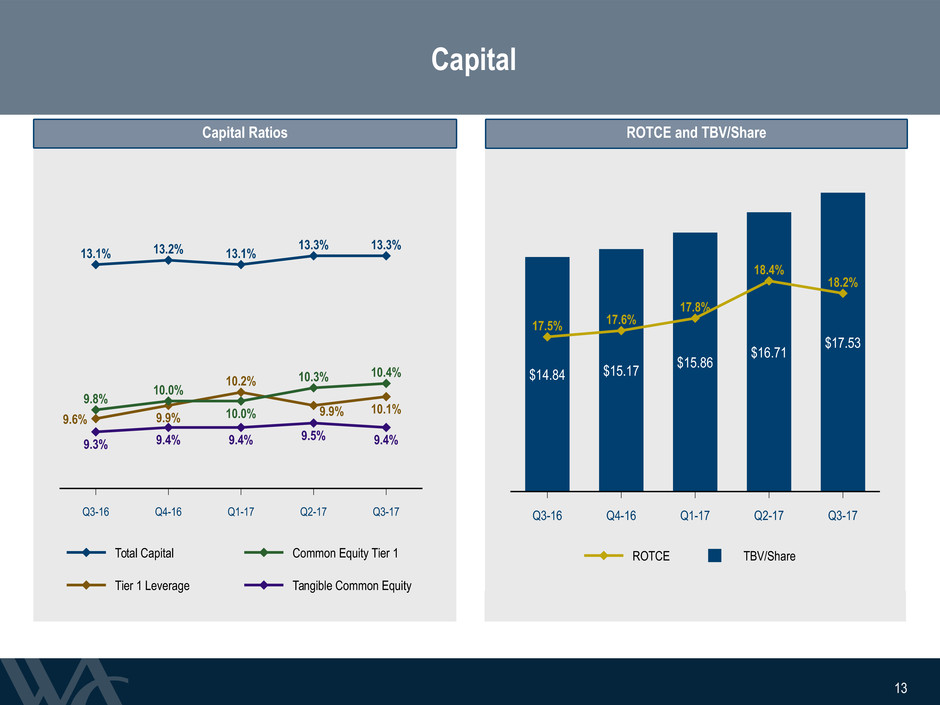
Capital
Total Capital Common Equity Tier 1
Tier 1 Leverage Tangible Common Equity
Q3-16 Q4-16 Q1-17 Q2-17 Q3-17
13.1% 13.2% 13.1% 13.3% 13.3%
9.8% 10.0%
10.0%
10.3% 10.4%
9.6% 9.9%
10.2%
10.1%
9.3% 9.4% 9.4% 9.5% 9.4%
Capital Ratios ROTCE and TBV/Share
13
9.9%
14
Management Outlook
14
▪ Financial Position
▪ Revenue
▪ Expenses
▪ Asset Quality

Questions
&
Answers
16
Forward-Looking Statements
16
This presentation contains forward-looking statements that relate to expectations, beliefs, projections, future plans and strategies,
anticipated events or trends, and similar expressions concerning matters that are not historical facts. Examples of forward-looking
statements include, among others, statements we make regarding our expectations with regard to our business, financial and operating
results, and future economic performance. The forward-looking statements contained herein reflect our current views about future
events and financial performance and are subject to risks, uncertainties, assumptions, and changes in circumstances that may cause
our actual results to differ significantly from historical results and those expressed in any forward-looking statement. Some factors that
could cause actual results to differ materially from historical or expected results include, among others: the risk factors discussed in
the Company’s Annual Report on Form 10-K for the year ended December 31, 2016 as filed with the Securities and Exchange
Commission; changes in general economic conditions, either nationally or locally in the areas in which we conduct or will conduct our
business; inflation, interest rate, market and monetary fluctuations; increases in competitive pressures among financial institutions and
businesses offering similar products and services; higher defaults on our loan portfolio than we expect; changes in management’s
estimate of the adequacy of the allowance for credit losses; legislative or regulatory changes or changes in accounting principles,
policies, or guidelines; supervisory actions by regulatory agencies which may limit our ability to pursue certain growth opportunities,
including expansion through acquisitions; additional regulatory requirements resulting from our continued growth; management’s
estimates and projections of interest rates and interest rate policy; the execution of our business plan; and other factors affecting the
financial services industry generally or the banking industry in particular.
Any forward-looking statement made by us in this presentation is based only on information currently available to us and speaks
only as of the date on which it is made. We do not intend to have and disclaim any duty or obligation to update or revise any industry
information or forward-looking statements, whether written or oral, that may be made from time to time, set forth in this presentation
to reflect new information, future events or otherwise.
