Attached files
| file | filename |
|---|---|
| EX-99.3 - EX-99.3 - WARRIOR MET COAL, INC. | d478338dex993.htm |
| EX-99.1 - EX-99.1 - WARRIOR MET COAL, INC. | d478338dex991.htm |
| 8-K - 8-K - WARRIOR MET COAL, INC. | d478338d8k.htm |
Exhibit 99.2
On April 12, 2017, we completed a corporate conversion pursuant to which Warrior Met Coal, LLC was converted into a Delaware corporation and renamed Warrior Met Coal, Inc., as described under “Corporate Conversion.” We refer to this transaction herein as the “corporate conversion.” Except as otherwise indicated or required by the context, all references in this offering circular to the “Company,” “Warrior,” “we,” “us,” “our” or “Successor” relate to (1) Warrior Met Coal, LLC, a Delaware limited liability company, and its subsidiaries for periods beginning as of April 1, 2016 and ending immediately before the completion of our corporate conversion, and (2) Warrior Met Coal, Inc., a Delaware corporation, and its subsidiaries for periods beginning with the completion of our corporate conversion and thereafter. References in this offering circular to the “Predecessor” refer to the assets acquired and liabilities assumed by Warrior Met Coal, LLC from Walter Energy, Inc., a Delaware corporation (“Walter Energy”), in the Asset Acquisition on March 31, 2016, as further described below under “—Corporate History and Structure—Walter Energy Restructuring.” The Predecessor periods included in this offering circular begin as of January 1, 2015 and end as of March 31, 2016. “Met coal,” “hard coking coal” or “coking coal” as used in this offering circular means metallurgical coal. We have provided definitions for some of the other industry terms used in this offering circular in the “Glossary of Selected Terms” included elsewhere in this offering circular as Appendix A.
Warrior Met Coal, Inc.
Our Business
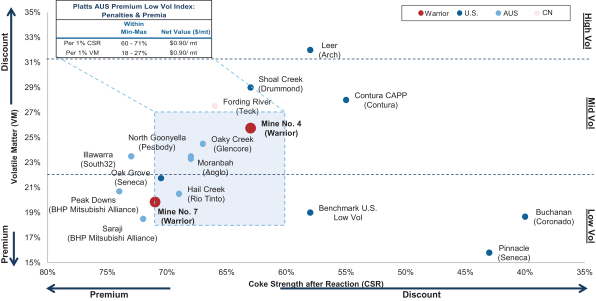
We are a large scale, low-cost U.S.-based producer and exporter of premium met coal operating two highly productive underground mines in Alabama, Mine No. 4 and Mine No. 7, that have an estimated annual production capacity of 7.3 million metric tons of coal. We sell a premium met coal product to leading steel manufacturers in Europe and South America. According to Wood Mackenzie, for 2017, we are expected to be the largest seaborne met coal supplier in the Atlantic Basin, and a top ten supplier to the global seaborne met coal market. As of December 31, 2016, based on a reserve report prepared by Marshall Miller, our two operating mines had approximately 107.8 million metric tons of recoverable reserves and, based on a reserve report prepared by Norwest, our undeveloped Blue Creek Energy Mine contained 103.0 million metric tons of recoverable reserves. As a result of its high coke strength after reaction (“CSR”) and low volatile matter (“VM”), the hard coking coal (“HCC”) we produce at Mine No. 4 and Mine No.7 is of a similar quality to the premium HCC produced in Australia. This allows us to achieve higher price realizations for our product relative to other North American HCC producers who produce lower quality products with higher VM and lower CSR.
1
Source: Platts, AME, Warrior management estimates
Note: 1 short ton is equivalent to 0.907185 metric tonnes.
Our operations generate industry-leading margins when compared to other publicly-listed U.S. coal companies. According to public filings of these companies, for the six months ended June 30, 2017, we had the highest operating margins among these companies.
We believe our high margins are the result of a combination of factors, including our ability to achieve high price realizations, our first quartile cost position, and, our close proximity to the Port of Mobile, Alabama as well as our seaborne freight advantage to reaching our primary end markets:
| • | Our HCC, mined from the Southern Appalachian region of the United States, is characterized by low-to-medium VM and high CSR. These qualities make our coal ideally suited as a coking coal for the manufacture of steel. As a result of our high quality coal, our realized price has historically been in line with, or at a slight discount to, the Australian premium low-vol HCC benchmark (“Australian HCC Benchmark”). In contrast, coal produced in the Central Appalachian region of the United States is typically characterized by medium-to-high VM and a CSR that is below the requirements of the Australian HCC Benchmark. Our 2016 average gross realized price was 99% of the Australian HCC Benchmark, excluding the effect of tons |
2
| contracted for sale in prior quarters. This is in significant contrast to other U.S. met coal producers, which we believe sell a relatively higher proportion of lower rank coals. |
Premium product with industry-leading realizations (2016 average realizations vs. benchmark HCC price)1
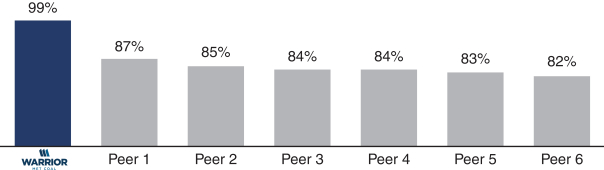
| 1 | Peer information based on management estimates as well as public disclosure as adjusted for mine-to-port transportation estimates from Wood Mackenzie. |
| • | Our operations utilize longwall mining techniques, which is the most productive coal mining method available, and allows mining at the lowest cost per ton. We are able to utilize longwall mining as a result of the medium to thick coal seams of Mine No. 4 and Mine No. 7. Additionally, our operations benefit from a highly competitive initial Collective Bargaining Agreement (“CBA”) with the United Mine Workers of America (“UMWA”), which has enabled us to structurally reduce our cash costs. According to Wood Mackenzie, we are one of the lowest cost U.S. seaborne producers of met coal: |
One of the Lowest Cost U.S Seaborne Met Producers1
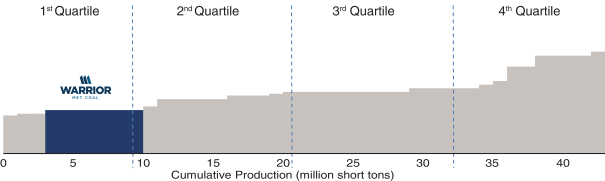
| 1 | 2017E mine-to-port transportation costs for U.S. seaborne met coal producers based on estimates from Wood Mackenzie. |
| • | Our two operating mines are located approximately 300 miles from our export terminal at the Port of Mobile, Alabama, which we believe to be the shortest mine-to-port distance of any U.S.-based met coal producer. Our low cost, flexible and efficient rail and barge network underpins our cost advantage and dependable access to the seaborne markets. We sell our coal to a diversified customer base of blast furnace steel producers, primarily located in Europe and South America. We enjoy a shipping time and distance advantage serving our customers throughout the Atlantic Basin relative to competitors located in Australia and Western Canada. |
3
We also benefit from a highly flexible cost structure that allows us to react to market conditions to ensure we remain profitable in different HCC price environments. Our initial CBA includes variable elements that tie compensation to HCC prices and production targets. Furthermore, in the event of lower coal prices, we have a variable transportation cost structure that results in lower cash requirements. We believe the step-down in costs and greater variability in our cost structure allows our operations to respond to adverse price environments and generate strong cash flows through-the-cycle.
For the twelve months ended June 30, 2017, on a pro forma basis, our operations generated revenues of $823.5 million, net income of $229.9 million and Adjusted EBITDA of $366.0 million. For a definition of Adjusted EBITDA and a reconciliation to our most directly comparable financial measure calculated and presented in accordance with GAAP, please read “Summary Consolidated and Combined Historical and Pro Forma Financial Data—Non-GAAP Financial Measures—Adjusted EBITDA.”
Our Competitive Strengths
We believe that we have the following competitive strengths:
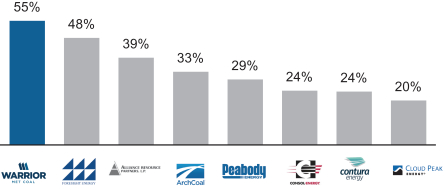
Leading met coal producer focused on premium met coal products. Unlike other publicly-listed U.S. coal companies, substantially all of our revenue is derived from the sale of premium met coal in the global seaborne markets. All of our resources are primarily allocated to the mining, transportation and marketing of met coal. The premium HCC we produce at Mine No. 4 and Mine No. 7 is of a similar quality to the HCC produced in Australia. The premium nature of our HCC makes it ideally suited as a base feed coal for steel makers and results in price realizations near or above the Australian HCC Benchmark. Coal from Mine No. 7 is classified as a premium low-volatility HCC and coal from Mine No. 4 is classified as premium mid-volatility HCC. The combination of low sulfur, low-to-medium ash, low-to-medium volatility, and other characteristics of our coal, as well as our ability to blend them, makes our HCC product an important component within our customers’ overall coking coal requirements. As a result, our realized price has historically been in line with or at a slight discount to the Australian HCC Benchmark or, more recently, at a slight premium to the industry index average. Other publicly-listed U.S. coal companies sell a higher proportion of lower rank met coals, including high-volatility, semi-soft coking coal (“SSCC”), and pulverized coal injection (“PCI”) coal. These lower rank coals typically have lower realized prices compared to low- and mid-volatility met coals due to their relative availability and lower quality characteristics. For example, the premium low-volatility HCC that we produce has sold at a premium of 2%, 14%, 30% and 47% of the prices realized for mid-volatility, high-volatility, PCI and SSCC coals, respectively, based on five-year average prices. Additionally, these companies typically have significant thermal coal production that further reduces their realized price and operating margin per metric ton. As a result of our premium met coal, we are able to achieve higher realized prices and operating margins relative to other U.S. met coal producers.
4
2017E Projected Met Coal Production(1)
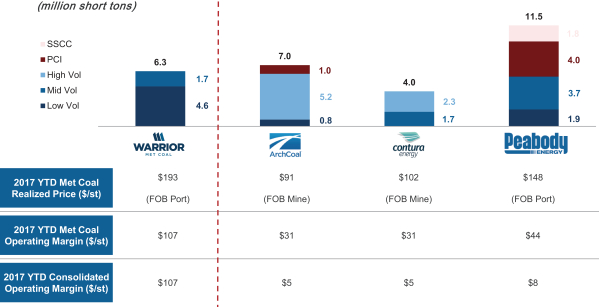
Source: Company filings, AME, Warrior management estimates
Note: Met coal realized price, met coal operating margin and consolidated operating margin shown as of June 30, 2017 YTD. Contura based on 2016 results as they appear in S-1 filing. CAPP segment used for Contura to represent met coal exposure. 1 short ton is equivalent to 0.907185 metric tonnes. FOB mine for Contura based on domestic sales contracts discussed in S-1 filing.
| (1) | Projected production shown for Warrior and Arch while projected sales shown for Contura and Peabody. Total production and sales volume based on company guidance. Warrior coal type based on 2017YTD and extrapolated to 2017 expected production. Arch coal type based on 2016 tons sold and extrapolated to 2017 expected production. Contura coal type based on Jul-2016 to Dec-2016 tons sold and extrapolated to 2017 expected sales. |
Highly flexible cost structure protects through-the-cycle profitability. We have “variabilized” our cost structure in our labor and logistics contracts, increasing the proportion of our cost structure that varies in response to changes in benchmark HCC prices. Our initial CBA, combined with our flexible rail, port and barge logistics and our royalty structure, results in a highly variable operating cost profile that allows our cash cost of sales to move with changes in the price we realize for our coal. Approximately two-thirds of our cash cost of sales relate to the cost of production at our mines, while the remaining one-third relates to our logistics costs from mine to port as well as royalties. Our logistics costs are structured to reduce cash requirements in lower HCC price environments and to increase cash requirements within a range with higher HCC prices. Our royalties are calculated as a percentage of the price we realize and therefore increase or decrease with changes in HCC prices. Our initial CBA includes variable elements that tie compensation to HCC prices. In addition, we can adjust our usage of continuous miner units in response to HCC pricing. Our variable cost structure dramatically lowers our cash cost of sales if our realized price falls, while being effectively capped in higher price environments allowing us to generate significant operating cash flow. Our highly flexible cost structure provides us with a key competitive advantage relative to our competitors and which we expect should allow us to remain profitable in all coal market conditions. For example, at HCC benchmark prices of $198 and $130 per short ton, we expect to realize illustrative operating margins of 54% and 35%, respectively.
5
Illustrative Run Rate Cash Cost of Sales(2) at the Port of Mobile ($ / short ton) across Various HCC Benchmark Prices from $91/st to $181/st
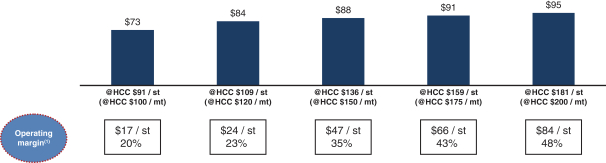
Note: 1 short ton is equivalent to 0.907185 metric tonnes.
| (1) | Operating margin assumes 99% realization of benchmark price. |
| (2) | Cash cost of sales includes cost of producing and selling met coal free-on-board at the Port of Mobile. |
Significant logistical cost advantage to the seaborne market. Our two operating mines are located approximately 300 miles from our export terminal capacity in Mobile, Alabama and have multiple alternative transportation routes to move our coal to port. These alternatives include direct rail access at the mine sites and a wholly-owned barge load-out facility, enabling us to utilize the lowest cost option between the two at any given point in time. We believe our logistics costs are highly competitive following negotiations in 2016 that led to a reduction in rail, barge and port costs. In addition, we have a contract with the Port of Mobile, Alabama, that provides us up to 8.0 million metric tons of annual port capacity through July 2026 for our coal at very competitive rates. The total annual capacity of the McDuffie Coal Terminal at the Port of Mobile, Alabama is approximately 27.2 million metric tons and this coal terminal is presently utilized for all of our coal exports. Our proximity to port contrasts with the approximately 400-mile distances for major Central Appalachian met coal producers to access their nearest port, the Port of Hampton Roads, Virginia. Our proximity to port and the flexibility of our logistics networks underpin our logistical cost advantage compared to other U.S. met coal producers.
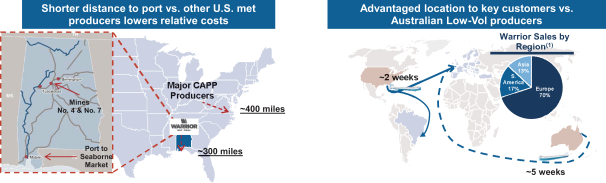
Source: Wood Mackenzie
Note: 1 short ton is equivalent to 0.907185 metric tonnes. “Major CAPP Producers” include the Central Appalachian mines projected by Wood Mackenzie to produce over 1 million metric tonnes of metallurgical coal in 2017. Distances for competitor mine to port distances estimated using Google Maps.
| (1) | Year-to-date sales by region as of 6/30/17. |
6
We sell our coal to a diversified customer base of blast furnace steel producers, primarily located in Europe and South America. We enjoy a shipping time and distance advantage serving customers throughout the Atlantic Basin relative to competitors located in Australia and Western Canada. This advantage results in a higher margin for our met coal. We believe that we are uniquely advantaged to sell to our primary European customer base relative to other North American met coal producers due to (i) the superior quality and higher strength of the coal produced at our Mine No. 4 and Mine No. 7; and (ii) our freight cost advantage from the Port of Mobile, Alabama, which, according to Wood Mackenzie, enables us to deliver our product to the European market in approximately two weeks, in contrast to the approximately five weeks required to ship HCC from Australia to the European market. We are similarly able to access key Brazilian ports in two weeks. Our strategic location is enhanced by our long-tenured, well-established customer portfolio, which includes significant recurring sales to multiple customers in excess of 10 years.
High realized prices and low cost structure drive industry leading margins. Our operations have industry-leading margins as a result of our premium met coal products, and associated high price realizations, as well as our first quartile cost position. According to data compiled by EVA, for the six months ending June 30, 2017, we had the highest operating and EBITDA margins among all publicly-listed U.S. coal producers. The coal from our mines is competitive in quality with the premium HCC produced in Australia, which is used to set quarterly benchmark pricing for the industry. The combination of low sulfur, low-to-medium ash, low-to-medium volatility and high coking strength drives our consistently high price realization relative to other U.S. met coal producers who typically focus on lower rank met coals. We believe Mine No.4 and Mine No. 7 are two of the lowest cost met coal mines in North America. Our low cost position is derived from our operations’ favorable geology, automated long-wall mining methods, and significant flexibility allowed under our initial CBA. Additionally, given our highly flexible cost structure, we believe we will be able to maintain our industry leading margins in all coal market conditions, which we expect should allow us to outperform our competitors.
High realized prices and low cost structure drive industry-leading margins (YTD EBITDA Margin)(1)
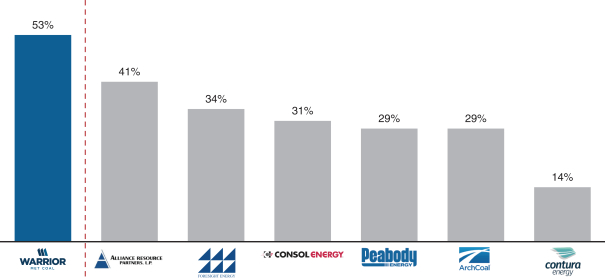
Source: Peer company Adjusted EBITDA for Q2 2017 as appears in each peer company’s public filings (note Peabody excludes brokerage and trading operations and Contura is based on FY 2016 results). Reference each peer company’s public filings for corresponding presentation of Adjusted EBITDA. Adjusted EBITDA is a non-GAAP financial measure. Each peer company’s calculation of Adjusted EBITDA may not be directly comparable.
7
| 1 | Adjusted EBITDA Margin represents each peer company’s Adjusted EBITDA divided by its total revenue or sales. |
Clean balance sheet and tax asset to drive robust cash flow generation. Unlike other U.S. coal producers, we have no pension or OPEB legacy liabilities with manageable surety bond requirements. With minimal legacy liabilities, we are not burdened by the annual fixed obligations that are typically associated with these types of liabilities. Our clean balance sheet and its low sustaining capital expenditure requirements position the Company to generate strong cash flows across a range of met coal price environments. Additionally, we expect our cash flows to benefit from a low effective tax rate as a result of our significant net operating loss carryforwards (“NOLs”). As a result of these tax assets, we believe our effective income tax rate will be approximately 2% until our NOLs are fully utilized, which will enable strong cash conversion from our operating profits.
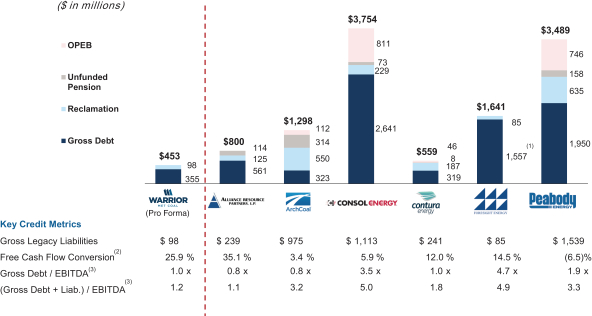
Source: Company Filings as of June 30, 2017 except as noted below.
Note: Warrior free cash flow conversion inclusive of pro forma interest expense for the transaction. All data sourced from most recently available 10-K or 10-Q filings, with the exception of Contura (sourced from S-1 / A; dated 7/31/2017). Annual interest expense for Arch Coal and Peabody Energy pro forma for newly announced deal terms (Arch reduction of margin on first-lien by 75bps as of 9/21/17 and Peabody reduction of spread on TLB from L+450 to L+350).
| 1 | Includes Foresight’s sale-leasebacks. |
| 2 | Calculated as Free Cash Flow (Adjusted EBITDA – Interest Exp. – Capex +/- Other Cash Flow Items)/Total Revenues |
| 3 | Calculated as of the last twelve months ended June 30, 2017. Adjusted EBITDA used from company filings, each company applies nuances in calculating Adjusted EBITDA. Liabilities includes OPEB, pension, and reclamation. |
Disciplined financial policies to ensure stable performance. We believe maintaining financial discipline will provide us with the ability to manage the volatility in our business resulting from changes in met coal prices. We intend to preserve a strong and conservative balance sheet, with sufficient liquidity and financial flexibility to support our operations. As such, we will seek to maintain a conservative financial leverage target of 1.50-2.00x based on normalized EBITDA and seek to maintain minimum liquidity of $100 million. We plan to continually evaluate our liquidity needs based on our estimated capital needs. Pro forma for this offering and the use of proceeds therefrom as described elsewhere in this offering memorandum, we will have approximately $115.2 million of available liquidity (consisting of $100 million of borrowing capacity under the ABL Facility and $15.2 million of cash and cash equivalents). In the event we generate cash flow in excess of the needs of our business, we plan to take a holistic approach to capital allocation and will evaluate a range of options, including debt
8
repayment. We will seek to preserve our capital structure with low financial leverage that is largely free from legacy liabilities in order to ensure maximum free cash flow generation.
Highly experienced leadership team with deep industry expertise. Our Chief Executive Officer (“CEO”), Walter J. Scheller, III, is the former CEO of Walter Energy and has six years of direct experience managing Mine No. 4 and Mine No. 7, and over 30 years of experience in longwall coal mining. Furthermore, following the Asset Acquisition, we hired several key personnel with extensive direct operational experience in met coal longwall mining, including our Chief Operating Officer, Jack Richardson, and our Chairman, Stephen D. Williams. We have a strong record of operating safe mines and are committed to environmental excellence. Our dedication to safety is at the core of all of our overall operations as we work to further reduce workplace incidents by focusing on policy awareness and accident prevention. Our continued emphasis on enhancing our safety performance has resulted in zero fatal incidents as compared to the national fatal incidence rate for underground coal mines in the United States of 0.02 for the six months ended June 30, 2017 as well as total reportable incidence rates of 3.54 at Mine No. 4 and 3.21 at Mine No. 7 for the six months ended June 30, 2017, which are considerably lower than the national total reportable incidence rate for all underground coal mines in the United States of 5.02 for the six months ended June 30, 2017.
Our Business Strategies
Our business strategies are described below:
Maximize profitable production. In the year ended December 31, 2016, we produced 3.1 million metric tons of met coal, predominantly from Mine No. 7, as we temporarily idled our Mine No. 4 in early 2016. In the six months ended June 30, 2017, we produced 3.2 million metric tons from Mine No. 7 and Mine No. 4. We have the flexibility in our new initial CBA that allows us to increase annual production with relatively modest incremental capital expenditures. We operated at an annual combined production level of 7.3 million metric tons from Mine No. 4 and Mine No. 7 as recently as 2013. Based on our management’s operational experience, we are confident in our ability to produce at or close to this capacity in a safe and efficient manner, and with a comparable cost profile to our current costs, should market conditions warrant.
Maintain and further improve our low-cost operating cost profile. While we have already achieved significant structural cost reductions at our two operating mines, we see further opportunities to reduce our costs over time. Our initial CBA with the UMWA allows for these ongoing cost optimization initiatives. For example, in our initial CBA, we have additional flexibility in our operating days and alternative work schedules as compared to certain optional and more expensive provisions under the Walter Energy collective bargaining agreement. We have variable elements that tie compensation to HCC prices. Additionally, our CBA enables us to contract out work under certain circumstances. We believe these types of structural incentive provisions and workforce flexibility in the initial CBA are helpful to further align our organization with operational excellence and to increase the proportion of our costs that vary in response to changes in the HCC price.
Broaden our marketing reach and maintain strong correlation between realized coal prices and HCC benchmark. We have implemented a strategy to improve both our sales and marketing focus, with a goal of achieving better pricing relative to the HCC industry index average price, which includes: (i) opportunistic selling into the spot met coal market and (ii) selected instances of entering into longer term fixed price contracts. Each of these elements is intended to further embed our coal product among a broader group of steel customers. Traditionally, we have predominantly marketed our coal to European and South American buyers. However, we expect to increase our focus on Asian
9
customers, in particular, Japanese steel mills, some of which have expressed a desire to diversify their supply of premium HCC away from Australian coals. Year-to-date as of June 30, 2017, our geographic customer mix is 70% in Europe, 17% in South America and 13% in Asia. We have an arrangement with Xcoal Energy & Resource (“Xcoal”) to serve as Xcoal’s strategic partner for exports of low volatility HCC. Under this arrangement, Xcoal takes title to and markets coal that we would historically have sold on the spot market, in an amount of the greater of (i) 10% of our total production during the applicable term of the arrangement or (ii) 250,000 metric tons. While the volumes being sold through this arrangement with Xcoal are relatively limited, we are positioned to potentially benefit from Xcoal’s expertise and relationships across all coal that we sell. To that end, we also have an incentive-based arrangement with Xcoal to cover other tonnage, in the event Xcoal is able to offer us a higher realized price relative to the HCC industry index average than we have previously achieved.
Met Coal Industry Overview
Met coal, which is converted to coke, is a critical input in the steel production process. In particular, coke is used as a fuel and a reducing agent in steel blast furnaces to convert iron ore to iron and subsequently to create steel. Met coal is a form of hard bituminous coal, which is distinct from softer bituminous and non-bituminous forms of coal that are used to generate electricity.
According to Wood Mackenzie, global steel production is estimated to be 1,699 million metric tons in 2017, which is a 4.2% increase from 2016 and a 3.3% increase from 2013. Future growth in global steel demand and production will be largely driven by infrastructure investment and urbanization in developing markets, particularly China and India which are expected to account for 49.6% and 5.9% of global steel production in 2017, respectively, according to Wood Mackenzie. Global steel consumption and production will also be impacted by infrastructure improvement in developed countries, in particular the United States. Steel production in the United States was 78.5 million metric tons in 2016, representing a 0.5% decrease from 2015 and an 11.5% decrease from recent peak production in 2012 according to Wood Mackenzie. Approximately 33.4% of 2016 steel production in the United States, or 26.2 million metric tons, was manufactured using blast furnaces according to Wood Mackenzie. Further, Wood Mackenzie forecasts global steel production to grow from current levels to 1,761 million metric tons in 2021, a 3.7% increase, with CAGRs of 0%, 1%, 2%, 0%, 0% and 2% in Japan, Europe, India, China, South Korea and Brazil, respectively.
| Steel production (Millions of metric tons) |
2017E | |||
| China |
843 | |||
| Europe |
206 | |||
| Japan |
104 | |||
| India |
99 | |||
| South Korea |
70 | |||
| Brazil |
35 | |||
| Other |
342 | |||
| Total |
1,699 | |||
Source: Wood Mackenzie.
According to Wood Mackenzie, approximately 74.2% of the world’s steel production in 2016, or 1,211 million metric tons, was estimated to be manufactured using blast furnaces. Three major types of met coal are produced globally with varying characteristics: HCC, semi soft coking coal (“SSCC”) and pulverized coal for injection (“PCI”). Unlike SSCC and PCI, HCC currently has no substitutes and must be used in the production of steel by the blast furnace method. For each type of coal, various
10
specifications can affect price, including the volatility, strength, fluidity, swell and ash content. HCC with low volatile matter and limited swell is required for blending with coal with less desirable qualities.
Met coal, and in particular HCC, is a scarce commodity with large scale mineable deposits limited to specific geographic regions located in the Eastern United States, Western Canada, Eastern Australia, Russia, China, Mozambique and Mongolia. Collectively, these countries are estimated to have represented 95.7% of global met coal production in 2016 according to Wood Mackenzie. Global met coal production is estimated to have been 1,070 million metric tons in 2016, of which only 597 million metric tons, or 55.8%, was classified as HCC, according to Wood Mackenzie. Of this amount, Wood Mackenzie estimates that 192 million metric tons of HCC were traded on the seaborne market. Wood Mackenzie estimates the global met coal market to reach 1,087 million metric tons in 2017, 27% of which is expected to be traded on the seaborne market.
Met coal trades in a global seaborne market and in domestic markets in areas of China and the United States where coal mines are located closer to regional suppliers than ocean ports. According to Wood Mackenzie, seaborne trade of met coal is expected to be 292 million metric tons in 2017, 61% of which is classified as HCC, with a modest expected increase to 295 million metric tons by 2021. The United States is an important met coal supplier to the seaborne export market, and is the second largest supplier behind Australia. For 2017, Wood Mackenzie estimates these two countries will be responsible for 18.1% and 57.0% of global seaborne met coal exports, respectively.
| Seaborne HCC exports (Millions of metric tons) |
2017E | % of total |
Seaborne HCC imports (Millions of metric tons) |
2017E | % of total |
|||||||||||||||
| Australia |
101 | 57.0 | % | India |
36 | 20.2 | % | |||||||||||||
| United States |
32 | 18.1 | % | Europe |
36 | 20.1 | % | |||||||||||||
| Western Canada |
23 | 13.0 | % | Japan |
29 | 16.3 | % | |||||||||||||
| Russia |
10 | 5.6 | % | China |
27 | 15.3 | % | |||||||||||||
| Mozambique |
6 | 3.4 | % | South Korea |
18 | 10.3 | % | |||||||||||||
| Other |
5 | 2.8 | % | Brazil |
11 | 6.2 | % | |||||||||||||
| Total |
177 | 100.0 | % | Other |
20 | 11.6 | % | |||||||||||||
| Total |
177 | 100.0 | % | |||||||||||||||||
Source: Wood Mackenzie.
On the supply side, the industry has experienced a net reduction in total seaborne met coal exports in recent years. Wood Mackenzie estimates that from 2013 to 2016, seaborne met coal exports declined from a peak of 302 million metric tons to 278 million metric tons, an 8.2% decline. This reduction in supply has been accompanied by a shift in the mix of key producing regions. According to Wood Mackenzie, from 2011 to 2016, producers in Australia are estimated to have increased seaborne met coal exports by an expected 51 million metric tons, or 37.8%. This increase in exports at a time of multi-year declines in benchmark HCC prices eventually resulted in significant supply rationalization by higher cost met coal exporting regions. For instance, in the United States, seaborne exports will have declined from a peak of 60 million metric tons in 2013 to an expected 33 million metric tons in 2016, a 45.3% decline. In Canada, Wood Mackenzie predicts that seaborne exports will decline from a peak of 34 million metric tons in 2013 to an expected 25 million metric tons in 2016, a 26.9% decline. According to Wood Mackenzie, Australia, the United States and Canada are projected to experience declining seaborne met coal exports between 2017 and 2021, with negative CAGRs of (1%), (5%) and (1%), respectively. Russia is estimated to experience an increase in seaborne met coal exports between 2017 and 2021 at a CAGR of 7%.
11
From 2016 to 2020, Wood Mackenzie forecasts relatively limited growth in global seaborne exports at a CAGR of 1.0% per annum. Consistent with Wood Mackenzie’s outlook for supply, we believe that much of the decrease in met coal production is likely to persist despite currently elevated prices, and reflects an extended period of underinvestment in the industry, mine-life extension and infrastructure constraints in Australia and Canada, as well as the permanent closure of higher cost mines globally.
Prices for met coal are generally set in the seaborne market, primarily driven by Japanese and Chinese import demand and Australian supply. Chinese import demand depends in part on Chinese steel production and domestic coal production. Of note, China is the largest met coal producer and consumer in the world, consuming over 99% of its 2016 production of 663 million metric tons of met coal domestically. However, due to the lower quality coal that is produced domestically and the distance of Chinese mines relative to the location of coastal steel mills, according to Wood Mackenzie, the Chinese domestic met coal market has a structural need for approximately 47 million metric tons of premium benchmark quality HCC in 2017. Wood Mackenzie believes that this shortfall will be filled predominantly through the seaborne market, providing sustained demand support in the global seaborne market for premium quality HCC.
Chinese authorities have been implementing plans to move steel production capacity from inland areas to port areas. We expect that should the Chinese government continue to pursue these policy objectives, it could be supportive for Chinese imports of seaborne met coal due to the closer proximity of these mills to Chinese east coast port facilities as well as the continued reduction of domestic coal production capacity. Chinese steelmaking capacity is being relocated away from inland Chinese cities and towards larger facilities in coastal areas. Finally, the Chinese shift to BOF steel will influence the met coal market in 2017 by pushing up imported coal demand in and outside of China.
In June 2017, the structure of quarterly contract pricing changed as Nippon Steel & Sumitomo Metal Corporation announced that it was switching to index-based pricing as the mechanism to determine benchmark prices for low-volatile hard coking coal. Previously, a quarterly benchmark HCC price was set between major Australian suppliers and major Japanese steel mill customers, and that price served as a reference for most met coal, with adjustments for quality differences. With the new pricing methodology, the price will be calculated using a basket of three established indexes. Unlike iron ore, which uses the average price of the last three quarters, the Nippon Steel & Sumitomo Metal Corporation method is based on prices one month from the previous quarter and the first two months in the current quarter and payments are back-adjusted at the end of the quarter.
Met coal prices have been highly volatile in the last decade due to seaborne supply disruptions and, more recently, Chinese restrictions on domestic coal production, including workday restrictions imposed in 2016. In 2008, benchmark coking coal prices reached $300 per metric ton in response to flooding in Australia’s producing regions, falling to $129 per metric ton in 2009. In 2011, benchmark prices reached $330 per metric ton as a result of flooding in Australia, falling back to $84 per metric ton five years later in early 2016. In the first quarter of 2017, Cyclone Debbie made landfall in Australia, reducing supply and pushing the benchmark price to $285 per metric ton, during which time certain vessels sold at rates equal to 102% to 105% of the HCC index pricing. As of the second quarter of 2017, the last quarterly benchmark date, prices had receded post Cyclone Debbie to $190 per metric ton.
12
Inflation-adjusted historical HCC prices ($/metric ton)
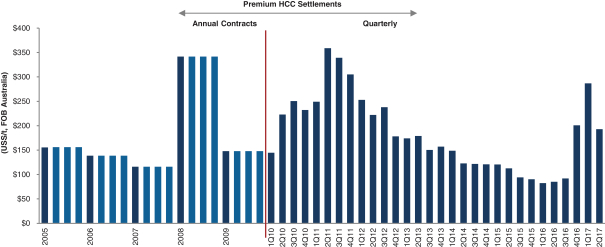
Source: Bloomberg
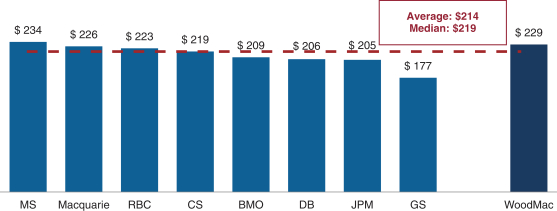
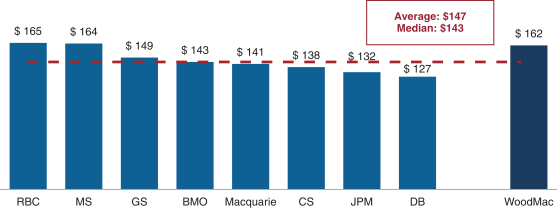
Looking forward, research analysts are forecasting HCC prices of approximately $214/mt in 2017 and approximately $143/mt in 2018. This is a result of both political factors, such as China’s recent environmental policies, and long-term urbanization trends in emerging markets which will likely drive demand growth. Lack of domestic high-quality met coal in China, India and Brazil will continue to drive import demand, along with other economies, such as those in southeast Asia, that are experiencing rapid growth and urbanization rates.
2017 HCC price forecast ($ / metric ton)
13
2018 HCC price forecast ($ / metric ton)
Overview of the U.S. Met Coal Market
The U.S. met coal market had historically been viewed as the swing supplier in the global seaborne market, since U.S. mines are more adversely affected by changes in benchmark HCC prices than mines in Australia and Canada. This is due to the United States’ relatively larger number of higher cost mines compared to Australia and Canada. According to Wood Mackenzie, the United States is expected to produce 61 million metric tons of met coal in 2017, down 20.6% from 77 million metric tons in 2013, reflecting meaningful mine supply rationalization in response to weaker met coal prices. Of the United States’ expected production of 61 million metric tons, 18 million metric tons (29.8%) are expected to be consumed domestically and 38 million metric tons are expected to be exported through the seaborne market to international blast furnace steel producers, with the balance shipped to Canada. In line with falling overall production, U.S. seaborne exports of met coal in 2017 are expected to be 36.1% lower than peak export levels of 60 million metric tons in 2013. In 2017, U.S. met coal seaborne exports are expected to be directed to Europe (55% of total U.S. met coal seaborne exports), Brazil (15.6%), and Japan (12.9%).
According to Wood Mackenzie, 10 million metric tons of U.S. met coal capacity reductions since 2013 are the result of permanent mine closures. As noted earlier, Wood Mackenzie does not expect the United States to increase exports through 2020. Wood Mackenzie believes capital considerations to re-start idled U.S mines, as well as their lower margins relative to global competitors, will likely require greater certainty of a longer-term, higher met coal price before owners of idled mines can justify re-starting.
According to Wood Mackenzie, the five largest U.S. exporters of met coal in 2017 are expected to be Arch Coal, Inc., Blackhawk Mining, LLC, Warrior Met Coal, Inc., Coronado Coal, LLC, and Alpha Natural Resources, Inc. These five producers are expected to account for approximately 59.2% of U.S. met coal exports in 2017. Wood Mackenzie projects that for 2018, we will be the largest U.S. met coal exporter by tonnage due to our restart and ramping up of the longwall systems we idled in the first half of 2016.
Competitive Dynamics
Substantially all of our met coal sales are exported. Our major competitors also sell into our core geographic end-markets of Europe and South America. We compete with producers of premium met
14
coal primarily from Australia, while also competing, to a lesser extent, with met coal producers from Canada, Russia and the United States. The principal factors on which we compete are coal prices at the port of delivery, coal quality and characteristics, customer relationships and the reliability of supply. Of note, the benchmark quality met coal produced by us and select Australian mines have very high coking strengths as indicated by coke strength after reaction (“CSR”) scores compared to other low-vol met coals from U.S. mines. This contributes to our very high price realizations relative to the HCC benchmark, including a 99% average gross realized price (excluding the effect of tons contracted for sale in prior quarters) in 2016. This is in significant contrast to other U.S. met coal producers, which we believe sell a relatively higher proportion of lower rank coals to domestic steel producers.
U.S. met coals with lower CSR scores are most easily sold to U.S. steel mills, which are comparatively older and smaller than their European, Asian and Brazilian counterparts and have lower coking strength requirements. As such, we believe that other U.S. met coal producers are particularly impacted by the competitiveness and financial health of the U.S. steel industry. Conversely, our coals are competitive with coals from Australian mines, and are more exposed to the global economy and worldwide demand for steel. In this vein, we believe that we may be able to market our coal to Japanese steelmakers that have indicated a desire to diversify away from Australian met coal producers.
We believe that we are uniquely advantaged to sell to our primary European customer base relative to other North American met coal producers due to (i) the superior quality and higher strength of the coal produced at our Mine No. 4 and Mine No. 7; and (ii) our freight cost advantage from the Port of Mobile, Alabama, which, according to Wood Mackenzie, enables us to deliver our product to the European market in approximately two weeks, in contrast to the approximately five weeks required to ship HCC from Australia to the European market. We are similarly able to access key Brazilian ports in two weeks.
15
SUMMARY CONSOLIDATED AND COMBINED HISTORICAL AND PRO FORMA FINANCIAL DATA
The following tables set forth our summary consolidated and combined historical and pro forma financial data as of and for each of the periods indicated. The summary unaudited consolidated historical financial data as of June 30, 2017, for the six months ended June 30, 2017 and for the three months ended June 30, 2016 is derived from the unaudited condensed financial statements of the Successor included elsewhere in this offering circular and has been prepared on a basis consistent with the Successor’s audited financial statements. In the opinion of management, the unaudited data reflects all adjustments, consisting only of normal recurring adjustments necessary for a fair presentation of the financial information in those statements. The summary consolidated historical financial data as of December 31, 2016 and for the nine months ended December 31, 2016 is derived from the audited consolidated financial statements of the Successor included elsewhere in this offering circular. The summary combined historical financial data as of December 31, 2015 and for the three months ended March 31, 2016 and the year ended December 31, 2015 is derived from the audited combined financial statements of our Predecessor included elsewhere in this offering circular. The term “Successor” refers to (1) Warrior Met Coal, LLC and its subsidiaries for periods beginning as of April 1, 2016 and ending immediately before the completion of our corporate conversion and (2) Warrior Met Coal, Inc. and its subsidiaries for periods beginning with the completion of our corporate conversion and thereafter. The term “Predecessor” refers to the assets acquired and liabilities assumed by Warrior Met Coal, LLC from Walter Energy in the Asset Acquisition on March 31, 2016. The Predecessor periods included in this offering circular begin as of January 1, 2015 and end as of March 31, 2016.
The summary unaudited pro forma financial data for the twelve months ended June 30, 2017 has been calculated by taking the pro forma financial data for the six months ended June 30, 2017, adding the historical data for the nine months ended December 31, 2016 and subtracting the historical data for the three months ended June 30, 2016. The summary unaudited pro forma statements of operations data for the six months ended June 30, 2017 and the year ended December 31, 2016 are derived from the unaudited pro forma condensed statements of operations included elsewhere in this offering circular. The unaudited pro forma condensed statement of operations for the six months ended June 30, 2017 assumes that the Asset Acquisition, the IPO, the corporate conversion, the issuance of the notes contemplated hereby and the Concurrent Special Dividend (collectively, the “Transactions”) occurred as of January 1, 2016. The unaudited pro forma condensed combined statement of operations for the year ended December 31, 2016 assumes that the Transactions occurred as of January 1, 2016. The summary unaudited pro forma financial data is based upon available information and certain assumptions that management believes are factually supportable, are reasonable under the circumstances and are directly related to the Transactions. The summary unaudited pro forma financial data is provided for informational purposes only and does not purport to represent what our results of operations or financial position actually would have been if these transactions had occurred at any other date, and such data does not purport to project our results of operations for any future period.
You should read this summary consolidated and combined historical and pro forma financial data together with “Use of Proceeds,” “Management’s Discussion and Analysis of Financial Condition and Results of Operations,” “Selected Consolidated and Combined Historical and Pro Forma Financial Data,” the unaudited pro forma condensed combined statements of operations and the audited and unaudited financial statements and related notes thereto included elsewhere in this offering circular. Our historical results are not necessarily indicative of our future results of operations, financial position and cash flows.
16
| Historical | Pro Forma | |||||||||||||||||||||||||||||||||||
| Successor |
|
Predecessor | Predecessor/ Successor |
Successor | ||||||||||||||||||||||||||||||||
| For the six months ended June 30, 2017 (unaudited)(1) |
For the nine months ended December 31, 2016 |
For the three months ended June 30, 2016 (unaudited) |
|
For the three months ended March 31, 2016 |
For the year ended December 31, 2015 |
For the year ended December 31, 2016 (unaudited) |
For the six months ended June 30, 2017 (unaudited) |
For the twelve months ended June 30, 2017 (unaudited) |
||||||||||||||||||||||||||||
| (in thousands, except average price per metric ton data) | ||||||||||||||||||||||||||||||||||||
| Statements of Operations Data: |
||||||||||||||||||||||||||||||||||||
| Revenues: |
||||||||||||||||||||||||||||||||||||
| Sales |
$ | 592,844 | $ | 276,560 | $ | 85,415 | $ | 65,154 | $ | 514,334 | $ | 341,714 | $ | 592,844 | $ | 783,989 | ||||||||||||||||||||
| Other revenues |
24,490 | 21,074 | 6,059 | 6,229 | 30,399 | 27,303 | 24,490 | 39,505 | ||||||||||||||||||||||||||||
|
|
|
|
|
|
|
|
|
|
|
|
|
|
|
|
|
|
|
|||||||||||||||||||
| Total revenues |
617,334 | 297,634 | 91,474 | 71,383 | 544,733 | 369,017 | 617,334 | 823,494 | ||||||||||||||||||||||||||||
|
|
|
|
|
|
|
|
|
|
|
|
|
|
|
|
|
|
|
|||||||||||||||||||
| Costs and expenses: |
||||||||||||||||||||||||||||||||||||
| Cost of sales (exclusive of items shown separately below) |
266,296 | 244,723 | 103,866 | 72,297 | 601,545 | 315,563 | 266,296 | 407,153 | ||||||||||||||||||||||||||||
| Cost of other revenues (exclusive of items shown separately below) |
15,974 | 19,367 | 5,126 | 4,698 | 27,442 | 24,065 | 15,974 | 30,215 | ||||||||||||||||||||||||||||
| Depreciation and depletion |
34,232 | 47,413 | 15,821 | 28,958 | 123,633 | 58,950 | 34,232 | 65,824 | ||||||||||||||||||||||||||||
| Selling, general and administrative |
13,830 | 20,507 | 5,815 | 9,008 | 38,922 | 29,125 | 13,830 | 28,522 | ||||||||||||||||||||||||||||
| Other postretirement benefits |
— | — | — | 6,160 | 30,899 | — | — | — | ||||||||||||||||||||||||||||
| Restructuring costs |
— | — | — | 3,418 | 13,832 | 3,418 | — | — | ||||||||||||||||||||||||||||
| Asset impairment charges |
— | — | — | — | 27,986 | — | — | — | ||||||||||||||||||||||||||||
| Transaction and other costs |
12,873 | 13,568 | 10,475 | — | — | — | 12,873 | 15,966 | ||||||||||||||||||||||||||||
|
|
|
|
|
|
|
|
|
|
|
|
|
|
|
|
|
|
|
|||||||||||||||||||
| Total costs and expenses |
343,205 | 345,578 | 141,103 | 124,539 | 864,259 | 431,121 | 343,205 | 547,680 | ||||||||||||||||||||||||||||
|
|
|
|
|
|
|
|
|
|
|
|
|
|
|
|
|
|
|
|||||||||||||||||||
| Operating income (loss) |
274,129 | (47,944 | ) | (49,629 | ) | (53,156 | ) | (319,526 | ) | (62,104 | ) | 274,129 | 275,814 | |||||||||||||||||||||||
| Interest expense, net |
(1,250 | ) | (1,711 | ) | (434 | ) | (16,562 | ) | (51,077 | ) | (29,483 | ) | (14,742 | ) | (16,019 | ) | ||||||||||||||||||||
| Gain on extinguishment of debt |
— | — | — | — | 26,968 | — | — | — | ||||||||||||||||||||||||||||
| Reorganization items, net |
— | — | — | 7,920 | (7,735 | ) | — | — | — | |||||||||||||||||||||||||||
|
|
|
|
|
|
|
|
|
|
|
|
|
|
|
|
|
|
|
|||||||||||||||||||
| Income (loss) before income taxes |
272,879 | (49,655 | ) | (50,063 | ) | (61,798 | ) | (351,370 | ) | (91,587 | ) | 259,387 | 259,795 | |||||||||||||||||||||||
| Income tax expense (benefit) |
34,706 | 18 | — | 18 | (40,789 | ) | 36 | 29,865 | 29,883 | |||||||||||||||||||||||||||
|
|
|
|
|
|
|
|
|
|
|
|
|
|
|
|
|
|
|
|||||||||||||||||||
| Net income (loss) |
$ | 238,173 | $ | (49,673 | ) | $ | (50,063 | ) | $ | (61,816 | ) | $ | (310,581 | ) | $ | (91,623 | ) | $ | 229,522 | $ | 229,912 | |||||||||||||||
|
|
|
|
|
|
|
|
|
|
|
|
|
|
|
|
|
|
|
|||||||||||||||||||
| Statements of Cash Flow Data: |
||||||||||||||||||||||||||||||||||||
| Cash provided by (used in): |
||||||||||||||||||||||||||||||||||||
| Operating activities |
$ | 226,957 | $ | (9,187 | ) | $ | (28,888 | ) | $ | (40,698 | ) | $ | (131,818 | ) | ||||||||||||||||||||||
| Investing activities |
$ | (28,263 | ) | $ | (30,884 | ) | $ | (34,230 | ) | $ | (5,422 | ) | $ | (64,249 | ) | |||||||||||||||||||||
| Financing activities |
$ | (194,204 | ) | $ | 192,727 | $ | 194,720 | $ | (6,240 | ) | $ | (147,145 | ) | |||||||||||||||||||||||
| Other Financial Data: |
||||||||||||||||||||||||||||||||||||
| Depreciation and depletion |
$ | 34,232 | $ | 47,413 | $ | 15,821 | $ | 28,958 | $ | 123,633 | $ | 58,950 | $ | 34,232 | $ | 65,824 | ||||||||||||||||||||
| Capital expenditures(2) |
$ | 28,263 | $ | 11,531 | $ | 6,014 | $ | 5,422 | $ | 64,971 | ||||||||||||||||||||||||||
| Adjusted EBITDA(3) |
$ | 323,947 | $ | 50,089 | $ | 8,073 | $ | (9,048 | ) | $ | (145,805 | ) | $ | 48,428 | $ | 323,947 | $ | 365,963 | ||||||||||||||||||
| Sales Data: |
||||||||||||||||||||||||||||||||||||
| Metric tons sold |
2,784 | 2,391 | 1,022 | 777 | 5,121 | 3,168 | 2,784 | 4,153 | ||||||||||||||||||||||||||||
| Average price of HCC benchmark/index price |
$ | 239.50 | $ | 125.50 | $ | 92.50 | $ | 81.00 | $ | 102.00 | $ | 114.38 | $ | 239.50 | $ | 192.88 | ||||||||||||||||||||
| Average selling price per metric ton |
$ | 212.94 | $ | 115.67 | $ | 83.57 | $ | 83.85 | $ | 100.44 | $ | 107.86 | $ | 212.94 | $ | 188.79 | ||||||||||||||||||||
17
| Pro Forma(5) | Historical | |||||||||||||||||||
| Successor | Successor | Predecessor | ||||||||||||||||||
| June 30, 2017 (unaudited) |
June 30, 2017 (unaudited) |
December 31, 2016 |
December 31, 2015 |
|||||||||||||||||
| (in thousands) | ||||||||||||||||||||
| Balance Sheet Data: |
||||||||||||||||||||
| Cash and cash equivalents(6) |
$ | 15,200 | $ | 155,792 | $ | 150,045 | $ | 79,762 | ||||||||||||
| Working capital(7) |
$ | 19,374 | $ | 279,374 | $ | 226,137 | $ | 129,558 | ||||||||||||
| Mineral interests, net |
$ | 134,597 | $ | 134,597 | $ | 143,231 | $ | 5,295 | ||||||||||||
| Property, plant and equipment, net |
$ | 495,072 | $ | 495,072 | $ | 496,959 | $ | 567,594 | ||||||||||||
| Total assets |
$ | 750,361 | $ | 1,010,361 | $ | 947,631 | $ | 802,137 | ||||||||||||
| Long-term debt(8) |
$ | 342,257 | $ | 2,257 | $ | 3,725 | $ | — | ||||||||||||
| Total liabilities not subject to compromise |
$ | 553,241 | $ | 213,241 | $ | 194,664 | $ | 126,720 | ||||||||||||
| Total stockholders’/members’ equity and parent net investment |
$ | 197,120 | $ | 797,120 | $ | 752,967 | $ | (820,861 | ) | |||||||||||
| (1) | During the three months ended June 30, 2017, (i) the industry benchmark was replaced by a new average index pricing methodology, which varies by supplier, but was based on the average of the Platts premium low-volatile (“low-vol”) index, which resulted in a second quarter benchmark index price per metric ton of $194.00, (ii) our average realized price per metric ton was $199.65, (iii) metric tons sold were 1.8 million, (iv) our revenues were $363.4 million, (v) our Adjusted EBITDA, a non-GAAP financial measure, was $188.5 million, (vi) our cash cost of sales, a non-GAAP financial measure, per metric ton were $90.62 and (vii) our capital expenditures were $16.9 million. For a definition of Adjusted EBITDA and a reconciliation to our most directly comparable financial measure calculated and presented in accordance with GAAP, please read “—Non-GAAP Financial Measures—Adjusted EBITDA.” For a definition of cash cost of sales and a reconciliation to our most directly comparable financial measure calculated and presented in accordance with GAAP, please read “—Non-GAAP Financial Measures—Cash Cost of Sales.” |
| (2) | Capital expenditures consist of the purchases of property, plant and equipment. |
| (3) | Adjusted EBITDA is a non-GAAP financial measure. For a definition of Adjusted EBITDA and a reconciliation to our most directly comparable financial measure calculated and presented in accordance with GAAP, please read “—Non-GAAP Financial Measures—Adjusted EBITDA.” |
| (4) | Pro forma interest expense for the twelve months ended June 30, 2017 represents interest paid for the twelve months ended June 30, 2017 as adjusted for the additional estimated interest expense associated with the issuance of the notes offered hereby. |
| (5) | Reflects the issuance of the notes contemplated hereby and the payment of the Concurrent Special Dividend using the net proceeds of the notes offered hereby and cash on hand as of October 13, 2017. Refer to “Capitalization” for the impact of the issuance of the notes and payment of the Concurrent Special Dividend. |
| (6) | As of October 13, 2017, we had cash and cash equivalents of $275.2 million. Cash on hand as of June 30, 2017, plus cash on hand generated from operations subsequent to June 30, 2017, will be used, together with the net proceeds from this offering of notes, to pay the Concurrent Special Dividend in the amount of $600.0 million. |
| (7) | Working capital consists of current assets less current liabilities. |
| (8) | As of June 30, 2017, on a pro forma basis, this amount represents the issuance of the notes offered hereby, net of $10.0 million of debt issuance costs associated with this offering. On a pro forma and historical basis for the periods presented, the amounts represent the long-term portion of a promissory note assumed in the Asset Acquisition. The agreement was entered into for the purchase of underground mining equipment. The promissory note matures on March 31, 2019, has a fixed interest rate of 4.00% per annum and is secured by the underground mining equipment it was used to purchase. |
Non-GAAP Financial Measures
Cash Cost of Sales
Cash cost of sales is based on reported cost of sales and includes items such as freight, royalties, manpower, fuel and other similar production and sales cost items, and may be adjusted for other items that, pursuant to GAAP, are classified in the Statements of Operations as costs other than cost of sales, but relate directly to the costs incurred to produce and sell met coal free-on-board at the Port of Mobile. Our cash cost of sales per metric ton is calculated as cash cost of sales divided by the metric tons sold.
Cash costs of sales is a financial measure that is not calculated in conformity with GAAP and should be considered supplemental to, and not as a substitute or superior to, financial measures calculated in conformity with GAAP. We believe that this non-GAAP financial measure provides additional insight into our operating performance, and reflects how management analyzes our
18
operating performance and compares that performance against other companies on a consistent basis for purposes of business decision making by excluding the impact of certain items that management does not believe are indicative of our core operating performance. We believe that cash costs of sales presents a useful measure of our controllable costs and our operational results by including all costs incurred to produce and sell met coal free-on-board at the Port of Mobile. Period-to-period comparisons of cash cost of sales are intended to help our management identify and assess additional trends potentially impacting the Company that may not be shown solely by period-to-period comparisons of cost of sales. In addition, we believe that cash costs of sales is a useful measure as some investors and analysts use it to compare us against other companies. However, cash cost of sales may not be comparable to similarly titled measures used by other entities.
The following table presents a reconciliation of cost of sales to cash costs of sales (in thousands):
| Historical | Pro Forma | |||||||||||||||||||||||||||||||||||
| Successor |
|
Predecessor | Predecessor/ Successor |
Successor | ||||||||||||||||||||||||||||||||
| For the six months ended June 30, 2017 (unaudited)(3) |
For the nine months ended December 31, 2016 |
For the three months ended June 30, 2016 (unaudited) |
|
For the three months ended March 31, 2016 |
For the year ended December 31, 2015 |
For the year ended December 31, 2016 (unaudited) |
For the six months ended June 30, 2017 (unaudited) |
For the twelve months ended June 30, 2017 (unaudited) |
||||||||||||||||||||||||||||
| Cost of sales |
$ | 266,296 | $ | 244,723 | $ | 103,866 | $ | 72,297 | $ | 601,545 | $ | 315,563 | $ | 266,296 | $ | 407,153 | ||||||||||||||||||||
| Mine No. 4 idle costs(1) |
— | (8,726 | ) | (5,342 | ) | (10,173 | ) | — | (18,899 | ) | — | (3,384 | ) | |||||||||||||||||||||||
| VEBA contribution(2) |
— | (25,000 | ) | (25,000 | ) | — | — | (25,000 | ) | — | — | |||||||||||||||||||||||||
| Other (asset retirement obligations, stock compensation, operating overhead, etc.) |
(957 | ) | (12,922 | ) | (3,881 | ) | (7,936 | ) | (23,077 | ) | (20,858 | ) | (957 | ) | (9,998 | ) | ||||||||||||||||||||
|
|
|
|
|
|
|
|
|
|
|
|
|
|
|
|
|
|
|
|||||||||||||||||||
| Cash cost of sales |
$ | 265,339 | $ | 198,075 | $ | 69,643 | $ | 54,188 | $ | 578,468 | $ | 250,806 | $ | 265,339 | $ | 393,771 | ||||||||||||||||||||
| Cash cost of sales (free-on-board port) per metric ton |
$ | 95.30 | $ | 82.84 | $ | 68.14 | $ | 69.74 | $ | 112.96 | $ | 79.17 | $ | 95.30 | $ | 94.82 | ||||||||||||||||||||
|
|
|
|
|
|
|
|
|
|
|
|
|
|
|
|
|
|
|
|||||||||||||||||||
| (1) | Represents idle costs incurred, such as electricity, insurance and maintenance labor. This mine was idled in early 2016 and restarted in August 2016. |
| (2) | On April 1, 2016 we entered into a new initial CBA with the UMWA pursuant to which we agreed to contribute $25.0 million to a Voluntary Employees’ Beneficiary Association (“VEBA”) trust formed and administered by the UMWA. |
| (3) | The following table presents a reconciliation of cost of sales to cash cost of sales for the three months ended June 30, 2017 (in thousands): |
| Successor | ||||
| For the three months ended June 30, 2017 |
||||
| Cost of sales |
$ | 160,152 | ||
| Asset retirement obligation accretion |
(401 | ) | ||
| Stock compensation expense |
(75 | ) | ||
|
|
|
|||
| Cash cost of sales |
$ | 159,676 | ||
Adjusted EBITDA
Adjusted EBITDA is defined as net income (loss) before net interest expense, income tax expense (benefit), depreciation and depletion, net reorganization items, gain on extinguishment of debt, restructuring costs, asset impairment charges, transaction and other costs, Mine No. 4 idle costs, VEBA contributions, non-cash stock compensation expense and non-cash asset retirement obligation accretion.
19
Adjusted EBITDA is a financial measure that is not calculated in conformity with GAAP and should be considered supplemental to, and not as a substitute or superior to, financial measures calculated in conformity with GAAP. We believe that this non-GAAP financial measure provides additional insights into our operating performance, and it reflects how management analyzes our operating performance and compares that performance against other companies on a consistent basis for purposes of business decision making by excluding the impact of certain items that management does not believe are indicative of our core operating performance. We believe Adjusted EBITDA assists management in comparing performance across periods, planning and forecasting future business operations and helping determine levels of operating and capital investments. Period-to-period comparisons of Adjusted EBITDA are intended to help our management identify and assess additional trends potentially impacting our Company that may not be shown solely by period-to-period comparisons of net income (loss). We also utilize Adjusted EBITDA in certain calculations under our ABL Facility and for purposes of determining executive compensation, and will in the future use Adjusted EBITDA in certain calculations under the indenture. In addition, we believe that Adjusted EBITDA is a useful measure as some investors and analysts use Adjusted EBITDA to compare us against other companies. However, Adjusted EBITDA may not be comparable to similarly titled measures used by other entities.
The following table presents a reconciliation of net income (loss) to Adjusted EBITDA (in thousands):
| Historical | Pro Forma | |||||||||||||||||||||||||||||||||||
| Successor |
|
Predecessor | Predecessor/ Successor |
Successor | ||||||||||||||||||||||||||||||||
| For the six months ended June 30, 2017 (unaudited) |
For the nine months ended December 31, 2016(10) |
For the three months ended June 30, 2016 (unaudited) |
|
For the three months ended March 31, 2016 |
For the year ended December 31, 2015 |
For the year ended December 31, 2016 (unaudited) |
For the six months ended June 30, 2017 (unaudited) |
For the twelve months ended June 30, 2017 (unaudited) |
||||||||||||||||||||||||||||
| Net income (loss) |
$ | 238,173 | $ | (49,673 | ) | $ | (50,063 | ) | $ | (61,816 | ) | $ | (310,581 | ) | $ | (91,623 | ) | $ | 229,522 | $ | 229,912 | |||||||||||||||
| Interest expense, net |
1,249 | 1,711 | 434 | 16,562 | 51,077 | 29,483 | 14,742 | 16,019 | ||||||||||||||||||||||||||||
| Income tax expense (benefit) |
34,706 | 18 | — | 18 | (40,789 | ) | 36 | 29,865 | 29,883 | |||||||||||||||||||||||||||
| Depreciation and depletion |
34,232 | 47,413 | 15,821 | 28,958 | 123,633 | 58,950 | 34,232 | 65,824 | ||||||||||||||||||||||||||||
| Reorganization items, net(1) |
— | — | — | (7,920 | ) | 7,735 | — | — | — | |||||||||||||||||||||||||||
| Gain on extinguishment of debt(2) |
— | — | — | — | (26,968 | ) | — | — | — | |||||||||||||||||||||||||||
| Restructuring costs(3) |
— | — | — | 3,418 | 13,832 | 3,418 | — | — | ||||||||||||||||||||||||||||
| Asset impairment charges(4) |
— | — | — | — | 27,986 | — | — | — | ||||||||||||||||||||||||||||
| Transaction and other costs(5) |
12,873 | 13,568 | 10,475 | — | — | — | 12,873 | 15,966 | ||||||||||||||||||||||||||||
| Mine No. 4 idle costs(6) |
— | 8,726 | 5,342 | 10,173 | — | 18,899 | — | 3,384 | ||||||||||||||||||||||||||||
| VEBA contribution(7) |
— | 25,000 | 25,000 | — | — | 25,000 | — | — | ||||||||||||||||||||||||||||
| Stock compensation expense(8) |
922 | 509 | 125 | 390 | 4,034 | 509 | 922 | 1,306 | ||||||||||||||||||||||||||||
| Asset retirement obligation accretion(9) |
1,792 | 2,817 | 939 | 1,169 | 4,236 | 3,756 | 1,792 | 3,670 | ||||||||||||||||||||||||||||
|
|
|
|
|
|
|
|
|
|
|
|
|
|
|
|
|
|
|
|||||||||||||||||||
| Adjusted EBITDA |
$ | 323,947 | $ | 50,089 | $ | 8,073 | $ | (9,048 | ) | $ | (145,805 | ) | $ | 48,428 | $ | 323,947 | $ | 365,963 | ||||||||||||||||||
|
|
|
|
|
|
|
|
|
|
|
|
|
|
|
|
|
|
|
|||||||||||||||||||
| (1) | Represents expenses and income directly associated with the Predecessor’s Chapter 11 Cases (as defined in “Management’s Discussion and Analysis of Financial Condition and Results of Operations”). |
| (2) | Represents a portion of the gain on extinguishment of debt that was attributed to the Predecessor. |
| (3) | Represents cost and expenses in connection with workforce reductions at Mine No. 4 and Mine No. 7 and corporate headquarters. |
20
| (4) | Represents asset impairment charges associated with the Blue Creek Energy Mine, which was impaired during the fourth quarter of 2015. |
| (5) | Represents costs incurred by the Company in connection with the Asset Acquisition and the IPO. |
| (6) | Represents idle costs incurred, such as electricity, insurance and maintenance labor. This mine was idled in early 2016 and restarted in August 2016. |
| (7) | We entered into a new initial CBA with the UMWA pursuant to which we agreed to contribute $25.0 million to a VEBA trust formed and administered by the UMWA. |
| (8) | Represents non-cash stock compensation expense associated with equity awards. |
| (9) | Represents non-cash accretion expense associated with our asset retirement obligations. |
| (10) | The following table presents a reconciliation of net income to Adjusted EBITDA for the three months ended June 30, 2017 (in thousands): |
| Successor | ||||
| For the three months ended June 30, 2017 |
||||
| Net income |
$ | 129,865 | ||
| Interest expense, net |
642 | |||
| Income tax expense |
32,769 | |||
| Depreciation and depletion |
19,650 | |||
| Transaction and other costs(a) |
3,837 | |||
| Stock compensation expense(b) |
922 | |||
| Asset retirement obligation accretion(c) |
797 | |||
|
|
|
|||
| Adjusted EBITDA |
$ | 188,482 | ||
|
|
|
|||
| (a) | Represents costs incurred by the Company in connection with the IPO. |
| (b) | Represents non-cash stock compensation expense associated with equity awards. |
| (c) | Represents non-cash accretion expense associated with our asset retirement obligations. |
21
RISK FACTORS
We may be unable to generate sufficient taxable income from future operations, or other circumstances could arise, which may limit or eliminate our ability to utilize our significant tax NOLs or maintain our deferred tax assets.
In connection with the Asset Acquisition consummated on March 31, 2016, we acquired deferred tax assets primarily associated with NOLs attributable to Walter Energy’s write-off of its investment in Walter Energy Canada Holdings, Inc. As a result of our history of losses and other factors, a valuation allowance has been recorded against our deferred tax assets, including our NOLs. A valuation allowance was established on our opening balance sheet at April 1, 2016 because it was more likely than not that a portion of the acquired deferred tax assets would not be realized in the future. Certain factors could change or circumstances could arise that could further limit or eliminate the amount of the available NOLs to the Company, such as an ownership change or an adjustment by a tax authority, and could necessitate a change in our valuation allowance or our liability for income taxes. In addition, we have a limited operating history as a new standalone company, have incurred additional operating losses since the Asset Acquisition and have recorded additional deferred tax assets and valuation allowances with respect thereto. Also, certain circumstances, including our failing to generate sufficient future taxable income from operations, could limit our ability to fully utilize our deferred tax assets. At December 31, 2016, we recorded a valuation allowance of $767.3 million against all federal and state NOLs and gross deferred tax assets not expected to provide future tax benefits.
Under the Code, a company is generally allowed a deduction for NOLs against its federal taxable income. We had federal and state NOLs, in each case, of approximately $1.8 billion to $2.0 billion (after giving effect to the downward adjustment to our NOLs resulting from the favorable private letter ruling described below), which expire predominantly in 2034 through 2036 and 2029 through 2031, respectively, for income tax purposes. These NOLs and our other gross deferred tax assets collectively represent a deferred tax asset of approximately $949.7 million at December 31, 2016, before reduction
22
for the valuation allowance described above. Our NOLs are subject to adjustment on audit by the IRS and state authorities. The IRS has not audited any of the tax returns for any of the years in which the losses giving rise to the NOLs were generated. Were the IRS to challenge the size or availability of our NOLs and prevail in such challenge, all or a portion of our NOLs, or our ability to utilize our NOLs to offset any future consolidated taxable income, may be impaired, which could have a significant negative impact on our financial condition, results of operations and cash flows.
A company’s ability to deduct its NOLs and utilize certain other available tax attributes can be substantially constrained under the general annual limitation rules of Section 382 of the Code if it undergoes an “ownership change” as defined in Section 382 or if similar provisions of state law apply. We experienced an ownership change in connection with the Asset Acquisition and as such, the limitations under Section 382 would generally apply unless an exception to such rule applies. Our pro forma financial statements included in this offering circular have been prepared based on the assumption that the limitation under Section 382 applies. An exception to the limitation rules of Section 382 is applicable to certain companies under the jurisdiction of a bankruptcy court. Due to certain uncertainties as to whether such exception applies to us, we filed a request for a private letter ruling from the IRS on these points.
On September 18, 2017, the IRS issued to us a private letter ruling, which favorably resolved these uncertainties. Based on such private letter ruling, we believe that there is no limitation (other than with respect to the AMT) on the utilization of our NOLs to shield our income from federal taxation. The private letter ruling was issued based on, among other things, certain facts and assumptions, as well as certain representations, statements and undertakings provided to the IRS by us. If any of these material facts, assumptions, representations, statements or undertakings are, or become, incorrect, inaccurate or incomplete, the private letter ruling may be invalidated and our ability to rely on the conclusions reached therein could be jeopardized.
While we do not believe an ownership change has occurred since April 1, 2016, because the rules under Section 382 are highly complex and actions of our stockholders which are beyond our control or knowledge could impact whether an ownership change has occurred, we cannot give you any assurance that another Section 382 ownership change will not occur in the future. As a result of our qualifying for the aforementioned exception, were we to undergo a subsequent ownership change prior to April 1, 2018, our NOLs would effectively be reduced to zero. An ownership change after such date would subject our utilization of the NOLs to annual limitations pursuant to Section 382.
Certain transactions, including public offerings by us or our stockholders and redemptions may cause us to undergo an “owner shift” which by itself or when aggregated with other owner shifts that we have undergone or will undergo could cause us to experience an ownership change. Our certificate of incorporation contains transfer restrictions (the “382 Transfer Restrictions”) to minimize the likelihood of an ownership change. We may engage in transactions or approve waivers of the 382 Transfer Restrictions that may cause an ownership shift. In doing so we expect to first perform the calculations necessary to confirm that our ability to use our NOLs and other federal income tax attributes will not be affected or otherwise determine that such transactions or waivers are in our best interests. For example, under certain circumstances, our board of directors may determine it is in our best interest to exempt certain transactions from the operation of the 382 Transfer Restrictions, if such transaction is determined not to be detrimental to the utilization of our NOLs or otherwise in our best interests. These calculations are complex and reflect certain necessary assumptions. Accordingly, it is possible that we could approve or engage in a transaction involving our common stock that causes an ownership change and impairs the use of our NOLs and other federal income tax attributes.
23
Changes in tax legislation, regulation and government policy, including as a result of U.S. presidential and congressional elections, may have a material adverse effect on our business in the future.
U.S. lawmakers are evaluating proposals for substantial changes to U.S. fiscal and tax policies, which could include comprehensive tax reform. A variety of tax reform proposals that would significantly impact U.S. taxation of corporations are under consideration, including reductions in the U.S. corporate tax rate, repeal of the corporate alternative minimum tax, introduction of a capital expense investment deduction, the limitation of the deduction for interest expense and changes to the international tax system. A reduction in the U.S. corporate tax rate may significantly decrease the value of our deferred tax assets which would result in a reduction of net income in the period in which the change is enacted. There can be no assurance that our effective tax rate, tax payments or deferred tax assets will not be adversely affected by enactment of any tax reform initiatives.
24