Attached files
| file | filename |
|---|---|
| EX-99.2 - EX-99.2 - CROWN CASTLE INTERNATIONAL CORP | q32017supplement.htm |
| 8-K - 8-K - CROWN CASTLE INTERNATIONAL CORP | q320178-k.htm |
Exhibit 99.1
 | NEWS RELEASE October 18, 2017 | |
Contacts: Dan Schlanger, CFO | |
Son Nguyen, VP & Treasurer | |
FOR IMMEDIATE RELEASE | Crown Castle International Corp. |
713-570-3050 | |
CROWN CASTLE REPORTS THIRD QUARTER 2017 RESULTS, PROVIDES OUTLOOK FOR FULL YEAR 2018 AND
ANNOUNCES 11% INCREASE TO COMMON STOCK DIVIDEND
October 18, 2017 - HOUSTON, TEXAS - Crown Castle International Corp. (NYSE: CCI) ("Crown Castle") today reported results for the quarter ended September 30, 2017.
"We delivered another quarter of excellent financial results that demonstrate the strong operating performance of our business, exceeding our previously provided Outlook for site rental revenues, net income, Adjusted EBITDA and AFFO," stated Jay Brown, Crown Castle’s Chief Executive Officer. "We also increased our quarterly common stock dividend by 11% to $1.05 per share, reflecting our expectation of continued growth in 2018 and the anticipated contribution from the pending acquisition of Lightower, which we expect to close by year-end. Based on the strong demand we see across each of towers, small cells and fiber, we expect revenue growth to accelerate driven by an increase in new leasing activity in 2018. Looking beyond 2018, we are excited by the opportunity to leverage our leading asset portfolio to grow our cash flows and deliver on our 7% to 8% long-term annual dividend growth target by capitalizing on the expected exponential growth in demand for data and connectivity. We believe the combination of our unparalleled portfolio of assets and our industry-leading capabilities across towers, small cells and fiber positions us to meet the evolving needs of our customers while delivering long-term value to our shareholders."
RESULTS FOR THE QUARTER
The table below sets forth select financial results for the three month period ended September 30, 2017 and September 30, 2016. For further information, refer to the financial statements and non-GAAP, segment and other calculation reconciliations included in this press release.
(in millions) | Actual | Midpoint Q3 2017 Outlook(b) | Actual Compared to Outlook | |||
Q3 2017 | Q3 2016 | Change | % Change | |||
Site rental revenues | $893 | $812 | +$81 | 10% | $891 | +$2 |
Net income (loss) | $115 | $98 | +$17 | 17% | $100 | +$15 |
Adjusted EBITDA(a) | $605 | $564 | +$41 | 7% | $603 | +$2 |
AFFO(a) | $459 | $416 | +$43 | 10% | $450 | +$9 |
Weighted-average common shares outstanding - diluted | 397 | 338 | +59 | 17% | 368 | +29 |
Note: Figures may not tie due to rounding.
(a) | See reconciliation of this non-GAAP financial measure to net income (loss) and definition included herein. |
(b) | As issued on July 19, 2017. |
The Foundation for a Wireless World.
CrownCastle.com
News Release continued: | Page 2 | |
HIGHLIGHTS FROM THE QUARTER
• | Site rental revenues. Site rental revenues grew approximately 10%, or $81 million, from third quarter 2016 to third quarter 2017, inclusive of approximately $41 million in Organic Contribution to Site Rental Revenues plus $52 million in contributions from acquisitions and other items, less a $12 million reduction in straight-lined revenues. The $41 million in Organic Contribution to Site Rental Revenues represents approximately 5% growth, comprised of approximately 8% growth from new leasing activity and contracted tenant escalations, net of approximately 3% from tenant non-renewals. |
• | Net income (loss). Net income (loss) for third quarter 2017 was $115 million. |
• | AFFO. AFFO for third quarter 2017 benefited from approximately $5 million in lower than expected sustaining capital expenditures during the quarter. This benefit is primarily attributable to timing, as the unspent amount from third quarter 2017 is expected to be spent during fourth quarter 2017. |
• | Capital expenditures and acquisitions. Capital expenditures during the quarter were approximately $288 million, comprised of approximately $24 million of land purchases, approximately $24 million of sustaining capital expenditures and approximately $240 million of revenue generating capital expenditures. |
• | Common stock dividend. During the quarter, Crown Castle paid common stock dividends of approximately $386 million in the aggregate, or $0.95 per common share, an increase of approximately 7% on a per share basis compared to the same period a year ago. |
• | Financing activities related to pending acquisition of Lightower. During third quarter 2017, to fund the pending acquisition of LTS Group Holdings LLC ("Lightower"), Crown Castle issued $1.75 billion in aggregate principal amount of senior unsecured notes, $1.65 billion in mandatory convertible preferred stock and 40.15 million shares of common stock (collectively, "Lightower Financings"). The common stock issuance raised approximately $3.8 billion in net proceeds and increased the weighted-average common shares outstanding on a diluted basis by 29 million and 17 million for third quarter 2017 and full year 2017, respectively. Except for the impact related to the Lightower Financings, the pending acquisition of Lightower did not contribute to results during third quarter 2017. The acquisition of Lightower is expected to close by year-end 2017, and Crown Castle expects to use the proceeds from the Lightower Financings and borrowings under its revolving credit facility to fund the acquisition at close. |
"Our excellent third quarter positions us to end 2017 on a strong note and provides us with momentum entering 2018, as we expect the positive trends impacting our business to continue," stated Dan Schlanger, Crown Castle's Chief Financial Officer. "Further, as evidenced by our full year 2017 and 2018 Outlook, the strength of our business model and leadership position across towers, small cells and fiber enable us to continue to deliver on our growth targets, invest for the future and return capital to investors through a substantial and growing dividend. Since 2014, and inclusive of the dividend increase we are announcing today, we have increased our dividend by a compounded annual growth rate of approximately 9%, exceeding our previous long-term target of 6% to 7% annual growth, and we are well-positioned to meet our 7% to 8% long-term annual dividend growth target into the future."
DIVIDEND INCREASE ANNOUNCEMENT
Crown Castle's Board of Directors has declared a quarterly cash dividend of $1.05 per common share, representing an increase of approximately 11% over the previous quarterly dividend of $0.95 per share. The quarterly dividend will be payable on December 29, 2017 to common stockholders of record at the close of business on December 15, 2017. Future dividends are subject to the approval of Crown Castle's Board of Directors.
The Foundation for a Wireless World.
CrownCastle.com
News Release continued: | Page 3 | |
OUTLOOK
This Outlook section contains forward-looking statements, and actual results may differ materially. Information regarding potential risks which could cause actual results to differ from the forward-looking statements herein is set forth below and in Crown Castle's filings with the SEC.
The following table sets forth Crown Castle's current Outlook for fourth quarter 2017, full year 2017 and full year 2018:
(in millions) | Fourth Quarter 2017 | Full Year 2017(a) | Full Year 2018(a) | ||||||
Site rental revenues | $904 | to | $909 | $3,522 | to | $3,527 | $4,546 | to | $4,591 |
Site rental cost of operations(b) | $281 | to | $286 | $1,096 | to | $1,101 | $1,360 | to | $1,405 |
Net income (loss) | $91 | to | $116 | $438 | to | $463 | $515 | to | $595 |
Adjusted EBITDA(c) | $624 | to | $629 | $2,399 | to | $2,404 | $3,013 | to | $3,058 |
Interest expense and amortization of deferred financing costs(d) | $159 | to | $164 | $590 | to | $595 | $644 | to | $689 |
FFO(c) | $376 | to | $381 | $1,590 | to | $1,595 | $1,910 | to | $1,955 |
AFFO(c)(f) | $430 | to | $435 | $1,779 | to | $1,784 | $2,219 | to | $2,264 |
Weighted-average common shares outstanding - diluted(e) | 408 | 383 | 408 | ||||||
(a) | Except for the impact related to the Lightower Financings, the full year 2017 Outlook does not include any contribution from the pending acquisition of Lightower, which is expected to close by year-end 2017. Full year 2018 Outlook includes the expected contribution from the pending acquisition of Lightower. |
(b) | Exclusive of depreciation, amortization and accretion. |
(c) | See reconciliation of this non-GAAP financial measure to net income (loss) and definition included herein. |
(d) | See reconciliation of "components of interest expense and amortization of deferred financing costs" herein for a discussion of non-cash interest expense. |
(e) | The assumption for fourth quarter 2017, full year 2017 and full year 2018 diluted weighted-average common shares outstanding is based on diluted common shares outstanding as of September 30, 2017. For all periods presented, the diluted weighted-average common shares outstanding assumes no conversion of the 6.875% Mandatory Convertible Preferred Stock in the share count. |
(f) | Our AFFO for historical periods may not be comparable to those periods presented prospectively from and after January 1, 2018, including our full year 2018 Outlook herein. See "Sustaining capital expenditures" and "Integration capital expenditures" within "Non-GAAP Financial Measures, Segment Measures and Other Calculations" for further information. |
Full Year 2017 Outlook
The table below compares the results for full year 2016, the midpoint of the current full year 2017 Outlook and the midpoint of the previously provided full year 2017 Outlook for select metrics.
Midpoint of FY 2017 Outlook to FY 2016 Actual Comparison | Previous Full Year 2017 Outlook(b) | Current Compared to Previous Outlook | ||||
(in millions) | Current Full Year 2017 Outlook | Full Year 2016 Actual | Change | % Change | ||
Site rental revenues | $3,525 | $3,233 | +$292 | +9% | $3,517 | +$8 |
Net income (loss) | $451 | $357 | +$94 | +26% | $451 | — |
Adjusted EBITDA(a) | $2,402 | $2,228 | +$174 | +8% | $2,402 | — |
AFFO(a) | $1,782 | $1,610 | +$172 | +11% | $1,826 | -$44 |
Weighted-average common shares outstanding - diluted(c) | 383 | 341 | +42 | +12% | 366 | +17 |
(a) | See reconciliation of this non-GAAP financial measure to net income (loss) and definition included herein. |
(b) | As issued on July 19, 2017. Represents midpoint of Outlook. |
(c) | The assumption for full year 2017 diluted weighted-average common shares outstanding is based on diluted common shares outstanding as of September 30, 2017. For all periods presented, the diluted weighted-average common shares outstanding assumes no conversion of the 6.875% Mandatory Convertible Preferred Stock in the share count. |
The Foundation for a Wireless World.
CrownCastle.com
News Release continued: | Page 4 | |
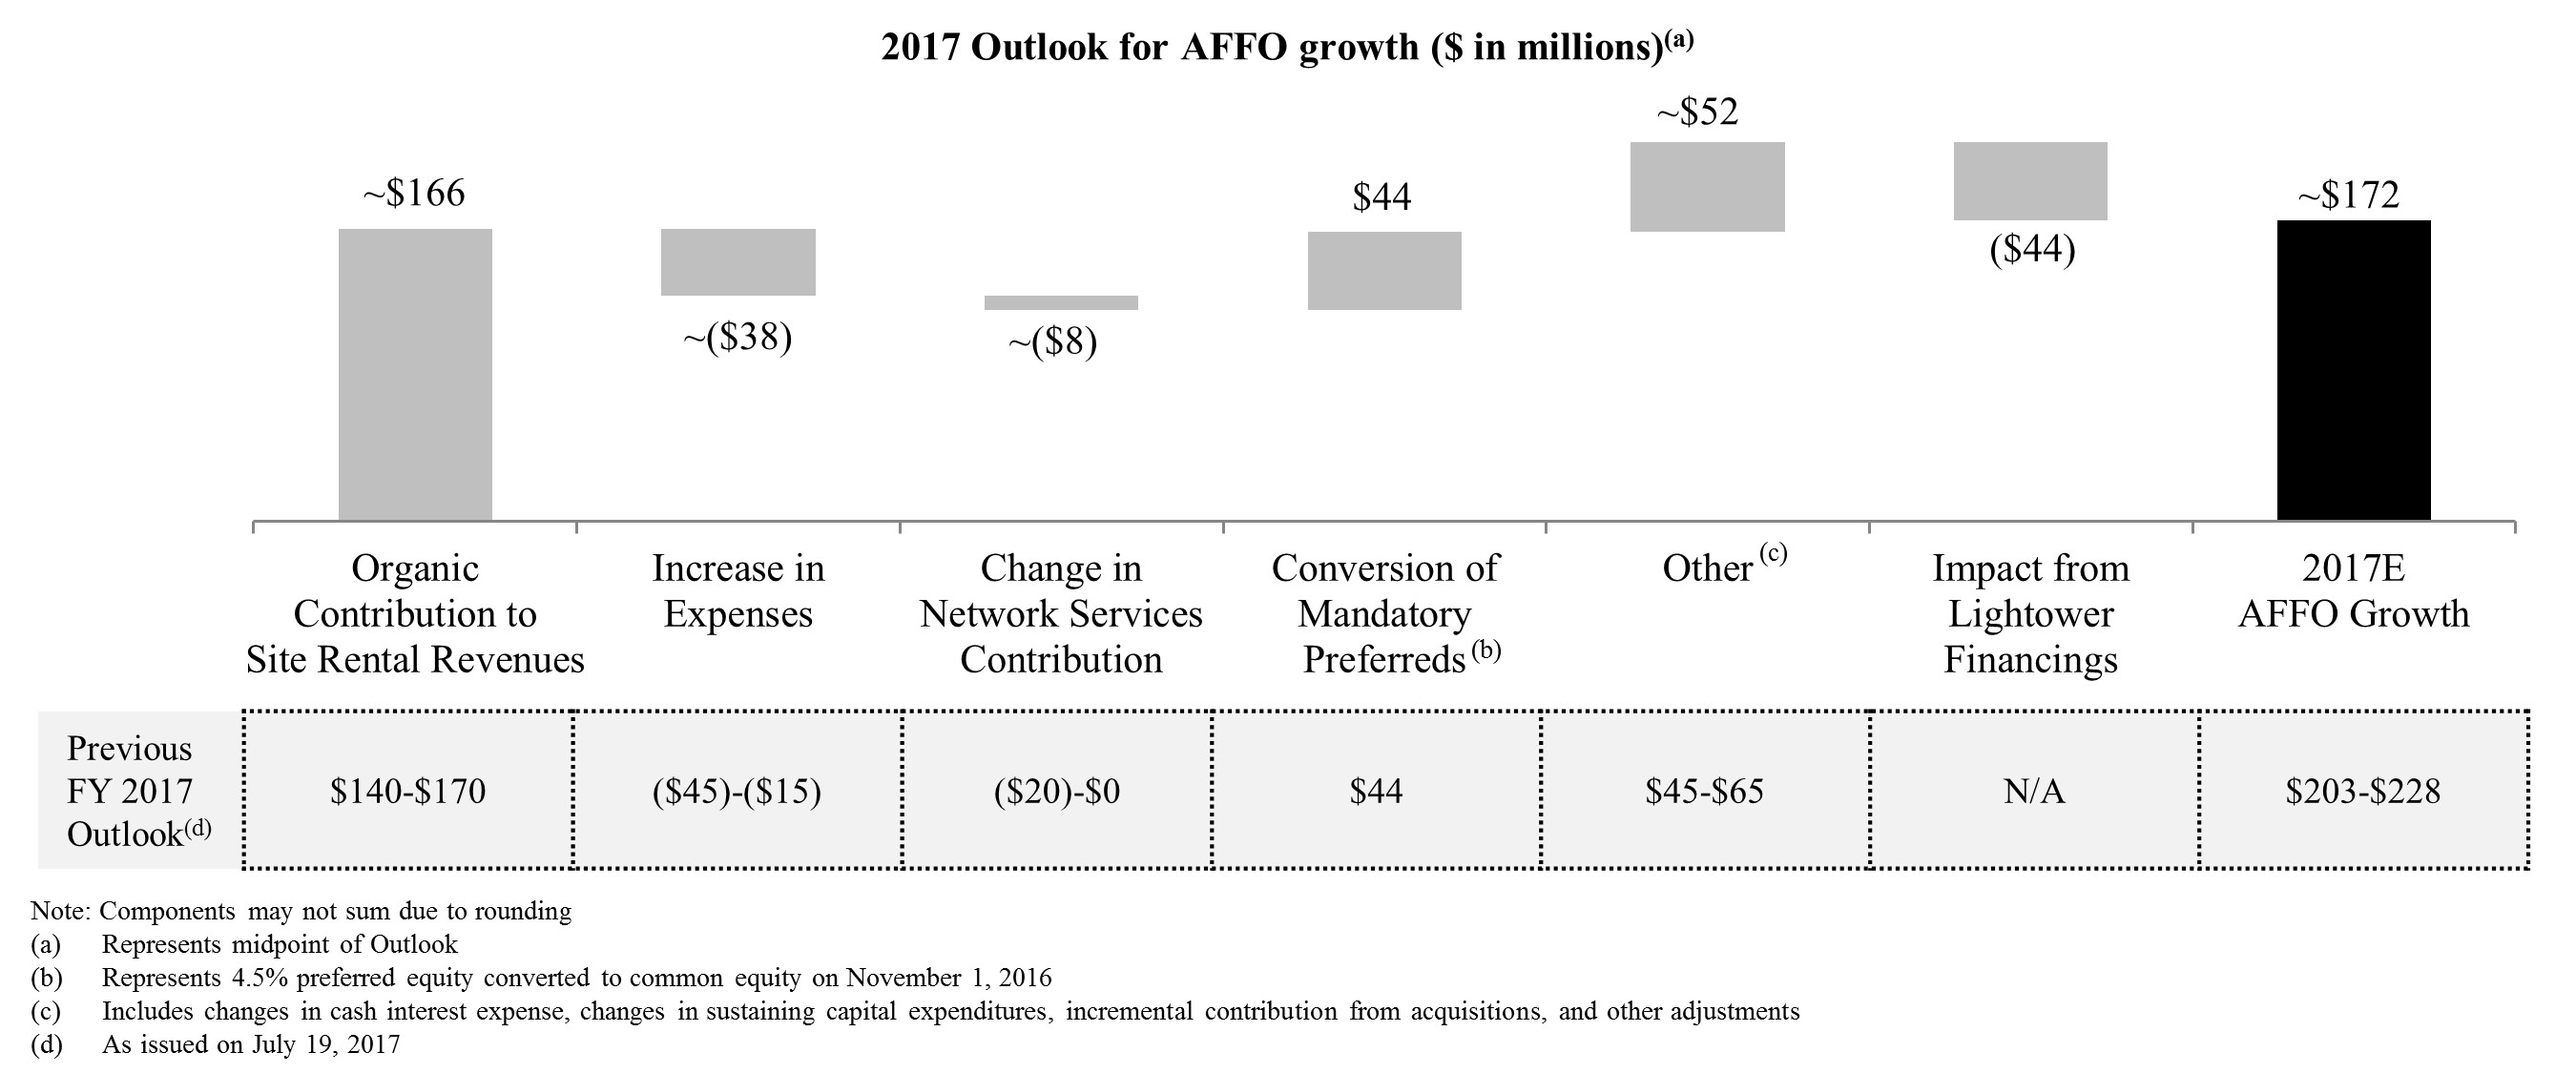
• | The updated full year 2017 Outlook primarily reflects higher than expected results from the third quarter and an expectation of continued strong leasing activity during the fourth quarter, offset by higher repair and maintenance expenses associated with hurricanes Harvey, Irma and Maria. |
• | The full year 2017 Outlook for AFFO is negatively impacted by $44 million from interest expense, net of interest income, and cash dividends paid on preferred stock as a result of the Lightower Financings. Excluding the impact of the Lightower Financings, the midpoint of the updated full year 2017 Outlook for AFFO is unchanged compared to our previous full year 2017 Outlook at approximately $1.826 billion. Except for the impact from the Lightower Financings, the updated full year 2017 Outlook does not include any contribution from the pending acquisition of Lightower, which is expected to close by year-end 2017. |
• | The chart below reconciles the components of expected growth in AFFO from 2016 to 2017 of approximately $172 million at the midpoint. |
Full Year 2018 Outlook
The table below compares the midpoint of the full year 2018 Outlook and the midpoint of the currently provided full year 2017 Outlook for select metrics.
Midpoint of FY 2018 Outlook to Midpoint of FY 2017 Outlook | ||||
(in millions) | Current Full Year 2018 Outlook(a) | Current Full Year 2017 Outlook(a) | Change | % Change |
Site rental revenues | $4,569 | $3,525 | +$1,044 | +30% |
Net income (loss) | $555 | $451 | +$104 | +23% |
Adjusted EBITDA(b) | $3,036 | $2,402 | +$634 | +26% |
AFFO(b)(d) | $2,242 | $1,782 | +$460 | +26% |
Weighted-average common shares outstanding - diluted(c) | 408 | 383 | +25 | +7% |
(a) | Except for the impact related to the Lightower Financings, the full year 2017 Outlook does not include any contribution from the pending acquisition of Lightower, which is expected to close by year-end 2017. Full year 2018 Outlook includes the expected contribution from the pending acquisition of Lightower. |
(b) | See reconciliation of this non-GAAP financial measure to net income (loss) and definition included herein. |
The Foundation for a Wireless World.
CrownCastle.com
News Release continued: | Page 5 | |
(c) | The assumption for full year 2017 and full year 2018 diluted weighted-average common shares outstanding is based on diluted common shares outstanding as of September 30, 2017. For all periods presented, the diluted weighted-average common shares outstanding assumes no conversion of the 6.875% Mandatory Convertible Preferred Stock in the share count. |
(d) | Our AFFO for historical periods may not be comparable to those periods presented prospectively from and after January 1, 2018, including our full year 2018 Outlook herein. See "Sustaining capital expenditures" and "Integration capital expenditures" within "Non-GAAP Financial Measures, Segment Measures and Other Calculations" for further information. |
• | The full year 2018 Outlook includes the expected contribution from the pending acquisition of Lightower, which is assumed to close on December 31, 2017 for purposes of the full year 2017 Outlook and full year 2018 Outlook. As previously disclosed, for 2018, the pending acquisition of Lightower is expected to contribute $850 million to $870 million in site rental revenues, $163 million to $213 million in net income, $510 million to $530 million in Adjusted EBITDA and $465 million to $485 million in AFFO before financing costs. Further, during 2018, Crown Castle expects to incur integration costs of approximately $20 million to $40 million and integration capital expenditures of approximately $20 million to $25 million related to the pending acquisition of Lightower. |
• | The chart below reconciles the components of expected growth in site rental revenues from 2017 to 2018 of $1.020 billion to $1.065 billion, inclusive of expected Organic Contribution to Site Rental Revenues during 2018 of $185 million to $225 million compared to the midpoint of full year 2017 Outlook of $166 million. |
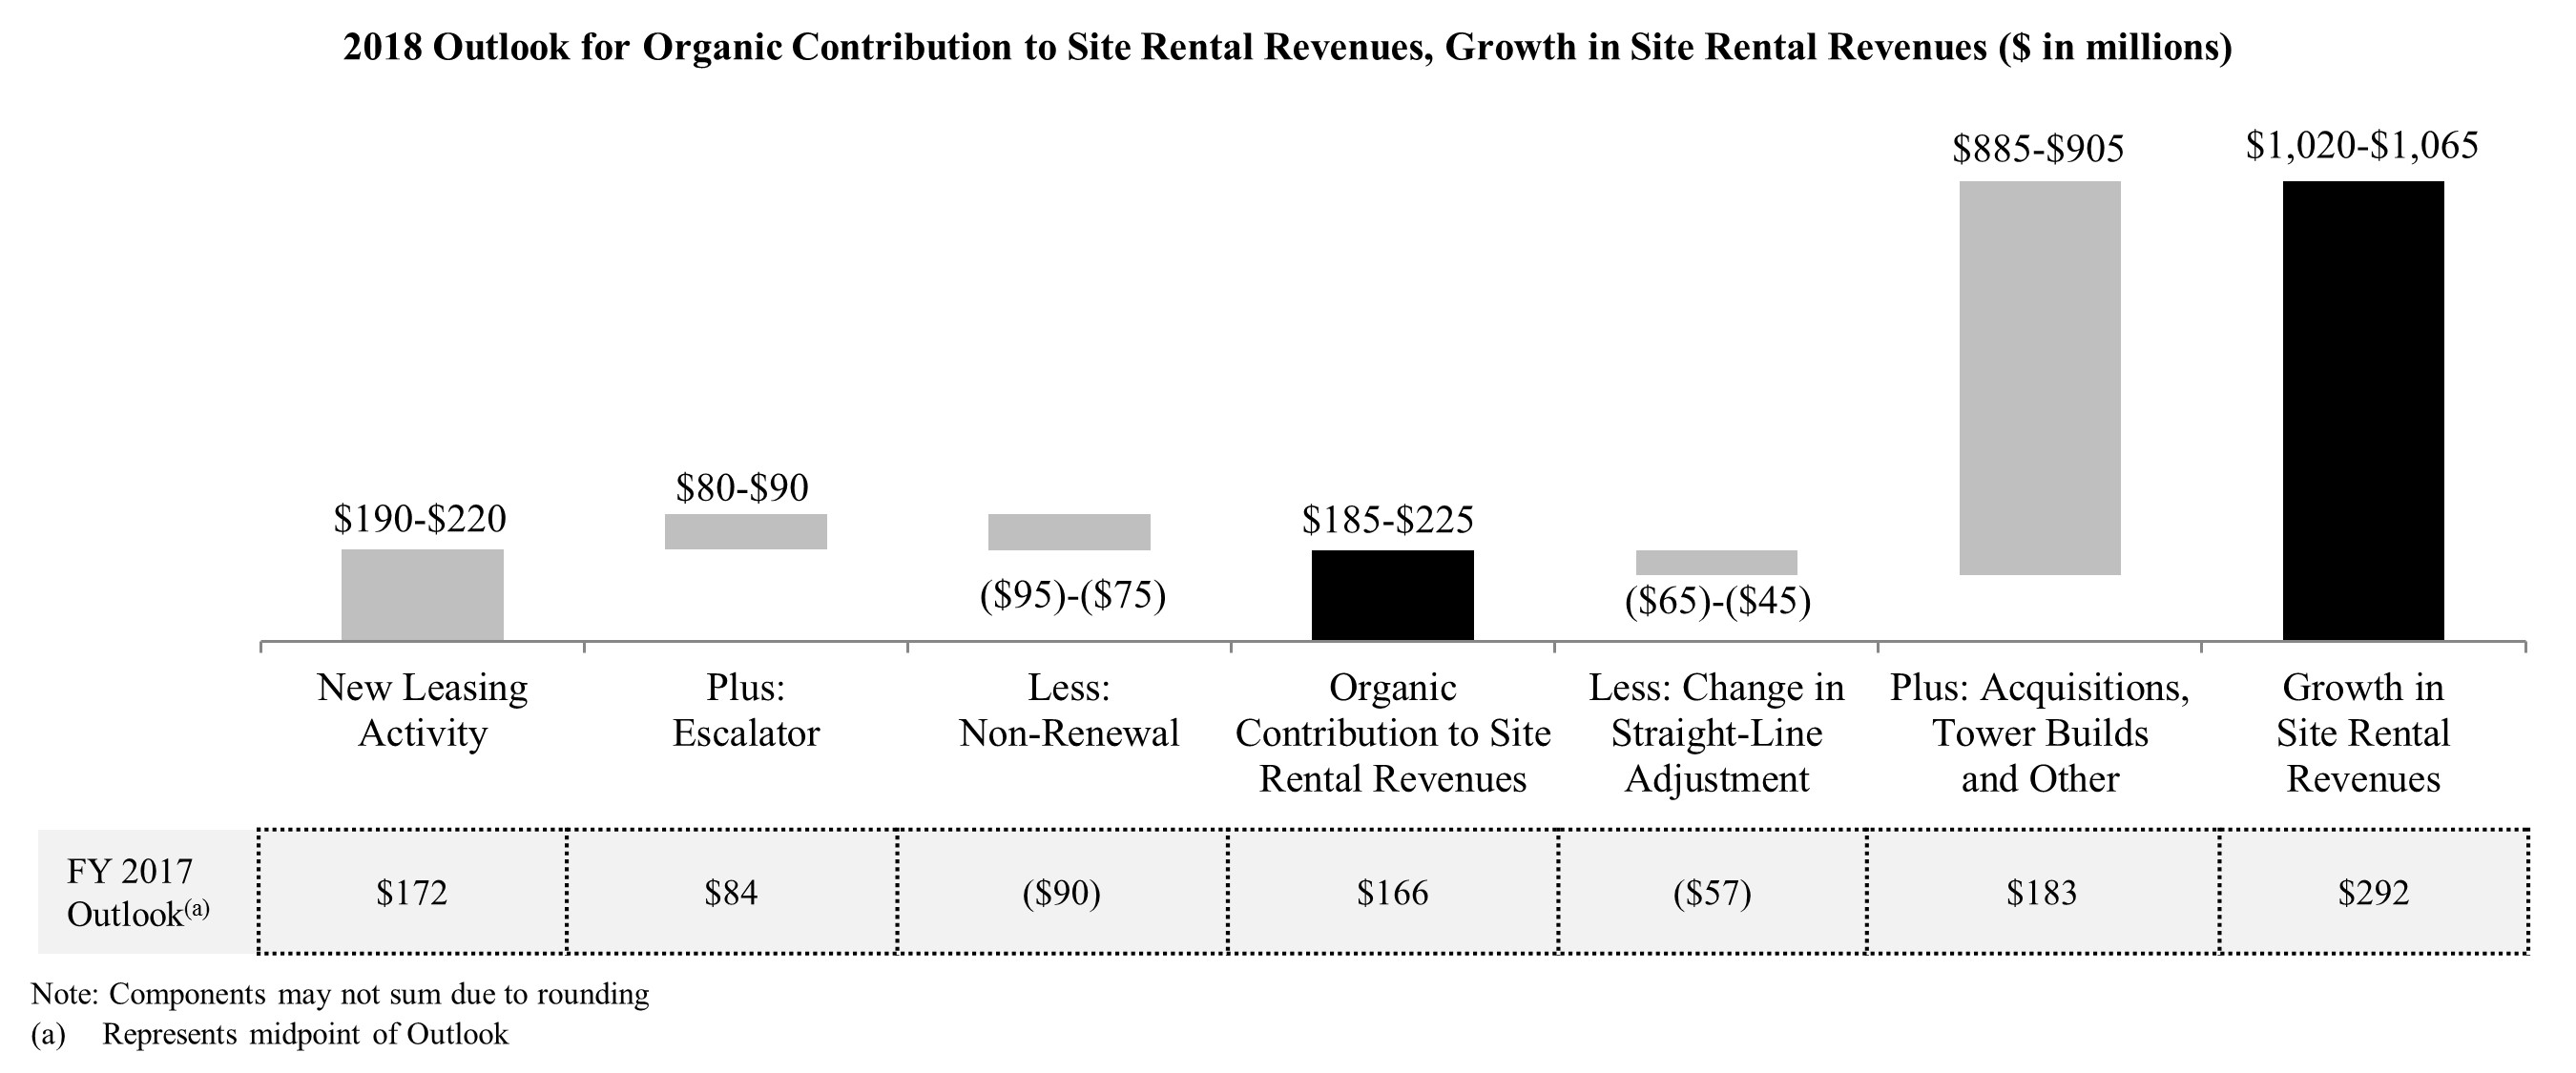
• | New leasing activity is expected to contribute $190 million to $220 million to 2018 Organic Contribution to Site Rental Revenues, consisting of new leasing activity from Towers of $100 million to $115 million and Small Cells of $90 million to $105 million. In comparison to full year 2017, Towers new leasing activity is expected to be modestly higher, and Small Cells new leasing activity is expected to increase by approximately $30 million. |
• | Acquisitions of FPL FiberNet Holdings, LLC ("FiberNet") and Wilcon Holdings LLC ("Wilcon"), both of which closed during 2017, and the pending acquisition of Lightower are collectively expected to contribute between $885 million and $905 million to site rental revenues during 2018. |
The Foundation for a Wireless World.
CrownCastle.com
News Release continued: | Page 6 | |
• | The chart below reconciles the components of expected growth in AFFO from 2017 to 2018 of between $440 million and $480 million. |
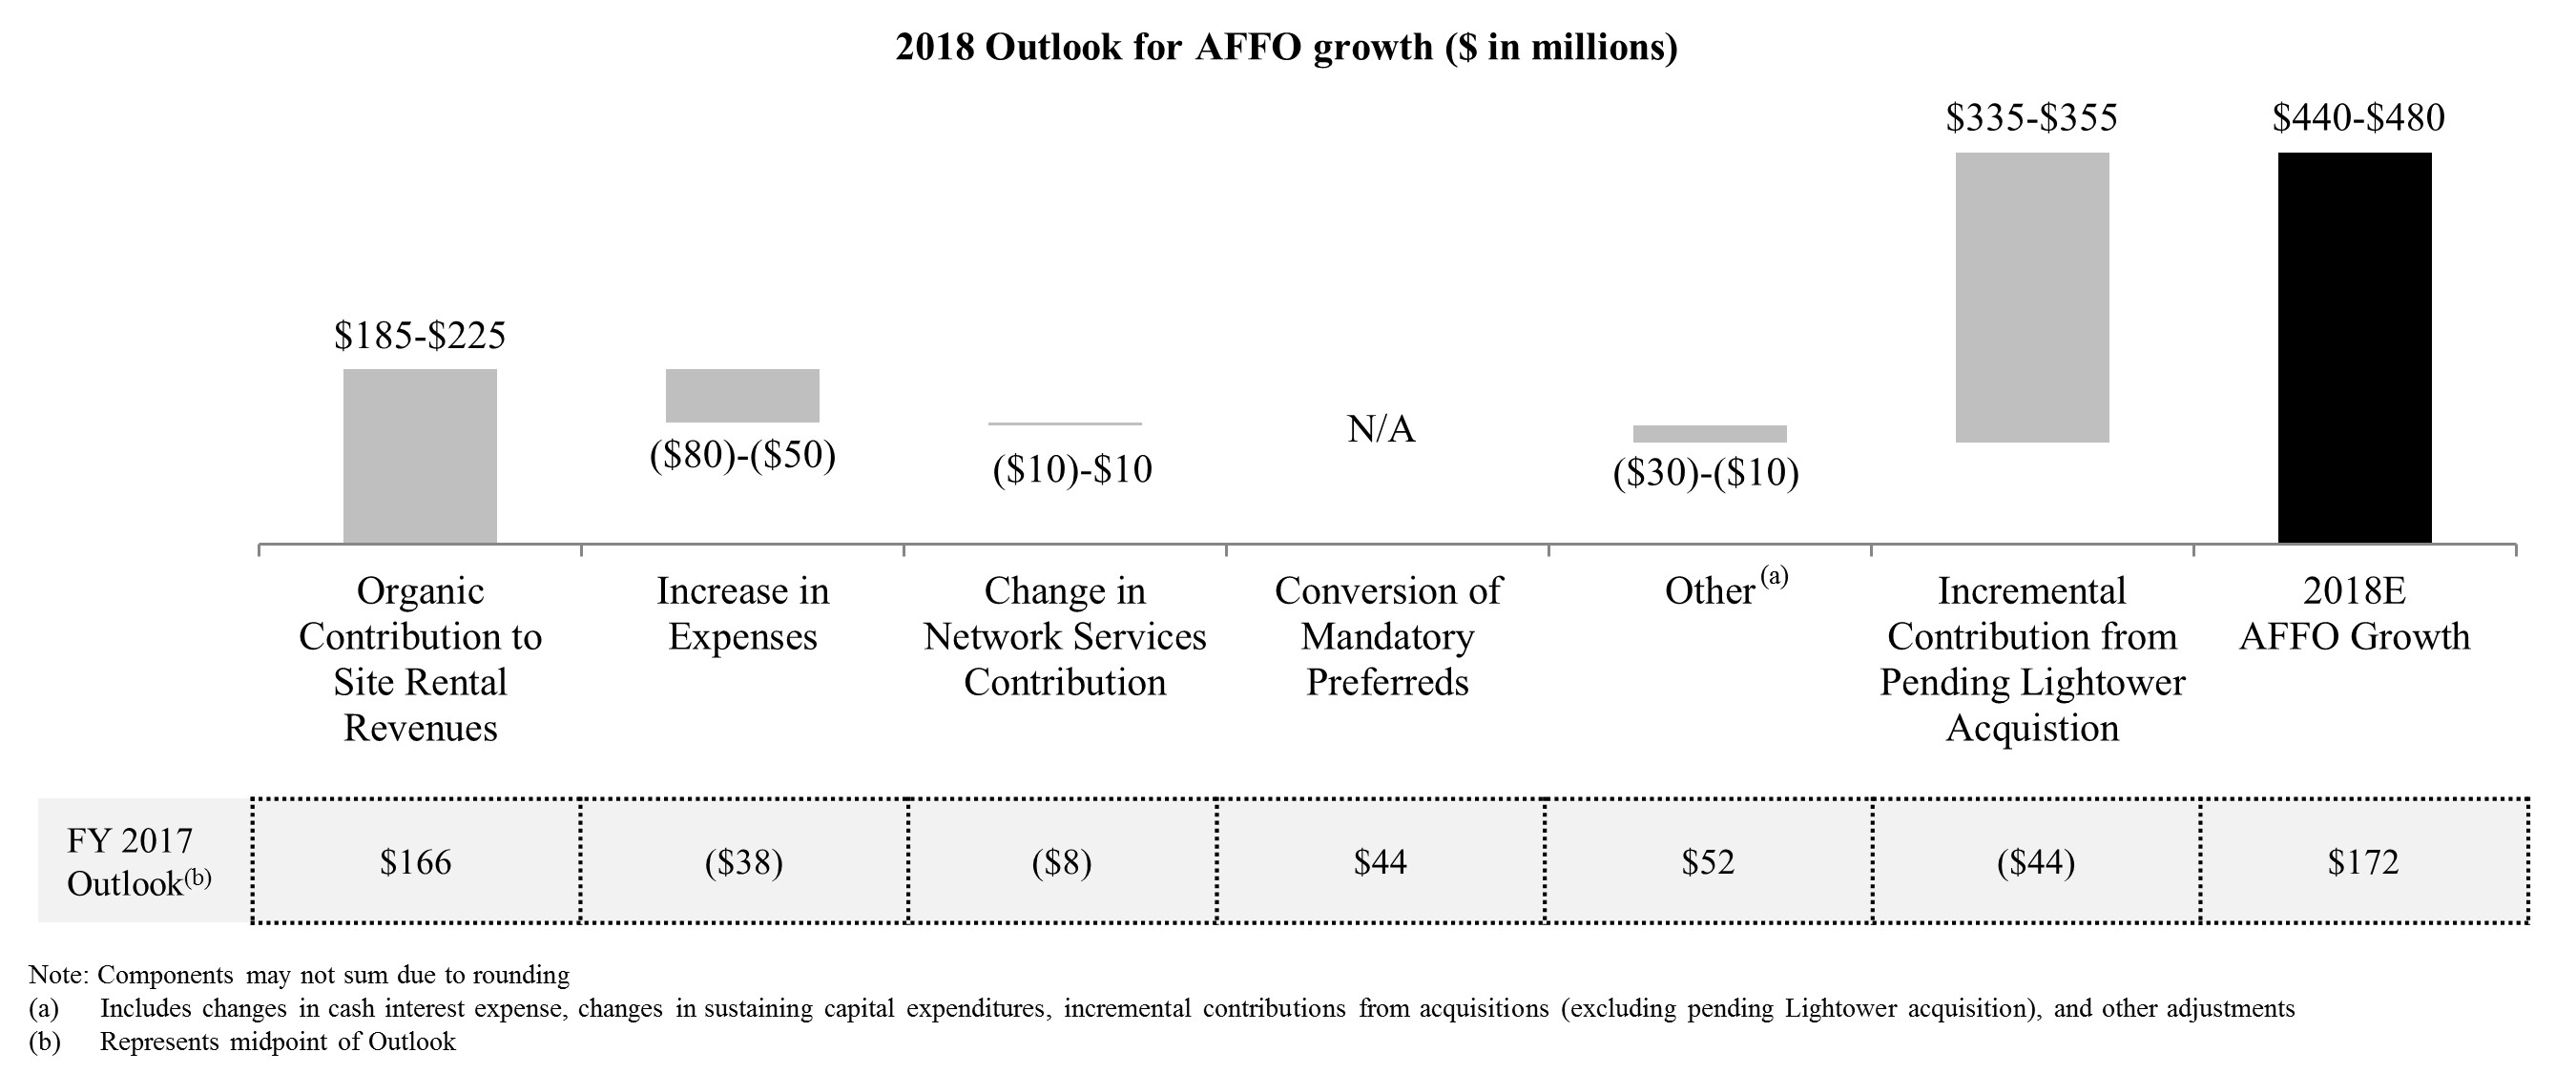
• | Incremental contribution to AFFO from the pending acquisition of Lightower is expected to be approximately $335 million to $355 million, net of the incremental financing expenses compared to 2017. |
• | Additional information is available in Crown Castle's quarterly Supplemental Information Package posted in the Investors section of its website. |
CONFERENCE CALL DETAILS
Crown Castle has scheduled a conference call for Thursday, October 19, 2017, at 10:30 a.m. Eastern time to discuss its third quarter 2017 results. The conference call may be accessed by dialing 888-211-9963 and asking for the Crown Castle call (access code 7075767) at least 30 minutes prior to the start time. The conference call may also be accessed live over the Internet at http://investor.crowncastle.com. Supplemental materials for the call have been posted on the Crown Castle website at http://investor.crowncastle.com.
A telephonic replay of the conference call will be available from 1:30 p.m. Eastern time on Thursday, October 19, 2017, through 1:30 p.m. Eastern time on Wednesday, January 17, 2018, and may be accessed by dialing 888-203-1112 and using access code 7075767. An audio archive will also be available on the company's website at http://investor.crowncastle.com shortly after the call and will be accessible for approximately 90 days.
ABOUT CROWN CASTLE
Crown Castle provides wireless carriers with the infrastructure they need to keep people connected and businesses running. With approximately 40,000 towers and over 60,000 route miles of fiber supporting small cells following the completion of the Lightower acquisition, Crown Castle is the nation's largest provider of shared wireless infrastructure with a significant presence in the top 100 U.S. markets. For more information on Crown Castle, please visit www.crowncastle.com.
The Foundation for a Wireless World.
CrownCastle.com
News Release continued: | Page 7 | |
Non-GAAP Financial Measures, Segment Measures and Other Calculations
This press release includes presentations of Adjusted EBITDA, Adjusted Funds from Operations ("AFFO"), Funds from Operations ("FFO") and Organic Contribution to Site Rental Revenues, which are non-GAAP financial measures. These non-GAAP financial measures are not intended as alternative measures of operating results or cash flow from operations (as determined in accordance with Generally Accepted Accounting Principles ("GAAP")).
Our measures of Adjusted EBITDA, AFFO, FFO and Organic Contribution to Site Rental Revenues may not be comparable to similarly titled measures of other companies, including other companies in the wireless infrastructure sector or other real estate investment trusts ("REITs"). Our definition of FFO is consistent with guidelines from the National Association of Real Estate Investment Trusts with the exception of the impact of income taxes in periods prior to our REIT conversion.
In addition to the non-GAAP financial measures used herein, we also provide Segment Site Rental Gross Margin, Segment Network Services and Other Gross Margin and Segment Operating Profit, which are key measures used by management to evaluate our operating segments for purposes of making decisions about allocating capital and assessing performance. These segment measures are provided pursuant to GAAP requirements related to segment reporting. In addition, we provide the components of certain GAAP measures, such as capital expenditures.
Adjusted EBITDA, AFFO, FFO and Organic Contribution to Site Rental Revenues are presented as additional information because management believes these measures are useful indicators of the financial performance of our business. Among other things, management believes that:
• | Adjusted EBITDA is useful to investors or other interested parties in evaluating our financial performance. Adjusted EBITDA is the primary measure used by management (1) to evaluate the economic productivity of our operations and (2) for purposes of making decisions about allocating resources to, and assessing the performance of, our operations. Management believes that Adjusted EBITDA helps investors or other interested parties meaningfully evaluate and compare the results of our operations (1) from period to period and (2) to our competitors, by removing the impact of our capital structure (primarily interest charges from our outstanding debt) and asset base (primarily depreciation, amortization and accretion) from our financial results. Management also believes Adjusted EBITDA is frequently used by investors or other interested parties in the evaluation of the wireless infrastructure sector and other REITs to measure financial performance without regard to items such as depreciation, amortization and accretion which can vary depending upon accounting methods and the book value of assets. In addition, Adjusted EBITDA is similar to the measure of current financial performance generally used in our debt covenant calculations. Adjusted EBITDA should be considered only as a supplement to net income computed in accordance with GAAP as a measure of our performance. |
• | AFFO is useful to investors or other interested parties in evaluating our financial performance. Management believes that AFFO helps investors or other interested parties meaningfully evaluate our financial performance as it includes (1) the impact of our capital structure (primarily interest expense on our outstanding debt and dividends on our preferred stock) and (2) sustaining capital expenditures, and excludes the impact of our (a) asset base (primarily depreciation, amortization and accretion) and (b) certain non-cash items, including straight-lined revenues and expenses related to fixed escalations and rent free periods. GAAP requires rental revenues and expenses related to leases that contain specified rental increases over the life of the lease to be recognized evenly over the life of the lease. In accordance with GAAP, if payment terms call for fixed escalations, or rent free periods, the revenue or expense is recognized on a straight-lined basis over the fixed, non-cancelable term of the contract. Management notes that Crown Castle uses AFFO only as a performance measure. AFFO should be considered only as a supplement to net income computed in accordance with GAAP as a measure of our performance and should not be considered as an alternative to cash flows from operations or as residual cash flow available for discretionary investment. |
• | FFO is useful to investors or other interested parties in evaluating our financial performance. Management believes that FFO may be used by investors or other interested parties as a basis to compare our financial performance with that of other REITs. FFO helps investors or other interested parties meaningfully evaluate financial performance by excluding the impact of our asset base (primarily depreciation, amortization and accretion). FFO is not a key performance indicator used by Crown Castle. FFO should be considered only as a supplement to net income computed in accordance with GAAP as a measure of our performance and should not be considered as an alternative to cash flow from operations. |
The Foundation for a Wireless World.
CrownCastle.com
News Release continued: | Page 8 | |
• | Organic Contribution to Site Rental Revenues is useful to investors or other interested parties in understanding the components of the year-over-year changes in our site rental revenues computed in accordance with GAAP. Management uses the Organic Contribution to Site Rental Revenues to assess year-over-year growth rates for our rental activities, to evaluate current performance, to capture trends in rental rates, new leasing activities and customer non-renewals in our core business, as well to forecast future results. Organic Contribution to Site Rental Revenues is not meant as an alternative measure of revenue and should be considered only as a supplement in understanding and assessing the performance of our site rental revenues computed in accordance with GAAP. |
We define our non-GAAP financial measures, segment measures and other calculations as follows:
Non-GAAP Financial Measures
Adjusted EBITDA. We define Adjusted EBITDA as net income (loss) plus restructuring charges (credits), asset write-down charges, acquisition and integration costs, depreciation, amortization and accretion, amortization of prepaid lease purchase price adjustments, interest expense and amortization of deferred financing costs, gains (losses) on retirement of long-term obligations, net gain (loss) on interest rate swaps, gains (losses) on foreign currency swaps, impairment of available-for-sale securities, interest income, other income (expense), benefit (provision) for income taxes, cumulative effect of a change in accounting principle, income (loss) from discontinued operations and stock-based compensation expense.
Adjusted Funds from Operations. We define Adjusted Funds from Operations as FFO before straight-lined revenue, straight-lined expense, stock-based compensation expense, non-cash portion of tax provision, non-real estate related depreciation, amortization and accretion, amortization of non-cash interest expense, other (income) expense, gain (loss) on retirement of long-term obligations, net gain (loss) on interest rate swaps, gains (losses) on foreign currency swaps, acquisition and integration costs, and adjustments for noncontrolling interests, and less capital improvement capital expenditures and corporate capital expenditures (i.e., sustaining capital expenditures). See "Sustaining capital expenditures" and "Integration capital expenditures" below for further information regarding our calculation of certain components of AFFO.
Funds from Operations. We define Funds from Operations as net income plus real estate related depreciation, amortization and accretion and asset write-down charges, less noncontrolling interest and cash paid for preferred stock dividends, and is a measure of funds from operations attributable to CCIC common stockholders.
Organic Contribution to Site Rental Revenues. We define the Organic Contribution to Site Rental Revenues as the sum of the change in GAAP site rental revenues related to (1) new leasing activity, including revenues from the construction of small cells and the impact of prepaid rent, (2) escalators and less (3) non-renewals of customer contracts.
Segment Measures
Segment Site Rental Gross Margin. We define Segment Site Rental Gross Margin as segment site rental revenues less segment site rental cost of operations, excluding stock-based compensation expense and prepaid lease purchase price adjustments recorded in consolidated site rental cost of operations.
Segment Network Services and Other Gross Margin. We define Segment Network Services and Other Gross Margin as segment network services and other revenues less segment network services and other cost of operations, excluding stock-based compensation expense recorded in consolidated network services and other cost of operations.
Segment Operating Profit. We define Segment Operating Profit as segment revenues less segment cost of operations and segment general and administrative expenses, excluding stock-based compensation expense and prepaid lease purchase price adjustments recorded in cost of operations.
Other Calculations
Discretionary capital expenditures. We define discretionary capital expenditures as those capital expenditures made with respect to activities which we believe exhibit sufficient potential to enhance long-term stockholder value. They consist of (1) improvements to existing wireless infrastructure and construction of new wireless infrastructure (collectively referred to as "revenue generating") and (2) purchases of land assets under towers as we seek to manage our interests in the land beneath our towers.
Sustaining capital expenditures. We define sustaining capital expenditures as those capital expenditures made with respect to either (1) corporate capital expenditures, such as buildings, information technology equipment and office equipment or (2) capital improvement capital expenditures to our wireless infrastructure assets that enable our customers' ongoing quiet enjoyment of the wireless infrastructure. For periods presented prior to 2018, integration capital expenditures are included within sustaining capital expenditures, as discussed in "Integration capital expenditures" below.
The Foundation for a Wireless World.
CrownCastle.com
News Release continued: | Page 9 | |
Integration capital expenditures. Upon the closing of the pending Lightower acquisition, we anticipate incurring initial capital expenditures related to integrating Lightower into our existing business. We anticipate that the majority of these expected capital expenditures will primarily relate to the overall integration of Lightower’s information technology assets into our business. We believe these expenditures are not indicative of our ongoing financial performance, and therefore their inclusion in our AFFO may hinder usefulness to investors and other interested parties. Moreover, integration capital expenditures were approximately $3.2 million, $0.1 million, and $0.1 million for the nine months ended September 30, 2017 and the years ended December 31, 2016 and 2015, respectively, and as such, we believe that these costs have not previously been significant enough to warrant separate consideration with regard to the impact to AFFO.
As such, for periods presented prior to 2018, integration capital expenditures were included as a component within sustaining capital expenditures. For periods presented beginning January 1, 2018, including our full year 2018 Outlook included herein, we no longer reflect integration capital expenditures within sustaining capital expenditures and consider integration capital expenditures as its own component of our capital expenditures.
Because of our reclassification of integration capital expenditures, our AFFO for historical periods may not be comparable to those periods presented prospectively from and after January 1, 2018, including our full year 2018 Outlook herein.
We define integration capital expenditures as those capital expenditures made specifically with respect to recent acquisitions that are essential to integrating acquired companies into our business.
The tables set forth below reconcile the non-GAAP financial measures used herein to comparable GAAP financial measures. The components in these tables may not sum to the total due to rounding.
The Foundation for a Wireless World.
CrownCastle.com
News Release continued: | Page 10 | |
Reconciliations of Non-GAAP Financial Measures, Segment Measures and Other Calculations to Comparable GAAP Financial Measures:
Reconciliation of Historical Adjusted EBITDA:
For the Three Months Ended | For the Twelve Months Ended | ||||||||||
September 30, 2017 | September 30, 2016 | December 31, 2016 | |||||||||
(in millions) | |||||||||||
Net income (loss) | $ | 115.2 | $ | 98.4 | $ | 357.0 | |||||
Adjustments to increase (decrease) net income (loss): | |||||||||||
Asset write-down charges | 5.3 | 8.3 | 34.5 | ||||||||
Acquisition and integration costs | 13.2 | 2.7 | 17.5 | ||||||||
Depreciation, amortization and accretion | 296.0 | 280.8 | 1,108.6 | ||||||||
Amortization of prepaid lease purchase price adjustments | 5.0 | 5.4 | 21.3 | ||||||||
Interest expense and amortization of deferred financing costs(a) | 154.1 | 129.9 | 515.0 | ||||||||
Gains (losses) on retirement of long-term obligations | — | 10.3 | 52.3 | ||||||||
Interest income | (11.2 | ) | (0.2 | ) | (0.8 | ) | |||||
Other income (expense) | — | 0.8 | 8.8 | ||||||||
Benefit (provision) for income taxes | 2.4 | 5.0 | 16.9 | ||||||||
Stock-based compensation expense | 24.7 | 22.6 | 96.5 | ||||||||
Adjusted EBITDA(b)(c) | $ | 604.8 | $ | 564.1 | $ | 2,227.5 | |||||
(a) | See the reconciliation of "components of interest expense and amortization of deferred financing costs" herein for a discussion of non-cash interest expense. |
(b) | See "Non-GAAP Financial Measures, Segment Measures and Other Calculations" herein for a discussion of our definition of Adjusted EBITDA. |
(c) | The above reconciliation excludes line items included in our definition which are not applicable for the periods shown. |
Reconciliation of Current Outlook for Adjusted EBITDA:
Q4 2017 | Full Year 2017 | Full Year 2018 | |||||||||
(in millions) | Outlook | Outlook | Outlook | ||||||||
Net income (loss) | $91 | to | $116 | $438 | to | $463 | $515 | to | $595 | ||
Adjustments to increase (decrease) net income (loss): | |||||||||||
Asset write-down charges | $9 | to | $11 | $19 | to | $21 | $35 | to | $45 | ||
Acquisition and integration costs | $11 | to | $15 | $38 | to | $42 | $64 | to | $74 | ||
Depreciation, amortization and accretion | $296 | to | $310 | $1,176 | to | $1,190 | $1,508 | to | $1,544 | ||
Amortization of prepaid lease purchase price adjustments | $4 | to | $6 | $19 | to | $21 | $19 | to | $21 | ||
Interest expense and amortization of deferred financing costs(a) | $159 | to | $164 | $590 | to | $595 | $644 | to | $689 | ||
Gains (losses) on retirement of long-term obligations | $0 | to | $0 | $4 | to | $4 | $0 | to | $0 | ||
Interest income | $(1) | to | $1 | $(14) | to | $(12) | $(2) | to | $2 | ||
Other income (expense) | $(1) | to | $3 | $(4) | to | $0 | $3 | to | $5 | ||
Benefit (provision) for income taxes | $3 | to | $7 | $14 | to | $18 | $32 | to | $40 | ||
Stock-based compensation expense | $23 | to | $25 | $89 | to | $91 | $115 | to | $120 | ||
Adjusted EBITDA(b)(c) | $624 | to | $629 | $2,399 | to | $2,404 | $3,013 | to | $3,058 | ||
(a) | See the reconciliation of "components of interest expense and amortization of deferred financing costs" herein for a discussion of non-cash interest expense. |
(b) | See "Non-GAAP Financial Measures, Segment Measures and Other Calculations" herein for a discussion of our definition of Adjusted EBITDA. |
(c) | The above reconciliation excludes line items included in our definition which are not applicable for the periods shown. |
The Foundation for a Wireless World.
CrownCastle.com
News Release continued: | Page 11 | |
Reconciliation of Historical FFO and AFFO:
For the Three Months Ended | For the Nine Months Ended | For the Twelve Months Ended | |||||||||||||||||
(in millions) | September 30, 2017 | September 30, 2016 | September 30, 2017 | September 30, 2016 | December 31, 2016 | ||||||||||||||
Net income (loss) | $ | 115.2 | $ | 98.4 | $ | 346.4 | $ | 232.3 | $ | 357.0 | |||||||||
Real estate related depreciation, amortization and accretion | 287.9 | 274.2 | 857.3 | 815.1 | 1,082.1 | ||||||||||||||
Asset write-down charges | 5.3 | 8.3 | 10.3 | 28.3 | 34.5 | ||||||||||||||
Dividends on preferred stock | — | (11.0 | ) | — | (33.0 | ) | (44.0 | ) | |||||||||||
FFO(a)(b)(c)(d)(e) | $ | 408.4 | $ | 369.9 | $ | 1,214.0 | $ | 1,042.6 | $ | 1,429.5 | |||||||||
FFO (from above) | $ | 408.4 | $ | 369.9 | $ | 1,214.0 | $ | 1,042.6 | $ | 1,429.5 | |||||||||
Adjustments to increase (decrease) FFO: | |||||||||||||||||||
Straight-lined revenue | 3.4 | (8.8 | ) | 3.0 | (42.4 | ) | (47.4 | ) | |||||||||||
Straight-lined expense | 24.0 | 23.5 | 69.9 | 71.1 | 94.2 | ||||||||||||||
Stock-based compensation expense | 24.7 | 22.6 | 66.5 | 75.3 | 96.5 | ||||||||||||||
Non-cash portion of tax provision | (1.5 | ) | 3.5 | (2.7 | ) | 5.2 | 7.3 | ||||||||||||
Non-real estate related depreciation, amortization and accretion | 8.1 | 6.6 | 22.9 | 19.6 | 26.5 | ||||||||||||||
Amortization of non-cash interest expense | 2.4 | 3.3 | 7.6 | 11.3 | 14.3 | ||||||||||||||
Other (income) expense | — | 0.8 | (3.5 | ) | 4.6 | 8.8 | |||||||||||||
Gains (losses) on retirement of long-term obligations | — | 10.3 | 3.5 | 52.3 | 52.3 | ||||||||||||||
Acquisition and integration costs | 13.2 | 2.7 | 27.1 | 11.5 | 17.5 | ||||||||||||||
Capital improvement capital expenditures | (10.9 | ) | (10.0 | ) | (27.3 | ) | (25.4 | ) | (42.8 | ) | |||||||||
Corporate capital expenditures | (13.4 | ) | (8.5 | ) | (32.4 | ) | (22.4 | ) | (46.9 | ) | |||||||||
AFFO(a)(b)(c)(d)(e) | $ | 458.5 | $ | 415.8 | $ | 1,348.6 | $ | 1,203.5 | $ | 1,609.9 | |||||||||
(a) | See "Non-GAAP Financial Measures, Segment Measures and Other Calculations" herein for a discussion of our definitions of FFO and AFFO. |
(b) | FFO and AFFO are reduced by cash paid for preferred stock dividends during the period in which they are paid. |
(c) | Diluted weighted-average common shares outstanding were 397.0 million, 338.4 million, 375.0 million, 337.1 million and 340.9 million for the three months ended September 30, 2017 and 2016, the nine months ended September 30, 2017 and 2016 and the twelve months ended December 31, 2016, respectively. For all periods presented, the diluted weighted-average common shares outstanding assumes no conversion of the 6.875% Mandatory Convertible Preferred Stock in the share count. |
(d) | The above reconciliation excludes line items included in our definition which are not applicable for the periods shown. |
(e) | Attributable to CCIC common stockholders. |
The Foundation for a Wireless World.
CrownCastle.com
News Release continued: | Page 12 | |
Reconciliation of Current Outlook for FFO and AFFO:
Q4 2017 | Full Year 2017 | Full Year 2018 | |||||||||
(in millions) | Outlook | Outlook | Outlook | ||||||||
Net income (loss) | $91 | to | $116 | $438 | to | $463 | $515 | to | $595 | ||
Real estate related depreciation, amortization and accretion | $290 | to | $300 | $1,147 | to | $1,157 | $1,442 | to | $1,463 | ||
Asset write-down charges | $9 | to | $11 | $19 | to | $21 | $35 | to | $45 | ||
Dividends on preferred stock | $(30) | to | $(30) | $(30) | to | $(30) | $(113) | to | $(113) | ||
FFO(a)(b)(c)(d)(e) | $376 | to | $381 | $1,590 | to | $1,595 | $1,910 | to | $1,955 | ||
FFO (from above) | $376 | to | $381 | $1,590 | to | $1,595 | $1,910 | to | $1,955 | ||
Adjustments to increase (decrease) FFO: | |||||||||||
Straight-lined revenue | $5 | to | $10 | $8 | to | $13 | $57 | to | $77 | ||
Straight-lined expense | $20 | to | $25 | $90 | to | $95 | $70 | to | $90 | ||
Stock-based compensation expense | $23 | to | $25 | $89 | to | $91 | $115 | to | $120 | ||
Non-cash portion of tax provision | $(2) | to | $3 | $(4) | to | $1 | $(7) | to | $8 | ||
Non-real estate related depreciation, amortization and accretion | $6 | to | $10 | $29 | to | $33 | $66 | to | $81 | ||
Amortization of non-cash interest expense | $1 | to | $6 | $9 | to | $14 | $6 | to | $16 | ||
Other (income) expense | $(1) | to | $3 | $(4) | to | $0 | $3 | to | $5 | ||
Gains (losses) on retirement of long-term obligations | $0 | to | $0 | $4 | to | $4 | $0 | to | $0 | ||
Acquisition and integration costs | $11 | to | $15 | $38 | to | $42 | $64 | to | $74 | ||
Capital improvement capital expenditures | $(11) | to | $(6) | $(39) | to | $(34) | $(73) | to | $(63) | ||
Corporate capital expenditures | $(19) | to | $(14) | $(52) | to | $(47) | $(53) | to | $(43) | ||
AFFO(a)(b)(c)(d)(e)(f) | $430 | to | $435 | $1,779 | to | $1,784 | $2,219 | to | $2,264 | ||
(a) | The assumption for fourth quarter 2017, full year 2017 and full year 2018 diluted weighted-average common shares outstanding is 408.0 million, 383.4 million and 408.0 million, respectively, based on diluted common shares outstanding as of September 30, 2017. For all periods presented, the diluted weighted-average common shares outstanding assumes no conversion of 6.875% Mandatory Convertible Preferred Stock in the share count. |
(b) | See "Non-GAAP Financial Measures, Segment Measures and Other Calculations" herein for a discussion for our definitions of FFO and AFFO. |
(c) | FFO and AFFO are reduced by cash paid for preferred stock dividends during the period in which they are paid. |
(d) | The above reconciliation excludes line items included in our definition which are not applicable for the periods shown. |
(e) | Attributable to CCIC common stockholders. |
(f) | Our AFFO for historical periods may not be comparable to those periods presented prospectively from and after January 1, 2018, including our full year 2018 Outlook herein. See "Sustaining capital expenditures" and "Integration capital expenditures" within "Non-GAAP Financial Measures, Segment Measures and Other Calculations" for further information. |
The Foundation for a Wireless World.
CrownCastle.com
News Release continued: | Page 13 | |
For Comparative Purposes - Reconciliation of Previous Outlook for Adjusted EBITDA:
Previously Issued | Previously Issued | ||||||
Q3 2017 | Full Year 2017 | ||||||
(in millions) | Outlook | Outlook | |||||
Net income (loss) | $90 | to | $110 | $426 | to | $476 | |
Adjustments to increase (decrease) net income (loss): | |||||||
Asset write-down charges | $9 | to | $11 | $20 | to | $30 | |
Acquisition and integration costs | $8 | to | $12 | $28 | to | $38 | |
Depreciation, amortization and accretion | $296 | to | $310 | $1,178 | to | $1,208 | |
Amortization of prepaid lease purchase price adjustments | $4 | to | $6 | $19 | to | $21 | |
Interest expense and amortization of deferred financing costs | $142 | to | $147 | $552 | to | $582 | |
Gains (losses) on retirement of long-term obligations | $0 | to | $0 | $4 | to | $4 | |
Interest income | $(1) | to | $1 | $(3) | to | $1 | |
Other income (expense) | $(1) | to | $3 | $(2) | to | $0 | |
Benefit (provision) for income taxes | $3 | to | $7 | $14 | to | $22 | |
Stock-based compensation expense | $24 | to | $26 | $89 | to | $94 | |
Adjusted EBITDA(a)(b) | $600 | to | $605 | $2,389 | to | $2,414 | |
(a) | See "Non-GAAP Financial Measures, Segment Measures and Other Calculations" herein for a discussion of our definition of Adjusted EBITDA. |
(b) | The above reconciliation excludes line items included in our definition which are not applicable for the periods shown. |
For Comparative Purposes - Reconciliation of Previous Outlook for FFO and AFFO:
Previously Issued | Previously Issued | ||||||
Q3 2017 | Full Year 2017 | ||||||
(in millions) | Outlook | Outlook | |||||
Net income (loss) | $90 | to | $110 | $426 | to | $476 | |
Real estate related depreciation, amortization and accretion | $291 | to | $301 | $1,154 | to | $1,174 | |
Asset write-down charges | $9 | to | $11 | $20 | to | $30 | |
FFO(a)(b)(c) | $404 | to | $409 | $1,623 | to | $1,653 | |
FFO (from above) | $404 | to | $409 | $1,623 | to | $1,653 | |
Adjustments to increase (decrease) FFO: | |||||||
Straight-lined revenue | $0 | to | $5 | $4 | to | $19 | |
Straight-lined expense | $20 | to | $25 | $81 | to | $96 | |
Stock-based compensation expense | $24 | to | $26 | $89 | to | $94 | |
Non-cash portion of tax provision | $(2) | to | $3 | $(6) | to | $4 | |
Non-real estate related depreciation, amortization and accretion | $5 | to | $9 | $24 | to | $34 | |
Amortization of non-cash interest expense | $2 | to | $5 | $9 | to | $15 | |
Other (income) expense | $(1) | to | $3 | $(2) | to | $0 | |
Gains (losses) on retirement of long-term obligations | $0 | to | $0 | $4 | to | $4 | |
Acquisition and integration costs | $8 | to | $12 | $28 | to | $38 | |
Capital improvement capital expenditures | $(15) | to | $(10) | $(41) | to | $(31) | |
Corporate capital expenditures | $(19) | to | $(14) | $(53) | to | $(43) | |
AFFO(a)(b)(c) | $447 | to | $452 | $1,813 | to | $1,838 | |
(a) | Previously issued third quarter 2017 and full year 2017 outlook assumes diluted common shares outstanding as of June 30, 2017 of approximately 367.5 million and 365.7 million, respectively. |
(b) | See "Non-GAAP Financial Measures, Segment Measures and Other Calculations" herein for a discussion for our definitions of FFO and AFFO. |
(c) | The above reconciliation excludes line items included in our definition which are not applicable for the periods shown. |
The Foundation for a Wireless World.
CrownCastle.com
News Release continued: | Page 14 | |
The components of changes in site rental revenues for the quarters ended September 30, 2017 and 2016 are as follows:
Three Months Ended September 30, | |||||||
(in millions) | 2017 | 2016 | |||||
Components of changes in site rental revenues(f): | |||||||
Prior year site rental revenues exclusive of straight-line associated with fixed escalators(a)(c) | $ | 803 | $ | 737 | |||
New leasing activity(a)(c) | 40 | 45 | |||||
Escalators | 21 | 22 | |||||
Non-renewals | (20 | ) | (20 | ) | |||
Organic Contribution to Site Rental Revenues(d) | 41 | 47 | |||||
Straight-lined revenues associated with fixed escalators | (3 | ) | 9 | ||||
Acquisitions and builds(b) | 52 | 19 | |||||
Other | — | — | |||||
Total GAAP site rental revenues | $ | 893 | $ | 812 | |||
Year-over-year changes in revenue: | |||||||
Reported GAAP site rental revenues | 10.0 | % | |||||
Organic Contribution to Site Rental Revenues(d)(e) | 5.1 | % | |||||
(a) | Includes revenues from amortization of prepaid rent in accordance with GAAP. |
(b) | The financial impact of acquisitions, as measured by the initial contribution, and tower builds is excluded from Organic Contribution to Site Rental Revenues until the one-year anniversary of the acquisition or build. |
(c) | Includes revenues from the construction of new small cell nodes, exclusive of straight-lined revenues related to fixed escalators. |
(d) | See "Non-GAAP Financial Measures, Segment Measures and Other Calculations" herein. |
(e) | Calculated as the percentage change from prior year site rental revenues exclusive of straight-lined revenues associated with fixed escalations compared to Organic Contribution to Site Rental Revenues for the current period. |
(f) | Additional information regarding Crown Castle's site rental revenues including projected revenue from customer licenses, tenant non-renewals, straight-lined revenues and prepaid rent is available in Crown Castle's quarterly Supplemental Information Package posted in the Investors section of its website. |
The Foundation for a Wireless World.
CrownCastle.com
News Release continued: | Page 15 | |
The components of the changes in site rental revenues for the year ending December 31, 2017 and December 31, 2018 are forecasted as follows:
(in millions) | Midpoint of Full Year 2017 Outlook | Full Year 2018 Outlook | |
Components of changes in site rental revenues(g): | |||
Prior year site rental revenues exclusive of straight-line associated with fixed escalators(a)(c) | $3,186 | $3,534 | |
New leasing activity(a)(c) | 172 | 190-220 | |
Escalators | 84 | 80-90 | |
Non-renewals | (90) | (95)-(75) | |
Organic Contribution to Site Rental Revenues(d) | 166 | 185-225 | |
Straight-lined revenues associated with fixed escalators | (10) | (65)-(45) | |
Acquisitions and builds(b) | 183 | 885-905 | |
Other | — | — | |
Total GAAP site rental revenues | $3,525 | $4,546-$4,591 | |
Year-over-year changes in revenue:(f) | |||
Reported GAAP site rental revenues | 9.0% | 29.6% | |
Organic Contribution to Site Rental Revenues(d)(e) | 5.2% | 5.8% | |
(a) | Includes revenues from amortization of prepaid rent in accordance with GAAP. |
(b) | The financial impact of acquisitions, as measured by the initial contribution, and tower builds is excluded from Organic Contribution to Site Rental Revenues until the one-year anniversary of the acquisition or build. |
(c) | Includes revenues from the construction of new small cell nodes, exclusive of straight-lined revenues related to fixed escalators. |
(d) | See "Non-GAAP Financial Measures, Segment Measures and Other Calculations" herein. |
(e) | Calculated as the percentage change from prior year site rental revenues exclusive of straight-lined revenues associated with fixed escalations compared to Organic Contribution to Site Rental Revenues for the current period. |
(f) | Calculated based on midpoint of Full Year 2017 Outlook and Full Year 2018 Outlook. |
(g) | Additional information regarding Crown Castle's site rental revenues including projected revenue from customer licenses, tenant non-renewals, straight-lined revenues and prepaid rent is available in Crown Castle's quarterly Supplemental Information Package posted in the Investors section of its website. |
The Foundation for a Wireless World.
CrownCastle.com
News Release continued: | Page 16 | |
Components of Historical Interest Expense and Amortization of Deferred Financing Costs:
For the Three Months Ended | |||||||
(in millions) | September 30, 2017 | September 30, 2016 | |||||
Interest expense on debt obligations | $ | 151.8 | $ | 126.6 | |||
Amortization of deferred financing costs and adjustments on long-term debt, net | 4.9 | 4.6 | |||||
Other, net | (2.5 | ) | (1.3 | ) | |||
Interest expense and amortization of deferred financing costs | $ | 154.1 | $ | 129.9 | |||
Components of Current Outlook for Interest Expense and Amortization of Deferred Financing Costs:
Q4 2017 | Full Year 2017 | Full Year 2018 | |||||||||
(in millions) | Outlook | Outlook | Outlook | ||||||||
Interest expense on debt obligations | $157 | to | $162 | $580 | to | $585 | $645 | to | $665 | ||
Amortization of deferred financing costs and adjustments on long-term debt, net | $4 | to | $7 | $18 | to | $21 | $17 | to | $22 | ||
Other, net | $(3) | to | $(1) | $(9) | to | $(7) | $(11) | to | $(6) | ||
Interest expense and amortization of deferred financing costs | $159 | to | $164 | $590 | to | $595 | $644 | to | $689 | ||
Debt balances and maturity dates as of September 30, 2017 are as follows:
(in millions) | Face Value | Final Maturity | |||
Bank debt - variable rate: | |||||
2016 Revolver | $ | — | Aug. 2022 | ||
2016 Term Loan A | 2,416.3 | Aug. 2022 | |||
Total bank debt | 2,416.3 | ||||
Securitized debt - fixed rate: | |||||
Secured Notes, Series 2009-1, Class A-1(a) | 37.9 | Aug. 2019 | |||
Secured Notes, Series 2009-1, Class A-2(a) | 70.0 | Aug. 2029 | |||
Tower Revenue Notes, Series 2010-3(b) | 1,250.0 | Jan. 2040 | |||
Tower Revenue Notes, Series 2010-6(b) | 1,000.0 | Aug. 2040 | |||
Tower Revenue Notes, Series 2015-1(b) | 300.0 | May 2042 | |||
Tower Revenue Notes, Series 2015-2(b) | 700.0 | May 2045 | |||
Total securitized debt | 3,357.9 | ||||
Bonds - fixed rate: | |||||
5.250% Senior Notes | 1,650.0 | Jan. 2023 | |||
3.849% Secured Notes | 1,000.0 | Apr. 2023 | |||
4.875% Senior Notes | 850.0 | Apr. 2022 | |||
3.400% Senior Notes | 850.0 | Feb. 2021 | |||
4.450% Senior Notes | 900.0 | Feb. 2026 | |||
3.700% Senior Notes | 750.0 | June 2026 | |||
2.250% Senior Notes | 700.0 | Sept. 2021 | |||
4.000% Senior Notes | 500.0 | Mar. 2027 | |||
4.750% Senior Notes | 350.0 | May 2047 | |||
3.200% Senior Notes | 750.0 | Sept. 2024 | |||
3.650% Senior Notes | 1,000.0 | Sept. 2027 | |||
Total bonds | 9,300.0 | ||||
Capital leases and other obligations | 237.7 | Various | |||
Total Debt | $ | 15,311.9 | |||
Less: Cash and Cash Equivalents(c) | $ | 6,719.1 | |||
Net Debt | $ | 8,592.8 | |||
(a) | The Senior Secured Notes, Series 2009-1, Class A-1 principal amortizes during the period beginning January 2010 and ending in 2019 and the Senior Secured Notes, 2009-1, Class A-2 principal amortizes during the period beginning in 2019 and ending in 2029. |
(b) | The Senior Secured Tower Revenue Notes, Series 2010-3 and 2010-6 have anticipated repayment dates in 2020. The Senior Secured Tower Revenue Notes, Series 2015-1 and 2015-2 have anticipated repayment dates in 2022 and 2025, respectively. |
(c) | Excludes restricted cash. |
The Foundation for a Wireless World.
CrownCastle.com
News Release continued: | Page 17 | |
Net Debt to Last Quarter Annualized Adjusted EBITDA is computed as follows:
(in millions) | For the Three Months Ended September 30, 2017 | |||
Total face value of debt | $ | 15,311.9 | ||
Ending cash and cash equivalents(a) | 6,719.1 | |||
Total Net Debt | $ | 8,592.8 | ||
Adjusted EBITDA for the three months ended September 30, 2017 | $ | 604.8 | ||
Last quarter annualized adjusted EBITDA | 2,419.2 | |||
Net Debt to Last Quarter Annualized Adjusted EBITDA | 3.6 | x | (b) | |
(a) | Excludes restricted cash. |
(b) | The Net Debt to Last Quarter Annualized Adjusted EBITDA calculation does not give effect to (1) the pending Lightower acquisition, as this pending acquisition is expected to close during the fourth quarter of 2017 and (2) the Company's expected use of cash proceeds from the Lightower Financings to fund the pending Lightower acquisition. |
Components of Capital Expenditures:
For the Three Months Ended | |||||||||||||||||||||||||
(in millions) | September 30, 2017 | September 30, 2016 | |||||||||||||||||||||||
Towers | Small Cells | Other | Total | Towers | Small Cells | Other | Total | ||||||||||||||||||
Discretionary: | |||||||||||||||||||||||||
Purchases of land interests | $ | 23.7 | $ | — | $ | — | $ | 23.7 | $ | 17.4 | $ | — | $ | — | $ | 17.4 | |||||||||
Wireless infrastructure construction and improvements | 72.5 | 167.8 | — | 240.3 | 76.6 | 108.6 | — | 185.2 | |||||||||||||||||
Sustaining: | |||||||||||||||||||||||||
Capital improvement and corporate | 12.5 | 3.9 | 7.9 | 24.2 | 9.7 | 3.2 | 5.6 | 18.5 | |||||||||||||||||
Total | $ | 108.6 | $ | 171.7 | $ | 7.9 | $ | 288.2 | $ | 103.7 | $ | 111.8 | $ | 5.6 | $ | 221.1 | |||||||||
Note: See "Non-GAAP Financial Measures, Segment Measures and Other Calculations" herein for further discussion of our components of capital expenditures.
The Foundation for a Wireless World.
CrownCastle.com
News Release continued: | Page 18 | |
Cautionary Language Regarding Forward-Looking Statements
This press release contains forward-looking statements and information that are based on our management's current expectations. Such statements include our Outlook and plans, projections, and estimates regarding (1) potential benefits, returns, opportunities and shareholder value which may be derived from our business, assets, investments, acquisitions (including the pending acquisition of Lightower) and dividends, including on a long-term basis, (2) our strategy, strategic position, business model and capabilities and the strength of our business, (3) needs of and demand from our customers, and the benefits which may be derived therefrom, (4) growth in demand for data and connectivity and the benefits which may be derived therefrom, (5) our growth, including our revenue growth, long-term prospects and the trends impacting our business, (6) the pending acquisition of Lightower, including financing and timing thereof, quality of Lightower's assets, integration costs and capital expenditures resulting therefrom and the potential benefits and contributions which may be derived from such acquisition, including (a) improvements to or enhancements of our asset portfolio, growth and industry position and (b) contribution to or impact on our financial or operating results, including site rental revenues, Adjusted EBITDA, net income and AFFO, (7) use of proceeds from the Lightower Financings, (8) leasing environment and activity, (9) our investments, including in towers, small cells, fiber and other assets, and the potential growth, returns and benefits therefrom, (10) our dividends, including our dividend plans and the amount of our dividends and dividend growth rate and targets, (11) demand for our wireless infrastructure (including fiber and small cells) and services, (12) tenant non-renewals, including the impact thereof, (13) capital expenditures, including sustaining capital expenditures and integration capital expenditures and the timing thereof, (14) straight-line adjustments, (15) site rental revenues and estimated growth thereof, (16) site rental cost of operations, (17) net income (loss), (18) Adjusted EBITDA, (19) expenses, including interest expense and amortization of deferred financing costs, (20) FFO, (21) AFFO and estimated growth thereof, (22) Organic Contribution to Site Rental Revenues, (23) our weighted-average common shares outstanding, including on a diluted basis, (24) network services contribution and (25) the utility of certain financial measures, including non-GAAP financial measures. Such forward-looking statements are subject to certain risks, uncertainties and assumptions prevailing market conditions and the following:
• | Our business depends on the demand for our wireless infrastructure, driven primarily by demand for wireless connectivity, and we may be adversely affected by any slowdown in such demand. Additionally, a reduction in the amount or change in the mix of carrier network investment may materially and adversely affect our business (including reducing demand for tenant additions and network services). |
• | A substantial portion of our revenues is derived from a small number of customers, and the loss, consolidation or financial instability of any of our limited number of customers may materially decrease revenues or reduce demand for our wireless infrastructure and network services. |
• | The business model for small cells contains certain differences from our traditional site rental business, resulting in different operational risks. If we do not successfully operate that business model or identify or manage those operational risks, such operations may produce results that are less than anticipated. |
• | Our substantial level of indebtedness could adversely affect our ability to react to changes in our business, and the terms of our debt instruments limit our ability to take a number of actions that our management might otherwise believe to be in our best interests. In addition, if we fail to comply with our covenants, our debt could be accelerated. |
• | We have a substantial amount of indebtedness. In the event we do not repay or refinance such indebtedness, we could face substantial liquidity issues and might be required to issue equity securities or securities convertible into equity securities, or sell some of our assets to meet our debt payment obligations. |
• | Sales or issuances of a substantial number of shares of our common stock may adversely affect the market price of our common stock. |
• | As a result of competition in our industry, we may find it more difficult to achieve favorable rental rates on our new or renewing tenant leases. |
• | New technologies may reduce demand for our wireless infrastructure or negatively impact our revenues. |
• | The expansion or development of our business, including through acquisitions, increased product offerings or other strategic growth opportunities, may cause disruptions in our business, which may have an adverse effect on our business, operations or financial results. |
• | If we fail to retain rights to our wireless infrastructure, including the land interests under our towers, our business may be adversely affected. |
• | Our network services business has historically experienced significant volatility in demand, which reduces the predictability of our results. |
• | New wireless technologies may not deploy or be adopted by customers as rapidly or in the manner projected. |
• | If we fail to comply with laws or regulations which regulate our business and which may change at any time, we may be fined or even lose our right to conduct some of our business. |
The Foundation for a Wireless World.
CrownCastle.com
News Release continued: | Page 19 | |
• | If radio frequency emissions from wireless handsets or equipment on our wireless infrastructure are demonstrated to cause negative health effects, potential future claims could adversely affect our operations, costs or revenues. |
• | Certain provisions of our restated certificate of incorporation, amended and restated by-laws and operative agreements, and domestic and international competition laws may make it more difficult for a third party to acquire control of us or for us to acquire control of a third party, even if such a change in control would be beneficial to our stockholders. |
• | We may be vulnerable to security breaches that could adversely affect our business, operations, and reputation. |
• | The pending Lightower acquisition may not be completed within the expected timeframe, if at all, and the pendency of such acquisition could adversely affect our business, financial condition, results of operations and cash flows. |
• | We may fail to realize all of the anticipated benefits of the pending Lightower acquisition or those benefits may take longer to realize than expected. We may also encounter significant difficulties in integrating Lightower’s business. |
• | Future dividend payments to our stockholders will reduce the availability of our cash on hand available to fund future discretionary investments, and may result in a need to incur indebtedness or issue equity securities to fund growth opportunities. In such event, the then current economic, credit market or equity market conditions will impact the availability or cost of such financing, which may hinder our ability to grow our per share results of operations. |
• | Remaining qualified to be taxed as a REIT involves highly technical and complex provisions of the U.S. Internal Revenue Code. Failure to remain qualified as a REIT would result in our inability to deduct dividends to stockholders when computing our taxable income, which would reduce our available cash. |
• | Complying with REIT requirements, including the 90% distribution requirement, may limit our flexibility or cause us to forgo otherwise attractive opportunities, including certain discretionary investments and potential financing alternatives. |
• | REIT related ownership limitations and transfer restrictions may prevent or restrict certain transfers of our capital stock. |
• | If we fail to pay scheduled dividends on the 6.875% Mandatory Convertible Preferred Stock, in cash, common stock, or any combination of cash and common stock, we will be prohibited from paying dividends on our common stock, which may jeopardize our status as a REIT. |
Should one or more of these or other risks or uncertainties materialize, or should underlying assumptions prove incorrect, actual results may vary materially from those expected. More information about potential risk factors which could affect our results is included in our filings with the Securities and Exchange Commission. As used in this release, the term "including," and any variation thereof, means "including without limitation."
The Foundation for a Wireless World.
CrownCastle.com
News Release continued: | Page 20 | |
| CROWN CASTLE INTERNATIONAL CORP. CONDENSED CONSOLIDATED BALANCE SHEET (UNAUDITED) (in thousands, except share amounts) |
September 30, 2017 | December 31, 2016 | ||||||
ASSETS | |||||||
Current assets: | |||||||
Cash and cash equivalents | $ | 6,719,134 | $ | 567,599 | |||
Restricted cash | 115,730 | 124,547 | |||||
Receivables, net | 317,856 | 373,532 | |||||
Prepaid expenses | 167,235 | 128,721 | |||||
Other current assets | 154,600 | 130,362 | |||||
Total current assets | 7,474,555 | 1,324,761 | |||||
Deferred site rental receivables | 1,285,547 | 1,317,658 | |||||
Property and equipment, net | 10,599,604 | 9,805,315 | |||||
Goodwill | 6,905,922 | 5,757,676 | |||||
Other intangible assets, net | 3,885,311 | 3,650,072 | |||||
Long-term prepaid rent and other assets, net | 860,817 | 819,610 | |||||
Total assets | $ | 31,011,756 | $ | 22,675,092 | |||
LIABILITIES AND EQUITY | |||||||
Current liabilities: | |||||||
Accounts payable | $ | 179,335 | $ | 188,516 | |||
Accrued interest | 99,467 | 97,019 | |||||
Deferred revenues | 387,447 | 353,005 | |||||
Other accrued liabilities | 268,424 | 221,066 | |||||
Current maturities of debt and other obligations | 114,198 | 101,749 | |||||
Total current liabilities | 1,048,871 | 961,355 | |||||
Debt and other long-term obligations | 15,090,217 | 12,069,393 | |||||
Other long-term liabilities | 2,200,336 | 2,087,229 | |||||
Total liabilities | 18,339,424 | 15,117,977 | |||||
Commitments and contingencies | |||||||
CCIC stockholders' equity: | |||||||
Common stock, $0.01 par value; 600,000,000 shares authorized; shares issued and outstanding: September 30, 2017—406,274,802 and December 31, 2016—360,536,659 | 4,063 | 3,605 | |||||
6.875% Mandatory Convertible Preferred Stock, Series A, $0.01 par value; 20,000,000 shares authorized; shares issued and outstanding: September 30, 2017—1,650,000 and December 31, 2016—0; aggregate liquidation value: September 30, 2017—$1,650,000 and December 31, 2016—$0 | 17 | — | |||||
Additional paid-in capital | 16,818,738 | 10,938,236 | |||||
Accumulated other comprehensive income (loss) | (4,959 | ) | (5,888 | ) | |||
Dividends/distributions in excess of earnings | (4,145,527 | ) | (3,378,838 | ) | |||
Total equity | 12,672,332 | 7,557,115 | |||||
Total liabilities and equity | $ | 31,011,756 | $ | 22,675,092 | |||
The Foundation for a Wireless World.
CrownCastle.com
News Release continued: | Page 21 | |
| CROWN CASTLE INTERNATIONAL CORP. CONDENSED CONSOLIDATED STATEMENT OF OPERATIONS (UNAUDITED) (in thousands, except share and per share amounts) |
Three Months Ended September 30, | Nine Months Ended September 30, | ||||||||||||||
2017 | 2016 | 2017 | 2016 | ||||||||||||
Net revenues: | |||||||||||||||
Site rental | $ | 892,763 | $ | 812,032 | $ | 2,618,505 | $ | 2,415,926 | |||||||
Network services and other | 170,475 | 179,984 | 499,010 | 472,883 | |||||||||||
Net revenues | 1,063,238 | 992,016 | 3,117,515 | 2,888,809 | |||||||||||
Operating expenses: | |||||||||||||||
Costs of operations (exclusive of depreciation, amortization and accretion): | |||||||||||||||
Site rental | 280,667 | 256,750 | 814,969 | 762,223 | |||||||||||
Network services and other | 106,707 | 109,228 | 310,137 | 286,066 | |||||||||||
General and administrative | 100,772 | 89,941 | 299,232 | 278,909 | |||||||||||
Asset write-down charges | 5,312 | 8,339 | 10,284 | 28,251 | |||||||||||
Acquisition and integration costs | 13,180 | 2,680 | 27,080 | 11,459 | |||||||||||
Depreciation, amortization and accretion | 296,033 | 280,824 | 880,197 | 834,725 | |||||||||||
Total operating expenses | 802,671 | 747,762 | 2,341,899 | 2,201,633 | |||||||||||
Operating income (loss) | 260,567 | 244,254 | 775,616 | 687,176 | |||||||||||
Interest expense and amortization of deferred financing costs | (154,146 | ) | (129,916 | ) | (430,402 | ) | (385,656 | ) | |||||||
Gains (losses) on retirement of long-term obligations | — | (10,274 | ) | (3,525 | ) | (52,291 | ) | ||||||||
Interest income | 11,188 | 175 | 12,585 | 454 | |||||||||||
Other income (expense) | (32 | ) | (832 | ) | 3,462 | (4,623 | ) | ||||||||
Income (loss) before income taxes | 117,577 | 103,407 | 357,736 | 245,060 | |||||||||||
Benefit (provision) for income taxes | (2,383 | ) | (5,041 | ) | (11,290 | ) | (12,797 | ) | |||||||
Net income (loss) | 115,194 | 98,366 | 346,446 | 232,263 | |||||||||||
Dividends on preferred stock | (29,935 | ) | (10,997 | ) | (29,935 | ) | (32,991 | ) | |||||||
Net income (loss) attributable to CCIC common stockholders | $ | 85,259 | $ | 87,369 | $ | 316,511 | $ | 199,272 | |||||||
Net income (loss) attributable to CCIC common stockholders, per common share: | |||||||||||||||
Net income (loss) attributable to CCIC common stockholders—basic | $ | 0.22 | $ | 0.26 | $ | 0.85 | $ | 0.59 | |||||||
Net income (loss) attributable to CCIC common stockholders—diluted | $ | 0.21 | $ | 0.26 | $ | 0.84 | $ | 0.59 | |||||||
Weighted-average common shares outstanding (in thousands): | |||||||||||||||
Basic | 395,359 | 337,564 | 373,561 | 336,426 | |||||||||||
Diluted | 397,035 | 338,409 | 374,992 | 337,076 | |||||||||||
The Foundation for a Wireless World.
CrownCastle.com
News Release continued: | Page 22 | |
| CROWN CASTLE INTERNATIONAL CORP. CONDENSED CONSOLIDATED STATEMENT OF CASH FLOWS (UNAUDITED) (in thousands) |
Nine Months Ended September 30, | ||||||||||||
2017 | 2016 | |||||||||||
Cash flows from operating activities: | ||||||||||||
Net income (loss) | $ | 346,446 | $ | 232,263 | ||||||||
Adjustments to reconcile net income (loss) to net cash provided by (used for) operating activities: | ||||||||||||
Depreciation, amortization and accretion | 880,197 | 834,725 | ||||||||||
Gains (losses) on retirement of long-term obligations | 3,525 | 52,291 | ||||||||||
Amortization of deferred financing costs and other non-cash interest | 7,637 | 11,293 | ||||||||||
Stock-based compensation expense | 67,264 | 60,402 | ||||||||||
Asset write-down charges | 10,284 | 28,251 | ||||||||||
Deferred income tax benefit (provision) | 330 | 6,626 | ||||||||||
Other non-cash adjustments, net | (3,159 | ) | 1,548 | |||||||||
Changes in assets and liabilities, excluding the effects of acquisitions: | ||||||||||||
Increase (decrease) in liabilities | 61,988 | 122,944 | ||||||||||
Decrease (increase) in assets | 42,779 | (45,628 | ) | |||||||||
Net cash provided by (used for) operating activities | 1,417,291 | 1,304,715 | ||||||||||
Cash flows from investing activities: | ||||||||||||
Payments for acquisition of businesses, net of cash acquired | (2,112,887 | ) | (545,162 | ) | ||||||||
Capital expenditures | (851,512 | ) | (614,178 | ) | ||||||||
Net (payments) receipts from settled swaps | (328 | ) | 8,141 | |||||||||
Other investing activities, net | (6,147 | ) | 11,616 | |||||||||
Net cash provided by (used for) investing activities | (2,970,874 | ) | (1,139,583 | ) | ||||||||
Cash flows from financing activities: | ||||||||||||
Proceeds from issuance of long-term debt | 3,092,323 | 5,201,010 | ||||||||||
Principal payments on debt and other long-term obligations | (89,817 | ) | (69,717 | ) | ||||||||
Purchases and redemptions of long-term debt | — | (4,044,834 | ) | |||||||||
Borrowings under revolving credit facility | 1,755,000 | 3,440,000 | ||||||||||
Payments under revolving credit facility | (1,755,000 | ) | (4,155,000 | ) | ||||||||
Payments for financing costs | (26,684 | ) | (41,471 | ) | ||||||||
Net proceeds from issuance of common stock | 4,220,766 | 323,798 | ||||||||||
Net proceeds from issuance of preferred stock | 1,607,759 | — | ||||||||||
Purchases of capital stock | (23,037 | ) | (24,759 | ) | ||||||||
Dividends/distributions paid on common stock | (1,082,015 | ) | (896,628 | ) | ||||||||
Dividends paid on preferred stock | — | (32,991 | ) | |||||||||
Net (increase) decrease in restricted cash | 4,960 | 40 | ||||||||||
Net cash provided by (used for) financing activities | 7,704,255 | (300,552 | ) | |||||||||
Net increase (decrease) in cash and cash equivalents - continuing operations | 6,150,672 | (135,420 | ) | |||||||||
Discontinued operations: | ||||||||||||
Net cash provided by (used for) investing activities | — | 113,150 | ||||||||||
Net increase (decrease) in cash and cash equivalents - discontinued operations | — | 113,150 | ||||||||||
Effect of exchange rate changes | 863 | (321 | ) | |||||||||
Cash and cash equivalents at beginning of period | 567,599 | 178,810 | ||||||||||
Cash and cash equivalents at end of period | $ | 6,719,134 | $ | 156,219 | ||||||||
Supplemental disclosure of cash flow information: | ||||||||||||
Interest paid | 420,317 | 357,094 | ||||||||||
Income taxes paid | 13,853 | 11,740 | ||||||||||
The Foundation for a Wireless World.
CrownCastle.com
News Release continued: | Page 23 | |
| CROWN CASTLE INTERNATIONAL CORP. SEGMENT OPERATING RESULTS (UNAUDITED) (in thousands) |
SEGMENT OPERATING RESULTS | |||||||||||||||||||||||||||||
Three Months Ended September 30, 2017 | Three Months Ended September 30, 2016 | ||||||||||||||||||||||||||||
Towers | Small Cells | Other | Consolidated Total | Towers | Small Cells | Other | Consolidated Total | ||||||||||||||||||||||
Segment site rental revenues | $ | 724,813 | $ | 167,950 | $ | 892,763 | $ | 709,603 | $ | 102,429 | $ | 812,032 | |||||||||||||||||
Segment network services and other revenue | 153,001 | 17,474 | 170,475 | 166,979 | 13,005 | 179,984 | |||||||||||||||||||||||
Segment revenues | 877,814 | 185,424 | 1,063,238 | 876,582 | 115,434 | 992,016 | |||||||||||||||||||||||
Segment site rental cost of operations | 212,037 | 59,319 | 271,356 | 210,322 | 37,754 | 248,076 | |||||||||||||||||||||||
Segment network services and other cost of operations | 90,845 | 14,245 | 105,090 | 97,395 | 10,194 | 107,589 | |||||||||||||||||||||||
Segment cost of operations(a) | 302,882 | 73,564 | 376,446 | 307,717 | 47,948 | 355,665 | |||||||||||||||||||||||
Segment site rental gross margin(b) | 512,776 | 108,631 | 621,407 | 499,281 | 64,675 | 563,956 | |||||||||||||||||||||||
Segment network services and other gross margin(b) | 62,156 | 3,229 | 65,385 | 69,584 | 2,811 | 72,395 | |||||||||||||||||||||||
Segment general and administrative expenses(a) | 22,490 | 18,415 | 41,085 | 81,990 | 22,225 | 14,480 | 35,526 | 72,231 | |||||||||||||||||||||
Segment operating profit(b) | 552,442 | 93,445 | (41,085 | ) | 604,802 | 546,640 | 53,006 | (35,526 | ) | 564,120 | |||||||||||||||||||
Stock-based compensation expense | 24,681 | 24,681 | 22,594 | 22,594 | |||||||||||||||||||||||||
Depreciation, amortization and accretion | 296,033 | 296,033 | 280,824 | 280,824 | |||||||||||||||||||||||||
Interest expense and amortization of deferred financing costs | 154,146 | 154,146 | 129,916 | 129,916 | |||||||||||||||||||||||||
Other (income) expenses to reconcile to income (loss) before income taxes(c) | 12,365 | 12,365 | 27,379 | 27,379 | |||||||||||||||||||||||||
Income (loss) before income taxes | $ | 117,577 | $ | 103,407 | |||||||||||||||||||||||||
(a) | Segment cost of operations exclude (1) stock-based compensation expense of $5.9 million and $4.9 million for the three months ended September 30, 2017 and 2016, respectively and (2) prepaid lease purchase price adjustments of $5.0 million and $5.4 million for the three months ended September 30, 2017 and 2016, respectively. Segment general and administrative expenses exclude stock-based compensation expense of $18.8 million and $17.7 million for the three months ended September 30, 2017 and 2016, respectively. |
(b) See "Non-GAAP Financial Measures, Segment Measures and Other Calculations" herein for a discussion of our definitions of segment site rental gross margin, segment network service and other gross margin and segment operating profit.
(c) | See condensed consolidated statement of operations for further information. |
The Foundation for a Wireless World.
CrownCastle.com
News Release continued: | Page 24 | |
SEGMENT OPERATING RESULTS | |||||||||||||||||||||||||||||
Nine Months Ended September 30, 2017 | Nine Months Ended September 30, 2016 | ||||||||||||||||||||||||||||
Towers | Small Cells | Other | Consolidated Total | Towers | Small Cells | Other | Consolidated Total | ||||||||||||||||||||||
Segment site rental revenues | $ | 2,158,994 | $ | 459,511 | $ | 2,618,505 | $ | 2,118,159 | $ | 297,767 | $ | 2,415,926 | |||||||||||||||||
Segment network services and other revenue | 460,593 | 38,417 | 499,010 | 434,042 | 38,841 | 472,883 | |||||||||||||||||||||||
Segment revenues | 2,619,587 | 497,928 | 3,117,515 | 2,552,201 | 336,608 | 2,888,809 | |||||||||||||||||||||||
Segment site rental cost of operations | 632,705 | 158,426 | 791,131 | 625,331 | 109,402 | 734,733 | |||||||||||||||||||||||
Segment network services and other cost of operations | 275,618 | 31,078 | 306,696 | 249,306 | 30,652 | 279,958 | |||||||||||||||||||||||
Segment cost of operations(a) | 908,323 | 189,504 | 1,097,827 | 874,637 | 140,054 | 1,014,691 | |||||||||||||||||||||||
Segment site rental gross margin(b) | 1,526,289 | 301,085 | 1,827,374 | 1,492,828 | 188,365 | 1,681,193 | |||||||||||||||||||||||
Segment network services and other gross margin(b) | 184,975 | 7,339 | 192,314 | 184,736 | 8,189 | 192,925 | |||||||||||||||||||||||
Segment general and administrative expenses(a) | 69,125 | 54,770 | 121,045 | 244,940 | 68,329 | 45,720 | 107,161 | 221,210 | |||||||||||||||||||||
Segment operating profit(b) | 1,642,139 | 253,654 | (121,045 | ) | 1,774,748 | 1,609,235 | 150,834 | (107,161 | ) | 1,652,908 | |||||||||||||||||||
Stock-based compensation expense | 66,458 | 66,458 | 75,297 | 75,297 | |||||||||||||||||||||||||
Depreciation, amortization and accretion | 880,197 | 880,197 | 834,725 | 834,725 | |||||||||||||||||||||||||
Interest expense and amortization of deferred financing costs | 430,402 | 430,402 | 385,656 | 385,656 | |||||||||||||||||||||||||
Other income (expenses) to reconcile to income (loss) from continuing operations before income taxes(c) | 39,955 | 39,955 | 112,170 | 112,170 | |||||||||||||||||||||||||
Income (loss) from continuing operations before income taxes | $ | 357,736 | $ | 245,060 | |||||||||||||||||||||||||
(a) | Segment cost of operations exclude (1) stock-based compensation expense of $12.2 million and $17.6 million for the nine months ended September 30, 2017 and 2016, respectively and (2) prepaid lease purchase price adjustments of $15.1 million and $16.0 million for the nine months ended September 30, 2017 and 2016, respectively. Segment general and administrative expenses exclude stock-based compensation expense of $54.3 million and $57.7 million for the nine months ended September 30, 2017 and 2016, respectively. |
(b) See "Non-GAAP Financial Measures, Segment Measures and Other Calculations" herein for a discussion of our definitions of segment site rental gross margin, segment network service and other gross margin and segment operating profit.
(c) | See condensed consolidated statement of operations for further information. |
The Foundation for a Wireless World.
CrownCastle.com