Attached files
| file | filename |
|---|---|
| EX-99.1 - PRESS RELEASE - Thermon Group Holdings, Inc. | pressreleasecci.htm |
| EX-10.1 - COMMITMENT LETTER - Thermon Group Holdings, Inc. | exhibit101commitmentletter.htm |
| EX-2.2 - EMPLOYEE SHARE PURCHASE AGREEMENT - Thermon Group Holdings, Inc. | employeesharepurchase.htm |
| EX-2.1 - SALE AND PURCHASE AGREEMENT - Thermon Group Holdings, Inc. | exhibit102ccithermalspa.htm |
| 8-K - 8-K - Thermon Group Holdings, Inc. | a8-kcci.htm |

R 226
G 35
B 26
R 255
G 255
B 255
R 00
G 00
B 00
R 239
G 66
B 67
R 199
G 33
B 39
R 154
G 29
B 32
R 207
G 205
B 206
R 160
G 158
B 159
R 70
G 70
B 71
R 15
G 72
B 120
R 21
G 93
B 160
R 58
G 135
B 193
1
Thermon Announces
Acquisition of CCI Thermal
October 4th, 2017

R 226
G 35
B 26
R 255
G 255
B 255
R 00
G 00
B 00
R 239
G 66
B 67
R 199
G 33
B 39
R 154
G 29
B 32
R 207
G 205
B 206
R 160
G 158
B 159
R 70
G 70
B 71
R 15
G 72
B 120
R 21
G 93
B 160
R 58
G 135
B 193
2
Disclaimer
Cautionary Note Regarding Forward-Looking Statements
This presentation and related investor conference call and press release contain “forward-looking statements” within the meaning of the safe harbor provisions of the U.S.
Private Securities Litigation Reform Act of 1995 concerning Thermon, CCI, the proposed acquisition and other matters. All statements other than statements of historical fact
are forward-looking statements, including, among others, statements we make regarding the intended acquisition of CCI, future revenues, future earnings, future cash
flows, target leverage ratios, acquisition synergies, regulatory developments, market developments, new products and growth strategies, and the effects of any of the
foregoing on our future results of operations or financial conditions. Forward-looking statements can be identified by words such as: “anticipate,” “intend,” “plan,” “believe,”
“project,” “estimate,” “expect,” “may,” “should,” “will” and similar references to future periods.
Forward-looking statements are neither historical facts nor assurances of future performance. Instead, they are based only on our current beliefs, expectations and
assumptions regarding the future of our business, future plans and strategies, projections, anticipated events and trends, the economy and other future conditions. Because
forward-looking statements relate to the future, they are subject to inherent uncertainties, risks and changes in circumstances that are difficult to predict and many of which
are outside of the control of Thermon and CCI. Some of these expectations may be based upon assumptions, data or judgments that prove to be incorrect and our actual
results and financial condition may differ materially from the views expressed today. Important factors that could cause our actual results and financial condition to differ
materially from those indicated in the forward-looking statements include, among others, the following: (i) risks related to the acquisition of CCI, including integration risks
and failure to achieve the anticipated benefits of the acquisition; (ii) changes in laws and regulations applicable to our business model; and (iii) changes in market conditions
and receptivity to services and offerings; (iv) general economic conditions and cyclicality in the markets we serve; (v) future growth of energy and chemical processing capital
investments; (vi) our ability to deliver existing orders within our backlog; (iv) our ability to bid and win new contracts; (vii) competition from various other sources providing
similar products and services, or alternative technologies, to customers; (viii) changes in relevant currency exchange rates; (ix) potential liability related to our products as
well as the delivery of products and services; (x) our ability to comply with the complex and dynamic system of laws and regulations applicable to international operations;
(xi) our ability to protect data and thwart potential cyber attacks; (xii) a material disruption at any of our manufacturing facilities; (xiii) our dependence on subcontractors
and suppliers; (xiv) our ability to attract and retain qualified management and employees, particularly in our overseas markets; (xv) our ability to continue to generate
sufficient cash flow to satisfy our liquidity needs; (xvi) the extent to which federal, state, local and foreign governmental regulation of energy, chemical processing and power
generation products and services limits or prohibits the operation of our business; and (xvii) other factors discussed in more detail under the caption "Risk Factors" in our
Annual Report on Form 10-K for the fiscal year ended March 31, 2017, filed with the Securities and Exchange Commission on May 30, 2017. Any one of these factors or a
combination of these factors could materially affect our financial condition, results of operations and cash flows and could influence whether any forward-looking
statements contained in this release ultimately prove to be accurate.
Any forward-looking statement made by us in this press release and in the related conference call is based only on information currently available to us and speaks only as of
the date on which it is made. Our forward-looking statements are not guarantees of future performance and we undertake no obligation to publicly update any forward-
looking statement, whether written or oral, that may be made from time to time, whether as a result of new information, future developments or otherwise, unless we are
required to do so under applicable securities laws.
Non-GAAP Financial Measures
Disclosure in this release of "Adjusted EBITDA" and other "non-GAAP financial measures" as defined under the rules of the Securities and Exchange Commission (the "SEC"),
are intended as supplemental measures of our financial performance that are not required by, or presented in accordance with, U.S. generally accepted accounting
principles ("GAAP"). We believe these non-GAAP financial measures are meaningful to our investors to enhance their understanding of our financial performance and are
frequently used by securities analysts, investors and other interested parties. These non-GAAP financial measures should be considered in addition to, not as substitutes for
measures of financial performance reported in accordance with GAAP. For a description of how such non-GAAP financial measures reconcile to the most comparable GAAP
measure, please see the table below.

R 226
G 35
B 26
R 255
G 255
B 255
R 00
G 00
B 00
R 239
G 66
B 67
R 199
G 33
B 39
R 154
G 29
B 32
R 207
G 205
B 206
R 160
G 158
B 159
R 70
G 70
B 71
R 15
G 72
B 120
R 21
G 93
B 160
R 58
G 135
B 193
3
LEADERSHIP
Continue providing
global industry
leadership in our core
competency areas, and
establish this leadership
position in new markets
as we grow
EXPANSION
Expand our core
businesses through
providing complete
solutions, while
exploring new business
opportunities in
adjacent markets that
leverage our core
competencies
INNOVATION
Feed the Thermon
innovation pipeline,
investing in ideas and
technologies that
differentiate our
offerings and best serve
our customers
CUSTOMERS
Partner with our
customers to learn their
business, anticipate
their needs, and
provide solutions that
solve their most
challenging problems
PEOPLE
Our people have always
come first at Thermon.
We strive to attract,
develop and retain our
people and continue to
feed their passion for
excellence, reward hard
work, and ensure their
safety
Thermon’s vision is to be the world’s leader in industrial process heating solutions
“With passionate people dedicated to anticipating customer needs, we will safely deliver innovative
solutions to improve our customer’s measures of success”
Thermon’s mission is to provide safe, reliable and innovative mission-critical industrial process
heating solutions that create value for our customers
Vision
Mission
R 226
G 35
B 26
R 255
G 255
B 255
R 00
G 00
B 00
R 239
G 66
B 67
R 199
G 33
B 39
R 154
G 29
B 32
R 207
G 205
B 206
R 160
G 158
B 159
R 70
G 70
B 71
R 15
G 72
B 120
R 21
G 93
B 160
R 58
G 135
B 193
4
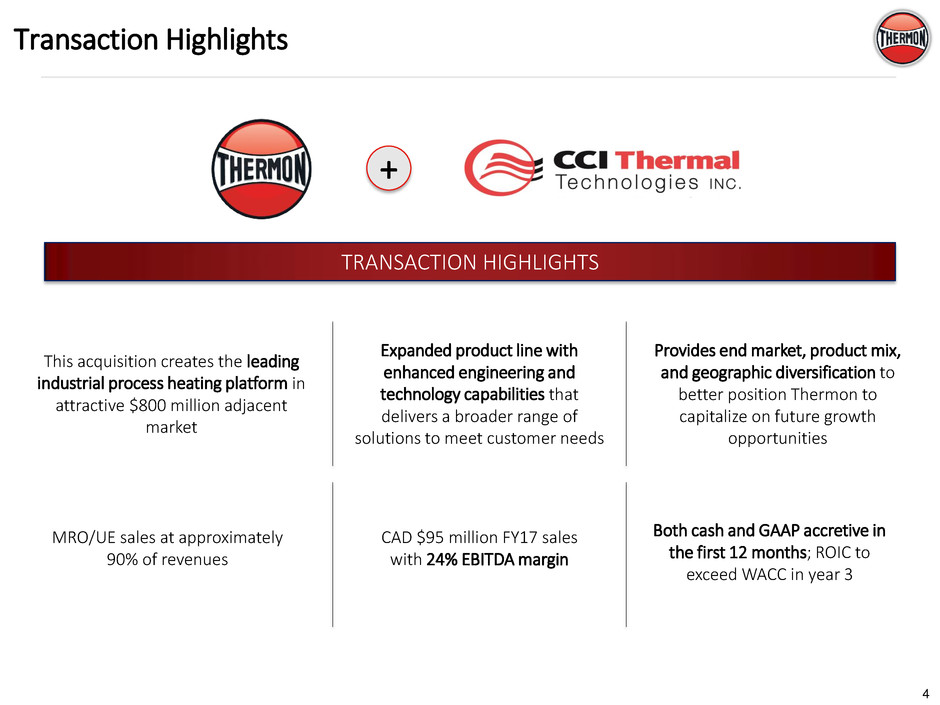
Transaction Highlights
TRANSACTION HIGHLIGHTS
This acquisition creates the leading
industrial process heating platform in
attractive $800 million adjacent
market
Provides end market, product mix,
and geographic diversification to
better position Thermon to
capitalize on future growth
opportunities
CAD $95 million FY17 sales
with 24% EBITDA margin
Both cash and GAAP accretive in
the first 12 months; ROIC to
exceed WACC in year 3
Expanded product line with
enhanced engineering and
technology capabilities that
delivers a broader range of
solutions to meet customer needs
+
MRO/UE sales at approximately
90% of revenues

R 226
G 35
B 26
R 255
G 255
B 255
R 00
G 00
B 00
R 239
G 66
B 67
R 199
G 33
B 39
R 154
G 29
B 32
R 207
G 205
B 206
R 160
G 158
B 159
R 70
G 70
B 71
R 15
G 72
B 120
R 21
G 93
B 160
R 58
G 135
B 193
5
Transaction Summary
Thermon to acquire CCI
Thermal for CAD$ 258
million in cash on a cash-
free, debt-free basis
Implied FY2018E
TEV/EBITDA multiple of 8.2x
including synergies
Approximately ~$2mm
run-rate cost synergies
Deal Considerations Timing & Approvals Financing Considerations
Unanimously approved by
the boards of directors of
both companies
No regulatory approvals
required
Financing fully underwritten
by JP Morgan
Expect to close FY Q3 2018
Funded with a $250 million
7-year senior secured term
loan B
Pro forma net leverage at
close of 3.4x
High cash-generating
business will allow THR to
comfortably operate the
business while rapidly de-
levering
Deal Co si erations Timing & Appr vals Financing si erations

R 226
G 35
B 26
R 255
G 255
B 255
R 00
G 00
B 00
R 239
G 66
B 67
R 199
G 33
B 39
R 154
G 29
B 32
R 207
G 205
B 206
R 160
G 158
B 159
R 70
G 70
B 71
R 15
G 72
B 120
R 21
G 93
B 160
R 58
G 135
B 193
6
Compelling Strategic and Financial Benefit
Expands markets and solutions for customers
CCI Thermal will strengthen our industrial process heating
business, providing a platform for expansion and growth
Strong brands in new product categories with
complementary blue chip industrial customer base
Diversifies end market exposure shifting mix toward natural
gas and adding rail, nuclear, transit
Platform for growth
Provides high quality, reliable products with best-in-class
customer service model
Introduces CCI Thermal’s products to new geographies
through Thermon global channels
Diversifies Thermon end markets through increasing natural
gas and power exposure, and introducing transit and rail to
our product mix
Enhances profitability and financial profile
Added scale with additional CAD$95 million FY17 sales
Strong LTM Adj. EBITDA margin of ~24%
Like Thermon, CCI is characterized by low capital intensity
and high margins; this acquisition improves free cash flow
and cash flow conversion
Platform for growth
Expands markets and
solutions for customers
Enhances profitability and
financial profile

R 226
G 35
B 26
R 255
G 255
B 255
R 00
G 00
B 00
R 239
G 66
B 67
R 199
G 33
B 39
R 154
G 29
B 32
R 207
G 205
B 206
R 160
G 158
B 159
R 70
G 70
B 71
R 15
G 72
B 120
R 21
G 93
B 160
R 58
G 135
B 193
7
CCI Thermal is a platform business well-positioned
to consolidate a highly fragmented $800mm market
Highlights:
CCI Thermal develops, designs, and manufactures
advanced industrial heating and filtration solutions that
serve clients around the world
Strong competitive advantage based on:
─ Ability to deliver high-quality, reliable products –
including products servicing hazardous areas /
classified locations
─ Best in-class customer service
─ Strong brand equity and large installed base
Historical Performance (CAD$ millions)
CCI Thermal – Company Overview
Revenue by Geography1
North America
(excl. CAN)
44% Canada
51%
Other 5%
Note: Based on FY ended July 31
1 Based on FY2016
2 Based on FY2017
$121.1
$85.2
$94.7 $96.7
$42.8
$16.1
$22.5 $23.0
35.3%
18.9%
23.7% 23.8%
FY 2015 FY 2016 FY 2017 LTM 8/31
Gas 27%
Electrical
distribution
17%
Transit / Rail
10%
Power
Generation 5%
Other
16%
General
Industrial 8%
Petrochem
11%
Oil 7%
Revenue by End Market2

R 226
G 35
B 26
R 255
G 255
B 255
R 00
G 00
B 00
R 239
G 66
B 67
R 199
G 33
B 39
R 154
G 29
B 32
R 207
G 205
B 206
R 160
G 158
B 159
R 70
G 70
B 71
R 15
G 72
B 120
R 21
G 93
B 160
R 58
G 135
B 193
8
Comp. A
11%
CCI Thermal
11%
Comp. B
10%
Comp. C
9%
Comp. D
8%
Comp. E
8%
Comp. F
7%
Comp. G
7%
Comp. H
4%
Comp. I
4%
Comp. J
3%
Comp. K
1%
Others
17%
1 Edmonton serves as headquarters and a manufacturing location
North America Focused Footprint Tier I Player in Highly Fragmented Heavy Industrial
Heating Market
Longstanding Relationships with Diverse Customers
Leadership Position in Attractive, Fragmented Niche Market
Manufacturing location Size (sq ft)
Edmonton, Canada 113,850
Oakville, Canada 99,281
Orillia, Canada 99,982
Denver 28,360
Houston 16,900
Total 358,373
North America footprint with and 2 facilities in the U.S. and 3
facilities in Canada
Headquarters1
Manufacturing location
R 226
G 35
B 26
R 255
G 255
B 255
R 00
G 00
B 00
R 239
G 66
B 67
R 199
G 33
B 39
R 154
G 29
B 32
R 207
G 205
B 206
R 160
G 158
B 159
R 70
G 70
B 71
R 15
G 72
B 120
R 21
G 93
B 160
R 58
G 135
B 193
9
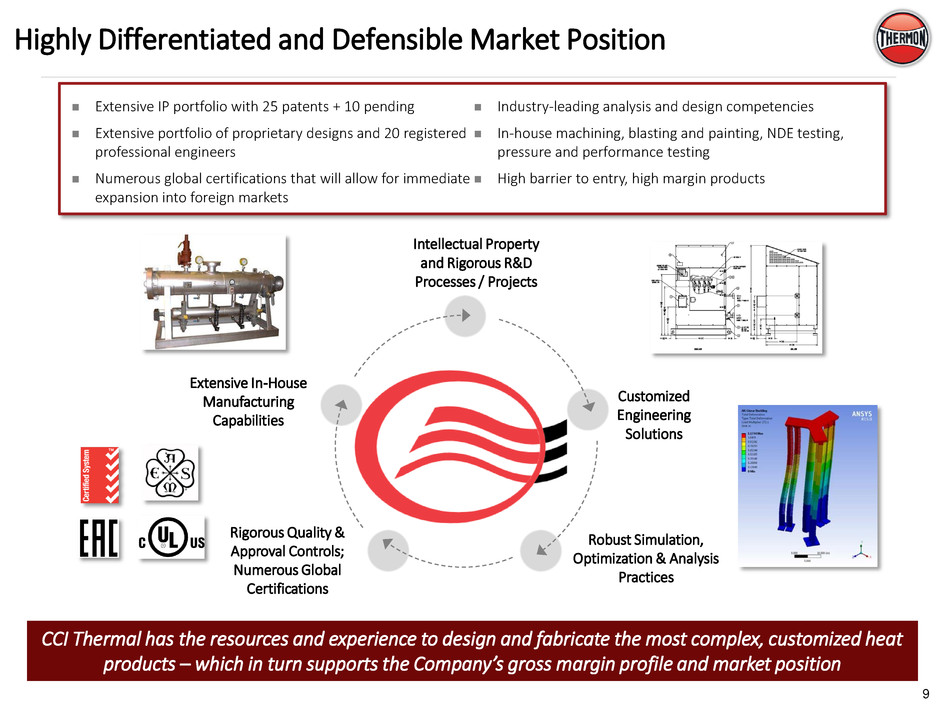
Extensive IP portfolio with 25 patents + 10 pending
Extensive portfolio of proprietary designs and 20 registered
professional engineers
Numerous global certifications that will allow for immediate
expansion into foreign markets
Industry-leading analysis and design competencies
In-house machining, blasting and painting, NDE testing,
pressure and performance testing
High barrier to entry, high margin products
Customized
Engineering
Solutions
Intellectual Property
and Rigorous R&D
Processes / Projects
Rigorous Quality &
Approval Controls;
Numerous Global
Certifications
Robust Simulation,
Optimization & Analysis
Practices
Extensive In-House
Manufacturing
Capabilities
CCI Thermal has the resources and experience to design and fabricate the most complex, customized heat
products – which in turn supports the Company’s gross margin profile and market position
Highly Differentiated and Defensible Market Position
R 226
G 35
B 26
R 255
G 255
B 255
R 00
G 00
B 00
R 239
G 66
B 67
R 199
G 33
B 39
R 154
G 29
B 32
R 207
G 205
B 206
R 160
G 158
B 159
R 70
G 70
B 71
R 15
G 72
B 120
R 21
G 93
B 160
R 58
G 135
B 193
10
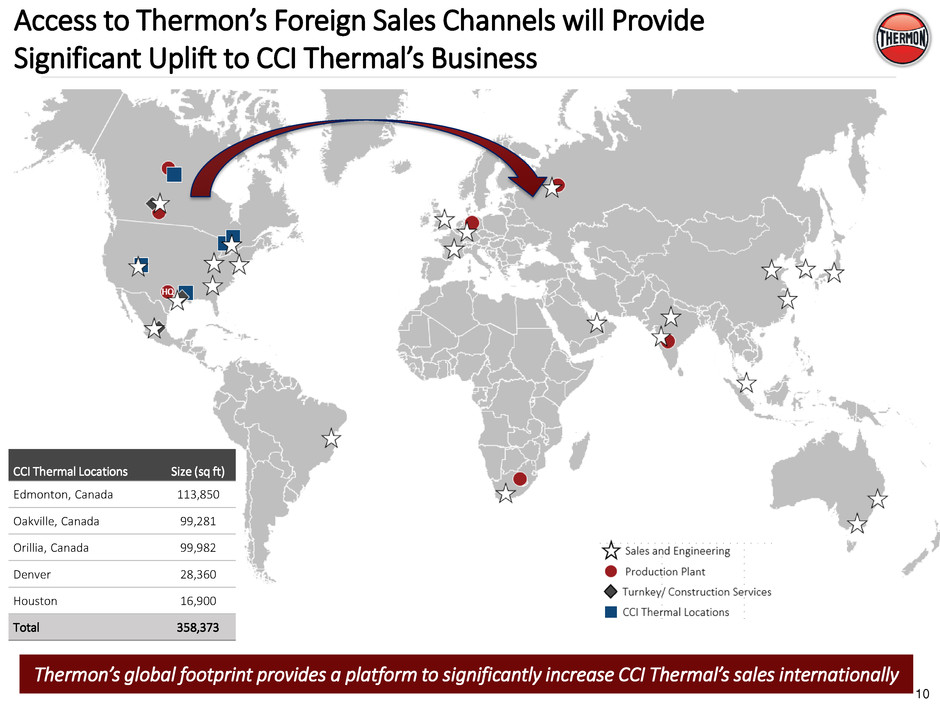
Thermon’s global footprint provides a platform to significantly increase CCI Thermal’s sales internationally
Access to Thermon’s Foreign Sales Channels will Provide
Significant Uplift to CCI Thermal’s Business
CCI Thermal Locations Size (sq ft)
Edmonton, Canada 113,850
Oakville, Canada 99,281
Orillia, Canada 99,982
Denver 28,360
Houston 16,900
Total 358,373
R 226
G 35
B 26
R 255
G 255
B 255
R 00
G 00
B 00
R 239
G 66
B 67
R 199
G 33
B 39
R 154
G 29
B 32
R 207
G 205
B 206
R 160
G 158
B 159
R 70
G 70
B 71
R 15
G 72
B 120
R 21
G 93
B 160
R 58
G 135
B 193
11
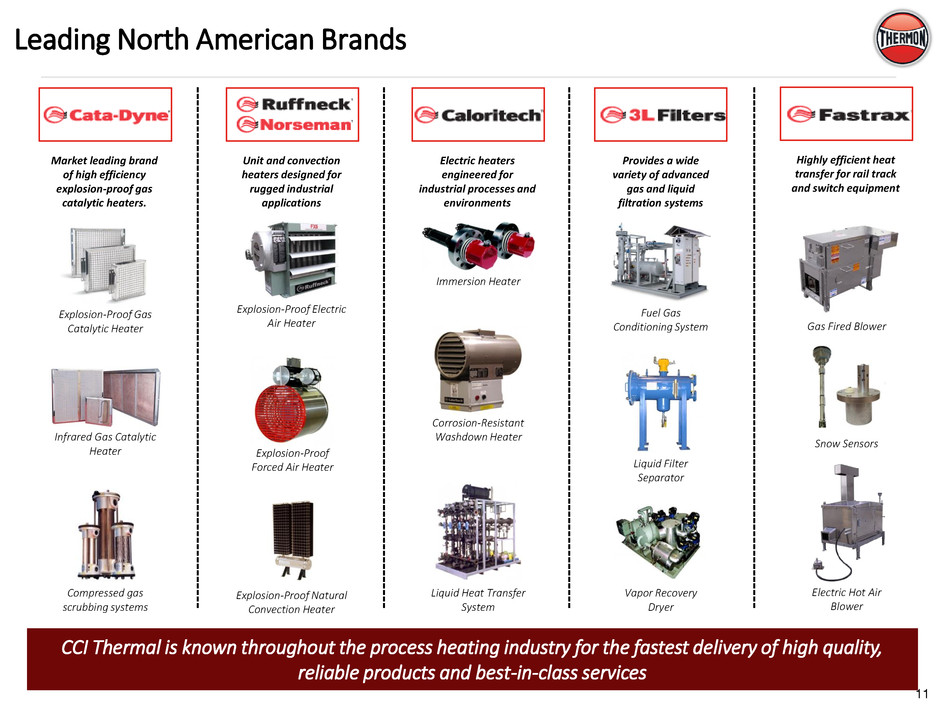
Leading North American Brands
CCI Thermal is known throughout the process heating industry for the fastest delivery of high quality,
reliable products and best-in-class services
Highly efficient heat
transfer for rail track
and switch equipment
Gas Fired Blower
Electric Hot Air
Blower
Snow Sensors
Provides a wide
variety of advanced
gas and liquid
filtration systems
Fuel Gas
Conditioning System
Liquid Filter
Separator
Vapor Recovery
Dryer
Electric heaters
engineered for
industrial processes and
environments
Immersion Heater
Corrosion-Resistant
Washdown Heater
Liquid Heat Transfer
System
Unit and convection
heaters designed for
rugged industrial
applications
Explosion-Proof
Forced Air Heater
Explosion-Proof Natural
Convection Heater
Explosion-Proof Electric
Air Heater
Market leading brand
of high efficiency
explosion-proof gas
catalytic heaters.
Explosion-Proof Gas
Catalytic Heater
Infrared Gas Catalytic
Heater
Compressed gas
scrubbing systems

R 226
G 35
B 26
R 255
G 255
B 255
R 00
G 00
B 00
R 239
G 66
B 67
R 199
G 33
B 39
R 154
G 29
B 32
R 207
G 205
B 206
R 160
G 158
B 159
R 70
G 70
B 71
R 15
G 72
B 120
R 21
G 93
B 160
R 58
G 135
B 193
12
Capabilities Complement Our Process Heating Portfolio
Thermon’s increased capabilities and global footprint will broaden our ability to deliver complete industrial
process heating & thermal management solutions to our customers
Transformer
Power Distribution
/ Control Panel
Conduit &
Wire
Heating Cable
RTD/Temperature Sensor
Thermal Insulation
Communication
Software
Thermon Heat Tracing Systems CCI Thermal Process Heating Systems
Thermon heat tracing uses advanced controls and
communications platforms to heat external transfer lines
to maintain process fluid temperature within specified
ranges and then communicates that information back to
the operator…
…while CCI Thermal’s advanced heating products provide
heat to process fluids at others stages in the process – and
in other areas within a facility. This serves to broaden
Thermon’s scope through a providing a broader set of
solutions to the customer

R 226
G 35
B 26
R 255
G 255
B 255
R 00
G 00
B 00
R 239
G 66
B 67
R 199
G 33
B 39
R 154
G 29
B 32
R 207
G 205
B 206
R 160
G 158
B 159
R 70
G 70
B 71
R 15
G 72
B 120
R 21
G 93
B 160
R 58
G 135
B 193
13
20%
80%
Combination Expands Market with Leading Platform
Note: Represents Thermon internal estimates
11%
89%
17%
83%
+
$1.5 billion
Addressable market
$800 million $2.3 billion + =
The addition of CCI Thermal expands Thermon’s addressable market by over 50%
Design & supply of
industrial electric
heat trace systems
Heavy industrial
process heating
equipment
Combined Industrial
Process Heating
R 226
G 35
B 26
R 255
G 255
B 255
R 00
G 00
B 00
R 239
G 66
B 67
R 199
G 33
B 39
R 154
G 29
B 32
R 207
G 205
B 206
R 160
G 158
B 159
R 70
G 70
B 71
R 15
G 72
B 120
R 21
G 93
B 160
R 58
G 135
B 193
14
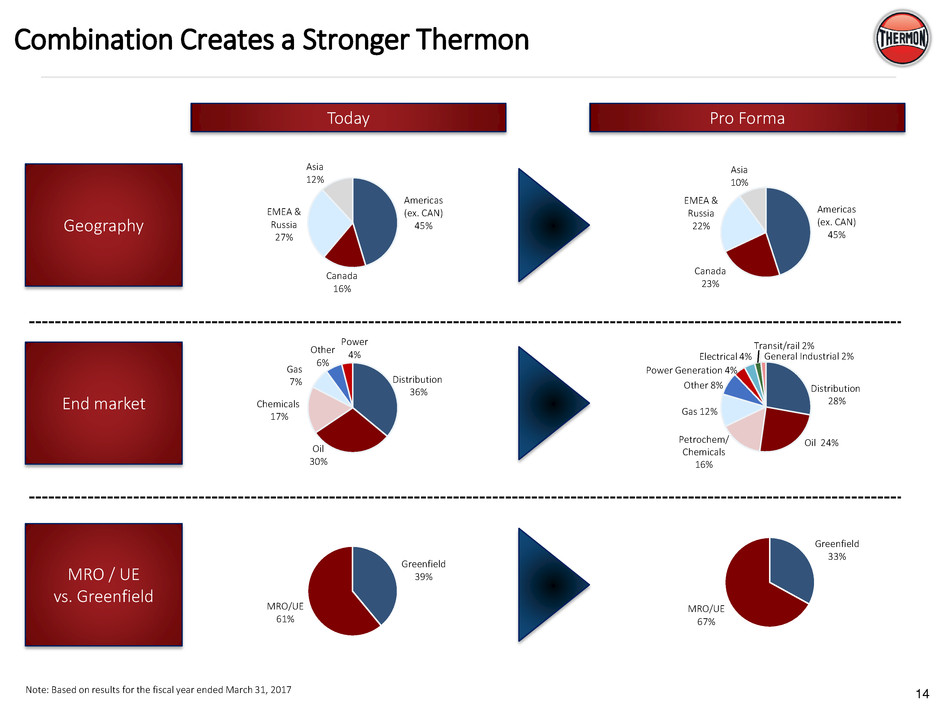
Americas
(ex. CAN)
45%
Canada
16%
EMEA &
Russia
27%
Asia
12%
Americas
(ex. CAN)
45%
Canada
23%
EMEA &
Russia
22%
Asia
10%
Geography
End market
Oil
30%
Other
6%
Power
4%
Oil 24%
Gas 12%
Other 8%
Distribution
36%
Petrochem/
Chemicals
16%
Distribution
28%
General Industrial 2%
Transit/rail 2%
Power Generation 4%
Electrical 4%
Chemicals
17%
Gas
7%
Combination Creates a Stronger Thermon
Note: Based on results for the fiscal year ended March 31, 2017
Today Pro Forma
MRO / UE
vs. Greenfield
Greenfield
39%
MRO/UE
61%
Greenfield
33%
MRO/UE
67%
Addressable
Market
Thermon
100%
Thermon
65%
CCI
Thermal
35%
$1.5
billion
$2.3
billion

R 226
G 35
B 26
R 255
G 255
B 255
R 00
G 00
B 00
R 239
G 66
B 67
R 199
G 33
B 39
R 154
G 29
B 32
R 207
G 205
B 206
R 160
G 158
B 159
R 70
G 70
B 71
R 15
G 72
B 120
R 21
G 93
B 160
R 58
G 135
B 193
15
Transaction Valuation Multiples
Key Valuation Metrics
Merger Consideration
(CAD$ in Millions)
Transaction Consideration $258.0
EBITDA Valuation Metrics
Standalone - Excluding Synergies
LTM 8/31/17A Adj. EBITDA $23.0
EV / LTM 8/31/17A Adj. EBITDA 11.2x
FY2018B Adj. EBITDA $29.3
EV / FY2018B Adj. EBITDA 8.8x
Pro Forma - Including Synergies
LTM 8/31/17A Synergized Adj. EBITDA
1
$25.1
EV / LTM 8/31/17A Synergized Adj. EBITDA 1 10.3x
FY2018B Synergized Adj. EBITDA 1 $31.4
EV / FY2018B Synergized Adj. EBITDA
1
8.2x
Source: Agreement, Logan management and Thunder management
Note: Fiscal year ending 7/31
1 Synergized EBITDA reflects pro forma run-rate cost synergies of $2.0 million

R 226
G 35
B 26
R 255
G 255
B 255
R 00
G 00
B 00
R 239
G 66
B 67
R 199
G 33
B 39
R 154
G 29
B 32
R 207
G 205
B 206
R 160
G 158
B 159
R 70
G 70
B 71
R 15
G 72
B 120
R 21
G 93
B 160
R 58
G 135
B 193
16
Key Financial Terms and Leverage At Close
CCI top line growth of 12% in FY’17 and 16% on TTM Basis
7 year average EBITDA to revenue of 29.4%, 5% higher
than Thermon’s performance
JPM Chase is providing fully committed financing with a
term loan B for $250M plus a $60M revolver
Thermon’s annual debt service to decrease by 20% from
$23M to $16M
Key Financing Metrics
Strong cash flows from the combined businesses will create the financial capability to comfortably operate
the business and associated debt levels while concurrently de-levering our business
As of 6/30/2017 Thermon PF Combined
Total debt $76M $250M
Net debt ($12M) $210M
Net debt/LTM
EBITDA
NM 3.4x
Cash $88M $40M

R 226
G 35
B 26
R 255
G 255
B 255
R 00
G 00
B 00
R 239
G 66
B 67
R 199
G 33
B 39
R 154
G 29
B 32
R 207
G 205
B 206
R 160
G 158
B 159
R 70
G 70
B 71
R 15
G 72
B 120
R 21
G 93
B 160
R 58
G 135
B 193
17
How CCI Helps Achieve Our Objectives
Customers
Leadership
Expansion
Innovation
People
Improves Financial Profile
Becomes a Thermon platform for #1 market position in
industrial process heating
Positions Thermon in a consolidator role for an adjacent,
fragmented $800m market
Adds technology, engineering, manufacturing capabilities, and
significant IP
Great cultural fit with long-tenured workforce
Outstanding brands and long-standing, blue-chip customer
relationships
$2m run-rate synergies and accretive to margins, FCF, and EPS
Accelerates Growth
Opportunity to sell CCI products into new end markets through
Thermon’s global footprint
+
Our Values & Goals How CCI Thermal Fits:
R 226
G 35
B 26
R 255
G 255
B 255
R 00
G 00
B 00
R 239
G 66
B 67
R 199
G 33
B 39
R 154
G 29
B 32
R 207
G 205
B 206
R 160
G 158
B 159
R 70
G 70
B 71
R 15
G 72
B 120
R 21
G 93
B 160
R 58
G 135
B 193
18
18

R 226
G 35
B 26
R 255
G 255
B 255
R 00
G 00
B 00
R 239
G 66
B 67
R 199
G 33
B 39
R 154
G 29
B 32
R 207
G 205
B 206
R 160
G 158
B 159
R 70
G 70
B 71
R 15
G 72
B 120
R 21
G 93
B 160
R 58
G 135
B 193
19
CCI Thermal Adjusted EBITDA Reconciliation
Reconciliation of Reported Net Earnings to Adjusted EBITDA
($CAD in Millions) Fiscal year ending July 31, LTM
2014A 2015A 2016A 2017A 8/31/17
Reported Net Earnings (In accordance with GAAP) $31.4 $33.8 $8.4 $15.9 $16.4
(Gain)/loss on sale of property and equipment 0.3 - (0.0) - -
Income tax expense 0.2 1.4 0.2 0.0 0.0
Interest expense 0.0 0.0 0.0 0.0 0.0
Interest income (0.0) (0.0) (0.0) (0.0) (0.0)
Reported EBIT $31.9 $35.2 $8.6 $15.9 $16.5
Depreciation - Cost of sales 1.1 1.2 1.2 1.2 1.2
Depreciation - Operating 0.2 0.2 0.3 0.3 0.3
Depreciation - Aircraft 0.5 0.6 0.4 0.3 0.3
Amortization of intangible assets 1.6 1.6 1.5 0.8 0.7
Reported EBITDA $35.4 $38.8 $12.1 $18.5 $19.1
Adjustments
1: Travel (aircraft) - actual 0.9 1.0 1.1 0.8 0.8
1: Travel (aircraft) - fair market value (0.0) (0.0) (0.0) (0.0) (0.0)
2: Related party rent - actual 2.7 2.8 2.8 2.8 2.8
3: Discontinued operations - Indiana 0.3 - - - -
4: Donations 0.1 0.1 0.1 0.1 0.1
5: Relocation expenses - 0.0 0.1 - -
6: Edmonton renovation expenses - 0.1 - - -
7: Hovey acquisition expenses - - - 0.1 0.1
8: Other non-recurring expenses - - - 0.1 0.1
9: Oakville expansion cancellation costs - - - 0.1 0.1
Adjusted EBITDA $39.4 $42.8 $16.1 $22.5 $23.0
Source: Financial Statements
Note: Adj. EBITDA defined as earnings before interest, taxes, depreciation and amortization, adjusted to exclude non-recurring items and related-party rent
expense given Thunder’s acquisition of the Canadian Real Property
