Attached files
| file | filename |
|---|---|
| EX-32.2 - EXHIBIT 32.2 - Nutanix, Inc. | ex322-7312017x10k.htm |
| EX-32.1 - EXHIBIT 32.1 - Nutanix, Inc. | ex321-7312017x10k.htm |
| EX-31.2 - EXHIBIT 31.2 - Nutanix, Inc. | ex312-7312017x10k.htm |
| EX-31.1 - EXHIBIT 31.1 - Nutanix, Inc. | ex311-7312017x10k.htm |
| EX-23.1 - EXHIBIT 23.1 - Nutanix, Inc. | exhibit231-auditorsconsent.htm |
| EX-21.1 - EXHIBIT 21.1 - Nutanix, Inc. | exhibit211-listofsubsidiar.htm |
UNITED STATES
SECURITIES AND EXCHANGE COMMISSION
Washington, D.C. 20549
FORM 10-K
(Mark One)
x | ANNUAL REPORT PURSUANT TO SECTION 13 OR 15(d) OF THE SECURITIES EXCHANGE ACT OF 1934 |
For the fiscal year ended July 31, 2017
OR
o | TRANSITION REPORT PURSUANT TO SECTION 13 OR 15(d) OF THE SECURITIES EXCHANGE ACT OF 1934 |
For the transition period from to
Commission File Number: 001-37883
NUTANIX, INC.
(Exact name of registrant as specified in its charter)
Delaware | 27-0989767 | |
(State or other jurisdiction of incorporation or organization) | (I.R.S. Employer Identification No.) | |
1740 Technology Drive, Suite 150 San Jose, CA 95110 | ||
(Address of principal executive offices, including zip code) | ||
(408) 216-8360 | ||
(Registrant's telephone number, including area code) | ||
Indicate by check mark whether the registrant (1) has filed all reports required to be filed by Section 13 or 15(d) of the Securities Exchange Act of 1934 during the preceding 12 months (or for such shorter period that the registrant was required to file such reports), and (2) has been subject to such filing requirements for the past 90 days. Yes x No ¨
Indicate by check mark whether the registrant has submitted electronically and posted on its corporate Web site, if any, every Interactive Data File required to be submitted and posted pursuant to Rule 405 of Regulation S-T during the preceding 12 months (or for such shorter period that the registrant was required to submit and post such files). Yes x No ¨
Indicate by check mark if disclosure of delinquent filers pursuant to Item 405 of Regulation S-K is not contained herein, and will not be contained, to the best of registrant’s knowledge, in definitive proxy or information statements incorporated by reference in Part III of this Form 10-K, or any amendment to this Form 10-K. ¨
Indicate by check mark whether the registrant is a large accelerated filer, an accelerated filer, a non-accelerated filer, a smaller reporting company, or an emerging growth company. See the definitions of “large accelerated filer,” “accelerated filer,” “smaller reporting company,” and “emerging growth company” in Rule 12b-2 of the Exchange Act. (Check one):
Large accelerated filer | o | Accelerated filer | o | ||
Non-accelerated filer | o (Do not check if a smaller reporting company) | Smaller reporting company | o | ||
Emerging growth company | x | If an emerging growth company, indicate by check mark if the registrant has elected not to use the extended transition period for complying with any new or revised financial accounting standards provided pursuant to Section 13(a) of the Exchange Act. | o | ||
Indicate by check mark whether the registrant is a shell company (as defined in Rule 12b-2 of the Securities Exchange Act). Yes o No x
The aggregate market value of the registrant's common stock held by non-affiliates of the registrant as of January 31, 2017 (the last business day of the registrant's most recently completed second fiscal quarter) was approximately $2.7 billion, based upon the closing sale price of such stock on the NASDAQ Global Select Market. The registrant has no non-voting common equity.
As of August 31, 2017, the registrant had 95,793,160 shares of Class A common stock, $0.000025 par value per share, and 59,150,486 shares of Class B common stock, $0.000025 par value per share, outstanding.
DOCUMENTS INCORPORATED BY REFERENCE
As noted herein, the information called for by Parts II and III is incorporated by reference to specified portions of the registrant’s definitive proxy statement to be filed in conjunction with the registrant’s 2017 annual meeting of stockholders, which is expected to be filed not later than 120 days after the registrant's fiscal year ended July 31, 2017.
TABLE OF CONTENTS
Page | |
i
SPECIAL NOTE REGARDING FORWARD LOOKING STATEMENTS
This Annual Report on Form 10-K contains forward-looking statements within the meaning of Section 27A of the Securities Act of 1933, as amended, or the Securities Act, and Section 21E of the Securities Exchange Act of 1934, as amended, or the Exchange Act, which statements involve substantial risks and uncertainties. All statements contained in this Annual Report on Form 10-K other than statements of historical fact, including statements regarding our future results of operations and financial position, our business strategy and plans, and our objectives for future operations, are forward-looking statements. The words “believe,” “may,” “will,” “potentially,” “estimate,” “continue,” “anticipate,” “plan,” “intend,” “could,” “would,” “expect” and similar expressions that convey uncertainty of future events or outcomes are intended to identify forward-looking statements. Forward-looking statements included in this Annual Report on Form 10-K include, but are not limited to, statements regarding:
• | our future revenue, cost of revenue, and operating expenses, as well as changes in the cost of product revenue, component costs, product gross margins and support and other services revenue, and changes in research and development, sales and marketing and general and administrative expenses; |
• | our business plan and our ability to effectively manage our growth; |
• | anticipated trends, growth rates and challenges in our business and in the markets in which we operate, including the productivity of our sales team; |
• | our ability to develop new solutions, product features and technology, such as Nutanix Calm and Nutanix Xi Cloud Services, and bring them to market in a timely manner; |
• | market acceptance of new technology and recently introduced solutions; |
• | the interoperability and availability of our solutions with and on third-party hardware platforms, such as IBM Power Systems; |
• | our beliefs and objectives for future operations, including plans to continue to invest in our global engineering, research and development, and sales and marketing teams, and the impact of such investments on our operations; |
• | our ability to increase sales of our solutions; |
• | our ability to attract new end-customers, and retain and grow sales from our existing end-customers; |
• | our ability to maintain and strengthen our relationships with our channel and OEM partners; |
• | the effects of seasonal trends on our results of operations; |
• | our expectations concerning relationships with third parties, including our ability to compress and stabilize sales cycles; |
• | our ability to maintain, protect and enhance our intellectual property; |
• | our ability to continue to expand internationally; |
• | the effects of increased competition in our market and our ability to compete effectively; |
• | anticipated capital expenditures; |
• | future acquisitions or investments in complementary companies, products, services or technologies and the ability to successfully integrate acquisitions such as Calm and PernixData; |
• | our ability to stay in compliance with laws and regulations that currently apply or become applicable to our business both in the United States and internationally; |
• | economic and industry trends, projected growth or trend analysis; |
• | the attraction and retention of qualified employees and key personnel; |
• | our expectations concerning future shifts in the mix of whether our solutions are sold as an appliance or as software-only, and in the mix of the types of appliances we sell; and |
• | sufficiency of cash to meet cash needs for at least the next 12 months. |
We have based these forward-looking statements largely on our current expectations and projections about future events and trends that we believe may affect our financial condition, results of operations, business strategy, short-term and long-term business operations and objectives and financial needs. These forward-looking statements are subject to a number of risks, uncertainties and assumptions, including those described in Part I, Item 1A. “Risk Factors” in this Annual Report on Form 10-K. Moreover, we operate in a very competitive and rapidly changing environment. New risks emerge from time to time. It is not possible for us to predict all risks, nor can we assess the impact of all factors on our business or the extent to which any factor, or combination of factors, may cause actual results to differ materially from those contained in any forward-looking statements we may make. In light of these risks, uncertainties and assumptions, the forward-looking events and trends discussed in this Annual Report on Form 10-K may not occur and actual results could differ materially and adversely from those anticipated or implied in the forward-looking statements.
You should not rely upon forward-looking statements as predictions of future events. Although we believe that the expectations reflected in the forward-looking statements are reasonable, we cannot guarantee that the future results, performance, or events and circumstances reflected in the forward-looking statements will be achieved or occur. The forward-looking statements in this Annual Report on Form 10-K relate only to events as of the date on which the statements are made. We undertake no obligation to update, revise or publicly release the results of any revision to these forward-looking statements to reflect new information or the occurrence of unanticipated events, except as required by law. We may not actually achieve the plans, intentions or expectations disclosed on our forward looking statements and you should not place undue reliance on our forward looking statements.
ii
ITEM 1. Business
Overview
We provide a leading next-generation enterprise cloud operating system that converges traditional silos of server, virtualization, storage and networking into one integrated solution and unifies private and public cloud into a single software fabric. Our software delivers the agility, scalability and pay-as-you-grow economics of the public cloud, while addressing enterprise requirements of application mobility, security, data integrity and control. We provide our customers with the flexibility to selectively utilize the public cloud for suitable workloads and specific use cases by enabling increasing levels of application mobility across private and public clouds. This capability will enable hybrid cloud deployments and addresses a critical requirement for any next-generation enterprise cloud operating system. We have also recently announced additional capabilities that will enable native application orchestration and lifecycle management across multiple private and public cloud environments, as well as a native cloud-based disaster recovery service, which will further extend our hybrid cloud vision across the entire software stack. We have combined advanced web-scale technologies with elegant consumer-grade design to deliver a powerful enterprise cloud operating system that elevates IT organizations to focus on the applications and services that power their businesses. Our operating system is designed to create “invisible infrastructure” that provides constant availability and low-touch management, enables application mobility across computing environments and reduces inefficiencies in IT planning.
Our Enterprise Cloud Operating System
Our enterprise cloud operating system is based on powerful distributed systems architecture and converges server, virtualization, storage and networking resources into one integrated operating system. Generalist IT professionals are able to manage one datacenter operating system and management interface, which reduces administrative time and costs. Our solution is currently comprised of two comprehensive software product families, Acropolis and Prism.
Acropolis. Acropolis includes our Distributed Storage Fabric that replaces traditional storage arrays and delivers efficient and high performance enterprise-grade data management across a range of storage protocols to support a wide variety of enterprise applications, and we have recently introduced the capability to operate both virtualized and non-virtualized applications. Acropolis also includes our innovative Application Mobility Fabric that will enable increasing levels of application placement, conversion and migration across different hypervisors and public clouds. Additionally, the built-in Acropolis Hypervisor can replace expensive third-party hypervisors and eliminate an additional infrastructure silo.
Prism. Built with consumer-grade design, Prism delivers integrated virtualization and infrastructure management, robust operational analytics, a search-first interface, self-service capabilities and one-click administration. Prism allows routine IT operations that are typically manual and cumbersome to be fully automated or completed with just one click, including capacity planning, provisioning of new applications and resources, troubleshooting and software upgrades. Prism also offers a self-service portal that enables developers and line-of-business owners to provision services as well as a broad set of APIs for integration with third-party cloud management and orchestration software.
1
Our Technology
Our enterprise cloud operating system converges server, virtualization, storage and networking into one software-driven integrated operating system that unifies private and public cloud into a single software fabric. Our operating system is designed to run on a variety of hardware platforms, including off-the-shelf x86 servers. Our solutions are easy-to-deploy and can be expanded one node at a time, reducing costs associated with overprovisioning. The product is a scalable distributed system and can be formed into very large clusters without any single point of failure or degradation of performance. Our solution is currently comprised of two comprehensive software product families, Acropolis and Prism.
Acropolis. Acropolis provides an open platform designed to address storage, application mobility and virtualization needs for a wide range of workloads that can be run at any scale. This platform offers IT professionals feature-rich turnkey infrastructure with increased flexibility of where to run their applications. Acropolis delivers enterprise-grade data management services, applied to individual virtual machines or applications to provide our customers with the granular infrastructure control they desire. Acropolis also provides scalable, efficient and secure platform services with built-in virtualization. Acropolis is comprised of three foundational components that can replace mid-range to high-end storage arrays and standalone virtualization products:
• | Acropolis Distributed Storage Fabric: Building on our Nutanix Distributed File System, the Acropolis Distributed Storage Fabric, or DSF, enables robust enterprise storage services across multiple storage protocols and hypervisors. Acropolis DSF provides file-based and block-based storage for both virtualized and non-virtualized environments. |
• | Acropolis Application Mobility Fabric: The Acropolis Application Mobility Fabric, or AMF, provides an open environment capable of delivering intelligent application placement and migration, as well as cross-hypervisor high availability and integrated disaster recovery. Acropolis supports all virtualized applications, and is intended to provide a seamless path to containers and hybrid cloud computing in the future. AMF allows migration from one hypervisor, such as VMware ESXi, to another hypervisor such as AHV. Acropolis DSF abstracts out the storage dependencies and AMF automates the workflows of the discrete steps of file format conversion, driver injection and VM provisioning. AMF also includes Cloud Connect, which offers extended hybrid cloud capabilities such as disaster recovery. |
• | Acropolis Hypervisor: Our built-in Acropolis Hypervisor, or AHV, is based on widely-used open source hypervisor technology known as Linux KVM, and is hardened with enterprise-grade security, self-healing capabilities and robust virtual machine, or VM, management. AHV is also integrated with Prism to deliver streamlined administrator workflows when provisioning, cloning and placing VMs. |
Prism. Prism offers a single point of management for server, virtualization, storage and networking resources and provides an end-to-end view of all common administrator workflows, system health, alerts and notifications through a simple, elegant and intuitive interface. Prism features innovative technology that streamlines time-consuming IT tasks, and includes one-click operation of software upgrades, detailed capacity analysis and troubleshooting.
2
The Prism homepage shows an overview of the cluster, system health and critical alerts:
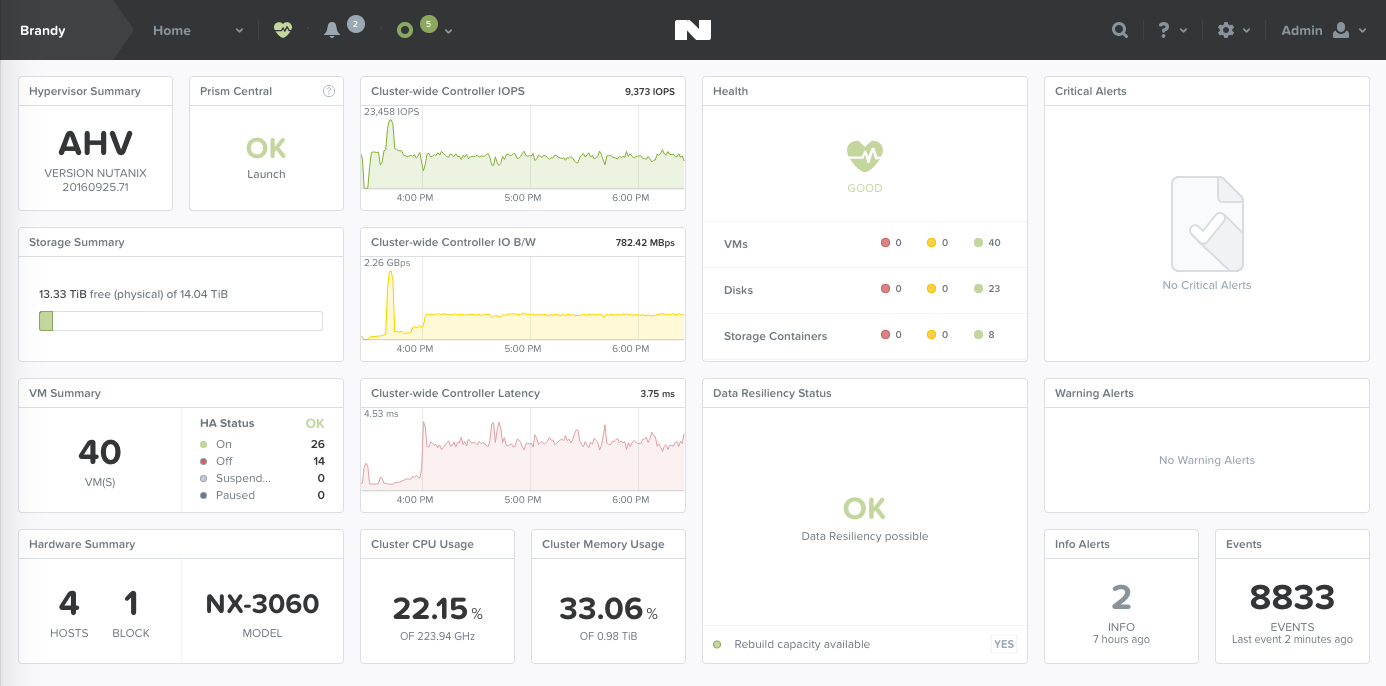
Prism enables efficient management of enterprise-wide deployments by serving as a central administration point to manage multiple clusters and hypervisors (including VMware ESXi environments) within a datacenter or across multiple sites. Prism is built with HTML5 and can be accessed from any connected device that is HTML5-enabled, including smartphones and tablets. With innovative built-in machine intelligence technology, Prism provides capacity runway projections and capacity optimization recommendations to ensure just the right amount of resources are provisioned to support the applications running on the platform. Users can then precisely track infrastructure utilization across a distributed environment and add or remove nodes to any cluster in minutes. Prism is also built using a distributed, scale-out NoSQL database, meaning that software updates and patches can be executed non-disruptively on a rolling basis and do not require the cluster to be brought offline. Prism provides a suite of APIs for integration with third-party cloud management and orchestration systems, and allows developers and business users to provision infrastructure services without the need for intervention by IT. Often viewed as a key capability of any cloud platform, the Nutanix Self Service features built into Prism improve IT agility by radically simplifying application delivery and development while also heightening infrastructure automation.
Our Solutions. Our software is combined with off-the-shelf x86 servers and sold as integrated appliances by us (via our reseller partners) or by one of our OEM partners. Additionally, end-customers can buy our stand-alone software and deploy the software on a variety of hardware platforms, including qualified x86 servers.
The appliances we sell are designed and optimized for various use cases and workloads, ranging from the NX-1000 series, which is intended for remote branch office environments, to our NX-8000 series, which is intended for high-end databases and enterprise applications requiring the highest performance. In addition, our Xpress product line leverages the Nutanix enterprise cloud software to address the needs of small and medium-sized businesses.
Across the breadth of models we offer, our appliances may include one, two or four nodes in a 2U (rack unit) footprint. Our appliances are configured to order, providing our customers with a range of available hardware combinations in terms of central processing unit, memory, flash devices, hard drives and networking interfaces to meet the specific requirements of customers’ workloads. All Nutanix appliances can be configured with all-flash storage to meet higher-end application performance requirements. Our appliances can be mixed and matched with different models in a cluster to provide maximum flexibility and address the requirement to scale storage and compute resources independently.
3
We also have OEM partnerships with Dell Technologies, or Dell, and Lenovo Group Ltd., or Lenovo, which license our software and package it with their hardware into the Dell XC Series and Lenovo Converged HX Series appliances, respectively. Dell and Lenovo offer the XC Series and HX Series in a range of configurations and also sell associated support offerings, which we jointly support. We also recently announced a partnership with International Business Machines Corporation, or IBM, to deliver our software on IBM Power Systems, as the IBM CS Series.
Acropolis is available in different software editions so that our end-customers can easily select the capabilities to meet their infrastructure needs.
• | Starter: The Acropolis Starter edition offers the core set of our software functionality. This edition is designed for smaller-scale deployments with a limited set of non-critical workloads. The Starter edition is included in the price of each appliance. |
• | Pro: The Acropolis Pro edition offers enhanced data services, along with higher level resilience and management features. This edition is designed for enterprises running multiple applications on a cluster or for large-scale single workload deployments. |
• | Ultimate: The Acropolis Ultimate edition offers the complete suite of our software capabilities, including application mobility and even more robust data protection, to meet the most demanding infrastructure requirements. This edition is designed for multi-site deployments and for meeting advanced security requirements. |
Prism is also available in multiple software editions, helping our end-customers choose the advanced management and automation capabilities that best fit their operational needs.
• | Starter: The Prism Starter edition is a complete system management platform and includes single and multi-site management of Nutanix clusters. Capabilities include streamlined administration of all compute, virtualization, storage and networking services in the Nutanix operating system. |
• | Pro: The Prism Pro edition includes an advanced machine intelligence platform, delivering robust operations and automation capabilities such as capacity planning, one-click capacity optimization, integrated consumer-grade search and customizable dashboards. This edition adds advanced IT operations management and eliminates the need for expensive third party cloud management and orchestration products. |
Recent Developments
We recently announced Nutanix Calm and Nutanix Xi Cloud Services, two of our upcoming products and services which, once available, are expected to extend our operating system to customers’ multiple cloud deployments and integrate private cloud and public cloud deployments. Nutanix Calm is a native application orchestration and lifecycle management software solution that abstracts application environments from the underlying infrastructure, and is expected to be available in late 2017. Nutanix Xi Cloud Services will allow IT leaders to leverage Nutanix software infrastructure as a native cloud-delivered service, initially for disaster recovery, and is expected to be available in 2018.
4
Our Support Program
We offer technical support to our end-customers around the clock to meet their needs and four hour part replacement for end-customers who purchase our highest level of support. Our support centers are located around the world and are staffed by our employees. We offer technical support in multiple different subscription and support programs, generally available in one, three or five-year packages including the following:
• | Xpress Support: Our Xpress Program is designed specifically to support customers of our Xpress product line. |
• | Production: Our Production Program is designed for mid-size to large enterprises that operate business-critical operations. The Production Program entitles end-customers to 24 hour support, priority call and case handling and next business day on-site part replacement. |
• | Mission Critical: Our Mission Critical Program is designed for large enterprises that operate our products in mission-critical environments. The Mission Critical Program entitles end-customers to 24 hour support, priority call and case handling, direct access to senior level engineers and up to four hour on-site part replacement. |
Our End-Customers
Our software is combined with off-the-shelf x86 servers and sold as integrated appliances by us (via our reseller partners) or by one of our OEM partners. Additionally, end-customers can buy our stand-alone software and deploy the software on a variety of hardware platforms, including qualified x86 servers, which we believe expands our addressable market. Our solution addresses a broad range of workloads, including enterprise applications, databases, virtual desktop infrastructure, or VDI, unified communications and big data analytics. We have end-customers across a broad range of industries, including automotive, consumer goods, education, energy, financial services, healthcare, manufacturing, media, public sector, retail, technology and telecommunications. We also sell to service providers who utilize our operating system to provide a variety of cloud-based services to their customers, including infrastructure-as-a-service offerings. We had a broad and diverse base of 7,051 end-customers as of July 31, 2017, including many Global 2000 enterprises. Carahsoft Technology Corp., a distributor to our end-customers, represented 23%, 15% and 11% of our total revenue for fiscal 2015, fiscal 2016 and fiscal 2017, respectively. Promark Technology Inc., another distributor to our end-customers, represented 15%, 20% and 22% of our total revenue for fiscal 2015, fiscal 2016 and fiscal 2017, respectively.
We define the number of end-customers as the number of end-customers for which we have received an order by the last day of the period indicated. Our count of end-customers does not include partners to which we have sold product for their own demonstration purposes. A single organization or customer may represent multiple end-customers for separate divisions, segments or subsidiaries.
5
Sales and Marketing
We primarily engage our end-customers through our global sales force who directly interact with key IT decision makers while also providing sales development, opportunity qualification and support to our channel partners. We have established relationships with many of the key resellers and distributors of datacenter infrastructure software and systems in each of the geographic regions where we operate.
We also engage our end-customers through our OEM partners Dell and Lenovo, which license our software and package it with their hardware into the Dell XC Series and Lenovo Converged HX Series appliances, respectively. Dell and Lenovo products incorporating our software are sold through their direct sales forces and channel partners. We also recently announced a partnership with IBM, which will license our software and package it with IBM Power Systems servers to create the IBM CS Series, which will be sold through IBM’s direct sales force and channel partners.
Our agreements with Dell, Lenovo and IBM provide that these partners pay us royalties for the distribution of our software together with their hardware and the sale of support and maintenance contracts for the integrated products. We provide training to their support personnel, and we also coordinate with them to collectively resolve support issues for end-customers. We have also agreed with Dell, Lenovo and IBM to invest in sufficient sales and marketing resources to support the launch and promotion of the integrated products, which, in the case of Lenovo, includes the commitment of dedicated sales personnel to support the sale of the integrated products. We work with each of Dell, Lenovo and IBM to ensure interoperability between our software and their hardware and to certify certain hardware configurations for use with our software.
Our agreement with Lenovo expires in October 2018, and automatically renews for two successive one-year periods thereafter unless one party gives six months’ prior notice to the other party of its intent not to renew. Our agreement with Dell expires in June 2021, and automatically renews for successive one-year periods thereafter unless one party gives six months’ prior notice to the other party of its intent not to renew. Our agreement with IBM expires in July 2020, and automatically renews for successive one-year periods thereafter unless one party gives 180 days’ prior notice to the other party of its intent not to renew.
Our channel partners have joined our integrated partner program, the Nutanix Partner Network, which provides market development funds, preferred pricing through deal registration, sales enablement and product training, innovative marketing campaigns and dedicated account support. We also coordinate with Dell, Lenovo and IBM on joint marketing activities.
We supplement our sales efforts with our marketing program that includes print and online advertising, corporate and third-party events, demand generation activities, social media promotions, media and analyst relations and communities programs. For example, in June 2017 we hosted our third annual .NEXT Conference, where more than 3,500 attendees came to learn about our current and future products and solutions. We also establish deep integration with our ecosystem of third-party technology partners and engage in joint marketing activities with them.
Research and Development
Our research and development efforts are focused primarily on improving current technology, developing new technologies in current and adjacent markets and supporting existing end-customer deployments. Our research and development teams primarily consist of distributed systems software and user interface engineers. Most of our research and development team is based in San Jose, California. We also maintain research and development centers in Bangalore, India, Durham, North Carolina and Seattle, Washington. We plan to dedicate significant resources to our continued research and development efforts.
Research and development expense was $73.5 million, $116.4 million and $288.6 million for fiscal 2015, fiscal 2016 and fiscal 2017, respectively.
6
Manufacturing
We outsource the assembly of our hardware products to two contract manufacturers, Super Micro Computer, Inc., or Super Micro, and Flextronics Systems Limited, or Flextronics. Super Micro and Flextronics assemble and test our products and they generally procure the components used in our products directly from third-party suppliers. Our agreement with Super Micro expires in May 2018, and automatically renews for successive one-year periods thereafter with the option to terminate upon each annual renewal. In the third quarter of fiscal 2017, we entered into a Memorandum of Understanding with Flextronics pursuant to which we have transitioned and will continue to transition portions of our manufacturing operations to Flextronics, and we are currently working with Flextronics to finalize a manufacturing agreement. Distributors handle fulfillment and shipment for certain end-customers, but do not hold inventory.
Backlog
We typically accept and ship orders within a short time frame. In general, customers may cancel or reschedule orders without penalty, and delivery schedules requested by customers in their purchase orders vary based upon each customer’s particular needs. As a result, we do not believe that our backlog at any particular time is a reliable indicator of future revenue.
Competition
We operate in the intensely competitive enterprise infrastructure market and compete primarily with companies that sell software to build and operate enterprise clouds, integrated systems, and standalone storage and servers, as well as providers of public cloud infrastructure solutions. These markets are characterized by constant change and rapid innovation. Our main competitors fall into the following categories:
• | software providers, such as VMware, Inc., or VMware, and Red Hat, Inc., that offer a broad range of virtualization, infrastructure and management products to build and operate enterprise clouds; |
• | traditional IT systems vendors such as Hewlett Packard Enterprise Company, or HPE, Cisco Systems, Inc., or Cisco, Lenovo, Dell, Hitachi Data Systems, or Hitachi, and IBM, that offer integrated systems that include bundles of servers, storage and networking solutions, as well as a broad range of standalone server and storage products; |
• | traditional storage array vendors, such as Dell, NetApp, Inc. and Hitachi, which typically sell centralized storage products; and |
• | providers of public cloud infrastructure and services, such as Amazon.com, Inc., Google, and Microsoft Corporation. |
In addition, we compete against vendors of hyperconverged infrastructure and software-defined storage products such as VMware, Cisco, HPE, Dell and many smaller emerging companies. As our market grows, we expect it will continue to attract new companies as well as existing larger vendors. Some of our competitors may expand their product offerings, acquire competing businesses, sell at lower prices, bundle with other products, provide closed technology platforms, or otherwise attempt to gain a competitive advantage.
We believe the principal competitive factors in the infrastructure software and systems market include:
• | product features and capabilities; |
• | system scalability, performance and resiliency; |
• | management and operations, including provisioning, analytics, automation and upgrades; |
• | total cost of ownership over the lifetime of the technology; |
• | product interoperability with third-party applications, infrastructure software, infrastructure systems and public clouds; |
• | application mobility across disparate silos of enterprise computing, including public and private cloud infrastructure; and |
7
• | complete customer experience, including support and professional services. |
We believe we are positioned favorably against our competitors based on these factors. However, many of our competitors have substantially greater financial, technical and other resources, greater brand recognition, larger sales forces and marketing budgets, broader distribution, and larger and more mature intellectual property portfolios.
Intellectual Property
Our success depends in part upon our ability to protect and use our core technology and intellectual property. We rely on patents, trademarks, copyrights and trade secret laws, confidentiality procedures, and employee nondisclosure and invention assignment agreements to protect our intellectual property rights. As of July 31, 2017, we had 48 United States patents that have been issued or allowed and 161 patent applications pending in the United States. Our issued patents expire between 2031 and 2037. We also integrate open source software into our products.
We control access to and use of our proprietary software and other confidential information through the use of internal and external controls, including contractual protections with employees, contractors, customers and partners, and our software is protected by U.S. and international copyright laws. Despite our efforts to protect our trade secrets and proprietary rights through intellectual property rights, licenses and confidentiality agreements, unauthorized parties may still copy or otherwise obtain and use our software and technology. In addition, we sell extensively internationally, and effective patent, copyright, trademark and trade secret protection may not be available or may be limited in foreign countries.
Our industry is characterized by the existence of a large number of patents and frequent claims and related litigation regarding patent and other intellectual property rights. We believe that competitors will try to develop products and services that are similar to ours and that may infringe our intellectual property rights. Our competitors or other third-parties may also claim that our operating system infringes their intellectual property rights. In particular, leading companies in our industry have extensive patent portfolios. From time to time, third-parties, including certain of these leading companies and non-practicing entities, may assert patent, copyright, trademark and other intellectual property rights against us, our channel partners, or our end-customers, which our standard license and other agreements obligate us to indemnify against such claims. Successful claims of infringement by a third-party could prevent us from distributing certain products or performing certain services, require us to expend time and money to develop non-infringing solutions, or force us to pay substantial damages (including damages if we are found to have willfully infringed patents or copyrights), royalties or other fees. In addition, to the extent that we gain greater visibility and market exposure as a public company, we face a higher risk of being the subject of intellectual property infringement claims from third parties. We cannot assure you that we do not currently infringe, or that we will not in the future infringe, upon any third-party patents or other proprietary rights. See “Risk Factors—Third-party claims that we are infringing intellectual property, whether successful or not, could subject us to costly and time-consuming litigation or expensive licenses, and our business could be harmed” for additional information.
8
Facilities
Our corporate headquarters are located in San Jose, California where, under two lease agreements that expire in March 2021, we currently lease approximately 176,000 square feet of space. We also maintain offices in North America, Europe, Asia-Pacific, Middle East, Latin America and Africa. We lease all of our facilities and do not own any real property. We expect to add facilities as we grow our employee base and expand geographically. We believe that our facilities are adequate to meet our needs for the immediate future, and that, should it be needed, suitable additional space will be available to accommodate expansion of our operations.
Employees
We had 2,813 employees worldwide as of July 31, 2017. None of our employees in the United States is represented by a labor organization or is a party to any collective bargaining arrangement. In certain of the European countries in which we operate, we are subject to, and comply with, local labor law requirements in relation to the establishment of works councils. We are often required to consult and seek the consent or advice of these works councils. We have never had a work stoppage and we consider our relationship with our employees to be good.
Information about Segment and Geographic Areas
The segment and geographic information required herein is contained in Note 14 of our Notes to Consolidated Financial Statements in Part II, Item 8 of this Annual Report on Form 10-K.
Corporate Information
We were incorporated in Delaware in September 2009 as Nutanix, Inc. Our principal executive offices are located at 1740 Technology Drive, Suite 150, San Jose, California 95110, and our telephone number is (408) 216-8360. We have operations throughout North America, Europe, Asia-Pacific, Middle East, Latin America and Africa. Our website address is www.nutanix.com. Information contained on or accessible through our website is not a part of this report and the inclusion of our website address in this report is an inactive textual reference only.
Available Information
Our website is located at www.nutanix.com, and our investor relations website is located at ir.nutanix.com. This Annual Report on Form 10-K and our Quarterly Reports on Form 10-Q, Current Reports on Form 8-K and amendments to reports filed or furnished pursuant to Sections 13(a) and 15(d) of the Securities Exchange Act of 1934, as amended, or the Exchange Act, are available free of charge on the investor relations portion of our website as soon as reasonably practicable after we electronically file such material with, or furnish it to, the Securities and Exchange Commission, or SEC. We also provide a link to the section of the SEC’s website at www.sec.gov that has or will have all of our public filings, including this Annual Report on Form 10-K and our Quarterly Reports on Form 10-Q, Current Reports on Form 8-K, all amendments to those reports, our Proxy Statements, and other ownership related filings. We use our investor relations website as a channel of distribution for important company information. For example, webcasts of our earnings calls and certain events we participate in or host with members of the investment community are on our investor relations website. Additionally, we announce investor information, including news and commentary about our business and financial performance, SEC filings, notices of investor events, and our press and earnings releases, on our investor relations website. Investors and others can receive notifications of new information posted on our investor relations website in real time by signing up for email alerts and RSS feeds. Further corporate governance information, including our corporate governance guidelines, board committee charters, and code of conduct, is also available on our investor relations website under the heading “Governance.” The contents of our websites are not incorporated by reference into this Annual Report on Form 10-K or in any other report or document we file with the SEC, and any references to our websites are intended to be inactive textual references only.
9
Item 1A. Risk Factors
You should carefully consider the risks and uncertainties described below, together with all of the other information contained in this Annual Report on Form 10-K, including our consolidated financial statements and related notes, before making a decision to invest in our Class A common stock. The risks and uncertainties described below are not the only ones we face. Additional risks and uncertainties that we are unaware of, or that we currently believe are not material, may also become important factors that affect our business. If any of the following risks occur, our business, financial condition, operating results and prospects could be materially harmed. In that event, the price of our Class A common stock could decline, and you could lose part or all of your investment.
Risks Related to Our Business and Industry
We have a history of losses and we may not be able to achieve or maintain profitability in the future.
We have incurred net losses in all periods since our inception, and we expect that we will continue to incur net losses for the foreseeable future. We experienced net losses of $126.1 million, $168.5 million and $458.0 million for fiscal 2015, fiscal 2016 and fiscal 2017, respectively. As of July 31, 2017, we had an accumulated deficit of $899.8 million. In addition to the investments we expect to continue to make to grow our business, we have also incurred and expect to continue incurring significant additional legal, accounting and other expenses as a newly public company that we did not incur as a private company. If we fail to increase our revenue and manage our expenses, we may not achieve or sustain profitability in the future.
The markets in which we compete are rapidly evolving, which make it difficult to forecast end-customer adoption rates and demand for our solutions.
The markets in which we compete are rapidly evolving. Accordingly, our future financial performance will depend in large part on the allocation of spending in traditional IT markets and on our ability to adapt to new market demands. Currently, sales of our solutions are dependent in large part upon replacement of spending in traditional markets, including x86 servers, storage systems and virtualization software. In addition, as we develop new solutions designed to address new market demands, such as the recently announced Nutanix Xi Cloud Services and Nutanix Calm, sales of our solutions will in part be dependent on capturing new spending in these markets, including hybrid cloud services. If these markets experience a shift in customer demand, or if customers in these markets focus their new spending on, or shift their existing spending to, public cloud solutions more quickly or more extensively than expected, our solutions may not compete as effectively, if at all. It is also difficult to predict end-customer demand or adoption rates for our solutions or the future growth of our market.
If end-customers do not adopt our solutions, our ability to grow our business and operating results may be adversely affected.
Traditional IT infrastructure architecture is entrenched in the datacenters of many of our end-customers because of their historical financial investment in existing IT infrastructure architecture and the existing knowledge base and skillsets of IT administrators. As a result, our sales efforts often involve extensive efforts to educate our end-customers as to the benefits and capabilities of our web-scale architecture solutions, particularly as we continue to pursue large organizations as end-customers. If we fail to achieve market acceptance of our solutions, our ability to grow our business and our operating results will be adversely affected.
A shift in our relationships with our OEM partners could adversely affect our results of operations.
Our relationships with our OEM partners continue to shift as industry dynamics change, and our OEM partners may be less willing to partner with us as an OEM or otherwise as such shifts occur. For example,
Dell is not just an OEM partner, but also a competitor of ours, and accounted for over 10% of our total billings in each of fiscal 2016 and fiscal 2017. In September 2016, EMC Corporation, or EMC, was acquired by Dell. As a result of the acquisition, Dell may be more likely to promote and sell its own solutions, including those from EMC’s complementary product portfolio, over our products, or cease selling or promoting our products entirely. Also, Dell holds a majority of outstanding voting power in VMware, and could combine the Dell, EMC and VMware product portfolios into unified offerings optimized for their platforms. If Dell decides to sell its own solutions over our products, that could adversely impact our OEM sales and harm our business, operating results and prospects, and our stock price could decline.
10
Further, since we account for OEM sales, including sales made by Dell, as software sales for revenue recognition purposes, and because we have decided to early adopt the new revenue recognition standard (Accounting Standard Update 2014-09, Revenue from Contracts with Customers, or ASC 606) effective as of August 1, 2017, any reduction in OEM sales by any of our OEM partners will have an increased impact on our reported revenue and gross margins in future periods, potentially making it more difficult for us to forecast revenue and gross margins in future quarters. Under ASC 606, revenue from Dell would have accounted for approximately 12% and 10% of our total revenue in fiscal 2016 and fiscal 2017, respectively.
Our revenue growth in recent periods may not be indicative of our future performance.
We have experienced significant growth in recent periods with total revenue of $241.4 million, $444.9 million and $766.9 million for fiscal 2015, fiscal 2016 and fiscal 2017, respectively. You should not consider our revenue growth in recent periods as indicative of our future performance. While we have recently experienced significant revenue growth, we may not achieve similar revenue growth in future periods. Accordingly, you should not rely on our revenue growth for any prior periods as an indication of our future revenue or revenue growth.
We have experienced rapid growth in recent periods and we may not be able to sustain or manage any future growth effectively.
We have expanded our overall business and operations significantly in recent periods. Our employee headcount increased from 247 as of July 31, 2013 to 2,813 as of July 31, 2017, and we may have significant headcount increases in the future. We anticipate that our operating expenses will increase in the foreseeable future as we scale our business, including in developing and improving our solutions, expanding our sales and marketing capabilities and global coverage, and in providing general and administrative resources to support our growth. As we continue to grow our business, we must effectively integrate, develop and motivate a large number of new employees, as well as existing employees who are promoted or moved into new roles, while maintaining the effectiveness of our business execution. In particular, our success depends heavily on our ability to ramp new sales teams in a fast and effective manner. We must also continue to improve and expand our IT and financial infrastructure, management systems and product management and sales processes. We expect that our future growth will continue to place a significant strain on our management, operational and financial resources. We may incur costs associated with future growth prior to realizing the anticipated benefits, and the return on these investments may be lower, or may develop more slowly than we expect. If we are unable to manage our growth effectively, we may not be able to take advantage of market opportunities. We also may fail to satisfy end-customers’ requirements, maintain product quality, execute on our business plan or respond to competitive pressures, any of which could adversely affect our business, operating results, financial condition and prospects.
We compete with traditional storage vendors, IT systems vendors, including providers of public cloud services, and infrastructure software providers, and expect competition to continue to intensify in the future from both established competitors and new market entrants.
We operate in the intensely competitive enterprise infrastructure market and compete primarily with companies that sell software to build and operate enterprise clouds, integrated systems, and standalone storage and servers, as well as providers of public cloud infrastructure solutions. These markets are characterized by constant change and rapid innovation. Our main competitors fall into the following categories:
• | software providers such as VMware, Inc., or VMware, and Red Hat, Inc., that offer a broad range of virtualization, infrastructure and management products to build and operate enterprise clouds; |
• | traditional IT systems vendors such as Hewlett Packard Enterprise Company, or HPE, Cisco Systems, Inc., or Cisco, Lenovo Group Ltd., Dell Technologies Inc., or Dell, Hitachi Data Systems Corporation, or Hitachi, and International Business Machines Corporation, or IBM, that offer integrated systems that include bundles of servers, storage and networking solutions, as well as a broad range of standalone server and storage products; |
• | traditional storage array vendors such as Dell, NetApp, Inc., or NetApp, and Hitachi, which typically sell centralized storage products; and |
• | providers of public cloud infrastructure such as Amazon.com, Inc., Google Inc., and Microsoft Corporation. |
11
In addition, we compete against vendors of hyperconverged infrastructure and software-defined storage products such as VMware, Cisco, HPE, Dell and many smaller emerging companies. As our market grows, we expect it will continue to attract new companies as well as existing larger vendors. For example, NetApp recently released its first hyperconverged solution. Some of our competitors may expand their product offerings, acquire competing businesses, sell at lower prices, bundle with other products, provide closed technology platforms or otherwise attempt to gain a competitive advantage. For example, HPE acquired SimpliVity Corporation and Cisco recently announced its intention to acquire Springpath, Inc., both of which are emerging hyperconverged vendors, in order to bolster their own hyperconverged product lines. Furthermore, as we expand our product offerings, we may expand into new markets and we may encounter additional competitors in such markets. Additionally, as companies increasingly offer competing solutions, they may be less willing to partner with us as an OEM or otherwise.
Many of our existing competitors have, and some of our potential competitors may have, competitive advantages over us, such as longer operating histories, significantly greater financial, technical, marketing or other resources, stronger brand awareness and name recognition, larger intellectual property portfolios and broader global presence and distribution networks. Furthermore, some of our competitors supply a wide variety of products to, and have well-established relationships with, our current and prospective end-customers. Some of these competitors have in the past and may in the future take advantage of their existing relationships with end-customers, distributors or resellers to provide incentives to such current or prospective end-customers that make their products more economically attractive or to interfere with our ability to offer our solutions to our end-customers. Our competitors may also be able to offer products or functionality similar to ours at a more attractive price, such as by integrating or bundling their solutions with their other product offerings or those of technology partners or establishing cooperative relationships with other competitors, technology partners or other third parties. Potential end-customers may prefer to purchase from their existing suppliers rather than a new supplier, especially given the significant investments that they have historically made in their legacy infrastructures. Some of our competitors may also have stronger or broader relationships with technology partners than we do, which could make their products more attractive than ours. As a result, we cannot assure you that our solutions will compete favorably, and any failure to do so could adversely affect our business, operating results and prospects.
Our relatively limited operating history makes it difficult to evaluate our current business and prospects, and may increase the risk of your investment.
We began selling our products in October 2011. We have relatively limited historical financial data, and we operate in a rapidly evolving market. Our relatively limited operating history makes it difficult to evaluate our current business and our future prospects, including our ability to plan for and model future growth. For example, recent changes in our sales organization have impacted our sales productivity, making it difficult to project our business growth. In addition, the rapidly evolving nature of the enterprise IT infrastructure market, as well as other factors beyond our control, reduces our ability to accurately forecast quarterly or annual performance. Our solutions may never reach widespread adoption, and changes or advances in technologies could adversely affect the demand for our solutions. A reduction in demand for web-scale architectures caused by lack of customer acceptance, technological challenges, competing technologies and solutions or otherwise would result in lower revenue growth rates or decreased revenue, either of which could negatively impact our business, operating results and prospects. Any predictions about future revenue and expenses may not be as accurate as they would be if we had a longer operating history. We have encountered and will continue to encounter risks and difficulties associated with rapid growth and expansion and a relatively limited operating history. If we do not address these risks successfully, our business and operating results would be adversely affected, and our stock price could decline.
12
Developments or improvements in enterprise IT infrastructure technologies may materially and adversely affect the demand for our solutions.
Significant developments in enterprise IT infrastructure technologies, such as advances in storage, virtualization, containers and management software, may materially and adversely affect our business, operating results and prospects in ways we do not currently anticipate. For example, improvements in existing data storage technologies, such as a significant increase in the speed of traditional interfaces for transferring data between a server and a storage system or the speed of traditional embedded controllers within the storage system, could emerge as a preferred alternative to our solutions, especially if they are sold at lower prices. Any failure by us to develop new or enhanced technologies or processes, to react to changes or advances in existing technologies or to correctly anticipate these changes or advances as we create and invest in our product roadmap could materially delay our development and introduction of new solutions, which could result in the loss of competitiveness of our solutions, decreased revenue and a loss of market share to competitors. In addition, the servers, network, software and other components and systems of a datacenter must comply with established industry standards in order to interoperate and function efficiently together. If larger companies who are more influential in driving industry standards do not support the same standards we use, market acceptance of our solutions could be adversely affected, or we may be required to spend significant time and resources duplicating efforts to adapt to different standards.
Public cloud infrastructure offers alternatives to the on-premise infrastructure deployments that our operating system primarily supports. Various factors could cause the rate of adoption of public cloud infrastructure to increase, including continued or accelerated decreases in the price of public cloud offerings and improvements in the ability of public cloud providers to deliver reliable performance, enhanced security, better application compatibility and more precise infrastructure control. Any of these factors could make our operating system less competitive as compared to the public cloud, and could materially and adversely affect the demand for our solutions.
If other vendors do not cooperate with us to ensure that our solutions interoperate with their products, including by providing us with early access to their new products or information about their new products, our product development efforts may be delayed or impaired, which could adversely affect our business, operating results and prospects.
Our solutions provide an operating system on which software applications and hypervisors from different software providers run. As a result, our solutions must interoperate with our end-customers’ existing hardware and software infrastructure, specifically their networks, servers, software and operating systems, as well as the applications that they run on this infrastructure, which may be manufactured and provided by a wide variety of vendors and OEMs. In addition to ensuring that our solutions interoperate with these hardware and software products initially, we must occasionally update our software to ensure that our solutions continue to interoperate with new or updated versions of these hardware and software products. Current or future providers of hardware, software applications, hypervisors or data management tools could make changes that would diminish the ability of our solutions to interoperate with them, and significant additional time and effort may be necessary to ensure the continued compatibility of our solutions, which might not be possible at all. Even if our solutions are compatible with those of other providers, if they do not certify or support our solutions for their systems or cooperate with us to coordinate troubleshooting and hand off of support cases, end-customers may be reluctant to buy our solutions, which could decrease demand for our solutions and harm our ability to achieve a return on the investments and resources that we have dedicated to ensuring compatibility. Developing solutions that interoperate properly requires substantial partnering, capital investment and employee resources, as well as the cooperation of the vendors or developers of the software applications and hypervisors both with respect to product development and product support. Vendors may not provide us with early or any access to their technology and products, assist us in these development efforts, certify our solutions, share with or sell to us any APIs, formats, or protocols we may need, or cooperate with us to support end-customers. If they do not provide us with the necessary access, assistance or proprietary technology on a timely basis or at all, we may experience product development delays or be unable to ensure the compatibility of our solutions with such new technology or products. To the extent that vendors develop products that compete with ours, they have in the past, and may again in the future, withhold their cooperation, decline to share access, certify our solutions or sell or make available to us their proprietary APIs, protocols or formats or engage in practices to actively limit the functionality, or compatibility, and certification of our products. If any of the foregoing occurs, our product development efforts may be delayed or impaired, our solutions could become less attractive to end-customers resulting in a decline in sales, and our business, operating results and prospects may be adversely affected.
13
Shifts in our product mix more toward selling our solutions as software-only as opposed to as an appliance may cause our revenue to decline, and our gross margins to fluctuate.
Software-only sales typically reflect higher gross margins and lower revenue in a given period, as compared to software sales deployed on off-the-shelf servers, since the sale does not include the revenue or cost of the hardware components in an appliance. If adoption of our solutions continues to increase, there may be an increase in the delivery of our solutions as software-only licenses on separately procured hardware, and our overall product mix may shift more towards sales of our solutions as software-only licenses. Unless we can replace the hardware revenue with additional software sales, any increase in software-only sales may cause our revenue to decline, and our gross margins to fluctuate, and may adversely impact our operating results in the short term.
If we fail to develop or introduce new or enhanced solutions on a timely or cost-effective basis, our ability to attract and retain end-customers could be impaired and our competitive position could be harmed.
We operate in a dynamic environment characterized by rapidly changing technologies and industry standards and technological obsolescence. We will need to continue to create valuable software solutions and integrate these solutions across hardware platforms. To compete successfully, we must design, develop, market and sell new or enhanced solutions that provide increasingly higher levels of performance, capacity, scalability, security, application mobility, and reliability and meet the cost expectations of our end-customers. The introduction of new products by our competitors, the market acceptance of products based on new or alternative technologies, or the emergence of new industry standards could render our existing or future solutions obsolete or less attractive to end-customers. Any failure to anticipate or develop new or enhanced solutions or technologies in a timely or cost-effective manner in response to technological shifts could result in decreased revenue and harm to our business and prospects. Any new feature or application that we develop or acquire may not be introduced in a timely or cost-effective manner and may not achieve broad market acceptance and investments in research and development or efforts to optimize our engineering cost structure may not be successful. If we fail to introduce new or enhanced solutions that meet the needs of our end-customers or penetrate new markets in a timely fashion, we will lose market share and our business, operating results and prospects will be adversely affected.
If we are not successful in executing our strategy to increase sales of our solutions to new and existing large organizations, service providers, and government entities, our operating results may suffer.
Our growth strategy is dependent in large part upon increasing sales of our solutions to new and existing large enterprises, service providers and government entities, particularly when such sales result in large orders for our solutions. Sales to these end-customers involve risks that may not be present (or that are present to a lesser extent) with sales to smaller end-customers, which can act as a disincentive to our sales team to pursue these larger end-customers. These risks include:
• | competition from companies that traditionally target larger enterprises, service providers and government entities and that may have pre-existing relationships or purchase commitments from such end-customers; |
• | increased purchasing power and leverage held by large end-customers in negotiating contractual arrangements with us; |
• | more stringent requirements in our support service contracts, including demand for quicker support response times and penalties for any failure to meet support requirements; and |
• | longer sales cycles and the associated risk that substantial time and resources may be spent on a potential end-customer that elects not to purchase our solutions. |
14
Large organizations often undertake a significant evaluation process that results in a lengthy sales cycle. Although we have a channel sales model, our sales representatives typically engage in direct interaction with our prospective end-customers as well as our distributors and resellers. We typically provide evaluation products to these end-customers and may spend substantial time, effort and money in our sales efforts to these prospective end-customers. In addition, product purchases by large organizations are frequently subject to budget constraints, multiple approvals and unanticipated administrative, processing and other delays. Finally, large organizations typically have longer implementation cycles, require greater product functionality and scalability, require a broader range of services, demand that vendors take on a larger share of risks, require acceptance provisions that can lead to a delay in revenue recognition and expect greater payment flexibility. If we fail to realize an expected sale from a large end-customer in a particular quarter or at all, our business and operating results could be adversely affected. All of these factors can add further risk to business conducted with these end-customers.
Our growth depends on our existing end-customers making additional purchases of software licenses and software upgrades and renewing and upgrading their support and software maintenance agreements, and the failure of our end-customers to do so could harm our business and operating results.
Our future success depends in part on purchases by our existing end-customers of additional appliances and software as well as renewals and upgrades to their support and software maintenance agreements. If our end-customers do not purchase additional software licenses or appliances or software upgrades, or renew or upgrade their support and software maintenance agreements, our revenue may decline and our operating results may be harmed. In order for us to maintain or improve our operating results, we depend on our existing end-customers renewing support and software maintenance agreements or purchasing additional appliances. End-customers may choose not to renew their support and software maintenance agreements or purchase additional appliances because of several factors, including dissatisfaction with our prices or features relative to competitive offerings, reductions in our end-customers’ spending levels or other causes outside of our control. If our existing end-customers do not purchase new solutions, or renew or upgrade their support and software maintenance agreements, our revenue may grow more slowly than expected or may decline, and our business and operating results may be adversely affected.
We rely on our key personnel, and our Chief Executive Officer in particular, to grow our business, and the loss of one or more such key employees or the inability to attract and retain qualified personnel could harm our business.
Our success and future growth depends to a significant degree on the skills and continued services of our executive officers and key personnel. In particular, we are highly dependent on the services of Dheeraj Pandey, our Chief Executive Officer and Chairman, who is critical to the development of our technology, future vision and strategic direction. We do not have life insurance policies that cover any of our executive officers or other key employees. The loss of the services of Mr. Pandey or any of our key employees or executive officers could disrupt our business and negatively impact our operating results, prospects and future growth. Our future success also depends on our ability to continue to attract, integrate and retain highly skilled personnel, especially skilled sales and engineering employees. Competition for highly skilled personnel is frequently intense, especially in the San Francisco Bay Area where we are headquartered. Volatility or lack of performance in our stock price may also affect our ability to attract and retain our key employees. We cannot assure you that we will be able to successfully attract or retain qualified personnel. Our inability to attract and retain the necessary personnel could adversely affect our business, operating results and financial condition.
15
If we do not effectively expand and train our sales force, we may be unable to add new end-customers or increase sales to our existing end-customers and our business will be adversely affected.
Although we have a channel sales model, our sales representatives typically engage in direct interaction with our prospective end-customers. Therefore, we continue to be substantially dependent on our sales force to obtain new end-customers and sell additional solutions to our existing end-customers. There is significant competition for sales personnel with the skills and technical knowledge that we require. Our ability to achieve significant revenue growth will depend, in large part, on our success in recruiting, training and retaining sufficient numbers of sales personnel to support our growth. New hires require significant training and may take significant time before they achieve full productivity; we estimate based on past experience that sales team members typically do not fully ramp and are not fully productive until around the time of the start of their fourth quarter of employment with us. Our recent hires and planned hires may not become productive as quickly as we expect, and we may be unable to hire or retain sufficient numbers of qualified individuals in the markets where we do business or plan to do business. Furthermore, hiring sales personnel in new countries requires additional set up, upfront and ongoing costs that we may not recover if the sales personnel fail to achieve full productivity. In addition, as a result of our rapid growth, a large percentage of our sales force is new to our company and our solutions and therefore less effective than our more seasoned employees. If these new employees do not become fully productive on the timelines that we have projected, our revenue will not increase at anticipated levels and our ability to achieve long term projections may be negatively impacted. If we are unable to hire and train sufficient numbers of effective sales personnel, or the sales personnel are not successful in obtaining new end-customers or increasing sales to our existing customer base, our business, operating results and prospects will be adversely affected.
If we do not effectively structure our sales force to focus on the end-customers that will primarily drive our growth strategy, our business will be adversely affected.
As indicated above, our growth is dependent in large part on increasing our sales to large enterprises, particularly when those sales result in large orders for our solutions. Over the past year, we have started to segment our sales force to focus on these major accounts and large deals. This process, which we anticipate will continue for the foreseeable future, has involved hiring new, and promoting existing members of our sales team into, global account manager roles that will focus exclusively on large sales to major accounts. As discussed above, we anticipate that the sales cycles associated with major accounts will be longer that our traditional sales cycles, which will increase the time it will take our new global account managers to become fully productive. The new sales processes and leadership structures for these global sales teams may also take longer than anticipated to implement, further impacting productivity. In addition, as our organization focuses more heavily on major accounts and large deals, the productivity of our traditional sales teams may be impacted. For example, we experienced what we believe was a short-term decrease in sales productivity of our North American sales teams as well as a reduction in the number of large deals executed during the quarter ended January 31, 2017 due to the continued segmentation of our sales teams. These potential fluctuations in sales productivity make it more difficult to accurately project our operating results or plan for future growth. If we unable to effectively manage these changes or implement our news sales structure in a timely manner, or if our decision to segment our sales force is not successful in obtaining large sales of our solutions, our growth and ability to achieve long term projections may be negatively impacted, and our business and operating results will be adversely affected.
We rely primarily on indirect sales channels for the distribution of our solutions, and disruption within these channels could adversely affect our business, operating results and cash flows.
We primarily sell our solutions through indirect sales channels, including channel partners such as distributors, our hardware OEM partners, value added resellers and system integrators. Our OEM partners in turn distribute our solutions through their own networks of channel partners with whom we have no direct relationships.
16
We rely, to a significant degree, on our channel partners to select, screen and maintain relationships with their distribution networks and to distribute our solutions in a manner that is consistent with applicable law, regulatory requirements and our quality standards. If our channel partners or a partner in their distribution network violates applicable law or regulatory requirements or misrepresents the functionality of our solutions, our reputation could be damaged and we could be subject to potential liability. Additionally, if we are unable to establish relationships with strong channel partners in key growth regions, our ability to sell our solutions in these regions may be adversely affected. Our agreements with our channel partners are non-exclusive, meaning our channel partners may offer end-customers the products of several different companies, including products that compete with ours. If our channel partners do not effectively market and sell our solutions, choose to use greater efforts to market and sell their own products or those of our competitors, or fail to meet the needs of our end-customers, our business, operating results and prospects may be adversely affected. Our channel partners may cease marketing our solutions with limited or no notice and with little or no penalty. The loss of a substantial number of our channel partners, together with our inability to replace them, or the failure to recruit additional channel partners or establish an alternative distribution network could materially and adversely affect our business and operating results. For example, sales through Carahsoft Technology Corp. and Promark Technology Inc. to our end-customers represented 23% and 15%, respectively, of our total revenue for fiscal 2015, represented 15% and 20%, respectively, of our total revenue for fiscal 2016, and represented 11% and 22%, respectively, of our total revenue for fiscal 2017. In addition, if a channel partner offers its own products or services that are competitive to our solutions, is acquired by a competitor or reorganizes or divests its reseller business units, our revenue derived from that partner may be adversely impacted or eliminated altogether.
Recruiting and retaining qualified channel partners and training them in the use of our technologies require significant time and resources. If we fail to devote sufficient resources to support and expand our network of channel partners, our business may be adversely affected. Maintaining strong indirect sales channels for our products and effectively leveraging our channel partners and OEMs is important to our growth strategy, and the failure to effectively manage these relationships may lead to higher costs and reduced revenue. Also, in certain international markets we are in the process of transitioning our distribution model from contracting directly with hundreds of individual resellers to contracting with a smaller number of larger global distributors. Although we believe that this transition will make our sales channels more efficient and broader reaching in the long term in these markets, there is no guarantee that this new distribution model will increase our sales in the short term or allow us to sustain our gross margins. Any potential delays or confusion during the transition process to our new partners may negatively affect our relationship with our existing end-customers and channel partners and may cause us to lose prospective end-customers or additional business from existing end-customers. Upon completion of the transition to the new sales model, we will be more reliant on fewer channel partners, which may reduce our contact with our end-customers making it more difficult for us to establish brand awareness, ensure proper delivery and installation of our software, support ongoing end-customer requirements, estimate end-customer demand, respond to evolving end-customer needs and obtain subscription renewals from end-customers.
All of our sales to government entities have been made indirectly through our channel partners. Government entities may have statutory, contractual or other legal rights to terminate contracts with our channel partners for convenience or due to a default, and, in the future, if the portion of government contracts that are subject to renegotiation or termination at the election of the government are material, any such termination or renegotiation may adversely impact our future operating results. Additionally, we sometimes rely on our channel partners to satisfy certain regulatory obligations that we would otherwise have to satisfy if we sold directly to the government entities, and our channel partners may be unable or unwilling to satisfy these obligations in the future. In the event of such termination or change, it may be difficult for us to arrange for another channel partner to sell our solutions to these government entities in a timely manner, and we could lose sales opportunities during the transition. Governments routinely investigate and audit government contractors’ (including subcontractors') administrative processes, and any unfavorable audit could result in the government refusing to continue buying our solutions, our channel partners changing their business models or refusing to continue to sell our solutions under current models, a reduction of revenue or fines, or civil or criminal liability if the audit uncovers improper or illegal activities.
If our indirect distribution channel is disrupted, particularly if we are reliant on a fewer number of channel partners, or if we are required to directly satisfy certain regulatory obligations imposed by government entities as a result of our efforts to expand our sales to government entities, we may be required to devote more time and resources to distribute our solutions directly and support our end-customers, which may not be as effective and could lead to higher costs, reduced revenue and growth that is slower than expected.
17
Our operating results may fluctuate significantly, which could make our future results difficult to predict and could cause our operating results to fall below expectations.
Our operating results may fluctuate due to a variety of factors, many of which are outside of our control. As a result, comparing our operating results on a period-to-period basis may not be meaningful. If our revenue or operating results in any particular period fall below investor expectations, the price of our Class A common stock would likely decline. Factors that are difficult to predict and that could cause our operating results to fluctuate include:
• | the timing and magnitude of orders, shipments and acceptance of our solutions in any quarter; |
• | our ability to attract new and retain existing end-customers; |
• | disruptions in our sales channels or termination of our relationship with important channel partners and OEMs; |
• | the timing of revenue recognition for our sales, which will materially change for the majority of sales of software-only licenses on or after August 1, 2017 as a result of our adoption of the new ASC 606 revenue recognition standard which requires us to recognize the revenue from sales of software licenses upon transfer of control to our end-customers, instead of deferring the revenue over the post contract support period; this change will heighten the impact of any fluctuations in the timing and magnitude of software-only sales on our quarterly operating results; |
• | reductions in end-customers’ budgets for information technology purchases; |
• | delays in end-customers’ purchasing cycles or deferments of end-customers’ purchases in anticipation of new products or updates from us or our competitors; |
• | fluctuations in demand and competitive pricing pressures for our solutions; |
• | the mix of solutions, sold, including the mix between appliance and software-only sales and the mix of the types of appliances that we sell, and the mix of revenue between products and support and other services; |
• | our ability to develop, introduce and ship in a timely manner new solutions and product enhancements that meet customer requirements; |
• | the timing of product releases or upgrades or announcements by us or our competitors; |
• | any change in the competitive dynamics of our markets, including consolidation among our competitors or resellers, new entrants or discounting of prices; |
• | the amount and timing of expenses to grow our business and the extent to which we are able to take advantage of economies of scale or to leverage our relationships with OEM or channel partners; |
• | the costs associated with acquiring new businesses and technologies and the follow-on costs of integrating and consolidating the results of acquired businesses; |
• | the amount and timing of stock-based compensation expenses; |
• | our ability to control the costs of our solutions and their key components, or to pass along any cost increases to our end-customers; |
• | general economic, industry and market conditions; and |
• | future accounting pronouncements and changes in accounting policies, including our ability to implement the new procedures and processes necessary to accurately recognize our revenue under the new ASC 606 revenue recognition standard. |
The occurrence of any one of these risks could negatively affect our operating results in any particular quarter, which could cause the price of our Class A common stock to decline.
18
Our gross margins are impacted by a variety of factors and may be subject to variation from period to period.
Our gross margins may be affected by a variety of factors, including shifts in the mix of whether our solutions are sold as an appliance or as software-only, fluctuations in the pricing of our products, including as a result of competitive pricing pressures or increases in component pricing, and the degree to which we are successful in selling the value of incremental feature improvements and upgrades, changes in the cost of components of our hardware appliances, changes in the mix between direct versus indirect sales, changes in the mix of products sold, including whether they are sold as appliances or as software-only, and the timing and amount of recognized and deferred revenue, particularly as our recognition of revenue from sales of software-only licenses changes following our adoption of the new ASC 606 revenue recognition standard. For example, in the last three quarters of fiscal 2017, the prices of DRAM and NAND components increased due to supply constraints, causing a negative impact on our gross margin. We expect these price increases to continue for the immediate future, and to continue to impact our gross margin. If we are unable to manage these factors effectively, our gross margins may decline, and fluctuations in gross margin may make it difficult to manage our business and to achieve or maintain profitability, which could adversely affect our business and operating results.
Our sales cycles can be long and unpredictable and our sales efforts require considerable time and expense. As a result, it can be difficult for us to predict when, if ever, a particular customer will choose to purchase our solutions, which may cause our operating results to fluctuate significantly.
Our sales efforts involve educating our end-customers about the uses and benefits of our solutions, including their technical capabilities and cost saving potential. End-customers often undertake an evaluation and testing process that can result in a lengthy sales cycle. Increasing competition and the emergence of new hyperconverged infrastructure product offerings often result in customers evaluating multiple vendors at the same time, which can further lengthen the sales cycle. We spend substantial time and resources on our sales efforts without any assurance that our efforts will produce any sales. Platform purchases are frequently subject to budget constraints, multiple approvals and unanticipated administrative, processing and other delays. The broad nature of the technology shift that our solutions represent and the legacy relationships our end-customers have with existing IT vendors sometimes lead to unpredictable sales cycles, which make it difficult for us to predict when end-customers may purchase solutions from us. The unpredictable nature of our sales cycles may be increased in future periods as we focus our sales efforts more heavily on major accounts and large deals. Our business and operating results will be significantly affected by the degree to which and speed with which organizations adopt our solutions.
Because we depend on contract manufacturers to assemble and test our hardware appliances, we are susceptible to delays and pricing fluctuations that could prevent us from shipping orders on time, if at all, or on a cost-effective basis, which would cause our business to be adversely affected.
We rely substantially on Super Micro Computer, Inc., or Super Micro, and Flextronics Systems Limited, or Flextronics, to assemble and test our appliances. Our reliance on these contract manufacturers reduces our control over the manufacturing process and exposes us to risks, including reduced control over quality assurance, product costs and product supply and timing. Furthermore, our orders represent a relatively small percentage of the overall orders received by our third-party manufacturers from their customers. Therefore, fulfilling our orders may not be a priority in guiding their business decisions and operational commitments. If we fail to manage our relationships with these contract manufacturers effectively, inaccurately forecast our component requirements, or if either of them experience delays or increased manufacturing lead-times, disruptions, capacity constraints or quality control problems in their operations or are unable to meet our requirements for timely delivery, or we are unable to shift operations from one contract manufacturer to the other, our ability to ship high-quality solutions to our end-customers could be severely impaired, we could incur substantial costs, such as costs relating to the procurement of non-standard components and inventory costs, and our business and operating results, competitive position and reputation could be harmed.
19
Our agreement with Super Micro expires in May 2018, and automatically renews for successive one-year periods thereafter with the option to terminate upon each annual renewal , and does not contain any minimum long-term commitment to manufacture our solutions. In addition, in the third quarter of fiscal 2017, we entered into a Memorandum of Understanding with Flextronics pursuant to which we have transitioned and will continue to transition portions of our manufacturing operations to Flextronics, and we are currently working with Flextronics to finalize a manufacturing agreement. The Flextronics Memorandum of Understanding does not contain any minimum long-term commitment to manufacture our solutions, and the terms of the manufacturing agreement have not yet been finalized. Further, any orders are fulfilled only after a purchase order has been delivered and accepted. If we are required to change contract manufacturers, we may lose revenue, incur increased costs and damage our channel partner and end-customer relationships. We may also decide to switch or bring on additional contract manufacturers in order to better meet our needs. Switching to or bringing on a new contract manufacturer and commencing production is expensive and time-consuming and may cause delays in order fulfillment at our existing contract manufacturers or cause other disruptions. For example, while we have already transitioned some of our manufacturing operations to Flextronics, we may encounter unexpected issues as we scale our operations with them. Our agreements with Super Micro and Flextronics do not contain any price assurances, and any increases in component costs, without a corresponding increase in the price of our solutions, could harm our gross margins. Furthermore, we may need to increase our component purchases, manufacturing capacity and internal test and quality functions if we experience increased demand. The inability of Super Micro, Flextronics or other contract manufacturers to provide us with adequate supplies of high-quality products could cause a delay in our order fulfillment, and our business, operating results and prospects would be adversely affected.
We rely on a limited number of suppliers, and in some cases single-source suppliers, for several key components of our hardware appliances, and any disruption in the availability or quality of these components could delay shipments of our appliances and damage our channel partner or end-customer relationships.
We rely on a limited number of suppliers, and in some cases single-source suppliers, for several key hardware components of our appliances. These components are generally purchased on a purchase order basis through Super Micro and we do not have long-term supply contracts with our suppliers. Our reliance on key suppliers exposes us to risks, including reduced control over product quality, production and component costs, timely delivery and capacity. It also exposes us to the potential inability to obtain an adequate supply of required components because we do not have long-term supply commitments, and replacing some of these components would require a product qualification process that could take months to complete. Furthermore, we extensively test and qualify the components that are used in our appliances to ensure that they meet certain quality and performance specifications. If our supply of certain components is disrupted or delayed, or if we need to replace our existing suppliers, there can be no assurance that additional supplies or components can serve as adequate replacements for the existing components, will be available when required or that supplies will be available on terms that are favorable to us, and we may be required to modify our solutions to interoperate with the replacement components. Any of these developments could extend our lead times, increase the costs of our components or costs of product development and adversely affect our business, operating results and financial condition.
We generally maintain minimal inventory for repairs and a limited number of evaluation and demonstration units, and generally acquire components only as needed. We do not enter into long-term supply contracts for these components. As a result, our ability to respond to channel partner or end-customer orders efficiently may be constrained by the then-current availability, terms and pricing of these components. The technology industry has experienced component shortages and delivery delays in the past, and we may experience shortages or delays of critical components in the future as a result of strong demand in the industry or other factors. If we or our suppliers inaccurately forecast demand for our solutions or we ineffectively manage our enterprise resource planning processes, our suppliers may have inadequate inventory, which could increase the prices we must pay for substitute components or result in our inability to meet demand for our solutions, as well as damage our channel partner or end-customer relationships.
20
If the suppliers of the components of our hardware appliances increase prices of components, experience delays, disruptions, capacity constraints, quality control problems in their manufacturing operations or adverse changes to their financial condition, our ability to ship appliances to our channel partners or end-customers in a timely manner and at competitive prices could be impaired and our competitive, reputation, and operating results could be adversely affected. For example, in the last three quarters of fiscal 2017, the prices of DRAM and NAND components increased due to supply constraints. Qualifying a new component is expensive and time-consuming. If we are required to change key suppliers or assume internal manufacturing operations, we may lose revenue and damage our channel partner or end-customer relationships which could adversely impact our revenue and operating results.
We enter into arrangements with our suppliers that could require us to purchase certain minimum levels of inventory, which could result in us incurring losses with respect to such inventory, and may negatively impact our business and operating results.
We enter into arrangements with our suppliers whereby the supplier will purchase certain quantities of components and allocate them exclusively for our use in our products. If we are unable to use the inventory within a specified period, we may be required to purchase the inventory, or to pay the supplier the difference between the price at which the supplier purchased the inventory and the price at which the supplier is ultimately able to sell the inventory to a third party. As a result, if we inaccurately or mistakenly forecast our need for any such components, or if the market price of any such components decreases after the components are purchased by a supplier, we may suffer losses with respect to such inventory, and our business and operating results could be adversely affected.
We rely upon third parties for the warehousing and delivery of our appliances and replacement parts for support, and we therefore have less control over these functions than we otherwise would.
We outsource the warehousing and delivery of all of our appliances to a third-party logistics provider for worldwide fulfillment. In addition, some of our support offerings commit us to replace defective parts in our appliances as quickly as four hours after the initial customer support call is received, which we satisfy by storing replacement parts inventory in various third-party supply depots in strategic locations. As a result of relying on third parties, we have reduced control over shipping and logistics, quality control, security and the supply of replacement parts for support. Consequently, we may be subject to shipping disruptions as well as failures to provide adequate support for reasons that are outside of our direct control. If we are unable to have our appliances or replacement products shipped in a timely manner, end-customers may cancel their contracts with us, we may suffer reputational harm and our business, operating results and prospects may be adversely affected.
Our ability to sell our solutions is dependent in part on ease of use and the quality of our technical support, and any failure to offer high-quality technical support would harm our business, operating results and financial condition.
Once our solutions are deployed, our end-customers depend on our support organization to resolve any technical issues relating to our solutions. Furthermore, because of the emerging nature of our solutions, our support organization often provides support for and troubleshoots issues for products of other vendors running on our solutions, even if the issue is unrelated to our solutions. There is no assurance that we can solve issues unrelated to our solutions, or that vendors whose products run on our solutions will not challenge our provision of technical assistance to their products. Our ability to provide effective support is largely dependent on our ability to attract, train and retain personnel who are not only qualified to support our solutions, but also well versed in some of the primary applications and hypervisors that our end-customers run on our solutions. Furthermore, as we expand our operations internationally, our support organization will face additional challenges, including those associated with delivering support, training and documentation in languages other than English. Any failure to maintain high-quality installation and technical support, or a market perception that we do not maintain high-quality support, could harm our reputation, adversely affect our ability to sell our solutions to existing and prospective end-customers, and could harm our business, operating results and financial condition.
21
Our solutions are highly technical and may contain undetected defects, which could cause data unavailability, loss or corruption that might, in turn, result in liability to our end-customers and harm to our reputation and business.
Our solutions are highly technical and complex and are often used to store information critical to our end-customers’ business operations. Our solutions may contain undetected errors, defects or security vulnerabilities that could result in data unavailability, unauthorized access to, loss, corruption or other harm to our end-customers’ data. Some errors or defects in our solutions may only be discovered after they have been installed and used by end-customers. We previously conducted an in-field replacement of equipment manufactured by our previous outsourced manufacturer, and may be required to do so again in the future. In addition, we may make certain commitments to our OEM partners regarding the time frames within which we will correct any security vulnerabilities in our software. If any hardware or software errors, defects or security vulnerabilities are discovered in our solutions after commercial release, a number of negative effects in our business could result, including:
• | lost revenue or lost OEM or other channel partners or end-customers; |
• | increased costs, including warranty expense and costs associated with end-customer support as well as development costs to remedy the errors or defects; |
• | delays, cancellations, reductions or rescheduling of orders or shipments; |
• | product returns or discounts; and |
• | damage to our reputation and brand. |
In addition, we could face legal claims for breach of contract, product liability, tort or breach of warranty. While many of our contracts with end-customers contain provisions relating to warranty disclaimers and liability limitations, these provisions might not be upheld or might not provide adequate protection if we face such legal claims. Defending a lawsuit, regardless of its merit, could be costly and may divert management’s attention and adversely affect the market’s perception of us and our solutions. In addition, our business liability insurance coverage could prove inadequate with respect to a claim and future coverage may be unavailable on acceptable terms or at all. These product-related issues could result in claims against us and our business could be adversely impacted.
Our business depends, in part, on sales to government organizations, and significant changes in the contracting or fiscal policies of such government organizations could have an adverse effect on our business and operating results.
We derive a portion of our revenue from contracts with federal, state, local and foreign governments, and we believe that the success and growth of our business will continue to depend on our successful procurement of government contracts. However, demand is often unpredictable from government organizations, and there can be no assurance that we will be able to maintain or grow our revenue from the public sector. Government agencies are subject to budgetary processes and expenditure constraints that could lead to delays or decreased capital expenditures in IT spending, particularly in light of continued uncertainties about government spending levels and recent changes to, or failure to appoint new, government leaders. The budget and approval process for government agencies also experiences a longer sales cycle relative to our other end-customers. If government organizations reduce or shift their capital spending patterns, our business, operating results and prospects may be harmed. Factors that could impede our ability to maintain or increase the amount of revenue derived from government contracts, include:
• | public sector budgetary cycles and funding authorizations; |
• | changes in fiscal or contracting policies; |
• | decreases in available government funding; |
• | changes in government programs or applicable requirements; |
• | the adoption of new laws or regulations or changes to existing laws or regulations; |
22
• | potential delays or changes in the government appropriations or other funding authorization processes; and |
• | higher expenses associated with, or delays caused by, diligence and qualifying or maintaining qualification as a government vendor. |
The occurrence of any of the foregoing could cause governments and governmental agencies to delay or refrain from purchasing our solutions in the future or otherwise have an adverse effect on our business, operating results and prospects.
Third-party claims that we are infringing intellectual property, whether successful or not, could subject us to costly and time-consuming litigation or expensive licenses, and our business could be harmed.
A number of companies, both within and outside of the enterprise computing infrastructure industry, hold a large number of patents covering aspects of storage, servers and virtualization products. In addition to these patents, participants in this industry typically also protect their technology through copyrights and trade secrets. As a result, there is frequent litigation based on allegations of infringement, misappropriation or other violations of intellectual property rights. We have received, and in the future may receive, inquiries from other intellectual property holders and may become subject to claims that we infringe their intellectual property rights, particularly as we expand our presence in the market and face increasing competition. Based upon our review of these claims, we believe we have meritorious defenses to the allegations, although there can be no assurance that we will be successful in defending against these allegations or reaching a business resolution that is satisfactory to us. In addition, parties may claim that the names and branding of our solution infringe their trademark rights in certain countries or territories. If such a claim were to prevail we may have to change the names and branding of our solution in the affected territories and we could incur other costs.
We currently have a number of agreements in effect pursuant to which we have agreed to defend, indemnify and hold harmless our end-customers, suppliers and channel and other partners from damages and costs which may arise from the infringement by our solutions of third-party patents or other intellectual property rights. The scope of these indemnity obligations varies, but may, in some instances, include indemnification for damages and expenses, including attorneys’ fees. Our insurance may not cover all intellectual property infringement claims. A claim that our solutions infringe a third party’s intellectual property rights, even if untrue, could harm our relationships with our end-customers and/or channel partners, may deter future end-customers from purchasing our solutions and could expose us to costly litigation and settlement expenses. Even if we are not a party to any litigation between a customer and a third party relating to infringement by our solutions, an adverse outcome in any such litigation could make it more difficult for us to defend our solutions against intellectual property infringement claims in any subsequent litigation in which we are a named party. Any of these results could harm our brand and operating results.
Our defense of intellectual property rights claims brought against us or our end-customers, suppliers and channel partners, with or without merit, could be time-consuming, expensive to litigate or settle, divert management resources and attention and force us to acquire intellectual property rights and licenses, which may involve substantial royalty or other payments. Further, a party making such a claim, if successful, could secure a judgment that requires us to pay substantial damages. An adverse determination also could invalidate our intellectual property rights and prevent us from offering our solutions to our end-customers and may require that we procure or develop substitute solutions that do not infringe, which could require significant effort and expense. We may have to seek a license for the technology, which may not be available on acceptable terms or at all, and as a result may significantly increase our operating expenses or require us to restrict our business activities in one or more respects. Any of these events could adversely affect our business, operating results, financial condition and prospects.
23
The success of our business depends in part on our ability to protect and enforce our intellectual property rights.
We rely on a combination of patent, copyright, service mark, trademark and trade secret laws, as well as confidentiality procedures and contractual restrictions and covenants, to establish and protect our proprietary rights, all of which provide only limited protection. We cannot assure you that any patents will be issued with respect to our currently pending patent applications in a manner that gives us adequate defensive protection or competitive advantages, if at all, or that any patents issued to us will not be challenged, invalidated or circumvented. We have filed for patents in the United States and in certain international jurisdictions, but such protections may not be available in all countries in which we operate or in which we seek to enforce our intellectual property rights, or may be difficult to enforce in practice. Our currently issued patents and any patents that may be issued in the future with respect to pending or future patent applications may not provide sufficiently broad protection or they may not prove to be enforceable in actions against alleged infringers. We cannot be certain that the steps we have taken will prevent unauthorized use of our technology or the reverse engineering of our technology. Moreover, others may independently develop technologies that are competitive to ours or infringe our intellectual property.
Protecting against the unauthorized use of our intellectual property, solutions and other proprietary rights is expensive and difficult, particularly internationally. Litigation may be necessary in the future to enforce or defend our intellectual property rights or to determine the validity and scope of the proprietary rights of others. Any such litigation could result in substantial costs and diversion of management resources, either of which could harm our business, operating results and financial condition. Further, many of our current and potential competitors have the ability to dedicate substantially greater resources to defending intellectual property infringement claims and to enforcing their intellectual property rights than we have. Attempts to enforce our rights against third parties could also provoke these third parties to assert their own intellectual property or other rights against us, or result in a holding that invalidates or narrows the scope of our rights, in whole or in part. Effective patent, trademark, service mark, copyright and trade secret protection may not be available in every country in which our solutions are available. An inability to adequately protect and enforce our intellectual property and other proprietary rights could seriously harm our business, operating results, financial condition and prospects.
We may become subject to claims that our employees have wrongfully disclosed or we have wrongfully used proprietary information of our employees’ former employers. These claims may be costly to defend and if we do not successfully do so, our business could be harmed.
Many of our employees were previously employed at current or potential competitors. Although we have processes to ensure that our employees do not use the proprietary information or know-how of others in their work for us, we may in the future become subject to claims that these employees have divulged, or we have used, proprietary information of these employees’ former employers. Litigation may be necessary to defend against these claims. If we fail in defending such claims, in addition to paying monetary damages, we may lose valuable intellectual property rights or personnel. A loss of key research personnel or their work product could hamper our ability to develop new solutions and features for existing solutions, which could severely harm our business. Even if we are successful in defending against these claims, litigation efforts are costly, time-consuming and a significant distraction to management.
If we fail to maintain an effective system of internal controls, our ability to produce timely and accurate financial statements or comply with applicable regulations could be impaired.
As a public company, we are subject to the reporting requirements of the Securities Exchange Act of 1934, as amended, or Exchange Act, the Sarbanes-Oxley Act of 2002, or the Sarbanes-Oxley Act, and the rules and regulations of the NASDAQ Stock Market. We expect that the requirements of these rules and regulations will continue to increase our legal, accounting and financial compliance costs, make some activities more difficult, time-consuming and costly, and place significant strain on our personnel, systems and resources.
The Sarbanes-Oxley Act requires, among other things, that we maintain effective disclosure controls and procedures and internal control over financial reporting. We are continuing to develop and refine our disclosure controls, internal control over financial reporting and other procedures that are designed to ensure that information required to be disclosed by us in the reports that we will file with the Securities and Exchange Commission, or SEC, is recorded, processed, summarized and reported within the time periods specified in SEC rules and forms, and that information required to be disclosed in reports under the Exchange Act is accumulated and communicated to our principal executive and financial officers.
24
Our current controls and any new controls that we develop may become inadequate because of changes in conditions in our business. Further, weaknesses in our internal controls may be discovered in the future. Any failure to develop or maintain effective controls, or any difficulties encountered in their implementation or improvement, could harm our operating results or cause us to fail to meet our reporting obligations and may result in a restatement of our financial statements for prior periods. Any failure to implement and maintain effective internal controls also could adversely affect the results of periodic management evaluations and annual independent registered public accounting firm attestation reports regarding the effectiveness of our internal control over financial reporting that we are required to include in our periodic reports we will file with the SEC under Section 404 of the Sarbanes-Oxley Act. Ineffective disclosure controls and procedures and internal control over financial reporting could also cause investors to lose confidence in our reported financial and other information, which would likely have a negative effect on the market price of our Class A common stock.
In order to maintain and improve the effectiveness of our disclosure controls and procedures and internal control over financial reporting, we have expended and anticipate that we will continue to expend significant resources, including accounting-related costs, and provide significant management oversight. Any failure to maintain the adequacy of our internal controls, or consequent inability to produce accurate financial statements on a timely basis, could increase our operating costs and could materially impair our ability to operate our business. In the event that our internal controls are perceived as inadequate or that we are unable to produce timely or accurate financial statements, investors may lose confidence in our operating results and our stock price could decline. In addition, if we are unable to continue to meet these requirements, we may not be able to remain listed on the NASDAQ Global Select Market.
We are not currently required to comply with the SEC rules that implement Sections 302 and 404 of the Sarbanes-Oxley Act, and are therefore not required to make a formal assessment of the effectiveness of our internal controls over financial reporting for that purpose. We will be required to comply with certain of these rules, which will require management to certify financial and other information in our quarterly and annual reports and provide an annual management report on the effectiveness of our internal control over financial reporting commencing with our annual report on Form 10-K for the fiscal year ending July 31, 2018. To comply with the requirements of being a public company, we will need to undertake various actions, such as implementing new internal controls and procedures and hiring accounting or internal audit staff.
Our independent registered public accounting firm is not required to formally attest to the effectiveness of our internal control over financial reporting until after we are no longer an emerging growth company. At such time, our independent registered public accounting firm may issue a report that is adverse in the event it is not satisfied with the level at which our controls are documented, designed or operating. Any failure to maintain effective disclosure controls and internal control over financial reporting could have a material and adverse effect on our business and operating results and could cause a decline in the price of our Class A common stock.
Failure to comply with laws and regulations applicable to our business could subject us to fines and penalties and could also cause us to lose end-customers in the public sector or negatively impact our ability to contract with the public sector.
Our business is subject to regulation by various federal, state, local and foreign governmental agencies, including agencies responsible for monitoring and enforcing employment and labor laws, antitrust laws, workplace safety, product safety, environmental laws, consumer protection laws, anti-bribery laws, import/export controls, federal securities laws and tax laws and regulations. In certain jurisdictions, these regulatory requirements may be more stringent than in the United States. Noncompliance with applicable regulations or requirements could subject us to investigations, sanctions, mandatory product recalls, enforcement actions, disgorgement of profits, fines, damages and civil and criminal penalties or injunctions. If any governmental sanctions are imposed, or if we do not prevail in any possible civil or criminal litigation, our business, operating results and financial condition could be adversely affected. In addition, responding to any action will likely result in a significant diversion of management’s attention and resources and an increase in third-party professional fees. Enforcement actions and sanctions could harm our business, operating results and financial condition.
25
In addition, we must comply with laws and regulations relating to the formation, administration and performance of contracts with the public sector, including U.S. federal, state and local governmental organizations, which affect how we and our channel partners do business with governmental agencies. Selling our solutions to the U.S. government, whether directly or through channel partners, also subjects us to certain regulatory and contractual requirements. Failure to comply with these requirements by either us or our channel partners could subject us to investigations, fines and other penalties, which could have an adverse effect on our business, operating results, financial condition and prospects. As an example, the U.S. Department of Justice, or DOJ, and the General Services Administration, or GSA, have in the past pursued claims against and financial settlements with IT vendors under the False Claims Act and other statutes related to pricing and discount practices and compliance with certain provisions of GSA contracts for sales to the federal government. The DOJ and GSA continue to actively pursue such claims. Violations of certain regulatory and contractual requirements could also result in us being suspended or debarred from future government contracting. Any of these outcomes could have an adverse effect on our revenue, operating results, financial condition and prospects.
These laws and regulations impose added costs on our business, and failure to comply with these or other applicable regulations and requirements, including non-compliance in the past, could lead to claims for damages from our channel partners, penalties, termination of contracts, loss of exclusive rights in our intellectual property, and temporary suspension or permanent debarment from government contracting. Any such damages, penalties, disruptions or limitations in our ability to do business with the public sector could have an adverse effect on our business and operating results.
We are subject to governmental regulation and other legal obligations, particularly related to privacy, data protection and information security, and our actual or perceived failure to comply with such obligations could adversely affect our business and operating results. Compliance with such laws could also impair our efforts to maintain and expand our customer base, and thereby decrease our revenue.
Personal privacy, data protection and information security are significant issues in the United States and the other jurisdictions where we offer our solutions. The regulatory framework for privacy and security issues worldwide is rapidly evolving and is likely to remain uncertain for the foreseeable future. Our handling of data is subject to a variety of laws and regulations, including regulation by various government agencies, including the U.S. Federal Trade Commission, or FTC, and various state, local and foreign bodies and agencies.
The U.S. federal and various state and foreign governments have adopted or proposed limitations on the collection, distribution, use and storage of personal information of individuals, including end-customers and employees. In the United States, the FTC and many state attorneys general are applying federal and state consumer protection laws to the online collection, use and dissemination of data. Additionally, many foreign countries and governmental bodies, including in Australia, the European Union, India, Japan and numerous other jurisdictions in which we operate or conduct our business, have laws and regulations concerning the collection and use of personal information obtained from their residents or by businesses operating within their jurisdiction. These laws and regulations often are more restrictive than those in the United States. Such laws and regulations may require companies to implement new privacy and security policies, permit individuals to access, correct and delete personal information stored or maintained by such companies, inform individuals of security breaches that affect their personal information, and, in some cases, obtain individuals’ consent to use personal information for certain purposes. In addition, a foreign government could require that any personally identifiable information collected in a country not be disseminated outside of that country, and we are not currently equipped to comply with such a requirement.
26
We also expect that there will continue to be new proposed laws, regulations and industry standards concerning privacy, data protection and information security in the United States, the European Union and other jurisdictions, and we cannot yet determine the impact such future laws, regulations and standards may have on our business. Additionally, we expect that existing laws, regulations and standards may be interpreted in new manners in the future. There remains significant uncertainty surrounding the regulatory framework for the future of personal data transfers from the European Union to the United States with regulations such as the recently adopted a General Data Protection Regulation, or GDPR, effective in May 2018, that will supersede current EU data protection legislation, impose more stringent EU data protection requirements, provide an enforcement authority,
and impose large penalties for noncompliance. Future laws, regulations, standards and other obligations, including the adoption of the GDPR, as well as changes in the interpretation of existing laws, regulations, standards and other obligations could impair our or our customers’ ability to collect, use or disclose information relating to individuals, which could decrease demand for our solutions, require us to restrict our business operations, increase our costs and impair our ability to maintain and grow our customer base and increase our revenue.
Although we are working to comply with those federal, state and foreign laws and regulations, industry standards, contractual obligations and other legal obligations that apply to us, those laws, regulations, standards and obligations are evolving and may be modified, interpreted and applied in an inconsistent manner from one jurisdiction to another, and may conflict with one another, other requirements or legal obligations, our practices or the features of our solutions. As such, we cannot assure ongoing compliance with all such laws or regulations, industry standards, contractual obligations and other legal obligations. Any failure or perceived failure by us to comply with federal, state or foreign laws or regulations, industry standards, contractual obligations or other legal obligations, or any actual or suspected security incident, whether or not resulting in unauthorized access to, or acquisition, release or transfer of personal information or other data, may result in governmental enforcement actions and prosecutions, private litigation, fines and penalties or adverse publicity and could cause our customers to lose trust in us, which could have an adverse effect on our reputation and business. Any inability to adequately address privacy and security concerns, even if unfounded, or comply with applicable laws, regulations, policies, industry standards, contractual obligations or other legal obligations could result in additional cost and liability to us, damage our reputation, inhibit sales, and adversely affect our business and operating results.
Failure to comply with anticorruption and anti-money laundering laws, including the U.S. Foreign Corrupt Practices Act of 1977, as amended, or the FCPA, and similar laws associated with our activities outside of the United States could subject us to penalties and other adverse consequences.
We are subject to the FCPA, the U.S. domestic bribery statute contained in 18 U.S.C. § 201, the U.S. Travel Act, the USA PATRIOT Act, the United Kingdom Bribery Act of 2010, or the U.K. Bribery Act, and possibly other anti-bribery and anti-money laundering laws in countries in which we conduct activities. We face significant risks if we fail to comply with the FCPA and other anticorruption laws that prohibit companies and their employees and third-party intermediaries from authorizing, offering or providing, directly or indirectly, improper payments or benefits to foreign government officials, political parties and private-sector recipients for the purpose of obtaining or retaining business, directing business to any person or securing any advantage. In many foreign countries, particularly in countries with developing economies, it may be a local custom that businesses engage in practices that are prohibited by the FCPA or other applicable laws and regulations. In addition, we use various third parties to sell our solutions and conduct our business abroad. We or our third-party intermediaries may have direct or indirect interactions with officials and employees of government agencies or state-owned or affiliated entities and we can be held liable for the corrupt or other illegal activities of these third-party intermediaries, our employees, representatives, contractors, partners, and agents, even if we do not explicitly authorize such activities. We continue to update and implement our FCPA/anti-corruption compliance program and no assurance can be given that all of our employees and agents, as well as those companies to which we outsource certain of our business operations, will not take actions in violation of our policies and applicable law, for which we may be ultimately held responsible.
Any violation of the FCPA, other applicable anticorruption laws, and anti-money laundering laws could result in whistleblower complaints, adverse media coverage, investigations, loss of export privileges, severe criminal or civil sanctions and, in the case of the FCPA, suspension or debarment from U.S. government contracts, which could have a material and adverse effect on our reputation, business, operating results and prospects. In addition, responding to any enforcement action may result in a materially significant diversion of management’s attention and resources and significant defense costs and other third-party professional fees.
27
We are subject to governmental export and import controls that could impair our ability to compete in international markets or subject us to liability if we violate the controls.
Our solutions are subject to U.S. export controls, including the Export Administration Regulations and economic sanctions administered by the Office of Foreign Assets Control, and we incorporate encryption technology into certain of our solutions. These encryption products and the underlying technology may be exported outside of the United States only with the required export authorizations, including by license, a license exception or other appropriate government authorizations, including the filing of an encryption registration.
Furthermore, our activities are subject to the U.S. economic sanctions laws and regulations that prohibit the shipment of certain products and services without the required export authorizations, including to countries, governments and persons targeted by U.S. embargoes or sanctions. Additionally, the Trump administration has been critical of existing trade agreements and may impose more stringent export and import controls. Obtaining the necessary export license or other authorization for a particular sale may be time-consuming and may result in the delay or loss of sales opportunities even if the export license ultimately may be granted. While we take precautions to prevent our solutions from being exported in violation of these laws, including obtaining authorizations for our encryption products, implementing IP address blocking and screenings against U.S. government and international lists of restricted and prohibited persons, we cannot guarantee that the precautions we take will prevent violations of export control and sanctions laws. Violations of U.S. sanctions or export control laws can result in significant fines or penalties and possible incarceration for responsible employees and managers could be imposed for criminal violations of these laws.
We also note that if our channel partners fail to obtain appropriate import, export or re-export licenses or permits, we may also be adversely affected, through reputational harm as well as other negative consequences including government investigations and penalties. We presently incorporate export control compliance requirements into our channel partner agreements; however, no assurance can be given that our channel partners will be able to comply with such requirements.
Also, various countries, in addition to the United States, regulate the import and export of certain encryption and other technology, including import and export licensing requirements, and have enacted laws that could limit our ability to distribute our solutions or could limit our end-customers’ ability to implement our solutions in those countries. Changes in our solutions or future changes in export and import regulations may create delays in the introduction of our solutions in international markets, prevent our end-customers with international operations from deploying our solutions globally or, in some cases, prevent the export or import of our solutions to certain countries, governments, or persons altogether. From time to time, various governmental agencies have proposed additional regulation of encryption technology, including the escrow and government recovery of private encryption keys. Any change in export or import regulations, economic sanctions or related legislation, increased export and import controls stemming from Trump administration policies, or change in the countries, governments, persons or technologies targeted by such regulations, could result in decreased use of our solutions by, or in our decreased ability to export or sell our solutions to, existing or potential end-customers with international operations. Any decreased use of our solutions or limitation on our ability to export or sell our solutions would adversely affect our business, operating results and prospects.
28
Our international operations expose us to additional risks, and failure to manage those risks could adversely affect our business, operating results and cash flows.
Increasingly, we derive a significant portion of our revenue from end-customers and channel partners outside the United States. We derived approximately 33%, 37% and 40% of our total revenue from our international customers based on bill-to-location for fiscal 2015, fiscal 2016 and fiscal 2017, respectively. We are continuing to adapt to and develop strategies to address international markets but there is no guarantee that such efforts will have the desired effect. As of July 31, 2017, approximately 40% of our full-time employees were located outside of the United States. We expect that our international activities will continue to grow over the foreseeable future as we continue to pursue opportunities in existing and new international markets, which will require significant management attention and financial resources. We are subject to risks associated with having significant worldwide operations, including:
• | business practices may differ from those in the United States and may require us in the future to include terms other than our standard terms in customer, channel partner, employee, consultant and other contracts; |
• | political, economic and social instability or uncertainty around the world; |
• | potential changes in trade relations arising from policy initiatives implemented by, or statements made by, the Trump administration, which has been critical of existing and proposed trade agreements; |
• | greater difficulty in enforcing contracts, judgments and arbitration awards in international courts, and in collecting accounts receivable and longer payment and collection periods; |
• | greater risk of unexpected changes in regulatory practices, tariffs, and tax laws and treaties; |
• | risks associated with trade restrictions and foreign legal requirements, including the importation, certification and localization of our solutions required in foreign countries; |
• | greater risk of a failure of foreign employees, partners, distributors and resellers to comply with both U.S. and foreign laws, including antitrust regulations, the FCPA, the U.K. Bribery Act, U.S. or foreign sanctions regimes and export or import control laws, and any trade regulations ensuring fair trade practices; |
• | heightened risk of unfair or corrupt business practices in certain geographies and of improper or fraudulent sales arrangements that may impact financial results and result in restatements of, or irregularities in, financial statements; |
• | requirements to comply with foreign privacy, data protection and information security laws and regulations and the risks and costs of non-compliance; |
• | reduced or uncertain protection for intellectual property rights in some countries; |
• | impediments to the flow of foreign exchange capital payments and receipts due to exchange controls instituted by certain foreign governments; |
• | increased expenses incurred in establishing and maintaining corporate entities, office space, and equipment for our international operations; |
• | difficulties in managing and staffing international offices and increased travel, infrastructure and legal compliance costs associated with multiple international locations; |
• | greater difficulty in identifying, attracting and retaining local experienced personnel, and the costs and expenses associated with such activities; |
• | the challenge of managing a development team in geographically disparate locations; |
• | management communication and integration problems resulting from cultural and geographic dispersion; |
• | differing employment practices and labor relations issues; |
29
• | fluctuations in exchange rates between the U.S. dollar and foreign currencies in markets where we do business; and |
• | treatment of revenue from international sources for tax purposes and changes in tax laws, regulations or official interpretations, including being subject to foreign tax laws and being liable for paying withholding, income or other taxes in foreign jurisdictions. |
As we expand our business globally, our success will depend, in large part, on our ability to anticipate and effectively manage these risks. These factors and other factors could harm our ability to gain future international revenue and, consequently, materially impact our business, operating results and financial condition. The expansion of our existing international operations and entry into additional international markets will require significant management attention and financial resources. Our failure to successfully manage our international operations and the associated risks effectively could limit the future growth of our business. Additionally, failure to effectively manage this growth may result in reduced international revenue relative to U.S. revenue, and as a result, a higher effective tax rate due to the overall percentage of total revenue from U.S. customers relative to international customers.
A number of our solutions incorporate software provided under open source licenses which may restrict or impose certain obligations on how we use or distribute our solutions or subject us to various risks and challenges, which could result in increased development expenses, delays or disruptions to the release or distribution of those solutions, inability to protect our intellectual property rights and increased competition.
Certain significant components of our solutions incorporate or are based upon open source software, and we may incorporate open source software into other solutions in the future. Such open source software is generally licensed under open source licenses, including, for example, the GNU General Public License, the GNU Lesser General Public License, “Apache-style” licenses, “BSD-style” licenses and other open source licenses. The use of open source software subjects us to a number of risks and challenges, including:
• | If open source software programmers, most of whom we do not employ, do not continue to develop and enhance open source technologies, our development expenses could be increased and our product release and upgrade schedules could be delayed. |
• | Open source software is open to further development or modification by anyone. As a result, others may develop such software to be competitive with our operating system, and may make such competitive software available as open source. It is also possible for competitors to develop their own solutions using open source software, potentially reducing the demand for, and putting price pressure on, our solutions. |
• | The licenses under which we license certain types of open source software may require that, if we modify the open source software we receive, we are required to make such modified software and other related proprietary software of ours publicly available without cost and on the same terms. Accordingly, we monitor our use of open source software in an effort to avoid subjecting our proprietary software to such conditions and others we do not intend. Although we believe that we have complied with our obligations under the various applicable licenses for open source software that we use, our processes used to monitor how open source software is used could be subject to error. In addition, there is little or no legal precedent governing the interpretation of terms in most of these licenses. Therefore, any improper usage of open source could result in unanticipated obligations regarding our solutions and technologies, which could have an adverse impact on our intellectual property rights and our ability to derive revenue from solutions incorporating the open source software. |
• | If an author or other third party that distributes such open source software were to allege that we had not complied with the conditions of one or more of these licenses, we could be required to incur legal expenses defending against such allegations, or engineering expenses in developing a substitute solution. |
If we are unable to successfully address the challenges of integrating offerings based upon open source technology into our business, our business and operating results may be adversely affected and our development costs may increase.
30
Our failure to raise additional capital or generate the significant capital necessary to expand our operations and invest in new solutions could reduce our ability to compete and could harm our business.
We expect that our existing cash and cash equivalents, and short-term investments, together with the net proceeds that we received from our initial public offering, or IPO, will be sufficient to meet our anticipated cash needs for working capital and capital expenditures for at least the next 12 months. We may, however, need to raise additional funds in the future, and we may not be able to obtain those funds on favorable terms, or at all. If we raise additional equity financing, our stockholders may experience significant dilution of their ownership interests and the per share value of our Class A common stock could decline. Furthermore, if we engage in debt financing, the holders of debt would have priority over the holders of our common stock, and we may be required to accept terms that restrict our ability to incur additional indebtedness. We may also be required to take other actions, any of which could harm our business and operating results. If we are unable to obtain adequate financing or financing on terms satisfactory to us, when we require it, our ability to continue to support our business growth and to respond to business challenges could be significantly limited, and our business, operating results, financial condition and prospects could be adversely affected.
Adverse economic conditions or reduced datacenter spending may adversely impact our revenues and profitability.
Our operations and performance depend in part on worldwide economic conditions and the impact these conditions have on levels of spending on enterprise computing technology. Our business depends on the overall demand for enterprise computing infrastructure and on the economic health and general willingness of our current and prospective end-customers to purchase our solutions. Weak economic conditions, or a reduction in enterprise computing spending, would likely adversely affect our business, operating results and financial condition in a number of ways, including by reducing sales, lengthening sales cycles and lowering prices for our solutions.
We are exposed to fluctuations in currency exchange rates, which could negatively affect our operating results.
Our sales contracts are denominated in U.S. dollars, and therefore, substantially all of our revenue is not subject to foreign currency risk. However, a strengthening of the U.S. dollar could increase the real cost of our solutions to our end-customers outside of the United States, which could adversely affect our financial condition and operating results. In addition, an increasing portion of our operating expenses is incurred outside the United States, is denominated in foreign currencies such as the Euro, the Pound Sterling, the Indian Rupee, the Canadian Dollar and the Australian Dollar, and is subject to fluctuations due to changes in foreign currency exchange rates. If we become more exposed to currency fluctuations and are not able to successfully hedge against the risks associated with currency fluctuations, our operating results could be adversely affected. To date, we have not entered into any hedging arrangements with respect to foreign currency risk or other derivative instruments.
Taxing authorities may successfully assert that we should have collected or in the future should collect sales and use, value added or similar taxes, and we could be subject to liability with respect to past or future sales, which could adversely affect our operating results.
We do not collect sales and use, value added or similar taxes in all jurisdictions in which we have sales, and we have been advised that such taxes are not applicable to our products and services in certain jurisdictions. Sales and use, value added and similar tax laws and rates vary greatly by jurisdiction. Certain jurisdictions in which we do not collect such taxes may assert that such taxes are applicable, which could result in tax assessments, penalties and interest, to us or our end-customers for the past amounts, and we may be required to collect such taxes in the future. If we are unsuccessful in collecting such taxes from our end-customers, we could be held liable for such costs, which may adversely affect our operating results.
31
Our international operations may subject us to potential adverse tax consequences.
We are expanding our international operations and staff to better support our growth into the international markets. Our corporate structure and associated transfer pricing policies contemplate the business flows and future growth into the international markets, and consider the functions, risks and assets of the various entities involved in the intercompany transactions. The amount of taxes we pay in different jurisdictions may depend on the application of the tax laws of the various jurisdictions, including the United States, to our international business activities, changes in tax rates, new or revised tax laws or interpretations of existing tax laws and policies and our ability to operate our business in a manner consistent with our corporate structure and intercompany arrangements. The taxing authorities of the jurisdictions in which we operate may challenge our methodologies for pricing intercompany transactions pursuant to the intercompany arrangements or disagree with our determinations as to the income and expenses attributable to specific jurisdictions. If such a challenge or disagreement were to occur, and our position was not sustained, we could be required to pay additional taxes, interest and penalties, which could result in one-time tax charges, higher effective tax rates, reduced cash flows and lower overall profitability of our operations. Our financial statements could fail to reflect adequate reserves to cover such a contingency.
We expect to receive significant tax benefits from sales to our non-U.S. customers. These benefits are contingent upon existing tax laws and regulations in the U.S. and in the countries in which our international operations are located. Future changes in domestic or international tax laws and regulations could adversely affect our ability to continue to realize these tax benefits. President Trump and the U.S. Congress have called for comprehensive tax reform which, among other things, might change certain U.S. tax rules impacting the way U.S. based multinationals are taxed on foreign income. This could adversely affect our effective tax rate or result in higher tax liabilities.
Our business is subject to the risks of earthquakes, fire, floods and other natural catastrophic events, and interruptions by man-made problems, such as network security breaches, computer viruses or terrorism.
A significant natural disaster, such as an earthquake, fire, flood or significant power outage could have an adverse impact on our business and operating results. Despite the implementation of network security measures, our networks also may be vulnerable to computer viruses, break-ins and similar disruptions from unauthorized tampering with our solutions. Both our corporate headquarters and our main contract manufacturers are located in the San Francisco Bay Area, a region known for seismic activity. In addition, natural disasters, acts of terrorism or war could cause disruptions in our or our end-customers’ or channel partners’ businesses, our suppliers’ and manufacturers’ operations or the economy as a whole. We also rely on IT systems to communicate among our workforce and with third parties. Any disruption to our communications, whether caused by a natural disaster or by manmade problems, such as power disruptions, could adversely affect our business. We do not have a formal disaster recovery plan or policy in place and do not currently require that our manufacturing partners have such plans or policies in place. To the extent that any such disruptions result in delays or cancellations of orders or impede our suppliers’ or our manufacturers’ ability to timely deliver our solutions and product components, or the deployment of our solutions, our business, operating results and financial condition would be adversely affected. We do maintain what we believe are commercially reasonable levels of business interruption insurance. However, such insurance may not adequately cover our losses in the event of a significant disruption in our business.
32
If our networks, computer systems or software solutions are breached or unauthorized access to customer data otherwise occurs, our enterprise and our solutions may be perceived as insecure, we may lose existing end-customers or fail to attract new end-customers, our reputation may be damaged and we may incur significant liabilities.
We store, transmit and process our end-customers’ data. If any unauthorized access to or security breach of our solutions occurs, or is believed to have occurred, such an event or perceived event could result in the loss of data, loss of intellectual property or trade secrets, loss of business, severe reputational or brand damage adversely affecting end-customer or investor confidence, regulatory investigations and orders, litigation, indemnity obligations, damages for contract breach, and penalties for violation of privacy, data protection and other applicable laws, regulations or contractual obligations. We may also be subject to significant costs for remediation that may include liability for stolen assets or information and repair of system damage that may have been caused or incentives offered to end-customers or other business partners in an effort to maintain business relationships after a breach and other liabilities. Additionally, any such event or perceived event could impact our reputation, harm customer confidence, hurt our sales and expansion into new markets or cause us to lose existing end-customers. We could be required to expend significant capital and other resources to alleviate problems caused by such actual or perceived breaches and to remediate our systems, we could be exposed to a risk of loss, litigation or regulatory action and possible liability, and our ability to operate our business may be impaired. Additionally, actual, potential or anticipated attacks may cause us to incur increasing costs, including costs to deploy additional personnel and protection technologies, train employees and engage third-party experts and consultants.
Additionally, we depend upon our employees to appropriately handle confidential data and deploy our IT resources in a safe and secure fashion that does not expose our network systems, or those of our end-customers, to security breaches and the loss of data. Accordingly, if our cybersecurity systems and measures or those of our contractors, partners and vendors fail to protect against unauthorized access, sophisticated cyberattacks and the mishandling of data by our employees, contractors, partners or vendors, our business and prospects could be adversely affected. We could lose or suffer the exposure of sensitive data regarding our business, including intellectual property or other proprietary data, or personally identifiable information of our end-customers, employees and business partners; encounter disruptions in our communications systems that impair our ability to conduct our business operations; and experience degradation in our ability to process customer orders or deliver solutions, affecting our distribution channels and delaying our revenue recognition. Likewise, security vulnerabilities could be exploited or introduced into our solutions, thereby damaging the reputation and perceived reliability and security of our products and services and potentially making the data systems of our end-customers vulnerable to further data loss and cyber incidents.
In addition, if the security measures of our end-customers are compromised, even without any actual compromise of our own systems or of our solutions used by such end-customers, we may face negative publicity or reputational harm if our end-customers or anyone else incorrectly attributes the blame for such security breaches to us or our solutions. If end-customers believe that our solutions do not provide adequate security for the storage of personal or other sensitive or proprietary information or the transmission of such information over the internet, our business will be harmed. End-customers’ concerns about security or privacy may deter them from using our solutions for activities that involve personal or other sensitive information, which may significantly affect our business and operating results.
Because the techniques used and vulnerabilities exploited to obtain unauthorized access or to sabotage systems change frequently and generally are not identified until they are launched against a target, we may be unable to anticipate these techniques or vulnerabilities or implement adequate preventative measures. We may also experience security breaches that may remain undetected for an extended period.
33
We are dependent on the continued availability of the Internet and third-party computer and communications systems.
Our ability to provide services and solutions to our end-customers depends on our ability to communicate with our end-customers through the public Internet and electronic networks that are owned and operated by third parties. In addition, in order to provide customer service and sales on-demand and promptly, our computer equipment and network servers must be functional 24 hours per day, which requires access to telecommunications facilities managed by third parties and the availability of electricity, which we do not control. A severe disruption of one or more of these networks, including as a result of utility or third-party system interruptions, could impair our ability to process information, which could impede our ability to provide services to our end-customers, harm our reputation, result in a loss of end-customers and adversely affect our business and operating results.
Our estimates of end-customer cost savings may not be indicative of the actual benefits that end-customers experience in the future.
We have based our estimates of the cost savings that end-customers may experience on our internal models, which depend on a variety of assumptions, including publicly-available industry data, our estimates of spending on IT and our industry experience. These assumptions may turn out to be incorrect, may not reflect the specific circumstances faced by an end-customer or could change over time due to a variety of factors, including our assumptions regarding the costs of third-party equipment, software licenses, services, support offerings and IT administration may change over time, may not accurately reflect current market trends or may not accurately reflect the actual costs faced by our end-customers; the prices of our solutions may change; technological changes could render the need for some equipment obsolete; and competitors may offer more favorable pricing or bundle some components together with other products, reducing the cost of the infrastructures or solutions against which we have made our comparisons. As a result, end-customers may not experience these estimated cost savings, and the failure of many of them to do so could harm our brand or our future sales, which could harm our business.
We have expanded and may further expand through acquisitions of, or investments in, other companies, each of which may divert our management’s attention, resulting in additional dilution to our stockholders and consumption of resources that are necessary to sustain and grow our business.
Our business strategy may, from time to time, include acquiring other complementary products, technologies or businesses. For example, in August 2016, we acquired Calm.io Pte. Ltd., or Calm, and in September 2016, we acquired PernixData, Inc., or PernixData. We also may enter into relationships with other businesses in order to expand our solutions, which could involve preferred or exclusive licenses, additional channels of distribution or discount pricing or investments in other companies. Negotiating these transactions can be time-consuming, difficult and expensive, and our ability to close these transactions may be subject to third-party approvals, such as government regulatory approvals, which are beyond our control. Consequently, we can make no assurance that these transactions once undertaken and announced, will close.
These kinds of acquisitions or investments may result in unforeseen operating difficulties and expenditures. In particular, we may encounter difficulties assimilating or integrating the businesses, technologies, products, personnel or operations of companies that we may acquire, particularly if the key personnel of the acquired business choose not to work for us. We may have difficulty retaining the customers of any acquired business or the acquired technologies or research and development expectations may prove unsuccessful. Acquisitions may also disrupt our ongoing business, divert our resources and require significant management attention that would otherwise be available for development of our business. We may not successfully evaluate or utilize the acquired technology or personnel, or accurately forecast the financial impact of an acquisition transaction, including accounting charges. Any acquisition or investment could expose us to unknown liabilities. Moreover, we cannot assure you that the anticipated benefits of any acquisition or investment would be realized or that we would not be exposed to unknown liabilities. In connection with these types of transactions, we may issue additional equity securities that would dilute our stockholders, use cash that we may need in the future to operate our business, incur debt on terms unfavorable to us or that we are unable to repay, incur large charges or substantial liabilities, encounter difficulties integrating diverse business cultures, and become subject to adverse tax consequences, substantial depreciation or deferred compensation charges. These challenges related to acquisitions or investments could adversely affect our business, operating results, financial condition and prospects.
34
Regulations related to conflict minerals may cause us to incur additional expenses and could limit the supply and increase the costs of certain metals used in the manufacturing of our solutions.
We are subject to the requirements under the Dodd-Frank Wall Street Reform and Consumer Protection Act of 2010, or the Dodd-Frank Act, that will require us to diligence, disclose and report whether our solutions contain conflict minerals. The Trump administration has indicated that the Dodd-Frank Act will be under further scrutiny and some of the provisions of the Dodd-Frank Act may be revised, repealed or amended, and, in April 2017, the SEC announced that it was suspending enforcement of portions of the conflict minerals regulations enacted under the Dodd-Frank Act following a ruling by the U.S. Court of Appeals for the District of Columbia Circuit. The implementation of these requirements and any changes effected by the Trump administration's implementation of these requirements could adversely affect the sourcing, availability and pricing of the materials used in the manufacture of components used in our appliances. In addition, we will incur additional costs to comply with the disclosure requirements, including costs related to conducting diligence procedures to determine the sources of conflict minerals that may be used in or necessary to the production of our appliances and, if applicable, potential changes to appliances, processes or sources of supply as a consequence of such verification activities. It is also possible that we may face reputational harm if we determine that certain of our appliances contain minerals not determined to be conflict-free or if we are unable to alter our appliances, processes or sources of supply to avoid use of such materials.
Risks Related to Ownership of Our Class A Common Stock
The market price of our Class A common stock may be volatile and may decline.
The market price of our Class A common stock has fluctuated and may continue to fluctuate substantially. The market price of our Class A common stock depends on a number of factors, including those described in this “Risk Factors” section, many of which are beyond our control and may not be related to our operating performance. These fluctuations could cause you to lose all or part of your investment in our Class A common stock. Factors that could cause fluctuations in the market price of our Class A common stock include the following:
• | price and volume fluctuations in the overall stock market from time to time; |
• | volatility in the market prices and trading volumes of high technology stocks; |
• | changes in operating performance and stock market valuations of other technology companies generally, or those in our industry in particular; |
• | failure of financial analysts to maintain coverage of us, changes in financial estimates by any analysts who follow our company, or our failure to meet these estimates or the expectations of investors; |
• | the financial projections we may provide to the public, any changes in these projections or our failure to meet these projections; |
• | announcements by us or our competitors of new products or new or terminated significant contracts, commercial relationships or capital commitments; |
• | public analyst or investor reaction to our press releases, other public announcements and filings with the SEC; |
• | rumors and market speculation involving us or other companies in our industry; |
• | actual or anticipated changes or fluctuations in our operating results; |
• | actual or anticipated developments in our business or our competitors’ businesses or the competitive landscape generally; |
• | actual or threatened litigation involving us, our industry or both, or investigations by regulators into our operations or those of our competitors; |
• | developments or disputes concerning our intellectual property or our solutions, or third-party proprietary rights; |
35
• | rumored, announced or completed acquisitions of businesses or technologies by us or our competitors; |
• | new laws or regulations or new interpretations of existing laws or regulations applicable to our business; |
• | changes in accounting standards, policies, guidelines, interpretations or principles; |
• | any major changes in our management or our board of directors; |
• | general economic conditions and slow or negative growth of our markets; and |
• | other events or factors, including those resulting from war, incidents of terrorism or responses to these events. |
In addition, the stock market in general, and the market for technology companies in particular, have experienced extreme price and volume fluctuations that have often been unrelated or disproportionate to the operating performance of those companies. Broad market and industry factors may seriously affect the market price of our Class A common stock, regardless of our actual operating performance. In addition, in the past, following periods of volatility in the overall market and the market prices of a particular company’s securities, securities class action litigation has often been instituted against that company. Securities litigation, if instituted against us, could result in substantial costs and divert our management’s attention and resources from our business. This could have an adverse effect on our business, operating results and financial condition.
Sales of substantial amounts of our Class A common stock in the public markets, or the perception that they might occur, could reduce the price that our Class A common stock might otherwise attain and may dilute your voting power and your ownership interest in us.
Sales of a substantial number of shares of our Class A common stock in the public markets, particularly sales by our directors, executive officers and significant stockholders, or the perception that these sales could occur, could adversely affect the market price of our Class A common stock.
In addition, certain holders of our Class B common stock are entitled to rights with respect to registration of these shares under the Securities Act of 1933, as amended, pursuant to our Amended and Restated Investors’ Rights Agreement. If such holders exercise their registration rights and sell a large number of shares, they could adversely affect the market price for our Class A common stock. We have also registered the offer and sale of all shares of Class A and Class B common stock that we may issue under our equity compensation plans.
We may also issue our shares of Class A common stock or securities convertible into shares of our Class A common stock from time to time in connection with a financing, acquisition, investments or otherwise. Any such issuance could result in substantial dilution to our existing stockholders and cause the market price of our Class A common stock to decline.
36
The dual class structure of our common stock as contained in our charter documents has the effect of concentrating voting control with a limited number of stockholders that held our stock prior to our IPO, including our directors, executive officers, and employees and their affiliates, and significant stockholders, which will limit your ability to influence corporate matters.
Our Class B common stock has 10 votes per share, and our Class A common stock has one vote per share. As of July 31, 2017, stockholders who hold shares of Class B common stock, including our investors and our directors, executive officers, and employees, and their affiliates, together hold a significant majority of the voting power of our outstanding capital stock. As a result, for the foreseeable future, such stockholders will have significant influence over the management and affairs of our company and over the outcome of all matters submitted to our stockholders for approval, including the election of directors and significant corporate transactions, such as a merger, consolidation or sale of substantially all of our assets.
In addition, the holders of Class B common stock collectively will continue to control all matters submitted to our stockholders for approval even if their stock holdings represent less than 50% of the outstanding shares of our common stock. Because of the ten-to-one voting ratio between our Class B and Class A common stock, the holders of our Class B common stock collectively will continue to control a majority of the combined voting power of our common stock so long as the shares of Class B common stock represent at least 9.1% of all outstanding shares of our Class A and Class B common stock. This concentrated control will limit your ability to influence corporate matters for the foreseeable future, and, as a result, the market price of our Class A common stock could be adversely affected. These holders of our Class B common stock may also have interests that differ from yours and may vote in a way with which you disagree and which may be adverse to your interests, and, unless earlier converted at the election of the holders of 67% of our outstanding Class B common stock, our amended and restated certificate of incorporation provides for a dual class stock structure for 17 years following the completion of our IPO.
Future transfers, whether or not for value, by holders of Class B common stock will generally result in those shares converting to Class A common stock, subject to limited exceptions, such as certain transfers affected for estate planning purposes. The conversion of shares of our Class B common stock into shares of our Class A common stock will have the effect, over time, of increasing the relative voting power of those holders of Class B common stock who retain their shares in the long term. If one or more significant holders of our Class B common stock decides to convert or sell their shares, it could result in a different group of Class B common stock holders having the power to exert significant influence over our company, which may or may not align with the strategy and direction set by our management. Any such changes could adversely affect the market price of our Class A common stock.
We are an “emerging growth company” and we cannot be certain if the reduced disclosure requirements applicable to emerging growth companies will make our Class A common stock less attractive to investors.
For so long as we remain an “emerging growth company” as defined in the in the Jumpstart Our Business Startups Act, or JOBS Act, we may take advantage of certain exemptions from various requirements that are applicable to public companies that are not “emerging growth companies,” including, but not limited to, not being required to comply with the auditor attestation requirements of Section 404 of the Sarbanes-Oxley Act, reduced disclosure obligations regarding executive compensation in our periodic reports and proxy statements and exemptions from the requirements of holding a nonbinding advisory vote on executive compensation and stockholder approval of any golden parachute payments not previously approved. We may take advantage of these exemptions until we are no longer an emerging growth company. We would cease to be an emerging growth company upon the earliest to occur of: (i) the first fiscal year following the fifth anniversary of our IPO; (ii) the first fiscal year after our annual gross revenue is $1 billion or more; (iii) the date on which we have, during the previous three-year period, issued more than $1 billion in non-convertible debt securities; or (iv) as of the end of any fiscal year in which the market value of our common stock held by non-affiliates exceeded $700 million as of the end of the second quarter of that fiscal year. We cannot predict if investors will find our Class A common stock less attractive because we may rely on these exemptions. If some investors find our Class A common stock less attractive as a result, there may be a less active trading market for our Class A common stock and our stock price may be more volatile.
37
The requirements of being a public company may strain our resources, divert management’s attention and affect our ability to attract and retain qualified board members.
We are subject to the reporting and corporate governance requirements of the Exchange Act, the listing requirements of the NASDAQ Global Select Market and other applicable securities rules and regulations, including the Sarbanes-Oxley Act and the Dodd-Frank Act. Compliance with these rules and regulations will increase our legal and financial compliance costs, make some activities more difficult, time-consuming or costly and increase demand on our systems and resources, particularly after we are no longer an “emerging growth company” as defined in the JOBS Act. Among other things, the Exchange Act requires that we file annual, quarterly and current reports with respect to our business and results of operations and maintain effective disclosure controls and procedures and internal control over financial reporting. In order to improve our disclosure controls and procedures and internal control over financial reporting to meet this standard, significant resources and management oversight may be required. As a result, management’s attention may be diverted from other business concerns, which could harm our business, financial condition, results of operations and prospects. Although we have already hired additional employees to help comply with these requirements, we may need to further expand our legal and finance departments in the future, which will increase our costs and expenses.
In addition, changing laws, regulations and standards relating to corporate governance and public disclosure are creating uncertainty for public companies, increasing legal and financial compliance costs and making some activities more time-consuming. These laws, regulations and standards are subject to varying interpretations, in many cases due to their lack of specificity, and, as a result, their application in practice may evolve over time as new guidance is provided by regulatory and governing bodies. This could result in continuing uncertainty regarding compliance matters and higher costs necessitated by ongoing revisions to disclosure and governance practices. We intend to invest resources to comply with evolving laws, regulations and standards, and this investment may result in increased general and administrative expense and a diversion of management’s time and attention from revenue-generating activities to compliance activities. If our efforts to comply with new laws, regulations and standards differ from the activities intended by regulatory or governing bodies, regulatory authorities may initiate legal proceedings against us and our business and prospects may be harmed. As a result of disclosure of information in the filings required of a public company, our business and financial condition will become more visible, which may result in threatened or actual litigation, including by competitors and other third parties. If such claims are successful, our business, financial condition, results of operations and prospects could be harmed, and even if the claims do not result in litigation or are resolved in our favor, these claims, and the time and resources necessary to resolve them, could divert the resources of our management and harm our business, financial condition, results of operations and prospects.
In addition, as a result of our disclosure obligations as a public company, we will have reduced strategic flexibility and will be under pressure to focus on short-term results, which may adversely affect our ability to achieve long-term profitability.
If financial or industry analysts do not publish research or reports about our business, or if they issue inaccurate or unfavorable research regarding our Class A common stock, our stock price and trading volume could decline.
The trading market for our Class A common stock will be influenced by the research and reports that industry or financial analysts publish about us or our business. We do not control these analysts or the content and opinions included in their reports. As a new public company, we may be slow to attract research coverage and the analysts who publish information about our Class A common stock will have had relatively little experience with our company, which could affect their ability to accurately forecast our results and make it more likely that we fail to meet their estimates. In the event we obtain industry or financial analyst coverage, if any of the analysts who cover us issue an inaccurate or unfavorable opinion regarding our stock price, our stock price would likely decline. In addition, the stock prices of many companies in the high technology industry have declined significantly after those companies have failed to meet, or often times significantly exceeded, the financial guidance publicly announced by the companies or the expectations of analysts. If our financial results fail to meet (or significantly exceed) our announced guidance or the expectations of analysts or public investors, analysts could downgrade our Class A common stock or publish unfavorable research about us. If one or more of these analysts cease coverage of our company or fail to publish reports on us regularly, we could lose visibility in the financial markets, which in turn could cause our stock price or trading volume to decline.
38
Certain provisions in our charter documents and under Delaware law could make an acquisition of our company more difficult, limit attempts by our stockholders to replace or remove members of our board of directors or current management and may adversely affect the market price of our Class A common stock.
Our amended and restated certificate of incorporation and amended and restated bylaws contain provisions that could delay or prevent a change in control of our company. These provisions could also make it difficult for stockholders to elect directors that are not nominated by the current members of our board of directors or take other corporate actions, including effecting changes in our management. These provisions include:
• | our amended and restated certificate of incorporation provides for a dual class common stock structure for 17 years following the completion of our IPO; |
• | a classified board of directors with three-year staggered terms, which could delay the ability of stockholders to change the membership of a majority of our board of directors; |
• | the ability of our board of directors to issue shares of preferred stock and to determine the price and other terms of those shares, including preferences and voting rights, without stockholder approval, which could be used to significantly dilute the ownership of a hostile acquirer; |
• | upon the conversion of our Class A common stock and Class B common stock into a single class of common stock, the exclusive right of our board of directors to elect a director to fill a vacancy created by the expansion of our board of directors or the resignation, death or removal of a director, which prevents stockholders from being able to fill vacancies on our board of directors; |
• | upon the conversion of our Class A common stock and Class B common stock into a single class of common stock, a prohibition on stockholder action by written consent, which forces stockholder action to be taken at an annual or special meeting of our stockholders; |
• | the requirement that a special meeting of stockholders may be called only by the chairman of our board of directors, our lead independent director, our president, our secretary or a majority vote of our board of directors, which could delay the ability of our stockholders to force consideration of a proposal or to take action, including the removal of directors; |
• | the requirement for the affirmative vote of holders of at least 66 2⁄3% of the voting power of all of the then outstanding shares of the voting stock, voting together as a single class, to amend the provisions of our amended and restated certificate of incorporation relating to the issuance of preferred stock and management of our business or our amended and restated bylaws, which may inhibit the ability of an acquirer to effect such amendments to facilitate an unsolicited takeover attempt; |
• | the ability of our board of directors, by majority vote, to amend our amended and restated bylaws, which may allow our board of directors to take additional actions to prevent an unsolicited takeover and inhibit the ability of an acquirer to amend our amended and restated bylaws to facilitate an unsolicited takeover attempt; and |
• | advance notice procedures with which stockholders must comply to nominate candidates to our board of directors or to propose matters to be acted upon at a stockholders’ meeting, which may discourage or deter a potential acquirer from conducting a solicitation of proxies to elect the acquirer’s own slate of directors or otherwise attempting to obtain control of us. |
In addition, as a Delaware corporation, we are subject to Section 203 of the Delaware General Corporation Law. These provisions may prohibit large stockholders, in particular those owning 15% or more of our outstanding voting stock, from merging or combining with us for a certain period of time.
39
We believe our long-term value as a company will be greater if we focus on growth, which may negatively impact our profitability in the near term.
Part of our business strategy is to primarily focus on our long-term growth. As a result, our profitability may be lower in the near term than it would be if our strategy was to maximize short-term profitability. Expenditures on expanding our research and development efforts, sales and market efforts, infrastructure and other such investments may not ultimately grow our business or cause long-term profitability. If we are ultimately unable to achieve profitability at the level anticipated by analysts and our stockholders, our stock price may decline.
We do not intend to pay dividends in the foreseeable future. As a result, your ability to achieve a return on your investment will depend on appreciation in the price of our Class A common stock.
We have never declared or paid any cash dividends on our Class A common stock. We currently intend to retain all available funds and any future earnings for use in the operation of our business and do not anticipate paying any dividends on our Class A common stock in the foreseeable future. Any determination to pay dividends in the future will be at the discretion of our board of directors. Accordingly, investors must rely on sales of their Class A common stock after price appreciation, which may never occur, as the only way to realize any future gains on their investments.
Item 1B. Unresolved Staff Comments
Not Applicable
Item 2. Properties
Our corporate headquarters are located in San Jose, California where, under two lease agreements that expire in March 2021, we currently lease approximately 176,000 square feet of space. We also maintain offices in North America, Europe, Asia-Pacific, Middle East, Latin America and Africa. We lease all of our facilities and do not own any real property. We expect to add facilities as we grow our employee base and expand geographically. We believe that our facilities are adequate to meet our needs for the immediate future, and that, should it be needed, suitable additional space will be available to accommodate expansion of our operations.
Item 3. Legal Proceedings
We are not currently a party to any material legal proceedings that we believe to be material to our business or financial condition. From time to time we may become party to various litigation matters and subject to claims that arise in the ordinary course of business.
Item 4. Mine Safety Disclosures
Not Applicable
40
PART II
Item 5. Market for Registrant's Common Equity, Related Stockholder Matters and Issuer Purchases of Equity Securities
Market Information for Common Stock
Our Class A common stock began trading publicly on the NASDAQ Global Select Market under the ticker symbol “NTNX” on September 30, 2016. Prior to that time, there was no public market for our Class A common stock. The following table sets forth, for the periods indicated, the high and low sale prices of our Class A common stock as reported on the NASDAQ Global Select Market since our initial public offering, or IPO.
Fiscal Year 2017 Quarter Ended: | High | Low | |||||
October 31, 2016 (from September 30, 2016) | $ | 44.46 | $ | 24.50 | |||
January 31, 2017 | $ | 34.69 | $ | 23.37 | |||
April 30, 2017 | $ | 33.10 | $ | 15.19 | |||
July 31, 2017 | $ | 24.41 | $ | 14.46 | |||
Our Class B common stock is not listed nor traded on any stock exchange.
Holders of Record
As of July 31, 2017, there were 175 holders of record of our Class A common stock. This figure does not include a substantially greater number of “street name” holders or beneficial holders of our common stock whose shares are held of record by banks, brokers and other financial institutions. As of July 31, 2017, there were approximately 120 stockholders of record of our Class B common stock.
Dividend Policy
We have never declared or paid cash dividends on our common stock. We currently intend to retain all available funds and any future earnings for use in the operation of our business and do not anticipate paying any dividends in the foreseeable future. Any future determination to declare dividends will be made at the discretion of our board of directors, subject to applicable laws, and will depend on our financial condition, operating results, capital requirements, general business conditions and other factors that our board of directors may deem relevant.
Sale of Unregistered Securities and Use of Proceeds
(a) Unregistered Sales of Equity Securities
None
(b) Use of Proceeds
Our IPO of Class A common stock was effected through Registration Statements on Form S-1 (File Nos. 333-208711 and 333-213876), which were declared or became effective on September 29, 2016. There has been no material change in the use of proceeds from our IPO as described in our final prospectus filed with the Securities and Exchange Commission, or SEC, pursuant to Rule 424(b) of the Securities Act of 1933, as amended, or the Securities Act, and other periodic reports previously filed with the SEC.
41
Issuer Purchases of Equity Securities
We issued shares of common stock related to exercises of unvested stock options, or the early exercised stock options. The shares of common stock issued in connection with the early exercised stock options are subject to our repurchase right at the original purchase price. The proceeds are initially recorded as a liability and reclassified to common stock and additional paid in capital as our repurchase right lapses. During fiscal 2017, we repurchased the following shares related to unvested early exercised stock options due to termination:
Period | Total Number of Shares (or Units) Purchased | Average Price Paid per Share (or Unit) | |||||
August 1, 2016 to October 31, 2016 | — | $ | — | ||||
November 1, 2016 to January 31, 2017 | 9,480 | $ | 1.89 | ||||
February 1, 2017 to April 30, 2017 | 1,250 | $ | 1.22 | ||||
May 1, 2017 to July 31, 2017 | 10,938 | $ | 2.34 | ||||
Total | 21,668 | $ | 2.08 | ||||
Purchases of Equity Securities by the Issuer
None.
Stock Performance Graph
The following graph shows a comparison from September 30, 2016 (the date our Class A common stock commenced trading on the NASDAQ Global Select Market) through July 31, 2017 of the cumulative total return for our Class A common stock. The graph assumes that $100 was invested on September 30, 2016 in the common stock of Nutanix, Inc., the NASDAQ Composite Index and NASDAQ Computer Index, and assumes reinvestment of any dividends. The stock price performance on the following graph is not necessarily indicative of future stock price performance.
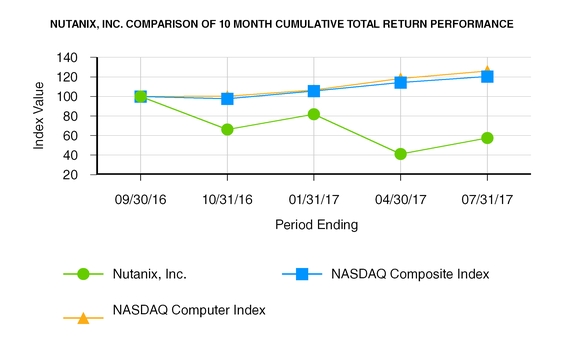
42
Quarter Ended | |||||||||||||||||||
September 30, 2016 | October 31, 2016 | January 31, 2017 | April 30, 2017 | July 31, 2017 | |||||||||||||||
Nutanix, Inc. | $ | 100 | $ | 66.22 | $ | 81.81 | $ | 41.05 | $ | 57.42 | |||||||||
NASDAQ Composite Index | $ | 100 | $ | 97.55 | $ | 105.66 | $ | 114.16 | $ | 120.32 | |||||||||
NASDAQ Computer Index | $ | 100 | $ | 100.13 | $ | 106.54 | $ | 118.27 | $ | 126.04 | |||||||||
The information on the above graph shall not be deemed to be “filed” for purposes of Section 18 of the the Securities Exchange Act of 1934, as amended, or otherwise subject to the liabilities of that section or Sections 11 and 12(a)(2) of the Securities Act, and shall not be incorporated by reference into any registration statement or other document filed by us with the SEC, whether made before or after the date of this Annual Report on Form 10-K, regardless of any general incorporation language in such filing, except as shall be expressly set forth by specific reference in such filing.
Securities Authorized for Issuance Under Equity Compensation Plans
The information required by this item is incorporated herein by reference to our definitive proxy statement for our 2017 annual meeting of stockholders, which will be filed not later than 120 days after the end of our fiscal year ended July 31, 2017.
43
Item 6. Selected Consolidated Financial and Other Data
The selected consolidated statement of operations data for fiscal 2015, fiscal 2016, and fiscal 2017 and the consolidated balance sheet data as of July 31, 2016 and 2017 are derived from our audited consolidated financial statements included elsewhere in this Annual Report on Form 10-K. The selected consolidated statement of operations data for fiscal 2014 and fiscal 2013 and the consolidated balance sheet data as of July 31, 2013, 2014, and 2015 are derived from audited financial statements not included in this Annual Report on Form 10-K. Our historical results are not necessarily indicative of the results that may be expected in the future. The selected consolidated financial data below should be read in conjunction with the section entitled “Management’s Discussion and Analysis of Financial Condition and Results of Operations” included in Part II, Item 7 of this Annual Report on Form 10-K and our consolidated financial statements and related notes included in Part II, Item 8 of this Annual Report on Form 10-K.
Fiscal Year Ended July 31, | |||||||||||||||||||
2013 | 2014 | 2015 | 2016 | 2017 | |||||||||||||||
(In thousands, except share and per share data) | |||||||||||||||||||
Consolidated Statements of Operations Data: | |||||||||||||||||||
Revenue: | |||||||||||||||||||
Product | $ | 28,138 | $ | 113,562 | $ | 200,833 | $ | 350,798 | $ | 583,011 | |||||||||
Support and other services | 2,395 | 13,565 | 40,599 | 94,130 | 183,858 | ||||||||||||||
Total revenue | 30,533 | 127,127 | 241,432 | 444,928 | 766,869 | ||||||||||||||
Cost of revenue: | |||||||||||||||||||
Product(1) (2) | 24,171 | 52,417 | 80,900 | 133,541 | 249,393 | ||||||||||||||
Support and other services(1) | 2,433 | 8,495 | 20,059 | 37,246 | 77,938 | ||||||||||||||
Total cost of revenue | 26,604 | 60,912 | 100,959 | 170,787 | 327,331 | ||||||||||||||
Gross profit | 3,929 | 66,215 | 140,473 | 274,141 | 439,538 | ||||||||||||||
Operating expenses: | |||||||||||||||||||
Sales and marketing(1) (2) | 27,200 | 93,001 | 161,829 | 288,493 | 500,529 | ||||||||||||||
Research and development(1) | 16,496 | 38,037 | 73,510 | 116,400 | 288,619 | ||||||||||||||
General and administrative(1) | 4,833 | 13,496 | 23,899 | 34,265 | 77,341 | ||||||||||||||
Total operating expenses | 48,529 | 144,534 | 259,238 | 439,158 | 866,489 | ||||||||||||||
Loss from operations | (44,600 | ) | (78,319 | ) | (118,765 | ) | (165,017 | ) | (426,951 | ) | |||||||||
Other expense—net | (54 | ) | (5,076 | ) | (5,818 | ) | (1,290 | ) | (26,377 | ) | |||||||||
Loss before provision for income taxes | (44,654 | ) | (83,395 | ) | (124,583 | ) | (166,307 | ) | (453,328 | ) | |||||||||
Provision for income taxes | 80 | 608 | 1,544 | 2,192 | 4,683 | ||||||||||||||
Net loss | $ | (44,734 | ) | $ | (84,003 | ) | $ | (126,127 | ) | $ | (168,499 | ) | $ | (458,011 | ) | ||||
Net loss per share attributable to Class A and Class B common stockholders—basic and diluted | $ | (1.36 | ) | $ | (2.30 | ) | $ | (3.11 | ) | $ | (3.83 | ) | $ | (3.57 | ) | ||||
Weighted-average shares used in computing net loss per share attributable to Class A and Class B common stockholders—basic and diluted | 32,866,059 | 36,520,107 | 40,509,481 | 43,970,381 | 128,295,563 | ||||||||||||||
44
(1) | Includes stock-based compensation expense as follows: |
Fiscal Year Ended July 31, | |||||||||||||||||||
2013 | 2014 | 2015 | 2016 | 2017 | |||||||||||||||
(In thousands) | |||||||||||||||||||
Cost of revenue: | |||||||||||||||||||
Product | $ | 61 | $ | 124 | $ | 363 | $ | 391 | $ | 3,066 | |||||||||
Support and other services | 40 | 194 | 718 | 968 | 10,411 | ||||||||||||||
Total cost of revenue | 101 | 318 | 1,081 | 1,359 | 13,477 | ||||||||||||||
Sales and marketing | 611 | 2,150 | 6,474 | 8,006 | 78,117 | ||||||||||||||
Research and development | 3,835 | 2,243 | 5,411 | 6,259 | 109,044 | ||||||||||||||
General and administrative | 443 | 1,149 | 4,174 | 4,432 | 30,853 | ||||||||||||||
Total stock-based compensation expense | $ | 4,990 | $ | 5,860 | $ | 17,140 | $ | 20,056 | $ | 231,491 | |||||||||
During the three months ended October 31, 2016, we recorded approximately $83.0 million of compensation expense related to the performance stock awards as we determined that the performance conditions (certain liquidity events, including IPO, and achievement of specified performance targets) were probable of achievement.
(2)Includes amortization of intangible assets as follows:
Fiscal Year Ended July 31, | |||||||||||||||||||
2013 | 2014 | 2015 | 2016 | 2017 | |||||||||||||||
(In thousands) | |||||||||||||||||||
Product cost of revenue | $ | — | $ | — | $ | — | $ | — | $ | 1,314 | |||||||||
Sales and marketing | — | — | — | — | 915 | ||||||||||||||
Total amortization of intangible assets | $ | — | $ | — | $ | — | $ | — | $ | 2,229 | |||||||||
As of July 31, | |||||||||||||||||||
2013 | 2014 | 2015 | 2016 | 2017 | |||||||||||||||
(In thousands) | |||||||||||||||||||
Consolidated Balance Sheet Data: | |||||||||||||||||||
Cash, cash equivalents and short-term investments | $ | 18,047 | $ | 57,485 | $ | 150,539 | $ | 185,200 | $ | 349,053 | |||||||||
Total assets | $ | 44,340 | $ | 118,964 | $ | 249,831 | $ | 399,086 | $ | 726,073 | |||||||||
Deferred revenue (current and non-current portion) | $ | 12,530 | $ | 36,477 | $ | 103,598 | $ | 296,465 | $ | 526,071 | |||||||||
Senior notes | $ | — | $ | — | $ | — | $ | 73,260 | $ | — | |||||||||
Preferred stock warrant liability | $ | 1,110 | $ | 5,507 | $ | 11,683 | $ | 9,679 | $ | — | |||||||||
Convertible preferred stock | $ | 71,368 | $ | 172,075 | $ | 310,379 | $ | 310,379 | $ | — | |||||||||
Total stockholders’ (deficit) equity | $ | (55,885 | ) | $ | (130,775 | ) | $ | (234,734 | ) | $ | (376,315 | ) | $ | 48,202 | |||||
45
Item 7. Management's Discussion and Analysis of Financial Condition and Results of Operations
You should read the following discussion and analysis of our financial condition and results of operations together with the consolidated financial statements and related notes that are included elsewhere in this Annual Report on Form 10-K. The last day of our fiscal year is July 31. Our fiscal quarters end on October 31, January 31, April 30 and July 31. This discussion contains forward-looking statements based upon current expectations that involve risks and uncertainties. Our actual results may differ materially from those anticipated in these forward-looking statements as a result of various factors, including those set forth under “Risk Factors” or in other parts of this Annual Report on Form 10-K.
Overview
We provide a leading next-generation enterprise cloud operating system that converges traditional silos of server, virtualization, storage and networking into one integrated solution and unifies private and public cloud into a single software fabric. Our software delivers the agility, scalability and pay-as-you-grow economics of the public cloud, while addressing enterprise requirements of application mobility, security, data integrity and control. We provide our customers with the flexibility to selectively utilize the public cloud for suitable workloads and specific use cases by enabling increasing levels of application mobility across private and public clouds. We have combined advanced web-scale technologies with elegant consumer-grade design to deliver a powerful enterprise cloud operating system that elevates IT organizations by enabling them to focus on the applications and services that power their businesses. Our invisible infrastructure provides constant availability and low-touch management, enables application mobility across computing environments and reduces inefficiencies in IT planning.
Our solution can be delivered either as an appliance that is configured to order or as software only. When end-customers purchase our operating system, they typically also purchase one or more years of support and maintenance in order to receive software upgrades, bug fixes and parts replacement. Product revenue is generated primarily from the sales of our solution, and is generally recognized upon shipment. Support and other services revenue is derived from the related support and maintenance contracts, and is recognized ratably over the term of the support contracts.
We had a broad and diverse base of 7,051 end-customers as of July 31, 2017, including approximately 559 Global 2000 enterprises. Since shipping our first product in fiscal 2012, our end-customer base has grown rapidly. The number of end-customers grew from 3,768 as of July 31, 2016 to 7,051 as of July 31, 2017. Our operating system is primarily sold through channel partners, including distributors and resellers, and delivered directly to our end-customers. A major part of our sales and marketing investment is to educate our end-customers about the benefits of our solution, particularly as we continue to pursue large enterprises and mission critical workloads. Our solutions serve a broad range of workloads, including enterprise applications, databases, virtual desktop infrastructure, or VDI, unified communications and big data analytics and we have recently announced the capability to support both virtualized and non-virtualized applications. We have end-customers across a broad range of industries, such as automotive, consumer goods, education, energy, financial services, healthcare, manufacturing, media, public sector, retail, technology and telecommunications. We also sell to service providers, who utilize our operating system to provide a variety of cloud-based services to their customers.
We have invested heavily in the growth of our business, including the development of our solutions, build-out of our global sales force and the acquisitions of Calm.io Pte. Ltd., or Calm, and PernixData, Inc., or PernixData, during the first quarter of fiscal 2017. The number of our full-time employees increased from 1,980 as of July 31, 2016 to 2,813 as of July 31, 2017. We have recruited an engineering team focused on distributed systems and IT infrastructure technologies at our San Jose, California headquarters and at our research and development centers in Bangalore, India, Durham, North Carolina and Seattle, Washington. We have also expanded our international sales and marketing presence by continuing to build out our global teams. We intend to continue to invest in our global engineering team to enhance the functionality of our operating system, introduce new products and features and build upon our technology leadership, as well as continue to expand our global sales and marketing teams.
46
Our total revenue was $444.9 million and $766.9 million for fiscal 2016 and fiscal 2017, respectively, representing year-over-year growth of 72.4%. Our net losses were $168.5 million and $458.0 million for fiscal 2016 and fiscal 2017, respectively. Net cash generated from operations was $3.6 million and $13.8 million for fiscal 2016 and fiscal 2017, respectively. Free cash flow was an outflow of $38.7 million and $36.4 million for fiscal 2016 and fiscal 2017, respectively. As of July 31, 2017, we had an accumulated deficit of $899.8 million.
Initial Public Offering
In October 2016, we completed our initial public offering, or IPO, of Class A common stock, in which we sold 17,100,500 shares, including 2,230,500 shares pursuant to the underwriters’ over-allotment option. The shares were sold at an IPO price of $16.00 per share for net proceeds of $254.5 million, after deducting underwriting discounts and commissions of $19.2 million. We incurred offering costs of $5.3 million.
Key Financial and Performance Metrics
We monitor the following key financial and performance metrics:
As of and for the | |||||||||||
Year Ended July 31, | |||||||||||
2015 | 2016 | 2017 | |||||||||
(Dollars in thousands) | |||||||||||
Total revenue | $ | 241,432 | $ | 444,928 | $ | 766,869 | |||||
Year-over-year percentage increase | 90 | % | 84 | % | 72 | % | |||||
Billings | $ | 308,553 | $ | 637,795 | $ | 990,467 | |||||
Gross margin percentage | 58 | % | 62 | % | 57 | % | |||||
Adjusted gross margin percentage | 59 | % | 62 | % | 59 | % | |||||
Total deferred revenue | $ | 103,598 | $ | 296,465 | $ | 526,071 | |||||
Net cash provided by (used in) operating activities | $ | (25,694 | ) | $ | 3,636 | $ | 13,822 | ||||
Free cash flow | $ | (49,002 | ) | $ | (38,658 | ) | $ | (36,359 | ) | ||
Non-GAAP operating expenses | $ | 243,179 | $ | 420,461 | 644,964 | ||||||
Total end-customers | 1,799 | 3,768 | 7,051 | ||||||||
Non-GAAP Financial Measures and Key Performance Measures
We regularly monitor billings, adjusted gross margin percentage, free cash flow and non-GAAP operating expenses, which are non-GAAP financial measures and key performance measures, to help us evaluate our growth and operational efficiencies, measure our performance and identify trends in our sales activity, and establish our budgets. We evaluate these measures because they:
• | are used by our management and board of directors to understand and evaluate our performance and trends as well as provide a useful measure for period-to-period comparisons of our core business; |
• | are widely used by investors and other parties in understanding and evaluating companies in our industry as a measure of financial performance; and |
• | are used by management to prepare and approve our annual budget and to develop short-term and long-term operational and compensation plans, as well as to assess the extent of achievement of goals. |
47
Billings is a performance measure which our management believes provides useful information to investors because it represents the amounts under binding purchase orders received by us during a given period that have been billed. Free cash flow is a performance measure that our management believes provides useful information to management and investors about the amount of cash (used in) generated by the business after necessary capital expenditures. We use these non-GAAP financial and key performance measures for financial and operational decision-making and as a means to evaluate period-to-period comparisons. Our management believes that these non-GAAP financial and key performance measures provide meaningful supplemental information regarding our performance and liquidity by excluding certain expenses and expenditures such as stock-based compensation expense that may not be indicative of our ongoing core business operating results. Billings, adjusted gross margin percentage, free cash flow and non-GAAP operating expenses have limitations as analytical tools, and you should not consider them in isolation or as substitutes for analysis of our results as reported under GAAP. Billings, adjusted gross margin percentage, free cash flow and non-GAAP operating expenses are not substitutes for total revenue, gross margin percentage, cash (used in) provided by operating activities, or GAAP operating expenses, respectively. In addition, other companies, including companies in our industry, may calculate non-GAAP financial measures and key performance measures differently or may use other measures to evaluate their performance, all of which could reduce the usefulness of our non-GAAP financial measures and key performance measures as tools for comparison. We urge you to review the reconciliation of our non-GAAP financial measures and key performance measures to the most directly comparable GAAP financial measures included below, and not to rely on any single financial measure to evaluate our business.
We calculate our non-GAAP measures as follows:
Billings—We calculate billings by adding the change in deferred revenue (net of acquisitions) between the start and end of the period to total revenue recognized in the same period.
Adjusted gross margin percentage—We calculate adjusted gross margin percentage as adjusted gross profit divided by total revenue. We define adjusted gross profit as our gross profit adjusted to exclude stock-based compensation and amortization of acquired intangible assets. Our presentation of adjusted gross margin percentage should not be construed as implying that our future results will not be affected by any recurring expenses or any unusual or non-recurring items that we exclude from our calculation of this non-GAAP financial measure.
Free cash flow—We calculate free cash flow as net cash (used in) provided by operating activities adjusted with purchases of property and equipment, which measures our ability to generate cash from our business operations after our capital expenditures.
Non-GAAP operating expenses—We define non-GAAP operating expenses as operating expenses adjusted to exclude stock-based compensation and the related income tax impact and costs associated with business acquisitions (such as amortization of acquired intangible assets, revaluation of contingent consideration, income tax related impact, and other acquisition-related costs). Our presentation of non-GAAP operating expenses should not be construed as implying that our future results will not be affected by any recurring expenses or any unusual or non-recurring items that we exclude from our calculation of this non-GAAP financial measure.
48
The following table presents a reconciliation of billings, adjusted gross margin percentage, free cash flow and non-GAAP operating expenses to the most directly comparable GAAP financial measures, for each of the periods indicated:
Year Ended July 31, | |||||||||||
2015 | 2016 | 2017 | |||||||||
(Dollars in thousands) | |||||||||||
Total revenue | $ | 241,432 | $ | 444,928 | $ | 766,869 | |||||
Change in deferred revenue (net of acquisitions) | 67,121 | 192,867 | 223,598 | ||||||||
Billings (non-GAAP) | $ | 308,553 | $ | 637,795 | $ | 990,467 | |||||
Gross profit | $ | 140,473 | $ | 274,141 | $ | 439,538 | |||||
Stock-based compensation | 1,081 | 1,359 | 13,477 | ||||||||
Amortization of intangible assets | — | — | 1,314 | ||||||||
Adjusted gross profit (non-GAAP) | $ | 141,554 | $ | 275,500 | $ | 454,329 | |||||
Gross margin percentage | 58 | % | 62 | % | 57 | % | |||||
Stock-based compensation | 1 | % | — | % | 2 | % | |||||
Amortization of intangibles | — | % | — | % | — | % | |||||
Adjusted gross margin percentage (non-GAAP) | 59 | % | 62 | % | 59 | % | |||||
Net cash provided by (used in) operating activities | $ | (25,694 | ) | $ | 3,636 | $ | 13,822 | ||||
Purchases of property and equipment | (23,308 | ) | (42,294 | ) | (50,181 | ) | |||||
Free cash flow (non-GAAP) | $ | (49,002 | ) | $ | (38,658 | ) | $ | (36,359 | ) | ||
Operating expenses | $ | 259,238 | $ | 439,158 | $ | 866,489 | |||||
Stock-based compensation | (16,059 | ) | (18,697 | ) | (218,014 | ) | |||||
Change in fair value of contingent consideration | — | — | (1,924 | ) | |||||||
Amortization of intangible assets | — | — | (915 | ) | |||||||
Business acquisition-related costs | — | — | (672 | ) | |||||||
non-GAAP operating expenses | $ | 243,179 | $ | 420,461 | $ | 644,964 | |||||
Factors Affecting Our Performance
We believe that our future success will depend on many factors, including those described below. While these areas present significant opportunity, they also present risks that we must manage to achieve successful results. See the section titled “Risk Factors”. If we are unable to address these challenges, our business and operating results could be adversely affected.
49
Investment in Growth
We plan to continue to invest in sales and marketing so that we can capitalize on our market opportunity, and as part of this, we intend to specifically expand our focus on opportunities with major accounts and large deals, which we define as transactions over $500,000 in committed value. We have significantly increased our sales and marketing personnel, which grew by 42% from July 31, 2016 to July 31, 2017. We estimate, based on past experience, that sales team members typically become fully ramped around the time of the start of their fourth quarter of employment with us, and as our newer employees ramp up, we expect their increased productivity to contribute to our revenue growth. As of July 31, 2017, we considered 59% of our global sales team members to be fully productive, while the remaining 41% of our global sales team members are in the process of ramping up. As we shift the focus of some of our new and existing sales team members to major accounts and large deals, it may take longer for these sales team members to become fully productive, and there may also be an impact to the overall productivity of our sales team. We are focused on actively managing this realignment, and expect continuing improvement over the coming quarters. We intend to continue to grow our global sales and marketing team to acquire new end-customers and to increase sales to existing end-customers.
We also intend to continue to grow our research and development and global engineering team to enhance our solutions, improve integration with new and existing ecosystem partners, and broaden the range of IT infrastructure technologies that we converge into our operating system. We believe that these investments will contribute to our long-term growth, although they may adversely affect our profitability in the near term.
Market Adoption of Our Products
The public cloud has changed IT buyer expectations about the simplicity, agility, scalability and pay-as-you-grow economics of IT resources, which represent a major architectural shift and business model evolution. A key focus of our sales and marketing efforts is creating market awareness about the benefits of our operating system, both as compared to traditional data center architectures as well as the public cloud, particularly as we continue to pursue large enterprises and mission critical workloads. The broad nature of the technology shift that our operating system represents and the relationships our end-customers have with existing IT vendors sometimes lead to unpredictable sales cycles, which we hope to compress and stabilize as market adoption increases, as we gain leverage with our channel partners and as our sales and marketing efforts expand. Our business and operating results will be significantly affected by the degree to and speed with which organizations adopt our operating system.
Leveraging Channel and OEM Partners
We plan to continue to strengthen and expand our network of channel and OEM partners to increase sales to both new and existing end-customers. We believe that increasing channel leverage by investing aggressively in sales enablement and co-marketing with our partners will extend and improve our engagement with a broad set of end-customers. Our business and results of operations will be significantly affected by our success in leveraging and expanding our network of channel and OEM partners.
Continued Purchases and Upgrades within Existing Customer Base
Our end-customers typically deploy our technology for a specific workload initially. After a new end-customer's initial order, which includes the product and associated maintenance, support and services, we focus on expanding our footprint by serving more workloads. We also generate recurring revenue from our support and maintenance renewals. We view continued purchases and upgrades as critical drivers of our success, as the sales cycles are typically shorter compared to new end-customer deployments and selling efforts are typically less. As of July 31, 2017, approximately 74% of our end-customers who have been with us for 18 months or more have made a repeat purchase, which is defined as any purchase activity, including support and maintenance renewals, subsequent to the initial purchase. Additionally, end-customers who have been with us for 18 months or more have total lifetime orders (which includes the initial order) to date in an amount that is more than 4.8x greater, on average, than their initial order. This number increases to approximately 8.1x, on average, for our 559 Global 2000 end-customers and to more than 18.8x, on average, for our top 25 end-customers as of July 31, 2017. The multiples exclude the effect of one end-customer who had a very large and irregular purchase pattern that we believe is not representative of the purchase patterns of all our other end-customers. Our business and operating results will depend on our ability to sell additional products to our current existing and future base of end-customers.
50
Changes in Product Mix and Associated Accounting Impact
Shifts in the mix of whether our solutions are sold as an appliance or as software-only could result in fluctuations in our revenue and gross margins. Software-only sales typically reflect higher gross margins and lower revenue in a given period, since the sale does not include the revenue or cost of the hardware components in an appliance. When we sell our solution as an appliance, the revenue for the appliance and the basic version of our software included in the appliance is generally recognized upon delivery, whereas revenue from software-only transactions is only recognized upon delivery to the extent we have established vendor specific objective evidence, or VSOE, of the fair value of the related maintenance and support contracts, otherwise revenue for the entire arrangement is deferred and recognized over the term of our maintenance and support contracts. Historically, most of our solutions have been delivered on an appliance, and, as a result, most of our historical product revenue has been recognized upon delivery. However, we anticipate that to the extent that broad market adoption of our solutions continues to increase, there may be an increase in the delivery of our software licenses on separately procured hardware. For additional information on our revenue recognition and VSOE, please see the section titled “Critical Accounting Estimates” later in this “Management’s Discussion and Analysis of Financial Condition and Results of Operations” section.
Revenue from Contracts with Customers
In May 2014, the Financial Accounting Standards Board, or FASB, issued ASU 2014-09, Revenue from Contracts with Customers (ASC 606). The standard is a comprehensive new revenue recognition model that will be effective for us beginning August 1, 2018, and permits us the ability to early adopt on August 1, 2017. The standard permits two methods of adoption: retrospectively to each prior reporting period presented (full retrospective method), or retrospectively with the cumulative effect of initially applying the guidance recognized at the date of initial application (the cumulative catch-up transition method).
The new standard would have been effective for us beginning in August 1, 2018, however, we elected to early adopt the standard effective August 1, 2017 using the full retrospective method, which requires us to restate our historical financial information for fiscal 2016 and 2017 to be consistent with the standard. The most significant impact of the standard relates to the timing of revenue recognition for certain software licenses sold with post contract support, or PCS, for which we do not have VSOE under current guidance. Under the new standard the requirement to have VSOE for undelivered elements is eliminated and we will recognize revenue for such software licenses upon transfer of control to our customers. In addition, the adoption of ASC 606 will also result in differences in the timing of recognition of contract costs, such as sales commissions, as well as the corresponding impacts to provision for income taxes.
The adoption of the standard will result in the recognition of additional revenue of $58.5 million and $79.0 million for fiscal 2016 and fiscal 2017, respectively, an increase in gross profit of $58.5 million and $79.0 million in fiscal 2016 and fiscal 2017, respectively, a decrease in sales and marketing expense of $1.9 million in fiscal 2016 and an increase in sales and marketing expense of $0.5 million in fiscal 2017, and a decrease in loss from operations of $60.4 million in fiscal 2016 and $78.5 million in fiscal 2017. In addition, the adoption of the standard will result in a decrease in total net deferred revenue of $78.0 million and $157.0 million as of July 31, 2016 and 2017, respectively, driven by the upfront recognition of software licenses sold with PCS for which we do not have VSOE, and an increase in total deferred commissions of $12.6 million and $12.1 million as of July 31, 2016 and 2017, respectively, which will be recognized in sales and marketing expense in future periods. The adoption of the standard will have no significant impact to the provision for income taxes and will have no impact to cash from or used in operating, investing, or financing on our consolidated statements of cash flows. For additional information on the expected impacts to reported results, see Note 2 of Part II, Item 8 of this Annual Report on Form 10-K.
51
Components of Our Results of Operations
Our results of operations for fiscal 2017 include (i) stock-based compensation related to stock awards with performance conditions, referred to as the performance stock awards, due to our IPO and (ii) the impact of the Calm and PernixData acquisitions, which closed during the first quarter of fiscal 2017. No expense associated with the performance stock awards was recorded prior to our IPO, as the qualifying event (IPO) had not been deemed probable (see Note 11 of Part II, Item 8 of this Annual Report on Form 10-K). Beginning in fiscal 2014, we began granting performance stock awards with vesting subject to (i) continuous service with us and (ii) satisfaction of one or more performance conditions (a liquidity event or both a liquidity event and certain performance targets). As a result of our IPO, we began to recognize stock-based compensation expense related to the performance stock awards during the three months ended October 31, 2016 as the performance condition, a liquidity event or IPO, was deemed probable of achievement.
Revenue
Product revenue. We generate our product revenue from the sales of our solutions, delivered both on a hardware appliance as well as software-only. Our revenue from software-only sales, which currently constitute a small portion of our product revenue, is subject to industry-specific software revenue recognition guidance and has typically been deferred and recognized over the contractual support period associated with the delivered software licenses. However, revenue associated with certain software licenses can be recognized upon delivery to our end-customers to the extent we have established VSOE for related support and other services.
Support and other services revenue. We generate our support and other services revenue primarily from support and maintenance contracts, and, to a lesser extent, from professional services. The majority of our product sales are sold in conjunction with support and maintenance contracts with terms ranging from one to five years. We recognize revenue from support and maintenance contracts over the contractual service period. We recognize revenue related to professional services as they are performed.
Cost of Revenue
Cost of product revenue. Cost of product revenue consists of costs paid to third-party contract manufacturers, which includes hardware costs, personnel costs (consisting of salaries, benefits, bonuses and stock-based compensation) associated with our operations function and allocated costs (which consist of certain facilities, depreciation and amortization, recruiting, and information technology costs allocated based on headcount). We expect our cost of product revenue to increase in absolute dollars as our product revenue increases.
Cost of support and other services revenue. Cost of support and other services revenue includes personnel and operating costs associated with our global customer support organization as well as allocated costs. We expect our cost of support and other services revenue to increase in absolute dollars as our support and other services revenue increases.
Operating Expenses
Our operating expenses consist of sales and marketing, research and development, and general and administrative expenses. The largest component of our operating expenses is personnel costs. Personnel costs consist of wages, benefits, bonuses, and, with respect to sales and marketing expenses, sales commissions. Personnel costs also include stock-based compensation expense.
Sales and marketing. Sales and marketing expense consists primarily of personnel costs. Sales and marketing expense also includes sales commissions, costs for promotional activities and other marketing costs, travel costs, and costs associated with demonstration units, including depreciation and allocated costs. Commissions are deferred and recognized as we recognize the associated revenue. We expect sales and marketing expense to continue to increase in absolute dollars as we increase the size of our global sales and marketing organizations. Our sales and marketing expense may fluctuate as a percentage of total revenue.
52
Research and development. Research and development expense primarily consists of personnel costs, as well as other direct and allocated costs. We have devoted our product development efforts primarily to enhancing the functionality and expanding the capabilities of our solutions. Research and development costs are expensed as incurred. We expect research and development expense to increase in absolute dollars as we continue to invest in our future products and services, although our research and development expense may fluctuate as a percentage of total revenue.
General and administrative. General and administrative expense consists primarily of personnel costs, which include our executive, finance, human resources and legal organizations. General and administrative expense also includes outside professional services, which consists primarily of legal, accounting and other consulting costs, as well as insurance and other costs associated with being a public company and allocated costs. We expect general and administrative expense to increase in absolute dollars particularly due to additional legal, accounting, insurance and other costs associated with both our growth and operating as a public company, although our general and administrative expense may fluctuate as a percentage of total revenue.
Other Income (Expense)—net
Other income (expense)—net consists primarily of interest income and expense, foreign exchange gains or losses and gains or losses on investments. Upon the completion of our IPO, we reclassified the convertible preferred stock warrants, which, prior to our IPO, were classified as a liability on our consolidated balance sheet and re-measured to fair value at each balance sheet date with the corresponding changes in fair value recorded as other expense, into warrants to purchase Class B common stock. As a result, the convertible preferred stock liability was re-measured to its then fair value, which was based on the closing per share price of our Class A common stock on October 4, 2016, and reclassified to additional paid-in capital. Subsequent to the conversion of our convertible preferred stock warrants in connection with our IPO, we no longer remeasure them at fair value or incur any charges related to changes in fair value. In addition, during the three months ended October 31, 2016, we fully repaid our outstanding $75.0 million of senior notes due April 15, 2019, or the senior notes, and incurred a loss on debt extinguishment.
Provision for Income Taxes
Provision for income taxes consists primarily of income taxes in certain foreign jurisdictions in which we conduct business and state income taxes in the United States. We have recorded a full valuation allowance related to our federal and state net operating losses and other net deferred tax assets due to the uncertainty of the ultimate realization of the future benefits of those assets.
53
Results of Operations
The following tables set forth our consolidated results of operations in dollars and as a percentage of total revenue for the years presented:
Fiscal Year Ended July 31, | |||||||||||
2015 | 2016 | 2017 | |||||||||
(In thousands) | |||||||||||
Consolidated Statements of Operations Data: | |||||||||||
Revenue: | |||||||||||
Product | $ | 200,833 | $ | 350,798 | $ | 583,011 | |||||
Support and other services | 40,599 | 94,130 | 183,858 | ||||||||
Total revenue | 241,432 | 444,928 | 766,869 | ||||||||
Cost of revenue: | |||||||||||
Product(1) (2) | 80,900 | 133,541 | 249,393 | ||||||||
Support and other services(1) | 20,059 | 37,246 | 77,938 | ||||||||
Total cost of revenue | 100,959 | 170,787 | 327,331 | ||||||||
Gross profit | 140,473 | 274,141 | 439,538 | ||||||||
Operating expenses: | |||||||||||
Sales and marketing(1) (2) | 161,829 | 288,493 | 500,529 | ||||||||
Research and development(1) | 73,510 | 116,400 | 288,619 | ||||||||
General and administrative(1) | 23,899 | 34,265 | 77,341 | ||||||||
Total operating expenses | 259,238 | 439,158 | 866,489 | ||||||||
Loss from operations | (118,765 | ) | (165,017 | ) | (426,951 | ) | |||||
Other expense—net | (5,818 | ) | (1,290 | ) | (26,377 | ) | |||||
Loss before provision for income taxes | (124,583 | ) | (166,307 | ) | (453,328 | ) | |||||
Provision for income taxes | 1,544 | 2,192 | 4,683 | ||||||||
Net loss | $ | (126,127 | ) | $ | (168,499 | ) | $ | (458,011 | ) | ||
54
(1) | Includes stock-based compensation expense as follows: |
Fiscal Year Ended July 31, | |||||||||||
2015 | 2016 | 2017 | |||||||||
(In thousands) | |||||||||||
Cost of revenue: | |||||||||||
Product | $ | 363 | $ | 391 | $ | 3,066 | |||||
Support and other services | 718 | 968 | 10,411 | ||||||||
Total cost of revenue | 1,081 | 1,359 | 13,477 | ||||||||
Sales and marketing | 6,474 | 8,006 | 78,117 | ||||||||
Research and development | 5,411 | 6,259 | 109,044 | ||||||||
General and administrative | 4,174 | 4,432 | 30,853 | ||||||||
Total stock-based compensation expense | $ | 17,140 | $ | 20,056 | $ | 231,491 | |||||
(2) Includes amortization of intangible assets as follows:
Fiscal Year Ended July 31, | |||||||||||
2015 | 2016 | 2017 | |||||||||
(In thousands) | |||||||||||
Product cost of revenue | $ | — | $ | — | $ | 1,314 | |||||
Sales and marketing | — | — | 915 | ||||||||
Total amortization of intangible assets | $ | — | $ | — | $ | 2,229 | |||||
55
Fiscal Year Ended July 31, | ||||||||
2015 | 2016 | 2017 | ||||||
(As a percentage of total revenue) | ||||||||
Consolidated Statements of Operations Data: | ||||||||
Revenue: | ||||||||
Product | 83 | % | 79 | % | 76 | % | ||
Support and other services | 17 | 21 | 24 | |||||
Total revenue | 100 | 100 | 100 | |||||
Cost of revenue: | ||||||||
Product | 34 | 30 | 33 | |||||
Support and other services | 8 | 8 | 10 | |||||
Total cost of revenue | 42 | 38 | 43 | |||||
Gross profit | 58 | 62 | 57 | |||||
Operating expenses: | ||||||||
Sales and marketing | 67 | 65 | 65 | |||||
Research and development | 30 | 26 | 38 | |||||
General and administrative | 10 | 8 | 10 | |||||
Total operating expenses | 107 | 99 | 113 | |||||
Loss from operations | (49 | ) | (37 | ) | (56 | ) | ||
Other expense—net | (2 | ) | — | (3 | ) | |||
Loss before provision for income taxes | (51 | ) | (37 | ) | (59 | ) | ||
Provision for income taxes | 1 | 1 | 1 | |||||
Net loss | (52 | )% | (38 | )% | (60 | )% | ||
56
Revenue
Fiscal Year Ended July 31, | |||||||||||||||||||||||||||||
2015 | 2016 | $ Change | % Change | 2016 | 2017 | $ Change | % Change | ||||||||||||||||||||||
(In thousands, except percentages) | |||||||||||||||||||||||||||||
Product | $ | 200,833 | $ | 350,798 | $ | 149,965 | 75 | % | $ | 350,798 | $ | 583,011 | $ | 232,213 | 66 | % | |||||||||||||
Support and other services | 40,599 | 94,130 | 53,531 | 132 | % | 94,130 | 183,858 | 89,728 | 95 | % | |||||||||||||||||||
Total revenue | $ | 241,432 | $ | 444,928 | $ | 203,496 | 84 | % | $ | 444,928 | $ | 766,869 | $ | 321,941 | 72 | % | |||||||||||||
Total revenue by bill-to-location was as follows:
Fiscal Year Ended July 31, | |||||||||||||||||||||||||||||
2015 | 2016 | $ Change | % Change | 2016 | 2017 | $ Change | % Change | ||||||||||||||||||||||
(In thousands, except percentages) | |||||||||||||||||||||||||||||
U.S. | $ | 161,439 | $ | 280,800 | $ | 119,361 | 74 | % | $ | 280,800 | $ | 462,770 | $ | 181,970 | 65 | % | |||||||||||||
Europe, the Middle East and Africa | 43,526 | 81,320 | 37,794 | 87 | % | 81,320 | 139,170 | 57,850 | 71 | % | |||||||||||||||||||
Asia-Pacific | 28,386 | 63,610 | 35,224 | 124 | % | 63,610 | 131,921 | 68,311 | 107 | % | |||||||||||||||||||
Other Americas | 8,081 | 19,198 | 11,117 | 138 | % | 19,198 | 33,008 | 13,810 | 72 | % | |||||||||||||||||||
Total revenue | $ | 241,432 | $ | 444,928 | $ | 203,496 | 84 | % | $ | 444,928 | $ | 766,869 | $ | 321,941 | 72 | % | |||||||||||||
Product revenue increased year-over-year for both fiscal 2016 and fiscal 2017. The increase in product revenue reflects increased domestic and international demand for our solution as we continue our penetration and expansion in global markets through increased sales and marketing activities. Our total end-customer count increased from 1,799 as of July 31, 2015 to 3,768 as of July 31, 2016 and to 7,051 as of July 31, 2017.
Support and other services revenue increased year-over-year for both fiscal 2016 and fiscal 2017 in conjunction with the growth of our established base of end-customers with support and software maintenance contracts.
Cost of Revenue and Gross Margin
Fiscal Year Ended July 31, | |||||||||||||||||||||||||||||
2015 | 2016 | $ Change | % Change | 2016 | 2017 | $ Change | % Change | ||||||||||||||||||||||
(In thousands, except percentages) | |||||||||||||||||||||||||||||
Cost of product revenue | $ | 80,900 | $ | 133,541 | $ | 52,641 | 65 | % | $ | 133,541 | $ | 249,393 | $ | 115,852 | 87 | % | |||||||||||||
Product gross margin | 60 | % | 62 | % | 62 | % | 57 | % | |||||||||||||||||||||
Cost of support and other revenue | $ | 20,059 | $ | 37,246 | $ | 17,187 | 86 | % | $ | 37,246 | $ | 77,938 | $ | 40,692 | 109 | % | |||||||||||||
Support and other services gross margin | 51 | % | 60 | % | 60 | % | 58 | % | |||||||||||||||||||||
Total gross margin percentage | 58 | % | 62 | % | 62 | % | 57 | % | |||||||||||||||||||||
57
Cost of product revenue
The increase in cost of product revenue in fiscal 2016 compared to fiscal 2015 was primarily due to the corresponding year-over-year increase in product sales. The increase in cost of product revenue in fiscal 2017 compared to fiscal 2016 was mainly due to the corresponding year-over-year increase in product sales, an increase in stock-based compensation expense of $2.7 million as a result of our IPO, and the $1.3 million amortization of intangible assets related to our business acquisitions in fiscal 2017. Additionally, starting in the second quarter of fiscal 2017, the cost of certain of our hardware components, specifically DRAM and NAND, increased due to supply constraints.
Product gross margin increased from 60% in fiscal 2015 to 62% in fiscal 2016 primarily due to cost savings achieved from our procurement process, and changes in product mix. Product gross margin decreased from 62% in fiscal 2016 to 57% in fiscal 2017 primarily due to an increase in stock-based compensation expense and an increase in amortization of intangible assets. This was partially offset by cost savings achieved in our procurement process, and changes in product mix. We expect to see continued pressure on the costs of DRAM and NAND as a result of continued supply constraints in fiscal 2018 and we expect these costs to continue to increase so long as the DRAM and NAND markets remain supply constrained.
Cost of support and other services revenue
The increase in cost of support and other services revenue was primarily due to higher personnel costs of our global customer support organization, as our customer support and services headcount increased in order to support our growing end-customer base.
Cost of support and other services revenue increased year-over-year for both fiscal 2016 and 2017 primarily due to higher personnel costs from our global customer support organization, resulting from increases in our customer support and services headcount of 113% from July 31, 2015 to July 31, 2016 and 62% from July 31, 2016 to July 31, 2017. The increase in cost of support and other services revenue in fiscal 2017 was also driven by a $9.4 million year-over-year increase in stock-based compensation expense as a result of our IPO.
Support and other services gross margin in fiscal 2016 improved compared to fiscal 2015 as we continued to gain leverage from our support organization. Support and other services gross margin in fiscal 2017 decreased compared to fiscal 2016 primarily due to higher stock-based compensation expense mentioned above.
Operating Expenses
Sales and marketing
Fiscal Year Ended July 31, | |||||||||||||||||||||||||||||
2015 | 2016 | $ Change | % Change | 2016 | 2017 | $ Change | % Change | ||||||||||||||||||||||
(In thousands, except percentages) | |||||||||||||||||||||||||||||
Sales and marketing | $ | 161,829 | $ | 288,493 | $ | 126,664 | 78 | % | $ | 288,493 | $ | 500,529 | $ | 212,036 | 73 | % | |||||||||||||
Percent of total revenue | 67 | % | 65 | % | 65 | % | 65 | % | |||||||||||||||||||||
Sales and marketing expense increased year-over-year both for fiscal 2016 and 2017 primarily due to higher personnel costs and sales commissions, as our sales and marketing headcount increased year-over-year by 70% in fiscal 2016 and 42% in fiscal 2017. The year-over-year increase in fiscal 2017 in sales and marketing personnel costs includes a $70.1 million increase in stock-based compensation expense as a result of our IPO. Additionally, as part of our efforts to penetrate and expand in global markets, we have continually increased our marketing activities related to brand awareness, promotions, trade shows and partner programs.
58
Research and development
Fiscal Year Ended July 31, | |||||||||||||||||||||||||||||
2015 | 2016 | $ Change | % Change | 2016 | 2017 | $ Change | % Change | ||||||||||||||||||||||
(In thousands, except percentages) | |||||||||||||||||||||||||||||
Research and development | $ | 73,510 | $ | 116,400 | $ | 42,890 | 58 | % | $ | 116,400 | $ | 288,619 | $ | 172,219 | 148 | % | |||||||||||||
Percent of total revenue | 30 | % | 26 | % | 26 | % | 38 | % | |||||||||||||||||||||
Research and development expense increased year-over-year both for fiscal 2016 and 2017 primarily due to higher personnel costs as our research and development headcount increased year-over-year by 59% in fiscal 2016 and 40% (inclusive of the additional headcount from the PernixData and Calm acquisitions) in fiscal 2017, as we have continued the expansion of our product development activities. The year-over-year increase in fiscal 2017 in research and development personnel costs includes a $102.8 million increase in stock-based compensation expense as a result of our IPO.
General and administrative
Fiscal Year Ended July 31, | |||||||||||||||||||||||||||||
2015 | 2016 | $ Change | % Change | 2016 | 2017 | $ Change | % Change | ||||||||||||||||||||||
(In thousands, except percentages) | |||||||||||||||||||||||||||||
General and administrative | $ | 23,899 | $ | 34,265 | $ | 10,366 | 43 | % | $ | 34,265 | $ | 77,341 | $ | 43,076 | 126 | % | |||||||||||||
Percent of total revenue | 10 | % | 8 | % | 8 | % | 10 | % | |||||||||||||||||||||
General and administrative expense increased year-over-year both for fiscal 2016 and 2017 primarily due to higher personnel costs as our general and administrative headcount increased year-over-year by 51% in fiscal 2016 and 24% in fiscal 2017 in order to support our growing operations and international footprint, as well as costs associated with being a public company. The year-over-year increase in fiscal 2017 in general and administrative personnel costs includes a $26.4 million increase in stock-based compensation expense as a result of our IPO.
Other expense—net
Fiscal Year Ended July 31 | |||||||||||||||||||||||||||||
2015 | 2016 | $ Change | % Change | 2016 | 2017 | $ Change | % Change | ||||||||||||||||||||||
(In thousands, except percentages) | |||||||||||||||||||||||||||||
Other expense-net | $ | (5,818 | ) | $ | (1,290 | ) | $ | 4,528 | (78 | )% | $ | (1,290 | ) | $ | (26,377 | ) | $ | (25,087 | ) | 1,945 | % | ||||||||
The year-over-year decrease in other expense—net in fiscal 2016 was primarily due to $8.2 million of higher charges related to the change in fair value of our convertible preferred stock warrant liability in fiscal 2015 compared to fiscal 2016, partially offset by a $2.3 million increase in interest expense from the issuance of the senior notes in fiscal 2016 and a $1.5 million increase in net foreign currency losses in fiscal 2016 compared to fiscal 2015.
The year-over-year increase in other expense-net in fiscal 2017 was primarily due to $23.1 million of higher charges resulting from changes in the fair value of our convertible preferred stock warrant liability and $3.3 million loss on debt extinguishment resulting from early extinguishment of our senior notes.
59
Provision for income taxes
Fiscal Year Ended July 31, | |||||||||||||||||||||||||||||
2015 | 2016 | $ Change | % Change | 2016 | 2017 | $ Change | % Change | ||||||||||||||||||||||
(In thousands, except percentages) | |||||||||||||||||||||||||||||
Provision for income taxes | $ | 1,544 | $ | 2,192 | $ | 648 | 42 | % | $ | 2,192 | $ | 4,683 | $ | 2,491 | 114 | % | |||||||||||||
The year-over-year increase in the provision for income taxes in fiscal 2017 was primarily due to increases in foreign taxes as a result of higher taxable earnings in foreign jurisdictions as we continued our global expansion, partially offset by a $1.5 million partial release of the U.S. valuation allowance from the PernixData acquisition. The net deferred tax liability from the PernixData acquisition provided an additional source of taxable income to support the realizability of the pre-existing deferred tax assets and, as a result, we released a portion of the U.S. deferred tax asset valuation allowance. We continue to maintain full valuation allowance on our U.S. federal and state deferred tax assets.
The year-over-year increase in the provision for income taxes in fiscal 2016 was primarily due to higher foreign taxes as a result of higher taxable earnings in foreign jurisdictions as we continued to expand globally.
Liquidity and Capital Resources
As of July 31, 2017, we had $138.4 million of cash and cash equivalents and $210.7 million of short-term investments.
Prior to our IPO, we satisfied our liquidity needs primarily through the sale of convertible preferred stock, senior notes, borrowings from our credit facilities and proceeds from the exercise of stock options. In October 2016, we completed our IPO of Class A common stock and received net proceeds of $254.5 million after deducting underwriting discounts and commissions of $19.2 million, but before deducting offering costs of $5.3 million. Additionally, in September 2016, we fully repaid the outstanding balance of our senior notes. As of July 31, 2017, we did not have any outstanding borrowings.
As discussed above, we have previously granted performance stock awards with vesting subject to satisfaction of one or more performance conditions, including a liquidity event condition tied to our IPO. Certain of those performance stock awards began to vest during the three months ending April 30, 2017, and, subject to the terms of the underlying awards, will continue to vest periodically thereafter. In February 2017, we changed the method by which withholding taxes resulting from the vesting of such performance stock awards held by our executive officers would be covered to be consistent with that of the rest of our employee population. As a result, in addition to our general employee population being required to sell a portion of the shares that they receive upon vesting of their performance stock awards in order to cover any required withholding taxes, or sell-to-cover, our executive officers will now also be required to fund any withholding taxes resulting from the vesting of their performance stock awards through a sell-to-cover, as opposed to our previous approach of retaining a number of shares with a value equal to the amount of the tax and remitting cash to the appropriate taxing authorities, or net share settlement. The sell-to-cover approach allows us to avoid the large cash outflows that would have otherwise been required to satisfy withholding tax obligations resulting from the vesting of performance stock awards, including those held by our executive officers, under the net share settlement approach. In addition, as compared to the net share settlement approach, sell-to-cover will result in more shares being issued into the market as employees’ performance stock awards vest, thereby increasing the dilutive impact of our share-based compensation programs on shareholders.
We believe that our cash and cash equivalents and short-term investments will be sufficient to meet our anticipated cash needs for working capital and capital expenditures for at least the next 12 months. Our future capital requirements will depend on many factors, including our growth rate, the timing and extent of spending to support development efforts, the expansion of sales and marketing activities, the introduction of new and enhanced product and service offerings, and the continuing market acceptance of our products. In the event that additional financing is required from outside sources, we may not be able to raise such financing on terms acceptable to us or at all. If we are unable to raise additional capital when desired, our business, operating results, and financial condition would be adversely affected.
60
Cash Flows
The following table summarizes our cash flows for the periods presented:
Fiscal Year Ended July 31, | |||||||||||
2015 | 2016 | 2017 | |||||||||
(In thousands) | |||||||||||
Net cash (used in) provided by operating activities | $ | (25,694 | ) | $ | 3,636 | $ | 13,822 | ||||
Net cash used in investing activities | (106,667 | ) | (46,504 | ) | (176,094 | ) | |||||
Net cash provided by financing activities | 142,755 | 74,198 | 201,422 | ||||||||
Net increase in cash and cash equivalents | $ | 10,394 | $ | 31,330 | $ | 39,150 | |||||
Cash Flows from Operating Activities
Net cash generated from operating activities was $3.6 million and $13.8 million for fiscal 2016 and fiscal 2017, respectively. The generation of cash for both fiscal years was primarily due to higher billings and collections, partially offset by higher operating expenses as we continued to invest in the longer term growth of our business. The cash flow generated from fiscal 2017 included $14.4 million of withholdings related to our employee stock purchase plan.
Net cash used in operating activities for fiscal 2015 was $25.7 million compared to $3.6 million of net cash provided by operating activities for fiscal 2016. The generation in cash was primarily due to higher billings and collections, partially offset by higher operating expenses as we continued to invest in the longer term growth of our business.
Cash Flows from Investing Activities
Net cash used in investing activities of $176.1 million for fiscal 2017 was due to $242.5 million of purchases of investments using a significant portion of the proceeds from our IPO and $50.2 million of purchases of property and equipment as we continue to invest in the longer term growth of our business, partially offset by $84.2 million of maturities and $32.6 million of sales of investments.
Net cash used in investing activities of $46.5 million for fiscal 2016 was due to $106.3 million of purchases of investments and $42.3 million of purchases of property and equipment as we continue to invest in the longer term growth of our business, partially offset by $102.1 million of maturities of investments.
Net cash used in investing activities of $106.7 million for fiscal 2015 was due to $116.1 million of purchases of investments and $23.3 million of purchases of property and equipment, partially offset by $32.8 million of maturities of investments.
Cash Flows from Financing Activities
Net cash provided by financing activities of $201.4 million for the year ended July 31, 2017 was primarily due to net proceeds of $254.5 million, after deducting underwriting discounts and commission from our IPO and $32.3 million net proceeds from sales of shares through employee equity incentive plans, partially offset by $76.6 million of repayment of our senior notes including debt extinguishment costs, $7.1 million payment of debt in conjunction with the PernixData acquisition and $1.7 million of payments of IPO costs.
Net cash provided by financing activities of $74.2 million for fiscal 2016 primarily consisted of $73.3 million of net proceeds from the senior notes and $3.1 million of net proceeds from sales of shares through employee equity incentive plans, partially offset by $3.2 million in payments of IPO costs.
Net cash provided by financing activities of $142.8 million for fiscal 2015 primarily consisted of $138.3 million of net proceeds from the sale of our Series E convertible preferred stock and $4.8 million of net proceeds from sales of shares through employee equity incentive plans.
61
Debt Obligations
In April 2016, we issued an aggregate principal amount of $75.0 million of senior notes due on April 15, 2019 to Goldman Sachs Specialty Lending Group, L.P. In September 2016, we repaid the entire outstanding principal amount of the senior notes and incurred $3.3 million of loss on debt extinguishment.
Contractual Obligations
The following table summarizes our contractual obligations as of July 31, 2017:
Payments Due by Period | |||||||||||||||||||
Total | Less than 1 Year | 1 Year to 3 Years | 3 to 5 Years | More than 5 Years | |||||||||||||||
(In thousands) | |||||||||||||||||||
Contractual Obligations: | |||||||||||||||||||
Operating lease obligations | $ | 58,377 | $ | 16,304 | $ | 27,649 | $ | 12,732 | $ | 1,692 | |||||||||
Other purchase commitments(1) | 26,580 | 26,580 | — | ||||||||||||||||
Purchase commitments with contract manufacturers(2) | 72,622 | 72,622 | — | — | — | ||||||||||||||
Contingent consideration(3) | 5,690 | — | 5,690 | — | — | ||||||||||||||
Total | $ | 163,269 | $ | 115,506 | $ | 33,339 | $ | 12,732 | $ | 1,692 | |||||||||
(1) | Purchase obligations pertaining to our normal operations. |
(2) | Commitments with our contract manufacturers, which consist of obligations for on-hand inventories and non-cancelable purchase orders for certain components. |
(3) | Represents $7.5 million contingent payments, net of $1.8 million working capital adjustment, assumed in the PernixData acquisition. The amount is remeasured at fair value every reporting period with the change in fair value recorded in general and administrative expenses (see Note 3 and Note 4, of Part II, Item 8 of this Annual Report on Form 10-K). The actual amount ultimately paid out may be different depending on the level of achievement of certain operating milestones. |
As of July 31, 2017, payments related to our above outstanding non-cancellable lease obligations will be made through fiscal 2024.
From time to time, we make commitments with our contract manufacturer, which consist of obligations for on-hand inventories and non-cancelable purchase orders for non-standard components. We record a charge to cost of product sales for firm, non-cancelable and unconditional purchase commitments with the contract manufacturers for non-standard components when and if quantities exceed our future demand forecasts. Our historical charges have not been material.
As of July 31, 2017, we had accrued liabilities related to uncertain tax positions, which are reflected on our consolidated balance sheet. These accrued liabilities are not reflected in the table above since it is unclear when these liabilities will be paid.
Off-Balance Sheet Arrangements
As of July 31, 2017, we did not have any relationships with unconsolidated organizations or financial partnerships, such as structured finance or special purpose entities that would have been established for the purpose of facilitating off-balance sheet arrangements or other contractually narrow or limited purposes.
62
Critical Accounting Estimates
Our consolidated financial statements are prepared in accordance with GAAP. The preparation of these consolidated financial statements requires our management to make estimates, assumptions and judgments that affect the reported amounts of assets and liabilities and disclosure of contingent assets and liabilities at the date of the financial statements, and the reported amounts of revenue and expenses during the applicable periods. We base our estimates, assumptions and judgments on historical experience and on various other factors that we believe to be reasonable under the circumstances. Different assumptions and judgments would change the estimates used in the preparation of our consolidated financial statements, which, in turn, could change the results from those reported. We evaluate our estimates, assumptions and judgments on an ongoing basis.
The critical accounting estimates, assumptions and judgments that we believe have the most significant impact on our consolidated financial statements are described below.
Revenue Recognition
We derive revenue from two sources: (i) product revenue, which consists of hardware combined with software and software-only revenue, and (ii) support and service revenue which includes PCS and professional services. Revenue is recognized when all of the following criteria are met:
Persuasive evidence of an arrangement exists. We rely on sales agreements and purchase orders to determine the existence of an arrangement.
Delivery has occurred. We typically recognize product revenue upon shipment, when title and risk of loss are transferred to our partners at that time. Service revenue is recognized as services are performed.
The fee is fixed or determinable. We assess whether the fee is fixed or determinable based on the payment terms associated with the transaction. Payment from partners is not contingent upon the partners receiving payments from end-customers.
Collectability is reasonably assured. We assess collectability based on a credit analysis and payment history.
Most of our arrangements are multiple-element arrangements with a combination of hardware, software, support and maintenance and other professional services. Products and services generally qualify as separate units of accounting. Hardware deliverables include proprietary software, which together deliver the essential functionality of the products. For multiple-element arrangements, we allocate revenue to each unit of accounting based on an estimated selling price at the arrangement inception. The estimated selling price for each element is based upon the following hierarchy: VSOE of selling price, if available, third-party evidence, or TPE, of selling price, if VSOE of selling price is not available, or best estimate of selling price, or BESP, if neither VSOE of selling price nor TPE of selling price are available. Other than certain PCS related deliverables, we have not established VSOE of fair value and TPE typically cannot be obtained, therefore we typically allocate consideration to deliverables based on BESP. Our process to determine VSOE is based upon the evaluation of normal pricing and discount practices on deliverables when they are sold separately. Our process to determine BESP for our products and services is based on qualitative and quantitative considerations of multiple factors, which primarily include historical sales, margin objectives and discount behavior. Additional considerations are given to other factors such as customer demographics, costs to manufacture products or provide services, pricing practices and market conditions.
Commissions
Commissions consist of direct incremental costs paid to our sales force related to customer orders. Commissions are expensed over the same period that revenue is recognized from the related customer order. Deferred commissions are recoverable through the revenue streams that will be recognized under the related orders. Amortization of deferred commissions is included in sales and marketing expense in the consolidated statements of operations.
63
Income Taxes
We account for income taxes using the asset and liability method. Deferred income taxes are recognized by applying enacted statutory tax rates applicable to future years to differences between the financial statement carrying amounts of existing assets and liabilities and their respective tax bases and operating loss and tax credit carryforwards. The effect on deferred tax assets and liabilities of a change in tax rates is recognized in income in the period that includes the enactment date. The measurement of deferred tax assets is reduced, if necessary, by a valuation allowance to amounts that are more likely than not to be realized.
We recognize uncertain tax positions only if it is more likely than not to be sustained based solely on its technical merits as of the reporting date. We consider many factors when evaluating and estimating our tax positions and tax benefits, which may require periodic adjustments and which may not accurately anticipate actual outcomes.
Stock-Based Compensation
We measure and recognize compensation expense for all stock-based awards including stock options and purchase rights issued to employees under our employee stock purchase plan, or ESPP, based on estimated fair value of the awards on the grant date. We use Black-Scholes option pricing model to estimate the fair value of a stock option and ESPP purchase rights. The fair value of a restricted stock unit, or RSU, is measured using the fair value of our common stock on the date of the grant. The fair value of stock options and RSUs is recognized as an expense on a straight-line basis over the requisite service periods, which is generally four years. For stock-based awards granted to employees with a performance condition, we recognize stock-based compensation expense for these awards under the accelerated attribution method over the requisite service period when management determines it is probable that the performance condition will be satisfied. The fair value of the ESPP purchase rights is recognized as an expense on a straight-line basis over the offering period.
Our use of the Black-Scholes option-pricing model requires the input of highly subjective assumptions, including the fair value of the underlying common stock, expected term of the option, expected volatility of the price of our common stock, risk-free interest rates, and the expected dividend yield of our common stock. The assumptions used in our option-pricing model represent management’s best estimates. These estimates involve inherent uncertainties and the application of management’s judgment. If factors change and different assumptions are used, our stock-based compensation expense could be materially different in the future.
These assumptions and estimates are as follows:
Fair Value of Common Stock. Prior to our IPO, the fair value of the common stock underlying our stock options was determined by our board of directors. The valuations of our common stock were determined in accordance with the guidelines outlined in the American Institute of Certified Public Accountants Practice Aid, Valuation of Privately-Held-Company Equity Securities Issued as Compensation. Our board of directors, with input from management, exercised significant judgment and considered numerous objective and subjective factors to determine the fair value of our common stock at each grant date, including but not limited to, (i) contemporaneous valuations of common stock performed by unrelated third-party specialists; (ii) recent private stock sales transactions; (iii) the prices, rights, preferences and privileges of our convertible preferred stock relative to those of our common stock; (iv) the lack of marketability of our common stock; (v) developments in the business; (vi) the likelihood of achieving a liquidity event, such as an IPO or a merger or acquisition of our business, given prevailing market conditions; (vii) the market performance of comparable publicly traded companies; (viii) our actual operating and financial performance; (ix) U.S. and global capital market conditions; (x) the illiquidity of stock-based awards involving securities in a private company; (xi) our stage of development; and (xii) our history and the timing of the introduction of new products and services.
Subsequent to our IPO, we use the market closing price for our Class A common stock as reported on the NASDAQ Global Select Market on the date of grant.
Expected Term. The expected term of employee stock options represents the weighted-average period that the stock options are expected to remain outstanding. To determine the expected term, we generally apply the simplified approach in which the expected term of an award is presumed to be the mid-point between the vesting date and the expiration date of the award as we do not have sufficient historical exercise data to provide a reasonable basis for an estimate of expected term.
64
Risk-Free Interest Rate. We base the risk-free interest rate on the yields of U.S. Treasury securities with maturities approximately equal to the term of employee stock option awards.
Expected Volatility. As we do not have sufficient trading history for our common stock, the expected volatility for our common stock was estimated by taking the average historic price volatility for industry peers based on daily price observations over a period equivalent to the expected term of the stock option awards. Industry peers consist of several public companies in our industry which are either similar in size, stage of life cycle or financial leverage and were the same as the comparable companies used in the common stock valuation analyses.
Dividend Rate. We have never declared or paid any cash dividends and do not presently plan to pay cash dividends in the foreseeable future. Consequently, we use a dividend rate of zero.
We will continue to use judgment in evaluating the assumptions related to our stock-based compensation on a prospective basis. As we continue to accumulate additional data related to our common stock, we may have refinements to our estimates, which could materially impact our future stock-based compensation expense.
Business Combinations
We account for our acquisitions using the acquisition method. Goodwill is measured at the acquisition date as the excess of the purchase price over the fair value of the assets acquired and liabilities assumed. Significant estimates and assumptions are made by management to value such assets and liabilities. Although we believe that those estimates and assumptions are reasonable and appropriate, they are inherently uncertain and subject to refinement. Additional information related to the acquisition date fair value of acquired assets and assumed liabilities obtained during the measurement period, not to exceed one year, may result in changes to the recorded values of such assets and liabilities, resulting in an offsetting adjustment to the goodwill associated with the business acquired.
Uncertain tax positions and tax-related valuation allowances are initially established in connection with a business combination as of the acquisition date. We continue to collect information and reevaluate these estimates and assumptions quarterly. We will record any adjustments to our preliminary estimates to goodwill provided that we are within the one-year measurement period.
Any contingent consideration payable is recognized at fair value at the acquisition date. Liability-classified contingent consideration is remeasured each reporting period with changes in fair value recognized in earnings until the contingent consideration is settled.
Goodwill, Intangible Assets and Impairment Assessment
Goodwill represents the excess of the purchase price over the fair value of the assets acquired and liabilities assumed, if any, in a business combination, and is allocated to our single reporting unit. We review our goodwill and other intangible assets determined to have an indefinite useful, such as in-process research and development, or IPR&D, for impairment at least annually, or whenever events or changes in circumstances indicate that the carrying value of an asset may not be recoverable. Goodwill is tested for impairment by comparing the reporting unit's carrying value, including goodwill, to the fair value of the reporting unit. We operate under one reporting unit and for our annual goodwill impairment test, we determine the fair value of our reporting unit based on our enterprise value. We may elect to utilize a qualitative assessment to determine whether it is more likely than not that the fair value of our reporting unit is less than its carrying value. If, after assessing the qualitative factors, we determine that it is more likely than not that the fair value of our reporting unit is less than its carrying value, an impairment analysis will be performed. The Company compares the fair value of its reporting unit with its carrying amount and if the carrying value of the reporting unit exceeds its fair value, an impairment loss is recognized.
IPR&D is tested for impairment by comparing the carrying amount of the related technology to the estimated undiscounted future cash flows expected to be generated by the asset. If the carrying amount of the asset exceeds its estimated future cash flows, an impairment charge is recognized in the amount by which the carrying amount of the asset exceeds the fair value of the asset.
To date, we have not recorded any impairment charges related to our goodwill and intangible assets. However, deteriorating market conditions or any future events that negatively impact our business may result in an impairment charge.
65
We will start amortizing the in-process R&D during the first quarter of fiscal 2018 over a useful life of between 5 to 7 years as the related technology was completed and released in the first quarter of fiscal 2018.
Recent Accounting Pronouncements
Refer to “Recent Accounting Pronouncements” in Note 2. Basis of Presentation and Summary of Significant Accounting Policies of Notes to Consolidated Financial Statements included in Part II, Item 8 of this Annual Report on Form 10-K.
Item 7A. Quantitative and Qualitative Disclosures About Market Risk
We have operations both within the United States and internationally, and we are exposed to market risk in the ordinary course of our business. We are exposed to market risk in the ordinary course of our business. Market risk represents the risk of loss that may impact our financial position due to adverse changes in financial market prices and rates. Our market risk exposure is primarily a result of fluctuations in foreign currency exchange rates and interest rates.
Foreign Currency Risk
Our consolidated results of operations and cash flows are subject to fluctuations due to changes in foreign currency exchange rates. Historically, our revenue contracts have been denominated in U.S. dollars. Our expenses are generally denominated in the currencies in which our operations are located. To date, we have not entered into any hedging arrangements with respect to foreign currency risk or other derivative instruments. In the event our foreign sales and expenses increase, our operating results may be more greatly affected by foreign currency exchange rate fluctuations, which can affect our operating income or loss. The effect of a hypothetical 10% change in foreign currency exchanges rates on our non-U.S. dollar monetary assets and liabilities would not have had a material impact on our historical consolidated financial statements. Foreign currency transaction gains and losses and exchange rate fluctuations have not been material to our consolidated financial statements.
A hypothetical 10% decrease in the U.S. dollar against other currencies would result in an increase in operating loss of approximately $11.8 million and $23.2 million for fiscal 2016 and fiscal 2017, respectively. The change in hypothetical increase in operating loss for fiscal 2017 compared to prior year was primarily due to our global expansion which resulted to an increase in foreign currency denominated expenses. This analysis disregards the possibilities that rates can move in opposite directions and that losses from one geographic area may be offset by gains from another geographic area.
Interest Rate Risk
Our investment objective is to conserve capital and maintain liquidity to support our operations; therefore, we generally invest in highly liquid securities, consisting primarily of bank deposits, money market funds, commercial paper, U.S. government securities and corporate bonds. Such fixed and floating interest-earning instruments carry a degree of interest rate risk. Fixed income securities may have their fair market value adversely impacted due to a rise in interest rates, while floating rate securities may produce less income than predicted if interest rates fall. Due to the short-term nature of our investment portfolio, we do not believe an immediate 10% increase or decrease in interest rates would have a material effect on the fair market value of our portfolio. Therefore, we do not expect our operating results or cash flows to be materially affected by a sudden change in interest rates.
66
Item 8. Financial Statements and Supplementary Data
INDEX TO CONSOLIDATED FINANCIAL STATEMENTS
67
REPORT OF INDEPENDENT REGISTERED PUBLIC ACCOUNTING FIRM
To the Board of Directors and Stockholders of
Nutanix, Inc.
San Jose, California
We have audited the accompanying consolidated balance sheets of Nutanix, Inc. and subsidiaries (the “Company”) as of July 31, 2017 and 2016, and the related consolidated statements of operations, comprehensive loss, convertible preferred stock and stockholders’ (deficit) equity, and cash flows for each of the three years in the period ended July 31, 2017. These financial statements are the responsibility of the Company's management. Our responsibility is to express an opinion on the financial statements based on our audits.
We conducted our audits in accordance with the standards of the Public Company Accounting Oversight Board (United States). Those standards require that we plan and perform the audit to obtain reasonable assurance about whether the financial statements are free of material misstatement. The Company is not required to have, nor were we engaged to perform, an audit of its internal control over financial reporting. Our audits included consideration of internal control over financial reporting as a basis for designing audit procedures that are appropriate in the circumstances, but not for the purpose of expressing an opinion on the effectiveness of the Company's internal control over financial reporting. Accordingly, we express no such opinion. An audit also includes examining, on a test basis, evidence supporting the amounts and disclosures in the financial statements, assessing the accounting principles used and significant estimates made by management, as well as evaluating the overall financial statement presentation. We believe that our audits provide a reasonable basis for our opinion.
In our opinion, such consolidated financial statements present fairly, in all material respects, the financial position of Nutanix, Inc. and subsidiaries as of July 31, 2017 and 2016, and the results of their operations and their cash flows for each of the three years in the period ended July 31, 2017, in conformity with accounting principles generally accepted in the United States of America.
/s/ DELOITTE & TOUCHE LLP | |
San Jose, California | |
September 18, 2017 | |
68
NUTANIX, INC.
CONSOLIDATED BALANCE SHEETS
(In thousands, except share and per share data)
As of July 31, | |||||||
2016 | 2017 | ||||||
Assets | |||||||
Current assets: | |||||||
Cash and cash equivalents | $ | 99,209 | $ | 138,359 | |||
Short-term investments | 85,991 | 210,694 | |||||
Accounts receivable—net of allowance of $132 and $132 as of July 31, 2016 and 2017 | 110,659 | 178,876 | |||||
Deferred commissions—current | 17,864 | 27,679 | |||||
Prepaid expenses and other current assets | 16,138 | 28,362 | |||||
Total current assets | 329,861 | 583,970 | |||||
Property and equipment—net | 42,218 | 58,072 | |||||
Deferred commissions—non-current | 19,029 | 33,709 | |||||
Intangible assets-net | — | 26,001 | |||||
Goodwill | — | 16,672 | |||||
Other assets—non-current | 7,978 | 7,649 | |||||
Total assets | $ | 399,086 | $ | 726,073 | |||
Liabilities, Convertible Preferred Stock and Stockholders’ (Deficit) Equity | |||||||
Current liabilities: | |||||||
Accounts payable | $ | 52,111 | $ | 73,725 | |||
Accrued compensation and benefits | 24,547 | 57,521 | |||||
Accrued expenses and other current liabilities | 5,537 | 9,414 | |||||
Deferred revenue—current | 130,569 | 233,498 | |||||
Total current liabilities | 212,764 | 374,158 | |||||
Deferred revenue—non-current | 165,896 | 292,573 | |||||
Senior notes | 73,260 | — | |||||
Convertible preferred stock warrant liability | 9,679 | — | |||||
Early exercised stock options liability | 2,320 | 851 | |||||
Other liabilities—non-current | 1,103 | 10,289 | |||||
Total liabilities | 465,022 | 677,871 | |||||
Commitments and contingencies (Note 7) | |||||||
Convertible preferred stock, par value of $0.000025 per share— 78,263,309 and no shares authorized as of July 31, 2016 and 2017; 76,319,511 and no shares issued and outstanding as of July 31, 2016 and 2017; aggregate liquidation preference of $370,244 as of July 31, 2016 | 310,379 | — | |||||
Stockholders’ (deficit) equity: | |||||||
Preferred stock, par value of $0.000025 per share— no and 200,000,000 shares authorized as of July 31, 2016 and 2017; no shares issued and outstanding as of July 31, 2016 and 2017 | — | — | |||||
Common stock, par value of $0.000025 per share—165,000,000 and 1,200,000,000 (1,000,000,000 Class A, 200,000,000 Class B) shares authorized as of July 31, 2016 and 2017; 46,083,651 and 154,636,520 (93,570,171 Class A, 61,066,349 Class B) shares issued and outstanding as of July 31, 2016 and 2017 | 1 | 4 | |||||
Additional paid-in capital | 65,629 | 948,134 | |||||
Accumulated other comprehensive loss | (12 | ) | (106 | ) | |||
Accumulated deficit | (441,933 | ) | (899,830 | ) | |||
Total stockholders’ (deficit) equity | (376,315 | ) | 48,202 | ||||
Total liabilities, convertible preferred stock and stockholders’ (deficit) equity | $ | 399,086 | $ | 726,073 | |||
See the accompanying notes to the consolidated financial statements.
69
NUTANIX, INC.
CONSOLIDATED STATEMENTS OF OPERATIONS
(In thousands, except share and per share data)
Year Ended July 31, | |||||||||||
2015 | 2016 | 2017 | |||||||||
Revenue: | |||||||||||
Product | $ | 200,833 | $ | 350,798 | $ | 583,011 | |||||
Support and other services | 40,599 | 94,130 | 183,858 | ||||||||
Total revenue | 241,432 | 444,928 | 766,869 | ||||||||
Cost of revenue: | |||||||||||
Product | 80,900 | 133,541 | 249,393 | ||||||||
Support and other services | 20,059 | 37,246 | 77,938 | ||||||||
Total cost of revenue | 100,959 | 170,787 | 327,331 | ||||||||
Gross profit | 140,473 | 274,141 | 439,538 | ||||||||
Operating expenses: | |||||||||||
Sales and marketing | 161,829 | 288,493 | 500,529 | ||||||||
Research and development | 73,510 | 116,400 | 288,619 | ||||||||
General and administrative | 23,899 | 34,265 | 77,341 | ||||||||
Total operating expenses | 259,238 | 439,158 | 866,489 | ||||||||
Loss from operations | (118,765 | ) | (165,017 | ) | (426,951 | ) | |||||
Other expense—net | (5,818 | ) | (1,290 | ) | (26,377 | ) | |||||
Loss before provision for income taxes | (124,583 | ) | (166,307 | ) | (453,328 | ) | |||||
Provision for income taxes | 1,544 | 2,192 | 4,683 | ||||||||
Net loss | $ | (126,127 | ) | $ | (168,499 | ) | $ | (458,011 | ) | ||
Net loss per share attributable to Class A and Class B common stockholders—basic and diluted | $ | (3.11 | ) | $ | (3.83 | ) | $ | (3.57 | ) | ||
Weighted-average shares used in computing net loss per share attributable to Class A and Class B common stockholders—basic and diluted | 40,509,481 | 43,970,381 | 128,295,563 | ||||||||
See the accompanying notes to the consolidated financial statements.
70
NUTANIX, INC.
CONSOLIDATED STATEMENTS OF COMPREHENSIVE LOSS
(In thousands)
Year Ended July 31, | |||||||||||
2015 | 2016 | 2017 | |||||||||
Net loss | $ | (126,127 | ) | $ | (168,499 | ) | $ | (458,011 | ) | ||
Other comprehensive income (loss)—net of tax: | |||||||||||
Unrealized gain (loss) on available-for-sale securities | (14 | ) | 2 | (94 | ) | ||||||
Total other comprehensive income (loss)—net of tax | (14 | ) | 2 | (94 | ) | ||||||
Comprehensive loss | $ | (126,141 | ) | $ | (168,497 | ) | $ | (458,105 | ) | ||
See the accompanying notes to the consolidated financial statements.
71
NUTANIX, INC.
CONSOLIDATED STATEMENTS OF CONVERTIBLE PREFERRED STOCK AND STOCKHOLDERS’ (DEFICIT) EQUITY
(In thousands, except share and per share data)
Convertible Preferred Stock | Common Stock | Additional Paid-In Capital | Accumulated Other Comprehensive Loss | Accumulated Deficit | Total Stockholders’ (Deficit) Equity | ||||||||||||||||||||||||
Shares | Amount | Shares | Amount | ||||||||||||||||||||||||||
Balance - August 1, 2014 | 65,495,787 | $ | 172,075 | 42,937,818 | $ | 1 | $ | 16,531 | $ | — | $ | (147,307 | ) | $ | (130,775 | ) | |||||||||||||
Stock-based compensation | — | — | — | — | 17,140 | — | — | 17,140 | |||||||||||||||||||||
Issuance of Series E Convertible Preferred Stock at $13.3965 per share—net of issuance costs | 10,823,724 | 138,304 | — | — | — | — | — | — | |||||||||||||||||||||
Issuance of common stock upon exercise of stock options | — | — | 1,996,194 | — | 1,584 | — | — | 1,584 | |||||||||||||||||||||
Vesting of early exercised stock options | — | — | — | — | 3,458 | — | — | 3,458 | |||||||||||||||||||||
Repurchase of common stock from early exercised stock options | — | — | (136,811 | ) | — | — | — | — | — | ||||||||||||||||||||
Other comprehensive loss | — | — | — | — | — | (14 | ) | — | (14 | ) | |||||||||||||||||||
Net loss | — | — | — | — | — | — | (126,127 | ) | (126,127 | ) | |||||||||||||||||||
Balance - July 31, 2015 | 76,319,511 | 310,379 | 44,797,201 | 1 | 38,713 | (14 | ) | (273,434 | ) | (234,734 | ) | ||||||||||||||||||
Stock-based compensation | — | — | — | — | 20,056 | — | — | 20,056 | |||||||||||||||||||||
Issuance of common stock upon exercise of stock options | — | — | 1,573,577 | — | 2,675 | — | — | 2,675 | |||||||||||||||||||||
Vesting of early exercised stock options | — | — | — | — | 3,205 | — | — | 3,205 | |||||||||||||||||||||
Repurchase of common stock from early exercised stock options | — | — | (287,127 | ) | — | — | — | — | — | ||||||||||||||||||||
Excess tax benefit from stock-based compensation | — | — | — | — | 980 | — | — | 980 | |||||||||||||||||||||
Other comprehensive income | — | — | — | — | — | 2 | — | 2 | |||||||||||||||||||||
Net loss | — | — | — | — | — | — | (168,499 | ) | (168,499 | ) | |||||||||||||||||||
Balance - July 31, 2016 | 76,319,511 | 310,379 | 46,083,651 | 1 | 65,629 | (12 | ) | (441,933 | ) | (376,315 | ) | ||||||||||||||||||
Conversion of convertible preferred stock to common stock upon IPO | (76,319,511 | ) | (310,379 | ) | 76,319,511 | 2 | 310,377 | — | — | 310,379 | |||||||||||||||||||
Issuance of class A common stock upon IPO, net of issuance costs | — | — | 17,100,500 | 1 | 249,169 | — | — | 249,170 | |||||||||||||||||||||
Reclassification of convertible preferred stock warrant liability to APIC upon IPO | — | — | — | — | 30,812 | — | — | 30,812 | |||||||||||||||||||||
Issuance of common stock upon exercise of common stock warrants | — | — | 775,554 | — | 77 | — | — | 77 | |||||||||||||||||||||
Issuance of common stock through employee equity incentive plans, net of repurchases | — | — | 10,871,714 | — | 14,956 | — | — | 14,956 | |||||||||||||||||||||
Issuance of common stock from ESPP purchase | — | — | 1,246,054 | — | 16,946 | — | — | 16,946 | |||||||||||||||||||||
Issuance of common stock for acquisitions | — | — | 2,239,536 | — | 27,063 | — | 27,063 | ||||||||||||||||||||||
Vesting of early exercised stock options | — | — | — | — | 1,614 | — | — | 1,614 | |||||||||||||||||||||
Stock-based compensation | — | — | — | — | 231,491 | — | — | 231,491 | |||||||||||||||||||||
Cumulative-effect adjustment from adoption of ASU 2016-09 | — | — | — | — | — | — | 114 | 114 | |||||||||||||||||||||
Other comprehensive loss | — | — | — | — | — | (94 | ) | — | (94 | ) | |||||||||||||||||||
Net loss | — | — | — | — | — | — | (458,011 | ) | (458,011 | ) | |||||||||||||||||||
Balance - July 31, 2017 | — | $ | — | 154,636,520 | $ | 4 | $ | 948,134 | $ | (106 | ) | $ | (899,830 | ) | $ | 48,202 | |||||||||||||
See the accompanying notes to the consolidated financial statements.
72
NUTANIX, INC.
CONSOLIDATED STATEMENTS OF CASH FLOWS
(In thousands)
Year Ended July 31, | |||||||||||
2015 | 2016 | 2017 | |||||||||
Cash flows from operating activities: | |||||||||||
Net loss | $ | (126,127 | ) | $ | (168,499 | ) | $ | (458,011 | ) | ||
Adjustments to reconcile net loss to net cash (used in) provided by operating activities: | |||||||||||
Depreciation and amortization | 16,567 | 26,408 | 38,399 | ||||||||
Stock-based compensation | 17,140 | 20,056 | 231,491 | ||||||||
Change in fair value of convertible preferred stock warrant liability | 6,176 | (2,004 | ) | 21,133 | |||||||
Loss on debt extinguishment | — | — | 3,320 | ||||||||
Change in fair value of contingent consideration | — | — | 1,924 | ||||||||
Other | 483 | 129 | 764 | ||||||||
Changes in operating assets and liabilities: | |||||||||||
Accounts receivable—net | (9,018 | ) | (71,406 | ) | (67,382 | ) | |||||
Deferred commission | (8,978 | ) | (19,813 | ) | (24,495 | ) | |||||
Prepaid expenses and other assets | (7,003 | ) | (3,460 | ) | (15,830 | ) | |||||
Accounts payable | 11,318 | 19,985 | 21,280 | ||||||||
Accrued compensation and benefits | 4,903 | 10,709 | 32,687 | ||||||||
Accrued expenses and other liabilities | 1,724 | (1,336 | ) | 4,944 | |||||||
Deferred revenue | 67,121 | 192,867 | 223,598 | ||||||||
Net cash (used in) provided by operating activities | (25,694 | ) | 3,636 | 13,822 | |||||||
Cash flows from investing activities: | |||||||||||
Purchases of investments | (116,116 | ) | (106,345 | ) | (242,525 | ) | |||||
Maturities of investments | 32,757 | 102,135 | 84,156 | ||||||||
Sales of investments | — | — | 32,640 | ||||||||
Payments for business acquisitions, net of cash acquired | — | — | (184 | ) | |||||||
Purchases of property and equipment | (23,308 | ) | (42,294 | ) | (50,181 | ) | |||||
Net cash used in investing activities | (106,667 | ) | (46,504 | ) | (176,094 | ) | |||||
Cash flows from financing activities: | |||||||||||
Proceeds from initial public offering, net of underwriting discounts and commissions | — | — | 254,455 | ||||||||
Proceeds from senior notes—net of issuance costs | — | 73,255 | — | ||||||||
Payments of offering costs, net | (299 | ) | (3,186 | ) | (1,717 | ) | |||||
Proceeds from sales of shares through employee equity incentive plans, net of repurchases | 4,750 | 3,149 | 32,254 | ||||||||
Repayment of senior notes | — | — | (75,000 | ) | |||||||
Debt extinguishment costs | — | — | (1,580 | ) | |||||||
Payment of debt in conjunction with a business acquisition | — | — | (7,124 | ) | |||||||
Proceeds from issuance of convertible preferred stock—net of issuance costs | 138,304 | — | — | ||||||||
Other | — | 980 | 134 | ||||||||
Net cash provided by financing activities | 142,755 | 74,198 | 201,422 | ||||||||
Net increase in cash and cash equivalents | 10,394 | 31,330 | 39,150 | ||||||||
Cash and cash equivalents—beginning of period | 57,485 | 67,879 | 99,209 | ||||||||
Cash and cash equivalents—end of period | $ | 67,879 | $ | 99,209 | $ | 138,359 | |||||
Supplemental disclosures of cash flow information: | |||||||||||
Cash paid for income taxes | $ | 1,169 | $ | 2,455 | $ | 5,213 | |||||
Cash paid for interest | $ | — | $ | 2,188 | $ | 1,271 | |||||
Supplemental disclosures of non-cash investing and financing information: | |||||||||||
Vesting of early exercised stock options | $ | 3,458 | $ | 3,205 | $ | 1,614 | |||||
Purchases of property and equipment included in accounts payable | $ | 5,104 | $ | 5,007 | $ | 5,591 | |||||
Offering costs included in accounts payable | $ | 1,796 | $ | 902 | $ | 85 | |||||
Conversion of convertible preferred stock to common stock, net of issuance costs | $ | — | $ | — | $ | 310,379 | |||||
Reclassification of convertible preferred stock warrant liability to additional paid-in capital | $ | — | $ | — | $ | 30,812 | |||||
Issuance of common stock for business acquisitions | $ | — | $ | — | $ | 27,063 | |||||
See the accompanying notes to the consolidated financial statements.
73
NOTES TO CONSOLIDATED FINANCIAL STATEMENTS
NOTE 1. | BUSINESS OVERVIEW |
Organization and Description of Business—Nutanix, Inc. was incorporated in the state of Delaware in September 2009. Nutanix, Inc. is headquartered in San Jose, California, and together with its wholly-owned subsidiaries (collectively, the “Company”) has operations throughout North America, Europe, Asia-Pacific, Middle East, Latin America and Africa.
The Company’s enterprise cloud operating system converges traditional silos of server, virtualization, storage and networking into one integrated solution and unifies private and public cloud into a single software fabric. The Company primarily sells its products and services to end-customers through distributors, resellers and original equipment manufacturers (collectively “Partners”).
During the first quarter of fiscal 2017, the Company completed two acquisitions, Calm.io Pte. Ltd. (“Calm”) and PernixData, Inc. (“PernixData”) (see Note 3).
Initial Public Offering—In October 2016, the Company completed its initial public offering (“IPO”) of Class A common stock, in which it sold 17,100,500 shares, including 2,230,500 shares pursuant to the underwriters’ over-allotment option. The shares were sold at an IPO price of $16.00 per share for net proceeds of $254.5 million, after deducting underwriting discounts and commissions of $19.2 million. Additionally, offering costs incurred by the Company totaled $5.3 million. Immediately prior to the closing of the Company’s IPO, all outstanding shares of common stock were reclassified as Class B common stock, and all outstanding shares of its convertible preferred stock automatically converted into 76,319,511 shares of common stock on a one-to-one basis and then reclassified as shares of Class B common stock. Following the IPO, the Company has two classes of authorized common stock, Class A common stock, which entitles holders to one vote per share, and Class B common stock which entitles holders to 10 votes per share.
NOTE 2. | BASIS OF PRESENTATION AND SUMMARY OF SIGNIFICANT ACCOUNTING POLICIES |
Principles of Consolidation—The consolidated financial statements, which include the accounts of Nutanix, Inc. and its wholly-owned subsidiaries, have been prepared in conformity with accounting principles generally accepted in the United States (“U.S. GAAP”). All intercompany accounts and transactions have been eliminated in consolidation.
Use of Estimates—The preparation of consolidated financial statements in conformity with U.S. GAAP requires management to make estimates and assumptions that affect the amounts reported in the consolidated financial statements and accompanying notes. Such management estimates include, but are not limited to, the best estimate of selling prices for products and related support; useful lives of intangible assets and property and equipment; allowance for doubtful accounts; determination of fair value of common stock and convertible preferred stock, fair value of stock-based awards and convertible preferred stock warrant liability; accounting for income taxes, including the valuation reserve on deferred tax assets and uncertain tax positions; warranty liability; fair value of contingent consideration in a business combination; sales commissions expense; and contingencies and litigation. Management evaluates these estimates and assumptions on an ongoing basis using historical experience and other factors and makes adjustments when facts and circumstances dictate. As future events and their effects cannot be determined with precision, actual results could materially differ from those estimates and assumptions.
74
Concentration Risk:
Credit Risk—Financial instruments that potentially subject the Company to concentrations of credit risk consist of cash and cash equivalents and accounts receivable. The Company places its cash and cash equivalents primarily with domestic financial institutions that are federally insured within statutory limits. The Company places its deposits with multiple institutions, however such deposits may exceed federally insured limits. The Company provides credit, in the normal course of business, to a number of companies and performs credit evaluations of its customers.
Concentration of Revenue and Accounts Receivable—The Company sells its products primarily through Partners and occasionally directly to end-customers. For the years ended July 31, 2015, 2016 and 2017, no end-customer accounted for more than 10% of total revenue.
For each significant Partner, revenue as a percentage of total revenue and accounts receivable as a percentage of total accounts receivable, net are as follows:
Revenue | Accounts Receivable | |||||||||||||
Fiscal Year Ended July 31, | As of July 31 | |||||||||||||
Customers | 2015 | 2016 | 2017 | 2016 | 2017 | |||||||||
Partner A | 23 | % | 15 | % | 11 | % | * | * | ||||||
Partner B | 15 | % | 20 | % | 22 | % | 17 | % | 12 | % | ||||
Partner C | * | 14 | % | 18 | % | 12 | % | 14 | % | |||||
Partner D | * | * | * | 23 | % | 20 | % | |||||||
Partner E | * | 11 | % | * | 11 | % | * | |||||||
Partner F | * | 15 | % | 13 | % | * | 18 | % | ||||||
___________________
* | Less than 10% |
Vendor Risk—The Company relies on a limited number of suppliers for its contract manufacturing and certain raw material components. In instances where suppliers fail to perform their obligations, the Company may be unable to find alternative suppliers or satisfactorily deliver its products to its customers on time.
Cash, Cash Equivalents and Short-Term Investments—The Company classifies all highly liquid investments with original maturities of three months or less from the date of purchase as cash equivalents and all highly liquid investments with stated maturities of greater than three months as marketable securities.
The Company determines the appropriate classifications of its marketable securities at the time of purchase and reevaluates such designation as of each balance sheet date. The Company classifies and accounts for its marketable securities as available-for-sale securities. The Company classifies its marketable securities with stated maturities greater than twelve months as short-term investments due to its intention to use these securities to support its current operations.
The Company’s marketable securities are recorded at their estimated fair value. Unrealized gains or losses on available-for-sale securities are reported in other comprehensive income (loss). The Company periodically reviews whether its securities may be other-than-temporarily impaired, including whether or not (i) the Company has the intent to sell the security or (ii) it is more likely than not that the Company will be required to sell the security before its anticipated recovery. If one of these factors is met, the Company will record an impairment loss associated with its impaired investment. The impairment loss will be recorded as a write-down of investments in the consolidated balance sheets and a realized loss within other expense in the consolidated statements of operations.
75
Fair Value Measurement—The Company defines fair value as the price that would be received from selling an asset or paid to transfer a liability in an orderly transaction between market participants at the measurement date. When determining the fair value measurements for assets and liabilities, which are required to be recorded at fair value, the Company considers the principal or most advantageous market in which to transact and the market-based risk. The Company applies fair value accounting for all assets and liabilities that are recognized or disclosed at fair value in the consolidated financial statements on a recurring basis. The carrying amounts reported in the consolidated financial statements for cash and cash equivalents, accounts receivable, accounts payable and accrued liabilities approximate their fair values due to their short-term nature. The fair value of the Company’s Senior Notes (see Note 6) approximates their face value as the effective interest rates on the Senior Notes approximate market interest rates for similar instruments.
Accounts Receivable and Allowance for Doubtful Accounts—Accounts receivable are recorded at the invoiced amount, net of an allowance for doubtful accounts. Credit is extended to customers based on an evaluation of their financial condition and other factors. The Company generally does not require collateral or other security to support accounts receivable. The Company performs ongoing credit evaluations of its customers and maintains an allowance for doubtful accounts.
The allowance for doubtful accounts is based on the best estimate of the amount of probable credit losses in existing accounts receivable. The Company evaluates the collectability of its accounts receivable based on known collection risks and historical experience. In circumstances where the Company is aware of a specific customer’s inability to meet its financial obligations (e.g., bankruptcy filings or substantial downgrading of credit ratings), the Company records allowance for doubtful accounts in order to reduce the net recognized receivable to the amount the Company reasonably believes will be collected. For all other customers, the Company records allowance for doubtful accounts based on the length of time the accounts receivable are past due and the Company’s historical experience of collections and write-offs.
The changes in the allowance for doubtful accounts are as follows (in thousands):
Fiscal Year Ended July 31, | |||||||||||
2015 | 2016 | 2017 | |||||||||
Allowance for doubtful accounts—beginning balance | $ | 400 | $ | 410 | $ | 132 | |||||
Charged to provision for doubtful accounts (credit) | 119 | (85 | ) | — | |||||||
Write-offs | (109 | ) | (193 | ) | — | ||||||
Allowance for doubtful accounts—ending balance | $ | 410 | $ | 132 | $ | 132 | |||||
Property and Equipment—Property and equipment, including leasehold improvements, are stated at cost, less accumulated depreciation and amortization. The Company includes the cost to acquire demonstration units and the related accumulated depreciation in property and equipment as such units are generally not available for sale. Depreciation and amortization is computed using the straight-line method over the estimated useful lives of the related assets.
Business Combinations—The Company accounts for its acquisitions using the acquisition method. Goodwill is measured at the acquisition date as the excess of the purchase price over the fair value of the assets acquired and liabilities assumed. Significant estimates and assumptions are made by management to value such assets and liabilities. Although the Company believes that those estimates and assumptions are reasonable and appropriate, they are inherently uncertain and subject to refinement. Additional information related to the acquisition date fair value of acquired assets and assumed liabilities obtained during the measurement period, not to exceed one year, may result in changes to the recorded values of such assets and liabilities, resulting in an offsetting adjustment to the goodwill associated with the business acquired.
Uncertain tax positions and tax-related valuation allowances are initially established in connection with a business combination as of the acquisition date. The Company continues to collect information and reevaluate these estimates and assumptions quarterly. The Company will record any adjustments to its preliminary estimates to goodwill provided that the Company is within the one year measurement period.Any contingent consideration payable is recognized at fair value at the acquisition date. Liability-classified contingent consideration is remeasured each reporting period with changes in fair value recognized in earnings until the contingent consideration is settled.
Acquisition related costs incurred in connection with a business combination, other than those associated with the issuance of debt or equity securities, are expensed as incurred.
76
Goodwill, Intangible Assets and Other Long-Lived Assets—Goodwill represents the future economic benefits arising from other assets acquired in a business combination or an acquisition that are not individually identified and separately recorded. The excess of the purchase price over the estimated fair value of net assets of businesses acquired in a business combination is recognized as goodwill.
Intangible assets consist of identifiable intangible assets, including developed technology, customer relationships and in-process research and development (“IPR&D”), resulting from business acquisitions. Finite-lived intangible assets are recorded at fair value, net of accumulated amortization. Finite-lived intangible assets are amortized on a straight-line basis over their estimated useful lives. Amortization expense is included as a component of cost of product revenue and sales and marketing expense in the accompanying consolidated statements of operations. Amounts included in sales and marketing expense relate to amortization of intangible asset attributed to customer relationships.
Goodwill and other intangible assets acquired in a business combination and determined to have an indefinite useful life, such as IPR&D, are not amortized, but instead tested for impairment at least annually as of May 1st. Such goodwill and other intangible assets may also be tested for impairment between annual tests in the presence of impairment indicators such as, but not limited to: (a) a significant adverse change in legal factors or in the business climate; (b) a substantial decline in the Company's market capitalization, (c) an adverse action or assessment by a regulator; (d) unanticipated competition; (e) loss of key personnel; (f) a more likely-than-not expectation of sale or disposal of a reporting unit or a significant portion thereof; (g) a realignment of the Company's resources or restructuring of its existing businesses in response to changes to industry and market conditions; (h) testing for recoverability of a significant asset group within a reporting unit; or (i) higher discount rate used in the impairment analysis as impacted by an increase in interest rates.
Goodwill is tested for impairment by comparing the reporting unit's carrying value, including goodwill, to the fair value of the reporting unit. The Company operates under one reporting unit and for its annual goodwill impairment test, the Company determines the fair value of its reporting unit based on the Company's enterprise value. The Company may elect to utilize a qualitative assessment to determine whether it is more likely than not that the fair value of its reporting unit is less than its carrying value. If, after assessing the qualitative factors, the Company determines that it is more likely than not that the fair value of its reporting unit is less than its carrying value, an impairment analysis will be performed. The Company compares the fair value of its reporting unit with its carrying amount and if the carrying value of the reporting unit exceeds its fair value, an impairment loss is recognized.
Long-lived assets, such as property and equipment and finite-lived intangible assets subject to depreciation and amortization, are evaluated for impairment whenever events or changes in circumstances indicate that their carrying amount may not be recoverable. Among the factors and circumstances we considered in determining recoverability are: (i) a significant decrease in the market price of a long-lived asset; (ii) a significant adverse change in the extent or manner in which a long-lived asset is being used or in its physical condition; (iii) a significant adverse change in legal factors or in the business climate that could affect the value of a long-lived asset, including an adverse action or assessment by a regulator; (iv) an accumulation of costs significantly in excess of the amount originally expected for the acquisition and (v) current-period operating or cash flow loss combined with a history of operating or cash flow losses or a projection or forecast that demonstrates continuing losses associated with the use of a long-lived asset. Recoverability of assets to be held and used is measured by a comparison of the carrying amount of an asset to the estimated undiscounted future cash flows expected to be generated by the asset. If the carrying amount of an asset exceeds its estimated future cash flows, an impairment charge is recognized in the amount by which the carrying amount of the asset exceeds the fair value of the asset.
There have been no indicators of impairment of goodwill, intangible assets and other long-lived assets, and we did not record any impairment losses during fiscal 2015, 2016 and 2017.
77
Revenue Recognition—The Company derives revenue from two sources (1) product revenue, which consists of hardware combined with software and software-only revenue, and (2) support and service revenue which includes post-contract customer support (“PCS”) and professional services.
The Company recognizes revenue when:
• | Persuasive evidence of an arrangement exists—The Company relies on sales agreements and purchase orders to determine the existence of an arrangement. |
• | Delivery has occurred—The Company typically recognizes product revenue upon shipment, when title and risk of loss are transferred to its Partners at that time. Service revenue is recognized as services are performed. |
• | The fee is fixed or determinable—The Company assesses whether the fee is fixed or determinable based on the payment terms associated with the transaction. Payment from Partners is not contingent upon the Partners receiving payments from end-customers. |
• | Collection is reasonably assured—The Company assesses collectability based on a credit analysis and payment history. |
The Company reports revenue net of sales taxes. The Company includes shipping charges billed to customers in revenue and the related shipping costs are included in cost of revenue.
A substantial majority of the Company’s product revenue is generated from the sale of the Company’s software operating system, which is typically delivered on a hardware appliance that is configured to order. The software is deemed essential to the functionality of the hardware. Although historically it has represented a small portion of the Company’s product revenue, the Company’s proprietary software can also be delivered on a software-only basis. The Company also sells non-essential software, which can be purchased by customers to enhance the functionality of the Company’s offerings. The hardware appliance and the software essential to the functionality of the hardware appliance are considered non-software deliverables and, therefore, are not subject to industry-specific software revenue recognition guidance. Software-only and non-essential software sales are subject to the industry-specific software revenue recognition guidance. The Company established Vendor Specific Objective Evidence (“VSOE”) of fair value for certain of its PCS offerings during the fourth quarter of the year ended July 31, 2015. The establishment of VSOE for these PCS offerings did not have a material impact on the Company’s results. When VSOE of fair value for PCS does not exist, revenues subject to industry-specific software revenue recognition guidance are deferred and generally recognized ratably over the PCS period (see VSOE related discussion below).
Support and other services revenue includes the sale of PCS contracts and professional services such as installation, training and onsite engineering support. The Company’s PCS contracts include the right to receive unspecified software upgrades and enhancements on a when-and-if-available basis, bug fixes, as well as parts replacement services related to the Company’s hardware appliances. The Company’s PCS contracts support both non-software deliverables and non-essential software. The Company allocates fees associated with PCS to the software deliverables and non-software deliverables in a contract based on the relative selling prices of such deliverables, which is based on VSOE when available. When VSOE is not available, relative selling prices are determined based upon the Company’s best estimate of selling price, as third-party evidence is also not available. Revenue related to PCS contracts are recognized ratably over the contractual term, which generally range from one to five years. Revenue related to installation, training and onsite engineering support services are recognized as the services are provided to the customer.
Most of the Company’s arrangements, other than stand-alone renewals of PCS contracts, are multiple-element arrangements with a combination of product and support and service related deliverables (as defined above). In multiple-element revenue arrangements, the Company allocates consideration at the inception of an arrangement to all deliverables based on the relative selling price method in accordance with the selling price hierarchy, which includes (i) VSOE of selling price, if available; (ii) third-party evidence (“TPE”) of selling price, if VSOE is not available; and (iii) best estimate of selling price (“BESP”), if neither VSOE nor TPE is available. For deliverables where the Company has not established VSOE, the Company typically allocates consideration to all deliverables based on BESP as TPE typically cannot be obtained.
78
VSOE—In the Company’s multiple-element arrangements, the Company determines VSOE based on its historical pricing and discounting practices for the specific products and services when sold separately. In determining VSOE, the Company requires that a substantial majority of the stand-alone selling prices fall within a reasonably narrow pricing range. The Company has established VSOE for certain PCS related deliverables based upon the pricing and discounting of a substantial majority of stand-alone sales of the deliverables falling within a reasonably narrow range. The Company has not established VSOE for any of its other deliverables given that its pricing is not sufficiently concentrated (based on an analysis of separate sales of the deliverables) to conclude that it can demonstrate VSOE of selling prices.
TPE—When VSOE cannot be established for deliverables in multiple-element arrangements, the Company applies judgment with respect to whether it can establish a selling price based on TPE. TPE is determined based on competitor prices for interchangeable products or services when sold separately to similarly situated customers. However, because the Company’s products contain a significant element of proprietary technology and the Company’s solutions offer substantially different features and functionality, the comparable pricing of products with similar functionality cannot be obtained.
BESP—When neither VSOE nor TPE can be established, the Company utilizes BESP to allocate consideration to deliverables in a multiple-element arrangement. The Company’s process to determine its BESP for products and services is based on qualitative and quantitative considerations of multiple factors, which primarily include historical sales, margin objectives and discount behavior. Additional considerations are given to other factors such as customer demographics, pricing practices and market conditions.
Deferred Revenue—The Company recognizes certain revenue ratably over the contractual support period. Amounts prepaid by customers in excess of revenue recognized are deferred. The current portion of deferred revenue represents the amounts that are expected to be recognized as revenue within one year of the consolidated balance sheet date.
Deferred Commissions—Deferred commissions consist of direct and incremental costs paid to the Company’s sales force related to customer contracts. The deferred commission amounts are recoverable through the revenue streams that will be recognized under the related customer contracts. Direct sales commissions are deferred when earned and amortized over the same period that revenue is recognized from the related customer contract. Amortization of deferred commissions is included in sales and marketing expense in the consolidated statements of operations.
Cost of Revenue—Cost of revenue consists of cost of product revenue and cost of support and other revenue. Personnel costs associated with the Company’s operations and global customer support organizations consist of salaries, benefits, and stock-based compensation. Allocated costs consist of certain facilities, depreciation and amortization, recruiting, and information technology costs allocated based on headcount.
Warranties—The Company generally provides a one-year warranty on hardware and a 90-day warranty on software licenses. The hardware warranty provides for parts replacement for defective components and the software warranty provides for bug fixes. With respect to the hardware warranty obligation, the Company has a warranty agreement with its contract manufacturers under which the contract manufacturers are generally required to replace defective hardware within three years of shipment. Furthermore, the Company’s PCS agreements provide for the same parts replacement that customers are entitled to under the warranty program, except that replacement parts are delivered according to targeted response times to minimize disruption to the customers’ critical business applications. Substantially all customers purchase PCS agreements.
Given the warranty agreement with the Company’s contract manufacturers and considering that substantially all products are sold together with PCS agreements, the Company generally has very limited exposure related to warranty costs and therefore no warranty reserve has been recognized.
Research and Development—The Company’s research and development expense consists primarily of product development personnel costs, including salaries and benefits, stock-based compensation and allocated facilities costs. Research and development costs are expensed as incurred.
79
Convertible Preferred Stock Warrant Liability—The Company accounted for freestanding warrants to purchase shares of its Convertible Preferred Stock (the “Convertible Preferred Stock Warrants”), as liabilities in the consolidated balance sheets at their estimated fair value. The fair value of the warrants was estimated using the Black-Scholes-Merton (“Black-Scholes”) option-pricing model and was remeasured at fair value at each reporting date until the warrants were converted to common stock upon the completion of the Company’s IPO. Changes in the estimated fair value of the Convertible Preferred Stock Warrants were recorded in the consolidated statements of operations within other expense, net. Upon the conversion of the underlying Convertible Preferred Stock to common stock upon the completion of the Company's IPO, the related convertible preferred stock warrant liability was re-measured to its then fair value and was reclassified to additional paid-in capital.
Stock-Based Compensation—Stock-based compensation expense is measured based on the grant-date fair value of the share-based awards. The fair value of the stock options and purchase rights issued to employees under our ESPP is estimated using Black-Scholes, which is impacted by the fair value of our common stock, as well as changes in assumptions regarding a number of subjective variables. These variables include the expected common stock price volatility over the term of the awards, the expected term of the awards, risk-free interest rates and expected dividend yield. The Company grants both stock awards with service condition only and with service and performance conditions. The Company recognizes stock-based compensation expense for employee stock awards with a service condition only using the straight-line method over the requisite service period of the awards, which is generally the vesting period. The Company uses the accelerated attribution method of recognizing stock-based compensation expense related to its employee stock awards that contain both service and performance conditions. The fair value of the ESPP purchase rights is recognized as an expense on a straight-line basis over the offering period.
The Company determines the fair value of the stock awards issued to non-employees on the date of grant utilizing Black-Scholes. Stock-based compensation expense for stock awards issued to non-employees is recognized over the requisite service period or when it is probable that the performance condition will be satisfied. Awards subject to vesting are periodically remeasured to current fair value over the vesting period.
Foreign Currency—The functional currency of the Company’s foreign subsidiaries is the U.S. dollar. Transactions denominated in currencies other than the functional currency are re-measured at the average exchange rate in effect during the reporting period. At the end of each reporting period all monetary assets and liabilities of the Company’s subsidiaries are re-measured at the current U.S. dollar exchange rate at the end of the reporting period. Remeasurement gains and losses are included within other expense, net in the accompanying consolidated statements of operations. For the year ended July 31, 2015, the Company’s net foreign currency gains were immaterial. During the years ended July 31, 2016 and 2017, the Company recognized foreign currency losses of $1.5 million and $2.6 million, respectively. To date, the Company has not undertaken any hedging transactions related to foreign currency exposure.
Income Taxes—The Company accounts for income taxes using the asset and liability method. Deferred income taxes are recognized by applying enacted statutory tax rates applicable to future years to differences between the financial statement carrying amounts of existing assets and liabilities and their respective tax bases and operating loss and tax credit carryforwards. The effect on deferred tax assets and liabilities of a change in tax rates is recognized in income in the period that includes the enactment date. The measurement of deferred tax assets is reduced, if necessary, by a valuation allowance to amounts that are more likely than not to be realized.
The Company records a liability for uncertain tax positions if it is not more likely than not to be sustained based solely on its technical merits as of the reporting date. The Company considers many factors when evaluating and estimating its tax positions and tax benefits, which may require periodic adjustments and may not accurately anticipate actual outcomes.
Advertising Costs—Advertising costs are charged to sales and marketing expenses as incurred in the consolidated statements of operations. During the years ended July 31, 2015, 2016 and 2017, advertising expense was $3.5 million, $6.5 million and $13.0 million, respectively.
80
Deferred Offering Costs—Deferred offering costs consisted of fees and expenses incurred in connection with the sale of the Company’s common stock in its IPO, including the legal, accounting, printing and other IPO-related costs. Upon completion of the Company’s IPO, these deferred offering costs were reclassified to stockholders’ (deficit) equity and offset against the proceeds of the offering. As of July 31, 2016, deferred offering costs of $4.5 million were included within other assets—non-current. Total deferred offering costs recognized through the completion of the IPO and reclassified to stockholders' deficit and offset against the IPO proceeds were $5.3 million.
Recently Adopted Accounting Pronouncement— In March 2016, the Financial Accounting Standards Board (“FASB”) issued Accounting Standards Update (“ASU”) 2016-09, Stock Compensation, which is intended to simplify several aspects of the accounting for share-based payment award transactions. ASU 2016-09 (i) requires all income tax effects of awards to be recognized in the income statement when the awards vest or are settled, (ii) requires classification of excess tax benefits as an operating activity in the statement of cash flows rather than a financing activity, (iii) eliminates the requirement to defer recognition of an excess tax benefit until the benefit is realized through a reduction to taxes payable, (iv) modifies statutory withholding tax requirements and (v) provides for a policy election to account for forfeitures as they occur. The Company early adopted ASU 2016-09 during the three months ended October 31, 2016. As a result of the adoption of ASU 2016-09, the Company recorded excess tax benefits prospectively in its provision for income taxes. Upon adoption, the Company recognized the previously unrecognized foreign excess tax benefits, which resulted in a cumulative effect adjustment of $0.1 million that reduced its accumulated deficit and increased its foreign deferred tax assets, using a modified retrospective transition method. The previously unrecognized U.S. excess tax benefits were recorded as a deferred tax asset, which was fully offset by a valuation allowance resulting in no impact to the accumulated deficit. Additionally, the Company elected to account for forfeitures as they occur using a modified retrospective transition method, which requires the Company to record cumulative-effect adjustment to accumulated deficit, and determined that the cumulative impact was immaterial. The Company presents its excess tax benefits as a component of operating cash flows rather than financing cash flows on a prospective basis.
In January 2017, the FASB issued ASU 2017-04, Intangibles—Goodwill and Other (Topic 350): Simplifying the Test for Goodwill Impairment. ASU 2017-04 removes Step 2 of the goodwill impairment test, which requires a hypothetical purchase price allocation. An impairment charge will now be the amount by which a reporting unit’s carrying value exceeds its fair value, not to exceed the carrying amount of goodwill. ASU 2017-04 is effective for the Company beginning August 1, 2020, with early adoption permitted for interim or annual goodwill impairment tests performed on testing dates after January 1, 2017. As the Company evaluates goodwill for impairment on an annual basis as of May 1st, the Company early adopted ASU 2017-04 in fiscal 2017 and its adoption did not have any impact on its consolidated financial statements.
Recently Issued and Not Yet Adopted Accounting Pronouncements— In May 2017, the FASB issued ASU 2017-09, Compensation-Stock Compensation (Topic 718): Scope of Modification Accounting, which provides guidance about which changes to the terms or conditions of a share-based payment award require an entity to apply modification accounting in Topic 718. The guidance is effective for annual periods beginning after December 15, 2017, with early adoption permitted, including adoption in any interim period for which financial statements have not yet been issued. The Company is currently evaluating the effect the adoption of this guidance will have on its consolidated financial statements.
In January 2017, the FASB issued ASU No. 2017-01, Business Combinations (Topic 805) to clarify the definition of a business to assist entities with evaluating whether transactions should be accounted for as acquisitions (or disposals) of assets or businesses. The guidance is effective for fiscal years beginning after December 15, 2017 including interim periods within those fiscal years. Early adoption is permitted under certain circumstances. The Company is currently evaluating the effect the adoption of this guidance will have on its consolidated financial statements.
In November 2016, the FASB issued ASU 2016-18, Statement of Cash Flows (Topic 230): Restricted Cash. ASU 2016-18 will require the Company to present the change in the amounts described as restricted cash or restricted cash equivalents in the statement of cash flows. ASU 2016-18 is effective for the Company beginning August 1, 2018, with early adoption permitted. The Company does not believe that adoption of this ASU will have a material impact on its consolidated financial statements.
81
In October 2016, the FASB issued ASU 2016-16, Income Taxes (Topic 740): Intra-Entity Transfers of Assets Other Than Inventory. ASU 2016-16 will require the Company to recognize the income tax consequences of an intra-entity transfer of an asset other than inventory when the transfer occurs. ASU 2016-16 is effective for the Company beginning August 1, 2018, with early adoption permitted. The Company is currently evaluating the effect the adoption of this guidance will have on its consolidated financial statements.
In August 2016, the FASB issued ASU 2016-15, Statement of Cash Flows (Topic 230): Classification of Certain Cash Receipts and Cash Payments. This new standard will make eight targeted changes to how cash receipts and cash payments are presented and classified in the statement of cash flows. The new standard is effective for the Company beginning August 1, 2018. The new standard will require adoption on a retrospective basis unless it is impracticable to apply, in which case the Company would be required to apply the amendments prospectively as of the earliest date practicable. The Company is currently evaluating the effect the adoption of this guidance will have on its consolidated financial statements.
In February 2016, the FASB issued ASU 2016-02, Leases, which requires recognition of right-to-use lease assets and lease liabilities for all leases (with the exception of short-term leases) on the balance sheet of lessees. ASU 2016-02 is effective for the Company beginning August 1, 2019, including interim periods within those fiscal years, with early adoption permitted. This new standard requires a modified retrospective transition approach and provides certain optional transition relief. The Company is currently evaluating the effect the adoption of this guidance will have on its consolidated financial statements.
In May 2014, the FASB issued ASU 2014-09, Revenue from Contracts with Customers (ASC 606). The standard is a comprehensive new revenue recognition model that requires revenue to be recognized in a manner to depict the transfer of goods or services to a customer at an amount that reflects the consideration expected to be received in exchange for those goods or services. The FASB has issued several amendments to the standard, including clarifications on disclosure of prior-period performance obligations and remaining performance obligations.
The guidance permits two methods of adoption: retrospectively to each prior reporting period presented (full retrospective method), or retrospectively with the cumulative effect of initially applying the guidance recognized at the date of initial application (the cumulative catch-up transition method). The new standard will be effective for the Company beginning August 1, 2018, and adoption as of the original effective date of August 1, 2017 is permitted. The Company elected to early adopt the standard effective August 1, 2017 using the full retrospective method, which requires the Company to restate our historical financial information for fiscal years 2016 and 2017 to be consistent with the standard. The most significant impact of the standard relates to the timing of revenue recognition for certain software licenses sold with PCS for which it does not have VSOE under current guidance. Under the new standard the requirement to have VSOE for undelivered elements is eliminated and the Company will recognize revenue for such software licenses upon transfer of control to its customers. In addition, the adoption of ASC 606 will also result in differences in the timing of recognition of contract costs, such as sales commissions, as well as the corresponding impacts to provision for income taxes.
The adoption of the standard will result in the recognition of additional revenue of $58.5 million and $79.0 million for fiscal 2016 and fiscal 2017, respectively, an increase in gross profit of $58.5 million and $79.0 million in fiscal 2016 and fiscal 2017, respectively, a decrease in sales and marketing expense of $1.9 million in fiscal 2016 and an increase in sales and marketing of $0.5 million in fiscal 2017, and a decrease in loss from operations of $60.4 million in fiscal 2016 and $78.5 million in fiscal 2017. In addition, the adoption of the standard will result in a decrease in total net deferred revenue of $78.0 million and $157.0 million as of July 31, 2016 and 2017, respectively, driven by the upfront recognition of software licenses sold with PCS for which the Company does not have VSOE, and an increase in total deferred commissions of $12.6 million and $12.1 million as of July 31, 2016 and 2017, respectively, which will be recognized in sales and marketing expense in future periods. The adoption of the standard will have no significant impact to the provision for income taxes and will have no impact to the net cash from or used in operating, investing, or financing on the Company's consolidated statements of cash flows. See Expected Impacts to Reported Results below for the impact of adoption of the standard on the Company's consolidated balance sheets and consolidated statements of operations.
82
Expected Impacts to Reported Results
The adoption of the standard related to the new revenue recognition is expected to impact our reported results as follows:
Fiscal Year 2016:
Income Statement: | Year Ended July 31, 2016 | ||||||||||
As Reported | Impact of Adoption | As Adjusted | |||||||||
(in thousands, except per share data) | |||||||||||
Product revenue | $ | 350,798 | $ | 63,112 | $ | 413,910 | |||||
Support and other services | 94,130 | (4,630 | ) | 89,500 | |||||||
Total revenue | $ | 444,928 | $ | 58,482 | $ | 503,410 | |||||
Gross profit | $ | 274,141 | $ | 58,482 | $ | 332,623 | |||||
Operating expenses | $ | 439,158 | $ | (1,909 | ) | $ | 437,249 | ||||
Loss from operations | $ | (165,017 | ) | $ | 60,391 | $ | (104,626 | ) | |||
Net Loss | $ | (168,499 | ) | $ | 60,266 | $ | (108,233 | ) | |||
Basic and diluted net loss per share | $ | (3.83 | ) | $ | 1.37 | $ | (2.46 | ) | |||
Fiscal Year 2017:
Income Statement: | Year Ended July 31, 2017 | ||||||||||
As Reported | Impact of Adoption | As Adjusted | |||||||||
(in thousands, except per share data) | |||||||||||
Product revenue | $ | 583,011 | $ | 90,286 | $ | 673,297 | |||||
Support and other services | 183,858 | (11,252 | ) | 172,606 | |||||||
Total revenue | $ | 766,869 | $ | 79,034 | $ | 845,903 | |||||
Gross profit | $ | 439,538 | $ | 79,034 | $ | 518,572 | |||||
Operating expenses | $ | 866,489 | $ | 492 | $ | 866,981 | |||||
Loss from operations | $ | (426,951 | ) | $ | 78,542 | $ | (348,409 | ) | |||
Net Loss | $ | (458,011 | ) | $ | 78,373 | $ | (379,638 | ) | |||
Basic and diluted net loss per share | $ | (3.57 | ) | $ | 0.61 | $ | (2.96 | ) | |||
83
Fiscal Year 2016:
Balance Sheet: | As of July 31, 2016 | ||||||||||
As Reported | Impact of Adoption | As Adjusted | |||||||||
(in thousands, except per share data) | |||||||||||
Deferred commissions - current | $ | 17,864 | $ | (3,648 | ) | (1) | $ | 14,216 | |||
Deferred commissions - non-current | 19,029 | 16,277 | (1) | 35,306 | |||||||
Total deferred commissions | $ | 36,893 | $ | 12,629 | $ | 49,522 | |||||
Deferred revenue - current | $ | 130,569 | $ | (28,962 | ) | (2) | $ | 101,607 | |||
Deferred revenue - non-current | 165,896 | (49,022 | ) | (2) | 116,874 | ||||||
Total deferred revenue | $ | 296,465 | $ | (77,984 | ) | $ | 218,481 | ||||
Accrued expenses and other current liabilities | $ | 5,537 | $ | 125 | (3) | $ | 5,662 | ||||
Stockholders' deficit | $ | (376,315 | ) | $ | 90,488 | $ | (285,827 | ) | |||
Fiscal Year 2017:
Balance Sheet: | As of July 31, 2017 | ||||||||||
As Reported | Impact of Adoption | As Adjusted | |||||||||
(in thousands, except per share data) | |||||||||||
Deferred commissions - current | $ | 27,679 | $ | (3,836 | ) | (1) | $ | 23,843 | |||
Deferred commissions - non-current | 33,709 | 15,975 | (1) | 49,684 | |||||||
Total deferred commissions | $ | 61,388 | $ | 12,139 | $ | 73,527 | |||||
Deferred revenue - current | $ | 233,498 | $ | (63,375 | ) | (2) | $ | 170,123 | |||
Deferred revenue - non-current | 292,573 | (93,640 | ) | (2) | 198,933 | ||||||
Total deferred revenue | $ | 526,071 | $ | (157,015 | ) | $ | 369,056 | ||||
Accrued expenses and other current liabilities | $ | 9,414 | $ | 293 | (3) | $ | 9,707 | ||||
Stockholders' equity | $ | 48,202 | $ | 168,861 | $ | 217,063 | |||||
_______________________
(1) Impact of cumulative change in commissions expense
(2) Impact of cumulative change in revenue
(3) Impact of cumulative change in provision for income taxes
84
NOTE 3. | BUSINESS COMBINATIONS |
Calm Acquisition
On August 22, 2016, the Company completed the acquisition of all outstanding shares of Calm, a company based in Singapore which specializes in container and DevOps automation, for an aggregate purchase price of $7.7 million, net of cash acquired (the “Calm Acquisition”). Consideration consisted of 528,517 shares of the Company’s common stock and $1.4 million of cash. The preliminary purchase price allocation includes $4.8 million of goodwill and $4.0 million of identifiable intangible assets, which primarily consist of developed technology, with an expected useful life of approximately 4.8 years. Goodwill represents the excess of the purchase price over the fair value of the net tangible and intangible assets acquired, and is not expected to be deductible for income tax purposes. The goodwill in this transaction is primarily attributable to the acquired workforce and expected operating synergies. The Company incurred approximately $0.6 million of acquisition costs related to the Calm Acquisition.
The results of operations of Calm are included in the results of the Company beginning on the date the acquisition was completed. Actual and pro forma results of operations have not been presented as the total amounts of revenue and net income are not material to the Company’s consolidated results for the year ended July 31, 2017.
PernixData Acquisition
On September 6, 2016, the Company completed the acquisition of PernixData, a company based in the U.S., which specializes in scale-out data acceleration and analytics, for an aggregate purchase price of $23.0 million (the “PernixData Acquisition”). Total consideration consisted of 1,711,019 shares of the Company’s common stock and contingent consideration. Total potential contingent payments amount to $19.0 million, which may be payable over the next three years upon the achievement of certain operating milestones. Up to $7.5 million of the contingent payments are deemed to be part of the purchase price, which may be limited based on certain closing conditions, including PernixData’s working capital upon completion of the acquisition. Up to $11.5 million of the payments also require future services to be provided to the Company by the related employees and will be recorded as compensation expense over the service period. The fair value of the contingent consideration considered to be part of the purchase price was $2.4 million as of the acquisition date, and is net of expected limitations of approximately $1.8 million due to closing conditions. The Company incurred approximately $0.7 million of acquisition costs related to the PernixData Acquisition.
As of the date of the PernixData Acquisition, the preliminary purchase price allocation was as follows (in thousands):
Cash and cash equivalents | $ | 1,051 | |
Accounts receivable | 718 | ||
Goodwill | 11,853 | ||
Intangible assets | 24,270 | ||
Other assets | 761 | ||
Deferred revenue | (6,007 | ) | |
Debt | (7,124 | ) | |
Other liabilities | (2,515 | ) | |
Total | $ | 23,007 | |
Goodwill represents the excess of the purchase price over the fair value of the net tangible and intangible assets acquired and is not expected to be deductible for income tax purposes. The goodwill in this transaction is primarily attributable to the acquired workforce and expected operating synergies.
85
The acquired identifiable intangible assets consist of (in thousands, except estimated useful life):
Amount | Estimated Useful Life (in years) | ||||
In-process R&D | $ | 16,100 | — | ||
Developed technology | 3,570 | 5 | |||
Customer relationships | 4,600 | 6 | |||
$ | 24,270 | ||||
In-process R&D is tested for impairment at least annually, or whenever events or changes in circumstances indicate that the carrying value of the asset may not be recoverable. The Company will start amortizing the in-process R&D during the first quarter of fiscal 2018 over a useful life of between 5 to 7 years as the related technology was completed and released in the first quarter of fiscal 2018.
Unaudited Pro Forma Combined Consolidated Financial Information—The following unaudited pro forma combined consolidated financial information summarizes the combined results of operations of the Company and PernixData as though the PernixData Acquisition occurred on August 1, 2015. The unaudited pro forma combined consolidated financial information for all periods presented also included the business combination accounting effects resulting from this acquisition, including amortization charges from acquired intangible assets. The results of operations of PernixData are included in the results of the Company beginning on the date of the acquisition, and are not material.
The unaudited pro forma combined consolidated financial information is as follows (in thousands, except per share data):
Fiscal Year Ended July 31, | |||||||
2016 | 2017 | ||||||
Revenue | $ | 454,665 | $ | 767,681 | |||
Net loss | $ | (199,351 | ) | $ | (459,454 | ) | |
Basic and diluted net loss per share | $ | (4.36 | ) | $ | (3.53 | ) | |
86
NOTE 4. | FAIR VALUE MEASUREMENTS |
The authoritative guidance on fair value measurements establishes a three-tier fair value hierarchy based on the observability of the inputs available in the market used to measure fair value as follows:
• | Level I—Inputs are unadjusted, quoted prices in active markets for identical assets or liabilities at the measurement date; |
• | Level II—Inputs are observable, unadjusted quoted prices in active markets for similar assets or liabilities, unadjusted quoted prices for identical or similar assets or liabilities in markets that are not active, or other inputs that are observable or can be corroborated by observable market data for substantially the full term of the related assets or liabilities; and |
• | Level III—Unobservable inputs that are significant to the measurement of the fair value of the assets or liabilities that are supported by little or no market data. |
Assets and Liabilities Measured at Fair Value on a Recurring Basis
Cash equivalents and short-term investments. The Company’s money market funds are classified within Level I due to the highly liquid nature of these assets and have unadjusted inputs, quoted prices in active markets for these assets at the measurement date from the financial institution that carries these investment securities. The Company’s investments in available-for-sale debt securities such as commercial paper and corporate bonds are classified within Level II. The fair value of these securities is priced by using inputs based on non-binding market consensus prices that are corroborated by observable market data, quoted market prices for similar instruments, or pricing models such as discounted cash flow techniques.
Convertible Preferred Stock warrant liability. The Company’s convertible preferred stock warrant liability is classified within Level III. The convertible preferred stock warrant liability is measured at fair value on a recurring basis using Black-Scholes. The valuation takes into account multiple inputs, such as the estimated fair value of the underlying stock at the valuation measurement date, the remaining contractual term of the warrants, risk-free interest rates, expected dividends and the expected volatility of the underlying stock. Generally, changes in the fair value of the underlying stock would result in a directionally similar impact to the fair value measurement. The valuation methodology and underlying assumptions are discussed further in Note 8.
The fair value of the Company’s financial assets and liabilities measured on a recurring basis is as follows:
As of July 31, 2016 | |||||||||||||||
Level I | Level II | Level III | Total | ||||||||||||
(In thousands) | |||||||||||||||
Financial Assets: | |||||||||||||||
Cash equivalents: | |||||||||||||||
Money market funds | $ | 47,305 | $ | — | $ | — | $ | 47,305 | |||||||
Commercial paper | — | 4,999 | — | 4,999 | |||||||||||
Short-term investments: | |||||||||||||||
Corporate bonds | — | 64,360 | — | 64,360 | |||||||||||
Commercial paper | — | 21,631 | — | 21,631 | |||||||||||
Total measured at fair value | 47,305 | 90,990 | — | 138,295 | |||||||||||
Cash | 46,905 | ||||||||||||||
Total cash, cash equivalents and short-term investments | $ | 185,200 | |||||||||||||
Financial Liabilities: | |||||||||||||||
Convertible preferred stock warrant liability | $ | — | $ | — | $ | 9,679 | $ | 9,679 | |||||||
87
As of July 31, 2017 | |||||||||||||||
Level I | Level II | Level III | Total | ||||||||||||
(In thousands) | |||||||||||||||
Financial Assets: | |||||||||||||||
Cash equivalents: | |||||||||||||||
Money market funds | $ | 34,784 | $ | — | $ | — | $ | 34,784 | |||||||
Commercial paper | — | 23,041 | — | 23,041 | |||||||||||
Short-term investments: | |||||||||||||||
Corporate bonds | — | 160,634 | — | 160,634 | |||||||||||
Commercial paper | — | 36,084 | — | 36,084 | |||||||||||
U.S. government securities | — | 13,976 | — | 13,976 | |||||||||||
Total measured at fair value | 34,784 | 233,735 | — | 268,519 | |||||||||||
Cash | 80,534 | ||||||||||||||
Total cash, cash equivalents and short-term investments | $ | 349,053 | |||||||||||||
Financial Liabilities: | |||||||||||||||
Contingent consideration | $ | — | $ | — | $ | 4,295 | $ | 4,295 | |||||||
A summary of the changes in the fair value of the Company’s convertible preferred stock warrant liability is as follows (in thousands):
Fiscal Year Ended July 31, | |||||||||||
2015 | 2016 | 2017 | |||||||||
Convertible preferred stock warrant liability—beginning balance | $ | 5,507 | $ | 11,683 | $ | 9,679 | |||||
Change in fair value* | 6,176 | (2,004 | ) | 21,133 | |||||||
Reclassification of unexercised warrants to APIC upon the IPO | — | — | (30,812 | ) | |||||||
Convertible preferred stock warrant liability—ending balance | $ | 11,683 | $ | 9,679 | $ | — | |||||
______________
* | Recognized in the consolidated statements of operations within other expense—net. |
A summary of the changes in the fair value of the Company’s contingent consideration is as follows (in thousands):
Fiscal Year Ended July 31, 2017 | |||
Contingent consideration—beginning balance | $ | — | |
Assumed in the PernixData acquisition | 2,371 | ||
Change in fair value* | 1,924 | ||
Contingent consideration—ending balance | $ | 4,295 | |
______________
* | Recognized in the consolidated statements of operations within general and administrative expenses. |
The Company remeasures the fair value of its Level 3 contingent consideration liability using the Monte Carlo simulation on projected future payments. The fair value is determined by calculating the net present value of the expected payments using significant inputs that are not observable in the market, including the probability of achieving the milestone, estimated bookings and discount rates. The fair value of the contingent consideration will increase or decrease according to the movement of the inputs.
88
NOTE 5. | BALANCE SHEET COMPONENTS |
Short-Term Investments—The amortized cost of the Company’s short-term investments approximate their fair value. As of July 31, 2016 and 2017, unrealized gains or losses from the Company’s short-term investments were immaterial and there were no securities that were in an unrealized loss position for more than 12 months.
The following table summarizes the estimated fair value of the Company’s investments in marketable debt securities, by the contractual maturity date (in thousands):
As of July 31 | |||
2017 | |||
Due within 1 year | $ | 151,014 | |
Due after 1 year through 3 years | 59,680 | ||
Total | $ | 210,694 | |
Property and Equipment—Net—Property and equipment, net consists of the following (in thousands):
Estimated Useful Life | As of July 31 | ||||||||
2016 | 2017 | ||||||||
(In months) | |||||||||
Computer, production, engineering and other equipment | 36 | $ | 54,161 | $ | 85,280 | ||||
Demonstration units | 12 | 33,184 | 46,387 | ||||||
Leasehold improvements | ** | 6,619 | 10,562 | ||||||
Furniture and fixtures | 60 | 3,641 | 4,744 | ||||||
Total property and equipment—gross | 97,605 | 146,973 | |||||||
Less accumulated depreciation and amortization | (55,387 | ) | (88,901 | ) | |||||
Total property and equipment—net | $ | 42,218 | $ | 58,072 | |||||
_________________
** Leasehold improvements are amortized over the shorter of the estimated useful lives of the improvements or the remaining lease term.
Depreciation and amortization expense for the fiscal years ended July 31, 2015, 2016 and 2017 was $16.6 million, $26.4 million and $38.4 million, respectively.
Intangible Assets—Net—Intangible assets, net consists of the following (in thousands):
As of July 31, 2017 | |||
Indefinite-lived intangible asset: | |||
In-process R&D | $ | 16,100 | |
Finite-lived intangible assets: | |||
Developed technology | 7,300 | ||
Customer relationships | 4,830 | ||
Total finite-lived intangible assets, gross | 12,130 | ||
Total intangible assets, gross | 28,230 | ||
Less: | |||
Accumulated amortization of developed technology | (1,314 | ) | |
Accumulated amortization of customer relationships | (915 | ) | |
Total accumulated amortization | (2,229 | ) | |
Intangible assets, net | $ | 26,001 | |
89
Changes in the net book value of intangible assets are as follows (in thousands):
Fiscal Year Ended July 31, 2017 | |||
Intangible assets, net—beginning balance | $ | — | |
Acquired in the Calm Acquisition | 3,960 | ||
Acquired in the PernixData Acquisition | 24,270 | ||
Amortization of intangible assets * | (2,229 | ) | |
Intangible assets, net—ending balance | $ | 26,001 | |
______________
* | Represents amortization expense of finite-lived intangible assets recognized in the consolidated statement of operations during the year within product cost of revenue and sales and marketing expenses. |
Estimated future amortization expense of finite-lived intangible assets is as follows:
Fiscal Year Ending July 31: | (In thousands) | ||
2018 | $ | 2,220 | |
2019 | 2,201 | ||
2020 | 2,201 | ||
2021 | 2,201 | ||
Thereafter | 1,078 | ||
Total | $ | 9,901 | |
Goodwill - Changes in the carrying amount of goodwill for fiscal 2017 are as follows (in thousands):
Fiscal Year Ended July 31, 2017 | |||
Goodwill—beginning balance | $ | — | |
Acquired in the Calm Acquisition | 4,819 | ||
Acquired in the PernixData Acquisition | 11,853 | ||
Goodwill—ending balance | $ | 16,672 | |
Accrued Compensation and Benefits—Accrued compensation and benefits consists of the following (in thousands):
As of July 31 | |||||||
2016 | 2017 | ||||||
Accrued commissions | $ | 14,203 | $ | 20,388 | |||
Contributions to ESPP withheld | — | 14,371 | |||||
Accrued bonus | 3,592 | 7,342 | |||||
Accrued vacation | 3,490 | 6,286 | |||||
Payroll taxes payable | 1,234 | 3,434 | |||||
Other | 2,028 | 5,700 | |||||
Total accrued compensation and benefits | $ | 24,547 | $ | 57,521 | |||
90
Accrued Expenses and Other Current Liabilities—Accrued expenses and other current liabilities consists of the following (in thousands):
As of July 31 | |||||||
2016 | 2017 | ||||||
Accrued professional services | $ | 3,585 | $ | 4,167 | |||
Income taxes payable | 1,417 | 3,580 | |||||
Other | 535 | 1,667 | |||||
Total accrued expenses and other current liabilities | $ | 5,537 | $ | 9,414 | |||
NOTE 6. | DEBT |
Senior Notes—In April 2016, the Company issued an aggregate principal amount of $75.0 million of senior notes due on April 15, 2019 (the “Senior Notes”) to a lender. The Senior Notes contained a guaranteed minimum return to the holder of the Senior Notes (the “Guaranteed Minimum Return”). In September 2016, the Company fully repaid all outstanding principal balance of the Senior Notes and incurred approximately $3.3 million of loss on debt extinguishment, which consisted of $1.7 million of unamortized debt issuance costs and $1.6 million of debt extinguishment costs primarily related to the Guaranteed Minimum Return.
NOTE 7. | COMMITMENTS AND CONTINGENCIES |
Operating Leases—The Company has commitments for future payments related to its office facility leases and other contractual obligations. The Company leases its office facilities under non-cancelable operating lease agreements expiring through the year ending 2024. Certain of these lease agreements have free or escalating rent payments. The Company recognizes rent expense under such agreements on a straight-line basis over the lease term, with any free or escalating rent payments amortized as a reduction or addition of rent expense over the lease term.
Future minimum payments due under operating leases as of July 31, 2017 are as follows (in thousands):
Fiscal Year Ending July 31: | |||
2018 | $ | 16,304 | |
2019 | 14,891 | ||
2020 | 12,758 | ||
2021 | 9,197 | ||
2022 | 3,535 | ||
Thereafter | 1,692 | ||
Total | $ | 58,377 | |
Rent expense incurred under operating leases was $4.0 million, $7.6 million and $12.7 million for the years ended July 31, 2015, 2016 and 2017, respectively.
Purchase Commitments—In the normal course of business, the Company makes commitments with its third-party hardware product manufacturers to manufacture its inventories and non-standard components based on its forecasts. These commitments consist of obligations for on-hand inventories and non-cancelable purchase orders for non-standard components. The Company records a charge for firm, non-cancelable and unconditional purchase commitments with its third-party hardware product manufacturers for non-standard components when and if quantities exceed its future demand forecasts through a charge to cost of product sales. As of July 31, 2017, the Company had approximately $72.6 million of non-cancellable purchase commitments with its contract manufacturers. As of July 31, 2017, the Company had approximately $26.6 million in other purchase obligations pertaining to its normal operations.
91
Guarantees—The Company has entered into agreements with some of its Partners and customers that contain indemnification provisions in the event of claims alleging that the Company’s products infringe the intellectual property rights of a third party. The scope of such indemnification varies, and may include, in certain cases, the ability to cure the indemnification by modifying or replacing the product at the Company’s own expense, requiring the return and refund of the infringing product, procuring the right for the partner and/or customer to continue to use or distribute the product, as applicable, and/or defending the partner or customer against and paying any damages from third-party actions based upon claims of infringement. Other guarantees or indemnification arrangements include guarantees of product and service performance. The fair value of liabilities related to indemnifications and guarantee provisions are not material and have not had any material impact on the consolidated financial statements to date.
Litigation —From time to time, the Company may become involved in various litigation and administrative proceedings relating to claims arising from its operations in the normal course of business. Management is not currently aware of any matters that may have a material adverse impact on the Company’s business, financial position, results of operations or cash flows.
NOTE 8. | CONVERTIBLE PREFERRED STOCK WARRANTS |
The Convertible Preferred Stock Warrants outstanding prior to the IPO were as follows (in thousands, except for share and per share amounts):
Fair Value as of | ||||||||||||||||||
Class of Shares | Issuance Date | Contractual Term | Number of Shares | Exercise Price per Share | July 31, 2016 | IPO Date(1) | ||||||||||||
Series A warrants | December 21, 2009 | 10 years | 683,644 | $ | 0.234 | $ | 8,259 | $ | 25,883 | |||||||||
Series A warrants | May 10, 2010 | 10 years | 85,450 | $ | 0.234 | 1,032 | 3,235 | |||||||||||
Series D warrants | November 26, 2013 | 10 years | 10,000 | $ | 7.289 | 77 | 308 | |||||||||||
Series D warrants | December 12, 2013 | 7 years | 45,000 | $ | 7.289 | 311 | 1,386 | |||||||||||
824,094 | $ | 9,679 | (2) | $ | 30,812 | |||||||||||||
______________
(1) | Immediately prior to the closing of the Company’s IPO. |
(2) Reflected in the consolidated balance sheets as convertible preferred stock warrant liability.
Immediately prior to the closing of the Company’s IPO, all outstanding convertible preferred stock warrants automatically converted to common stock warrants, and then were reclassified as Class B common stock warrants. As a result of the automatic conversion of the convertible preferred stock warrants to Class B common stock warrants, the Company revalued the convertible preferred stock warrants as of the completion of the IPO and reclassified the outstanding preferred stock warrant liability balance to additional paid-in capital with no further remeasurements as the common stock warrants are now deemed permanent equity. During the year ended July 31, 2017, a total of 789,914 Class B common stock warrants were exercised. As a result, during the year ended July 31, 2017, the Company issued a total of 775,554 shares of Class B common stock as the contracts allow a net share settlement for Class B common stock. As of July 31, 2017, there were 34,180 Class B common stock warrants outstanding.
Prior to the Company's IPO, it estimated the fair value of each Convertible Preferred Stock Warrants using Black-Scholes with the following assumptions:
Fair Value of Convertible Preferred Stock—The fair value of Convertible Preferred Stock represented the fair value of the underlying Convertible Preferred Stock that the warrants were convertible into.
Remaining Contractual Term—The remaining contractual term represented the time from the date of the valuation to the expiration of the warrant.
Risk-Free Interest Rate—The risk-free interest rate was based on U.S. Treasury yield in effect as of the measurement dates, and for zero coupon U.S. Treasury notes with maturities approximately equal to the term of the warrant.
92
Volatility—The volatility was derived from historical volatilities of several unrelated publicly-listed peer companies over a period approximately equal to the term of the warrant because the Company had limited information on the volatility of the Convertible Preferred Stock since there was currently no trading history. When making the selections of industry peer companies to be used in the volatility calculation, the Company considered the size, operational and economic similarities to the Company’s principle business operations.
Dividend Yield—The expected dividend assumption was based on the Company’s current expectations about the Company’s anticipated dividend policy.
The assumptions used to determine the fair value of the Company’s Series A convertible preferred stock warrants prior to the Company's IPO are as follows:
As of July 31, 2016 | ||||
Fair value of convertible preferred stock | $ | 12.31 | ||
Risk-free interest rate | 0.9 | % | ||
Contractual term (in years) | 3.4 | |||
Volatility | 54 | % | ||
Dividend yield | — | |||
The assumptions used to determine the fair value of the Company’s Series D convertible preferred stock warrants prior to the Company's IPO are as follows:
As of July 31, 2016 | ||||
Fair value of convertible preferred stock | $ | 13.16 | ||
Risk-free interest rate | 1.0 | % | ||
Contractual term (in years) | 4.9 | |||
Volatility | 35 | % | ||
Dividend yield | — | |||
NOTE 9. CONVERTIBLE PREFERRED STOCK
Series A Convertible Preferred Stock, Series B Convertible Preferred Stock, Series C Convertible Preferred Stock, Series D Convertible Preferred Stock and Series E Convertible Preferred Stock (collectively the “Convertible Preferred Stock”) outstanding consisted of the following as of July 31, 2016 and as of immediately prior to the automatic conversion of the Convertible Preferred Stock into Class B common stock:
Shares Authorized | Shares Issued and Outstanding | Aggregate Liquidation Preference | |||||||
(In thousands) | |||||||||
Series A | 28,165,300 | 27,396,198 | $ | 15,494 | |||||
Series B | 16,558,441 | 16,558,441 | 25,250 | ||||||
Series C | 7,683,710 | 7,683,710 | 33,000 | ||||||
Series D | 13,912,438 | 13,857,438 | 151,500 | ||||||
Series E | 11,943,420 | 10,823,724 | 145,000 | ||||||
78,263,309 | 76,319,511 | $ | 370,244 | ||||||
Immediately prior to the closing of the Company’s IPO, all shares of the Company’s then-outstanding Convertible Preferred Stock, as shown in the table above, automatically converted on a one-for-one basis into an aggregate of 76,319,511 shares of common stock, which were then reclassified into Class B common stock.
93
NOTE 10. | STOCKHOLDERS’ EQUITY |
Preferred Stock
Immediately prior to the closing of the Company’s IPO, the Company filed an Amended and Restated Certificate of Incorporation, which authorized the issuance of undesignated preferred stock with rights and preferences, including voting rights, designated from time to time by the Company’s Board of Directors (the “Board”). As of July 31, 2017, there were 200,000,000 shares of preferred stock authorized with a par value of $0.000025 and no shares of preferred stock issued and outstanding.
Common Stock
In connection with the IPO, the Company established two classes of authorized common stock, Class A common stock and Class B common stock. All shares of common stock outstanding immediately prior to the IPO, including shares of common stock issued upon the conversion of the Convertible Preferred Stock, were converted into an equivalent number of shares of Class B common stock. As of July 31, 2017, the Company had 1,000,000,000 shares of Class A common stock authorized with a par value of $0.000025 per share and 200,000,000 shares of Class B common stock authorized with a par value of $0.000025 per share. As of July 31, 2017, 93,570,171 shares of Class A common stock were issued and outstanding and 61,066,349 shares of Class B common stock were issued and outstanding.
Holders of Class A common stock are entitled to one vote for each share of Class A common stock held on all matters submitted to a vote of stockholders and holders of Class B common stock are entitled to ten votes for each share of Class B common stock held on all matters submitted to a vote of stockholders. Except with respect to voting, the rights of the holders of Class A and Class B common stock are identical. Shares of Class B common stock are voluntarily convertible into shares of Class A common stock at the option of the holder and are generally automatically converted into shares of the Company's Class A common stock upon sale or transfer. Shares issued in connection with exercises of stock options, vesting of restricted stock units, or shares purchased under the employee stock purchase plan are generally automatically converted into shares of the Company’s Class A common stock. Shares issued in connection with an exercise of the common stock warrants are converted into shares of the Company’s Class B common stock.
Common Stock Reserved For Issuance
As of July 31, 2017, we had reserved shares of common stock for future issuance as follows:
July 31, 2017 | ||
Shares reserved for future equity grants | 15,149,589 | |
Shares underlying outstanding stock options | 20,334,531 | |
Shares underlying outstanding restricted stock units | 17,376,090 | |
Shares reserved for future employee stock purchase plan awards | 2,553,946 | |
Shares underlying outstanding common stock warrants | 34,180 | |
Total | 55,448,336 | |
94
NOTE 11. | EQUITY AWARD PLANS |
Stock Plans—In June 2010, the Company adopted the 2010 Stock Plan (“2010 Plan”), and in December 2011, the Company adopted the 2011 Stock Plan (“2011 Plan”). In December 2015, the Board adopted the 2016 Equity Incentive Plan (“2016 Plan” and together with the 2010 Plan and 2011 Plan, the “Stock Plans”), which was amended in September 2016. The Company’s stockholders approved the 2016 Plan in March 2016 and it became effective in connection with the Company’s IPO. As a result, upon the IPO, the Company ceased granting additional stock awards under the 2010 Plan and 2011 Plan and the 2010 Plan and 2011 Plan terminated. Any outstanding stock awards under the 2010 Plan and 2011 Plan will remain outstanding, subject to the terms of the applicable plan and award agreements, until such shares are issued under those stock awards, by exercise of stock options or settlement of RSUs, or until those stock awards become vested or expired by their terms. Under the 2016 Plan, the Company may grant incentive stock options (“ISO”), non-statutory stock options (“NSO”), restricted stock (“RS”), restricted stock units (“RSU”) and stock appreciation rights (“SAR”) to employees, directors and consultants. The Company has initially reserved 22,400,000 shares of the Company’s Class A common stock for issuance under the 2016 Plan. The number of shares of Class A common stock available for issuance under the 2016 Plan will also include an annual increase on the first day of each fiscal year beginning in fiscal year 2018, equal to the lesser of: 18,000,000 shares, 5% of the outstanding shares of all classes of common stock as of the last day of the Company’s immediately preceding fiscal year, or such other amount as may be determined by the Board. In addition, up to a maximum of 38,667,284 shares of Class B common stock returned to the 2010 Plan and 2011 Plan as the result of expiration or termination of awards after the IPO will also become available for issuance under the 2016 Plan. As of July 31, 2017, the Company had reserved a total of 52,860,210 shares for the issuance of equity awards under the Stock Plans, of which 15,149,589 shares were still available for grant.
Restricted Stock Units
Performance RSUs. The Company grants RSUs that contain both service and performance conditions to its executives and employees. Vesting of the Performance RSUs is subject to continuous service with the Company and satisfaction of certain liquidity events of the Company, including the expiration of a lock-up period established in connection with the IPO, or both certain liquidity events and specified performance targets (collectively, the “Performance RSUs”). While the Company recognizes cumulative stock-based compensation expense for the portion of the awards for which the service condition has been satisfied when it is probable that the performance conditions will be met, vesting and settlement of the Performance RSUs are subject to the performance conditions actually being met. During the first quarter of fiscal 2017, the Company began to recognize Performance RSUs with liquidity event performance conditions as the satisfaction of the performance conditions for vesting became probable.
The Company’s summary of RSU activity under the Stock Plans is as follows:
Number of Shares | Grant Date Fair Value per Share | |||||
Outstanding—July 31, 2016 | 12,265,369 | $ | 13.23 | |||
Granted | 12,986,597 | $ | 21.84 | |||
Released | (6,146,169 | ) | $ | 15.63 | ||
Canceled/forfeited | (1,729,707 | ) | $ | 13.57 | ||
Outstanding—July 31, 2017 | 17,376,090 | $ | 18.85 | |||
Offer to Exchange Stock Options for RSUs (the “Tender Offer”). In July 2016, the Company approved a tender offer stock option exchange program under which outstanding employee stock options with exercise prices of $8.41 or greater per share could be exchanged for a specified number of Performance RSUs based on a predetermined exchange ratio granted with a new vesting period. As a result of the Tender Offer, on August 16, 2016, stock options to purchase 1,361,317 common shares were cancelled and, in exchange, the Company granted 911,489 Performance RSUs to eligible employees. The Tender Offer resulted in a total incremental stock-based compensation expense of approximately $3.4 million.
95
Employee Stock Purchase Plan—In December 2015, the Board adopted the 2016 Employee Stock Purchase Plan, which was subsequently amended in January 2016 and September 2016 and approved by the Company’s stockholders in March 2016 (the “2016 ESPP”). The 2016 ESPP became effective in connection with the Company’s IPO. A total of 3,800,000 shares of Class A common stock were initially reserved for issuance under the 2016 ESPP. The number of shares of Class A common stock available for sale under the 2016 ESPP will also include an annual increase on the first day of each fiscal year beginning in fiscal 2018, equal to the lesser of: 3,800,000 shares, 1% of the outstanding shares of all classes of common stock as of the last day of the Company’s immediately preceding fiscal year, or such other amount as may be determined by the Board.
The 2016 ESPP allows eligible employees to purchase shares of the Company’s Class A common stock at a discount through payroll deductions of up to 15% of eligible compensation, subject to caps of $25,000 in any calendar year and 1,000 shares on any purchase date. The 2016 ESPP provides for 12-month offering periods generally beginning March and September of each year, and each offering period consists of two six-month purchase periods. The initial offering period began in September 2016 and will end in September 2017.
On each purchase date, participating employees will purchase Class A common stock at a price per share equal to 85% of the lesser of the fair market value of the Company’s Class A common stock on (i) the first trading day of the applicable offering period and (2) the last trading day of each purchase period in the applicable offering period. If the stock price of the Company's Class A common stock on any purchase date in an offering period is lower than the stock price on the enrollment date of that offering period, the offering period will immediately reset after the purchase of shares on such purchase date and automatically roll into a new offering period.
For the first offering period, which began on September 30, 2016, the fair market value of the common stock used for the first offering period was $16, the IPO price of the Company’s Class A common stock, and on April 5, 2017, 1,246,054 shares of common stock were purchased for an aggregate amount of $16.9 million. As of July 31, 2016, 2,553,946 shares were available for future issuance under the 2016 ESPP.
The Company uses the Black-Scholes option-pricing model to determine the fair value of shares purchased under the 2016 ESPP with the following weighted-average assumptions on the date of grant (on October 11, 2016 and April 5, 2017):
Fiscal Year Ended July 31, 2017 | ||
Expected term (in years) | 0.75 | |
Risk-free interest rate | 0.6 | % |
Volatility | 51.0 | % |
Dividend yield | — | % |
Stock Options
The Board determines the period over which stock options become exercisable and stock options generally vest over a four-year period. Stock options generally expire 10 years from the date of grant. The term of an ISO grant to a 10% stockholder will not exceed five years from the date of the grant. The exercise price of an ISO will not be less than 100% of the estimated fair value of the shares of common stock underlying the stock option (or 110% of the estimated fair value in the case of an ISO granted to a 10% stockholder) on the date of grant. The exercise price of a NSO is determined by the Board at the time of grant, and is generally not less than 100% of the estimated fair value of the shares of common stock underlying the stock option on the date of grant.
96
The Company’s stock option activity under the Stock Plan is as follows:
Options Outstanding | |||||||||||||
Number of Shares | Weighted- Average Exercise Price | Weighted- Average Remaining Contractual Life | Aggregate Intrinsic Value | ||||||||||
(In years) | (In thousands) | ||||||||||||
Outstanding—August 1, 2016 | 26,166,968 | (1) | $ | 4.39 | 7.5 | $ | 208,101 | ||||||
Options granted | 1,047,950 | 12.14 | |||||||||||
Options exercised | (4,786,381 | ) | 3.27 | ||||||||||
Options canceled/forfeited | (2,094,006 | ) | 8.89 | ||||||||||
Outstanding—July 31, 2017 | 20,334,531 | 4.59 | 6.4 | 338,787 | |||||||||
Exercisable—July 31, 2017 | 19,645,676 | 4.43 | 6.3 | 330,486 | |||||||||
Vested and expected to vest—July 31, 2017 | 20,334,531 | 4.59 | 6.4 | 338,787 | |||||||||
(1) | Includes 455,000 stock options with both service and performance conditions with a weighted-average fair value per share of $3.78 (the “Performance Stock Options”). Vesting of the Performance Stock Options was subject to continuous service with the Company (the “service condition”) and satisfaction of certain liquidity events of the Company (the “performance condition”). The Company recognized cumulative stock-based compensation expense related to the Performance Stock Options in the first quarter of fiscal year 2017 as the performance condition was met upon the Company's successful IPO. The cumulative stock-based compensation expense recorded in the first quarter of fiscal 2017 was for the portion of the awards for which the relevant service condition had been satisfied and the remaining expense is being recognized over the remaining service period. |
The stock options exercisable as of July 31, 2017 include 15,241,715 of stock options are related to vested options and 4,403,961 of stock options that are unvested with an early exercise provision. The weighted-average grant-date fair value per share of stock options granted was $4.86, $6.36 and $6.41 for the years ended July 31, 2015, 2016 and 2017, respectively. The aggregate intrinsic value of stock options exercised was $16.2 million, $18.3 million and $73.9 million for the years ended July 31, 2015, 2016 and 2017, respectively. Aggregate intrinsic value represents the difference between the exercise price of the options and the estimated fair value of the Company’s common stock. The total grant date fair value of stock options vested was $10.8 million, $23.9 million and $16.1 million for the years ended July 31, 2015, 2016 and 2017, respectively. The vested and expected to vest amounts included in the table above exclude early exercised stock options of 243,148 as of July 31, 2017.
Early Exercise of Stock Options. The Company issued 1,019,223, 269,737 and 67,360 shares of common stock for total proceeds of $3.3 million, $0.8 million and $0.2 million, respectively, related to exercises of unvested stock options (the “early exercised stock options”) during the years ended July 31, 2015, 2016 and 2017. The shares of common stock issued in connection with the early exercised stock options are subject to the Company’s repurchase right at the original purchase price. The proceeds initially are recorded as a liability and reclassified to common stock and additional paid in capital as the Company’s repurchase right lapses. As of July 31, 2016 and 2017, 954,215 and 243,148 respectively, shares of common stock related to the early exercised stock options held by employees at an aggregate price of $2.3 million and $0.9 million, respectively, were subject to the Company’s repurchase right.
97
Stock-Based Compensation—Total stock-based compensation expense recognized for stock awards granted under the equity award plans in the consolidated statements of operations is as follows (in thousands):
Fiscal Year Ended July 31, | |||||||||||
2015 | 2016 | 2017 | |||||||||
Cost of revenue: | |||||||||||
Product | $ | 363 | $ | 391 | $ | 3,066 | |||||
Support and other services | 718 | 968 | 10,411 | ||||||||
Sales and marketing | 6,474 | 8,006 | 78,117 | ||||||||
Research and development | 5,411 | 6,259 | 109,044 | ||||||||
General and administrative | 4,174 | 4,432 | 30,853 | ||||||||
Total stock-based compensation expense | $ | 17,140 | $ | 20,056 | $ | 231,491 | |||||
Fiscal year 2017 included cumulative stock-compensation expense related to stock awards with performance conditions, which vesting was deemed probable in the first quarter of fiscal 2017 upon the Company’s successful IPO. Prior to fiscal 2017, no expense was recognized related to these stock awards with performance conditions as vesting was not deemed probable. The cumulative stock-based compensation expense recorded in the first quarter of fiscal 2017 was for the portion of the awards for which the relevant service condition had been satisfied and the Company has continued to recognize the remaining expense over the remaining service period.
As of July 31, 2017, unrecognized stock-based compensation expense related to the outstanding stock awards was approximately $273.6 million and is expected to be recognized over a weighted-average period of approximately 2.2 years.
Determination of Fair Value—The fair value of options granted to employees is estimated on the grant date using Black-Scholes. Compensation expense related to options granted to non-employees is recognized as the equity instruments vest, and such options are revalued at each reporting date. As a result, compensation expense related to unvested options granted to non-employees fluctuates as the fair value of the Company’s common stock fluctuates.
The valuation model for stock-based compensation expense requires the Company to make assumptions and judgments about the variables used in the calculation, including the expected term (weighted-average period of time that the options granted are expected to be outstanding), the expected volatility of the Company’s common stock, a risk-free interest rate and expected dividend yield.
The fair value of the Company’s stock options was estimated using the following weighted-average assumptions:
Fiscal Year Ended July 31, | |||||||||||
2015 | 2016 | 2017 | |||||||||
Fair value of common stock | $ | 10.29 | $ | 14.81 | $ | 12.14 | |||||
Expected term (in years) | 6.1 | 6.1 | 6.1 | ||||||||
Risk-free interest rate | 1.7 | % | 1.6 | % | 1.3 | % | |||||
Volatility | 46 | % | 42 | % | 52 | % | |||||
Dividend yield | — | — | — | ||||||||
The fair value of each grant of stock options was determined using Black-Scholes and assumptions discussed below. Each of these inputs is subjective and generally requires significant judgment to determine.
98
Fair Value of Common Stock—Prior to the Company’s IPO, the fair value of the common stock underlying its stock options was determined by its board of directors. The valuations of its common stock were determined in accordance with the guidelines outlined in the American Institute of Certified Public Accountants Practice Aid, Valuation of Privately-Held-Company Equity Securities Issued as Compensation. The Board, with input from management, exercised significant judgment and considered numerous objective and subjective factors to determine the fair value of the Company’s common stock at each grant date, including but not limited to, (i) contemporaneous valuations of common stock performed by unrelated third-party specialists; (ii) recent private stock sales transactions; (iii) the prices, rights, preferences and privileges of the Company’s convertible preferred stock relative to those of our common stock; (iv) the lack of marketability of the Company’s common stock; (v) developments in the business; (vi) the likelihood of achieving a liquidity event, such as an IPO or a merger or acquisition of the Company’s business, given prevailing market conditions; (vii) the market performance of comparable publicly traded companies; (viii) the Company’s actual operating and financial performance; (ix) U.S. and global capital market conditions; (x) the illiquidity of stock-based awards involving securities in a private company; (xi) the Company’s stage of development; and (xii) the Company’s history and the timing of the introduction of new products and services.
Subsequent to its IPO, the Company uses the market closing price for our Class A common stock as reported on the NASDAQ Global Select Market on the date of grant.
Expected Term—The expected term represents the period that the stock-based awards are expected to be outstanding. For option grants that are considered to be “plain vanilla,” the Company determines the expected term using the simplified method as provided by the Securities and Exchange Commission. The simplified method deems the term to be the average of the time-to-vesting and the contractual life of the options.
Risk-Free Interest Rate—The risk-free interest rate is based on U.S. Treasury yield curve in effect at the time of grant for zero-coupon U.S. Treasury notes with maturities approximately equal to the option’s expected term.
Expected Volatility—Since the Company does not have a long trading history of its common stock, the expected volatility was derived from the average historical stock volatilities of several unrelated public companies within the Company’s industry that its considers to be comparable to its business over a period equivalent to the expected term of the stock option grants.
Dividend Rate—The expected dividend was assumed to be zero, as the Company has never paid dividends and have no current plans to do so.
99
NOTE 12. | NET LOSS PER SHARE ATTRIBUTABLE TO COMMON STOCKHOLDERS |
Basic and diluted net loss per share attributable to common stockholders is presented in conformity with the two-class method required for participating securities. The Company’s Convertible Preferred Stock is considered a participating security. Participating securities do not have a contractual obligation to share in the Company’s losses. As such, for the periods the Company incurs net losses, there is no impact on the calculated net loss per share attributable to common stockholders in applying the two-class method.
Basic net loss per share attributable to common stockholders is computed by dividing the net loss by the weighted-average number of shares of common stock outstanding during the period. The diluted net loss per share attributable to common stockholders is computed by giving effect to all potential dilutive common stock equivalents outstanding for the period. For purposes of this calculation, participating securities, stock options to purchase common stock, RSUs and warrants to purchase Convertible Preferred Stock are considered to be common stock equivalents and have been excluded from the calculation of diluted net loss per share attributable to common stockholders, as their effect is antidilutive.
The rights, including the liquidation and dividend rights, of the holders of our Class A and Class B common stock are identical, except with respect to voting. As the liquidation and dividend rights are identical, the Company’s undistributed earnings or losses are allocated on a proportionate basis among the holders of both Class A and Class B common stock. As a result, the net loss per share attributed to common stockholders will, therefore, be the same for both Class A and Class B common stock on an individual or combined basis.
Net Loss Per Share Attributable to Class A and Class B Common Stockholders—The computation of basic and diluted net loss per share is as follows (in thousands, except share and per share data):
Fiscal Year Ended July 31 | |||||||||||
2015 | 2016 | 2017 | |||||||||
Numerator: | |||||||||||
Net loss | $ | (126,127 | ) | $ | (168,499 | ) | $ | (458,011 | ) | ||
Denominator: | |||||||||||
Weighted-average shares—basic and diluted | 40,509,481 | 43,970,381 | 128,295,563 | ||||||||
Net loss per share —basic and diluted | $ | (3.11 | ) | $ | (3.83 | ) | $ | (3.57 | ) | ||
The potential shares of common stock that were excluded from the computation of diluted net loss per share attributable to common stockholders for the years presented because including them would have been antidilutive are as follows:
As of July 31 | ||||||||
2015 | 2016 | 2017 | ||||||
Convertible preferred stock | 76,319,511 | 76,319,511 | — | |||||
Stock awards | 33,039,810 | 38,432,337 | 37,710,621 | |||||
Employee stock purchase plan | — | — | 1,447,385 | |||||
Common stock subject to repurchase | 2,549,102 | 954,215 | 243,148 | |||||
Convertible preferred stock warrants | 824,094 | 824,094 | 34,180 | |||||
Total | 112,732,517 | 116,530,157 | 39,435,334 | |||||
Shares that will be issued in connection with the Company’s stock awards and shares that will be purchased under the employee stock purchase plan are generally automatically converted into shares of the Company’s Class A common stock. Shares issued in connection with an exercise of the common stock warrants are converted into shares of the Company’s Class B common stock and are voluntarily convertible into shares of Class A common stock at the option of the holder.
100
NOTE 13. INCOME TAXES
Income Taxes—Loss before provision for income taxes by fiscal year consisted of the following (in thousands):
Fiscal Year Ended July 31, | |||||||||||
2015 | 2016 | 2017 | |||||||||
Domestic | $ | (84,327 | ) | $ | (104,339 | ) | $ | (350,759 | ) | ||
Foreign | (40,256 | ) | (61,968 | ) | (102,569 | ) | |||||
Loss before provision for income taxes | $ | (124,583 | ) | $ | (166,307 | ) | $ | (453,328 | ) | ||
Provision for income taxes by fiscal year consisted of the following (in thousands):
Fiscal Year Ended July 31, | |||||||||||
2015 | 2016 | 2017 | |||||||||
Current: | |||||||||||
State and local | $ | 56 | $ | 140 | $ | 193 | |||||
Foreign | 1,655 | 3,047 | 8,027 | ||||||||
Total current taxes | 1,711 | 3,187 | 8,220 | ||||||||
Deferred: | |||||||||||
U.S. federal | — | — | (1,342 | ) | |||||||
State and local | — | — | 13 | ||||||||
Foreign | (167 | ) | (995 | ) | (2,208 | ) | |||||
Total deferred taxes | (167 | ) | (995 | ) | (3,537 | ) | |||||
Provision for income taxes | $ | 1,544 | $ | 2,192 | $ | 4,683 | |||||
The income tax provision differs from the amount of income tax determined by applying the applicable U.S. federal statutory income tax rate of 34% to pretax loss. The reconciliation of the statutory federal income tax and the Company’s effective income tax is as follows (in thousands):
Fiscal Year Ended July 31, | |||||||||||
2015 | 2016 | 2017 | |||||||||
U.S. federal income tax at statutory rate | $ | (42,351 | ) | $ | (56,545 | ) | $ | (153,965 | ) | ||
Change in valuation allowance | 24,030 | 31,700 | 102,549 | ||||||||
Effect of foreign operations | 15,168 | 23,121 | 27,652 | ||||||||
Stock-based compensation | 2,152 | 3,655 | 6,701 | ||||||||
Warrant revaluation | 2,100 | (681 | ) | 7,185 | |||||||
Non-deductible expenses | 389 | 802 | 1,693 | ||||||||
State income taxes | 56 | 140 | 206 | ||||||||
Transfer pricing adjustments | — | — | 11,822 | ||||||||
Other | — | — | 840 | ||||||||
Total | $ | 1,544 | $ | 2,192 | $ | 4,683 | |||||
During the year ended July 31, 2017, the Company’s provision for income taxes was primarily attributable to foreign tax provision in certain foreign jurisdictions in which it conducts business.
During the year ended July 31, 2016, the Company early adopted ASU 2015-17 on a prospective basis. As a result of this adoption, the Company decreased $3.3 million of its non-current deferred tax assets, which are included within other assets—non-current, and $3.3 million of its current deferred tax liabilities, which are included within accrued expenses and other liabilities, on its consolidated balance sheet upon adoption. The Company did not retrospectively adjust prior periods.
101
The temporary differences that give rise to significant portions of deferred tax assets and liabilities are as follows (in thousands):
As of July 31, | |||||||
2016 | 2017 | ||||||
Deferred tax assets: | |||||||
Net operating loss carryforward | $ | 81,546 | $ | 135,929 | |||
Deferred revenue | 9,935 | 37,274 | |||||
Tax credit carryforward | 7,304 | 13,100 | |||||
Property and equipment | — | 1,118 | |||||
Accruals and reserves | 1,938 | 7,427 | |||||
Stock compensation expense | 5,780 | 27,512 | |||||
Total deferred tax assets | 106,503 | 222,360 | |||||
Deferred tax liabilities: | |||||||
Deferred commission expense | (13,483 | ) | (22,535 | ) | |||
Other | (424 | ) | (558 | ) | |||
Total deferred tax liabilities | (13,907 | ) | (23,093 | ) | |||
Valuation allowance | (91,346 | ) | (196,091 | ) | |||
Net deferred tax assets | $ | 1,250 | $ | 3,176 | |||
Total net deferred tax assets and liabilities included in the Company’s consolidated balance sheets are as follows (in thousands):
As of July 31, | |||||||
2016 | 2017 | ||||||
Non-current deferred tax assets | $ | 1,250 | $ | 3,176 | |||
Current deferred tax liabilities | — | — | |||||
Net deferred tax assets | $ | 1,250 | $ | 3,176 | |||
Management believes that, based on available evidence, both positive and negative, it is more likely than not that the U.S. deferred tax assets will not be utilized, such that a full valuation allowance has been recorded.
The valuation allowance for deferred tax assets was $196.1 million as of July 31, 2017. The net change in the total valuation allowance for the years ended July 31, 2016 and 2017 was an increase of $36.7 million and $104.7 million, respectively.
As of July 31, 2017, the Company had approximately $453.5 million of federal net operating loss carryforwards and $282.4 million of state net operating loss carryforwards available to reduce future taxable income, which will begin to expire in 2030.
In addition, the Company had approximately $11.6 million of federal research credit carryforwards and $11.6 million of state research credit carryforwards. The federal credits will begin to expire in 2030 and the state credits can be carried forward indefinitely.
Utilization of the net operating loss and tax credits carryforwards may be subject to an annual limitation due to the ownership change limitations provided by the Internal Revenue Code of 1986, as amended, and similar state provisions. Any annual limitation may result in the expiration of net operating losses and credits before utilization. If an ownership change occurred, utilization of the net operating loss and tax credit carryforwards could be significantly reduced.
102
As of July 31, 2017, the Company held an aggregate of $58.9 million in cash and cash equivalents in the Company’s foreign subsidiaries, of which $49.5 million was denominated in U.S. dollars. None of the Company’s short-term investments was held in its foreign subsidiaries as of July 31, 2017. The Company attributes revenue, costs and expenses to domestic and foreign components based on the terms of its agreements with its subsidiaries. The Company does not provide for federal income taxes on the undistributed earnings of its foreign subsidiaries, as such earnings are to be reinvested offshore indefinitely. The income tax liability would be insignificant if these earnings were to be repatriated.
The Company recognizes uncertain tax positions in the financial statements if that position is more likely than not of being sustained on audit, based on the technical merits of the position. A reconciliation of the Company’s unrecognized tax benefits, excluding accrued interest and penalties, is as follows (in thousands):
Fiscal Year Ended July 31, | |||||||
2016 | 2017 | ||||||
Balance at the beginning of the year | $ | 28,311 | $ | 19,711 | |||
Increases related to current year tax positions | 1,654 | 22,571 | |||||
Increases related to prior year tax positions | 972 | 373 | |||||
Decreases related to prior year tax positions | (3,942 | ) | — | ||||
Settlements with tax authorities | (7,284 | ) | — | ||||
Balance at the end of the year | $ | 19,711 | $ | 42,655 | |||
During the fiscal year ended July 31, 2017, the increase in unrecognized tax positions was primarily attributable to federal and state research and development credits, intercompany charges and business acquisitions in fiscal year 2017.
During the fiscal year ended July 31, 2016, the $3.9 million decrease in unrecognized tax benefits was due to the issuance of a California Supreme Court opinion on December 31, 2015 disallowing taxpayers to use the three-factor apportionment formula pursuant to the Multistate Tax Compact, which the Company previously elected. The California Supreme Court decision resulted in an adjustment to the Company’s deferred tax assets and a corresponding adjustment to the valuation allowance but did not impact provision for income taxes in the Company’s statement of operations. In addition, the $7.3 million decrease in unrecognized tax benefits during the year ended July 31, 2016 was due to the resolution of an uncertain tax position with a foreign tax authority, of which $0.4 million impacted the Company’s effective tax rate and the remaining amount resulted in an adjustment to the Company’s deferred tax assets and a corresponding adjustment to the valuation allowance.
As of July 31, 2017, if uncertain tax positions are fully recognized in the future, $1.6 million would impact the effective tax rate, and the remaining amount would result in adjustments to deferred tax assets and corresponding adjustments to the valuation allowance.
The Company recognizes interest and/or penalties related to income tax matters as a component of income tax expense. As of July 31, 2017, the Company had recognized immaterial accrued interest and penalties related to uncertain tax positions.
The Company files income tax returns in the U.S. federal jurisdiction as well as various U.S. states and foreign jurisdictions. The tax years 2009 and forward remain open to examination by the major jurisdictions in which the Company is subject to tax. These fiscal years outside the normal statute of limitation remain open to audit by tax authorities due to tax attributes generated in those early years, which have been carried forward and may be audited in subsequent years when utilized. The Company is subject to the continuous examination of income tax returns by various tax authorities. The Company regularly assesses the likelihood of adverse outcomes resulting from these examinations to determine the adequacy of the provision for income taxes. The Company believes that adequate amounts have been reserved for any adjustments that may ultimately result from these examinations and does not anticipate a significant impact to the gross unrecognized tax benefits within the next 12 months related to these years.
103
NOTE 14. | SEGMENT INFORMATION |
The Company’s chief operating decision maker is a group which is comprised of its Chief Executive Officer, Chief Financial Officer and President. This group reviews financial information presented on a consolidated basis for purposes of allocating resources and evaluating financial performance. Accordingly, the Company has a single reportable segment.
The following table sets forth revenue by geographic area by bill-to location (in thousands):
Fiscal Year Ended July 31, | |||||||||||
2015 | 2016 | 2017 | |||||||||
U.S. | $ | 161,439 | $ | 280,800 | $ | 462,770 | |||||
Europe, the Middle East and Africa | 43,526 | 81,320 | 139,170 | ||||||||
Asia-Pacific | 28,386 | 63,610 | 131,921 | ||||||||
Other Americas | 8,081 | 19,198 | 33,008 | ||||||||
Total revenue | $ | 241,432 | $ | 444,928 | $ | 766,869 | |||||
As of July 31, 2016 and 2017, $30.0 million and $63.3 million, respectively, of the Company’s long-lived assets, net were located in the United States.
NOTE 15. | 401(K) PLAN |
The Company has a 401(k) Savings Plan (“401(k) Plan”) that qualifies as a deferred salary arrangement under Section 401(k) of the Internal Revenue Code. Under the 401(k) Plan, participating full-time employees over the age of 21 may voluntarily elect to contribute up to 75% of their eligible compensation, subject to maximum allowed by law. The 401(k) Plan provides for a discretionary employer-matching contribution. The Company has not made any matching contributions to the 401(k) Plan to date.
NOTE 16. | RELATED-PARTY TRANSACTIONS |
The Company enters into various transactions with its related parties in the normal course of business. During the years ended July 31, 2015, 2016 and 2017, the Company’s purchases of goods or services from related parties totaled $0.2 million, $0.8 million and $0.9 million, respectively. The Company did not have any payables outstanding to related parties as of July 31, 2016 and 2017. Revenue from related parties for the years ended July 31, 2015, 2016 and 2017 were $0.1 million, $0.6 million and $0.4 million, respectively. The Company did not have any receivables outstanding from related parties as of July 31, 2016 and 2017, respectively.
In connection with the PernixData Acquisition (see Note 3), entities affiliated with Lightspeed Venture Partners, which owned approximately 36.7% of the Company’s outstanding Convertible Preferred Stock as of July 31, 2016, owned approximately 26.4% of the outstanding capital stock of PernixData immediately prior to the completion of the PernixData Acquisition. These entities received 625,478 shares of the Company’s common stock in the PernixData Acquisition, as well as the right to receive up to approximately $2.7 million in cash in the event the contingent consideration becomes payable. Two members of the Board are affiliated with Lightspeed Venture Partners. As of July 31, 2017, entities affiliated with Lightspeed Venture partners owned approximately 7.5% of the Company's outstanding common stock.
104
NOTE 17. | SELECTED QUARTERLY FINANCIAL DATA (UNAUDITED) |
The following sets forth selected unaudited quarterly consolidated statements of operations data for each of the eight quarters in the period ended July 31, 2017 (in thousands, except per share amounts). The information for each of these quarters has been prepared on a basis consistent with our audited annual consolidated financial statements included elsewhere in this report and, in the opinion of management, includes all adjustments of a normal, recurring nature that are necessary for the fair presentation of the results of operations for these periods in accordance with generally accepted accounting principles in the United States. This data should be read in conjunction with our audited consolidated financial statements and related notes included elsewhere in this report. These historical quarterly operating results are not necessarily indicative of the results that may be expected for a full fiscal year or any future period.
Three Months Ended | |||||||||||||||||||||||||||||||
October 31, 2015 | January 31, 2016 | April 30, 2016 | July 31, 2016 | October 31, 2016 | January 31, 2017 | April 30, 2017 | July 31, 2017 | ||||||||||||||||||||||||
(unaudited, in thousands, except per share amounts) | |||||||||||||||||||||||||||||||
Revenue: | |||||||||||||||||||||||||||||||
Product | $ | 70,396 | $ | 81,229 | $ | 89,957 | $ | 109,216 | $ | 129,657 | $ | 138,508 | $ | 143,142 | $ | 171,704 | |||||||||||||||
Support and other services | 17,360 | 21,468 | 24,733 | 30,569 | 37,152 | 43,687 | 48,621 | 54,398 | |||||||||||||||||||||||
Total revenue | 87,756 | 102,697 | 114,690 | 139,785 | 166,809 | 182,195 | 191,763 | 226,102 | |||||||||||||||||||||||
Cost of revenue: | |||||||||||||||||||||||||||||||
Product (1) (2) | 27,657 | 29,977 | 33,427 | 42,480 | 52,210 | 58,403 | 62,593 | 76,187 | |||||||||||||||||||||||
Support and other services (1) | 7,422 | 7,959 | 9,966 | 11,899 | 17,552 | 18,443 | 20,613 | 21,330 | |||||||||||||||||||||||
Total cost of revenue | 35,079 | 37,936 | 43,393 | 54,379 | 69,762 | 76,846 | 83,206 | 97,517 | |||||||||||||||||||||||
Gross profit | 52,677 | 64,761 | 71,297 | 85,406 | 97,047 | 105,349 | 108,557 | 128,585 | |||||||||||||||||||||||
Operating expenses: | |||||||||||||||||||||||||||||||
Sales and marketing (1) (2) | 58,599 | 66,128 | 75,849 | 87,917 | 128,775 | 111,244 | 128,007 | 132,503 | |||||||||||||||||||||||
Research and development (1) | 23,857 | 26,024 | 31,390 | 35,129 | 75,281 | 70,914 | 74,607 | 67,817 | |||||||||||||||||||||||
General and administrative (1) | 7,375 | 7,840 | 8,761 | 10,289 | 29,372 | 15,481 | 15,610 | 16,878 | |||||||||||||||||||||||
Total operating expenses | 89,831 | 99,992 | 116,000 | 133,335 | 233,428 | 197,639 | 218,224 | 217,198 | |||||||||||||||||||||||
Loss from operations | (37,154 | ) | (35,231 | ) | (44,703 | ) | (47,929 | ) | (136,381 | ) | (92,290 | ) | (109,667 | ) | (88,613 | ) | |||||||||||||||
Other income (expense)—net | (871 | ) | 2,646 | (2,106 | ) | (959 | ) | (25,712 | ) | (421 | ) | 303 | (547 | ) | |||||||||||||||||
Loss before provision for income taxes | (38,025 | ) | (32,585 | ) | (46,809 | ) | (48,888 | ) | (162,093 | ) | (92,711 | ) | (109,364 | ) | (89,160 | ) | |||||||||||||||
Provision for income taxes | 520 | 620 | 11 | 1,041 | 76 | 501 | 2,613 | 1,493 | |||||||||||||||||||||||
Net loss | $ | (38,545 | ) | $ | (33,205 | ) | $ | (46,820 | ) | $ | (49,929 | ) | $ | (162,169 | ) | $ | (93,212 | ) | $ | (111,977 | ) | $ | (90,653 | ) | |||||||
Net loss per share attributable to Class A and Class B common stockholders—basic and diluted | $ | (0.90 | ) | $ | (0.76 | ) | $ | (1.05 | ) | $ | (1.11 | ) | $ | (2.18 | ) | $ | (0.66 | ) | $ | (0.78 | ) | $ | (0.59 | ) | |||||||
Basic and diluted earnings per share are computed independently for each of the quarters presented. Therefore, the sum of quarterly basic and diluted per share amounts may not equal annual basic and diluted per share amounts.
105
(1) Includes stock-based compensation as follows:
Three Months Ended | |||||||||||||||||||||||||||||||
October 31, 2015 | January 31, 2016 | April 30, 2016 | July 31, 2016 | October 31, 2016 | January 31, 2017 | April 30, 2017 | July 31, 2017 | ||||||||||||||||||||||||
(unaudited, in thousands) | |||||||||||||||||||||||||||||||
Product cost of sales | $ | 109 | $ | 104 | $ | 98 | $ | 80 | $ | 966 | $ | 848 | $ | 610 | $ | 642 | |||||||||||||||
Support cost of sales | 293 | 241 | 230 | 204 | 3,350 | 2,389 | 2,471 | 2,201 | |||||||||||||||||||||||
Sales and marketing | 2,118 | 1,964 | 2,029 | 1,895 | 33,891 | 15,528 | 15,726 | 12,972 | |||||||||||||||||||||||
Research and development | 1,629 | 1,612 | 1,519 | 1,499 | 34,026 | 28,759 | 27,041 | 19,218 | |||||||||||||||||||||||
General and administrative | 1,237 | 1,029 | 1,168 | 998 | 18,495 | 5,083 | 4,503 | 2,772 | |||||||||||||||||||||||
Total | $ | 5,386 | $ | 4,950 | $ | 5,044 | $ | 4,676 | $ | 90,728 | $ | 52,607 | $ | 50,351 | $ | 37,805 | |||||||||||||||
(2) Includes amortization of intangible assets as follows:
Three Months Ended | |||||||||||||||||||||||||||||||
October 31, 2015 | January 31, 2016 | April 30, 2016 | July 31, 2016 | October 31, 2016 | January 31, 2017 | April 30, 2017 | July 31, 2017 | ||||||||||||||||||||||||
(unaudited, in thousands) | |||||||||||||||||||||||||||||||
Product cost of sales | $ | — | $ | — | $ | — | $ | — | $ | 238 | $ | 360 | $ | 358 | $ | 358 | |||||||||||||||
Sales and marketing | — | — | — | 167 | 248 | 250 | 250 | ||||||||||||||||||||||||
Total | $ | — | $ | — | $ | — | $ | — | $ | 405 | $ | 608 | $ | 608 | $ | 608 | |||||||||||||||
Item 9. Changes in and Disagreements with Accountants on Accounting and Financial Disclosure
None.
Item 9A. Controls and Procedures
Evaluation of Disclosure Controls and Procedures
Our management, with the participation of our Chief Executive Officer and our Chief Financial Officer, has evaluated the effectiveness of our disclosure controls and procedures (as defined in Rules 13a-15(e) and 15d-15(e) under the the Securities and Exchange Act of 1934, as amended, or the Exchange Act) prior to the filing of this Annual Report on Form 10-K. Based on such evaluation, our Chief Executive Officer and Chief Financial Officer have concluded that, as of the end of the period covered by this Annual Report on Form 10-K, our disclosure controls and procedures were, in design and operation, effective at the reasonable assurance level.
Changes in Internal Control over Financial Reporting
There was no change in our internal control over financial reporting identified in connection with the evaluation required by Rule 13a-15(d) and 15d-15(d) of the Exchange Act that occurred during the quarter ended July 31, 2017 that has materially affected, or is reasonably likely to materially affect, our internal control over financial reporting.
Management’s Report on Internal Control over Financial Reporting
This Annual Report on Form 10-K does not include a report of management’s assessment regarding internal control over financial reporting or an attestation report of our independent registered public accounting firm due to a transition period established by the rules of the Securities Exchange Commission for newly public companies.
Attestation Report of the Registered Public Accounting Firm
This Annual Report on Form 10-K does not include an attestation report of our registered public accounting firm due to an exemption established by the Jumpstart Our Business Startups Act, or JOBS Act, for “emerging growth companies.”
106
Item 9B. Other Information
None.
PART III
Item 10. Directors, Executive Officers, and Corporate Governance
The information required by this item is incorporated herein by reference to our definitive proxy statement for our 2017 annual meeting of stockholders (“2017 Proxy Statement”), which will be filed not later than 120 days after the end of our fiscal year ended July 31, 2017.
Item 11. Executive Compensation
The information required by this item is incorporated herein by reference to our 2017 Proxy Statement.
Item 12. Security Ownership of Certain Beneficial Owners and Management and Related Stockholder Matters
The information required by this item is incorporated herein by reference to our 2017 Proxy Statement.
Item 13. Certain Relationships and Related Transactions, and Director Independence
The information required by this item is incorporated herein by reference to our 2017 Proxy Statement.
Item 14. Principal Accountant Fees and Services
The information required by this item is incorporated herein by reference to our 2017 Proxy Statement.
PART IV
Item 15. Exhibits and Financial Statement Schedules
(a)(1) Consolidated Financial Statements
We have filed the consolidated financial statements listed in the Index to Consolidated Financial Statements, Schedules, and Exhibits included in Part II, Item 8, “Financial Statements and Supplementary Data” of this Annual Report on Form 10-K.
(a)(2) Financial Statement Schedules
All financial statement schedules have been omitted because they are not applicable, not material, or the required information is shown in the consolidated financial statements or the notes thereto.
(a)(3) Exhibits
See the Exhibit Index below in this Annual Report on Form 10-K.
Item 16. Form 10-K Summary
None.
107
EXHIBIT INDEX
Incorporated by Reference | ||||||
Number | Exhibit Title | Form | File No. | Exhibit | Filing Date | Filed Herewith |
10-Q | 001-37883 | 3.1 | 12/8/2016 | |||
S-1/A | 333-208711 | 3.4 | 5/27/2016 | |||
S-1 | 333-208711 | 4.1 | 12/22/2015 | |||
S-1/A | 333-208711 | 4.2 | 4/4/2016 | |||
S-1 | 333-208711 | 4.3 | 12/22/2015 | |||
10.1† | 10-Q/A | 001-37883 | 10.1 | 7/5/2017 | ||
S-1 | 333-208711 | 10.1 | 12/22/2015 | |||
10.3+ | S-1/A | 333-208711 | 10.2 | 8/16/2016 | ||
10.4+ | S-1 | 333-208711 | 10.3 | 12/22/2015 | ||
10.5+ | S-1/A | 333-208711 | 10.4 | 9/19/2016 | ||
10.6+ | S-1/A | 333-208711 | 10.5 | 9/19/2016 | ||
10.7+ | S-1 | 333-208711 | 10.6 | 12/22/2015 | ||
10.8+ | S-1 | 333-208711 | 10.7 | 12/22/2015 | ||
10.9+ | S-1 | 333-208711 | 10.8 | 12/22/2015 | ||
S-1 | 333-208711 | 10.9 | 12/22/2015 | |||
S-1 | 333-208711 | 10.11 | 12/22/2015 | |||
S-1 | 333-208711 | 10.12 | 12/22/2015 | |||
S-1 | 333-208711 | 10.13 | 12/22/2015 | |||
S-1 | 333-208711 | 10.14 | 12/22/2015 | |||
S-1/A | 333-208711 | 10.15 | 8/16/2016 | |||
S-1/A | 333-208711 | 10.16 | 8/16/2016 | |||
S-1 | 333-208711 | 10.17 | 12/22/2015 | |||
S-1/A | 333-208711 | 10.19 | 9/12/2016 | |||
S-1/A | 333-208711 | 10.21 | 9/12/2016 | |||
S-1/A | 333-208711 | 10.18 | 5/27/2016 | |||
10-Q | 001-37883 | 10.1 | 3/10/2017 | |||
X | ||||||
X | ||||||
X | ||||||
X | ||||||
X | ||||||
X | ||||||
X | ||||||
101.INS | XBRL Instance Document. | X | ||||
101.SCH | XBRL Taxonomy Extension Schema Document. | X | ||||
101.CAL | XBRL Taxonomy Extension Calculation Linkbase Document. | X | ||||
101. | XBRL Taxonomy Extension Definition. | X | ||||
101. | XBRL Taxonomy Extension Label Linkbase | X | ||||
101.PRE | XBRL Taxonomy Extension Presentation Linkbase Document. | X | ||||
† Confidential treatment has been requested for portions of this exhibit. These portions have been omitted and have been filed separately with the Securities and Exchange Commission.
* These exhibits are furnished with this Annual Report on Form 10-K and are not deemed filed with the Securities and Exchange Commission and are not incorporated by reference in any filing of Nutanix, Inc. under the Securities Act of 1933, as amended, or the Securities Exchange Act of 1934, as amended, whether made before or after the date hereof and irrespective of any general incorporation language contained in such filings.
+Indicates a management contract or compensatory plan or arrangement.
108
SIGNATURES
Pursuant to the requirements of Section 13 or 15(d) of the Securities Exchange Act of 1934, the registrant has duly caused this report to be signed on its behalf by the undersigned, thereto duly authorized.
NUTANIX, INC. | ||
Date: September 18, 2017 | By: | /s/ DHEERAJ PANDEY |
Dheeraj Pandey Chief Executive Officer and Chairman | ||
POWER OF ATTORNEY
KNOW ALL PERSONS BY THESE PRESENTS, that each person whose signature appears below constitutes and appoints Dheeraj Pandey and Duston M. Williams, jointly and severally, his attorneys-in-fact, each with the power of substitution, for him in any and all capacities, to sign any amendments to this report, and to file the same, with exhibits thereto and other documents in connection therewith, with the Securities and Exchange Commission, hereby ratifying and confirming all that each of said attorneys-in-fact, or his substitute or substitutes, may do or cause to be done by virtue hereof.
Pursuant to the requirements of the Securities Exchange Act of 1934, this report has been signed by the following persons on behalf of the registrant and in the capacities and on the dates indicated.
Signature | Title | Date | ||
/S/ DHEERAJ PANDEY | Chief Executive Officer and Chairman (Principal Executive Officer) | September 18, 2017 | ||
Dheeraj Pandey | ||||
/S/ DUSTON M. WILLIAMS | Chief Financial Officer (Principal Financial Officer) | September 18, 2017 | ||
Duston M. Williams | ||||
/S/ KENNETH W. LONG III | Vice President, Corporate Controller and Chief Accounting Officer (Principal Accounting Officer) | September 18, 2017 | ||
Kenneth W. Long III | ||||
/s/ Steven J. Gomo | Director | September 18, 2017 | ||
Steven J. Gomo | ||||
/s/ John McAdam | Director | September 18, 2017 | ||
John McAdam | ||||
/s/ Ravi Mhatre | Director | September 18, 2017 | ||
Ravi Mhatre | ||||
/s/ Jeffrey T. Parks | Director | September 18, 2017 | ||
Jeffrey T. Parks | ||||
/s/ Michael P. Scarpelli | Director | September 18, 2017 | ||
Michael P. Scarpelli | ||||
/s/ Bipul Sinha | Director | September 18, 2017 | ||
Bipul Sinha | ||||
109