Attached files
| file | filename |
|---|---|
| 8-K - 8-K - PNMAC Holdings, Inc. | pfsi-20170911x8k.htm |
Exhibit 99.1
|
|
Barclays Global FinancialServices Conference September 11, 2017 |
|
|
Forward-Looking Statements This presentation forward-looking statements within the meaning of Section 21E of the Securities Exchange Act of 1934, as amended, regarding management’s beliefs, estimates, projections and assumptions with respect to, among other things, the Company’s financial results, future operations, business plans and investment strategies, as well as industry and market conditions, all of which are subject to change. Words like “believe,” “expect,” “anticipate,” “promise,” “plan,” and other expressions or words of similar meanings, as well as future or conditional verbs such as “will,” “would,” “should,” “could,” or “may” are generally intended to identify forward-looking statements. Actual results and operations for any future period may vary materially from those projected herein and from past results discussed herein. Factors which could cause actual results to differ materially from historical results or those anticipated include, but are not limited to: the continually changing federal, state and local laws and regulations applicable to the highly regulated industry in which we operate; lawsuits or governmental actions that may result from any noncompliance with the laws and regulations applicable to our businesses; the mortgage lending and servicing-related regulations promulgated by the Consumer Financial Protection Bureau and its enforcement of these regulations; our dependence on U.S. government-sponsored entities and changes in their current roles or their guarantees or guidelines; changes to government mortgage modification programs; the licensing and operational requirements of states and other jurisdictions applicable to the Company’s businesses, to which our bank competitors are not subject; foreclosure delays and changes in foreclosure practices; certain banking regulations that may limit our business activities; our dependence on the multifamily and commercial real estate sectors for future originations of commercial mortgage loans and other commercial real estate related loans; changes in macroeconomic and U.S. real estate market conditions; difficulties inherent in growing loan production volume; difficulties inherent in adjusting the size of our operations to reflect changes in business levels; purchase opportunities for mortgage servicing rights and our success in winning bids; changes in prevailing interest rates; increases in loan delinquencies and defaults; our reliance on PennyMac Mortgage Investment Trust (NYSE: PMT) as a significant source of financing for, and revenue related to, our mortgage banking business; any required additional capital and liquidity to support business growth that may not be available on acceptable terms, if at all; our obligation to indemnify third-party purchasers or repurchase loans if loans that we originate, acquire, service or assist in the fulfillment of, fail to meet certain criteria or characteristics or under other circumstances; our obligation to indemnify PMT and the Investment Funds if its services fail to meet certain criteria or characteristics or under other circumstances; decreases in the returns on the assets that we select and manage for our clients, and our resulting management and incentive fees; the extensive amount of regulation applicable to our investment management segment; conflicts of interest in allocating our services and investment opportunities among us and our advised entities; the effect of public opinion on our reputation; our recent growth; our ability to effectively identify, manage, monitor and mitigate financial risks; our initiation of new business activities or expansion of existing business activities; our ability to detect misconduct and fraud; and our ability to mitigate cybersecurity risks and cyber incidents. You should not place undue reliance on any forward-looking statement and should consider all of the uncertainties and risks described above, as well as those more fully discussed in reports and other documents filed by the Company with the Securities and Exchange Commission from time to time. The Company undertakes no obligation to publicly update or revise any forward-looking statements or any other information contained herein, and the statements made in this presentation are current as of the date of this release only. 2 |
|
|
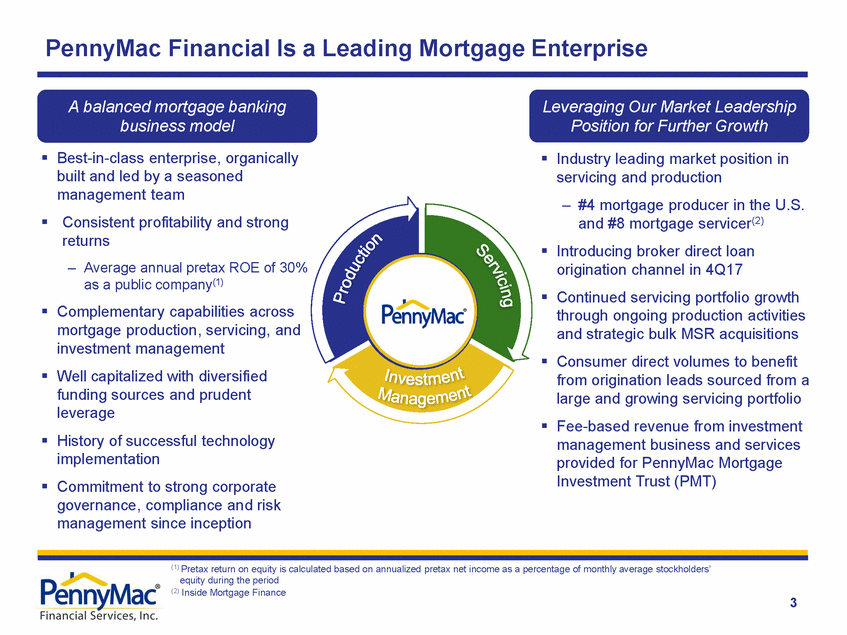
PennyMac Financial Is a Leading Mortgage Enterprise A balanced mortgage banking business model Best-in-class enterprise, organically built and led by a seasoned management team Consistent profitability and strong returns – Average annual pretax ROE of 30% as a public company(1) Complementary capabilities across mortgage production, servicing, and investment management Well capitalized with diversified funding sources and prudent leverage History of successful technology implementation Commitment to strong corporate governance, compliance and risk management since inception Leveraging Our Market Leadership Position for Further Growth Industry leading market position in servicing and production – #4 mortgage producer in the U.S. and #8 mortgage servicer(2) Introducing broker direct loan origination channel in 4Q17 Continued servicing portfolio growth through ongoing production activities and strategic bulk MSR acquisitions Consumer direct volumes to benefit from origination leads sourced from a large and growing servicing portfolio Fee-based revenue from investment management business and services provided for PennyMac Mortgage Investment Trust (PMT) (1) Pretax return on equity is calculated based on annualized pretax net income as a percentage of monthly average stockholders’ equity during the period (2) Inside Mortgage Finance 3 |
|
|
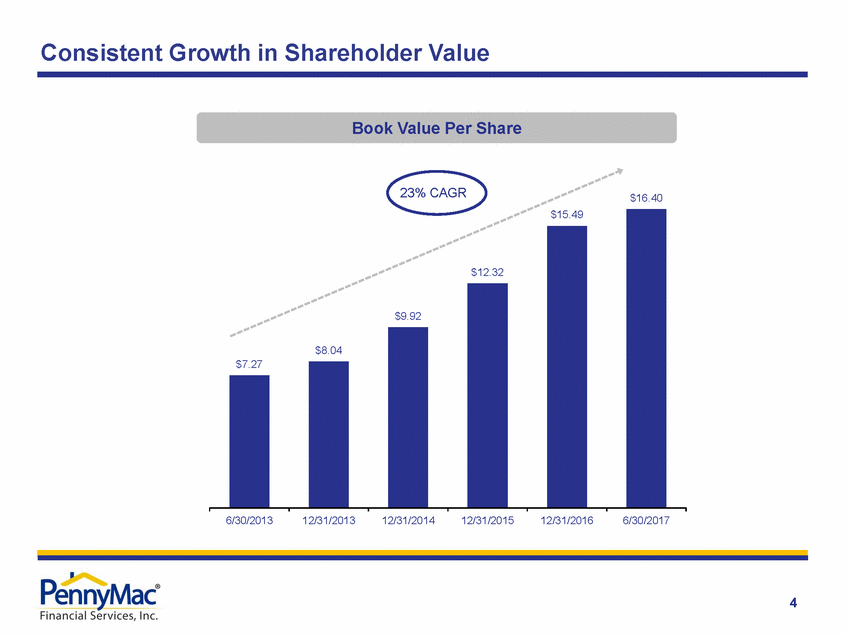
Consistent Growth in Shareholder Value Book Value Per Share 23% CAGR $16.40 6/30/2013 12/31/2013 12/31/2014 12/31/2015 12/31/2016 6/30/2017 4 $15.49 $12.32 $9.92 $8.04 $7.27 |
|
|
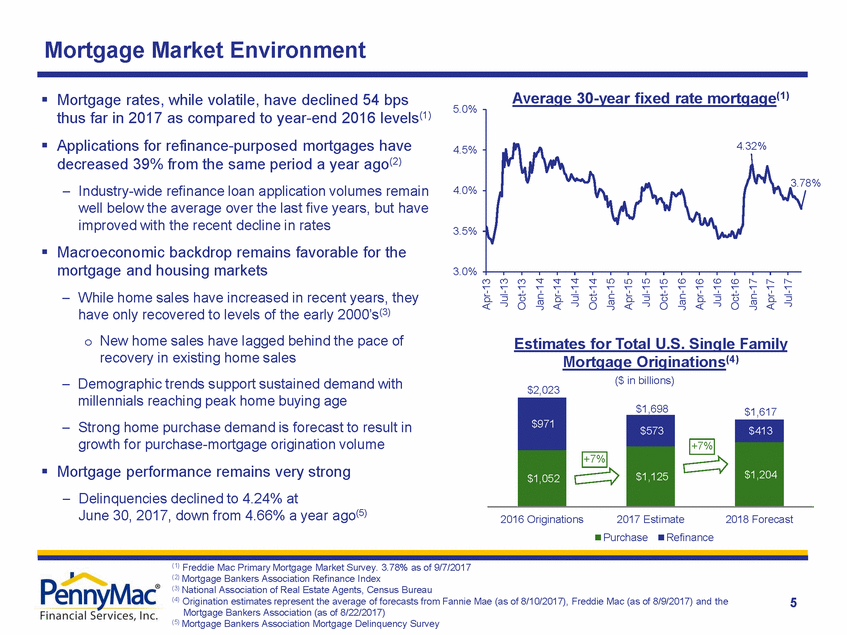
Mortgage Market Environment Average 30-year fixed rate mortgage(1) Mortgage rates, while volatile, have declined 54 bps thus far in 2017 as compared to year-end 2016 levels(1) Applications for refinance-purposed mortgages have decreased 39% from the same period a year ago(2) – Industry-wide refinance loan application volumes remain well below the average over the last five years, but have improved with the recent decline in rates Macroeconomic backdrop remains favorable for the mortgage and housing markets – While home sales have increased in recent years, they have only recovered to levels of the early 2000’s(3) o New home sales have lagged behind the pace of recovery in existing home sales – Demographic trends support sustained demand with millennials reaching peak home buying age – Strong home purchase demand is forecast to result in growth for purchase-mortgage origination volume Mortgage performance remains very strong – Delinquencies declined to 4.24% at June 30, 2017, down from 4.66% a year ago(5) 5.0% 4.5% .78% 4.0% 3.5% 3.0% Estimates for Total U.S. Single Family Mortgage Originations(4) ($ in billions) $2,023 2016 Originations 2017 Estimate 2018 Forecast Purchase Refinance (1) Freddie Mac Primary Mortgage Market Survey. 3.78% as of 9/7/2017 (2) Mortgage Bankers Association Refinance Index (3) National Association of Real Estate Agents, Census Bureau (4) Origination estimates represent the average of forecasts from Fannie Mae (as of 8/10/2017), Freddie Mac (as of 8/9/2017) and the Mortgage Bankers Association (as of 8/22/2017) (5) Mortgage Bankers Association Mortgage Delinquency Survey 5 Apr-13 Jul-13 Oct-13 Jan-14 Apr-14 Jul-14 Oct-14 Jan-15 Apr-15 Jul-15 Oct-15 Jan-16 Apr-16 Jul-16 Oct-16 Jan-17 Apr-17 Jul-17 $971 $1,698$1,617 $573 $413 $1,204 $1,125 $1,052 +7% +7% 4.32% 3 |
|
|
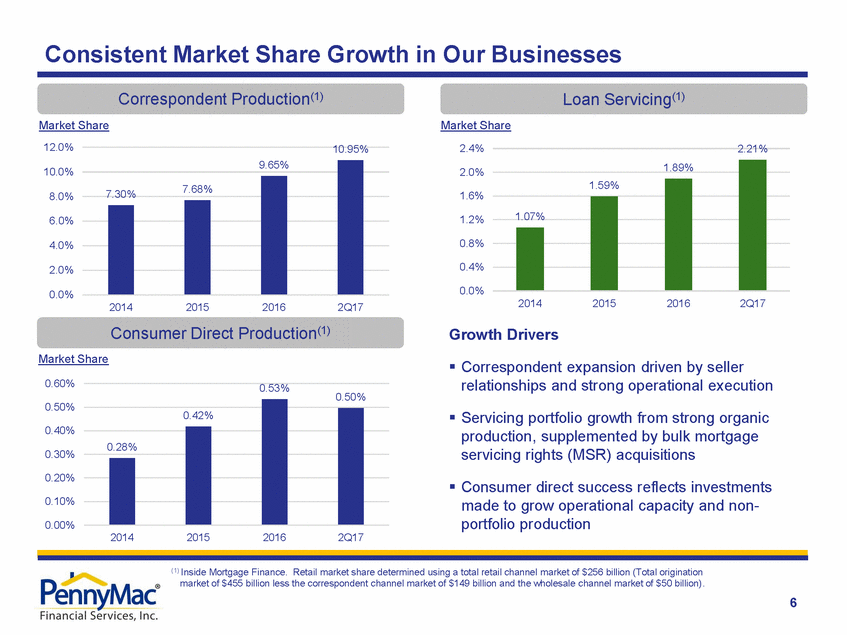
Consistent Market Share Growth in Our Businesses Correspondent Production(1) Loan Servicing(1) Market Share Market Share 12.0% 2.4% 2.21% 10.95% 10.0% 2.0% 1.6% 8.0% 1.2% 6.0% 0.8% 4.0% 0.4% 2.0% 0.0% 0.0% 2014 2015 2016 2Q17 2014 2015 2016 2Q17 Consumer Direct Production(1) Growth Drivers Market Share Correspondent expansion driven by seller relationships and strong operational execution 0.60% 0.53% 0.50% 0.50% Servicing portfolio growth from strong organic production, supplemented by bulk mortgage servicing rights (MSR) acquisitions 0.40% 0.30% 0.20% Consumer direct success reflects investments made to grow operational capacity and non-portfolio production 0.10% 0.00% 2014 2015 2016 2Q17 (1) Inside Mortgage Finance. Retail market share determined using a total retail channel market of $256 billion (Total origination market of $455 billion less the correspondent channel market of $149 billion and the wholesale channel market of $50 billion). 6 0.42% 0.28% 9.65% 7.30%7.68% 1.89% 1.59% 1.07% |
|
|
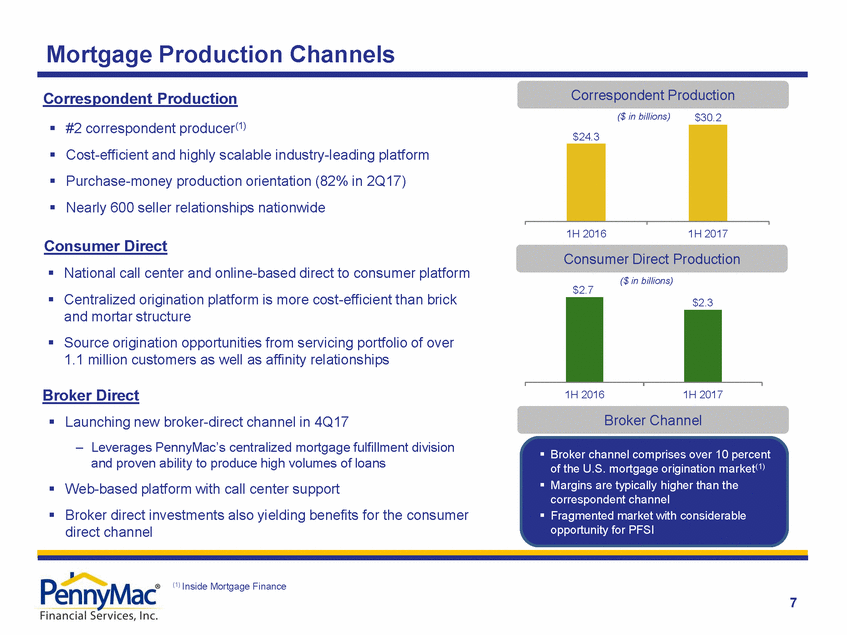
Mortgage Production Channels Correspondent Production Correspondent Production ($ in billions) $30.2 #2 correspondent producer(1) Cost-efficient and highly scalable industry-leading platform Purchase-money production orientation (82% in 2Q17) Nearly 600 seller relationships nationwide 1H 2016 1H 2017 Consumer Direct Consumer Direct Production ($ in billions) National call center and online-based direct to consumer platform Centralized origination platform is more cost-efficient than brick and mortar structure Source origination opportunities from servicing portfolio of over 1.1 million customers as well as affinity relationships $2.7 Broker Direct 1H 2016 1H 2017 Broker Channel Launching new broker-direct channel in 4Q17 – Leverages PennyMac’s centralized mortgage fulfillment division and proven ability to produce high volumes of loans Web-based platform with call center support Broker direct investments also yielding benefits for the consumer direct channel Broker channel comprises over 10 percent of the U.S. mortgage origination market(1) Margins are typically higher than the correspondent channel Fragmented market with considerable opportunity for PFSI (1) Inside Mortgage Finance 7 $2.3 $24.3 |
|
|
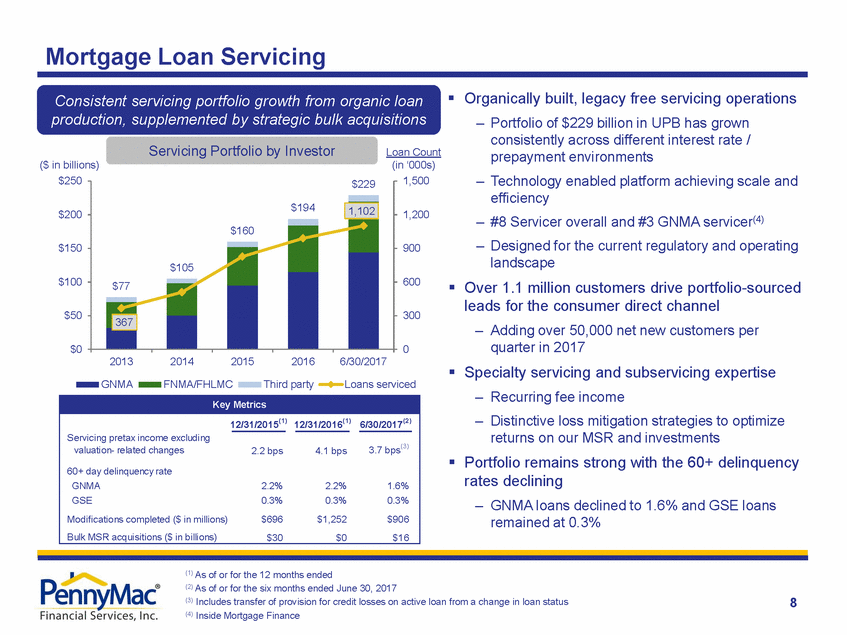
Mortgage Loan Servicing Organically built, legacy free servicing operations Consistent servicing portfolio growth from organic loan production, supplemented by strategic bulk acquisitions – Portfolio of $229 billion in UPB has grown consistently across different interest rate / prepayment environments Technology enabled platform achieving scale and efficiency #8 Servicer overall and #3 GNMA servicer(4) Designed for the current regulatory and operating landscape Servicing Portfolio by Investor Loan Count ($ in billions) (in ‘000s) – $250 1,500 $200 1,200 – – $150 900 $100 600 Over 1.1 million customers drive portfolio-sourced leads for the consumer direct channel – Adding over 50,000 net new customers per quarter in 2017 Specialty servicing and subservicing expertise – Recurring fee income – Distinctive loss mitigation strategies to optimize returns on our MSR and investments Portfolio remains strong with the 60+ delinquency rates declining – GNMA loans declined to 1.6% and GSE loans remained at 0.3% $50 300 $0 0 2013 2014 2015 2016 6/30/2017 GNMA FNMA/FHLMC Third party Loans serviced (1) As of or for the 12 months ended (2) As of or for the six months ended June 30, 2017 (3) Includes transfer of provision for credit losses on active loan from a change in loan status (4) Inside Mortgage Finance 8 Key Metrics 12/31/2015(1) 12/31/2016(1) 6/30/2017(2) Servicing pretax income excluding valuation-related changes 2.2 bps 4.1 bps 3.7 bps(3) 60+ day delinquency rate GNMA 2.2% 2.2% 1.6% GSE 0.3% 0.3% 0.3% Modifications completed ($ in millions) $696 $1,252 $906 Bulk MSR acquisitions ($ in billions) $30 $0 $16 $229 $194 1,102 $160 $105 $77 367 |
|
|
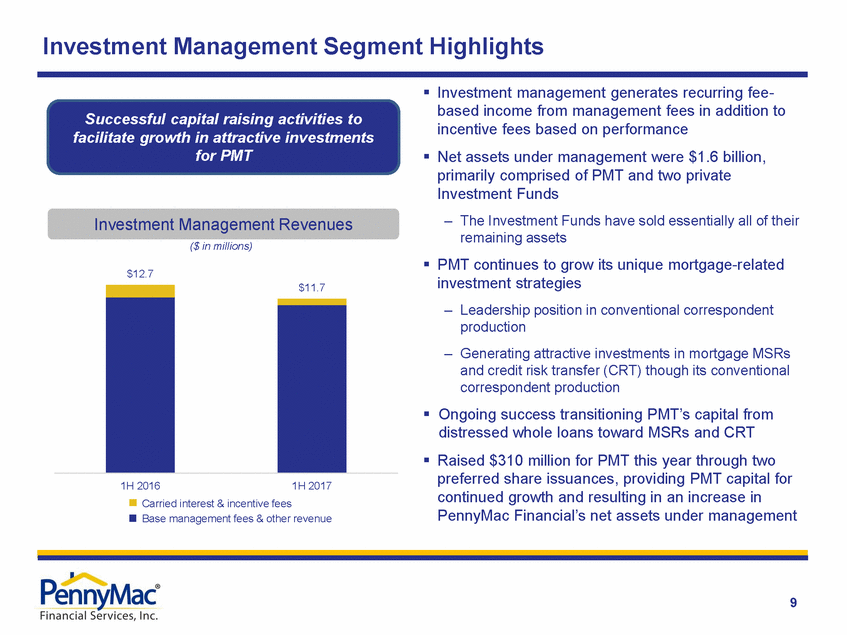
Investment Management Segment Highlights Investment management generates recurring fee-based income from management fees in addition to incentive fees based on performance Net assets under management were $1.6 billion, primarily comprised of PMT and two private Investment Funds – The Investment Funds have sold essentially all of their remaining assets PMT continues to grow its unique mortgage-related investment strategies – Leadership position in conventional correspondent production – Generating attractive investments in mortgage MSRs and credit risk transfer (CRT) though its conventional correspondent production Ongoing success transitioning PMT’s capital from distressed whole loans toward MSRs and CRT Raised $310 million for PMT this year through two preferred share issuances, providing PMT capital for continued growth and resulting in an increase in PennyMac Financial’s net assets under management Successful capital raising activities to facilitate growth in attractive investments for PMT Investment Management Revenues ($ in millions) $12.7 1H 2016 1H 2017 Carried interest & incentive fees Base management fees & other revenue 9 $11.7 |
|
|
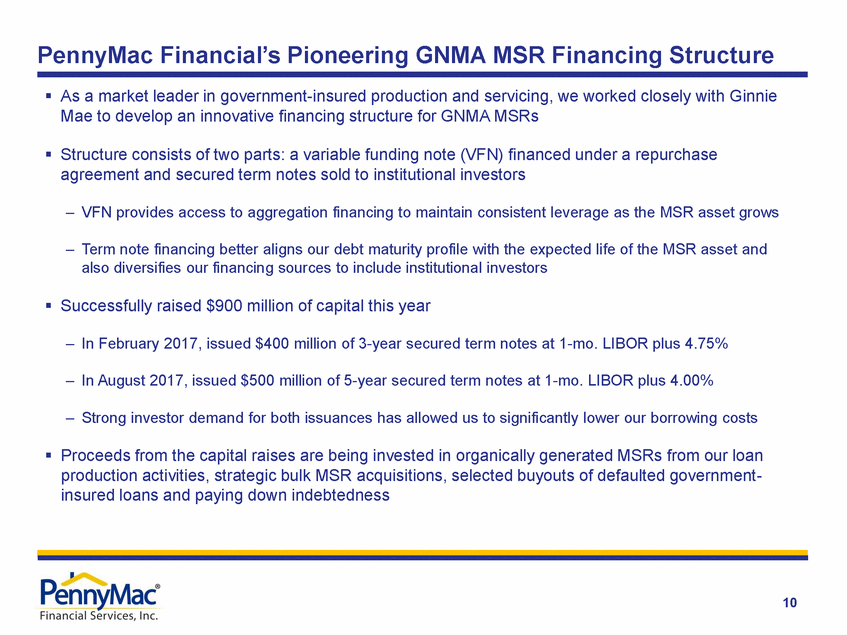
PennyMac Financial’s Pioneering GNMA MSR Financing Structure As a market leader in government-insured production and servicing, we worked closely with Ginnie Mae to develop an innovative financing structure for GNMA MSRs Structure consists of two parts: a variable funding note (VFN) financed under a repurchase agreement and secured term notes sold to institutional investors – VFN provides access to aggregation financing to maintain consistent leverage as the MSR asset grows – Term note financing better aligns our debt maturity profile with the expected life of the MSR asset and also diversifies our financing sources to include institutional investors Successfully raised $900 million of capital this year – In February 2017, issued $400 million of 3-year secured term notes at 1-mo. LIBOR plus 4.75% – In August 2017, issued $500 million of 5-year secured term notes at 1-mo. LIBOR plus 4.00% – Strong investor demand for both issuances has allowed us to significantly lower our borrowing costs Proceeds from the capital raises are being invested in organically generated MSRs from our loan production activities, strategic bulk MSR acquisitions, selected buyouts of defaulted government-insured loans and paying down indebtedness 10 |
|
|
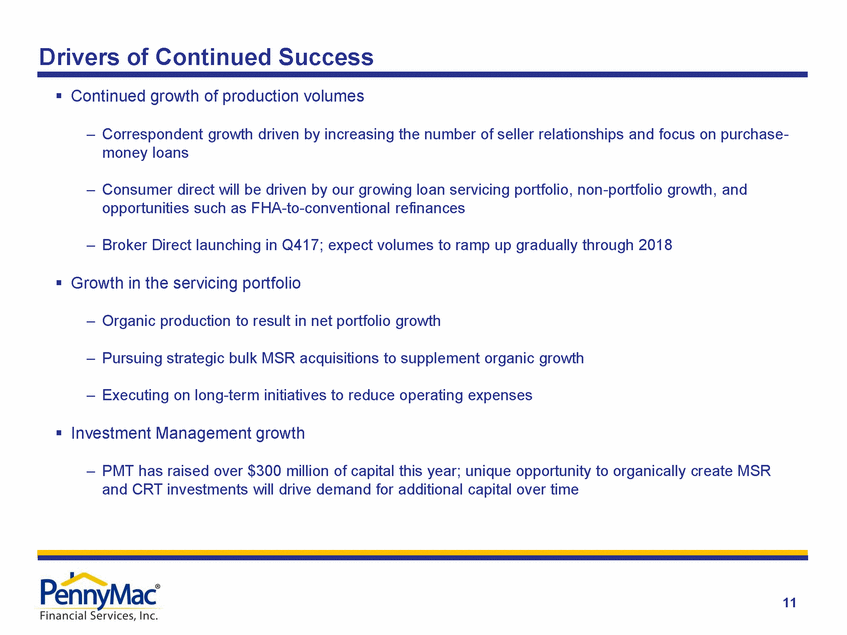
Drivers of Continued Success Continued growth of production volumes – Correspondent growth driven by increasing the number of seller relationships and focus on purchase-money loans – Consumer direct will be driven by our growing loan servicing portfolio, non-portfolio growth, and opportunities such as FHA-to-conventional refinances – Broker Direct launching in Q417; expect volumes to ramp up gradually through 2018 Growth in the servicing portfolio – Organic production to result in net portfolio growth – Pursuing strategic bulk MSR acquisitions to supplement organic growth – Executing on long-term initiatives to reduce operating expenses Investment Management growth – PMT has raised over $300 million of capital this year; unique opportunity to organically create MSR and CRT investments will drive demand for additional capital over time 11 |

