Attached files
| file | filename |
|---|---|
| EX-99.2 - EX-99.2 - Aptiv PLC | d456127dex992.htm |
| 8-K - 8-K - Aptiv PLC | d456127d8k.htm |
Exhibit 99.1
Delphi Powertrain Presentation Senior Notes Offering September 2017
Disclosure This presentation, as well as other statements made by Delphi Jersey Holdings plc (the “Company”), contain forward-looking statements that reflect, when made, the Company’s current views with respect to current events. Such forward-looking statements are subject to many risks, uncertainties and factors relating to the Company’s operations and business environment, which may cause the actual results of the Company to be materially different from any future results. All statements that address future operating, financial or business performance or the Company’s strategies or expectations are forward-looking statements. Factors that could cause actual results to differ materially from these forward-looking statements are discussed under the captions “Risk Factors” and “Management’s Discussion and Analysis of Financial Condition and Results of Operations” in the offering memorandum for this transaction. New risks and uncertainties arise from time to time, and it is impossible for us to predict these events or how they may affect the Company. The Company disclaims any intention or obligation to update or revise any forward-looking statements, whether as a result of new information, future events and/or otherwise, except as may be required by law. In presenting the Company’s results, management has included and discussed certain non-GAAP measures. Management believes that these non-GAAP measures, which may be defined differently by other companies, better explain the Company’s results of operations in a manner that allows for a more complete understanding of the underlying trends in the Company’s business. However, these measures have important limitations as analytical tools, and you should not consider them in isolation or as substitutes for results as reported under U.S. GAAP. For a description of non-GAAP measures and reconciliations used in this presentation, please see the appendix of this presentation.
2. Evolution of Delphi & Key Powertrain Highlights
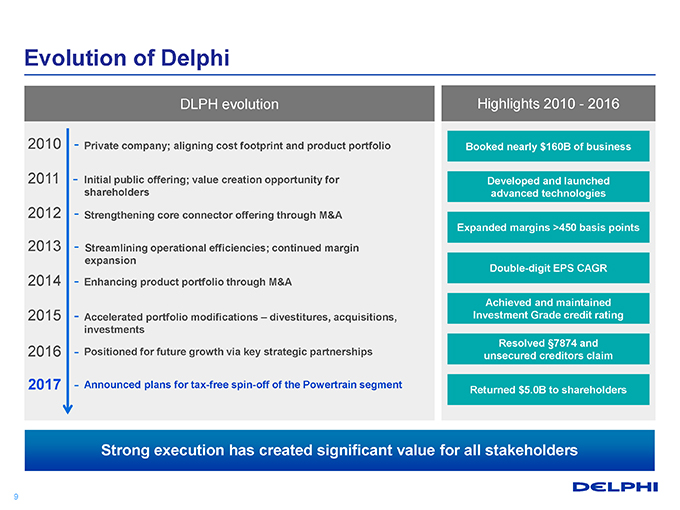
Evolution of Delphi DLPH evolution Highlights 2010 - 2016 2010 - Private company; aligning cost footprint and product portfolio Booked nearly $160B of business 2011 - Initial public offering; value creation opportunity for Developed and launched shareholders advanced technologies 2012 - Strengthening core connector offering through M&A Expanded margins >450 basis points 2013 - Streamlining operational efficiencies; continued margin expansion Double-digit EPS CAGR 2014 - Enhancing product portfolio through M&A Achieved and maintained 2015 - Accelerated portfolio modifications – divestitures, acquisitions, Investment Grade credit rating investments Positioned for future growth via key strategic partnerships Resolved §7874 and 2016 - unsecured creditors claim 2017 - Announced plans for tax-free spin-off of the Powertrain segment Returned $5.0B to shareholders Strong execution has created significant value for all stakeholders
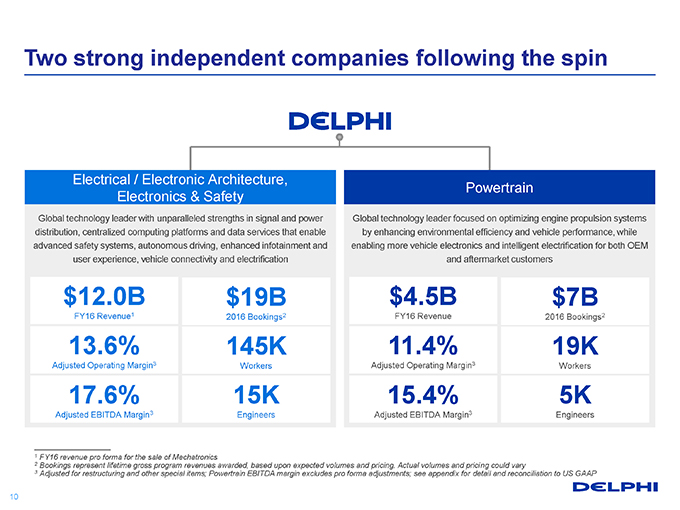
Two strong independent companies following the spin Electrical / Electronic Architecture, Powertrain Electronics & Safety Global technology leader with unparalleled strengths in signal and power Global technology leader focused on optimizing engine propulsion systems distribution, centralized computing platforms and data services that enable by enhancing environmental efficiency and vehicle performance, while advanced safety systems, autonomous driving, enhanced infotainment and enabling more vehicle electronics and intelligent electrification for both OEM user experience, vehicle connectivity and electrification and aftermarket customers $12.0B $19B $4.5B $7B FY16 Revenue1 2016 Bookings2 FY16 Revenue 2016 Bookings2 13.6% 145K 11.4% 19K Adjusted Operating Margin3 Workers Adjusted Operating Margin3 Workers 17.6% 15K 15.4% 5K Adjusted EBITDA Margin3 Engineers Adjusted EBITDA Margin3 Engineers __________________ 1 FY16 revenue pro forma for the sale of Mechatronics 2 Bookings represent lifetime gross program revenues awarded, based upon expected volumes and pricing. Actual volumes and pricing could vary 3 Adjusted for restructuring and other special items; Powertrain EBITDA margin excludes pro forma adjustments; see appendix for detail and reconciliation to US GAAP 10
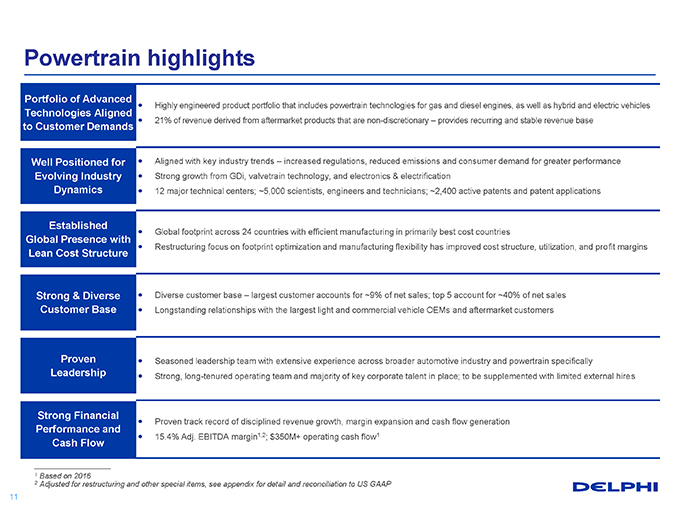
Powertrain highlights Portfolio of Advanced Highly engineered product portfolio that includes powertrain technologies for gas and diesel engines, as well as hybrid and electric vehicles Technologies Aligned 21% of revenue derived from aftermarket products that are non-discretionary – provides recurring and stable revenue base to Customer Demands Well Positioned for Aligned with key industry trends – increased regulations, reduced emissions and consumer demand for greater performance Evolving Industry Strong growth from GDi, valvetrain technology, and electronics & electrification Dynamics 12 major technical centers; ~5,000 scientists, engineers and technicians; ~2,400 active patents and patent applications Established Global footprint across 24 countries with efficient manufacturing in primarily best cost countries Global Presence with Restructuring focus on footprint optimization and manufacturing flexibility has improved cost structure, utilization, and profit margins Lean Cost Structure Strong & Diverse Diverse customer base – largest customer accounts for ~9% of net sales; top 5 account for ~40% of net sales Customer Base Longstanding relationships with the largest light and commercial vehicle OEMs and aftermarket customers Proven Seasoned leadership team with extensive experience across broader automotive industry and powertrain specifically Leadership Strong, long-tenured operating team and majority of key corporate talent in place; to be supplemented with limited external hires Strong Financial Proven track record of disciplined revenue growth, margin expansion and cash flow generation Performance and Cash Flow 15.4% Adj. EBITDA margin1,2; $350M+ operating cash flow1 __________________ 1 Based on 2016 2 Adjusted for restructuring and other special items, see appendix for detail and reconciliation to US GAAP 11
3. Powertrain Overview
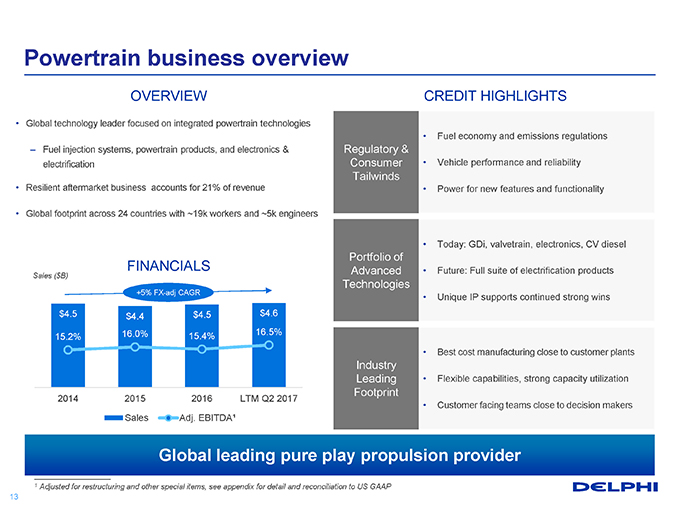
Powertrain business overview OVERVIEW CREDIT HIGHLIGHTS • Global technology leader focused on integrated powertrain technologies • Fuel economy and emissions regulations Fuel injection systems, powertrain products, and electronics & Regulatory & electrification Consumer • Vehicle performance and reliability Tailwinds • Resilient aftermarket business accounts for 21% of revenue • Power for new features and functionality • Global footprint across 24 countries with ~19k workers and ~5k engineers • Today: GDi, valvetrain, electronics, CV diesel Portfolio of FINANCIALS Advanced • Future: Full suite of electrification products Sales ($B) Technologies +5% FX-adj CAGR • Unique IP supports continued strong wins $4.5 $4.4 $4.5 $4.6 16.0% 15.4% 16.5% 15.2% • Best cost manufacturing close to customer plants Industry Leading • Flexible capabilities, strong capacity utilization Footprint 2014 2015 2016 LTM Q2 2017 • Customer facing teams close to decision makers Sales Adj. EBITDA¹ Global leading pure play propulsion provider _____ 1 Adjusted for restructuring and other special items, see appendix for detail and reconciliation to US GAAP 13
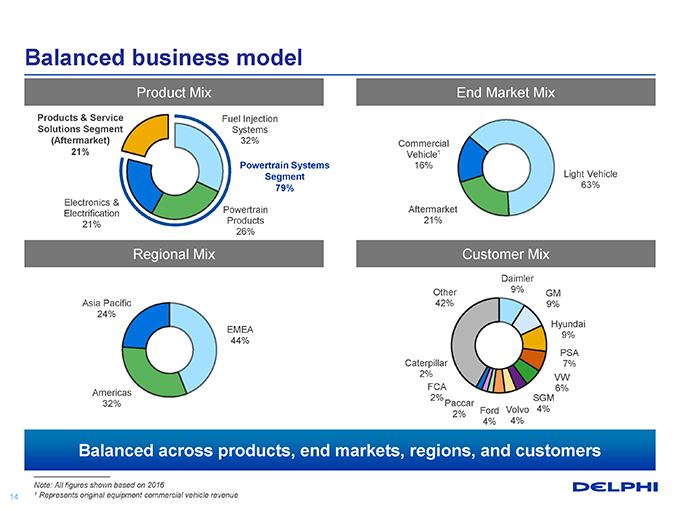
Balanced business model Product Mix End Market Mix Products & Service Fuel Injection Solutions Segment Systems (Aftermarket) 32% Commercial 21% Vehicle1 Powertrain Systems 16% Light Vehicle Segment 63% 79% Electronics & Powertrain Aftermarket Electrification Products 21% 21% 26% Regional Mix Customer Mix Daimler Other 9% GM Asia Pacific 42% 9% 24% Hyundai EMEA 9% 44% PSA Caterpillar 7% 2% VW FCA 6% Americas 2% SGM 32% Paccar Ford Volvo 4% 2% 4% 4% Balanced across products, end markets, regions, and customers ______ Note: All figures shown based on 2016 14 1 Represents original equipment commercial vehicle revenue
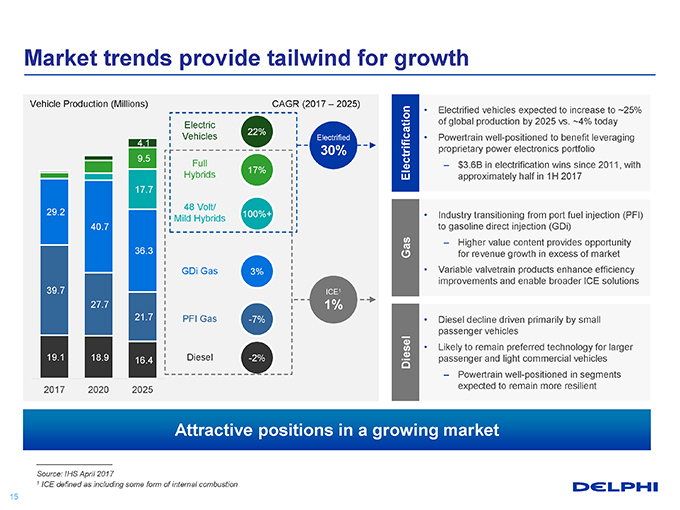
Market trends provide tailwind for growth Vehicle Production (Millions) CAGR (2017 – 2025) • Electrified vehicles expected to increase to ~25% Electric of global production by 2025 vs. ~4% today 22% Vehicles Electrified • Powertrain well-positioned to benefit leveraging 4.1 30% proprietary power electronics portfolio 9.5 Full $3.6B in electrification wins since 2011, with 17% Hybrids Electrification approximately half in 1H 2017 17.7 48 Volt/ 29.2 100%+ • Industry transitioning from port fuel injection (PFI) 40.7 Mild Hybrids to gasoline direct injection (GDi) 36.3 Higher value content provides opportunity Gas for revenue growth in excess of market GDi Gas 3% • Variable valvetrain products enhance efficiency improvements and enable broader ICE solutions 39.7 ICE1 27.7 1% 21.7 PFI Gas -7% • Diesel decline driven primarily by small passenger vehicles • Likely to remain preferred technology for larger 19.1 18.9 16.4 Diesel -2% Diesel passenger and light commercial vehicles Powertrain well-positioned in segments 2017 2020 2025 expected to remain more resilient Attractive positions in a growing market __ Source: IHS April 2017 1 ICE defined as including some form of internal combustion 15
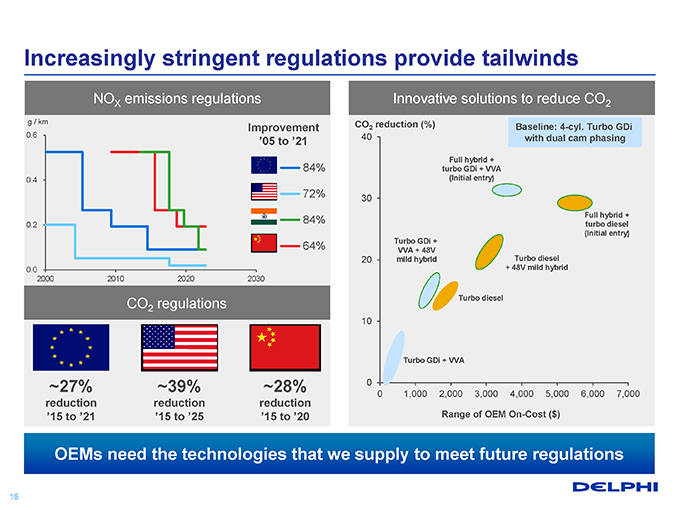
Increasingly stringent regulations provide tailwinds NOX emissions regulations Innovative solutions to reduce CO2 g / km CO2 reduction (%) Improvement Baseline: 4-cyl. Turbo GDi 0.6 40 with dual cam phasing ‘05 to ‘21 Full hybrid + eu 84% turbo GDi + VVA 0.4 (Initial entry) us 72% 30 Full hybrid + s 84% 0.2 turbo diesel (Initial entry) Turbo GDi + r64% VVA + 48V 20 mild hybrid Turbo diesel 0.0 + 48V mild hybrid 2000 2010 2020 2030 CO regulations Turbo diesel 2 10 Turbo GDi + VVA ~27% ~39% ~28% 0 reduction reduction reduction 0 1,000 2,000 3,000 4,000 5,000 6,000 7,000 ‘15 to ‘21 ‘15 to ‘25 ‘15 to ‘20 Range of OEM On-Cost ($) OEMs need the technologies that we supply to meet future regulations 16
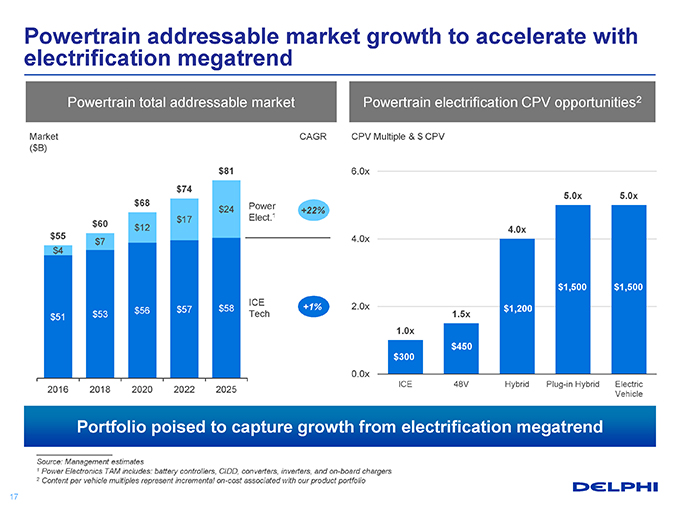
Powertrain addressable market growth to accelerate with electrification megatrend Powertrain total addressable market Powertrain electrification CPV opportunities2 Market CAGR CPV Multiple & $ CPV ($B) $81 6.0x $74 5.0x 5.0x $68 Power $24 Elect.1 +22% $17 $60 $12 4.0x $55 4.0x $7 $4 $1,500 $1,500 ICE 2.0x $56 $57 $58 +1% $1,200 $53 Tech 1.5x $51 1.0x $450 $300 0.0x ICE 48V Hybrid Plug-in Hybrid Electric 2016 2018 2020 2022 2025 Vehicle Portfolio poised to capture growth from electrification megatrend ___ Source: Management estimates 1 Power Electronics TAM includes: battery controllers, CIDD, converters, inverters, and on-board chargers 2 Content per vehicle multiples represent incremental on-cost associated with our product portfolio 17
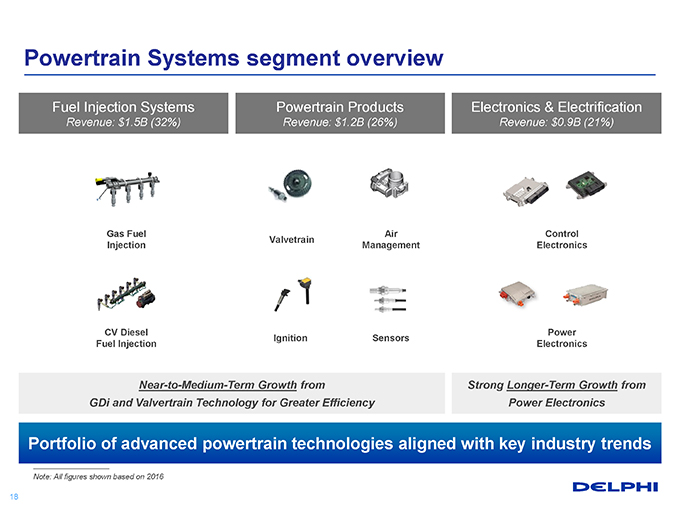
Powertrain Systems segment overview Fuel Injection Systems Powertrain Products Electronics & Electrification Revenue: $1.5B (32%) Revenue: $1.2B (26%) Revenue: $0.9B (21%) Gas Fuel Air Control Valvetrain Injection Management Electronics CV Diesel Power Ignition Sensors Fuel Injection Electronics Near-to-Medium-Term Growth from Strong Longer-Term Growth from GDi and Valvertrain Technology for Greater Efficiency Power Electronics Portfolio of advanced powertrain technologies aligned with key industry trends __ Note: All figures shown based on 2016 18
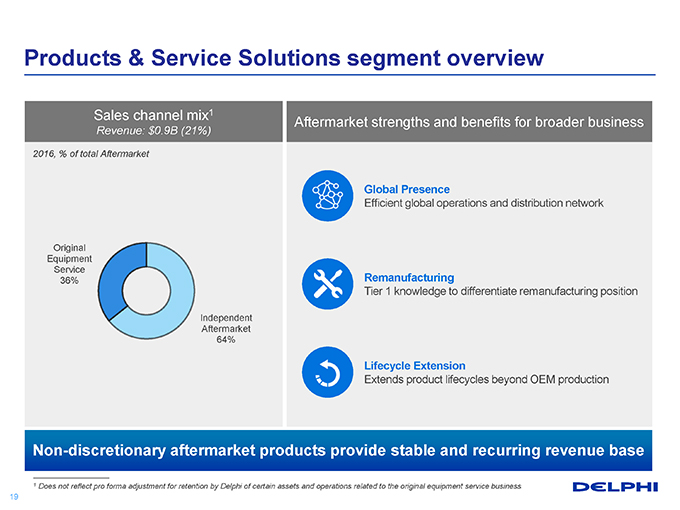
Products & Service Solutions segment overview Sales channel mix1 Aftermarket strengths and benefits for broader business Revenue: $0.9B (21%) 2016, % of total Aftermarket Global Presence Efficient global operations and distribution network Original Equipment Service 36% Remanufacturing Tier 1 knowledge to differentiate remanufacturing position Independent Aftermarket 64% Lifecycle Extension Extends product lifecycles beyond OEM production Non-discretionary aftermarket products provide stable and recurring revenue base __ 1 Does not reflect pro forma adjustment for retention by Delphi of certain assets and operations related to the original equipment service business 19
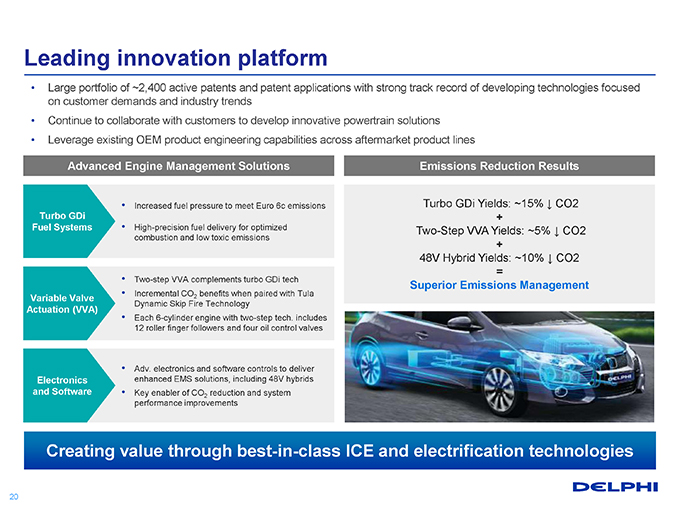
Leading innovation platform • Large portfolio of ~2,400 active patents and patent applications with strong track record of developing technologies focused on customer demands and industry trends • Continue to collaborate with customers to develop innovative powertrain solutions • Leverage existing OEM product engineering capabilities across aftermarket product lines Advanced Engine Management Solutions Emissions Reduction Results • Increased fuel pressure to meet Euro 6c emissions Turbo GDi Yields: ~15% CO2 Turbo GDi + Fuel Systems • High-precision fuel delivery for optimized Two-Step VVA Yields: ~5% CO2 combustion and low toxic emissions + 48V Hybrid Yields: ~10% CO2 Two-step tech = • VVA complements turbo GDi Superior Emissions Management • Incremental CO2 benefits when paired with Tula Variable Valve Dynamic Skip Fire Technology Actuation (VVA) • Each 6-cylinder engine with two-step tech. includes 12 roller finger followers and four oil control valves • Adv. electronics and software controls to deliver Electronics enhanced EMS solutions, including 48V hybrids and Software • Key enabler of CO reduction and system 2 performance improvements Creating value through best-in-class ICE and electrification technologies 20
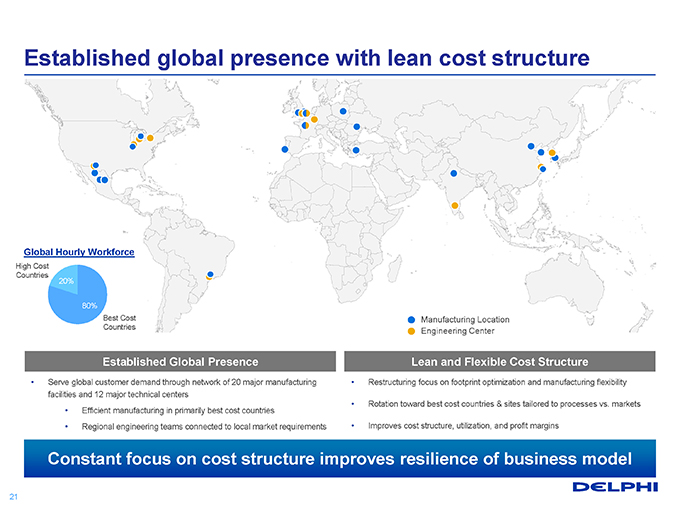
Established global presence with lean cost structure Global Hourly Workforce High Cost Countries 20% 80% Best Cost Manufacturing Location Countries Engineering Center Established Global Presence Lean and Flexible Cost Structure • Serve global customer demand through network of 20 major manufacturing • Restructuring focus on footprint optimization and manufacturing flexibility facilities and 12 major technical centers • Rotation toward best cost countries & sites tailored to processes vs. markets • Efficient manufacturing in primarily best cost countries • Regional engineering teams connected to local market requirements • Improves cost structure, utilization, and profit margins Constant focus on cost structure improves resilience of business model 21
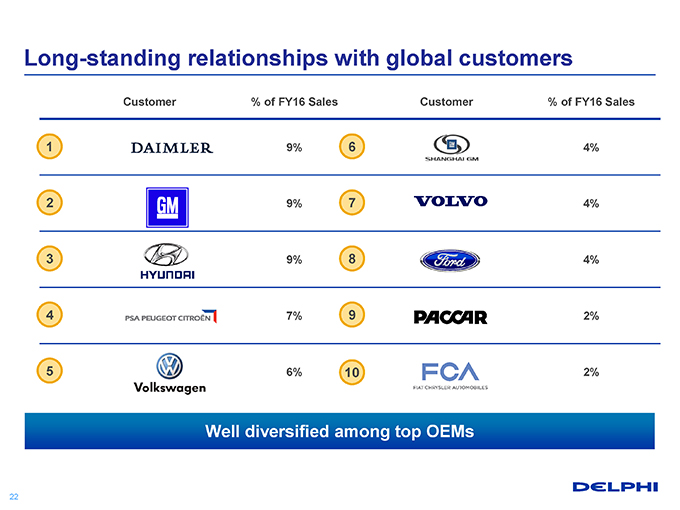
Long-standing relationships with global customers Customer % of FY16 Sales Customer % of FY16 Sales 1 9% 6 4% 2 7 4% 3 8 4% 4 9 2% 5 10 2% Well diversified among top OEMs 22
4. Financial Summary 23
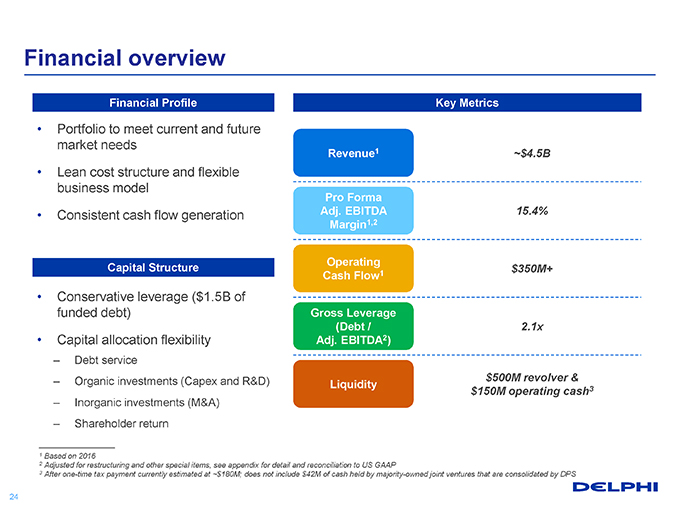
Financial overview Financial Profile Key Metrics • Portfolio to meet current and future market needs Revenue1 ~$4.5B • Lean cost structure and flexible business model Pro Forma • Consistent cash flow generation Adj. EBITDA 15.4% Margin1,2 Operating Capital Structure $350M+ Cash Flow1 • Conservative leverage ($1.5B of funded debt) Gross Leverage (Debt / 2.1x • Capital allocation flexibility Adj. EBITDA2) Debt service Organic investments (Capex and R&D) $500M revolver & Liquidity $150M operating cash3 Inorganic investments (M&A) Shareholder return _____ 1 Based on 2016 2 Adjusted for restructuring and other special items, see appendix for detail and reconciliation to US GAAP 3 After one-time tax payment currently estimated at ~$180M; does not include $42M of cash held by majority-owned joint ventures that are consolidated by DPS 24
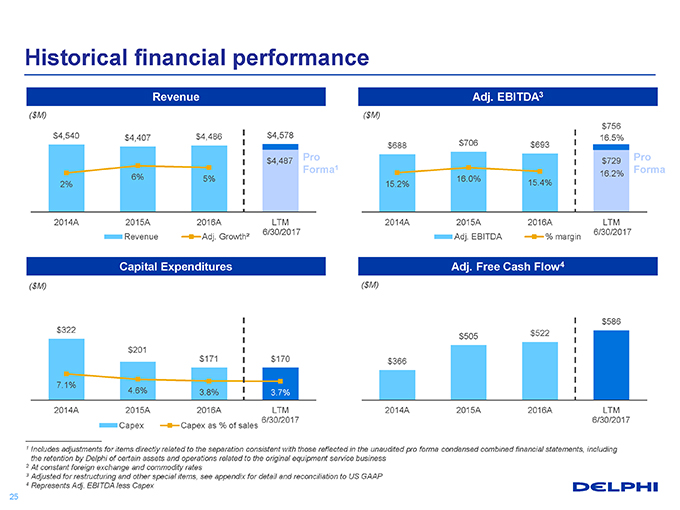
Historical financial performance Revenue Adj. EBITDA3 ($M) ($M) $756 $4,540 $4,407 $4,486 $4,578 $706 16.5% $688 $693 $4,487 Pro $729 Pro Forma1 Forma 6% 16.2% 5% 16.0% 2% 15.2% 15.4% 2014A 2015A 2016A LTM 2014A 2015A 2016A LTM 6/30/2017 6/30/2017 Revenue Adj. Growth² Adj. EBITDA % margin Capital Expenditures Adj. Free Cash Flow4 ($M) ($M) $586 $322 $522 $505 $201 $171 $170 $366 7.1% 4.6% 3.8% 3.7% 2014A 2015A 2016A LTM 2014A 2015A 2016A LTM 6/30/2017 6/30/2017 Capex Capex as % of sales __ 1 Includes adjustments for items directly related to the separation consistent with those reflected in the unaudited pro forma condensed combined financial statements, including 2 the retention by Delphi of certain assets and operations related to the original equipment service business 2 At constant foreign exchange and commodity rates 3 Adjusted for restructuring and other special items, see appendix for detail and reconciliation to US GAAP 4 Represents Adj. EBITDA less Capex 25
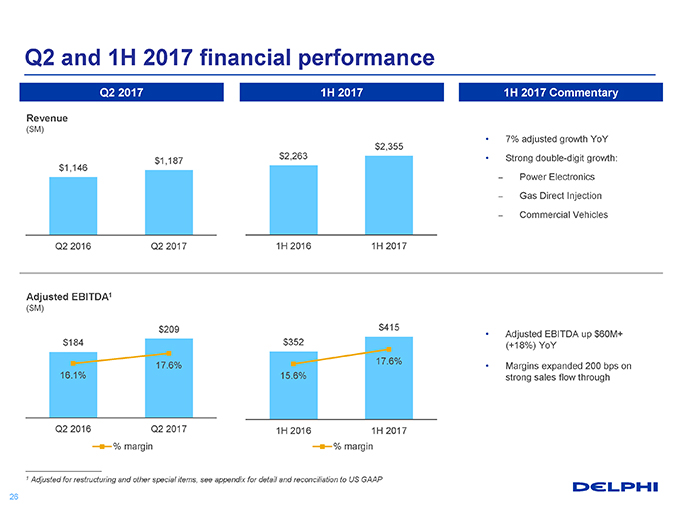
Q2 and 1H 2017 financial performance Q2 2017 1H 2017 1H 2017 Commentary Revenue ($M) • 7% adjusted growth YoY $2,355 $2,263 • Strong double-digit growth: $1,187 $1,146 Power Electronics Gas Direct Injection Commercial Vehicles Q2 2016 Q2 2017 1H 2016 1H 2017 Adjusted EBITDA1 ($M) $209 $415 $352 • Adjusted EBITDA up $60M+ $184 (+18%) YoY 17.6% 17.6% • Margins expanded 200 bps on 16.1% 15.6% strong sales flow through Q2 2016 Q2 2017 1H 2016 1H 2017 % margin % margin ____ 1 Adjusted for restructuring and other special items, see appendix for detail and reconciliation to US GAAP 26
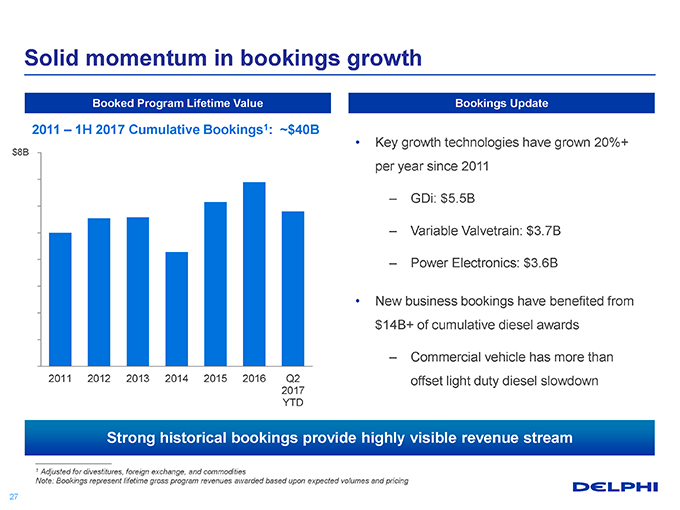
Solid momentum in bookings growth Booked Program Lifetime Value Bookings Update 2011 – 1H 2017 Cumulative Bookings1: ~$40B • Key growth technologies have grown 20%+ $8B per year since 2011 GDi: $5.5B Variable Valvetrain: $3.7B Power Electronics: $3.6B • New business bookings have benefited from $14B+ of cumulative diesel awards Commercial vehicle has more than 2011 2012 2013 2014 2015 2016 Q2 offset light duty diesel slowdown 2017 YTD Strong historical bookings provide highly visible revenue stream ___ 1 Adjusted for divestitures, foreign exchange, and commodities Note: Bookings represent lifetime gross program revenues awarded based upon expected volumes and pricing 27
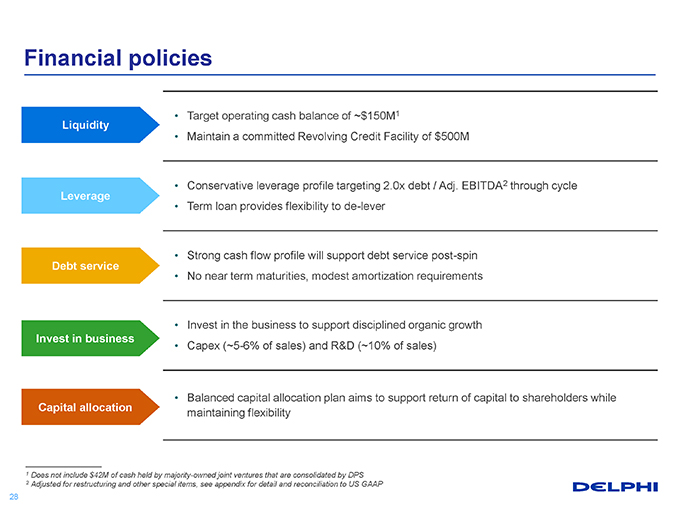
Financial policies • Target operating cash balance of ~$150M1 Liquidity • Maintain a committed Revolving Credit Facility of $500M • Conservative leverage profile targeting 2.0x debt / Adj. EBITDA2 through cycle Leverage • Term loan provides flexibility to de-lever • Strong cash flow profile will support debt service post-spin Debt service • No near term maturities, modest amortization requirements • Invest in the business to support disciplined organic growth Invest in business • Capex (~5-6% of sales) and R&D (~10% of sales) Capital allocation • Balanced capital allocation plan aims to support return of capital to shareholders while maintaining flexibility _ 1 Does not include $42M of cash held by majority-owned joint ventures that are consolidated by DPS 2 Adjusted for restructuring and other special items, see appendix for detail and reconciliation to US GAAP 28
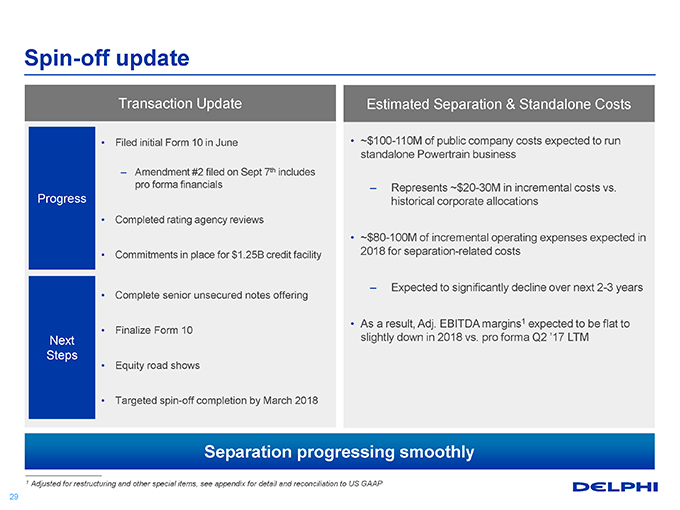
Spin-off update Transaction Update Estimated Separation & Standalone Costs • Filed initial Form 10 in June • ~$100-110M of public company costs expected to run standalone Powertrain business Amendment #2 filed on Sept 7th includes pro forma financials Represents ~$20-30M in incremental costs vs. Progress historical corporate allocations • Completed rating agency reviews • ~$80-100M of incremental operating expenses expected in • Commitments in place for $1.25B credit facility 2018 for separation-related costs Expected to significantly decline over next 2-3 years • Complete senior unsecured notes offering • As a result, Adj. EBITDA margins1 expected to be flat to • Finalize Form 10 Next slightly down in 2018 vs. pro forma Q2 ‘17 LTM Steps • Equity road shows • Targeted spin-off completion by March 2018 Separation progressing smoothly _ 1 Adjusted for restructuring and other special items, see appendix for detail and reconciliation to US GAAP 29
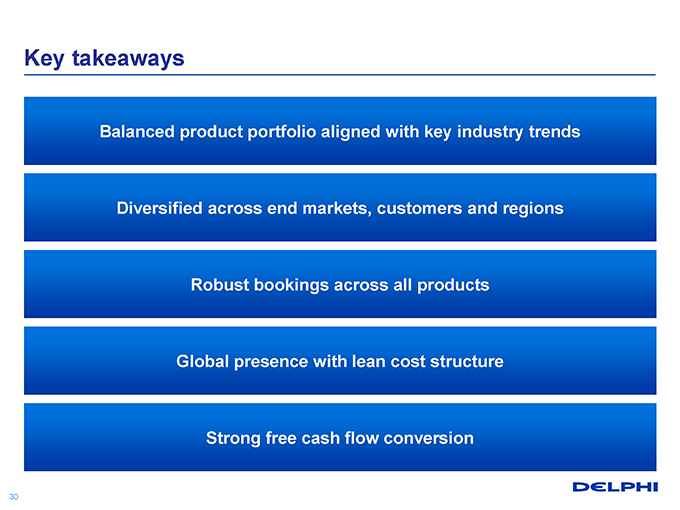
Key takeaways Balanced product portfolio aligned with key industry trends Diversified across end markets, customers and regions Robust bookings across all products Global presence with lean cost structure Strong free cash flow conversion 30
Appendix 31
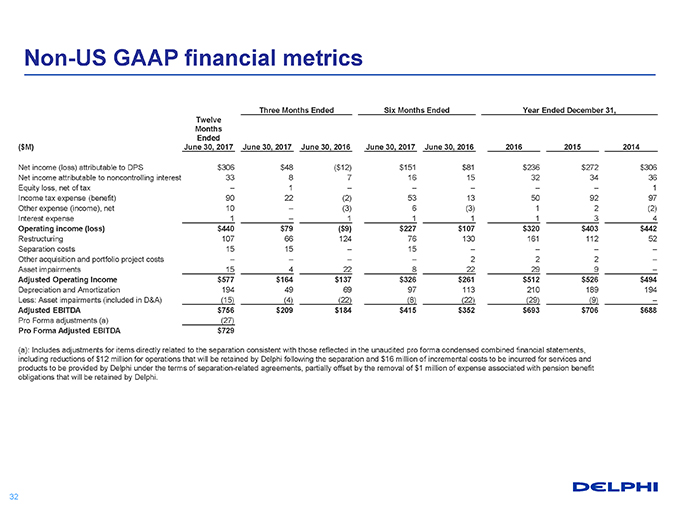
Non-US GAAP financial metrics Three Months Ended Six Months Ended Year Ended December 31, Twelve Months Ended ($M) June 30, 2017 June 30, 2017 June 30, 2016 June 30, 2017 June 30, 2016 2016 2015 2014 Net income (loss) attributable to DPS $306 $48 ($12) $151 $81 $236 $272 $306 Net income attributable to noncontrolling interest 33 8 7 16 15 32 34 36 Equity loss, net of tax – 1 – – – – – 1 Income tax expense (benefit) 90 22 (2) 53 13 50 92 97 Other expense (income), net 10 – (3) 6 (3) 1 2 (2) Interest expense 1 – 1 1 1 1 3 4 Operating income (loss) $440 $79 ($9) $227 $107 $320 $403 $442 Restructuring 107 66 124 76 130 161 112 52 Separation costs 15 15 – 15 – – – –Other acquisition and portfolio project costs – – – – 2 2 2 –Asset impairments 15 4 22 8 22 29 9 – Adjusted Operating Income $577 $164 $137 $326 $261 $512 $526 $494 Depreciation and Amortization 194 49 69 97 113 210 189 194 Less: Asset impairments (included in D&A) (15) (4) (22) (8) (22) (29) (9) – Adjusted EBITDA $756 $209 $184 $415 $352 $693 $706 $688 Pro Forma adjustments (a) (27) Pro Forma Adjusted EBITDA $729 (a): Includes adjustments for items directly related to the separation consistent with those reflected in the unaudited pro forma condensed combined financial statements, including reductions of $12 million for operations that will be retained by Delphi following the separation and $16 million of incremental costs to be incurred for services and products to be provided by Delphi under the terms of separation-related agreements, partially offset by the removal of $1 million of expense associated with pension benefit obligations that will be retained by Delphi. 32
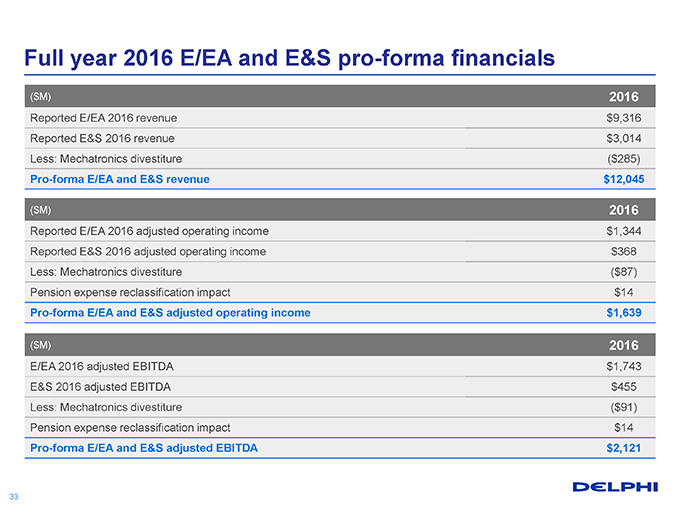
Full year 2016 E/EA and E&S pro-forma financials ($M) 2016 Reported E/EA 2016 revenue $9,316 Reported E&S 2016 revenue $3,014 Less: Mechatronics divestiture ($285) Pro-forma E/EA and E&S revenue $12,045 ($M) 2016 Reported E/EA 2016 adjusted operating income $1,344 Reported E&S 2016 adjusted operating income $368 Less: Mechatronics divestiture ($87) Pension expense reclassification impact $14 Pro-forma E/EA and E&S adjusted operating income $1,639 ($M) 2016 E/EA 2016 adjusted EBITDA $1,743 E&S 2016 adjusted EBITDA $455 Less: Mechatronics divestiture ($91) Pension expense reclassification impact $14 Pro-forma E/EA and E&S adjusted EBITDA $2,121 33
DELPHI Innovation for the Real World