Attached files
| file | filename |
|---|---|
| EX-32.2 - EXHIBIT 32.2 - Lifevantage Corp | ex322cfosec906certificatio.htm |
| EX-32.1 - EXHIBIT 32.1 - Lifevantage Corp | ex321ceosec906certificatio.htm |
| EX-31.2 - EXHIBIT 31.2 - Lifevantage Corp | ex312cfosec302certificatio.htm |
| EX-31.1 - EXHIBIT 31.1 - Lifevantage Corp | ex311ceosec302certificatio.htm |
| EX-23.2 - EXHIBIT 23.2 - Lifevantage Corp | ex232wsrpconsent2017063020.htm |
| EX-23.1 - EXHIBIT 23.1 - Lifevantage Corp | ex231ekshconsent2017063020.htm |
UNITED STATES
SECURITIES AND EXCHANGE COMMISSION
WASHINGTON, D.C. 20549
________________________________________________________________________________
FORM 10-K
(Mark One)
ý | ANNUAL REPORT UNDER SECTION 13 OR 15(d) OF THE SECURITIES EXCHANGE ACT OF 1934. |
For the fiscal year ended June 30, 2017
¨ | TRANSITION REPORT UNDER SECTION 13 OR 15(d) OF THE SECURITIES EXCHANGE ACT OF 1934. |
For the transition period from __________ to __________
Commission file number: 001-35647
________________________________________________________________________________
LIFEVANTAGE CORPORATION
(Exact name of registrant as specified in its charter)
Colorado | 90-0224471 |
(State or other jurisdiction of incorporation or organization) | (IRS Employer Identification No.) |
9785 S. Monroe, Ste 300 | |
Sandy, UT 84070 | |
(Address of principal executive offices, including zip code) | |
Registrant’s telephone number: (801) 432-9000 | |
Securities registered pursuant to Section 12(b) of the Act:
Title of Each Class | Name of Each Exchange on which Registered | |
Common Stock, par value $0.001 per share | NASDAQ Global Market | |
Securities registered pursuant to Section 12(g) of the Act: None
________________________________________________________________________________
Indicate by check mark if the registrant is a well-known seasoned issuer, as defined in Rule 405 of the Securities Act. Yes ¨ No ý
Indicate by check mark if the registrant is not required to file reports pursuant to Section 13 or Section 15(d) of the Act. Yes ¨ No ý
Indicate by check mark whether the registrant (1) has filed all reports required to be filed by Section 13 or 15(d) of the Securities Exchange Act of 1934 during the preceding 12 months (or for such shorter period that the registrant was required to file such reports), and (2) has been subject to such filing requirements for the past 90 days. Yes ý No ¨
Indicate by check mark whether the registrant has submitted electronically and posted on its corporate Web site, if any, every Interactive Data File required to be submitted and posted pursuant to Rule 405 of Regulation S-T during the preceding 12 months (or for such shorter period that the registrant was required to submit and post such files). Yes ý No ¨
Indicate by check mark if disclosure of delinquent filers pursuant to Item 405 of Regulation S-K is not contained herein, and will not be contained, to the best of registrant’s knowledge, in definitive proxy or information statements incorporated by reference in Part III of this Form 10-K or any amendment to this Form 10-K. ¨
Indicate by check mark whether the registrant is a large accelerated filer, an accelerated filer, a non-accelerated filer, a smaller reporting company, or an emerging growth company. See the definitions of “large accelerated filer,” “accelerated filer,” “smaller reporting company,” and "emerging growth company" in Rule 12b-2 of the Exchange Act. (Check one):
Large accelerated filer | ¨ | Accelerated filer | ý |
Non-accelerated filer | ¨ (Do not check if a smaller reporting company) | Smaller reporting company | ¨ |
Emerging growth company | ¨ | ||
If an emerging growth company, indicate by check mark if the registrant has elected not to use the extended transition period for complying with any new or revised financial accounting standards provided pursuant to Section 13(a) of the Exchange Act. ¨
Indicate by check mark whether the registrant is a shell company (as defined in Rule 12b-2 of the Act). Yes ¨ No ý
The aggregate market value of the registrant's common stock held by non-affiliates as of December 31, 2016, the end of the registrant's second fiscal quarter, was approximately $114.5 million, based on a closing market price of $8.15 per share.
The number of shares of common stock (par value $0.001) outstanding as of September 1, 2017 was 14,228,144 shares.
________________________________________________________________________________
DOCUMENTS INCORPORATED BY REFERENCE
None.
EXPLANATORY NOTE
In this annual report on Form 10-K for the fiscal year ended June 30, 2017, we are revising our consolidated balance sheet as of June 30, 2016, our consolidated statements of operations and comprehensive income, stockholders' equity and cash flows for the fiscal years ended June 30, 2016 and 2015, and our selected financial data for the fiscal years ended June 30, 2016, 2015, 2014, and 2013 to correct immaterial errors related to our income tax provisions during these periods. We assessed the impact of these revisions and concluded that they were not material to any of our financial statements for each of the three quarters within the nine months ended March 31, 2017, or fiscal years ended June 30, 2016, 2015, 2014, or 2013. As a result, we have not filed amendments to any of our previously filed annual reports on Form 10-K or quarterly reports on Form 10-Q. Although the effect of these revisions was not material to these previously issued financial statements, the cumulative effect of reflecting these revisions in the current year would have been material for the fiscal year ended June 30, 2017. Consequently, we have revised these historical financial results in this annual report on Form 10-K. Because these revisions are treated as corrections to our prior period financial results, the revisions are considered to be a restatement under generally accepted accounting principles (“GAAP”). Accordingly, the revised financial information included in this annual report on Form 10-K has been identified "as revised.”
For more information regarding the impact on our financial results, refer to Part II, Item 6, “Selected Financial Data,” and Item 7, “Management's Discussion and Analysis of Financial Condition and Results of Operations,” and to our Consolidated Financial Statements included in Part II, Item 8, including Note 2, “Summary of Significant Accounting Policies,” and Note 13, “Interim Financial Results (Unaudited).”
CAUTIONARY NOTE REGARDING FORWARD-LOOKING STATEMENTS
Certain statements contained in this report and the information incorporated by reference herein may contain “forward-looking statements” (as such term is defined in Section 27A of the Securities Act of 1933, as amended, and Section 21E of the Securities Exchange Act of 1934, as amended). These statements, which involve risks and uncertainties, reflect our current expectations, intentions, or strategies regarding our possible future results of operations, performance, and achievements. Forward-looking statements include, without limitation: statements regarding future products or product development; statements regarding future selling, general and administrative costs and research and development spending; statements regarding the future performance of our network marketing efforts; statements regarding our expectations regarding ongoing litigation; statements regarding international growth; and statements regarding future financial performance, results of operations, capital expenditures and sufficiency of capital resources to fund our operating requirements. These forward-looking statements are made pursuant to the safe harbor provisions of the Private Securities Litigation Reform Act of 1995 and applicable rules of the Securities and Exchange Commission and common law.
These forward-looking statements may be identified in this report and the information incorporated by reference by words such as “anticipate”, “believe”, “could”, “estimate”, “expect”, “intend”, “plan”, “predict”, “project”, “should” and similar terms and expressions, including references to assumptions and strategies. These statements reflect our current beliefs and are based on information currently available to us. Accordingly, these statements are subject to certain risks, uncertainties, and contingencies, which could cause our actual results, performance, or achievements to differ materially from those expressed in, or implied by, such statements.
The following factors are among those that may cause actual results to differ materially from our forward-looking statements:
• | Inability to properly manage, motivate and retain our independent distributors or to attract new independent distributors on an ongoing basis; |
• | Inability to manage existing markets, open new international markets or expand our operations; |
• | Non-compliance by our independent distributors with applicable legal requirements or our policies and procedures; |
• | Inability of new products and technological innovations to gain distributor or market acceptance; |
• | Matters relating to our audit committee's independent review into sales of our products in certain international markets; |
• | Potential adverse effects on our business and stock price due to ineffective internal controls; |
• | Inability to manage financial reporting and internal control systems and processes and maintain appropriate level of internal control over financial reporting; |
• | Inability to execute our product launch process due to increased pressure on our supply chain, information systems and management; |
• | Inability to appropriately manage our inventory; |
• | Disruptions in our information technology systems; |
• | Inability to protect against cyber security risks and to maintain the integrity of data; |
• | Inability to comply with financial covenants imposed by our credit facility and the impact of debt service obligations and restrictive debt covenants; |
• | International trade or foreign exchange restrictions, increased tariffs, foreign currency exchange fluctuations; |
• | Deterioration of global economic conditions; |
• | Inability to raise additional capital or complete desired acquisitions; |
• | Exposure to environmental liabilities stemming from past operations and property ownership; |
• | Dependence upon a few products for revenue; |
• | High quality materials for our products may become difficult to obtain or expensive; |
• | Dependence on third parties to manufacture our products; |
• | Disruptions to the transportation channels used to distribute our products; |
• | We may be subject to a product recall; |
• | Unfavorable publicity on our business or products; |
• | Our direct selling program could be found to not be in compliance with current or newly adopted laws or regulations in various markets; |
• | Legal proceedings may be expensive and time consuming; |
• | Strict government regulations on our business; |
• | Regulations governing the production or marketing of our skin care products; |
• | Risk of investigatory and enforcement action by the Federal Trade Commission; |
• | Government authorities may question our tax positions or transfer pricing policies or change their laws in a manner that could increase our effective tax rate or otherwise harm our business; |
• | Failure to comply with anti-corruption laws; |
• | Inability to build and integrate our new management team could harm our business; |
• | Loss of, or inability to attract, key personnel; |
• | We may be held responsible for certain taxes or assessments relating to the activity of our independent distributors; |
• | Competition in the dietary supplement market; |
• | Our inability to protect our intellectual property rights; |
• | Third party claims that we infringe on their intellectual property; |
• | Product liability claims against us; |
• | Economic, political, foreign exchange and other risks associated with international operations; |
• | Potential delisting of our common stock due to non-compliance with Nasdaq's continued listing requirements; |
• | Volatility of the market price of our common stock; |
• | Substantial sales of shares may negatively impact the market price of our common stock; and |
2
• | Dilution of outstanding common shares may occur if holders of our existing options exercise their securities or upon future vesting of performance restricted stock units. |
When considering these forward-looking statements, you should keep in mind the cautionary statements in this report and the documents incorporated by reference. Except as required by law, we have no obligation and do not undertake to update or revise any such forward-looking statements to reflect events or circumstances after the date of this report.
3
TABLE OF CONTENTS
Page | |
4
PART I
ITEM 1 — BUSINESS
Overview
LifeVantage Corporation (sometimes used herein, the "Company," "we," "us," "our," and similar terms) is a company focused on bio-hacking the aging code through nutrigenomics, the study of how nutrition and naturally occurring compounds affect our genes. We are dedicated to helping people achieve their health, wellness and financial independence goals. We provide quality, scientifically-validated products and a financially rewarding direct sales business opportunity to preferred customers, retail customers and independent distributors who seek a healthy lifestyle and financial freedom. We sell our products in the United States, Japan, Hong Kong, Australia, Canada, Mexico, Thailand, the United Kingdom, the Netherlands and Germany, as of September 2017. In addition, we expect to expand into China in the near term through a new e-commerce business model.
We engage in the identification, research, development and distribution of advanced nutraceutical dietary supplements and skin care products, including Protandim®, our line of scientifically-validated dietary supplements, TrueScience®, our line of anti-aging skin care products, Petandim™ for Dogs, our companion pet supplement formulated to combat oxidative stress in dogs, Axio®, our Smart Energy Drink mixes, and PhysIQ™, our Smart Weight Management System.
We were incorporated in Colorado in June 1988 under the name Andraplex Corporation. We changed our corporate name to Yaak River Resources, Inc. in January 1992, and subsequently changed it again in October 2004 to Lifeline Therapeutics, Inc. In October 2004 and March 2005, we acquired all of the outstanding common stock of Lifeline Nutraceuticals Corporation. In November 2006, we changed our name to LifeVantage Corporation. From our fiscal year 2005 until our fiscal year 2009, we marketed and sold a single product, Protandim®, through traditional retail stores. In October 2008, we announced that we were transitioning our business model from a traditional retail model to a direct sales model in which Protandim® would be sold primarily through our network of independent distributors. Since entering direct sales, we have increased our geographic reach by entering new international markets and increased our product offering by introducing additional scientifically-validated products.
Fiscal Year 2017 Highlights
Technology Innovation
We combined our mobile applications along with our replicated website service into one subscription, the Full Tech Stack, which is designed to help our distributors enhance their businesses by enabling them to perform critical business functions directly from their smart phones. We also added TaxBot to the suite to include tax management tools to the distributors' tool set. This innovative solution has helped create “frictionless” customer and distributor experiences by simplifying our enrollment and ordering processes.
Compensation Plan
We updated our distributor compensation plan to include weekly and monthly bonuses for qualified distributors. In addition, we added new distributor ranks during the fiscal year. Master Pro 10 was formerly the highest rank distributors could achieve under our compensation plan. The new ranks include Executive Master Pro 10 and Presidential Master Pro 10. Distributors who advance to these ranks are eligible for additional achievement bonuses.
Brand Refresh
We introduced new branding designs to improve the presentation of products. We debuted our TrueScience® Beauty System, a four-product TSA-compliant set including our TrueScience® Facial Cleanser, TrueScience® Perfecting Lotion, TrueScience® Eye Serum, and TrueScience® Anti-Aging Cream. In addition, our former Canine Health product has been re-branded and is now called Petandim™ for Dogs.
Product Bundles
We introduced product bundles that combine complementary products into packages that include free shipping, which provides our customers with greater value and broader exposure to our product offering, while increasing average order size with our subscription model. Activated Essentials is a three-part product bundle that includes Protandim® NRF1 and Nrf2 Synergizers along with PhysIQ™ Probio. Customers also have the option to include the TrueScience® Beauty System as part of a bundle.
Loyalty Program
5
Our Loyalty Program allows independent distributors and preferred customers who order products under a monthly subscription to earn reward points while receiving products at wholesale pricing. In addition, points are awarded for referring new customers. Loyalty Program participants can redeem points for LifeVantage products.
Executive Team
We made significant changes to our executive management team during fiscal year 2017. In March 2017, we appointed Charles J. Wach as our Chief Operating Officer. Mr. Wach is an accomplished leader with more than 30 years of operations and leadership experience in the nutritional supplement, direct selling, online retail, and global and beverage industries. Also in March 2017, we appointed Steven R. Fife as our Chief Financial Officer. Mr. Fife has substantial public company and international experience and brings a diverse financial perspective to our Company. Mr. Fife has more than three decades of financial and executive leadership experience having served in several C-level financial and leadership roles.
Additions to Board of Directors
We also added three independent Board members who each bring relevant strategic capabilities to our Board that will further aid in the achievement of our strategic priorities to more effectively engage our distributors and customers, compete globally within the new economy, provide relentless focus on science-based nutrigenomics products and related science, and create frictionless customer and distributor experiences. Raymond Greer's expertise includes international logistics and supply chain management, which will provide us with strategic leadership as we look to further expand internationally and enhance customer service across our global distribution footprint. We plan to leverage Vinayak Hegde's experience, technical skills and knowledge in digital and e-commerce in our efforts to more effectively engage our distributors and customers while enhancing our strategic e-commerce and technology investments. Darwin Lewis' extensive knowledge in global consumer goods sales and operations support our strategy to expand our operations and our long-term growth efforts across current and future international markets.
Our Competitive Advantages
We believe we have a competitive advantage in several key areas:
• | Our Compensation: We believe our distributor compensation plan is one of the more financially rewarding in the direct selling industry. Our percentage of sales paid to independent distributors as compensation and incentives is one of the highest percentages reported in the direct selling industry. Our compensation plan also enables independent distributors to earn compensation early and often as they sell our products. Some elements of our compensation plan are paid weekly, allowing new independent distributors to receive compensation quickly. We believe more frequent payments of compensation helps us retain new independent distributors by allowing them to experience success soon after enrolling. We also offer a variety of incentive programs to our independent distributors for achieving specified sales goals. For example, My LifeVenture® is an incentive program that enables independent distributors to earn the title to a new Jeep Wrangler by achieving and maintaining specified sales goals. We believe our compensation plan and incentive programs help motivate our independent distributors to achieve success. |
• | Our Products: We have a focus in nutrigenomics, the study of how nutrition and naturally occurring compounds affect our genes. We have developed quality, scientifically-validated nutrigenomics products focused on helping individuals look, feel and perform better. Our products are the Protandim® product line, the TrueScience® anti-aging skin care line, Axio® Smart Energy Drink mixes, PhysIQ™ Smart Weight Management System, and Petandim™ for Dogs. The Protandim® product line includes Protandim® NRF1 and Nrf2 Synergizers™. The Protandim® NRF1 Synergizer is formulated to increase cellular energy and performance by boosting mitochondria production to improve cellular repair and slow cellular aging. The Protandim® Nrf2 Synergizer™ contains a proprietary blend of ingredients and has been shown to combat oxidative stress and enhance energy production by increasing the body’s natural antioxidant protection at the genetic level, inducing the production of naturally-occurring protective antioxidant enzymes including superoxide dismutase, catalase, and glutathione synthase. Our TrueScience® anti-aging skin care line includes TrueScience® Facial Cleanser, TrueScience® Perfecting Lotion, TrueScience® Eye Serum, TrueScience® Anti-Aging Cream, TrueScience® Micro-Lift Serum and TrueScience® Hand Cream. Axio® is our line of Smart Energy Drink mixes formulated to promote alertness and support mental performance. Petandim™ for Dogs is a supplement specially formulated to combat oxidative stress in dogs through Nrf2 activation. PhysIQ™ is our Smart Weight Management System which includes PhysIQ™ Fat Burn, PhysIQ™ ProBio, PhysIQ™ Cleanse and PhysIQ™ Protein Shake mix, all formulated to aid in weight management. We believe our significant number of preferred customers who regularly purchase our products without the intention of becoming independent distributors is a strong indicator of the benefits of our products. |
• | Technology-Enabled Distributor Training and Resources: We are committed to providing our independent distributors with resources and training designed to increase productivity and increase their potential for success. We are dedicated |
6
to using technology to facilitate a streamlined approach for independent distributors to manage their businesses and sell our products. Our suite of mobile applications provides the training and tools to help our independent distributors share our products and business opportunity directly from their smart phones. In November 2017, we expect to launch LifeVantage Digital, a proprietary tech platform designed to take the guess work out of building a business for distributors, including those who are brand new to the company, through one comprehensive app. In addition, we provide training materials and we encourage our independent distributors to participate in company-sponsored events, including conventions, promotions and incentives.
• | Our Culture: We are committed to creating a culture for our independent distributors, customers and employees that focuses on ethical, legal and transparent business practices. At enrollment, our independent distributors agree to abide by our policies and procedures. Our policies and procedures, when followed, ensure that our independent distributors comply with applicable laws and regulations. Our compliance department monitors the activities of our independent distributors as part of our effort to enforce our policies and procedures. Similarly, our code of business conduct and ethics sets forth guidelines and expectations for our employees. We believe our ethical, legal and transparent culture attracts highly qualified employees and independent distributors who share our commitment to these principles. |
• | Our Employees: We believe that our employees are an essential asset. We have a dedicated team of professionals that support our system of independent distributors, work to generate long-term value for our shareholders and contribute to the broader public through LifeVantage Legacy and other charitable programs. In turn, we offer competitive compensation, invest in our employees' careers and direct their focus on the long-term goals of our independent distributors and shareholders. |
Scientific Background
Oxidative Stress
Oxidative stress refers to the cellular and tissue damage caused by chemically reactive oxygen species that is generated as a natural result of cellular metabolism and the body's use of oxygen to generate energy. Levels of reactive oxygen species, also known as ROS, and free radicals can be elevated under a wide variety of conditions, including radiation, UV light, smoking, excessive alcohol consumption, as well as medical conditions involving inflammation, cardiovascular disease, neurodegenerative disease, diabetes and advancing age. Elevated ROS levels inflict structural damage on nucleic acid, lipid, carbohydrate and protein components of cells, thereby directly contributing to or exacerbating tissue dysfunction, disease and age-related debilitation.
Cellular antioxidant enzymes normally serve to inactivate ROS and maintain levels of ROS at those compatible with normal cell function. Important among these cellular antioxidant enzymes are superoxide dismutase and catalase. However, the levels of these protective antioxidant enzymes decrease with age and in a number of disease conditions. As we age and the levels of antioxidant enzymes decrease, oxidative stress levels increase significantly and our body is unable to maintain homeostasis relative to elevated ROS levels.
Oxidative stress is widely believed to be a key factor in many of the undesirable effects of aging because it promotes cell death. Additionally, high levels of oxidative stress have also been linked as a causative or associated factor in over 100 diseases.
Nrf2 Activation
Nuclear factor (erythroid-derived 2)-like 2, also known as NFE2L2 or Nrf2, is a transcription factor that in humans is encoded by the NFE2L2 gene. Nrf2 is the master regulator of the antioxidant response, which is important for the amelioration of oxidative stress. Because Nrf2 is able to induce gene activity important in combating oxidative stress, thereby activating the body’s own protective response, it helps protect from a variety of complications related to oxidative stress.
Under normal or unstressed conditions, Nrf2 resides in the cytoplasm of the cell, outside the nucleus, and is targeted for degradation. When activated, Nrf2 is able to move into the nucleus where it promotes the expression of several thousand genes, including those that encode antioxidant enzymes as well as anti-inflammatory and stress response proteins.
In recent years, Nrf2 has become the subject of intense research. A common theme in much of this research is that activation of Nrf2 upregulates a coordinated antioxidant response and is therefore capable of protecting against oxidative stress-related injury and inflammatory disease in a wide variety of animal models. Therefore, Nrf2 represents an important therapeutic target.
NRF1 Activation
7
Nuclear Respiratory Factor 1 or NRF1 is a transcription factor that contributes to the expression of many genes required for the maintenance and function of the mitochondria. Mitochondria are subcellular self-autonomous organelles and are primarily responsible for the generation of the chemical energy (ATP) that cells require to stay alive. Mitochondria constantly expand and divide based on the demand of the tissue cells in which they reside. They also play an important role in triggering the signaling cascade that results in the death of cells (apoptosis). Proper regulation of these mitochondrial functions is vitally important for the life and death of cells and for human health.
Dysfunction of mitochondria has been associated with many chronic diseases in a wide variety of animal models. Therefore, the upregulation of NRF1 represents an important therapeutic target to support the proper function of mitochondria and human health.
Research and Development
Historically, we have focused our research and development efforts on creating and supporting scientifically-validated, yet highly demonstrative products under the Protandim®, TrueScience®, Petandim™ for Dogs, Axio®, and PhysIQ™ federation of brands. We anticipate that our future research and development efforts will be focused on creating, developing and evaluating new products that are consistent with our commitment to provide quality, scientifically-validated products. We intend to build on our foundation of combating oxidative stress and targeting specific benefit areas that help individuals feel, look and perform better. We also plan to continue sponsoring additional studies on our current products in an effort to further validate the benefits they provide.
Product Overview
Protandim® Nrf2 Synergizer
Protandim® Nrf2 Synergizer is a patented dietary supplement that has been shown in a clinical trial to reduce the age-dependent increase in markers of oxidative stress, and has also been shown to provide substantial benefits to combat the variety of negative health effects linked to oxidative stress.
Protandim® Nrf2 Synergizer combats oxidative stress by increasing the body’s natural antioxidant protection at the genetic level. The unique blend of phytonutrients in Protandim® Nrf2 Synergizer signals the activation of Nrf2 to increase production of antioxidant enzymes, specifically superoxide dismutase and catalase, and other cell-protective gene products. The body's internally produced antioxidant enzymes provide a better defense against oxidative stress than externally derived sources of antioxidants such as Vitamin C, Vitamin E and Coenzyme Q-10. Unlike externally derived sources of antioxidants, these enzymes are “catalytic,” which means these enzymes are not used up upon neutralizing free radicals.
We hold multiple U.S. and international patents relating to Protandim® Nrf2 Synergizer. We believe these patents set Protandim® apart from other dietary supplements and protect the original formula as well as certain formula modifications we could create to extend our Protandim® product line. We sell Protandim® Nrf2 Synergizer in three formulas.
Protandim® Nrf2 Synergizer has been, and is currently, the subject of numerous independent scientific studies at various universities and research facilities including Ohio State University, Louisiana State University, University of Colorado Denver, Virginia Commonwealth University, Colorado State University, Texas Tech University and the National Institute on Aging. The results of these studies have been published in a variety of peer-reviewed scientific journals, including Free Radical Biology & Medicine, Enzyme Research, Circulation-the scientific journal of the American Heart Association, American Journal of Physiology-Lung Cellular and Molecular Physiology, PLoS One, Journal of Dietary Supplements, Molecular Aspects of Medicine, Oxidative Medicine and Cell Longevity, Exercise & Sports Science Reviews, Clinical Pharmacology, and The FASEB Journal.
Protandim® NRF1 Synergizer
Protandim® NRF1 Synergizer is a dietary supplement which was formulated to strengthen the mitochondria, the powerhouse of all cells, for better cellular health. It is designed to work in tandem with our flagship Protandim® Nrf2 Synergizer and further enhance the body's internal ability to naturally produce antioxidants and reduce the effects of cellular stress. Protandim® NRF1 Synergizer activates NRF1, a protein that regulates the expression of genes involved in mitochondrial DNA transcription, translation and repair. The unique blend of ingredients in Protandim® NRF1 Synergizer supports the mitochondria to slow cellular aging and increase cellular energy.
LifeVantage TrueScience®
We sell a full line of anti-aging skin care products under our LifeVantage TrueScience® brand, which consists of:
• | TrueScience® Facial Cleanser: a concentrated, ultra-rich cleanser used to remove impurities and light make-up without drying or stripping natural oils in the skin. |
8
• | TrueScience® Perfecting Lotion: a hybrid lotion formulated for smoother, radiant and brighter looking skin. |
• | TrueScience® Eye Serum: a serum that noticeably improves the visible signs of fine lines, creases and wrinkles around the entire eye area, diminishes puffiness above and below the eye, firms and tightens the upper eyelid area and evens skin tone and dark circles that are visible signs of aging. |
• | TrueScience® Anti-Aging Cream: a cream that deeply moisturizes and helps to combat the appearance of fine lines and wrinkles. |
• | TrueScience® Micro-Lift Serum: a serum that tightens and smooths skin around eyes to combat the appearance of fine lines and wrinkles. |
• | TrueScience® Hand Cream: a cream formulated with Nrf2 ingredients to moisturize skin and improve the visible signs of premature aging on the hands. This product was introduced as a limited-release in July 2017. |
Our TrueScience® Beauty System includes the following products in a TSA-compliant set: TrueScience® Facial Cleanser, TrueScience® Perfecting Lotion, TrueScience® Eye Serum, and TrueScience® Anti-Aging Cream.
We received a composition patent for our LifeVantage TrueScience® skin care products, which were tested in an independent third-party clinical study and shown to reduce the visible signs of aging by utilizing Nrf2 technology to mitigate the visible effects of skin damage caused by oxidative stress. Our LifeVantage TrueScience® skin care products leverage our research on Nrf2 activation and oxidative stress.
Petandim™ for Dogs
Petandim™ for Dogs is a supplement specially formulated to combat oxidative stress in dogs through Nrf2 activation. Petandim™ for Dogs builds upon the active ingredients in Protandim® Nrf2 Synergizer to reduce oxidative stress and support joint function, mobility and flexibility in dogs. Petandim™ for Dogs received the Quality Seal from the National Animal Supplement Council.
Axio®
Axio® is our line of Smart Energy Drink mixes, formulated to promote alertness and support mental performance. These energy drink powders deliver sustained energy, as well as improved mental focus and promote a positive mood. Axio® is derived from a unique combination of scientifically-validated ingredients.
PhysIQ™ Smart Weight Management System
We sell a full line of weight management products under our PhysIQ™ brand, which consists of:
• | PhysIQ™ Fat Burn: a supplement containing natural active ingredients to stimulate the breakdown of abdominal fat, increase energy and support long-term weight management. |
• | PhysIQ™ Probio: a supplement designed to support long-term gut health by restoring healthy gut bacteria to support digestive system health. |
• | PhysIQ™ Cleanse: a supplement designed to stimulate healthy digestion and regularity and supports the cleansing of your digestive system. |
• | PhysIQ™ Protein Shake: a combination of fast and slow release proteins designed to satisfy hunger and deliver amino acids to support quick recovery and improved muscle synthesis. |
Distribution of Products
We believe our products are well suited for person-to-person sales through our direct selling model. This model allows our independent distributors to educate our customers regarding the benefits of our unique products more thoroughly than other business models. Our direct selling model also allows our independent distributors to offer personalized customer service to our customers and encourage regular use of our products.
Product Return Policy
All products purchased directly from us include a customer satisfaction guarantee. Subject to some exceptions based on local regulations, customers may return unopened product to us within 30 days of purchase for a refund of the purchase price less shipping and handling. In addition, our inventory repurchase program allows independent distributors who terminate their distributorship to return certain amounts of unopened, unexpired product purchased within the prior 12 months for a refund of
9
the purchase price less a 10% restocking fee. The amount of inventory we will repurchase from an independent distributor is subject to specified consumption limitations.
Customers
We generally categorize our customers as independent distributors and preferred customers.
Independent Distributors
An independent distributor in our company is someone who participates in our direct sales business opportunity by purchasing our products at wholesale prices and selling our products to others. We believe our independent distributors are typically entrepreneurs who believe in our products and desire to earn income by building a business of their own. Many of our independent distributors are attracted by the opportunity to sell unique, scientifically-validated products without incurring significant start-up costs. Independent distributors sign a contract with us that includes a requirement that they adhere to strict policies and procedures. Independent distributors purchase product from us for individual consumption, but also purchase small quantities of product from us to use for demonstrations and one-off, person-to-person retailing opportunities. They also encourage others to purchase our products, either for personal consumption or resale.
While we provide support, product samples, brochures, magazines, and other sales and marketing materials, independent distributors are primarily responsible for attracting, enrolling and educating new independent distributors with respect to our products and compensation plan. An independent distributor creates multiple levels of compensation by selling our products and enrolling new independent distributors who sell our products. These newly enrolled independent distributors form a “downline” for the independent distributor who enrolled them. If downline independent distributors enroll new independent distributors who purchase our products, they create additional levels of compensation and their downline independent distributors remain in the same downline network as the original enrolling independent distributor. We pay commissions only upon the sale of our products. We do not pay commissions for enrolling independent distributors.
We define “active independent distributors” as those independent distributors who have purchased product from us for retail or personal consumption during the prior three months. As of June 30, 2017 and 2016, we had approximately 64,000 and 69,000 active independent distributors, respectively.
Independent Distributor Compensation
We believe our compensation plan is one of the more financially rewarding in the direct selling industry. Our percentage of sales paid to independent distributors as compensation and incentives is one of the highest percentages reported in the direct selling industry. Some elements of our compensation plan are paid weekly. We believe this gives us a competitive advantage and helps retain new distributors by allowing them to experience success quickly from their efforts. Our compensation plan is intended to appeal to a broad cross-section of people, particularly those seeking to supplement family income, start a home-based business or pursue entrepreneurial opportunities full- or part-time. Our independent distributors earn compensation on their product sales and product sales made by independent distributors within their sales organization, or "downline." Our independent distributors can also earn money by purchasing product from us at our wholesale cost and selling that product to others at the retail cost. We generally pay commissions in the local currency of the independent distributor’s home country.
Independent Distributor Motivation and Training
Our revenue depends in part on the success and productivity of our independent distributors. We provide tools, training and technology designed to increase our independent distributors' productivity and increase their potential for success. We offer training and business development opportunities to our independent distributors, including the following:
• | Blueprint: professionally-designed training materials independent distributors can utilize in their sales efforts; |
• | Pro Audio Series: our weekly audio series presented by our independent distributor leaders providing training and tips on becoming more productive independent distributors; |
• | Elite Academy and Global Convention: regularly occurring company-sponsored events intended to provide training and motivation to our independent distributors; |
• | Promotions and Incentive Trips: we hold special promotions and incentive trips from time to time in order to motivate our independent distributors to accomplish specific sales goals; and |
• | Mobile Applications: we offer the following mobile applications as part of our Full Tech Stack for our independent distributors to use to enhance their businesses: |
10
◦ | LV Pro App: designed to enable independent distributors to access to their business in real-time, directly from their smart phone; |
◦ | LV Share App: uses social media as an effective tool to connect and expand social reach on sites like Facebook, Twitter, Pinterest and Instagram; |
◦ | Tax Bot: application equipped with tax management tools for distributors, including business expense tracking; |
◦ | LV Move App: platform designed to engage new distributors upon enrollment and mentor existing distributors to help them launch their respective businesses. |
We are continuing to evaluate new ways in which to incorporate new technology and training opportunities to improve distributor success.
Distributor Compliance Activities
Given that our independent distributors are independent contractors, we do not control or direct their promotional efforts. We do, however, require that our independent distributors abide by policies and procedures that require them to act in an ethical manner and in compliance with applicable laws and regulations. As a member of the United States Direct Selling Association and similar organizations in many of the markets where we do business, we are also subject to the ethical business practices and consumer service standards required by the industry's code of ethics.
Independent distributors must represent to us that their receipt of commissions is based on retail sales and substantial personal sales efforts. We must produce or pre-approve all sales aids used by distributors such as brochures and online materials. Products may be promoted only by personal contact or by collateral materials produced or approved by us. Independent distributors may not use our trademarks or other intellectual property without our consent.
We monitor and systematically review alleged independent distributor misbehavior through our internal compliance department. If we determine one of our independent distributors has violated any of our policies and procedures, we may discipline the independent distributor and may terminate the independent distributor’s rights to distribute our products. When necessary, we have brought legal action against independent distributors, or former independent distributors, to enforce our policies and procedures. Short of termination or legal action, we may impose sanctions against independent distributors whose actions are in violation of our policies and procedures. Such sanctions may include warnings, probation, withdrawal or denial of an award, suspension of privileges of a distributorship, fines and/or withholding of commissions until specified conditions are satisfied, or other appropriate injunctive relief.
Preferred Customers
Preferred customers are customers who purchase products directly from us at our wholesale price on a monthly subscription basis for personal consumption, without the intent to resell or earn commissions from the sale of products. A preferred customer may enroll as an independent distributor at any time if he or she becomes interested in reselling the product. We believe our preferred customers are a great source of word-of-mouth advertising for our products. We also believe our large base of preferred customers validates the benefits of our products, separate from the direct selling business opportunity.
We define an “active preferred customer” as a preferred customer who has purchased product from us within the prior three months. As of June 30, 2017 and 2016, we had approximately 112,000 and 117,000 active preferred customers, respectively.
Sales of Our Products
We accept orders for our products through our own website at www.lifevantage.com and through personalized websites we provide to our independent distributors, which we refer to as “Virtual Offices”. Orders placed through Virtual Offices and through our website are processed daily at our fulfillment centers, where orders are shipped directly to the consumer.
We offer toll-free numbers for our independent distributors and other customers to order product or ask questions. Our customer service representatives assist customers in placing orders through our web order processing system, answering questions, tracking packages, and initiating refunds. The customer service representatives receive extensive training about our products and our direct selling business model. Independent distributors and preferred customers generally pay for products by credit card, prior to shipment, and as a result, we carry minimal accounts receivable.
Seasonality
11
In addition to general economic factors, we are impacted by seasonal factors and trends such as major cultural events and vacation patterns. We believe that direct selling in Japan and the United States is also generally negatively impacted during our first fiscal quarter, from July 1 through September 30, when many individuals, including our independent distributors, traditionally take vacations.
Although our product launch process may vary by market, we may introduce new products to our independent distributors and customers through limited-time offers and promotions. The limited-time offers and promotions typically generate significant activity and a high level of purchasing, which may result in a higher than normal increase in revenue during the quarter of the limited-time offer and skew year-over-year and sequential comparisons.
Geographic Information
We currently sell and distribute products in the United States, Japan, Hong Kong, Australia, Canada, Mexico, Thailand, the United Kingdom and the Netherlands. In fiscal year 2017, revenue generated in the United States accounted for approximately 73% of our total revenue and revenue generated from Japan accounted for approximately 20% of our total revenue. For reporting purposes, we generally divide our markets into two geographic regions: the Americas region and the Asia/Pacific & Europe region. The following table sets forth net revenue information by region for the periods indicated (in thousands):
For the years ended June 30, | ||||||||||||||||||||
2017 | 2016 | 2015 | ||||||||||||||||||
Americas | $ | 150,841 | 75.6 | % | $ | 158,291 | 76.6 | % | $ | 138,118 | 72.6 | % | ||||||||
Asia/Pacific & Europe | 48,648 | 24.4 | % | 48,249 | 23.4 | % | 52,218 | 27.4 | % | |||||||||||
Total | $ | 199,489 | 100.0 | % | $ | 206,540 | 100.0 | % | $ | 190,336 | 100.0 | % | ||||||||
Additional comparative revenue and related financial information is presented in the section captioned "Segment Information" in Note 2 to our consolidated financial statements.
Marketing
We have a sales, marketing, public relations and customer service group consisting of 106 full-time employees as of June 30, 2017. We utilize our network of independent distributors located throughout the United States, Australia, Hong Kong, Japan, Canada, Mexico, Thailand, the United Kingdom and the Netherlands to market and sell our products.
Raw Materials and Manufacturing
We outsource the primary manufacturing, fulfillment, and shipping components of our business to companies we believe possess a high degree of expertise. We believe outsourcing provides us access to advanced manufacturing process capabilities and expertise without incurring fixed costs associated with manufacturing our own products.
We currently outsource the manufacture of our products to multiple contract manufacturers. Our contract manufacturers of Protandim® have a legal obligation to comply with the current Good Manufacturing Practices regulations that are applicable to those who manufacture, package, label and hold dietary supplements. Additionally, we are subject to regulations that, among other things, obligate us to know what and how manufacturing activities are performed so that we can make decisions related to whether the packaged and labeled product conforms to our established specifications and whether to approve and release product for distribution. We maintain and qualify alternative manufacturing options in order to keep our costs low, maintain the quality of our products, and be prepared for unanticipated spikes in demand or manufacturing failure. Our contract manufacturers deliver products to our fulfillment centers based on our purchase orders.
We acquire raw materials for our products from third-party suppliers. Although we generally have good relationships with our suppliers, we believe we could replace any of our current suppliers without great difficulty or significant increase to our cost of goods sold. We also have ongoing relationships with secondary and tertiary suppliers. Please refer to "Risk Factors - High quality material for our products may be difficult to obtain or expensive" for a discussion of the risks and uncertainties associated with our sourcing of raw materials.
Product Liability and Other Insurance
We have product liability insurance coverage for our products that we believe is adequate for our needs. We also maintain commercial property and liability coverage and directors’ and officers’ liability insurance.
12
Intellectual Property
We use commercially reasonable efforts to protect our intellectual property and license rights through patent protection, trade secrets and contractual protections, and intend to continue to develop a strong brand identity for our company and our products.
Protandim® Nrf2 Synergizer is a proprietary, patented dietary supplement formulation for enhancing antioxidant enzymes including superoxide dismutase and catalase. The patents and patent applications protecting this formulation are held by our wholly-owned subsidiary, Lifeline Nutraceuticals Corporation. Our intellectual property is covered, in part, by seven issued U.S. and five issued foreign patents. Our patents and patent applications claim the benefit of priority of multiple U.S. provisional patent applications, the earliest of which was filed on March 23, 2004, and relate to compositions, methods of use, and methods of manufacture of various compositions, including those embodied by the Protandim® Nrf2 Synergizer formulation. The expected duration of our patent protection via granted patents for Protandim® Nrf2 Synergizer is through approximately March 2025. In fiscal 2016, we received a composition patent for our LifeVantage TrueScience® skin care products. This patent expires in approximately April 2034.
We continue to protect our products and brands using trademarks. We have filed and successfully procured registered trademarks for Protandim®, LifeVantage®, TrueScience® and Axio® in many countries around the world, and we have pending trademark applications in many other countries. We anticipate seeking protection in other countries as we deem appropriate.
In order to protect the confidentiality of our intellectual property, including trade secrets, know-how and other proprietary technical and business information, it is our policy to limit access to such information to those who require access in order to perform their functions and to enter into agreements with employees, consultants and vendors to contractually protect such information.
Competition
Direct Selling Companies
We compete with other direct selling companies, many of which have longer operating histories and greater visibility, name recognition and financial resources than we do. We also compete with newer direct selling companies that attempt to solicit our independent distributors by offering the possibility of a more financially rewarding opportunity by being among the Company's early distributor base. We compete for new independent distributors with these companies on the basis of our business opportunity, product offerings, compensation plan, management and our operations. In order to successfully compete in the direct selling industry and attract and retain independent distributors, we must maintain the attractiveness of our business opportunity, product offerings and compensation plan.
Dietary Supplement Market
We compete with other companies that sell dietary supplements. We believe the dietary supplement market is a highly fragmented and competitive market. We believe competition in the dietary supplement market is based primarily on quality, price, efficacy of products, brand name and recognition of product benefits. In the dietary supplement industry, our competition includes numerous nutritional supplement companies, pharmaceutical companies and packaged food and beverage companies. Many of these companies have broader product lines, larger sales volumes and greater financial resources than we do. Additionally, some of these companies are able to compete more effectively due to greater vertical integration. Increased competition in the dietary supplement market could have a material adverse effect on our results of operations and financial condition.
Nrf2 Activators
In the last few years we have seen the number of products marketed as Nrf2 activators increase, and we are currently aware of at least five such products. We anticipate the number of products that claim to activate Nrf2 will continue to increase as the technology becomes more popular and more broadly accepted. Although we are unaware of any competing direct selling company marketing products as Nrf2 activators, we are aware that at least two competing direct selling companies have sponsored research studies related to Nrf2 activation.
Direct Antioxidants
Vitamin C, Vitamin E, Coenzyme Q-10, and other sources of externally derived antioxidants may be considered competitors of Protandim® but they are mechanistically distinct from Protandim®. These other sources of antioxidants do not increase the body’s elimination of oxidants using internal antioxidant enzymes. Our research indicates that Protandim® increases production of hundreds of stress-related anti-inflammatory, and anti-fibrotic gene products including antioxidant
13
enzymes, such as superoxide dismutase and catalase, within the cells of the body. We believe that the body’s internally produced antioxidant enzymes provide a better defense against oxidative stress than externally derived sources of antioxidants.
Oral Superoxide Dismutase and Catalase
There are many companies performing research into antioxidants. Several companies sell oral forms of superoxide dismutase and catalase. Although we believe Protandim® is a superior alternative to oral forms of superoxide dismutase and catalase, these products do compete with Protandim® in the marketplace. We anticipate additional companies will likely develop, purchase or in-license products that are competitive with Protandim®.
Personal Skin Care Market
In the personal skin care market, we compete principally with large, well-known cosmetics companies that manufacture and sell broad product lines through retail establishments. Many of these competitors have greater financial resources and brand recognition than we do. We believe, however, we can compete with these larger companies by leveraging our direct selling model and emphasizing our unique, science-based skin care products.
Animal Supplement Market
We compete principally with large, well-known companies in the animal supplement market. Most of the companies we compete with in the animal supplement market have broad distribution channels that include retail establishments. Many of these competitors have greater financial resources and brand recognition than we do. We believe, however, we can compete with these larger companies by leveraging our direct selling model and emphasizing our unique, science-based animal supplement product.
Energy Drink Market
We compete with large, well-known companies in the energy drink market. Most of the companies we compete with in the energy drink market have broad distribution channels that include big box retail establishments. Many of these competitors have greater financial resources and brand recognition than we do. We intend to compete with these larger companies by leveraging our direct selling model and emphasizing our unique, science-based energy drink product. Axio® is a no sugar, low-carbohydrate and low calorie energy drink that is also non-GMO, gluten-free and vegan.
Weight Management Market
We compete with large, well-known companies in the weight management market. Most of the companies we compete with in the weight management market have broad distribution channels that include big box retail establishments. Many of these competitors have greater financial resources and brand recognition than we do. We intend to compete with these larger companies by leveraging our direct selling model and emphasizing our unique, science-based weight management products.
Regulatory Environment
The formulation, manufacturing, packaging, labeling, and advertising of our products in the United States are subject to regulation by the Food and Drug Administration, or FDA, and the Federal Trade Commission, or FTC, as well as comparable state laws.
FDA Regulations and DSHEA
We market our Protandim® products as “dietary supplements” as defined in the Dietary Supplement Health and Education Act of 1994, or DSHEA. DSHEA is intended to promote access to safe, quality dietary supplements, and information about dietary supplements. DSHEA established a new framework governing the composition and labeling of dietary supplements. DSHEA does not apply to animal supplements like Petandim™ for Dogs. We are not required to obtain FDA pre-market approval to sell our products in the United States under current laws.
DSHEA permits statements of nutritional support, called “structure-function” statements, to be included in labeling for dietary supplements without FDA marketing approval. Such statements may claim a benefit related to a classical nutrient deficiency disease and disclose the prevalence of such disease in the United States, describe the role of a nutrient or dietary ingredient intended to affect the structure or function in humans, characterize the documented mechanism by which a nutrient or dietary ingredient acts to maintain such structure or function, or describe general well-being from consumption of a nutrient or dietary ingredient. Such statements may not expressly or impliedly claim that a dietary supplement is intended to diagnose, cure, mitigate, treat, or prevent a disease. A company that uses a statement of nutritional support in labeling must possess evidence substantiating that the statement is truthful and not misleading and is supported by competent and reliable scientific evidence.
14
The FDA may assert that a particular statement of nutritional support that a company is using is an illegal claim; that assertion, normally, is in the form of a warning letter to that company. We have a duty to send to the FDA a notice that lists each new structure-function statement made by us; we are obligated to send that notice within 30 days after the first marketing of a supplement with such a statement.
DSHEA also permits certain scientific literature, for example a reprint of a peer-reviewed scientific publication, to be used in connection with the sale of a dietary supplement to consumers without the literature being subject to regulation as labeling. However, such literature must not be false or misleading, the literature may not promote a particular manufacturer or brand of dietary supplement and it must include a balanced view of the available scientific information on the subject matter, among other requirements.
The FDA's Center for Veterinary Medicine, or CVM, is responsible for enforcing the portion of the Federal Food, Drug, and Cosmetic Act, or the Act, that relates to animal supplements, like our Petandim™ for Dogs product. CVM's primary responsibility in enforcing the Act is to ensure that animal supplements are safe, effective, and can be manufactured to a consistent standard. CVM has taken the position that DSHEA does not apply to products intended for animals, but it is clear that products like Petandim™ for Dogs are under FDA jurisdiction.
Our Petandim™ for Dogs product follows the labeling rules of the National Animal Supplement Council (NASC) of which LifeVantage is a member. Under the NASC rules, Petandim™ for Dogs is classified as a dosage form animal health product.
While we exercise care in our formulation, manufacturing, packaging, labeling, and advertising of our products, we cannot guarantee the FDA will never inform us that the FDA believes some violation of law has occurred either by us or by our independent distributors. Any allegations of our non-compliance may result in time-consuming and expensive defense of our activities. The FDA’s normal course of action is to issue a warning letter if it believes that a product is misbranded or adulterated. The responsive action requested by the FDA differs depending upon the nature of the product and claims in question. Typically, the FDA expects a written response within 15 working days of the receipt of a warning letter. The warning letter is public information posted on the FDA’s web site. That information could affect our relationships with our investors, independent distributors, vendors, and consumers. Warning letters also often spark private class action litigation under state consumer protection statutes. The FDA could also order compliance activities, such as an inspection of our facilities and products, and could file a civil lawsuit in which an arrest warrant (seizure) could be issued as to some or all of our products. In extraordinary cases, we could be named a defendant and sued for declaratory and injunctive relief.
FTC Regulations
Advertising and marketing of our products in the United States are also subject to regulation by the FTC under the Federal Trade Commission Act, or FTC Act. Among other things, the FTC Act prohibits unfair methods of competition and unfair false or deceptive acts or practices in or affecting commerce. The FTC Act also makes it illegal to disseminate or cause to be disseminated any false advertisement. The FTC Act provides that disseminating any false advertisement pertaining to foods, which would include dietary supplements, is an unfair or deceptive act or practice. An advertiser is required to have competent and reliable scientific evidence for all express and implied health-related product claims at the time the claims are first made. We are required to have adequate scientific substantiation for all material advertising claims made for our products in the United States. The FTC routinely reviews websites to identify questionable advertising claims and practices. Competitors sometimes inform the FTC when they believe other competitors are violating the FTC Act and consumers also notify the FTC of what they believe may be wrongful advertising. The FTC may initiate a non-public investigation that focuses on our advertising claims which usually involves non-public pre-lawsuit extensive formal discovery. Such an investigation may be very expensive to defend, be lengthy, and result in a publicly disclosed Consent Decree, which is a settlement agreement. If no settlement can be reached, the FTC may start an administrative proceeding or a federal court lawsuit against us or our principal officers. The FTC often seeks to recover from the defendants, whether in a Consent Decree or a proceeding, any or all of the following: (i) consumer redress in the form of monetary relief or disgorgement of profits; (ii) significant reporting requirements for several years; and (iii) injunctive relief. In addition, most, if not all, states have statutes prohibiting deceptive and unfair acts and practices. The requirements under these state statutes are similar to those of the FTC Act.
The National Advertising Division, or NAD, of the national Better Business Bureau, a non-governmental not-for-profit organization through its Advertising Self-Regulatory Council, or ASRC, is also actively engaged in conducting investigations, called inquiries, which are focused on determining whether the requisite claim substantiation standard exists for specific structure-function claims. Although the results of each inquiry or proceeding are not binding on the recipient, they are posted on NAD’s website, and the NAD often refers cases to the FTC if the advertisers do not agree to modify their advertising in conformance with the NAD decision. We have been the subject of a NAD proceeding in 2008 and 2009, which was concluded in 2009.
15
Regulation of Direct Selling Activities
Direct selling activities are regulated by the FTC, as well as various federal, state and local governmental agencies in the United States and foreign countries. These laws and regulations are generally intended to prevent fraudulent or deceptive schemes, often referred to as “pyramid” schemes, which compensate participants primarily for recruiting additional participants without significant emphasis on product sales. The laws and regulations often:
• | require us or our distributors to register with governmental agencies; |
• | impose caps on the amount of commission we can pay; |
• | impose reporting requirements; and |
• | require that we ensure, among other things, that our distributors maintain levels of product sales to qualify to receive commissions and that our distributors are being compensated primarily for sales of products and not primarily for recruiting additional participants. |
The laws and regulations governing direct selling are modified from time to time, and, like other direct selling companies, we may be subject from time to time to government investigations related to our direct selling activities. This may require us to make changes to our business model and our compensation plan.
State Regulations
In addition to United States federal regulation, each state has enacted its own food and drug laws. We may receive requests to supply information regarding our sales or advertising to state regulatory agencies. We remain subject to the risk that, in one or more of our present or future markets, our products, sales, and advertising could be found non-compliant with state laws and regulations. If we fail to comply with these laws and regulations, it could have a material adverse effect on our business in a particular market or in general. In addition, these laws and regulations could affect our ability to enter new markets.
The FDA Food Safety Modernization Act
The FDA Food Safety Modernization Act, or FSMA, was enacted in 2011 and is now part of the Federal Food, Drug and Cosmetic Act, or FFDCA. The FSMA is a comprehensive set of laws that gives the FDA considerable authority with respect to the prevention of food contamination and the serious problems associated with such contamination. Among other things, it does the following:
• | gives the FDA explicit authority to inspect and copy certain records related to any food and to compel a recall if the FDA believes there is a reasonable probability of serious adverse health consequences or death; |
• | places strict obligations on food and dietary supplement importers to verify that food from foreign suppliers is not adulterated or misbranded; and |
• | provides whistle blower protection for employees of conventional food or dietary supplement companies who provide information to governmental authorities about violations of the FFDCA. |
International Regulations
In addition to the regulations applicable to our activities in the United States, all other markets in which we operate our business regulate our products under a variety of statutory and regulatory schemes. We typically market our Protandim® line of products in international markets as foods, health foods or dietary supplements under applicable regulatory regimes. However, because of varied regulations, some products or ingredients that are recognized as a “food” in certain markets may be treated as a “pharmaceutical” or equivalent in other markets. In the event a product, or an ingredient in a product, is classified as a drug or pharmaceutical product in any market, we will generally not be able to distribute that product through our distribution channel because of pre-marketing approval requirements and strict regulations applicable to drug and pharmaceutical products. In Japan, for example, ashwagandha was determined to be inappropriate for inclusion in food products. Ashwagandha is one of the ingredients in Protandim® Nrf2 Synergizer. While we disagree with the assessment of ashwagandha by Japanese regulatory authorities, we are restricted from selling a formulation of Protandim® Nrf2 Synergizer that contains ashwagandha in Japan. As such, we reformulated Protandim® Nrf2 Synergizer for the Japan market to exclude ashwagandha. This reformulated Protandim® Nrf2 Synergizer was introduced in Japan in fiscal 2013.
Similarly, our other markets outside the United States regulate advertising and product claims regarding the efficacy of our products and require adequate substantiation of claims. As such, we are unable to claim that any of our products will diagnose, cure, mitigate, treat or prevent diseases. For example, in Japan, Protandim® Nrf2 Synergizer is considered a food product, which significantly limits our ability to make claims regarding the product. If marketing materials make claims that exceed the
16
scope of allowed claims for dietary supplements, regulatory authorities could deem our products to be unapproved drugs and we could experience substantial harm.
Our business model is also subject to regulatory frameworks that may limit or significantly alter the way business is done in foreign markets vis-à-vis the United States. For example, our marketing of products or business opportunity as a distributor in the United Kingdom differs significantly from marketing to United States customers and distributors. Consequently, we may experience additional costs and delays in entering or continuing to do business in foreign markets in order to comply with local regulations.
Potential FDA and Other Regulation
We could become subject to additional laws or regulations administered by the FDA, FTC, or other federal, state, local or international regulatory authorities, to the repeal of laws or regulations that we consider favorable, such as DSHEA, or to more stringent interpretations of current laws or regulations. Because of negative publicity associated with some adulterated or misbranded supplements, including pharmaceutical drugs marketed as dietary supplements, there has been an increased movement in the United States and other markets to expand the regulation of dietary supplements, which could impose additional restrictions or requirements in the future. In general, the regulatory environment is becoming more complex with increasingly strict regulations.
The Dietary Supplement and Nonprescription Drug Consumer Protection Act requires us to report to the FDA all serious adverse events and to maintain for six years records of all adverse events, whether or not serious. An adverse event is defined as any health-related event associated with the use of a dietary supplement that is adverse. In addition, this law requires the label of each dietary supplement, including our Protandim® products, to include a domestic address or telephone number by which the company selling the product may receive a report of a serious adverse event associated with such product. The labels of our Protandim® products comply with that statutory provision.
Employees
As of June 30, 2017 and 2016, we had 211 and 208 full time employees, respectively. As of June 30, 2017, 161 of our full time employees were based in the United States, 35 were based in Japan, nine were based in Thailand, four were based in Hong Kong and two were based in the Netherlands. We do not include our independent distributors in our number of employees because our independent distributors are independent contractors and not employees. We outsource our manufacturing and distribution operations.
Available Information
Our principal offices are located at 9785 S. Monroe Street, Suite 300, Sandy, UT 84070. Our telephone number is (801) 432-9000 and our fax number is (801) 880-0699. Our website address is www.lifevantage.com; however, information found on our website is not incorporated by reference into this report. Our website address is included in this annual report as an inactive textual reference only.
The reports filed with the Securities and Exchange Commission, or SEC, by us and by our officers, directors, and significant shareholders are available for review on the SEC’s website at www.sec.gov. You may also read and copy materials that we file with the SEC at the SEC’s Public Reference Room at 100 F Street, NE, Washington, DC 20549. You may obtain information on the operation of the Public Reference Room by calling the SEC at 1-800-SEC-0330.
ITEM 1A — RISK FACTORS
Because of the following risks, as well as other risks affecting our financial condition and operating results, past financial performance should not be considered to be a reliable indicator of future performance, and investors should not use historical trends to anticipate results or trends in future periods. The risks described below are those we currently believe could materially affect us. The following risks are not necessarily all of the important factors that could cause our actual results of operations to differ materially from those expressed in the forward-looking statements in this report.
Risks Relating to Our Company
An inability to properly motivate and manage our independent distributors could harm our business.
Motivating our independent distributors and providing them with appropriate resources, including technology, tools and training, are important to the growth and success of our business. From time to time, we face challenges in motivating and managing our independent distributors. For example, as previously disclosed, some of our independent distributors have carried or shipped our products into countries outside the U.S. in which such products are not registered or that otherwise impose stringent restrictions on our direct selling model and, in response, we took steps to stop or restrict these sales from occurring. Actions we take from time to time to enforce our policies and procedures, may cause discord among some of our independent
17
distributors. The loss of key distributors due to various factors including, but not limited to, voluntary termination or involuntary termination or suspension resulting from non-compliance with our policies and procedures, could distract our distributors and disrupt our business. For example, approximately 20% and 18% of our revenue for fiscal year 2017 and fiscal year 2016, respectively, was generated in Japan. During the past few years, we have experienced discord among our leading independent distributors in Japan and some of these distributors have left our company to join a competing direct selling company. If we fail to properly manage any discord among our leading independent distributors in Japan and other markets, we could lose additional leaders, including to competing direct selling companies, which could have a significant negative impact on our revenue. Further, from time to time, we are involved in legal proceedings with former distributors. Such legal proceedings can be a distraction to our active independent distributors and can be expensive, time-consuming and cause a disruption to our business. Our inability to properly manage these and other distractions may have a negative impact on our business.
We may not be successful in expanding our operations.
We may not be successful in expanding our operations. Although we began to sell our products through our direct selling network in fiscal year 2009, we still have limited experience in selling our products through direct selling compared to other companies in our industry. As such, we may have limited insight into trends, disruptions and other factors that may emerge and affect our business. For example, from time to time, we are obliged to terminate one or more of our independent distributors for actions contrary to their contractual obligations with us. In the past, some of these terminations have caused disruption among our independent distributors, and such terminations or resulting disruption in the future may slow our growth. Additionally, we may not be successful in keeping our leading independent distributors focused and motivated or in aligning their goals with the goals of our company. We also have limited experience expanding into new geographic markets. This limited experience was a contributing factor to the conduct that led to the independent review conducted by our audit committee in 2016. Although we are seeking to continue our expansion, if we fail to effectively expand our operations into additional markets, we may be unable to generate consistent operating profit growth in future periods.
If we are able to expand our operations, we may be unable to successfully manage our future growth.
Our business has grown significantly since we initiated our direct selling model in fiscal 2009. This growth placed substantial strain on our management, operational, financial and other resources. If we are able to continue expanding our operations in the United States and in other countries where we believe our products will be successful, such expansion could place increased strain on our management, operational, financial and other resources. In addition, an inability to leverage our current resources in an efficient manner could have a material adverse effect on our business, operating margins and results of operations.
We may not succeed in growing existing markets or opening new markets.
We have international operations in Japan, Hong Kong, Canada, Australia, Mexico, Thailand, the United Kingdom and the Netherlands. In fiscal 2017, we generated approximately 27% of our revenues from our international operations, most of which was generated from Japan. We believe that our ability to achieve future growth is dependent in part on our ability to effectively expand into new international markets. In some of our international markets, we have experienced unexpected difficulties which have resulted in adverse consequences to our business and financial results, including slower than anticipated growth, the closure of one of our markets (the Philippines) and disruption to our business as we implemented changes to our systems and distributor enrollment requirements as a result of the independent review conducted by our audit committee in 2016. We must overcome significant regulatory and legal barriers before we can begin marketing in any international market. Also, before marketing commences in a new country or market, it is difficult to assess the extent to which our products and sales techniques will be accepted or successful in any given country. In addition to significant regulatory barriers, we may also encounter problems conducting operations in new markets with different cultures and legal systems from those encountered elsewhere. We may be required to reformulate one or more of our products before commencing sales of that product in a given country. Once we have entered a market, we must adhere to the regulatory and legal requirements of that market. We may not be able to obtain and retain necessary permits and approvals in new markets, or we may have insufficient capital to finance our expansion efforts in a timely manner.
Our independent distributors could fail to comply with applicable legal requirements or our distributor policies and procedures, which could result in claims against us that could harm our business.
Our independent distributors are independent contractors and, accordingly, we are not in a position to directly provide the same oversight, direction and motivation as we would if they were our employees. As a result, there can be no assurance that our independent distributors will comply with applicable laws or regulations or our distributor policies and procedures, participate in our marketing strategies or plans, or accept our introduction of new products.
Extensive federal, state, local and international laws regulate our business, products and direct selling activities. Because we have expanded into foreign countries, our policies and procedures for our independent distributors differ slightly in some
18
countries due to the different legal requirements of each country in which we do business. In addition, as we have expanded internationally, some of our distributors have carried or shipped our products into countries in which such products are not registered or that otherwise impose stringent restrictions on our direct selling model. While we have taken steps to stop or restrict these sales from occurring, including through our distributor policies and procedures, it can be difficult to enforce these policies and procedures because of the large number of distributors and their independent status. If relevant regulatory authorities determined that any such activities are not compliant with all regulatory requirements, we could be subject to related fines, penalties and other assessments. Activities by our independent distributors that violate applicable laws or regulations could result in government or third party actions against us, which could harm our business. In addition, violations by our independent distributors of our policies and procedures could reflect negatively on our products and operations and harm our business reputation. In addition, it is possible that a court could hold us civilly or criminally accountable based on vicarious liability because of the actions of our independent distributors. In the past, we have had independent distributors investigated by government agencies for conduct violating the law and our policies. This type of investigation can have an adverse effect on us even if we are not involved in the independent distributor's activities.
Inability of new products and technological innovations to gain distributor or market acceptance could harm our business.
We believe our ability to introduce new products that gain acceptance among our distributors and customers is an important part of our ability to grow our revenue in future periods. However, any new products we introduce may not gain distributor and market acceptance to the extent we anticipate or project. Factors that could affect our ability to introduce new products include, among others, government regulations, the inability to attract and retain qualified research and development staff, the termination of third-party research and collaborative arrangements, proprietary protections of competitors that may limit our ability to offer comparable products and the difficulties in anticipating changes in consumer tastes and buying preferences. In addition, new products we introduce may not be successful or generate substantial revenue. The introduction of a new product could also negatively impact other product lines to the extent our distributor leaders focus their efforts on the new product instead of an existing product. If any of our products fails to gain distributor acceptance, we could see an increase in product returns.
In addition, we believe our ability to introduce new technologies that gain acceptance among our distributors and customers is an important part of our ability to grow our revenue in future periods. However, these or other new technologies that we introduce may not gain distributor acceptance to the extent we anticipate or project.
The matters relating to the 2016 independent review by our audit committee into sales of our products in certain international markets may continue to have adverse effects on our financial results.
As we previously disclosed in Item 9A of our Annual Report on Form 10-K for the year ended June 30, 2016, the Audit Committee of our Board of Directors conducted an independent review related to the distribution of our products into countries outside the U.S. in which those products were not registered or that otherwise imposed stringent restrictions on our direct selling model, and the associated revenue and tax and other accruals associated with such sales. This independent review was initiated following internal reviews conducted by Company personnel and was further informed by the content of employee complaints. The audit committee and our management team also reviewed the impact of these sales on our financial statements and reports filed with the Securities and Exchange Commission. This review and subsequent legal matters have required us to expend significant management time and incur expenses of approximately $2.9 million in accounting and legal costs.
Based on its review, the audit committee determined that (i) we had sold our products to independent distributors who carried or shipped such products primarily into four countries outside the U.S. in which those products were not registered or that otherwise impose stringent restrictions on our direct selling model; (ii) we allowed individuals who were resident in countries that impose stringent restrictions on our direct selling model to enroll as independent distributors; and (iii) we did not have in place sufficient controls governing our international business policies, practices, monitoring and training to provide reasonable assurance that such distribution of our products complied with applicable customs, tax and other regulatory requirements. In connection with this independent review, we identified a material weakness in our internal controls over financial reporting as of the period ended June 30, 2016. We have taken steps to remediate the material weakness and to help prevent our products from being distributed or sold into countries without complying with applicable customs, tax and other regulatory requirements and to appropriately verify the residency of individuals who want to become our independent distributors. Consistent with these regulatory requirements, in the future our independent distributors may be able to purchase a limited quantity of such products for personal consumption in one or more of these countries. While our management has determined that the material weakness has been remediated, our revenue in fiscal 2017 from sales of our products that are carried or shipped into these countries was significantly lower than fiscal 2016 and we expect such revenue in future periods to continue to be lower than fiscal 2016.
In addition, a purported securities class action lawsuit has been filed against us and certain of our executive officers alleging that the Company, our Chief Executive Officer and our former Chief Financial Officer violated Sections 10(b) and/or 20(a) of the Securities Exchange Act of 1934, 15 U.S.C. §§ 78j(b), 78t(a), and Rule 10b-5, 17 C.F.R. § 240.10b-5, promulgated
19
thereunder, by making false or misleading statements or omissions in public filings with the Securities and Exchange Commission regarding our internal control over financial reporting and our financial results for the first, second and third quarters of fiscal year 2016. Additionally, purported shareholder derivative actions were filed purportedly on behalf of the Company, alleging that our Chief Executive Officer, our former Chief Financial Officer and members of our board of directors breached their fiduciary duties owed to the Company by, among other things, causing or permitting the Company to issue false and misleading statements or omissions in its public filings with the Securities and Exchange Commission, as alleged in the class action lawsuit noted above. The defendants in these lawsuits plan to vigorously defend against them. Nonetheless, an unfavorable resolution of these matters could have a material adverse effect on our business, results of operations, financial condition and the trading price for our securities. See Note 11 Commitments and Contingencies in our Consolidated Financial Statements for a more detailed description of these lawsuits.
In addition to these matters, we also may become involved in other litigation, regulatory matters and government actions incidental to our business and the matters disclosed in this Annual Report on Form 10-K, including, but not limited to, product liability claims, regulatory actions, including relating to customs and duties matters, employment matters and commercial disputes. Moreover, litigation or defending against governmental actions can be time-consuming, expensive and disruptive to normal business operations, and the outcome of litigation or governmental actions is difficult to predict. The defense of these or other lawsuits or government actions may result in significant expenditures and the continued diversion of our management’s time and attention from the operation of our business, which could impede our business. In addition, all or a portion of any amount we may be required to pay to satisfy a judgment or settlement of any or all of these claims may not be covered by insurance.
While we believe that we have, based on the audit committee’s independent review, made appropriate judgments and disclosures with respect to our financial statements and this Annual Report on Form 10-K and our Annual Report on Form 10-K for fiscal 2016, the SEC may disagree with the manner in which we reported the results of the independent review or accounted for and reported, or did not report, the corresponding financial impact. Accordingly, it is possible that we could be required to restate our financial statements, amend prior filings with the SEC or take other actions not currently contemplated.
Our business and stock price may be adversely affected if our internal control over financial reporting is not effective.
As a public company, we are required to maintain internal controls over financial reporting and to report any material weaknesses in such internal controls. Section 404 of the Sarbanes-Oxley Act of 2002 (the Sarbanes-Oxley Act) requires that we evaluate and determine the effectiveness of our internal controls over financial reporting and provide a management report on the internal controls over financial reporting, which must be attested to by our independent registered public accounting firm.
In September 2016, our audit committee, with the assistance of outside legal counsel, commenced an independent review related to the distribution of our products into countries outside the U.S. in which such products are not registered or that otherwise impose stringent restrictions on our direct selling model, and the associated revenue and tax and other accruals associated with such sales. Based on its review, the audit committee determined that we had sold our products to independent distributors who carried or shipped such products primarily into four countries outside the U.S. in which those products are not registered or that otherwise impose stringent restrictions on our direct selling model and that we had allowed individuals who were resident in countries that impose stringent restrictions on our direct selling model to enroll as our independent distributors. Accordingly, we concluded that we had a material weakness in our internal control over financial reporting related to our business policies, practices, monitoring and training governing our international business operations, including the sale and distribution of our products in international markets. A “material weakness” is a deficiency, or a combination of deficiencies, in internal control over financial reporting such that there is a reasonable possibility that a material misstatement of our annual or interim financial statements will not be prevented or detected on a timely basis. We also evaluated the effectiveness of the design and operation of our disclosure controls and procedures as of June 30, 2016 and concluded that our disclosure controls and procedures were not effective as of that date, because of the material weakness in our internal control over financial reporting.
We adopted various measures that were designed to remediate the material weakness in our internal control over financial reporting, including the development and implementation of new control policies and procedures regarding the international business policies, practices, monitoring and training for each country outside the U.S. in which we do business. Our management has evaluated and tested the controls that have been implemented and, as a result of final testing of internal controls over financial reporting, concluded that the controls were in place and operating effectively to remediate the material weakness, described above, as of June 30, 2017. However, we cannot assure you that significant deficiencies or material weaknesses in our internal control over financial reporting will not exist in the future. Any failure to maintain or implement required new or improved controls, or any difficulties we encounter in their implementation, could result in significant deficiencies or material weaknesses, cause us to fail to timely meet our periodic reporting obligations, or result in material misstatements in our financial statements. Any such failure could also adversely affect the results of periodic management evaluations and annual auditor attestation reports regarding disclosure controls and the effectiveness of our internal control over financial reporting required under Section 404 of the Sarbanes-Oxley Act of 2002 and the rules promulgated thereunder. The
20
existence of a material weakness could result in errors in our financial statements that could result in a restatement of financial statements, cause us to fail to timely meet our reporting obligations and cause investors to lose confidence in our reported financial information, leading to a decline in our stock price.
If we do not adequately manage our financial reporting and internal control systems and processes, our ability to manage and grow our business may be harmed.
Our ability to implement our business plan and comply with regulations requires an effective planning and management process and there is no assurance that we can effectively implement an effective process. For example, based on the independent review conducted by our audit committee in 2016, as discussed above, the audit committee determined that we had sold our products to independent distributors who carried or shipped such products into countries outside the U.S. in which such products are not registered or that otherwise impose stringent restrictions on our direct selling model and that we had allowed individuals who were resident in countries that impose stringent restrictions on our direct selling model to enroll as our independent distributors. As a result, the audit committee and our management concluded that we did not have adequate internal controls and processes in place regarding our international business policies, practices, monitoring and training. We have taken many steps and efforts to remediate the material weakness in our internal controls and procedures and while our management has concluded that controls were in place and operating effectively to remediate the material weakness as of June 30, 2017, there is no assurance that we can continue to manage our future business effectively. Any implementation delays, or disruption in the transition to new or enhanced systems, procedures or controls, could harm our ability to forecast sales, manage our supply chain, and record and report financial and management information on a timely and accurate basis.
Our business could be negatively impacted if we fail to execute our product launch process due to increased pressure on our supply chain, information systems and management.
Although our product launch process may vary by market, we generally introduce new products to our independent distributors and preferred customers through live cyber launches, limited-time offers and promotions. The limited-time offers typically generate significant activity and a high level of purchasing, which may result in a higher than normal increase in revenue during the quarter of the limited-time offer and skew year-over-year and sequential comparisons. We may experience difficulty effectively managing growth associated with these limited-time offers. In addition, the size and condensed schedule of these product launches increases pressure on our supply chain. If we are unable to accurately forecast sales levels in each market, obtain sufficient ingredients or produce a sufficient supply to meet demand, we may incur higher expedited shipping costs and we may temporarily run out of stock of certain products, which could negatively impact the enthusiasm of our independent distributors and preferred customers. Conversely, if demand does not meet our expectations for a product launch, we could incur increased inventory write-offs. Any inventory write-off would negatively impact our gross margins. In addition, our order processing systems could have difficulties handling the high volume of orders generated by limited-time offers. Although our previous limited-time offers have not materially affected our product return rate, these events may increase our product return rate in the future.
Our business may be harmed if we are unable to appropriately manage our inventory.
In the past, we have experienced difficulties in appropriately managing our inventory. For example, when we launched our PhysIQ™ product line in December 2015, we experienced higher than expected demand and did not have sufficient inventory to meet demand. More recently, our inventory balances increased significantly, causing us to engage in a deliberate effort to manage our inventory balances down to levels we view as appropriate. We review all inventory items quarterly for obsolescence, and when items become obsolete or are expired we write down our inventory accordingly. If we are unable to sell our inventory in a timely manner, we may experience additional inventory obsolescence charges, including for finished products in inventory that have expired. If we are unable to appropriately manage our inventory balances, our business may be harmed.
We rely on our information technology systems to manage numerous aspects of our business, and a disruption in these systems could adversely affect our business.
We depend on our information technology, or IT, systems to manage numerous aspects of our business, including our finance and accounting transactions, to manage our independent distributor compensation plan and to provide analytical information to management. Our IT systems are an essential component of our business and growth strategies, and a serious disruption to our IT systems could significantly limit our ability to manage and operate our business efficiently. These systems are vulnerable to, among other things, damage and interruption from power loss or natural disasters, computer system and network failures, loss of telecommunications services, physical and electronic loss of data, security breaches and computer viruses. Any disruption could cause our business and competitive position to suffer and adversely affect our business and operating results. In addition, if we experience future growth, we will need to scale or change some of our systems to accommodate the increasing number of independent distributors and other customers.
21
Cyber security risks and the failure to maintain the integrity of data belonging to our company, employees, independent distributors and preferred customers could expose us to data loss, litigation and liability, and our reputation could be significantly harmed.
We collect and retain large volumes of data relating to our business and from our employees, independent distributors and preferred customers for business purposes, including for transactional and promotional purposes, and our various information technology systems enter, process, summarize and report such data. The integrity and protection of this data is critical to our business. We are subject to significant security and privacy regulations, as well as requirements imposed by the credit card industry. Maintaining compliance with these evolving regulations and requirements could be difficult and may increase our expenses. In addition, a penetrated or compromised data system or the intentional, inadvertent or negligent release or disclosure of data could result in theft, loss or fraudulent or unlawful use of data relating to our company or our employees, independent distributors or preferred customers, which could harm our reputation, disrupt our operations, or result in remedial and other costs, fines or lawsuits.
Inability to comply with financial covenants imposed by our credit facility and the impact of debt service obligations and restrictive covenants could impede our operations and flexibility.
We entered into a Financing Agreement in March 2016 that provides for a credit facility consisting of a term loan in an aggregate principal amount of $10 million and a revolving loan facility in an aggregate principal amount not to exceed $2 million. At the end of the fiscal year ended June 30, 2017, the principal amount owing under the credit facility was approximately $7.5 million. The principal amount borrowed under the credit facility is repayable in consecutive quarterly installments. We expect to generate the cash necessary to pay the principal and interest on the credit facility from our cash flows provided by operating activities. However, our ability to meet our debt service obligations will depend on our future performance, which may be affected by financial, business, economic, demographic and other factors. If we do not have enough money to pay our debt service obligations, we may be required to refinance all or part of our debt, sell assets, borrow more money or raise cash through the sale of equity. In such an event, we may not be able to refinance our debt, sell assets, borrow more money or raise cash through the sale of equity on terms acceptable to us or at all. Also, our ability to carry out any of these activities on favorable terms, if at all, may be further impacted by any financial or credit crisis which may limit access to the credit markets and increase the cost of capital.
The credit facility is secured by a lien on substantially all of our assets, and the assets of our subsidiaries, and contains customary covenants, including affirmative and negative covenants, that restrict our ability to incur or guarantee additional indebtedness, declare or pay dividends on or redeem capital stock, make other payments to holders of our equity interests, make certain investments, purchase or otherwise acquire all or substantially all the assets or equity interests of other companies, sell our assets and enter into consolidations, mergers or transfers of all or substantially all of our assets. The credit facility requires that we maintain specified financial ratios and satisfy certain financial condition tests and meet certain informational requirements. Our ability to meet these financial ratios and tests and informational requirements can be affected by events beyond our control and we may be unable to meet these ratios and tests and informational requirements. A breach of any of the covenants, ratios, tests or restrictions imposed by the credit facility would result in an event of default and the lender could declare all amounts outstanding under the credit facility to be immediately due and payable. Our assets may not be sufficient to repay the indebtedness if the lenders accelerate our repayment of the indebtedness under the credit facility.
A substantial portion of our business is conducted in foreign markets, exposing us to the risks of trade or foreign exchange restrictions, increased tariffs, foreign currency fluctuations, disruptions or conflicts with our third party importers and similar risks associated with foreign operations.
A substantial portion of our sales are generated outside the United States. If we are successful in entering additional foreign markets, we anticipate that the percentage of our sales generated outside the United States will increase. There are substantial risks associated with foreign operations. For example, a foreign government may impose trade or foreign exchange restrictions, increased tariffs or other legal, tax, customs or other financial burdens on us or our independent distributors, due, for example, to the structure of our operations in various markets. Any such actions could negatively impact our operations and financial results. We are also exposed to risks associated with foreign currency fluctuations. For instance, in preparing our financial statements, we translate revenue and expenses in our markets outside the United States from their local currencies into U.S. Dollars using weighted average exchange rates. If the U.S. Dollar strengthens relative to local currencies, our reported revenue, gross profit and net income will likely be reduced. Foreign currency fluctuations can also result in losses and gains resulting from translation of foreign currency denominated balances on our balance sheet. Additionally, purchases from suppliers are generally made in U.S. Dollars while sales to distributors are generally made in local currencies. Accordingly, strengthening of the U.S. Dollar versus a foreign currency could have a negative impact on us. Specifically, because a significant percentage of our revenues are generated in Japan, strengthening of the U.S. Dollar versus the Japanese yen has had and could continue to have an adverse impact on our financial results. Although we may engage in transactions intended to reduce our exposure to foreign currency fluctuations, there can be no assurance that these transactions will be effective. Given the complex global
22
political and economic dynamics that affect exchange rate fluctuations, it is difficult to predict future fluctuations and the effect these fluctuations may have upon future reported results or our overall financial condition.
Additionally, we may be negatively impacted by conflicts with or disruptions caused or faced by third party importers, as well as conflicts between such importers and local governments or regulatory agencies. Our operations in some markets also may be adversely affected by political, economic and social instability in foreign countries.
Global economic conditions could harm our business.
Global economic conditions continue to be challenging and unpredictable. Consumer confidence and spending have declined in recent years and the global credit crisis has limited access to capital for many companies and consumers. The global economic downturn could adversely impact our business by causing a decline in demand for our products, particularly if the economic conditions are prolonged or worsen. In addition, poor global economic conditions may adversely impact access to capital for us and our suppliers, may decrease our independent distributors’ ability to obtain or maintain credit, and may otherwise adversely impact our operations and overall financial condition.
If we are to expand our product offerings, we may need to raise additional capital.
Although we continue to introduce additional products, we primarily depend on the Protandim® product line for our revenue. We may decide to expand our product portfolio and may seek to do so by acquiring products by license or through product or company acquisitions. If cash generated from operations is insufficient to satisfy our requirements in this regard, we may need to raise additional capital, which may be dilutive to our existing shareholders. If we are unable to raise additional required capital in a timely manner, we could be forced to reduce our growth plans.
We could be exposed to certain environmental liabilities due to our past operations and property ownership.
During the 1990s, we owned mining properties in the Yaak River mining district of Montana. We never conducted any mining operations or ore processing on these properties, nor have we performed on-site environmental studies on these properties. The State of Montana Department of Environmental Quality believed that the properties may contain residues from past mining. We may be liable for material environmental liabilities associated with these properties.
In addition, until November 2004, we owned land in Lawrence, Colorado. We are not aware of any environmental liabilities with respect to this land. The party that acquired the land from us assumed any environmental liability related to the land. Nonetheless, a governmental agency or a private party could seek to hold us accountable for such environmental liabilities, if any.
Risks Relating to Our Business and Industry
We primarily depend on a few products for our revenue.
Although we generate revenue through the sale of our Petandim™ for Dogs, Axio®, and PhysIQ™ products, we primarily rely on our Protandim® and LifeVantage TrueScience® product lines for our revenue, which collectively represent approximately 77.9% of our total revenues and each of which account for over 10% of our total revenues. We do not currently have a broad portfolio of other products that we could rely on to support our operations if we were to experience any difficulty with the manufacture, marketing, sale or distribution of these product lines. For example, our revenue was adversely impacted because sales of Protandim® Nrf2 Synergizer slowed following our voluntary product recall during fiscal 2013. If we have similar problems in the future, our results could be negatively affected. In addition, we may be unable to sustain or increase the price or sales levels for the Protandim® product line, which could harm our business.
If we are unable to retain our existing independent distributors or attract additional independent distributors, our revenue will not increase and may even decline.
Our independent distributors may terminate their services at any time, and we can and have in the past terminated distributors for conduct violative of our policies and procedures. As such, like most direct selling companies, we have experienced and are likely to continue to experience turnover among independent distributors. The departure for any reason of one of our leading independent distributors can be a major disruption to other independent distributors and can have a significant negative impact on our operating results. Independent distributors who join our company to purchase our products for personal consumption or for short-term income goals may only stay with us for a short time. While we take steps to help train, motivate, and retain independent distributors, we cannot accurately predict the number or productivity of our independent distributors.
Our operating results will be harmed if we and our independent distributor leaders do not generate sufficient interest in our business to retain existing independent distributors and attract new independent distributors. The number and productivity of our independent distributors could be harmed by several factors, including:
• | any adverse publicity regarding us, our products, our distribution channel, or our competitors; |
23
• | non-compliance by our independent distributors with applicable legal requirements or our policies and procedures; |
• | lack of interest in existing or new products or their failure to achieve desired results; |
• | lack of a compelling business opportunity sufficient to generate the interest and commitment of new independent distributors; |
• | any changes we might make to our independent distributor compensation plan; |
• | any negative public perception of our company or our products or their ingredients; |
• | any negative public perception of our independent distributors and direct selling business in general; |
• | our actions to enforce our policies and procedures; |
• | any efforts to sell our products through competitive channels; |
• | any regulatory actions or charges against us or others in our industry; and |
• | general economic and business conditions. |
High quality materials for our products may be difficult to obtain or expensive.
Raw materials account for a significant portion of our manufacturing costs and we rely on third-party suppliers to provide raw materials. Suppliers may be unable or unwilling to provide the raw materials our manufacturers need in the quantities requested, at a price we are willing to pay, or that meet our quality standards. We are also subject to potential delays in the delivery of raw materials caused by events beyond our control, including labor disputes, transportation interruptions and changes in government regulations. Our business could be adversely affected if we are unable to obtain a reliable source of any of the raw materials used in the manufacturing of our products that meets our quality standards. Additionally, if demand for our products exceeds our forecasts, we may have difficulties in obtaining additional raw materials in time to meet the excess demand. Any significant delay in or disruption of the supply of raw materials could, among other things, substantially increase the cost of such materials, require reformulation or repackaging of products, require the qualification of new suppliers, or result in our inability to meet customer demands.
Although our independent distributors are independent contractors, improper distributor actions that violate laws or regulations could harm our business.
Our independent distributors are not employees and act independent of us. However, activities by our independent distributors that violate applicable laws or regulations could result in government or third-party actions against us, which could harm our business. Our independent distributors agree to abide by our strict policies and procedures designed to ensure our independent distributors will comply with legal requirements. We have a compliance department that addresses violations of our independent distributors when they become known to us. However, given the size of our independent distributor network, we experience problems with independent distributors violating our policies and procedures from time to time and are not always able to discover or remedy such violations.
One of our most significant areas of risk with respect to independent distributor activities relates to improper product claims and claims regarding the business opportunity of being an independent distributor. Any determination by the Federal Trade Commission, any state agency or other similar governmental agency outside the United States that we or our independent distributors are not in compliance with applicable laws could materially harm our business. Even if governmental actions do not result in rulings or orders against us, they could create negative publicity that could detrimentally affect our efforts to recruit or motivate independent distributors and attract customers or lead to consumer lawsuits against us. As we experience growth in the number of our independent distributors, we have seen an increase in sales aids and promotional material being produced by distributors and distributor groups in some markets. This places an increased burden on us to monitor compliance of such materials and increases the risk that such materials could contain problematic product or marketing claims in violation of our policies and applicable regulations. As we expand internationally, our distributors sometimes attempt to anticipate additional new markets that we may enter in the future and begin marketing and sponsoring activities in markets where we are not qualified to conduct business. For example, some of our independent distributors have carried or shipped our products into countries in which such products are not registered or that otherwise impose stringent restrictions on our direct selling model. These or other activities by our independent distributors that violate applicable laws or regulations could subject us to legal or regulatory claims or actions, which could result in fines, penalties or negative publicity, any of which could have an adverse impact on our business.
We are dependent upon third parties to manufacture our products.
We currently rely on third parties to manufacture the products we sell. We are dependent on the uninterrupted and efficient operation of third party manufacturers’ facilities. We currently use multiple third-party manufacturers for our products. If any of our current manufacturers are unable or unwilling to fulfill our manufacturing requirements or seek to impose unfavorable
24
terms, we will likely have to seek out other manufacturers, which could disrupt our operations and we may not be successful in finding alternative manufacturing resources. In addition, competitors who perform their own manufacturing may have an advantage over us with respect to pricing, availability of product, and in other areas through their control of the manufacturing process.
Disruptions to transportation channels used to distribute our products may adversely affect our margins and profitability.
We generally rely on the uninterrupted and efficient operation of third-party logistics companies to transport and deliver our products. These third-party logistics companies may experience disruptions to the transportation channels used to distribute our products, including increased airport and shipping port congestion, a lack of transportation capacity, increased fuel expenses, and a shortage of manpower. Disruptions to the transportation channels experienced by our third party logistics companies may result in increased costs, including the additional use of airfreight to meet demand.
We are subject to risks related to product recalls.
We have implemented measures in our manufacturing process that are designed to prevent and detect defects in our products, including contaminants. However, such measures may not prevent or reveal defects or detect contaminants in our products and such defects and contaminants may not become apparent until after our products have been sold into the market. Accordingly, there is a risk that product defects will occur, or that our products will contain foreign contaminants, and that such defects and contaminants will require a product recall. We do not maintain product recall insurance. In December 2012, we commenced a voluntary recall of certain lots of Protandim® Nrf2 Synergizer to alleviate concerns that some tablets may have included small metal fragments. We discovered these small metal fragments in certain batches of turmeric extract, an ingredient in Protandim® Nrf2 Synergizer we purchase from third-party suppliers. Product recalls and subsequent remedial actions can be expensive to implement and could have a material adverse effect on our business, results of operations and financial condition. In addition, product recalls could result in negative publicity and public concerns regarding the safety of our products, either of which could harm the reputation of our products and our business and could cause the market value of our common stock to decline.
The events that lead to and followed our voluntary product recall in December 2012 strained our relationships with some of our third-party manufacturers. Additionally, following the voluntary recall we implemented more stringent measures, including several redundant measures, in our manufacturing process to detect contaminants. Third-party manufacturers may be reluctant to implement these redundant measures, may refuse to manufacture our products, and these additional measures may increase our cost of goods sold and further strain our relationships with manufacturers.
Laws and regulations may prohibit or severely restrict direct selling and cause our revenue and profitability to decline, and regulators could adopt new regulations that negatively impact our business.
Various government agencies throughout the world regulate direct selling practices. The laws and regulations applicable to us and our independent distributors in Japan are particularly stringent. These laws and regulations are generally intended to prevent fraudulent or deceptive schemes, often referred to as “pyramid” schemes, which compensate participants primarily for recruiting additional participants without significant emphasis on the sale of product to end consumers. The laws and regulations in some of our markets impose cancellations, product returns, inventory buy-backs and cooling-off rights for our independent distributors and customers. Excessive refunds and/or product returns pursuant to local laws and regulations could have a negative impact on our operating results. Complying with these rules and regulations can be difficult and requires the devotion of significant resources on our part. We may not be able to continue business in existing markets or commence operations in new markets if we are unable to comply with these laws or adjust to changes in these laws.
Unfavorable publicity could materially harm our business.
We are highly dependent upon consumers' perceptions of the safety, quality, and efficacy of our products, as well as competitive products distributed by other companies. In the past, we have experienced negative publicity that has harmed our business. Critics of our industry and other individuals whose interests are not aligned with our interests, have in the past and may in the future utilize the Internet, the press and other means to publish criticism of the industry, our company, our products and our competitors, or make allegations regarding our business and operations, or the business and operations of our competitors. For instance, several prominent companies in our industry have been targeted by short sellers who profit if a company's stock price decreases. One such company was targeted by a short seller who, after taking a significant short position, publicly made allegations regarding the legality of the company's direct selling model. Short sellers have an incentive to publicly criticize our industry and business model and any such criticism may adversely affect our stock price.
Future scientific research or publicity may not be favorable to our industry or any particular product. Because of our dependence upon consumer perceptions, adverse publicity associated with illness or other adverse effects resulting or claimed to have resulted from the consumption or use of our products or any similar products distributed by other companies could have a material adverse impact on us. Such adverse publicity could arise even if the claims are unsubstantiated or if the adverse
25
effects associated with such products resulted from failure to consume or use such products as directed. Adverse publicity could also increase our product liability exposure, result in increased regulatory scrutiny and lead to the initiation of private lawsuits.
Our direct selling program could be found to be not in compliance with current or newly adopted laws or regulations in one or more markets, which could prevent us from conducting our business in these markets and harm our financial condition and operating results.
Some of the legal and regulatory requirements concerning the direct selling business model are ambiguous and subject to interpretation. As a result, regulators and courts have discretion in their application of these laws and regulations, and the enforcement or interpretation of these laws and regulations by governmental agencies or courts can change. Recent allegations by short sellers regarding the legality of multi-level marketing companies generally have also created intense public scrutiny of our industry and could cause governmental agencies to change their enforcement and interpretation of applicable laws and regulations. The failure of our business to comply with current or newly adopted regulations or interpretations could negatively impact our business in a particular market or in general and may adversely affect our stock price.
We may become involved in legal proceedings that are expensive, time consuming and, if adversely adjudicated or settled, could adversely affect our financial results.
Litigation claims can be expensive and time consuming to bring or defend against and could result in settlements or damages that could significantly affect our financial results. It is not possible to predict the final resolution of litigation to which we may become a party, and the impact of litigation proceedings on our business, results of operations and financial condition could be material.
We are currently involved in various lawsuits, both as a plaintiff and as defendant. While we believe the suits against us are without merit, they are costly to defend and we cannot be assured that we will ultimately prevail. If we do not prevail and are required to pay damages, it could harm our business.
Our business is subject to strict government regulations.
The manufacturing, packaging, labeling, advertising, sale and distribution of our products are subject to federal laws and regulations by one or more federal agencies, including, in the United States, the Food and Drug Administration, or FDA, the Federal Trade Commission, or FTC, the Consumer Product Safety Commission, and the United States Department of Agriculture. These activities are also regulated by various state, local, and international laws and agencies of the states, localities and countries in which our products are sold. For instance, the FDA regulates, among other things, the composition, safety, labeling, and marketing of dietary supplements (including vitamins, minerals, herbs and other dietary ingredients for human use). Government regulations may prevent or delay the introduction, or require the reformulation, of our products, which could result in lost revenues, increased costs and delay our expansion into new international markets.
The FDA may determine that a particular dietary supplement or ingredient is adulterated or misbranded or both, and may determine that a particular claim or statement of nutritional value that we make to support the marketing of a dietary supplement is an impermissible drug claim, is not substantiated, or is an unauthorized version of a “health claim.” Determining whether a claim is improper frequently involves a degree of subjectivity by the regulatory agency or individual regulator. Any of these determinations by the FDA could prevent us from marketing that particular dietary supplement product, or making certain claims for that product. The FDA could also require us to remove a particular product from the market. Any future recall or removal would result in additional costs to us, including lost revenues from any product that we are required to remove from the market, which could be material. Any product recalls or removals could also lead to liability, substantial costs, and reduced growth prospects.
In April 2017, we received a warning letter from the FDA alleging that information on our website contained impermissible drug claims relating to our Protandim® Nrf2 Synergizer product. We believe the letter from the FDA contained factual inaccuracies and we responded promptly to the FDA. We have not received any further correspondence from the FDA on this matter. We do not claim that any of our products prevent, diagnose, treat or cure any disease in any of our marketing materials or labeling and we proactively and consistently engage distinguished experts in FDA law and regulation to ensure our promotional materials and websites adhere to applicable requirements and restrictions. Nevertheless, in the future, we may receive similar warning letters from the FDA if it believes some violation of law has occurred either by us or by our independent distributors. Any allegations of our non-compliance may result in time-consuming and expensive defense of our activities. The warning letter is public information posted on the FDA’s website. That information could negatively affect our relationships with our investors, independent distributors, vendors, and consumers. Warning letters may also spark private class action litigation under state consumer protection statutes. The FDA could also order compliance activities, such as an inspection of our facilities and products, and could file a civil lawsuit in which an arrest warrant (seizure) could be issued as to some or all of our products. In extraordinary cases, we could be named a defendant and sued for declaratory and injunctive relief.
Additional or more stringent regulations of dietary supplements and other products have been considered from time to time. In recent years, there has been increased pressure in the United States and other markets to increase regulation of dietary
26
supplements. New regulations, or interpretations of those regulations, could impose additional restrictions, including requiring reformulation of some products to meet new standards, recalls or discontinuance of some products not able to be reformulated, additional record-keeping requirements, increased documentation of the properties of some products, additional or different labeling, additional scientific substantiation, additional adverse event reporting, or other new requirements. Any of these developments could increase our costs significantly.
In the United States, for example, some legislators and industry critics continue to push for increased regulatory authority by the FDA over dietary supplements. Our business could be harmed if more restrictive legislation is successfully introduced and adopted in the future. In the United States, the FTC’s Guides Concerning the Use of Endorsements and Testimonials in Advertising, or Guides, require disclosure of material connections between an endorser and the company they are endorsing and generally do not allow marketing using atypical results. Our independent distributors have historically used testimonials to market and sell our products. Producing marketing materials that conform to the requirements and restrictions of the Guides may diminish the impact of our marketing efforts and negatively impact our sales results. If we or our distributors fail to comply with these Guides, the FTC could bring an enforcement action against us and we could be fined and/or forced to alter our marketing materials. Our operations also could be harmed if new laws or regulations are enacted that restrict our ability to market or distribute dietary supplements or impose additional burdens or requirements on dietary supplement companies or require us to reformulate our products.
In addition, the Dietary Supplement and Nonprescription Drug Consumer Protection Act imposes significant regulatory requirements on dietary supplements, packers and distributors including the reporting of “serious adverse events” to the FDA and record keeping requirements. Complying with this legislation could raise our costs and negatively impact our business. We and our suppliers are also required to comply with FDA regulations with respect to current Good Manufacturing Practices in manufacturing, packaging, or holding dietary ingredients and dietary supplements. These regulations require dietary supplements to be prepared, packaged, and held in compliance with procedures that we and our subcontractors must develop and make available for inspection by the FDA. These regulations could raise our costs and negatively impact our business. Additionally, our third-party suppliers or vendors may not be able to comply with these rules without incurring substantial expenses. If our third-party suppliers or vendors are not able to comply with these rules, we may experience increased cost or delays in obtaining certain raw materials and third-party products.
In 2016, the FDA published an updated draft guidance which is intended, among other things, to help manufacturers and distributors of dietary supplement products determine when they are required to file with the FDA a New Dietary Ingredient, or NDI, notification with respect to a dietary supplement product. In this draft guidance, the FDA highlighted the necessity for marketers of dietary supplements to submit NDI notifications as an important preventive control to ensure that consumers are not exposed to potential unnecessary public health risks in the form of new ingredients with unknown safety profiles. Although we do not believe that any of our products contain an NDI, if the FDA were to conclude that we should have filed an NDI notification for any of our products, then we could be subject to enforcement actions by the FDA. Such enforcement actions could include product seizures and injunctive relief being granted against us, any of which would harm our business.
In May 2016, the FDA released a final rule updating the Nutrition Facts label for packaged foods and the Supplement Facts label for dietary supplements, with the objective to help consumers make better informed decisions. The original compliance deadline for manufacturers of food and dietary supplements to use the new label was July 26, 2018. FDA has announced it will extend the compliance period but has not yet announced a new compliance date. Change and implementation of the new label may result in additional costs to our business.
Regulations governing the production and marketing of our line of skin care products could harm our business.
LifeVantage TrueScience®, our line of anti-aging skin care products, is subject to various domestic and foreign laws and regulations that regulate cosmetic products and set forth regulations for determining whether a product can be marketed as a “cosmetic” or requires further approval as a drug. A determination that our skin care products impact the structure or function of the human body, including due to improper marketing claims by our independent distributors, may lead to a determination that the LifeVantage TrueScience® skin care products require pre-market approval as a drug. Such regulations in any given market can limit our ability to import products and can delay product launches as we go through the registration and approval process for those products. Furthermore, if we fail to comply with these regulations, we could face enforcement action against us and we could be fined, forced to alter or stop selling our skin care products and/or be required to adjust our operations. Our operations also could be harmed if new laws or regulations are enacted that restrict our ability to market or distribute our skin care products or impose additional burdens or requirements on the contents of our personal care products or require us to reformulate our products.
We are subject to the risk of investigatory and enforcement action by the FTC.
We are subject to the risk of investigatory and enforcement action by the FTC based on our advertising claims and marketing practices. The FTC routinely reviews product advertising, including websites, to identify significant questionable advertising claims and practices. The FTC has brought many actions against dietary supplement companies based upon
27
allegations that applicable advertising claims or practices were deceptive or not substantiated. If the FTC initiates an investigation, the FTC can initiate pre-complaint discovery that may be nonpublic in nature. Any investigation may be very expensive to defend and may result in an adverse ruling or in a consent decree.
Government authorities may question our tax positions or transfer pricing policies or change their laws in a manner that could increase our effective tax rate or otherwise harm our business.
As a U.S. company doing business in international markets through subsidiaries, we are subject to various tax and intercompany pricing laws, including those relating to the flow of funds between our company and our subsidiaries. From time to time, we are audited by tax regulators in the United States and in our foreign markets. If regulators challenge our tax positions, corporate structure, transfer pricing mechanisms or intercompany transfers, we may be subject to fines and payment of back taxes, our effective tax rate may increase and our operations may be harmed. Tax rates vary from country to country, and, if tax authorities determine that our profits in one jurisdiction may need to be increased, we may not be able to fully utilize all foreign tax credits that are generated, which will increase our effective tax rate. The various customs, exchange control and transfer pricing laws are continually changing and are subject to the interpretation of government agencies. We may experience increased efforts by customs authorities in foreign countries to reclassify our products or otherwise increase the level of duties we pay on our products. Despite our efforts to be aware of and comply with such laws, and changes to and interpretations thereof, there is a risk that we may not continue to operate in compliance with such laws. We may need to adjust our operating procedures in response to such changes and, as a result, our business may suffer. In addition, due to the international nature of our business, from time to time, we are subject to reviews and audits by taxing authorities of other jurisdictions in which we conduct business throughout the world.
Non-compliance with anti-corruption laws could harm our business.
Our international operations are subject to anti-corruption laws, including the Foreign Corrupt Practices Act, also known as the FCPA. Any allegations that we are not in compliance with anti-corruption laws may require us to dedicate time and resources to an internal investigation of the allegations or may result in a government investigation. Any determination that our operations or activities are not in compliance with existing anti-corruption laws or regulations could result in the imposition of substantial fines, and other penalties. Although we have implemented anti-corruption policies and controls to protect against violation of these laws, we cannot be certain that these efforts will be effective.
If we are unable to build and integrate our new management team, our business could be harmed.
Our executive management team has undergone significant changes, including the termination or resignation from employment of our former Chief Financial Officer and Chief Operating Officer. In March 2017, Charles Wach was appointed as our new Chief Operating Officer and Steven Fife was appointed as our Chief Financial Officer.
Our success depends largely on the development and execution of our business strategy by our senior management team. Our Chief Financial Officer and Chief Operating Officer are relatively new to our company. We cannot assure you that our new management will succeed in working together as a team, working well with our other existing employees or successfully executing our business strategy in the near-term or at all, which could harm our business and financial prospects. Further, integrating new management into existing operations may be challenging. If we are unable to effectively integrate our new executive management team, our operations and prospects could be harmed.
The loss of or inability to attract key personnel could negatively impact our business.
Our future performance will depend upon our ability to attract, retain, and motivate our executive and senior management team and scientific staff. Our success depends to a significant extent both upon the continued services of our current executive and senior management team and scientific staff, as well as our ability to attract, hire, motivate, and retain additional qualified management and scientific staff in the future. Specifically, competition for executive and senior staff in the direct selling and dietary supplement markets is intense, and our operations could be adversely affected if we cannot attract and retain qualified personnel. Additionally, former members of our executive and senior management team have in the past, and could in the future join or form companies that compete against us in the direct selling industry.
All of our employees are “at will” employees, which means any employee may quit at any time and we may terminate any employee at any time. We do not carry “key person” insurance covering members of senior management or our employees.
We may be held responsible for certain taxes or assessments relating to the activities of our independent distributors, which could harm our financial condition and operating results.
Our distributors are subject to taxation, and in some instances, legislation or governmental agencies impose an obligation on us to collect or withhold taxes, such as value added taxes or income taxes, and to maintain appropriate records. In the event that local laws and regulations or the interpretation of local laws and regulations change to require us to treat our independent distributors as employees, or that our distributors are deemed by local regulatory authorities in one or more of the jurisdictions in which we operate to be our employees rather than independent contractors under existing laws and interpretations, or our
28
independent distributors are deemed to be conducting business in countries outside of the country in which they are authorized to do business, we may be held responsible for social security, income, and other related taxes in those jurisdictions, plus any related assessments and penalties, which could harm our financial condition and operating results. If our independent distributors were deemed to be employees rather than independent contractors, we would also face the threat of increased vicarious liability for their actions.
The dietary supplement market is highly competitive.
Our flagship product line, Protandim®, competes in the dietary supplements market, which is large, highly competitive and fragmented. Participants include specialty retailers, supermarkets, drugstores, mass merchants, multi-level marketing organizations, on-line merchants, mail-order companies, and a variety of other smaller participants. Many of our competitors have greater financial and other resources available to them and possess better manufacturing, independent distribution and marketing capabilities than we do. We believe some of these competitors with greater resources are currently working on developing and releasing products that will compete directly with the Protandim® product line and be marketed as NRF1 and Nrf2 activators. One or more of these products could significantly reduce the demand for the Protandim® product line and have a material adverse effect on our revenue. We believe that the market is also highly sensitive to the introduction of new products, including various prescription drugs, which may rapidly capture a significant share of the market. Moreover, because of regulatory restrictions concerning claims about the efficacy of dietary supplements, we may have difficulty differentiating our products from our competitors’ products, and competing products entering the dietary supplements market could harm our revenue. In the United States and Japan, we also compete for sales with heavily advertised national brands manufactured by large pharmaceutical and food companies, as well as other retailers. In addition, as some products become more mainstream, we experience increased competition for those products as more participants enter the market. Our international competitors include large international pharmacy chains, major international supermarket chains, and other large U.S.-based companies with international operations. We may not be able to compete effectively and our attempt to do so may result in increased pricing pressure, which may result in lower margins and have a material adverse effect on our results of operations and financial condition.
Our intellectual property rights are valuable, and any inability to protect them could reduce the value of our products and brand.
The loss of our intellectual property rights in our products could permit our competitors to manufacture their own version of our products. We have attempted to protect our intellectual property rights in our products through a combination of patents, patent applications, trademarks, confidentiality agreements, non-compete agreements and other contractual protection mechanisms, and we will continue to do so. While we intend to defend against any threats to our intellectual property, our patents or various contractual protections may not adequately protect our intellectual property. In addition, we could be required to expend significant resources to defend our rights to proprietary information, and may not be successful in such defense.
Moreover, our intellectual property rights are more limited outside of the United States than they are in the United States. As such, we may not be successful in preventing third parties from copying or misappropriating our intellectual property. There can also be no assurance that pending patent applications owned by us will result in patents being issued to us, that patents issued to or licensed by us in the past or in the future will not be challenged or circumvented by competitors or that such patents will be found to be valid or sufficiently broad to protect our products or to provide us with any competitive advantage. Third parties could also obtain patents that may require us to negotiate to obtain licenses to conduct our business, and any required licenses may not be available on reasonable terms or at all. We also rely on confidentiality and non-compete agreements with certain employees, independent distributors, consultants and other parties to protect, in part, trade secrets and other proprietary rights. There can be no assurance that these agreements will not be breached, that we will have adequate remedies for any breach, that others will not independently develop substantially equivalent proprietary information or that third parties will not otherwise gain access to our trade secrets or proprietary knowledge.
Third parties might claim that we infringe on their intellectual property rights.
Although the dietary supplement industry has historically been characterized by products with naturally occurring ingredients, recently it is becoming more common for suppliers and competitors to apply for patents or develop proprietary technologies and processes. Third parties may assert intellectual property infringement claims against us despite our efforts to avoid such infringement. Such claims could prevent us from offering competitive products or result in litigation or threatened litigation.
Our business is susceptible to product liability claims.
The manufacture and sale of any product for human consumption raises the risk of product liability claims. These claims may derive from the product itself or a contaminant found in the product from the manufacturing, packaging, sales process or even due to tampering by unauthorized third parties. Our products consist of vitamins, minerals, herbs, and other ingredients that are classified as foods or dietary supplements and are not subject to pre-market regulatory approval in the United States.
29
Our products could contain contaminated substances, and some of our products contain ingredients that do not have long histories of human consumption. Previously unknown adverse reactions resulting from human consumption of these ingredients could occur. In addition, third-party manufacturers produce all of the products we sell. As a distributor of products manufactured by third parties, we may also be liable for various product liability claims for these products despite not manufacturing them. We may be subject to various product liability claims, including, among others, that our products include inadequate instructions for use or inadequate warnings concerning possible side effects and interactions with other substances. Any product liability claim against us could result in increased costs and could adversely affect our reputation with our customers, which in turn could adversely affect our revenues and operating income. Although we maintain insurance coverage, there is a risk that our insurance will not cover our potential exposure completely or would fail to cover a particular claim, in which case we may not have the financial resources to satisfy such claim. In addition, certain types of damages, such as punitive damages, are not covered by our insurance policy.
Economic, political, and other risks associated with our international operations could adversely affect our revenues and international growth prospects.
As part of our business strategy, we intend to continue to expand our international presence. Our international operations are subject to a number of risks inherent to operating in foreign countries, and any expansion of our international operations will increase the effects of these risks. These risks include, among others:
• | political and economic instability of foreign markets; |
• | foreign governments’ restrictive trade policies; |
• | lack of well-established or reliable legal systems in certain areas in which we operate; |
• | inconsistent product regulation or sudden policy changes by foreign agencies or governments; |
• | the imposition of, or increase in, duties, taxes, government royalties, or non-tariff trade barriers; |
• | difficulty in collecting international accounts receivable and potentially longer payment cycles; |
• | the possibility that a foreign government may limit our ability to repatriate cash; |
• | increased costs in maintaining international marketing efforts; |
• | problems entering international markets with different cultural bases and consumer preferences; and |
• | fluctuations in foreign currency exchange rates. |
Any of these risks could have a material adverse effect on our international operations and our growth strategy.
Risks Related to Ownership of Our Common Stock
If we are unable to maintain compliance with Nasdaq requirements for continued listing, our common stock could be delisted from trading.
As previously disclosed, in fiscal 2016, we were delinquent in the filing of our periodic reports with the SEC and, as a result, were not in compliance with the continued listing requirements of the Nasdaq Stock Market. Accordingly, we were subject to having our stock delisted from trading on Nasdaq though we later were successful in regaining compliance with the Nasdaq continued listing requirements. However, there can be no assurance that our common stock will not be subject to delisting by Nasdaq in the future. If our common stock is delisted, there can be no assurance whether or when it would again be listed for trading on Nasdaq or any other exchange. If our common stock is delisted, the market price of our shares will likely decline and become more volatile, and our stockholders may find that their ability to trade in our stock will be adversely affected. Furthermore, institutions whose charters do not allow them to hold securities in unlisted companies might sell our shares, which could have a further adverse effect on the price of our stock.
Our stock price may experience future volatility.
The trading price of our common stock has historically been subject to wide fluctuations. The price of our common stock may fluctuate in the future in response to quarter-to-quarter variations in operating results, material announcements by us or competitors, governmental regulatory action, conditions in the dietary supplement industry, or other events or factors, many of which are beyond our control, and some of which do not have a strong correlation to our operating performance.
Substantial sales of shares may impact the market price of our common stock.
If our shareholders sell substantial amounts of our common stock, the market price of our common stock may decline. These sales also might make it more difficult for us to sell equity or equity-related securities in the future at a time and price that we consider appropriate.
30
Additional shares that may be issued upon the exercise of currently outstanding options or upon future vesting of performance restricted stock units, would dilute the voting power of our currently outstanding common stock and could cause our stock price to decline.
As of June 30, 2017, we had 14.2 million shares of common stock outstanding. As of June 30, 2017, we also had stock options outstanding for an aggregate of 0.3 million shares of common stock. Additionally, the future vesting of performance restricted stock units may further increase our outstanding shares of common stock. The issuance of these shares will dilute the voting power of our currently outstanding common stock and could cause our stock price to decline.
We have never paid dividends on our capital stock, and we do not currently anticipate paying any cash dividends in the foreseeable future.
We have paid no cash dividends on any of our classes of capital stock to date. We currently intend to retain our future earnings, if any, to fund the development and growth of our business. Additionally, the Financing Agreement we entered into in March 2016 in connection with our credit facility contains a customary covenant that restricts our ability to pay dividends. As a result, capital appreciation, if any, of our common stock is likely to be your sole source of gain for the foreseeable future.
ITEM 1B — UNRESOLVED STAFF COMMENTS
None.
ITEM 2 — PROPERTIES
Corporate Offices
During fiscal year 2014, we moved into our corporate headquarters located at 9785 South Monroe Street, Suite 300, Sandy, Utah 84070. The lease for our corporate headquarters is for a term of ten years commencing on February 10, 2014, with an option for us to terminate the lease in our discretion after seven years. The lease includes approximately 44,353 square feet with options to occupy additional space in the future if needed.
In April 2014, we amended the lease for our previous corporate headquarters located at 9815 South Monroe Street in Sandy, Utah, to reduce the size of this location to approximately 8,742 square feet. The lease for the 9815 South Monroe Street property expires in September 2017.
Our subsidiary, LifeVantage Japan K.K., leases approximately 10,400 square feet of office space in Tokyo, Japan. The lease for the Tokyo, Japan property expires in July 2020.
Warehouse Facilities
Since fiscal year 2010, IntegraCore, LLC has provided fulfillment services to us, including services relating to procurement, warehousing, ordering, processing and shipping. We have also entered into arrangements to receive similar services in some of our international markets.
ITEM 3 — LEGAL PROCEEDINGS
See Note 11 of the Notes to the Consolidated Financial Statements contained within this Annual Report on Form 10-K for a discussion of the Company's legal proceedings.
ITEM 4 — MINE SAFETY DISCLOSURES
Not applicable.
PART II
ITEM 5 — MARKET FOR REGISTRANT’S COMMON EQUITY, RELATED STOCKHOLDER MATTERS AND ISSUER PURCHASES OF EQUITY SECURITIES
Market Information and Holders
Our common stock began trading on the NASDAQ Capital Market ("NASDAQ") under the symbol "LFVN" in September 2012. Our common stock was previously quoted on the OTC Bulletin Board under the symbol “LFVN.” On October 19, 2015, the Company effected a one-for-seven reverse stock split.
The table below sets forth, for the fiscal quarters indicated, the reported high and low prices of our common stock, as quoted on NASDAQ or the OTC Bulletin Board, as applicable, adjusted for the effects of the reverse stock split. These prices
31
were reported by an online service, reflect inter-dealer prices, without retail mark-up, mark-down or commission and may not represent actual transactions. Our fiscal year-end is June 30.
Fiscal year | |||||||||||||||
2017 | 2016 | ||||||||||||||
High | Low | High | Low | ||||||||||||
First Quarter | $ | 15.97 | $ | 8.01 | $ | 6.86 | $ | 1.40 | |||||||
Second Quarter | $ | 10.20 | $ | 6.43 | $ | 10.50 | $ | 4.66 | |||||||
Third Quarter | $ | 8.34 | $ | 4.61 | $ | 10.55 | $ | 7.63 | |||||||
Fourth Quarter | $ | 5.40 | $ | 3.70 | $ | 14.71 | $ | 8.01 | |||||||
Our common stock is issued in registered form and the following information is taken from the records of our current transfer agent, Computershare Trust Company, Inc., located in Golden, Colorado. As of June 30, 2017, we had 113 shareholders of record and 14.2 million shares of common stock outstanding. This does not include an unknown number of persons who hold shares in street name through brokers and dealers and who are not listed on our shareholder records.
Stock Performance Graph
The following line graph and table compares the cumulative total shareholder return on our common stock with the cumulative total return of (i) the NASDAQ Composite Index and (ii) a market-weighted index of publicly-traded peer companies (the "Peer Group") for the period from June 30, 2012 through June 30, 2017. The data shown assumes an investment on June 30, 2012 of $100 and reinvestment of all dividends into additional shares of the same class of equity, if applicable, to the stock or index. There is no expectation that the rate of return achieved in the prior 5 years will be achievable in the upcoming years.
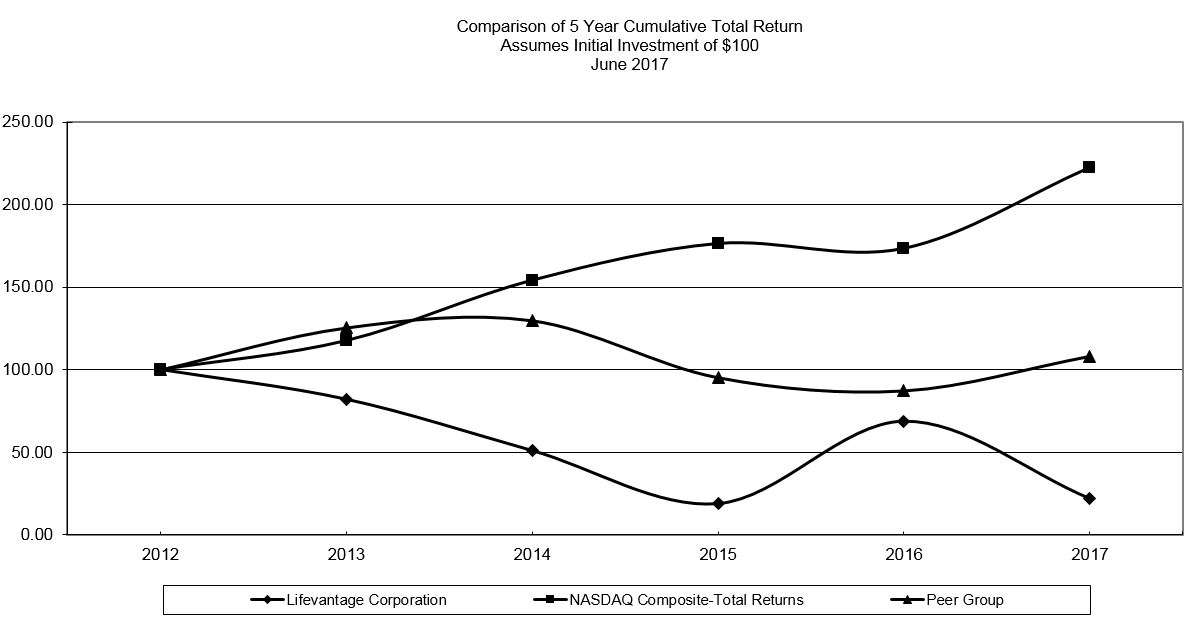
32
The Peer Group consists of the following companies, which compete in our industry and product categories: Nature's Sunshine Products, Inc.; Nu Skin Enterprises, Inc.; Mannatech, Incorporated; Herbalife LTD.; Reliv International, Inc.; Avon Products, Inc.; USANA Health Sciences, Inc. and Tupperware Brands Corporation.
Measured Period | LFVN | NASDAQ Composite | Peer Group | |||||||||
June 30, 2012 | $ | 100.00 | $ | 100.00 | $ | 100.00 | ||||||
June 30, 2013 | $ | 82.02 | $ | 117.60 | $ | 125.37 | ||||||
June 30, 2014 | $ | 50.91 | $ | 154.26 | $ | 129.74 | ||||||
June 30, 2015 | $ | 18.74 | $ | 176.53 | $ | 95.35 | ||||||
June 30, 2016 | $ | 68.69 | $ | 173.56 | $ | 87.34 | ||||||
June 30, 2017 | $ | 21.87 | $ | 222.67 | $ | 108.19 | ||||||
Dividends
We have not declared any dividends on any class of our equity securities since incorporation, and we do not currently anticipate declaring any dividends. Additionally, the March 2016 Credit Facility contains customary covenants that, among other things, restrict our ability to pay dividends.
Purchases of Equity Securities
We did not purchase any shares of our common stock during the quarter ended June 30, 2017.
During the three months ended June 30, 2017, we withheld 1,447 shares to satisfy tax withholding obligations in connection with the partial vesting of restricted stock awards.
Recent Sale of Unregistered Securities
None.
Equity Compensation Plan Information
This information is incorporated by reference to Part III, Item 12 of this report.
ITEM 6 — SELECTED FINANCIAL DATA
The following table summarizes certain historical financial information, which has been revised to correct immaterial errors included within previously issued financial statements, at the dates and for the periods indicated prepared in accordance with GAAP. For more information on these revisions, see Note 2 to the consolidated financial statements, included elsewhere in this annual report on Form 10-K.
The consolidated statement of operations data for the years ended June 30, 2017 and 2016, and the consolidated balance sheet data as of June 30, 2017 and 2016, have been derived from our consolidated financial statements audited by WSRP, LLC, an independent registered public accounting firm, included elsewhere in this annual report on Form 10-K. The consolidated statement of operations data for the year ended June 30, 2015 has been derived from our consolidated financial statements audited by EKS&H LLLP, an independent registered public accounting firm, included elsewhere in this annual report on Form 10-K. The consolidated statement of operations data for each of the years ended June 30, 2014 and 2013, and the consolidated balance sheet data as of June 30, 2015, 2014 and 2013, have been derived from our financial statements not included herein. The selected consolidated financial data should be read in conjunction with “Management's Discussion and Analysis of Financial Condition and Results of Operations” and the consolidated financial statements and notes thereto, which are included elsewhere in this annual report on Form 10-K. Our historical results are not necessarily indicative of operating results to be expected in the future.
33
Years Ended June 30, | |||||||||||||||||||
2017 | 2016 | 2015 | 2014 | 2013 | |||||||||||||||
(In thousands, except per share data) | (As revised) | (As revised) | (As revised) | (As revised) | |||||||||||||||
Statement of Operations Data: | |||||||||||||||||||
Revenue, net | $ | 199,489 | $ | 206,540 | $ | 190,336 | $ | 213,968 | $ | 208,178 | |||||||||
Cost of sales | 33,456 | 33,932 | 28,010 | 33,194 | 31,845 | ||||||||||||||
Product recall costs | — | — | — | — | 4,798 | ||||||||||||||
Gross profit | 166,033 | 172,608 | 162,326 | 180,774 | 171,535 | ||||||||||||||
Operating expenses: | |||||||||||||||||||
Commissions and incentives | 96,662 | 103,120 | 91,074 | 104,525 | 101,737 | ||||||||||||||
Selling, general and administrative | 64,922 | 56,074 | 57,353 | 56,801 | 57,730 | ||||||||||||||
Total operating expenses | 161,584 | 159,194 | 148,427 | 161,326 | 159,467 | ||||||||||||||
Operating income | 4,449 | 13,414 | 13,899 | 19,448 | 12,068 | ||||||||||||||
Other income (expense): | |||||||||||||||||||
Interest expense | (570 | ) | (3,321 | ) | (3,087 | ) | (3,177 | ) | (3 | ) | |||||||||
Other income (expense), net | (969 | ) | (1,409 | ) | (159 | ) | 384 | (912 | ) | ||||||||||
Total other income (expense) | (1,539 | ) | (4,730 | ) | (3,246 | ) | (2,793 | ) | (915 | ) | |||||||||
Income before income taxes | 2,910 | 8,684 | 10,653 | 16,655 | 11,153 | ||||||||||||||
Income tax expense | (1,302 | ) | (2,578 | ) | (3,528 | ) | (5,857 | ) | (3,699 | ) | |||||||||
Net income | $ | 1,608 | $ | 6,106 | $ | 7,125 | $ | 10,798 | $ | 7,454 | |||||||||
Net income per share: | |||||||||||||||||||
Basic | $ | 0.12 | $ | 0.44 | $ | 0.51 | $ | 0.71 | $ | 0.46 | |||||||||
Diluted | $ | 0.11 | $ | 0.42 | $ | 0.50 | $ | 0.68 | $ | 0.42 | |||||||||
Weighed average shares outstanding: | |||||||||||||||||||
Basic | 13,881 | 13,730 | 13,899 | 15,113 | 16,039 | ||||||||||||||
Diluted | 14,118 | 14,531 | 14,150 | 15,943 | 17,555 | ||||||||||||||
As of June 30, | |||||||||||||||||||
2017 | 2016 | 2015 | 2014 | 2013 | |||||||||||||||
(In thousands) | (As revised) | (As revised) | (As revised) | (As revised) | |||||||||||||||
Balance Sheet Data: | |||||||||||||||||||
Cash and cash equivalents | $ | 11,458 | $ | 7,883 | $ | 13,905 | $ | 20,387 | $ | 26,299 | |||||||||
Working capital | 12,191 | 12,484 | 3,259 | 16,414 | 25,211 | ||||||||||||||
Total assets | 45,249 | 50,855 | 40,065 | 51,826 | 55,477 | ||||||||||||||
Current liabilities | 23,355 | 30,628 | 27,663 | 23,539 | 20,723 | ||||||||||||||
Long-term debt, net of unamortized discount | 5,440 | 7,409 | 8,533 | 23,720 | — | ||||||||||||||
Total liabilities | 30,722 | 40,206 | 38,259 | 49,493 | 21,696 | ||||||||||||||
Total stockholders' equity | 14,527 | 10,649 | 1,806 | 2,333 | 33,781 | ||||||||||||||
ITEM 7 — MANAGEMENT’S DISCUSSION AND ANALYSIS OF FINANCIAL CONDITION AND RESULTS OF OPERATIONS
You should read the following discussion and analysis in connection with our financial statements and related notes beginning on page F-1 following Part III of this report.
Overview
We are a company focused on bio-hacking the aging code through nutrigenomics, the study of how nutrition and naturally occurring compounds affect human genes. We are dedicated to helping people achieve their health, wellness and financial independence goals. We provide quality, scientifically validated products and a financially rewarding direct sales business opportunity to preferred customers, retail customers and independent distributors who seek a healthy lifestyle and financial freedom. We engage in the identification, research, development and distribution of advanced nutraceutical dietary supplements and skin care products. We currently sell our products to preferred customers, retail customers and independent distributors in two geographic regions that we have classified as the Americas region and the Asia/Pacific & Europe region.
34
Our revenue depends on the number and productivity of our independent distributors and the number of our retail and preferred customers. When we are successful in attracting and retaining independent distributors and preferred customers, it is largely because of:
• | Our scientifically-validated products, including our Protandim® product line, TrueScience® anti-aging skin care line, Petandim™ for Dogs, Axio® Smart Energy Drink mixes, and PhysIQ™ Smart Weight Management System; |
• | Our compensation plan and other sales initiatives; and |
• | Our delivery of superior customer service. |
As a result, it is vital to our success that we leverage our product development resources to develop and introduce compelling and innovative products and provide opportunities for our independent distributors to sell these products in a variety of markets.
We have begun selling our products in and attracting new independent distributors and preferred customers in several new markets since the beginning of our direct selling activities in 2009, including Japan, Hong Kong, Australia, Canada, Mexico, Thailand, the United Kingdom, the Netherlands and Germany, as of September 2017. In addition, we expect to expand into China in the near term through a new e-commerce business model. Entering a new market requires a considerable amount of time, resources and continued support. If we are unable to properly support an existing or new market, our revenue growth may be negatively impacted.
Revision of Previously Issued Financial Statements for Correction of Immaterial Error
As discussed in the explanatory note and in Note 2 to our consolidated financial statements, we revised our prior period consolidated financial statements to correct immaterial errors related to our income tax provisions during these periods.
Our Products
Our products are the Protandim® product line, the TrueScience® anti-aging skin care line, Axio® Smart Energy Drink mixes, PhysIQ™ Smart Weight Management System, and Petandim™ for Dogs. The Protandim® product line includes Protandim® NRF1 and Nrf2 Synergizers™. The Protandim® NRF1 Synergizer is formulated to increase cellular energy and performance by boosting mitochondria production to improve cellular repair and slow cellular aging. The Protandim® Nrf2 Synergizer™ contains a proprietary blend of ingredients and has been shown to combat oxidative stress and enhance energy production by increasing the body’s natural antioxidant protection at the genetic level, inducing the production of naturally-occurring protective antioxidant enzymes including superoxide dismutase, catalase, and glutathione synthase. Our TrueScience® anti-aging skin care line includes TrueScience® Facial Cleanser, TrueScience® Perfecting Lotion, TrueScience® Eye Serum, TrueScience® Anti-Aging Cream and TrueScience® Micro-Lift Serum. Axio® is our line of Smart Energy Drink mixes formulated to promote alertness and support mental performance. Petandim™ for Dogs is a supplement specially formulated to combat oxidative stress in dogs through Nrf2 activation. PhysIQ™ is our Smart Weight Management System which includes PhysIQ™ Fat Burn, PhysIQ™ ProBio, PhysIQ™ Cleanse and PhysIQ™ Protein Shake mix, all formulated to aid in weight management. The following table shows revenues by major product line for the years ended June 30, 2017, 2016 and 2015.
For the years ended June 30, | ||||||||||||||||||||
2017 | 2016 | 2015 | ||||||||||||||||||
Protandim®product line | $ | 130,873 | 65.6 | % | $ | 128,019 | 62.0 | % | $ | 120,967 | 63.6 | % | ||||||||
TrueScience® product line | 24,440 | 12.3 | % | 32,914 | 15.9 | % | 38,287 | 20.1 | % | |||||||||||
Other | 44,176 | 22.1 | % | 45,607 | 22.1 | % | 31,082 | 16.3 | % | |||||||||||
Total | $ | 199,489 | 100.0 | % | $ | 206,540 | 100.0 | % | $ | 190,336 | 100.0 | % | ||||||||
The Company's revenues are largely attributed to two product lines, Protandim® and TrueScience®, which each accounted for more than 10% of total revenues for each of the years ended June 30, 2017, 2016 and 2015. On a combined basis, these products represent approximately 77.9%, 77.9% and 83.7% of our worldwide net revenues for the years ended June 30, 2017, 2016 and 2015, respectively.
We currently have additional products in development. Any delays or difficulties in introducing compelling products or attractive initiatives or tools into our markets may have a negative impact on our revenue and our ability to attract new independent distributors, preferred customers and retail customers.
35
Customers
Because we utilize a direct selling model for the distribution of our products, the success and growth of our business is primarily based on the effectiveness of our independent distributors in selling our products and on our ability to attract new and retain existing independent distributors. Changes in our product sales are typically the result of variations in product sales volume relating to fluctuations in the number of active independent distributors and preferred customers purchasing our products. The number of active independent distributors and preferred customers is, therefore, used by management as a key non-financial measure.
The following tables summarize the changes in our active customer base by geographic region. These numbers have been rounded to the nearest thousand as of the dates indicated. For purposes of this report, we only count as active customers those independent distributors and preferred customers who have purchased from us at any time during the most recent three-month period, either for personal use or for resale.
Active Preferred Customers By Region | |||||||||||||||||
As of June 30, 2017 | As of June 30, 2016 | Change from Prior Year | % Change | ||||||||||||||
Americas | 90,000 | 80.4 | % | 95,000 | 81.2 | % | (5,000 | ) | (5.3 | )% | |||||||
Asia/Pacific & Europe | 22,000 | 19.6 | % | 22,000 | 18.8 | % | — | — | % | ||||||||
112,000 | 100.0 | % | 117,000 | 100.0 | % | (5,000 | ) | (4.3 | )% | ||||||||
Active Independent Distributors By Region | |||||||||||||||||
As of June 30, 2017 | As of June 30, 2016 | Change from Prior Year | % Change | ||||||||||||||
Americas | 47,000 | 73.4 | % | 49,000 | 71.0 | % | (2,000 | ) | (4.1 | )% | |||||||
Asia/Pacific & Europe | 17,000 | 26.6 | % | 20,000 | 29.0 | % | (3,000 | ) | (15.0 | )% | |||||||
64,000 | 100.0 | % | 69,000 | 100.0 | % | (5,000 | ) | (7.2 | )% | ||||||||
Income Statement Presentation
We report revenue in two geographic regions and we translate revenue from each market's local currency into U.S. Dollars using weighted-average exchange rates. Revenue consists primarily of product sales, fee revenues, and shipping and handling fees, net of applicable sales discounts. Revenue is recognized at the time of shipment, which is when the passage of title and risk of loss to customers occurs. Also, reflected in revenue is a provision for product returns and allowances, which is estimated based on our historical experience. The following table sets forth net revenue information by region for the years indicated. The following table should be reviewed in connection with the tables presented under "Results of Operations" (in thousands):
For the years ended June 30, | ||||||||||||||||||||
2017 | 2016 | 2015 | ||||||||||||||||||
Americas | $ | 150,841 | 75.6 | % | $ | 158,291 | 76.6 | % | $ | 138,118 | 72.6 | % | ||||||||
Asia/Pacific & Europe | 48,648 | 24.4 | % | 48,249 | 23.4 | % | 52,218 | 27.4 | % | |||||||||||
Total | $ | 199,489 | 100.0 | % | $ | 206,540 | 100.0 | % | $ | 190,336 | 100.0 | % | ||||||||
Cost of sales primarily consists of costs of products purchased from and manufactured by third-party vendors, costs of adjustments to inventory carrying value, and costs of marketing materials which we sell to our distributor sales force, as well as freight, duties and taxes that are associated with the import and export of our products. As our international sales increase as a percentage of total revenue, cost of sales as a percentage of revenue likely will increase as a result of additional duties, freight, and other factors, such as changes in currency exchange rates.
Commissions and incentives expenses are our most significant expenses and are classified as operating expenses. Commissions and incentives expenses include sales commissions paid to our independent distributors, special incentives, costs for incentive trips and other rewards. Commissions and incentives expenses do not include any amounts we pay to our independent distributors for personal purchases. Commissions paid to independent distributors on personal purchases are considered a sales discount and are reported as a reduction to our net revenue. Our global sales compensation plan, which we employ in all our markets, is an important factor in our ability to attract and retain our independent distributors. Under our
36
global sales compensation plan, independent distributors can earn commissions for product sales to their preferred customers as well as the product sales made through the sales networks they have developed and trained. We do not pay commissions on sales materials, which are sold to our independent distributors. Commissions and incentives expenses, as a percentage of revenue, may increase in connection with limited-time offers due to growth in the number of independent distributors qualifying for increased sales compensation and promotional incentives. From time to time, we make modifications and enhancements to our global sales compensation plan in an effort to help motivate our sales force and develop leadership characteristics, which can have an impact on commissions and incentives expenses.
Selling, general and administrative expenses include wages and benefits, marketing and event costs, professional fees, rents and utilities, depreciation and amortization, research and development, travel costs, and other operating expenses. Wages and benefits represent the largest component of selling, general and administrative expenses. Marketing and event costs include costs of distributor conventions and events held in various markets worldwide, which we expense in the period in which they are incurred. Marketing and event costs also include expenses associated with our sponsorship of the Major League Soccer team, Real Salt Lake.
Sales to customers outside the United States are transacted in the respective local currencies and are translated to U.S. Dollars at weighted-average currency exchange rates for each monthly accounting period to which they relate. Consequently, our net sales and earnings are affected by changes in currency exchange rates. In general, sales and gross profit are affected positively by a weakening U.S. Dollar and negatively by a strengthening U.S. Dollar. Currency fluctuations, however, have the opposite effect on our commissions paid to independent distributors and selling, and general and administrative expenses. In our revenue discussions that follow, we approximate the impact of currency fluctuations on revenue by translating current year revenue at the average exchange rates in effect during the comparable prior year periods.
Results of Operations
For the fiscal years ended June 30, 2017, 2016 and 2015, we generated net revenues of $199.5 million, $206.5 million and $190.3 million, respectively, recognized operating profit of $4.4 million, $13.4 million and $13.9 million, respectively, and recognized net income of $1.6 million, $6.1 million and $7.1 million, respectively.
The following table presents certain consolidated earnings data as a percentage of net revenue for the years indicated:
For the years ended June 30, | ||||||||
2017 | 2016 | 2015 | ||||||
(As revised) | (As revised) | |||||||
Revenue, net | 100.0 | % | 100.0 | % | 100.0 | % | ||
Cost of sales | 16.8 | 16.4 | 14.7 | |||||
Gross profit | 83.2 | 83.6 | 85.3 | |||||
Operating expenses: | ||||||||
Commissions and incentives | 48.5 | 49.9 | 47.8 | |||||
Selling, general and administrative | 32.5 | 27.1 | 30.1 | |||||
Total operating expenses | 81.0 | 77.0 | 77.9 | |||||
Operating income | 2.2 | 6.6 | 7.4 | |||||
Other expense: | ||||||||
Interest expense | (0.3 | ) | (1.6 | ) | (1.6 | ) | ||
Other expense, net | (0.5 | ) | (0.7 | ) | (0.1 | ) | ||
Total other expense | (0.8 | ) | (2.3 | ) | (1.7 | ) | ||
Income before income taxes | 1.4 | 4.3 | 5.7 | |||||
Income tax expense | (0.7 | ) | (1.2 | ) | (1.9 | ) | ||
Net income | 0.7 | % | 3.1 | % | 3.8 | % | ||
Comparison of Fiscal Years Ended June 30, 2017 and 2016
Revenue, net. We generated net revenue of $199.5 million and $206.5 million during the years ended June 30, 2017 and 2016, respectively. The overall decrease was the result of a decrease in the Americas region, offset by a slight increase in the Asia/Pacific & Europe region. Foreign currency fluctuations positively impacted our net revenue $2.4 million or 1.2%, which is related primarily to our Asia/Pacific & Europe region. The overall decrease in sales of $7.0 million in fiscal 2017 primarily was due to decreases in revenue in our United States and Hong Kong markets. During fiscal 2017, we took steps, following the completion of the independent review conducted by the audit committee of our board of directors, to help ensure that our
37
products are not distributed or sold into countries without complying with applicable customs, tax and other regulatory requirements and to appropriately verify the residency of individuals who want to become our independent distributors. During the years ended June 30, 2017 and 2016, we estimate that approximately $3.0 million and $17.3 million in net revenue, respectively, related to sales of our products to independent distributors who may have carried or shipped such products into countries in which our products are not registered or that otherwise impose stringent restrictions on our direct selling model.
Americas. The following table sets forth revenue for the years ended June 30, 2017 and 2016 for the Americas region (in thousands):
For the years ended June 30, | ||||||||||
2017 | 2016 | % change | ||||||||
United States | $ | 144,842 | $ | 152,830 | (5.2 | )% | ||||
Other | 5,999 | 5,461 | 9.9 | % | ||||||
Americas Total | $ | 150,841 | $ | 158,291 | (4.7 | )% | ||||
Revenue in the Americas region for the fiscal year ended June 30, 2017 decreased $7.5 million, or 4.7%, compared to the prior year. The decrease in revenue during the year ended June 30, 2017 is due to a decrease in the number of active distributors of 4.1% and a decrease in the number of preferred customers of 5.3%. The more restrictive policies that we implemented in connection with the audit committee review as discussed above also contributed to the decline in revenue.
Asia/Pacific & Europe. The following table sets forth revenue for the years ended June 30, 2017 and 2016 for the Asia/Pacific & Europe region and its principal markets (in thousands):
For the years ended June 30, | ||||||||||
2017 | 2016 | % change | ||||||||
Japan | $ | 39,390 | $ | 36,343 | 8.4 | % | ||||
Hong Kong | 3,852 | 7,964 | (51.6 | )% | ||||||
Other | 5,406 | 3,942 | 37.1 | % | ||||||
Asia/Pacific & Europe Total | $ | 48,648 | $ | 48,249 | 0.8 | % | ||||
Revenue in the region for the year ended June 30, 2017 was positively impacted approximately $2.5 million, or 5.3%, by foreign currency exchange rate fluctuations.
Local currency revenue in Japan increased 1.3% in fiscal 2017 compared to fiscal 2016. During the year ended June 30, 2017 the Japanese yen, on average, continued to strengthen against the U.S. Dollar, positively impacting our revenue in this market by $2.5 million or 6.9%. The more restrictive policies that we implemented in connection with the audit committee review as disclosed previously contributed to the decline in revenue in Hong Kong.
Our sales and marketing efforts continue to be directed toward building our worldwide sales. We expect increased revenue in the Americas region as we focus on our growth initiatives, specifically the development and expansion of new distributor tools, training and technology and the continued scientific research and development of new products. During fiscal 2016, we held cyber launches for our PhysIQ™ Smart Weight Management System and the Protandim® NRF1 synergizer, both of which expanded our product offerings. We generated increased revenue in fiscal 2017 from the sale of these products and we expect further increased revenues from these products in the future. We expect revenue in the Asia/Pacific and Europe region to increase moderately as we focus on strengthening our sales and marketing efforts, including the global expansion of our product lines, the strengthening of our international management team, creating alignment among all of our markets and expanding our geographic reach while seeking to ensure that our products are not distributed or sold into countries without complying with applicable customs, duties and other regulatory requirements.
Gross Margin. Cost of sales were $33.5 million for the year ended June 30, 2017, and $33.9 million for the year ended June 30, 2016, resulting in a gross margin of $166.0 million, or 83.2%, and $172.6 million, or 83.6%, respectively. The decrease in gross margin as a percent of revenues in fiscal 2017 relative to fiscal 2016 was primarily due to increased costs associated with the obsolescence, storage, handling and shipment of inventory. We expect the gross margin percentage to be in the 83-85% range for the foreseeable future based on our expected inventory, manufacturing costs and product sales mix. Economic conditions and changes in the supply of raw materials, new products with differing raw material cost basis, and additional manufacturing process costs could negatively impact our gross margins in the future.
38
Operating Expenses. Total operating expenses for the year ended June 30, 2017 were $161.6 million as compared to operating expenses of $159.2 million for the year ended June 30, 2016. Operating expenses consist of commissions and incentives expenses and selling, general and administrative expenses. Operating expenses as a percentage of revenue increased to 81.0% for the year ended June 30, 2017 from 77.0% for the year ended June 30, 2016.
Commissions and Incentives. Commissions and incentives expenses for the fiscal year ended June 30, 2017 were $96.7 million or 48.5% of revenue compared to $103.1 million or 49.9% of revenue for the fiscal year ended June 30, 2016. The decrease in expense of $6.5 million in fiscal 2017 was due primarily to the overall decrease in sales. As a percentage of revenue, commissions and incentives expenses decreased by 1.4% in fiscal 2017. The decrease was primarily driven by refinements made to our commission and inventive programs during fiscal 2017 to align the programs with current growth and expansion initiatives. We expect commissions and incentives expenses to remain relatively stable as a percentage of net sales, with some fluctuations caused by changes to compensation and incentive programs and initiatives.
Selling, General and Administrative. Selling, general and administrative expenses for the year ended June 30, 2017 were $64.9 million compared to $56.1 million for the fiscal year ended June 30, 2016. The increase of $8.8 million was primarily due to increased legal and accounting expenses associated with the independent review conducted by the Audit Committee, which was completed during the quarter ended December 31, 2016. Additionally, expenses increased due to increased event expenses and increased expenses associated with employee salaries, benefits, stock compensation and travel as a result of executive turnover and increased head count compared to the prior year period. We expect selling, general and administrative expenses, as a percent of revenue, to remain relatively consistent as we continue to refine our strategic initiatives and coordinate our spending with sales trends and geographic expansion.
Primary factors that may cause our selling, general and administrative expenses to fluctuate in the future include changes in the number of employees, the timing and number of events we hold, marketing and branding initiatives and costs related to legal issues, as they arise. A fluctuation in our stock price may also impact our share-based compensation expense recorded for liability classified awards and equity awards made in future years.
Other Expense, Net. We recognized other expense for the year ended June 30, 2017 of $1.5 million as compared to $4.7 million for the year ended June 30, 2016. The decrease of $3.2 million was due to a decrease of $2.8 million in interest expense related to the write-off of debt transaction costs pursuant to the debt refinance completed during the prior year and a decrease of $0.4 million in other expenses related to a on disposal of fixed assets recorded during fiscal 2016 partially offset by write-off of intangible assets during fiscal 2017.
The following table sets forth interest expense for the years ended June 30, 2017 and 2016 (in thousands):
For the years ended June 30, | |||||||
2017 | 2016 | ||||||
Contractual interest expense: | |||||||
October 2013 Term Loan | $ | — | $ | 1,216 | |||
March 2016 Term Loan | 439 | 126 | |||||
Amortization of deferred financing fees: | |||||||
October 2013 Term Loan | — | 1,098 | |||||
March 2016 Term Loan | 12 | 3 | |||||
Amortization of debt discount: | |||||||
October 2013 Term Loan | — | 854 | |||||
March 2016 Term Loan | 19 | 5 | |||||
Other | 100 | 19 | |||||
Total interest expense | $ | 570 | $ | 3,321 | |||
Income Tax Expense. Our income tax expense for the year ended June 30, 2017 was $1.3 million as compared to income tax expense of $2.6 million for the year ended June 30, 2016. Our provision for income taxes for the year ended June 30, 2017 consisted primarily of federal, state, and foreign tax on anticipated fiscal 2017 income which was partially offset by tax benefits related to a deduction for domestic production activities and benefits related to foreign tax rate differences as the Company established a permanent reinvestment assertion during fiscal 2016. We expect our income tax expense to increase as our pre-tax income increases, and we expect our effective rate to fluctuate in future periods based on the impact of permanent items in relation to pre-tax income.
39
Net Income. As a result of the foregoing factors, net income for the year ended June 30, 2017 decreased to $1.6 million compared to $6.1 million for the year ended June 30, 2016.
Comparison of Fiscal Years Ended June 30, 2016 and 2015
Revenue, net. We generated net revenue of $206.5 million and $190.3 million during the years ended June 30, 2016 and 2015, respectively. The overall increase included an increase in the Americas region partially offset by a decrease in the Asia/Pacific & Europe region. Foreign currency fluctuations negatively impacted our net revenue $1.8 million or 1.0%, which is related primarily to our Asia/Pacific & Europe region. The overall increase in sales of $16.2 million in fiscal 2016 was due increased sales in the Americas region as a result of new product launches and an increase in active distributors during the year. In the years ended June 30, 2016 and 2015, we estimate that approximately $17.3 million and $6.7 million in net revenue, respectively, related to sales of our products to independent distributors who may have carried or shipped such products into countries in which our products are not registered or that otherwise impose stringent restrictions on our direct selling model.
Americas. The following table sets forth revenue for the years ended June 30, 2016 and 2015 for the Americas region (in thousands):
For the years ended June 30, | ||||||||||
2016 | 2015 | % change | ||||||||
United States | $ | 152,830 | $ | 132,831 | 15.1 | % | ||||
Other | 5,461 | 5,287 | 3.3 | % | ||||||
Americas Total | $ | 158,291 | $ | 138,118 | 14.6 | % | ||||
Revenue in the Americas region for the year ended June 30, 2016 increased $20.2 million or 14.6%. The increase in revenue during the year ended June 30, 2016 is due to an increase in the number of active distributors of 11.4% and higher volume of product sales related to the launch of the PhysIQ™ Smart Weight Management System line of products and the introduction of our new Protandim® NRK1 synergizer.
Asia/Pacific & Europe. The following table sets forth revenue for the years ended June 30, 2016 and 2015 for the Asia/Pacific & Europe region and its principal markets (in thousands):
For the years ended June 30, | ||||||||||
2016 | 2015 | % change | ||||||||
Japan | $ | 36,343 | $ | 41,428 | (12.3 | )% | ||||
Hong Kong | 7,964 | 5,963 | 33.6 | % | ||||||
Other | 3,942 | 4,827 | (18.3 | )% | ||||||
Asia/Pacific & Europe Total | $ | 48,249 | $ | 52,218 | (7.6 | )% | ||||
Revenue in the region for the year ended June 30, 2016 was negatively impacted approximately $1.1 million, or 2.1%, by foreign currency exchange rate fluctuations.
Local currency revenue in Japan decreased 10.3% in fiscal 2016 compared to fiscal 2015. During the year ended June 30, 2016 the Japanese yen, on average, weakened against the U.S. Dollar, which negatively impacting our revenue in this market by $0.7 million or 1.8%. In addition to the negative impact of foreign currency rate fluctuations, product sales volume decreased in Japan, Australia and the Philippines. The negative impact of foreign currency rate fluctuations and the decrease in product sales was partially offset by an increase in product sales in Hong Kong and Thailand, as well as increases associated with the launch of the United Kingdom and Netherlands during the year.
Gross Margin. Cost of sales were $33.9 million for the year ended June 30, 2016, and $28.0 million for the year ended June 30, 2015, resulting in a gross margin of $172.6 million, or 83.6%, and $162.3 million, or 85.3%, respectively. The decrease in gross margin as a percentage of revenues was primarily due to product recall related insurance benefits received during fiscal 2015 of $2.0 million, changes to our product sales mix and increased costs associated with the shipment, storage, and quality testing of inventory.
Operating Expenses. Total operating expenses for the year ended June 30, 2016 were $159.2 million as compared to operating expenses of $148.4 million for the year ended June 30, 2015. Operating expenses consist of commissions and
40
incentives expenses and selling, general and administrative expenses. Operating expenses as a percentage of revenue decreased slightly to 77.0% for the year ended June 30, 2016 from 77.9% for the year ended June 30, 2015.
Commissions and Incentives. Commissions and incentives expenses for the year ended June 30, 2016 were $103.1 million or 49.9% compared to $91.1 million or 47.8% for the fiscal year ended June 30, 2015. The increase in expense of $12.0 million in fiscal year 2016 was due primarily to the overall increase in sales. As a percentage of revenue, commissions and incentives expenses increased by 2.1% in fiscal year 2016. The increase is due to increased incentives and promotional expenses incurred as we instituted several new programs during the year to drive sales growth, enhance international market expansion and attract new leaders.
Selling, General and Administrative. Our selling, general and administrative expenses for the year ended June 30, 2016 were $56.1 million compared to $57.4 million for the fiscal year ended June 30, 2015. The decrease of $1.3 million was primarily due to decreased employment related expenses associated with contract labor and executive recruiting expenses, as well as decreased event expenses due to fewer events held during fiscal year 2016. These decreases were partially offset due to increases in stock compensation expenses and marketing expenses associated with new promotions and marketing initiatives.
Other Expense, Net. We recognized other expense for the year ended June 30, 2016 of $4.7 million as compared to $3.2 million for the year ended June 30, 2015. Other expense for the year ended June 30, 2016 consisted primarily of interest expense of $3.3 million, which includes the write-off of debt transaction costs pursuant to the debt refinance completed during fiscal 2016, the write-off of previously capitalized software development costs of $1.2 million and the impact of changes in foreign currency exchange rates.
Income Tax Expense. Our income tax expense for the year ended June 30, 2016 was $2.6 million as compared to income tax expense of $3.5 million for the year ended June 30, 2015. Our provision for income taxes for the year ended June 30, 2016 consisted primarily of federal, state, and foreign tax on anticipated fiscal 2016 income which was partially offset by tax benefits related to research and development credits, a deduction for domestic production activities and benefits related to foreign tax rate differences as the Company established a permanent reinvestment assertion during fiscal 2016.
Net Income. As a result of the foregoing factors, net income for the year ended June 30, 2016 decreased to $6.1 million compared to $7.1 million for the year ended June 30, 2015.
Liquidity and Capital Resources
Liquidity
Our primary liquidity and capital resource requirements are to service our debt and finance the cost of our planned operating expenses and working capital (principally inventory purchases), as well as capital expenditures. We have generally relied on cash flow from operations to fund operating activities and we have, at times, incurred long-term debt in order to fund stock repurchases and strategic transactions.
At June 30, 2017, our cash and cash equivalents were $11.5 million. This represented an increase of $3.6 million from the $7.9 million in cash and cash equivalents as of June 30, 2016. During the fiscal year ended June 30, 2017, our net cash provided by operating activities was $6.6 million as compared to net cash provided by operating activities of $6.0 million during the fiscal year ended June 30, 2016. The increase in cash provided by operating activities during the fiscal year ended June 30, 2017 is primarily due to decreased inventory purchases, partially offset by a decreases in net income and accounts payable.
During the fiscal year ended June 30, 2017, our net cash used in investing activities was $1.1 million, due to capital expenditures. During the fiscal year ended June 30, 2016, our net cash used in investing activities was $0.6 million, also due to capital expenditures.
Cash used in financing activities during the fiscal year ended June 30, 2017 was $2.0 million, compared to $11.7 million during the fiscal year ended June 30, 2016. Cash used in financing activities during the fiscal year ended June 30, 2017 included total principal payments on the Company's outstanding term debt of $2.0 million. Cash used in financing activities during the fiscal year ended June 30, 2016 included total principal payments on the Company's outstanding term debt of $22.1 million, partially offset by proceeds from the March 2016 Term Loan of $10.0 million associated with the refinancing of the October 2013 Term Loan and proceeds from the exercise of stock options.
At June 30, 2017 and 2016, the total amount of our foreign subsidiary cash was $6.6 million and $5.1 million, respectively. For earnings considered to be indefinitely reinvested, we have not accrued taxes. If we were to remit the cash and cash equivalents from our foreign subsidiaries to our U.S. consolidated group for the purpose of repatriation of undistributed earnings, we would need to accrue and pay taxes. As of June 30, 2017, our U.S. consolidated group had approximately $2.4 million of permanently reinvested unremitted earnings from our subsidiaries, and if these earnings were remitted, the impact of
41
any tax consequences on our overall liquidity position would not be material. We do not have any plans to repatriate these unremitted earnings to our parent; therefore, we do not have any liquidity concerns relating to these unremitted earnings and related cash and cash equivalents.
At June 30, 2017, we had working capital (current assets minus current liabilities) of $12.2 million compared to working capital of $12.5 million at June 30, 2016. The decrease in working capital was due primarily to a decrease in inventory, offset by an increase in cash and cash equivalents and a decrease in accounts payable. We believe that our cash and cash equivalents balances and our ongoing cash flow from operations will be sufficient to satisfy our cash requirements for at least the next 12 months. The majority of our historical expenses have been variable in nature and, as such, a potential reduction in the level of revenue would reduce our cash flow needs. In the event that our current cash balances and future cash flow from operations are not sufficient to meet our obligations or strategic needs, we would consider raising additional funds, which may not be available on terms that are acceptable to us, or at all. Our credit facility, however, contains covenants that restrict our ability to raise additional funds in the debt or equity markets and repurchase our equity securities without prior approval from the lender. Additionally, we would consider realigning our strategic plans including a reduction in capital spending.
Capital Resources
On October 18, 2013, we entered into a financing agreement providing for a term loan facility in an aggregate principal amount of $47 million (the “October 2013 Term Loan”) and a delayed draw term loan facility in an aggregate principal amount not to exceed $20 million (the “October 2013 Delayed Draw Term Loan”). The October 2013 Delayed Draw Term Loan was available for borrowing in specified minimum amounts from time to time beginning after the effective date until October 18, 2014. We did not borrow any amounts under the October 2013 Delayed Draw Term Loan.
On May 1, 2015, we entered into an Amendment No. 1 to October 2013 Term Loan ("Amendment No. 1"). Amendment No. 1 revised the covenants relating to minimum consolidated EBITDA (as defined in October 2013 Term Loan) for the four consecutive fiscal quarters ending March 31, 2015 and June 30, 2015 from $20.6 million and $21.3 million, respectively, to $17.0 million for each quarter end. Amendment No. 1 also revised the minimum unrestricted cash and cash equivalents that we were required to hold from $10.0 million to $8.0 million for the reporting periods ended March 31, 2015 and June 30, 2015. In addition, Amendment No. 1 required that we make certain accelerated principal payments on the October 2013 Term Loan totaling $4.5 million during the fourth quarter of fiscal year 2015.
On August 27, 2015, we entered into an Amendment No. 2 to October 2013 Term Loan ("Amendment No. 2" and collectively, with the October 2013 Term Loan, as previously amended by Amendment No. 1, the "October 2013 Credit Facility"). Amendment No. 2 revised the covenants related to minimum consolidated EBITDA (as defined in the amended October 2013 Term Loan) for the four consecutive fiscal quarters ending September 30, 2015, December 31, 2015, March 31, 2016 and June 30, 2016 from $22.2 million, $23.1 million, $24.4 million and $25.6 million, respectively, to $14.5 million, $15.0 million, $17.0 million and $17.5 million, respectively. In addition, Amendment No. 2 required that we make additional monthly accelerated principal payments on the October 2013 Term Loan in the amount of $0.5 million commencing on October 15, 2015 and continuing until the October 2013 Term Loan was paid in full. Amendment No. 2 also required that we make additional accelerated payments at the end of each fiscal quarter in the amount of all unrestricted cash on hand as of the close of business on the last day of the quarter in excess of $12.5 million. On March 30, 2016, we repaid the full amount outstanding under the October 2013 Term Loan and terminated the October 2013 Credit Facility.
On March 30, 2016, we entered into a Loan Agreement (the "March 2016 Loan Agreement") to refinance our outstanding debt under the October 2013 Term Loan. In connection with the March 2016 Loan Agreement and on the same date, we entered into a Security Agreement (the "March 2016 Security Agreement"). The March 2016 Loan Agreement provides for a term loan in an aggregate principal amount of $10.0 million (the "March 2016 Term Loan") and a revolving loan facility in an aggregate principal amount not to exceed $2.0 million (the "March 2016 Revolving Loan," and collectively with the March 2016 Term Loan, the March 2016 Loan Agreement and the March 2016 Security Agreement, the "March 2016 Credit Facility").
The principal amount of the March 2016 Term Loan is payable in consecutive quarterly installments in the amount of $0.5 million plus accrued interest beginning with the fiscal quarter ended June 30, 2016 and maturing on March 30, 2019 (the "Maturity Date"). The March 2016 Term Loan bears interest at a fixed rate of 4.93%. If we borrow under the March 2016 Revolving Loan, interest will be payable quarterly in arrears on the last day of each fiscal quarter at a variable rate equal to the 30 day LIBOR rate plus 3.5%.
Loans outstanding under the March 2016 Credit Facility may be prepaid in whole or in part at any time without premium or penalty. In addition, if, at any time, the aggregate principal amount outstanding under the March 2016 Revolving Loan exceeds $2.0 million, we must prepay an amount equal to such excess. Any principal amount of the March 2016 Term Loan which is prepaid or repaid may not be re-borrowed.
42
The March 2016 Credit Facility contains customary covenants, including affirmative and negative covenants that, among other things, restrict our ability to create certain types of liens, incur additional indebtedness, declare or pay dividends on or redeem capital stock, make other payments to holders of our equity interests, make certain investments, purchase or otherwise acquire all or substantially all the assets or equity interests of other companies, sell assets or enter into consolidations, mergers or transfers of all or any substantial part of our assets.
The March 2016 Credit Facility also contains various financial covenants that require us to maintain certain consolidated minimum tangible net worth, minimum consolidated working capital amounts, and certain consolidated debt to EBITDA and fixed charge coverage ratios. Specifically, we must:
• | Maintain a minimum fixed charge coverage ratio (as defined in the March 2016 Loan Agreement) of at least 1.50 to 1.00 at the end of each fiscal quarter, measured on a trailing twelve month basis; |
• | Maintain minimum consolidated working capital (as defined in the March 2016 Loan Agreement) at the end of each fiscal quarter of at least $5.0 million; |
• | Maintain a ratio of funded debt to EBITDA (as defined in the March 2016 Loan Agreement) of not greater than 2.00 to 1.00 at the end of each quarter, measured on a trailing twelve month basis; and |
• | Have a tangible net worth (as defined in the March 2016 Loan Agreement) of at least $4.0 million as of June 30, 2016 and maintain at least that minimum tangible net worth thereafter, measured annually at the end of each subsequent fiscal year. |
As of June 30, 2017, we were in compliance with all applicable financial covenants under the March 2016 Credit Facility; provided, however that on October 24, 2016, we were granted a waiver and extension to the covenants requiring us to provide the lender with audited financial statements for the Company’s 2016 fiscal year on or before October 28, 2016. Under the limited waiver and extension, the lender agreed to waive compliance with this requirement if we delivered such audited financial statements prior to December 31, 2016. See Note 6 to our Consolidated Financial Statements contained within this Annual Report on Form 10-K for a discussion of the limited waiver and extension. Management anticipates that in the normal course of operations we will be in compliance with the financial covenants during the ensuing year.
Commitments and Obligations
The following table summarizes our contractual payment obligations and commitments as of June 30, 2017 (in thousands):
Payments due by period | |||||||||||||||||||
Contractual Obligations | Total | Less than 1 year | 1-3 years | 3-5 years | Thereafter | ||||||||||||||
Long-term debt obligations | $ | 7,500 | $ | 2,000 | $ | 5,500 | $ | — | $ | — | |||||||||
Interest on long-term debt obligations | 525 | 338 | 187 | — | — | ||||||||||||||
Operating lease obligations | 12,991 | 2,610 | 6,610 | 3,771 | — | ||||||||||||||
Other operating obligations (1) | 7,188 | 7,188 | — | — | — | ||||||||||||||
Total | $ | 28,204 | $ | 12,136 | $ | 12,297 | $ | 3,771 | $ | — | |||||||||
(1) | Other operating obligations represent non-cancelable contractual obligations primarily related to marketing and sponsorship commitments, as well as purchases of inventory. |
Off-Balance Sheet Arrangements
At June 30, 2017 and 2016, we had no off-balance sheet arrangements.
Critical Accounting Policies
We prepare our financial statements in conformity with accounting principles generally accepted in the United States of America. As such, we are required to make certain estimates, judgments, and assumptions that we believe are reasonable based upon the information available. These estimates and assumptions affect the reported amounts of assets and liabilities at the date of the financial statements and the reported amounts of revenues and expenses during the periods presented. Actual results could differ from these estimates. Our significant accounting policies are described in Note 2 to our financial statements. Some of these significant accounting policies require us to make difficult, subjective, or complex judgments or estimates. We consider an accounting estimate to be critical if (1) the accounting estimate requires us to make assumptions about matters that were highly uncertain at the time the accounting estimate was made and (2) changes in the estimate that are reasonably likely to
43
occur from period to period, or use of different estimates that we reasonably could have used in the current period, would have a material impact on our financial condition or results of operations.
There are other items within our financial statements that require estimation, but are not deemed critical as defined above. Changes in estimates used in these and other items could have a material impact on our financial statements. Management has discussed the development and selection of these critical accounting estimates with our board of directors, and the audit committee has reviewed the disclosures noted below.
Allowances for Product Returns
We record allowances for product returns at the time we ship the product based on estimated return rates. Subject to some exceptions based on local regulations, customers may return unopened product to us within 30 days of purchase for a refund of the purchase price less shipping and handling. As of June 30, 2017, our shipments of products sold totaling approximately $16.1 million were subject to our return policy. In addition, we allow terminating distributors to return up to 30% of unopened, unexpired product that they purchased within the prior twelve months.
We monitor our product returns estimate on an ongoing basis and revise the allowances to reflect our experience. Our allowance for product returns was $0.4 million at June 30, 2017, compared with $0.3 million at June 30, 2016. To date, product expiration dates have not played any role in product returns, and we do not expect they will in the future as it is unlikely that we will ship product with an expiration date earlier than the latest allowable product return date.
Inventory Valuation
We value our inventory at the lower of cost or net realizable value on a first-in, first-out basis. Accordingly, we reduce our inventories for the diminution of value resulting from product obsolescence, damage or other issues affecting marketability equal to the difference between the cost of the inventory and its estimated market value. Factors utilized in the determination of estimated market value include (i) current sales data and historical return rates, (ii) estimates of future demand, (iii) competitive pricing pressures, (iv) new production introductions, (v) product expiration dates, and (vi) component and packaging obsolescence.
During the years ended June 30, 2017 and 2016, we recognized expenses of $1.3 million and $0.3 million, respectively, related to obsolete and slow-moving inventory.
Revenue Recognition
We ship the majority of our product directly to the consumer and receive substantially all payment for these sales in the form of credit card receipts. Revenue from direct product sales to customers is recognized upon shipment, which is when passage of title and risk of loss occurs.
Stock-Based Compensation
We use the fair value approach to account for stock-based compensation in accordance with current accounting guidance. We recognize compensation costs for awards with performance conditions when we conclude it is probable that the performance conditions will be achieved. We reassess the probability of vesting at each balance sheet date and adjust compensation costs based on our probability assessment. For awards with market-based performance conditions, the cost of the awards is recognized as the requisite service is rendered by the employees, regardless of when, if ever, the market-based performance conditions are satisfied.
Research and Development Costs
We expense all of our costs related to research and development activities as incurred.
Legal Accruals
We are occasionally involved in lawsuits and disputes arising in the normal course of business. Management regularly reviews all pending litigation matters in which we are involved and establishes accruals as we deem appropriate for these litigation matters when a probable loss estimate can be made. Estimated accruals require management judgment about future events. The results of lawsuits are inherently unpredictable and unfavorable resolutions could occur. As such, the amount of loss may differ from management estimates.
44
Recently Issued Accounting Standards
Refer to “Item 8. Financial Statements and Supplementary Data” and Note 2 to our consolidated financial statements included in Part IV, Item 15 of this report for discussion regarding the impact of accounting standards that were recently issued but not yet effective, on our consolidated financial statements.
ITEM 7A — QUANTITATIVE AND QUALITATIVE DISCLOSURES ABOUT MARKET RISK
We conduct business in several countries and intend to continue to grow our international operations. Net revenue, operating income, and net income are affected by fluctuations in currency exchange rates and other uncertainties in doing business and selling products in more than one currency. In addition, our operations are exposed to risks associated with changes in social, political and economic conditions inherent in international operations, including changes in the laws and policies that govern international investment in countries where we have operations, as well as, to a lesser extent, changes in U.S. laws and regulations relating to international trade and investment.
Foreign Currency Risk
During the year ended June 30, 2017, approximately 27% of our net revenue was realized outside of the United States. The local currency of each international subsidiary is generally the functional currency. All revenues and expenses are translated at weighted average exchange rates for the periods reported. Therefore, our reported revenue and earnings will be positively impacted by a weakening of the U.S. Dollar and will be negatively impacted by a strengthening of the U.S. Dollar. Currency fluctuations, however, have the opposite effect on our expenses incurred outside the U.S. Given the large portion of our business derived from Japan, any weakening of the Japanese Yen will negatively impact our reported revenue and profits, whereas a strengthening of the Japanese Yen will positively impact our reported revenue and profits. Because of the uncertainty of exchange rate fluctuations, it is difficult to predict the effect of these fluctuations on our future business, product pricing and results of operations or financial condition. Changes in various currency exchange rates affect the relative prices at which we sell our products. We regularly monitor our foreign currency risks and periodically take measures to reduce the risk of foreign exchange rate fluctuations on our operating results. Additionally, we may seek to reduce our exposure to fluctuations in foreign currency exchange rates through the use of foreign currency exchange contracts. We do not use derivative financial instruments for trading or speculative purposes. At June 30, 2017, we did not have any derivative instruments. A 10% strengthening of the U.S. Dollar compared to all of the foreign currencies in which we transact business would have resulted in a 2.4% decrease of our 2017 fiscal year revenue, in the amount of $4.9 million.
Following are the average currency exchange rates of U.S. $1 into local currency for each of our international or foreign markets:
Year ended June 30, 2017 | Year ended June 30, 2016 | ||||||||||||||||||||||
1st Quarter | 2nd Quarter | 3rd Quarter | 4th Quarter | 1st Quarter | 2nd Quarter | 3rd Quarter | 4th Quarter | ||||||||||||||||
Japan | 102.40 | 109.38 | 113.72 | 111.10 | 122.25 | 121.44 | 115.38 | 107.97 | |||||||||||||||
Australia | 1.32 | 1.34 | 1.32 | 1.33 | 1.38 | 1.39 | 1.39 | 1.34 | |||||||||||||||
Hong Kong | 7.76 | 7.76 | 7.76 | 7.79 | 7.75 | 7.75 | 7.77 | 7.76 | |||||||||||||||
Mexico | 18.76 | 19.88 | 20.32 | 18.57 | 16.42 | 16.77 | 18.04 | 18.11 | |||||||||||||||
Canada | 1.30 | 1.34 | 1.32 | 1.35 | 1.31 | 1.34 | 1.37 | 1.29 | |||||||||||||||
Thailand | 34.92 | 35.48 | 35.21 | 34.39 | 35.28 | 35.91 | 35.72 | 35.33 | |||||||||||||||
Europe | 0.90 | 0.93 | 0.94 | 0.91 | 0.90 | 0.91 | 0.91 | 0.89 | |||||||||||||||
ITEM 8 — FINANCIAL STATEMENTS AND SUPPLEMENTARY DATA
The information required by this Item 8 is set forth in the consolidated financial statements included in Part IV, Item 15 of this report and is incorporated into this Item 8 by reference.
ITEM 9 — CHANGES IN AND DISAGREEMENTS WITH ACCOUNTANTS ON ACCOUNTING AND FINANCIAL DISCLOSURE
None.
ITEM 9A — CONTROLS AND PROCEDURES
Disclosure Controls and Procedures
45
We maintain disclosure controls and procedures that are designed to ensure that information required to be disclosed in our reports filed pursuant to the Securities Exchange Act of 1934, as amended (the “Exchange Act”) is recorded, processed, summarized, and reported within the time periods specified in the SEC’s rules and forms, and that such information is accumulated and communicated to our management, including our Chief Executive Officer and Chief Financial Officer, as appropriate, to allow timely decisions regarding required disclosure. Our management, with the participation of our Chief Executive Officer and our Chief Financial Officer, has evaluated the effectiveness of our disclosure controls and procedures (as such term is defined in Rule 13a-15(e) under the Exchange Act) as of June 30, 2017. Based on this evaluation, our Chief Executive Officer and Chief Financial Officer concluded that our disclosure controls and procedures were designed and operating effectively as of June 30, 2017.
Management’s Report on Internal Control Over Financial Reporting
Our management is responsible for establishing and maintaining adequate internal control over financial reporting, as defined in Exchange Act Rules 13a-15(f) and 15d-15(f). Our system of internal control over financial reporting is designed to provide reasonable assurance to our management and Board of Directors regarding the preparation and fair presentation of our consolidated and combined financial statements for external purposes in accordance with GAAP.
Our management, under the supervision of our Chief Executive Officer and our Chief Financial Officer, assessed the effectiveness of our internal control over financial reporting as of June 30, 2017. In making this assessment, we used the framework included in Internal Control - Integrated Framework published by the Committee of Sponsoring Organizations of the Treadway Commission 2013 (COSO). Based on that evaluation, our management has concluded that internal control over financing reporting was effective as of June 30, 2017.
Remediation of Material Weakness
As we previously disclosed in Item 9A of our Annual Report on Form 10-K for the year ended June 30, 2016, the Audit Committee of our Board of Directors conducted an independent review related to the distribution of our products into countries outside the U.S. in which those products were not registered or that otherwise imposed stringent restrictions on our direct selling model, and the associated revenue and tax and other accruals associated with such sales. Based on its independent review, inadequate controls were identified and accordingly, we identified a material weakness in our internal controls over financial reporting as of the period ended June 30, 2016. To remediate the material weakness in our internal controls over financial reporting, we developed and implemented new controls that govern international business practices, country-specific policies and procedures, required trainings and control monitoring activities for each market in which we do business. We implemented changes to our systems and distributor enrollment requirements intended to control or restrict the processes used by independent distributors to purchase and carry or ship our products into countries in which those products are not registered or that otherwise impose stringent restrictions on our direct selling model. We developed appropriate country-specific policies and procedures that were designed to help control the distribution and sale of our products into countries in an effort to maintain compliance with applicable customs, tax and other regulatory requirements.
Additional steps we took to remediate the material weakness in our internal controls over financial reporting include creating market-specific policy manuals documenting the following: (i) distributor enrollment requirements by country, including the requirement of sufficient and appropriate oversight and senior management approvals for any changes to such country-specific policies; (ii) approved distributor payment and collection policies by country, including the requirement of sufficient and appropriate oversight and senior management approvals for any changes to such country-specific policies; (iii) approved shipping, order fulfillment and customs import policies by country, including the requirement of sufficient and appropriate oversight and senior management approvals for any changes to such country-specific policies; and (iv) approval requirements for transactions between us and independent distributors outside of our approved compensation plans.
In addition, as we implemented country-specific policies, we obtained international tax and legal advice from external accounting and law firms that have relevant country-specific expertise to help ensure that potential international tax and legal issues were appropriately identified and addressed. We evaluated and re-allocated personnel resources to ensure that each market has adequate resources to support our new processes and controls. We also established and conducted company-wide training programs on our new policies and controls.
Management has evaluated and tested the controls that have been implemented and, as a result of final testing of internal controls over financial reporting, concludes that the controls were in place and operating effectively to remediate the material weakness, described above, as of June 30, 2017.
Auditor’s Attestation Report on Internal Control Over Financial Reporting
46
WSRP, LLC, our independent registered public accounting firm, has audited our consolidated financial statements included in this Annual Report on Form 10-K and has issued an attestation report, included herein, on the effectiveness of our internal control over financial reporting as of June 30, 2017.
Changes in Internal Control over Financial Reporting
Except as described above, there were no changes in our internal control over financial reporting during the quarter ended June 30, 2017 that have materially affected or are reasonably likely to materially affect our internal control over financial reporting.
Inherent Limitations on Effectiveness of Controls
Our management, including our Chief Executive Officer and our Chief Financial Officer, cannot provide absolute assurance that our disclosure controls or our internal control over financial reporting will prevent or detect all error and all fraud. A control system, no matter how well designed and operated, can provide only reasonable, not absolute, assurance that the control system’s objectives will be met. The design of a control system must reflect the fact that there are resource constraints, and the benefits of controls must be considered relative to their costs. Further, because of the inherent limitations in all control systems, no evaluation of controls can provide absolute assurance that misstatements due to error or fraud will not occur or that all control issues and instances of fraud, if any, have been detected. These inherent limitations include the realities that judgments in decision-making can be faulty and that breakdowns can occur because of simple error or mistake. Controls can also be circumvented by the individual acts of some persons, by collusion of two or more people, or by management override of the controls. The design of any system of controls is based in part on certain assumptions about the likelihood of future events, and there can be no assurance that any design will succeed in achieving its stated goals under all potential future conditions. Projections of any evaluation of controls effectiveness to future periods are subject to risks. Over time, controls may become inadequate because of changes in conditions or deterioration in the degree of compliance with policies or procedures.
ITEM 9B — OTHER INFORMATION
None.
PART III
ITEM 10 — DIRECTORS, EXECUTIVE OFFICERS AND CORPORATE GOVERNANCE
The following table sets forth the names, ages and positions of our directors and executive officers as of June 30, 2017. Additional biographical information for each individual is provided in the text following the table.
Name | Age | Position with Company | ||
Mr. Darren Jensen | 48 | President, Chief Executive Officer and Director | ||
Mr. Steven R. Fife | 57 | Chief Financial Officer | ||
Mr. Ryan Goodwin | 41 | Chief Marketing Officer | ||
Mr. Courtland Pearson | 48 | Senior Vice President International | ||
Mr. Justin Rose | 49 | Chief Sales Officer | ||
Mr. Charles Wach | 55 | Chief Operating Officer | ||
Mr. Garry Mauro | 69 | Chairman, Independent Director | ||
Mr. Michael A. Beindorff | 65 | Independent Director | ||
Mr. Raymond B. Greer | 54 | Independent Director | ||
Mr. Vinayak R. Hegde | 48 | Independent Director | ||
Mr. Darwin K. Lewis | 58 | Independent Director | ||
Mr. George E. Metzger | 70 | Independent Director | ||
Mr. Richard Okumoto | 65 | Independent Director | ||
Mr. David Toole | 62 | Director | ||
Executive Officers
Each officer serves at the discretion of our board of directors and holds office until his or her successor is appointed or until his or her earlier resignation or removal. There are no family relationships among any of our executive officers and directors.
47
MR. DARREN JENSEN. Mr. Jensen was appointed as our President and Chief Executive Officer in May 2015. He was appointed to our board of directors in January 2016 by the board of directors. From June 2014 to May 2015, Mr. Jensen served as the President-Americas and from September 2012 to June 2014 as the Chief Sales Officer at Jeunesse Global, a privately held direct selling anti-aging and skin care company. Prior to joining Jeunesse Global, Mr. Jensen served from August 2011 to June 2012 as the Chief Sales Officer of Ampegy, a privately held direct selling company in the energy industry. Prior to that, he was the Executive Vice President and Corporate General Manager at Agel Enterprises, a nutritional supplements direct selling company, where he was also a Co-Founder of the Agel Cares Foundation. From 2003 to 2005, Mr. Jensen was the Director of International Business Development at USANA Inc. Mr. Jensen served as a Brand Manager at Amway Global from 1995 to 1997. Mr. Jensen began his direct selling career at Nu Skin Enterprises in Provo, where he served as an International Marketing Specialist from 1990-1995. Mr. Jensen received a bachelor of arts degree from Brigham Young University. Mr. Jensen’s more than 25 years of experience in the direct selling industry brings to our board of directors deep industry expertise as well as strong leadership in all aspects of our business.
MR. STEVEN R. FIFE. Mr. Fife was appointed as our Chief Financial Officer in March 2017. Prior to joining our company, Mr. Fife served as Chief Financial Officer for Evidera, Inc., a private equity sponsored professional services firm, from May 2014 to June 2016. Prior to joining Evidera, Inc., from October 2012 to December 2013, Mr. Fife served as Chief Financial Officer for Active Power, Inc., a publicly traded producer of kinetic energy storage systems that was later sold to Piller Power Systems Inc. In addition, from March 2011 to August 2012, Mr. Fife served as Interim Chief Financial Officer for Women’s Initiative for Self Employment, and from April 2007 to August 2010 as the Executive Vice President, Chief Financial Officer of LECG. Mr. Fife also served in a variety of financial roles for Gilead Sciences, Amkor Technologies, JDS Uniphase and Deloitte & Touche. Mr. Fife received his Bachelor of Science degree in Accounting from Brigham Young University.
MR. RYAN GOODWIN. Mr. Goodwin was appointed as our Chief Marketing Officer in November 2015. Mr. Goodwin brings more than a decade of experience building brands and marketing strategies for both direct sales companies and traditional consumer brands. In July 2013, Mr. Goodwin founded Dinng, a brand and digital brand studio, where he served as President and Creative Director. Prior to founding Dinng, in January 2003, Mr. Goodwin co-founded Struck, a full service creative agency, where he was in charge of the entire creative product as the Executive Creative Director until February 2009 after which he served as Chairman of the Board until September 2014. Mr. Goodwin earned his bachelor of fine arts degree from Brigham Young University.
MR. COURTLAND PEARSON. Mr. Pearson was appointed our Senior Vice President International in July 2016. From April 2012 until April 2016, Mr. Pearson was Vice President, Global Social Marketer Success and Regional Vice President over Asia for Modere, a manufacturer and distributor of products for personal care, health and wellness and household care. Prior to joining Modere, Mr. Pearson served as Vice President, Sales, NuSkin Japan and also served in various other positions in Asia for Nu Skin Enterprises beginning in 1998. Mr. Pearson earned a bachelor’s degree in Japanese with an emphasis in Business from Brigham Young University.
MR. JUSTIN ROSE. Mr. Rose was appointed as our Chief Sales Officer in July 2015. From December 2010 through January 2014, Mr. Rose served as the Regional Vice President Sales and from January 2014 through June 2015 as the Senior Vice President of Sales and Field Development at Shaklee Corporation, a manufacturer and distributor of natural nutritional supplements and beauty and household products. Prior to joining Shaklee Corporation, from April 2003 through December 2010, Mr. Rose was President of North America and South Pacific at Nu Skin Enterprises and prior to that he was the General Manager - North America from 2000 to 2003. Mr. Rose was Director of Business Marketing and Director of Sales at USANA Inc. from 1999 to 2000. From 1994 to 1996, Mr. Rose was Director of Marketing and Sales at Aveda. Mr. Rose began his career as Marketing Services Manager at Nu Skin Enterprises 1989 to 1994. Mr. Rose earned a bachelor’s degree in International Relations, Business Management from Brigham Young University.
MR. CHARLES WACH. Mr. Wach was appointed as our Chief Operating Officer in March 2017. Prior to joining our company, Mr. Wach served as Vice President of Operations and Supply Chain Executive for Bodybuilding.com, Inc., a global internet specialty retailer, from June 2013 to March 2017. Prior to joining Bodybuilding.com, Inc., Mr. Wach served as Director of Global Supply Chain, Materials Management for Nature’s Sunshine Products, Inc. from 2000 to 2012. Mr. Wach also served in a variety of operational roles for Nestle - Perrier Group of America Inc., H.J. Heinz Co. and Frito Lay Inc. Mr. Wach received his Master of Business Administration degree from Utah State University and his Bachelor of Science degree in Finance from Brigham Young University.
Directors
MR. GARRY MAURO. Mr. Mauro has been an independent member of our board of directors since April 2008 and has served as the chairman of the board of directors since November 2013. Mr. Mauro is currently a practicing attorney in Texas and the District of Columbia. He is also a licensed stock broker. He has worked for over 30 years at the local, state and national levels on behalf of both private and public sector entities. From 1983 to 1999, he served as Commissioner of the Texas General Land Office overseeing the management of more than 20 million acres of state land, 18,000 oil and gas wells, and the state’s
48
benefit program for Veterans. During his tenure as Commissioner, he also chaired the Veterans Land Board, the School Land Board, the Parks and Wildlife Board For Lease, the Texas Department of Corrections Board For Lease, the Permanent University Fund Board For Lease, the Coastal Coordination Council and the Texas Alternative Fuels Council and co-chaired the Sustainable Energy Development Council. He has received numerous honors and awards for his civic and philanthropic contributions in environmental, political and business arenas, including the “Man of the Year Award” from the Texas League of Women Voters and the “Rising Star of Texas Award” from Texas Business Magazine. In 1998, he was the Texas Democratic Party nominee for Governor. Mr. Mauro’s broad range of expertise brings to our board of directors experience in management and operations as well as strong leadership and oversight.
MR. MICHAEL A. BEINDORFF. Mr. Beindorff has been an independent member of our board of directors since January 2012. Mr. Beindorff brings more than 35 years of experience in general management, operations, sales and marketing with a strong track record of building and leading disciplined organizational teams, driving rapid, profitable growth and delivering results across a variety of business environments. He currently serves as Principal and President of the Far Niente Group, a management consultancy and private investment entity focused on helping clients build effective business models, strong differentiated brands, viable product lines and sustainable businesses while maximizing return on investment, a position he has held since 2008. From 2004 to 2008 he served as Chief Operating Officer of Exclusive Resorts, a private club for luxury travel experience. From 2002 to 2004 he served as Principal and President of the Greentree Group, a management consultancy focused on helping clients build strong brands and effective business models. From 1999 to 2002 he served first as President and COO and then as Chairman and Chief Executive Officer of PlanetRx.com, an internet pharmacy and on-line health portal. From 1995 to 1999 he served as Executive Vice President of Marketing, Operations and Product Management for VISA. From 1978 to 1995 he held various positions leading global advertising, marketing and brand management for The Coca-Cola Company and Rhodes Furniture. Mr. Beindorff received his Bachelor of Science in Business Administration from the University of Alabama and his Masters of Business Administration from the Gouzuietta Business School at Emory University. Mr. Beindorff's broad background building and leading organizations, and experience in building strong sales and marketing, and branding initiatives brings to our board of directors expertise in operations and oversight as well as strong leadership and initiative.
MR. RAYMOND B. GREER. Mr. Greer has been an independent member of our board of directors since February 2017. Mr. Greer has over 30 years of logistics and transportation experience. Mr. Greer has served since February 2011 as the President of BNSF Logistics, LLC, which is an international third party logistics provider and a wholly-owned subsidiary of Burlington Northern Santa Fe, LLC, a Berkshire Hathaway company. From March 2005 to January 2010, Mr. Greer served as President and Chief Executive Officer of Greatwide Logistics Services, a non-asset based logistics and transportation services company. From December 2002 to March 2005, Mr. Greer served as President and Chief Executive Officer for Newgistics, Inc., a reverse logistics company. Mr. Greer served as President of Global Network Solutions and Services for i2 Technologies, Inc., a supply chain management software and services company, from February 2002 to November 2002. Mr. Greer has also held senior management positions for Ryder and FedEx Corporation. From June 2005 to April 2007, Mr. Greer served as a director of Kitty Hawk, Inc., an air cargo company. Mr. Greer received a Bachelor of Science in Mathematics from the University of Utah and an Executive Masters in Information Systems & Telecommunications from Christian Brothers University. Mr. Greer brings to our board of directors deep experience in international logistics and supply chain management.
MR. VINAYAK R. HEGDE. Mr. Hegde has been an independent member of our board of directors since February 2017. Since October 2014, Mr. Hegde has served as the Senior Vice President and Global Chief Marketing Officer at Groupon, a company that operates online local commerce marketplaces that connect merchants to consumers by offering discounted goods and services in Europe, North America and Africa. From February 2012 to October 2014, Mr. Hegde served as Vice President of Engineering and Global Online Marketing at Groupon. From 2000 to February 2012, Mr. Hegde served in various roles including Director, General Manager of Worldwide Marketing, and Manager, Global Payment Services - India at Amazon.com, which offers a range of products and services through its websites, including merchandise and content that it purchases for resale from vendors and those offered by third-party sellers. From 1998 to 2000, Mr. Hegde served as Senior Member Technical Staff at Oracle - India, a global enterprise software company, which also provides hardware and service to support customers' businesses. From 1997 to 1998, Mr. Hegde served as a Software Engineer at Verifone - India, a developer and supplier of electronic payment hardware and software for merchant-operated, consumer facing, and self-service payment systems globally. In addition, Mr. Hegde served in Software Engineer roles at Lucent, Tatas and Citicorp between 1995 and 1997. Mr. Hegde currently sits on the board of directors of nearbuy.com, an India-based online marketplace platform. Mr. Hegde received his Bachelor of Science degree in Electrical Engineering from the National Institute of Technology Karnataka in Karnataka, India. Mr. Hegde brings to our board of directors deep experience and strong business and technical skills in the digital/e-commerce space.
MR. DARWIN K. LEWIS. Mr. Lewis has been an independent member of our board of directors since February 2017. Mr. Lewis joined SC Johnson & Son, Inc., a global consumer packaged goods company, in 1981. During his career there, he has held a number of sales, marketing, acquisition and general manager positions both domestically and abroad. Since July 2015, Mr. Lewis has served as the Senior Vice President-Global Sales and Chief Customer Officer at SC Johnson. Prior to that, Mr.
49
Lewis’ roles at SC Johnson included Senior Vice President of North American Sales and Chief Customer Officer (from November 2008 to June 2015), Vice President, Group General Manager in Greater China (from 2005 to 2008), Vice President of North American Sales (from 2000 to 2004), and President and General Manager over SCJ Canada (From 1997 to 2000). Prior to 1997, Mr. Lewis served in various other roles at SC Johnson including National Director of Special Business, Division Sales Director over the Midwest Division, Marketing Associate, Sales Director, Director of Trade Marketing and Area Manager and Division Sales Director. Mr. Lewis received his Masters of Business Administration from the University of Colorado and his Bachelor of Science degree in Business Administration from the University of Minnesota. Mr. Lewis brings to our board of directors extensive experience in managing sales and international operations in a global consumer goods business.
MR. GEORGE E. METZGER. Mr. Metzger has been an independent member of our board of directors since January 2012. Mr. Metzger has more than 30 years of experience in executive compensation, human resources, benefits and labor relations as well as workforce planning. In December 2007, Mr. Metzger retired from Textron Inc., a company with international operations in multiple industries. Mr. Metzger worked in various capacities while at Textron beginning in 1985, and most recently served as Vice President of Human Resources and Benefits from 2000 until December 2007. In this role, he was responsible for Textron's networked integrated human resource delivery system, including account based healthcare plans, retirement plan redesign and reward structure. From 1976 to 1985, he worked for Rockwell International, most recently as Director Human Resources. He worked at Clark Equipment Company from 1969 to 1976, where he served as Director Labor Relations at the time of his departure. From June 2008 until March 2014, Mr. Metzger served on the board of directors of WorkWell Systems, Inc., a privately-held physical medicine and workers' compensation solutions company. Mr. Metzger received his Bachelor of Science in Business Administration from Trine University. Mr. Metzger's extensive experience with executive compensation, labor relations and benefits brings to our board of directors experience in human resources oversight and workforce planning and development.
MR. RICHARD OKUMOTO. Mr. Okumoto has been an independent member of our board of directors since November 2012. Mr. Okumoto has over 30 years of corporate finance, operations, and strategy development experience in rapid growth technology companies in Silicon Valley. Mr. Okumoto is currently an adjunct professor in the Lucas Graduate and Undergraduate Schools of Business at San Jose State University, a position he has held since 2008. He is also currently on faculty at California State University Long Beach and Keck Graduate Institute, positions he has held since 2014 and 2015, respectively. He teaches business strategy to MBA and post-doctoral students. He was a principal with the consulting firm of Miller-Okumoto, Inc. from 2007 to 2012. From 2008 to 2010 Mr. Okumoto was the audit committee chairman and a member of the compensation committee for Logic Vision, Inc., a publicly traded electronic design automation company. From 2007 to 2009 Mr. Okumoto was the chief financial officer of Advanced Micro-Fabrication Equipment, Inc., a global micro-fabrication equipment company. From 2003 to 2006 Mr. Okumoto was the chief financial officer of Photon Dynamics, Inc., a publicly held manufacturer of flat panel display test equipment. From 1998 to 2001 Mr. Okumoto was the chief executive officer of TMT, Inc., a manufacturer of test equipment for the global semiconductor industry, and the Vice-President and General Manager for the Analog, Linear, and RF test equipment division of the acquiring company, Credence Systems Corporation, a publicly traded manufacturer of test equipment for the global semiconductor industry. From 1993 to 1998 Mr. Okumoto was the executive vice president and chief financial officer of Credence Systems Corporation, where he completed that company’s initial public offering. From 1990 to 1993 Mr. Okumoto was the Corporate Controller at Novellus Systems, Inc., a publicly traded supplier of wafer fabrication equipment and services. From 1974 to 1990 Mr. Okumoto held finance and operations roles at such companies as: Fairchild Semiconductor Corporation, Measurex Corporation (Honeywell), Commodore Business Machines, Inc., Basys, Inc., and Digital Research Corporation. Mr. Okumoto also serves on the board of directors of Vantage Technology Corporation, a privately held micro-analytical metrology tool company. Mr. Okumoto received his Bachelor of Science in Business Administration with an emphasis in Accounting from San Jose State University and his Master of Arts in Communication and Leadership from Gonzaga University. Mr. Okumoto holds a Registered Financial Consultant designation: RFC®. Mr. Okumoto brings to our board of directors extensive business background in finance and accounting, general management, and business strategy as a public company chief financial officer and audit committee chairman, as a chief executive officer and division general manager, and practitioner and academic of business strategy.
MR. DAVID TOOLE. Mr. Toole has been a member of our board of directors since January 2016. Mr. Toole brings over 35 years of experience as a technology, supply chain, digital media and video expert, and has been the Chief Executive Officer of MediaMobz, a private company that enables brands to increase their capacity to create video centric digital media that drives business results, since 2008. Mr. Toole is also currently the Chief Executive Officer of Outhink Media, an emerging media incubator, a position he has held since 2001. Prior to Outhink Media, Mr. Toole spent 21 years at GaSonics International, a semiconductor capital equipment company, where he worked in various positions, including as Chief Executive Officer from 1993 to 2001. As Chief Executive Officer at GaSonics, Mr. Toole led the company's initial public offering in 1994 and the sale of the company to Novellus Systems in 2001. Mr. Toole began his career at Advance Micro Devices, a manufacturer of early computer chips, where he was a production supervisor from 1976 to 1979. Mr. Toole received his Bachelor of Arts degree in Business from the University of California, Santa Barbara. Mr. Toole’s executive leadership experience, including as the Chief Executive Officer of a public company, and extensive digital media experience brings to our board of directors strong
50
leadership and oversight as well as strategic leadership as our company leverages digital media to enhance our business initiatives.
Audit Committee
The audit committee was established by our board of directors in accordance with Section 3(a)(58)(A) of the Exchange Act. The current members of our audit committee are Messrs. Lewis, Mauro and Okumoto, with Mr. Okumoto serving as chair. Our board of directors has determined that all three members of the audit committee qualify as “independent” under NASDAQ Rules. Our board of directors has also determined that each member of the audit committee meets the financial literacy and sophistication requirements set forth in the NASDAQ Rules and that Mr. Okumoto qualifies as “audit committee financial expert,” as that term is defined by SEC rules. Our board of directors made a qualitative assessment of Mr. Okumoto's level of knowledge and experience based on a number of factors, including his formal education, his past experience as a public company chief financial officer, and his experience reviewing and analyzing company financial statements as an investor and audit committee chair of a public company, and his other prior professional experience.
The audit committee operates under a written charter adopted by our board of directors that is available on our website at http://investor.lifevantage.com/governance.cfm. Our website does not constitute part of this annual report.
Code of Ethics
We have adopted the LifeVantage Corporation Code of Business Conduct and Ethics which applies to all our executive officers, employees and members of our board of directors. Our Code of Business Conduct and Ethics is designed to deter wrongdoing and to promote: (1) honest and ethical conduct, including the ethical handling of actual or apparent conflicts of interest between personal and professional relationships; (2) full, fair, accurate, timely, and understandable disclosure in reports and documents that we file with, or submit to, the SEC and in other public communications we make; (3) compliance with applicable governmental laws, rules and regulations; (4) the prompt internal reporting of violations of the code to an appropriate person or persons identified in the code; and (5) accountability for adherence to the code. A copy of our Code of Business Conduct and Code of Ethics is available on our website at http://investor.lifevantage.com/governance.cfm. In the event that an amendment to, or a waiver from, a provision of our Code of Business and Ethics that applies to any of our directors or executive officers is necessary, we intend to post such information on our website. Our website does not constitute part of this annual report.
Section 16(a) Beneficial Ownership Reporting Compliance
Section 16(a) of the Exchange Act requires our directors, executive officers, and persons who own more than 10% of our common stock to report their ownership of our common stock and any changes in that ownership to the SEC. The SEC has established specific due dates for these reports, and we are required to report in this annual report any failure to file by the specific due dates. To our knowledge, based solely on a review of the copies of such reports furnished to us and written representations that no other reports were required, during the fiscal year ended June 30, 2017, we believe that all such reports were filed on a timely basis.
ITEM 11 — EXECUTIVE COMPENSATION
Compensation Discussion and Analysis
In this section, we describe the material components of compensation that were paid or awarded to, or earned by, our “named executive officers” (our “NEOs”) in fiscal 2017, provide an overview of the information set forth below in the Summary Compensation Table and other compensation tables, and address actions taken regarding executive compensation after the end of fiscal 2017 that could affect a fair understanding of a NEO’s compensation during fiscal 2017.
Our named executive officers for fiscal 2017 and their principal positions are:
NEO | Position | |
Darren Jensen | President and Chief Executive Officer | |
Steven R. Fife | Chief Financial Officer(1) | |
Ryan Goodwin | Chief Marketing Officer | |
Courtland Pearson | Senior Vice President International(2) | |
Justin Rose | Chief Sales Officer | |
Mark Jaggi | Former Chief Financial Officer and Treasurer(3) | |
Gary Koos | Former Interim Chief Financial Officer(4) | |
(1) | Mr. Fife was appointed as our Chief Financial Officer effective March 13, 2017. |
51
(2) | Mr. Pearson was appointed as our Senior Vice President International effective July 2, 2016. |
(3) | Mr. Jaggi's employment with the Company was terminated effective January 18, 2017. |
(4) | Mr. Koos served as our Interim Chief Financial Officer from January 18, 2017 until March 13, 2017, through an agreement with Cerius Interim Executive Solutions and as described in further detail in the footnotes to our Summary Compensation Table. As a result, he was not eligible during fiscal 2017 for all of the elements of compensation described below that are provided to our other NEOs and was only eligible for the compensation he received through Cerius Interim Executive Solutions. |
Executive Summary
Overall, we are focused on long-term growth strategies for our business, including through the adoption of improved operational controls designed to ensure the long-term success of our domestic and international businesses and the implementation of technology-enabled distributor training and resources to increase their productivity and potential for success. During fiscal 2017, we added key individuals to both our executive team and our board of directors, each of whom brings demonstrated talent and experience to advance significantly our long-term strategic goals and provide the appropriate management and oversight of our operations. In addition, our compensation committee continues to adjust our compensation programs to incorporate longer-term performance periods and refine applicable performance metrics to better align compensation with our strategic goals, while balancing the need to maintain a market competitive compensation program to continue to attract and retain our management team.
This Compensation Discussion and Analysis is divided into three parts:
• | Part I-Compensation Principles and Processes. In this part we describe the important principles, processes and tools that help us determine compensation for our NEOs. |
• | Part II-Compensation Components. In this part we discuss the three material components of NEO compensation - base salary, annual incentive compensation and long-term incentive compensation - and actual compensation paid or awarded to, or earned by, our NEOs in fiscal 2017. |
• | Part III-Other Matters. In this part we discuss other compensation practices that affect how we compensate our NEOs, including employment agreements and certain corporate policies. |
PART I. COMPENSATION PRINCIPLES AND PROCESSES
Our Compensation Principles and Objectives
Our executive compensation program is designed to be fair, reasonable and competitive and to attract, retain and motivate talented executives capable of achieving our business objective of creating long-term shareholder value. We actively seek to foster a pay-for-performance environment that encourages our executive officers to enhance shareholder value. To this end, we seek to establish a compensation program linked directly to the delivery of long-term returns to our shareholders, the achievement of short- and long-term strategic business objectives, individual performance, and the demonstration of competencies that are aligned with our culture and values. With our recent hiring of several new members of our executive management team, including our Chief Executive Officer in fiscal 2015, we have also had to prioritize the market competitiveness of our executive compensation program.
To ensure that our compensation programs support our business objectives, we observe several core compensation principles and objectives. We believe our executive compensation program should:
• | manage the distribution of gains between our NEOs and our shareholders; |
• | reward company and individual performance; |
• | maintain an appropriate balance between base salary and annual and long-term incentive opportunities; |
• | be externally competitive and internally equitable; and |
• | give us the flexibility to attract, retain and motivate talented executives. |
Compensation Committee
Our compensation principles and objectives are sustained, in part, by our board of directors and the independent oversight of NEO compensation by its compensation committee. The compensation committee is responsible for overseeing our compensation policies, plans and programs, and reviewing and recommending to our board of directors the base salary, annual and long-term incentives, perquisites, severance arrangements and other related benefits paid to our directors and executive officers, including our NEOs.
52
The compensation committee has the authority and responsibility to review and recommend to the board of directors on an annual basis the corporate goals and objectives with respect to compensation for Mr. Jensen, our President and Chief Executive Officer (whom we refer to as our “CEO”). The compensation committee evaluates at least annually the performance of our CEO in light of these established goals and objectives. The compensation committee, based upon its evaluations, makes a recommendation regarding our CEO's annual compensation to the independent members of our board of directors for its approval. Our CEO is not present during any meeting of the compensation committee during which it deliberates upon or approves determinations of or recommendations regarding the determination of the compensation of our CEO.
The compensation committee also has the authority and responsibility to review and recommend to our board of directors on an annual basis the evaluation process and compensation structure for our executive officers, including our NEOs, other than our CEO. The compensation committee evaluates the performance of these executive officers and reviews and approves or recommends to our board of directors for approval the compensation, including base salary and annual and long-term incentive compensation, for such executive officers. The compensation committee's recommendation in this regard is based, in part, on amounts proposed by our CEO.
Each member of our compensation committee is an “independent outside director,” as defined under Section 162(m) of the Internal Revenue Code, and is independent under NASDAQ Rules. Our compensation committee approves components of our executive compensation where appropriate to facilitate our ability to deduct amounts under the corporate tax deduction limitations imposed by Section 162(m). A complete description of the authority and responsibility of our compensation committee is set forth in its charter, which is available on our website at http://investor.lifevantage.com/governance.cfm and in print upon request. Our website does not constitute part of this annual report.
To assist it with fulfilling its responsibility for making NEO compensation decisions consistent with the principles and objectives discussed above, the compensation committee utilizes a variety of tools, as described below.
Compensation Consultant
For fiscal 2017, the compensation committee engaged Barney & Barney as an independent compensation consultant. Specifically, Barney & Barney was engaged to review and recommend refinements of our peer group of companies and assess, relative to our peer group, total compensation of our executives, compensation of our board of directors and to develop long-term incentive grant guidelines and strategies for all employees. The compensation committee has engaged Barney & Barney since fiscal year 2011 to provide similar services.
The compensation committee has the exclusive right to select, retain and terminate Barney & Barney as well as to approve any fees, terms or other conditions of its compensation advisory services. Barney & Barney and its lead compensation consultant report directly to the compensation committee, but when directed to do so by the compensation committee, work cooperatively with our executive officers to develop analyses and proposals for presentations to the compensation committee. The compensation committee reviews Barney & Barney's performance on at least an annual basis and determines whether to continue that relationship.
The compensation committee concluded for fiscal 2017 that Barney & Barney is independent and that its work in advising the compensation committee does not raise any conflict of interest. In making such determination, the compensation committee considered, among other things, (i) the provision of other services to us by Barney & Barney; (ii) the amount of fees received by Barney & Barney from us, as a percentage of Barney & Barney's total revenue; (iii) Barney & Barney's policies and procedures that are designed to prevent conflicts of interest; (iv) any business or personal relationship of Barney & Barney with members of the compensation committee; (v) any of our stock owned by Barney & Barney; and (vi) any business or personal relationship of Barney & Barney with our executive officers.
CEO Recommendations
As discussed above, the compensation committee relies upon our CEO for compensation recommendations for the NEOs other than himself. Our CEO and the compensation committee discuss our CEO's assessment of the NEOs and any other factors the CEO believes may be relevant for the compensation committee's consideration.
Fiscal 2017 Peer Group
During fiscal 2017, Barney & Barney reviewed and made recommendations to the compensation committee regarding refinements to our peer group for market assessments for fiscal 2017 (our “FY2017 Peer Group”) that adjusted the peer group (our “FY2016 Peer Group”) the compensation committee had used for our fiscal 2016 compensation decisions. Barney & Barney considered industry, company size and location as selection criteria in identifying appropriate peer companies for fiscal 2017. Our compensation committee uses the peer group to establish a framework for evaluating our NEO compensation practices. Our FY2017 Peer Group consists of the following companies:
53
CVR Partners (UAN) | Nutraceutical International (NATR) |
Depomed (DEPO) | Nutrisystem (NTRI) |
Endocyte (ECYT) | Omega Protein (OME) |
Gaiam (GAIA) | PetMed Express (PETS) |
Lifeway Foods (LWAY) | Quidel (ODEL) |
Mannatech (MTEX) | QuinStreet (QNST) |
Medifast (MED) | Sagent Pharmaceuticals (SGNT) |
Meridian Bioscience (VIVO) | SciClone Pharmaceuticals (SCLN) |
MGP Ingredients (MGPI) | Spectrum Pharmaceuticals (SPPI) |
MusclePharm (MSLP) | Sucampo Pharmaceuticals (SCMP) |
Natural Alternatives Int'l (NAII) | |
Because of the limited number of public companies in our industry that meet the recommended criteria for selecting our compensation peer group, the compensation committee includes selected companies in industries similar to our industry, including neutraceuticals, network marketing and life sciences. In determining our FY2017 Peer Group, our compensation committee narrowed one of the three factors used in determining the FY2016 Peer Group. While the peer group used for each fiscal year used a total revenue factor ranging from $70 million to $450 million and the factor relating to the number of company employees ranging from 70 to 800 employees, the compensation committee on advice of Barney & Barney adjusted the market capitalization factor to $1.0 billion or less. As a result of this refinement in the peer group’s market capitalization factor and based upon the recommendation of Barney and Barney, two companies were added to the FY2017 Peer Group: Endocyte and Nutrisystem. Additionally, Rentech Nitrogen was removed from the FY2017 Peer Group as a result of its acquisition by CVR Partners.
The compensation committee used data from our FY2017 Peer Group companies to help ensure that the compensation of NEOs was competitive and that its decisions were appropriate. The compensation committee generally believes that the base salary and total direct compensation of our NEOs should be set within a range of plus or minus 20% of the 50th percentile of each of the base salary and the total direct compensation of persons in reasonably similar positions at companies in our FY2017 Peer Group.
Role of Say-on-Pay Vote
At our fiscal 2016 Annual Meeting of Shareholders held in October 2015, our shareholders were provided an opportunity to cast an advisory vote on the compensation of our named executive officers, as described in the proxy statement for the fiscal 2016 Annual Meeting of Shareholders. Approximately 70% of shareholders’ votes were cast in favor of the compensation of our NEOs, which the compensation committee believes affirms general support for our executive compensation program by our shareholders. Changes made to our executive compensation programs in fiscal 2016 and fiscal 2017 took into account that our compensation committee would like to improve the percentage by which our say on pay advisory vote passes when it is next submitted to shareholders at our annual meeting with respect to fiscal 2018.
At our fiscal 2013 Annual Meeting of Shareholders held in November 2012, our shareholders voted in favor of holding an advisory vote on the compensation of our executive officers once every three years. As such, we do not intend to hold another advisory shareholder vote on our NEO compensation until our fiscal 2019 Annual Meeting of Shareholders (which meeting is expected to be held in late 2018 or early in 2019).
Compensation Risk Analysis
The compensation committee annually reviews our executive compensation program, including our compensation-related risk profile, to ensure that our compensation-related risks are not likely to have a material adverse effect on our company. The compensation committee does not believe our executive compensation program encourages excessive or inappropriate risk taking. The base salary portion of compensation is designed to provide a steady income regardless of our stock price performance, so that our NEOs do not feel pressured to focus exclusively on stock price performance to the detriment of other important aspects of our business. Our long-term incentive awards have been structured to provide longer term incentives that correlate with total shareholder return. As a result, the compensation committee believes our executive compensation program strikes a balance between providing fixed compensation and appropriate long-term incentives, such that our NEOs are not encouraged to take unnecessary or excessive risks.
PART II. COMPENSATION COMPONENTS
The three components of our executive compensation program are base salary, annual or short-term incentives and long-term incentives in the form of equity-based awards. While no specific formula is used to determine the allocation of a NEO's total annual compensation among these three components, we strive to achieve market competitive pay in each compensation
54
component. An underlying principle in each of the compensation components is that the compensation of our executives should correlate with their level of performance. In addition, the compensation committee has not established any formal policies or guidelines for allocating compensation between cash and non-cash compensation.
Base Salary
Base salary is the primary fixed component of our executive compensation program. We believe that base salaries should provide a fixed level of competitive compensation to help us attract and retain strong executive talent and compensate executives for services rendered during the fiscal year.
For newly hired executives, the compensation committee determines base salary on a case-by-case basis by evaluating a number of factors, including the executive's qualifications and experience, the competitive recruiting environment for his or her services, the executive's anticipated role and responsibilities with our company, the executive's past compensation history, internal pay equity, and comparisons to market data regarding compensation levels for comparable executives of other companies in our peer group.
How Our CEO's Base Salary is Determined
Under the compensation committee's charter, each year the compensation committee reviews and recommends to the board of directors the corporate goals and objectives with respect to our CEO's compensation, including base salary. The compensation committee evaluates the CEO's performance in light of the established corporate goals and objectives and whether our CEO's compensation falls within a range of plus or minus 20% of the 50th percentile of the compensation of other CEOs in our peer group. Based on such evaluation, the compensation committee recommends our CEO's compensation, including base salary, to the independent members of the board of directors for their approval. The independent members of the board of directors collectively have the discretion to set our CEO's base salary. Our CEO is not present during the portion of any meeting of the compensation committee or board of directors during which it votes on or deliberates regarding the compensation of our CEO.
Our CEO, Mr. Jensen, joined the Company in May 2015 at which time his salary was determined based upon a review of his base salary in his prior position and a review of the salaries of CEOs in our fiscal 2015 peer group. Mr. Jensen’s initial salary was set at $550,000 and fell within a range of plus or minus 20% of the 50th percentile of base salaries of other CEOs in our fiscal 2015 peer group. As Mr. Jensen joined our company less than two months prior to the beginning of fiscal 2016, the compensation committee determined that Mr. Jensen’s salary would remain unchanged for fiscal 2016. In June 2016, the compensation committee recommended to the board of directors that Mr. Jensen’s base salary for fiscal 2017 not be increased and his base salary remained unchanged for fiscal 2017.
How Our Other NEOs' Base Salaries are Determined
At least annually, the compensation committee reviews our performance evaluation process and compensation structure for our executive officers, including our NEOs. Among other things, the compensation committee compares the compensation of our executive officers against data derived from an analysis of similar executive officers in our peer group and reviews each executive officer's performance with our CEO. Following its evaluation and review, the compensation committee recommends to our board of directors the base salary of each executive officer, other than our CEO. In making such recommendations, the compensation committee considers proposals and recommendations of our CEO. The base salaries of our executive officers, including our NEOs other than our CEO, are established by our board of directors after taking into account the recommendation of the compensation committee. See “PART I. COMPENSATION PRINCIPLES AND PROCESSES-Compensation Committee.”
Similar to the base salary of our CEO, we believe that the base salary of our other NEOs should be competitive with the base salary ranges for persons in similar positions at the companies within our peer group and should generally be set within a range of plus or minus 20% of the 50th percentile of the base salaries of such persons. The base salaries of each of Messrs. Goodwin and Rose were determined in prior fiscal years when they were hired. The base salaries of each of Messrs. Fife and Pearson were determined at the time of their hire during fiscal 2017.
In June 2016 the compensation committee determined to recommend to our board of directors that the annual base salary payable to each of Messrs. Goodwin or Rose (and Mr. Jaggi, who was still employed by us at such time) for fiscal 2017 not be increased.
Short-Term Cash Incentive Plans
The second material component of our NEOs' compensation is the opportunity to earn cash incentives under one of our annual incentive plans. Generally, we believe annual incentives should:
• | Reward the NEOs for business and individual performance; |
• | Encourage effective short-term performance while balancing long-term focus; |
55
• | Provide a significant portion of total compensation opportunity that is at risk; and |
• | Be externally competitive and internally equitable. |
In May 2016, our board of directors, upon the recommendation of the compensation committee, adopted a fiscal 2017 annual incentive plan (the “FY2017 Annual Incentive Plan”). The FY 2017 Annual Incentive Plan is intended to reward certain full time employees who were selected by the compensation committee for participation in the plan for their performance in meeting corporate goals. All of our NEOs were eligible to participate in the FY 2017 Annual Incentive Plan based on achievement of specified performance goals, both corporate and individual.
Our CEO was also eligible during fiscal 2017 to earn cash incentive awards related to the performance of three of our product lines (the “FY2017 Product Line Awards”).
FY2017 Annual Incentive Plan
Under the terms of the FY2017 Annual Incentive Plan, our CEO and our other eligible NEOs were eligible to receive a cash bonus if we met certain corporate goals or they achieved certain individual goals. Target bonus amounts for our NEOs are established as a percentage of their annual base salary. For all NEOs other than Mr. Jensen, the target bonus amount ranges from 40% to 50% of the NEO’s annual base salary, with a maximum bonus of 152.5% of the target amount. Mr. Jensen’s target bonus amount is 82% of his annual base salary, with a maximum bonus equal to 150% of his annual base salary.
For fiscal 2017, two corporate goals comprised 70% of the target bonus amount for our NEOs, with an earnings per share target (“EPS”) comprising 35% of target, and a revenue target, comprising the other 35% of target. The applicable revenue and EPS targets, along with minimum and maximum amounts payable for such goals, were as follows:
EPS | |||
FY 2017 EPS (rounded to nearest cent) | Performance Bonus Percentage | ||
Minimum | $0.40 | 20% | |
$0.42 | 40% | ||
$0.44 | 60% | ||
$0.45 | 80% | ||
$0.47 | 100% | ||
$0.51 | 125% | ||
Maximum | $0.54 | 150% | |
Top Line Revenue | |||
FY 2017 Top Line Revenue | Performance Bonus Percentage | ||
Minimum | $207,000,000 | 20% | |
$208,250,000 | 40% | ||
$209,500,000 | 60% | ||
$210,750,000 | 80% | ||
$212,000,000 | 100% | ||
$214,500,000 | 125% | ||
$217,000,000 | 150% | ||
$219,500,000 | 175% | ||
Maximum | $222,000,000 | 200% | |
The remaining 30% of the target bonus amount was comprised of individual goals, determined on a quarterly basis with 7.5% of the target bonus amount allocated to each fiscal quarter. A minimum of 80% and a maximum of 100% applied to the individual goals for fiscal 2017.
Following the end of fiscal 2017, it was determined that no amount would be payable to any of our NEOs attributable to our corporate goals, as achievement was below the minimum level applicable to both the revenue and EPS targets. Annual Incentive Plan bonus payments attributable to individual goals were, however, paid to each of our NEOs other than Mr. Jensen
56
in the following amounts: Mr. Fife, $12,375 (for the fourth quarter of fiscal 2017 only); Mr. Goodwin, $66,375; Mr. Pearson, $27,188; Mr. Rose, $38,250; and Mr. Jaggi, $24,375 (for the first two quarters of fiscal 2017, prior to termination of his employment).
For fiscal 2016, we paid no annual incentive plan bonuses to our NEOs (other than Mr. Rose, who during that year participated in a different incentive plan) as a result of the disruption to our business caused by the independent review conducted by the audit committee after the end of fiscal 2016 which resulted in our delayed filing of our Form 10-K for fiscal 2016.
FY2017 Product Line Awards
In September 2016, our compensation committee approved the FY2017 Product Line Awards for our CEO. Pursuant thereto, Mr. Jensen was eligible to receive three separate cash incentive awards for revenue generated by each of three Company product lines subject to (i) a maximum amount payable of $1,000,000 in the aggregate and (ii) reduction if our overall gross profit margin for fiscal year 2017 fell below the overall gross profit margin for fiscal year 2016 (a 25% reduction for each 10% reduction in overall gross profit margin, with straight line interpolation applied to any decline in overall gross margin of other than 10%).
Mr. Jensen’s bonus opportunity for the Protandim and TrueScience product lines originated from his employment agreement negotiated with us at the time he was hired in May 2015. The PhysIQ product line bonus opportunity was approved as an additional award in September 2016. For the Protandim product line, including the Protandim NRF1 synergizer and the Protandim Nrf2 synergizer (together, the “Protandim Product Line”), Mr. Jensen was eligible to receive a cash incentive award equal to 3% of the positive difference in total net revenue from the Protandim Product Line for fiscal year 2017 as compared to fiscal year 2016.
For the TrueScience skin care regimen products, including the TrueScience Ultra Gentle Facial Cleanser, the TrueScience Perfecting Lotion, the TrueScience Eye Corrector Serum, the TrueScience Anti-Aging Cream and the TrueScience Micro Lift Serum (collectively, the “TrueScience Product Line”), Mr. Jensen was eligible to receive a cash incentive award equal to 2% of the positive difference in total net revenue from the TrueScience Product Line for fiscal year 2017 as compared to fiscal year 2016.
For the PhysIQ Smart Weight Management System products, including the PhysIQ Cleanse, the PhysIQ Probio, the PhysIQ Fat Burn and the PhysIQ Protein (collectively, the “PhysIQ Product Line”), Mr. Jensen was eligible to receive a cash incentive award equal to 2% of the positive difference in total net revenue from the PhysIQ Product Line for the fiscal year 2017 performance period (December 1, 2016 to June 30, 2017) as compared to the fiscal year 2016 performance period (December 1, 2015 to June 30, 2016).
In the first quarter of fiscal year 2018, our compensation committee determined that Mr. Jensen was eligible to receive a cash incentive award solely for the FY2017 Product Line Award related to the Protandim Product Line, as the revenues for our TrueScience Product Line and the PhysIQ Product Line for fiscal year 2017 or, in the case of the PhysIQ Product Line, for the fiscal year 2017 performance period, were not greater than fiscal year 2016 (or the fiscal year 2016 performance period, for the PhysIQ Product Line). Based on increased revenues for the Protandim Product Line of $3,515,059, Mr. Jensen was eligible to receive an award of $105,452; however, due to our overall gross margin for fiscal year 2017 being less than the overall gross margin for fiscal year 2016 (-0.41%), Mr. Jensen’s cash incentive award was reduced by 1.02% for a payout of $104,371.
Long-Term Incentive Plan
The third material component of our NEOs' compensation includes awards granted under our equity incentive plan. Prior to 2017, such awards were granted pursuant to our 2010 Long-Term Incentive Plan, or 2010 LTIP. Following the adoption of our 2017 Long-Term Incentive Plan in December 2016, equity awards are now granted pursuant to the 2017 Long-Term Incentive Plan, or 2017 LTIP. Historically, we have not granted long-term incentive awards as compensation for past performance, and instead believe that long-term incentive awards should:
• | align NEO's incentives directly with shareholder value; |
• | encourage performance that increases long-term shareholder return; |
• | serve as a retention tool; and |
• | give NEOs a meaningful equity stake in our business. |
The awards granted to our NEOs historically have consisted of stock options or restricted stock awards, in each case subject to time-based vesting; however, we have not granted stock options to NEOs since 2012. New hire awards are usually granted to executive officers at the time employment commences, and such awards typically vest over a three year period following the commencement of employment.
57
In January 2015, we began granting performance-based restricted stock units (“PRSUs”) to our NEOs under the 2010 LTIP, which utilize the Company’s total shareholder return (“TSR”) as a performance metric. In determining the number of PRSUs to award to our NEOs, the compensation committee takes into account our compensation philosophy that the overall compensation of our NEOs should be set within a range of plus or minus 20% of the 50th percentile of the overall compensation of persons in reasonably similar positions at companies in our peer group. The compensation committee approves all equity awards to our employees, including awards to our executive officers.
Fiscal 2017 PRSUs
In March 2017, our compensation committee granted PRSUs (the “2017 PRSUs”) to our NEOs and certain other officers of the Company pursuant to the 2017 LTIP. Vesting of the PRSUs is subject to continued service and the Company’s TSR during a three-year performance period commencing on January 1, 2017 and ending on December 31, 2019. Vesting of 50% of the PRSUs is based on the Company’s absolute TSR for the performance period as compared to a matrix of fixed numeric values, and the vesting of the other 50% of the PRSUs is based on a relative comparison of the Company’s TSR to the Vanguard Russell 2000 exchange traded fund TSR for the performance period. The number of PRSUs eligible to vest is 0% to 200% of the target.
The Company's NEO long term compensation grant levels are determined to be within a range of plus or minus 20% of the 50th percentile of the long term compensation paid to executives preforming comparable tasks at our compensation peer group. The plus or minus 20% of the 50th percentile range allows for a level of discretion in making awards while assuring market competitive compensation that enables the Company to attract and retain qualified, focused and engaged executives. Additional details regarding the 2017 PRSUs granted to our NEOs in fiscal 2017 are detailed in the “Grants of Plan-Based Awards” table below.
Fiscal 2017 New Hire Awards
In connection with their commencement of employment with the Company during fiscal 2017, our board of directors approved the grant of restricted stock awards to each of Messrs. Fife and Pearson. These awards vest based on the NEO’s continuing service, with one-third of the award vesting on each of the first three anniversaries of their respective employment start dates. These awards are detailed in the “Grants of Plan-Based Awards” table below.
Other Components
As a general matter, subject only to limited exceptions, we do not provide perquisites or benefits to our NEOs on a basis that is different from other eligible employees, and such perquisites or benefits represent only a minor portion of the total compensation of the NEOs. We maintain health, dental, long term and short term disability, and vision insurance plans for the benefit of all eligible employees, including our NEOs. We pay for basic coverage under each of these benefit plans and any premium in excess of the basic coverage is paid by the employee. We also provide wealth accumulation benefits to eligible employees, including our NEOs, in the form of a 401(k) savings plan. These benefit programs are offered on the same basis to all employees, including our NEOs.
PART III. OTHER MATTERS
Employment Agreements
We currently have an employment agreement with Mr. Jensen. Messrs. Fife, Goodwin, Pearson and Rose are entitled to certain severance benefits under key executive benefits package contracts which are described below in “Severance or Change-in-Control Agreements.” Below is a summary of the material terms of the employment agreement we have in place with Mr. Jensen. During fiscal 2017, we entered into an amendment and restatement of Mr. Jensen’s employment agreement as described below.
Darren Jensen Compensation Arrangements
On April 26, 2015, we entered into an employment agreement with Mr. Jensen pursuant to which he was appointed as our President and Chief Executive Officer effective May 18, 2015. On December 6, 2016, we amended and restated Mr. Jensen’s employment agreement. Mr. Jensen’s employment agreement as amended and restated is referred to herein as the employment agreement. Mr. Jensen’s employment agreement will expire on the 90th day following the close of the first fiscal year in which our net revenue exceeds $500 million, unless earlier terminated in accordance with the terms of the employment agreement or extended by mutual agreement of the parties.
Base Salary. Mr. Jensen’s base salary was set at $550,000 at the time of his hiring in 2015 and remained at that level through fiscal 2017.
Bonus Awards; Annual Incentives. For fiscal 2017, Mr. Jensen’s target bonus percentage was set at 82% of his annual base salary, with a maximum bonus percentage of 150% of his annual base salary. Mr. Jensen’s annual incentive arrangements for fiscal 2017, as set forth in his employment agreement, are as described above in “Annual Incentive Plan.” Pursuant to his
58
employment agreement, beginning with fiscal 2018 and ending with the fiscal year in which the Company first achieves annual revenue of at least $500 million, Mr. Jensen will be entitled to the following annual incentive payments granted under the Company’s shareholder-approved long-term incentive plan, as currently in effect or as may be in effect in the future:
• | An annual incentive payment for incremental annual revenue from sales of the Protandim product line over prior year revenue for such product in an amount equal to 3% of the positive difference between total net revenue from sales of Protandim for the most recently completed fiscal year relative to the prior fiscal year; |
• | An annual incentive payment for incremental annual revenue from sales of TrueScience Skin Care Regimen products over prior year revenue for such products in an amount equal to 2% of the positive difference between total net revenue from sales of TrueScience Skin Care Regimen for the most recently completed fiscal year relative to the prior fiscal year; and |
• | An annual incentive payment for incremental annual revenue from sales of PhysIQ products over prior year revenue for such products in an amount equal to 2% of the positive difference between total net revenue from sales of PhysIQ for the most recently completed fiscal year relative to the prior fiscal year. |
Under each of the three above product line-based awards, if our overall gross profit margin for a completed fiscal year falls below the overall gross profit margin for the prior year, then the annual incentive payments described above relating to such year shall be reduced by twenty-five percent (25%) for each ten percent (10%) reduction in overall gross profit margin (with straight line interpolation applied to any decline in overall gross margin of other than ten percent (10%)).
As described above in "FY2017 Product Line Awards," for fiscal 2017, our compensation committee determined that Mr. Jensen was eligible to receive a cash bonus solely from sales of the Protandim product line as the revenues for the TrueScience products and PhysIQ products for fiscal 2017 were not greater than fiscal year 2016 (or the fiscal 2017 performance period versus the 2016 performance period, for the PhysIQ products).
Under the terms of his employment agreement, beginning with fiscal 2018 and ending at the end of the fiscal year during which the Company first achieves annual revenue of at least $500 million, Mr. Jensen will also be eligible to earn the following additional amounts:
• | a one-time cash bonus of $300,000 when our annual net revenue exceeds $300 million; |
• | a one-time cash bonus of $400,000 when our annual net revenue exceeds $400 million; and |
• | a one-time cash bonus of $500,000 when our annual net revenue exceeds $500 million (each of $300 million, $400 million and $500 million, a “Revenue Milestone”). |
If two (or more) annual Revenue Milestones are first achieved during a single fiscal year, Mr. Jensen will be paid the sum of the bonus amounts that relate to each Revenue Milestone achieved during such year. If, following achievement of a Revenue Milestone, our annual revenue for a subsequent fiscal year is less than the previously achieved Revenue Milestone, the next Revenue Milestone is voided and no bonus will be paid for achievement of such next Revenue Milestone.
Equity Awards. Pursuant to the terms of his employment agreement and as described above in “Long-Term Incentive Plan,” Mr. Jensen received a grant of 93,300 PRSUs under the 2017 LTIP in March 2017.
Reimbursement of Expenses. While the employment agreement remains in effect, we will pay up to $20,000 annually to cover costs incurred by Mr. Jensen for professional assistance with respect to personal financial and tax planning and compliance.
Severance. Mr. Jensen's employment with us is at-will and either he or we can terminate his employment at any time and for any reason or for no reason. If we terminate Mr. Jensen's employment without “cause” or if he resigns for “good reason,” which includes customary triggers, he will be asked to execute and deliver to us a separation agreement that will provide, among other things, a release of all claims against us and a covenant not to sue us. So long as Mr. Jensen executes and does not revoke the separation agreement, and he remains in full compliance with its terms, then in addition to the Accrued Pay, he will be entitled to payments equal in the aggregate to six (6) months of his then annualized base salary. The salary continuation payments referred to in the preceding sentence will be paid in substantially equal monthly installments over a 12 month period following the date of termination of employment.
Change in Control. If, within 12 months after the occurrence of an event constituting a change in control, Mr. Jensen's employment terminates without cause or if Mr. Jensen resigns for good reason, then we will pay him severance payments equal to 12 months of his annual base salary, paid as described in the paragraph above, and unless otherwise provided in the applicable option agreement or award agreement, all restricted stock awards and other equity-based awards granted to Mr. Jensen will be entitled to receive full service-based vesting credit and deemed attainment at target of all performance-based vesting milestones as of the date of the change in control, the performance period with respect to all PRSUs shall be deemed to
59
have ended as of the date of the change in control, and the performance over such shortened performance period shall be measured as of such date.
Separation Arrangement with Mark Jaggi
On January 18, 2017, the Company terminated the employment of Mr. Jaggi, the Company’s Chief Financial Officer. Mr. Jaggi participated in the key executive benefit package, pursuant to which he was eligible to receive severance in an aggregate amount equal to six months his annual base salary as of the termination date. This severance amount was paid in substantially equal monthly installments over the six-month period following his termination date. As a condition to receiving the severance payments, Mr. Jaggi provided a separation agreement in a form prescribed by us, which included, among other things, a release of all claims against the Company, a covenant not to sue and certain other covenants during the severance period.
Severance or Change-in-Control Agreements
Messrs. Fife, Goodwin, Pearson and Rose are eligible to receive severance benefits pursuant to the terms of their key executive benefit package agreements.
The key executive benefit package agreements with Messrs. Fife, Goodwin, Pearson and Rose provide that their employment with us is at-will and either the NEO or the Company can terminate the NEO’s employment at any time and for any reason or for no reason, in each case subject to the terms and provisions of the key executive benefit package agreement. These agreements provided that, if we terminate their employment without cause, the NEO will be asked to execute and deliver to us a separation agreement that will provide, among other things, a release of all claims against us and a covenant not to sue us. So long as the NEO executes and does not revoke the separation agreement, and remains in full compliance with its terms, he will be entitled to payments equal in the aggregate to six months of his then annualized base salary. These severance payments will be paid in substantially equal monthly installments over the six month period following the date of termination of employment.
The contractually-provided severance benefits under the terms of their respective key benefit package agreements are intended to provide compensation to the applicable NEO while he searches for new employment after his employment with us is terminated without cause or he resigns for good reason. We believe that providing severance protection for these NEOs upon their termination of employment under these circumstances is necessary in the competitive marketplace for talented executives. We believe that the amounts of these payments and benefits and the periods of time during which they would be provided are fair and reasonable. The agreements governing the 2010 LTIP awards granted to our NEOs also generally provide for some or all of the unvested shares underlying equity awards granted thereunder to vest immediately when certain events occur, including a change in control, described below under “SUMMARY COMPENSATION TABLE-Long Term Incentive Plan.” For further details of the potential amounts that a NEO may receive in connection with a change-in-control transaction see the “Potential Payments Upon Termination or Change-in-Control” table.
Equity Ownership Policy
Our equity ownership policy, which we adopted in June 2013, requires certain of our executive officers, including our NEOs, to own a minimum number of shares of our common stock. Our equity ownership policy requires (i) our Chief Executive Officer to hold a number of shares of our common stock having a value equal to or greater than six times his annual base salary, (ii) each of our officers who has been designated by our board of directors as an “officer” within the meaning of Rule 16a-1 of the Securities Exchange Act of 1934, to hold a number of shares of our common stock having a value equal to or greater than three times his or her annual base salary, and (iii) any other executive officer designated by our CEO to be subject to the equity ownership policy to hold a number of shares of our common stock having a value equal to or greater than two times his or her annual base salary. Such ownership targets will be measured each year on the date of our board of directors meeting held on the date of, or next following the date of, our annual meeting of shareholders. Each employee subject to our equity ownership policy has five years from the time he or she becomes subject to the equity ownership policy to meet his or her required level of equity ownership. Until such time as each employee subject to our equity ownership policy obtains the ownership targets, such employee is required to retain direct ownership of at least fifty percent of the shares of our common stock he or she receives as a result of the exercise, vesting or payment of equity awards. If an employee subject to our equity ownership policy does not achieve his or her ownership target as of the end of his or her buy-in period, then he or she is required to retain direct ownership of all of the shares of our common stock he or she receives as a result of the exercise, vesting or payment of equity awards until his or her ownership target is achieved. The compensation committee has full power and authority to administer and interpret our equity ownership policy and may grant exceptions based on economic hardship or other showing of good cause.
Tax and Accounting Considerations
In fiscal 2017, while the compensation committee generally considered the financial accounting and tax implications of its executive compensation decisions, neither element was a material consideration in the compensation awarded to our NEOs
60
during such fiscal year. The amendment during fiscal 2017 of Mr. Jensen's employment agreement was done, in part, to facilitate qualification of his cash incentive awards for deduction under Section 162(m) of the Code.
SUMMARY COMPENSATION TABLE
The following table sets forth the compensation of our NEOs for the fiscal years ended June 30, 2017, 2016 and 2015. However, information for fiscal 2016 and fiscal 2015 is not provided if a NEO first became a NEO for fiscal 2017 and information for fiscal 2015 is not provided if a NEO first became a NEO for fiscal 2016. The primary components of each NEO's compensation are also described in our “Compensation Discussion and Analysis,” above.
Name and Principal Position | Year | Salary ($) | Bonus ($) | Stock Awards ($)(1) | Non-equity Plan Compensation(2) | All Other Compensation ($) | Total ($) | |||||||||||||
Darren J. Jensen, President | 2017 | 550,000 | — | 437,577 | (3) | 104,371 | 21,102 | (4) | 1,113,050 | |||||||||||
and Chief Executive Officer | 2016 | 550,000 | — | 2,031,840 | 98,600 | 20,988 | 2,701,428 | |||||||||||||
2015 | 68,750 | 451,000 | (5) | 630,000 | — | 2,414 | 1,152,164 | |||||||||||||
Steven R. Fife, Chief | 2017 | 86,308 | 25,000 | (7) | 442,800 | 12,375 | 241,257 | (8) | 807,740 | |||||||||||
Financial Officer (6) | ||||||||||||||||||||
Ryan Goodwin, Chief | 2017 | 350,000 | — | 219,023 | (10) | 66,375 | 8,358 | (11) | 643,756 | |||||||||||
Marketing Officer (9) | ||||||||||||||||||||
Courtland Pearson, Senior Vice | 2017 | 239,583 | 75,000 | (13) | 300,743 | (14) | 27,188 | 2,796 | (15) | 645,310 | ||||||||||
President of International (12) | ||||||||||||||||||||
Justin Rose, Chief Sales Officer (16) | 2017 | 340,000 | — | 219,023 | (10) | 38,250 | 17,224 | (17) | 614,497 | |||||||||||
2016 | 323,436 | (19) | — | 676,281 | (20) | 83,338 | (21) | 10,325 | (22) | 1,093,380 | ||||||||||
Mark Jaggi, Former Chief | 2017 | 206,889 | — | — | 24,375 | 126,614 | (20) | 357,878 | ||||||||||||
Financial Officer (19) | 2016 | 294,688 | — | 695,961 | — | — | 990,649 | |||||||||||||
Gary Koos, Former Interim Chief | 2017 | 64,149 | (22) | — | — | — | — | 64,149 | ||||||||||||
Financial Officer (21) | ||||||||||||||||||||
(1) | The amounts in the current year in this column represent the aggregate grant date fair value of stock awards granted to the NEO in the applicable fiscal year under either our 2010 Long-Term Incentive Plan (the “2010 LTIP”) or our 2017 Long-Term Incentive Plan (the “2017 LTIP”) and computed in accordance with FASB ASC Topic 718. See Note 8 of the notes to our consolidated financial statements for a discussion of all assumptions made by the Company in determining the grant date fair values of its equity awards. Each NEO other than Messrs. Fife, Jaggi and Koos was granted performance-based RSUs (“PRSUs”) on March 28, 2017, the vesting of which is tied to the Company’s total shareholder return (“TSR”) during a three-year performance period commencing on January 1, 2017 and ending on December 31, 2019. The PRSUs granted to our NEOs in fiscal 2017 are described in greater detail in “Compensation Discussion and Analysis - Part II - Compensation Components - Long-Term Incentive Plan” above. In accordance with SEC rules, the grant date fair value reflected in the above table of an equity award that is subject to performance conditions is based on the probable outcome of the performance condition. Below in the footnotes related to each individual’s equity award we specify the grant date fair value assuming maximum achievement of the PRSUs. |
(2) | The amounts in this column reflect cash bonus awards earned by the NEOs under one of our cash incentive plans or, in the case of Mr. Jensen, pursuant to his fiscal year product line awards under our 2010 LTIP. |
(3) | Assuming the highest level of performance conditions will be achieved, the grant date fair value of the PRSUs awarded would be $875,154. |
(4) | Reflects reimbursements Mr. Jensen received for travel, including travel by Mr. Jensen’s spouse in the amount of $4,224, $270 for a cash holiday gift, $108 for a distributor event gift, and $16,500 in 401(k) matching contributions. |
(5) | Reflects a signing bonus paid to Mr. Jensen in connection with the commencement of his employment. |
(6) | Mr. Fife was hired as our Chief Financial Officer on March 13, 2017. Mr. Fife’s annualized salary during the fiscal year was $330,000. |
(7) | Reflects a signing bonus paid to Mr. Fife in connection with the commencement of his employment. |
(8) | Reflects relocation expenses paid by the Company in fiscal 2017 in the amount of $130,913, plus a tax gross-up payment thereon of $110,344 which will be paid to Mr. Fife in fiscal 2018. |
61
(9) | Mr. Goodwin was hired as our Chief Marketing Officer on October 19, 2015. |
(10) | Assuming the highest level of performance conditions will be achieved, the grant date fair value of the PRSUs awarded would be $438,046. |
(11) | Reflects reimbursements Mr. Goodwin received for travel, including travel by Mr. Goodwin’s spouse in the amount of $980, $270 for a cash holiday gift, $108 for a distributor event gift, and $7,000 in 401(k) matching contributions. |
(12) | Mr. Pearson was hired as our Senior Vice President, International, on July 2, 2016. |
(13) | Reflects a signing bonus paid to Mr. Pearson in connection with the commencement of his employment. |
(14) | Includes $219,023, the grant date fair value of the PRSUs granted on March 28, 2017, calculated based on the probable outcome of the performance condition applicable to such award. Assuming the highest level of performance conditions will be achieved, the grant date fair value of the PRSUs would be $438,046. |
(15) | Reflects reimbursements Mr. Pearson received for travel, including travel by Mr. Pearson’s family member(s) in the amount of $2,148, $270 for a cash holiday gift, $108 for a distributor event gift. |
(16) | Mr. Rose was hired as our Chief Sales Officer on July 21, 2015. |
(17) | Reflects reimbursements Mr. Rose received for travel, including travel by Mr. Rose’s spouse in the amount of $9,471, $270 for a cash holiday gift, $108 for a distributor event gift, and $7,375 in 401(k) matching contributions. |
(18) | Reflects relocation expenses paid by the Company in the amount of $8,170 and reimbursements for travel, including airfare, in the amount of $1,770 and $385 for a holiday cash gift. |
(19) | Mr. Jaggi’s employment with the Company was terminated effective January 18, 2017. |
(20) | Represents severance payments made pursuant to Mr. Jaggi's separation agreement. |
(21) | Mr. Koos served as our Interim Chief Financial Officer from January 18, 2017 through March 13, 2017. |
(22) | Mr. Koos was paid on an interim basis with Cerius Enterprises. This reflects the total paid to Cerius and may not be the total paid to Mr. Koos. |
Salary, Bonus and Non-Equity Incentive Plan Compensation in Proportion to Total Compensation
The amount of salary, bonus and non-equity incentive plan compensation awarded to, earned by, or paid to our NEOs for fiscal 2017 in proportion to the total compensation reported for each NEO who remained in service with us through the end of the fiscal year ranged from 16% in the case of Mr. Fife to 64% in the case of Mr. Goodwin.
GRANTS OF PLAN-BASED AWARDS
The following table sets forth information concerning the grants of non-equity incentive and equity incentive plan awards to our NEOs in fiscal 2017. Non-equity incentive plan awards are provided under our fiscal 2017 Annual Incentive Plan, or AIP, or, in the case of Mr. Jensen during fiscal 2017, pursuant to our 2010 LTIP. Equity incentive awards are provided under either our 2010 LTIP or, after its adoption, the 2017 LTIP. These non-equity and equity incentive plan awards are also described in “Compensation Discussion and Analysis-Part II-Compensation Components-Cash Incentive Plan” and “Compensation Discussion and Analysis-Part II-Compensation Components-Annual Incentive Plan-Long Term Incentive Plan.” Mr. Jaggi did not receive any grants of equity incentive plan awards due to his termination of employment with the Company effective January 18, 2017. Mr. Koos did not receive any grants of equity or non-equity incentive plan awards due to his interim role.
62
Name | Award Type (1) | Grant Date | Estimated Future Payouts Under Non-Equity Incentive Plan Awards (2) | Estimated Future Payouts Under Equity Incentive Plan Awards (3) | All Other Stock Awards: Number of Shares Or Units (#)(4) | Grant Date Fair Value of Stock and Option Awards ($)(5) | |||||||||||
Threshold ($) | Target ($) | Maximum ($) | Target (#) | Maximum (#) | |||||||||||||
Darren Jensen | PRSU | 3/28/2017 | — | — | — | 93,300 | 186,600 | — | 437,577 | ||||||||
AIP | n/a | 27,060 | 451,000 | 825,000 | — | — | — | — | |||||||||
2010 LTIP | n/a | — | — | 1,000,000 | (6) | — | — | — | — | ||||||||
Steven R. Fife | RSA | 3/28/2017 | — | — | — | — | — | 90,000 | 442,800 | ||||||||
AIP | n/a | 9,900 | 12,375 | — | (7) | — | — | — | — | ||||||||
Ryan Goodwin | PRSU | 3/28/2017 | — | — | — | 46,700 | 93,400 | — | 219,023 | ||||||||
AIP | n/a | 10,500 | 175,000 | 266,875 | — | — | — | — | |||||||||
Courtland Pearson | RSA | 9/14/2016 | — | — | — | — | — | 9,000 | 81,720 | ||||||||
PRSU | 3/28/2017 | — | — | — | 46,700 | 93,400 | — | 219,023 | |||||||||
AIP | n/a | 6,000 | 100,000 | 152,500 | — | — | — | — | |||||||||
Justin Rose | PRSU | 3/28/2017 | — | — | — | 46,700 | 73,400 | — | 219,023 | ||||||||
AIP | n/a | 10,200 | 170,000 | 259,250 | — | — | — | — | |||||||||
Mark Jaggi(8) | AIP | n/a | 9,750 | 162,500 | 247,813 | — | — | — | — | ||||||||
(1) | “AIP” denotes that the award was made pursuant to our fiscal 2017 annual incentive plan. “2010 LTIP” denotes a cash award made pursuant to our 2010 LTIP. “RSA” denotes an award of restricted stock that was made pursuant to our 2010 LTIP or our 2017 LTIP. “PRSU” denotes a performance-based restricted stock unit award that was made pursuant to our 2010 LTIP or our 2017 LTIP. |
(2) | The annual incentive plan (AIP) is a cash incentive plan that pays awards for performance, with awards for corporate performance metrics paid on an annual basis after the end of the applicable year and awards for individual performance metrics paid on a quarterly basis after the end of each applicable quarter. See our “Compensation Discussion and Analysis-Part II-Compensation Components-Cash Incentive Plans” for a detailed description of annual incentive plan awards. The amounts reported in the Threshold column reflect the lowest payout possible under the AIP, which would have been attributable to achievement at the minimum level of one fiscal quarter of individual performance goals. The amounts reported in the Target column reflect the at-target potential payout if the Company’s revenue and earnings per share for the fiscal year were at target and the NEO achieved all of the NEO’s individual performance metrics for the fiscal year. The amounts reported in the Maximum column reflect the maximum payout possible under the plan. Amounts for each NEO are based on a percentage of the NEO’s base salary set prior to the beginning of the fiscal year. |
(3) | Messrs. Jensen, Goodwin, Pearson and Rose were each granted PRSUs under the 2017 LTIP on March 28, 2017, the vesting of which is tied to the Company's TSR during a three-year performance period commencing on January 1, 2017 and ending on December 31, 2019. Vesting of 50% of the PRSUs is based on the Company’s absolute TSR for the performance period as compared to a matrix of fixed numeric values, and the vesting of the other 50% of the PRSUs is based on a relative comparison of the Company’s TSR to the Vanguard Russell 2000 exchange traded fund TSR for the performance period. The number of PRSUs eligible to vest is 0% to 200% of the target. The number of PRSUs shown in the target column represents the number of PRSUs that will vest if achievement is at 100% for the performance period, and the maximum reflects achievement at 200%. No threshold is applicable to the PRSUs. |
(4) | Messrs. Fife and Pearson were granted shares of restricted stock in connection with the commencement of their employment. These awards vest over three years in equal installments based on continued employment with the Company on each such date. See our “Compensation Discussion and Analysis -Part II-Compensation Components-Annual Incentive Plan-Long Term Incentive Plan” above and also the Outstanding Equity Awards table below for a description of restricted stock awards under our 2010 LTIP and our 2017 LTIP. |
(5) | We calculate the grant date fair value of each award in accordance with FASB ASC Topic 718 and as described in Footnote 1 to the “Summary Compensation Table,” above. In accordance with SEC rules, the grant date fair value of an award that is subject to a performance condition is based on the probable outcome of the performance condition. |
(6) | Mr. Jensen was eligible to receive cash incentive awards for fiscal 2017 related to revenue generated by three of our product lines. See our “Compensation Discussion and Analysis-Part II-Compensation Components-Cash Incentive Plans” for a detailed description of Mr. Jensen’s FY2017 Product Line Awards. The amount Mr. Jensen was eligible to receive pursuant to the FY2017 Product Line Awards in fiscal 2017 was a percentage of actual revenue generated with |
63
a maximum of $1,000,000 payable in the aggregate for the three product lines. No threshold or target level was applicable to such award.
(7) | Due to Mr. Fife’s partial year of employment with the Company, he was only eligible for a bonus under the AIP for fiscal 2017 related to his individual performance goals for our fourth fiscal quarter. As a result, full achievement would have occurred at the target level and no maximum was applicable. |
(8) | The amounts included in the table above as threshold, target and maximum for Mr. Jaggi do not reflect his termination of employment during fiscal 2017. As a result of his termination, he was only eligible to receive a bonus for the first two quarters of fiscal 2017 attributable to his individual performance goals. |
OUTSTANDING EQUITY AWARDS AT FISCAL YEAR-END
The following table sets forth information concerning all restricted stock and performance-based restricted stock units (“PRSUs”) held by our NEOs as of June 30, 2017. As of June 30, 2017, none of our NEOs held unexercised options.
Stock Awards | ||||||||||||
Name | Number of Shares or Units of Stock That Have Not Vested (#) | Market Value of Shares or Units of Stock That Have Not Vested ($)(1) | Equity Incentive Plan Awards: Number of Unearned Shares, Units or Other Rights That Have Not Vested (#) (2) | Equity Incentive Plan Awards: Market or Payout Value of Unearned Shares, Units or Other Rights That Have Not Vested ($)(3) | ||||||||
Darren Jensen | 142,858 | (4) | 618,575 | — | — | |||||||
— | — | 153,000 | (5) | 662,490 | ||||||||
— | — | 93,300 | (6) | 403,989 | ||||||||
Steven R. Fife | 90,000 | (7) | 389,700 | — | — | |||||||
Ryan Goodwin | 11,429 | (8) | 49,488 | — | — | |||||||
— | — | 46,000 | (5) | 199,180 | ||||||||
— | — | 46,700 | (6) | 202,211 | ||||||||
Courtland Pearson | 9,000 | (9) | 38,970 | — | — | |||||||
— | — | 46,700 | (6) | 202,211 | ||||||||
Justin Rose | 11,428 | (10) | 49,483 | — | — | |||||||
— | — | 46,000 | (5) | 199,180 | ||||||||
— | — | 46,700 | (6) | 202,211 | ||||||||
(1) | Computed in accordance with SEC rules as the number of unvested RSAs multiplied by the closing market price of our common stock at the end of the 2017 fiscal year, which was $4.33 on June 30, 2017 (the last business day of the 2017 fiscal year). The actual value (if any) to be realized by the NEO depends on whether the shares vest and the future performance of our common stock. |
(2) | In the event of a change in control prior to the end of the applicable performance period, the performance period will be deemed to end on the effective date of the change in control and performance determined as of such date. |
(3) | Computed in accordance with SEC rules as the number of unvested PRSUs multiplied by the closing market price of our common stock at the end of the 2017 fiscal year, which was $4.33 on June 30, 2017 (the last business day of the 2016 fiscal year). The actual value (if any) to be realized by the NEO depends on whether the performance milestones related thereto are achieved and the future performance of our common stock. |
(4) | These shares of restricted stock were granted on May 18, 2015 and vest in full on the third anniversary of Mr. Jensen’s commencement of employment with the Company, assuming continuous employment with the Company through such date. |
(5) | These PRSUs were granted under the 2010 LTIP on March 28, 2016. Vesting of the PRSUs is subject to continued service and the Company’s TSR during a three-year performance period commencing on January 1, 2016 and ending on December 31, 2018. Vesting of 50% of the PRSUs is based on the Company’s absolute TSR for the performance period as compared to a matrix of fixed numeric values, and the vesting of the other 50% of the PRSUs is based on a relative comparison of the Company’s TSR to the Vanguard Russell 2000 exchange traded fund TSR for the performance period. The number of PRSUs eligible to vest is 0% to 200% of the target in the case of all NEOs other than Mr. Jensen, for whom the maximum number of PRSUs eligible to vest is 116.7% of the target. The number of PRSUs in the table reflects performance at the 100% target level. |
64
(6) | These PRSUs were granted under the 2017 LTIP on March 28, 2017. Vesting of the PRSUs is subject to continued service and the Company’s TSR during a three-year performance period commencing on January 1, 2017 and ending on December 31, 2019. Vesting of 50% of the PRSUs is based on the Company’s absolute TSR for the performance period as compared to a matrix of fixed numeric values, and the vesting of the other 50% of the PRSUs is based on a relative comparison of the Company’s TSR to the Vanguard Russell 2000 exchange traded fund TSR for the performance period. The number of PRSUs eligible to vest is 0% to 200% of the target. The number of PRSUs in the table reflects performance at the 100% target level. |
(7) | These shares of restricted stock were granted on March 28, 2017 and vest in three equal annual installments beginning on March 13, 2018 assuming Mr. Fife's continuous employment with the Company through each such date. |
(8) | These shares of restricted stock are part of a restricted stock grant that was granted on January 4, 2016 and vested in three equal annual installments beginning on October 19, 2016 assuming Mr. Goodwin's continuous employment with the Company through each such date. |
(9) | These shares of restricted stock were granted on July 2, 2016 and vest in three equal annual installments beginning on July 2, 2017 assuming continuous employment with the Company through each such date. |
(10) | These shares of restricted stock were granted on July 27, 2015 and vest in three equal annual installments beginning on July 27, 2016 assuming continuous employment with the Company through each such date. |
2017 Long Term Incentive Plan
In December 2016, our board of directors adopted our 2017 Long-Term Incentive Plan, or 2017 LTIP. The 2017 LTIP replaced the 2010 Long Term Incentive Plan, or 2010 LTIP, for all equity-based awards granted to our NEOs and other employees. The 2017 LTIP was approved by our shareholders in February 2017. The 2017 LTIP permits the discretionary award of incentive stock options, non-statutory stock options, restricted stock, stock units, stock appreciation rights and performance-based cash awards to eligible service providers.
The 2017 LTIP reserves a maximum of 1,125,000 shares to be issued thereunder. 650,000 shares were immediately available to be issued on February 16, 2017, following the approval of the plan by our shareholders. Up to an additional 475,000 shares may become available for issuance under the 2017 LTIP, which consist of shares available for grant under the 2010 LTIP that were not issued or subject to outstanding awards plus shares subject to awards previously granted under the 2010 LTIP if they expire or lapse unexercised or are subsequently forfeited to or repurchased by the Company. As of June 30, 2017, 283,156 shares (of the 475,000 shares) have become available for grant under the 2017 LTIP. As of June 30, 2017, there were awards outstanding, net of awards expired, for an aggregate of 514,200 shares of our common stock under the 2017 LTIP.
2010 Long Term Incentive Plan
In 2010, we adopted our 2010 Long-Term Incentive Plan, or 2010 LTIP, which was approved by our shareholders in November 2010. The 2010 LTIP replaced the 2007 Long Term Incentive Plan for all equity-based awards granted to our NEOs and other employees. In September 2011, our board of directors approved an amendment to the 2010 LTIP to increase the number of shares of our common stock that are available for issuance under the 2010 Plan by 485,715 to 985,715. Our shareholders approved that amendment in January 2012.
In August 2014, our board of directors approved an amendment to the 2010 LTIP to increase the number of shares of our common stock that are available for issuance under the 2010 LTIP by 514,286 to 1,500,001, which was approved by our shareholders in November 2014.
Following the adoption of our 2017 LTIP, no further awards will be granted pursuant to the 2010 LTIP. As of June 30, 2017, there were awards outstanding, net of awards expired, under our 2010 LTIP for an aggregate of 606,857 shares of our common stock.
2007 Long Term Incentive Plan
We previously adopted and our shareholders approved the 2007 Long Term Incentive Plan, or the 2007 LTIP, effective November 21, 2006. A maximum of 1,428,572 shares of common stock could be issued under the 2007 LTIP in connection with the grant of awards. Awards to purchase common stock have been granted pursuant to the 2007 LTIP and are outstanding to various employees, officers, directors, members of our scientific advisory board and independent distributors at prices between $1.47 and $10.50 per share with respect to options to purchase common stock, vesting over one- to three-year periods. Awards expire in accordance with the terms of each award and the shares subject to the award are added back to the 2007 LTIP upon expiration of the award. As of June 30, 2017, there were awards outstanding, net of awards expired, for the purchase in aggregate of 227,188 shares of our common stock. As of June 30, 2017, there were 33,328 shares unallocated under the 2007 LTIP. This plan expired on November 21, 2016.
65
OPTION EXERCISES AND STOCK VESTED
The following table sets forth information concerning the common shares acquired by each of our NEOs upon the vesting of restricted stock awards during the fiscal year ended June 30, 2017. None of our NEOs (have been granted or) exercised any stock options during the fiscal year ended June 30, 2017.
Stock Awards | ||||||
Name | Number of Shares Acquired on Vesting (#) | Value Realized on Vesting ($)(1) | ||||
Darren Jensen | — | — | ||||
Steven R. Fife | — | — | ||||
Ryan Goodwin | 5,714 | 52,053 | ||||
Courtland Pearson | — | — | ||||
Justin Rose | 5,715 | 82,753 | ||||
Mark Jaggi | 5,715 | 79,324 | ||||
Gary Koos | — | — | ||||
(1) | Value realized upon vesting of stock awards was determined by multiplying the number of shares of restricted stock that vested by the fair market value of our common stock on the vesting date. |
PENSION BENEFITS
We do not maintain any defined benefit pension plans.
NONQUALIFIED DEFERRED COMPENSATION
We do not maintain any nonqualified deferred compensation plans.
POTENTIAL PAYMENTS UPON TERMINATION OR CHANGE IN CONTROL
As of June 30, 2017, all of our NEOs other than Messrs. Jaggi and Koos were eligible to receive contractually-provided severance benefits under the terms of their respective employment agreements or key executive benefit package agreements, as applicable. Mr. Jaggi would not have been entitled to benefits on June 30, 2017, as a result of his departure from the Company prior to such date. Mr. Koos, having served as our Interim Chief Financial Officer, was not eligible for severance benefits due to service through an agreement with Cerius Interim Executive Solutions. See “Compensation Discussion and Analysis-Part III-Other Matters-Employment Agreements” and “Compensation Discussion and Analysis-Part III-Other Matters-Severance or Change-in-Control Agreements,” above.
Upon retirement or separation from service for reasons that do not trigger the contractually-provided severance benefits under the terms of their respective employment agreements or key executive benefit package agreements, as applicable, NEOs are entitled to certain accrued benefits and payments generally afforded other employees.
The table below provides estimates for compensation payable to each of our NEOs under hypothetical termination of employment and change in control scenarios under our compensatory arrangements other than nondiscriminatory arrangements generally available to salaried employees. Due to the number of factors and assumptions that can affect the nature and amount of any benefits provided upon the events discussed below, any amounts paid or distributed upon an actual event may differ.
For purposes of the hypothetical payment estimates shown in the below table, some of the important assumptions were:
• | Executive’s rate of base salary as of June 30, 2017; |
• | Full acceleration of all unvested equity awards held by the Executive upon a change in control, except for the 2016 performance-based restricted stock units (the “2016 PRSUs”) and the 2017 performance-based restricted stock units (the “2017 PRSUs”), for which awards no value has been attributed to vesting acceleration, as the achievement of the applicable performance metrics for such awards would have been determined as of June 30, 2017 and no portion of either the 2016 PRSUs or the 2017 PRSUs would have been eligible to vest as of that date; |
• | Cash severance as provided under the NEO’s employment agreement or key executive benefit package agreement, as applicable, in effect as of June 30, 2017; |
• | Change in control occurring on June 30, 2017; |
• | Termination of the NEO’s employment occurring on June 30, 2017; and |
66
• | A price per share of $4.33, which was the closing price of our common stock on June 30, 2017, the final trading day of fiscal 2017. |
Each of the columns in the table below show the total hypothetical payment estimate upon a specified event and the amounts in the columns should not be aggregated across the table.
Involuntary Termination ($)(1) | Involuntary Termination within 12 months after a Change in Control ($)(2) | ||||||
Darren Jensen | |||||||
Base salary continuation | 275,000 | 550,000 | |||||
Acceleration of vesting of equity awards | — | (3) | 618,575 | ||||
Total | 275,000 | 1,168,575 | |||||
Steven R. Fife | |||||||
Base salary continuation | 165,000 | 165,000 | |||||
Acceleration of vesting of equity awards | — | 389,700 | |||||
Total | 165,000 | 554,700 | |||||
Ryan Goodwin | |||||||
Base salary continuation | 175,000 | 175,000 | |||||
Acceleration of vesting of equity awards | — | (3) | 49,488 | ||||
Total | 175,000 | 224,488 | |||||
Courtland Pearson | |||||||
Base salary continuation | 125,000 | 125,000 | |||||
Acceleration of vesting of equity awards | — | 38,970 | |||||
Total | 125,000 | 163,970 | |||||
Justin Rose | |||||||
Base salary continuation | 170,000 | 170,000 | |||||
Acceleration of vesting of equity awards | — | (3) | 49,483 | ||||
Total | 170,000 | 219,483 | |||||
(1) | For purposes of this table, an involuntary termination consists of our termination of their respective employment without cause or their resignation for good reason. See “Compensation Discussion and Analysis-Part III-Other Matters-Employment Agreements” and “Compensation Discussion and Analysis-Part III-Other Matters-Severance or Change-in-Control Agreements,” above. |
(2) | For purposes of this table, an involuntary termination within 12 months after a change in control consists of, with respect to Mr. Jensen, the termination of his employment without cause or his resignation for good reason. See “Compensation Discussion and Analysis-Part III-Other Matters-Employment Agreements” and “Compensation Discussion and Analysis-Part III-Other Matters-Severance or Change-in-Control Agreements,” above. |
(1) | No value has been included for the 2016 PRSUs granted to Messrs. Jensen, Goodwin and Rose, which provide for a pro-rated portion of such PRSUs to remain eligible to vest if the executive is terminated without cause during the performance period, with the performance determined at the end of the performance period. Assuming both the performance period and termination without cause had occurred on June 30, 2017, no portion of the 2016 PRSUs would have been eligible to vest. |
COMPENSATION COMMITTEE INTERLOCKS AND INSIDER PARTICIPATION
The current members of the compensation committee are Messrs. Beindorff, Greer and Metzger, with Mr. Metzger serving as chair. Our board of directors has determined that all three members of the compensation committee qualify as "independent" under NASDAQ Rules. There are no interlocking relationships between any of our executive officers and compensation committee members, on the one hand, and the executive officers and compensation committee members of any other companies, on the other hand, nor have any such interlocking relationships existed in the past.
Compensation Committee Report
The following report has been submitted by the compensation committee of our board of directors:
The compensation committee has reviewed and discussed our Compensation Discussion and Analysis with management. Based on this review and discussion, the compensation committee recommended to the board of directors that the
67
Compensation Discussion and Analysis be included in our Annual Report on Form 10-K for the fiscal year ended June 30, 2017.
The Compensation Committee | ||
George E. Metzger, Chair | ||
Michael Beindorff | ||
Raymond B. Greer | ||
The preceding “Compensation Committee Report” shall not be deemed soliciting material or filed with the SEC, nor shall any information in this report be incorporated by reference into any past or future filing under the Securities Act of 1933, as amended, or the Securities Exchange Act of 1934, as amended, except to the extent the company specifically incorporates it by reference into such filing.
DIRECTOR COMPENSATION
Fiscal 2017
For fiscal 2017 our non-employee director compensation consisted of (i) monthly retainers for Board service and for service as chairman of our board of directors and the chair of one of the standing Board committees and (ii) equity awards granted on an annual basis to continuing non-employee directors and granted to new non-employee directors, as described below. Our directors who are also our employees receive no additional compensation for their service on our board of directors.
Non-Employee Director Compensation
Cash Compensation. Each non-employee director receives a monthly retainer for their service as directors as follows: $6,000 for the chairman of our board of directors, $5,500 for the chairs of our audit and compensation committees and $5,000 for all other non-employee directors.
Equity Compensation. Each non-employee director will receive the following annual equity awards in connection with each annual meeting of our shareholders or initial equity award upon joining our board of directors:
• | Annual Equity Awards - On the date of the next regular annual meeting of shareholders after the annual meeting of shareholders at which a continuing non-employee director is re-elected (the “Election Date”) (for example, for continuing non-employee directors re-elected at and having an Election Date of the fiscal 2016 annual meeting of shareholders, the fiscal 2017 annual meeting of shareholders), each such continuing non-employee director who continues to serve as a member of our board of directors immediately prior to the next regular annual meeting of shareholders following the Election Date will receive a fully vested stock award for a number of shares of our common stock determined as follows: $75,000 divided by the “average stock price” and rounded down to the nearest whole share, with the “average stock price” calculated by averaging the closing prices of a share of our common stock on the last trading day of the calendar month (each, a “Month End”) for each Month End occurring between the Election Date and date of the next regular annual meeting of shareholders. |
• | Initial Equity Awards - On the one year anniversary of the non-employee director joining our board of directors, each new non-employee director will receive an award for that number of shares of our common stock determined as follows: $150,000 divided by the “average stock price” and rounded down to the nearest whole share, with the “average stock price” calculated by averaging the closing prices of a share of our common stock on the last trading day of the month for each of the twelve months prior to the one year anniversary of the non-employee director joining our board. |
The table below summarizes the compensation we paid to our non-employee directors for fiscal 2017:
Name | Fees Earned or Paid in Cash ($) | Stock Awards ($)(1) | All Other Compensation | Total ($) | |||||||
Michael A. Beindorff | 60,000 | 49,948 | — | 109,948 | |||||||
Raymond B. Greer | 25,000 | — | (2) | — | 25,000 | ||||||
Vinayak R. Hegde | 25,000 | — | (2) | 25,000 | |||||||
Darwin K. Lewis | 25,000 | — | (2) | 25,000 | |||||||
David Manovich | 40,000 | 49,948 | (3) | 89,948 | |||||||
Garry Mauro | 72,000 | 49,948 | — | 121,948 | |||||||
George E. Metzger | 66,000 | 49,948 | — | 115,948 | |||||||
Richard Okumoto | 66,000 | 49,948 | — | 115,948 | |||||||
David Toole | 60,000 | 113,777 | — | 173,777 | |||||||
68
(1) | These amounts represent the grant date fair value of restricted stock awards granted by the Company during the period presented, determined in accordance with FASB ASC Topic 718. For the assumptions used in our valuations, see Note 8 of the notes to our consolidated financial statements for a discussion of all assumptions made by the Company in determining the grant date fair values of its equity awards. |
(2) | There were no stock awards granted to these Directors during fiscal 2017. |
(3) | Mr. Manovich served as a non-employee director until the annual meeting of stockholders held in February 2017. |
The table below summarizes the unexercised stock options, all of which are fully vested, held by our non-employee directors as of June 30, 2017:
Option Awards | |||||||||
Name | Number of Securities Underlying Unexercised Options (#) Exercisable | Number of Securities Underlying Unexercised Options (#) Unexercisable | Option Exercise Price ($) | ||||||
Michael A. Beindorff | 14,286 | — | 9.31 | ||||||
Garry Mauro | 14,286 | — | 2.10 | ||||||
Garry Mauro | 17,143 | — | 1.47 | ||||||
Garry Mauro | 17,143 | — | 1.75 | ||||||
Garry Mauro | 17,143 | — | 5.60 | ||||||
Garry Mauro | 14,286 | — | 9.31 | ||||||
ITEM 12 — SECURITY OWNERSHIP OF CERTAIN BENEFICIAL OWNERS AND MANAGEMENT AND RELATED STOCKHOLDER MATTERS.
The following table sets forth certain information regarding the ownership of our common stock as of August 31, 2017 by: (i) each director; (ii) each of our named executive officers; and (iii) all of our executive officers and directors as a group. As of August 31, 2017, other than those individuals listed on the chart below, no other individuals were known to us to own beneficially more than five percent of our common stock. The shares disclosed in this table are based upon information supplied to us by the foregoing parties and filings made by such parties with the SEC.
Except as otherwise noted, the address for each person listed below is c/o LifeVantage Corporation, 9785 South Monroe Street, Suite 300, Sandy, Utah 84070.
69
The percentages of beneficial ownership set forth below are based on 14,228,144 shares of our common stock issued and outstanding as of August 31, 2017.
Name of Beneficial Owner(1) | Number of Shares | Percent of Class | ||||
Principal Shareholders | ||||||
Dell Loy Hansen | 711,839 | (2) | 5.00 | % | ||
595 S. Riverwoods Pkwy, Suite 400 | ||||||
Logan, UT 84321 | ||||||
Directors and Named Executive Officers | ||||||
Michael A. Beindorff | 54,978 | (3) | * | |||
Raymond B. Greer | — | |||||
Vinayak R. Hegde | — | |||||
Darwin K. Lewis | — | |||||
Garry P. Mauro | 135,140 | (4) | * | |||
George Metzger | 32,637 | (5) | * | |||
Richard Okumoto | 32,708 | (6) | * | |||
David Toole | 16,662 | (7) | * | |||
Darren J. Jensen | 146,958 | (8) | 1.03 | % | ||
Steven R. Fife | 90,000 | (9) | * | |||
Ryan Goodwin | 17,143 | (10) | * | |||
Courtland Pearson | 9,000 | (11) | * | |||
Justin Rose | 14,316 | (12) | * | |||
Charles Wach | 4,000 | (13) | * | |||
Mark Jaggi | — | |||||
Gary Koos | — | |||||
All executive officers and directors (14 persons) | 553,542 | (14) | 3.86 | % | ||
(1) | The shares of our common stock beneficially owned are reported on the basis of regulations of the SEC governing the determination of beneficial ownership of securities. Under the rules of the SEC, a person is deemed to be a “beneficial owner” of a security if that person has or shares voting power, which includes the power to vote or direct the voting of such security, or investment power, which includes the power to dispose of or to direct the disposition of such security. A person is also deemed to be a beneficial owner of any securities of which that person has a right to acquire beneficial ownership within 60 days. Securities that can be so acquired are deemed to be outstanding for purposes of computing such person's ownership percentage, but not for purposes of computing any other person's percentage. Under these rules, more than one person may be deemed beneficial owner of the same securities and a person may be deemed to be a beneficial owner of securities as to which such person has no economic interest. This table is based upon information supplied by officers, directors and principal shareholders and Schedules 13D and 13G filed with the SEC. Except as otherwise indicated in these footnotes and subject to community property laws where applicable, each of the beneficial owners has, to our knowledge, sole voting and investment power with respect to the indicated shares of common stock. |
(2) | Based solely upon a Schedule 13D filed on July 17, 2015, by Dell Loy Hansen and Hansen Guaranty, LLC. According to the Schedule 13D, adjusted for our October 19, 2015 reverse stock split, Dell Loy Hansen has sole voting and dispositive power with respect to 191,000 shares and shared voting and dispositive power with respect to 520,839 shares. Hansen Guaranty, LLC has shared voting and dispositive power with respect to 520,839 shares. |
(3) | Includes 38,865 shares held directly by Mr. Beindorff, 1,501 shares owned by Mr. Beindorff's spouse which he is deemed to beneficially own, and 326 shares owned by Mr. Beindorff's spouse in a custodial account for their minor children, which Mr. Beindorff is deemed to beneficially own. Also includes the following shares which Mr. Beindorff has the right to acquire or will have the right to acquire within 60 days of August 31, 2017 upon the exercise of options: 14,286 shares at an exercise price of $9.31 per share. |
(4) | Includes 55,221 shares directly owned by Mr. Mauro, 225 shares owned by Mr. Mauro's spouse which he is deemed to beneficially own, and 694 shares owned by Mr. Mauro in a custodial account for his minor children, which he is deemed to beneficially own. Also includes the following shares which Mr. Mauro has the right to acquire or will have the right to acquire within 60 days of August 31, 2017 upon the exercise of options: 14,286 |
70
shares at an exercise price of $2.10 per share, 17,143 shares at an exercise price of $1.47 per share, 17,143 shares at an exercise price of $1.75 per share, 17,143 shares at an exercise price of $5.60 per share and 14,286 shares at an exercise price of $9.31 per share.
(5) | Consists of 32,637 shares directly owned by Mr. Metzger. |
(6) | Consists of 32,708 shares directly owned by Mr. Okumoto. |
(7) | Consists of 16,662 shares directly owned by Mr. Toole. |
(8) | Consists of 4,100 shares directly owned by Mr. Jensen and 142,858 shares held pursuant to a Restricted Stock Award. |
(9) | Consists of 90,000 shares held pursuant to a Restricted Stock Award. |
(10) | Includes 5,714 shares directly owned by Mr. Goodwin and 11,429 shares held pursuant to a Restricted Stock Award. |
(11) | Consists of 3,000 shares directly owned by Mr. Pearson and 6,000 shares held pursuant to a Restricted Stock Award. |
(12) | Consists of 8,602 shares directly owned by Mr. Rose and 5,714 shares held pursuant to a Restricted Stock Award. |
(13) | Consists of 4,000 shares held pursuant to a Restricted Stock Award. |
(14) | Consists of 455,255 shares directly owned by our executive officers and directors as a group and 94,287 shares which our executive officers and directors as a group have the right to acquire or will have the right to acquire within 60 days of August 31, 2017. |
Securities Authorized for Issuance Under Equity Compensation Plans
The following table provides certain information as of June 30, 2017 with respect to all compensation plans under which shares of our common stock are authorized for issuance.
(a) | (b) | (c) | (d) | ||||||
Number of securities to be issued upon exercise of outstanding options, warrants and rights and vesting of restricted stock awards (#) | Weighted-average exercise price of outstanding options, warrants and rights ($) | Number of securities remaining available for future issuance under equity compensation plans (excluding securities reflected in column (b)) (#) | |||||||
All equity compensation plans approved by security holders | 1,348,245 | (1) | 6.35 | (2) | 633,051 | ||||
Equity compensation plans not approved by security holders | — | — | — | ||||||
(1) | Includes 309,473 shares of our common stock that can be issued upon the exercise of outstanding options and 1,038,772 shares of our common stock that can be issued upon vesting of restricted stock awards and PRSUs. |
(2) | Does not take into account outstanding restricted stock awards and PRSUs, as those awards have no exercise price. |
ITEM 13 — CERTAIN RELATIONSHIP AND RELATED TRANSACTIONS, AND DIRECTORS INDEPENDENCE
Related-Party Transactions Policies and Procedures
Related-party transactions have the potential to create actual or perceived conflicts of interest between our company and our directors and executive officers or their immediate family members. Under its charter, our audit committee is charged with the responsibility of reviewing and approving all related-party transactions. To assist in identifying such transactions for our fiscal year ended June 30, 2016, we distributed questionnaires to each of our directors and officers.Although we do not have a formal policy with regard to approving related-party transactions, our audit committee may consider the following factors when deciding whether to approve a related-party transaction: the nature of the related party's interest in the transaction; the material terms of the transaction, including, without limitation, the amount and type of the transaction; the importance of the transaction
71
to the related party; whether the transaction would impair the judgment of a director or executive officer to act in our best interests; and any other matters deemed appropriate by our audit committee.
Certain Related-Party Transactions
In the last fiscal year, there have been four transactions or series of similar transactions to which the Company was or is to be a party in which the amount involved exceeds $120,000 and in which any director, executive officer, holder of more than 5% of our common stock or any member of the immediate family of any of the foregoing persons had or will have a direct or indirect material interest.
During fiscal 2017, Dinng, a brand and digital brand studio, provided branding and marketing services to the Company. In June 2017, the Company completed an acquisition of the assets of Dinng. The Company paid a total of $0.5 million for branding and marketing services provided during fiscal 2017 and the asset acquisition. The Company paid $0.5 million for branding and marketing services provided during fiscal 2016. The Company's Chief Marketing Officer, Ryan Goodwin, was the Founder, President and Creative Director of Dinng. Mr. Goodwin and his wife were both salaried employees at Dinng during fiscal 2017, prior to the completion of the asset acquisition.
Effective January 2014, the Company commenced a partnership with Real Salt Lake of Major League Soccer, which includes the placement of the Company's logo on the front of the team’s jersey as well as strategic placement of the Company's logo around the stadium and on televised broadcasts of the games. In July 2015, Dell Loy Hansen, the sole owner of Real Salt Lake and Real Monarchs SLC, became a major stockholder of the Company. During the fiscal years ended June 30, 2017, 2016 and 2015, the Company paid $2.2 million, $2.8 million and $0.2 million, respectively, to Real Salt Lake, pursuant to the terms of this partnership, and other various amounts for the endorsement of Real Monarchs SLC and for product marketing expenses.
During fiscal 2017, Outhink Inc., a digital media and application development company, provided consulting services to the Company pursuant to an Agreement for Services dated October 20, 2016 between the Company and Outhink Inc. in the amount of $0.1 million. David Toole, a member of the Company's board of directors, is the majority owner and serves as the Chief Executive Officer of Outhink Inc.
During fiscal 2017, the Company entered into an agreement with Gig Economy Group ("GEG") for outsourced software application development services. Pursuant to the agreement, the Company paid $0.4 million and will pay a total of $1.2 million under the terms of the agreement. David Toole, a member of the Company's board of directors, is the majority owner and an officer of GEG.
Director Independence
NASDAQ Stock Market Rules, or NASDAQ Rules, require that a majority of the members of our board of directors qualify as "independent," as affirmatively determined by our board of directors. Our board of directors has determined that each of Messrs. Beindorff, Greer, Hegde, Lewis, Mauro, Metzger and Okumoto is an “independent director” under NASDAQ Rules.
ITEM 14 — PRINCIPAL ACCOUNTING FEES AND SERVICES
Principal Accountant Fees and Services
EKS&H LLLP (“EKS&H”) reviewed the Company's interim quarterly filings for the periods ended September 30, 2015 and December 31, 2015. On April 8, 2016 the audit committee dismissed EKS&H as the Company's independent registered public accounting firm. In connection reviews of the Company’s interim periods through April 8, 2016, there were no disagreements with EKS&H on any matters of accounting principles or practices, financial statement disclosure or auditing scope or procedure, which, if not resolved to the satisfaction of EKS&H, would have caused EKS&H to make reference to the matter in their report. In addition, during the interim period through April 8, 2016, there were no reportable events described under Item 304(a)(1)(v) of Regulation S-K.
Effective as of April 12, 2016, the audit committee engaged BDO USA, LLP (“BDO”) as the Company’s independent registered public accounting firm for the fiscal year ending June 30, 2016. On July 7, 2016, the audit committee dismissed BDO as the Company’s independent registered public accounting firm, effective immediately, due to BDO’s determination that it was not independent of the Company with respect to the Company’s fiscal year ended June 30, 2016 and not for any reason related to the Company’s financial reporting or accounting operations or policies. BDO concluded that it was not independent of the Company with respect to fiscal 2016 because, during fiscal 2016 but prior to BDO’s appointment as the Company’s independent registered public accounting firm, a firm in the BDO international network had provided certain prohibited non-audit services as a subcontractor to a third party contractor who had been engaged to provide payroll services to an international subsidiary of the Company. BDO was engaged by the Company on April 12, 2016 and as a result did not deliver an audit report on the financial statements of the Company for the fiscal year ended June 30, 2016. At no point during BDO’s engagement were there any (i) disagreements with BDO on any matter of accounting principles or practices, financial statement disclosure or auditing scope or procedure, which, if not resolved to the satisfaction of BDO would have caused it to make
72
reference to the subject matter of the disagreement in connection with its report, or (ii) “reportable events” as defined in Item 304(a)(1)(v) of Regulation S-K.
Effective as of July 11, 2016, the audit committee engaged WSRP, LLC as the Company’s independent registered public accounting firm for the interim periods subsequent to the dismissals of EKS&H and BDO and for the fiscal years ended June 30, 2017 and 2016.
The following table presents fees for professional audit services rendered by EKS&H LLLP for fiscal years ended June 30, 2017 and 2016:
EKS&H LLLP | Fiscal year ended June 30, | |||||||
2017 | 2016 | |||||||
Audit Fees (1) | $ | 27,085 | $ | 156,966 | ||||
Audit-Related Fees | — | — | ||||||
Tax Fees (2) | 2,000 | 91,434 | ||||||
All Other Fees | — | — | ||||||
$ | 29,085 | $ | 248,400 | |||||
(1) | Audit Fees consist of fees billed for the review of interim financial statements. |
(2) | Tax Fees consisted of fees billed for professional services for tax compliance, tax advice and tax planning. |
The following table presents fees for professional audit services rendered by BDO USA, LLP for fiscal years ended June 30, 2017 and 2016:
BDO USA, LLP | Fiscal year ended June 30, | |||||||
2017 | 2016 | |||||||
Audit Fees (1) | $ | — | $ | — | ||||
Audit-Related Fees (2) | 15,994 | — | ||||||
Tax Fees | — | — | ||||||
All Other Fees | — | — | ||||||
$ | 15,994 | $ | — | |||||
(1) | Audit Fees consist of fees billed for the review of interim financial statements. |
(2) | Audit-Related Fees consist of fees billed for the audit of our employee benefit plan. |
The following table presents fees for professional audit services rendered by WSRP, LLC for fiscal years ended June 30, 2017 and 2016:
WSRP, LLC | Fiscal year ended June 30, | |||||||
2017 | 2016 | |||||||
Audit Fees (1) | $ | 241,228 | $ | 194,843 | ||||
Audit-Related Fees | — | — | ||||||
Tax Fees (2) | — | — | ||||||
All Other Fees | — | — | ||||||
$ | 241,228 | $ | 194,843 | |||||
(1) | Audit Fees consist of fees billed for the audit of annual financial statements and internal control over financial reporting and the review of interim financial statements. |
(2) | Tax Fees consisted of fees billed for professional services for tax compliance, tax advice and tax planning. |
Pre-Approval Policies and Procedures
73
The audit committee has adopted policies and procedures for the pre-approval of audit and non-audit services rendered by our independent registered public accounting firm. The policies require pre-approval of all auditing and such non-auditing services as our independent registered public accounting firm is permitted to provide, subject to de minimus exceptions for services other than audit, review, or attest services that are approved by the audit committee prior to completion of the audit. All of the items identified under “Audit-Related Fees,” “Tax Fees” and “All Other Fees” above were approved by the audit committee. Alternatively, the engagement of our independent registered public accounting firm may be entered into pursuant to pre-approved policies and procedures that our audit committee may establish, so long as these policies and procedures are detailed as to particular services and the audit committee is informed of each service. In making these determinations, the audit committee will consider whether the services provided are compatible with maintaining the independence of the independent registered public accounting firm. We are prohibited by applicable law from obtaining certain non-audit services from our independent registered public accounting firm and, in that event, we would obtain these non-audit services from other providers.
Our audit committee has considered whether the provision of non-audit services is compatible with maintaining the independence of our independent registered public accounting firm and determined that it is consistent with such independence.
PART IV
ITEM 15 — EXHIBITS, FINANCIAL STATEMENT SCHEDULES
The following documents are being filed as part of this report:
Financial Statements
See the information beginning on page F-1 of this report.
Exhibits
See the Exhibit Index following the signature page of this report.
74
SIGNATURES
Pursuant to the requirements of Section 13 or 15(d) of the Securities Exchange Act of 1934, the registrant duly caused this report to be signed on its behalf by the undersigned, thereunto duly authorized.
LifeVantage Corporation. a Colorado corporation | |
By: | /s/ Darren Jensen |
Darren Jensen | |
President and Chief Executive Officer | |
Date: | September 7, 2017 |
Each person whose individual signature appears below hereby constitutes and appoints Darren Jensen and Steven Fife, and each of them, with full power of substitution and resubstitution and full power to act without the other, as his or her true and lawful attorney-in-fact and agent to act in his or her name, place and stead and to execute in the name and on behalf of each person, individually and in each capacity stated below, and to file any and all amendments to this report, and to file the same, with all exhibits thereto, and other documents in connection therewith, with the Securities and Exchange Commission, granting unto said attorneys-in-fact and agents, and each of them, full power and authority to do and perform each and every act and thing, ratifying and confirming all that said attorneys-in-fact and agents or any of them or their or his substitute or substitutes may lawfully do or cause to be done by virtue thereof.
Pursuant to the requirements of the Securities Exchange Act of 1934, this report has been signed below by the following persons on behalf of the registrant and in the capacities and on the dates indicated.
75
Signature | Date | Title | ||
/s/ Darren Jensen | September 7, 2017 | President and Chief Executive Officer (Principal Executive Officer) | ||
Darren Jensen | ||||
/s/ Steven R. Fife | September 7, 2017 | Chief Financial Officer (Principal Financial Officer and Principal Accounting Officer) | ||
Steven R. Fife | ||||
/s/ Garry Mauro | September 7, 2017 | Chairman of the Board | ||
Garry Mauro | ||||
/s/ Michael A. Beindorff | September 7, 2017 | Director | ||
Michael A. Beindorff | ||||
/s/ George E. Metzger | September 7, 2017 | Director | ||
George E. Metzger | ||||
/s/ Richard Okumoto | September 7, 2017 | Director | ||
Richard Okumoto | ||||
/s/ Dave Toole | September 7, 2017 | Director | ||
Dave Toole | ||||
/s/ Raymond B. Greer | September 7, 2017 | Director | ||
Raymond B. Greer | ||||
/s/ Vinayak R. Hedge | September 7, 2017 | Director | ||
Vinayak R. Hedge | ||||
/s/ Darwin K. Lewis | September 7, 2017 | Director | ||
Darwin K. Lewis | ||||
76
EXHIBIT INDEX
Exhibit No. | Document Description | Filed Herewith or Incorporated by Reference From | ||
3.1(a) | Exhibit to 4.1 to Registration Statement on Form S-8 (File No. 333-200363) filed on November 19, 2014. | |||
3.1(b) | Exhibit 3.1(b) to Form 10-Q for the fiscal quarter ended September 30, 2015 filed on November 4, 2015. | |||
3.2(a) | Exhibit 3.2 to Form 10-K for the fiscal year ended June 30, 2011 filed on September 28, 2011. | |||
3.2(b) | Exhibit to 3.1 Form 8-K filed on May 31, 2012. | |||
4.1 | Exhibit 4.2 to Form 8-K filed on November 18, 2009. | |||
4.2 | Exhibit 4.3 to Form 10-Q for the fiscal quarter ended December 31, 2010 filed on February 16, 2010. | |||
4.3 | Exhibit 4.5 to Form 10-Q for the fiscal quarter ended December 31, 2009 filed on February 16, 2010. | |||
4.4 | Exhibit 4.2 to Form 10-Q for the fiscal quarter ended March 31, 2010 filed on May 14, 2010. | |||
4.5 | Exhibit (a)(1)(ii) to Schedule TO filed on November 29, 2011. | |||
10.1 | Exhibit 10.21 to Form 10-K/A for the fiscal year ended June 30, 2009 filed October 28, 2009. | |||
10.2# | Exhibit 10.14 to Form 10-K for the fiscal year ended June 30, 2010 filed on September 15, 2010. | |||
10.3 | Exhibit 10.1 to Form 8-K filed on November 18, 2009. | |||
10.4 | Exhibit 10.3 to Form 10-Q for the fiscal quarter ended December 31, 2009 filed on February 16, 2010. | |||
10.5 | Exhibit 10.1 to Form 10-Q for the fiscal quarter ended March 31, 2010 filed on May 14, 2010. | |||
10.6 | Exhibit 10.2 to Form 10-Q for the fiscal quarter ended March 31, 2010 filed on May 14, 2010. | |||
10.7 | Exhibit 10.3 to Form 10-Q for the fiscal quarter ended March 31, 2010 filed on May 14, 2010. | |||
77
Exhibit No. | Document Description | Filed Herewith or Incorporated by Reference From | ||
10.8 | Exhibit 10.4 to Form 10-Q for the fiscal quarter ended March 31, 2010 filed on May 14, 2010. | |||
10.9# | Appendix B to Proxy Statement on Schedule 14A filed on October 20, 2006. | |||
10.10(a)# | Annex A to Proxy Statement on Schedule A filed on October 6, 2014. | |||
10.10(b)# | Exhibit 4.4 to Registration Statement on Form S-8 (File No. 333-175104) filed on June 23, 2011. | |||
10.10(c)# | Exhibit 4.5 to Registration Statement on Form S-8 (File No. 333-175104) filed on June 23, 2011. | |||
10.10(d)# | Exhibit 10.3 to Form 10-Q for the fiscal quarter ended March 31, 2016 filed on May 4, 2016. | |||
10.11# | Exhibit 10.13 to Form 10-K for the fiscal year ended June 30, 2014 filed on September 10, 2014. | |||
10.12# | Exhibit 10.14 to Form 10-K for the fiscal year ended June 30, 2014 filed on September 10, 2014. | |||
10.13# | Exhibit 10.15 to Form 10-K for the fiscal year ended June 30, 2015 filed on September 1, 2015. | |||
10.14# | Exhibit 10.16 to Form 10-K for the fiscal year ended June 30, 2015 filed on September 1, 2015. | |||
10.15# | Exhibit 10.17 to Form 10-K for the fiscal year ended June 30, 2015 filed on September 1, 2015. | |||
10.16# | Exhibit 10.16 to the Form 10-K for the fiscal year ended June 30, 2016 filed on December 12, 2016. | |||
10.17# | Exhibit 10.17 to the Form 10-K for the fiscal year ended June 30, 2016 filed on December 12, 2016. | |||
10.18# | Exhibit 10.14 to Form 10-K for the fiscal year ended June 30, 2013 filed on September 12, 2013. | |||
10.19# | Exhibit 10.15 to Form 10-K for the fiscal year ended June 30, 2013 filed on September 12, 2013. | |||
10.20# | Exhibit 10.19 to Form 10-K for the fiscal year ended June 30, 2015 filed on September 1, 2015. | |||
10.21# | Exhibit 10.21 to the Form 10-K for the fiscal year ended June 30, 2016 filed on December 12, 2016. | |||
78
Exhibit No. | Document Description | Filed Herewith or Incorporated by Reference From | ||
10.22# | Exhibit 10.1 to Form 8-K filed on February 20, 2015. | |||
10.23# | Exhibit 10.1 to Form 8-K filed on April 29, 2015. | |||
10.24# | Exhibit 10.25 to Form 10-K for the fiscal year ended June 30, 2015 filed on September 1, 2015. | |||
10.25# | Exhibit 10.28 to Form 10-K for the fiscal year ended June 30, 2015 filed on September 1, 2015. | |||
10.26 | Exhibit 10.3 to Form 10-Q for the fiscal quarter ended September 30, 2011 filed on November 14, 2011. | |||
10.27 | Exhibit 10.1 to Form 10-Q for the fiscal quarter ended September 30, 2012 filed on November 8, 2012. | |||
10.28 | Exhibit 10.3 to Form 10-Q for the fiscal quarter ended March 31, 2014 filed on May 6, 2014. | |||
10.29* | Exhibit 10.1 to Form 10-Q for the fiscal quarter ended March 31, 2014 filed on May 6, 2014. | |||
10.30* | Exhibit 10.1 to Form 10-Q/A for the fiscal quarter ended March 31, 2013 filed on May 24, 2013. | |||
10.31* | Exhibit 10.2 to Form 10-Q/A for the fiscal quarter ended March 31, 2013 filed on May 24, 2013. | |||
10.32* | Exhibit 10.29 to Form 10-K for the fiscal year ended June 30, 2014 filed on September 10, 2014. | |||
10.33* | Exhibit 10.30 to Form 10-K for the fiscal year ended June 30, 2014 filed on September 10, 2014. | |||
10.34# | Exhibit (b) to the Schedule TO-I/A filed on October 18, 2013. | |||
10.35# | Exhibit 10.1 to Form 10-Q for the quarter ended March 31, 2015 filed on May 6, 2015. | |||
79
Exhibit No. | Document Description | Filed Herewith or Incorporated by Reference From | ||
10.36 | Exhibit 10.39 to Form 10-K for the fiscal year ended June 30, 2015 filed on September 1, 2015. | |||
10.37 | Exhibit 10.1 to Form 8-K filed on January 8, 2016. | |||
10.38 | Exhibit 10.1 to Form 8-K filed on April 4, 2016. | |||
10.39 | Exhibit 10.2 to Form 8-K filed on April 4, 2016. | |||
10.40# | Exhibit 99.2 to Form 8-K filed on December 12, 2016. | |||
10.41# | Exhibit 10.1 to Form 8-K filed on January 18, 2017. | |||
10.42# | Exhibit 10.1 to Form 10-Q filed for the fiscal quarter ended December 31, 2016 filed on February 8, 2017. | |||
10.43# | Exhibit 10.1 to Form 8-K filed on March 9, 2017. | |||
10.44# | Exhibit 10.2 to Form 8-K filed on March 9, 2017. | |||
10.45# | Exhibit 10.1 to Form 10-Q filed for the fiscal quarter ended March 31, 2017 filed on May 10, 2017. | |||
10.46# | Exhibit 10.5 to Form 10-Q filed for the fiscal quarter ended March 31, 2017 filed on May 10, 2017. | |||
10.47# | Exhibit 10.6 to Form 10-Q filed for the fiscal quarter ended March 31, 2017 filed on May 10, 2017. | |||
10.48# | Exhibit 99.1 to the Registration Statement on Form S-8 (File No. 333-216957) filed on March 27, 2017 | |||
10.49# | Exhibit 99.2 to the Registration Statement on Form S-8 (File No. 333-216957) filed on March 27, 2017 | |||
10.50# | Exhibit 99.3 to the Registration Statement on Form S-8 (File No. 333-216957) filed on March 27, 2017 | |||
21.1 | Exhibit 21.1 to Form 10-K for the fiscal year ended June 30, 2014 filed on September 10, 2014. | |||
23.1 | Filed herewith. | |||
80
Exhibit No. | Document Description | Filed Herewith or Incorporated by Reference From | ||
23.2 | Filed herewith. | |||
24.1 | Power of Attorney | Signature page to this report. | ||
31.1 | Filed herewith. | |||
31.2 | Filed herewith. | |||
32.1 | Furnished herewith. | |||
32.2 | Furnished herewith. | |||
101 | The following financial information from the registrant’s Annual Report on Form 10-K for the year ended June 30, 2017 formatted in XBRL (eXtensible Business Reporting Language): (i) Consolidated Balance Sheets; (ii) Consolidated Statements of Operations and Other Comprehensive Income; (iii) Consolidated Statement of Stockholders’ Deficit; (iv) Consolidated Statements of Cash Flows; and (v) Notes to Consolidated Financial Statements, tagged as blocks of text. | Filed herewith. | ||
# | Management contract or compensatory plan. | |
* | The Company has been granted confidential treatment for portions of this agreement. Accordingly, certain portions of this agreement have been omitted in the version filed with this report and such confidential portions have been filed with the SEC. | |
81
LIFEVANTAGE CORPORATION
Index to Consolidated Financial Statements
F - 1
REPORT OF INDEPENDENT REGISTERED PUBLIC ACCOUNTING FIRM
The Board of Directors and Stockholders
LifeVantage Corporation
Sandy, Utah
We have audited the accompanying consolidated balance sheets of LifeVantage Corporation and subsidiaries (the "Company") as of June 30, 2017 and 2016 and the related consolidated statements of operations and comprehensive income, stockholders’ equity, and cash flows for each of the two years in the period ended June 30, 2017. These consolidated financial statements are the responsibility of the Company’s management. Our responsibility is to express an opinion on these consolidated financial statements based on our audits.
We conducted our audits in accordance with the standards of the Public Company Accounting Oversight Board (United States). Those standards require that we plan and perform the audits to obtain reasonable assurance about whether the financial statements are free of material misstatement. An audit includes examining, on a test basis, evidence supporting the amounts and disclosures in the financial statements, assessing the accounting principles used and significant estimates made by management, as well as evaluating the overall financial statement presentation. We believe that our audit provides a reasonable basis for our opinion.
In our opinion, the consolidated financial statements referred to above present fairly, in all material respects, the financial position of the Company at June 30, 2017 and 2016, and the results of its operations and its cash flows for each of the two years in the period ended June 30, 2017, in conformity with accounting principles generally accepted in the United States of America.
We also have audited, in accordance with the standards of the Public Company Accounting Oversight Board (United States), the Company’s internal control over financial reporting as of June 30, 2017, based on criteria established in Internal Control - Integrated Framework (2013) issued by the Committee of Sponsoring Organizations of the Treadway Commission (COSO) and our report dated September 7, 2017 expressed an unqualified opinion thereon.
WSRP, LLC
Salt Lake City, Utah
September 7, 2017
F - 2
REPORT OF INDEPENDENT REGISTERED PUBLIC ACCOUNTING FIRM
The Board of Directors and Stockholders
LifeVantage Corporation
Sandy, Utah
We have audited LifeVantage Corporation and subsidiaries' (the "Company") internal control over financial reporting as of June 30, 2017, based on criteria established in Internal Control - Integrated Framework (2013) issued by the Committee of Sponsoring Organizations of the Treadway Commission (the COSO criteria). The Company's management is responsible for maintaining effective internal control over financial reporting and for its assessment of the effectiveness of internal control over financial reporting, included in the accompanying Item 9A, Managements Report on Internal Control Over Financial Reporting. Our responsibility is to express an opinion on the Company's internal control over financial reporting based on our audit.
We conducted our audit in accordance with the standards of the Public Company Accounting Oversight Board (United States). Those standards require that we plan and perform the audit to obtain reasonable assurance about whether effective internal control over financial reporting was maintained in all material respects. Our audit included obtaining an understanding of internal control over financial reporting, assessing the risk that a material weakness exists, and testing and evaluating the design and operating effectiveness of internal control based on the assessed risk. Our audit also included performing such other procedures as we considered necessary in the circumstances. We believe that our audit provides a reasonable basis for our opinion.
A company's internal control over financial reporting is a process designed to provide reasonable assurance regarding the reliability of financial reporting and the preparation of financial statements for external purposes in accordance with generally accepted accounting principles. A company's internal control over financial reporting includes those policies and procedures that (1) pertain to the maintenance of records that, in reasonable detail, accurately and fairly reflect the transactions and dispositions of the assets of the company; (2) provide reasonable assurance that transactions are recorded as necessary to permit preparation of financial statements in accordance with generally accepted accounting principles, and that receipts and expenditures of the company are being made only in accordance with authorizations of management and directors of the company; and (3) provide reasonable assurance regarding prevention or timely detection of unauthorized acquisition, use, or disposition of the company's assets that could have a material effect on the financial statements.
Because of its inherent limitations, internal control over financial reporting may not prevent or detect misstatements. Also, projections of any evaluation of effectiveness to future periods are subject to the risk that controls may become inadequate because of changes in conditions, or that the degree of compliance with the policies or procedures may deteriorate.
In our opinion, the Company maintained, in all material respects, effective internal control over financial reporting as of June 30, 2017, based on the COSO criteria.
We also have audited, in accordance with the standards of the Public Company Accounting Oversight Board (United States), the consolidated balance sheets of the Company as of June 30, 2017 and 2016, and the related consolidated statements of operations and comprehensive income, stockholders’ equity, and cash flows for each of the two years in the period ended June 30, 2017 and our report dated September 7, 2017 expressed an unqualified opinion thereon.
WSRP, LLC
Salt Lake City, Utah
September 7, 2017
F - 3
REPORT OF INDEPENDENT REGISTERED PUBLIC ACCOUNTING FIRM
The Board of Directors and Stockholders
LifeVantage Corporation
Sandy, Utah
We have audited the accompanying consolidated statements of operations and comprehensive income, stockholders’ equity, and cash flows of LifeVantage Corporation and subsidiaries (the “Company”) for the year ended June 30, 2015. The Company’s management is responsible for these financial statements. Our responsibility is to express an opinion on these financial statements based on our audit.
We conducted our audit in accordance with the standards of the Public Company Accounting Oversight Board (United States). Those standards require that we plan and perform the audit to obtain reasonable assurance about whether the financial statements are free of material misstatement. An audit also includes assessing the accounting principles used and significant estimates made by management, as well as evaluating the overall financial statement presentation. We believe that our audit provides a reasonable basis for our opinion.
In our opinion, the consolidated financial statements referred to above presents fairly, in all material respects, the results of operations and cash flows of LifeVantage Corporation and subsidiaries for the year ended June 30, 2015, in conformity with accounting principles generally accepted in the United States of America.
EKS&H LLLP
September 1, 2015
Denver, Colorado
F - 4
LIFEVANTAGE CORPORATION AND SUBSIDIARIES
CONSOLIDATED BALANCE SHEETS
June 30, | |||||||
2017 | 2016 | ||||||
(In thousands, except per share data) | (As revised) | ||||||
ASSETS | |||||||
Current assets | |||||||
Cash and cash equivalents | $ | 11,458 | $ | 7,883 | |||
Accounts receivable | 1,334 | 1,552 | |||||
Income tax receivable | 913 | — | |||||
Inventory, net | 16,575 | 25,116 | |||||
Current deferred income tax asset | — | 2,260 | |||||
Prepaid expenses and deposits | 5,266 | 6,301 | |||||
Total current assets | 35,546 | 43,112 | |||||
Property and equipment, net | 3,127 | 3,456 | |||||
Intangible assets, net | 1,247 | 1,744 | |||||
Long-term deferred income tax asset | 4,087 | 1,023 | |||||
Other long-term assets | 1,242 | 1,520 | |||||
TOTAL ASSETS | $ | 45,249 | $ | 50,855 | |||
LIABILITIES AND STOCKHOLDERS’ EQUITY | |||||||
Current liabilities | |||||||
Accounts payable | $ | 4,850 | $ | 8,891 | |||
Commissions payable | 6,837 | 7,719 | |||||
Income tax payable | 215 | 3,284 | |||||
Other accrued expenses | 9,453 | 8,734 | |||||
Current portion of long-term debt | 2,000 | 2,000 | |||||
Total current liabilities | 23,355 | 30,628 | |||||
Long-term debt | |||||||
Principal amount | 5,500 | 7,500 | |||||
Less: unamortized discount and deferred offering costs | (60 | ) | (91 | ) | |||
Long-term debt, net of unamortized discount and deferred offering costs | 5,440 | 7,409 | |||||
Other long-term liabilities | 1,927 | 2,169 | |||||
Total liabilities | 30,722 | 40,206 | |||||
Commitments and contingencies — Note 11 | |||||||
Stockholders’ equity | |||||||
Preferred stock — par value $0.001, 50,000 shares authorized, no shares issued or outstanding | — | — | |||||
Common stock — par value $0.001, 250,000 shares authorized and 14,232 and 14,028 issued and outstanding as of June 30, 2017 and 2016, respectively | 14 | 14 | |||||
Additional paid-in capital | 121,599 | 119,242 | |||||
Accumulated deficit | (106,992 | ) | (108,600 | ) | |||
Accumulated other comprehensive loss | (94 | ) | (7 | ) | |||
Total stockholders’ equity | 14,527 | 10,649 | |||||
TOTAL LIABILITIES AND STOCKHOLDERS’ EQUITY | $ | 45,249 | $ | 50,855 | |||
The accompanying notes are an integral part of these consolidated financial statements.
F - 5
LIFEVANTAGE CORPORATION AND SUBSIDIARIES
CONSOLIDATED STATEMENTS OF OPERATIONS AND COMPREHENSIVE INCOME
For the years ended June 30, | |||||||||||
2017 | 2016 | 2015 | |||||||||
(As revised) | (As revised) | ||||||||||
(In thousands, except per share data) | |||||||||||
Revenue, net | $ | 199,489 | $ | 206,540 | $ | 190,336 | |||||
Cost of sales | 33,456 | 33,932 | 28,010 | ||||||||
Gross profit | 166,033 | 172,608 | 162,326 | ||||||||
Operating expenses: | |||||||||||
Commissions and incentives | 96,662 | 103,120 | 91,074 | ||||||||
Selling, general and administrative | 64,922 | 56,074 | 57,353 | ||||||||
Total operating expenses | 161,584 | 159,194 | 148,427 | ||||||||
Operating income | 4,449 | 13,414 | 13,899 | ||||||||
Other expense: | |||||||||||
Interest expense | (570 | ) | (3,321 | ) | (3,087 | ) | |||||
Other expense, net | (969 | ) | (1,409 | ) | (159 | ) | |||||
Total other expense | (1,539 | ) | (4,730 | ) | (3,246 | ) | |||||
Income before income taxes | 2,910 | 8,684 | 10,653 | ||||||||
Income tax expense | (1,302 | ) | (2,578 | ) | (3,528 | ) | |||||
Net income | $ | 1,608 | $ | 6,106 | $ | 7,125 | |||||
Net income per share: | |||||||||||
Basic | $ | 0.12 | $ | 0.44 | $ | 0.51 | |||||
Diluted | $ | 0.11 | $ | 0.42 | $ | 0.50 | |||||
Weighted-average shares outstanding: | |||||||||||
Basic | 13,881 | 13,730 | 13,899 | ||||||||
Diluted | 14,118 | 14,531 | 14,150 | ||||||||
Other comprehensive income (loss), net of tax: | |||||||||||
Foreign currency translation adjustment | (87 | ) | 244 | (135 | ) | ||||||
Other comprehensive income (loss), net of tax: | (87 | ) | 244 | (135 | ) | ||||||
Comprehensive income | $ | 1,521 | $ | 6,350 | $ | 6,990 | |||||
The accompanying notes are an integral part of these consolidated financial statements.
F - 6
LIFEVANTAGE CORPORATION AND SUBSIDIARIES
CONSOLIDATED STATEMENTS OF STOCKHOLDERS’ EQUITY
For the years ended June 30, 2017, 2016 and 2015
Common Stock | Additional Paid-In Capital | Accumulated Deficit | Accumulated Other Comprehensive Income (Loss) | Total | ||||||||||||||||||
Shares | Amount | |||||||||||||||||||||
(In thousands) | ||||||||||||||||||||||
Balances, June 30, 2014, as revised | 14,601 | $ | 15 | $ | 114,423 | $ | (111,989 | ) | $ | (116 | ) | $ | 2,333 | |||||||||
Stock-based compensation | — | — | 1,737 | — | — | 1,737 | ||||||||||||||||
Exercise of options and warrants | 376 | — | 589 | — | — | 589 | ||||||||||||||||
Issuance of shares related to restricted stock | 189 | — | — | — | — | — | ||||||||||||||||
Shares canceled or surrendered as payment of tax withholding | (129 | ) | — | — | — | — | — | |||||||||||||||
Repurchase of company stock | (1,079 | ) | (1 | ) | — | (9,842 | ) | — | (9,843 | ) | ||||||||||||
Currency translation adjustment | — | — | — | — | (135 | ) | (135 | ) | ||||||||||||||
Net income | — | — | — | 7,125 | — | 7,125 | ||||||||||||||||
Balances, June 30, 2015, as revised | 13,958 | $ | 14 | $ | 116,749 | $ | (114,706 | ) | $ | (251 | ) | $ | 1,806 | |||||||||
Stock-based compensation | — | — | 1,966 | — | — | 1,966 | ||||||||||||||||
Exercise of options and warrants | 52 | — | 527 | — | — | 527 | ||||||||||||||||
Issuance of shares related to restricted stock | 76 | — | — | — | — | — | ||||||||||||||||
Shares canceled or surrendered as payment of tax withholding | (58 | ) | — | — | — | — | — | |||||||||||||||
Currency translation adjustment | — | — | — | — | 244 | 244 | ||||||||||||||||
Net income | — | — | — | 6,106 | — | 6,106 | ||||||||||||||||
Balances, June 30, 2016, as revised | 14,028 | $ | 14 | $ | 119,242 | $ | (108,600 | ) | $ | (7 | ) | $ | 10,649 | |||||||||
Stock-based compensation | — | — | 2,315 | — | — | 2,315 | ||||||||||||||||
Exercise of options and warrants | 76 | — | 42 | — | — | 42 | ||||||||||||||||
Issuance of shares related to restricted stock | 166 | — | — | — | — | — | ||||||||||||||||
Shares canceled or surrendered as payment of tax withholding | (38 | ) | — | — | — | — | — | |||||||||||||||
Currency translation adjustment | — | — | — | — | (87 | ) | (87 | ) | ||||||||||||||
Net income | — | — | — | 1,608 | — | 1,608 | ||||||||||||||||
Balances, June 30, 2017 | 14,232 | $ | 14 | $ | 121,599 | $ | (106,992 | ) | $ | (94 | ) | $ | 14,527 | |||||||||
The accompanying notes are an integral part of these consolidated financial statements.
F - 7
LIFEVANTAGE CORPORATION AND SUBSIDIARIES
CONSOLIDATED STATEMENTS OF CASH FLOWS
For the years ended June 30, | |||||||||||
2017 | 2016 | 2015 | |||||||||
(In thousands) | (As revised) | (As revised) | |||||||||
Cash Flows from Operating Activities: | |||||||||||
Net income | $ | 1,608 | $ | 6,106 | $ | 7,125 | |||||
Adjustments to reconcile net income to net cash provided by operating activities: | |||||||||||
Depreciation and amortization | 1,643 | 1,895 | 2,285 | ||||||||
Loss on disposal of fixed assets | — | 1,186 | — | ||||||||
Stock-based compensation | 2,647 | 2,621 | 1,806 | ||||||||
Amortization of deferred financing fees | 12 | 232 | 255 | ||||||||
Amortization of debt discount | 19 | 183 | 198 | ||||||||
Write-off of capitalized debt transaction costs pursuant to debt refinance | — | 1,544 | — | ||||||||
Write-off of intangible assets | 350 | — | — | ||||||||
Deferred income tax | (740 | ) | (2,118 | ) | (796 | ) | |||||
Changes in operating assets and liabilities: | |||||||||||
Accounts receivable | 160 | (409 | ) | 149 | |||||||
Income tax receivable | (912 | ) | 2,179 | 2,502 | |||||||
Inventory, net | 8,309 | (15,650 | ) | (936 | ) | ||||||
Prepaid expenses and deposits | 3,318 | (356 | ) | 1,269 | |||||||
Other long-term assets | 103 | 258 | 826 | ||||||||
Accounts payable | (6,210 | ) | 3,673 | (171 | ) | ||||||
Income tax payable | (3,132 | ) | 1,481 | 966 | |||||||
Other accrued expenses | 135 | 2,243 | (2,170 | ) | |||||||
Other long-term liabilities | (713 | ) | 968 | (87 | ) | ||||||
Net Cash Provided by Operating Activities | 6,597 | 6,036 | 13,221 | ||||||||
Cash Flows from Investing Activities: | |||||||||||
Purchase of equipment | (1,055 | ) | (562 | ) | (1,159 | ) | |||||
Net Cash Used in Investing Activities | (1,055 | ) | (562 | ) | (1,159 | ) | |||||
Cash Flows from Financing Activities: | |||||||||||
Proceeds from term loan | — | 10,000 | — | ||||||||
Payment of deferred financing fees | — | (99 | ) | — | |||||||
Excess tax benefits from stock-based compensation | — | 266 | 128 | ||||||||
Repurchase of company stock | — | — | (9,850 | ) | |||||||
Payment on term loan | (2,000 | ) | (22,125 | ) | (9,200 | ) | |||||
Exercise of options and warrants | 42 | 261 | 468 | ||||||||
Net Cash Used in Financing Activities | (1,958 | ) | (11,697 | ) | (18,454 | ) | |||||
Foreign Currency Effect on cash | (9 | ) | 201 | (90 | ) | ||||||
Increase (decrease) in cash and cash equivalents | 3,575 | (6,022 | ) | (6,482 | ) | ||||||
Cash and Cash Equivalents — beginning of period | 7,883 | 13,905 | 20,387 | ||||||||
Cash and Cash Equivalents — end of period | $ | 11,458 | $ | 7,883 | $ | 13,905 | |||||
The accompanying notes are an integral part of these consolidated financial statements.
F - 8
LIFEVANTAGE CORPORATION AND SUBSIDIARIES
CONSOLIDATED STATEMENTS OF CASH FLOWS
For the years ended June 30, | |||||||||||
2017 | 2016 | 2015 | |||||||||
Non Cash Investing and Financing Activities: | |||||||||||
Increase in property and equipment/other long-term liabilities | $ | 116 | $ | — | $ | — | |||||
SUPPLEMENTAL DISCLOSURE OF CASH FLOW INFORMATION | |||||||||||
Cash paid for interest | $ | 438 | $ | 1,342 | $ | 2,633 | |||||
Cash paid for income taxes | $ | 5,496 | $ | 1,368 | $ | 1,658 | |||||
Common stock shares issued upon cashless warrant exercises | 53 | 6 | 252 | ||||||||
Total cashless exercise price of warrants | $ | 88 | $ | 9 | $ | 1,462 | |||||
Gross warrants underlying cashless exercises | 63 | 6 | 418 | ||||||||
The accompanying notes are an integral part of these consolidated financial statements.
F - 9
LIFEVANTAGE CORPORATION AND SUBSIDIARIES
NOTES TO CONSOLIDATED FINANCIAL STATEMENTS
Note 1 — The Company
LifeVantage Corporation (the "Company") is a company focused on nutrigenomics, the study of how nutrition and naturally occurring compounds affect our genes. The Company is dedicated to helping people achieve their health, wellness and financial independence goals. The Company provides quality, scientifically-validated products and a financially rewarding direct sales business opportunity to preferred customers, retail customers and independent distributors who seek a healthy lifestyle and financial freedom. The Company sells its products in the United States, Japan, Hong Kong, Australia, Canada, Mexico, Thailand, the United Kingdom and the Netherlands.
The Company engages in the identification, research, development and distribution of advanced nutraceutical dietary supplements and skin care products, including Protandim®, its line of scientifically-validated dietary supplements, TrueScience®, its line of anti-aging skin care products, Petandim™ for Dogs, its companion pet supplement formulated to combat oxidative stress in dogs, Axio®, its Smart Energy Drink mixes, and PhysIQ™, its Smart Weight Management System.
The Company was incorporated in Colorado in June 1988 under the name Andraplex Corporation. The Company changed its corporate name to Yaak River Resources, Inc. in January 1992, and subsequently changed it again in October 2004 to Lifeline Therapeutics, Inc. In October 2004 and March 2005, the Company acquired all of the outstanding common stock of Lifeline Nutraceuticals Corporation. In November 2006, the Company changed its name to LifeVantage Corporation.
Note 2 — Summary of Significant Accounting Policies
Revision of Previously Issued Financial Statements for Correction of Immaterial Errors
During the preparation of our fiscal 2017 tax provision, management discovered immaterial errors regarding foreign book-to-tax differences and the reconciliation of balance sheet accounts impacted by the income tax provision.
Pursuant to the guidance of SEC Staff Accounting Bulletin (“SAB”) No. 99, Materiality, management concluded that the errors were not material to any of the Company's prior period financial statements. Although the errors were immaterial to prior periods, the prior period financial statements were revised, in accordance with SAB No. 108, Considering the Effects of Prior Year Misstatements when Quantifying Misstatements in Current Year Financial Statements. Prior period amounts stated in this Form 10-K have been revised to facilitate comparability between current and prior year periods.
The following tables summarize the impact and financial statement line items affected by the revisions:
As of June 30, 2016 (in thousands) | |||||||||||
Consolidated Balance Sheet: | As Reported | Adjustments | As Revised | ||||||||
Current deferred income tax asset | $ | 2,776 | $ | (516 | ) | $ | 2,260 | ||||
Prepaid expenses and deposits | 5,082 | 1,219 | 6,301 | ||||||||
Total current assets | 42,409 | 703 | 43,112 | ||||||||
Long-term deferred income tax asset | 1,130 | (107 | ) | 1,023 | |||||||
Total assets | 50,259 | 596 | 50,855 | ||||||||
Income tax payable | 1,206 | 2,078 | 3,284 | ||||||||
Total current liabilities | 28,550 | 2,078 | 30,628 | ||||||||
Total liabilities | 38,128 | 2,078 | 40,206 | ||||||||
Additional paid-in capital | 120,150 | (908 | ) | 119,242 | |||||||
Accumulated deficit | (108,076 | ) | (524 | ) | (108,600 | ) | |||||
Accumulated other comprehensive income (loss) | 43 | (50 | ) | (7 | ) | ||||||
Total stockholders’ equity | 12,131 | (1,482 | ) | 10,649 | |||||||
Total liabilities and stockholders' equity | 50,259 | 596 | 50,855 | ||||||||
F - 10
For the year ended June 30, 2016 (in thousands, except per share data) | |||||||||||
Statement of Operations and Comprehensive Income: | As Reported | Adjustments | As Revised | ||||||||
Income tax expense | $ | (2,665 | ) | $ | 87 | $ | (2,578 | ) | |||
Net income | 6,019 | 87 | 6,106 | ||||||||
Net income per share: | |||||||||||
Basic | 0.44 | 0.44 | |||||||||
Diluted | 0.41 | 0.42 | |||||||||
Foreign currency translation adjustment | 294 | (50 | ) | 244 | |||||||
Other comprehensive income (loss), net of tax: | 294 | (50 | ) | 244 | |||||||
Comprehensive income | 6,313 | 37 | 6,350 | ||||||||
For the year ended June 30, 2015 (in thousands, except per share data) | |||||||||||
Statement of Operations and Comprehensive Income: | As Reported | Adjustments | As Revised | ||||||||
Income tax expense | $ | (3,666 | ) | $ | 138 | $ | (3,528 | ) | |||
Net income | 6,987 | $ | 138 | $ | 7,125 | ||||||
Net income per share: | |||||||||||
Basic | 0.50 | $ | 0.51 | ||||||||
Diluted | 0.49 | $ | 0.50 | ||||||||
Comprehensive income | 6,852 | $ | 138 | $ | 6,990 | ||||||
Statements of Stockholders' Equity | ||||||||||||||||||||||
Common Stock | Additional Paid-In Capital | Accumulated Deficit | Accumulated Other Comprehensive Income (Loss) | Total | ||||||||||||||||||
(In thousands) | Shares | Amount | ||||||||||||||||||||
Balances, June 30, 2014, as reported | 14,601 | $ | 15 | $ | 115,331 | $ | (111,240 | ) | $ | (116 | ) | $ | 3,990 | |||||||||
Adjustments | — | — | (908 | ) | (749 | ) | — | (1,657 | ) | |||||||||||||
Balances, June 30, 2014, as revised | 14,601 | $ | 15 | $ | 114,423 | $ | (111,989 | ) | $ | (116 | ) | $ | 2,333 | |||||||||
Balances, June 30, 2015, as reported | 13,958 | $ | 14 | $ | 117,657 | $ | (114,095 | ) | $ | (251 | ) | $ | 3,325 | |||||||||
Adjustments | — | — | (908 | ) | (611 | ) | — | (1,519 | ) | |||||||||||||
Balances, June 30, 2015, as revised | 13,958 | $ | 14 | $ | 116,749 | $ | (114,706 | ) | $ | (251 | ) | $ | 1,806 | |||||||||
Balances, June 30, 2016, as reported | 14,028 | $ | 14 | $ | 120,150 | $ | (108,076 | ) | $ | 43 | $ | 12,131 | ||||||||||
Adjustments | — | — | (908 | ) | (524 | ) | (50 | ) | (1,482 | ) | ||||||||||||
Balances, June 30, 2016, as revised | 14,028 | $ | 14 | $ | 119,242 | $ | (108,600 | ) | $ | (7 | ) | $ | 10,649 | |||||||||
For the year ended June 30, 2016 (in thousands) | |||||||||||
Consolidated Statement of Cash Flows | As Reported | Adjustments | As Revised | ||||||||
Cash Flows from Operating Activities: | |||||||||||
Net income | $ | 6,019 | $ | 87 | $ | 6,106 | |||||
Deferred income tax | (2,491 | ) | 373 | (2,118 | ) | ||||||
Prepaid expenses and deposits | 392 | (748 | ) | (356 | ) | ||||||
Income tax payable | 1,143 | 338 | 1,481 | ||||||||
Net Cash Provided by Operating Activities | 5,986 | 50 | 6,036 | ||||||||
Foreign Currency Effect on cash | 251 | (50 | ) | 201 | |||||||
Increase (decrease) in cash and cash equivalents | (6,022 | ) | — | (6,022 | ) | ||||||
F - 11
For the year ended June 30, 2015 (in thousands) | |||||||||||
As Reported | Adjustments | As Revised | |||||||||
Cash Flows from Operating Activities: | |||||||||||
Net income | $ | 6,987 | $ | 138 | $ | 7,125 | |||||
Deferred income tax | 91 | (887 | ) | (796 | ) | ||||||
Prepaid expenses and deposits | 1,486 | (217 | ) | 1,269 | |||||||
Income tax payable | — | 966 | 966 | ||||||||
Net Cash Provided by Operating Activities | 13,221 | — | 13,221 | ||||||||
Increase (decrease) in cash and cash equivalents | (6,482 | ) | — | (6,482 | ) | ||||||
Consolidation
The consolidated financial statements include the accounts of the Company and its wholly-owned subsidiaries. All significant intercompany accounts and transactions are eliminated in consolidation. Certain other prior period balances have also been reclassified to conform to the current period presentation.
Use of Estimates
The Company prepares the consolidated financial statements and related disclosures in conformity with accounting principles generally accepted in the United States of America (GAAP). In preparing these statements, the Company is required to use estimates and assumptions that affect the reported amounts of assets and liabilities, the disclosure of contingent assets and liabilities at the date of the financial statements and the reported amounts of revenues and expenses during the reporting period. Actual results could differ materially from those estimates and assumptions. On an ongoing basis, the Company reviews its estimates, including those related to inventory valuation and obsolescence, sales returns, income taxes and tax valuation reserves, share-based compensation, and loss contingencies.
Foreign Currency Translation
A portion of the Company’s business operations occurs outside the United States. The local currency of each of the Company’s subsidiaries is generally its functional currency. All assets and liabilities are translated into U.S. Dollars at exchange rates existing at the balance sheet dates, revenue and expenses are translated at weighted-average exchange rates and stockholders’ equity is recorded at historical exchange rates. The resulting foreign currency translation adjustments are recorded as a separate component of stockholders’ equity in the consolidated balance sheets and as a component of comprehensive income. Transaction gains and losses are included in other expense, net in the consolidated statements of operations and comprehensive income.
Fair Value of Financial Instruments
Accounting guidance on fair value measurements and disclosures requires disclosures about the fair value for all financial instruments, whether or not recognized, for financial statement purposes. Disclosures about fair value of financial instruments are based on pertinent information available to management as of June 30, 2017 and 2016. Accordingly, the estimates presented in these consolidated financial statements are not necessarily indicative of the amounts that could be realized on disposition of the financial instruments.
Management has estimated the fair values of cash and cash equivalents, accounts receivable, accounts payable, commissions payable and other accrued expenses to approximate their respective carrying values reported in these consolidated financial statements because of their short maturities.
Cash and Cash Equivalents
The Company considers only its monetary liquid assets with original maturities of three months or less to be cash and cash equivalents.
Accounts Receivable
The Company’s accounts receivable for the years ended June 30, 2017 and 2016 consist primarily of credit card receivables. Based on the Company’s verification process for customer credit cards and historical information available, management has determined that an allowance for doubtful accounts on credit card sales related to its customer sales as of June 30, 2017 or 2016 is not necessary. No bad debt expense has been recorded for the years ended June 30, 2017, 2016 and 2015.
F - 12
Inventory
As of June 30, 2017 and 2016, inventory consisted of (in thousands):
June 30, | |||||||
2017 | 2016 | ||||||
Finished goods | $ | 7,817 | $ | 14,852 | |||
Raw materials | 8,758 | 10,264 | |||||
Total inventory | $ | 16,575 | $ | 25,116 | |||
Inventories are carried and depicted above at the lower of cost or market, using the first-in, first-out method, which includes a reduction in inventory values of $0.9 million and $0.4 million at June 30, 2017 and 2016, respectively, related to obsolete and slow-moving inventory.
Property and Equipment
Property and equipment are recorded at cost and depreciated using the straight-line method over the following useful lives:
Years | |
Equipment (includes computer hardware and software) | 3 |
Furniture and fixtures | 5 |
Vehicles | 5 |
Leasehold improvements are depreciated over the shorter of estimated useful life of the related asset or the lease term.
The cost of normal maintenance and repairs is charged to expense as incurred. When an asset is sold or otherwise disposed of, the cost and associated accumulated depreciation are removed from the accounts and the resulting gain or loss is recognized in the consolidated statements of operations and comprehensive income in other expense, net. Significant expenditures that increase the useful life of an asset are capitalized and depreciated over the estimated useful life of the asset. Property and equipment are reviewed for impairment whenever events or changes in circumstances indicate that the carrying amount of such assets may not be recoverable. An impairment loss is recognized if the carrying amount of the asset exceeds its fair value. During the year ended June 30, 2017, there were no losses on disposal of assets. During the year ended June 30, 2016, the Company recognized a loss on disposal of $1.2 million related to the write-off of previously capitalized software development costs incurred.
Intangible Assets
Intangible assets are stated at cost less accumulated amortization. Definite-lived intangible assets are amortized over their related useful lives, using a straight-line method, consistent with the underlying expected future cash flows related to the specific intangible asset. Definite-lived intangible assets are reviewed for impairment whenever events or changes in circumstances exist that indicate the carrying amount of an asset may not be recoverable. When indicators of impairment exist, an estimate of undiscounted net cash flows is used in measuring whether the carrying amount of the asset or related asset group is recoverable. Measurement of the amount of impairment, if any, is based upon the difference between the asset’s carrying value and estimated fair value.
Indefinite-lived intangible assets are not amortized; however, they are tested at least annually for impairment or more frequently if events or changes in circumstances exist that may indicate impairment. An impairment loss is recognized if the carrying amount of the asset exceeds its fair value. Annual impairment tests were completed resulting in no impairment charges for any of the periods shown. During the year ended June 30, 2017, the Company recognized a loss of $0.4 million upon write-off of previously capitalized indefinite-lived intangible assets.
Impairment of Long-Lived Assets
Pursuant to guidance established for impairment or disposal of assets, the Company assesses impairment whenever events or changes in circumstances indicate that the carrying amount of a long-lived asset may not be recoverable. When an assessment for impairment of long-lived assets, long-lived assets to be disposed of, and certain identifiable intangibles related to those assets is performed, the Company is required to compare the net carrying value of long-lived assets on the lowest level at which cash flows can be determined on a consistent basis to the related estimates of future undiscounted net cash flows for such assets. If the net carrying value exceeds the net cash flows, then an impairment is recognized to reduce the carrying value
F - 13
to the estimated fair value, generally equal to the future discounted net cash flow. Except as previously disclosed, for the years ended June 30, 2017 and 2016, management has concluded that there are no indications of impairment.
Concentration of Credit Risk
Accounting guidance for financial instruments requires disclosure of significant concentrations of credit risk regardless of the degree of such risk. Financial instruments with significant credit risk include cash and cash equivalents. At June 30, 2017, the Company had $8.2 million in cash accounts at one financial institution and $3.3 million in other financial institutions. As of June 30, 2017 and 2016, and during the years then ended, the Company’s cash balances exceeded federally insured limits.
Revenue Recognition
The Company ships the majority of its product directly to the consumer and receives substantially all payment for these sales in the form of credit card receipts. Revenue from direct product sales to customers is recognized upon shipment, which is when passage of title and risk of loss occurs. Estimated returns are recorded when product is shipped. Subject to some exceptions based on local regulations, the Company’s return policy is to provide a full refund for product returned within 30 days if the returned product is unopened or defective. After 30 days, the Company generally does not issue refunds to direct sales customers for returned product. The Company allows terminating distributors to return up to 30% of unopened, unexpired product that they have purchased within the prior twelve months for a full refund, less a 10% restocking fee. The Company establishes the returns reserve based on historical experience. The returns reserve is evaluated on a quarterly basis. As of June 30, 2017 and 2016, the Company’s reserve balance for returns and allowances was $0.4 million and $0.3 million, respectively.
Commissions and Incentives
Commissions and incentives expenses are the Company’s most significant expenses and are classified as operating expenses. Commissions and incentives expenses include sales commissions paid to the Company's independent distributors, special incentives, costs for incentive trips and other rewards. Commissions and incentives expenses do not include any amounts the Company pays to its independent distributors for personal purchases. Commissions paid to independent distributors on personal purchases are considered a sales discount and are reported as a reduction to net revenue.
Shipping and Handling
Shipping and handling costs associated with inbound freight and freight out to customers, including independent distributors, are included in cost of sales. Shipping and handling fees charged to all customers are included in sales.
Research and Development Costs
The Company expenses all costs related to research and development activities as incurred. Research and development expenses for the years ended June 30, 2017, 2016 and 2015 were $1.1 million, $1.0 million and $2.4 million, respectively.
Stock-Based Compensation
The Company recognizes stock-based compensation by measuring the cost of services to be rendered based on the grant date fair value of the equity award. The Company recognizes stock-based compensation, net of any estimated forfeitures, over the period an employee is required to provide service in exchange for the award, generally referred to as the requisite service period. For awards with market-based performance conditions, the cost of the awards is recognized as the requisite service is rendered by employees, regardless of when, if ever, the market-based performance conditions are satisfied.
The Black-Scholes option pricing model is used to estimate the fair value of stock options. The determination of the fair value of stock options is affected by the Company's stock price and a number of assumptions, including expected volatility, expected life, risk-free interest rate and expected dividends. The Company uses historical volatility as the expected volatility assumption required in the Black-Scholes model. The Company utilizes a simplified method for estimating the expected life of the options. The Company uses this method because it believes that it provides a better estimate than the Company’s historical data as post vesting exercises have been limited. The risk-free interest rate assumption is based on observed interest rates appropriate for the expected terms of the stock options.
The fair value of restricted stock grants is based on the closing market price of the Company's stock on the date of grant less the Company's expected dividend yield. The fair value of performance restricted stock units that include market-based performance conditions is based on the closing market price of the Company's stock on the date of grant less the Company's expected dividend yield, with further adjustments made to reflect the market conditions that must be satisfied in order for the units to vest by using a Monte-Carlo simulation model. Key assumptions for the Monte-Carlo simulation model include the risk-free rate, expected volatility, expected dividends and the correlation coefficient. The fair value of cash-settled
F - 14
performance-based awards, accounted for as liabilities, is remeasured at the end of each reporting period and is based on the closing market price of the Company’s stock on the last day of the reporting period. The Company recognizes compensation costs for awards with performance conditions when it concludes it is probable that the performance conditions will be achieved. The Company reassesses the probability of vesting at each balance sheet date and adjusts compensation costs accordingly.
Reverse Stock Split
In October 2015, following approval of the Company's shareholders, the Company's board of directors approved the filing of an amendment to the Company's amended and restated articles of incorporation to effectuate a reverse split of the issued and outstanding shares of the Company's common stock on a one-for-seven basis. The reverse stock split was effective on October 19, 2015. The par value and authorized number of shares of common stock were not adjusted as a result of the reverse split. All fractional shares resulting from the reverse stock split were rounded up. All issued and outstanding common stock and per share amounts contained within the Company's consolidated financial statements and footnotes have been retroactively adjusted to reflect this reverse stock split for all periods presented.
Income Taxes
Income taxes are accounted for under the asset and liability method. Deferred tax assets and liabilities are recognized for the future tax consequences attributable to differences between the financial statement carrying amounts of existing assets and liabilities and their respective tax bases and operating loss and tax credit carry-forwards. Deferred tax assets and liabilities are measured using statutory tax rates expected to apply to taxable income in the years in which those temporary differences are expected to be recovered or settled. The effect on deferred tax assets and liabilities from a change in tax rates is recognized in income in the period that includes the effective date of the change.
The Company recognizes tax liabilities or benefits from an uncertain position only if it is more likely than not that the position will be sustained upon examination by taxing authorities based on the technical merits of the issue. The amount recognized would be the largest liability or benefit that the Company believes has greater than a 50% likelihood of being realized upon settlement.
Income Per Share
Basic income per common share is computed by dividing the net income by the weighted-average number of common shares outstanding during the period, less unvested restricted stock awards. Diluted income per common share is computed by dividing net income by the weighted-average common shares and potentially dilutive common share equivalents using the treasury stock method.
The effects of approximately 0.2 million and 0.2 million common shares issuable upon exercise of options and non-vested shares of restricted stock outstanding as of June 30, 2017 and 2016, respectively, are not included in the computations as their effect was anti-dilutive.
The following is a reconciliation of net income per share and the weighted-average common shares outstanding for purposes of computing basic and diluted net income per share (in thousands, except per share amounts):
Years ended June 30, | |||||||||||
2017 | 2016 | 2015 | |||||||||
(As revised) | (As revised) | ||||||||||
Numerator: | |||||||||||
Net income | $ | 1,608 | $ | 6,106 | $ | 7,125 | |||||
Denominator: | |||||||||||
Basic weighted-average common shares outstanding | 13,881 | 13,730 | 13,899 | ||||||||
Effect of dilutive securities: | |||||||||||
Stock awards and options | 237 | 735 | 180 | ||||||||
Warrants | — | 66 | 71 | ||||||||
Diluted weighted-average common shares outstanding | 14,118 | 14,531 | 14,150 | ||||||||
Net income per share, basic | $ | 0.12 | $ | 0.44 | $ | 0.51 | |||||
Net income per share, diluted | $ | 0.11 | $ | 0.42 | $ | 0.50 | |||||
F - 15
Segment Information
The Company operates in a single operating segment by selling products to an international network of independent distributors that operates in an integrated manner from market to market. Commissions and incentives expenses are the Company’s largest expense comprised of the commissions paid to its independent distributors. The Company manages its business primarily by managing its international network of independent distributors. The Company does not use profitability reports on a regional or divisional basis for making business decisions. However, the Company does report revenue in two geographic regions: the Americas region and the Asia/Pacific & Europe region. Revenues by geographic area are as follows (in thousands):
Years ended June 30, | |||||||||||
2017 | 2016 | 2015 | |||||||||
Americas | $ | 150,841 | $ | 158,291 | $ | 138,118 | |||||
Asia/Pacific & Europe | 48,648 | 48,249 | 52,218 | ||||||||
Total revenues | $ | 199,489 | $ | 206,540 | $ | 190,336 | |||||
Additional information as to the Company’s revenue from operations in the most significant geographical areas is set forth below (in thousands):
Years ended June 30, | |||||||||||
2017 | 2016 | 2015 | |||||||||
United States | $ | 144,842 | $ | 152,830 | $ | 132,831 | |||||
Japan | $ | 39,390 | $ | 36,343 | $ | 41,428 | |||||
As of June 30, 2017, long-lived assets were $6.2 million in the U.S. and $0.9 million in Japan. As of June 30, 2016, long-lived assets were $4.2 million in the U.S. and $1.3 million in Japan.
Major Products
The Company's revenues are largely attributed to two product lines, Protandim® and TrueScience®, which each accounted for more than 10% of total revenues for each of the years ended June 30, 2017, 2016 and 2015. On a combined basis, these products represent approximately 77.9%, 77.9% and 83.7% of the Company's worldwide gross revenues for the years ended June 30, 2017, 2016 and 2015, respectively. The following table shows revenues by major product line for the years ended June 30, 2017, 2016 and 2015.
For the years ended June 30, | ||||||||||||||||||||
2017 | 2016 | 2015 | ||||||||||||||||||
Protandim®product line | $ | 130,873 | 65.6 | % | $ | 128,019 | 62.0 | % | $ | 120,967 | 63.6 | % | ||||||||
TrueScience® product line | 24,440 | 12.3 | % | 32,914 | 15.9 | % | 38,287 | 20.1 | % | |||||||||||
Other | 44,176 | 22.1 | % | 45,607 | 22.1 | % | 31,082 | 16.3 | % | |||||||||||
Total | $ | 199,489 | 100.0 | % | $ | 206,540 | 100.0 | % | $ | 190,336 | 100.0 | % | ||||||||
New Accounting Pronouncements
In May 2014, the Financial Accounting Standards Board ("FASB") issued Accounting Standards Update ("ASU") 2014-09, Revenue from Contracts with Customers (Topic 606), and has subsequently issued ASU 2015-14, Revenue from Contracts with Customers (Topic 606): Deferral of the Effective Date, ASU 2016-08, Revenue from Contracts with Customers (Topic 606): Principal versus Agent Considerations (Reporting Revenue Gross versus Net), ASU 2016-10, Revenue from Contracts with Customers (Topic 606): Identifying Performance Obligations and Licensing, ASU 2016-11, Revenue Recognition (Topic 605) and Derivatives and Hedging (Topic 815), ASU 2016-12, Revenue from Contracts with Customers (Topic 606): Narrow-Scope Improvements and Practical Expedients, and ASU 2016-20, Technical Corrections and Improvements to Topic 606, Revenue from Contracts with Customers (collectively, Topic 606).
Topic 606 outlines a single comprehensive model for entities to use in accounting for revenue arising from contracts with customers and supersedes most current revenue recognition guidance, including industry-specific guidance. The core principle of the new guidance is for companies to recognize revenue to depict the transfer of goods or services to customers in amounts that reflect the consideration it expects to receive in exchange for those goods or services. The guidance also requires additional disclosure about the nature, amount, timing and uncertainty of revenue and cash flows arising from customer contracts,
F - 16
including significant judgments and changes in judgments and assets recognized from costs incurred to fulfill a contract. This guidance is effective for the Company beginning on July 1, 2018 with the option to adopt using either a full retrospective or a modified retrospective approach. The Company expects to adopt Topic 606 using the modified retrospective approach, under which the cumulative effect of initially applying Topic 606 is recognized as an adjustment to the opening balance of retained earnings in the first quarter of fiscal 2019.
The Company is concluding the assessment phase of implementing this guidance. The Company has evaluated each of its revenue streams and has identified similar performance obligations under Topic 606 as compared to current revenue recognition guidance. As a result, the Company expects that the timing of the recognition of revenue will remain materially unchanged compared to the current guidance.
There are also considerations related to internal control over financial reporting associated with implementing Topic 606. The Company is currently evaluating its control framework for revenue recognition and identifying any changes that may need to be made in response to the new guidance. Disclosure requirements under Topic 606 have been expanded compared to the disclosure requirements under the current guidance. Designing and implementing the appropriate controls over gathering and reporting the information required under Topic 606 is currently in process.
In April 2015, FASB issued ASU 2015-03, Interest - Imputation of Interest (Subtopic 835-30): Simplifying the Presentation of Debt Issuance Costs. This guidance requires that debt issuance costs related to a recognized debt liability be presented in the balance sheet as a direct deduction from the carrying amount of that debt liability, consistent with debt discounts. The Company adopted this updated standard in the current year during the interim period ended September 30, 2016 by reclassifying the debt issuance costs from long-term assets to a direct deduction from the related debt, consistent with the debt discount. All prior period balances have been retrospectively adjusted.
In November 2015, FASB issued ASU No. 2015-17, Income Taxes (Topic 740): Balance Sheet Classification of Deferred Taxes. Current GAAP requires an entity to separate deferred income tax liabilities and assets into current and noncurrent amounts in a classified statement of financial position. To simplify the presentation of deferred income taxes, the amendments in this update require that all deferred tax assets or liabilities be classified as noncurrent in the classified statement of financial position. The Company early adopted this update prospectively during the first quarter of fiscal 2017, which resulted in the reclassification of the deferred taxes from current to noncurrent on the balance sheet. Prior period balances were not retrospectively adjusted.
In February 2016, FASB issued ASU No. 2016-02, Leases (Topic 841). For lessees, the amendments in this update require that for all leases not considered to be short term, a company recognize both a lease liability and right-of-use asset on its balance sheet, representing the obligation to make payments and the right to use or control the use of a specified asset for the lease term. The amendments in this update are effective for annual periods beginning after December 15, 2018 and interim periods within those annual periods. The Company is currently evaluating the impact that this amendment will have on its consolidated financial statements.
In March 2016, FASB issued ASU 2016-09, Compensation - Stock Compensation (Topic 718): Improvements to Employee Share-Based Payment Accounting. The amendments in this update involve several aspects of the accounting for share-based compensation transactions, including the income tax consequences, forfeitures, statutory withholding requirements and cash flow classification for applicable transactions, in an effort to reduce costs and complexity associated with these transactions while maintaining the usefulness of financial information. Prior to this update, all excess tax benefits were recognized in additional paid in capital ("APIC") and accumulated in an APIC pool and any tax deficiencies realized were offset against the APIC pool to the extent available, with any excess amounts recognized in the income statement. Under this new amendment, any excess tax benefits or deficiencies resulting from the exercise, vesting or settlement of share-based payment transactions will be recognized in the income statement as tax benefits or expenses prospectively from the date of adoption. Estimating forfeitures as part of the recognition of compensation costs is no longer required, rather, an entity can make the election to account for forfeitures when they occur. The Company early adopted this update during the first quarter of fiscal 2017 and began recording the excess tax benefits to the income statement. The Company elected to continue estimating forfeitures as part of its share-based compensation accounting policy.
In May 2017, FASB issued ASU No. 2017-09, Compensation - Stock Compensation (Topic 718): Scope of Modification Accounting. The amendments in this update provide guidance about which changes to the terms or conditions of a share-based award require an entity to apply modification accounting in Topic 718. An entity should account for the effects of a modification unless all the following are met: (1) The fair value of the modified award is the same as the fair value of the original award immediately before the original award is modified, (2) The vesting conditions of the modified award are the same as the vesting conditions of the original award immediately before the original award is modified, (3) The classification of the modified award as an equity instrument or a liability instrument is the same as the classification of the original award immediately before the original award is modified. The current disclosure requirements in Topic 718 apply regardless of
F - 17
whether an entity is required to apply modification accounting under the amendments in this update. The amendments in this update are effective for all annual periods, and interim periods within those annual periods, beginning after December 15, 2017. Early adoption is permitted. The amendments in this update should be applied prospectively to an award modified on or after the adoption date. The Company will apply this amendment to any award modifications made on or after the adoption date.
Note 3 — Property and Equipment, Net
Property and equipment, net consist of (in thousands):
June 30, | |||||||
2017 | 2016 | ||||||
Equipment (includes computer hardware and software) | $ | 7,420 | $ | 6,402 | |||
Furniture and fixtures | 1,536 | 1,485 | |||||
Leasehold improvements | 3,421 | 3,497 | |||||
Vehicles | 51 | 51 | |||||
Accumulated depreciation | (9,301 | ) | (7,979 | ) | |||
Total property and equipment, net | $ | 3,127 | $ | 3,456 | |||
Depreciation expense totaled $1.5 million, $1.8 million and $2.3 million for the years ended June 30, 2017, 2016 and 2015, respectively.
Note 4 — Intangible Assets, Net
Intangible assets, net consist of (in thousands):
June 30, | |||||||
2017 | 2016 | ||||||
Patent costs | $ | 2,330 | $ | 2,330 | |||
Accumulated amortization | (1,328 | ) | (1,181 | ) | |||
Total definite-lived intangible assets, net | 1,002 | 1,149 | |||||
Trademarks and other indefinite-lived intangible assets | 245 | 595 | |||||
Total intangible assets, net | $ | 1,247 | $ | 1,744 | |||
Amortization expense totaled $0.1 million, $0.1 million and $0.1 million for the years ended June 30, 2017, 2016 and 2015, respectively. As of June 30, 2017, the remaining weighted-average amortization period for definite-lived intangible assets was 7.75 years. Annual estimated amortization expense is expected to approximate $0.1 million for each of the five succeeding fiscal years.
F - 18
Note 5 — Other Accrued Expenses
Other accrued expenses consist of (in thousands):
June 30, | |||||||
2017 | 2016 | ||||||
Deferred revenue | $ | 1,743 | $ | 2,406 | |||
Other taxes payable | 1,517 | 1,410 | |||||
Accrued incentive compensation | 1,151 | 1,320 | |||||
Accrued other expenses | 1,112 | 589 | |||||
Accrued incentives and promotions to distributors | 988 | 408 | |||||
Accrued import liabilities | 940 | 889 | |||||
Accrued payroll and other employee expenses | 899 | 774 | |||||
Accrued payable to vendors | 801 | 838 | |||||
Accrued severance | 302 | 100 | |||||
Total other accrued expenses | $ | 9,453 | $ | 8,734 | |||
Note 6 — Long-Term Debt
On October 18, 2013, the Company entered into a financing agreement providing for a term loan facility in an aggregate principal amount of $47 million (the “October 2013 Term Loan”) and a delayed draw term loan facility in an aggregate principal amount not to exceed $20 million (the “October 2013 Delayed Draw Term Loan”). The October 2013 Delayed Draw Term Loan was available for borrowing in specified minimum amounts from time to time beginning after the effective date until October 18, 2014. The Company did not borrow any amounts under the October 2013 Delayed Draw Term Loan.
On May 1, 2015, the Company entered into an Amendment No 1 to October 2013 Term Loan ("Amendment No. 1"). Amendment No. 1 revised the March 31, 2015 and June 30, 2015 consolidated EBITDA covenants from $20.6 million and $21.3 million, respectively, to $17.0 million for each quarter end. Amendment No. 1 also revised the minimum unrestricted cash and cash equivalents that the Company was required to hold from $10.0 million to $8.0 million for the reporting periods ended March 31, 2015 and June 30, 2015. In addition, Amendment No. 1 required that the Company make certain accelerated principal payments on the October 2013 Term Loan totaling $4.5 million during the fourth quarter of fiscal year 2016.
On August 27, 2015, the Company entered into an Amendment No. 2 to October 2013 Term Loan ("Amendment No. 2" and collectively, with the October 2013 Term Loan, as previously amended by Amendment No. 1, the "October 2013 Credit Facility"). Amendment No. 2 revised the covenants related to minimum consolidated EBITDA (as defined in the amended October 2013 Term Loan) for the four consecutive fiscal quarters ending September 30, 2015, December 31, 2015, March 31, 2016 and June 30, 2016 from $22.2 million, $23.1 million, $24.4 million and $25.6 million, respectively, to $14.5 million, $15.0 million, $17.0 million and $17.5 million, respectively. In addition, Amendment No. 2 required that the Company make additional monthly accelerated principal payments on the October 2013 Term Loan in the amount of $0.5 million commencing on October 15, 2015 and continuing until the October 2013 Term Loan was paid in full. Amendment No. 2 also required that the Company make additional accelerated payments at the end of each fiscal quarter in the amount of all unrestricted cash on hand as of the close of business on the last day of the quarter in excess of $12.5 million.
The principal amount of the October 2013 Term Loan was payable in consecutive quarterly installments beginning with the calendar quarter ended March 31, 2014 and matured on the earlier of October 18, 2018 or such date as the outstanding loans become payable in accordance with the terms of the October 2013 Term Loan (the “Final Maturity Date”). The October 2013 Term Loan bore interest at a rate equal to 7.50% per annum plus the greater of (i) 1.25% or (ii) LIBOR, or at the Company’s option, a reference rate (as defined in the October 2013 Term Loan) plus 6.50% per annum, with such interest payable monthly. On March 30, 2016, the Company repaid the full amount outstanding under the October 2013 Term Loan and terminated the October 2013 Credit Facility.
On March 30, 2016, the Company entered into a loan agreement (the "March 2016 Loan Agreement") to refinance its outstanding debt under the October 2013 Term Loan. In connection with the March 2016 Loan Agreement and on the same date, the Company entered into a security agreement (the "March 2016 Security Agreement"). The March 2016 Loan Agreement provides for a term loan in an aggregate principal amount of $10.0 million (the "March 2016 Term Loan") and a revolving loan facility in an aggregate principal amount not to exceed $2.0 million (the "March 2016 Revolving Loan," and
F - 19
collectively with the March 2016 Term Loan, the March 2016 Loan Agreement and the March 2016 Security Agreement, the "March 2016 Credit Facility").
The principal amount of the March 2016 Term Loan is payable in consecutive quarterly installments in the amount of $0.5 million plus accrued interest beginning with the fiscal quarter ended June 30, 2016 and maturing on March 30, 2019 (the "Maturity Date"). The March 2016 Term Loan bears interest at a fixed rate of 4.93%. If the Company borrows under the March 2016 Revolving Loan, interest will be payable quarterly in arrears on the last day of each fiscal quarter at a variable rate equal to the 30 day LIBOR rate plus 3.50%.
The Company’s obligations under the March 2016 Credit Facility are secured by a security interest in substantially all of the Company’s assets. Loans outstanding under the March 2016 Credit Facility may be prepaid in whole or in part at any time without premium or penalty. In addition, if, at any time, the aggregate principal amount outstanding under the March 2016 Revolving Loan exceeds $2.0 million, the Company must prepay an amount equal to such excess. Any principal amount of the March 2016 Term Loan which is prepaid or repaid may not be re-borrowed.
The March 2016 Credit Facility contains customary covenants, including affirmative and negative covenants that, among other things, restrict the Company's ability to create certain types of liens, incur additional indebtedness, declare or pay dividends on or redeem capital stock, make other payments to holders of equity interests in the Company, make certain investments, purchase or otherwise acquire all or substantially all the assets or equity interests of other companies, sell assets or enter into consolidations, mergers or transfers of all or any substantial part of the Company's assets. The March 2016 Credit Facility also contains various financial covenants that require the Company to maintain a certain consolidated minimum tangible net worth, minimum working capital amounts, and debt to EBITDA and fixed charge coverage ratios. Additionally, the March 2016 Credit Facility contains cross-default provisions, whereby a default under the terms of certain indebtedness or an uncured default of a payment or other material obligation of the Company under a material contract of the Company will cause a default on the remaining indebtedness under the March 2016 Credit Facility. As of June 30, 2017, the Company was in compliance with all applicable covenants under the March 2016 Credit Facility; provided, however, that on October 24, 2016, the Company was granted a waiver and extension to covenants requiring the Company to provide the lender with audited financial statements for the Company's 2016 fiscal year on or before October 28, 2016. Under the limited waiver and extension, the lender agreed to waive compliance with this requirement if the Company delivered such audited financial statements prior to December 31, 2016. In connection with filing the Company's FY 2016 Form 10-K on December 12, 2016, the Company delivered all required information to the lender to satisfy the requirement.
The Company incurred transaction costs associated with the October 2013 Credit Facility totaling $2.7 million. In connection with refinancing the outstanding debt under the October 2013 Credit Facility on March 30, 2016, the Company charged to interest expense the remaining $1.5 million in unamortized transaction costs associated with that credit facility. At June 30, 2017, the Company had unamortized transaction costs totaling $0.1 million included in the consolidated balance sheet related to the March 2016 Credit Facility. This balance will be amortized to interest expense using the interest method over the term of the loan.
The Company’s book value for the March 2016 Credit Facility approximates the fair value. Aggregate future principal payments required in accordance with the terms of the March 2016 Credit Facility are as follows (in thousands):
Year ending June 30, | Amount | |||
2018 | $ | 2,000 | ||
2019 | 5,500 | |||
$ | 7,500 | |||
Note 7 — Stockholders’ Equity
During the years ended June 30, 2017, 2016 and 2015, the Company issued 0.1 million, 0.1 million and 0.4 million shares, respectively, of common stock as a result of the exercise of options and warrants and during the years ended June 30, 2017, 2016 and 2015, the Company issued 0.2 million, 0.1 million and 0.2 million shares, respectively, of restricted common stock. During the year ended June 30, 2017, 39,000 shares of restricted stock were canceled or surrendered as payment of tax withholding upon vesting.
On November 6, 2014, the Company announced a share repurchase program authorizing it to repurchase up to $7 million in shares of the Company's common stock. As part of that repurchase program, the Company entered into a pre-arranged stock repurchase plan that operated in accordance with guidelines specified under Rule 10b5-1 of the Securities Exchange Act of 1934, as amended (the "1934 Act"). The pre-arranged stock repurchase program terminated in accordance with its terms on February 13, 2015. Pursuant to the program, the Company purchased 0.6 million shares of its common stock at an aggregate
F - 20
purchase price of $5.9 million. The remaining $1.1 million authorized under the program for repurchases was unused when the program expired.
On June 3, 2014, the Company announced a share repurchase program authorizing it to repurchase up to $4 million in shares of the Company's common stock. As part of that repurchase program, the Company entered into a pre-arranged stock repurchase plan that operated in accordance with guidelines specified under Rule 10b5-1 of the 1934 Act. The pre-arranged stock repurchase program terminated in accordance with its terms on December 31, 2014. Pursuant to the program, the Company purchased 0.4 million shares of its common stock at an aggregate purchase price of $4 million under this repurchase program.
The Company’s Articles of Incorporation authorize the issuance of preferred shares. However, as of June 30, 2017, none have been issued nor have any rights or preferences been assigned to the preferred shares by the Company’s Board of Directors.
Note 8 — Share-Based Compensation
Long-Term Incentive Plans
The Company adopted and the shareholders approved the 2007 Long-Term Incentive Plan (the “2007 Plan”), effective November 21, 2006, to provide incentives to certain eligible employees, directors and consultants. A maximum of 1.4 million shares of the Company’s common stock can be issued under the 2007 Plan in connection with the grant of awards. Awards to purchase common stock have been granted pursuant to the 2007 Plan and are outstanding to various employees, officers, directors, Scientific Advisory Board members and independent distributors at prices between $1.47 and $10.50 per share, with initial vesting periods of one to three years. Awards expire in accordance with the terms of each award and the shares subject to the award are added back to the 2007 Plan upon expiration of the award. The contractual term of stock options granted is generally ten years. As of June 30, 2017, there were stock option awards outstanding, net of awards expired, for the purchase in aggregate of 0.2 million shares of the Company’s common stock. Effective November 21, 2016 no new awards can be granted under the 2007 Plan.
The Company adopted and the shareholders approved the 2010 Long-Term Incentive Plan (the “2010 Plan”), effective September 27, 2010, as amended on August 21, 2014, to provide incentives to certain employees, directors and consultants. A maximum of 1.5 million shares of the Company’s common stock can be issued under the 2010 Plan in connection with the grant of awards. Awards to purchase common stock have been granted pursuant to the 2010 Plan and are outstanding to various employees, officers and directors. Outstanding stock options awarded under the 2010 Plan have exercise prices between $4.41 and $24.71 per share, and vest over one to four year vesting periods. Awards expire in accordance with the terms of each award and the shares subject to the award are added back to the 2010 Plan upon expiration of the award. The contractual term of stock options granted is generally ten years. As of June 30, 2017, there were stock option awards outstanding, net of awards expired, for an aggregate of 0.1 million shares of the Company’s common stock. No new awards will be granted under the 2010 Plan and forfeited or terminated shares will be added to the 2017 Plan pool as described below.
The Company adopted a Performance Incentive Plan effective July 1, 2014 (the "Fiscal 2015 Performance Plan"). The Fiscal 2015 Performance Plan is intended to provide selected employees an opportunity to earn performance-based cash bonuses whose value is based upon the Company’s stock value and to encourage such employees to provide services to the Company and to attract new individuals with outstanding qualifications. The Fiscal 2015 Performance Plan seeks to achieve this purpose by providing for awards in the form of performance share units (the “Units”). No shares will be issued under the Fiscal 2015 Performance Plan. Awards may be settled only with cash and will be paid subsequent to award vesting. The fair value of share-based compensation awards, that include performance shares, are accounted for as liabilities. Vesting for the Units is subject to achievement of both service-based and performance-based vesting requirements. Performance-based vesting occurs in three installments if the Company meets certain performance criteria generally set for each year of a three-year performance period. The service-based vesting criteria occurs in a single installment at the end of the third fiscal year after the awards are granted if the participant has continuously remained in service from the date of award through the end of the third fiscal year. The fair value of these awards is based on the trading price of the Company's common stock and is remeasured at each reporting period date until settlement. The Company adopted separate Performance Incentive Plans effective July 1, 2015 (the "Fiscal 2016 Performance Plan") and July 1, 2016 (the "Fiscal 2017 Performance Plan"). The Fiscal 2016 Performance Plan and Fiscal 2017 Performance Plan include performance-based and service-based vesting requirements and payment terms that are substantially the same as described above the Fiscal 2015 Performance Plan.
The Company adopted and the shareholders approved the 2017 Long-Term Incentive Plan (the “2017 Plan”), effective February 16, 2017 to provide incentives to eligible employees, directors and consultants. The maximum number of shares that can be issued under the 2017 Plan is not to exceed 1,125,000 shares, calculated as the sum of (i) 650,000 shares and (ii) up to 475,000 shares previously reserved for issuance under the 2010 Plan, including shares returned upon cancellation,
F - 21
termination or forfeiture of awards that were previously granted under that plan. Awards expire in accordance with the terms of each award and the shares subject to the award are added back to the 2017 Plan upon expiration of the award.
Stock-Based Compensation
In accordance with accounting guidance for stock-based compensation, payments in equity instruments for goods or services are accounted for by the fair value method. For the fiscal years ended June 30, 2017, 2016 and 2015, stock-based compensation of $2.3 million, $2.0 million and $1.7 million, respectively, was reflected as an increase to additional paid in capital and $0.7 million, $0.7 million and $0.1 million was reflected as an increase to other accrued expenses for the fiscal years ended June 30, 2017, 2016 and 2015, respectively. For the fiscal years ended June 30, 2017, 2016 and 2015, all stock-based compensation was employee related.
At June 30, 2017, there was $4.5 million of unrecognized compensation cost related to nonvested share-based compensation arrangements under the 2010 and 2017 Plans, based on management's estimate of the shares that will ultimately vest. The Company expects to recognize such costs over a weighted-average period of 1.94 years.
Stock Options
There were no stock option grants during the fiscal years ended June 30, 2017, 2016 and 2015. The following is a summary of stock option activity for the years ended June 30, 2017, 2016 and 2015:
Options (in thousands) | Weighted Average Exercise Price | Weighted Average Remaining Contractual Term (in years) | Aggregate Intrinsic Value (in thousands) | |||||||||
Outstanding at June 30, 2014 | 735 | $ | 8.23 | |||||||||
Granted | — | $ | — | |||||||||
Exercised | (22 | ) | 5.04 | $ | 60 | |||||||
Forfeited | (251 | ) | 9.18 | |||||||||
Expired or Canceled | — | — | ||||||||||
Outstanding at June 30, 2015 | 462 | 7.87 | ||||||||||
Granted | — | $ | — | |||||||||
Exercised | (46 | ) | 5.66 | $ | 209 | |||||||
Forfeited | (33 | ) | 17.85 | |||||||||
Expired or Canceled | — | — | ||||||||||
Outstanding at June 30, 2016 | 383 | 7.28 | ||||||||||
Granted | — | $ | — | |||||||||
Exercised | (4 | ) | 4.14 | $ | 17 | |||||||
Forfeited | (62 | ) | 12.64 | |||||||||
Expired or Canceled | (7 | ) | 2.45 | |||||||||
Outstanding at June 30, 2017 | 310 | 6.35 | 2.71 | $ | 139 | |||||||
Exercisable at June 30, 2017 | 310 | $ | 6.35 | 2.71 | $ | 139 | ||||||
F - 22
Restricted Shares
The following is a summary of restricted shares granted during the years ended June 30, 2017, 2016 and 2015:
Nonvested Shares | Shares (in thousands) | Weighted Average Grant Date Fair Value | |||||
Nonvested at June 30, 2014 | 246 | $ | 17.25 | ||||
Granted | 189 | $ | 5.57 | ||||
Vested | (75 | ) | 16.57 | ||||
Forfeited | (110 | ) | 15.54 | ||||
Nonvested at June 30, 2015 | 250 | 9.36 | |||||
Vested at June 30, 2015 | — | — | |||||
Granted | 60 | $ | 5.94 | ||||
Vested | (40 | ) | 15.64 | ||||
Forfeited | (39 | ) | 16.21 | ||||
Nonvested at June 30, 2016 | 231 | 6.24 | |||||
Vested at June 30, 2016 | — | — | |||||
Granted | 156 | $ | 5.81 | ||||
Vested | (88 | ) | 8.31 | ||||
Forfeited | (22 | ) | 10.70 | ||||
Nonvested at June 30, 2017 | 277 | 4.98 | |||||
Vested at June 30, 2017 | — | $ | — | ||||
The total vesting date fair value of restricted shares that vested during the years ended June 30, 2017, 2016 and 2015 was $0.7 million, $0.4 million and $0.6 million, respectively.
Performance Restricted Stock Units
During the year ended June 30, 2015, the Company awarded performance restricted stock units (the "FY 2015 Performance Stock Units") to its executive officers and senior management (the "Recipients"). Vesting for the FY 2015 Performance Stock Units occurs over three consecutive annual performance periods and is subject to achievement of both service-based and market-based performance vesting requirements. Subject generally to the Recipient's continued service with the Company (the service based requirement), each performance restricted stock unit represents a contingent right for the Recipient to receive, within thirty days after the end of each of three annual performance periods, a distribution of shares of common stock of the Company equal to 0% to 200% of the target number of performance restricted stock units subject to the award for each performance period. The actual number of shares distributed will be based on the Company's total stockholder return ("TSR") performance during the relevant performance period, subject to acceleration upon a change in control of the Company. The vesting for 50% of the target performance restricted stock units is based upon the Company's absolute TSR for the performance period as compared to a matrix of fixed numeric values and the vesting for the other 50% of the target performance restricted stock units is based upon the relative comparison of the Company's TSR to the Vanguard Russell 2000 exchange traded fund TSR. The fair value of the performance restricted stock units will be recognized on a straight-line basis over the requisite service period of the awards, regardless of when, if ever, the market-based performance conditions are satisfied.
During the years ended June 30, 2017 and 2016, the Company awarded additional performance restricted stock units ("FY 2017 Performance Stock Units" and "FY 2016 Performance Stock Units") to its executive officers and senior management. The FY 2017 Performance Stock Units and FY 2016 Performance Stock Units are substantially similar to the FY 2015 Performance Stock Units except that the service-based vesting criteria occurs in a single installment and is achieved at the end of the three year performance period if the participant has continuously remained in service from the date of the award through the end of the performance period.
The fair values of performance restricted stock units granted during the years ended June 30, 2017, 2016 and 2015 were estimated using a Monte Carlo simulation model which included the following assumptions in order to reflect the performance conditions that must be satisfied for the share units to vest:
F - 23
June 30, 2017 | June 30, 2016 | June 30, 2015 | ||||||
Risk-free interest rate | 1.49 | % | 1.31 | % | 1.07 | % | ||
Dividend yield | — | % | — | % | — | % | ||
Expected volatility - Company | 62.0 | % | 55.5 | % | 54.1 | % | ||
Expected volatility - peer company | 17.1 | % | 15.7 | % | 15.7 | % | ||
Total measurement period (years) | 2.8 | 3.0 | 3.0 | |||||
The following is a summary of performance restricted stock units granted during the years ended June 30, 2017, 2016 and 2015:
Number of Units (in thousands) | Weighted Average Grant Date Fair Value | ||||||
Nonvested at June 30, 2014 | — | $ | — | ||||
Granted | 229 | $ | 10.76 | ||||
Vested | — | — | |||||
Forfeited | (114 | ) | 10.76 | ||||
Nonvested at June 30, 2015 | 115 | 10.76 | |||||
Granted | 848 | $ | 12.30 | ||||
Vested | (15 | ) | 10.76 | ||||
Forfeited | (485 | ) | 11.25 | ||||
Nonvested at June 30, 2016 | 463 | 13.07 | |||||
Granted | 420 | $ | 4.69 | ||||
Vested | (10 | ) | 10.76 | ||||
Forfeited | (111 | ) | 12.86 | ||||
Nonvested at June 30, 2017 | 762 | 8.51 | |||||
Vested at June 30, 2017 | — | $ | — | ||||
The total vesting date fair value of performance restricted stock units that vested during the years ended June 30, 2017 and 2016 was $0.1 million and $0.1 million, respectively. There were no performance restricted stock units that vested during the year ended June 30, 2015.
F - 24
Cash-Settled Performance Units
The following is a summary of cash-settled performance units granted during the years ended June 30, 2017, 2016 and 2015:
Number of Units (in thousands) | Weighted Average Grant Date Fair Value | ||||||
Outstanding at June 30, 2014, nonvested | — | ||||||
Granted | 69 | $ | 8.05 | ||||
Vested | (51 | ) | — | ||||
Forfeited | (18 | ) | $ | 8.12 | |||
Outstanding at June 30, 2015, nonvested | — | ||||||
Granted | 77 | $ | 8.47 | ||||
Vested | (13 | ) | — | ||||
Forfeited | (13 | ) | $ | 8.30 | |||
Outstanding at June 30, 2016, nonvested | 51 | ||||||
Granted | 95 | $ | 13.17 | ||||
Vested | (25 | ) | — | ||||
Forfeited | (89 | ) | $ | 12.43 | |||
Outstanding at June 30, 2017, nonvested | 32 | ||||||
The fair value of vested awards under the cash-settled performance plan for the years ended June 30, 2017, 2016 and 2015 was $0.1 million, $0.2 million and $0.2 million. Payments of $0.2 million, $0.1 million and $0.3 million were made to settle vested cash-settled performance units during the years ended June 30, 2017, 2016 and 2015, respectively.
Warrants
As of June 30, 2017, the Company had no outstanding warrants.
The following is a summary of the warrant activity for the years ended June 30, 2017, 2016 and 2015 (in thousands):
Common Stock Warrants | ||
Outstanding and exercisable, June 30, 2014 | 606 | |
Issued | — | |
Canceled | — | |
Exercised | (519 | ) |
Expired | — | |
Outstanding and exercisable, June 30, 2015 | 87 | |
Issued | — | |
Canceled | — | |
Exercised | (7 | ) |
Expired | — | |
Outstanding and exercisable, June 30, 2016 | 80 | |
Issued | — | |
Canceled | — | |
Exercised | (80 | ) |
Expired | — | |
Outstanding and exercisable, June 30, 2017 | — | |
F - 25
As of June 30, 2017, 2016 and 2015, the Company had no warrants classified as derivative liabilities.
Note 9 — Other Expense, Net
Other expense, net consists of the following (in thousands):
Year ended June 30, | |||||||||||
2017 | 2016 | 2015 | |||||||||
Foreign currency transaction loss, net | $ | (182 | ) | $ | (11 | ) | $ | (498 | ) | ||
Gain (loss) on settlement of forward contract | (292 | ) | (212 | ) | 203 | ||||||
Loss on disposal of fixed assets | (12 | ) | (1,186 | ) | — | ||||||
Write-off of intangible assets | (350 | ) | — | — | |||||||
Other income (expense), net | (133 | ) | — | 136 | |||||||
Total other expense, net | $ | (969 | ) | $ | (1,409 | ) | $ | (159 | ) | ||
Note 10 — Income Taxes
As of June 30, 2017, the Company had utilized all of its U.S. Federal net operating loss (“NOL”) carry-forwards. As of June 30, 2017, state NOLs were $8.2 million and foreign NOLs were $1.0 million. The income tax expense for the years ended June 30, 2017, 2016 and 2015 consists of the following (in thousands):
Year ended June 30, | |||||||||||
2017 | 2016 | 2015 | |||||||||
(As Revised) | (As Revised) | ||||||||||
Income / (Loss) Before Income Taxes: | |||||||||||
Domestic | $ | 1,642 | $ | 7,518 | $ | 8,249 | |||||
International | 1,268 | 1,166 | 2,404 | ||||||||
$ | 2,910 | $ | 8,684 | $ | 10,653 | ||||||
Current Taxes: | |||||||||||
Federal | $ | 1,324 | $ | 4,180 | $ | 2,600 | |||||
State | 137 | 561 | 446 | ||||||||
Foreign | 510 | 455 | 1,663 | ||||||||
Total Current Income Tax Provision | $ | 1,971 | $ | 5,196 | $ | 4,709 | |||||
Deferred Taxes: | |||||||||||
Federal | $ | (473 | ) | $ | (2,326 | ) | $ | 97 | |||
State | (21 | ) | (105 | ) | 4 | ||||||
Foreign | (175 | ) | (187 | ) | (1,282 | ) | |||||
Total Deferred Income Tax Provision | $ | (669 | ) | $ | (2,618 | ) | $ | (1,181 | ) | ||
Net Income Tax Provision | $ | 1,302 | $ | 2,578 | $ | 3,528 | |||||
F - 26
The effective income tax rate for the years ended June 30, 2017, 2016 and 2015 differs from the U.S. Federal statutory income tax rate due to the following:
Year ended June 30, | ||||||||
2017 | 2016 | 2015 | ||||||
(As Revised) | (As Revised) | |||||||
Federal statutory income tax rate | 34.0 | % | 35.0 | % | 35.0 | % | ||
State income taxes, net of federal benefit | 5.9 | % | 2.8 | % | 2.0 | % | ||
Foreign tax rate difference | (4.6 | )% | (2.3 | )% | (1.3 | )% | ||
Tax return to provision true-up | 0.6 | % | 0.7 | % | 1.3 | % | ||
Other differences | (2.1 | )% | 0.0 | % | 0.0 | % | ||
Permanent differences: | ||||||||
— stock based compensation | 4.6 | % | 0.9 | % | 1.2 | % | ||
— domestic production activities deduction | (3.3 | )% | (4.4 | )% | (1.6 | )% | ||
— credit for increasing research activities | (0.9 | )% | (0.7 | )% | (3.8 | )% | ||
— meals and entertainment | 3.4 | % | 1.0 | % | 1.0 | % | ||
— penalties | 1.5 | % | 0.0 | % | 0.0 | % | ||
— other | 4.3 | % | (3.9 | )% | (0.7 | )% | ||
Change in valuation allowance | 1.3 | % | 0.6 | % | 0.0 | % | ||
Net income tax provision | 44.7 | % | 29.7 | % | 33.1 | % | ||
The components of the deferred tax assets and liabilities as of June 30, 2017 and 2016 are as follows (in thousands):
June 30, | |||||||
2017 | 2016 | ||||||
(As Revised) | |||||||
Deferred tax assets: | |||||||
Federal, state, and foreign net operating loss carryovers | $ | 536 | $ | 519 | |||
Stock option compensation | 1,531 | 1,098 | |||||
Accrued vacation, allowance for returns, bonuses & other | 3,173 | 3,081 | |||||
Gross deferred tax asset | $ | 5,240 | $ | 4,698 | |||
Deferred tax liabilities: | |||||||
Patents and trademarks | (253 | ) | (417 | ) | |||
Property & equipment | (588 | ) | (722 | ) | |||
Gross deferred tax liabilities | (841 | ) | (1,139 | ) | |||
Less: valuation allowance | (312 | ) | (276 | ) | |||
Deferred tax assets, net | $ | 4,087 | $ | 3,283 | |||
During the year ended June 30, 2016, the Company put into effect a permanent reinvestment assertion on the earnings of its foreign subsidiaries as the Company intends to reinvest all foreign earnings in its foreign operations, with the exception of certain foreign earnings that are subject to U.S. taxation. As of June 30, 2017, the U.S. consolidated group had approximately $2.4 million of permanently reinvested unremitted earnings from the Company's subsidiaries.
The Company has adopted accounting guidance for uncertain tax positions which provides that in order to recognize an uncertain tax benefit, the taxpayer must be more likely than not of sustaining the position, and the measurement of the benefit is calculated as the largest amount that is more than 50% likely to be realized upon recognition of the benefit. The Company believes it has no material uncertain tax positions and does not expect significant changes within the next twelve months in the amount of unrecognized tax benefits. Accordingly, The Company has not reserved for interest or penalties. The tax years open for examination by the IRS include returns for fiscal years ended June 30, 2014 through present and the open tax years by state tax authorities include returns for fiscal years ended June 30, 2012 through present. In addition, the IRS and state tax authorities may examine NOLs for any previous years if utilized by the Company.
F - 27
The Company conducts its business globally. As a result, the Company and its subsidiaries file income tax returns in the U.S. federal jurisdiction and various state and foreign jurisdictions, and are subject to examination for the open tax years ended June 30, 2012 through June 30, 2016.
Note 11 — Commitments and Contingencies
Operating Leases
The Company leases its facilities under non-cancelable operating leases, which expire at various dates through 2024. The facilities leases contain renewal options and are subject to cost increases. Future minimum annual payments under non-cancelable operating leases at June 30, 2017 are as follows (in thousands):
Year ending June 30, | Amount | |||
2018 | $ | 2,610 | ||
2019 | 2,571 | |||
2020 | 2,598 | |||
2021 | 1,442 | |||
2022 | 1,379 | |||
Thereafter | 2,391 | |||
Total future minimum lease payments | $ | 12,991 | ||
Rent expense totaled $2.5 million, $2.3 million and $2.4 million for the years ended June 30, 2017, 2016 and 2015, respectively.
Contingencies
The Company accounts for contingent liabilities in accordance with Accounting Standards Codification ("ASC") Topic 450, Contingencies. This guidance requires management to assess potential contingent liabilities that may exist as of the date of the financial statements to determine the probability and amount of loss that may have occurred, which inherently involves an exercise of judgment. If the assessment of a contingency indicates that it is probable that a material loss has been incurred and the amount of the liability can be estimated, then the estimated liability would be accrued in the Company’s financial statements. If the assessment indicates that a potential material loss contingency is not probable but is reasonably possible, or is probable but cannot be estimated, then the nature of the contingent liability, and an estimate of the range of possible losses, if determinable and material, would be disclosed. For loss contingencies considered remote, no accrual or disclosures are generally made. Management has assessed potential contingent liabilities as of June 30, 2017, and based on the assessment there are no probable loss contingencies requiring accrual or disclosures within its financial statements.
Legal Accruals
In addition to commitments and obligations in the ordinary course of business, from time to time, the Company is subject to various claims, pending and potential legal actions, investigations relating to governmental laws and regulations and other matters arising out of the Company's normal conduct of business. Management assesses contingencies to determine the degree of probability and range of possible loss for potential accrual in the consolidated financial statements. An estimated loss contingency is accrued in the consolidated financial statements if it is probable that a liability has been incurred and the amount of the loss can be reasonably estimated. Because evaluating legal claims and litigation results are inherently unpredictable and unfavorable results could occur, assessing contingencies is highly subjective and requires judgments about future events. When evaluating contingencies, management may be unable to provide a meaningful estimate due to a number of factors, including the procedural status of the matter in question, the presence of complex or novel legal theories, and/or the ongoing discovery and development of information important to the matters. In addition, damage amounts claimed or asserted against the Company may be unsupported, exaggerated or unrelated to possible outcomes, and as such are not meaningful indicators of a potential liability. Management regularly reviews contingencies to determine the adequacy of financial statement accruals and related disclosures. The amount of ultimate loss may differ from these estimates. It is possible that cash flows or results of operations could be materially affected in any particular period by the unfavorable resolution of one or more of these contingencies. Whether any losses finally determined in any claim, action, investigation or proceeding could reasonably have a material effect on the Company's business, financial condition, results of operations or cash flows will depend on a number of variables, including: the timing and amount of such losses; the structure and type of any remedies; the significance of the impact any such losses, damages or remedies may have on the consolidated financial statements; and the unique facts and circumstances of the particular matter that may give rise to additional factors.
F - 28
Class Action Lawsuit: On September 15, 2016, a purported securities class action was filed in the United States District Court for the District of Utah, entitled Zhang v. LifeVantage Corp., Case No. 2:16-cv-00965-BCW (D. Utah filed Sept. 15, 2016). In this action (now recaptioned as In re LifeVantage Corp. Securities Litigation), plaintiff alleges that the Company, its Chief Executive Officer and former Chief Financial Officer violated Sections 10(b) and/or 20(a) of the Securities Exchange Act of 1934, 15 U.S.C. §§ 78j(b), 78t(a), and Rule 10b-5, 17 C.F.R. § 240.10b-5, promulgated thereunder, by making false or misleading statements or omissions in public filings with the Securities and Exchange Commission regarding the Company's internal controls and financial results for the first, second and third quarters of fiscal year 2016. The initial complaint sought unspecified damages against the defendants on behalf of a class of purchasers of the Company’s stock between November 4, 2015 and September 13, 2016. By stipulation filed October 7, 2016, the parties agreed that defendants need not respond to the initial complaint in the action until after a lead plaintiff is appointed pursuant to the Private Securities Litigation Reform Act of 1995 (“PSLRA”), at which time the parties would meet and confer regarding the timing of the filing of an amended complaint and responses thereto. On December 13, 2016, the Court appointed Dale Blanch and Yvonne Cohen as lead plaintiffs and approved their selection of lead plaintiffs’ counsel. On January 27, 2017, lead plaintiffs filed an amended complaint. On March 13, 2017, defendants filed a motion to dismiss the amended complaint for failure to state a claim for relief and a motion to strike certain irrelevant matters from the amended complaint. On June 15, 2017, the Court granted defendants’ motion to dismiss, without prejudice, denied defendants’ motion to strike and granted lead plaintiffs fourteen days to file a motion for leave to amend. Thereafter, the parties agreed to extend lead plaintiffs’ deadline to file a motion for leave to amend by one week. On July 6, 2017, lead plaintiffs filed a motion for leave to amend. Defendants’ opposition to that motion is due to be filed on July 20, 2017. No hearing date has been set for this motion. By operation of the PSLRA, all discovery and other proceedings remain stayed. The Company has not established a loss contingency accrual for this lawsuit as it believes liability is not probable or estimable, and the Company plans to continue to vigorously defend against this lawsuit. Nonetheless, an unfavorable resolution of this matter could have a material adverse effect on the Company's business, results of operations or financial condition.
Derivative Action Lawsuits: On October 11, 2016, two purported shareholder derivative actions were filed in the Third District Court of the State of Utah, Salt Lake County, entitled Johnson v. Jensen, Case No. 160906320 MI (Utah Dist. filed Oct. 11, 2016), and Rupp v. Jensen, Case No. 160906321 MI (Utah Dist. filed Oct. 11, 2016). In these actions (which are substantively identical), plaintiffs, purportedly on behalf of the Company, allege that the Company's Chief Executive Officer, former Chief Financial Officer and members of the Board of Directors breached their fiduciary duties owed to the Company by, among other things, causing or permitting the Company to issue false and misleading statements or omissions in public filings with the Securities and Exchange Commission, as alleged in the class action lawsuit noted above. On October 19, 2016, the Court entered an order consolidating the two actions under the Johnson case number, with the new caption In re LifeVantage Corp. Derivative Litigation, providing that defendants and nominal defendant need not respond to the initial complaints and directing the parties to meet and confer within thirty days on a schedule for further proceedings in this action. On November 21, 2016, the Court approved a stipulation between the parties providing that (a) defendants and nominal defendant need not respond to the initial complaints and (b) within thirty days from the earlier of (i) the Company’s filing of its Form 10-K for fiscal year 2016 and (ii) plaintiffs’ filing of a consolidated amended complaint, the parties will meet and confer on a schedule regarding further proceedings in this action. On January 10, 2017, the Court approved a stipulation between the parties providing that this action would be deferred (i.e., stayed) pending a ruling on defendants’ then-anticipated motion to dismiss the amended complaint in the Class Action Lawsuit. On March 13, 2017, plaintiffs filed a consolidated amended complaint. On July 14, 2017, the parties agree to continue the deferral (stay) of this action pending a ruling denying lead plaintiffs’ motion for leave to amend or on defendants’ anticipated motion to dismiss the amended complaint in the Class Action Lawsuit.
On January 30, 2017, another purported shareholder derivative action was filed in the United States District Court for the District of Utah, entitled Hansen v. Jensen, Case No. 2:17-cv-00075-DN (D. Utah filed Jan. 30, 2017). In this action, plaintiff, purportedly on behalf of the Company, alleges that the Company’s Chief Executive Officer, former Chief Financial Officer and members of the Board of Directors violated Section 14(a) of the Securities Exchange Act of 1934, 15 U.S.C. § 78n(a), and breached their fiduciary duties owed to the Company by, among other things, causing or permitting the Company to issue false and misleading statements or omissions in public filings with the SEC, as alleged in the class action lawsuit noted above. On March 30, 2017, the parties entered into a stipulation providing that this action would be stayed pending a ruling on defendants’ motion to dismiss the amended complaint in the Class Action Lawsuit. On February 27, 2017, another purported shareholder derivative action was filed in the United States District Court for the District of Utah, entitled Baker v. Jensen, Case No. 2:17-cv-00141-PMW (D. Utah filed Feb. 27, 2017). Also, on April 24, 2017, another purported shareholder derivative action was filed in the United States District Court for the District of Utah, entitled Inforzato v. Jensen, Case No. 2:17-cv-00317-JNP (D. Utah filed Apr. 24, 2017). In these actions, plaintiffs, also purportedly on behalf of the Company, make similar allegations as the plaintiff in Hansen v. Jensen, described above. The parties in Baker and Inforzato similarly have agreed to stays of those actions pending a ruling on defendants’ motion to dismiss in the Class Action Lawsuit. All Derivative Action Lawsuits remain stayed.
F - 29
The Company notes that although the plaintiffs in the Derivative Action Lawsuits purport to seek unspecified damages against the individual defendants on behalf of the Company, the Company owes certain indemnification obligations to these individual defendants under Colorado law and existing indemnification agreements. The Company has not established a loss contingency accrual for this lawsuit as it believes liability is not probable or estimable, and the defendants plan to vigorously defend against this lawsuit. Nonetheless, an unfavorable resolution of this matter could have a material adverse effect on the Company's business, results of operations or financial condition.
Other Matters. In addition to the matters described above, the Company also may become involved in other litigation and regulatory matters incidental to its business and the matters disclosed in this Annual Report on Form 10-K, including, but not limited to, product liability claims, regulatory actions, employment matters and commercial disputes. The Company intends to defend itself in any such matters and does not currently believe that the outcome of any such matters will have a material adverse effect on the Company's business, financial condition, results of operations and cash flows.
Note 12 — Related Party Transactions
During fiscal 2017, Dinng, a brand and digital brand studio, provided branding and marketing services to the Company. In June 2017, the Company completed an acquisition of the assets of Dinng. The Company paid a total of $0.5 million for branding and marketing services provided during fiscal 2017 and the asset acquisition. The Company paid $0.5 million for branding and marketing services provided during fiscal 2016. The Company's Chief Marketing Officer, Ryan Goodwin, was the Founder, President and Creative Director of Dinng. Mr. Goodwin and his wife were both salaried employees at Dinng during fiscal 2017, prior to the completion of the asset acquisition.
Effective January 2014, the Company commenced a partnership with Real Salt Lake of Major League Soccer, which includes the placement of the Company's logo on the front of the team’s jersey as well as strategic placement of the Company's logo around the stadium and on televised broadcasts of the games. In July 2015, Dell Loy Hansen, the sole owner of Real Salt Lake and Real Monarchs SLC, became a major stockholder of the Company. During the fiscal years ended June 30, 2017, 2016 and 2015, the Company paid $2.2 million, $2.8 million and $0.2 million, respectively, to Real Salt Lake, pursuant to the terms of this partnership, and other various amounts for the endorsement of Real Monarchs SLC and for product marketing expenses.
During fiscal 2017, Outhink Inc., a digital media and application development company, provided consulting services to the Company pursuant to an Agreement for Services dated October 20, 2016 between the Company and Outhink Inc. in the amount of $0.1 million. David Toole, a member of the Company's board of directors, is the majority owner and serves as the Chief Executive Officer of Outhink Inc.
During fiscal 2017, the Company entered into an agreement with Gig Economy Group ("GEG") for outsourced software application development services. Pursuant to the agreement, the Company paid $0.4 million and will pay a total of $1.2 million under the terms of the agreement. David Toole, a member of the Company's board of directors, is the majority owner and an officer of GEG.
Note 13 — Interim Financial Results (Unaudited)
The following summarizes selected quarterly financial information for quarterly periods during the years ended June 30, 2017 and 2016, and includes revisions to prior period balances to adjust for the immaterial errors discussed previously in Note 2 to the consolidated financial statements.
LIFEVANTAGE CORPORATION AND SUBSIDIARIES
CONDENSED CONSOLIDATED QUARTERLY RESULTS
(in thousands except per share data)
Fiscal Quarter | Year ended June 30, 2017 | ||||||||||||||||||
First | Second | Third | Fourth | ||||||||||||||||
Revenue, net | $ | 54,894 | $ | 48,947 | $ | 45,007 | $ | 50,641 | $ | 199,489 | |||||||||
Gross profit | 46,062 | 41,447 | 36,774 | 41,750 | 166,033 | ||||||||||||||
Net income | $ | 1,180 | $ | 283 | $ | 61 | $ | 84 | $ | 1,608 | |||||||||
Per common share: | |||||||||||||||||||
Income per share, basic | $ | 0.09 | $ | 0.02 | $ | 0.00 | $ | 0.01 | $ | 0.12 | |||||||||
Income per share, diluted | $ | 0.08 | $ | 0.02 | $ | 0.00 | $ | 0.01 | $ | 0.11 | |||||||||
F - 30
Fiscal Quarter | Year ended June 30, 2016 | ||||||||||||||||||
First | Second | Third | Fourth | ||||||||||||||||
(As Revised) | (As Revised) | ||||||||||||||||||
Revenue, net | $ | 45,352 | $ | 51,995 | $ | 56,160 | $ | 53,033 | $ | 206,540 | |||||||||
Gross profit | 38,377 | 44,153 | 46,446 | 43,632 | 172,608 | ||||||||||||||
Net income | $ | 1,066 | $ | 1,600 | $ | 1,003 | $ | 2,437 | $ | 6,106 | |||||||||
Per common share: | |||||||||||||||||||
Income per share, basic | $ | 0.08 | $ | 0.12 | $ | 0.07 | $ | 0.18 | $ | 0.44 | |||||||||
Income per share, diluted | $ | 0.08 | $ | 0.11 | $ | 0.07 | $ | 0.17 | $ | 0.42 | |||||||||
F - 31