Attached files
| file | filename |
|---|---|
| EX-32 - EXHIBIT 32 - Fenix Parts, Inc. | fenx-20161231xex32.htm |
| EX-31.2 - EXHIBIT 31.2 - Fenix Parts, Inc. | fenx-20161231xex312.htm |
| EX-31.1 - EXHIBIT 31.1 - Fenix Parts, Inc. | fenx-20161231xex311.htm |
| EX-23.2 - EXHIBIT 23.2 - Fenix Parts, Inc. | fenx-20161231xex232.htm |
| EX-23.1 - EXHIBIT 23.1 - Fenix Parts, Inc. | fenx-20161231xex231.htm |
| EX-21 - EXHIBIT 21 - Fenix Parts, Inc. | fenx-20161231xex21.htm |
| EX-10.67# - EXHIBIT 10.67# - Fenix Parts, Inc. | fenx-20161231xex1067.htm |
| EX-10.66# - EXHIBIT 10.66# - Fenix Parts, Inc. | fenx-20161231xex1066.htm |
| EX-10.65 - EXHIBIT 10.65 - Fenix Parts, Inc. | fenx-20161231xex1065.htm |
| EX-10.9 - EXHIBIT 10.9 - Fenix Parts, Inc. | fenx-20161231xex109.htm |
SECURITIES AND EXCHANGE COMMISSION
WASHINGTON, D.C. 20549
_______________________________________
FORM 10-K
_______________________________________
x | ANNUAL REPORT PURSUANT TO SECTION 13 OR 15(d) OF THE SECURITIES EXCHANGE ACT OF 1934 |
For the fiscal year ended December 31, 2016
OR
¨ | TRANSITION REPORT PURSUANT TO SECTION 13 OR 15(d) OF THE SECURITIES EXCHANGE ACT OF 1934 |
For the Transition Period from to
Commission File Number 001-37382
_______________________________________
FENIX PARTS, INC.
(Exact name of Registrant as specified in its charter)
_______________________________________
Delaware | 46-4421625 | |
(State or other jurisdiction of incorporation or organization) | (I.R.S. ID) | |
One Westbrook Corporate Center, Suite 920 Westchester, Illinois | 60154 | |
(Address of Principal Executive Offices) | (Zip Code) | |
Registrant’s telephone number, including area code: 708-407-7200
_______________________________________
Title of Each Class | Name of each exchange on which registered | |
Common Stock, par value $.001 per share | NASDAQ Global Market* | |
Securities registered pursuant to Section 12(g) of the Act: None
________________________________________
Indicate by check mark if the registrant is a well-known seasoned issuer, as defined in Rule 405 of the Securities Act. Yes ¨ No x
Indicate by check mark if the registrant is not required to file reports pursuant to Section 13 or 15(d) of the Act. Yes ¨ No x
Indicate by check mark whether the registrant: (1) has filed all reports required to be filed by Section 13 or 15(d) of the Securities Exchange Act of 1934 during the preceding 12 months (or for such shorter period that the registrant was required to file such reports), and (2) has been subject to such filing requirements for the past 90 days. Yes ¨ No x
Indicate by check mark whether the registrant has submitted electronically and posted on its corporate Web site, if any, every Interactive Data File required to be submitted and posted pursuant to Rule 405 of Regulation S-T (§232.405 of this chapter) during the preceding 12 months (or for such shorter period that the registrant was required to submit and post such files). Yes x No ¨
Indicate by check mark if disclosure of delinquent filers pursuant to Item 405 of Regulation S-K (§229.405) is not contained herein, and will not be contained, to the best of registrant's knowledge, in definitive proxy or information statements incorporated by reference in Part III of this Form 10-K or any amendment to this Form 10-K. ¨
Indicate by check mark whether the registrant is a large accelerated filer, an accelerated filer, a non-accelerated filer, or a smaller reporting company. See the definitions of "large accelerated filer," "accelerated filer," and "smaller reporting company" in Rule 12b-2 of the Exchange Act. (Check one):
Large accelerated filer | ¨ | Accelerated filer | ¨ |
Non-accelerated filer | x (Do not check if a smaller reporting company) | Smaller reporting company | ¨ |
Emerging growth company | x | ||
If an emerging growth company, indicate by check mark if the registrant has elected not to use the extended transition period for complying with any new or revised financial accounting standards provided pursuant to Section 13(a) of the Exchange Act. | x | ||
Indicate by check mark whether the registrant is a shell company (as defined in Rule 12b-2 of the Exchange Act). Yes ¨ No x
As of June 30, 2016, the aggregate market value of common stock outstanding held by stockholders who were not affiliates of the registrant was approximately $64 million (based on the closing sale price on the NASDAQ Global Market on such date).
The number of outstanding shares of the registrant's common stock as of July 20, 2017 was 20,327,685.
* Suspended from trading on June 29, 2017
Documents Incorporated by Reference
None.
TABLE OF CONTENTS
Page No. | ||
3
PART I
CAUTIONARY NOTE REGARDING FORWARD-LOOKING STATEMENTS
This Annual Report on Form 10-K includes "forward-looking statements" within the meaning of the federal securities laws, which involve risks and uncertainties. Forward-looking statements include all statements that do not relate solely to historical or current facts, and you can identify forward-looking statements because they contain words such as "believes," "expects," "may," "will," "should," "seeks," "intends," "trends," "plans," "estimates," "projects" or "anticipates" or similar expressions that concern our strategy, plans, expectations or intentions. All statements made relating to our estimated and projected earnings, margins, costs, expenditures, cash flows, growth rates and financial results are forward-looking statements. These forward-looking statements are subject to risks, uncertainties and other factors that may cause our actual results, performance or achievements to be materially different from expected or projected results, performance or achievements expressed or implied by such forward-looking statements. We derive many of our forward-looking statements from our operating budgets and forecasts, which are based upon many detailed assumptions. While we believe that our assumptions are reasonable, it is very difficult to predict the effect of known factors, and, of course, it is impossible to anticipate all factors that could affect our actual results. Some of these risks, uncertainties, and other factors are set forth elsewhere in this Annual Report on Form 10-K and in other documents we have filed with the SEC and include, among other things:
• | Lack of liquidity materially adversely affecting our ability to continue as a going concern if we are unable to execute on the development of a strategic alternative to improve liquidity; |
• | Our relatively short operating history and our ability to successfully integrate our operating subsidiaries ("Subsidiaries"), and those subsidiaries we may acquire; |
• | Reduced liquidity and market price of our stock due to trading on Pink Sheets, instead of being listed on a national securities exchange; |
• | Our ability to satisfy our debt obligations and to operate in compliance with our financing agreements; |
• | Our ability to successfully locate and acquire businesses that provide recycled OEM automotive products and our ability to successfully integrate acquired companies with our business; |
• | Our ability to acquire additional businesses that may require financing that we are unable to obtain on acceptable terms or at all; |
• | Our success in managing internal growth; |
• | Variations in the number of vehicles sold, vehicle accident rates, miles driven and the age of vehicles in accidents; |
• | Competition from vehicle replacement part companies, including but not limited to those that provide recycled parts; |
• | Our ability to maintain our relationships with auto body shops, insurers, other customers and with auction companies from which we purchase our salvage vehicles; |
• | Our compliance and our Subsidiaries' past compliance with environmental laws and regulations and federal, state and local operating and permitting requirements; |
• | Known environmental liabilities at the facility we have been leasing in Toronto, Ontario since May 2015, associated with groundwater and surface water contamination as a result of historical releases and a petroleum hydrocarbon spill in November 2010, which we did not assume; |
• | Potential for significant impairment of goodwill and intangibles; |
• | Fluctuations in the prices of scrap metal and other metals; |
• | Changes in the exchange rate for the Canadian Dollar; |
• | Changes in the national, provincial or state laws and regulations affecting our business; |
• | Disruptions in the information technology systems on which our business relies; |
• | Damage to our business and reputation in the event of an unfavorable outcome to an ongoing SEC inquiry which commenced in September 2016; |
• | Securities class action litigation filed in 2017 due to the decline in our stock price; |
• | The impact of a fire in April 2017 at our Toronto Facility and a subsequent order by a Director of the Ontario Ministry of the Environment and Climate Change that we must submit a plan for approval prior to recommencing operations; |
• | Material weaknesses in our internal control over financial reporting; and |
• | Other factors discussed under the headings "Risk Factors," "Management’s Discussion and Analysis of Financial Condition and Results of Operations" and "Business". |
Given these risks and uncertainties, you are cautioned not to place undue reliance on our forward-looking statements. Projections and other forward-looking statements included in this filing have been prepared based on assumptions, which we believe to be reasonable, but not in accordance with GAAP or any guidelines of the SEC. Actual results may vary, perhaps materially. All subsequent written and oral forward-looking statements attributable to us or to persons acting on our behalf are expressly qualified in their entirety by these cautionary statements. Except as required by federal securities laws, we disclaim any intention or obligation to update or revise any forward-looking statements, whether as a result of new information, future events or otherwise. Any such forward-looking statements, whether made in this Annual Report on Form 10-K or elsewhere, should be considered in the context of the various
4
disclosures made by us about our business including, without limitation, the risk factors discussed above. For further discussion of these and other factors that could impact our future results, performance or transactions, please carefully read "Risk Factors."
ITEM 1. BUSINESS
As used in this Annual Report on Form 10-K, references to "Fenix" refer to Fenix Parts, Inc. solely, and references to the "Company," "our", "we", "us" and similar terms refer to Fenix Parts, Inc., together with our Subsidiaries, as defined below.
OVERVIEW
We are in the business of automotive recycling, which is the recovery and resale of original equipment manufacturer ("OEM") parts, components and systems, such as engines, transmissions, radiators, trunks, lamps and seats (referred to as "products") reclaimed from damaged, totaled or low value vehicles. We purchase our vehicles primarily at auto salvage auctions. Upon receipt of vehicles, we inventory and then dismantle the vehicles and sell the recycled products. Our customers include collision repair shops (body shops), mechanical repair shops, auto dealerships and individual retail customers. We also generate a portion of our revenue from the sale as scrap of unusable parts and materials, from the sale of used cars and motorcycles, the sale of aftermarket parts, and from the sale of extended warranty contracts.
We provide customers with high quality recycled OEM products, extensive inventory and product availability, responsive customer service and fast delivery. We operate a hub and spoke distribution network allowing us to efficiently move products among our locations and expedite delivery to our customers. We distribute a variety of products to collision and mechanical repair shops, including recycled OEM products, as well as aftermarket, refurbished and remanufactured parts. Collectively, we refer to these products as alternative parts because they are not new OEM products.
History
Fenix was founded on January 2, 2014 to acquire and combine companies in the automobile recycling and resale industry. Fenix Parts Canada, Inc. ("Fenix Canada"), a wholly-owned subsidiary of Fenix, was established on September 24, 2014 primarily to facilitate the acquisition and combination of companies in the automobile recycling and resale industry in Canada. Through November 2014, Fenix and Fenix Canada entered into Combination Agreements to acquire (in transactions referred to as the "Combinations") eleven corporate entities that operate eight businesses (the "Founding Companies"), contingent upon, among other things, the closing of an initial public offering ("IPO"). On May 19, 2015, Fenix completed the IPO and closed on the Combinations with the Founding Companies, including those Founding Companies that are designated as accounting co-predecessors, Don’s Automotive Mall, Inc., Gary’s U-Pull It, Inc., and Horseheads Automotive Recycling, Inc. (collectively, the "Beagell Group"); and Standard Auto Wreckers Inc., End of Life Vehicles Inc., Goldy Metals Incorporated, and Goldy Metals (Ottawa) Incorporated (collectively, "Standard"). The aggregate consideration paid by Fenix in the Combinations (the "Combination Consideration") is detailed in Note 4 to the consolidated financial statements in this document. Fenix raised the cash portion of the Combination Consideration in its IPO as well as from indebtedness. The operations of the Founding Companies are reflected in the consolidated statements of operations from the date of acquisition on May 19, 2015. During the third quarter and fourth quarter of 2015, Fenix acquired three additional automobile recycling companies ("Subsequent Acquisitions"). Our Founding Companies and Subsequent Acquisitions represent our operating subsidiaries ("Subsidiaries"). The operations of our Subsequent Acquisitions are also reflected in the consolidated statements of operations from their respective dates of acquisition.
Products
The recycled OEM products that we sell include mechanical parts used to repair or replace worn or damaged components, such as engines and transmissions, and collision repair parts used to repair vehicles typically involved in a collision, such as door assemblies, trunk lids, lights, fenders and other products. These products are "insurance quality," which means they are acceptable for use in a repair paid for by an insurance company. Many consumers and repair facilities use recycled OEM products because they are less expensive than new OEM products and are perceived to be of higher quality and better fit than products made by non-OEM manufacturers, known as aftermarket products. Recycled OEM products often are sold as assemblies, which shorten repair times and help reduce labor costs. In addition, insurance companies are increasingly influencing repair facilities to use recycled OEM products as a lower cost alternative to new OEM products.
Typically, damaged, totaled or low value vehicles acquired by insurance companies are resold through auto salvage auctions. Some insurance companies mandate that recycled OEM products be no older than the vehicle they are used to repair; thus, the majority of the vehicles we acquire are not more than ten years old. We employ software-based inventory management systems to determine what vehicles to purchase and at what price, based upon our estimation of the demand for the products on the vehicle, the prices we can obtain for those products and the final scrap value of the vehicle.
The demand for our products and services is influenced by several factors, including the number of vehicles on the road, the number of miles being driven, the number and age of drivers, the frequency and severity of vehicle accidents, the age of vehicles in accidents, availability and pricing of new OEM parts and weather conditions. There is no standard price for many of our products, but rather a pricing structure that varies based upon such factors as product availability, quality, demand, new OEM product prices, the age and mileage of the vehicle from which the part was obtained and competitor pricing.
6
In addition, we generate revenues from the disposal of end of life vehicles, related scrap sales and the sale of extended warranties. We obtain scrap as a byproduct from vehicles that have been used in both full-service and self-service recycling operations. The sale of scrap includes catalytic converters, fluids, wheels and tires, copper wiring, cores and crushed hulls. Ancillary revenues related to the disposal of end of life vehicles and related scrap sales will vary based on fluctuations in commodity prices and the volume of materials sold.
Customers
Our customers include collision and mechanical repair shops, auto dealerships and individual retail customers. Competition for sales is based primarily on product availability, delivery times and price. Our ability to deliver insurance quality recycled OEM products on a same or next day basis is a critical service requirement of our customers. Customers can find and purchase our parts in many ways including searching our websites, by telephone (speaking with one of our sales professionals) or in-person at one of our fulfillment centers. We apply a coordinated regional approach to our inventory management and distribution activities, which allows us to increase the availability of our products and efficiently meet demand within the markets we serve. In 2016, we sold products to more than 12,000 customers. There were no significant customers that accounted for more than 10% of total revenues during 2016 or 2015.
Industry
The Auto Care Association ("ACA") estimates that the U.S. automotive aftermarket was approximately $267 billion in 2016. We operate in the U.S. collision and mechanical repair products market, a subset of the U.S. automotive aftermarket. According to ACA, the U.S. collision and mechanical repair products market was approximately $70 billion in 2016.
The automotive recycling industry is highly fragmented, with few multi-facility operators. According to the Automotive Recyclers Association ("ARA"), there are an estimated 9,400 vehicle recycling facilities in the United States and Canada. We believe that there is only one direct competitor with more than 1% market share within the automotive recycling industry. We believe this competitor has less than 10% market share.
The automotive recycling industry obtains its insurance quality recycled OEM products from damaged, totaled or low value vehicles purchased at salvage auctions. In 2016, there were over 300 salvage auction locations in the U.S. and Canada at which over 2.5 million damaged, totaled or low value vehicles were sold on behalf of automobile insurance companies and other sellers to licensed buyers, such as us.
The industry’s direct customers are collision and mechanical repair shops that use recycled OEM products in vehicle repairs. The industry also indirectly serves insurance companies as they pay for the majority of repairs to insured vehicles and thus have significant influence over the repair process. Major U.S. insurance companies are encouraging collision repair shops to reduce costs, thus influencing them to utilize recycled OEM products in the repair of damaged vehicles.
In addition, automotive recycling is considered environmentally responsible, as approximately 86% of a vehicle's material content is typically reclaimed or recycled. We believe that many environmentally conscious consumers prefer recycled products and over time government regulation will continue to favor environmentally friendly solutions.
Competition
Buyers of vehicle replacement products have the option to purchase from primarily five sources: new products produced by OEM; new products produced by companies other than the OEMs, which are commonly referred to as aftermarket products; recycled OEM products obtained by automobile recyclers from salvage vehicles; used automotive products that have been refurbished; and used automotive products that have been remanufactured. We view all suppliers of vehicle replacement products as our competitors. While we compete with all parts suppliers, there are few automobile recyclers with regional distribution networks like ours that can reach the majority of customers within the optimum delivery time. We have begun to distinguish ourselves from other suppliers primarily through our broad recycled OEM product selection, which encompasses popular and hard-to-find items or products, our distribution network, stock management systems, and our service. We compete on the basis of product breadth and depth, rapid and dependable delivery, marketing initiatives, support services, and price.
COMPETITIVE STRENGTHS
Favorable Industry Dynamics
We believe that demand for recycled OEM products is highly stable and marked by consistent long-term growth due to a number of favorable trends, including the number of vehicles on the road (commonly referred to as the "car parc"), the increasing miles driven and the number and age of drivers. Additionally, we believe the utilization of recycled OEM products over the last decade has continued to increase given the inherent favorable pricing and product availability of recycled OEM products relative to other replacement products.
Competitive Market Position
We believe that we operate the second largest network of automotive recycling companies in the eastern region of North America (U.S. and Canada) with twelve full-service and four self-service recycling locations, two of which are co-located at existing full-service facilities,
7
although our Toronto, Ontario facility (the "Toronto facility") was severely damaged in a fire in April 2017. Please see the section below entitled "Facilities" and Risk Factors for a more detailed discussion of the fire and its repercussions. We believe the strength of our regional network, our customer relationships and our extensive inventory of insurance quality recycled OEM automotive products give us a competitive advantage and create high barriers to entry.
Extensive Inventory and Distribution Platform with Broad Customer Reach
Our extensive inventory of insurance quality recycled OEM automotive products and our distribution infrastructure give us the ability to help our customers reduce repair cycle time by delivering our products typically the same or next day. In order to increase the availability of our products, we maintain an extensive inventory and have developed a coordinated regional approach to inventory management and distribution. Our network enables us to reach three of the ten largest cities in North America by population. This customer base exceeds 12,000 customers with no one customer accounting for more than 3% of our consolidated net revenues in 2016 and 2015.
Dynamic Vehicle Procurement Process
A critical component of our success and growth is our ability to identify and value the products that can be recycled from a salvage vehicle. We have developed a scalable, data-driven approach, utilizing real-time sales and inventory information, which allows us to procure vehicles in a cost-efficient manner, optimize the dismantling process and profitably sell these products to our customers.
Deep Industry Expertise
We benefit from the industry expertise and deep customer relationships that have been established at the Subsidiaries over the course of their history as standalone businesses. Our key management personnel at most of the Subsidiaries have served an average of 20 years in the automotive recycling industry and many have held senior leadership positions in key industry trade groups, such as the ARA.
Experienced Management Team
Our senior management has significant experience operating and growing automotive and logistics-based businesses. Prior to co-founding Fenix, our Chief Executive Officer, Kent Robertson, held several senior leadership positions at Stericycle, Inc. ("Stericycle"), a national reverse logistics and regulated waste management company. Mr. Robertson had more than 20 years of experience managing multi-line decentralized distribution and services businesses at Stericycle and at American Medical Disposal, Inc., a company he co-founded in 1990, which was acquired by Stericycle in 2001. Under Mr. Robertson’s leadership, Stericycle successfully completed and integrated over 70 acquisitions. Our Chief Financial Officer, Scott Pettit, also a co-founder of Fenix, has significant automotive industry, public company, acquisition and integration experience, including serving from 2001 to 2007 as the Chief Financial Officer of Insurance Auto Auctions, Inc.
Attractive Financial Model
We believe our highly variable cost structure, low requirements for capital expenditures (in 2016, our maintenance capital expenditures were less than 1% of total revenues) and the stability of the collision and mechanical repair products market combine to give our business the potential to deliver strong results through a variety of business cycles. We believe that these factors should allow us to produce significant cash flow. However, our achieving these cash flows has been, and may continue to be constrained by the extraordinary levels of professional fees that we have experienced.
Organizational Structure
We operate on a decentralized basis with an emphasis on regional and local market execution supported by corporate coordination. Local management teams operate the businesses and leverage their relationships with customers and suppliers. At the same time, certain administrative functions are centralized on a regional and, in certain circumstances, a national basis, including but not limited to corporate strategy and acquisitions, accounting and related functions, marketing, human resources, information technology and systems support and environmental compliance.
STRATEGY
We believe that there is significant demand for a strong “number two” participant in the OEM automotive parts recycling business to compete with the industry leader, and that the execution of our business strategies would allow us to grow and to enhance shareholder value. However, because of our lack of liquidity (described in Note 1 to the consolidated financial statements included in this Annual Report on Form 10-K) and lack of strong internal control over financial reporting and integrated information systems, which has led to extraordinarily high professional fees and delays in being able to publicly report financial results, we are currently not in a position to implement or continue to pursue many of these business strategies, and there is no guarantee that we will be able to do so in the future.
Enhance and Build our Network through Acquisitions
The acquisition of other OEM automotive products recycling businesses is a key element of our strategy. This would increase our customer base, grow our distribution network and expand our inventory and warehouse capacity. There are currently an estimated 9,000 facilities in the automotive recycling industry, and we believe an ample number of attractive acquisition candidates. Subsequent to our initial public offering and the acquisition of the Founding Companies, during 2015 we acquired three businesses operating in geographic areas that fit
8
within our strategic growth plan. We use a disciplined approach to identify and evaluate acquisition candidates to increase customer and route density within our network and expand into new geographic markets. However, our Credit Facility and related Forbearance Agreement (described in Note 1 to the consolidated financial statements included in this Annual Report on Form 10-K) contain financial covenants that are likely to preclude the acquisition of new businesses for the foreseeable future.
Organically Grow Market Share and Unit Volume
We have identified initiatives to increase vehicle processing throughput, inventory and product availability, and thereby grow revenue, volume and market share. However, because of our current lack of liquidity described in Note 1 to the consolidated financial statements included in this Annual Report on Form 10-K, we may not be able to fully pursue these initiatives in the foreseeable future.
These initiatives include:
• | Expand Dismantling Capacity. We operate 67 dismantling bays within our full-service auto recycling facilities. We can also add bays or shifts to increase dismantling utilization. We believe these initiatives would help us increase dismantling capacity and productivity, thereby increasing inventory and product availability to meet additional demand for our products. |
• | Develop an Integrated Technology Platform. We currently utilize third-party software solutions to support our business. We believe this software is sufficient for our current needs, but we are working to implement an integrated technology platform to support our future growth. We believe that any associated cost would be offset through improvements in salvage vehicle procurement, production management, part pricing, inventory management, marketing, sales, logistics and compliance. |
• | Enhance Sales Force Effectiveness. We maintain sales specialists in their local markets to preserve high levels of service and existing customer relationships. We seek to provide our sales force with enhanced training and additional resources to reach new markets and customers. |
• | Expand our Logistics Capacity. We intend to continue to expand our logistics capacity to meet the delivery expectations of our customers (typically the same or next day). Provided sufficient capital is available, we may invest in additional infrastructure, including trucks, employees or transfer hubs, to expand in existing markets and into adjacent markets. |
Enhance Operating Efficiencies and Increase Profit Margins
We have identified certain best practices among our Subsidiaries that improve salvage vehicle procurement and dismantling, enhance product delivery and maximize the value of end-of-life vehicles. We have begun to implement these best practices across our network to improve our operating efficiencies and profit margins. Further, we believe an integrated operating platform within geographic areas creates opportunities for economies of scale as we grow.
INTELLECTUAL PROPERTY
We own various trade names as a result of the acquisitions of the Subsidiaries. We do not believe that our business is materially dependent on any single or group of related trade names.
EMPLOYEES
As of December 31, 2016, we had approximately 633 employees at our recycled parts facilities and approximately 33 employees at our corporate headquarters. We enjoy good relations with our employees and are not party to any labor management agreement.
RELATED PARTIES
Please refer to Item 13, "Certain Relationships and Related Transactions and Director Independence," and Note 15 Related Party Transactions, to the consolidated financial statements included in this Annual Report on Form 10-K for information about our related parties and corresponding transactions with them.
FACILITIES
We lease an office building in Westchester, Illinois, which serves as our corporate headquarters. This facility will meet our growth requirements for the foreseeable future.
We have twelve full-service recycling facilities, concentrated in the Northeastern and Southeastern United States and Southeastern Canada. These locations include Bayville, NJ, Binghamton, NY, Forest City, NC, Greensboro, NC, Niagara Falls, NY, Pennsburg, PA, Rahway, NJ, Ottawa, Ontario, Port Hope, Ontario, Queensbury, NY, Watertown, NY, and Jacksonville, FL. Our full-service recycling facilities have a total of 67 bays for dismantling of vehicles and approximately 553,000 square feet of indoor warehouse space and approximately 226 acres of total storage. Our facilities employ state-of-the art environmental systems for removing fluids prior to dismantling. We have
9
four self-service locations, two of which are co-located with full-service facilities. Our self-service locations are in Binghamton, NY, Elmira, NY, Ottawa, Ontario and Scarborough, Ontario. At these locations, we allow retail customers to directly dismantle, recover and purchase recycled OEM products. Our self-service recycling facilities have approximately 77,000 square feet of indoor storage space and are situated on approximately 55 acres.
On April 6, 2017, a fire destroyed the buildings and contents therein, including computer equipment and certain accounting records, located at our Scarborough (Toronto), Ontario facility. The vehicle inventory stored on the premises was largely undamaged. We maintain insurance for property damage and business interruption losses; however, coverage is subject to deductibles, limits and certain exclusions and may not be sufficient to cover all of the losses incurred. We plan to recommence operations as soon as practicable and rebuild the Toronto facility and infrastructure using insurance proceeds. The Ontario Ministry of Environment and Climate Change issued an order prohibiting us from receiving and processing vehicles at the Toronto facility until the Ministry has accepted a plan to recommence operations in an environmentally safe manner. We are cooperating with all environmental and licensing authorities to recommence operations as soon as practical. See Risk Factors below for further information.
ITEM 1A. RISK FACTORS
Risks Relating to Our Business
We are in breach of certain covenants in our Credit Agreement. Our failure to successfully identify and complete a transaction that improves our liquidity during the forbearance period agreed to by our lenders could materially adversely affect our ability to continue as a going concern.
As a result of certain defaults under our Credit Agreement, we lack liquidity that is necessary to sustain our operations as a going concern. In March 2017, we entered into a forbearance agreement with our lenders that provides us with access to liquidity to continue our operations. The forbearance agreement was amended on June 23, 2017 to extend the forbearance period, which had originally expired on May 26, 2017, until August 31, 2017 (unless terminated earlier due to new defaults not anticipated in the forbearance agreement) and to resolve certain new defaults. We have engaged a financial advisor to assist us in identifying and evaluating strategic alternatives that are intended to improve our liquidity. Unless we have identified and have demonstrated progress satisfactory to our lenders toward the completion of a transaction that could include a business combination, debt and/or equity financing, or a strategic investment into us, after the expiration of the forbearance period, there can be no assurance that our lenders will continue to forbear exercising all remedies available to them under the Credit Agreement, including declaring some or all of the amounts outstanding to be immediately due and payable. If this happens, we do not expect to have sufficient liquidity to repay those amounts, nor would we be able to satisfy our significant obligations under contingent consideration agreements related to certain acquired companies, and our lenders could elect to take action resulting in our liquidation. These matters are more fully described in Note 1 to the consolidated financial statements included in this Annual Report on Form 10-K - "Liquidity and Financial Condition" and “Ability to Continue as a Going Concern.”
We have limited combined operating history, and there are risks associated with the acquisition of our Subsidiaries that could adversely affect the results of our operations.
We were founded in January 2014, and we combined with each of our Founding Companies simultaneously with, and as a condition to, the sale of the shares in our initial public offering in May 2015. During the second half of 2015, we acquired three additional subsidiaries. While we have operated as a combined business with the Subsidiaries since each of their acquisitions, there can be no assurance that we will be able to fully integrate the operations of our Subsidiaries successfully or to institute the necessary systems and procedures, including accounting and financial reporting systems, to manage the combined enterprise on a profitable basis, reduce the extraordinary high level of auditing and accounting fees historically incurred, and report the results of operations of the combined entities on a timely basis. In addition, there can be no assurance that our management team will be able to successfully manage the combined entity and effectively implement our operating or growth strategies. Our success will depend on management’s ability to integrate our current Subsidiaries and any companies we may acquire into one organization. Our inability to successfully integrate the companies we have acquired and to coordinate and integrate certain operational, administrative, financial and information technology systems would have a material adverse effect on our financial condition and results of operations.
If our efforts to locate and acquire desirable companies in the business of providing recycled OEM automotive products are not successful or if we are unable to acquire desirable companies on commercially reasonable terms, our growth prospects will be adversely affected.
One of our principal growth strategies when Fenix was founded and during 2015 was to increase our revenue through the acquisition of additional businesses within our industry. We do not currently have sufficient liquidity or access to capital to support an acquisition strategy. If liquidity improves and the strategy to acquire additional businesses resumes, we face competition in our pursuit to acquire additional businesses, which limits the number of available companies for sale and may lead to higher acquisition prices. When we identify desirable companies, their owners may not be willing to sell their companies at all or on terms that we have determined to be
10
commercially reasonable. If our efforts to locate and acquire desirable companies are not successful, our growth prospects will be adversely affected.
Our ability to acquire additional businesses may require financing that we are unable to obtain or to obtain on acceptable terms.
The timing, size and success of our acquisition efforts is directly related to our ability to obtain capital commitments, which cannot be readily predicted at this time. We have used cash and common stock for acquisitions of companies. However, the significant decline in the price of our common stock and the suspension in trading of our common stock on the Nasdaq Global Market and eventual delisting may result in the unwillingness of potential acquisition candidates to accept common stock as part of the consideration for the sale of their businesses, in which case we may be required to utilize more cash resources. Currently and until the defaults under our Credit Facility (described in Notes 1 and 4 to the consolidated financial statements included in this Annual Report on Form 10-K) are rectified or waived, there can be no further borrowings under our Credit Facility. Furthermore, even if the defaults are rectified or waived there can be no assurance that we will have available sources of financing to support our acquisition strategy or we will be able to obtain financing if and when it is needed or that it will be available on terms that we deem acceptable. Under our Credit Facility, permitted acquisitions are subject to bank review and our meeting certain financial ratios, after giving effect to such acquisition. Our cash and cash equivalents, cash provided by operating activities and funds available from bank borrowings are not sufficient for acquisitions, and we need to raise additional funds through public or private financing or other arrangements. There can be no assurance that additional funding, or refinancing of our Credit Facility, if needed, will be available on terms attractive to us, or at all. Furthermore, any additional equity financing may be dilutive to stockholders, and debt financing, if available, may be costly and involve further restrictive covenants. Failure to raise capital as needed will have a material adverse impact on our acquisition strategy and on our business, operating results, and financial condition.
We may not be able to successfully integrate future acquisitions or generate sufficient revenues from future acquisitions, which could cause our business to suffer.
Assuming that we are able to finance an acquisition, there can be no assurance that we will be able to profitably manage such business or successfully integrate such business without substantial costs, delays or other operational or financial problems. There can be no assurance that the businesses we may acquire will achieve anticipated revenues and earnings. Additionally:
•the key personnel of an acquired business may decide not to work for us;
•changes in management at an acquired business may impair its relationships with employees and customers;
•we may be unable to maintain uniform standards, controls, procedures and policies among acquired businesses;
• | we may be held liable for environmental risks and liabilities as a result of our acquisitions, some of which we may not have discovered during our due diligence; |
•our ongoing business may be disrupted or receive insufficient management attention; and
•we may not be able to realize the cost savings or other financial benefits we anticipated.
Some or all of these factors could have a material adverse effect on our business, financial condition and results of operations.
If we are not able to manage our internal growth, the results of our operations will be adversely affected.
We will attempt to grow our revenues through internal growth as well as through acquisitions, although we do not currently have sufficient liquidity or access to capital to support an acquisition strategy and, as a result, management has focused over the past year on attempting to grow our revenues and increase cash flow through internal growth and integration of existing operations. There can be no assurance that our systems, procedures and controls will be adequate to support our operations as they expand. Any future growth will also impose significant additional responsibilities on management. Furthermore, as we grow, our ability to increase productivity and profitability will be limited by our ability to employ, train and retain skilled personnel to handle critical tasks within our operations and provide services to our customers and partners. There can be no assurance that we will be able to maintain an adequate skilled labor force necessary to operate efficiently or that our labor expenses will not increase as a result of a shortage in the supply of skilled personnel. To the extent that we are unable to manage our growth efficiently and effectively, or are unable to attract and retain skilled personnel, our growth prospects and thereby our financial condition and results of operations will be materially adversely affected.
If the number of vehicles involved in accidents declines or the number of cars being repaired declines, our business could suffer.
11
Our business depends on vehicle accidents and mechanical failures for both the demand for repairs using our products and the supply of recycled, remanufactured and refurbished parts. The number and/or severity of accidents and mechanical failures is influenced by factors including, but not limited to, the number of vehicles on the road, the number of miles driven, the ages of drivers, the occurrence and severity of weather conditions, the congestion of traffic, the use of cellular telephones and other electronic equipment by drivers, the use of alcohol and drugs by drivers, the effectiveness and extent of adoption of accident avoidance systems in newer vehicles, the reliability of new OEM parts, and the condition of roadways. Increases in fuel prices may cause the number of vehicles on the road, the number of miles driven, and the need for mechanical repairs and maintenance to decline, as motorists seek alternative transportation options. Mild weather conditions, particularly during winter months, tend to result in a decrease in vehicle accidents. Additionally, a number of states and municipalities have adopted, or are considering adopting, legislation banning the use of handheld cellular telephones or other electronic devices while driving, and such restrictions could lead to a decline in accidents.
Systems designed to help drivers avoid accidents, including but not limited to impact warning or avoidance systems, lane and vehicle recognition systems and driverless vehicle guidance systems are becoming more prevalent and more technologically sophisticated. To the extent manufacturers install or are mandated by law to install accident avoidance systems in their vehicles, the number and severity of accidents could decrease, which could have a material adverse effect on our business.
We depend upon the services of our management team.
Our success depends, in part, upon the continuing contributions of our executive officers and key employees at the management level. This includes, in part, continuing efforts from many of the executives and managers of the Subsidiaries, whose reputations and client relationships have contributed significantly to the long-term success of those companies. Although we have employment and noncompetition agreements with certain of our key executive officers and managers, there is no guarantee that they will not leave. The loss of the services of any of our executive officers or managers, or our failure to attract other executive officers or managers could have a material adverse effect on our business or our business prospects. If we lose the services of any of our key employees at the operating or regional level, we may not be able to replace them with similarly qualified personnel, which could harm our business.
We face intense competition from local, regional, national and internet-based automotive products providers, and this competition could negatively affect our business.
The recycled vehicle replacement parts and automotive recycling industries are highly competitive and are served by local owner-operated companies, several large regional companies and internet-based parts providers. Additionally, in certain regions of the country where we operate, local automotive recycling companies have formed cooperative inventory sharing programs. We currently participate in certain of these programs, but may elect not to in the future, and as a public company, we sometimes do not qualify to participate in certain inventory sharing programs. One such cooperative disqualified us from participation because our Subsidiaries were no longer independently owned. We could also face additional competition in the future from others entering the market, such as OEMs, insurance companies, new parts producers other than OEMs, sometimes referred to as "aftermarket" suppliers, and industry consolidators. Some of our current and potential competitors may have more operational expertise and greater financial, technical, manufacturing, distribution and other resources, longer operating histories, lower cost structures and better key relationships in the insurance and automotive industries. As a result, they may be able to provide products that we are unable to supply, sell their products at lower costs or serve customers we are unable to serve.
If we fail to maintain or adequately replace our relationships with auto body shops, insurers and other customers, through which we make a significant portion of our revenue, our revenue will be adversely affected.
The majority of our products and services are sold to collision repair shops, also known as body shops, and mechanical repair shops. Additionally, we indirectly rely on insurance companies to help drive demand, as insurance companies are increasingly influencing repair facilities to use recycled OEM products as a lower cost alternative to new OEM products. We also generate a portion of our revenue from scrap sales to metal recyclers. If we are not able to continue our current or similar arrangements with these body shops, mechanical repair shops, insurers and scrap metal recyclers, the volume of our sales, revenue and profitability will be materially adversely affected.
An adverse change in our relationships with auction companies could increase our expenses and hurt our relationships with our customers.
Our inventory primarily consists of vehicles offered at salvage auctions operated by companies that own auction facilities in numerous locations across the U.S. We do not typically have contracts with these auction companies. A small number of companies control a large percentage of the salvage auction market in the U.S. and Canada. We acquire substantially all of our salvage autos from two of these auction companies. If either of these companies prohibited us from participating in its auctions, began competing with us, or significantly raised its fees, our business could be adversely affected through higher costs or the resulting potential inability to service our customers. Moreover, we face competition in the purchase of vehicles from direct competitors, rebuilders, exporters and others.
12
We are subject to environmental regulations and incur costs relating to environmental matters.
Our operations, both in the U.S. and Canada, are subject to national, state, provincial and local environmental, health and safety laws and regulations governing, among other things:
• | the emission and discharge of wastes, chemicals, contaminants and other hazardous materials into the ground, air, or water; |
• | the exposure to hazardous materials; and |
• | the generation, handling, storage, use, treatment, identification, reporting, record-keeping, transportation and disposal of industrial by-products, waste water, storm water, solid and hazardous wastes, petroleum products and hazardous materials. |
We are in the process of implementing environmental management systems that are designed to facilitate and support our compliance with these requirements and to address current outstanding environmental and operating permit issues. However, if we violate or fail to comply with these laws or regulations we could be fined or otherwise sanctioned by regulators.
Contamination resulting from vehicle recycling processes can include air, soil, surface water and ground water contamination from the release, storage, transportation, or disposal of motor oil, gasoline, or other petroleum products, antifreeze, transmission fluid, waste solvents, chlorofluorocarbons from air conditioners, other hazardous materials, or metals such as aluminum, cadmium, chromium, lead and mercury. Contamination can migrate on-site or off-site which can increase the risk and the amount of any potential liability.
We may assume the liabilities of the companies we acquire. Contamination at properties owned or operated by the Subsidiaries or companies we acquire in the future may result in liability for us under environmental laws and regulations for the full amount of assessment and remediation-related costs, including those for the investigation and cleanup of contaminated soil, surface water and ground water, building contamination, and impacts to human health, and damages to natural resources. Under certain environmental laws, including but not limited to the Comprehensive Environmental Response, Compensation and Liability Act, or CERCLA, we and our directors and officers could be held responsible for all of the costs relating to any contamination at, or migrating to or from, the Subsidiaries’ or any newly acquired company’s past or present facilities and at third-party waste disposal sites. These laws often impose liability even if the owner or operator did not know of, or was not responsible for causing, any such contamination. The costs of complying with environmental laws and regulations and any claims concerning noncompliance or liability with respect to contamination in the future could have a material adverse effect on our financial condition or operating results.
Environmental laws are complex, change frequently and have tended to become more stringent over time. Significant capital and operating costs may be incurred at any time to keep our operations in compliance with environmental, health and safety laws and regulations. If it is not economical to make those expenditures, or if we violate any of these laws and regulations, it may be necessary to restrict or modify our operations, which could have a material adverse effect on our business, financial condition and results of operations.
One of the facilities that we lease is the subject of environmental claims.
Groundwater and surface water contamination has been detected in the past at the facility in Toronto, Ontario that we leased when we acquired the assets of Goldy Metals Incorporated ("GMI"), as a result of historical releases and a petroleum hydrocarbon spill in November 2010. Since November 2010, the Ontario Ministry of the Environment issued a series of regulatory orders under Ontario’s Environmental Protection Act that required the owner of GMI to investigate and remediate all areas that were contaminated by the spill and to take protective and remedial actions related to its property and operations as well as adjacent areas. We believe GMI has been and is taking necessary steps to remediate the surface water and groundwater contamination. Furthermore, we did not assume this liability and GMI, its shareholder and certain affiliates have agreed to indemnify us for a period of three years from the date of Combination against any liability that may be imposed on us as a result of this contamination. However, as the successor to GMI’s business and lessee of the facility, we may become legally responsible for this liability, and we and our directors and officers may be responsible under national and provincial laws and regulations for the assessment, delineation, control, clean-up, remediation, monitoring and verification of, or as a result of, any environmental contamination at that site and any affected off-site areas. The owner of GMI and certain of its affiliates have agreed, pursuant to the Combination Agreements, to continue to be responsible for the costs of an additional storm water management, control and discharge system following the completion of the Combinations. However, there can be no assurance that the owner of GMI or its affiliates will perform their obligations under such agreements and their failure to perform would require us to undertake these environmental obligations.
The site and operations in Toronto have been operating since the 1960s. During the last decade, the surrounding parkland and agricultural area, as well as the site itself, have been designated part of a new federal urban park. Accordingly, there has been continual governmental, quasi-governmental, and non-governmental body environmental oversight and intervention, including various enforcement initiatives. We anticipate that this will continue.
13
The Province of Ontario has filed a civil lawsuit against GMI and the owner of the land on which the Toronto, Ontario facility is located claiming damages of Canadian Dollars ("CAD") $10.5 million plus pre- and post-judgment interest and court costs, for alleged historical and spill-related contamination as well as for alleged property encroachment damage. The lawsuit is currently in the pre-discovery stage. We did not assume this liability, and GMI, its owner and certain affiliates have agreed to indemnify us, subject to certain limits as defined in the Combination agreements, for a period of three years from the date of Combination against any liability that may be imposed on us as a result of this liability. However, we may become legally responsible for this liability as the successor to GMI’s business and lessee of the facility. We cannot assure you that we will not become responsible for this liability, or that GMI and its owner or their affiliates will have the capacity to indemnify us in the event we become responsible for this liability in whole or in part. We also have been advised by experts retained by or on behalf of GMI, the landowner and us that the amount of damages, if any, are more likely than not to be less than $500,000; however, our responsibility for this liability in amounts exceeding the estimates of our experts could have a material adverse effect on our results of operations and financial position.
Prior to our leasing this facility, GMI was also charged by the Province of Ontario for causing or permitting an oil spill in Toronto which allegedly impaired a nearby creek. This matter was settled through a guilty plea on consent, with GMI paying a penalty of CAD $94,000. A future charge and conviction under the same or other environmental statute in Ontario could result in the imposition of a minimum fine of CAD $100,000 per day plus a 25% surcharge, up to a maximum of CAD $10 million. We did not assume this liability, and GMI, its owner and certain affiliates have agreed to indemnify us for a period of three years from the date of Combination against any liability that may be imposed on us as a result of this liability. However, we may become legally responsible for this liability as the successor to GMI’s business and lessee of the facility. We cannot assure you that we will not become responsible for this liability, or that GMI, and its shareholder or their affiliates will have the capacity to indemnify us in the event we become responsible for this liability in whole or in part. Our responsibility for this liability in whole or in significant part could have a material adverse effect on our results of operations and financial position.
GMI is also the subject of further regulatory orders relating to sedimentation monitoring and control in the creek, rehabilitating the creek area that was diverted in 2011 as well as assessing, preventing, treating and controlling off-site groundwater and surface water discharges. To address these orders, GMI intends to implement a new surface water control, management and discharge system, the details of which are in the process of being negotiated.
The recent fire at our Toronto, Ontario facility and the delay in the recommencement of operations at the facility as a result of the order from a director of the Ontario Ministry of the Environment and Climate Change to cease operations pending the acceptance of a remediation plan could have a material adverse effect on our business, financial condition and results of operations.
On April 6, 2017, there was a fire at our facility in Toronto, Ontario where two separate operations are conducted: (i) wrecking, salvaging and processing vehicles and recycling the auto parts, and (ii) selling auto parts to the public (the “self-service operation”). The fire destroyed all of the buildings on the property, although the used vehicles stored on the property were, for the most part, undamaged. Firefighters used water to extinguish the fire, reportedly (per the provincial officer's order discussed below) resulting in water seeping into the ground and surface water runoff onto the adjacent property. An emergency response team was retained to contain the water to keep it from flowing into the ground and a nearby creek. Since then, water and ash resulting from the fire were successfully contained on the premises, the ash has been hauled away, and the water will be removed once we complete testing for contaminants and determine the appropriate means of disposal. We also contracted with a restoration company to oversee the setup of both temporary and permanent structures so that we can recommence operations. We and/or our landlord maintain insurance for property damage and business interruption losses; however, coverage is subject to deductibles, limits and certain exclusions and may not be sufficient to cover all of the losses incurred.
On April 10, 2017, while we were engaged in clean-up operations, a provincial officer of the Ontario Ministry of the Environment and Climate Change entered the premises and ordered us to cease the acceptance of new vehicles and all vehicle processing on the property until such time that the officer had accepted a plan to recommence operations in an environmentally safe manner. The order did not affect the self-service operation for vehicles already processed and on the premises. However, if we are unable to accept and process additional vehicles, once the inventory of vehicles on the premises at the time of the fire is sold, we will be unable to replace it with new inventory until such time as we are able to resume full operations. We filed a request for a review and stay of the provincial officer's order (the “order”), which was denied in a ruling on April 27, 2017 by a Director of the Ontario Ministry of the Environment and Climate Change (the "Director's ruling"). The Director's ruling further provided that the Director believed that the site in its current condition had evidence of contamination, but that the Director also believed that actions could be taken to ensure that the site could be operated in an environmentally safe manner. The Director indicated that this was particularly true with respect to the receiving and processing of end-of-life vehicles, and the Director's ruling requested that the plan specifically address such end-of-life vehicle operations. The Director's ruling did not address the self-service operation, other than to note the Director's understanding that it would not be operated until the debris from the fire was cleaned up and the ash and firewater completely managed.
We have requested a hearing before the Environmental Review Tribunal with respect to the Director's ruling on the basis, among others, that there was no evidence that the fire and its extinguishment or the resumption of our processing operations in accordance with our
14
prior practices would cause us to be out of compliance with any environmental law or create the opportunity for contamination of the environment. Since our leasing of this facility in 2015, our operations prior to the fire had never been cited for any non-compliance with applicable environmental laws, although certain storm water issues that arose prior to our leasing of the site remain unresolved. For additional information on these storm water issues, see the Risk Factor immediately above entitled, "One of the facilities that we lease is the subject of environmental claims."
We believe that the Director's ruling is premature and therefore without merit, as we intend to comply with applicable environmental laws and rules in the rebuilding of the facility and future operations; however, we may be unable to successfully appeal the order. The potential delay and uncertain timing as to our recommencement of operations at the facility necessitated by the requirement to obtain prior approval of a plan to do so, the possibility that the Director may impose costly remediation measures upon us or may never approve a plan, and the possible incurrence of uninsured losses could have a material adverse effect on our business, financial condition and results of operations.
Governmental agencies may refuse to grant or renew our operating licenses and environmental and other permits.
Our current Subsidiaries and future subsidiaries must receive certain licenses and permits from state and local governments to conduct their operations, including but not limited to permits required by environmental laws. We may face unexpected delays in obtaining the necessary permits and approvals required by environmental and other laws in connection with our facilities. If we violate or fail to obtain or comply with any permits required by environmental or other laws, we could be fined or otherwise sanctioned by regulators. Furthermore, when we develop or acquire a new facility, we must seek the approval of state and local units of government and satisfy applicable siting laws and regulations. Governmental agencies often resist the establishment of an automotive recycling facility in their communities. There can be no assurance that future approvals or transfers will be granted. In addition, there can be no assurance that we will be able to maintain and renew the licenses and permits we and our Subsidiaries currently hold.
We have a large amount of goodwill as a result of the acquisitions of our Subsidiaries, which was impaired and may become further impaired, in which case our earnings would be adversely affected.
As of December 31, 2016, we had recorded goodwill of $37.0 million. Goodwill represents the excess of the amount we pay for our acquisitions over the fair value of the acquired net assets. We do not amortize acquired goodwill but instead we test it for impairment on an annual basis in the fourth quarter and between annual tests if events and circumstances indicate that it is more likely than not that the fair value of our one reporting unit is less than its carrying value. We performed the annual goodwill impairment test as of October 1, 2015, updated the test as of December 31, 2015, and determined that no impairment of goodwill existed at either date.
During the first quarter of 2016, our stock price declined 32% from $6.79/share at December 31, 2015 to $4.60/share at March 31, 2016. Accordingly, using the methodology and assumptions explained in Note 11 to the consolidated financial statements included in this Annual Report on Form 10-K, management calculated a goodwill impairment of $45.3 million that was recorded in March 2016 and is reflected in the accompanying consolidated results of operations for the year ended December 31, 2016.
Testing for impairment of goodwill involves an estimation of the fair value of our net assets and involves a high degree of judgment and subjectivity. Significant judgments inherent in these analyses include assumptions about appropriate sales growth rates, weighted average cost of capital and the amount of expected future net cash flows. The judgments and assumptions used in the estimate of fair value are generally consistent with the projections and assumptions that are used in current operating plans. Such assumptions are subject to change as a result of changing economic and competitive conditions. The determination of fair value is highly sensitive to differences between estimated and actual cash flows changes in the related discount rate used to evaluate the fair value of our single reporting unit and other key variables. In addition, there are two generally accepted valuation methodologies and the weighting given to each is dependent upon management's assessment of current circumstances which can change from period to period. As a result of the quantitative analyses performed at October 1, 2016 and December 31, 2016, it was calculated that the fair value of our reporting unit exceeded its carrying value and no further impairments were recorded in 2016. However, such excess of estimated fair value over book value was only 7% at December 31, 2016.
There are numerous risks that may cause the fair value of our Company to fall below its book value carrying amount, which could lead to the measurement and recognition of goodwill impairment. These risks include, but are not limited to, (i) significant underperformance relative to historical or projected future operating results and/or reductions in estimated future sales growth rates, (ii) further reduction in scrap prices, (iii) further reduction in the Canadian exchange rate, (iv) an increase in our weighted average cost of capital, (v) significant increases in our vehicle procurement costs, (vi) significant changes in the manner of or use of the assets or the strategy for our overall business, (vii) variation in vehicle accident rates or other significant negative industry trends, (viii) changes in state or federal laws, (ix) a significant economic downturn, (x) our inability to successfully complete our ongoing process to explore and ultimately consummate a strategic and /or financial transaction that will provide us with improved liquidity and maximize shareholder value, or (xi) changes in other variables that can materially impact our business. If we have any additional significant impairment to our goodwill, it would have a material adverse effect on our reported financial results for the period in which the non-cash charge is taken. For further information
15
regarding the impairment testing done in 2015 and 2016, see Note 11 to the consolidated financial statements included in this Annual Report on Form 10-K.
Our annual and quarterly performance may fluctuate.
Our revenue, cost of salvage vehicles and operating results have fluctuated on a quarterly and annual basis in the past and on a consolidated basis have fluctuated and can be expected to continue to fluctuate in the future as a result of a number of factors, some of which are beyond our control. Future factors that may affect our operating results include, but are not limited to, the following:
• | fluctuations in the market value of salvage and used vehicles; |
• | the availability to procure salvage vehicles at an attractive price; |
• | variations in vehicle accident rates; |
• | changes in state or federal laws or regulations affecting our business; |
• | our ability to successfully integrate in a timely manner and manage our acquisitions; |
• | severity of weather and seasonality of weather patterns; |
• | the amount and timing of operating costs and capital expenditures relating to the maintenance and expansion of our business, operations and infrastructure; and |
• | declines in asset values, including but not limited to goodwill impairment. |
• | declines in scrap metal prices |
• | increases in financing costs due to our current financial condition; and |
• | declines in the value of the Canadian Dollar relative to the US dollar. |
Due to the foregoing factors, our operating results in one or more future periods can be expected to fluctuate and period-to-period comparisons of our results of operations should not be relied upon as indications of future performance. These fluctuations in our operating results may cause our results to fall below the expectations of public market analysts and investors, which could cause our stock price to decline.
Fluctuations in the prices of metals could adversely affect our financial results.
Our operations generate scrap metal. After we dismantle a salvage vehicle for parts and after vehicles have been used in our self-service business, any remaining metal is sold to processors and brokers of metal and the remaining vehicle hulks are sold to scrap processors. In addition, we receive vehicles from various sources, which we sell at scrap metal market rates calculated on a per-ton basis. The price of scrap metal has historically fluctuated, sometimes significantly, due to market factors. In addition, buyers may stop purchasing metal entirely due to excess supply. To the extent that the price of metal or the demand for scrap metal decreases materially, our revenue from such sales will be adversely impacted and a write-down of our inventory value could be required. Despite our recent experience with declining purchase prices on vehicles as a result of reduced commodity prices, there can be no assurance that our vehicle purchasing costs will continue to decrease by a corresponding amount or at the same rate as the scrap metal prices decline, and there may be a delay between the scrap metal price reductions and any vehicle purchasing cost reductions.
We operate in Canada, which exposes us to foreign exchange and other risks.
We have operations in Canada. Our Canadian operations expose us to additional risks associated with international business, which has had an adverse effect on our business, results of operations, and financial condition. We collect revenues and incur costs at our Canadian operations in Canadian dollars. The significant decline in the value of the Canadian dollar against the U.S. dollar from 2014 to 2015 has had an adverse effect on our reported results of operations and financial condition in 2016 and 2015, and could have a similar effect in the future. In addition to foreign exchange exposure, we are subject to foreign tax, foreign employment laws and regulations and other foreign and domestic laws.
If we experience problems with our fleet of trucks, our business could be harmed.
We operate a fleet of trucks throughout our network to deliver products to our customers and transfer hubs. We are subject to the risks associated with providing trucking services, including inclement weather, disruptions in the transportation infrastructure, availability and price of fuel, and liabilities arising from accidents to the extent we are not covered by insurance. In addition, our failure to deliver parts
16
in a timely and accurate manner could harm our customer relationships and reputation, which could have a material adverse effect on our business.
We rely on information technology in critical areas of our operations, and a disruption relating to such technology could harm our business.
We rely on information technology for significant aspects of our business, including our financial reporting, accounting, accounts payable, payroll, procurement, inventory control, customer selling and billing, sales analysis, vehicle tracking and profitability reporting, as well as an electronic exchange system for identifying and locating parts at other selected recyclers and facilitating brokered sales to fill customer orders for items not in stock. Any disruption relating to our information systems and hardware could seriously harm our operations.
We may not be able to sell our products due to existing or new laws prohibiting or restricting the sale of recycled automotive products.
Some jurisdictions have enacted laws prohibiting or severely restricting the sale of certain recycled automotive products that we provide, such as airbags. Additional jurisdictions could enact similar laws or could prohibit additional automotive products we sell. Restrictions on the products we are able to sell could decrease our revenue and have an adverse effect on our business and operations.
Risks Relating to Our Common Stock and Financial Structure
We may incur additional costs in connection with an SEC inquiry, and an unfavorable outcome could damage our business and reputation and result in claims or additional proceedings against us.
In September 2016, we received a subpoena from the Chicago Regional Office of the Securities and Exchange Commission (the "SEC") requiring the production of various documents, which were all provided during December 2016 and January 2017. The SEC inquiry appears to be focused on our change in our independent registered public accounting firm, our previously announced business combinations and related goodwill impairment charge, the effectiveness of our internal control over financial reporting and our inventory valuation methodology. We have incurred substantial legal fees and other costs associated with production of the documents required by the SEC and may incur further costs before this inquiry is concluded. We cannot predict the duration or outcome of the inquiry, and an unfavorable outcome could damage our business and reputation and result in claims or additional proceedings against us.
Our stock is currently not listed on a national securities exchange, which can adversely affect the liquidity of our stock and its price.
Trading in our common stock on the Nasdaq Global Market was suspended on June 29, 2017, and Nasdaq will complete the delisting of our common stock after applicable appeal periods have lapsed. The suspension was due to our continuing non-compliance with Nasdaq Listing Rule 5250(c)(1) and, in particular, our failure to file the 2016 Annual Report on Form 10-K (the "Annual Report") by its due date (as extended by Nasdaq). Our common stock is currently quoted on the OTC Pink operated by the OTC Markets Group Inc. (also known as the "Pink Sheets").
Our suspension from Nasdaq has caused negative publicity and a decrease in our stock price. Trading on the Pink Sheets, instead of being listed on a national securities exchange, may cause our stock price to continue to decline or fluctuate and trading volume to decline over time (notwithstanding the increase in trading volume since the announcement of the suspension). Many institutional investors have internal policies that prohibit the purchase or maintenance of positions in stocks that trade in the Pink Sheets. These policies likely caused the sale by certain of our institutional investors of their shares of our stock and will further limit the market for our shares in the future. A limited public market for our common shares may limit the ability of investors to sell their shares and negatively impact our ability to raise capital. Additionally, stocks that trade in the Pink Sheets cannot be purchased with margin loans, which may make our stock less attractive to investors. A company trading in the Pink Sheets cannot avail itself of federal preemption of state securities or "blue sky" laws, which adds substantial compliance costs to securities issuances, including pursuant to employee stock purchase or option plans and private or public offerings of securities. Trading in our stock also may be subject to the "penny stock" rules of the SEC, which would adversely impact liquidity.
Our stock price has declined significantly and could continue to be volatile, which has exposed us, and could continue to expose us, to securities class action and shareholder derivative litigation.
The price of our common stock has declined significantly, likely due in part to the suspension from trading and eventual delisting from the Nasdaq Global Market of our common stock, our late filings of our quarterly reports on Form 10-Q and this Form 10-K, our breach of certain loan covenants in our Credit Facility, the ongoing SEC inquiry, and the operating losses reflected in the consolidated financial statements included in this Annual Report on Form 10-K, all of which are discussed in other risk factors above. There also may be volatility due to perceived uncertainties about our future as we consider strategic alternatives, as discussed in a risk factor above. This volatility may persist or increase if a decision to pursue a particular alternative is announced or if we are unable to complete a transaction to increase our liquidity.
17
In addition to these specific factors, the price of our common stock, in general, could be extremely volatile and may fluctuate substantially due to the following other factors, some of which are beyond our control:
•variations in our operating results;
• | variations between our actual operating results and the expectations of securities analysts, investors and the financial community; |
•announcements of developments affecting our business or expansion plans by us or others; and
•conditions and trends in the auto parts industry and the economy as a whole.
Stock market volatility also has had a significant effect on the market prices of securities issued by many companies for reasons unrelated to the operating performance of these companies. Downturns in the stock market may cause the price of our common stock to decline. Additionally, the market price for our common stock has been in the past, and in the future may be, adversely affected by allegations made or reports issued by short sellers, analysts or others regarding our business model, our management or our financial accounting.
In the past, securities class action and shareholder derivative litigation often has been instituted against companies following periods of volatility in the market price of their securities. Such litigation can result in substantial costs and a diversion of management’s attention and resources. Two lawsuits, Beezley v. Fenix Parts, Inc. et al, and Melanie Weiss, derivatively on behalf of Fenix Parts, Inc. v. Kent Robertson, et al, and Fenix Parts, Inc. were filed against us during 2017, as discussed in greater detail below.
We and certain of our officers have been named as defendants in a securities class action lawsuit and certain of our officers and our directors have been named as defendants in a shareholder derivative lawsuit that could divert management's time and attention from our business and have a negative effect on our results of operations.
In January 2017, a class action lawsuit entitled Beezley v. Fenix Parts, Inc. et al, was filed in the United States District Court for the District of New Jersey against us, Kent Robertson, our President and Chief Executive Officer, and Scott Pettit, our Chief Financial Officer. The lawsuit was filed on behalf of purchasers of our shares from May 14, 2015 through October 12, 2016. The complaint alleges violations of the federal securities laws. For additional information with regard to allegations in the complaint, see Note 12 to the consolidated financial statements included in this Annual Report on Form 10-K. The plaintiffs seek class certification, an award of unspecified damages, an award of reasonable costs and expenses, including attorneys' fees and expert fees, and other further relief as the Court may deem just and proper.
In July 2017, a shareholder derivative lawsuit, entitled Melanie Weiss, derivatively on behalf of Fenix Parts, Inc. v. Kent Robertson, et al, and Fenix Parts, Inc., was filed in the Circuit Court of Cook County, Illinois, Chancery Division, against Messrs. Robertson and Pettit and the members of our board of directors. The complaint alleges, among other things, breach of fiduciary duty, unjust enrichment, waste of corporate assets and gross mismanagement. For additional information with regard to allegations in the complaint, see Note 12 to the consolidated financial statements included in this Annual Report on Form 10-K. The plaintiff seeks relief which includes unspecified damages and restitution from the individual defendants, an order requiring actions to be taken to improve corporate governance and internal procedures, an award of reasonable costs and expenses, including attorneys' fees and expert fees, and other further relief as the Court may deem just and proper.
In the case of both the Beezley and Weiss lawsuits, we believe that the allegations contained in the complaints are without merit and, in conjunction with our insurance carrier, intend to vigorously defend against all claims asserted therein. Nonetheless, the lawsuits may result in costly and protracted litigation, which may require a significant commitment of our resources and time. The ultimate outcome of any litigation is uncertain and the outcome of these matters, whether favorable or unfavorable, could have a negative impact on our financial condition or results of operations due to defense costs, diversion of management resources and other factors.
We have a substantial amount of indebtedness to bank lenders and former owners of acquired Subsidiaries, which could have a material adverse effect on our financial condition and our ability to obtain financing in the future and to execute our business strategy.
As of December 31, 2016, we had $21.5 million of debt outstanding under the Credit Facility, consisting of $12.8 million under our revolving line of credit and $8.7 million under our term loan. We also have a letter of credit for $6.4 million secured under the facility. In addition, we have contingent consideration arrangements with the former owners of three acquired businesses that could result in substantial future cash obligations in 2017 as described in Management's Discussion and Analysis of Financial Condition and Results of Operations - "Liquidity and Capital Resources" and as estimated and recorded in the accompanying consolidated balance sheet as of December 31, 2016 included in this Annual Report on Form 10-K. The Credit Facility contains operating restrictions and financial covenants that can restrict our business and limit our access to additional borrowings. As of December 31, 2016, for reasons described in Note 1 to the accompanying consolidated financial statements, we were in breach of certain financial covenants in the Credit Facility, as well as the requirements for repaying over-advances and timely delivery of certain quarterly certificates and reports. As a result, all
18
of the Credit Facility debt is reported in the consolidated balance sheet as a current liability at December 31, 2016, and there can be no further borrowings of any availability under the Credit Facility until such defaults are rectified or waived. On March 27, 2017, we entered into a Forbearance Agreement to the Credit Facility (the "Forbearance Agreement"). Pursuant to the Forbearance Agreement, the banks have agreed to forbear from exercising their rights and remedies under the Credit Facility with respect to the above described defaults and any similar defaults during the forbearance period, provided no other defaults occur. The Forbearance Agreement was amended on June 23, 2017 to extend the forbearance period, which had originally expired on May 26, 2017, until August 31, 2017 and to resolve certain new defaults. Our significant amount of debt, limited borrowing capacity and our debt service and contingent consideration obligations could limit our ability to satisfy our obligations, limit our ability to operate our business, execute our expansion strategy and impair our competitive position. Moreover, even if our current defaults are rectified or waived, any new failure to comply with the covenants and restrictions in our Credit Facility (other than those anticipated and enumerated in the Forbearance Agreement, as amended) could result in a future event of default, which would permit our lender to call for the immediate repayment of some or all of the amounts outstanding under our Credit Facility, among other remedies. If this happens, we do not expect to have sufficient liquidity to pay the outstanding Credit Facility debt. In addition, we have significant obligations under contingent consideration agreements related to certain acquired companies as described in Note 6, and we would need access to additional credit to be able to satisfy these obligations. The acceleration of our obligations under the Credit Facility or the failure to ultimately satisfy our contingent consideration obligations would have a material adverse effect on our business.
We have assumed uncertain tax positions as part of the acquisitions of the Subsidiaries.
We assumed the uncertain tax positions of certain acquired Subsidiaries and have recorded reserves for these positions, including related interest and penalties, of approximately $2.2 million as of December 31, 2016. If the settlement of any unrecognized tax reserves is different than that accrued, it would impact our effective tax rate. Under certain conditions, payments made by us, including interest and penalties, for assumed uncertain tax positions are indemnified by the previous owners of the Subsidiaries for a period of three years from the dates of acquisition and we have an indemnification receivable of $2.0 million recorded in the accompanying consolidated balance sheet as of December 31, 2016 included in this Annual Report on Form 10-K. If a reserved uncertain tax position results in an actual liability and we are unable to collect on or enforce the related indemnification provision or if the actual liability occurs after the applicable three-year indemnity period has expired, there could be a material charge to our consolidated financial results and reduction of cash resources.
Future sales of our common stock or other securities may depress our stock price.
We and our stockholders may sell shares of common stock or other equity, debt or instruments which constitute an element of our debt and equity (collectively, "securities") in the future. We may also issue shares of common stock under our stock plan or in connection with future acquisitions. We cannot predict the size of future issuances of securities or the effect, if any, that future issuances and sales of shares of our common stock or other securities will have on the price of our common stock. Sales of substantial amounts of common stock (including shares issued in connection with an acquisition), the issuance of debt securities, or the perception that such sales or issuances could occur, may cause the price of our common stock to fall.
Our officers and directors and the stockholders and former equity interest holders of the Subsidiaries and their affiliates exercise significant influence over us.
As of December 31, 2016, our executive officers and directors and the stockholders and former equity interest holders of the Subsidiaries and their immediate family members beneficially owned, in the aggregate, approximately 18% of our outstanding common stock. As a result, these stockholders are able to exercise significant influence over all matters requiring stockholder approval, including the election of directors and approval of significant corporate transactions, which could delay or prevent someone from acquiring or merging with us. These stockholders may have interests that are different from yours.
Provisions in our certificate of incorporation and bylaws, Delaware law and our loan documents could discourage a takeover that stockholders may consider favorable.
Our amended and restated certificate of incorporation and amended and restated bylaws may discourage, delay or prevent a merger or acquisition that a stockholder may consider favorable because they, among other things:
• | authorize our board of directors, without stockholder approval, to issue up to 100,000 shares of undesignated preferred stock; |
• | do not provide for cumulative voting in the election of directors; |
• | establish supermajority voting requirements in order to amend certain provisions in our certificate of incorporation; and |
• | prohibit stockholders from calling a special meeting of stockholders. |
19
As a Delaware corporation, we are also subject to the Delaware anti-takeover provisions contained in Section 203 of the Delaware General Corporation Law. Under Delaware law, a corporation may not engage in a business combination with any holder of 15% or more of its capital stock unless the holder has held the stock for three years or, among other things, the board of directors has approved the transaction. Our board of directors could rely on this provision to prevent or delay an acquisition of us. In addition, our credit agreement provides that a change of control is an event of default, which could impede an acquisition, takeover or other business combination involving us or discourage a potential acquirer from making a tender offer for our common stock, which, under certain circumstances, could reduce the price of our common stock.
We do not intend to pay dividends.
We have never declared or paid any cash dividends on our capital stock and do not intend to pay dividends in the foreseeable future. We intend to invest our future earnings, if any, to fund our growth. We cannot assure you that you will receive a return on your investment when you sell your shares or that you will not lose the entire amount of your investment.
Our internal control over financial reporting, and , as a result, our disclosure controls and procedures, have been determined to not be effective, and we may not succeed in establishing and maintaining effective internal control over financial reporting, which may adversely affect investor confidence in our Company and, as a result, the value of our common stock.
We have evaluated the effectiveness of our internal control over financial reporting and our disclosure controls and procedures as of December 31, 2016, the end of the period covered by this report on Form 10-K. Based on that evaluation, our Chief Executive Officer and Chief Financial Officer concluded that our internal control over financial reporting was not effective, and as a result our disclosure controls and procedures were not effective, because of material weaknesses attributable to (A) our lack during 2016 of (i) accounting personnel with an appropriate level of accounting knowledge, experience, and training commensurate with our complex accounting issues and financial reporting requirements, (ii) adequate procedures to prepare, document and review areas of significant judgments and accounting estimates, including purchase accounting, contingent consideration, potential goodwill impairment and inventory valuation, (iii) timely and systematic review by management of account reconciliations, journal entries and other analyses to appropriately document and support the recording of financial information, (iv) thorough review of significant contracts for key accounting ramifications, (v) documentation retention to support the amounts reported and (vi) segregation of duties over journal entries as well as (B) undue reliance on the findings and conclusions of third-party specialists without an appropriate level of internal review, and (C) inadequate Information Technology General Controls, including limited segregation of duties and access rights controls over information systems at Subsidiaries without compensating corporate procedures and controls. Certain of these weaknesses were previously described in our Annual Report on Form 10-K for the year ended December 31, 2015 filed on April 14, 2016. Our efforts to remediate these material weaknesses are still in progress and may require substantial resources at significant cost over an extended period of time to complete. More generally, ensuring that we have adequate internal financial, accounting and disclosure controls in place requires a costly and time-consuming effort that needs to be re-evaluated frequently. If we fail to establish and maintain effective internal control over financial reporting and disclosure controls and procedures, our actual and/or perceived ability to timely and accurately report on our financial results on a timely basis and meet our SEC reporting obligations could continue to be adversely affected. That could result in additional loss of confidence in our Company, and the price of our common stock could further decline.
When we cease to be an "emerging growth company" as defined under the JOBS Act, our auditors will be required to express an opinion on the effectiveness of our internal controls. If our auditors are then unable to express an opinion that our internal control over financial reporting is effective there could be an additional adverse impact on trading in our common stock.
The requirements of being a public company have increasingly strained our resources, increased our costs and distracted management, and we may be unable to comply with these requirements in a timely or cost-effective manner.
As a public company with listed equity securities, we must comply with certain laws, regulations and requirements, including corporate governance provisions of the Sarbanes-Oxley Act, related regulations of the Securities and Exchange Commission (the "SEC") and (if we are relisted on a national stock exchange) the requirements of the stock exchange where our shares may be listed, with which we were not required to comply as a private company. Complying with these statutes, regulations and requirements occupies a significant amount of the time of our board of directors and management and results in significant costs and expenses, which will increase after we are no longer an emerging growth company under the JOBS Act. Among the actions we have taken or are in the process of taking are to:
• | institute comprehensive corporate governance and compliance functions; |
• | design, establish, evaluate and maintain a system of internal control over financial reporting in compliance with the requirements of Section 404(a) of the Sarbanes-Oxley Act and the related rules and regulations of the SEC and the Public Company Accounting Oversight Board; |
• | comply with rules promulgated by the NASDAQ Global Market; |
• | prepare and distribute periodic public reports in compliance with our obligations under the federal securities laws; |
20
• | establish internal policies, such as those relating to disclosure controls and procedures and insider trading; |
• | involve and retain outside counsel and accountants in connection with these activities; and |
• | establish an investor relations function. |
Due to the historic decentralized cash basis financial reporting at the Subsidiaries, complex accounting required by the acquisitions of Subsidiaries and our historic lack of effective controls over financial reporting, we have incurred accounting and auditing fees that are extraordinarily high for a public company of our size. In addition, these complexities have resulted in our inability to file our quarterly reports on Form 10-Q and a Form 10-K in a timely manner, which resulted in the suspension from trading (and will result in the eventual delisting) from the Nasdaq Global Market of our common stock. Please see the description elsewhere in these risk factors of our delinquencies in filing our quarterly reports on Form 10-Q and this Form 10-K. We have also incurred in the past and continue to incur considerable legal fees in connection with various matters described elsewhere in these risk factors. Total outside service and professional fees of almost $16 million have been incurred over the past two fiscal years while total revenues have been approximately $200 million over this period. Continued high legal, accounting and auditing costs of this magnitude are not sustainable and could have a material adverse effect on our financial condition, and continued late filing of routine securities filings could undermine investors’ confidence in our Company.
We are an emerging growth company and our reliance on the reduced disclosure requirements applicable to emerging growth companies may make our common stock less attractive to investors.
We are an "emerging growth company," as defined in the JOBS Act, and we may take advantage of certain exemptions and relief from various reporting requirements that are applicable to other public companies, but are not applicable to emerging growth companies. In particular, while we are an emerging growth company, we are not required to comply with the auditor attestation requirements of Section 404(b) of the Sarbanes-Oxley Act, we are subject to reduced disclosure obligations regarding executive compensation in our periodic reports and proxy statements, and we are not required to hold nonbinding advisory votes on executive compensation or shareholder approval of any golden parachute payments not previously approved. We have taken advantage of certain reduced disclosure obligations and may elect to take advantage of other reduced burdens in future filings. Investors may find our common stock less attractive when we rely on these exemptions and relief. If some investors find our common stock less attractive as a result, there may be a less active trading market for our common stock and our stock price may decline and/or become more volatile.
ITEM 1B. UNRESOLVED STAFF COMMENTS
None.
ITEM 2. PROPERTIES
Our properties are described in the Facilities section in Item 1 of this Annual Report on Form 10-K, and such description is incorporated by reference into this Item 2. Our properties are sufficient to meet our present needs, and we do not anticipate any difficulty in securing additional space to conduct operations or additional office space, as needed, on terms acceptable to us.
ITEM 3. LEGAL PROCEEDINGS
From time to time, we are subject to litigation related to normal business operations. We maintain insurance for normal business risks and seek to vigorously defend ourselves in litigation.
SEC Inquiry
In September 2016, we received a subpoena from the Chicago Regional Office of the SEC requiring the production of various documents, which were all provided during December 2016 and January 2017. The SEC inquiry appears to be focused on the change during 2016 in our independent registered public accounting firm, our previously announced business combinations and related goodwill impairment charge, the effectiveness of our internal controls over financial reporting and our inventory valuation methodology. Our receipt of a subpoena from the SEC does not mean that we have violated securities laws. Although we have incurred substantial legal fees and other costs associated with production of the documents required by the SEC and may incur further costs before this inquiry is concluded, management does not believe that the inquiry will ultimately have a material impact on our financial condition, results of operations or cash flow, but cannot predict the duration or outcome of the inquiry.
Lawsuits
In January 2017, a class action lawsuit entitled Beezley v. Fenix Parts, Inc. et al, was filed in the United States District Court for the District of New Jersey against Fenix Parts, Inc., Kent Robertson, its President and Chief Executive Officer, and Scott Pettit, its Chief Financial Officer (the “Defendants”). The lawsuit was filed on behalf of purchasers of our shares from May 14, 2015 through October
21
12, 2016. The complaint asserts that all defendants violated Section 10(b) of the Securities Exchange Act of 1934, as amended (the "Exchange Act"), and SEC Rule 10b-5 and that Messrs. Robertson and Pettit violated Section 20(a) of the Exchange Act. The complaint asserts that we made false and/or misleading statements and/or failed to disclose that: (1) we had an inadequate inventory valuation methodology; (2) had an inadequate methodology to calculate goodwill impairment; (3) were engaging and/or had engaged in conduct that would result in an SEC investigation; and (4) as a result, our statements about our business, operations, and prospects, were materially false and misleading and/or lacked a reasonable basis at all relevant times. The plaintiffs seek class certification, an award of unspecified damages, an award of reasonable costs and expenses, including attorneys' fees and expert fees, and other further relief as the Court may deem just and proper.
In July 2017, a shareholder derivative lawsuit, entitled Melanie Weiss, derivatively on behalf of Fenix Parts, Inc. v. Kent Robertson, et al, and Fenix Parts, Inc., was filed in the Circuit Court of Cook County, Illinois, Chancery Division, against Messrs. Robertson and Pettit and the members of our board of directors. This lawsuit contains allegations of wrongful conduct that are substantially similar to those in the Beezley lawsuit, with additional allegations that defendants’ wrongful conduct caused, among other things, our non-compliance with Credit Facility financial covenants, our failure to maintain effective internal controls, and our inability to timely file SEC-required periodic reports. Unlike the Beezley lawsuit, the plaintiff bases her demands for recovery on non-securities law claims, including breach of fiduciary duty, unjust enrichment, waste of corporate assets and gross mismanagement. The plaintiff seeks relief which includes unspecified damages and restitution from the individual defendants, an order requiring actions to be taken to improve corporate governance and internal procedures, an award of reasonable costs and expenses, including attorneys' fees and expert fees, and other further relief as the Court may deem just and proper.
In the case of both the Beezley and Weiss lawsuits, we believe that the allegations contained in the complaints are without merit and, in conjunction with our insurance carrier, intend to vigorously defend against all claims asserted therein. A reasonable estimate of the amount of any possible loss or range of loss, after applicable insurance coverage, cannot be made at this time and, as such, we have not recorded an accrual for any potential loss as of December 31, 2016.
ITEM 4. MINE SAFETY DISCLOSURES
Not applicable.
PART II
ITEM 5 – MARKET FOR REGISTRANT’S COMMON EQUITY, RELATED STOCKHOLDER MATTERS AND ISSUER PURCHASE OF EQUITY SHARES
Market
Our common shares were trading under the trading symbol FENX on the NASDAQ Global Market ("NASDAQ") from May 2015 until our suspension from trading on June 29, 2017. Since that time, our common shares have been trading on the OTC Pink operated by the OTC Markets Group Inc. (also known as the "Pink Sheets"). The trading symbol continues to be FENX.
Prices
The table below sets forth the high and low sales prices during each calendar quarter since May 14, 2015, the date the IPO closed.
2016 | High | Low | ||||
Fourth Quarter | $ | 4.60 | $ | 2.75 | ||
Third Quarter | $ | 5.38 | $ | 3.17 | ||
Second Quarter | $ | 5.35 | $ | 2.94 | ||
First Quarter | $ | 7.01 | $ | 4.33 | ||
2015 | ||||||
Fourth Quarter | $ | 8.50 | $ | 5.40 | ||
Third Quarter | $ | 10.94 | $ | 6.65 | ||
Second Quarter | $ | 11.92 | $ | 8.59 | ||
Dividends
We have never paid cash dividends on our common shares and have no current plan to do so in the foreseeable future. The declaration and payment of dividends on our common shares are subject to the discretion of our Board of Directors. The decision of the Board of Directors to pay future dividends will depend on general business conditions, the effect of a dividend payment on our financial condition,
22
and other factors the Board of Directors may consider relevant. In addition, our bank credit agreement requires us to obtain bank approval prior to paying a dividend.
Holders
Based on information from our transfer agent and from banks and brokers as of July 20, 2017, there were approximately 43 registered stockholders and beneficial holders of our common shares. The number of registered stockholders does not include beneficial owners whose shares are held in the names of banks, brokers, nominees or other fiduciaries.
Transfer Agent
The transfer agent and registrar for our common shares is American Stock Transfer & Trust Company, LLC, 6201 15th Avenue, Brooklyn, NY 11219.
Securities Authorized for Issuance Under Equity Compensation Plans.
See our disclosure below in "Part III, Item 12. Security Ownership of Certain Beneficial Owners and Management and Related Stockholder Matters."
Performance Graph
The following graph compares our total return to stockholders per common share by quarter for the period of May 14, 2015, the date the IPO closed, through December 31, 2016, to that of the NASDAQ North American Auto & Parts Index and the following group of peer companies (the "Peer Group"): LKQ Inc.; Copart, Inc.; Genuine Parts, Inc.; Dorman Products Inc.; US Auto Parts Network and Advanced Auto Parts Inc. for the period beginning on May 14, 2015 (which was the date of the Company’s IPO) and ending on December 31, 2016. The stock price performance in the following graph is not necessarily indicative of future stock price performance. The graph assumes that the value of an investment in each of the Company’s common stock, the NASDAQ North American Auto & Parts Index and the Peer Group was $100 on May 14, 2015.
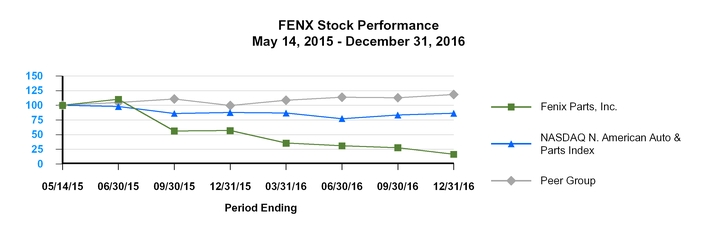
This stock performance information is "furnished" and shall not be deemed to be "soliciting material" or subject to Rule 14A, shall not be deemed "filed" for purposes of Section 18 of the Securities Exchange Act of 1934 or otherwise subject to the liabilities of that section, and shall not be deemed incorporated by reference in any filing under the Securities Act of 1933 or the Securities Exchange Act of 1934, whether made before or after the date of this report and irrespective of any general incorporation by reference language in any such filing, except to the extent that it specifically incorporates the information by reference.
Recent Sales of Unregistered Securities
During January 2016, we issued 10,707 unregistered shares of our common stock to the former owner of an acquired Subsidiary in payment of a consulting fee. The award was valued at $50,000, based on the share price on the date of the grant. The foregoing grant was exempt from registration under the Securities Act pursuant to Section 4(a)(2) thereof on the basis that the transaction did not involve a public offering.
Effective as of May 23, 2016, we issued an aggregate of 19,332 restricted shares of common stock to five of our outside directors in lieu of cash compensation for their service as directors of the Company. The shares were issued under our 2014 Stock Plan. The number of shares issued to these directors was determined by dividing the dollar amount of the cash compensation each such director was entitled to receive for his service from January 1, 2016 until May 23, 2016, which was an aggregate of approximately $94,000, by the average closing price of our common stock on NASDAQ for that period. These shares were exempt from registration under the Securities Act pursuant to Section 4(a)(2) thereof on the basis that the transaction did not involve a public offering.
23
This information regarding the sale of unregistered securities is "furnished" and shall not be deemed to be "soliciting material" or subject to Rule 14A, shall not be deemed "filed" for purposes of Section 18 of the Securities Exchange Act of 1934 or otherwise subject to the liabilities of that section, and shall not be deemed incorporated by reference in any filing under the Securities Act of 1933 or the Securities Exchange Act of 1934, whether made before or after the date of this report and irrespective of any general incorporation by reference language in any such filing, except to the extent that it specifically incorporates the information by reference.
ITEM 6 – FENIX PARTS, INC. SELECTED FINANCIAL DATA
Selected financial data is presented below as of the end of and for each of the years ended December 31. The selected financial data should be read in conjunction with the consolidated financial statements as of and for the years ended December 31, and "Management’s Discussion and Analysis of Financial Condition and Results of Operations" included elsewhere in this report and the schedules thereto (in thousands, except share and per share data).
Fenix Parts Inc. and Subsidiaries | |||||||||
December 31, | |||||||||
Statement of Operations Data: | 2016 | 2015 | 2014 | ||||||
Total revenues | $ | 132,100 | $ | 68,946 | $ | — | |||
Cost of goods sold | 78,641 | 53,559 | — | ||||||
Gross profit | 53,459 | 15,387 | — | ||||||
Operating loss | (47,757 | ) | (30,843 | ) | (4,747 | ) | |||
Net loss | $ | (42,869 | ) | $ | (26,041 | ) | $ | (4,746 | ) |
Net loss available to common shareholders | $ | (40,717 | ) | $ | (24,819 | ) | $ | (4,746 | ) |
Basic and diluted loss per share available to common shareholders | $ | (2.05 | ) | $ | (1.86 | ) | $ | (2.22 | ) |
Weighted-average basic shares outstanding | 19,869,316 | 13,332,691 | 2,142,994 | ||||||
Other Data: | |||||||||
Net cash provided by (used in): | |||||||||
Operating activities | (1,717 | ) | (15,750 | ) | (3,166 | ) | |||
Investing activities | (741 | ) | (105,554 | ) | — | ||||
Financing activities | 362 | 123,743 | 3,619 | ||||||
Fenix Parts Inc. and Subsidiaries | ||||||
December 31, | ||||||
Balance Sheet Data: | 2016 | 2015 | ||||
Cash and cash equivalents | $ | 738 | $ | 2,827 | ||
Working capital | 1,040 | 30,599 | ||||
Total assets | 125,397 | 179,838 | ||||
Total Credit Facility debt, including current portion | 21,094 | 20,438 | ||||
Total Fenix Parts, Inc. shareholders’ equity before noncontrolling interest | 62,229 | 101,384 | ||||
ITEM 6A – BEAGELL GROUP AND STANDARD (DESIGNATED ACCOUNTING CO-PREDECESSORS) SELECTED FINANCIAL DATA
Selected financial data for the Beagell Group and Standard are presented below for the fiscal year ended December 31, 2014 and the period of January 1, 2015 to May 18, 2015. The selected financial data should be read in conjunction with the respective Beagell Group and Standard combined financial statements as of and for the period ended May 18, 2015 and as of and for the year ended December 31, 2014, and "Management’s Discussion and Analysis of Financial Condition and Results of Operations" included elsewhere in this report and the schedules thereto (dollars in thousands).
24
Beagell Group (Designated accounting predecessor) | Standard (Designated accounting predecessor) | ||||||||||||||
Period From January 1, 2015 to May 18, 2015 | Year Ended December 31, 2014 | Period From January 1, 2015 to May 18, 2015 | Year Ended December 31, 2014 | ||||||||||||
Statement of Operations Data: | |||||||||||||||
Total revenues | $ | 11,107 | $ | 30,598 | $ | 8,914 | $ | 31,126 | |||||||
Gross profit | 3,712 | 10,701 | 2,918 | 11,409 | |||||||||||
Operating income (loss) | 528 | 2,393 | (467 | ) | 1,885 | ||||||||||
Net income (loss) | 516 | 2,242 | (245 | ) | 2,043 | ||||||||||
Other Data: | |||||||||||||||
Net cash provided by (used in): | |||||||||||||||
Operating activities | 477 | 2,915 | (576 | ) | 2,267 | ||||||||||
Investing activities | 803 | 32 | 51 | (2,183 | ) | ||||||||||
Financing activities | (1,885 | ) | (1,897 | ) | — | (246 | ) | ||||||||
25
ITEM 7 – MANAGEMENT’S DISCUSSION AND ANALYSIS OF FINANCIAL CONDITION AND RESULTS OF OPERATIONS
The following is an analysis of the Company’s results of operations, liquidity and capital resources and should be read in conjunction with the consolidated financial statements and notes related thereto included in this Form 10-K. To the extent that the following Management’s Discussion and Analysis contains statements which are not of a historical nature, such statements are forward-looking statements which involve risks and uncertainties. These risks include, but are not limited to the risks and uncertainties discussed in "Item 1A Risk Factors" in this Annual Report on Form 10-K. The following discussion and analysis should be read in conjunction with the "Forward Looking Statements" and "Item 1A Risk Factors" each included in this Annual Report on Form 10-K.
Financial Statement Components
Revenue
Our combined sales consist of revenues from: (i) recycled OEM and related products, and (ii) other related and ancillary sources. Our recycled OEM and related products revenue is generated from the sale of recycled OEM and related products to collision repair shops and mechanical repair shops, parts suppliers and individual retail customers through centralized distribution facilities. Our recycled OEM and related products include mechanical parts used to repair worn or damaged components, such as engines, transmissions, transfer cases, air conditioning compressors and knee assemblies, and collision repair parts used to repair vehicles typically involved in a collision, such as doors, lids, gates, front and rear bumpers, and headlights. In addition, we purchase recycled OEM and related products from third parties for resale and distribution to our customers. For each of the years ended December 31, 2016 and 2015, recycled OEM and related product sales revenue represented approximately 86% of our combined net revenues (combined revenues as reported for 2015 on an unaudited pro forma basis).
Other ancillary revenues primarily include the disposal of end of life vehicles, related scrap sales and the sale of extended warranties. We obtain scrap as a byproduct from the vehicles that have been used in both full-service and self-service recycling operations. The sale of scrap includes catalytic converters, fluids, wheels and tires, copper wiring, cores and crushed hulls. Other ancillary revenues related to the disposal of end of life vehicles and related scrap sales will vary based on fluctuations in commodity prices and the volume of materials sold. Other ancillary revenues also include the sale of extended warranty contracts for certain mechanical products. For each of the years ended December 31, 2016 and 2015, revenue from other ancillary sources represented approximately 14% of our combined net revenues (combined revenues as reported for 2015 on an unaudited pro forma basis).
Under the acquisition method of accounting, the deferred revenue associated with the extended warranty contracts acquired during 2015 was determined to be negligible and the balance was effectively written-off as of the date of acquisition for all acquired companies. New warranty contract sales subsequent to the acquisition date are deferred and recognized ratably over the term of the contracts, or five years in the case of lifetime warranties.
Cost of Goods Sold
Our cost of goods sold for recycled OEM and related products includes the price we pay for the vehicles we purchase and, where applicable, auction, storage and towing fees and other costs of procurement and dismantling, primarily direct labor and overhead allocable to dismantling operations or, in the case of used car and motorcycle sales, to preparing the vehicle for sale. We acquire vehicles for dismantling from several sources, including auto salvage auctions and from the public. Inventory costs for recycled OEM parts are established using a retail method of accounting as described in Note 2 to the consolidated financial statements in this document. Prices for vehicles may be impacted by a variety of factors, including the demand and pricing trends for used vehicles, the number of vehicles designated as "total losses" by insurance companies, the production level of new vehicles, and the status of laws regulating the titling of "total loss" vehicles and the bidders of vehicles at auction.
Our cost of goods sold also includes the price we pay to third parties for recycled OEM and related products purchased for resale. These products are purchased to supplement our inventory for sale to our customers. Direct labor and other overhead incurred to purchase and dismantle vehicles accounted for approximately 23% of our total cost of goods sold during the year ended December 31, 2016.
Under the acquisition method of accounting, inventories acquired are adjusted to fair value as of the date of acquisition. The incremental adjustment of inventory to fair value is amortized through cost of goods sold based on the average utilization of the acquired inventory. The cost of goods sold impact of the fair value amortization amounted to $1.4 million and $8.6 million for the years ended December 31, 2016 and 2015, respectively, offset by a credit to cost of goods sold of $2.2 million during 2016 in accordance with ASU No. 2015-16 related to a change in the first quarter of 2016 in the estimated fair value of the inventories acquired in 2015. See Note 4 to the consolidated financial statements in this document for further information.
Some of our mechanical products are sold with a warranty against defects which could result in product returns. We record the estimated returns reserves at the time of sale using historical returns information to project future returns and related expenses.
Operating Expenses
26
Our expenses primarily consist of costs of operations and distribution as well as selling, marketing, general and administrative expenses, including outside services and professional fees, and depreciation and amortization. These costs include (1) wages for the operating management, facility and distribution personnel not directly related to the procurement and dismantling of vehicles, and related incentive compensation and employee benefits; (2) costs to occupy and operate the facilities including rent, utilities, insurance, repairs and taxes not allocated to dismantling operations; (3) costs to distribute products and scrap, including freight, vehicle operating expenses and repairs and maintenance; and (4) other facility expenses not allocated to dismantling operations. Our operations and distribution expenses are integral to the operation of each facility and primarily include our costs to prepare and deliver our products to our customers. These costs include labor costs for drivers, fuel, third party freight costs, local delivery and transfer truck leases or rentals and related repairs and maintenance, insurance, and supplies.
Our selling and marketing expenses primarily include salary, commission and other incentive compensation expenses for sales personnel, advertising, promotion and marketing costs, telephone and other communication expenses, credit card fees and bad debt expense. Most of our product sales personnel are paid on a commission basis. The size and quality of our sales force are critical to our ability to respond to our customers’ needs and increase our sales volume.
Our general and administrative expenses primarily include the costs of our corporate offices and field support services center that provide field management, treasury, accounting, legal, payroll, business development, human resources and information systems functions. These costs include wages and benefits for corporate, regional and administrative personnel, share-based compensation and other incentive compensation, IT system support and maintenance expenses, supplies, travel, director & officer insurance and other costs attributable to being a publicly-traded company.
Outside services and professional fees include third-party costs related to legal matters, accounting and auditing, tax compliance and consultation, and acquisition due diligence.
Also included in operating expenses are changes in the estimated fair value of contingent consideration liabilities, reductions in the indemnification receivables established at the acquisitions of Subsidiaries in 2015, and goodwill impairment.
Critical Accounting Policies and Estimates
The consolidated financial statements are prepared in accordance with accounting principles generally accepted in the United States of America, which require us to make estimates and assumptions that affect the amounts reported in the consolidated financial statements and accompanying notes, especially as it relates to Revenue Recognition, Allowance for Doubtful Accounts, Inventories, Business Combinations, Goodwill, Intangible Assets, Income Taxes, Share-based Compensation, and Contingent Consideration. Actual results could differ from those estimates. We believe that the following accounting policies (see Note 2, Summary of Significant Accounting Policies, to the consolidated financial statements in this document) involve a higher degree of judgment and complexity and are deemed critical. We discuss our critical accounting policies with the audit committee of the Board of Directors.
Revenue Recognition
For our recycled OEM and related products, we recognize and report revenue from the sale of recycled OEM and related products when they are shipped or picked up by the customers and ownership has transferred, subject to an allowance for estimated returns (often pursuant to standard warranties on sold products) discounts and allowances that management estimates based upon historical information. We analyze historical returns and allowances activity by comparing the items to the original invoice amounts and dates. We use this information to project future returns and allowances on products sold. If actual returns and allowances are significantly higher than our historical experience, there would be an adverse impact on our operating results in the period of occurrence. For an additional fee, we also sell extended warranty contracts for certain mechanical products. Revenue from these contracts is deferred and recognized ratably over the term of the contracts, or five years in the case of lifetime warranties.
For our other ancillary revenue, we recognize revenue from the sale of scrap, cores and other metals when ownership has transferred, which typically occurs upon delivery to the customer.
Allowance for Doubtful Accounts
The allowance for doubtful accounts is management’s best estimate of the amount of credit losses in accounts receivable. In order to control and monitor the credit risk associated with our customer base, we review the credit worthiness of our customers on a recurring basis. Factors influencing the level of scrutiny include the level of business the customer has with us, the customer’s payment history and the customer’s financial stability. Receivables are considered past due if payment is not received by the date agreed upon with the customer, which is normally 30 days. Representatives of our management team review all past due accounts on a bi-weekly basis to assess collectability. At the end of each reporting period, the allowance for doubtful accounts balance is reviewed relative to management’s collectability assessment and is adjusted if deemed necessary through a corresponding charge or credit to bad debt expense, which is included in selling, general, and administrative expenses in the consolidated statements of operations. Bad debt write-offs are made when management believes it is probable a receivable will not be recovered.
27
Inventories
Our recycled OEM and related product inventory cost is established based upon the price we pay for a vehicle, including auction, storage and towing fees, as well as expenditures for buying and dismantling vehicles using a retail method of accounting. Parts are dismantled from purchased vehicles and a retail price is assigned to each dismantled part. The total retail price of the inventoried parts is reduced by the estimated balance of parts that will be subsequently sold for scrap or discounted to a reduced expected selling price. These scrap and discount estimates are significant and require application of complex assumptions and judgments that are subject to change from period to period. The cost assigned to the salvaged parts and scrap is determined using the average cost-to-sales percentage at each operating facility and applying that percentage to the facility's inventory at expected selling prices. The average cost-to-sales percentage is derived from each facility’s historical sales and actual cost paid for salvage vehicles purchased at auction or procured from other sources. We also capitalize direct labor and overhead costs incurred to dismantle salvaged parts and prepare the parts for sale. With respect to self-service inventories, costs are established by calculating the average sales price per vehicle, including its scrap value and part value, applied to the total vehicles on-hand. Inventory costs for aftermarket parts, used cars and motorcycles for resale are established based upon the price we pay for these items.
All inventory is recorded at the lower of cost or market. The market value of our inventory is determined based on the nature of the inventory and anticipated demand. If actual demand differs from our earlier estimates, reductions to inventory carrying value would be necessary in the period such determination is made.
The historical cost basis of inventories acquired in conjunction with the business acquisitions made in 2015 includes an adjustment to record the inventory at its estimated fair value on the dates of acquisition. This incremental adjustment of inventory to fair value is amortized through cost of goods sold based on the average utilization of the acquired inventory. The acquisitions of the Subsidiaries contributed a $10.0 million increase in our recycled OEM and related products inventory during 2015, of which approximately $1.4 million and $8.6 million was amortized through cost of goods sold during 2016 and 2015, respectively. During the first quarter of 2016, we adjusted the estimated fair value of acquired inventory and accordingly decreased this fair value mark-up by $2.2 million, which was recorded as a credit to cost of goods sold during 2016 in accordance with ASU No. 2015-16. See Note 4 to the consolidated financial statements in this document for further information on our acquired inventory.
Acquisitions
We record our business combinations under the acquisition method of accounting, under which acquisition purchase price is allocated to the identifiable assets acquired and liabilities assumed based upon their respective fair values. We utilize management estimates and, in some instances, independent third-party valuation firms to assist in determining the fair values of the identifiable assets acquired, liabilities assumed and contingent consideration granted. Such estimates and valuations required us to make significant assumptions, including projections of future events and operating performance. The purchase price allocation is subject to change during the measurement period, which is limited to one year subsequent to the acquisition date. Any excess purchase price over the fair value of the net tangible and intangible assets acquired is allocated to goodwill. During March 2016, the Company made certain changes to the purchase price allocations of the Subsidiaries acquired in 2015 that increased goodwill by approximately $5.3 million, primarily as a result of substantial reductions in the estimated value of acquired inventories, as described in Note 4 to the consolidated financial statements in this document. Transaction and restructuring costs associated with a business combination are expensed as incurred.
Assessment of Potential Impairments of Goodwill
We are required to assess our goodwill for impairment at least annually for our one reporting unit and we do this as of October 1st. If the reporting unit has historically had a significant excess of fair value over book value and based on current operations is expected to continue to do so, the Company’s annual impairment test is performed qualitatively. If this is not the case, the first step of the goodwill impairment process ("Step 1") is completed, which involves determining whether the estimated fair value of the reporting unit exceeds the respective book value. In performing Step 1, management compares the carrying amount of the reporting unit to its estimated fair value. If the fair value exceeds the book value, goodwill of that reporting unit is not impaired.
The estimated fair value of the reporting unit is calculated using one or both of the following generally accepted valuation techniques: the income approach (discounted cash flows) and the market approach (using market multiples derived from a set of companies with comparable market characteristics). The appropriate methodology is determined by management based on available information at the time of the test. When both approaches are used, the estimated fair values are weighted. Substantial management judgment must be applied in determining such weightings.
If the Step 1 result concludes that the estimated fair value does not exceed the book value of the reporting unit, goodwill may be impaired and additional analysis is required ("Step 2"). Step 2 of the goodwill impairment test compares the implied fair value of a reporting unit’s goodwill to its carrying value. The implied fair value of goodwill is derived by performing a hypothetical purchase price allocation for the reporting unit as of the measurement date, by allocating the reporting unit’s estimated fair value to its assets and liabilities including any unrecognized intangible assets. The residual amount from performing this allocation represents the implied fair value of goodwill. To the extent this amount is below the carrying value of goodwill, an impairment loss is recorded.
28
On a quarterly basis, we consider whether events or circumstances are present that may lead to the determination that an indicator of impairment exists. These circumstances include, but are not limited to, deterioration in key performance indicators or industry and market conditions as well as adverse changes in cost of capital, discount rates and terminal values.
The process of evaluating the potential impairment of goodwill is highly subjective and requires significant judgment and estimates. During the first quarter of 2016, we recorded an impairment charge of $45.3 million, and the process and assumptions used to calculate such impairment are fully described in Note 11 to the consolidated financial statements in this document. Also discussed therein are the additional tests and calculation that were performed as of October 1, 2016 and December 31, 2016, which determined that no further impairment of goodwill was required during 2016. For these calculations, management (a) performed a more comprehensive income approach calculation extending the income plan from 5 to 7 years due to anticipated changes in future business, and (b) substantially eliminated use of the market approach calculation because delays in quarterly reporting of financial results made it impracticable for the market to evaluate the value of the reporting unit at that time.
Impairment of Long-Lived Assets and Amortizable Intangible Assets
In conjunction with our third party valuation expert, we used various techniques in estimating the initial fair value attributed to intangible assets acquired in 2015, such as customer relationships, trade names and covenants not to compete, and other long lived assets. We evaluate the carrying value of intangible assets and other long lived assets for impairment whenever events or changes in circumstances indicate that the carrying amount of the assets may not be recoverable. We test these assets for recoverability by comparing the net carrying value of the asset or asset group to the undiscounted net cash flows to be generated from the use and eventual disposition of that asset or asset group. If the assets are not recoverable, an impairment loss is recognized for any deficiency of the asset or asset group's estimated fair value compared to their carrying value. Although we base cash flow forecasts on assumptions that are consistent with plans and estimates we use to manage our business, there is significant judgment in determining the cash flows attributable to these assets, including markets and market share, customer attrition rates, sales volumes and mix, capital spending and working capital changes and we did not identify any impairment through December 31, 2016.
Income Taxes
We account for income taxes using the asset and liability method, which requires the recognition of deferred tax assets or liabilities for the tax-effected temporary differences between the financial reporting and tax bases of our assets and liabilities and for certain tax credit carryforwards. The objectives of accounting for income taxes are to recognize the amount of taxes payable or refundable for the current year and deferred tax liabilities and assets for the future tax consequences of events that have been recognized in our financial statements or tax returns. Judgment is required in addressing the future tax consequences of events that have been recognized in our consolidated financial statements or tax returns. Deferred tax assets are recorded net of a valuation allowance when, based on the weight of available evidence, we believe it is more likely than not that some portion or all of the recorded deferred tax assets will not be realized in future periods. We consider all available positive and negative evidence when assessing the likelihood of future realization of our deferred tax assets, including recent cumulative earnings experience, expectations of future taxable income and available tax planning strategies that could be implemented to realize the net deferred tax assets, the ability to carryback losses and other relevant factors. Failure to achieve forecasted taxable income in applicable tax jurisdictions could affect the ultimate realization of deferred tax assets and could result in an increase in the Company's effective tax rate on future earnings or reversal of tax benefits applicable to future losses.
We file income tax returns in the United States and Canada. We are not currently subject to any income tax examinations; however, tax returns of Fenix for 2014 (year of inception), 2015 (consolidated after the Combinations) and 2016 (consolidated) and tax returns of the acquired Subsidiaries for tax years 2013 through pre-acquisition periods in 2015 remain open under the statute of limitations. As of December 31, 2016 and 2015, we had a net deferred tax asset of $1.7 million and $0.6 million, respectively, attributable to Canadian subsidiaries primarily because of net operating loss carryforwards generated in 2016 and 2015 and goodwill impairment in 2016. Based on the available evidence and given the uncertainties associated with generating future taxable income in Canada, we have recorded a full valuation allowance for the net Canadian deferred tax assets at both balance sheet dates.
The calculation of tax liabilities involves dealing with uncertainties in the application of complex tax regulations. We follow a two-step approach to recognizing and measuring uncertain tax positions. The first step is to evaluate the tax position for recognition by determining if the weight of available evidence indicates it is more likely than not that the position will be sustained on audit, including resolution of related appeals or litigation processes, if any. The second step is to measure the tax liability as the largest amount that is more than 50% likely of being realized upon ultimate settlement. We consider many factors when evaluating and estimating its tax positions, which may require periodic adjustments and which may not accurately forecast actual outcomes. Our uncertain tax position reserves include related interest and penalties and all relate to tax positions taken on returns prior to the individual acquisitions of Subsidiaries. Our policy is to include interest and penalties associated with income tax obligations in income tax expense. Our right to indemnification under certain of the combination agreements related to these uncertain tax positions is subject to a threshold of 1% of the purchase price, a cap of 40% of the purchase price paid for each individual acquisition. These indemnifications are subject to a three year limitation from date of the acquisitions. See Note 10 to the consolidated financial statements in this document for further information on our uncertain tax positions.
29
Our uncertain tax position reserves, including the reserves for related interest and penalties of approximately $0.5 million and $2.4 million, were $2.2 million and $5.7 million as of December 31, 2016 and 2015, respectively. During the year ended December 31, 2016, the statute of limitations lapsed without audit for certain tax returns filed by acquired Subsidiaries for which reserves for uncertain tax positions and indemnification receivables had been established. As a result, we reversed approximately $3.4 million of uncertain tax position reserves, which included $1.9 million of accrued interest and penalties, as a credit to the income tax benefit in the consolidated statement of operations in 2016. Correspondingly, the indemnification receivables, which were $2.0 million and $5.1 million as recorded in the consolidated balance sheets as of December 31, 2016 and 2015, respectively, were reduced by $2.9 million through a charge to operating expenses in 2016. If a reserved uncertain tax position results in an actual liability and we are unable to collect on or enforce the related indemnification provision or if the actual liability occurs after the applicable indemnity period has expired, there could be a material charge to our consolidated financial results and reduction of cash resources.
Undistributed earnings of our Canadian subsidiaries are considered to be indefinitely reinvested, and accordingly no provision for U.S. income taxes has been provided thereon. Upon repatriation of those earnings, in the form of dividends or otherwise, we would be subject to both U.S. income taxes (subject to adjustment for foreign tax credits) and potential withholding taxes payable in Canada. Determination of the amount of unrecognized deferred U.S. income tax liability is not practicable due to the complexities associated with its hypothetical calculation; however, unrecognized foreign tax credits would be available to reduce materially any U.S. liability.
Share-based Compensation
We recognize compensation expense for employee equity awards ratably over the requisite service period of the awards. For the equity award grants, there was no estimated annual forfeiture rate applied due to the lack of historical forfeiture experience to date, and expense of $2.6 million and $3.0 million was recorded in the consolidated statements of operations for 2016 and 2015, respectively. If actual forfeitures are significant in the future, share-based compensation expense would be reduced in future periods.
We utilize the Black-Scholes option-pricing model to estimate the fair value of stock option awards. Determining the fair value of stock options using the Black-Scholes model requires judgment, including estimates for (1) risk-free interest rate – an estimate based on the yield of zero-coupon treasury securities with a maturity equal to the expected life of the option; (2) expected volatility – an estimate based on the historical volatility of comparable companies' common shares for a period equal to the expected life of the option; and (3) expected life of the option – an estimate based on industry historical experience including the effect of employee terminations; and (4) expected dividend yield – an estimate of cash dividends, which we do not currently intend to pay. For further information, see Note 8 to the consolidated financial statements in this document.
Contingent Consideration
Under arrangements with the former owners of three Founding Companies, those former owners can earn additional cash and stock if certain performance measures are achieved subsequent to the combinations. The fair value of the aggregate contingent consideration was initially estimated as $10.2 million and recorded in the consolidated financial statements at the acquisition date based on independent valuations considering our initial projections for the relevant Founding Companies, the respective target levels, the relative weighting of various future scenarios and a discount rate of approximately 5.0%. Subsequent to the Combinations, our management reviews the amounts of contingent consideration that are likely to be payable under current operating conditions and adjusts the initial liability as deemed necessary, including adjustments for mark-to-market fluctuations based on changes between periods in the trading price of Fenix common stock and, with respect to the Canadian Founding Companies, currency remeasurement, with such subsequent adjustments being recorded through the statement of operations as a credit or charge. In the event that there is a range of possible outcomes, we apply a probability approach to determine the estimated obligation to be recorded at the end of an accounting period. Estimating the range of possible outcomes and amount of contingent consideration that may be payable in future periods involves the application of significant judgment and assumptions about future events by our management based on the information available at the time.
During 2015, we recorded a $6.0 million increase and during 2016, an $8.2 million decrease in the contingent consideration liabilities. As of December 31, 2016, the estimated contingent consideration liability, which was all classified as current, was $7.2 million. We are in negotiations with the former owners to determine the amounts due under these covenants and schedule payment of currently due amounts. We expect to fund any cash payments to the former owners, to the extent they are ultimately deemed earned, through cash generated from future operations or, if necessary and available, through draws on the revolving Credit Facility or through other sources of capital that may be available, and through draws on the bank letter of credit for the Canadian Founding Companies, which is considered Funded Debt under the Total Leverage Ratio required under the Credit Facility. We are currently at an impasse in negotiations with the former owners of the Canadian Founding Companies regarding the calculation of contingent consideration earned, if any, and the parties have begun the process of submitting their respective calculations to binding arbitration. The ultimate resolution of the total amounts payable under these covenants could differ substantially from what is recorded at December 31, 2016, based on future developments. For further information, see Note 6 to the consolidated financial statements in this document.
30
Recently Adopted Accounting Standards
In March 2016, the FASB issued ASU No. 2016-09, Compensation-Stock Compensation (Topic 718): Improvements to Employee Share-Based Payment Accounting. The ASU changes the accounting for certain aspects of share-based payment awards to employees and requires the recognition of the income tax effects of awards in the income statement when the awards vest or are settled, thus eliminating additional paid in capital pools. The guidance also allows for the employer to repurchase more of an employee’s shares for tax withholding purposes without triggering liability accounting. In addition, the guidance allows for a policy election to account for forfeitures as they occur rather than on an estimated basis. This pronouncement is effective for fiscal years and interim periods beginning after December 15, 2016, with early adoption permitted. We adopted ASU 2016-09 effective April 1, 2016 and all forfeitures have been applied when they occurred.
In September 2015, FASB issued ASU No. 2015-16, Business Combinations (Topic 805), Simplifying the Accounting for Measurement-Period Adjustments, which simplifies the accounting for adjustments made to provisional amounts recognized in business combinations. The amendments require that an acquirer recognize adjustments to provisional amounts that are identified during the measurement period in the reporting period in which the adjustment amounts are determined. The amendments also require that the acquirer record, in the same period’s financial statements, the effect on earnings of changes in depreciation, amortization, or other income effects, if any, as a result of the change to provisional amounts, calculated as if the accounting had been completed at the acquisition date. The ASU also requires an entity to present separately on the face of the income statement or disclose in the notes the portion of the amount recorded in current-period earnings by line item that would have been recorded in previous reporting periods if the adjustment to the provisional amounts had been recognized as of the acquisition date. This guidance is effective for fiscal years beginning after December 15, 2015, including interim periods within those fiscal years. We adopted ASU 2015-16 effective January 1, 2016, resulting in the recognition of certain adjustments during the first quarter of 2016 to goodwill and other balance sheet and income statement accounts as described in Note 4 to the consolidated financial statements in this document.
In August 2015, the FASB issued ASU No. 2015-15, Interest - Imputed Interest (Subtopic 835-30): Presentation and Subsequent Measurement of Debt Issuance Costs Associated with Line-of-Credit Arrangements, which clarifies that the guidance in ASU 2015-03 does not apply to line-of-credit arrangements. According to ASU 2015-15, debt issuance costs related to line-of-credit arrangements will continue to be deferred and presented as an asset and subsequently amortized ratably over the term of the arrangement. The amendments in ASU 2015-03 and clarifications of ASU 2015-15 were effective for us in the first quarter of 2016. The early adoption of ASU 2015-03 and the adoption of ASU 2015-15 resulted in $438,000 in original debt issuance costs incurred during 2015 and an additional $102,000 in amendment charges during 2016, being netted against the term loan balance and such amounts are being amortized over the life of the term loan as described more fully in Note 5 to the consolidated financial statements in this document.
In August 2014, the FASB issued ASU No. 2014-15, Presentation of Financial Statements - Going Concern (Subtopic 205-40): Disclosure of Uncertainties about an Entity’s Ability to Continue as a Going Concern. ASU 2014-15 describes how an entity’s management should assess, considering both quantitative and qualitative factors, whether there are conditions and events that raise substantial doubt about an entity’s ability to continue as a going concern within one year after the date that the financial statements are issued, which represents a change from the previous literature that required consideration about an entity’s ability to continue as a going concern within one year after the balance sheet date. We adopted this standard during the fourth quarter of 2016. The implementation of this standard did not have a material impact on our consolidated financial statements and related disclosures. See the discussion of "Liquidity and Capital Resources" in this section of our Annual Report on Form 10-K for 2016.
Recent Accounting Pronouncements
In January 2017, the Financial Accounting Standards Board ("FASB") issued Accounting Standards Update ("ASU") 2017-04, Simplifying the Test for Goodwill Impairment, which simplifies how an entity is required to test goodwill for impairment by eliminating Step 2 from the goodwill impairment test. Step 2 measures a goodwill impairment loss by comparing the implied fair value of a reporting unit’s goodwill with the carrying amount. The new rules will be effective for us in the first quarter of 2020. We do not expect the adoption of the new accounting rules to have a material impact on our financial condition, results of operations and cash flows.
In January 2017, the FASB issued ASU 2017-03, Accounting Changes and Error Corrections (Topic 250), this amendment states that registrants should consider additional qualitative disclosures if the impact of an issued but not yet adopted ASU is unknown or cannot be reasonably estimated and to include a description of the effect of the accounting policies that the registrant expects to apply, if determined. This standard is effective for fiscal years beginning after December 15, 2019, including interim periods within that reporting period. We do not expect the adoption of the new accounting rules to have a material impact on our financial condition, results of operations and cash flows.
In January 2017, the FASB issued ASU 2017-01, Clarifying the Definition of a Business, which clarifies the definition of "a business" to assist entities with evaluating whether transactions should be accounted for as acquisitions or disposals of assets or businesses. The standard introduces a screen for determining when assets acquired are not a business and clarifies that a business must include, at a
31
minimum, an input and a substantive process that contribute to an output to be considered a business. This standard is effective for fiscal years beginning after December 15, 2017, including interim periods within that reporting period. We do not expect this new guidance to have a material impact on its consolidated financial statements.
In August 2016, the FASB issued ASU No. 2016-15, Classification of Certain Cash Receipts and Cash Payments (Topic 230) (a consensus of the Emerging Issues Task Force). ASU 2016-15 addresses eight specific cash flow issues and applies to all entities, including both business entities and not-for-profit entities that are required to present a statement of cash flows under ASC 230, Statement of Cash Flows. The amendments in ASU 2016-15 are effective for public business entities for fiscal years beginning after December 15, 2017, and interim periods within those fiscal years. Early adoption is permitted, including adoption in an interim period. We have not yet adopted this update and are currently evaluating the impact it may have on its financial condition and results of operations.
In June 2016, the FASB issued ASU No. 2016-13, Financial Instruments—Credit Losses (Topic 326): Measurement of Credit Losses on Financial Instruments. ASU 2016-13 introduces a new forward-looking approach, based on expected losses, to estimate credit losses on certain types of financial instruments, including trade receivables, which will require entities to incorporate considerations of historical information, current information and reasonable and supportable forecasts. This ASU also expands disclosure requirements. ASU 2016-13 is effective for us beginning the first quarter of 2020 with early adoption permitted. We are currently evaluating the impact of adoption of ASU 2016-13 on its consolidated financial statements and related financial statement disclosures.
In February 2016, the FASB issued ASU No. 2016-02, Leases (Topic 842). The guidance in ASU 2016-02 supersedes the lease recognition requirements in ASC Topic 840, Leases (FAS 13). The new standard establishes a right-of-use (ROU) model that requires a lessee to record an ROU asset and a lease liability on the balance sheet for all leases with terms longer than 12 months. Leases will be classified as either finance or operating, with classification affecting the pattern of expense recognition in the income statement. The new standard is effective for fiscal years beginning after December 15, 2018, including interim periods within those fiscal years, with early adoption permitted. A modified retrospective transition approach is required for lessees for capital and operating leases existing at, or entered into after, the beginning of the earliest comparative period presented in the financial statements, with certain practical expedients available. While we are currently evaluating the effect this standard will have on its consolidated financial statements and timing of adoption, we expect that upon adoption, we will recognize ROU assets and lease liabilities and those amounts are likely to be material.
In May 2014, the FASB issued ASU 2014-09, Revenue from Contracts with Customers (Topic 606). This update outlines a single, comprehensive model for accounting for revenue from contracts with customers. In August 2015, the FASB deferred the effective date by one year to January 1, 2018, while providing the option to early adopt the standard on the original effective date of January 1, 2017. We plan to adopt this update on January 1, 2018. The guidance can be adopted either retrospectively or as a cumulative-effect adjustment as of the date of adoption. We are currently evaluating the adoption alternatives, which include utilizing a bottom-up approach to analyze the standard’s impact on our contract portfolio, comparing historical accounting policies and practices to the new standard to identify potential differences from applying the requirements of the new standard to its contracts. We have not yet selected a transition method and are currently evaluating the impact it may have on its consolidated financial statements and related disclosures.
Fenix Parts, Inc.
Overview
We are in the business of automotive recycling, which is the recovery and resale of OEM parts, components and systems, such as engines, transmissions, radiators, trunks, lamps and seats reclaimed from damaged, totaled or low value vehicles. We purchase our vehicles primarily at auto salvage auctions. Upon receipt of vehicles, we inventory and then dismantle the vehicles and sell the recycled components. Our customers include collision repair shops, mechanical repair shops (body shops), auto dealerships and individual retail customers. We also generate a portion of our revenue from the sale as scrap of the unusable parts and materials, from the sale of used cars and motorcycles, the sale of aftermarket parts, and from the sale of extended warranty contracts.
Fenix was founded on January 2, 2014 for the purpose of effecting the Combinations and IPO. Fenix had no automobile recycling operations before May 2015 during which time it had two employees. From inception to May 19, 2015, Fenix incurred various legal, accounting, auditing and administrative costs in preparation for its IPO, the Combinations and for its operation as a publicly-traded company upon consummation of these transactions. After May 18, 2015, Fenix’s results include the operations of the Founding Companies and, beginning with the third quarter of 2015, of the Subsequent Acquisitions.
Liquidity and Ability to Continue as a Going Concern
Our consolidated financial statements have been prepared assuming we will continue as a going concern, which contemplates continuity of operations, realization of assets and the satisfaction of liabilities in the normal course of business. As such, the accompanying consolidated financial statements do not include any adjustments relating to the recoverability and classification of assets and their carrying amounts, or the amount and classification of liabilities that may result should we be unable to continue as a going concern.
32
As of June 30, 2016, September 30, 2016 and December 31, 2016, we were in breach of certain financial covenants contained in our Credit Facility as well as the requirement for timely delivery of certain quarterly certificates and reports. As a result, all of the Credit Facility debt of $21.5 million at December 31, 2016, less unamortized debt issuance costs of $0.4 million, is reported in the accompanying consolidated balance sheet as a current liability at December 31, 2016 and there can be no further borrowings on any availability under the Credit Facility until such defaults are rectified or waived. On March 27, 2017, we entered into a Forbearance Agreement to the Credit Facility (the "Forbearance Agreement") with BMO Harris Bank N.A and its Canadian affiliate, Bank of Montreal. Pursuant to the Forbearance Agreement, the banks have agreed to forbear from exercising their rights and remedies under the Credit Facility with respect to the above described defaults and any similar defaults during the forbearance period, provided no other defaults occur. The Forbearance Agreement was amended on June 23, 2017 to extend the forbearance period, which had originally expired on May 26, 2017, until August 31, 2017 and to resolve certain new defaults.
Our Board of Directors has engaged a financial advisor to advise the Board and management and to assist in pursuing a range of potential strategic and financial transactions that will provide us with improved liquidity and maximize shareholder value. The financial advisor will identify and evaluate potential alternatives including a business combination, debt and/or equity financing, or a strategic investment into the Company, and is reporting directly to a special committee of independent directors established to oversee and coordinate these activities. The Board has not set a definitive timetable for completion of this process. There can be no assurance that this process will result in a transaction or other strategic alternative of any kind. Furthermore, the June 29, 2017 suspension in trading and eventual delisting of our common stock on the Nasdaq Global Market negates our ability to pursue strategic and financial transactions available only to listed companies.
If we are unable to reach further agreement with our lenders to obtain waivers or amendments to the existing Credit Facility, find acceptable alternative financing, obtain equity contributions, or arrange a business combination our Credit Facility lenders could elect to declare some or all of the amounts outstanding under the facility to be immediately due and payable. If this happens, we do not expect to have sufficient liquidity to pay the outstanding Credit Facility debt. In addition, we have significant obligations under contingent consideration agreements related to certain acquired companies, and we will need access to additional credit to be able to satisfy these obligations. These matters, including our ability to continue as a going concern, are more fully discussed below under Liquidity and Capital Resources.
CONSOLIDATED RESULTS OF OPERATIONS
Comparison of Years Ended December 31, 2016 and 2015
(in thousands, except percentages) | December 31, 2016 | Percent of Net Revenues | December 31, 2015 | Percent of Net Revenues | |||||||||
Net revenues | $ | 132,100 | 100.0 | % | $ | 68,946 | 100.0 | % | |||||
Cost of goods sold | 78,641 | 59.5 | % | 53,559 | 77.7 | % | |||||||
Gross profit | 53,459 | 40.5 | % | 15,387 | 22.3 | % | |||||||
Selling, general and administrative expenses | 49,888 | 37.8 | % | 28,346 | 41.1 | % | |||||||
Outside service and professional fees | 6,741 | 5.1 | % | 9,091 | 13.2 | % | |||||||
Depreciation and amortization | 4,601 | 3.5 | % | 2,743 | 4.0 | % | |||||||
Change in fair value of contingent consideration liabilities | (8,234 | ) | (6.2 | )% | 6,050 | 8.8 | % | ||||||
Change in indemnification receivable | 2,920 | 2.2 | % | — | — | % | |||||||
Goodwill impairment | 45,300 | 34.3 | % | — | — | % | |||||||
Operating loss | (47,757 | ) | (36.2 | )% | (30,843 | ) | (44.8 | )% | |||||
Interest expense | (1,384 | ) | (1.0 | )% | (263 | ) | (0.4 | )% | |||||
Other (expense) income, net | (14 | ) | — | % | (1,959 | ) | (2.8 | )% | |||||
Total other expense, net | (1,398 | ) | (1.0 | )% | (2,222 | ) | (3.2 | )% | |||||
Loss before income tax benefit | (49,155 | ) | (37.2 | )% | (33,065 | ) | (48.0 | )% | |||||
Benefit from income taxes | 6,286 | 4.8 | % | 7,024 | 10.2 | % | |||||||
Net loss | $ | (42,869 | ) | (32.4 | )% | $ | (26,041 | ) | (37.8 | )% | |||
Pro Forma Results (Unaudited)
The following table shows the unaudited pro forma combined net revenues and net loss for 2015 as if the acquisition of all Subsidiaries had occurred on January 1, 2015, as compared to the reported results for 2016. These unaudited pro forma amounts presented are not necessarily indicative of either the actual consolidated results had the acquisition occurred as of January 1, 2015 or of future operating results:
33
(Unaudited) | |||||||||||||||
Year Ended December 31, | Difference | ||||||||||||||
(in thousands, except percentages) | 2016 as Reported | 2015 Pro Forma | $ | % | |||||||||||
Net revenues | $ | 132,100 | $ | 126,897 | $ | 5,203 | 4.1 | % | |||||||
Net loss | $ | (42,869 | ) | $ | (23,716 | ) | $ | (19,153 | ) | 80.8 | % | ||||
Pro forma combined net revenues consisted of:
(Unaudited) | |||||||||||||||
(in thousands, except percentages) | Year Ended December 31, | Difference | |||||||||||||
2016 as Reported | 2015 Pro Forma | $ | % | ||||||||||||
Recycled OE parts and related products | $ | 114,110 | $ | 109,658 | $ | 4,452 | 4.1 | % | |||||||
Other ancillary products (scrap) | 17,990 | 17,239 | 751 | 4.4 | % | ||||||||||
Total | $ | 132,100 | $ | 126,897 | $ | 5,203 | 4.1 | % | |||||||
Significant adjustments to the historical revenues of the Subsidiaries include the elimination of sales between acquired companies, for which there is a corresponding decrease in pro forma cost of goods sold, and the elimination of revenue from the sale of warranties that are not recognized by us in the post-acquisition periods.
Significant adjustments to expenses include eliminating the effect of shares transferred from founding investors to later investors, incremental amortization of acquired intangible assets, rent expense associated with leases with the former owners of the Subsidiaries, compensation related to certain bonuses paid to owners and employees and related income tax effects.
The cost of goods sold impact of the subsequent sale of acquired inventories written-up from historic cost basis to fair value is reflected for pro forma reporting purposes in the same manner as reported in the accompanying consolidated financial statements and is not adjusted back to January 1, 2015, as it does not have a continuing impact. As a result, pro forma gross profit and net income in the periods immediately following the acquisitions are substantially lower than the pre-acquisition periods.
Net Revenues
Net revenues for the year ended December 31, 2016 were $132.1 million. This represents a 91.6% increase over net revenues for the year ended December 31, 2015 of $68.9 million. This change is primarily a result of having automotive recycling operations for the Founding Companies from May 18, 2015 to December 31, 2015, and for the Subsequent Acquisitions beginning in the third quarter of 2015 to December 31, 2015. Net revenues of $132.1 million represents a 4.1% increase over unaudited pro forma combined net revenues for the year ended December 31, 2015 of $126.9 million. Of this increase, $4.5 million was attributable to sales of OE parts and related products and $0.8 million was attributable to sales of scrap.
We are subject to risks and uncertainties relating to the price of scrap metal, which can fluctuate significantly from period to period. While sales of scrap metal represent a small portion of our overall revenues, significant fluctuations have been experienced in metal prices over the past 24 months which have had an effect on our reported revenues including a decline of approximately 22% in average market prices for scrap auto bodies from the year ended December 31, 2015 to the year ended December 31, 2016 (as per the American Metal Market Index, 2015 = $162/ton; 2016 = $126/ton), which had an adverse effect on our reported revenues during the year ended December 31, 2016. Continued weakness in metals prices could continue to adversely affect our revenues and profits. This trend should be viewed in light of the partially offsetting effect of lower metals prices on our cost of acquiring vehicles for recycling.
Because we have substantial operations in Canada doing business in Canadian Dollars, we are also subject to risks and uncertainties relating to foreign currency exchange rates. Because of the significant increase in the value of the U.S Dollar against the Canadian Dollar during 2015, in the fourth quarter of 2015 and continuing through 2016, we substantially reduced shipments of parts from our U.S. facilities into the Canadian markets resulting in lower revenue at our Canadian facilities as they sought to develop Canadian sources to acquire vehicles and product for recycling. Continued changes in exchange rates could result in ongoing changes to operational and financial performance of the Canadian operations that could adversely affect our future reported results of operations.
Cost of Goods Sold
Our cost of goods sold for the year ended December 31, 2016 amounted to $78.6 million, or 59.5% of net revenues and a gross profit percentage of 40.5%. This represents a 46.8% increase over cost of goods sold for the year ended December 31, 2015 of 53.6 million. This change is primarily a result of having automotive recycling operations for the Founding Companies from May 18, 2015 to December 31, 2015, and for the Subsequent Acquisitions beginning in the third quarter of 2015 to December 31, 2015. Included in the cost of goods
34
sold for the year ended December 31, 2016 is a benefit of $2.2 million from retrospective adjustments to reduce the value of acquired inventories in the business combinations and $1.8 million in lower value of acquired inventory for periods prior to December 31, 2015. These credits to cost of goods sold, recorded as of March 31, 2016, were partially offset by the impact of post-acquisition amortization of the higher inventory values that resulted from applying the purchase method of accounting of $1.4 million in the year ended December 31, 2016 as compared to $8.6 million in the year ended December 31, 2015. As of December 31, 2016, there was no remaining unamortized fair value inventory adjustment as the acquired inventory was expected to be sold within three to six months. Depreciation of $1.0 million and $0.5 million was included in cost of goods sold during the years ended December 31, 2016 and 2015, respectively.
As mentioned above, our results of operations are exposed to market risk related to price fluctuations in scrap metal and other metals. Market prices of these metals affect the amount that we pay for our inventory, in addition to the revenue that we generate from sales of these metals. As both our revenue and costs are affected by the price fluctuations, we have a natural hedge against price changes. However, there is typically a lag between the effect on our revenue from metal price fluctuations and the corresponding effect on cost of goods sold. Our cost of goods sold for recycled OEM and related products reflects the historic average cost to acquire such products, including the price to purchase vehicles, auction, storage and towing fees, and expenditures for buying and dismantling vehicles.
Selling, General and Administrative Expenses
Our selling, general and administrative expenses for the year ended December 31, 2016 amounted to $49.9 million, or 37.8% of net revenues. This represents a 76.0% increase over selling, general and administrative expense for the year ended December 31, 2015 of $28.3 million. This change is primarily a result of having automotive recycling operations for the Founding Companies from May 18, 2015 to December 31, 2015, and for the Subsequent Acquisitions beginning in the third quarter of 2015 to December 31, 2015. Selling, general and administrative expenses consisted of (a) operating and distribution costs that are not directly related to the procurement and dismantling of vehicles, (b) selling and marketing expenses, (c) general and administrative expenses, and (d) amortization of $2.6 million and $3.0 million of non-cash share-based compensation during the years ended December 31, 2016 and 2015, respectively.
Outside Service and Professional Fees
Our outside service and professional fees for the year ended December 31, 2016 amounted to $6.7 million, or 5.1% of net revenues. This represents a 25.8% decrease from outside service and professional fees for the year ended December 31, 2015 of $9.1 million. Outside service and professional fees consisted primarily of auditing, valuation reports and opinions, tax compliance and consulting, and legal fees for the year ended December 31, 2016, and also included significant fees incurred in conjunction with our transition to a new audit firm. For the year ended December 31, 2015, outside service and professional fees included costs related to due diligence, finalizing the audits and establishing the initial accounting valuations for the acquisitions of the Founding Companies, due diligence related to the Subsequent Acquisitions, and for outside accounting services after the IPO as we had not yet recruited and staffed an internal accounting department.
Depreciation and Amortization Expense
Our depreciation and amortization not directly attributable to cost of goods sold for the year ended December 31, 2016 amounted to $4.6 million, or 3.5% of net revenues. This represents a 67.7% increase over depreciation and amortization for the year ended December 31, 2015 of $2.7 million. This change is primarily a result of having automotive recycling operations for the Founding Companies from May 18, 2015 to December 31, 2015, and for the Subsequent Acquisitions beginning in the third quarter of 2015 to December 31, 2015. Amortization expense for intangible assets established in connection with acquisitions was $3.6 million and $2.1 million for the years ended December 31, 2016 and 2015, respectively.
Change in Fair Value of Contingent Consideration Liabilities
Our estimated fair value of contingent consideration liabilities decreased by $8.2 million for the year ended December 31, 2016, resulting in income equal to 6.2% of net revenues. This compares to an increase in estimated fair value of contingent consideration liabilities and resulting loss recorded during the year ended December 31, 2015 of $6.0 million. The contingent consideration liability primarily relates to covenants allowing for additional consideration to be paid to the former owners of the Canadian Founding Companies and Jerry Brown, Ltd. (“Jerry Brown”) if specified future events occur or conditions are met, such as meeting profitability or earnings targets. The change during 2016 primarily results because the estimated contingent consideration liability for the Canadian Founding Companies was reduced by $4.2 million during the year ended December 31, 2016 in accordance with FASB ASC No. 805 “Business Combinations,” which requires that we estimate contingent consideration at fair value using probable outcomes. As the amount of the contingent consideration is currently in dispute, we recorded the estimated contingent consideration liability for the Canadian Founding Companies as of December 31, 2016 based on the results of our assessment of the possible outcomes. During the year ended December 31, 2015, we increased the contingent consideration liability by $5.1 million based on substantial operating improvements and management’s budget for Jerry Brown for 2016. Based on results actually achieved by Jerry Brown during 2016, the estimated fair value of the contingent liability was reduced by $3.8 million, resulting in a credit to income which is reflected in the consolidated statement of operations for the year ended December 31, 2016. In addition, since some of the contingent consideration is payable in shares of our stock, movements in our stock price during the respective periods and currency remeasurement resulted in changes to the contingent consideration liabilities during the years ended December 31, 2016 and 2015.
35
Change in Indemnification Receivable
Our estimated fair value of the indemnification receivable decreased by $2.9 million for the year ended December 31, 2016, resulting in an expense equal to 2.2% of net revenues. The expense was attributable to the reduction in the receivable from former owners related to the indemnification for uncertain tax positions, recorded as a benefit under income taxes.
Goodwill Impairment
Based on the result of the first step of the goodwill impairment analysis, we determined that the fair value of our reporting unit was less than its carrying value as of March 31, 2016 and, as such, we applied the second step of the goodwill impairment test. Based on the result of this second step of the goodwill impairment analysis, we recorded a $45.3 million non-cash pretax charge to reduce the carrying value of goodwill in March 2016.
Interest Expense and Other (Expense) Income, net
Our interest expense, primarily related to our Credit Facility, was $1.4 million and $0.3 million for the years ended December 31, 2016 and 2015, respectively. Our first draw on the Credit Facility was in May 2015 in connection with the closing of the Combinations, and the increase in interest expense during 2016 is attributable to higher average balances outstanding during the year at slightly higher weighted average rates. Our other (expense) income, net was $0.0 million and expense of $2.0 million for the years ended December 31, 2016 and 2015, respectively. Other (expense) income, net for 2015 includes a $1.8 million charge for the make whole provision for pre-IPO investors.
Benefit from Income Taxes
We recorded an income tax benefit of $6.3 million for the year ended December 31, 2016, with an effective rate of 12.8% of the pretax loss reported for the year. This represents a 10.5% decrease as compared to the income tax benefit for the year ended December 31, 2015 of $7.0 million with an effective tax rate of 21.2%. The benefit recorded during the year ended December 31, 2016 includes a $3.4 million reversal of uncertain tax positions. However, the effective rate for 2016 was lower than the statutory rate applied to the pretax loss of $49.2 million for the year because no significant amount of tax benefit was recorded for the goodwill impairment of $45.3 million in 2016. The tax benefit associated with the portion of this impairment charge related to future goodwill deductions by the Canadian Founding Companies was offset by a valuation allowance because of the uncertainties associated with generating future taxable income in Canada. In addition to the items discussed above, the effective rate in the years ended December 31, 2016 and 2015 differs from the U.S. federal statutory rate due to the effects of the state and Canadian income taxes and non-deductible income and expense items reported in the consolidated statements of operations, such as changes in contingent consideration and changes in indemnification receivables. See Note 10 to the consolidated financial statements in this document.
Net Loss
Net loss for the year ended December 31, 2016 and 2015 was $42.9 million and $26.0 million, respectively. This represents a 64.6% decrease which results from the $45.3 million impairment of goodwill in 2016 and the other matters described above.
Comparison of Years Ended December 31, 2015 and 2014
(in thousands, except percentages) | Year Ended December 31, 2015 | Percent of Net Revenues | Period from January 2, 2014 (Inception) to December 31, 2014 | |||||||
Net revenues | $ | 68,946 | 100.0 | % | $ | — | ||||
Cost of goods sold | 53,559 | 77.7 | % | — | ||||||
Gross profit | 15,387 | 22.3 | % | — | ||||||
Selling, general and administrative expenses | 28,346 | 41.1 | % | 232 | ||||||
Outside service and professional fees | 9,091 | 13.2 | % | 4,515 | ||||||
Depreciation and amortization | 2,743 | 4.0 | % | — | ||||||
Change in fair value of contingent consideration liabilities | 6,050 | 8.8 | % | — | ||||||
Operating loss | (30,843 | ) | (44.8 | )% | (4,747 | ) | ||||
Interest expense | (263 | ) | (0.4 | )% | — | |||||
Other (expense) income, net | (1,959 | ) | (2.8 | )% | 1 | |||||
Total other expense, net | (2,222 | ) | (3.2 | )% | 1 | |||||
Loss before income tax benefit | (33,065 | ) | (48.0 | )% | (4,746 | ) | ||||
Benefit for income taxes | 7,024 | 10.2 | % | — | ||||||
Net loss | $ | (26,041 | ) | (37.8 | )% | $ | (4,746 | ) | ||
36
Pro Forma Results (Unaudited)
The following table shows the unaudited combined pro forma net revenues and net loss for 2015 and 2014 as if the acquisition of all Subsidiaries had occurred on January 1, 2014. These unaudited pro forma amounts presented are not necessarily indicative of either the actual consolidated results had the acquisition occurred as of January 1, 2014 or of future operating results:
(Unaudited) | |||||||||||||||
(in thousands, except percentages) | Year Ended December 31, | Difference | |||||||||||||
2015 | 2014 | $ | % | ||||||||||||
Net revenues | $ | 126,897 | $ | 132,802 | $ | (5,905 | ) | (4.4 | )% | ||||||
Net loss | $ | (23,716 | ) | $ | (4,594 | ) | $ | (19,122 | ) | 416.2 | % | ||||
Pro forma combined net revenues consisted of:
(Unaudited) | |||||||||||||||
(in thousands, except percentages) | Year Ended December 31, | Difference | |||||||||||||
2015 | 2014 | $ | % | ||||||||||||
Recycled OEM parts and related products | $ | 109,658 | $ | 108,361 | $ | 1,297 | 1.2 | % | |||||||
Other ancillary products (scrap) | 17,239 | 24,441 | (7,202 | ) | (29.5 | )% | |||||||||
Total | $ | 126,897 | $ | 132,802 | $ | (5,905 | ) | (4.4 | )% | ||||||
Significant adjustments to the historical revenues of the Subsidiaries include the elimination of sales between acquired companies, for which there is a corresponding decrease in pro forma cost of goods sold, and the elimination of revenue from the sale of warranties that are not recognized by us in the post-acquisition periods.
Significant adjustments to expenses include eliminating the effect of shares transferred from founding investors to later investors, incremental amortization of acquired intangible assets, rent expense associated with leases with the former owners of the Subsidiaries, compensation related to certain bonuses paid to owners and employees and related income tax effects.
The cost of goods sold impact of the subsequent sale of acquired inventories written-up from historic cost basis to fair value is reflected for pro forma reporting purposes in the same manner as reported in the accompanying consolidated financial statements and is not adjusted back to January 1, 2014, as it does not have a continuing impact. As a result, pro forma gross profit and net income in the periods immediately following the acquisitions are substantially lower than the pre-acquisition periods.
Net Revenues
Net revenues for the year ended December 31, 2015 were $68.9 million, reflecting our automobile recycling operations from May 19, 2015 to December 31, 2015. On an unaudited pro forma combined basis assuming the acquisition of all current Subsidiaries occurred on January 1, 2014, net revenues for the years ended December 31, 2015 and 2014 were $126.9 million and $132.8 million, respectively, representing a 4.4% decrease. Pro forma net revenues in the year ended December 31, 2015, as compared to the same period in 2014, were adversely impacted by lower prices received for scrap sales and lower reported revenues at the Canadian operations because of a stronger U.S. Dollar.
Fenix is subject to risks and uncertainties relating to the price of scrap metal. While sales of scrap metal represent a small portion of our overall revenues, the decline of approximately 66% from 2014 to 2015 in market prices for scrap autobodies (as per the American Metal Market Index) had an adverse effect on reported revenues in 2015. Continued weakness in metals prices could adversely affect our revenues and profits. This trend should be viewed in light of the partially offsetting effect of lower metals prices on our cost of acquiring vehicles for recycling.
Because we have substantial operations in Canada doing business in Canadian Dollars, we are also subject to risks and uncertainties relating to foreign currency exchange rates. During 2015, the Canadian Dollar depreciated approximately 15% against the U.S. Dollar, and this had the effect of reducing reported and pro forma revenues in the year ended December 31, 2015 as compared to pro forma revenues for the year ended December 31, 2014. The continued strengthening in the U.S. Dollar relative to the Canadian Dollar could adversely affect our future reported results of operations.
Cost of Goods Sold
Our cost of goods sold for the year ended December 31, 2015 amounted to $53.6 million, or 77.7% of revenue and a gross profit percentage of 22.3%. Cost of goods sold for 2015 includes $8.6 million, or 12.5% of net revenues, attributable to post-acquisition amortization of higher inventory values from applying the purchase method of accounting to the acquired inventories of the Subsidiaries. Without the impact of this acquisition accounting step up in initial inventory values, cost of goods sold as a percentage of net revenues was 65.2%
37
and gross profit percentage was 34.8% for the year ended December 31, 2015. As of December 31, 2015, the remaining unamortized fair value inventory adjustment is approximately $1.4 million and was fully amortized in 2016. Cost of goods sold for the year ended December 31, 2015 also includes approximately $0.5 million of depreciation.
As mentioned above, our results of operations are exposed to market risk related to price fluctuations in scrap metal and other metals. Market prices of these metals affect the amount that we pay for our inventory, in addition to the revenue that we generate from sales of these metals. As both our revenue and costs are affected by the price fluctuations, we have a natural hedge against the changes. However, there is typically a lag between the effect on our revenue from metal price fluctuations and the corresponding effect on cost of goods sold. Our cost of goods sold for recycled OEM and related products reflects the historic average cost to acquire such products, including the price to purchase vehicles, auction, storage and towing fees, and expenditures for buying and dismantling vehicles. Because of the significant drop in the value of scrap metal throughout 2015 and, in particular in the fourth quarter of 2015, the cost of goods sold reflected in our consolidated financial statements is higher than the current cost to replace that same inventory.
Selling, General and Administrative Expenses
Our selling, general and administrative expenses for the year ended December 31, 2015 amounted to $28.3 million, or 41.1% of net revenues.
Outside Service and Professional Fees
Our outside service and professional fees for the year ended December 31, 2015 amounted to $9.1 million, or 13.2% of net revenues, and consists primarily of accounting, auditing, tax consulting, and legal professional fees. This represents a 101.4% increase from outside service and professional fees for the year ended December 31, 2014 of $4.5 million.
Depreciation and Amortization Expense
Our depreciation and amortization not directly attributable to cost of goods sold for the year ended December 31, 2015 amounted to $2.7 million, or 4.0% of net revenues, and consists primarily of amortization of intangible assets established in connection with acquisitions.
Change in Fair Value of Contingent Consideration Liabilities
Our estimated fair value of contingent consideration liabilities was increased by $6.0 million for the year ended December 31, 2015, resulting in a charge equal to 8.8% of net revenues. The charge was primarily attributable to an increase in the estimated contingent consideration to one Founding Company and minor changes in estimated contingent consideration attributable to two other Founding Companies.
Interest Expense and Other (Expense) Income, net
Our interest expense, primarily related to our Credit Facility, was $0.3 million for the year ended December 31, 2015. Our interest and other (expense) income, net for the year ended December 31, 2015 amounted to $2.0 million, or 2.8% of revenue and consists primarily of a $1.8 million non-cash charge related to make whole provisions whereby certain of our shareholders were contractually required to deliver Fenix common shares to other of our shareholders when the offering price per share was below $10. The amount equals the number of shares transferred times the public offering price of $8 per share. See Note 7, Common Stock and Preferred Shares, to consolidated financial statements in this document for a further discussion of these transactions.
Benefit for Income Taxes
The Company’s effective tax rate was 21.2% and 0.0% for the years ended December 31, 2015 and 2014, respectively. The effective rate in 2015 differs from the U.S. federal statutory rate due to the effects of the state and Canadian income taxes and non-deductible expenses reported in the statement of operations.
Net Loss
Net loss for the years ended December 31, 2015 and 2014 was $26.0 million and $4.7 million, respectively. On an unaudited pro forma basis assuming the acquisition of all current Subsidiaries occurred on January 1, 2014, net loss for the years ended December 31, 2015 and 2014 was $23.7 million and $4.6 million, respectively.
Liquidity and Capital Resources
Effective December 31, 2015, we entered into a $35.0 million amended and restated senior secured credit facility with BMO Harris Bank N.A. (the "Credit Facility" or the "Amended Credit Facility") which replaces the original Credit Facility with BMO Harris Bank N.A. (the "Original Credit Facility"). The Amended Credit Facility contained substantially the same terms as the Original Credit Facility except for adjustments to covenants which are discussed below. Previous borrowings under the Original Credit Facility remained outstanding under the Amended Credit Facility. The Credit Facility was further amended on June 27, 2016 and August 19, 2016, with retroactive effect to March 31, 2016 and June 30, 2016, respectively, pursuant to which certain financial covenant calculations, which are described below, were further clarified and amended. The Credit Facility consists of $25.0 million that is available as a revolving credit facility,
38
allocated $20.0 million in U.S. revolving loans, with a $7.5 million sublimit for letters of credit, and $5.0 million in Canadian revolving loans, with a $2.5 million sublimit for letters of credit. The remaining $10.0 million has been drawn as a term loan.
Our U.S. borrowings under the Credit Facility bear interest at fluctuating rates, at our election in advance for any applicable interest period, by reference to the "base rate," "Eurodollar rate" or "Canadian Prime Rate" plus the applicable margin within the relevant range of margins provided in the Credit Facility. The base rate is the highest of (i) the rate BMO Harris Bank N.A. announces as its "prime rate," (ii) 0.50% above the rate on overnight federal funds transactions, or (iii) the London Interbank Offered Rate (LIBOR) for an interest period of one month plus 1.00%. The applicable margin is based on our Total Leverage Ratio, as described below. The borrowings were subject to interest rates ranging from 3.57% - 6.50% at December 31, 2016.
The Canadian Dollar borrowings under the Credit Facility bear interest at fluctuating rates at our election in advance for any applicable interest period, by reference to the "Canadian Prime Rate" plus the applicable margin within the relevant range of margins provided in the Credit Facility. The Canadian Prime Rate is the higher of (i) the rate the Bank of Montreal announces as its "reference rate," or (ii) the Canadian Dollar Offered Rate (CDOR) for an interest period equal to the term of any applicable borrowing plus 0.50%. The applicable margin is determined quarterly based on our Total Leverage Ratio, as described below. The maximum and initial margin for interest rates after March 31, 2016 on Canadian borrowings under the Credit Facility is 2.75% on base rate loans.
The Credit Facility is secured by a first-priority perfected security interest in substantially all of our assets and the stock of our domestic subsidiaries, which also guaranty the borrowings, and 66% of the stock of our direct Canadian Subsidiary, Fenix Canada (other than its exchangeable preferred shares). Proceeds of the Credit Facility can be used for capital expenditures, working capital, permitted acquisitions, and general corporate purposes. The Credit Facility expires on May 19, 2020. The Credit Facility contains customary events of default, including the failure to pay any principal, interest or other amount when due, violation of certain of our affirmative covenants or any negative covenants or a breach of representations and warranties and, in certain circumstances, a change of control. Upon the occurrence of an event of default, payment of indebtedness may be accelerated and the lending commitments may be terminated.
The Credit Facility also contains financial covenants with which we must comply on a quarterly or annual basis, which have been amended since entering into the Original Credit Facility, including a Total Funded Debt to EBITDA Ratio (or “Total Leverage Ratio”, as defined). Total Funded Debt as it relates to the Total Leverage Ratio is defined as all indebtedness (a) for borrowed money, (b) for the purchase price of goods or services, (c) secured by assets of Fenix or its Subsidiaries, (d) for any capitalized leases of property, (e) for letters of credit or other extensions of credit, (f) for payments owed regarding equity interests in Fenix or its Subsidiaries, (g) for interest rate, currency or commodities hedging arrangements, or (h) for any guarantees of any of the foregoing as of the end of the most recent fiscal quarter. Consistent with the Original Credit Facility, Permitted Acquisitions are subject to bank review and a maximum Total Leverage Ratio, after giving effect to such acquisition. We must also comply with a minimum Fixed Charge Coverage Ratio. Fixed charge coverage is defined as the ratio of (a) EBITDA less unfinanced capital expenditures for the four trailing quarterly periods to (b) fixed charges (principal and interest payments, taxes paid and other restricted payments); except that for the first three quarters of 2016, for the purposes of determining this ratio, EBITDA will be calculated based on a multiple of the then current EBITDA, instead of using the EBITDA for the prior four quarters. A similar annualization adjustment will be made for unfinanced capital expenditures for the same period. EBITDA includes after tax earnings with add backs for interest expense, income taxes, depreciation and amortization, share-based compensation expenses, and other additional items as outlined in the Credit Facility. In addition, the Credit Facility covenants include a minimum net worth covenant, which was revised effective March 31, 2016. Net worth is defined as the total shareholders’ equity, including capital stock, additional paid in capital, and retained earnings after deducting treasury stock. The Amended Credit Facility includes a mandatory prepayment clause requiring certain cash payments when EBITDA exceeds defined requirements for the most recently completed fiscal year. These prepayments will be applied first to outstanding term loans and then to the revolving credit.
We are also subject to a limitation on our indebtedness based on quarterly calculations of a Borrowing Base. The Borrowing Base is determined based upon Eligible Receivables and Eligible Inventory and is calculated separately for the United States and Canadian borrowings. If the total amount of principal outstanding for revolving loans, term loans, letters of credit and other defined obligations is in excess of the Borrowing Base, then we are required to repay the difference or be in default of the Credit Facility.
As of December 31, 2016, we owed $21.5 million under the Amended Credit Facility (consisting of term loan and revolving credit debt of $8.7 million and $12.8 million, respectively). We also had $6.4 million outstanding in standby letters of credit under the Credit Facility related to the contingent consideration agreement with the former owners of the Canadian Founding Companies and our property and casualty insurance program. As of June 30, 2016, September 30, 2016 and December 31, 2016, for reasons described in Note 1 to the consolidated financial statements in this document, we were in breach of the Credit Facility's Total Leverage Ratio and Fixed Charge Coverage Ratio requirements and the Borrowing Base requirement for repaying over-advances, as well as the requirement for timely delivery of certain quarterly certificates and reports. Since we are in default as of the date that this Annual Report on Form 10-K is being filed, all of the Credit Facility debt is reported as a current liability in the accompanying consolidated balance sheet as of December 31, 2016 and there can be no further borrowings of any availability under the Credit Facility until such defaults are rectified or waived.
39
On March 27, 2017, we entered into a Forbearance Agreement to the Credit Facility (the "Forbearance Agreement") with BMO Harris Bank N.A. and its Canadian affiliate, Bank of Montreal. Pursuant to the Forbearance Agreement, the banks have agreed to forbear from exercising their rights and remedies under the Credit Facility with respect to the above-described defaults and any similar defaults during the forbearance period, provided no other defaults occur. The Forbearance Agreement was amended on June 23, 2017 to extend the forbearance period, which had originally expired on May 26, 2017, until August 31, 2017 and to resolve certain new defaults. The Forbearance Agreement, as amended, also permits us to add the quarterly interest payments otherwise due for the first two quarters of 2017 to the principal amount of debt outstanding and defer the $250,000 principal payments due on March 31, 2017 and June 30, 2017 to the end of the forbearance period.
Our Board of Directors has engaged a financial advisor to advise the Board and Company management and to assist in pursuing a range of potential strategic and financial transactions that will provide us with improved liquidity and maximize shareholder value. The financial advisor will identify and evaluate potential alternatives including a business combination, debt and/or equity financing, or a strategic investment into the Company, and is reporting directly to a special committee of independent directors established to oversee and coordinate these activities. The Board has not set a definitive timetable for completion of this process. There can be no assurance that this process will result in a transaction or other strategic alternative of any kind. Furthermore, the June 29, 2017 suspension in trading and eventual delisting of our common stock on the Nasdaq Global Market negates our ability to pursue strategic and financial transactions available only to listed companies.
If we are unable to reach further agreement with our lenders to obtain waivers or amendments to the existing Credit Facility, find acceptable alternative financing, obtain equity contributions, or arrange a business combination, after the forbearance period (and during the forbearance period in the event of any new defaults other than those anticipated defaults enumerated in the Forbearance Agreement, as amended), our Credit Facility lenders could elect to declare some or all of the amounts outstanding under the facility to be immediately due and payable. If this happens, we do not expect to have sufficient liquidity to pay the outstanding Credit Facility debt. In addition, we have significant obligations under contingent consideration agreements related to certain acquired companies as described below and in Note 6 to the consolidated financial statements in this document, and we will need access to additional credit to be able to satisfy these obligations.
As a result of the above, substantial doubt exists regarding our ability to continue as a going concern, which contemplates continuity of operations, realization of assets and the satisfaction of liabilities in the normal course of business within one year from the date of this filing.
Net cash used in operating activities totaled $1.7 million and $15.8 million for the years ended December 31, 2016 and 2015, respectively. The year ended December 31, 2015 only includes automotive recycling operations from May 19, 2015, the date of the Combinations with the Founding Companies.
Net cash used in investing activities totaled $0.7 million and $105.6 million for the years ended December 31, 2016 and 2015, respectively. Investing activities in the year ended December 31, 2016 consisted primarily of the cash used to make $0.6 million of capital expenditures associated with our automotive recycling operations. Investing activities in the year ended December 31, 2015 consisted primarily of the cash used to purchase the Subsidiaries of $105.2 million and $0.3 million of capital expenditures after the acquisitions.
Net cash provided by financing activities totaled $0.4 million and $123.7 million for the years ended December 31, 2016 and 2015, respectively. During the year ended December 31, 2016, we borrowed a net of $0.7 million on our Credit Facility. During the year ended December 31, 2015, we raised $101.3 million in net proceeds from the IPO and borrowed a net of $20.8 million on our Credit Facility.
At present, our primary source of ongoing liquidity is cash flows from our operations. Payroll and the procurement of inventory are our largest operating uses of funds. We normally pay for vehicles acquired at salvage auctions and under some direct procurement arrangements at the time that possession is taken of the vehicles. We are unable to access any available credit under the Credit Facility unless and until we are able to reach agreement with our lenders to favorably resolve the current events of default.
Over the next 12 months, in addition to any working capital needs, a modest amount of necessary capital expenditures, debt service on the term loan as discussed above, and accrued federal and state income tax payments of approximately $1.5 million to be made when the applicable 2016 tax returns are filed, we are also likely to have a need for cash to satisfy certain contingent consideration liabilities, as described more fully in Note 6 to the consolidated financial statements in this document. As part of the consideration for three of the Founding Companies, we entered into contingent consideration agreements with certain of the selling shareholders under which additional consideration will be payable to the former owners in cash and stock if specified future events occur or conditions are met, such as meeting profitability or earnings targets. We have recorded a current liability of $7.2 million for the estimated fair value of these contractual commitments in the accompanying consolidated balance sheet as of December 31, 2016, which, if earned, would all be payable over the next 12 months. Approximately $0.6 million of this potential liability is payable in stock (valued at the closing price of our common stock on December 31, 2016) and $2.9 million of the recorded liability is secured by a letter of credit totaling $5.9 million under our Credit Facility. The remainder would be payable in cash, of which $0.2 million is currently held in an escrow account as described below.
40
For the Combination with Jerry Brown, we are required to pay (a) up to an additional $1.8 million if the business achieved certain revenue targets during the twelve-month period beginning June 2015, and (b) an additional uncapped amount if the business exceeds certain EBITDA levels during 2016. Based on an evaluation of the likelihood of meeting these performance targets, we recorded a liability for the acquisition date fair value of the contingent consideration of $2.5 million and increased this liability by $5.1 million during 2015 based on substantial operating improvements and management’s budget for Jerry Brown for 2016. Based on results actually achieved during 2016, the estimated fair value of the contingent liability was reduced by $3.8 million, resulting in a credit to income which is reflected in the consolidated statement of operations for the year ended December 31, 2016. As of December 31, 2016, the total contingent consideration liability attributable to the Jerry Brown acquisition was (a) $1.8 million for achieving the revenue target, which management and the former owners of Jerry Brown agree was fully earned and is currently due and payable, and (b) $2.0 million estimated for the EBITDA target which will be determined in 2017. We are in negotiations with the former owners of Jerry Brown to schedule payment of currently due amounts, and we expect to fund these and future determined payments to the former owners of Jerry Brown, to the extent they are ultimately deemed earned, through cash generated from operations or, if necessary and available, through draws on the revolving Credit Facility or through other sources of capital that may be available.
The Combination Agreements for Eiss Brothers and the Canadian Founding Companies provide for a holdback of additional Combination Consideration which will be payable, in part or in whole, only if certain performance hurdles are achieved. The maximum amount of additional consideration that can be earned by the former owners of Eiss Brothers is $0.2 million in cash plus 11,667 shares of our common stock, of which none, some or all will be released from escrow depending upon the EBITDA of Eiss Brothers during the twelve-month period beginning June 2015. The maximum amount of additional consideration that can be earned and is subject to holdback for the Canadian Founding Companies is $5.9 million in cash, secured by a letter of credit under our Credit Facility, plus 280,000 Exchangeable Preferred Shares currently held in escrow, of which, none, some or all will be released to the former owners of the Canadian Founding Companies depending on their combined revenues from specific types of sales for the twelve-month period beginning June 2015. Based on management’s evaluation of the likelihood of meeting these performance targets for these two acquisitions, a liability of $7.8 million was recorded at the acquisition date for the fair value of the aggregate contingent consideration, which included the present value of the estimated cash portion and the then-current value of the Fenix common stock and the Exchangeable Preferred Shares held in escrow. While management’s estimate of the operating results for Eiss Brothers has not changed since its acquisition, the contingent consideration for the Canadian Founding Companies was remeasured at fair value each reporting period during the year ended December 31, 2016. As the amount of the contingent consideration is currently in dispute, we recorded the estimated contingent consideration liability for the Canadian Founding Companies as of December 31, 2016 based on the result of our assessment of the possible outcomes. These contingent consideration liabilities are also subject to mark-to-market fluctuations based on changes in the trading price of our common stock and, with respect to the Canadian Founding Companies, currency remeasurement. As a result of all these factors, the estimated fair value of the aggregate contingent consideration liability due to the former owners of Eiss Brothers and the Canadian Founding Companies was reduced by $4.3 million, and an exchange rate gain of $0.5 million was recognized in the consolidated statement of operations for the year ended December 31, 2016. We are currently at an impasse with the former owners of the Canadian Founding Companies regarding the calculation of contingent consideration earned, if any, and the parties have begun the process of submitting their respective calculations to binding arbitration. We expect that any contingent consideration payments to the former owners of the Canadian Founding Companies, to the extent they are ultimately deemed earned, will be drawn on the bank letter of credit, which is considered Funded Debt under the Total Leverage Ratio required under our Credit Facility.
Management has been and remains highly focused on maximizing cash flows from operations and, to the extent possible under the circumstances, minimizing the cost of outsourced professional fees. Although scrap metal prices increased during 2016 and have increased slightly further since December 31, 2016, and our expectation is that the current high level of professional fees should decline after the first half of 2017, we still may not be able to comply with all the financial covenants contained in our Credit Facility in future periods unless those requirements are waived or amended or unless we can reduce the amount of Credit Facility debt by obtaining new subordinated debt or equity financing. While our Board of Directors has engaged a financial advisor to advise the Board and Company management and to assist in pursuing a range of potential strategic and financial transactions that will provide us with improved liquidity and maximize shareholder value, there can be no assurance that this process will result in a transaction or other strategic alternative of any kind. In addition, there can be no assurance that additional funding, or refinancing of our Credit Facility, will be available on terms attractive to us, or at all. Furthermore, any additional equity financing may be dilutive to stockholders, and debt financing, if available, may be costly and involve further restrictive covenants. Failure to raise capital or consummate a strategic investment into the Company or a business combination could have a material adverse impact on our business, operating results, and financial condition.
Contractual Obligations and Commercial Commitments
Operating leases with the former owners of the Subsidiaries or their affiliates have terms of 15 years with options for additional renewals. The sublease for corporate office space has a term of May 1, 2015 to September 30, 2018. Cash payments for rent under these leases, future payments on debt (principal only) and consulting obligations, and future contingent consideration payments described above by year are:
41
Payments Due By Period as of December 31, 2016 | |||||||||||||||||||
(in thousands) | Total | 1 Year or less | 2-3 Years | 4-5 Years | More Than 5 Years | ||||||||||||||
Operating leases | $ | 38,941 | $ | 2,604 | $ | 5,160 | $ | 5,331 | $ | 25,846 | |||||||||
Current debt | 21,094 | 21,094 | — | — | — | ||||||||||||||
Consulting obligations | 1,226 | 394 | 201 | 100 | 531 | ||||||||||||||
Contingent consideration liabilities | 7,156 | 7,156 | — | — | — | ||||||||||||||
Total | $ | 68,417 | $ | 31,248 | $ | 5,361 | $ | 5,431 | $ | 26,377 | |||||||||
Operating leases — See Note 12 to the consolidated financial statements in this document for discussion of facility leases with the former owners of the Subsidiaries.
Current debt — Current debt consists of amounts owed under our Credit Facility. See Note 5, to the consolidated financial statements in this document for a summary of the amended and restated Credit Facility and reasons why this debt is all classified as a current liability.
Consulting obligations — Consulting obligations reflect non-substantive (future performance not required) consulting arrangements with former owners as agreed to during the Combinations with the Founding Companies.
Contingent consideration liabilities — Represents the estimated fair value of contingent consideration arrangements with the former owners of three Founding Companies as of December 31, 2016. Under these arrangements, the former owners of the Canadian Founding Companies and Eiss can earn up to an aggregate of $6.1 million in cash, 11,667 shares of Fenix common stock and 280,000 Exchangeable Preferred Shares. The former owners of Jerry Brown can earn up to an additional $1.8 million in cash if the business achieves certain revenue targets during the twelve-month period beginning June 2015, and an additional, uncapped amount if the business exceeds certain EBITDA levels during 2016. The estimated fair value of the contingent consideration liabilities at the Combination date was based on independent valuations considering our projections for the relevant Founding Companies, the respective target levels, the relative weighting of various future scenarios and a discount rate of approximately 5.0%. Subsequent to the Combination, we periodically review the amount of contingent consideration that is likely to be payable under current operating conditions and adjust the estimated liability as deemed necessary. See Note 6 to the consolidated financial statements in this document. The changes in the estimated fair value of this Combination liability resulted in a benefit of $8.2 million as compared to a net charge of $6.0 million for the years ended December 31, 2016 and 2015, respectively.
Off-Balance Sheet Arrangements — We have a $6.4 million standby letters of credit outstanding under our Credit Facility at December 31, 2016 to support contingent consideration that may be payable under the Combination Agreement for the Canadian Founding Companies ($5.9 million) and our property and casualty insurance program ($0.5 million). Other than this standby letter of credit and the operating lease commitments included above, we have no off-balance sheet arrangements that would have a current or future material effect on our financial condition, changes in financial condition, revenue, expense, results of operations, liquidity, capital expenditures or capital resources.
Inflation — We believe that inflation has not had a significant impact in the past and is not likely to have a significant impact in the foreseeable future on our results of operations.
Beagell Group
Overview
The Beagell Group, a co-predecessor, includes three commonly-controlled companies: Don’s, Gary’s and Horseheads. Don’s and Gary’s were founded in 1979 in Binghamton, New York, and Horseheads was founded in 1990 in Elmira, New York. Don’s sells recycled OEM products through its two full-service dismantling and distribution facilities located in Binghamton, New York and Pennsburg, Pennsylvania. As of May 18, 2015, Don’s operated a total of six dismantling bays and had approximately 81 full-time employees. Gary’s and Horseheads sell recycled OEM products through their self-service facilities in Binghamton and Elmira, New York. As of May 18, 2015, Gary’s and Horseheads together had approximately 39 employees.
Results of Operations for the period from January 1, 2015 to May 18, 2015 Compared to the Year Ended December 31, 2014
Revenue decreased by $19.5 million, or 63.7% to $11.1 million for the period from January 1, 2015 to May 18, 2015 from $30.6 million for the year ended December 31, 2014. Cost of goods sold decreased by $12.5 million, or 62.8%, to $7.4 million for the period from January 1, 2015 to May 18, 2015 from $19.9 million for the year ended December 31, 2014. As a percentage of revenue, cost of goods sold increased to 66.6% of revenue for the period from January 1, 2015 to May 18, 2015 compared to 65.0% of revenue for the year ended December 31, 2014. Operating expenses decreased by $5.1 million, or 61.7%, to $3.2 million for the period from January 1, 2015 to May 18, 2015 from $8.3 million for the year ended December 31, 2014. The primary reason for these changes is the reduced number of days in the 2015 period compared to 2014.
Liquidity and Capital Resources
Prior to its acquisition by Fenix Parts on May 19, 2015, the primary source of ongoing liquidity for Beagell Group was cash flows from operations and the primary use of cash was the payment of distributions to the then-shareholders. Also, during the period from January 1, 2015 to May 18, 2015, $0.6 million in cash was provided by the liquidation of life insurance policies.
42
Standard Group
Overview
Standard Auto Wreckers, Inc., was founded in 2005, in Niagara Falls, New York; End of Life Vehicles Inc. was founded in 2007 in Toronto, Ontario; Goldy Metals Incorporated was founded in 1979 in Toronto, Ontario; and Goldy Metals (Ottawa) Incorporated was founded in 2013 in Ottawa, Ontario. We collectively refer to Standard Auto Wreckers, Inc. and its three Canadian affiliates as "Standard" and consider it a co-predecessor company.
Standard sells recycled OEM products through three full-service dismantling and distribution facilities located in Niagara Falls, New York; Port Hope, Ontario; and Ottawa, Ontario. As of May 18, 2015, Standard operated a total of 22 dismantling bays and had 191 full-time employees. Ottawa facilities run self-service operations adjacent to the full-service operation. An additional full-service dismantling and distribution facility with 12 dismantling bays were added in Port Hope, Ontario in 2014 to replace the Scarborough full-service operation and allow for the expansion of the self-service operation.
Results of Operations for the period from January 1, 2015 to May 18, 2015 Compared to the Year Ended December 31, 2014
Revenue decreased by $22.2 million, or 71.4%, to $8.9 million for the period from January 1, 2015 to May 18, 2015 from $31.1 million for the year ended December 31, 2014. Cost of goods sold decreased by $13.7 million, or 69.6%, to $6.0 million for the period from January 1, 2015 to May 18, 2015 from $19.7 million for the year ended December 31, 2014. As a percentage of revenue, cost of goods sold increased to 67.3% of revenue for the period from January 1, 2015 to May 18, 2015 compared to 63.3% of revenue for the year ended December 31, 2014. Operating expenses decreased by $6.1 million, or 64.5%, to $3.4 million for the period from January 1, 2015 to May 18, 2015 from $9.5 million for the year ended December 31, 2014. The primary reason for these changes is the reduced number of days in the 2015 period compared to 2014.
Liquidity and Capital Resources
Prior to its acquisition by Fenix Parts on May 19, 2015, the primary source of ongoing liquidity for Standard was cash flows from operations. As described in Note 6, Fire at Toronto Facility, to the combined financial statements in this document, a fire occurred at the Goldy Metals Toronto facility in March 2014 which destroyed the dismantling facility and a substantial portion of the location’s inventory. Standard received substantial insurance proceeds during the year ended December 31, 2014, which were primarily used to fund capital expenditures of $2.1 million during the period to build a new facility in Port Hope.
ITEM 7A – Quantitative and Qualitative Disclosures about Market Risk
Our results of operations are exposed to market risk related to price fluctuations in scrap metal and other metals. Market prices of these metals affect the amount that we pay for our inventory as well as the revenue that we generate from sales of these metals. As both our revenue and costs are affected by the price fluctuations, we have a natural hedge against the changes. However, there is typically a lag between the effect on our revenue from metal price fluctuations and inventory cost changes. Therefore, we can experience positive or negative gross margin effects in periods of rising or falling metal prices, particularly when such prices move rapidly. If market prices fall at a greater rate than our vehicle acquisition costs, as occurred during 2015 and especially in the fourth quarter of 2015, we experience a decline in our reported gross margins. We have not entered into any risk mitigation strategies, as any short-term exposure would reverse in the long term.
Interest Rates
Our results of operations are affected by changes in interest rates with respect to borrowings under our Credit Facility. As of December 31, 2015, the interest rates on our borrowings denominated in both U.S. and Canadian dollars had been 2.5%. In accordance with the loan indenture, these rates increased under the formula therein to 5.75% and 5.2% on the U.S. dollar and Canadian dollar debt, respectively. Both of these rates are the maximum rate allowed under the indentures, so no further increase is expected. However, as we are currently in default of several of the terms of the Credit Facility and operating under a Forbearance Agreement with our lenders, it is impossible to forecast what likely future interest charges may be or in what manner the conditions of default will ultimately be resolved. At December 31, 2016, none of our variable interest rate debt under our Credit Facility is hedged. A 100 basis point movement in interest rates would change interest expense by approximately $0.2 million over the next twelve months.
Foreign Exchange
Our operations in Canada are exposed to changes in the relationship between the U.S. dollar and the Canadian dollar. As both our revenue and costs are affected by the price fluctuations, we have a natural hedge against the changes. Canadian dollar fluctuations can also impact the financial results we report in U.S. dollars and can impact the economics of cross-border trading of inventory between our U.S. and Canadian operations. Because of the significant increase in the value of the U.S Dollar against the Canadian Dollar during 2015, in the fourth quarter of 2015 and continuing through 2016, we substantially reduced shipments of parts from our U.S. facilities into the Canadian markets resulting in lower revenue at our Canadian facilities as they sought to develop Canadian sources to acquire vehicles and product for recycling. Our operations in Canada represented approximately 13% and 19% of our total net revenues during 2016 and 2015,
respectively. At the current relative distribution of net revenues and expenses, a 10% increase or decrease in the strength of the U.S. dollar against the Canadian dollar would have resulted in a change of approximately 1.3% in our consolidated net revenues and 1.9% in our consolidated loss before income taxes reported for the year ended December 31, 2016.
We do not hold derivative contracts to hedge Canadian dollar risk. Our net revenue is partially hedged by our Canadian dollar denominated purchases. We elected not to hedge the Canadian dollar risk related to the interest payments on Canadian borrowings as we generate cash flows in Canadian dollars that were used to fund these debt payments. As of December 31, 2016, we have C$1.2 million in revolving credit borrowings outstanding under our Credit Facility.
ITEM 8 – FINANCIAL STATEMENTS AND SUPPLEMENTARY DATA
Report of Independent Registered Public Accounting Firm
Board of Directors and Stockholders
Fenix Parts, Inc.
Westchester, IL
We have audited the accompanying consolidated balance sheet of Fenix Parts, Inc. as of December 31, 2016 and the related consolidated statements of operations, comprehensive loss, stockholders’ equity, and cash flows for the year ended December 31, 2016. These financial statements are the responsibility of the Company’s management. Our responsibility is to express an opinion on these financial statements based on our audit.
We conducted our audit in accordance with the standards of the Public Company Accounting Oversight Board (United States). Those standards require that we plan and perform the audit to obtain reasonable assurance about whether the financial statements are free of material misstatement. The Company is not required to have, nor were we engaged to perform, an audit of its internal control over financial reporting in accordance with standards of the Public Company Accounting Oversight Board (United States). Our audit included consideration of internal control over financial reporting as a basis for designing audit procedures that are appropriate in the circumstances, but not for the purpose of expressing an opinion on the effectiveness of the Company's internal control over financial reporting in accordance with the standards of the Public Company Accounting Oversight Board (United States). Accordingly, we express no such opinion. An audit includes examining, on a test basis, evidence supporting the amounts and disclosures in the consolidated financial statements. An audit also includes assessing the accounting principles used and significant estimates made by management, as well as evaluating the overall consolidated financial statement presentation. We believe that our audit provides a reasonable basis for our opinion.
In our opinion, the consolidated financial statements referred to above present fairly, in all material respects, the financial position of Fenix Parts, Inc. at December 31, 2016, and the results of its operations and its cash flows for the year ended December 31, 2016 in conformity with U.S. generally accepted accounting principles.
As discussed in Note 3 to the consolidated financial statements, in 2016 the Company adopted ASU No. 2014-15 Presentation of Financial Statements - Going Concern. As discussed in Note 1 to the consolidated financial statements, the Company has incurred recurring losses from operations, was out of compliance with certain of its credit facility covenants during 2016 and has been operating under forbearance agreements with its lender, with the latest forbearance agreement maturing on August 31, 2017. The Company does not have sufficient liquidity to make full payment on the debt. These factors raise substantial doubt about the Company's ability to continue as a going concern. Management’s plans in regard to these matters are also described in Note 1. The consolidated financial statements do not include any adjustments that might result from the outcome of this uncertainty. Our opinion is not modified with respect to these matters.
/s/ Crowe Horwath LLP
Oak Brook, IL
August 15, 2017
45
Report of Independent Registered Public Accounting Firm
Board of Directors and Stockholders
Fenix Parts, Inc.
Westchester, IL
We have audited the accompanying consolidated balance sheet of Fenix Parts, Inc. as of December 31, 2015 and the related consolidated statements of operations, comprehensive loss, stockholders' equity, and cash flows for the year ended December 31, 2015 and the period from January 2, 2014 (inception) to December 31, 2014. These financial statements are the responsibility of the Company's management. Our responsibility is to express an opinion on these financial statements based on our audits.
We conducted our audits in accordance with the standards of the Public Company Accounting Oversight Board (United States). Those standards require that we plan and perform the audit to obtain reasonable assurance about whether the financial statements are free of material misstatement. The Company is not required to have, nor were we engaged to perform, an audit of its internal control over financial reporting. Our audits included consideration of internal control over financial reporting as a basis for designing audit procedures that are appropriate in the circumstances, but not for the purpose of expressing an opinion on the effectiveness of the Company’s internal control over financial reporting. Accordingly, we express no such opinion. An audit also includes examining, on a test basis, evidence supporting the amounts and disclosures in the consolidated financial statements, assessing the accounting principles used and significant estimates made by management, as well as evaluating the overall consolidated financial statement presentation. We believe that our audits provide a reasonable basis for our opinion.
In our opinion, the consolidated financial statements referred to above present fairly, in all material respects, the financial position of Fenix Parts, Inc. at December 31, 2015, and the results of its operations and its cash flows for the year ended December 31, 2015 and the period from January 2, 2014 (inception) to December 31, 2014, in conformity with accounting principles generally accepted in the United States of America.
/s/ BDO USA LLP
Chicago, IL
April 14, 2016
46
Fenix Parts, Inc.
CONSOLIDATED BALANCE SHEETS
(In thousands, except share data) | December 31, 2016 | December 31, 2015 | ||||
ASSETS | ||||||
Current assets: | ||||||
Cash and cash equivalents | $ | 738 | $ | 2,827 | ||
Accounts receivable, net of allowance | 7,203 | 6,834 | ||||
Inventories | 32,568 | 38,892 | ||||
Prepaid expenses and other current assets | 435 | 545 | ||||
Total current assets | 40,944 | 49,098 | ||||
Property and equipment, net | 10,089 | 11,609 | ||||
Goodwill | 37,027 | 76,812 | ||||
Intangible assets, net | 32,211 | 33,786 | ||||
Indemnification receivables | 2,009 | 5,078 | ||||
Other non-current assets | 3,117 | 3,455 | ||||
TOTAL ASSETS | $ | 125,397 | $ | 179,838 | ||
LIABILITIES | ||||||
Current liabilities: | ||||||
Account payable | $ | 4,955 | $ | 3,456 | ||
Accrued expenses | 4,800 | 2,847 | ||||
Contingent consideration liabilities - current | 7,156 | 9,345 | ||||
Current portion of long-term debt under Credit Facility | 21,094 | 793 | ||||
Other current liabilities | 1,899 | 2,058 | ||||
Total current liabilities | 39,904 | 18,499 | ||||
Deferred warranty revenue, net of current portion | 558 | 227 | ||||
Long-term related party debt, net of current portion | 832 | 2,071 | ||||
Long-term debt under Credit Facility, net of current portion | — | 19,645 | ||||
Contingent consideration liabilities, net of current portion | — | 6,085 | ||||
Deferred income tax liabilities | 8,170 | 15,624 | ||||
Reserve for uncertain tax positions | 2,180 | 5,733 | ||||
Other non-current liabilities | 3,124 | 2,170 | ||||
Total non-current liabilities | 14,864 | 51,555 | ||||
TOTAL LIABILITIES | 54,768 | 70,054 | ||||
COMMITMENTS AND CONTINGENCIES | ||||||
SHAREHOLDERS’ EQUITY | ||||||
Common stock, $0.001 par value; 30,000,000 shares authorized; 20,038,489 and 19,926,868 shares issued and outstanding at December 31, 2016 and 2015, respectively | 20 | 20 | ||||
Additional paid-in capital | 139,193 | 136,398 | ||||
Accumulated other comprehensive loss | (3,328 | ) | (4,247 | ) | ||
Accumulated deficit | (73,656 | ) | (30,787 | ) | ||
Total Fenix Parts, Inc. shareholders’ equity before noncontrolling interest | 62,229 | 101,384 | ||||
Noncontrolling interest | 8,400 | 8,400 | ||||
Total shareholders’ equity | 70,629 | 109,784 | ||||
TOTAL LIABILITIES AND SHAREHOLDERS’ EQUITY | $ | 125,397 | $ | 179,838 | ||
The accompanying notes to the consolidated financial statements are an integral part of these statements.
47
Fenix Parts, Inc.
CONSOLIDATED STATEMENTS OF OPERATIONS
(In thousands, except share data) | Year Ended December 31, 2016 | Year Ended December 31, 2015 | Period from January 2, 2014 (Inception) to December 31, 2014 | ||||||||
Net revenues | $ | 132,100 | $ | 68,946 | $ | — | |||||
Cost of goods sold | 78,641 | 53,559 | — | ||||||||
Gross profit | 53,459 | 15,387 | — | ||||||||
Selling, general and administrative expenses | 49,888 | 28,346 | 232 | ||||||||
Outside service and professional fees | 6,741 | 9,091 | 4,515 | ||||||||
Depreciation and amortization | 4,601 | 2,743 | — | ||||||||
Change in fair value of contingent consideration liabilities | (8,234 | ) | 6,050 | — | |||||||
Change in indemnification receivable | 2,920 | — | — | ||||||||
Goodwill impairment | 45,300 | — | — | ||||||||
Operating loss | (47,757 | ) | (30,843 | ) | (4,747 | ) | |||||
Interest expense | (1,384 | ) | (263 | ) | — | ||||||
Other (expense) income, net | (14 | ) | (1,959 | ) | 1 | ||||||
Total other expense, net | (1,398 | ) | (2,222 | ) | 1 | ||||||
Loss before income tax benefit | (49,155 | ) | (33,065 | ) | (4,746 | ) | |||||
Benefit for income taxes | 6,286 | 7,024 | — | ||||||||
Net loss | $ | (42,869 | ) | $ | (26,041 | ) | $ | (4,746 | ) | ||
Loss per share available to common shareholders: | |||||||||||
Basic & Diluted | $ | (2.05 | ) | $ | (1.86 | ) | $ | (2.22 | ) | ||
Weighted average common shares outstanding: | |||||||||||
Basic & Diluted | 19,869,316 | 13,332,691 | 2,142,994 | ||||||||
CONSOLIDATED STATEMENTS OF COMPREHENSIVE LOSS | |||||||||||
Net loss | $ | (42,869 | ) | $ | (26,041 | ) | $ | (4,746 | ) | ||
Foreign currency translation adjustment | 919 | (4,247 | ) | — | |||||||
Net comprehensive loss | $ | (41,950 | ) | $ | (30,288 | ) | $ | (4,746 | ) | ||
The accompanying notes to the consolidated financial statements are an integral part of these statements.
48
Fenix Parts, Inc.
CONSOLIDATED STATEMENTS OF SHAREHOLDERS’ EQUITY
(In thousands, except share data) | Common Stock | Additional paid-in capital | Accumulated other comprehensive loss | Accumulated deficit | Noncontrolling interest | Total shareholders equity | ||||||||||||||||||||
Shares | Amount | |||||||||||||||||||||||||
Balance at January 2, 2014 (inception) | — | $ | — | $ | — | $ | — | $ | — | $ | — | $ | — | |||||||||||||
Shareholder contributions | 2,429,333 | 2 | 3,616 | — | — | — | 3,618 | |||||||||||||||||||
Net loss | — | — | — | — | (4,746 | ) | — | (4,746 | ) | |||||||||||||||||
Balance at December 31, 2014 | 2,429,333 | $ | 2 | $ | 3,616 | $ | — | $ | (4,746 | ) | $ | — | $ | (1,128 | ) | |||||||||||
Shareholder contributions prior to initial public offering | 319,594 | — | 3,904 | — | — | — | 3,904 | |||||||||||||||||||
Net proceeds from initial public offering | 13,800,000 | 14 | 101,265 | — | — | — | 101,279 | |||||||||||||||||||
Issuance of Fenix shares for Combination Consideration | 3,083,962 | 3 | 24,568 | — | — | — | 24,571 | |||||||||||||||||||
Issuance of Fenix Canada preferred shares to non-controlling interest for Combination Consideration | — | — | — | — | — | 8,400 | 8,400 | |||||||||||||||||||
Compensation for pre-IPO services | 20,000 | — | 217 | — | — | — | 217 | |||||||||||||||||||
Leesville retention bonus | 271,111 | 1 | 1,378 | — | — | — | 1,379 | |||||||||||||||||||
Share based compensation to employees and directors | 2,868 | — | 1,450 | — | — | — | 1,450 | |||||||||||||||||||
Foreign currency translation adjustment | — | — | — | (4,247 | ) | — | — | (4,247 | ) | |||||||||||||||||
Net loss | — | — | — | — | (26,041 | ) | — | (26,041 | ) | |||||||||||||||||
Balance at December 31, 2015 | 19,926,868 | $ | 20 | $ | 136,398 | $ | (4,247 | ) | $ | (30,787 | ) | $ | 8,400 | $ | 109,784 | |||||||||||
Leesville retention bonus | — | — | 790 | — | — | — | 790 | |||||||||||||||||||
Share based compensation to employees and directors | 65,039 | — | 1,847 | — | — | — | 1,847 | |||||||||||||||||||
Employee Stock Purchase Plan | 46,582 | — | 158 | — | — | — | 158 | |||||||||||||||||||
Foreign currency translation adjustment | — | — | — | 919 | — | — | 919 | |||||||||||||||||||
Net loss | — | — | — | — | (42,869 | ) | — | (42,869 | ) | |||||||||||||||||
Balance at December 31, 2016 | 20,038,489 | $ | 20 | $ | 139,193 | $ | (3,328 | ) | $ | (73,656 | ) | $ | 8,400 | $ | 70,629 | |||||||||||
The accompanying notes to the consolidated financial statements are an integral part of these statements.
49
Fenix Parts, Inc.
CONSOLIDATED STATEMENTS OF CASH FLOWS
(In thousands) | Year Ended December 31, 2016 | Year Ended December 31, 2015 | Year Ended December 31, 2014 | ||||||||
Cash flows from operating activities | |||||||||||
Net loss | $ | (42,869 | ) | $ | (26,041 | ) | $ | (4,746 | ) | ||
Adjustments to reconcile net loss to net cash used in operating activities | |||||||||||
Depreciation and amortization | 5,657 | 3,571 | — | ||||||||
Share-based compensation expense | 2,637 | 3,046 | — | ||||||||
Deferred income taxes | (4,460 | ) | (8,662 | ) | — | ||||||
Deferral of warranty sales | 836 | 772 | — | ||||||||
Non-cash rent expense | 1,083 | 567 | — | ||||||||
Reversal of reserves for uncertain tax positions | (3,404 | ) | — | — | |||||||
Reduction in indemnification receivables | 2,920 | — | — | ||||||||
Amortization of inventory fair value adjustment | 1,402 | 8,585 | — | ||||||||
Retrospective inventory opening balance sheet adjustment | (2,221 | ) | — | — | |||||||
Lower value of acquired inventory | (1,777 | ) | — | — | |||||||
Change in fair value of contingent consideration liabilities | (8,234 | ) | 6,050 | — | |||||||
Make whole provision for pre-IPO investors | — | 1,827 | — | ||||||||
Loss on disposal of fixed assets | 221 | — | — | ||||||||
Goodwill impairment | 45,300 | — | — | ||||||||
Change in assets and liabilities, net of acquired businesses in 2015: | |||||||||||
Accounts receivable | (273 | ) | (4,760 | ) | — | ||||||
Inventories | (1,633 | ) | (276 | ) | — | ||||||
Prepaid expenses and other current assets | 405 | 647 | (397 | ) | |||||||
Accounts payable | 1,490 | (806 | ) | 1,673 | |||||||
Accrued expenses | 2,272 | (1,046 | ) | 304 | |||||||
Other current liabilities | (270 | ) | — | — | |||||||
Due to related parties | (799 | ) | 776 | — | |||||||
Net cash used in operating activities | (1,717 | ) | (15,750 | ) | (3,166 | ) | |||||
Cash flows from investing activities | |||||||||||
Capital expenditures | (592 | ) | (330 | ) | — | ||||||
Purchases of companies, net of cash acquired | (149 | ) | (105,224 | ) | — | ||||||
Net cash used in investing activities | (741 | ) | (105,554 | ) | — | ||||||
Cash flows from financing activities | |||||||||||
Net proceeds from initial public offering | — | 101,279 | — | ||||||||
Net proceeds from other issuances of common stock | — | 2,077 | 3,619 | ||||||||
Borrowings on revolving credit line | 1,615 | 21,200 | — | ||||||||
Payments on term loan | (960 | ) | (375 | ) | — | ||||||
Proceeds from the Employee Stock Purchase Plan | 237 | — | — | ||||||||
Debt issuance cost | (102 | ) | (438 | ) | — | ||||||
Additional financing payments | (428 | ) | — | — | |||||||
Net cash provided by financing activities | 362 | 123,743 | 3,619 | ||||||||
Effect of foreign exchange fluctuations on cash and cash equivalents | 7 | (65 | ) | — | |||||||
(Decrease) increase in cash and cash equivalents | (2,089 | ) | 2,374 | 453 | |||||||
Cash and cash equivalents, beginning of period | 2,827 | 453 | — | ||||||||
Cash and cash equivalents, end of period | $ | 738 | $ | 2,827 | $ | 453 | |||||
50
Supplemental cash flow disclosures: | |||||||||||
Cash paid for interest | $ | 1,044 | $ | 229 | $ | — | |||||
Cash paid for income taxes | $ | 497 | $ | 129 | $ | — | |||||
Noncash transactions: | |||||||||||
Equity issued for purchases of the Subsidiaries | $ | — | $ | 32,971 | $ | — | |||||
Accrued non-substantive consulting fees for acquisitions | $ | — | $ | 1,787 | $ | — | |||||
Note related to Go Pull-it | $ | — | $ | 200 | $ | — | |||||
Off market lease net asset from acquisitions | $ | — | $ | 1,538 | $ | — | |||||
Accrued contingent consideration for acquisitions | $ | — | $ | 10,237 | $ | — | |||||
The accompanying notes to the consolidated financial statements are an integral part of these statements.
51
Fenix Parts, Inc.
NOTES TO CONSOLIDATED FINANCIAL STATEMENTS (in thousands, except share and per share amounts)
Note 1. Description of Business and Financial Condition
Description of Business
Fenix Parts, Inc. and subsidiaries ("Fenix" or the "Company") are in the business of automotive recycling, which is the recovery and resale of original equipment manufacturer ("OEM") parts, components and systems, such as engines, transmissions, radiators, trunks, lamps and seats (referred to as "products") reclaimed from damaged, totaled or low value vehicles. The Company purchases its vehicles primarily at auto salvage auctions. Upon receipt of vehicles, the Company inventories and then dismantles the vehicles and sells the recycled products. The Company’s customers include collision repair shops (body shops), mechanical repair shops, auto dealerships and individual retail customers. The Company also generates a portion of its revenue from the sale as scrap of unusable parts and materials, from the sale of used cars and motorcycles, the sale of aftermarket parts, and from the sale of extended warranty contracts.
Fenix Parts, Inc. was founded on January 2, 2014, to acquire and combine companies in the automobile recycling and resale industry. Fenix Parts Canada, Inc. (“Fenix Canada”), a wholly-owned subsidiary of Fenix, was established on September 24, 2014 primarily to facilitate the acquisition and combination of companies in the automobile recycling and resale industry in Canada. Through November 2014, Fenix and Fenix Canada entered into Combination Agreements to acquire the eleven corporate entities that operate eight businesses (the "Founding Companies") contingent upon, among other things, the closing of an initial public offering of common stock (the "IPO"). On May 19, 2015, Fenix completed the IPO and closed on the combinations with the Founding Companies (the "Combinations"), including those Founding Companies that are designated as accounting co-predecessors. Fenix raised the cash portion of the Combination Consideration in its IPO as well as from additional funding from indebtedness. During the third and fourth quarters of 2015, Fenix acquired three additional automobile recycling companies ("Subsequent Acquisitions"). The Founding Companies and Subsequent Acquisitions represent Fenix's operating subsidiaries ("Subsidiaries"). The operations of the Founding Companies are reflected in the consolidated statements of operations from the date of acquisition on May 19, 2015. The Subsequent Acquisitions are reflected in the consolidated statements of operations from their respective dates of acquisition. The aggregate consideration paid for the Combinations and Subsequent Acquisitions and pro forma financial data is detailed in Note 4.
Liquidity and Financial Condition
Since its inception, the Company's primary sources of ongoing liquidity are cash flows from operations, cash provided by bank borrowings, proceeds from private stock sales, and the $101.3 million in net proceeds from its initial public offering ("IPO") of common stock completed in May 2015. The Company has incurred operating losses since its inception and expects to continue to report operating losses for the foreseeable future as it integrates the subsidiaries it has acquired (see Note 4 below) and amortizes asset write-ups and intangibles assets established at acquisition. The Company may never become profitable if it cannot successfully integrate and grow the acquired operations and reduce the level of outside professional fees that have been incurred during 2015 and 2016. During the year ended December 31, 2016, the Company recorded a net loss of $42.9 million, and cash used in operating activities was $1.7 million. During the year ended December 31, 2016, goodwill was impaired $45.3 million (see Note 11 below), somewhat offset by the favorable impact on costs of goods sold attributable to an adjustment to the value assigned to acquired inventories (see Note 4 below) and reductions in the estimated fair value of contingent consideration liabilities (see Note 6 below). As of December 31, 2016, the Company had an accumulated deficit of $73.7 million.
Effective December 31, 2015, the Company entered into a $35 million amended and restated senior secured credit facility with BMO Harris Bank N.A. and its Canadian affiliate, Bank of Montreal (the "Amended Credit Facility" or "Credit Facility") (see Note 5 below for further details) which replaced the original Credit Facility with them (the "Original Credit Facility"). The Amended Credit Facility contained substantially the same terms as the Original Credit Facility except for adjustments to covenants which are discussed in Note 5, below. Previous borrowings under the Original Credit Facility remained outstanding under the Amended Credit Facility, and the term remained as five years from the date of the Original Credit Facility, expiring on May 19, 2020. The Credit Facility was further amended on June 27, 2016 and August 19, 2016, with retroactive effect to March 31, 2016 and June 30, 2016, respectively, pursuant to which certain financial covenant calculations, which are described in Note 5, below, were further clarified and amended. As of December 31, 2016, after classifying the Credit Facility debt as a current liability as discussed further below, the Company had working capital of $1.0 million, including cash and cash equivalents of $0.7 million. As of December 31, 2016, the Company owed $21.5 million under the Amended Credit Facility (consisting of a term loan with a balance of $8.7 million and a revolving credit facility with a balance of $12.8 million), and had $6.4 million in outstanding standby letters of credit.
The Credit Facility is secured by a first-priority perfected security interest in substantially all of the Company’s assets as well as all of the assets and the stock of its domestic subsidiaries, which also guaranty the borrowings, and 66% of the stock of its direct Canadian Subsidiary, Fenix Canada (other than its exchangeable preferred shares). The Credit Facility contains financial covenants with which the Company must comply which are described further in Note 5. Compliance with the financial covenants is measured quarterly and determines the amount of additional available credit, if any, that will be available in the future. The Credit Facility also contains other
52
customary events of default, including the failure to pay any principal, interest or other amount when due, violation of certain of the Company’s affirmative covenants or any negative covenants or a breach of representations and warranties and, in certain circumstances, a change in control. Upon the occurrence of an event of default, payment of indebtedness may be accelerated and the lending commitments may be terminated.
As of June 30, 2016, September 30, 2016 and December 31, 2016, the Company was in breach of the Credit Facility’s Total Leverage Ratio and Fixed Charge Coverage Ratio requirements and the Borrowing Base requirement for repaying over-advances (which were created by establishing lower acquired inventory values as described in Note 4 that reduced the applicable borrowing base), as well as the requirement for timely delivery of certain quarterly certificates and reports. The financial covenants are defined in Note 5. As a result, all of the Credit Facility debt is reported as a current liability in the accompanying consolidated balance sheet as of December 31, 2016, and there can be no further borrowings of any availability under the Credit Facility until such defaults are rectified or waived. On March 27, 2017, the Company entered into a Forbearance Agreement to the Credit Facility (the "Forbearance Agreement"). Pursuant to the Forbearance Agreement, the banks have agreed to forbear from exercising their rights and remedies under the Credit Facility with respect to the above described defaults and any similar defaults during the forbearance period, provided no other defaults occur. The Forbearance Agreement was amended on June 23, 2017 to extend the forbearance period, which had originally expired on May 26, 2017, until August 31, 2017 and to resolve certain new defaults. The Forbearance Agreement, as amended, also permits the Company to add the quarterly interest payments otherwise due for the first two quarters of 2017 to the principal amount of debt outstanding and defer the $250,000 principal payments due on March 31, 2017 and June 30, 2017 to the end of the forbearance period.
Ability to Continue as a Going Concern
The accompanying consolidated financial statements have been prepared assuming the Company will continue as a going concern, which contemplates continuity of operations, realization of assets and the satisfaction of liabilities in the normal course of business. As such, the accompanying consolidated financial statements do not include any adjustments relating to the recoverability and classification of assets and their carrying amounts, or the amount and classification of liabilities that may result should the Company be unable to continue as a going concern.
The Company is in breach of certain financial covenants contained in the Credit Facility as described above and in Note 5. The failure to operate within the requirements of these financial covenants was due primarily to (a) lower asset values as a result of reductions during 2016 to the aggregate estimated fair value of inventory acquired as part of the purchase of Subsidiaries, which have reduced the Company’s borrowing base, (b) limits on certain non-cash adjustments to calculate EBITDA for covenant compliance, and (c) EBITDA during 2016 that was lower than forecasted because of a shortfall in revenue from sales of scrap metals and higher operating expenses, including significant accounting, legal and other fees, primarily as a result of fees incurred from a new public accounting firm beginning in July 2016 and the SEC inquiry discussed in Note 12, which have forced the Company to incur significant accounting and legal fees during the second half of 2016.
Management has been and remains highly focused on maximizing cash flows from operations and, to the extent possible under the circumstances, minimizing the cost of outsourced professional fees. Although scrap metal prices increased during 2016 and have increased slightly further since December 31, 2016, and the Company’s expectation is that the current high level of professional fees should decline after the first half of 2017, the Company still may not be able to comply with all the financial covenants contained in its Credit Facility in future periods unless those requirements are waived or amended or unless the Company can reduce the amount of Credit Facility debt by obtaining new subordinated debt or equity financing. The Board of Directors of the Company has engaged a financial advisor to advise the Board and Company management and to assist in pursuing a range of potential strategic and financial transactions that will provide the Company with improved liquidity and maximize shareholder value. The financial advisor will identify and evaluate potential alternatives including a business combination, debt and/or equity financing, or a strategic investment into the Company, and is reporting directly to a special committee of independent directors established to oversee and coordinate these activities. The Board has not set a definitive timetable for completion of this process. There can be no assurance that this process will result in a transaction or other strategic alternative of any kind. Furthermore, the June 29, 2017 suspension in trading and eventual delisting of Fenix common stock on the Nasdaq Global Market negates the Company's ability to pursue strategic and financial transactions available only to listed companies.
On March 27, 2017, the Company entered into the Forbearance Agreement, as amended on June 23, 2017, described above. If the Company is unable to reach further agreement with its lenders to obtain waivers or amendments to the existing Credit Facility, find acceptable alternative financing, obtain equity contributions, or arrange a business combination, after the forbearance period (and during the forbearance period in the event of any new defaults other than those anticipated defaults enumerated in the Forbearance Agreement, as amended), the Company’s Credit Facility lenders could elect to declare some or all of the amounts outstanding under the facility to be immediately due and payable. If this happens, the Company does not expect to have sufficient liquidity to pay the outstanding Credit Facility debt. In addition, the Company has significant obligations under contingent consideration agreements related to certain acquired companies as described in Note 6, and it will need access to additional credit to be able to satisfy these obligations.
53
As a result of the above, substantial doubt exists regarding the ability of the Company to continue as a going concern, which contemplates continuity of operations, realization of assets and the satisfaction of liabilities in the normal course of business within one year from the date of this filing.
Note 2. Summary of Significant Accounting Policies
Basis of Presentation
These consolidated financial statements include the accounts of Fenix Parts, Inc. and its wholly owned Subsidiaries and were prepared in accordance with accounting principles generally accepted in the United States of America ("GAAP"). All intercompany transactions have been eliminated. The consolidated Company represents a single operating segment as described in Note 13.
Use of Estimates
The preparation of consolidated financial statements in conformity with GAAP requires management to make estimates and assumptions that affect the amounts reported in the financial statements and accompanying notes. The Company uses estimates in accounting for, among other items, the purchase price allocations in business combinations, allowances for doubtful accounts receivable, inventory valuation using the retail method of accounting and reserves for potentially excess and unsalable inventory, contingent consideration liabilities, uncertain tax positions, share-based compensation, assessing goodwill and other intangible and long-lived assets for potential impairment, and certain other assets and liabilities at the date of the financial statements and the reported amounts of revenue and expenses during the reporting periods. These estimates require the application of complex assumptions and judgments, often because they involve matters that are inherently uncertain and will likely change in subsequent periods. The impact of any change in estimates is included in earnings in the period in which the estimate is adjusted.
Fair Value Measurements
Fair value measurements of financial assets and liabilities are defined as the exchange price that would be received to sell an asset or paid to transfer a liability in an orderly transaction between market participants in the principal market at the measurement date (exit price). The Company is required to classify fair value measurements in one of the following categories:
Level 1 - inputs which are defined as quoted prices (unadjusted) in active markets for identical assets or liabilities that the reporting entity has the ability to access at the measurement date. | |
Level 2 - inputs which are defined as inputs other than quoted prices included within Level 1 that are observable for the assets or liabilities, either directly or indirectly. | |
Level 3 - inputs which are defined as unobservable inputs for the assets or liabilities. Financial assets and liabilities are classified based on the lowest level of input that is significant to the fair value measurement. | |
The Company's assessment of the significance of a particular input to the fair value measurement requires judgment, and may affect the valuation of the fair value of assets and liabilities and their placement within the fair value hierarchy levels.
Certain assets and liabilities are required to be recorded at fair value on either a recurring or non-recurring basis. The Company's financial instruments, including cash and cash equivalents, accounts receivable, accounts payable, and accrued expenses are carried at cost, which are Level 1 as they approximate fair value due to the short-term maturity of these instruments.
The Company's debt, classified as Level 2, is carried at cost and approximates fair value due to its variable interest rates, which are consistent with the interest rates in the market. The Company may be required, on a non-recurring basis, to adjust the carrying value of the Company's property and equipment, intangible assets, goodwill and contingent consideration. When necessary, these valuations are determined by the Company using Level 3 inputs. These assets are subject to fair value adjustments in certain circumstances, such as when there is evidence that impairment may exist
At December 31, 2016 and 2015, the fair value of contingent consideration, which is a recurring fair value measurement, was valued in the consolidated financial statements using Level 3 inputs. See Note 6 below for further details related to contingent consideration fair value estimates and related adjustments recorded in the consolidated financial statements.
Cash and Cash Equivalents
The Company includes cash and investments having an original maturity of three months or less at the time of acquisition in cash and cash equivalents.
Accounts Receivable and Allowance for Doubtful Accounts
54
In the normal course of business, the Company extends credit to customers after a review of each customer’s credit history. The Company maintained a reserve for uncollectible accounts of approximately $0.4 million and $0.5 million, at December 31, 2016 and 2015, respectively. The reserve is based upon management’s assessment of the collectability of specific customer accounts, the aging of the accounts receivable and historical experience. Receivables are written off once collection efforts have been exhausted. Recoveries of accounts receivable previously written off are recorded when received.
Inventories
Inventories consist primarily of recycled OEM products, including car hulls and other materials that will be sold as scrap and, to a lesser extent, aftermarket parts, used cars and motorcycles for resale. Inventory costs for recycled OEM parts are established using a retail method of accounting. Parts are dismantled from purchased vehicles and a retail price is assigned to each dismantled part. The total retail price of the inventoried parts is reduced by the estimated balance of parts that will be subsequently sold for scrap or discounted to a reduced expected selling price. These scrap and discount estimates are significant and require application of complex assumptions and judgments that are subject to change from period to period. The cost assigned to the salvaged parts and scrap is determined using the average cost-to-sales percentage at each operating facility and applying that percentage to the facility’s inventory at expected selling prices. The average cost-to-sales percentage is derived from each facility’s historical sales and actual cost paid for salvage vehicles purchased at auction or procured from other sources. The Company also capitalizes direct labor and overhead costs incurred to dismantle salvaged parts and prepare the parts for sale. With respect to self-service inventories, costs are established by calculating the average sales price per vehicle, including its scrap value and part value, applied to the total vehicles on-hand. Inventory costs for aftermarket parts, used cars and motorcycles for resale are established based upon the price the Company pays for these items. All inventory is recorded at the lower of cost or market value. The market value of the Company's inventory is determined based on the nature of the inventory and anticipated demand. If actual demand differs from the Company's earlier estimates, reductions to inventory carrying value are made in the period such determination is made.
Foreign Currency Translation and Transactions
A majority of the revenues of the Company are generated in U.S. dollars ("dollars"). In addition, a substantial portion of the Company’s costs are incurred in dollars. Management believes that the dollar is the primary currency of the economic environment in which the Company operates. Thus, the functional and reporting currency of the Company including most of its subsidiaries is the dollar. Accordingly, monetary accounts maintained in currencies other than dollars are re-measured into dollars, with resulting gains and losses reflected in the Consolidated Statements of Operations, as appropriate. The assets and liabilities of Fenix Canada, whose functional currency is the Canadian dollar, are translated into U.S. dollars, the reporting currency, at period-end exchange rates. Income and expense items are translated at the average rates of exchange prevailing during the period. The adjustments resulting from translating the Canadian financial statements are reflected as a component of accumulated other comprehensive loss within shareholders’ equity. Foreign currency transaction gains and losses are recognized in net earnings based on differences between foreign exchange rates on the transaction date and the settlement or period end date.
Revenue Recognition
The Company recognizes revenue from the sale of vehicle replacement products and scrap and, to a lesser extent, used cars and motorcycles, when they are shipped or picked up by the customers and ownership has transferred, subject to an allowance for estimated uncollectible accounts, representing management's best estimate of the amount of credit losses in accounts receivable, and estimated sales returns, discounts and allowances that management estimates based upon historical information. Management analyzes historical returns (often pursuant to standard warranties on the sold products), discounts and allowances activity by comparing the items to the original invoice amounts and dates. The Company uses this information to project future returns and allowances on products sold. If actual returns and allowances deviate significantly from the Company’s historical experience, there could be an impact on its operating results in the period of occurrence. The Company has recorded a sales return reserve for estimated returns and discounts of approximately $0.4 million and $0.7 million at December 31, 2016 and 2015, respectively.
The Company presents taxes assessed by governmental authorities collected from customers on a net basis. Therefore, the taxes are excluded from revenue and expenses on the consolidated statements of operations and are shown as current liabilities on the consolidated balance sheets until remitted. Revenue includes amounts billed to customers for shipping and handling.
Revenue from the sale of separately priced extended warranty contracts is reported as deferred revenue and recognized ratably over the term of the contracts or over five years for life-time warranties. Revenue from such extended warranty contracts was approximately $1.0 million and $0.3 million for the years ended December 31, 2016 and 2015, respectively.
The change in the deferred warranty liability during the years ended December 31, is summarized below:
55
(In thousands) | 2016 | 2015 | ||||
Beginning balance | $ | 769 | $ | — | ||
Warranty sales | 1,785 | 1,061 | ||||
Revenue recognized | (979 | ) | (292 | ) | ||
Ending balance | $ | 1,575 | $ | 769 | ||
Cost of Goods Sold
Cost of goods sold primarily includes (a) amounts paid for the purchase of vehicles, scrap, parts for resale and related products, (b) related auction, storage and towing fees, and (c) other costs of procurement and dismantling, primarily direct labor and overhead allocable to dismantling operations or, in the case of car and motorcycle sales, to preparing the vehicle for sale.
Selling, General, and Administrative ("SG&A") Expenses
SG&A expenses are primarily comprised of (a) salaries and benefits of employees that are not related to the procurement and dismantling of vehicles, (b) facility costs such as rent, utilities, insurance, repairs and taxes not allocated to dismantling operations, (c) selling and marketing costs, (d) costs to distribute products and scrap and (e) other general and administrative costs. SG&A expenses for the periods presented also include corporate office costs such as travel expenses and the costs related to being a publicly-traded company. Advertising costs are charged to expense as incurred. For the years ended December 31, 2016, 2015 and 2014 advertising and marketing expense amounted to approximately $0.8 million, $0.7 million and $0.0 million, respectively.
Outside Services and Professional Fees
Outside services and professional fees include third-party costs related to legal matters, accounting and auditing, tax compliance and consultation, and acquisition due diligence. Professional fees associated with a business combination are expensed as incurred.
Facility Leases/Deferred Rent
The Company leases dismantling, distribution and warehouse facilities, as well as office space for corporate administrative purposes under operating leases. For scheduled rent escalation clauses during the lease terms or for rental payments commencing at a date other than the date of initial possession, the Company records minimum rent expense on a straight-line basis over the terms of the leases in SG&A expenses and cost of goods sold, as applicable.
For leases entered into upon the closing of the acquisitions, any difference between contractual payments and then-current market rental rates is accounted for as a deferred rent asset or liability that served to reduce the aggregate consideration paid by a net of approximately $1.5 million. These assets and liabilities are being amortized over the terms of the leases as additional or reduced rent expense as the fair value of the total difference in cash rent payments from market rents. Accordingly, the consolidated statements of operations reflect the straight line rental expense as described above plus $0.1 million in 2016 and $0.2 million in 2015 in amortization of the deferred market rental asset and liability established at acquisition.
Concentrations of Risk
Financial instruments that potentially subject the Company to significant concentration of credit risk consist primarily of cash and cash equivalents and accounts receivable. The majority of cash and cash equivalents are maintained with several major financial institutions. The Company maintains its cash in bank deposit accounts which, at times, may exceed the insurance limits of the Federal Deposit Insurance Corporation. The Company has not experienced any losses in such accounts. Concentrations of credit risk with respect to accounts receivable are limited because a large number of customers make up the Company’s customer base. During 2016 and 2015, no customer accounted for more than 1% of the Company's OEM parts revenue, and no single customer accounted for more than 10% of total net revenues. The Company controls credit risk through credit approvals, credit limits and monitoring procedures.
The Company primarily obtains its recycled OEM and related products from damaged, totaled or low value vehicles purchased at salvage auto auctions. Since the IPO, substantially all of the vehicle purchases from auction for dismantling were acquired at auctions run by two salvage auto auction companies.
Property and Equipment
Property and equipment are recorded at cost. Depreciation expense is calculated using the straight-line method over the estimated useful lives. Leasehold improvements are amortized over the shorter of the useful life of the related assets or the lease term. Expenditures for maintenance and repairs are charged against operations. Renewals and betterments that materially extend the useful life of an asset are capitalized. As property and equipment are sold or retired, the applicable cost and accumulated depreciation are removed from the accounts and any resulting gain or loss thereon is recognized.
The components of property and equipment are as follows:
56
(In thousands) | December 31, | |||||
2016 | 2015 | |||||
Machinery | $ | 7,407 | $ | 7,197 | ||
Leasehold improvements | 1,604 | 1,522 | ||||
Vehicles, computers and fixtures | 4,476 | 4,385 | ||||
Gross property and equipment | 13,487 | 13,103 | ||||
Less: accumulated depreciation | (3,398 | ) | (1,494 | ) | ||
Net property and equipment | $ | 10,089 | $ | 11,609 | ||
Depreciation expense totaled approximately $2.0 million and $1.5 million for the years ended December 31, 2016 and 2015, respectively. Depreciation expense associated with the Company's procurement and dismantling operations is charged to inventories and then included in cost of goods sold in the consolidated statements of operations. Approximately $1.0 million and $0.5 million of total depreciation expense for the years ended December 31, 2016 and 2015, respectively, was included in cost of goods sold.
Estimated useful lives of property and equipment acquired by the Company after the acquisitions of the Subsidiaries are as follows:
Vehicles | 3-5 years |
Machinery and equipment | 3-10 years |
Leasehold improvements | 10-15 years or term of lease, if shorter |
Office furniture and fixtures | 4-7 years |
Computer equipment and software | 1-5 years |
The Company evaluates the recoverability of the carrying amount of property and equipment whenever events or changes in circumstances indicate that the carrying amount of an asset may not be fully recoverable based on an analysis of undiscounted cash flows. If the carrying value is greater than the undiscounted cash flows, impairments, if any, are reported at the lower of cost or fair value. There were no impairment charges related to property and equipment during 2016 or 2015.
Intangible Assets
Intangible assets arise in connection with business combinations and are initially established in accordance with applicable guidance provided within the business combination rules. Intangible assets subject to amortization consist of trade names, customer relationships, and covenants not to compete. Amortization expense is calculated using the straight-line method over the estimated useful lives of the assets of 5 years for trade names and 5 years for covenants not to compete. Amortization expense is calculated using the accelerated method over the estimated useful life of the asset of 15 years for customer relationships.
Intangible assets arising in the 2015 acquisitions have been valued at $39.1 million as of the respective acquisition dates, which includes an adjustment recorded in the first quarter of 2016 to increase the value assigned to customer relationships by $1.7 million, as described in Note 4 below. Because of post-acquisition translation differences for the Canadian subsidiaries, the carrying amounts of intangible assets are subject to subsequent adjustments. The components of intangible assets are as follows at December 31, 2016 and 2015:
(In thousands) | 2016 | 2015 | |||||
Customer relationships | $ | 30,181 | $ | 28,157 | |||
Trade names | 6,013 | 6,033 | |||||
Covenants not to compete | 1,661 | 1,649 | |||||
Intangible assets, gross | $ | 37,855 | $ | 35,839 | |||
Accumulated amortization | (5,644 | ) | (2,053 | ) | |||
Intangible assets, net | $ | 32,211 | $ | 33,786 | |||
Amortization expense for intangible assets was $3.6 million and $2.1 million for the years ended December 31, 2016 and 2015, respectively.
The Company evaluates the carrying value of intangible assets for impairment whenever events or changes in circumstances indicate that the carrying amount of the assets may not be recoverable. In such instances, the Company tests these assets for recoverability by comparing the net carrying value of the asset or asset group to the undiscounted net cash flows to be generated from the use and eventual disposition of that asset or asset group. If the assets are not recoverable, an impairment loss is recognized for any deficiency of the
57
asset or asset group's estimated fair value compared to their carrying value. Although the Company bases cash flow forecasts on assumptions that are consistent with plans and estimates the Company uses to manage our business, there is significant judgment in determining the cash flows attributable to these assets, including markets and market share, customer attrition rates, sales volumes and mix, capital spending and working capital changes. There were no impairment charges to intangible assets during 2016 or 2015.
The following table shows the estimated future amortization expense for intangible assets as of December 31, 2016:
(In thousands) | |||
2017 | $ | 3,819 | |
2018 | $ | 4,103 | |
2019 | $ | 4,179 | |
2020 | $ | 3,214 | |
2021 | $ | 2,467 | |
Thereafter | $ | 14,429 | |
Goodwill
Goodwill is recorded when the purchase price for an acquisition exceeds the estimated fair value of the net tangible and identified intangible assets acquired.
The Company tests goodwill for impairment annually on October 1st at the reporting unit level. If the reporting unit has historically had a significant excess of fair value over book value and based on current operations is expected to continue to do so, the Company’s annual impairment test is performed qualitatively. If this is not the case, the first step of the goodwill impairment process ("Step 1") is completed, which involves determining whether the estimated fair value of the reporting unit exceeds the respective book value. In performing Step 1, management compares the carrying amount of the reporting unit to its estimated fair value. If the estimated fair value exceeds the book value, goodwill of that reporting unit is not impaired. The estimated fair value of the reporting unit is calculated using one or both of the following generally accepted valuation techniques: the income approach (discounted cash flows) and the market approach (using market multiples derived from a set of companies with comparable market characteristics). The appropriate methodology is determined by management based on available information at the time of the test. When both approaches are used, the estimated fair values are weighted.
If the Step 1 result concludes that the estimated fair value does not exceed the book value of the reporting unit, goodwill may be impaired and additional analysis is required ("Step 2"). Step 2 of the goodwill impairment test compares the implied fair value of a reporting unit’s goodwill to its carrying value. The implied fair value of goodwill is derived by performing a hypothetical purchase price allocation for the reporting unit as of the measurement date, by allocating the reporting unit’s estimated fair value to its assets and liabilities including any unrecognized intangible assets. The residual amount from performing this allocation represents the implied fair value of goodwill. To the extent this amount is below the carrying value of goodwill, an impairment loss is recorded.
On a quarterly basis, the Company considers whether events or circumstances are present that may lead to the determination that an indicator of impairment exists. These circumstances include, but are not limited to, deterioration in key performance indicators or industry and market conditions as well as adverse changes in cost of capital, discount rates and terminal values.
The process of evaluating the potential impairment of goodwill is highly subjective and requires significant judgment and estimates. During the first quarter of 2016, the Company recorded an impairment charge of $45.3 million, and the process and assumptions used to calculate such impairment are fully described in Note 11 below. Also discussed therein are the additional tests and calculations that were performed as of October 1, 2016 and December 31, 2016, which determined that no further impairment of goodwill was required during 2016.
Related Parties
The Company has defined, for financial reporting purposes, a "Related Party" as any (a) person who is or was during the periods being reported an executive officer, director or nominee for election as a director, (b) greater than 5 percent beneficial owner of the Company’s common stock, or (c) immediate family member of any of the foregoing. See Note 15 for a discussion of transactions between the Company and related parties.
Contingent Consideration
The Company accounts for contingent consideration in a business combination in accordance with applicable guidance provided within the business combination rules. Under arrangements with the former owners of three Founding Companies, the former owners can earn additional cash and stock if certain performance measures are achieved subsequent to the combinations. The fair value of contingent
58
consideration recorded in the financial statements at the Combination date was based on independent valuations considering the Company's initial projections for the relevant Founding Companies, the respective target levels, the relative weighting of various future scenarios and a discount rate of approximately 5.0%. Subsequent to the Combination, management reviews the amounts of contingent consideration that are likely to be payable under current operating conditions and adjusts the initial liability as deemed necessary, with such subsequent adjustments being recorded through the statement of operations as a credit or charge (See Note 6).
Indemnification Receivables
In conjunction with the acquisition of the Subsidiaries, the acquisition agreements contained indemnifications from the former owners to cover, within defined limits, certain matters such as environmental and tax, for a period up to three years. As such, the Company recorded indemnification receivables, which represent recoverable amounts from the former owners of certain of the Subsidiaries if the Company is required to make certain income tax or other payments, as defined in the indemnification provisions within the relevant combination agreements. Reductions in the indemnification receivables that resulted in $2.9 million of expense being recorded during 2016 are described in Note 10 below.
Stock Offering Costs
The Company incurred approximately $1.4 million and $0.3 million of legal, accounting, auditing and other costs directly related to its IPO through May 19, 2015 and December 31, 2014, respectively. The Company also incurred $7.7 million of underwriting cost through May 19, 2015. Such costs were applied against the gross proceeds from the IPO upon its closing.
Share-based Compensation
The Company recognizes compensation expense for employee and director equity awards ratably over the requisite service period of the award, adjusted for actual forfeitures (See Note 8).
Income Taxes
Income taxes are accounted for under the asset and liability method where deferred tax assets and liabilities are recognized for the future tax consequences attributable to differences between the financial statement carrying amounts of existing assets and liabilities and the respective tax basis and for tax credit carry forwards. Deferred tax assets and liabilities are measured using enacted tax rates expected to apply to taxable income in the years in which those temporary differences are expected to be recovered or settled. The effect on deferred tax assets and liabilities of a change in tax rates is recognized in income in the period that includes the enactment date.
The Company evaluates the realizability of its deferred tax assets and records a valuation allowance against the deferred tax assets when management believes that it is more likely than not that some portion or all of the recorded deferred tax assets will not be realized in future periods. The Company considers all available positive and negative evidence when assessing the likelihood of future realization of our deferred tax assets, including recent cumulative earnings experience, expectations of future taxable income and available tax planning strategies that could be implemented to realize the net deferred tax assets, the ability to carryback losses and other relevant factors. Failure to achieve forecasted taxable income in applicable tax jurisdictions could affect the ultimate realization of deferred tax assets and could result in an increase in the Company’s effective tax rate on future earnings or reversal of tax benefits applicable to future losses.
The Company follows a two-step approach to recognizing and measuring uncertain tax positions. The first step is to evaluate the tax position for recognition by determining if the weight of available evidence indicates it is more likely than not that the position will be sustained on audit, including resolution of related appeals or litigation processes, if any. The second step is to measure the tax liability as the largest amount that is more than 50% likely of being realized upon ultimate settlement. The Company considers many factors when evaluating and estimating its tax positions, which may require periodic adjustments and which may not accurately forecast actual outcomes. The Company's uncertain tax position reserves include related interest and penalties and all relate to tax positions taken on returns prior to the individual acquisitions of the Subsidiaries. The Company’s policy is to include interest and penalties associated with income tax obligations in income tax expense. The Company’s right to indemnification under certain of the combination agreements related to these uncertain tax positions is subject to a threshold of 1% of the purchase price, a cap of 40% of the purchase price paid for each individual acquisition. These indemnifications are subject to a three year limitation from date of the acquisitions.
Undistributed earnings of the Company's Canadian subsidiaries are considered to be indefinitely reinvested, and accordingly no provision for U.S. income taxes has been provided thereon. Upon repatriation of those earnings, in the form of dividends or otherwise, the Company would be subject to both U.S. income taxes (subject to adjustment for foreign tax credits) and potential withholding taxes payable in Canada. Determination of the amount of unrecognized deferred U.S. income tax liability is not practicable due to the complexities associated with its hypothetical calculation; however, unrecognized foreign tax credits would be available to reduce materially any U.S. liability (See Note 10).
Loss Per Share
59
Basic loss per share is computed by dividing net loss available to common shares by the weighted average common shares outstanding during the period using the two-class method. The Fenix Canada preferred shares do not entitle the holders to any dividends or distributions and as such, no earnings or losses of Fenix Canada are attributable to those holders. However, these shares are considered participating securities and therefore share in the net loss of the period since being issued on May 19, 2015. Diluted loss per share would include the impact of outstanding common share equivalents as if those equivalents were exercised or converted into common shares if such assumed exercise or conversion were dilutive. Contingently issuable shares are excluded from basic and diluted earnings per share until issuance is no longer contingent.
For the years ended December 31, 2016, 2015 and 2014, basic loss per share is equal to diluted loss per share because all outstanding stock awards are considered anti-dilutive during periods of net loss.
The Company issued 1,050,000 exchangeable preferred shares of Fenix’s subsidiary, Fenix Parts Canada, Inc. ("Exchangeable Preferred Shares") as Combination Consideration valued at the public offering price of common stock of $8.00 per share. Because these shares do not entitle the holders to any Fenix Canada dividends or distributions, no earnings or losses of Fenix Canada are attributable to those holders. However, these shares do participate in the net income or loss of the consolidated Company back to time of issuance upon being exercised for common stock.
The Company has 11,667 common shares and 280,000 shares of Fenix Canada exchangeable preferred stock held in escrow relating to contingent consideration agreements with certain Subsidiaries. These shares are not included in basic loss per share or in the shares used to calculate the net loss attributable to Fenix Canada preferred shares until the issuance is no longer contingent on future events (see Note 9).
Correction of Immaterial Errors
The Company previously incorrectly presented the net value of its above and below market long-term leases in its balance sheet and incorrectly computed the net loss available to common shareholders as described in Note 14. The Company assessed the materiality of these misstatements on prior periods’ financial statements in accordance with the SEC’s Staff Accounting Bulletin ("SAB") No. 99, Materiality, codified in ASC No. 250, Presentation of Financial Statements, and concluded that the misstatements were not material to any prior annual or interim periods. In the current period, the Company has corrected the immaterial error such that below market leases are recorded in other non-current assets and above market leases are recorded in other non-current liabilities as shown in the table below.
(In thousands) | December 31, 2015 | ||
Previous presentation | |||
Other non-current assets | $ | 1,218 | |
Current presentation | |||
Other non-current assets | $ | 3,388 | |
Other non-current liabilities | $ | 2,170 | |
Note 3. Recent Accounting Pronouncements
In January 2017, the Financial Accounting Standards Board ("FASB") issued Accounting Standards Update ("ASU") 2017-04, Simplifying the Test for Goodwill Impairment, which simplifies how an entity is required to test goodwill for impairment by eliminating Step 2 from the goodwill impairment test. Step 2 measures a goodwill impairment loss by comparing the implied fair value of a reporting unit’s goodwill with the carrying amount. The new rules will be effective for the Company in the first quarter of 2020. The Company does not expect the adoption of the new accounting rules to have a material impact on the Company’s financial condition, results of operations and cash flows.
In January 2017, the FASB issued ASU 2017-03, Accounting Changes and Error Corrections (Topic 250), this amendment states that registrants should consider additional qualitative disclosures if the impact of an issued but not yet adopted ASU is unknown or cannot be reasonably estimated and to include a description of the effect of the accounting policies that the registrant expects to apply, if determined. Transition guidance included in certain issued but not yet adopted ASUs was also updated to reflect this update. This standard is effective for fiscal years beginning after December 15, 2019, including interim periods within that reporting period. The Company does not expect the adoption of the new accounting rules to have a material impact on the Company’s financial condition, results of operations and cash flows.
In January 2017, the FASB issued ASU 2017-01, Clarifying the Definition of a Business, which clarifies the definition of "a business" to assist entities with evaluating whether transactions should be accounted for as acquisitions or disposals of assets or businesses. The
60
standard introduces a screen for determining when assets acquired are not a business and clarifies that a business must include, at a minimum, an input and a substantive process that contribute to an output to be considered a business. This standard is effective for fiscal years beginning after December 15, 2017, including interim periods within that reporting period. The Company does not expect this new guidance to have a material impact on its consolidated financial statements.
In August 2016, the FASB issued ASU No. 2016-15, Classification of Certain Cash Receipts and Cash Payments (Topic 230) (a consensus of the Emerging Issues Task Force). ASU 2016-15 addresses eight specific cash flow issues and applies to all entities, including both business entities and not-for-profit entities that are required to present a statement of cash flows under ASC 230, Statement of Cash Flows. The amendments in ASU 2016-15 are effective for public business entities for fiscal years beginning after December 15, 2017, and interim periods within those fiscal years. Early adoption is permitted, including adoption in an interim period. The Company has not yet adopted this update and is currently evaluating the impact it may have on its financial condition and results of operations.
In June 2016, the FASB issued ASU No. 2016-13, Financial Instruments—Credit Losses (Topic 326): Measurement of Credit Losses on Financial Instruments. ASU 2016-13 introduces a new forward-looking approach, based on expected losses, to estimate credit losses on certain types of financial instruments, including trade receivables, which will require entities to incorporate considerations of historical information, current information and reasonable and supportable forecasts. This ASU also expands disclosure requirements. ASU 2016-13 is effective for the Company beginning the first quarter of 2020 with early adoption permitted. The Company is currently evaluating the impact of adoption of ASU 2016-13 on its consolidated financial statements and related financial statement disclosures.
In March 2016, the FASB issued ASU No. 2016-09, Compensation-Stock Compensation (Topic 718): Improvements to Employee Share-Based Payment Accounting. The ASU changes the accounting for certain aspects of share-based payment awards to employees and requires the recognition of the income tax effects of awards in the income statement when the awards vest or are settled, thus eliminating additional paid in capital pools. The guidance also allows for the employer to repurchase more of an employee’s shares for tax withholding purposes without triggering liability accounting. In addition, the guidance allows for a policy election to account for forfeitures as they occur rather than on an estimated basis. This pronouncement is effective for fiscal years and interim periods beginning after December 15, 2016, with early adoption permitted. The Company adopted ASU 2016-09 effective April 1, 2016 and all forfeitures have been applied when they occurred.
In February 2016, the FASB issued ASU No. 2016-02, Leases (Topic 842). The guidance in ASU 2016-02 supersedes the lease recognition requirements in ASC Topic 840, Leases (FAS 13). The new standard establishes a right-of-use (ROU) model that requires a lessee to record an ROU asset and a lease liability on the balance sheet for all leases with terms longer than 12 months. Leases will be classified as either finance or operating, with classification affecting the pattern of expense recognition in the income statement. The new standard is effective for fiscal years beginning after December 15, 2018, including interim periods within those fiscal years, with early adoption permitted. A modified retrospective transition approach is required for lessees for capital and operating leases existing at, or entered into after, the beginning of the earliest comparative period presented in the financial statements, with certain practical expedients available. While the Company is currently evaluating the effect this standard will have on its consolidated financial statements and timing of adoption, we expect that upon adoption, the Company will recognize ROU assets and lease liabilities and those amounts are likely to be material.
In September 2015, FASB issued ASU No. 2015-16, Business Combinations (Topic 805), Simplifying the Accounting for Measurement-Period Adjustments, which simplifies the accounting for adjustments made to provisional amounts recognized in business combinations. The amendments require that an acquirer recognize adjustments to provisional amounts that are identified during the measurement period in the reporting period in which the adjustment amounts are determined. The amendments also require that the acquirer record, in the same period’s financial statements, the effect on earnings of changes in depreciation, amortization, or other income effects, if any, as a result of the change to provisional amounts, calculated as if the accounting had been completed at the acquisition date. The ASU also requires an entity to present separately on the face of the income statement or disclose in the notes the portion of the amount recorded in current-period earnings by line item that would have been recorded in previous reporting periods if the adjustment to the provisional amounts had been recognized as of the acquisition date. This guidance is effective for fiscal years beginning after December 15, 2015, including interim periods within those fiscal years. The Company adopted ASU 2015-16 effective January 1, 2016, resulting in the recognition of certain adjustments during the first quarter of 2016 to goodwill and other balance sheet and income statement accounts as described in Note 4 below.
In August 2015, the FASB issued ASU No. 2015-15, Interest - Imputed Interest (Subtopic 835-30): Presentation and Subsequent Measurement of Debt Issuance Costs Associated with Line-of-Credit Arrangements, which clarifies that the guidance in ASU 2015-03 does not apply to line-of-credit arrangements. According to ASU 2015-15, debt issuance costs related to line-of-credit arrangements will continue to be deferred and presented as an asset and subsequently amortized ratably over the term of the arrangement. The amendments in ASU 2015-03 and clarifications of ASU 2015-15 were effective for the Company in the first quarter of 2016. The early adoption of ASU 2015-03 and the adoption of ASU 2015-15 resulted in $438,000 in original debt issuance costs incurred during 2015 and an additional $102,000 in amendment charges during 2016, being netted against the Company’s term loan balance and such amounts are being amortized over the life of the term loan as described more fully in Note 5.
61
In August 2014, the FASB issued ASU No. 2014-15, Presentation of Financial Statements - Going Concern (Subtopic 205-40): Disclosure of Uncertainties about an Entity’s Ability to Continue as a Going Concern. ASU 2014-15 describes how an entity’s management should assess, considering both quantitative and qualitative factors, whether there are conditions and events that raise substantial doubt about an entity’s ability to continue as a going concern within one year after the date that the financial statements are issued, which represents a change from the previous literature that required consideration about an entity’s ability to continue as a going concern within one year after the balance sheet date. The Company adopted this standard during the fourth quarter of 2016. The implementation of this standard did not have a material impact on the Company’s consolidated financial statements.
In May 2014, the FASB issued ASU 2014-09, Revenue from Contracts with Customers (Topic 606). This update outlines a single, comprehensive model for accounting for revenue from contracts with customers. In August 2015, the FASB deferred the effective date by one year to January 1, 2018, while providing the option to early adopt the standard on the original effective date of January 1, 2017. The Company plans to adopt this update on January 1, 2018. The guidance can be adopted either retrospectively or as a cumulative-effect adjustment as of the date of adoption. The Company is currently evaluating the adoption alternatives, which include utilizing a bottom-up approach to analyze the standard’s impact on our contract portfolio, comparing historical accounting policies and practices to the new standard to identify potential differences from applying the requirements of the new standard to its contracts. The Company has not yet selected a transition method and is currently evaluating the impact it may have on its consolidated financial statements and related disclosures.
Note 4. Acquisitions
2015 Acquired Companies
On May 19, 2015, Fenix closed on combinations with the eleven Founding Companies and subsequently during 2015 acquired three companies, all of which are engaged in the business of automotive recycling. Of the total purchase consideration of $154.5 million, $101.1 million was the base consideration paid in cash at closing, $33.1 million represents the value attributed to stock consideration issued in the acquisitions, $10.2 million was recorded as potentially issuable in cash and stock under contingent consideration agreements (see Note 6), and $10.1 million represents amounts payable for estimated working capital adjustments, employee bonuses for past service, and contractually required future payments for items such as non-substantive consulting fees, off market lease payments and other discounted cash payments to be made up to 15 years after the acquisitions. The total purchase consideration includes adjustments identified through May 2016, as part of working capital true-ups and other contractual adjustments to the purchase consideration, which resulted in a net increase in the goodwill previously reported of $0.1 million.
The table below summarizes the Company's best estimate of fair values of the aggregate assets acquired and liabilities assumed at the respective dates of acquisitions, and incorporates the provisional adjustments in measurement since they were previously reported at December 31, 2015 through December 31, 2016. The measurement period ended during 2016 and all purchase price allocations were finalized during 2016.
(In thousands) | Opening Balance Sheet as Previously Reported | Adjustments During 2016 | Adjusted Opening Balance Sheet | |||||||||
Cash and other current assets | $ | 8,666 | $ | — | $ | 8,666 | ||||||
Inventories | (i) | 47,794 | (10,722 | ) | 37,072 | |||||||
Property and equipment | (ii) | 13,235 | — | 13,235 | ||||||||
Other non-current assets | (iii) | 5,271 | — | 5,271 | ||||||||
Intangible assets | (iv) | 37,396 | 1,710 | 39,106 | ||||||||
Current liabilities | (7,572 | ) | — | (7,572 | ) | |||||||
Reserve for uncertain tax positions | (5,760 | ) | — | (5,760 | ) | |||||||
Deferred income taxes, net | (v) | (24,168 | ) | 3,758 | (20,410 | ) | ||||||
Non-current liabilities | (422 | ) | — | (422 | ) | |||||||
Total net identifiable assets acquired | 74,440 | (5,254 | ) | 69,186 | ||||||||
Goodwill | 80,023 | 5,403 | 85,426 | |||||||||
Total net assets acquired | $ | 154,463 | $ | 149 | $ | 154,612 | ||||||
During the three months ended March 31, 2016, the Company reduced the aggregate estimated value of the acquired inventories by $10.7 million to reflect the most recent historical information available regarding excess and unsaleable parts acquired as well as sales discounts given to sell certain acquired parts. This inventory adjustment resulted in a $1.7 million increase in intangible assets (customer relationships), a $3.8 million reduction in deferred income taxes and a $5.3 million increase in goodwill. In accordance with ASU No. 2015-16, which is discussed in Note 3 above, the adjustment also resulted in a reduced charge to cost of goods sold during the year ended December 31, 2016 of approximately $4.0 million consisting of $2.2 million for the opening inventory mark up to fair value (see (i) below) and $1.8 million related to the lower value of acquired inventories sold between the respective acquisition dates and
62
December 31, 2015. The $2.2 million adjustment to the opening inventory markup had a related $1.0 million deferred tax liability. The $2.2 million and the $1.0 million were previously recorded through the prior period operations and were adjusted through the operations for the year ended December 31, 2016 within the cost of goods sold and the tax benefit line items, respectively.
Included in the fair value allocation reflected in the table above are the various valuations described below which are primarily based on Level 3 inputs:
(i) | Inventory was marked up to 90% of its estimated selling price representing the inventory’s fair market valuation, with selling costs and related profit margin estimated at all companies to be 10%. This fair value adjustment to inventory, after a reduction of approximately $2.2 million for the opening balance sheet adjustment described above, totaled approximately $7.8 million, of which $1.4 million was amortized as an additional charge recorded in cost of goods sold during the year ended December 31, 2016. This fair value mark up adjustment was completely amortized during 2016 as the acquired inventory was expected to be sold within six to nine months. |
(ii) | Assumptions for property and equipment valuation, which are based on cost and market approaches, are based primarily on data from industry databases and dealers on current costs of new equipment and information about the useful lives and age of the equipment. The remaining useful life of property and equipment was determined based on historical experience using such assets, and varies from 1 - 6 years depending on the acquired company and nature of the assets. All property and equipment is being depreciated using the straight-line method. |
(iii) | The Company may recover amounts from the former owners of certain of the acquired companies if the Company is required to make certain income tax or other payments as defined in the relevant acquisition agreements after the acquisition. In the case of the Founding Companies, the Company’s right to these tax related indemnifications is generally subject to a threshold of 1% of the purchase price, a cap of 40% of the purchase price paid for each individual acquisition and a survival period of three years from the date of their acquisition. During the year ended December 31, 2016, the Company reversed $2.9 million of indemnification receivables through a charge in the accompanying consolidated statement of operations, as the statute of limitations expired on the tax-related indemnity as discussed further in Note 10 below. |
(iv) | The table below summarizes the aggregate gross intangible assets recorded: |
(In thousands) | |||
Customer relationships | $ | 31,308 | |
Trade names | 6,122 | ||
Covenants not to compete | 1,676 | ||
Total | $ | 39,106 | |
The fair value of trade names and customer relationships are based on a number of significant assumptions. Customer relationships are valued using an income approach called the multi-period excess earnings method, a form of discounted cash flow that estimates revenues and cash flows derived from the use of the intangible asset and then deducts portions of the cash flow that can be attributed to supporting assets, such as other intangible assets or property and equipment, that contributed to the generation of the cash flows to arrive at cash flows attributable solely to the intangible asset being valued. Descriptions of the inputs into this method, and the estimates or ranges of these inputs are as follows:
Compound annual revenue growth rate in forecast period | 2.1%-3.1% |
Annual customer attrition rate | 10.0% |
Gross margin in forecast period | 29.9%-48.1% |
Contributory asset charges as a percentage of revenue | 0.0%-2.6% |
Discount rate | 12.5%-16.0% |
Tax rate | 38.6%-40.9% |
The expected useful life of customer relationships is established as 15 years, which is the period over which these assets are expected to reasonably contribute to future cash flows. The Company amortizes such customer relationships using an accelerated method that reflects a greater relative contribution to future cash flows in the earlier years of the assets’ useful lives.
Trade names are valued using a “relief from royalty” method, which models cash savings from owning intangible assets as compared to paying a third party for their use. Descriptions of the inputs into this method, and the estimates or ranges of these inputs used are as follows:
63
Compound annual revenue growth rate over term of use | 3.0%-6.2% |
Percentage of revenue attributable to trade name in forecast year | 20%-100% |
Royalty rate | 2.0% |
Discount rate | 11.5%-14.0% |
Tax rate | 38.6%-40.9% |
The expected useful life of trade names is based on the Company’s planned timeframe for using the existing trade names the Company purchased in its acquisitions. The Company amortizes such trade names using the straight-line method as no other method of amortization is more representative of the Company’s usage of these assets.
(v) | The Company recorded deferred income taxes relating to the difference between financial reporting and tax basis of assets and liabilities acquired in the acquisitions in nontaxable transactions. The Company also eliminated historical deferred income taxes of the companies acquired in taxable transactions. |
Pro Forma Results
The following table shows the combined pro forma combined net revenues and net loss of the Company as if acquisitions of all of its Subsidiaries had occurred on January 1, 2014:
Year Ended December 31, 2015 | Year Ended December 31, 2014 | ||||||
(In thousands) | |||||||
Net revenues | $ | 126,897 | $ | 132,802 | |||
Net loss | $ | (23,716 | ) | $ | (4,594 | ) | |
Pro forma combined net revenues consisted of:
Year Ended December 31, 2015 | Year Ended December 31, 2014 | ||||||
(In thousands) | |||||||
Recycled OE parts and related products | $ | 109,658 | $ | 108,361 | |||
Other ancillary products (scrap) | 17,239 | 24,441 | |||||
Total | $ | 126,897 | $ | 132,802 | |||
Significant adjustments to the historical revenues of the Subsidiaries include the elimination of sales between acquired companies, for which there is a corresponding decrease in pro forma cost of goods sold, and the elimination of revenue from the sale of warranties that are not recognized by Fenix in the post-acquisition periods.
The cost of goods sold impact of the subsequent sale of acquired inventories written-up from historic cost basis to fair value is reflected for pro forma reporting purposes in the same manner as reported in the accompanying consolidated financial statements and is not adjusted back to January 1, 2014, as it does not have a continuing impact on the Company. As a result, pro forma gross profit and net income in the periods immediately following the acquisitions are substantially lower than the pre-acquisition periods.
Significant adjustments to expenses include eliminating the effects of shares transferred from founding investors to later investors, incremental amortization of acquired intangible assets, rent expense associated with leases with the former owners of the acquired companies, compensation related to certain bonuses paid to owners and employees and related income tax effects.
Note 5. Bank Credit Facility
Amended and Restated Credit Facility
Effective December 31, 2015, the Company entered into a $35 million amended and restated senior secured credit facility with BMO Harris Bank N.A. and its Canadian affiliate, Bank of Montreal (the "Amended Credit Facility" or "Credit Facility") which replaced the original Credit Facility with them (the "Original Credit Facility"). The Amended Credit Facility contained substantially the same terms as the Original Credit Facility except for adjustments to covenants which are discussed below. Previous borrowings under the Original Credit Facility remained outstanding under the Amended Credit Facility. The Credit Facility was further amended on June 27, 2016 and August 19, 2016, with retroactive effect to March 31, 2016 and June 30, 2016, respectively, pursuant to which certain financial covenant calculations, which are described below, were further clarified and amended.
64
The Credit Facility consists of $25.0 million as a revolving credit facility, allocated $20.0 million in U.S. Dollar revolving loans, with a $7.5 million sublimit for letters of credit, and $5.0 million in Canadian Dollar revolving loans, with a $2.5 million sublimit for letters of credit. The Company borrowed the remaining $10.0 million as a term loan concurrently with its IPO in May 2015. Proceeds of the credit facility can be used for capital expenditures, working capital, permitted acquisitions, and general corporate purposes. The term of the revolving credit facility and the term loan facility is 5 years from the date of the Original Credit Facility with each expiring on May 19, 2020. The Amended Credit Facility and both subsequent amendments were determined to be modifications under ASC 470-50 of the Original Credit Facility that was entered into at the time of the IPO.
The Credit Facility is secured by a first-priority perfected security interest in substantially all of the Company’s assets as well as all of the assets of its U.S. subsidiaries, which also guaranty the borrowings. In addition, the Company pledged all of the stock in its U.S. Subsidiaries as security and 66% of the stock of its direct Canadian Subsidiary, Fenix Canada (other than its exchangeable preferred shares).
The Company’s U.S. Dollar borrowings under the Amended Credit Facility bear interest at fluctuating rates, at the Company’s election in advance for any applicable interest period, by reference to the "base rate", "Eurodollar rate" or "Canadian Prime Rate" plus the applicable margin within the relevant range of margins provided in the Credit Facility. The base rate is the highest of (i) the rate BMO Harris Bank N.A. announces as its "prime rate," (ii) 0.50% above the rate on overnight federal funds transactions or (iii) the London Interbank Offered Rate (LIBOR) for an interest period of one month plus 1.00%. The applicable margin is determined quarterly based on the Company’s Total Leverage Ratio, as described below. The borrowings were subject to interest rates ranging from 3.57% - 6.50% at December 31, 2016.
The Canadian Dollar borrowings under the Amended Credit Facility bear interest at fluctuating rates, at the Company’s election in advance for any applicable interest period, by reference to the "Canadian Prime Rate" plus the applicable margin within the relevant range of margins provided in the Amended Credit Facility. The Canadian Prime Rate is the higher of (i) the rate the Bank of Montreal announces as its "reference rate," or (ii) the Canadian Dollar Offered Rate (CDOR) for an interest period equal to the term of any applicable borrowing plus 0.50%. The applicable margin is determined quarterly based on the Company’s Total Leverage Ratio, as described below. The maximum and initial margin for interest rates after March 31, 2016 on Canadian borrowings under the Credit Facility is 2.75% on base rate loans. The borrowings were subject to interest rates ranging from 4.00% - 4.66% at December 31, 2016.
The Credit Facility contains customary events of default, including the failure to pay any principal, interest or other amount when due, violation of certain of the Company’s affirmative covenants or any negative covenants or a breach of representations and warranties and, in certain circumstances, a change of control. Upon the occurrence of an event of default, payment of indebtedness may be accelerated and the lending commitments may be terminated.
The Credit Facility also contains financial covenants with which the Company must comply on a quarterly or annual basis, which have been amended since entering into the Original Credit Facility, including a Total Funded Debt to EBITDA Ratio (or "Total Leverage Ratio", as defined). Total Funded Debt as it relates to the Total Leverage Ratio is defined as all indebtedness (a) for borrowed money, (b) for the purchase price of goods or services, (c) secured by assets of the Company or its Subsidiaries, (d) for any capitalized leases of property, (e) for letters of credit or other extensions of credit, (f) for payments owed regarding equity interests in the Company or its Subsidiaries, (g) for interest rate, currency or commodities hedging arrangements, or (h) for any guarantees of any of the foregoing as of the end of the most recent fiscal quarter. Consistent with the Original Credit Facility, Permitted Acquisitions are subject to bank review and a maximum Total Leverage Ratio, after giving effect to such acquisition. The Company must also comply with a minimum Fixed Charge Coverage Ratio. Fixed charge coverage is defined as the ratio of (a) EBITDA less unfinanced capital expenditures for the four trailing quarterly periods to (b) fixed charges (principal and interest payments, taxes paid and other restricted payments); except that for the first three quarters of 2016, for the purposes of determining this ratio, EBITDA will be calculated based on a multiple of the then current EBITDA, instead of using the EBITDA for the prior four quarters. A similar annualization adjustment will be made for unfinanced capital expenditures for the same period. EBITDA includes after tax earnings with add backs for interest expense, income taxes, depreciation and amortization, share-based compensation expenses, and other additional items as outlined in the Credit Facility. In addition, the Credit Facility covenants include a minimum net worth covenant, which was revised effective March 31, 2016. Net worth is defined as the total shareholders’ equity, including capital stock, additional paid in capital, and retained earnings after deducting treasury stock. The Amended Credit Facility includes a mandatory prepayment clause requiring certain cash payments when EBITDA exceeds defined requirements for the most recently completed fiscal year. These prepayments will be applied first to outstanding term loans and then to the revolving credit. There were no such mandatory prepayments for the year ended December 31, 2016.
The Company also is subject to a limitation on its indebtedness based on quarterly calculations of a Borrowing Base. The Borrowing Base is determined based upon Eligible Receivables and Eligible Inventory and is calculated separately for the United States and Canadian borrowings. If the total amount of principal outstanding for revolving loans, term loans, letters of credit and other defined obligations is in excess of the Borrowing Base, then the Company is required to repay the difference or be in default of the Credit Facility.
65
As of December 31, 2016, the Company owed $21.5 million under the Credit Facility as shown in the table below. The Company also had $6.4 million outstanding in standby letters of credit under the Credit Facility related to the contingent consideration agreement with the former owners of the Canadian Founding Companies and the Company’s property and casualty insurance program. As of June 30, 2016, September 30, 2016, and December 31, 2016, for reasons described in Note 1, the Company was in breach of the Credit Facility’s Total Leverage Ratio and Fixed Charge Coverage Ratio requirements and the Borrowing Base requirement for repaying over-advances (which were created by establishing lower acquired inventory values as described in Note 4 that reduced the applicable borrowing base), as well as the requirement for timely delivery of certain quarterly certificates and reports. Since the Company is in default as of the date that this Annual Report on Form 10-K is being filed, all of the Credit Facility debt is being reported as a current liability in the accompanying consolidated balance sheet as of December 31, 2016, and there can be no further borrowings of any availability under the Credit Facility until such defaults are rectified or waived.
On March 27, 2017, the Company entered into a Forbearance Agreement to the Credit Facility (the "Forbearance Agreement") with BMO Harris Bank N.A. and its Canadian affiliate, Bank of Montreal. Pursuant to the Forbearance Agreement, the banks have agreed to forbear from exercising their rights and remedies under the Credit Facility with respect to the above-described defaults and any similar defaults during the forbearance period, provided no other defaults occur. The Forbearance Agreement was amended on June 23, 2017 to extend the forbearance period, which had originally expired on May 26, 2017, until August 31, 2017 and to resolve certain new defaults. The Forbearance Agreement, as amended, also permits the Company to add the quarterly interest payments otherwise due for the first two quarters of 2017 to the principal amount of debt outstanding and defer the $250,000 principal payments due on March 31, 2017 and June 30, 2017 to the end of the forbearance period. If the Company is unable to reach further agreement with its lenders to obtain waivers or amendments to the existing Credit Facility, find acceptable alternative financing, obtain equity contributions, or arrange a business combination, after the forbearance period (and during the forbearance period in the event of any new defaults other than those anticipated defaults enumerated in the Forbearance Agreement, as amended), the Company’s Credit Facility lenders could elect to declare some or all of the amounts outstanding under the facility to be immediately due and payable. If this happens, the Company does not expect to have sufficient liquidity to pay the outstanding Credit Facility debt.
The Board of Directors of the Company has engaged a financial advisor to advise the Board and Company management and to assist in pursuing a range of potential strategic and financial transactions that will provide the Company with improved liquidity and maximize shareholder value. The financial advisor will identify and evaluate potential alternatives including a business combination, debt and/or equity financing, or a strategic investment into the Company, and is reporting directly to a special committee of independent directors established to oversee and coordinate these activities. The Board has not set a definitive timetable for completion of this process. There can be no assurance that this process will result in a transaction or other strategic alternative of any kind. Furthermore, the June 29, 2017 suspension in trading and eventual delisting of Fenix common stock on the Nasdaq Global Market negates the Company's ability to pursue strategic and financial transactions available only to listed companies.
Maturities of Credit Facility
The following is a summary of the components of the Company’s Credit Facility debt and amounts outstanding at December 31, 2016 and December 31, 2015:
(In thousands) | December 31, 2016 | December 31, 2015 | |||||
Obligations: | |||||||
Term loan | $ | 8,665 | $ | 9,625 | |||
Revolving credit facility | 12,815 | 11,200 | |||||
Total debt | 21,480 | 20,825 | |||||
Less: long-term debt issuance costs | — | (299 | ) | ||||
Less: short-term debt issuance costs | (386 | ) | (88 | ) | |||
Total debt, net of issuance costs | 21,094 | 20,438 | |||||
Less: current maturities, net of debt issuance costs | (21,094 | ) | (793 | ) | |||
Long-term debt, net of issuance costs | $ | — | $ | 19,645 | |||
Scheduled maturities, which the Company continues to follow, are as follows for the years ending December 31; however, as described above, the Company is in default under the Credit Facility and the lenders could elect to declare some or all of the amounts shown below as immediately due and payable and therefore all the debt is classified as a current liability in the accompanying consolidated balance sheet.
66
(In thousands) | 2017 | 2018 | 2019 | 2020 | Total | ||||||||||||||
Revolving credit facility | $ | — | $ | — | $ | — | $ | 12,815 | $ | 12,815 | |||||||||
Term loan | 1,000 | 1,000 | 1,000 | 5,665 | 8,665 | ||||||||||||||
Debt issuance costs | (113 | ) | (113 | ) | (113 | ) | (47 | ) | (386 | ) | |||||||||
Total | $ | 887 | $ | 887 | $ | 887 | $ | 18,433 | $ | 21,094 | |||||||||
Debt Issuance Costs
As noted above, the Company entered into the Amended Credit Facility effective December 31, 2015 and amendments thereafter effective as of March 31, 2016 and June 30, 2016, that were deemed under ASC 470 to be a modification of the Original Credit Facility. As such, debt issuance costs will continue to be amortized over the remaining term of the Amended Credit Facility. As the termination date of the Amended Credit Facility is the same as the Original Credit Facility, this did not change the continuing impact of previous debt issuance costs.
In connection with the Original Credit Facility, the Company incurred $438,000 in original debt issuance costs during 2015 and an additional $102,000 in amendment charges during 2016, which are netted against the term loan balance and are being amortized over the term of the Original Credit Facility. The amortized debt issuance costs are recognized as interest expense in the consolidated statement of operations and amounted to $104,000 and $51,000 for the years ended December 31, 2016 and 2015, respectively.
Note 6. Contingent Consideration
As part of the consideration for three of the Founding Companies, the Company entered into contingent consideration agreements with certain of the selling shareholders, as described in the paragraphs below. Under the terms of the contingent consideration agreements, additional consideration will be payable to the former owners if specified future events occur or conditions are met, such as meeting profitability or earnings targets. The fair value of the aggregate contingent consideration was initially estimated as $10.2 million and recorded in the consolidated financial statements at the acquisition date based on independent valuations considering the Company’s initial projections for the relevant Founding Companies, the respective target levels, the relative weighting of various future scenarios and a discount rate of approximately 5.0%. Management periodically reviews the amount of contingent consideration that is likely to be payable under current operating conditions and has since adjusted the initial liability as deemed necessary, with such subsequent adjustments being recorded through the consolidated statement of operations as an operating charge or credit. In the event that there is a range of possible outcomes, the Company applies a probability approach to determine the estimated obligation to be recorded at the end of an accounting period.
For the combination with Jerry Brown, Ltd. ("Jerry Brown"), the Company is required to pay (a) up to an additional $1.8 million if the business achieved certain revenue targets during the twelve-month period beginning June 2015, and (b) an additional uncapped amount if the business exceeds certain EBITDA levels during 2016. Based on an evaluation of the likelihood of meeting these performance targets, the Company recorded a liability for the acquisition date fair value of the contingent consideration of $2.5 million and increased this liability by $5.1 million during 2015 based on substantial operating improvements and management’s budget for Jerry Brown for 2016. Based on results actually achieved during 2016, the estimated fair value of the contingent liability was reduced by $3.8 million, resulting in a credit to income which is reflected in the consolidated statement of operations for the year ended December 31, 2016. As of December 31, 2016, the total contingent consideration liability attributable to the Jerry Brown acquisition was (a) $1.8 million for achieving the revenue target, which management and the former owners of Jerry Brown agree was fully earned and is currently due and payable, and (b) $2.0 million estimated for the EBITDA target which will be determined in 2017. The Company is in negotiations with the former owners of Jerry Brown to schedule payment of currently due amounts and expects to fund these and future determined payments to the former owners of Jerry Brown, to the extent they are ultimately deemed earned, through cash generated from operations or, if necessary and available, through draws on the revolving Credit Facility or through other sources of capital that may be available.
The combination agreements for Eiss Brothers, Inc. ("Eiss Brothers") and End of Life Vehicles Inc., Goldy Metals Incorporated, and Goldy Metals (Ottawa) Incorporated (collectively, "the Canadian Founding Companies") provide for a holdback of additional consideration which will be payable, in part or in whole, only if certain performance targets are achieved. The maximum amount of additional consideration that can be earned by the former owners of Eiss Brothers is $0.2 million in cash plus 11,667 shares of Fenix common stock, of which none, some or all will be released from escrow depending upon the EBITDA of Eiss Brothers during the twelve-month period beginning June 2015. The maximum amount of additional consideration that can be earned and is subject to holdback for the Canadian Founding Companies is $5.9 million in cash, secured by a letter of credit under our Credit Facility, plus 280,000 Exchangeable Preferred Shares currently held in escrow, of which, none, some or all will be released to the former owners of the Canadian Founding Companies depending on their combined revenues from specific types of sales for the twelve-month period beginning June 2015. Based on management’s evaluation of the likelihood of meeting these performance targets for these two acquisitions, a liability of $7.8 million was recorded at the acquisition date for the fair value of the aggregate contingent consideration, which included the present value of the
67
estimated cash portion and the then-current value of the Fenix common stock and the Exchangeable Preferred Shares held in escrow. While management’s estimate of the operating results for Eiss Brothers has not changed since its acquisition, the contingent consideration liability for the Canadian Founding Companies was remeasured at fair value each reporting period during the year ended December 31, 2016. As the amount of the contingent consideration is currently in dispute, the Company has recorded the estimated contingent consideration liability for the Canadian Founding Companies as of December 31, 2016 based on the result of its assessment of the possible outcomes. These contingent consideration liabilities are also subject to mark-to-market fluctuations based on changes in the trading price of Fenix common stock and, with respect to the Canadian Founding Companies, currency remeasurement. As a result of all these factors, the estimated fair value of the aggregate contingent liability due to the former owners of Eiss Brothers and the Canadian Founding Companies was reduced by $4.3 million and $0.0 million, and an exchange rate gain of $0.5 million and $0.0 million was recognized in the consolidated statements of operations for the years ended December 31, 2016 and 2015, respectively. The Company is currently at an impasse in negotiations with the former owners of the Canadian Founding Companies regarding the calculation of contingent consideration earned, if any, and the parties have begun the process of submitting their respective calculations to binding arbitration. The Company expects that contingent consideration payments to the former owners of the Canadian Founding Companies, to the extent they are ultimately deemed earned, will be drawn on the bank letter of credit, which is considered Funded Debt under the Total Leverage Ratio required under the Credit Facility.
Note 7. Common Stock and Preferred Shares
Fenix was formed and initially capitalized in January 2014 by a group of investors, including the Chief Executive and the Chief Financial Officers, who paid nominal cash consideration for an aggregate of 1.8 million shares of Fenix common stock. In March and April 2014, Fenix issued and sold an aggregate of 402,000 shares of common stock for a purchase price of $5.00 per share. During the period of September 2014 through May 2015, Fenix issued and sold an aggregate of 546,927 shares of common stock for an ultimate purchase price of $6.50 per share. Of these shares, 20,000 were issued to certain investors for no cash consideration in order to effectively convert their $7.50 per share investments to $6.50 per share investments.
The Company completed its IPO on May 19, 2015. The Company raised approximately $110.4 million in gross proceeds from the IPO by selling 13.8 million shares at $8.00 per share and netted $101.3 million in the IPO after paying the underwriter’s discount and other offering costs.
The agreements that relate to the common stock sales in March, April and September 2014 included provisions that obligated the holders of the common stock issued in January 2014 to compensate the investors in the later sales if the IPO price of Fenix common stock was less than $10.00 per share. As the IPO price was $8.00 per share, the initial investors transferred 237,231 of their shares to the later investors equal in value to the aggregate difference in value between the IPO price of $8.00 per share and $10.00 per share, resulting in a charge of $1.7 million to other expense as of the IPO date. The later investors were also granted registration rights.
Effective May 19, 2015, the Company issued 1,050,000 exchangeable preferred shares of Fenix’s subsidiary, Fenix Parts Canada, Inc. ("Exchangeable Preferred Shares") as acquisition consideration valued at the public offering price of common stock of $8.00 per share. Because these shares do not entitle the holders to any Fenix Canada dividends or distributions, no earnings or losses of Fenix Canada are attributable to those holders. These shares are exchangeable on a 1-for-1 basis for shares of Fenix's common stock. The single share of special voting stock is entitled to vote on any matter submitted to a vote of holders of Fenix's common stock a number of votes equal to the number of Exchangeable Preferred Shares of Fenix Parts Canada, Inc. issued to the former shareholders of the Canadian Founding Companies. The share of special voting stock is intended to provide the former shareholders of the Canadian Founding Companies the equivalent voting rights in Fenix common stock they would have received if the combination agreement for the Canadian Founding Companies had required Fenix to issue shares of Fenix common stock instead of Exchangeable Preferred Shares. The share of special voting stock is held in a voting trust for the benefit of the former shareholders of the Canadian Founding Companies, and the trustee of the voting trust will vote the share of special voting stock in accordance with the beneficiaries’ directions. Neither the holder of the share of special voting stock nor the beneficiaries of the share of special voting stock is entitled to receive any dividends or other distributions that Fenix may make in respect of shares of Fenix's common stock.
Note 8. Share-based Compensation
Fenix’s 2014 Incentive Stock Plan (the "Plan") was adopted by the Board of Directors in November 2014 and went into effect January 6, 2015 after it was approved by the Company’s shareholders. The Plan was amended by the Board of Directors and restated effective July 8, 2015 and again in November 2015, effective December 1, 2015. The Plan permits grants of stock options, stock appreciation rights, restricted stock, restricted stock units, performance awards (in the form of equity bonuses), and other awards (which may be based in whole or in part on the value of the Company’s common stock). Directors, salaried employees, and consultants of the Company and its commonly-controlled affiliates are eligible to participate in the Plan, which is administered by the Compensation Committee of the Company’s Board of Directors. The number of shares originally reserved for share-based awards under the Plan equaled 2,750,000 shares. No awards were granted prior to the IPO. As of December 31, 2016, the Company had 383,303 shares available for share-based awards
68
under the Plan. The Plan requires that each restricted stock unit and each share of restricted stock awarded reduce shares available by two shares.
Share-based compensation is included in SG&A expenses in the consolidated statements of operations. The components of share-based compensation were as follows:
Year Ended December 31, | |||||||
(In thousands) | 2016 | 2015 | |||||
Stock options | $ | 1,362 | $ | 1,279 | |||
Restricted stock grants | 435 | 171 | |||||
Leesville bonus shares | 790 | 1,378 | |||||
Other restricted or unregistered share issuances | 50 | 217 | |||||
Total share-based compensation | $ | 2,637 | $ | 3,045 | |||
Stock Options
Stock options granted to employees under the Plan typically have a 10-year life and vest in equal installments on each of the first four anniversary dates of the grant, although certain awards have been made with a shorter vesting period. The Company calculates stock compensation expense for employee option awards based on the grant date fair value of the award, less actual annual forfeitures, and recognizes expense on a straight-line basis over the service period of the award. Stock options granted to non-executive directors vest on the first anniversary of the award date. Stock compensation expense for these awards to non-executive directors is based on the grant date fair value of the award and is recognized on a straight-line basis over the one-year service period of the award.
The Company uses the Black-Scholes option pricing model to estimate the grant date fair value of employee and director stock options. The principal variable assumptions utilized in valuing options and the methodology for estimating such model inputs include: (1) risk-free interest rate – an estimate based on the yield of zero–coupon treasury securities with a maturity equal to the expected life of the option; (2) expected volatility – an estimate based on the historical volatility of similar companies’ common stock for a period equal to the expected life of the option; (3) expected life of the option – an estimate based on industry historical experience including the effect of employee terminations; and (4) expected dividend yield - an estimate of cash dividends. The Company does not currently intend to pay cash dividends and thus has assumed a 0% dividend yield. In accordance with ASU No. 2016-09, all forfeitures were applied when they occurred. The forfeitures as noted below first occurred in the six months ended December 31, 2016.
Based on the results of the model, the fair value of the stock options granted during 2016 ranged from $1.00 to $1.54 per share. For stock options granted during the year ended 2015 the fair value ranged from $2.47 to $3.33 per share. The following assumptions were used to compute the fair value for each year:
2016 | 2015 | |||||
Expected dividend yield | — | % | — | % | ||
Risk-free interest rate | 1.1 - 2.05% | 1.57 - 1.85% | ||||
Expected volatility | 30.0 | % | 30.0 | % | ||
Expected life of option | 6.3 years | 5.3 | - | 6.3 years | ||
Stock option activity for the year ended December 31, 2016 was as follows:
Number of Options | Weighted- Average Exercise Price Per Share | Weighted- Average Remaining Contractual Term in Years | Aggregate Intrinsic Value | ||||||||||
Balance at December 31, 2015 | 1,590,297 | $ | 9.02 | ||||||||||
Granted | 532,750 | 3.93 | |||||||||||
Exercised | — | — | |||||||||||
Expired or forfeited | (73,500 | ) | 9.19 | ||||||||||
Vested shares forfeited | (1,250 | ) | 9.60 | ||||||||||
Balance at December 31, 2016 | 2,048,297 | $ | 7.69 | 8.68 | $ | — | |||||||
Exercisable on December 31, 2016 | 738,139 | $ | 8.99 | 8.26 | $ | — | |||||||
69
At December 31, 2016, there was $2.5 million of unrecognized compensation costs related to stock option awards to be recognized over a weighted average period of 2.7 years.
Restricted Stock Units
Restricted stock units (RSUs) granted to employees and directors vest over time based on continued service (typically, for employees, vesting over a four or five year period in equal annual installments). Such time-vested RSUs are valued at fair value based on the closing price of Fenix common stock on the date of grant. Compensation cost is amortized on a straight-line basis over the requisite service period.
A summary of restricted stock unit activity for the year ended December 31, 2016 is as follows:
Number of Awards | Weighted- Average Grant Date Fair Value Per Share | |||||
Unvested restricted stock units at December 31, 2015 | 150,000 | $ | 9.68 | |||
Granted | 29,332 | 4.23 | ||||
Forfeited | (23,000 | ) | 9.66 | |||
Vested | (54,332 | ) | 7.66 | |||
Unvested restricted stock units at December 31, 2016 | 102,000 | $ | 9.19 | |||
At December 31, 2016, there was $0.8 million of unrecognized compensation costs related to restricted stock units to be recognized over a weighted average period of 2.9 years.
The Company’s Director Compensation Policy provides that non-employee directors may elect to receive shares of fully-vested common stock in lieu of cash compensation based on the average closing price of the Company’s common stock during the period of service. During the years ended December 31, 2016 and 2015, the Company issued 19,332 and 2,868 fully-vested shares to the directors making such election and recorded total compensation expense of approximately $0.3 million (includes the accrued cost of services for which shares had not yet been issued as of December 31, 2016) and $0.1 million, respectively.
Leesville Bonus Shares
The Company issued 271,112 restricted shares of common stock as part of the closing of the Leesville acquisition for post-combination services of certain Leesville employees. The shares fully vested on May 13, 2016, twelve months after the grant date.
Employee Stock Purchase Plan
At the Company’s Annual Meeting on May 24, 2016, the Company’s shareholders approved the Employee Stock Purchase Plan ("ESP Plan") effective June 1, 2016. The number of shares authorized for purchase under the ESP Plan is 750,000. The first offering period commenced on July 1, 2016 and, on the first conversion date of October 1, 2016, the Company issued 46,582 shares for the ESP Plan for $158,000. During the year ended December 31, 2016, the Company collected $0.2 million from participating employees.
Other Awards
During June 2015, the Company issued a total of 20,000 unregistered common shares to two current employees in payment of their fees for pre-Combination services when they were consultants of the Company. Compensation expense for these awards is based on the share price on the date of grant and approximately $217,000 in expense was recorded during the year ended December 31, 2015.
In January 2016, the Company paid a consultant fee of $50,000 in the form of 10,707 unregistered shares.
Note 9. Loss Per Share
Basic loss per common share is computed by dividing net loss available to common shares by the weighted average common shares outstanding during the period using the two-class method. The Fenix Canada preferred shares do not entitle the holders to any dividends or distributions and therefore, no earnings or losses of Fenix Canada are attributable to those holders. However, these shares are considered participating securities and therefore share in the Company’s net income (loss) of the period since being issued on May 19, 2015. Diluted income (loss) per share includes the impact of outstanding common share equivalents as if those equivalents were exercised or converted into common shares if such assumed exercise or conversion is dilutive.
The calculations of loss per share are as follows:
70
Year Ended December 31, | |||||||||||
(In thousands except share data) | 2016 | 2015 | 2014 | ||||||||
Basic loss per common share computation: | |||||||||||
Net loss | $ | (42,869 | ) | $ | (26,041 | ) | $ | (4,746 | ) | ||
Net loss allocable to Fenix Canada preferred shares | (2,152 | ) | (1,222 | ) | — | ||||||
Net loss available to common shareholders | $ | (40,717 | ) | $ | (24,819 | ) | $ | (4,746 | ) | ||
Weighted-average common shares outstanding | 19,869,316 | 13,332,691 | 2,142,994 | ||||||||
Basic loss per common share | $ | (2.05 | ) | $ | (1.86 | ) | $ | (2.22 | ) | ||
The Company has 11,667 common shares and 280,000 shares of Fenix Canada exchangeable preferred stock held in escrow relating to contingent consideration agreements relating to certain acquired companies. These shares are not included in basic loss per share or in the shares used to calculate the net loss attributable to Fenix Canada preferred shares and will not be included until the contingencies relating to their issuance have been determined, and some, all or none of these shares have been issued. Outstanding stock options and unvested restricted stock units described in Note 8 above are not included in the computation of diluted loss per share for any periods during which the inclusion of such equity equivalents would be anti-dilutive. The Leesville bonus shares described in Note 8 above are included in the weighted-average common shares outstanding subsequent to their vesting in May 2016.
Note 10. Income Taxes
The components of loss before income taxes for the years ended December 31 are as follows:
(In thousands) | 2016 | 2015 | 2014 | ||||||||
United States | $ | 39,892 | $ | 28,236 | $ | 4,746 | |||||
Canada | 9,263 | 4,829 | — | ||||||||
Loss before income taxes | $ | 49,155 | $ | 33,065 | $ | 4,746 | |||||
Significant components of income tax benefit for the years ended December 31 are as follows:
(In thousands) | 2016 | 2015 | 2014 | ||||||||
Current: | |||||||||||
United States | $ | 1,826 | $ | (1,638 | ) | $ | — | ||||
Canada | — | — | — | ||||||||
Total current | 1,826 | (1,638 | ) | — | |||||||
Deferred: | |||||||||||
United States | 4,460 | 8,203 | — | ||||||||
Canada | — | 459 | — | ||||||||
Total deferred | 4,460 | 8,662 | — | ||||||||
Income tax benefit | $ | 6,286 | $ | 7,024 | $ | — | |||||
A reconciliation between the provision for income taxes calculated at the U.S. federal statutory income tax rate and the income tax benefit recognized in the consolidated statements of operations for the years ended December 31 is as follows:
2016 | 2015 | 2014 | ||||||
Benefit at the U.S. federal statutory rate | 34.0 | % | 34.0 | % | 34.0 | % | ||
State taxes, net of federal benefit | 1.3 | 1.5 | 4.9 | |||||
Foreign tax rate differential | (1.4 | ) | (1.3 | ) | — | |||
Non-deductible transaction costs | — | (3.7 | ) | (33.0 | ) | |||
Change in valuation allowance | (2.3 | ) | (1.8 | ) | (5.9 | ) | ||
Changes in contingent and other additional consideration | 3.7 | (4.5 | ) | — | ||||
Goodwill impairment | (26.3 | ) | — | — | ||||
Reduction in reserves for uncertain tax positions | 7.2 | — | — | |||||
Other non-deductible expenses | (2.1 | ) | (2.8 | ) | — | |||
Other | (1.3 | ) | (0.2 | ) | — | |||
Income tax benefit effective rate | 12.8 | % | 21.2 | % | — | % | ||
71
The deferred tax assets and liabilities at December 31, 2016 and 2015 are as follows:
2016 | 2015 | ||||||||||||||||||
(In thousands) | U.S. | Canada | Combined | U.S. | Canada | Combined | |||||||||||||
Deferred tax assets | |||||||||||||||||||
Accrued expenses and reserves | $ | 1,164 | $ | 114 | $ | 1,278 | $ | 714 | $ | 22 | $ | 736 | |||||||
Net operating loss carryforwards | 247 | 1,432 | 1,679 | 92 | 903 | 995 | |||||||||||||
Intangibles | — | 1,105 | 1,105 | — | 65 | 65 | |||||||||||||
Share-based compensation | 792 | — | 792 | 961 | — | 961 | |||||||||||||
State tax credits | 26 | — | 26 | 33 | — | 33 | |||||||||||||
Total deferred tax assets | $ | 2,229 | $ | 2,651 | $ | 4,880 | $ | 1,800 | $ | 990 | $ | 2,790 | |||||||
Deferred tax liabilities | |||||||||||||||||||
Inventories | $ | (1,683 | ) | $ | — | $ | (1,683 | ) | $ | (6,397 | ) | $ | (317 | ) | $ | (6,714 | ) | ||
Intangibles | (5,904 | ) | — | (5,904 | ) | (7,831 | ) | — | (7,831 | ) | |||||||||
Property and equipment | (2,812 | ) | (219 | ) | (3,031 | ) | (3,196 | ) | (14 | ) | (3,210 | ) | |||||||
Contingent consideration | — | (695 | ) | (695 | ) | — | (55 | ) | (55 | ) | |||||||||
Total deferred tax liabilities | $ | (10,399 | ) | $ | (914 | ) | $ | (11,313 | ) | $ | (17,424 | ) | $ | (386 | ) | $ | (17,810 | ) | |
Valuation allowance | — | (1,737 | ) | (1,737 | ) | — | (604 | ) | (604 | ) | |||||||||
Net deferred tax liability | $ | (8,170 | ) | $ | — | $ | (8,170 | ) | $ | (15,624 | ) | $ | — | $ | (15,624 | ) | |||
From its inception through May 2015, the Company incurred start-up costs that resulted in pre-tax losses. A full valuation allowance was established as of December 31, 2014 and through the IPO date against this potential benefit because the uncertainty of the Company’s future prospects at those balance sheet dates resulted in it being more likely than not that the deferred income tax asset relating to the benefit would not be realized. However, upon the successful closing of the Combinations in May 2015 and the concurrent recognition of significant deferred income tax liabilities, as well as the expectation of future pre-tax income from the acquired operating companies, the Company concluded that it was more likely than not that the deferred tax assets will be realized, and accordingly, recorded an income tax benefit from reversing the allowance of approximately $0.3 million upon the closing of the Combinations.
The Canadian operations were acquired as a taxable asset purchase and the Canadian deferred income tax liability created upon acquisition was thus significantly less than in the United States, where Fenix acquired the stock of most of its U.S. Founding Companies and Subsequent Acquisitions. As of December 31, 2016 and 2015, the Company had a net deferred tax asset of $1.7 million and $0.6 million, respectively, attributable to Canadian subsidiaries, primarily because of net operating loss carryforwards generated in 2015 and 2016 and goodwill impairment in 2016. Based on the available evidence and given the uncertainties associated with generating future taxable income in Canada, the Company has recorded a full valuation allowance for its net Canadian deferred tax assets.
The calculation of tax liabilities involves dealing with uncertainties in the application of complex tax regulations. The Company’s uncertain tax position reserves, including the reserves for related interest and penalties of approximately $0.5 million and $2.4 million, were approximately $2.2 million and $5.7 million as of December 31, 2016 and 2015, respectively, and were all originally assumed as part of the acquisitions of its Subsidiaries. The tax reserves are reviewed periodically and adjusted in light of changing facts and circumstances, such as progress of tax audits, lapse of applicable statutes of limitations, and changes in tax law. Under certain conditions, payments made by the Company, including interest and penalties, for assumed uncertain tax positions are indemnified by the previous owners of the Subsidiaries for a period of three years from the acquisition and there is an indemnification receivable of $2.0 million and $5.1 million recorded in the consolidated balance sheets as of December 31, 2016 and 2015, respectively. During the year ended December 31, 2016, the statute of limitations lapsed without audit for certain tax returns filed by acquired companies for which reserves for uncertain tax positions and indemnification receivables had been established. As a result, the Company reversed approximately $3.4 million of uncertain tax position reserves, which included $1.9 million of accrued interest and penalties, as a credit to current income tax benefit in the consolidated statement of operations for 2016. Correspondingly, the indemnification receivables were reduced by $2.9 million through a charge to operating expenses. If a reserved uncertain tax position results in an actual liability and the Company is unable to collect on or enforce the related indemnification provision or if the actual liability occurs after the applicable three-year indemnity period has expired, there could be a material charge to the Company's consolidated financial results and reduction of cash resources.
The Company files income tax returns in the United States and Canada. The Company is not currently subject to any income tax examinations; however, tax returns of Fenix for 2014 (year of inception) and 2015 (consolidated after the Combination) and tax returns of the acquired Subsidiaries for tax years 2013 through pre-acquisition periods in 2015 remain open under the statute of limitations.
The Company has a current tax liability of approximately $1.5 million recorded in accrued expenses in the accompanying consolidated balance sheet as of December 31, 2016, attributable to taxes that it anticipates will be due in 2017 for its consolidated U.S. federal return
72
and certain states' returns where its operations generated taxable income in 2016. The Company had tax loss and credit carryforwards at December 31, 2016, as follows (in thousands):
2016 | Beginning year of Expiration | ||||
State loss carryforwards | $ | 4,845 | 2023 | ||
Canadian loss carryforwards | 5,405 | 2035 | |||
State tax credits | 26 | 2025 | |||
Note 11. Goodwill
Goodwill represents the excess of the cost of an acquired business over the net of the amounts assigned to assets acquired and liabilities assumed. Changes in the carrying amount of goodwill were as follows:
(In thousands) | Total | ||
Balance as of December 31, 2014 | $ | — | |
Business acquisitions | 80,023 | ||
Exchange rate effects | (3,211 | ) | |
Balance as of December 31, 2015 | $ | 76,812 | |
Purchase accounting allocation adjustments (see Note 4) | 5,403 | ||
Goodwill impairment | (45,300 | ) | |
Exchange rate effects | 112 | ||
Balance as of December 31, 2016 | $ | 37,027 | |
Pursuant to the provisions of FASB ASC Topic 350, “Intangibles - Goodwill and Other,” goodwill is required to be tested at the reporting unit level for impairment annually or whenever indications of impairment arise. Management has determined the Company operates as one operating segment and one reporting unit, Automotive Recycling, and all the goodwill is considered attributable to that reporting unit for impairment testing. The Company performed its annual goodwill impairment test for 2015 as of October 1, 2015, also updated as of December 31, 2015, and management determined that no impairment of goodwill existed at either date.
During the first quarter of 2016, the Company’s stock price declined 32% from $6.79/share at December 31, 2015 to $4.60/share at March 31, 2016, and management performed Step 1 of the two-step impairment test and determined that potential impairment of the reporting unit existed at March 31, 2016, since book value at such date no longer exceeded the carrying amount. As such, management applied the second step of the goodwill impairment test and, with consideration of a third party valuation report, calculated an estimated fair value as a hypothetical purchase price for the reporting unit to determine the resulting “implied” goodwill (computed by estimating the fair value of the reporting unit and comparing that estimated fair value to the reporting unit’s carrying value). An excess of a reporting unit’s recorded goodwill over its “implied” goodwill is reported as an impairment charge.
The Company’s reporting unit fair value estimates are established using weightings of the Company’s market capitalization and a discounted future cash flow methodology. Management believes that using the two methods to estimate fair value limits the chances of an unrepresentative valuation. Nonetheless, these valuations are subject to significant subjectivity and assumptions as discussed further below.
The Company considers its current market capitalization compared to the sum of the estimated fair values of its business in conjunction with each impairment assessment. As part of this consideration, management recognizes that the Company’s market capitalization at March 31, 2016, or at any specific date, may not be an accurate representation of fair value for the following reasons:
• | The long-term horizon of the valuation process versus a short-term valuation using current market conditions; |
• | The timeliness of Company information available to the market; and |
• | Control premiums reflected in the reporting unit fair values but not in the Company’s stock price. |
In addition to market capitalization analysis the Company re-performed a discounted future cash flow analysis for the purpose of determining the amount of goodwill impairment. Such analysis relies on key assumptions, including, but not limited to, the estimated future cash flows of the reporting unit, weighted average cost of capital (“WACC”), and terminal growth rates of the Company. The determination of fair value is highly sensitive to differences between estimated and actual cash flows and changes in the WACC and related discount rate used to evaluate the fair value of the reporting unit. In evaluating the key variables this time, management (a) reduced the estimated future cash flows based upon actual results achieved during the three months ended March 31, 2016 and revised projections,
73
and (b) concluded that the Company’s WACC and terminal growth rates were 13% and 3%, respectively, as compared to 10% and 3% used in the test at October 1, 2015.
Based on the result of this second step of the goodwill impairment analysis as of March 31, 2016, the Company recorded a $45.3 million non-cash charge to reduce the carrying value of goodwill. The impairment calculation was based on a combination of the market capitalization and discounted cash flow methodologies, although a 10% change in the weighting of the two valuation approaches at such date would not have had a significant effect on the amount of the impairment recorded at March 31, 2016. The Canadian Founding Companies were acquired in 2015 in an asset purchase, and the tax benefit associated with the portion of this charge related to the Canadian Founding Companies was offset by a valuation allowance because of the uncertainties associated with generating future taxable income in Canada.
The Company completed its annual goodwill impairment test as of October 1, 2016. Inherent in the Company's analysis is the reliance on key assumptions, including, but not limited to, weightings for the methodologies used and estimating the future cash flows of the reporting unit, weighted average cost of capital ("WACC"), and terminal growth rates. As part of the Company's annual budget process and in light of the operating losses incurred in 2016, management prepared its 2017 forecast and seven year outlook so as to derive a reasonable view of the cash flows that the business would generate from 2017-2023. In evaluating the key variables, the Company assumed that its WACC and terminal growth rates were 13.5% and 3%, respectively, and also revised its weightings between the two methodologies. In an updated quantitative analysis at December 31, 2016, the Company assumed that its WACC and terminal growth rates were 14.0% and 3%, respectively, and again revised methodology weightings to substantially eliminate use of the market approach calculation because of the refinements that enhanced the income approach and delays in quarterly reporting of financial results that made it impracticable for the market to evaluate the value of the reporting unit at that time. As a result of these assumptions and quantitative analyses, it was calculated that the estimated fair value of the Company's reporting unit exceeded its carrying value by approximately 14% and 7% as of October 1, 2016 and December 31, 2016, respectively.
While management believes that the estimates and assumptions underlying the valuation methodology at the various dates described above are reasonable, different estimates and assumptions could result in substantially different outcomes. The table below presents the decrease in the estimated fair value of the reporting unit given a one percent increase in the discount rate or a one percent decrease in the long-term assumed annual revenue growth rate using the assumptions in the calculations as of December 31, 2016.
Decrease in Fair Value of Reporting Unit as of December 31, 2016 (in thousands) | |||
Discount Rate - Increase by 1% | $ | 12,000 | |
Long-term Growth Rate - Decrease by 1% | $ | 5,000 | |
A goodwill impairment analysis requires significant judgments, estimates and assumptions, and the results of the impairment analysis described above are as of a specific point in time. Future events that could result in further interim assessments of goodwill and a potential further impairment include, but are not limited to, (a) significant underperformance relative to historical or projected future operating results and/or reductions in estimated future sales growth rates, (b) further reduction in scrap prices, (c) further reduction in the Canadian exchange rate, (d) an increase in the Company’s weighted average cost of capital, (e) significant increases in vehicle procurement costs, (f) significant changes in the manner of or use of the assets or the strategy for the Company’s overall business, (g) variation in vehicle accident rates or other significant negative industry trends, (h) changes in state or federal laws, (i) a significant economic downturn, (j) the inability to successfully complete the Company's ongoing process to explore and ultimately consummate a strategic and/or financial transaction that will provide the Company with improved liquidity and maximize shareholder value, or (k) changes in other variables that can materially impact the Company’s business.
Note 12. Commitments and Contingencies
Operating Leases
Rental expense for operating leases, including the non-cash charge attributable to straight-lining rent expense over the lease term as described in Note 2, was approximately $3.6 million and $1.7 million for the years ended December 31, 2016 and 2015, respectively. The Company leases its operating facilities from the former owners of the Subsidiaries acquired in 2015 and other related parties; see Note 15. The Company did not enter into any significant new leases during the year ended December 31, 2016.
The following represents the future minimum lease payment schedule for all operating leases, including the related party facility leases discussed in Note 15, as of December 31, 2016:
74
(In thousands) | 2017 | 2018 | 2019 | 2020 | 2021 | Thereafter through 2030 | |||||||||||||||||
Operating leases | $ | 2,604 | $ | 2,598 | $ | 2,562 | $ | 2,652 | $ | 2,678 | $ | 25,846 | |||||||||||
Legal, Environmental and Related Contingencies
At any given time, Fenix is subject to claims and actions incidental to the operations of its business. Based on the information currently available, the Company does not expect that any sums it may receive or have to pay in connection with any legal proceeding would have a material adverse effect on its consolidated financial position or net cash flow.
Ground water and surface water contamination has been detected in the past at the facility in Toronto, Ontario, that the Company acquired as lessee when it acquired the assets of Goldy Metals Incorporated ("GMI"), in connection with the Combinations, as a result of historical releases and a petroleum hydrocarbon spill in November 2010. Since November 2010, the Ontario Ministry of the Environment issued a series of regulatory orders under Ontario’s Environmental Protection Act that required GMI to investigate and remediate areas that were contaminated by the spill and to take protective and remedial actions related to its property and operations as well as adjacent areas. The Company believes GMI has been and is taking necessary steps to resolve this issue with the regulatory authority. Fenix did not assume this liability and GMI, its owner and certain affiliates have agreed to indemnify the Company for a period of three years from the date of Combination against any liability that may be imposed on it as a result of this contamination. However, as the successor to GMI’s business and lessee of the facility, Fenix may become legally responsible for this liability, and the Company and its directors and officers may be responsible under national and provincial laws and regulations for the assessment, delineation, control, clean-up, remediation, monitoring and verification of, or as a result of, any environmental contamination at that site and any affected off-site areas. The owner of GMI and certain affiliates have agreed, pursuant to the Combination Agreements, to be responsible for the costs of an additional storm water management, control and discharge system following the completion of the Combinations. However, there can be no assurance that the owner of GMI or its affiliates will perform their obligations under such agreements and their failure to perform would require the Company to undertake these environmental obligations.
The site and operations in Toronto have been operating since the 1960s. During the last decade, the surrounding parkland and agricultural area, as well as the site itself, have been designated part of a new federal urban park. Accordingly, there has been continual governmental, quasi-governmental, and non-governmental body environmental oversight and intervention, including various enforcement initiatives. The Company anticipates that this will continue.
The Province of Ontario has filed a civil lawsuit against GMI and the owner of the land on which the Toronto, Ontario facility is located claiming damages of CAD $10.5 million plus pre- and post-judgment interest and court costs, for alleged historical and spill-related contamination as well as for alleged property encroachment damage. The lawsuit is currently in the pre-discovery stage. Fenix did not assume this liability, and GMI, its owner and certain affiliates have agreed to indemnify the Company, subject to certain limits as defined in the Combination agreements, for a period of three years from the date of Combination against any liability that may be imposed on us as a result of this liability. However, Fenix may become legally responsible for this liability as the successor to GMI’s business and lessee of the facility. The Company can make no assurances that it will not become responsible for this liability, or that GMI and its owner or their affiliates will have the capacity to indemnify it in the event Fenix becomes responsible for this liability in whole or in part. The Company's responsibility for this liability in whole or in significant part could have a material adverse effect on its results of operations and financial position. The Company has been advised by experts retained by or on behalf of GMI, the landowner and Fenix that the amount of damages, if any, are more likely than not to be less than $0.5 million; however, the Company's responsibility for this liability in amounts exceeding the estimates of our experts could have a material adverse effect on the Company's results of operations and financial position.
Prior to the Company leasing this facility, GMI was also charged by the Province of Ontario for causing or permitting an oil spill in Toronto which allegedly impaired a nearby creek. This matter was settled through a guilty plea on consent, with GMI paying a penalty of CAD $94,000. A future charge and conviction under the same or other environmental statute in Ontario could result in the imposition of a minimum fine of CAD $100,000 per day plus a 25% surcharge, up to a maximum of CAD $10 million. Fenix did not assume this liability, and GMI, its owner and certain affiliates have agreed to indemnify the Company for a period of three years from the date of Combination against any liability that may be imposed on us as a result of this liability. However, Fenix may become legally responsible for this liability as the successor to GMI’s business and lessee of the facility. The Company can make no assurances that it will not become responsible for this liability, or that GMI, and its owner or their affiliates will have the capacity to indemnify the Company in the event it becomes responsible for this liability in whole or in part.
GMI is also the subject of further regulatory orders relating to sedimentation monitoring and control in the creek, rehabilitating the creek area that was diverted in 2011 as well as assessing, preventing, treating and controlling off-site groundwater and surface water discharges. To address these orders, GMI intends to implement a new surface water control, management and discharge system, the details of which are in the process of being negotiated.
75
SEC Inquiry
In September 2016, the Company received a subpoena from the Chicago Regional Office of the SEC requiring the production of various documents, which were all provided during December 2016 and January 2017. The SEC inquiry appears to be focused on the Company’s change during 2016 in its independent registered public accounting firm, its previously announced business combinations and related goodwill impairment charge, the effectiveness of its internal controls over financial reporting and its inventory valuation methodology. The Company’s receipt of a subpoena from the SEC does not mean that it has violated securities laws. Although the Company has incurred substantial legal fees and other costs associated with production of the documents required by the SEC and may incur further costs before this inquiry is concluded, management does not believe that the inquiry will ultimately have a material impact on the Company’s financial condition, results of operations or cash flow, but cannot predict the duration or outcome of the inquiry.
Lawsuits
In January 2017, a class action lawsuit entitled Beezley v. Fenix Parts, Inc. et al, was filed in the United States District Court for the District of New Jersey against the Company, Kent Robertson, its President and Chief Executive Officer, and Scott Pettit, its Chief Financial Officer (the “Defendants”). The lawsuit was filed on behalf of purchasers of the Company’s shares from May 14, 2015 through October 12, 2016. The complaint asserts that all defendants violated Section 10(b) of the Securities Exchange Act of 1934, as amended (the "Exchange Act"), and SEC Rule 10b-5 and that Messrs. Robertson and Pettit violated Section 20(a) of the Exchange Act. The complaint asserts that the defendants made false and/or misleading statements and/or failed to disclose that: (1) the Company had an inadequate inventory valuation methodology; (2) the Company had an inadequate methodology to calculate goodwill impairment; (3) the Company was engaging and/or had engaged in conduct that would result in an SEC investigation; and (4) as a result, the defendants’ statements about the Company’s business, operations, and prospects, were materially false and misleading and/or lacked a reasonable basis at all relevant times. The plaintiffs seek class certification, an award of unspecified damages, an award of reasonable costs and expenses, including attorneys' fees and expert fees, and other further relief as the Court may deem just and proper.
In July 2017, a shareholder derivative lawsuit, entitled Melanie Weiss, derivatively on behalf of Fenix Parts, Inc. v. Kent Robertson, et al, and Fenix Parts, Inc., was filed in the Circuit Court of Cook County, Illinois, Chancery Division, against Messrs. Robertson and Pettit and the members of the Company’s board of directors. This lawsuit contains allegations of wrongful conduct that are substantially similar to those in the Beezley lawsuit, with additional allegations that defendants’ wrongful conduct caused, among other things, the Company’s non-compliance with Credit Facility financial covenants, its failure to maintain effective internal controls, and its inability to timely file SEC-required periodic reports. Unlike the Beezley lawsuit, the plaintiff bases her demands for recovery on non-securities law claims, including breach of fiduciary duty, unjust enrichment, waste of corporate assets and gross mismanagement. The plaintiff seeks relief which includes unspecified damages and restitution from the individual defendants, an order requiring actions to be taken to improve corporate governance and internal procedures, an award of reasonable costs and expenses, including attorneys' fees and expert fees, and other further relief as the Court may deem just and proper.
In the case of both the Beezley and Weiss lawsuits, the Company believes that the allegations contained in the complaints are without merit and, in conjunction with its insurance carrier, intends to vigorously defend itself against all claims asserted therein. A reasonable estimate of the amount of any possible loss or range of loss, after applicable insurance coverage, cannot be made at this time and, as such, the Company has not recorded an accrual for any potential loss as of December 31, 2016.
Note 13. Enterprise-Wide Disclosures
Operating Segments
Operating segments are defined in ASC Topic 280, Segment Reporting, as components of an enterprise for which separate financial information is available that is evaluated regularly by the chief operating decision maker, or decision making group, in deciding how to allocate resources and in assessing performance. The Company’s chief operating decision makers are its Chief Executive Officer and Chief Operating Officer. Since the IPO, the Company operates and internally manages a single operating segment, Automotive Recycling, as this is the only discrete financial information that is regularly prepared for and reviewed by the chief operating decision makers.
Geographic Areas
Net revenues and long-lived assets (property and equipment), split geographically by country of domicile, for the years ended December 31, 2016 and 2015 are summarized in the following table. Net revenues set forth below are based on the shipping destination. Long-lived assets information is based on the physical location of the asset.
76
(In thousands) | 2016 | 2015 | ||||
Net revenues: | ||||||
United States | $ | 114,611 | $ | 55,926 | ||
Canada | 17,489 | 13,020 | ||||
Total | $ | 132,100 | $ | 68,946 | ||
Long-lived assets: | ||||||
United States | $ | 7,417 | $ | 8,844 | ||
Canada | 2,672 | 2,765 | ||||
Total | $ | 10,089 | $ | 11,609 | ||
Note 14. Unaudited Quarterly Financial Data
Set forth below are the unaudited quarterly financial data for the years ended December 31, 2016 and 2015 (in thousands, except share and per share amounts). Gross profit margins vary significantly from quarter to quarter in 2015 and 2016 for a number of reasons, including the significant mark-up in acquired inventories that was fully amortized through higher charges to cost of goods sold of $8.6 million in 2015 and $1.4 million in the first half of 2016 as discussed in Note 4, the reduction to cost of goods of $4.0 million in the first quarter of 2016 due to reductions in the estimated fair value of inventories acquired in 2015 as discussed in Note 4, and a $1.6 million increase in inventories and corresponding reduction in cost of goods sold in the fourth quarter of 2016 to include all in-transit and not yet dismantled inventory at year-end 2016. Management of the Company believes these matters must be considered in analyzing gross profit margins between and among interim periods within 2015 and 2016.
2016 | March 31 (1) | June 30 | September 30 | December 31 | ||||||||
Total revenues | $ | 32,182 | $ | 34,234 | $ | 32,515 | $ | 33,169 | ||||
Cost of goods sold | 17,082 | 20,760 | 21,348 | 19,451 | ||||||||
Gross profit | 15,100 | 13,474 | 11,167 | 13,718 | ||||||||
Operating loss | (44,040 | ) | 1,472 | (3,530 | ) | (1,659 | ) | |||||
Net (loss) income | (41,362 | ) | 1,393 | (1,771 | ) | (1,129 | ) | |||||
Net (loss) income available to common shareholders | (39,280 | ) | 1,323 | (1,683 | ) | (1,077 | ) | |||||
Basic and diluted loss per common share | $ | (1.99 | ) | $ | 0.07 | $ | (0.08 | ) | $ | (0.05 | ) | |
Weighted-average basic shares outstanding | 19,664,345 | 19,799,664 | 19,988,809 | 20,023,132 | ||||||||
(1) These amounts reflect the correction of immaterial errors disclosed in Note 2 to the condensed consolidated financial statements within the Company’s Form 10-Q for the three and six months ended June 30, 2016.
2015 | March 31 | June 30 | September 30 | December 31 | ||||||||
Total revenues | $ | — | $ | 11,471 | $ | 27,275 | $ | 30,200 | ||||
Cost of goods sold | — | 10,008 | 20,584 | 22,967 | ||||||||
Gross profit | — | 1,463 | 6,691 | 7,233 | ||||||||
Operating loss | (2,629 | ) | (7,552 | ) | (11,519 | ) | (9,143 | ) | ||||
Net loss | (2,629 | ) | (3,974 | ) | (6,548 | ) | (12,891 | ) | ||||
Net loss available to common shareholders | (2,629 | ) | (3,799 | ) | (6,380 | ) | (12,012 | ) | ||||
Basic and diluted loss per common share(2) | $ | (1.02 | ) | $ | (0.33 | ) | $ | (0.33 | ) | $ | (0.61 | ) |
Weighted-average basic shares outstanding | 2,570,000 | 11,388,524 | 19,475,046 | 19,642,258 | ||||||||
(2) EPS for the fourth quarter 2015 was previously shown as ($.66) in the unaudited quarterly footnote in the Annual Report on Form 10-K for 2015, instead of the correct EPS of ($.61) as shown above.
Note 15. Related Party Transactions
Variable Interest Entity
An entity is referred to as a variable interest entity (VIE) if it meets the criteria outlined in ASC 810, Consolidation, which are: (i) the entity has equity that is insufficient to permit the entity to finance its activities without additional subordinated financial support from
other parties; or (ii) the entity has equity investors that cannot make significant decisions about the entity’s operations or that do not absorb their proportionate share of the entity’s expected losses or expected returns. The Company consolidates a VIE when it has both the power to direct the activities that most significantly impact the VIE’s economic success and a right to receive benefits or the obligation to absorb losses of the entity that could be potentially significant to the VIE (that is, it is the primary beneficiary).
As of and for the year ended December 31, 2016 and for the years ended December 31, 2016, 2015 and 2014 none of the related parties referenced below were deemed to be variable interest entities that would require consolidation. The entities have equity that is sufficient to permit the entity to finance its activities without additional subordinated financial support.
Facility Leases
As described in Note 12, the Company has operating leases with legal entities that are controlled by former owners of the Subsidiaries, who are also shareholders in Fenix and Fenix Canada and in certain cases are also in management at Fenix. One of the lessors is controlled by a Board member of Fenix. These leases, which generally have a term of 15 years with renewal options, relate to 19 distinct properties as of December 31, 2016, on which the Company conducts its automobile recycling business in the United States and Canada. These leases commenced on the closing of the acquisitions of the Subsidiaries. The aggregate scheduled payments under these facility leases over their original terms at inception of the leases totaled approximately $39.6 million.
Because these leases were entered into upon the closing of the acquisitions, any difference between their contractual payments and then-current market rental rates is accounted for as a net refundable or additional purchase price which served to reduce the aggregate purchase price by a net of approximately $1.5 million. These asset and liabilities are being amortized over the terms of the leases and amount to a net additional rent expense so that the amount in the consolidated statements of operations to more closely reflect the market rental expense.
Investment in GO Pull-It LLC
The Company holds a 5% investment and an option to purchase the remaining 95% interest in Go Pull-It LLC, an entity in which certain Fenix management also hold an equity investment. Go Pull-It LLC is a variable interest entity ("VIE") and the Company is not the primary beneficiary of that VIE because it does not have the power to direct the significant activities of the VIE. That power is held by the former owners of Go Auto. The Company has not and does not expect to provide any financial support to the VIE outside of the 5% investment. The 5% investment and purchase option have been valued at approximately $20,000 in the consolidated balance sheets at December 31, 2016 and 2015, which was part of the purchase price allocation described in Note 4 above.
Consulting Agreements
In conjunction with the Combinations, Fenix entered into non-substantive consulting agreements with certain former shareholders of the Founding Companies, including a director of the Company and his wife and brother. For these specific agreements, there was limited future service to be performed by the contracted party. As such, these agreements were treated as part of the purchase price consideration. The related liability for all non-substantive consulting agreements was $1.2 million and $1.6 million as of December 31, 2016 and 2015, respectively, and is reduced with each contractual payment.
Other Related Party Relationships
The Company's assistant corporate secretary is a founding shareholder whose firm provided legal services to Fenix which amounted to $524,000, $693,000 and $285,000 in 2016, 2015 and 2014, respectively.
Note 16. Employee Benefit Plans
The Subsidiaries maintained various defined contribution plans covering eligible employees, which includes matching and discretionary profit sharing contributions. As of January 1, 2016, the Company’s Board of Directors established the Fenix Parts, Inc. 401(k) Profit Sharing Plan and began merging similar plans maintained by acquired companies into this plan. The Company made contributions to the plans of approximately $1.0 million and $0.6 million during the years ended December 31, 2016 and 2015, respectively.
Note 17. Subsequent Events
Fire at the Company's Toronto Facility
On April 6, 2017, a fire destroyed the buildings and contents therein, including computer equipment and certain accounting records, located at the Company’s Toronto facility where both full-service and self-service auto recycling operations take place and certain administrative functions are performed for Canadian operations. The vehicle inventory stored on the property was largely undamaged. Firefighters used water to extinguish the fire and an emergency response team was retained to contain the water to keep it from flowing into the ground and a nearby creek. Since then, water and ash resulting from the fire were successfully contained on the premises, the ash has been hauled away, and the water will be removed once the Company completes testing for contaminants and determines the
78
appropriate means of disposal. The Company also contracted with a restoration company to oversee the setup of both temporary and permanent structures in order to recommence operations. The Company and/or its landlord maintain insurance for property damage and business interruption losses; however, coverage is subject to deductibles, limits and certain exclusions and may not be sufficient to cover all of the losses incurred.
On April 10, 2017, while Company personnel were engaged in clean-up operations, a provincial officer of the Ontario Ministry of the Environment and Climate Change entered the premises and ordered the Company to cease operations on the property until such time that the officer had accepted a plan to recommence operations in an environmentally safe manner. The Company filed a request for a review and stay of the provincial officer’s order (the "order"), which was denied in a ruling on April 27, 2017 by a Director of the Ontario Ministry of the Environment and Climate Change (the “Director’s ruling”). The Director's ruling further provided that the Director believed that the site in its current condition had evidence of contamination, but that the Director also believed that actions could be taken to ensure the site could be operated in an environmentally safe manner. The Director indicated that this was particularly true with respect to the receiving and processing of end-of-life vehicles, and the Director's ruling requested that the plan specifically address such end-of-life vehicle operations. The Director's ruling did not address the self-service operation, other than to note the Director’s understanding that it would not be operated until the debris from the fire was cleaned up and the ash and firewater completely managed.
The Company has requested a hearing before the Environmental Review Tribunal with respect to the Director’s ruling on the basis, among others, that there was no evidence that the fire and its extinguishment or the resumption of processing operations in accordance with the Company's prior practices would cause the Company to be out of compliance with any environmental law or create the opportunity for contamination or impact of the natural environment. Since the Company's leasing of this facility in 2015, the Company's operations prior to the fire had never been cited for any non-compliance with applicable environmental laws, although certain storm water issues that arose prior to the Company's leasing of the site remain unresolved. For additional information on these storm water issues, see Note 12 above.
The Company believes that the Director’s ruling is premature and therefore without merit, as the Company intends to comply with applicable environmental laws and rules in the rebuilding of the facility and future operations; however, the Company may be unable to successfully appeal the order. The potential delay and uncertain timing as to recommencement of operations at the facility necessitated by the requirement to obtain prior approval of a plan to do so, the possibility that the Director may impose costly remediation measures upon the Company or may never approve a plan, and the possible incurrence of uninsured losses could have a material adverse effect on the Company's business, financial condition and results of operations.
Suspension in Trading on Nasdaq of the Company’s Common Stock
Trading in the Company’s common stock on the Nasdaq Global Market was suspended on June 29, 2017, and Nasdaq will complete the delisting of the Company’s common stock after applicable appeal periods have lapsed. The suspension was due to the Company’s continuing non-compliance with Nasdaq Listing Rule 5250(c)(1) and, in particular, the Company’s failure to file the 2016 Annual Report on Form 10-K (the “Annual Report”) by its due date (as extended by Nasdaq). The Company’s common stock is currently quoted on the OTC Pink operated by the OTC Markets Group Inc. (also known as the "Pink Sheets").
Report of Independent Registered Public Accounting Firm
The Shareholders
The Beagell Group
Binghamton, New York
We have audited the accompanying combined statements of operations, shareholders’ equity, and cash flows of the Beagell Group (entities under common control as described in Note 1) for the period ended May 18, 2015 and the year ended December 31, 2014. These financial statements are the responsibility of the Beagell Group’s management. Our responsibility is to express an opinion on these financial statements based on our audits.
We conducted our audits in accordance with the standards of the Public Company Accounting Oversight Board (United States). Those standards require that we plan and perform the audit to obtain reasonable assurance about whether the combined financial statements are free of material misstatement. The Beagell Group is not required to have, nor were we engaged to perform, an audit of its internal control over financial reporting. Our audits included consideration of internal control over financial reporting as a basis for designing audit procedures that are appropriate in the circumstances, but not for the purpose of expressing an opinion on the effectiveness of the Beagell Group’s internal control over financial reporting. Accordingly, we express no such opinion. An audit also includes examining, on a test basis, evidence supporting the amounts and disclosures in the combined financial statements, assessing the accounting principles used and significant estimates made by management, as well as evaluating the overall presentation of the combined financial statements. We believe that our audits provide a reasonable basis for our opinion.
In our opinion, the combined financial statements referred to above present fairly, in all material respects, the results of its operations and its cash flows for the period ended May 18, 2015 and the year ended December 31, 2014, in conformity with accounting principles generally accepted in the United States of America.
As described in Note 1, the Beagell Group was acquired by an unrelated party.
/s/BDO USA LLP
Chicago, Illinois
April 14, 2016
80
Beagell Group (Designated Accounting Co-Predecessor)
COMBINED STATEMENTS OF OPERATIONS
Period from January 1, 2015 to May 18, 2015 | Year Ended December 31, 2014 | ||||
Net revenues | 11,107,071 | 30,597,756 | |||
Cost of goods sold | 7,395,359 | 19,896,923 | |||
Gross profit | 3,711,712 | 10,700,833 | |||
Operating expenses | 3,183,803 | 8,307,750 | |||
Income from operations | 527,909 | 2,393,083 | |||
Other income, net | 63,695 | 297,082 | |||
Income before income tax expense | 591,604 | 2,690,165 | |||
Income tax expense | 75,402 | 447,694 | |||
Net income | 516,202 | 2,242,471 | |||
Net income attributable to noncontrolling interest | 279,481 | 625,470 | |||
NET INCOME ATTRIBUTABLE TO BEAGELL GROUP | 236,721 | 1,617,001 | |||
The accompanying notes to the combined financial statements are an integral part of these statements.
Beagell Group
COMBINED STATEMENTS OF SHAREHOLDERS’ EQUITY
Common Stock | Additional paid-in capital | Retained Earnings | Non- Controlling | Total shareholders equity | ||||||||||||||||||
Shares | Amount | |||||||||||||||||||||
Balance at January 1, 2014 | 3,412 | $ | — | $ | 727,973 | $ | 8,578,003 | $ | 2,340,578 | $ | 11,646,554 | |||||||||||
Net income | — | — | — | 1,617,001 | 625,470 | 2,242,471 | ||||||||||||||||
Shareholder contributions | 12 | — | 20,520 | — | — | 20,520 | ||||||||||||||||
Shareholder distributions | — | — | — | (1,223,282 | ) | (696,000 | ) | (1,919,282 | ) | |||||||||||||
Balance at December 31, 2014 | 3,424 | $ | — | $ | 748,493 | $ | 8,971,722 | $ | 2,270,048 | $ | 11,990,263 | |||||||||||
Net income | — | — | — | 236,721 | 279,481 | 516,202 | ||||||||||||||||
Shareholder distributions | — | — | — | (1,798,900 | ) | (60,000 | ) | (1,858,900 | ) | |||||||||||||
Balance at May 18, 2015 | 3,424 | $ | — | $ | 748,493 | $ | 7,409,543 | $ | 2,489,529 | $ | 10,647,565 | |||||||||||
The accompanying notes to the combined financial statements are an integral part of these statements.
81
Beagell Group
COMBINED STATEMENTS OF CASH FLOWS
Period from January 1, 2015 to May 18, 2015 | Year Ended December 31, 2014 | ||||||
Cash flows from operating activities | |||||||
Net income | $ | 516,202 | $ | 2,242,471 | |||
Adjustments to reconcile net income to net cash provided by operating activities | |||||||
Depreciation expense | 277,183 | 853,358 | |||||
Provision for uncertain tax positions | 86,000 | (325,841 | ) | ||||
Gain on disposal of property and equipment | (61,658 | ) | 417,542 | ||||
Change in assets and liabilities | |||||||
Accounts receivable | (134,875 | ) | 53,268 | ||||
Inventories | 114,002 | (890,997 | ) | ||||
Prepaid expenses and other current assets | (103,812 | ) | (8,413 | ) | |||
Account payable | 233,192 | 147,398 | |||||
Accrued expenses and other liabilities | (306,112 | ) | 187,457 | ||||
Deferred warranty revenue | (142,884 | ) | 238,746 | ||||
Net cash provided by operating activities | 477,238 | 2,914,989 | |||||
Cash flows from investing activities | |||||||
Proceeds from disposal of property and equipment | 160,643 | 454,804 | |||||
Liquidation of (premium payments on) life insurance policies | 593,671 | (55,512 | ) | ||||
Payments received (made) on related party receivables | 333,270 | (38,870 | ) | ||||
Capital expenditures | (284,690 | ) | (328,553 | ) | |||
Net cash provided by investing activities | 802,894 | 31,869 | |||||
Cash flows from financing activities | |||||||
Payments of debt | (26,032 | ) | (133,957 | ) | |||
Proceeds from debt | — | 135,997 | |||||
Shareholder contributions | — | 20,520 | |||||
Shareholder distributions | (1,858,900 | ) | (1,919,282 | ) | |||
Net cash used in financing activities | (1,884,932 | ) | (1,896,722 | ) | |||
(Decrease) increase in cash and cash equivalents | (604,800 | ) | 1,050,136 | ||||
Cash and cash equivalents, beginning of period | 2,769,876 | 1,719,740 | |||||
Cash and cash equivalents, end of period | $ | 2,165,076 | $ | 2,769,876 | |||
Supplemental cash flow disclosures | |||||||
Cash paid for income taxes | $ | 4,773 | $ | 32,371 | |||
The accompanying notes to the combined financial statements are an integral part of these statements.
82
Beagell Group
NOTES TO FINANCIAL STATEMENTS
(in thousands except per share data)
Note 1. Nature of Operations
The Beagell Group ("Beagell") includes three commonly-controlled companies: Don’s Automotive Mall, Inc. ("Don’s"), Gary’s U-Pull It, Inc. ("Gary’s") and Horseheads Automotive Recycling, Inc. ("Horseheads"). Beagell’s primary business is auto recycling, which is the recovery and resale of original equipment manufacturer ("OEM") parts, components and systems, such as engines, transmissions, radiators, trunks, lamps and seats (referred to as "products") reclaimed from damaged, totaled or low value vehicles. Beagell purchases its vehicles primarily at auto salvage auctions. Upon receipt of vehicles, Beagell inventories and then either a) dismantles the vehicles and sells the recycled components at its full-service facilities or b) allows retail customers to directly dismantle, recover and purchase recycled parts at its self-service facilities. In addition, Beagell purchases recycled OEM and related products from third parties for resale and distribution to its customers. Beagell’s customers include collision repair shops (body shops), mechanical repair shops, auto dealerships and individual retail customers. Beagell also generates a portion of revenue from the sale of scrap of the unusable parts and materials and from the sale of extended warranties.
Don’s sells recycled OEM products through its two full-service dismantling and distribution facilities located in Binghamton, New York and Pennsburg, Pennsylvania. Gary’s and Horseheads sell recycled OEM products through their self-service facilities in Binghamton and Elmira, New York, respectively. Each of the three commonly-controlled companies is a New York corporation.
On May 19, 2015, all three commonly-controlled companies were purchased by Fenix Parts Inc. for an approximate purchase price of $34.5 million, subject to certain other adjustments. The Lessors (as defined below) were not purchased, but the owners of the Lessors entered into lease agreements with Fenix Parts, Inc. for certain properties on which Beagell conducts its automotive recycling business.
Note 2. Summary of Significant Accounting Policies
Basis of Presentation
These combined financial statements were prepared in accordance with accounting principles generally accepted in the United States of America ("GAAP"), pursuant to the rules and regulations of United States Securities and Exchange Commission (the "SEC"). All significant intercompany transactions and balances between Beagell's three entities have been eliminated in combination. The combined Beagell represents a single reportable segment.
The combined financial statements include the accounts of D&B Holdings, LLC and BBHC, LLC - the lessors of the premises from which Don’s operates, Beagell Properties, LLC - the lessor of the premises from which Gary’s operates, and Don’s Independent Salvage Company, LLC - the lessor of the premises from which Horseheads operates (collectively, "the Lessors"). Each of the Lessors are substantially owned by Beagell’s shareholders. Beagell has determined that each of the Lessors are variable interest entities because the holders of the equity investment at risk in these entities do not have the obligation to absorb their expected losses or receive their residual returns. Furthermore, Beagell has determined that it is the primary beneficiary of each Lessor because Beagell has the power to direct the activities that most significantly impact the Lessors’ economic performance, namely the operation and maintenance of the significant assets of the Lessors. Accordingly, and pursuant to consolidation requirements under GAAP, Beagell consolidates the Lessors. All intercompany transactions are eliminated in consolidation. All of the Lessors operating results are attributable to the noncontrolling interests in Beagell’s combined statements of operations and all of their shareholders’ equity is reported separately from Beagell’s shareholders’ equity in Beagell’s combined balance sheet and combined statements of shareholders’ equity.
Use of Estimates
The preparation of Beagell’s combined financial statements in conformity with GAAP requires management to make estimates and assumptions that affect the reported amounts of assets and liabilities and disclosure of contingent assets and liabilities as of the date of the combined financial statements, and the reported amounts of revenue and expenses during the reporting period. Actual results could differ from those estimates.
Cash and Cash Equivalents
Beagell includes cash and investments having an original maturity of three months or less at the time of acquisition in cash and cash equivalents.
Revenue Recognition
Beagell recognizes revenue from the sale of vehicle replacement products and scrap when they are shipped or picked up by the customers and ownership has transferred, subject to an allowance for estimated returns and discounts that management estimates
83
based upon historical information. Management analyzes historical returns (often pursuant to standard warranties on the sold products) and allowances activity by comparing the items returned to the original invoice amounts and dates. Beagell uses this information to project future returns and allowances on products sold. If actual returns and allowances deviate from Beagell’s historical experience, there could be an impact on its operating results in the period of occurrence. Beagell has recorded a reserve for estimated returns, discounts and allowances of approximately $116 and $99 at May 18, 2015 and December 31, 2014, respectively, within accrued expenses and other current liabilities.
Beagell presents taxes assessed by governmental authorities collected from customers on a net basis. Therefore, the taxes are excluded from revenue on the combined statements of operations and are shown as a current liability on the combined balance sheet until remitted. Revenue also includes amounts billed to customers for shipping and handling.
Revenue from the sale of separately priced extended warranty contracts is reported as deferred revenue and recognized ratably over the term of the contracts. Revenue from such extended warranty contracts was approximately $189 and $351 for the period ending May 18, 2015 and for the year ended December 31, 2014, respectively
Cost of Goods Sold
Cost of goods sold primarily includes a) amounts paid for the purchase of vehicles, scrap, parts for resale and related products, b) related auction, storage and towing fees, and c) other costs of procurement and dismantling, primarily labor and overhead allocable to dismantling operations.
Operating Expenses
Operating expenses are primarily comprised of a) salaries and benefits of employees that are not related to the procurement and dismantling of vehicles, b) facility costs such as rent, utilities, insurance, repairs and taxes not allocated to dismantling operations, c) selling and marketing costs, d) costs to distribute Beagell’s products and scrap and e) other general and administrative costs.
Leases
The Beagell Group leases dismantling, distribution and warehouse facilities, and office space for corporate administrative purposes under operating leases. For scheduled rent escalation clauses during the lease terms or for rental payments commencing at a date other than the date of initial possession, Beagell records minimum rent expense on a straight-line basis over the terms of the leases in operating expenses and cost of good sold.
Concentrations
Financial instruments that potentially subject Beagell to significant concentration of credit risk consist primarily of cash and cash equivalents and accounts receivable. The majority of cash and cash equivalents are maintained with several major financial institutions. Beagell maintains its cash in bank deposit accounts which, at times, may exceed the insurance limits of the Federal Deposit Insurance Corporation. Beagell has not experienced any losses in such accounts. Concentrations of credit risk with respect to accounts receivable are limited because a large number of customers make up Beagell’s customer base. Beagell controls credit risk through credit approvals, credit limits and monitoring procedures.
Beagell primarily obtains its recycled OEM and related products from damaged, totaled or low value vehicles purchased at salvage auto auctions. For 2015 and 2014, substantially all of the vehicles purchased by Beagell for dismantling were acquired at auctions run by two salvage auto auction companies.
Revenue derived from one of Beagell's customers accounted for 14% of combined revenues for the year ended December 31, 2014. No customer accounted for 10% or more of combined revenues for the period ended May 18, 2015.
Income Taxes
Each of the three commonly-controlled companies has elected to operate under Subchapter S of the Internal Revenue Code. Accordingly, the shareholders report their share of Beagell’s federal and most state’s taxable income or loss on their respective individual income tax returns. The Lessors are taxed as partnerships and therefore no provision for federal and state corporate taxes are recorded for the Lessors.
Beagell recognizes the benefits of uncertain tax positions taken or expected to be taken in tax returns in the provision for income taxes only for those positions that are more likely than not to be realized. Beagell follows a two-step approach to recognizing and measuring uncertain tax positions. The first step is to evaluate the tax position for recognition by determining if the weight of available evidence indicates it is more likely than not that the position will be sustained on audit, including resolution of related appeals or litigation processes, if any. The second step is to measure the tax benefit as the largest amount that is more than 50% likely of being realized upon ultimate settlement. Beagell considers many factors when evaluating and estimating tax positions
84
and tax benefits, which may require periodic adjustments and which may not accurately forecast actual outcomes. Beagell’s policy is to include interest and penalties associated with income tax obligations in income tax expense.
Advertising
For the period ended May 18, 2015 and the year ended December 31, 2014, advertising and marketing expense amounted to approximately $152 and $395, respectively. Advertising costs are charged to expense as incurred.
Fair Value Measurements
Fair value of financial assets and liabilities are defined as the exchange price that would be received to sell an asset or paid to transfer a liability in an orderly transaction between market participants in the principal market at the measurement date (exit price). Beagell is required to classify fair value measurements in one of the following categories:
• | Level 1 - inputs which are defined as quoted prices (unadjusted) in active markets for identical assets or liabilities that the reporting entity has the ability to access at the measurement date. |
• | Level 2 - inputs which are defined as inputs other than quoted prices included within Level 1 that are observable for the assets or liabilities, either directly or indirectly. |
• | Level 3 - inputs are defined as unobservable inputs for the assets or liabilities. Financial assets and liabilities are classified based on the lowest level of input that is significant to the fair value measurement. |
Beagell’s assessment of the significance of a particular input to the fair value measurement requires judgment, and may affect the valuation of the fair value of assets and liabilities and their placement within the fair value hierarchy levels.
Certain assets and liabilities are required to be recorded at fair value on either a recurring or non-recurring basis; however, Beagell has no assets or liabilities that require recurring fair value measurements. Fair value is determined based on the exchange price that would be received for an asset or paid to transfer a liability in an orderly transaction between market participants.
Beagell’s financial instruments, including cash and cash equivalents, accounts receivable, accounts payable, and accrued expenses are carried at cost, which is a level 1 input, and approximates fair value due to the short-term maturity of these instruments. Beagell’s debt is carried at cost, which is a level 2 input, and approximates fair value due to its variable interest rates, which are consistent with the interest rates in the market.
Beagell may be required, on a non-recurring basis, to adjust the carrying value of Beagell’s property and equipment and goodwill. When necessary, these valuations are determined by Beagell using Level 3 inputs. These assets are subject to fair value adjustments in certain circumstances, such as when there is evidence that impairment may exist. There have been no indicators of impairment for the period ended May 18, 2015 or the year ended December 31, 2014.
Recently Adopted Accounting Standards
In April 2014, the Financial Accounting Standards Board ("FASB") issued ASU No. 2014-08, Reporting Discontinued Operations and Disclosures of Disposals of Components of an Entity , which amends FASB Accounting Standards Codification ("ASC") Topic 205, Presentation of Financial Statements , and FASB ASC Topic 360, Property, Plant, and Equipment . This standard amends the definition of a discontinued operation and requires new disclosures of both discontinued operations and certain other disposals that do not meet the definition of a discontinued operation. This guidance is effective on a prospective basis for annual periods beginning on or after December 15, 2014. Beagell adopted this standard effective January 1, 2015. Adoption did not have a material impact on Beagell’s consolidated financial statements.
Recently Issued Accounting Standards
In May 2014, the FASB issued ASU No. 2014-09, Revenue from Contracts with Customers. The guidance in this update, as amended, supersedes nearly all existing revenue recognition guidance under U.S. GAAP and creates a single, principle-based revenue recognition framework that is codified in a new FASB ASC Topic 606. The core principle of this guidance is for the recognition of revenue to depict the transfer of goods or services to customers at an amount that reflects the consideration to which Beagell expects to be entitled in exchange for those goods or services. The ASU also requires additional disclosure about the nature, amount, timing and uncertainty of revenue and cash flows arising from customer contracts, including significant judgments and changes in judgments and assets recognized from costs incurred to obtain or fulfill a contract. The new revenue standard is effective for annual reporting periods beginning after December 15, 2017, and interim periods within those years. Early adoption is permitted only as of annual reporting periods beginning after December 31, 2016. The new standard allows for either full retrospective or modified retrospective adoption. Beagell is currently evaluating the transition method that will be elected and the potential effects of the adoption of the new standard on its consolidated financial statements.
85
In August 2014, the FASB issued ASU 2014-15 which amends ASC Topic 205, Presentation of Financial Statements, to describe management’s responsibility to evaluate whether there is substantial doubt about an organization’s ability to continue as a going concern and to provide related footnote disclosures. This guidance will be effective for Beagell's fiscal year ended December 31, 2016. Beagell does not expect adoption of this ASU to have a material impact on its consolidated financial statements.
In February 2015, the FASB issued ASU 2015-02, Amendments to the Consolidation Analysis, which modifies the evaluation of VIEs, and affects the consolidation analysis of reporting entities involved with VIEs. This guidance for public entities is effective for fiscal years beginning after December 15, 2015, with early adoption permitted. Beagell is currently evaluating the impact of adopting the new standard.
In July 2015, the FASB issued Accounting Standards Update ("ASU") No. 2015-11, Simplifying the Measurement of Inventory, to reduce the complexity in accounting for inventory. This ASU requires entities to measure inventory at the lower of cost or net realizable value. This guidance for public entities is effective for fiscal years beginning after December 15, 2016, with early adoption permitted. Beagell is currently evaluating the impact of adopting the new standard.
In September 2015, the FASB issued Accounting Standards Update ("ASC") No. 2015-16, Simplifying the Accounting for Measurement-Period Adjustments, which simplifies the accounting for adjustments made to provisional amounts recognized in business combinations. The amendments require that an acquirer recognize adjustments to provisional amounts that are identified during the measurement period in the reporting period in which the adjustment amounts are determined. The amendments also require that the acquirer record, in the same period's financial statements, the effect on earnings of changes in depreciation, amortization, or other income effects, if any, as a result of the change to provisional amounts, calculated as if the accounting had been completed at the acquisition date. The ASU also requires an entity to present separately on the face of the income statement or disclose in the notes the portion of the amount recorded in current-period earnings by line item that would have been recorded in previous reporting periods if the adjustment to the provisional amounts had been recognized as of the acquisition date. This guidance is effective for fiscal years beginning after December 15, 2015, including interim periods within those fiscal years. Beagell is currently evaluating the impact of adopting the new standard.
In February 2016, the FASB issued ASU No. 2016-02, Leases. ASU 2016-02 establishes a right-of-use (ROU) model that requires a lessee to record a ROU asset and a lease liability on the balance sheet for all leases with terms longer than 12 months. Leases will be classified as either finance or operating, with classification affecting the pattern of expense recognition in the income statement. ASU 2016-02 is effective for fiscal years beginning after December 15, 2018, including interim periods within those fiscal years. A modified retrospective transition approach is required for lessees for capital and operating leases existing at, or entered into after, the beginning of the earliest comparative period presented in the financial statements, with certain practical expedients available. While Beagell is still evaluating the impact of its pending adoption of the new standard on its consolidated financial statements, it expects that upon adoption will recognize ROU assets and lease liabilities and that the amounts could be material.
Reclassifications
Reclassifications of prior period amounts have been made to conform to the current period presentation. The reclassifications have no impact on net income, cash flows, total assets or shareholders equity as previously reported.
Note 3. Commitments and Contingencies
Operating Lease
Beagell was obligated under a non-cancelable operating lease for corporate office space, warehouse and distribution facilities. Through mid-2014, the facilities were owned by certain shareholders of Beagell, at which time they were contributed at minimal value to one of the Lessors . Rental expense for the operating lease was approximately $0 for the period ended May 18, 2015 and $72 for the year ended December 31, 2014.
Environmental and Related Contingencies
Beagell is subject to a variety of environmental and pollution control laws and regulations incident to the ordinary course of business. Beagell currently expects that the resolution of any potential contingencies arising from compliance with these laws and regulations will not materially affect Beagell’s financial position, results of operations or cash flows.
Note 4. Income Taxes
Each of Beagell’s commonly-controlled entities described in Note 2 have elected to operate under Subchapter S of the Internal Revenue Code. Beagell’s primary uncertain tax position arises from uncertainties regarding the continued qualifications of one of the entities for
86
that Subchapter S election. It is reasonably possible that the amount of benefits from this uncertain tax position will significantly increase or decrease in the next twelve months; however, no estimate of the range of the amount of the increase of decrease can be readily made.
A reconciliation of the beginning and ending amount of reserves for uncertain tax positions is as follows:
(in thousands) | Period Ended May 18, 2015 | Year Ended December 31, 2014 | |||||
Beginning balance | $ | 1,596 | $ | 1,199 | |||
Additions for tax positions of prior years | 62 | 397 | |||||
Ending balance | $ | 1,658 | $ | 1,596 | |||
In addition to the uncertain tax positions included in the table above, Beagell has other uncertain tax positions related to the timing of certain deductions for income tax purposes. The related basis differences caused by this timing of deductions for income tax purposes and the timing of expense recognition for financial reporting purposes are reported by Beagell’s equity holders. However, interest and penalties are separately recorded for all uncertain tax positions as part of income tax expense and amounted to approximately $20 and $24 for the period ended May 18, 2015 and the year ended December 31, 2014, respectively. Beagell had accumulated interest and penalties of approximately $397 and $377 as of May 18, 2015 and December 31, 2014, respectively, which are included in the reserve for uncertain tax positions on the combined balance sheet.
Beagell is generally no longer subject to examination in primary tax jurisdictions for tax years through 2011. Beagell is not currently subject to any audits or examinations.
Note 5. Employee Benefit Plans
Beagell provides a defined contribution plan covering eligible employees, which includes a matching contribution. Matching Company contributions to this plan were approximately $36 and $430 for the period ended May 18, 2015 and the year ended December 31, 2014, respectively.
Note 6. Common Stock
The capital structure of the combined entities as of December 31, 2014 and May 18, 2015, is as follows:
Common shares, no par value | Additional paid-in capital | ||||||
(In thousands, except for share data) | Authorized | Issued | |||||
Don’s | 5,000 | 1,200 | $ | 524 | |||
Gary’s | 3,000 | 2,104 | 184 | ||||
Horsehead’s | 200 | 120 | 40 | ||||
$ | 748 | ||||||
Note 7. Subsequent Events
On May 19, 2015, Beagell was acquired by Fenix Parts, Inc. ("Fenix"). On this date, Fenix completed an initial public offering of its common stock, which was contingent on the closing of the acquisition of Beagell and other auto recycling entities.
87
Report of Independent Registered Public Accounting Firm
The Shareholders
Standard
Toronto, Ontario
We have audited the accompanying combined statements of operations and comprehensive (loss) income, shareholders’ equity, and cash flows of Standard (entities under common control as described in Note 1) for the period ended May 18, 2015 and the year ended December 31, 2014. These financial statements are the responsibility of Standard’s management. Our responsibility is to express an opinion on these financial statements based on our audits.
We conducted our audits in accordance with the standards of the Public Company Accounting Oversight Board (United States). Those standards require that we plan and perform the audit to obtain reasonable assurance about whether the combined financial statements are free of material misstatement. Standard is not required to have, nor were we engaged to perform, an audit of its internal control over financial reporting. Our audits included consideration of internal control over financial reporting as a basis for designing audit procedures that are appropriate in the circumstances, but not for the purpose of expressing an opinion on the effectiveness of Standard’s internal control over financial reporting. Accordingly, we express no such opinion. An audit also includes examining, on a test basis, evidence supporting the amounts and disclosures in the combined financial statements, assessing the accounting principles used and significant estimates made by management, as well as evaluating the overall presentation of the combined financial statements. We believe that our audits provide a reasonable basis for our opinion.
In our opinion, the combined financial statements referred to above present fairly, in all material respects, the results of its operations and its cash flows for the period ended May 18, 2015 and the year ended December 31, 2014, in conformity with accounting principles generally accepted in the United States of America.
As described in Note 1, Standard was acquired by an unrelated party.
/s/ BDO USA LLP
Chicago, Illinois
April 14, 2016
88
Standard (Designated Accounting Co-Predecessor)
COMBINED STATEMENTS OF OPERATIONS AND COMPREHENSIVE (LOSS) INCOME
Period from January 1, 2015 to May 18, 2015 | Year Ended December 31, 2014 | ||||||
Net revenues | $ | 8,914,348 | $ | 31,126,456 | |||
Cost of goods sold | 5,995,959 | 19,717,339 | |||||
Gross profit | 2,918,389 | 11,409,117 | |||||
Operating expenses | 3,385,020 | 9,524,510 | |||||
(Loss) income from operations | (466,631 | ) | 1,884,607 | ||||
Other income, net | 301,533 | 842,509 | |||||
(Loss) income before income tax expense | (165,098 | ) | 2,727,116 | ||||
Income tax provision | 79,409 | 683,683 | |||||
Net (loss) income | (244,507 | ) | 2,043,433 | ||||
Net (loss) income attributable to noncontrolling interest | (15,104 | ) | 107,282 | ||||
Net (loss) income attributable to Standard | (229,403 | ) | 1,936,151 | ||||
Net (loss) income | (244,507 | ) | 2,043,433 | ||||
Foreign currency translation adjustments, net of tax | (365,753 | ) | (982,425 | ) | |||
Net comprehensive (loss) income | (610,260 | ) | 1,061,008 | ||||
Net comprehensive (loss) income attributable to noncontrolling interest | (17,027 | ) | 104,595 | ||||
Net comprehensive (loss) income attributable to Standard | (593,233 | ) | 956,413 | ||||
The accompanying notes to the combined financial statements are an integral part of these statements.
Standard
COMBINED STATEMENTS OF SHAREHOLDERS’ EQUITY
Common Stock | Additional paid-in capital | Retained Earnings | Accumulated Other Comprehensive Loss | Noncontrolling interest | Total shareholders equity | |||||||||||||||||||||
Shares | Amount | |||||||||||||||||||||||||
Balance at January 1, 2014 | 10,500 | $ | — | $ | 5,058,040 | $ | 8,950,774 | $ | 904,609 | $ | 572,901 | $ | 15,486,324 | |||||||||||||
Net income | — | — | — | 1,936,151 | — | 107,282 | 2,043,433 | |||||||||||||||||||
Shareholder distributions | — | — | — | (245,675 | ) | — | — | (245,675 | ) | |||||||||||||||||
Foreign currency translation adjustments | — | — | — | — | (979,738 | ) | (2,687 | ) | (982,425 | ) | ||||||||||||||||
Balance at December 31, 2014 | 10,500 | $ | — | $ | 5,058,040 | $ | 10,641,250 | $ | (75,129 | ) | $ | 677,496 | $ | 16,301,657 | ||||||||||||
Net income | — | — | — | (229,403 | ) | — | (15,104 | ) | (244,507 | ) | ||||||||||||||||
Foreign currency translation adjustments | — | — | — | — | (365,753 | ) | (1,923 | ) | (367,676 | ) | ||||||||||||||||
Balance at May 18, 2015 | 10,500 | — | 5,058,040 | 10,411,847 | (440,882 | ) | 660,469 | 15,689,474 | ||||||||||||||||||
The accompanying notes to the combined financial statements are an integral part of these statements.
89
Standard
COMBINED STATEMENTS OF CASH FLOWS
Period from January 1, 2015 to May 18, 2015 | Year Ended December 31, 2014 | ||||||
Cash flows from operating activities | |||||||
Net (loss) income | $ | (244,507 | ) | $ | 2,043,433 | ||
Adjustments to reconcile net (loss) income to net cash (used in) provided by operating activities | |||||||
Depreciation expense | 302,325 | 682,263 | |||||
Deferred income tax benefit | (193,890 | ) | (325,789 | ) | |||
Provision for uncertain tax positions | 68,966 | (235,888 | ) | ||||
Insurance proceeds | 150,307 | 1,505,371 | |||||
Gain on fire | (51,364 | ) | (758,481 | ) | |||
Loss on disposal of property and equipment | 15,139 | — | |||||
Change in assets and liabilities | |||||||
Accounts receivable | (216,359 | ) | 402,620 | ||||
Inventories | (11,578 | ) | (2,173,347 | ) | |||
Prepaid expenses and other current assets | (431,517 | ) | 29,306 | ||||
Accounts payable | (306,189 | ) | 38,864 | ||||
Accrued expenses and other current liabilities | 342,584 | 1,058,278 | |||||
Net cash (used in) provided by operating activities | (576,083 | ) | 2,266,630 | ||||
Cash flows from investing activities | |||||||
Capital expenditures | (119,425 | ) | (3,274,519 | ) | |||
Insurance Proceeds | 108,959 | 1,091,262 | |||||
Other | 61,659 | — | |||||
Net cash provided by (used in) investing activities | 51,193 | (2,183,257 | ) | ||||
Cash flows from financing activities | |||||||
Shareholder distribution | — | (245,675 | ) | ||||
Net cash used in financing activities | — | (245,675 | ) | ||||
Effect of foreign exchange fluctuations on cash and cash equivalents | 558,624 | (385,155 | ) | ||||
Net increase in cash and cash equivalents | 33,734 | (547,458 | ) | ||||
Cash and cash equivalents, beginning of period | 1,354,155 | 1,901,613 | |||||
Cash and cash equivalents, end of period | $ | 1,387,889 | $ | 1,354,155 | |||
Supplemental cash flow disclosure | |||||||
Cash paid for income taxes | $ | 9,098 | $ | 657,513 | |||
The accompanying notes to the combined financial statements are an integral part of these statements.
90
Standard
NOTES TO COMBINED FINANCIAL STATEMENTS
(in thousands except per share data)
Note 1. Nature of Operations
Standard ("Standard Auto") includes four commonly-controlled companies: Standard Auto Wreckers, Inc. ("Standard Auto Wreckers"), End of Life Vehicles Inc. ("End of Life Vehicles"), Goldy Metals (Ottawa) Incorporated ("Goldy Metals Ottawa") and Goldy Metals Incorporated ("Goldy Metals Toronto"). Standard Auto’s primary business is auto recycling, which is the recovery and resale of original equipment manufacturer ("OEM") parts, components and systems, such as engines, transmissions, radiators, trunks, lights and seats (referred to as "products") reclaimed from damaged, totaled or low value vehicles. Standard Auto purchases its vehicles primarily at auto salvage auctions. Upon receipt of vehicles, Standard Auto inventories and then a) dismantles the vehicles and sells the recycled components at its full-service facilities or b) allows retail customers to directly dismantle, recover and purchase recycled parts at its self-service facilities. In addition, Standard Auto purchases recycled OEM parts and related products from third parties for resale and distribution to its customers. Standard Auto’s customers include collision repair shops (body shops), mechanical repair shops, auto dealerships and individual retail customers. Standard Auto also generates a portion of revenue from the sale as scrap of the unusable parts and materials and from the sale of extended warranty contracts.
Standard Auto Wreckers is incorporated in New York, End of Life Vehicles, Goldy Metals Ottawa and Goldy Metals Toronto all operate in Canada and are incorporated in the Province of Ontario. Collectively, Standard Auto has three full-service dismantling and distribution facilities located in Niagara Falls, New York; Scarborough, Ontario; and Ottawa, Ontario. The Ottawa facility runs a self-service operation adjacent to its full-service operations and Goldy Metals Toronto has a second self-service operation in Scarborough, Ontario. End of Life Vehicles is a website based solution for individuals to arrange for an environmentally responsible disposal of their vehicle.
On May 19, 2015, all four commonly-controlled companies were purchased by Fenix Parts Inc. ("Fenix") for an approximate purchase price of $49.9 million, subject to working capital and other adjustments. The acquisition did not include the capital stock of Dalana Realty, Inc. ("Dalana Realty"), Standard Auto Wreckers (Port Hope), Inc. ("Port Hope"), or Standard Auto Wreckers (Cornwall) Inc. ("Cornwall"), which was formed by one of Standard Auto shareholders in 2013 to acquire property in Cornwall, Ontario to allow for future expansion. The owners of these entities, who also owned Standard prior to the acquisition by Fenix, entered into lease agreements with Fenix for certain properties on which Fenix conducts its automotive recycling business.
Note 2. Summary of Significant Accounting Policies
Basis of Preparation
These combined financial statements were prepared in accordance with accounting principles generally accepted in the United States of America ("GAAP"), pursuant to the rules and regulations of United States Securities and Exchange Commission (the "SEC"). All significant intercompany transactions and balances between Standard Auto's four entities have been eliminated in combination. The combined Company represents a single reportable segment.
The combined financial statements include the accounts of Dalana Realty, the lessor of the premises from which Standard Auto operates. Dalana Realty and Standard Auto share common ownership. In April 2014, Port Hope, an Ontario corporation, was formed by one of Standard Auto’s shareholders to hold new property to be used as a full-service dismantling and distribution facility in Port Hope, Ontario, to replace the Goldy Metals Toronto’s full-service operations in Scarborough which were not restarted after a fire at the facility in March 2014. The combined financial statements also include the accounts of Port Hope.
Standard Auto has determined Dalana Realty and Port Hope are variable interest entities ("VIEs") because the holders of the equity investment at risk do not have the obligation to absorb its expected losses or receive its residual returns. Furthermore, Standard Auto has determined it is the primary beneficiary of the VIEs because Standard Auto has the power to direct the activities that most significantly impact Dalana Realty’s and Port Hope’s economic performance. Standard Auto consolidates Dalana Realty and Port Hope. All intercompany transactions are eliminated in combination, and the VIE’s operating results are attributable to the noncontrolling interest in Standard Auto’s combined statements of operations and all of its shareholder’s equity is reported separately from Standard Auto’s shareholders’ equity in Standard Auto’s combined balance sheets and statements of shareholders’ equity.
Use of Estimates
The preparation of Standard Auto’s combined financial statements in conformity with GAAP requires management to make estimates and assumptions that affect the reported amounts of assets and liabilities and disclosure of contingent assets and liabilities
91
as of the date of the combined financial statements and the reported amounts of revenue and expenses during the reporting period. Actual results could differ from those estimates.
Cash and Cash Equivalents
Standard Auto includes cash and investments having an original maturity of three months or less at the time of acquisition in cash and cash equivalents.
Foreign Currency
The assets and liabilities of End of Life Vehicles, Goldy Metals Ottawa, Goldy Metals Toronto and Port Hope, whose functional currency is the Canadian dollar, are translated into US dollars at period-end exchange rates prior to combination. Income and expense items are translated at the average rates of exchange prevailing during the period. The adjustments resulting from translating the Canadian financial statements are reflected as a component of accumulated other comprehensive income within shareholders’ equity. Foreign currency transaction gains and losses are recognized in net earnings based on differences between foreign exchange rates on the transaction date and the settlement date. Transaction gains for the period from January 1, 2015 to May 18, 2015 and the year ended December 31, 2014, were $5 and $2, respectively, and are included in operating expenses on the combined statements of operations.
Revenue Recognition
Standard Auto recognizes revenue from the sale of vehicle replacement products and scrap when they are shipped or picked up by the customers and ownership has transferred, subject to an allowance for estimated returns and discounts that management estimates based upon historical information. Management analyzes historical returns (often pursuant to standard warranties on the sold products) and allowances activity by comparing the items to the original invoice amounts and dates. Standard Auto uses this information to project future returns and allowances on products sold. If actual returns and allowances deviate significantly from Standard Auto’s historical experience, there could be an impact on its operating results in the period of occurrence. Standard Auto has recorded a reserve for estimated returns and discounts of approximately $179 and $85 at May 18, 2015 and December 31, 2014, respectively, within accrued expenses and other current liabilities.
Standard Auto presents taxes assessed by governmental authorities collected from customers on a net basis. Therefore, the taxes are excluded from revenue on the combined statements of operations and are shown as current liabilities on the combined balance sheets until remitted. Revenue also includes amounts billed to customers for shipping and handling.
Revenue from the sale of separately priced extended warranty contracts is reported as deferred revenue and recognized ratably over the term of the contracts or over five years for life-time warranties. Revenue from such extended warranty contracts was approximately $98 and $412 for the period from January 1, 2015 to May 18, 2015 and the year ended December 31, 2014, respectively.
Net revenues of approximately $7,336 and $26,914 were reported by Standard Auto’s Canadian entities for the period from January 1, 2015 to May 18, 2015 and the year ended December 31, 2014, respectively.
Cost of Goods Sold
Cost of goods sold primarily includes a) amounts paid for the purchase of vehicles and parts for resale, b) related auction, storage and towing fees, and c) other costs of procurement and dismantling, primarily labor and overhead allocable to dismantling operations.
Operating Expenses
Operating expenses are primarily comprised of a) salaries and benefits of employees that are not related to the procurement and dismantling of vehicles, b) facility costs such as rent, utilities, insurance, repairs and taxes not allocated to dismantling operations, c) selling and marketing costs, d) costs to distribute products and scrap and e) other general and administrative costs.
Concentrations
Financial instruments that potentially subject Standard Auto to significant concentration of credit risk consist primarily of cash and cash equivalents and accounts receivable. The majority of cash and cash equivalents are maintained with several major financial institutions. Standard Auto maintains its cash in bank deposit accounts which, at times, may exceed the insurance limits of the Federal Deposit Insurance Corporation. Standard Auto has not experienced any losses in such accounts. Concentrations of credit risk with respect to accounts receivable are limited because a large number of customers make up Standard Auto’s customer base. Standard Auto controls credit risk through tough credit approvals, credit limits and monitoring procedures.
92
Standard Auto obtains its recycled OEM and related products from damaged, totaled or low value vehicles purchased at salvage auto auctions. For 2015 and 2014, substantially all of the vehicles purchased by Standard Auto for dismantling were acquired at auctions run by two salvage auto auction companies.
No customer accounted for 10% or more of combined revenues for either the period ended May 18, 2015 or year ended December 31, 2014.
Income taxes
Income taxes are accounted for under the asset and liability method where deferred tax assets and liabilities are recognized for the future tax consequences attributable to differences between the financial statement carrying amounts of existing assets and liabilities and the respective tax basis and for tax credit carryforwards. Deferred tax assets and liabilities are measured using enacted tax rates expected to apply to taxable income in the years in which those temporary differences are expected to be recovered or settled. The effect on deferred tax assets and liabilities of a change in tax rates is recognized in income in the period that includes the enactment date. A valuation allowance is established when it is more likely than not that some portion or all of the deferred tax assets will not be realized. Standard Auto evaluates the realizability of its deferred tax assets by assessing its valuation allowance and by adjusting the amount of such allowance, if necessary. The factors used to assess the likelihood of realization include historical cumulative losses, the forecast of future taxable income and available tax planning strategies that could be implemented to realize the net deferred tax assets. Failure to achieve forecasted taxable income in applicable tax jurisdictions could affect the ultimate realization of deferred tax assets and could result in an increase in Standard Auto’s effective tax rate on future earnings.
Standard Auto recognizes the benefits of uncertain tax positions taken or expected to be taken in tax returns in the provision for income taxes only for those positions that are more likely than not to be realized. Standard Auto follows a two-step approach to recognizing and measuring uncertain tax positions. The first step is to evaluate the tax position for recognition by determining if the weight of available evidence indicates it is more likely than not that the position will be sustained on audit, including resolution of related appeals or litigation processes, if any. The second step is to measure the tax benefit as the largest amount that is more than 50% likely of being realized upon ultimate settlement. Standard Auto considers many factors when evaluating and estimating its tax positions and tax benefits, which may require periodic adjustments and which may not accurately forecast actual outcomes. Standard Auto policy is to include interest and penalties associated with income tax obligations in income tax expense.
Advertising
For the period ended May 18, 2015 and the year ended December 31, 2014, advertising and marketing expense amounted to approximately $128 and $399, respectively. Advertising costs are charged to expense as incurred.
Fair Value Measurements
Fair value of financial assets and liabilities are defined as the exchange price that would be received to sell an asset or paid to transfer a liability in an orderly transaction between market participants in the principal market at the measurement date (exit price). Standard Auto is required to classify fair value measurements in one of the following categories:
• | Level 1 - inputs which are defined as quoted prices (unadjusted) in active markets for identical assets or liabilities that the reporting entity has the ability to access at the measurement date. |
• | Level 2 - inputs which are defined as inputs other than quoted prices included within Level 1 that are observable for the assets or liabilities, either directly or indirectly. |
• | Level 3 - inputs are defined as unobservable inputs for the assets or liabilities. Financial assets and liabilities are classified based on the lowest level of input that is significant to the fair value measurement. |
Standard Auto’s assessment of the significance of a particular input to the fair value measurement requires judgment, and may affect the valuation of the fair value of assets and liabilities and their placement within the fair value hierarchy levels.
Certain assets and liabilities are required to be recorded at fair value on either a recurring or non-recurring basis; however, Standard Auto has no assets or liabilities that require recurring fair value measurements. Fair value is determined based on the exchange price that would be received for an asset or paid to transfer a liability in an orderly transaction between market participants.
Standard Auto’s financial instruments, including cash and cash equivalents, accounts receivable, accounts payable, and accrued expenses are carried at cost, which is a level 1 input, and approximates fair value due to the short-term maturity of these instruments. Standard Auto’s debt and related party receivables are carried at cost, which is a level 2 input, and approximates fair value due to its variable interest rates, which are consistent with the interest rates in the market.
Standard Auto may be required, on a non-recurring basis, to adjust the carrying value of its property and equipment or goodwill. When necessary, these valuations may be determined by Standard Auto using Level 3 inputs. These assets are subject to fair value
93
adjustments in certain circumstances, such as when there is evidence that impairment may exist. There have been no indicators of impairment for the period from January 1, 2015 to May 18, 2015 and the year ended December 31, 2014.
Recently Adopted Accounting Standards
In April 2014, the Financial Accounting Standards Board ("FASB") issued ASU No. 2014-08, Reporting Discontinued Operations and Disclosures of Disposals of Components of an Entity , which amends FASB Accounting Standards Codification ("ASC") Topic 205, Presentation of Financial Statements , and FASB ASC Topic 360, Property, Plant, and Equipment . This standard amends the definition of a discontinued operation and requires new disclosures of both discontinued operations and certain other disposals that do not meet the definition of a discontinued operation. This guidance is effective on a prospective basis for annual periods beginning on or after December 15, 2014. Standard Auto adopted this standard effective January 1, 2015. Adoption did not have a material impact on Standard Auto’s consolidated financial statements.
In April 2015, the FASB issued ASU No. 2015-3 which amends ASC Topic 835, Interest, to require presentation of certain debt issuance costs as a direct deduction from the carrying amount of a debt liability, consistent with debt discounts. Standard Auto early adopted this ASU in fiscal 2015 and it did not have a material impact on the consolidated financial statements.
In November 2015, the FASB issued ASU No. 2015-17 which amends ASC 740, Income Taxes, to require that deferred tax liabilities and assets be classified as noncurrent in a classified statement of financial position. Standard Auto early adopted this ASU for the period ended December 31, 2015. All deferred income taxes are recorded as noncurrent as of December 31, 2014 and 2015.
Recently Issued Accounting Standards
In May 2014, the FASB issued ASU No. 2014-09, Revenue from Contracts with Customers. The guidance in this update, as amended, supersedes nearly all existing revenue recognition guidance under U.S. GAAP and creates a single, principle-based revenue recognition framework that is codified in a new FASB ASC Topic 606. The core principle of this guidance is for the recognition of revenue to depict the transfer of goods or services to customers at an amount that reflects the consideration to which Standard Auto expects to be entitled in exchange for those goods or services. The ASU also requires additional disclosure about the nature, amount, timing and uncertainty of revenue and cash flows arising from customer contracts, including significant judgments and changes in judgments and assets recognized from costs incurred to obtain or fulfill a contract. The new revenue standard is effective for annual reporting periods beginning after December 15, 2017, and interim periods within those years. Early adoption is permitted only as of annual reporting periods beginning after December 31, 2016. The new standard allows for either full retrospective or modified retrospective adoption. Standard Auto is currently evaluating the transition method that will be elected and the potential effects of the adoption of the new standard on its consolidated financial statements.
In August 2014, the FASB issued ASU 2014-15 which amends ASC Topic 205, Presentation of Financial Statements, to describe management’s responsibility to evaluate whether there is substantial doubt about an organization’s ability to continue as a going concern and to provide related footnote disclosures. This guidance will be effective for Standard Auto's fiscal year ended December 31, 2016. Standard Auto does not expect adoption of this ASU to have a material impact on its consolidated financial statements.
In February 2015, the FASB issued ASU 2015-02, Amendments to the Consolidation Analysis, which modifies the evaluation of VIEs, and affects the consolidation analysis of reporting entities involved with VIEs. This guidance for public entities is effective for fiscal years beginning after December 15, 2015, with early adoption permitted. Standard Auto is currently evaluating the impact of adopting the new standard.
In July 2015, the FASB issued ASU No. 2015-11, Simplifying the Measurement of Inventory, to reduce the complexity in accounting for inventory. This ASU requires entities to measure inventory at the lower of cost or net realizable value. This guidance for public entities is effective for fiscal years beginning after December 15, 2016, with early adoption permitted. Standard Auto is currently evaluating the impact of adopting the new standard.
In September 2015, the FASB issued ASC No. 2015-16, Simplifying the Accounting for Measurement-Period Adjustments, which simplifies the accounting for adjustments made to provisional amounts recognized in business combinations. The amendments require that an acquirer recognize adjustments to provisional amounts that are identified during the measurement period in the reporting period in which the adjustment amounts are determined. The amendments also require that the acquirer record, in the same period's financial statements, the effect on earnings of changes in depreciation, amortization, or other income effects, if any, as a result of the change to provisional amounts, calculated as if the accounting had been completed at the acquisition date. The ASU also requires an entity to present separately on the face of the income statement or disclose in the notes the portion of the amount recorded in current-period earnings by line item that would have been recorded in previous reporting periods if the adjustment to the provisional amounts had been recognized as of the acquisition date. This guidance is effective for fiscal years
94
beginning after December 15, 2015, including interim periods within those fiscal years. Standard Auto is currently evaluating the impact of adopting the new standard.
In February 2016, the FASB issued ASU No. 2016-02, Leases. ASU 2016-02 establishes a right-of-use (ROU) model that requires a lessee to record a ROU asset and a lease liability on the balance sheet for all leases with terms longer than 12 months. Leases will be classified as either finance or operating, with classification affecting the pattern of expense recognition in the income statement. ASU 2016-02 is effective for fiscal years beginning after December 15, 2018, including interim periods within those fiscal years. A modified retrospective transition approach is required for lessees for capital and operating leases existing at, or entered into after, the beginning of the earliest comparative period presented in the financial statements, with certain practical expedients available. While Standard Auto is still evaluating the impact of its pending adoption of the new standard on its consolidated financial statements, it expects that upon adoption will recognize ROU assets and lease liabilities and that the amounts could be material.
Note 3. Commitments and Contingencies
Leases
Goldy Metals Toronto pays rent to one of the shareholders under a month to month lease agreement. Lease expense under this operating lease was approximately $24 and $65 for the period from January 1, 2015 to May 18, 2015 and the year ended December 31, 2014, respectively.
Litigation and Related Contingencies
Standard Auto is subject to a variety of environmental and pollution control laws and regulations incident to the ordinary course of business. Standard Auto currently expects that the resolution of any other contingencies arising from compliance with these laws and regulations will not materially affect its combined financial position, results of operations or cash flows.
The Province of Ontario has filed a civil lawsuit against Goldy Metals Toronto and the owner of the land on which the facility is located claiming damages of CAD $10.5 million plus pre- and post-judgment interest and court costs, for alleged historical and spill-related contamination and property encroachment damage. The lawsuit is currently in the pre-discovery stage and no accrual has been recorded.
95
Note 4. Income Taxes
The provision (benefit) for income taxes consists of the following components (in thousands):
Period Ended May 18, 2015 | Year ended December 31, 2014 | ||||||
Current: | |||||||
United States | $ | 133 | $ | 473 | |||
Foreign | 140 | 537 | |||||
Total current | 273 | 1,010 | |||||
Deferred: | |||||||
United States | (103 | ) | (353 | ) | |||
Foreign | (91 | ) | 27 | ||||
Total deferred | (194 | ) | (326 | ) | |||
Income tax expense | $ | 79 | $ | 684 | |||
Income taxes have been based on the following components of income (loss) before provision for income taxes (in thousands):
Period Ended May 18, 2015 | Year ended December 31, 2014 | ||||||
Domestic | $ | 9 | $ | (313 | ) | ||
Foreign | (174 | ) | 3,040 | ||||
Income before income taxes | $ | (165 | ) | $ | 2,727 | ||
The U.S. federal statutory rate is reconciled to the effective tax rate as follows:
Period Ended May 18, 2015 | Year ended December 31, 2014 | ||||
Provision at the U.S. federal statutory rate | 34 | % | 34 | % | |
State taxes, net of state credits and federal tax impact | 4 | % | 0 | % | |
Impact on foreign tax rates | 9 | % | (8 | )% | |
Changes in uncertain tax positions | 0 | % | 11 | % | |
Other, net | 1 | % | (12 | )% | |
Effective tax rate | 48 | % | 25 | % | |
The significant components of Standard Auto's deferred tax assets and liabilities are as follows (in thousands):
May 18, 2015 | December 31, 2014 | ||||||
Deferred tax assets | |||||||
Accrued expenses and reserves | $ | 46 | $ | 55 | |||
Goodwill | — | 257 | |||||
Net operating loss carryforwards | — | 157 | |||||
State tax credits | 30 | 33 | |||||
Total deferred tax assets | 76 | 502 | |||||
Deferred tax liabilities | |||||||
Inventories | (589 | ) | (612 | ) | |||
Property and equipment | (49 | ) | (158 | ) | |||
Other | — | (464 | ) | ||||
Total deferred tax liabilities | (638 | ) | (1,234 | ) | |||
Net deferred tax liability | $ | (562 | ) | $ | (732 | ) | |
There are net operating loss carryforwards for foreign jurisdictions which result in tax benefits of approximately $0 and $592 at May 18, 2015 and December 31, 2014, respectively. The net operating loss carryforwards expire by 2033, while most tax credit carryforwards
96
have no expiration. Realization of these deferred tax assets is dependent on the generation of sufficient taxable income prior to the expiration dates. Based on historical and projected operating results, management believes that it is more than likely than not that earnings will be sufficient to realize the deferred tax assets for which valuation allowances have not year been provided. While management expects to realize the deferred tax assets, net of valuation allowances, changes in estimates of future taxable income or in tax laws may alter this expectation.
A reconciliation of the beginning and ending amount of gross unrecognized tax benefits is as follows (in thousands):
May 18, 2015 | December 31, 2014 | ||||||
Beginning balance | $ | 141 | $ | 142 | |||
Additions for tax positions of prior years | 4 | (1 | ) | ||||
Ending balance | $ | 145 | $ | 141 | |||
Standard Auto's uncertain tax positions include positions related to the timing of certain deductions for income tax purposes. The related basis differences caused by this timing of deductions for income tax purposes and the timing of expense recognition for financial reporting purposes are reflected in Standard Auto's deferred income tax liabilities. However, interest and penalties are separately recorded for all uncertain tax positions as part of income tax expense and amounted to approximately $65 and $135 for the period of January 1, 2015 to May 18, 2015 and for the year ended December 31, 2014, respectively. Standard Auto had accumulated interest and penalties of approximately $382 and $317 as of May 18, 2015 and December 31, 2014, respectively, which are included in the reserve for uncertain tax positions on the combined balance sheets.
Standard Auto is no longer subject to examination in Standard Auto's primary tax jurisdictions for tax years through 2011. Standard Auto is not currently subject to any audits or examinations. It is reasonably possible that new issues may be raised by tax authorities and that these issues may require increases in the balance of the reserve for uncertain tax positions.
Note 5. Related-Party Transactions
Standard Auto had related party payables of approximately $2,349 and $2,409 at May 18, 2015 and December 31, 2014, respectively. These amounts are due to Goldy Metals Holdings, Inc., the majority owner of Dalana Realty, for funds advanced to Dalana Realty and Port Hope for working capital needs, are payable on demand and bear no interest.
Standard Auto had related-party receivables of approximately $253 and $256 at May 18, 2015 and December 31, 2014, respectively. At May 18, 2015, this amount consists of a loan receivable from Goldy Metals Holdings, Inc. of approximately $105, a loan receivable of approximately $101 from 1321 Erie Rd., a related party through common ownership, and certain advances to shareholders and other related entities of approximately $47. At December 31, 2015, this amount consists of a loan receivable from Goldy Metals Holdings, Inc. of approximately $109, a loan receivable of approximately $104 from 1321 Erie Rd., a related party through common ownership, and certain advances to shareholders and other related entities of approximately $43. These receivables represent advances from Standard Auto to pay various operating expenses of the related parties and are due on demand. None of the receivables bears interest, with the exception of the 1321 Erie Road note which has a fixed rate of 2.5% per annum.
Standard Auto leases one of its Goldy Metals Toronto facilities from a shareholder on a month-to-month basis. Rent is paid at the rate of approximately $6 per month and no amounts were payable at either May 18, 2015 or December 31, 2014.
Note 6. Fire at Toronto Facility
On March 3, 2014, a fire occurred at the Goldy Metals Toronto facility located in Scarborough, Ontario. The fire destroyed the dismantling facility and a substantial portion of the location’s inventory. Standard Auto received approximately $2,597 in insurance proceeds in and recognized a $758 gain within other income in the year ended December 31, 2014 as a result of the settlement of lost inventory, damaged buildings and other miscellaneous items from the fire.
For the period of January 1, 2015 to May 18, 2015, Standard Auto did not incur any additional charges but received insurance recoveries of approximately $259, which was recognized as income when received. As of March 30, 2016, Standard Auto is in process of completing the insurance claim. At this time, Standard Auto is uncertain if it will receive any additional recoveries from the insurance company and expects the amount of any such recoveries to be insignificant.
Note 7. Common Stock
The capital structure of the combined entities as of May 18, 2015 and December 31, 2014, was as follows:
97
Common shares, no par value | Additional paid-in capital | |||||||
(In thousands, except for share data) | Authorized | Issued | ||||||
Standard Auto Wreckers | 1,000 | 200 | $ | 1,427 | ||||
End of Life Vehicles | unlimited | 200 | — | |||||
Goldy Metals Ottawa | unlimited | 100 | 249 | |||||
Goldy Metals Toronto | unlimited | 10,000 | 3,382 | |||||
$ | 5,058 | |||||||
Note 8. Subsequent Events
On May 19, 2015, Standard was acquired by Fenix Parts, Inc. ("Fenix"). On this date, Fenix completed an initial public offering of its common stock, which was contingent on the closing of the acquisition of Standard and other auto recycling entities.
98
ITEM 9 – CHANGES IN AND DISAGREEMENTS WITH ACCOUNTANTS ON ACCOUNTING AND FINANCIAL DISCLOSURE
None
ITEM 9A -- CONTROLS AND PROCEDURES
Evaluation of Disclosure Controls and Procedures
Our management establishes and maintains disclosure controls and procedures (as defined in Rule 13a-15(e) and 15d-15(e) under the Securities Exchange Act of 1934, as amended (the "Exchange Act")) designed to ensure that information required to be disclosed by us in the reports that we file or submit under the Exchange Act is recorded, processed, summarized and reported within the time periods specified in the Commission’s rules and forms. This information is intended to be accumulated and communicated to our management, including our Chief Executive Officer and Chief Financial Officer, as appropriate to allow timely decisions regarding required disclosure. We have evaluated the effectiveness of our internal control over financial reporting and our disclosure controls and procedures as of December 31, 2016, the end of the period covered by this report on Form 10-K. Based on that evaluation, our Chief Executive Officer and Chief Financial Officer concluded that our internal control over financial reporting was not effective, and as a result our disclosure controls and procedures were not effective, because of material weaknesses, as further described below.
Management's Report on Internal Control Over Financial Reporting
Our management is responsible for establishing and maintaining adequate internal control over financial reporting, as defined in Exchange Act Rule 13a-15(f). Our internal control over financial reporting is a process designed to provide reasonable assurance regarding the reliability of financial reporting and the preparation of financial statements for external purposes in accordance with generally accepted accounting principles.
Because of its inherent limitations, internal control over financial reporting may not prevent or detect misstatements. Also, projections of any evaluation of effectiveness to future periods are subject to the risk that controls may become inadequate because of changes in conditions, or that the degree of compliance with the policies or procedures may deteriorate.
Under the supervision and with the participation of management, including the Chief Executive Officer and Chief Financial Officer, we conducted an evaluation of the effectiveness of our internal control over financial reporting as of December 31, 2016 using the criteria established in "Internal Control - Integrated Framework" issued by the Committee of Sponsoring Organizations of the Treadway Commission ("COSO").
A material weakness is a deficiency, or combination of deficiencies, in internal control over financial reporting, such that there is a reasonable possibility that a material misstatement of the Company's annual or interim financial statements will not be prevented or detected on a timely basis. In its evaluation of the effectiveness of internal control over financial reporting as of December 31, 2016, our management determined that our internal control over financial reporting was not effective because of material weaknesses. These material weaknesses were attributable to (A) our lack during 2016 of (i) accounting personnel with an appropriate level of accounting knowledge, experience, and training commensurate with our complex accounting issues and financial reporting requirements, (ii) adequate procedures to prepare, document and review areas of significant judgments and accounting estimates, including purchase accounting, contingent consideration, potential goodwill impairment and inventory valuation, (iii) timely and systematic review by management of account reconciliations, journal entries and other analyses to appropriately document and support the recording of financial information, (iv) thorough review of significant contracts for key accounting ramifications, (v) documentation retention to support the amounts reported and (vi) segregation of duties over journal entries as well as (B) undue reliance on the findings and conclusions of third-party specialists without an appropriate level of internal review, and (C) inadequate Information Technology General Controls, including limited segregation of duties and access rights controls over information systems at Subsidiaries without compensating corporate procedures and controls. The material weaknesses described above also reflect an overall material weakness in our control environment. Certain of these weaknesses were previously described in our Annual Report on Form 10-K for the year ended December 31, 2015 filed on April 14, 2016.
Continuing Remediation of Material Weaknesses
We acquired the Founding Companies on May 19, 2015 concurrently with the closing of the initial public offering of our common stock and subsequently during 2015 acquired three additional businesses. Since becoming a publicly-traded company, we have initiated and are continuing to recruit and hire additional accounting and financial personnel, establish policies and procedures for timely and accurate financial reporting, upgrade our internal accounting information systems, and make various other efforts to remediate these weaknesses in our internal control. Management understands and appreciates the need to rapidly establish an effective system of internal controls over financial reporting and has made substantive improvements in this area, including a number of improvements since December 31, 2016. Recent progress in this regard includes hiring a corporate controller, accounting manager and director of information technology, staffing an internal information systems department and reducing reliance on multiple information technology vendors,
99
formalizing requirements for timely analyses and reconciliations of financial accounts and management reviews thereof, implementing steps to establish a company-wide system of uniform account classifications, and commencing a plan to migrate all operations to common information systems, beginning with payroll and accounts payable in January 2017. However, implementing effective processes and systems for financial reporting is a significant task and an integral part of our integration plan for the acquired businesses. Our efforts to remediate these material weaknesses are still in progress and may require substantial resources at significant cost over an extended period of time to complete. More generally, ensuring that we have adequate internal financial, accounting and disclosure controls in place requires a costly and time-consuming effort that needs to be re-evaluated frequently.
Auditor's Attestation Report Not Included
We are an "emerging growth company," as defined in the JOBS Act, and we may take advantage of certain exemptions and relief from various reporting requirements that are applicable to other public companies, but are not applicable to emerging growth companies. In particular, while we are an emerging growth company, we are not required to comply with the auditor attestation requirements of Section 404(b) of the Sarbanes-Oxley Act and, accordingly, this Annual Report on Form 10-K does not include an attestation report of our independent registered public accounting firm regarding internal control over financial reporting. Pursuant to rules of the SEC, we are providing only management's report in this Annual Report. However, in conjunction with their annual audit for 2016, our independent registered public accounting firm reported material weaknesses in our internal controls as of December 31, 2016, to the audit committee of our Board of Directors, which were consistent with those noted above by management under "Management's Report on Internal Controls Over Financial Reporting."
Changes in Internal Control over Financial Reporting
There were no changes in our internal control over financial reporting during the quarter ended December 31, 2016 that have materially affected, or are reasonably likely to materially affect, our internal control over financial reporting, except as described in "Continuing Remediation of Material Weaknesses" above with respect to the ongoing implementation of steps to remediate weaknesses.
ITEM 9B – OTHER INFORMATION
None
ITEM 10 – DIRECTORS, EXECUTIVE OFFICERS AND CORPORATE GOVERNANCE
DIRECTORS
The following table provides information about the directors of Fenix:
Director | Position with the Company | Age |
Kent Robertson | Chief Executive Officer and Director | 49 |
Gary Beagell | Director | 65 |
Steven Dayton | Director | 58 |
J. Michael McFall | Director | 62 |
Seth Myones | Director | 59 |
Thomas O'Brien | Director | 63 |
Clayton Trier | Director | 65 |
The following table provides information about the membership of the committees of the Board of Directors during 2016:
Director | Compensation Committee | Audit Committee | Nominating and Governance Committee | Special Committee | ||||
Steven Dayton | x* | x | x | |||||
J. Michael McFall | x | x | ||||||
Seth Myones | x | x* | ||||||
Thomas O'Brien | x | x* | x | |||||
Clayton Trier | x | x* | x | |||||
* | Chair of committee |
Kent Robertson has served as President and Chief Executive Officer (Principal Executive Officer ("PEO")) and a director since our inception in January 2014. From 2010 to 2013, Mr. Robertson was a director and interim Chief Executive Officer of Financial Recovery Group (“FRG”), a healthcare data analytics company. From 2001 until joining FRG, Mr. Robertson held senior leadership positions at Stericycle, Inc. (NASDAQ: SRCL), a national reverse logistics, document destruction and regulated waste management company. Mr. Robertson had more than 20 years of experience managing multi-line decentralized distribution and services businesses at Stericycle and at American Medical Disposal, Inc., a company he co-founded in 1990 and which was acquired by Stericycle in 2001. Under Mr. Robertson’s leadership, Stericycle successfully acquired and integrated over 70 acquisitions. Mr. Robertson holds a Bachelor of Science degree in Economics from the University of Oklahoma.
Gary Beagell has served as a director since our initial public offering in May 2015. Mr. Beagell is the founder and served as Chief Executive Officer of Gary’s U-Pull It, one of our founding companies, established in 1979. Mr. Beagell has been a leader in the automotive recycling industry domestically and internationally for over 40 years. Mr. Beagell is a former President of the ARA, and has owned and operated multiple self-service automobile recycling centers throughout the U.S. Mr. Beagell is a pioneer in recycling technology, holds patents in automotive fluid management systems and has developed yard management software.
Steven Dayton has served as a director since our initial public offering in May 2015. Mr. Dayton has been a partner in RVG Management and Development Company, a real property and commercial development and management company, since 2009. Mr. Dayton co-founded CODi, Inc. (“CODi”), a global manufacturer of computer cases and electronics accessories, in 1992. Prior to founding CODi, Mr. Dayton served as a technology consultant in the automotive aftermarket industry. Mr. Dayton currently serves as a Director at Centric Bank. Mr. Dayton holds a Bachelor of Science degree in Finance from Temple University.
J. Michael McFall has served as a director since August 2015. Mr. McFall is the co-founder of the Veretech division of Hearst Business Media, which provides a patented, web-based vehicle trade-in appraisal service under the Black Book brand. Before co-founding Veretech in 2001, Mr. McFall was President of Fleet Lease Disposal, a Florida-based vehicle remarketing and reconditioning company serving national corporate fleet operators. From 1999 to 2000, he served as Vice President of Strategy for the AutoNation e-commerce division. Prior to that, he served for 12 years as Director of Strategic Planning and Product Development for General Motors Acceptance Corp., the finance subsidiary of General Motors. Mr. McFall holds an MBA degree from George Washington University and a Bachelor of Arts degree in Communications from Towson University.
Seth Myones has served as a director since November 2015. From 2012 through April 2015, Mr. Myones served as the Chief Operating Officer and Executive Vice President of Covanta Holding Corporation, a provider of waste-to-energy, waste disposal and renewable energy solutions. Prior to that, he held several positions with Covanta Energy Corp, a wholly-owned subsidiary of Covanta Holding Corporation, including President, Covanta Americas, between November 2007 and March 2012, and Senior Vice President of Business Management from 2004 to 2007. From 2001 to 2004, he served as Vice President of Waste-to-Energy Business Management at Covanta Projects, Inc. Mr. Myones currently serves on the board of directors and as Chairman of the Audit Committee of Liberty Tire Recycling, LLC, a privately-held tire recycling company. He holds a Bachelor of Science degree in Industrial Engineering from the University of Buffalo, an MBA in Finance from New York University-Stern School of Business, and earned his CPA license from the State of Maryland.
Thomas O’Brien has served as a director since our initial public offering in May 2015. Mr. O’Brien was the Chief Executive Officer of Insurance Auto Auctions, Inc. (“IAA”), a subsidiary of KAR Auction Services, Inc. (“KAR”), from November 2000 until May 2014. Mr. O’Brien served as a director of IAA from 2001 until May 2007 and served as a director of KAR from May 2007 until June 2014. Mr. O’Brien also served as President of IAA from November 2000 to June 2011. Prior to joining IAA, Mr. O’Brien served as President of Thomas O’Brien & Associates, a management consulting firm, from 1999 to 2000, Executive Vice President of Safelite Glass Corporation from 1998 to 1999, Executive Vice President of Vistar, Inc., an automotive glass repair and replacement company, from 1996 to 1997 and President of U.S.A. Glass, Inc. from 1992 to 1996. Mr. O’Brien is also currently a director of CoreLogic, Inc., an information technology firm serving the financial services and real estate industries. Mr. O’Brien holds a bachelor’s degree in history from Northwestern University and a Masters of Management from the Kellogg Graduate School of Management at Northwestern University.
Clayton Trier was elected to fill a vacancy on our board in June 2015. Mr. Trier is a private investor based in Houston, Texas. Since 2005, Mr. Trier has been a Director and Chairman of the Audit Committee of U.S. Physical Therapy, Inc. (NYSE: USPH). In addition, he was a founder and, from 2005 through 2008, served as non-executive Chairman of Digital Music Group, Inc. (NASDAQ: DMGI), a reseller of digital music through online retailers, and was a founder and, from 1993 to 1997, served as Chairman and Chief Executive Officer of U.S. Delivery Systems, a NYSE-listed transportation and logistics company operating in North America. From 1991 to 1993, Mr. Trier headed Trier & Partners, a private investment banking firm focused on providing financing to and advising on mergers and acquisitions for environmental companies. From 1987 to 1991, Mr. Trier was President and CEO of Allwaste, Inc., a NYSE-listed environmental services firm. Prior to that, Mr. Trier was a partner in the Houston office of Arthur Andersen. Mr. Trier holds a Bachelor of Business Administration degree from Lamar University and earned his CPA license from the State of Texas.
101
There are no family relationships among any of our directors or executive officers, except for the following: Steven Dayton, a director, is a cousin of Kent Robertson, our President and Chief Executive Officer and a director. Despite the fact that our common stock is no longer listed on The NASDAQ Global Market, we have used the definition of “independence” of the NASDAQ Stock Market to determine whether our directors are deemed to be independent. Based on that definition, we have determined that, with the exception of Kent Robertson, our Chief Executive Officer, and Gary Beagell, all of our directors are independent.
Director Qualifications
We believe that our 7 directors possess the experience, qualifications and skills necessary to fulfill their roles as directors. Our directors have in common, among other qualities, a breadth of business experience, seasoned judgment and an insistence on looking beyond the next quarter or the next year in directing, overseeing and supporting our management. From their service in management, on the boards of other public and private companies, and in counseling other companies and their directors, our directors also bring to us the insights that they gain from the operating policies, governance structures and growth dynamics of these other companies.
Our directors individually bring to the Board a wide range of experience, backgrounds and knowledge. Among other things that each of our directors brings: Mr. Robertson brings a wealth of experience managing multi-line decentralized distribution and service businesses and his years of leadership experience at Stericycle, Inc. and at American Medical Disposal, Inc., a company he co-founded; Mr. Beagell brings his many years of experience and leadership roles in the automotive recycling business, including his position as founder and CEO of Gary’s U-Pull It, one of our founding companies; Mr. Dayton brings his significant business experience, including his role as a co-founder of CODi, Inc., a global manufacturer of computer cases and electronics accessories, and as a consultant in the automotive aftermarket industry; Mr. McFall brings his significant automotive industry experience, including as co-founder and President of the Veretech division of Hearst Business Media, which provides a patented vehicle trade-in appraisal service employed by many auto manufacturers and dealers; Mr. Myones brings his significant financial expertise and business experience in executive and senior officer positions in the waste disposal industry and as a current member of the board of directors and chair of the Audit Committee of a privately-held company; Mr. O’Brien brings his significant automotive industry experience as a former CEO and director of Insurance Auto Auctions, Inc.; and Mr. Trier brings his significant financial expertise, including an understanding of financial statements, finance, capital formation strategies and accounting, and his business experience leading publicly-listed companies, including his roles as the former CEO of two high-growth acquisition-oriented NYSE-listed companies.
EXECUTIVE OFFICERS
The following table provides information about our named executive officers ("NEOs"):
Executive Officer | Position with the Company | Age |
Kent Robertson | President and Chief Executive Officer | 49 |
Scott Pettit | Chief Financial Officer | 53 |
Arthur Golden | Chief Operating Officer | 53 |
Please see above under “Directors” for a description of Mr. Robertson’s background.
Scott Pettit has been our Chief Financial Officer since March 2014. Mr. Pettit has significant automotive industry, public company, acquisition and integration experience, including serving from 2007 to 2013 as a consultant to Insurance Auto Auctions, Inc. Mr. Pettit has also been President and Chief Operating Officer of Central Illinois Grain Inspection from January 2009 to present. From 2001 to 2007, Mr. Pettit served as Senior Vice President and Chief Financial Officer of Insurance Auto Auctions, Inc. Mr. Pettit has a Bachelor of Business Administration degree from University of Wisconsin-Madison and a Masters of Management from Kellogg Graduate School of Management at Northwestern University and earned his CPA license from the State of Illinois.
Arthur Golden has been our Chief Operating Officer since July 2015. Mr. Golden brings nearly 30 years of experience in various leadership roles including logistics, planning, warehousing, and field operations. Prior to joining Fenix, he served for 22 years at Stericycle, Inc. - a leading provider of waste disposal services to the Healthcare community specializing in Regulated Medical and Hazardous wastes - most recently as the Area Director of Operations, where he was responsible for overseeing operations in the northeastern region of the U.S. Before Stericycle, Mr. Golden served for six years as Transportation Manager at Ryder Distribution Resources, where he was responsible for distribution at Chrysler Motors and GE Supply.
Our executive officers are appointed by our Board of Directors, and their performance is subject to the Board’s review.
ELECTION 16(a) BENEFICIAL OWNERSHIP REPORTING COMPLIANCE
102
Section 16(a) of the Securities Exchange Act requires our directors and executive officers and persons beneficially owning more than 10% of our outstanding common stock to file periodic reports of stock ownership and stock transactions with the Securities and Exchange Commission. On the basis of a review of copies of these reports, we believe that all filing requirements for 2016 were satisfied in a timely manner.
CODE OF ETHICS AND BUSINESS CONDUCT
We have adopted a Code of Ethics and Business Conduct (the "Code") that applies to all employees, officers, and directors, including the Chief Executive Officer, Chief Financial Officer and Controller. A copy of the Code is available free of charge on our website at www.fenixparts.com.
AUDIT COMMITTEE
Our Board of Directors has a standing audit committee. We comply with the SEC’s and NASDAQ’s requirements for independence in the composition of audit committee. The members of our audit committee are Steven Dayton, J. Michael McFall, Seth Myones and Clayton Trier, who is also the chairman of the audit committee. Mr. Myones and Mr. Trier are audit committee financial experts as that term is described in the applicable rules of the U.S. Securities and Exchange Commission.
ITEM 11 – EXECUTIVE COMPENSATION
Director Compensation Table
The following table sets forth compensation paid to our non-employee directors for the year ended December 31, 2016:
Name | Fees Earned or Paid in Cash | Stock Awards | Option Awards | All Other Compensation | Total | ||||||||||||||||||||
(4) | (5) | ||||||||||||||||||||||||
Gary Beagell (1) | 2016 | $ | 24,869 | $ | 13,168 | — | $ | 221,201 | $ | 259,238 | |||||||||||||||
Steven Dayton (1) | 2016 | 47,877 | 18,876 | — | — | 66,753 | |||||||||||||||||||
J. Michael McFall (1) | 2016 | 37,508 | 15,096 | — | — | 52,604 | |||||||||||||||||||
Seth Myones (2) | 2016 | 34,295 | 14,452 | — | — | 48,747 | |||||||||||||||||||
Thomas O'Brien (1) | 2016 | 34,721 | 15,736 | — | — | 50,457 | |||||||||||||||||||
Clayton Trier (3) | 2016 | 71,000 | — | — | — | 71,000 | |||||||||||||||||||
(1) | Mr. Beagell, Mr. Dayton, Mr. McFall and Mr. O’Brien have elected to receive their board compensation for all of 2016 in the form of Fenix common stock, in lieu of the cash compensation they would otherwise be entitled to. The value of the common stock they received in May 2016 for the period beginning on January 1, 2016 and ending on May 23, 2016 is reflected in the Stock Awards column. The amounts listed above as Fees Earned or Paid in Cash for each of these four directors represent the amount of cash each director would have received for the period beginning on May 24, 2016 and ending on December 31, 2016 if he had elected to receive his fees in cash, which amount has been accrued on the Company’s books as an expense. These directors will not receive their compensation for this period until the date immediately prior to the date of the next election of directors by the shareholders, which we anticipate will occur some time in the second half of 2017. At that time, the number of shares each such director will receive will be equal to the total amount of cash compensation that he would have been entitled to for the entire period beginning the date of his re-election on May 24, 2016 until the date immediately prior to the next shareholders vote to elect the directors (the “2016-17 Service Period”), divided by the average closing share price of our common stock during the 2016-17 Service Period. The value of the shares of common stock that these directors will receive may be higher or lower than the dollar amount of cash these directors would have been entitled to had they elected to receive their fees in cash, depending on the performance of our common stock during the 2016-17 Service Period. |
(2) | Mr. Myones received compensation for his board service in the form of common stock for the period beginning on January 1, 2016 and ending on May 23, 2016, the value of which is reflected in the Stock Awards column. Mr. Myones elected to receive his compensation in cash for his board service during the 2016-17 Service Period. |
(3) | Mr. Trier elected to receive all of his compensation for 2016 in cash. |
(4) | The amounts represent the aggregate grant date fair value of awards granted in 2016, calculated in accordance with Financial Accounting Standards Board Accounting Standards Codification 718, “Compensation-Stock Compensation” (“FASB ASC Topic 718”). All director Stock Awards issued under our Director Compensation Policy are for past service and immediately vest as discussed in Note 8 to the consolidated financial statements in this document. |
(5) | Includes consulting payments to Gary Beagell and to his spouse for 2016 under three-year consulting agreements are described below under "Related Person Consultant and Employment Agreements." |
103
Each non-employee director receives cash fees that will differ among directors based on the director's board committee service. Effective January 1, 2016, each director who is not also one of our employees or an employee of one of our subsidiaries receives (i) a fee of $40,000 per year, payable quarterly, plus (ii) $1,000 for each committee meeting attended, plus (iii) an additional annual amount based on his or her service as a committee chair. The committee chair service fee is $15,000 per year for the audit committee, $10,000 per year for the compensation committee and $5,000 per year for the nominating and governance committee, and $1,000 per month for the special committee for every month or partial month that the special committee, formed in December 2016, is in existence. These directors were entitled to elect to convert their fees earned during the stub period January 1, 2016 until the date of the first annual meeting into a number of shares of our common stock equal to those fees, divided by the average daily closing price of our stock during that stub period. Effective May 23, 2016, we issued an aggregate of 19,332 fully vested restricted shares of stock under our Amended and Restated 2014 Incentive Stock Plan to the five non-employee directors who made this election for this stub period.
Beginning with our first annual meeting of shareholders on May 24, 2016, each non-employee director, upon his election or re-election as a director, may choose to receive, in lieu of a cash payment, a number of shares of our common stock equal to the sum of the director’s annual fee, the per meeting fee and the committee chair service fee earned during each election year, divided by the average closing price of our stock during the election year. Four of our directors chose this option and restricted stock granted to these directors pursuant to this arrangement will be granted under our Amended and Restated 2014 Incentive Stock Plan and will be issued on the date immediately preceding the next annual meeting of shareholders.
All of our non-employee directors are reimbursed for reasonable out-of-pocket expenses incurred in attending meetings of the Board of Directors or the committees thereof, and for other expenses reasonably incurred in their capacity as directors.
Executive Officer Compensation Table
The following table shows the total compensation paid during our fiscal years ended December 31, 2016 and 2015 to our NEOs:
Name | Year | Salary ($) (1) | Option Awards ($) (2) | Non-Equity Incentive Plan Compensation ($) | Total ($) | ||||||||||||
Kent Robertson | 2016 | $ | 300,000 | $ | $ | — | $ | 300,000 | |||||||||
Chief Executive Officer (PEO) | 2015 | 192,249 | 847,922 | — | 1,040,171 | ||||||||||||
Scott Pettit | 2016 | 250,000 | — | — | 250,000 | ||||||||||||
Chief Financial Officer (PFO) | 2015 | 165,155 | 714,422 | — | 879,577 | ||||||||||||
Arthur Golden (3) | 2016 | 250,000 | — | — | 250,000 | ||||||||||||
Chief Operating Officer | 2015 | 119,235 | 328,000 | — | 447,235 | ||||||||||||
(1) | The base compensation of our executives is discussed below. For Mr. Robertson and Mr. Pettit, salary compensation payments began on May 14, 2015. |
(2) | The amounts represent the aggregate grant date fair value of awards granted during the period indicated, calculated in accordance with FASB ASC Topic 718. See Note 8 to the consolidated financial statements in our 2015 Annual Report on Form 10-K. |
(3) | Arthur Golden started as our Chief Operating Officer on July 9, 2015. |
Employment Agreements and Change in Control Arrangements
On January 4, 2017, we entered into a new employment agreement with Kent Robertson, our President and Chief Executive Officer, the term of which is effective as of January 4, 2017 and expires on December 31, 2018. The employment agreement automatically renews on January 1 of each year, beginning in 2019, for successive one-year terms unless terminated in accordance with the terms of the agreement. Mr. Robertson will receive an annual base salary of $300,000 under the agreement, the same as he received in 2016. Mr. Robertson is eligible to receive an annual cash bonus and equity incentive awards under our Stock Plan, for 2016 at the discretion of our compensation committee, and for 2017 and thereafter, in accordance with a written plan to be established by the compensation committee. Mr. Robertson did not receive any cash bonus nor any equity incentive award in 2016, and the compensation committee has not established a bonus plan or an equity incentive plan for Mr. Robertson for 2017, pending the completion of an ongoing project whereby a financial advisor has been engaged to identify and evaluate potential strategic and financial transactions that will provide us with improved liquidity and maximize shareholder value. In the event that we terminate Mr. Robertson’s employment under a Termination Without Cause or a Constructive Termination, as those terms are defined in the agreement, he will receive certain severance benefits including post-termination cash compensation equal to two times his annual base salary and immediate vesting of any unvested stock options and restricted stock awards. If Mr. Robertson’s employment is terminated in connection with a Change of Control, as that term is defined in the agreement, or if a Termination Without Cause or Constructive Termination occurs within 12 months following a Change of Control, he will receive the same benefits as described in the preceding sentence, except the severance benefits will include post-termination cash compensation
104
equal to three times his annual base salary. Mr. Robertson’s employment agreement also contains noncompetition and nonsolicitation provisions.
On January 4, 2017, we entered into a new employment agreement with Scott Pettit, our Chief Financial Officer, the term of which is effective as of January 4, 2017 and expires on December 31, 2018. The employment agreement automatically renews on January 1 of each year, beginning in 2019, for successive one-year terms unless terminated in accordance with the terms of the agreement. Mr. Pettit will receive an annual base salary of $250,000 under the agreement, the same as he received in 2016. Mr. Pettit is eligible to receive an annual cash bonus and equity incentive awards under the Company’s Stock Plan, for 2016 at the discretion of our compensation committee, and for 2017 and thereafter, in accordance with a written plan to be established by the compensation committee. Mr. Pettit did not receive any cash bonus nor any equity incentive award in 2016, and the compensation committee has not established a bonus plan or an equity incentive plan for Mr. Pettit for 2017, pending the completion of an ongoing project whereby a financial advisor has been engaged to identify and evaluate potential strategic and financial transactions that will provide us with improved liquidity and maximize shareholder value. In the event that we terminate Mr. Pettit’s employment under a Termination Without Cause or a Constructive Termination, as those terms are defined in the agreement, he will receive certain severance benefits including post-termination cash compensation equal to his annual base salary and immediate vesting of any unvested stock options and restricted stock awards. If Mr. Pettit’s employment is terminated in connection with a Change of Control, as that term is defined in the agreement, or if a Termination Without Cause or Constructive Termination occurs within 12 months following a Change of Control, he will receive the same benefits as described in the preceding sentence, except the severance benefits will include post-termination cash compensation equal to two times his annual base salary. Mr. Pettit’s employment agreement also contains noncompetition and nonsolicitation provisions.
On January 4, 2017, we entered into a new employment agreement with Arthur Golden, our Chief Operating Officer, the term of which is effective as of January 4, 2017 and expires on December 31, 2018. The employment agreement automatically renews on January 1 of each year, beginning in 2019, for successive one-year terms unless terminated in accordance with the terms of the agreement. Mr. Golden will receive an annual base salary of $250,000 under the agreement, the same as he received in 2016. Mr. Golden is eligible to receive an annual cash bonus and equity incentive awards under the Company’s Stock Plan, for 2016 at the discretion of our compensation committee, and for 2017 and thereafter, in accordance with a written plan to be established by the compensation committee. Mr. Golden did not receive any cash bonus nor any equity incentive award in 2016, and the compensation committee has not established a bonus plan or an equity incentive plan for Mr. Golden for 2017, pending the completion of an ongoing project whereby a financial advisor has been engaged to identify and evaluate potential strategic and financial transactions that will provide us with improved liquidity and maximize shareholder value. In the event that we terminate Mr. Golden’s employment under a Termination Without Cause or a Constructive Termination, as those terms are defined in the agreement, he will receive certain severance benefits including post-termination cash compensation equal to his annual base salary and immediate vesting of any unvested stock options and restricted stock awards. If Mr. Golden’s employment is terminated in connection with a Change of Control, as that term is defined in the agreement, or if a Termination Without Cause or Constructive Termination occurs within 12 months following a Change of Control, he will receive the same benefits as described in the preceding sentence, except the severance benefits will include post-termination cash compensation equal to two times his annual base salary. Mr. Golden’s employment agreement also contains noncompetition and nonsolicitation provisions.
401(k) Plan
As of January 1, 2016, we established the Fenix Parts, Inc. 401(k) Profit Sharing Plan and began merging similar plans maintained by acquired companies into this plan. This is a tax-qualified retirement plan that provides eligible employees with an opportunity to save for retirement on a tax advantaged basis. We may make a discretionary matching contribution and a discretionary employer contribution to eligible employees each year. To date, we have not made any matching or profit-sharing contributions into the 401(k) plan. All participants’ interests in our matching and profit sharing contributions, if any, vest pursuant to a six-year graded vesting schedule from the time of contribution. Our executive officers, along with our other employees, are eligible to participate in this plan.
Equity Incentive Compensation Plans
The Fenix Parts, Inc. Amended and Restated 2014 Incentive Stock Plan (the “Stock Plan”) was adopted by our Board of Directors in November 2014 and went into effect January 6, 2015 after it was approved by our shareholders. The Plan was amended by the Board of Directors and restated effective July 8, 2015 and again in November 2015, effective December 1, 2015. Under the Stock Plan, we may grant stock options, stock appreciation rights, shares of restricted stock and restricted stock units. Our directors, executive officers, other salaried employees, and consultants are eligible to participate in the plan, which is administered by the compensation committee of the Board of Directors.
Outstanding Equity Awards at 2016 Year-End
The following table provides a summary of equity awards outstanding at December 31, 2016, for each of our NEOs:
105
Option Awards | Stock Awards | |||||||||||||||||||
Name | Number of Securities Underlying Unexercised Options (#) Exercisable | Number of Securities Underlying Unexercised Options (#) Unexercisable | Option Exercise Price ($) | Option Expiration Date | Number of Shares or Units of Stock That Have Not Vested (#) | Market Value of Shares or Units of Stock That Have Not Vested ($) | Equity Incentive Plan Awards: Number of Unearned Shares or Units of Stock That Have Not Vested (#) | Equity Incentive Plan Awards: Market Value of Unearned Shares or Units of Stock That Have Not Vested ($) | ||||||||||||
Kent Robertson | 50,000 | 150,000 | (1) | 8.00 | 5/13/2025 | 0 | 0 | 0 | 0 | |||||||||||
107,877 | 0 | (2) | 9.66 | 7/8/2025 | 0 | 0 | 0 | 0 | ||||||||||||
Scott Pettit | 37,500 | 112,500 | (1) | 8.00 | 5/13/2025 | 0 | 0 | 0 | 0 | |||||||||||
107,877 | 0 | (2) | 9.66 | 7/8/2025 | 0 | 0 | 0 | 0 | ||||||||||||
Arthur Golden | 25,000 | 75,000 | (1) | 9.82 | 7/9/2025 | 0 | 0 | 0 | 0 | |||||||||||
(1) | Each option award vests 25% each year on the anniversary date of the grant for a period of 4 years. |
(2) | Each option award vests 25% each three month period and was completely vested 1 year from date of grant. |
Compensation Committee Interlocks and Insider Participation
Messrs. Dayton (chairman), O’Brien and Trier served on the compensation committee in 2016. No member of the compensation committee has been one of our officers or employees, and none of our executive officers serves as a member of the board of directors or compensation committee of any entity that has one or more of its executive officers serving as a member of our Board of Directors or our compensation committee.
ITEM 12. SECURITY OWNERSHIP AND CERTAIN BENEFICIAL OWNERS AND MANAGEMENT AND RELATED STOCKHOLDER MATTERS
The following table provides information for all equity compensation plans as of the fiscal year ended December 31, 2016, under which our securities were authorized for issuance:
Plan Category | Number of securities to be issued upon exercise of outstanding options and vesting of restricted stock units | Weighted-average exercise price of outstanding options | Number of securities remaining for future issuance under equity compensation plan excluding securities listed in column (a) | |||||||
Equity compensation plans approved by security holders | 2,048,297 | $ | 7.69 | 383,303 | ||||||
Equity compensation plans not approved by security holders | N/A | N/A | N/A | |||||||
Total | 2,048,297 | $ | 7.69 | 383,303 | ||||||
The following table sets forth information regarding beneficial ownership of our common stock outstanding as of July 15, 2017 by:
•each person, or group of affiliated persons, known by us to beneficially own more than 5% of our common stock;
•each of our directors;
•each of our named executive officers (which constitute all of our executive officers); and
•all of our directors and named executive officers as a group.
Unless otherwise indicated, the persons or entities identified in this table have sole voting and investment power with respect to all shares shown as beneficially owned by them, subject to applicable community property laws.
Except as otherwise noted below, the address for each person or entity listed in the table is c/o Fenix Parts, Inc., at One Westbrook Corporate Center, Suite 920, Westchester, Illinois 60154.
106
Number of Shares Beneficially Owned (1) | Percentage of Shares Outstanding (3) | |||
Named Executive Officers and Directors: | ||||
Gary Beagell | 566,120 | 2.8% | ||
Steven Dayton | 249,434 | 1.2% | ||
Clayton Trier | 41,500 | * | ||
J. Michael McFall | 99,374 | * | ||
Seth Myones | 43,720 | * | ||
Thomas O’Brien | 63,888 | * | ||
Kent Robertson | 1,033,633 | 5.0% | ||
Scott Pettit | 503,252 | 2.4% | ||
Arthur Golden | 65,500 | * | ||
All Directors & Officers as a group (9 people) | 2,666,421 | 12.6% | ||
5% Owners (2) | ||||
Ascend Capital LLC, 4 Orinda Way, Suite 200-C, Orinda, CA | 1,861,317 | 9.2% | ||
Jennison Associates LLC, 466 Lexington Ave, New York, NY | 1,838,352 | 9.0% | ||
Royce & Associates, LP, 745 Fifth Ave, New York, NY | 1,532,264 | 7.5% | ||
Mass Financial Services, 111 Huntington Avenue, Boston, MA | 1,055,011 | 5.2% | ||
* | Represents less than 1% of our outstanding shares of common stock. |
(1) | Shares are considered beneficially owned, for the purpose of this table only, if held by the person indicated as beneficial owner, or if such person, directly or indirectly, through any contract, arrangement, understanding, relationship or otherwise has or shares the power to vote, to direct the voting of and/or to dispose of or to direct the disposition of such security, or if the person has the right to acquire beneficial ownership within 60 days, unless otherwise indicated in these footnotes. The numbers and percentages of shares owned by our directors and executive officers include in each case shares subject to currently outstanding stock options that were exercisable or scheduled to vest within 60 days of July 15, 2017 as follows: Gary Beagell - 40,000; Steven Dayton - 40,000; Clayton Trier - 40,000; J. Michael McFall - 40,000; Seth Myones - 40,000; Thomas O'Brien - 40,000; Kent Robertson - 284,408; Scott Pettit - 233,897; Arthur Golden - 50,000. |
(2) | Based on Schedule 13 G or 13 G/A filed by Ascend Capital LLC on February 2, 2017, Jennison Associates LLC on February 2, 2017, and Royce & Associates on January 9, 2017, Mass Financial Services on June 30, 2017 Certain of these filing dates for Schedules 13G or 13G/A predate the announcement made on June 28, 2017, of the suspension from trading and eventual delisting of our common stock on the Nasdaq Global Market. Substantial changes in beneficial ownership as set forth in this table may have occurred following that event. |
(3) | For each individual and group, percentage ownership is calculated by dividing the number of shares beneficially owned by such person or group by the sum of the 20,327,685 shares of common stock outstanding on July 15, 2017, plus the number of shares of common stock that such person or group had the right to acquire on or within 60 days after July 15, 2017. |
ITEM 13 – CERTAIN RELATIONSHIPS AND RELATED TRANSACTIONS, AND DIRECTOR INDEPENDENCE
Certain Relationships and Related Person Transactions
Our Board of Directors has adopted a written policy requiring certain transactions with related parties to be approved in advance by the audit committee. A related party includes any director or executive officer, or an immediate family member of any director or executive officer, for purposes of this policy. The transactions subject to review include any transaction, arrangement or relationship (or any series of similar transactions, arrangements and relationships) in which (i) we or one of our subsidiaries will be a participant, (ii) the aggregate amount involved exceeds $20,000, and (iii) a related party will have a direct or indirect interest. Before any related party transaction is consummated, management will advise the audit committee of the proposed transaction, and the committee will consider the benefits to us of the proposed transaction, the potential effect of the proposed transaction on the director’s independence (if the related party is a director), and the terms of the proposed transaction and whether those terms are comparable to the terms available to an unrelated third party or to employees generally in reviewing the proposed transaction with related parties.
Related Person Consideration in Connection with Leases
Gary Beagell, one of our directors, and persons related to Mr. Beagell, receive consideration in their respective capacities as lessors of real property that we lease. Amounts set forth in the “Rent Payments” column are for the aggregate base rental payments over the term of the relevant leases, all of which began upon the completion of our initial public offering in May 2015.
107
Related Person | Rent Payments | |||
Gary Beagell | $ | 1,447,527 | (1) | |
Linda Beagell | 1,447,527 | (2) | ||
Donald Beagell, Jr. | 3,989,228 | (3) | ||
Total | $ | 6,884,282 | ||
(1) | Gary Beagell owns a 50% membership interest in Beagell Properties, LLC, which is the landlord of the property at 13 Barlow Road, Binghamton, NY, which is leased to one of our Founding Companies. From inception of the lease, we will pay an aggregate of $132,000 in rent over the 5-year term of the lease for this property. Gary Beagell’s percentage interest in the aggregate rental payment is $66,000. Beagell Properties, LLC is also the landlord of the property at 230-246 Colesville Road, Binghamton, NY, which is leased to one of our Founding Companies. From inception of the lease, we will pay an aggregate of $2,763,055 in rent over the 15-year term of the lease for this property. Gary Beagell’s percentage interest in the aggregate rental payment is $1,381,527. |
(2) | Linda Beagell owns a 50% membership interest in Beagell Properties, LLC, which is the landlord of the property at 13 Barlow Road, Binghamton, NY, which is leased to one of our Founding Companies. From inception of the lease, we will pay an aggregate of $132,000 in rent over the 5-year term of the lease for this property. Ms. Beagell’s percentage interest in the aggregate rental payment is $66,000. Beagell Properties, LLC is also the landlord of the property at 230-246 Colesville Road, Binghamton, NY, which is leased to one of our Founding Companies. From inception of the lease, we will pay an aggregate of $2,763,055 in rent over the 15-year term of the lease for this property. Ms. Beagell’s percentage interest in the aggregate rental payment is $1,381,527. |
(3) | Donald Beagell owns a 50% membership interest in D & B Holdings, LLC, which is the landlord of the property at 216 Colesville Road, Binghamton, NY, which is leased to one of our Founding Companies. From inception of the lease, we will pay an aggregate of $4,993,529 in rent over the 15-year term of the lease for this property. Mr. Beagell’s interest in the aggregate rental payment is $2,496,765. Mr. Beagell also owns a 67% interest in BBHC, LLC, which is the landlord of the property at 1245 Sleepy Hollow Road, Pennsburg, PA, which is leased to one of our Founding Companies. From inception of the lease, we will pay an aggregate of $1,836,891 in rent over the 15-year term of the lease for this property. Mr. Beagell’s interest in the aggregate rental payment is $1,230,717. Mr. Beagell also owns a 12.50% interest in Don’s Independent Salvage Company, LLC, which is the landlord of the property at 1592 Sears Road, Elmira, NY, which is leased to Horseheads Automotive Recycling, Inc., a Founding Company. We will pay an aggregate of $2,093,964 in rent over the 15-year term of the lease for this property. Mr. Beagell’s interest in the aggregate rental payment is $261,746. |
Related Person Consultant and Employment Agreements
We pay consulting fees to certain related persons under agreements that began upon the completion of our initial public offering in May 2015. We pay a consulting fee in the amount of $150,000 a year to Gary Beagell, who is one of our directors, under a three-year consulting agreement, and another consulting fee in the amount of $75,000 a year to Linda Beagell, the spouse of Gary Beagell, under a three-year consulting agreement. We pay a consulting fee in the amount of $50,000 a year to Donald Beagell, Jr. under a three-year consulting agreement. Donald Beagell, Jr. is the brother of Gary Beagell, who is one of our directors.
ITEM 14 – PRINCIPAL ACCOUNTANT FEES AND SERVICES
Independent Registered Public Accounting Firm Fees and Services
During 2016, our audit committee dismissed BDO USA, LLP, which had served as our independent registered public accounting firm since our inception in January 2014 and audited our consolidated financial statements for the year ended December 31, 2015, and they engaged Crowe Horwath LLP in this role. Services performed by Crowe Horwath LLP in connection with their audit of our consolidated financial statements for the year ended December 31, 2016 took place primarily in 2017, and such fees, which were substantial, are not included in the table below.
Fees paid to our current independent registered public accounting firm, Crowe Horwath LLP, during the last two years are set forth below:
Year Ended December 31, | ||||||
2016 | 2015 | |||||
Audit fees (a) | $ | 1,348,155 | $ | — | ||
Audit-related fees (b) | — | — | ||||
Tax fees (c) | — | — | ||||
All other fees (d) | — | — | ||||
Total | $ | 1,348,155 | $ | 0 | ||
(a) | Primarily represents fees for professional services provided in connection with the transition to a new independent registered public accounting firm and reviews of our consolidated financial statements for the first and second quarters of 2016. |
(b) | This represents fees for assurance and services related to the performance of a filing or review of financial statements that are not included in audit fees reported in (a). |
(c) | Represents fees for tax compliance, tax advice, and tax planning. |
(d) | Represents fees for products and services provided by the principal accountant, other than services reported in (a), (b) and (c). |
Auditor Independence
The audit committee has determined that the provision by Crowe Horwath LLP of non-audit services is compatible with maintaining the independence of Crowe Horwath LLP. In accordance with its charter, the audit committee approves in advance all audit and non-audit services to be provided by Crowe Horwath LLP. In certain cases, the audit committee may delegate authority to pre-approve non-audit services on a preliminary basis to one or more members of the audit committee, provided that such approvals are communicated to the full committee at its next meeting. During the year ended December 31, 2016, there were no non-audit services performed by Crowe Horwath LLP.
109
ITEM 15 – EXHIBITS AND FINANCIAL STATEMENT SCHEDULES
(1) Financial Statements
The financial statements identified below and required by Part II, Item 8 of this Form 10-K are set forth above.
Report of Independent Registered Public Accounting Firm
Fenix Parts, Inc.
Consolidated Balance Sheets as of December 31, 2016 and 2015
Consolidated Statements of Operations and Comprehensive Loss for Years Ended December 31, 2016, 2015 and 2014
Consolidated Statements of Shareholders' Equity for the Years Ended December 31, 2016, 2015 and 2014
Consolidated Statements of Cash Flows for the Years Ended December 31, 2016, 2015 and 2014
Notes to the Consolidated Financial Statements
Beagell Group (Designated Accounting Co-Predecessor)
Combined Statements of Operations for the Period from January 1, 2015 to May 18, 2015 and the Year Ended December 31, 2014
Combined Statements of Shareholders' Equity for the Period from January 1, 2015 to May 18, 2015 and the Year Ended December 31, 2014
Combined Statements of Cash Flows for the Period from January 1, 2015 to May 18, 2015 and the Year Ended December 31, 2014
Notes to the Consolidated Financial Statements
Standard Group (Designated Accounting Co-Predecessor)
Combined Statements of Operations for the Period from January 1, 2015 to May 18, 2015 and the Year Ended December 31, 2014
Combined Statements of Shareholders' Equity for the Period from January 1, 2015 to May 18, 2015 and the Year Ended December 31, 2014
Combined Statements of Cash Flows for the Period from January 1, 2015 to May 18, 2015 and the Year Ended December 31, 2014
Notes to the Consolidated Financial Statements
(2) Financial Statement Schedules
All other schedules have been omitted because of the absence of conditions under which they are required or because the required information, where material, is shown in the financial statements or the notes thereto.
110
(3) Exhibits
Incorporated by Reference | Provided Herewith | ||||||
Exhibit Number | Description of Exhibit | Form | File No. | Exhibit(s) | Filing Date | ||
3.1 | Amended and Restated Certificate of Incorporation | S-1 | 333-203296 | 3.2 | 4/8/2015 | ||
3.2 | Amended and Restated Bylaws | 10-K | 001-37382 | 3.2 | 4/14/2016 | ||
4.1 | Certificate of Incorporation of Fenix Parts Canada, Inc. | S-1 | 333-203296 | 4.2 | 4/8/2015 | ||
4.2 | Form of Registration Rights Agreement among the stockholders of each US Founding Company (other than Standard Auto Wreckers, Inc.) and Fenix | S-1 | 333-203296 | 4.3 | 4/8/2015 | ||
4.3 | Form of Registration Rights Agreement among Fenix, Goldy Metals Incorporated and Goldy Metals (Ottawa) Incorporated | S-1 | 333-203296 | 4.4 | 4/8/2015 | ||
4.4 | Registration Rights Agreement among Fenix and the persons named therein | S-1/A | 333-203296 | 4.5 | 5/7/2015 | ||
10.1# | Form of Indemnification Agreement between Fenix and each of its directors and officers | S-1 | 333-203296 | 10.1 | 4/8/2015 | ||
10.2# | Amended and Restated 2014 Incentive Stock Plan | 10-K | 001-37382 | 3.2 | 4/14/2016 | ||
10.3# | Form of Incentive Stock Option Agreement under 2014 Stock Plan | 10-K | 001-37382 | 3.2 | 4/14/2016 | ||
10.4# | Form of Nonstatutory Stock Option Agreement under 2014 Stock Plan | 10-K | 001-37382 | 3.2 | 4/14/2016 | ||
10.5# | Form of Nonstatutory Stock Option Agreement under 2014 Stock Plan for Article 5.11, Director Annual Option Grants | 10-K | 001-37382 | 3.2 | 4/14/2016 | ||
10.6# | Form of Nonstatutory Stock Option Agreement under 2014 Stock Plan, Director Annual Option Grants | 10-K | 001-37382 | 3.2 | 4/14/2016 | ||
10.7# | Form of Restricted Stock Unit Award | 10-K | 001-37382 | 3.2 | 4/14/2016 | ||
10.8# | Employee Stock Purchase Plan | S-8 | 333-212623 | 4.1 | 7/22/2016 | ||
10.9# | Director Compensation Policy as Restated and Adopted by the Board of Directors on August 29, 2016 | X | |||||
10.10# | Offer Letter and noncompetition agreement dated November 3, 2014 with W. Kent Robertson, Chief Executive Officer of Fenix | S-1 | 333-203296 | 10.4 | 4/8/2015 | ||
10.11# | Offer Letter and noncompetition agreement dated November 3, 2014 with Scott Pettit, Chief Financial Officer of Fenix | S-1 | 333-203296 | 10.5 | 4/8/2015 | ||
10.12# | Form of Employment Agreement between Fenix Parts Canada, Inc., a subsidiary of Fenix, and David Gold, Executive Vice President of Fenix | S-1 | 333-203296 | Exhibit C to 10.16 | 4/08/2015 | ||
10.13# | Form of employment side letter dated between Fenix and David Gold | S-1 | 333-203296 | 10.7 | 4/08/2015 | ||
10.14# | Employment offer letter to Arthur Golden dated July 9, 2015 | 8-K | 001-37382 | 10.1 | 7/9/2015 | ||
10.15# | Employment Agreement dated January 4, 2017 between Fenix and Kent Robertson | 8-K | 001-37382 | 10.1 | 1/10/2017 | ||
111
10.16# | Employment Agreement dated January 4, 2017 between Fenix and Scott Pettit | 8-K | 001-37382 | 10.1 | 1/10/2017 | ||
10.17# | Employment Agreement dated January 4, 2017 between Fenix and Art Golden | 8-K | 001-37382 | 10.1 | 1/10/2017 | ||
10.18 | Combination Agreement dated as of August 27, 2014 among Fenix, Donald Beagell, Jr., Cynthia Howard, Gregory Beagell, Michael Colsten and Don’s Automotive Mall, Inc. | S-1 | 333-203296 | 10.8 | 4/08/2015 | ||
10.19 | Combination Agreement dated as of August 11, 2014 among Fenix, Mark Eiss, John Eiss, Timothy Eiss and Eiss Brothers, Inc. | S-1 | 333-203296 | 10.9 | 4/08/2015 | ||
10.20 | Combination Agreement dated as of August 26, 2014 among Fenix, Gary A. Beagell, Linda Beagell, Steve Barkwell and Gary’s U-Pull It, Inc. | S-1 | 333-203296 | 10.10 | 4/08/2015 | ||
10.21 | Combination Agreement dated as of August 14, 2014 among Fenix, Brian Shell, Jason Finley, Adam Mervis, Mervis 2006, LLC, Michael Stanley and Green Oak Investments LLC dba GO Auto Recycling | S-1 | 333-203296 | 10.11 | 4/08/2015 | ||
10.22 | Combination Agreement dated as of August 27, 2014 among Fenix, Bonita Beagell, Cynthia Howard, Gregory Beagell, Randy Howard, Michael Colsten, Leatrice Colsten, Darcy Beagell, Jessica Phillips and Horseheads Automotive Recycling, Inc. | S-1 | 333-203296 | 10.12 | 4/08/2015 | ||
10.23 | Combination Agreement dated as of September 30, 2014 among Fenix, Larry Brown, Stephen Brown and Jerry Brown, Ltd. | S-1 | 333-203296 | 10.13 | 4/08/2015 | ||
10.24 | Combination Agreement dated as of August 18, 2014 among Fenix, John J. Brennan and Leesville Auto Wreckers, Inc. | S-1 | 333-203296 | 10.14 | 4/08/2015 | ||
10.25 | Combination Agreement dated as of September 24, 2014 among Fenix, David A. Gold, Kenneth L. Gold, Goldy Metals Incorporated, Goldy Metals Holdings Inc. and Standard Auto Wreckers, Inc. | S-1 | 333-203296 | 10.15 | 4/08/2015 | ||
10.26 | Amended and Restated Combination Agreement dated as of November 10, 2014 among Fenix, Fenix Parts Canada, Inc., David A. Gold, Kenneth L. Gold, Goldy Metals Incorporated, End of Life Vehicles Inc., Goldy Metals (Ottawa) Incorporated and 2434861 Ontario Inc. | S-1 | 333-203296 | 10.16 | 4/08/2015 | ||
10.27 | Form of Exchange Agreement between Fenix and Fenix Parts Canada, Inc. | S-1 | 333-203296 | Exhibit I to 10.16 | 4/08/2015 | ||
10.28 | Form of Voting and Exchange Trust Agreement among Fenix, Fenix Parts Canada, Inc. and as Trustee | S-1 | 333-203296 | Exhibit A to Exhibit I to 10.16 | 4/08/2015 | ||
10.29 | Form of Lease Agreement between Don’s Automotive Mall, Inc., a subsidiary of Fenix, and D & B Holdings, LLC, for Fenix’s facility located at 216 Colesville Road, Binghamton, New York | S-1 | 333-203296 | Exhibit I-1 to 10.8 | 4/08/2015 | ||
10.30 | Form of Lease Agreement between Gary’s U-Pull It, Inc., a subsidiary of Fenix, and Beagell Properties, LLC for Fenix’s facility located at 13 Barlow Road, Binghamton, New York | S-1 | 333-203296 | Exhibit G-2 to 10.10 | 4/08/2015 | ||
10.31 | Form of Lease Agreement between Green Oak Investments LLC dba GO Auto Recycling, a subsidiary of Fenix, and New Kings LLC, 2014, for Fenix’s facility located at 12270 New Kings Road, Jacksonville, Florida | S-1 | 333-203296 | Exhibit F to 10.11 | 4/08/2015 | ||
112
10.32 | Form of Lease Agreement between Fenix Parts Canada, Inc., a subsidiary of Fenix, and Dalana Realty, Inc., for Fenix’s facility located at 3800 Highland Avenue, Niagara Falls, New York | S-1 | 333-203296 | Exhibit A to 10.15 | 4/08/2015 | ||
10.33 | Form of Lease Agreement between Fenix Parts Canada, Inc., a subsidiary of Fenix, and Goldy Metals (Ottawa) Incorporated, for Fenix’s facility located at 5402 Old Richmond Road, Ottawa, Ontario | S-1 | 333-203296 | Exhibit H-2 to 10.16 | 4/08/2015 | ||
10.34 | Form of Lease Agreement between Fenix Parts Canada, Inc., a subsidiary of Fenix, and Standard Auto Wreckers (Cornwall), Inc. for Fenix’s facility located at 4345 Northfield Road, Ottawa (Cornwall), Ontario | S-1 | 333-203296 | Exhibit H-1 to 10.16 | 4/08/2015 | ||
10.35 | Form of Lease Agreement between Don’s Automotive Mall, Inc., a subsidiary of Fenix, and BBHC, LLC, for Fenix’s facility located at 1245 Sleepy Hollow Road, Pennsburg, Pennsylvania | S-1 | 333-203296 | Exhibit I-2 to 10.8 | 4/08/2015 | ||
10.36 | Form of Lease Agreement between Fenix Parts Canada, Inc., a subsidiary of Fenix, and Standard Auto Wreckers (Port Hope) Inc., for Fenix’s facility located at 260 Peter Street, Port Hope, Ontario | S-1 | 333-203296 | Exhibit H-4 to 10.16 | 4/08/2015 | ||
10.37 | Form of Lease Agreement between Jerry Brown, Ltd., a subsidiary of Fenix, and JBAP Properties, LLC, SBLB Properties, LLC and SBLB Properties II, LLC., for Fenix’s facility located at 26 Lower Warren Street, Queensbury, New York | S-1 | 333-203296 | Exhibit G to 10.13 | 4/08/2015 | ||
10.38 | Form of Lease Agreement between Fenix and Loki-Lot I, LLC, for Fenix’s facility located at 391 E. Inman Avenue, Rahway, New Jersey | S-1 | 333-203296 | Exhibit G-2 to 10.14 | 4/08/2015 | ||
10.39 | Form of Lease Agreement between Fenix and PPP Group, LLC, for Fenix’s facility located at 63 Adele Street, Rahway, New Jersey | S-1 | 333-203296 | Exhibit G-4 to 10.14 | 4/08/2015 | ||
10.40 | Form of Lease Agreement between Fenix and Loki-Lot II, LLC, for Fenix’s facility located at 20 Leesville Avenue, Rahway (Avenel), New Jersey | S-1 | 333-203296 | Exhibit G-3 to 10.14 | 4/08/2015 | ||
10.41 | Form of Lease Agreement between Fenix and Gin-Jac, Inc., for Fenix’s facility located at 186 Leesville Avenue, Rahway (Avenel), New Jersey | S-1 | 333-203296 | Exhibit G-1 to 10.14 | 4/08/2015 | ||
10.42 | Form of Lease Agreement between Eiss Brothers, Inc., a subsidiary of Fenix, and Mark Eiss, John Eiss and Tim Eiss, for Fenix’s facility located at 28250 St. Rte. 37, Watertown, New York | S-1 | 333-203296 | Exhibit G to 10.9 | 4/08/2015 | ||
10.43 | Form of Lease Agreement between Gary’s U-Pull It, Inc., a subsidiary of Fenix, and Beagell Properties, LLC, for Fenix’s facility located at 230-246 Colesville Road, Binghamton, New York | S-1 | 333-203296 | Exhibit G-1 to 10.10 | 4/08/2015 | ||
10.44 | Form of Lease Agreement between Horseheads Automotive Recycling, Inc., a subsidiary of Fenix, and Don’s Independent Salvage Company, LLC, for Fenix’s facility located at 1592 Sears Road, Elmira, New York | S-1 | 333-203296 | See Exhibit F to 10.12 | 4/08/2015 | ||
10.45 | Form of Lease Agreement between Fenix Parts Canada, Inc., a subsidiary of Fenix, and Kenneth L. Gold and Goldy Metals Incorporated, for Fenix’s facility located at 1216 Sewells Road, Scarborough, Ontario | S-1 | 333-203296 | Exhibit H-3 to 10.16 | 4/08/2015 | ||
113
10.46 | First Amendment dated as of March 4, 2015, to Combination Agreement dated as of August 27, 2014 among Fenix, Donald Beagell, Jr., Cynthia Howard, Gregory Beagell, Michael Colsten and Don’s Automotive Mall, Inc. | S-1 | 333-203296 | 10.36 | 4/08/2015 | ||
10.47 | First Amendment dated as of March 5, 2015, to Combination Agreement dated as of August 11, 2014 among Fenix, Mark Eiss, John Eiss, Timothy Eiss and Eiss Brothers, Inc. | S-1 | 333-203296 | 10.37 | 4/08/2015 | ||
10.48 | First Amendment dated as of March 6, 2015, to Combination Agreement dated as of August 26, 2014 among Fenix, Gary A. Beagell, Linda Beagell, Steve Barkwell and Gary’s U-Pull It, Inc. | S-1 | 333-203296 | 10.38 | 4/08/2015 | ||
10.49 | First Amendment dated as of February 26, 2015, to Combination Agreement dated as of August 14, 2014 among Fenix, Brian Shell, Jason Finley, Adam Mervis, Mervis 2006, LLC, Michael Stanley and Green Oak Investments LLC dba GO Auto Recycling | S-1 | 333-203296 | 10.39 | 4/08/2015 | ||
10.50 | First Amendment dated as of March 4, 2015, to Combination Agreement dated as of August 27, 2014 among Fenix, Bonita Beagell, Cynthia Howard, Gregory Beagell, Randy Howard, Michael Colsten, Leatrice Colsten, Darcy Beagell, Jessica Phillips and Horseheads Automotive Recycling, Inc. | S-1 | 333-203296 | 10.40 | 4/08/2015 | ||
10.51 | First Amendment dated as of March 13, 2015, to Combination Agreement dated as of September 30, 2014 among Fenix, Larry Brown, Stephen Brown and Jerry Brown, Ltd. | S-1 | 333-203296 | 10.41 | 4/08/2015 | ||
10.52 | First Amendment dated as of February 26, 2015, to Combination Agreement dated as of August 18, 2014 among Fenix, John J. Brennan and Leesville Auto Wreckers, Inc. | S-1 | 333-203296 | 10.42 | 4/08/2015 | ||
10.53 | First Amendment dated as of February 26, 2015, to Combination Agreement dated as of September 24, 2014 among Fenix, David A. Gold, Kenneth L. Gold, Goldy Metals Incorporated, Goldy Metals Holdings Inc. and Standard Auto Wreckers Inc. | S-1 | 333-203296 | 10.43 | 4/08/2015 | ||
10.54 | First Amendment dated as of February 26, 2015, to Amended and Restated Combination Agreement dated as of November 10, 2014 among Fenix, Fenix Parts Canada, Inc., David A. Gold, Kenneth L. Gold, Goldy Metals Incorporated, End of Life Vehicles Inc., Goldy Metals (Ottawa) Incorporated and 2434861 Ontario Inc. | S-1 | 333-203296 | 10.44 | 4/08/2015 | ||
10.55 | Lease Agreement dated March 1, 2015 between W&D Leasing, LLC and Don’s Automotive Mall, Inc. for Fenix’s transfer hub located at 650 Conklin Road, Conklin, New York | S-1/A | 333-203296 | 10.45 | 4/23/2015 | ||
10.56 | Sublease dated April 22, 2015 between Bio-Medical Applications of Illinois, Inc. and Fenix for Fenix’s office located at One Westbrook Corporate Center, Westchester, Illinois | S-1/A | 333-203296 | 10.46 | 4/23/2015 | ||
10.53 | Form of Escrow Agreement among Fenix Parts Canada, Inc., Goldy Metal Incorporated and CST Trust Company | S-1 | 333-203296 | Exhibit B to Exhibit 10.16 | 4/08/2015 | ||
114
10.58 | Stock Purchase Agreement dated August 14, 2015 by and among Fenix and Ocean County Auto Wreckers, Inc., and Anthony Zaccaro, Joseph Zaccaro, Cosmo Zaccaro, Jr., Jean Ann Cochran, Dolores Morrison and Gerald Gambino | 8-K | 001-37382 | 10.1 | 8/19/2015 | ||
10.59 | Stock Purchase Agreement dated October 7, 2015 by and between Fenix and Brent R. Butler | 8-K | 001-37382 | 2.1 | 10/08/2015 | ||
10.60 | Stock Purchase Agreement dated October 9, 2015 by and between Fenix and Michael Guarglia, Joseph Guarglia, Jr. and Joseph Guarglia, Sr. | 8-K | 001-37382 | 2.1 | 10/13/2015 | ||
10.61 | Amended and Restated Multicurrency Credit Agreement dated effective as of December 31, 2015 Fenix, Fenix Parts Canada, Inc., and their subsidiaries as guarantors, BMO Harris Bank N.A., as administrative agent, lender and letter of credit issuer, Bank of Montreal as lender and letter of credit issuer, and the other lenders from time to time party thereto | 8-K | 001-37382 | 10.1 | 4/4/2016 | ||
10.62 | First Amendment to Amended and Restated Multicurrency Credit Agreement and Waiver | 10-Q | 001-37382 | 10.1 | 6/29/2016 | ||
10.63 | Second Amendment to Amended and Restated Multicurrency Credit Agreement and Waiver | 10-Q | 001-37382 | 10.1 | 2/21/2017 | ||
10.64 | Forbearance Agreement among Fenix, Fenix Parts Canada, Inc., and their subsidiaries, BMO Harris Bank N. A. and Bank of Montreal | 10-Q | 001-37382 | 10.1 | 3/29/2017 | ||
10.65 | Amendment No. 1 to Forbearance Agreement among Fenix, Fenix Parts Canada, Inc., and their subsidiaries, BMO Harris Bank N. A. and Bank of Montreal | X | |||||
10.66# | Stock Option Agreement dated January 6, 2017 between Fenix Parts, Inc. and Kent Robertson | X | |||||
10.67# | Stock Option Agreement dated January 6, 2017 between Fenix Parts, Inc. and Scott Pettit | X | |||||
21 | List of subsidiaries of Fenix | X | |||||
23.1 | Consent of Independent Registered Public Accounting Firm | X | |||||
23.2 | Consent of Independent Registered Public Accounting Firm | X | |||||
31.1 | Certification of Principal Executive Officer pursuant to Rule 13a-14(a) or 15d-14(a) of the Securities Exchange Act of 1934, as adopted pursuant to Section 302 of the Sarbanes-Oxley Act of 2002 | X | |||||
31.2 | Certification of Principal Financial Officer pursuant to Rule 13a-14(a) or 15d-14(a) of the Securities Exchange Act of 1934, as adopted pursuant to Section 302 of the Sarbanes-Oxley Act of 2002 | X | |||||
32 | Certification by Principal Executive Officer and Principal Financial Officer pursuant to 18 U.S.C. Section 1350, as adopted pursuant to Section 906 of the Sarbanes-Oxley Act of 2002 | X | |||||
101.INS | XBRL Instance Document | X | |||||
101.SCH | XBRL Taxonomy Extension Schema Document | X | |||||
101.CAL | XBRL Taxonomy Extension Calculation Linkbase Document | X | |||||
115
101.DEF | XBRL Taxonomy Extension Definition Linkbase Document | X | |||||
101.LAB | XBRL Taxonomy Extension Label Linkbase Document | X | |||||
101.PRE | XBRL Taxonomy Extension Presentation Linkbase Document | X | |||||
# Management contract or compensatory plan or arrangement
116
SIGNATURES
Pursuant to the requirements of Section 13 or 15(d) of the Securities Exchange Act of 1934, the Registrant has duly caused this report to be signed on its behalf by the undersigned thereunto duly authorized.
FENIX PARTS, INC.
Date: August 15, 2017 By: /s/ Kent Robertson
Kent Robertson |
President and Chief Executive Officer |
Pursuant to the requirements of the Securities and Exchange Act of 1934, this report has been duly signed below by the following persons on behalf of the Registrant and in the capacities and on the dates indicated.
Signature | Title | Date |
/s/ Kent Robertson | President, Chief Executive Officer and Director | August 15, 2017 |
Kent Robertson | (Principal Executive Officer) | |
/s/ Scott Pettit | Chief Financial Officer | August 15, 2017 |
Scott Pettit | (Principal Financial and Accounting Officer) | |
/s/ Gary Beagell | Director | August 15, 2017 |
Gary Beagell | ||
/s/ Steve Dayton | Director | August 15, 2017 |
Steve Dayton | ||
/s/ J. Michael McFall | Director | August 15, 2017 |
J. Michael McFall | ||
/s/ Seth Myones | Director | August 15, 2017 |
Seth Myones | ||
/s/ Thomas O’Brien | Director | August 15, 2017 |
Thomas O’Brien | ||
/s/ Clayton Trier | Director | August 15, 2017 |
Clayton Trier | ||
117