Attached files
| file | filename |
|---|---|
| EX-32.1 - EXHIBIT 32.1 CERTIFICATION PURSUANT TO SECTION 906 OF SARBANES-OXLEY ACT - CIMPRESS plc | ex32106301710-k.htm |
| EX-23.1 - EXHIBIT 23.1 PRICEWATERHOUSECOOPERS LLP CONSENT - CIMPRESS plc | ex231pricewaterhousecooper.htm |
| EX-31.2 - EXHIBIT 31.2 CERTIFICATION OF CFO - CIMPRESS plc | ex31206301710-k.htm |
| EX-31.1 - EXHIBIT 31.1 CERTIFICATION OF CEO - CIMPRESS plc | ex31106301710-k.htm |
| EX-21.1 - EXHIBIT 21.1 SUBSIDIARIES OF CIMPRESS N.V. - CIMPRESS plc | ex211.htm |
UNITED STATES
SECURITIES AND EXCHANGE COMMISSION
Washington, D.C. 20549
_________________________________
Form 10-K
(Mark One) | |
þ | ANNUAL REPORT PURSUANT TO SECTION 13 OR 15(d) OF THE SECURITIES EXCHANGE ACT OF 1934 |
For the fiscal year ended June 30, 2017 | |
or | |
o | TRANSITION REPORT PURSUANT TO SECTION 13 OR 15(d) OF THE SECURITIES EXCHANGE ACT OF 1934 |
For the transition period from to | |
Commission file number 000-51539
_________________________________
Cimpress N.V.
(Exact Name of Registrant as Specified in Its Charter)
_________________________________
The Netherlands | 98-0417483 | |
(State or Other Jurisdiction of Incorporation or Organization) | (I.R.S. Employer Identification No.) | |
Hudsonweg 8
5928 LW Venlo
The Netherlands
(Address of Principal Executive Offices) (Zip Code)
Registrant’s telephone number, including area code: 31-77-850-7700
Securities Registered Pursuant to Section 12(b) of the Act:
Title of Each Class | Name of Exchange on Which Registered | |
Ordinary Shares, €0.01 par value | NASDAQ Global Select Market | |
_________________________________
Securities registered pursuant to Section 12(g) of the Act: None
Indicate by check mark if the registrant is a well-known seasoned issuer, as defined in Rule 405 of the Securities Act. Yes þ No o
Indicate by check mark if the registrant is not required to file reports pursuant to Section 13 or 15(d) of the Securities Exchange Act of 1934. Yes o No þ
Indicate by check mark whether the registrant: (1) has filed all reports required to be filed by Section 13 or 15(d) of the Securities Exchange Act of 1934 during the preceding 12 months (or for such shorter period that the registrant was required to file such reports), and (2) has been subject to such filing requirements for the past 90 days. Yes þ No o
Indicate by check mark whether the registrant has submitted electronically and posted on its corporate Web site, if any, every Interactive Data File required to be submitted and posted pursuant to Rule 405 of Regulation S-T (§ 232.405 of this chapter) during the preceding 12 months (or for such shorter period that the registrant was required to submit and post such files). Yes þ No o
Indicate by check mark if disclosure of delinquent filers pursuant to Item 405 of Regulation S-K is not contained herein, and will not be contained, to the best of the registrant's knowledge, in definitive proxy or information statements incorporated by reference in Part III of this Form 10-K or any amendment to this Form 10-K. o
Indicate by check mark whether the registrant is a large accelerated filer, an accelerated filer, a non-accelerated filer, smaller reporting company, or an emerging growth company. See definitions of "large accelerated filer," "accelerated filer," "smaller reporting company," and "emerging growth company" in Rule 12b-2 of the Exchange Act.
Large accelerated filer þ | Accelerated filer o | Non-accelerated filer o | ||
Smaller reporting company o | (Do not check if a smaller reporting company) | |||
Emerging growth company o | ||||
If an emerging growth company, indicate by check mark if the registrant has elected not to use the extended transition period for complying with any new or revised financial accounting standards provided pursuant to Section 13(a) of the Exchange Act. ¨
Indicate by check mark whether the registrant is a shell company (as defined in Exchange Act Rule 12b-2). Yes o No þ
The aggregate market value of the ordinary shares held by non-affiliates of the registrant was approximately $2.66 billion on December 31, 2016 (the last business day of the registrant's most recently completed second fiscal quarter) based on the last reported sale price of the registrant's ordinary shares on the NASDAQ Global Select Market.
As of August 4, 2017, there were 31,303,590 Cimpress N.V. ordinary shares, par value €0.01 per share, outstanding.
DOCUMENTS INCORPORATED BY REFERENCE
The registrant intends to file a definitive proxy statement pursuant to Regulation 14A within 120 days of the end of the fiscal year ended June 30, 2017. Portions of such proxy statement are incorporated by reference into Items 10, 11, 12, 13, and 14 of Part III of this Annual Report on Form 10-K.
1
CIMPRESS N.V.
ANNUAL REPORT ON FORM 10-K
For the Fiscal Year Ended June 30, 2017
TABLE OF CONTENTS
Page | ||
Item 1. | ||
Item 1A. | ||
Item 1B. | ||
Item 2. | ||
Item 3. | ||
Item 4. | ||
Item 5. | ||
Item 6. | ||
Item 7. | ||
Item 7A. | ||
Item 8. | ||
Item 9. | ||
Item 9A. | ||
Item 9B. | ||
Item 10. | ||
Item 11. | ||
Item 12. | ||
Item 13. | ||
Item 14. | ||
Item 15. | ||
PART I
Item 1. Business
Overview
We are a technology driven company that aggregates, largely via the internet, large volumes of small, individually customized orders for a broad spectrum of print, signage, apparel and similar products. We operate in a largely decentralized manner. Our businesses, discussed in more detail below, fulfill orders with manufacturing capabilities that include Cimpress owned and operated manufacturing facilities and a network of third-party fulfillers to create customized products on-demand. Those businesses bring their products to market through a portfolio of customer-focused brands serving the needs of micro, small and medium sized businesses, resellers and consumers. These brands include Vistaprint, our global brand for micro business marketing products and services, as well as brands that we have acquired that serve the needs of various market segments, including resellers, micro, small and medium sized businesses with differentiated service needs, and consumers purchasing products for themselves and their families.
Our Priorities
We have two uppermost objectives:
1. | Strategic: To be the world leader in mass customization. |
2. | Financial: To maximize intrinsic value per share, defined as (a) the unlevered free cash flow per share that, in our best judgment, will occur between now and the long-term future, appropriately discounted to reflect our cost of capital, minus (b) net debt per share. |
World Leader in Mass Customization
Cimpress’ strategic objective is to defend and extend its position as the world leader in mass customization. Mass customization is a business model that allows companies to deliver major improvements to customer value across a wide variety of customized printed product categories. Companies that master mass customization are able to produce, with the reliability, quality and affordability of mass production, small individual orders where each one embodies the personal relevance inherent to customized products.
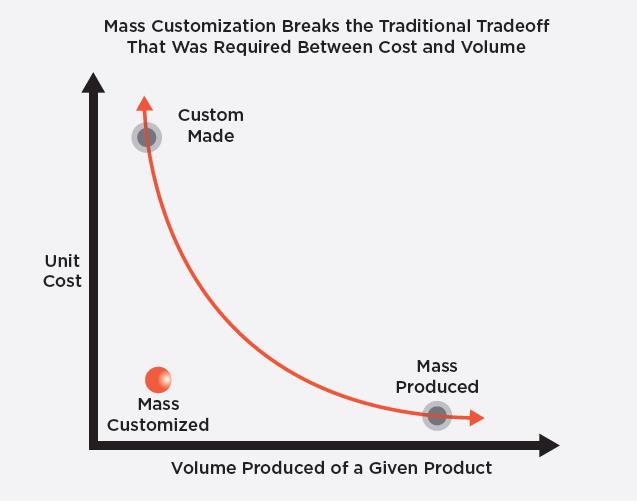 | The chart illustrates this concept. The horizontal axis represents the volume of production of a given product; the vertical axis represents the cost of producing one unit of that product. Traditionally, the only way to manufacture at a low unit cost was to produce a large volume of that product: mass-produced products fall in the lower right hand corner of the chart. Custom-made products (i.e., those produced in small volumes for a very specific purpose) historically incurred very high unit costs: they fall in the upper left hand side of the chart. Mass customization breaks this trade off, enabling low volume, low cost production of individually unique products. Very importantly, relative to traditional alternatives mass customization creates value in many ways, not just lower cost. Other advantages can include faster production, greater personal relevance, elimination of obsolete stock, better design, flexible shipping options, more product choice, and higher quality. | |
Mass customization delivers a breakthrough in customer value particularly in markets in which the worth of a physical product is inherently tied to a specific, unique use or application. For instance, there is limited value to a marketing brochure that is the same brochure as is used by many other companies: the business owner needs to describe what is unique about his or her endeavor. Likewise, a photo mug is more personally relevant if it shows pictures of someone’s own friends and family. Before mass customization, producing a high quality custom product
1
required high per-order setup costs, so it simply was not economical to produce a customized product in low quantities.
Cimpress’ focus on mass customization lies at the intersection of three overlapping areas:
• | Empowering People to Make an Impression (what we are passionate about) - Cimpress empowers people to make an impression through individually meaningful physical products. In other words, we make it easy and affordable for our customers to convey, in tangible and enduring media, the thoughts, design aesthetics, messages and/or sentiments that are important to them, their customers, their organization or their loved ones. |
• | Computer Integrated Manufacturing (where we can be the best in the world) - Low-volume custom products traditionally have a very high per-unit cost because of significant fixed costs related to conveying and using information that is required to process each order. Throughout our history, a differentiating capability of Cimpress has been our ability to develop systems to integrate every step of the value chain, from design creation to delivery. This greatly reduces the marginal cost of processing information related to each individual, customized order. We use computer integrated manufacturing, which harnesses the power of software and IT networks to automate the flow of information, allowing individual processes to exchange information with each other, to schedule activities, to initiate actions, and to route and control a broad range of activities related to the specification and production of physical goods. |
• | Large Scale in Small Quantities (what drives our economic engine) - By large scale we mean a large volume of orders; by small quantities we mean small individual orders. Large scale is an important driver of our competitive advantage because increasingly larger volumes of orders allow us to sort and then produce those orders in increasingly focused processes. This allows us to generate economic value by capturing a portion of the per-unit cost difference that exists between relatively high-volume, specialized processes and low volume (job shop) processes. When we have increased the volume of orders that we process and produce we have seen material improvements in quality, product selection, speed and cost. Cimpress' businesses process tens of millions of uniquely customized items per year. |
Our Corporate Strategy
We believe the mass customization opportunity is very large, with extremely diverse and continuously changing customer segments, product categories, go-to-market methods, business maturity levels, technologies and emerging opportunities. We face competition from hundreds of smaller, customer-focused companies as well as very large firms. Focus, nimbleness and speed are critical for Cimpress if we are to serve customers well. Given this context, we have chosen a deeply decentralized organizational strategy through which we hope to “stay small as we get big”.
Our strategy is to invest in and build customer-focused, entrepreneurial, mass customization businesses for the long term, which we manage in a decentralized, autonomous manner. We drive competitive advantage across Cimpress by investing in a select few shared capabilities that have the greatest potential to create company-wide value. We limit all other central activities to only those which we believe absolutely must be performed centrally.
Organizational Structure
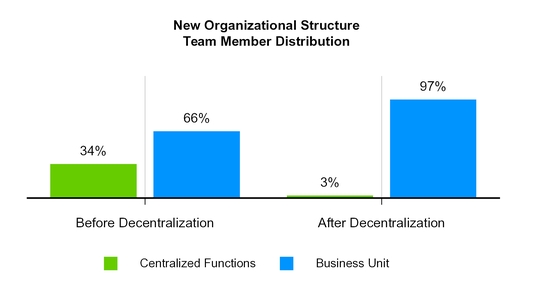
On January 23, 2017, the Supervisory Board of Cimpress N.V. approved a plan to restructure the company and implement organizational changes that decentralized the company’s operations in order to improve accountability for customer satisfaction and capital returns, simplify decision-making, improve the speed of execution, further develop our cadre of general managers, and release entrepreneurial energy. In order to enact the plan, we transferred approximately 3,000 team members that were part of central teams into our businesses. We also reduced the scope of certain other roles and functions that were previously performed centrally, which led to the termination of approximately 135 team members, and reduction of planned hiring in targeted areas. We also eliminated the positions of four Cimpress executive officers who, as a result, left the company.
Several groups that previously were part of our corporate and global functions, including significant portions of our technology, manufacturing and supply chain, finance, legal and other related groups, have been decentralized into our operating segments. The majority of the groups that transferred into our operating segments joined our Vistaprint business and to a much smaller extent our Upload and Print businesses.
2
Corporate and global functions now consist primarily of global procurement, a central technology team whose primary focus is building the mass customization platform, and essential corporate services, such as the corporate finance, communications, strategy and legal functions.
Market and Industry Background
Mass Customization Opportunity
Product: | Geography: | Customer: |
- Small format | - North America | - Businesses (micro, small, |
- Large format | - Europe | medium, large) |
- Promotional products and gifts | - Australia/New Zealand | - Graphic designers, resellers, |
- Decorated apparel | - South America | and print providers |
- Packaging | - Asia Pacific | - Teams, associations and |
- Photo products | groups | |
- Invitations and announcements | - Consumers (home and family) | |
Large traditional markets undergoing disruptive innovation
We believe that our mass customization business model can deliver great customer value across a diverse set of product applications, including marketing materials such as business cards, brochures, catalogs and flyers; signage and displays; promotional products; writing instruments; decorated apparel and bags; fabrics and textiles; keepsakes and gifts, packaging, photo products, invitations and announcements. Many different customers appreciate access to affordable, high quality, customized products in these categories, including businesses of all sizes, teams, associations and groups, consumers, and resellers and designers who serve customers in these groups.
The product categories and customers listed above constitute a large market opportunity that is highly fragmented. We believe that the vast majority of the markets to which mass customization could apply is still served by traditional business models that force customers either to produce in large quantities per order or to pay a high price per unit.
We believe that these large and fragmented markets are moving away from small traditional suppliers that employ job shop business models to fulfill a relatively small number of customer orders and toward companies such as Cimpress that aggregate a relatively large number of orders and fulfill them via focused supply chain and production capabilities at relatively high volumes, thereby achieving the benefits of mass customization. We believe we are early in the process of what will be a multi-decade shift from job-shop business models to mass customization.
3
Cimpress' current revenue represents a very small fraction of this market opportunity. Even though we believe Cimpress is the largest single player in this market, there are many other companies who are pursuing mass customization and/or business models that incorporate many aspects of mass customization. These non-traditional suppliers include both large firms and hundreds of focused smaller firms. We believe that Cimpress and competitors who have built their business around a mass customization model are “disruptive innovators” to these large markets because we enable small volume production of personalized high quality products at an affordable price. Disruptive innovation, a term coined by Harvard Business School professor Clayton Christensen, describes a process by which a product or service takes root initially in simple applications at the bottom of a market (such as free business cards for the most price sensitive of micro-businesses) and then moves up market, eventually displacing established competitors (such as those in the markets mentioned above).
We believe this opportunity to deliver substantially better customer value and to therefore disrupt very large traditional industries can translate into tremendous future opportunity for Cimpress if we execute well and constantly improve our business model over a long period of time. Until recently, we focused primarily on a narrow set of customers within the list above (micro businesses and consumers) with a very limited product offering. With acquisitions and via internal investments over the last several years, we have extended our ability to serve our traditional customers and have also gained a capability to serve larger businesses as well as resellers who, in turn, serve many different types of customers.
As we continue to evolve as a business, our understanding of these markets and their relative attractiveness is also evolving. Our expansion into the “upload and print” space, promotional products, apparel, gifts and packaging, as well as new geographic markets has significantly increased the size of our addressable market opportunity. We base our market size and attractiveness estimates upon considerable research and analysis; however we consider our estimates to be only approximate. Despite the imprecise nature of our estimates, we believe that our understanding is directionally correct and that we operate in an enormous aggregate market with significant opportunity for Cimpress to grow should we be successful in delivering a differentiated and attractive value proposition to customers.
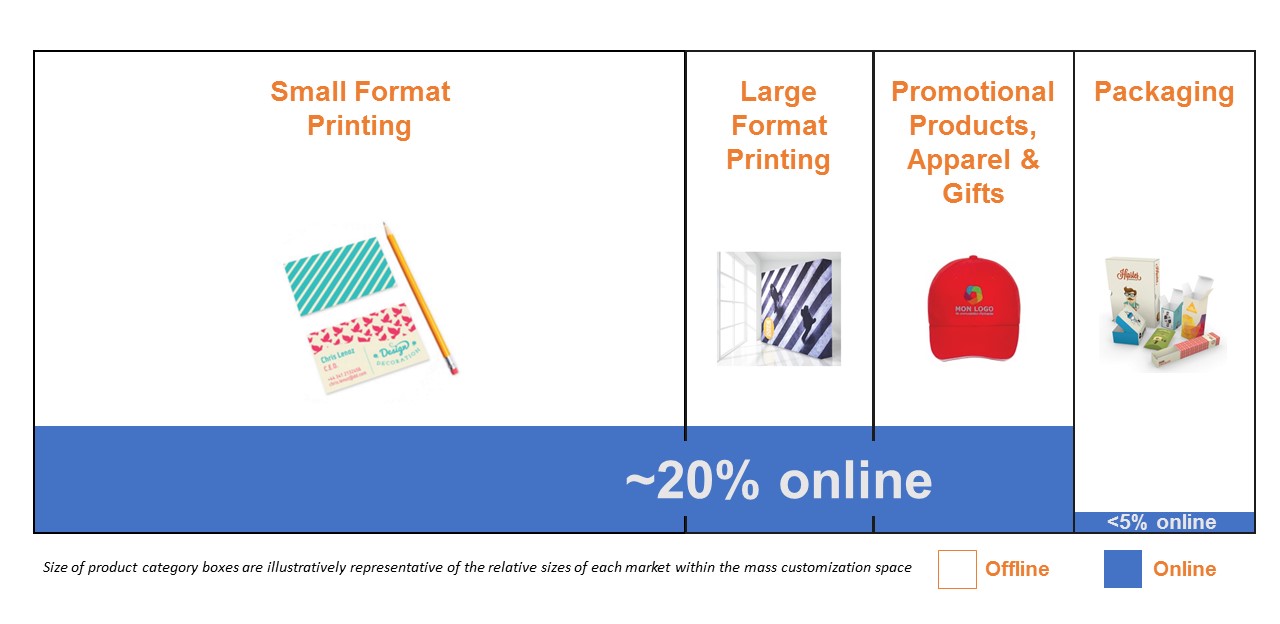
Today, we believe that the revenue opportunity for low-to-medium order quantities (i.e. still within our focus of small-sized individual orders) in the four product categories below is over $100 billion annually in North America and Europe. The addition of other geographies and the consumer products space adds at least 50% to this number:
• | Small format marketing materials such as business cards, flyers, leaflets, inserts, brochures and magazines. Businesses of all sizes are the main end users of short-and-medium run lengths (per order quantities below 2,500 units for business cards and below 20,000 units for other materials). |
• | Large format products such as banners, signs, tradeshow displays, and point-of-sale displays. Businesses of all sizes are the main end users of short-and-medium run lengths (less than 1,000 units). |
• | Promotional products, apparel and gifts including decorated apparel, bags and textiles, and hard goods such as pens, USB sticks, and drinkware. The end users of short-and-medium runs of these products range from businesses to teams, associations and groups, as well as consumers. |
• | Packaging products, such as corrugated board packaging, folded cartons, bags and labels. Businesses are the primary end users for short-and-medium runs (below 10,000 units). |
4
Our Opportunity: Over $100 billion total addressable market in North America and Europe
Our Business
Today’s Cimpress includes 13 previously independent businesses that we have acquired plus Vistaprint and several small startup businesses, which we grew organically. Prior to its acquisition, each of our acquired companies pursued business models which embodied the principles of mass customization. In other words, each provided a standardized set of products that could be configured and customized by customers, could be ordered in relatively low volumes, and could produce via relatively standardized, homogeneous production processes either internally and/or through third parties.
The majority of our businesses are driven by sophisticated, standardized processes and software. These technologies are designed to readily scale as the number of orders received per day increases. In particular, the more individual jobs we receive in a given time period, the more efficiently we can sort and route jobs with homogeneous production processes to given nodes of our internal production systems or of our third party supply chain. This sortation and subsequent process automation improves production efficiency. We believe that our strategy of systematizing our service and production systems enables us to deliver value to customers much more effectively than traditional competitors.
We operate production facilities in Australia, Austria, Brazil, Canada, China, France, India, Ireland, Italy, Japan, Mexico, the Netherlands, the United Kingdom and the United States. Importantly, we also work with a network of several hundred external fulfillers located across the globe. We believe that the improvements we have made and the future improvements we intend to make in software technologies that support the design, sortation, scheduling, production and delivery processes provide us with significant competitive advantage. In many cases we can produce and ship an order the same day we receive it. Our supply chain systems and processes seek to drive reduced inventory and working capital requirements as well as faster delivery to customers. In certain of our company-owned manufacturing facilities, software schedules the near-simultaneous production of different customized products that have been ordered by the same customer, allowing us to produce and deliver multi-part orders quickly and efficiently.
We believe that the standard business cards sold by our Vistaprint business provide a concrete example of the potential of our mass customization business model to deliver significant customer value and to develop strong profit franchises in large markets that were previously low growth and commoditized. The current Vistaprint operations for a typical order of 250 business cards in Europe and North America require less than 14 seconds of human labor for all of pre-press, printing, cutting and packaging, versus an hour or more for traditional printers. Combined with advantages of scale in purchasing of materials, our self-service ordering, pre-press automation, auto-scheduling and automated manufacturing processes enable us to produce standard business cards at a
5
fraction of the cost of typical traditional printers with very consistent quality and delivery reliability. Achieving this type of efficiency took us more than a decade and required massive volume, significant engineering investments and significant capital. Standard Vistaprint business cards (which account for approximately 28% of the Vistaprint business' total bookings for fiscal 2017) represent a mature, highly refined, and highly profitable example of the power of mass customization. Even though we do not expect many other products to reach this extreme level of automation, we do currently produce multiple other product categories (such as flyers, brochures, signage, mugs, calendars, pens, t-shirts, hats, embroidered soft goods, rubber stamps, photobooks, labels and holiday cards) via analogous methods whose volume and processes are well along the spectrum of mass customization relative to traditional suppliers and thus provide great customer value and a strong, profitable and growing revenue stream.
We believe that the potential for scale-based advantages are not limited to large, automated production lines. Other advantages include the ability to systematically and automatically sort through the voluminous "long tail" of diverse and uncommon orders in order to group them into more homogeneous categories, and to route them to production nodes that are specialized for that category of operations and/or which are geographically proximate to the customer. In such cases, even though the daily production volume of a given production node is small in comparison to our highest volume production lines, the homogeneity and volume we are able to achieve is nonetheless significant relative to traditional suppliers of the long tail product in question; thus our relative efficiency gains remain substantial. For this type of long tail production, we rely heavily on third-party fulfillment partnerships, which allow us to offer a very diverse set of products. We acquired most of our capabilities in this area via our investments in Exaprint, Printdeal, Pixartprinting and WIRmachenDRUCK. For instance, the product assortment of each of these four businesses is measured in the tens of thousands, versus just a few hundred at Vistaprint traditionally. This deep and broad product offering is important to many customers.
Our Businesses
We have adopted a multi-business approach, which we believe will help us effectively develop value propositions that resonate strongly with very different parts of our large and fragmented addressable market for mass customization. As such, we have structured our organization to provide significant autonomy and decentralization for the individual businesses. We believe that this autonomy allows for greater customer responsiveness, increased focus, and more innovation than if we were to manage our customer value proposition centrally.
We have many localized websites serving countries in North America, Europe, Asia Pacific and South America. Our websites offer a broad assortment of tools and features allowing customers to create a product design or upload their own complete design, and place an order on a completely self-service basis or with varying levels of assistance.
As of June 30, 2017, our businesses were organized into the following four reportable segments:
1. | Vistaprint: |
Includes the operations of our Vistaprint-branded websites focused on the North America, Europe, Australia and New Zealand markets, and our Webs-branded business, which is managed with the Vistaprint-branded digital business in these same geographies. |  |
Our Vistaprint business helps more than 17 million micro businesses (companies with fewer than 10 employees) create beautiful, professional quality marketing products at affordable prices and at low volumes. To help our customers market in the digital world, the teams at our Pagemodo and Webs brands develop intuitive DIY solutions that are brought to market via their own brands as well as via the Vistaprint brand.
2. | Upload and Print: |
Includes the operations of our druck.at, Easyflyer, Exagroup, Pixartprinting, Printdeal, Tradeprint, and WIRmachenDRUCK businesses.
Businesses regularly turn to trusted graphic professionals (either internal to their firm or at third parties) for advice and design services in order to create great looking, customized products like magazines,
6
brochures, flyers, catalogs, packaging, posters, presentation folders, signs, banners, logo apparel, business cards, labels, corporate gifts and more. These Cimpress businesses focus on serving graphic professionals: local printers, print resellers, graphic artists, advertising agencies and other customers with professional desktop publishing skill sets.
 | Druck.at, based in Austria, is a leading provider of customized web-to-print products including multi-page brochures, folders, flyers, business cards, signs and banners. |
Easyflyer, based in France, provides customers with a range of small and large format printed products available online, with a focus on providing the best customer experience. | |
 | Exaprint, based in France, is an online printer that exclusively serves the needs of print, design and marketing professionals. It offers a wide range of printed products, with a strong focus on both small format products like business cards, flyers and brochures and large-format products like banners, posters, roll-ups and rigid signage. |
 | Pixartprinting, based in Italy, is a leading web-to-print company serving customers across Europe. The company provides printing services for graphic design agencies, print resellers and local printers. |
 | Printdeal, a Dutch company with a focus on the “upload and print” market, specializes in high-volume, large-format printing. Printdeal also has offices in Belgium. |
 | Tradeprint, a leading online trade printer in the UK, serves local printers, print buyers and graphic arts professionals. Tradeprint offers customized products including flyers, leaflets, business cards, booklets, posters, letterheads and more. |
 | WIRmachenDRUCK, a German web-to-print company, offers graphic designers and print resellers an exciting range of highly customized products at low-cost prices, from promotional products to customized beverage cans. |
3. | National Pen: |
Includes the global operations of our National Pen business and a few smaller brands that are focused on custom writing instruments and promotional products, apparel and gifts for small- and medium-sized businesses. |  |
On December 30, 2016, we acquired 100% of the equity interests of National Pen Co. LLC, the leading provider of a wide array of customized writing instruments for small- and medium-sized businesses in more than 20 countries. The company also sells other promotional products, including travel mugs, water bottles, tech gadgets and trade show items.
National Pen's scale and vertical integration in writing instruments complements our organic investments in technology and supply chain capabilities for promotional products, apparel and gift offerings. It serves about a million small business customers through a successful direct mail marketing and telesales approach, as well as a small growing e-commerce business.
4. | All Other Businesses: |
Includes the operations of our Albumprinter, Most of World, and Corporate Solutions businesses. These businesses have been combined into one reportable segment based on materiality.
7
 | Albumprinter, a photo products business serving consumer needs in Europe, including in the Netherlands, Belgium, Sweden, Norway and the United Kingdom, via several brands. On July 21, 2017 we entered into a definitive agreement to sell our Albumprinter business. Refer to Note 2 in the accompanying notes to the consolidated financial statements included in Item 8 of Part II of this Report for additional details. |
 | Corporate Solutions, a business serving the needs of retail partners, small- and medium-sized businesses and third-party merchants and franchise businesses. This is achieved via partnership with third party firms and with two internal startup businesses: Vistaprint Corporate and Cimpress Open. |
  | Most of World, focused on our emerging market portfolio, including operations in Brazil, China, India and Japan. Most of World is a small, but fast growing portfolio, building foundations in regions with large market opportunities. |
| |
Our products
Customers visiting our websites can select the type of product they wish to design from our broad range of available products and services for the business, reseller and home and family markets. The combined product assortment across our businesses is extensive, including offerings in the following product categories: business cards, marketing materials such as flyers and postcards, digital and marketing services, writing instruments, signage, decorated apparel, promotional products and gifts, packaging, textiles and magazines and catalogs.
Central procurement
We are focused on achieving the lowest total cost in our strategic sourcing efforts by concentrating on quality, logistics, technology and cost, while also striving to use responsible sourcing practices within our supply chain. Our efforts include the procurement of high quality materials and equipment that meet our strict specifications at a low total cost across a growing number of manufacturing locations, with an increasing focus on supplier compliance with our sustainable paper procurement policy as well as our Supplier Code of Conduct. Additionally, we work to develop and implement logistics, warehousing, and outbound shipping strategies to provide a balance of low-cost material availability while limiting our inventory exposure. We believe investing in a strategic supply chain management capability that is tightly integrated with our other manufacturing teams helps us benefit from our large scale, improve efficiency and reduce costs, and increase the sustainability of our business.
Our Proprietary Technology, including our Mass Customization Platform
We rely on our advanced proprietary technology to market to, attract and retain our customers, to enable customers to create graphic designs and place orders on our websites, and to aggregate and produce multiple orders from all over the world. Technology is core to our competitive advantage, as without it we would not be able to produce custom orders in small quantities while achieving the economics that are more analogous to mass produced items.
Each of our businesses uses a mix of proprietary and third-party technology that supports the specific needs of that business. Over the past few years, many of our businesses have begun to modernize and modularize their technology to enable us to launch new products, provide a better customer experience, more easily connect to our mass customization platform technologies, and, where it makes sense, to leverage third-party technologies where we do not need to bear the cost of maintaining proprietary technologies. For example, our businesses are increasingly using third-party software for capabilities such as a shopping cart or customer reviews, which are areas that we can benefit from providing a more e-commerce standard experience, and better leverage engineering resources to focus on technologies from which we derive competitive advantage.
We are currently building a mass customization platform, which is a collection of software services, application programming interfaces and related technology that can be leveraged across our businesses and third parties. Different businesses can deploy different combinations of these services, depending on what capabilities these businesses need to complement their existing technology stack. This multi-year investment is still in its early stages, though many of our businesses are leveraging some of the technologies that have already been developed and/or shared by other businesses. The capabilities that are available in the mass customization platform today include customer-facing technologies, such as those that enable customers to visualize their designs on various
8
products, as well as manufacturing, supply chain, and logistics technologies that automate various stages of the production and delivery of a product to a customer. The anticipated benefits of the mass customization platform include improved speed to market for new product introduction, and more cost-efficient cost of production and customer delivery. Over time, we believe we can generate significant customer and shareholder value from increased specialization of production facilities, aggregated scale from multiple businesses, increased product offerings and shared technology development costs.
Technology Development
We intend to continue developing and enhancing our customer-facing and manufacturing, supply chain and logistics technologies and processes. We have designed (and/or are upgrading) our website technologies and infrastructure to accommodate future geographic expansion and growth in the number of customer visits, orders, and product and service offerings. This architecture makes our applications highly scalable and offers our customers fast system responsiveness. In addition, our production technologies for aggregating jobs in preparation for manufacturing are designed to readily scale as we grow. We have engineering and research and development centers in multiple businesses. We also develop technology centrally, primarily at our offices in Switzerland, India, the Netherlands, the Czech Republic and the United States. We are constantly seeking to strengthen our manufacturing and supply chain capabilities through engineering disciplines such as automation, manufacturing, choice of equipment, product manufacturability, materials science, process control and color control. Our technology and development expenses were approximately $243 million (11% of total revenues), $210 million (12% of total revenues) and $187 million (12% of total revenues) in the fiscal years ended June 30, 2017, 2016 and 2015, respectively.
Competition
The markets for the products we produce and sell are intensely competitive, highly fragmented and geographically dispersed, with many existing and potential competitors. We compete on the basis of breadth and depth of product offerings; price; convenience; quality; technology; design content, tools, and assistance; customer service; ease of use; and production and delivery speed. It is our intention to offer a broad selection of high-quality products as well as related services at low price points and in doing so, offer our customers an attractive value proposition. Our current competition includes a combination of the following:
• | traditional offline suppliers and graphic design providers; |
• | online printing and graphic design companies, many of which provide products and services similar to ours; |
• | office superstores, drug store chains, food retailers and other major retailers targeting small business and consumer markets; |
• | wholesale printers; |
• | self-service desktop design and publishing using personal computer software; |
• | email marketing services companies; |
• | website design and hosting companies; |
• | suppliers of customized apparel, promotional products and gifts; |
• | online photo product companies; |
• | internet firms and retailers; |
• | online providers of custom printing services that outsource production to third party printers; and |
• | providers of other digital marketing such as social media, local search directories and other providers. |
As we expand our geographic reach, product and service portfolio and customer base, our competition increases. Our geographic expansion creates competition with companies that have a multi-national presence as
9
well as experienced local firms. Product offerings such as photo products, websites, email marketing, signage, apparel and promotional products have resulted in new competition as we entered those markets. We encounter competition from large retailers offering a wide breadth of products and highly focused companies specializing in a subset of our customers or product offerings. Given the state of maturity of the online mass customization market, we believe that in aggregate, offline providers remain our biggest competition.
Barriers to entry have been lowered in many of our markets, and new players have entered the mass customization space, enabled by asset-light models, software-driven print-fulfillment platforms, innovation in production technology, and/or benefits of an intense focus on a niche product or geographic market. We believe that the long-term leaders in mass customization will be the companies that are innovative and agile, but also bring significant scale-based advantages to drive value to customers in the form of product selection, quality and cost, as well as service.
Environmental Responsibility
We regularly evaluate ways to minimize the impact of our operations on the environment. Our past efforts have substantially reduced the energy consumption of our operations. In fiscal 2017, we converted the vast majority of the paper we use in our Cimpress owned production facilities to FSC (Forest Stewardship Council) certified paper. FSC is an international non-profit organization committed to promoting the practice of sustainable forestry worldwide. FSC certification confirms that the paper comes from responsibly managed forests that meet FSC’s environmental and social standards.
Also, in fiscal 2017, we conducted an extensive planning process to reduce Cimpress’ carbon emissions at a rate in line with science-based targets established in 2015 by the United Nations Global Compact and others. As a result, we are embarking on a path to reduce emissions, through a combination of abatement measures and renewable energy sourcing.
Intellectual Property
We seek to protect our proprietary rights through a combination of patents, copyrights, trade secrets, and trademarks and contractual restrictions. We enter into confidentiality and proprietary rights agreements with our employees, consultants and business partners, and control access to, and distribution of, our proprietary information.
As of June 30, 2017, we held 295 issued patents worldwide, and we continue to file new patent applications around the world. Subject to our continued payment of required patent maintenance fees, our currently issued patents will expire between December 2017 and June 2035. We hold 222 trademark registrations in various jurisdictions globally.
Business Segment and Geographic Information
As of June 30, 2017, our reportable operating segments consisted of (a) Vistaprint, (b) Upload and Print, which includes our druck.at, Easyflyer, Exagroup, Pixartprinting, Printdeal, Tradeprint, and WIRmachenDRUCK businesses, (c) National Pen, which includes the global operations of our National Pen business, and (d) All Other Businesses, which include our Albumprinter business, our Most of World businesses and our Corporate Solutions business. Our Most of World businesses operate in China, India and Japan and (via partial equity ownership) Brazil. For more segment and geographic information about our revenues, adjusted net operating profit and long-lived assets, see Item 8 of Part II, “Financial Statements and Supplementary Data — Note 16 — Segment Information” and Item 7 of Part II, “Management’s Discussion and Analysis of Financial Condition and Results of Operations.” The descriptions of our business, products, and markets in this section apply to all of our operating segments.
Seasonality
Our profitability has historically been highly seasonal. Our second fiscal quarter, ending December 31, includes the majority of the holiday shopping season and has become our strongest quarter for sales of our consumer-oriented products, such as holiday cards, calendars, photo books, and personalized gifts.
10
Operating income during the second fiscal quarter represented 86%, and 62% of annual operating income in the years ended June 30, 2016 and 2015, respectively, and during the year ended June 30, 2017, in a period we recognized a loss from operations, the second quarter remained the only profitable quarter during the year.
Employees
As of June 30, 2017, we had approximately 10,700 full-time and approximately 900 temporary employees worldwide.
Corporate Information
Cimpress N.V. (formerly named Vistaprint N.V.) was incorporated under the laws of the Netherlands on June 5, 2009 and on August 30, 2009 became the publicly traded parent company of the Cimpress group of entities. We maintain our registered office at Hudsonweg 8, 5928 LW Venlo, the Netherlands. Our telephone number in the Netherlands is +31-77-850-7700. As a result of our change of domicile from Bermuda to the Netherlands on August 30, 2009, the common shareholders of Vistaprint Limited became ordinary shareholders of Vistaprint N.V. and Vistaprint N.V. became the publicly traded parent company of the Vistaprint group of entities. Vistaprint Limited, the immediate predecessor corporation to Vistaprint N.V., was incorporated under the laws of Bermuda in April 2002.
Available Information
We are registered as a reporting company under the U.S. Securities Exchange Act of 1934, as amended, which we refer to as the Exchange Act. Accordingly, we file or furnish with the U.S. Securities and Exchange Commission, or the SEC, annual reports on Form 10-K, quarterly reports on Form 10-Q, current reports on Form 8-K and proxy statements as required by the Exchange Act and the rules and regulations of the SEC. The public may read and copy our reports, proxy statements and other materials we file with the SEC at the SEC’s Public Reference Room at 100 F Street, NE, Washington, DC 20549. Information on the operation of the Public Reference Room is available by calling 1-800-SEC-0330. In addition, the SEC maintains an Internet website that contains reports, proxy and information statements and other information regarding issuers, such as Cimpress N.V, that file electronically with the SEC. The address of this website is www.sec.gov. We make available, free of charge through our United States website, the reports, proxy statements, amendments and other materials we file with or furnish to the SEC as soon as reasonably practicable after we electronically file or furnish such materials with or to the SEC. The address of our United States website is www.cimpress.com. We are not including the information contained on our website, or information that can be accessed by links contained on our website, as a part of, or incorporating it by reference into, this Annual Report on Form 10-K.
Item 1A. Risk Factors
Our future results may vary materially from those contained in forward-looking statements that we make in this Report and other filings with the SEC, press releases, communications with investors, and oral statements due to the following important factors, among others. Our forward-looking statements in this Report and in any other public statements we make may turn out to be wrong. These statements can be affected by, among other things, inaccurate assumptions we might make or by known or unknown risks and uncertainties or risks we currently deem immaterial. Consequently, no forward-looking statement can be guaranteed. We undertake no obligation to update any forward-looking statements, whether as a result of new information, future events, or otherwise.
Risks Related to Our Business
If our long-term growth strategy is not successful, our business and financial results could be harmed.
We may not achieve our long-term objectives, and our investments in our business may fail to impact our results and growth as anticipated. Some of the factors that could cause our business strategy to fail to achieve our objectives include, among others:
• | our failure to adequately execute our strategy or anticipate and overcome obstacles to achieving our strategic goals; |
• | our failure to develop our mass customization platform or the failure of the platform to drive the efficiencies and competitive advantage we expect; |
11
• | our failure to manage the growth, complexity, and pace of change of our business and expand our operations; |
• | our failure to acquire, at a value-accretive price or at all, businesses that enhance the growth and development of our business or to effectively integrate the businesses we do acquire into our business; |
• | our inability to purchase or develop technologies and other key assets and capabilities to increase our efficiency, enhance our competitive advantage, and scale our operations; |
• | our failure to realize the anticipated benefits of the decentralization of our operations; |
• | the failure of our current supply chain to provide the resources we need at the standards we require and our inability to develop new or enhanced supply chains; |
• | our failure to acquire new customers and enter new markets, retain our current customers, and sell more products to current and new customers; |
• | our failure to address inefficiencies and performance issues in some of our businesses and markets; |
• | our failure to sustain growth in relatively mature markets; |
• | our failure to promote, strengthen, and protect our brands; |
• | our failure to effectively manage competition and overlap within our brand portfolio; |
• | the failure of our current and new marketing channels to attract customers; |
• | our failure to realize expected returns on our capital allocation decisions; |
• | unanticipated changes in our business, current and anticipated markets, industry, or competitive landscape; |
• | our failure to attract and retain skilled talent needed to execute our strategy and sustain our growth; and |
• | general economic conditions. |
If our strategy is not successful, then our revenue, earnings, and value may not grow as anticipated or may decline, we may not be profitable, our cash flow may be negatively impacted, our reputation and brands may be damaged, and the price of our shares may decline. In addition, we may change our strategy from time to time, which can cause fluctuations in our financial results and volatility in our share price.
Purchasers of customized products may not choose to shop online, which would limit our acquisition of new customers that are necessary to the success of our business.
We sell most of our products and services through the Internet. Because the online market for most of our products and services is not mature, our success depends in part on our ability to attract customers who have historically purchased products and services we offer through offline channels. Specific factors that could prevent prospective customers from purchasing from us as an online retailer include:
• | concerns about buying customized products without face-to-face interaction with design or sales personnel; |
• | the inability to physically handle and examine product samples before making a purchase; |
• | delivery time associated with Internet orders; |
• | concerns about the security of online transactions and the privacy of personal information; |
• | delayed or lost shipments or shipments of incorrect or damaged products; |
12
• | limited access to the Internet; and |
• | the inconvenience associated with returning or exchanging purchased items. |
In addition, our internal research shows that an increasing number of current and potential customers access our websites using smart phones or tablets and that our website visits using traditional computers may be declining. Designing and purchasing custom designed products on a smart phone, tablet, or other mobile device is more difficult than doing so with a traditional computer due to limited screen sizes and bandwidth constraints. If our customers and potential customers have difficulty accessing and using our websites and technologies, then our revenue could decline.
We may not succeed in promoting and strengthening our brands, which could prevent us from acquiring new customers and increasing revenues.
A primary component of our business strategy is to promote and strengthen our brands to attract new and repeat customers, and we face significant competition from other companies in our markets who also seek to establish strong brands. To promote and strengthen our brands, we must incur substantial marketing expenses and establish a relationship of trust with our customers by providing a high-quality customer experience, which requires us to invest substantial amounts of our resources. Our ability to provide a high-quality customer experience is also dependent on external factors over which we may have little or no control, such as the reliability and performance of our suppliers, third-party carriers, and communication infrastructure providers. If we are unable to promote our brands or provide customers with a high-quality customer experience, we may fail to attract new customers, maintain customer relationships, and sustain or increase our revenues.
We manage our business for long-term results, and our quarterly and annual financial results will often fluctuate, which may lead to volatility in our share price.
Our revenues and operating results often vary significantly from period to period due to a number of factors, and as a result comparing our financial results on a period-to-period basis may not be meaningful. We prioritize our two uppermost objectives (leadership in mass customization and maximizing intrinsic value per share) even at the expense of shorter-term results and generally do not manage our business to maximize current period financial results, including our GAAP net (loss) income and operating cash flow and other results we report. Many of the factors that lead to period-to-period fluctuations are outside of our control; however, some factors are inherent in our business strategies. Some of the specific factors that could cause our operating results to fluctuate from quarter to quarter or year to year include among others:
• | investments in our business in the current period intended to generate longer-term returns, where the shorter-term costs will not be offset by revenue or cost savings until future periods, if at all; |
• | seasonality-driven or other variations in the demand for our products and services, in particular during our second fiscal quarter; |
• | currency and interest rate fluctuations, which affect our revenues, costs, and fair value of our assets and liabilities; |
• | our hedging activity; |
• | our ability to attract visitors to our websites and convert those visitors into customers; |
• | our ability to retain customers and generate repeat purchases; |
• | shifts in revenue mix toward less profitable products and brands; |
• | the commencement or termination of agreements with our strategic partners, suppliers, and others; |
• | our ability to manage our production, fulfillment, and support operations; |
• | costs to produce and deliver our products and provide our services, including the effects of inflation; |
13
• | our pricing and marketing strategies and those of our competitors; |
• | expenses and charges related to our compensation arrangements with our executives and employees, including expenses and charges relating to the new long-term incentive compensation program we launched at the beginning of fiscal year 2017; |
• | costs and charges resulting from litigation; |
• | significant increases in credits, beyond our estimated allowances, for customers who are not satisfied with our products; |
• | changes in our income tax rate; |
• | costs to acquire businesses or integrate our acquired businesses; |
• | financing costs; |
• | impairments of our tangible and intangible assets including goodwill; and |
• | the results of our minority investments and joint ventures. |
Some of our expenses, such as office leases, depreciation related to previously acquired property and equipment, and personnel costs, are relatively fixed, and we may be unable to, or may not choose to, adjust operating expenses to offset any revenue shortfall. Accordingly, any shortfall in revenue may cause significant variation in operating results in any period. Our operating results may sometimes be below the expectations of public market analysts and investors, in which case the price of our ordinary shares will likely decline.
We may not be successful in developing our mass customization platform or in realizing the anticipated benefits of the platform.
A key component of our strategy is the development of a mass customization platform. The process of developing new technology is complex, costly, and uncertain, and the development effort could be disruptive to our business and existing systems. We must make long-term investments, develop or obtain appropriate intellectual property, and commit significant resources before knowing whether our mass customization platform will be successful and make us more effective and competitive. As a result, there can be no assurance that we will successfully complete the development of the platform or that we will realize expected returns on the capital expended to develop the platform.
In addition, we are aware that other companies are developing platforms that could compete with ours. If a competitor were to develop and reach scale with a platform before we do, our competitive position could be harmed.
Our global operations, decentralized organizational structure, and expansion place a significant strain on our management, employees, facilities, and other resources and subject us to additional risks.
We are a global company with production facilities, offices, and localized websites in many countries across six continents, and we have decentralized our organizational structure and operations. We expect to establish operations, acquire or invest in businesses, and sell our products and services in additional geographic regions, including emerging markets, where we may have limited or no experience. We may not be successful in all regions and markets in which we invest or where we establish operations, which may be costly to us. We are subject to a number of risks and challenges that relate to our global operations, decentralization, and expansion, including, among others:
• | difficulty managing operations in, and communications among, multiple locations, businesses, and time zones; |
• | difficulty complying with multiple tax laws, treaties, and regulations and limiting our exposure to onerous or unanticipated taxes, duties, and other costs; |
14
• | our failure to improve and adapt our financial and operational controls to manage our decentralized business and comply with our legal obligations; |
• | local regulations that may restrict or impair our ability to conduct our business as planned; |
• | protectionist laws and business practices that favor local producers and service providers; |
• | our inexperience in marketing and selling our products and services within unfamiliar countries and cultures; |
• | challenges of working with local business partners; |
• | our failure to properly understand and develop graphic design content and product formats and attributes appropriate for local tastes; |
• | disruptions caused by political and social instability that may occur in some countries; |
• | corrupt business practices, such as bribery or the willful infringement of intellectual property rights, that may be common in some countries or in some sales channels and markets; |
• | difficulty expatriating cash from some countries; |
• | difficulty importing and exporting our products across country borders and difficulty complying with customs regulations in the many countries where we sell products; |
• | disruptions or cessation of important components of our international supply chain; |
• | the challenge of complying with disparate laws in multiple countries; |
• | restrictions imposed by local labor practices and laws on our business and operations; and |
• | failure of local laws to provide a sufficient degree of protection against infringement of our intellectual property. |
There is considerable uncertainty about the economic and regulatory effects of the United Kingdom's exit from the European Union (commonly referred to as "Brexit"). The UK is one of our largest markets in Europe, but we currently ship products to UK customers primarily from continental Europe. If Brexit results in greater restrictions on imports and exports between the UK and the EU or increased regulatory complexity, then our operations and financial results could be negatively impacted.
In addition, we are exposed to fluctuations in currency exchange rates that may impact items such as the translation of our revenues and expenses, remeasurement of our intercompany balances, and the value of our cash and cash equivalents and other assets and liabilities denominated in currencies other than the U.S. dollar, our reporting currency. While we engage in hedging activities to mitigate some of the net impact of currency exchange rate fluctuations, our financial results may differ materially from expectations as a result of such fluctuations. For example, the Brexit vote has caused significant currency volatility that was mitigated in the near term by our currency hedging programs but that could potentially hurt our financial results in the future.
Acquisitions and strategic investments may be disruptive to our business.
An important way in which we pursue our strategy is to selectively acquire businesses, technologies, and services and to make minority investments in businesses and joint ventures. The time and expense associated with finding suitable businesses, technologies, or services to acquire or invest in can be disruptive to our ongoing business and divert our management's attention. In addition, we have needed in the past, and may need in the future, to seek financing for acquisitions and investments, which may not be available on terms that are favorable to us, or at all, and can cause dilution to our shareholders, cause us to incur additional debt, or subject us to covenants restricting the activities we may undertake.
15
Our acquisitions and strategic investments may fail to achieve our goals.
An acquisition, minority investment, or joint venture may fail to achieve our goals and expectations for a number of reasons including the following:
• | The business we acquired or invested in may not perform as well as we expected. |
• | We may overpay for acquired businesses, which can, among other things, negatively affect our intrinsic value per share. |
• | We may fail to integrate acquired businesses, technologies, services, or internal systems effectively, or the integration may be more expensive or take more time than we anticipated. |
• | The management of our minority investments and joint ventures may be more expensive or may take more resources than we expected. |
• | We may not realize the anticipated benefits of integrating acquired businesses into our mass customization platform. |
• | We may encounter unexpected cultural or language challenges in integrating an acquired business or managing our minority investment in a business. |
• | We may not be able to retain customers and key employees of the acquired businesses, and we and the businesses we acquire or invest in may not be able to cross sell products and services to each other's customers. |
We generally assume the liabilities of businesses we acquire, which could include liability for an acquired business' violation of law that occurred before we acquired it. In addition, we have historically acquired smaller, privately held companies that may not have as strong a culture of legal compliance or as robust financial controls as a larger, publicly traded company like Cimpress, and if we fail to implement adequate training, controls, and monitoring of the acquired companies, we could also be liable for post-acquisition legal violations.
Our acquisitions and minority investments can negatively impact our financial results.
Acquisitions and minority investments can be costly, and some of our acquisitions and investments may be dilutive, leading to reduced earnings. Acquisitions and investments can result in increased expenses including impairments of goodwill and intangible assets if financial goals are not achieved, assumptions of contingent or unanticipated liabilities, amortization of acquired intangible assets, and increased tax costs.
In addition, the accounting for our acquisitions requires us to make significant estimates, judgments, and assumptions that can change from period to period, based in part on factors outside of our control, which can create volatility in our financial results. For example, we often pay a portion of the purchase price for our acquisitions in the form of an earn-out based on performance targets for the acquired companies, which can be difficult to forecast. We accrue liabilities for estimated future contingent earn-out payments based on an evaluation of the likelihood of achievement of the contractual conditions underlying the earn-out and weighted probability assumptions of the required outcomes. If in the future our assumptions change and we determine that higher levels of achievement are likely under our earn-outs, we will need to pay and record additional amounts to reflect the increased purchase price. These additional amounts could be significant and could adversely impact our results of operations. In addition, earn-out provisions can lead to disputes with the sellers about the achievement of the earn-out performance targets, and earn-out performance targets can sometimes create inadvertent incentives for the acquired company's management to take short-term actions designed to maximize the earn-out instead of benefiting the business.
If we are unable to attract visitors to our websites and convert those visitors to customers, our business and results of operations could be harmed.
Our success depends on our ability to attract new and repeat customers in a cost-effective manner. We rely on a variety of methods to draw visitors to our websites and promote our products and services, such as purchased search results from online search engines such as Google and Yahoo!, email, direct mail, advertising banners and
16
other online links, broadcast media, and word-of-mouth customer referrals. If the search engines on which we rely modify their algorithms, terminate their relationships with us, or increase the prices at which we may purchase listings, our costs could increase, and fewer customers may click through to our websites. If we are not effective at reaching new and repeat customers, if fewer customers click through to our websites, or if the costs of attracting customers using our current methods significantly increase, then traffic to our websites would be reduced, our revenue and net income could decline, and our business and results of operations would be harmed.
Seasonal fluctuations in our business place a strain on our operations and resources.
Our profitability has historically been highly seasonal. Our second fiscal quarter includes the majority of the holiday shopping season and accounts for a disproportionately high portion of our earnings for the year, primarily due to higher sales of home and family products such as holiday cards, calendars, photo books, and personalized gifts. In addition, the National Pen business we acquired in December 2016 has historically generated nearly all of its profits during the December quarter. Our operating income during the second fiscal quarter represented more than 60% of annual operating income in the years ended June 30, 2016 and 2015, and during the year ended June 30, 2017, in a period we recognized a loss from operations, the second quarter remained the only profitable quarter during the year. In anticipation of increased sales activity during our second fiscal quarter holiday season, we typically incur significant additional capacity related expenses each year to meet our seasonal needs, including facility expansions, equipment purchases and leases, and increases in the number of temporary and permanent employees. Lower than expected sales during the second quarter would likely have a disproportionately large impact on our operating results and financial condition for the full fiscal year. In addition, if our manufacturing and other operations are unable to keep up with the high volume of orders during our second fiscal quarter or we experience inefficiencies in our production, then our costs may be significantly higher, and we and our customers can experience delays in order fulfillment and delivery and other disruptions. If we are unable to accurately forecast and respond to seasonality in our business, our business and results of operations may be materially harmed.
Our hedging activity could negatively impact our results of operations and cash flows.
We have entered into derivatives to manage our exposure to interest rate and currency movements. If we do not accurately forecast our results of operations, execute contracts that do not effectively mitigate our economic exposure to interest rates and currency rates, elect to not apply hedge accounting, or fail to comply with the complex accounting requirements for hedging, our results of operations and cash flows could be volatile, as well as negatively impacted. Also, our hedging objectives may be targeted at non-GAAP financial metrics, which could result in increased volatility in our GAAP results.
We face risks related to interruption of our operations and lack of redundancy.
Our production facilities, websites, infrastructure, supply chain, customer service centers, and operations may be vulnerable to interruptions, and we do not have redundancies or alternatives in all cases to carry on these operations in the event of an interruption. In addition, because we are dependent in part on third parties for the implementation and maintenance of certain aspects of our communications and production systems, we may not be able to remedy interruptions to these systems in a timely manner or at all due to factors outside of our control. Some of the events that could cause interruptions in our operations or systems are, among others:
• | fire, natural disasters, or extreme weather |
• | labor strike, work stoppage, or other issues with our workforce |
• | political instability or acts of terrorism or war |
• | power loss or telecommunication failure |
• | attacks on our external websites or internal network by hackers or other malicious parties |
• | undetected errors or design faults in our technology, infrastructure, and processes that may cause our websites to fail |
• | inadequate capacity in our systems and infrastructure to cope with periods of high volume and demand |
17
• | human error, including poor managerial judgment or oversight |
Any interruptions to our systems or operations could result in lost revenue, increased costs, negative publicity, damage to our reputation and brands, and an adverse effect on our business and results of operations. Building redundancies into our infrastructure, systems and supply chain to mitigate these risks may require us to commit substantial financial, operational, and technical resources, in some cases before the volume of our business increases with no assurance that our revenues will increase.
We face intense competition, and we expect our competition to continue to increase.
The markets for small business marketing products and services and home and family custom products, including the printing and graphic design market, are intensely competitive, highly fragmented, and geographically dispersed. The competitive landscape for e-commerce companies continues to change as new e-commerce businesses are introduced and traditional “bricks and mortar” businesses establish an online presence. Competition may result in price pressure, reduced profit margins and loss of market share and brand recognition, any of which could substantially harm our business and financial results. Current and potential competitors include (in no particular order):
• | traditional offline suppliers and graphic design providers; |
• | online printing and graphic design companies, many of which provide products and services similar to ours; |
• | office superstores, drug store chains, food retailers and other major retailers targeting small business and consumer markets; |
• | wholesale printers; |
• | self-service desktop design and publishing using personal computer software; |
• | email marketing services companies; |
• | website design and hosting companies; |
• | suppliers of customized apparel, promotional products and gifts; |
• | online photo product companies; |
• | Internet firms and retailers; |
• | online providers of custom printing services that outsource production to third party printers; and |
• | providers of other digital marketing such as social media, local search directories and other providers. |
Many of our current and potential competitors have advantages over us, including longer operating histories, greater brand recognition or loyalty, more focus on a given subset of our business, or significantly greater financial, marketing, and other resources. Many of our competitors currently work together, and additional competitors may do so in the future through strategic business agreements or acquisitions. In addition, we have in the past and may in the future choose to collaborate with some of our existing and potential competitors in strategic partnerships that we believe will improve our competitive position and financial results. It is possible, however, that such ventures will be unsuccessful and that our competitive position and financial results will be adversely affected as a result of such collaboration.
Failure to meet our customers' price expectations would adversely affect our business and results of operations.
Demand for our products and services is sensitive to price for almost all of our businesses, and changes in our pricing strategies, including shipping pricing, have had a significant impact on the numbers of customers and orders in some regions, which in turn affects our revenues, profitability, and results of operations. Many factors can significantly impact our pricing and marketing strategies, including the costs of running our business, our
18
competitors' pricing and marketing strategies, and the effects of inflation. If we fail to meet our customers' price expectations, our business and results of operations may suffer.
Failure to protect our information systems and the confidential information of our customers, employees, and business partners against security breaches or thefts could damage our reputation and brands, subject us to litigation and enforcement actions, and substantially harm our business and results of operations.
Our business involves the receipt, storage, and transmission of customers' personal and payment card information, as well as confidential information about our business, employees, suppliers, and business partners, some of which is entrusted to third-party service providers, partners, and vendors. Our information systems and those of third parties with which we share information are vulnerable to an increasing threat of cyber security risks, including physical and electronic break-ins, computer viruses, and phishing and other social engineering scams, among other risks. As security threats evolve and become more sophisticated and more difficult to detect and defend against, a hacker or thief may defeat our security measures, or those of our third-party service provider, partner, or vendor, and obtain confidential or personal information, and we or the third party may not discover the security breach and theft of information for a significant period of time after the breach occurs. We may need to expend significant resources to protect against security breaches and thefts of data or to address problems caused by breaches or thefts, and we may not be able to anticipate cyber attacks or implement adequate preventative measures. Any compromise or breach of our information systems or the information systems of third parties with which we share information could, among other things:
• | damage our reputation and brands; |
• | expose us to losses, litigation, enforcement actions, and possible liability; |
• | result in a failure to comply with legal and industry privacy regulations and standards; |
• | lead to the misuse of our and our customers' confidential or personal information; or |
• | cause interruptions in our operations. |
We are subject to the laws of many states, countries, and regions and industry guidelines and principles governing the collection, use, retention, disclosure, sharing, and security of data that we receive from and about our customers and employees. Any failure or perceived failure by us to comply with any of these laws, guidelines, or principles could result in actions against us by governmental entities or others, a loss of customer confidence, and damage to our brands, any of which could have an adverse effect on our business. In addition, the regulatory landscape is constantly changing, as various regulatory bodies enact new laws concerning privacy, data retention, data transfer and data protection. For example, the recent General Data Protection Regulation in Europe includes operational and compliance requirements that are different than those currently in place and also includes significant penalties for non-compliance. Complying with these varying and changing requirements could cause us to incur substantial costs or require us to change our business practices in a manner adverse to our business and operating results.
We rely heavily on email to market to and communicate with customers, and email communications are subject to regulatory and reputation risks.
Various private entities attempt to regulate the use of commercial email solicitation by blacklisting companies that the entities believe do not meet their standards, which results in those companies' emails being blocked from some Internet domains and addresses. Although we believe that our commercial email solicitations comply with all applicable laws, from time to time some of our Internet protocol addresses appear on some of these blacklists, which can interfere with our ability to market our products and services, communicate with our customers, and operate and manage our websites and corporate email accounts. Further, we have contractual relationships with partners that market our products and services on our behalf, and some of our marketing partners engage third-party email marketers with which we do not have any contractual or other relationship. Although our contracts with our partners generally require that they comply with all applicable laws relating to email solicitations, we do not always have control over the third-party email marketers that our partners engage. If one of our partners or another third party were to send emails marketing our products and services in violation of applicable anti-spam or other laws, then our reputation could be harmed and we could potentially be liable for their actions.
19
We are subject to safety, health, and environmental laws and regulations, which could result in
liabilities, cost increases, or restrictions on our operations.
We are subject to a variety of safety, health and environmental, or SHE, laws and regulations in each of the jurisdictions in which we operate. These laws and regulations govern, among other things, air emissions, wastewater discharges, the storage, handling and disposal of hazardous and other regulated substances and wastes, soil and groundwater contamination and employee health and safety. We use regulated substances such as inks and solvents, and generate air emissions and other discharges at our manufacturing facilities, and some of our facilities are required to hold environmental permits. If we fail to comply with existing SHE requirements, or new, more stringent SHE requirements applicable to us are imposed, we may be subject to monetary fines, civil or criminal sanctions, third-party claims, or the limitation or suspension of our operations. In addition, if we are found to be responsible for hazardous substances at any location (including, for example, offsite waste disposal facilities or facilities at which we formerly operated), we may be responsible for the cost of cleaning up contamination, regardless of fault, as well as to claims for harm to health or property or for natural resource damages arising out of contamination or exposure to hazardous substances.
In some cases we pursue self-imposed socially responsible policies that are more stringent than is typically required by laws and regulations, for instance in the areas of worker safety, team member social benefits and environmental protection. The costs of this added SHE effort are often substantial and could grow over time.
The loss of key personnel or an inability to attract and retain additional personnel could affect our ability to successfully grow our business.
We are highly dependent upon the continued service and performance of our senior management and key technical, marketing, and production personnel, any of whom may cease their employment with us at any time with minimal advance notice. We face intense competition for qualified individuals from many other companies in diverse industries. The loss of one or more of our key employees may significantly delay or prevent the achievement of our business objectives, and our failure to attract and retain suitably qualified individuals or to adequately plan for succession could have an adverse effect on our ability to implement our business plan.
Our credit facility and the indenture that governs our senior notes restrict our current and future operations, particularly our ability to respond to changes or to take certain actions.
Our senior secured credit facility, which we refer to as our credit facility, and the indenture that governs our 7.0% senior unsecured notes due 2022, which we refer to as our senior notes, contain a number of restrictive covenants that impose significant operating and financial restrictions on us and may limit our ability to engage in acts that may be in our best interest, including restrictions on our ability to:
• | incur additional indebtedness, guarantee indebtedness, and incur liens; |
• | pay dividends or make other distributions or repurchase or redeem capital stock; |
• | prepay, redeem, or repurchase certain subordinated debt; |
• | issue certain preferred stock or similar redeemable equity securities; |
• | make loans and investments; |
• | sell assets; |
• | enter into transactions with affiliates; |
• | alter the businesses we conduct; |
• | enter into agreements restricting our subsidiaries’ ability to pay dividends; and |
• | consolidate, merge, or sell all or substantially all of our assets. |
20
As a result of these restrictions, we may be limited in how we conduct our business, grow in accordance with our strategy, compete effectively, or take advantage of new business opportunities. In addition, the restrictive covenants in the credit facility require us to maintain specified financial ratios and satisfy other financial condition tests. Our ability to meet those financial ratios and tests can be affected by events beyond our control, and we may be unable to meet them.
A default under our indenture or credit facility would have a material, adverse effect on our business.
Our failure to make scheduled payments on our debt or our breach of the covenants or restrictions under the indenture that governs our senior notes or under our credit facility could result in an event of default under the applicable indebtedness. Such a default would have a material, adverse effect on our business and financial condition, including the following, among others:
• | Our lenders could declare all outstanding principal and interest to be due and payable, and we and our subsidiaries may not have sufficient assets to repay that indebtedness. |
• | Our secured lenders could foreclose against the assets securing their borrowings. |
• | Our lenders under the credit facility could terminate all commitments to extend further credit under that facility. |
• | We could be forced into bankruptcy or liquidation. |
Our material indebtedness and interest expense could adversely affect our financial condition.
As of June 30, 2017, our total debt was $882.6 million, made up of $275.0 million of senior notes, $600.0 million of loan obligations under our credit facility and $7.5 million of other debt. We had unused commitments of $211.8 million under our credit facility (after giving effect to letter of credit obligations).
Subject to the limits contained in the credit facility, the indenture that governs our senior notes, and our other debt instruments, we may be able to incur substantial additional debt from time to time to finance working capital, capital expenditures, investments or acquisitions, or for other purposes. If we do so, the risks related to our level of debt could intensify. Specifically, our level of debt could have important consequences, including the following:
• | making it more difficult for us to satisfy our obligations with respect to our debt; |
• | limiting our ability to obtain additional financing to fund future working capital, capital expenditures, acquisitions, or other general corporate requirements; |
• | requiring a substantial portion of our cash flows to be dedicated to debt service payments instead of other purposes, thereby reducing the amount of cash flows available for working capital, capital expenditures, acquisitions, and other general corporate purposes; |
• | increasing our vulnerability to general adverse economic and industry conditions; |
• | exposing us to the risk of increased interest rates as some of our borrowings, including borrowings under our credit facility, are at variable rates of interest; |
• | limiting our flexibility in planning for and reacting to changes in the industry and marketplaces in which we compete; |
• | placing us at a disadvantage compared to other, less leveraged competitors; and |
• | increasing our cost of borrowing. |
21
We may not be able to generate sufficient cash to service all of our indebtedness and may be forced to take other actions to satisfy our obligations under our indebtedness, which may not be successful.
Our ability to make scheduled payments on or refinance our debt obligations depends on our financial condition and operating performance, which are subject to economic and competitive conditions and to various financial, business, legislative, regulatory, and other factors beyond our control. We may be unable to maintain a level of cash flows from operating activities sufficient to permit us to pay the principal, premium, if any, and interest on our indebtedness. If our cash flows and capital resources are insufficient to fund our debt service obligations, we could face substantial liquidity problems and could be forced to reduce or delay investments and capital expenditures or to dispose of material assets or operations, seek additional debt or equity capital, or restructure or refinance our indebtedness. We may not be able to effect any such alternative measures, if necessary, on commercially reasonable terms or at all.
If we cannot make scheduled payments on our debt, we will be in default. Our inability to generate sufficient cash flows to satisfy our debt obligations, or to refinance our indebtedness on commercially reasonable terms or at all, would materially and adversely affect our financial position and results of operations.
Our variable rate indebtedness subjects us to interest rate risk, which could cause our debt service obligations to increase significantly.
Borrowings under our credit facility are at variable rates of interest and expose us to interest rate risk. If interest rates were to increase, our debt service obligations on the variable rate indebtedness would increase even if the amount borrowed remained the same, and our net income and cash flows, including cash available for servicing our indebtedness, will correspondingly decrease. As of June 30, 2017, a hypothetical 100 basis point increase in rates, inclusive of our outstanding interest rate swaps, would result in an increase of interest expense of approximately $5.4 million over the next 12 months. Although we generally enter into interest rate swaps that involve the exchange of floating for fixed rate interest payments in order to reduce interest rate volatility, we might not maintain interest rate swaps with respect to all of our variable rate indebtedness, and any swaps we enter into may not fully mitigate our interest rate risk.
Border controls and duties and restrictions on cross-border commerce may negatively impact our business.
Many governments impose restrictions on shipping goods into their countries, as well as protectionist measures such as customs duties and tariffs that may apply directly to product categories comprising a material portion of our revenues. The customs laws, rules and regulations that we are required to comply with are complex and subject to unpredictable enforcement and modification. As a result of these restrictions, we have from time to time experienced delays in shipping our manufactured products into certain countries, and changes in cross-border regulations could have a significant negative effect on our business. For example, the current United States administration has signaled the possibility of major changes in trade policy between the United States and other countries, such as the disallowance of tax deductions for imported merchandise or the imposition of additional tariffs or duties on imported products. Because we produce most physical products for our United States customers at our facilities in Canada and Mexico and we source most materials for our products outside the United States, including large amounts of sourcing from China, major changes in tax policy or trade relations could adversely affect our business and results of operations.
If we are unable to protect our intellectual property rights, our reputation and brands could be damaged, and others may be able to use our technology, which could substantially harm our business and financial results.
We rely on a combination of patents, trademarks, trade secrets and copyrights and contractual restrictions to protect our intellectual property, but these protective measures afford only limited protection. Despite our efforts to protect our proprietary rights, unauthorized parties may be able to copy or use technology or information that we consider proprietary. There can be no guarantee that any of our pending patent applications or continuation patent applications will be granted, and from time to time we face infringement, invalidity, intellectual property ownership, or similar claims brought by third parties with respect to our patents. In addition, despite our trademark registrations throughout the world, our competitors or other entities may adopt names, marks, or domain names similar to ours, thereby impeding our ability to build brand identity and possibly leading to customer confusion. Enforcing our
22
intellectual property rights can be extremely costly, and a failure to protect or enforce these rights could damage our reputation and brands and substantially harm our business and financial results.
Intellectual property disputes and litigation are costly and could cause us to lose our exclusive rights, subject us to liability, or require us to stop some of our business activities.
From time to time, we receive claims from third parties that we infringe their intellectual property rights, that we are required to enter into patent licenses covering aspects of the technology we use in our business, or that we improperly obtained or used their confidential or proprietary information. Any litigation, settlement, license, or other proceeding relating to intellectual property rights, even if we settle it or it is resolved in our favor, could be costly, divert our management's efforts from managing and growing our business, and create uncertainties that may make it more difficult to run our operations. If any parties successfully claim that we infringe their intellectual property rights, we might be forced to pay significant damages and attorney's fees, and we could be restricted from using certain technologies important to the operation of our business.
Our business is dependent on the Internet, and unfavorable changes in government regulation of the Internet, e-commerce, and email marketing could substantially harm our business and financial results.
Due to our dependence on the Internet for most of our sales, laws specifically governing the Internet, e-commerce, and email marketing may have a greater impact on our operations than other more traditional businesses. Existing and future laws, such as laws covering pricing, customs, privacy, consumer protection, or commercial email, may impede the growth of e-commerce and our ability to compete with traditional “bricks and mortar” retailers. Existing and future laws or unfavorable changes or interpretations of these laws could substantially harm our business and financial results.
The failure of our business partners to use legal and ethical business practices could negatively impact our business.
We contract with multiple business partners in an increasing number of jurisdictions worldwide, including sourcing the raw materials for the products we sell from an expanding number of suppliers and contracting with third-party merchants and manufacturers for the placement and fulfillment of customer orders. Although we require our suppliers, fulfillers, and merchants to operate in compliance with all applicable laws, including those regarding corruption, working conditions, employment practices, safety and health, and environmental compliance, we cannot control their business practices. We may not be able to adequately vet, monitor, and audit our many business partners (or their suppliers) throughout the world, and our decentralized structure heightens this risk, as not all of our businesses have equal resources to manage their business partners. If any of them violates labor, environmental, or other laws or implements business practices that are regarded as unethical, our reputation could be severely damaged, and our supply chain and order fulfillment process could be interrupted, which could harm our sales and results of operations.
If we were required to review the content that our customers incorporate into our products and interdict the shipment of products that violate copyright protections or other laws, our costs would significantly increase, which would harm our results of operations.
Because of our focus on automation and high volumes, the vast majority of our sales do not involve any human-based review of content. Although our websites' terms of use specifically require customers to make representations about the legality and ownership of the content they upload for production, there is a risk that a customer may supply an image or other content for an order we produce that is the property of another party used without permission, that infringes the copyright or trademark of another party, or that would be considered to be defamatory, hateful, obscene, or otherwise objectionable or illegal under the laws of the jurisdiction(s) where that customer lives or where we operate. If we were to become legally obligated to perform manual screening of customer orders, our costs would increase significantly, and we could be required to pay substantial penalties or monetary damages for any failure in our screening process.
We are subject to customer payment-related risks.
We accept payments for our products and services on our websites by a variety of methods, including credit or debit card, PayPal, check, wire transfer or other methods. In some geographic regions, we rely on one or two third party companies to provide payment processing services. If any of the payment processing or other
23
companies with which we have contractual arrangements became unwilling or unable to provide these services to us or they or we are unable to comply with our contractual requirements under such arrangements, then we would need to find and engage replacement providers, which we may not be able to do on terms that are acceptable to us or at all, or to process the payments ourselves. Any of these scenarios could be disruptive to our business as they could be costly and time consuming and may unfavorably impact our customers.
As we offer new payment options to our customers, we may be subject to additional regulations, compliance requirements and fraud risk. For some payment methods, including credit and debit cards, we pay interchange and other fees, which may increase over time and raise our operating costs and lower our profit margins or require that we charge our customers more for our products. We are also subject to payment card association and similar operating rules and requirements, which could change or be reinterpreted to make it difficult or impossible for us to comply. If we fail to comply with these rules and requirements, we may be subject to fines and higher transaction fees and lose our ability to accept credit and debit card payments from our customers or facilitate other types of online payments, and our business and operating results could be materially adversely affected.
In addition, we may be liable for fraudulent transactions conducted on our websites, such as through the use of stolen credit card numbers. To date, quarterly losses from payment fraud have not exceeded 1% of total revenues in any quarter, but we continue to face the risk of significant losses from this type of fraud.
We may be subject to product liability or environmental compliance claims if people, property, or the environment are harmed by the products we sell.
Some of the products we sell may expose us to product liability or environmental compliance claims relating to issues such as personal injury, death, property damage, or the use or disposal of environmentally harmful substances and may require product recalls or other actions. Any claims, litigation, or recalls could be costly to us and damage our brands and reputation.
Our inability to use or maintain domain names in each country or region where we currently or intend to do business could negatively impact our brands and our ability to sell our products and services in that country or region.
We may not be able to prevent third parties from acquiring domain names that use our brand names or other trademarks or that otherwise infringe or decrease the value of our trademarks and other proprietary rights. If we are unable to use or maintain a domain name in a particular country or region, then we could be forced to purchase the domain name from an entity that owns or controls it, which we may not be able to do on commercially acceptable terms or at all; we may incur significant additional expenses to develop a new brand to market our products within that country; or we may elect not to sell products in that country.
We do not collect indirect taxes in all jurisdictions, which could expose us to tax liabilities.
In some of the jurisdictions where we sell products and services, we do not collect or have imposed upon us sales, value added or other consumption taxes, which we refer to as indirect taxes. The application of indirect taxes to e-commerce businesses such as Cimpress is a complex and evolving issue, and in many cases, it is not clear how existing tax statutes apply to the Internet or e-commerce. For example, some state governments in the United States have imposed or are seeking to impose indirect taxes on Internet sales. If a government entity claims that we should have been collecting indirect taxes on the sale of our products in a jurisdiction where we have not been doing so, then we could incur substantial tax liabilities for past sales.
If we are unable to retain security authentication certificates, which are supplied by a limited number of third party providers over which we exercise little or no control, our business could be harmed.
We are dependent on a limited number of third party providers of website security authentication certificates that are necessary for conducting secure transactions over the Internet. Despite any contractual protections we may have, these third party providers can disable or revoke, and in the past have disabled or revoked, our security certificates without our consent, which would render our websites inaccessible to some of our customers and could discourage other customers from accessing our sites. Any interruption in our customers' ability or willingness to access our websites if we do not have adequate security certificates could result in a material loss of revenue and profits and damage to our brands.
24
Risks Related to Our Corporate Structure
Challenges by various tax authorities to our international structure could, if successful, increase our effective tax rate and adversely affect our earnings.
We are a Dutch limited liability company that operates through various subsidiaries in a number of countries throughout the world. Consequently, we are subject to tax laws, treaties and regulations in the countries in which we operate, and these laws and treaties are subject to interpretation. From time to time, we are subject to tax audits, and the tax authorities in these countries could claim that a greater portion of the income of the Cimpress N.V. group should be subject to income or other tax in their respective jurisdictions, which could result in an increase to our effective tax rate and adversely affect our results of operations. For more information about audits to which we are currently subject refer to Note 13 “Income Taxes” in the accompanying notes to the consolidated financial statements included in Item 8 of Part II of this Report.
Changes in tax laws, regulations and treaties could affect our tax rate and our results of operations.
A change in tax laws, treaties or regulations, or their interpretation, of any country in which we operate could result in a higher tax rate on our earnings, which could result in a significant negative impact on our earnings and cash flow from operations. There are currently multiple initiatives for comprehensive tax reform underway in key jurisdictions where we have operations, including the United States and Switzerland. We continue to assess the impact of various international tax reform proposals and modifications to existing tax treaties in all jurisdictions where we have operations that could result in a material impact on our income taxes. We cannot predict whether any specific legislation will be enacted or the terms of any such legislation. However, if such proposals were enacted, or if modifications were to be made to certain existing treaties, the consequences could have a materially adverse impact on us, including increasing our tax burden, increasing costs of our tax compliance or otherwise adversely affecting our financial condition, results of operations and cash flows.
Our intercompany arrangements may be challenged, which could result in higher taxes or penalties and an adverse effect on our earnings.
We operate pursuant to written transfer pricing agreements among Cimpress N.V. and its subsidiaries, which establish transfer prices for various services performed by our subsidiaries for other Cimpress group companies. If two or more affiliated companies are located in different countries, the tax laws or regulations of each country generally will require that transfer prices be consistent with those between unrelated companies dealing at arm's length. With the exception of certain jurisdictions where we have obtained rulings or advance pricing agreements, our transfer pricing arrangements are not binding on applicable tax authorities, and no official authority in any other country has made a determination as to whether or not we are operating in compliance with its transfer pricing laws. If tax authorities in any country were successful in challenging our transfer prices as not reflecting arm's length transactions, they could require us to adjust our transfer prices and thereby reallocate our income to reflect these revised transfer prices. A reallocation of taxable income from a lower tax jurisdiction to a higher tax jurisdiction would result in a higher tax liability to us. In addition, if the country from which the income is reallocated does not agree with the reallocation, both countries could tax the same income, resulting in double taxation.
Our Articles of Association, Dutch law and the independent foundation, Stichting Continuïteit Cimpress, may make it difficult to replace or remove management, may inhibit or delay a change of control or may dilute shareholder voting power.
Our Articles of Association, or Articles, as governed by Dutch law, limit our shareholders' ability to suspend or dismiss the members of our management board and supervisory board or to overrule our supervisory board's nominees to our management board and supervisory board by requiring a supermajority vote to do so under most circumstances. As a result, there may be circumstances in which shareholders may not be able to remove members of our management board or supervisory board even if holders of a majority of our ordinary shares favor doing so.
In addition, an independent foundation, Stichting Continuïteit Cimpress, or the Foundation, exists to safeguard the interests of Cimpress N.V. and its stakeholders, which include but are not limited to our shareholders, and to assist in maintaining Cimpress' continuity and independence. To this end, we have granted the Foundation a call option pursuant to which the Foundation may acquire a number of preferred shares equal to the same number of ordinary shares then outstanding, which is designed to provide a protective measure against unsolicited take-
25
over bids for Cimpress and other hostile threats. If the Foundation were to exercise the call option, it may prevent a change of control or delay or prevent a takeover attempt, including a takeover attempt that might result in a premium over the market price for our ordinary shares. Exercise of the preferred share option would also effectively dilute the voting power of our outstanding ordinary shares by one half.
We have limited flexibility with respect to certain aspects of capital management and certain corporate transactions.
Subject to specified exceptions, Dutch law requires shareholder approval for many corporate actions, such as the approval of dividends, authorization to issue new shares or purchase outstanding shares, and corporate acquisitions of a certain size. Situations may arise where the flexibility to issue shares, pay dividends, purchase shares, acquire other companies, or take other corporate actions without a shareholder vote would be beneficial to us, but is not available under Dutch law.
Because of our corporate structure, our shareholders may find it difficult to pursue legal remedies against the members of our supervisory board or management board.
Our Articles and our internal corporate affairs are governed by Dutch law, and the rights of our shareholders and the responsibilities of our supervisory board and management board are different from those established under United States laws. For example, under Dutch law derivative lawsuits are generally not available, and our supervisory board and management board are responsible for acting in the best interests of the company, its business and all of its stakeholders generally (including employees, customers and creditors), not just shareholders. As a result, our shareholders may find it more difficult to protect their interests against actions by members of our supervisory board or management board than they would if we were a U.S. corporation.
Because of our corporate structure, our shareholders may find it difficult to enforce claims based on United States federal or state laws, including securities liabilities, against us or our management team.
We are incorporated under the laws of the Netherlands, and the vast majority of our assets are located outside of the United States. In addition, some of our officers and management board members reside outside of the United States. In most cases, a final judgment for the payment of money rendered by a U.S. federal or state court would not be directly enforceable in the Netherlands. Although there is a process under Dutch law for petitioning a Dutch court to enforce a judgment rendered in the United States, there can be no assurance that a Dutch court would impose civil liability on us or our management team in any lawsuit predicated solely upon U.S. securities or other laws. In addition, because most of our assets are located outside of the United States, it could be difficult for investors to place a lien on our assets in connection with a claim of liability under U.S. laws. As a result, it may be difficult for investors to enforce U.S. court judgments or rights predicated upon U.S. laws against us or our management team outside of the United States.
We may not be able to make distributions or purchase shares without subjecting our shareholders to Dutch withholding tax.
A Dutch withholding tax may be levied on dividends and similar distributions made by Cimpress N.V. to its shareholders at the statutory rate of 15% if we cannot structure such distributions as being made to shareholders in relation to a reduction of par value, which would be non-taxable for Dutch withholding tax purposes. We have purchased our shares and may seek to purchase additional shares in the future. Under our Dutch Advanced Tax Ruling, a purchase of shares should not result in any Dutch withholding tax if we hold the purchased shares in treasury for the purpose of issuing shares pursuant to employee share awards or for the funding of acquisitions. However, if the shares cannot be used for these purposes, or the Dutch tax authorities successfully challenge the use of the shares for these purposes, such a purchase of shares may be treated as a partial liquidation subject to the 15% Dutch withholding tax to be levied on the difference between our average paid in capital per share for Dutch tax purposes and the redemption price per share, if higher.
We may be treated as a passive foreign investment company for United States tax purposes, which may subject United States shareholders to adverse tax consequences.
If our passive income, or our assets that produce passive income, exceed levels provided by law for any taxable year, we may be characterized as a passive foreign investment company, or a PFIC, for United States federal income tax purposes. If we are treated as a PFIC, U.S. holders of our ordinary shares would be subject to a
26
disadvantageous United States federal income tax regime with respect to the distributions they receive and the gain, if any, they derive from the sale or other disposition of their ordinary shares.
We believe that we were not a PFIC for the tax year ended June 30, 2017 and we expect that we will not become a PFIC in the foreseeable future. However, whether we are treated as a PFIC depends on questions of fact as to our assets and revenues that can only be determined at the end of each tax year. Accordingly, we cannot be certain that we will not be treated as a PFIC in future years.
If a United States shareholder acquires 10% or more of our ordinary shares, it may be subject to increased United States taxation under the “controlled foreign corporation” rules. Additionally, this may negatively impact the demand for our ordinary shares.
If a United States shareholder owns 10% or more of our ordinary shares, it may be subject to increased United States federal income taxation (and possibly state income taxation) under the “controlled foreign corporation” rules. In general, if a U.S. person owns (or is deemed to own) at least 10% of the voting power of a non-U.S. corporation, or “10% U.S. Shareholder,” and if such non-U.S. corporation is a “controlled foreign corporation,” or “CFC,” for an uninterrupted period of 30 days or more during a taxable year, then such 10% U.S. Shareholder who owns (or is deemed to own) shares in the CFC on the last day of the CFC's taxable year must include in its gross income for United States federal income tax (and possibly state income tax) purposes its pro rata share of the CFC's “subpart F income,” even if the "subpart F income" is not distributed. In general, a non-U.S. corporation is considered a CFC if one or more 10% U.S. Shareholders together own more than 50% of the voting power or value of the corporation on any day during the taxable year of the corporation. “Subpart F income” consists of, among other things, certain types of dividends, interest, rents, royalties, gains, and certain types of income from services and personal property sales.
The rules for determining ownership for purposes of determining 10% U.S. Shareholder and CFC status are complicated, depend on the particular facts relating to each investor, and are not necessarily the same as the rules for determining beneficial ownership for SEC reporting purposes. For taxable years in which we are a CFC for an uninterrupted period of 30 days or more, each of our 10% U.S. Shareholders will be required to include in its gross income for United States federal income tax purposes its pro rata share of our "subpart F income," even if the subpart F income is not distributed by us. We currently do not believe we are a CFC. However, whether we are treated as a CFC can be affected by, among other things, facts as to our share ownership that may change. Accordingly, we cannot be certain that we will not be treated as a CFC in future years.
The risk of being subject to increased taxation as a CFC may deter our current shareholders from acquiring additional ordinary shares or new shareholders from establishing a position in our ordinary shares. Either of these scenarios could impact the demand for, and value of, our ordinary shares.
We will pay taxes even if we are not profitable on a consolidated basis, which could harm our results of operations.
The intercompany service and related agreements among Cimpress N.V. and its direct and indirect subsidiaries ensure that many of the subsidiaries realize profits based on their operating expenses. As a result, if the Cimpress group is less profitable, or even not profitable on a consolidated basis, many of our subsidiaries will be profitable and incur income taxes in their respective jurisdictions.
Item 1B. Unresolved Staff Comments
None.
Item 2. Properties
We own real property including the following manufacturing operations that provide support across our businesses:
• | A 582,000 square foot facility located near Windsor, Ontario, Canada primarily services our Vistaprint business. |
• | A 492,000 square foot facility located in Shelbyville, Tennessee, USA, primarily services our National Pen business. |
• | A 362,000 square foot facility located in Venlo, the Netherlands primarily services our Vistaprint business. |
• | A 130,000 square foot facility located in Kisarazu, Japan primarily services our Japanese market. |
27
• | A 124,000 square foot facility located in Deer Park, Australia primarily services our Vistaprint business. |
• | A 97,000 square feet, located near Montpellier, France primarily services our Upload and Print businesses. |
As of June 30, 2017, a summary of our currently occupied leased spaces is as follows:
Business Segment (1) | Square Feet | Type | Lease Expirations | ||||
Vistaprint | 640,799 | Technology development, marketing, customer service and administrative | December 2018 - November 2026 | ||||
Upload & Print | 584,837 | Technology development, marketing, customer service, manufacturing and administrative | July 2017 - December 2025 | ||||
National Pen | 314,533 | Marketing, customer service, manufacturing and administrative | December 2022 - April 2027 | ||||
All Other Businesses | 258,453 | Technology development, marketing, customer service, manufacturing and administrative | July 2017 - August 2023 | ||||
Other (2) | 86,902 | Corporate strategy, technology development and prototyping laboratory | May 2018 - June 2023 | ||||
___________________
(1) Many of our leased properties are utilized by multiple business segments, but each have been assigned to the segment that occupies the majority of our leased space.
(2) Includes locations that are exclusively corporate or global functions.
We believe that the total space available to us in the facilities we own or lease, and space that is obtainable by us on commercially reasonable terms, will meet our needs for the foreseeable future.
Item 3. Legal Proceedings
The information required by this item is incorporated by reference to the information set forth in Item 8 of Part II, “Financial Statements and Supplementary Data — Note 17 — Commitments and Contingencies,” in the accompanying notes to the consolidated financial statements included in this Report.
Item 4. Mine Safety Disclosures
None.
PART II
Item 5. Market for Registrant’s Common Equity, Related Stockholder Matters and Issuer Purchases of Equity Securities
The ordinary shares of Cimpress N.V. are traded on the NASDAQ Global Select Market (the "NASDAQ") under the symbol “CMPR.” As of July 31, 2017, there were approximately 11 holders of record of our ordinary shares, although there is a much larger number of beneficial owners. The following table sets forth, for the periods indicated, the high and low sale price per share of our ordinary shares on the NASDAQ:
High | Low | ||||||
Fiscal 2016: | |||||||
First Quarter | $ | 86.95 | $ | 63.15 | |||
Second Quarter | $ | 94.57 | $ | 74.57 | |||
Third Quarter | $ | 91.84 | $ | 67.89 | |||
Fourth Quarter | $ | 101.77 | $ | 86.93 | |||
Fiscal 2017: | |||||||
First Quarter | $ | 104.18 | $ | 88.31 | |||
Second Quarter | $ | 102.95 | $ | 80.47 | |||
Third Quarter | $ | 99.99 | $ | 79.15 | |||
Fourth Quarter | $ | 94.47 | $ | 78.80 | |||
28
Dividends
We have never paid or declared any cash dividends on our ordinary shares, and we do not anticipate paying any cash dividends in the foreseeable future. We currently intend to retain all future earnings to finance the growth and operations of our business, purchase our ordinary shares, or pay down our debt. Under Dutch law, we may pay dividends only out of profits shown on our annual accounts prepared in accordance with Dutch generally accepted accounting principles and adopted by our shareholders, and only to the extent our equity exceeds the sum of the paid and called up portion of our ordinary share capital and the reserves that must be maintained in accordance with provisions of Dutch law and our articles of association. In addition, the terms of our outstanding indebtedness restrict our ability to pay dividends, as further described in Item 8 of Part II, "Financial Statements and Supplementary Data - Note 10 - Debt," and in Management's Discussion and Analysis of Financial Condition and Results of Operations section of this report.
Issuer Purchases of Equity Securities
On March 22, 2017, in order to provide us with flexibility to repurchase our ordinary shares at times when our management believes it may be beneficial for our business, our Supervisory Board authorized the repurchase of up to 6,300,000 of our issued and outstanding ordinary shares on the open market (including block trades that satisfy the safe harbor provisions of Rule 10b-18 pursuant to the U.S. Securities Exchange Act of 1934), through privately negotiated transactions, or in one or more self-tender offers. This share repurchase authorization expires on May 15, 2018, and we may or may not choose to make repurchases under this authorization.
We did not repurchase any shares during the three months ended June 30, 2017, and 6,300,000 shares remain available for repurchase under this program, subject to certain limitations imposed by our debt covenants.
29
Performance Graph
The following graph compares the cumulative total return to shareholders of Cimpress N.V. ordinary shares relative to the cumulative total returns of the NASDAQ Composite index and the Research Data Group (RDG) Internet Composite index. An investment of $100 (with reinvestment of all dividends) is assumed to have been made in our ordinary shares and in each of the indexes on June 30, 2012 and the relative performance of each investment is tracked through June 30, 2017.
COMPARISON OF 5 YEAR CUMULATIVE TOTAL RETURN
Among Cimpress N.V., the NASDAQ Composite Index
and the RDG Internet Composite Index
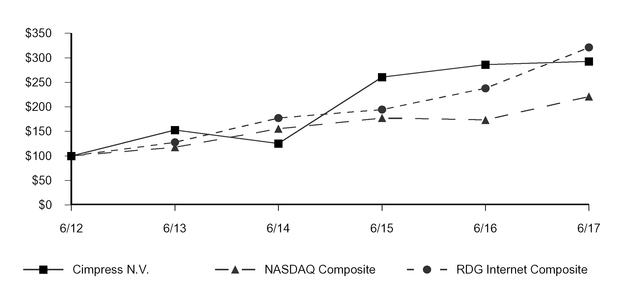
Year Ended June 30, | ||||||||||||||||||||||||
2012 | 2013 | 2014 | 2015 | 2016 | 2017 | |||||||||||||||||||
Cimpress N.V. | $ | 100.00 | $ | 152.85 | $ | 125.26 | $ | 260.56 | $ | 286.32 | $ | 292.66 | ||||||||||||
NASDAQ Composite | 100.00 | 117.69 | 155.50 | 177.19 | 173.36 | 221.11 | ||||||||||||||||||
RDG Internet Composite | 100.00 | 127.63 | 177.39 | 194.48 | 237.94 | 320.94 | ||||||||||||||||||
The share price performance included in this graph is not necessarily indicative of future share price performance.
30
Item 6. Selected Financial Data
The following financial data should be read in conjunction with our consolidated financial statements, the related notes and “Item 7. Management’s Discussion and Analysis of Financial Condition and Results of Operations” included elsewhere in this Report. The historical results are not necessarily indicative of the results to be expected for any future period.
Year Ended June 30, | |||||||||||||||||||
2017 (a) | 2016 (b) | 2015 (c) | 2014 (d) | 2013 (e) | |||||||||||||||
(In thousands, except share and per share data) | |||||||||||||||||||
Consolidated Statements of Operations Data: | |||||||||||||||||||
Revenue | $ | 2,135,405 | $ | 1,788,044 | $ | 1,494,206 | $ | 1,270,236 | $ | 1,167,478 | |||||||||
Net (loss) income attributable to Cimpress N.V. | (71,711 | ) | 54,349 | 92,212 | 43,696 | 29,435 | |||||||||||||
Net (loss) income per share attributable to Cimpress N.V.: | |||||||||||||||||||
Basic | $ | (2.29 | ) | $ | 1.72 | $ | 2.82 | $ | 1.33 | $ | 0.89 | ||||||||
Diluted | $ | (2.29 | ) | $ | 1.64 | $ | 2.73 | $ | 1.28 | $ | 0.85 | ||||||||
Shares used in computing net (loss) income per share attributable to Cimpress N.V.: | |||||||||||||||||||
Basic | 31,291,581 | 31,656,234 | 32,644,870 | 32,873,234 | 33,209,172 | ||||||||||||||
Diluted | 31,291,581 | 33,049,454 | 33,816,498 | 34,239,909 | 34,472,004 | ||||||||||||||
Year Ended June 30, | |||||||||||||||||||
2017 (a) | 2016 (b) | 2015 (c) | 2014 (d) | 2013 (e) | |||||||||||||||
(In thousands) | |||||||||||||||||||
Consolidated Statements of Cash Flows Data: | |||||||||||||||||||
Net cash provided by operating activities | $ | 156,736 | $ | 247,358 | $ | 242,022 | $ | 153,739 | $ | 141,808 | |||||||||
Purchases of property, plant and equipment | (74,157 | ) | (80,435 | ) | (75,813 | ) | (72,122 | ) | (78,999 | ) | |||||||||
Purchases of ordinary shares | (50,008 | ) | (153,467 | ) | — | (42,016 | ) | (64,351 | ) | ||||||||||
Business acquisitions, net of cash acquired | (204,875 | ) | (164,412 | ) | (123,804 | ) | (216,384 | ) | — | ||||||||||
Net proceeds of debt | 196,933 | 167,316 | 54,207 | 207,946 | 8,051 | ||||||||||||||
Year Ended June 30, | |||||||||||||||||||
2017 (a) | 2016 (b) | 2015 (c) | 2014 (d) | 2013 (e) | |||||||||||||||
(In thousands) | |||||||||||||||||||
Consolidated Balance Sheet Data: | |||||||||||||||||||
Cash, cash equivalents and marketable securities (f) | $ | 25,697 | $ | 85,319 | $ | 110,494 | $ | 76,365 | $ | 50,065 | |||||||||
Working capital (f) | (203,482 | ) | (135,095 | ) | (89,580 | ) | (83,560 | ) | (54,795 | ) | |||||||||
Total assets | 1,679,869 | 1,463,869 | 1,299,794 | 985,495 | 598,632 | ||||||||||||||
Total long-term debt, excluding current portion (g) | 847,730 | 656,794 | 493,039 | 408,150 | 227,700 | ||||||||||||||
Total shareholders’ equity | 75,212 | 166,076 | 249,419 | 232,457 | 189,561 | ||||||||||||||
___________________
(a) Includes the impact of the acquisition of National Pen on December 30, 2016. See Note 7 in our accompanying financial statements in this Report for a discussion of this acquisition.
(b) Includes the impact of the acquisitions of Litotipografia Alcione S.r.l. on July 29, 2015, Tradeprint Distribution Limited on July 31, 2015, and WIRmachenDRUCK GmbH on February 1, 2016. See Note 7 in our accompanying financial statements in this Report for a discussion of these acquisitions.
During fiscal 2016, we adopted Accounting Standards Update (ASU) 2016-09 requiring the recognition of excess tax benefits as a component of income tax expense, these benefits were historically recognized in equity. As the standard required a prospective method of adoption, our fiscal 2017 and 2016 net income includes $8.0 million and $3.5 million income tax benefits, respectively, due to the adoption that did not occur in the prior comparable periods presented above.
(c) Includes the impact of the acquisitions of FotoKnudsen AS on July 1, 2014, FL Print SAS on April 9, 2015, Exagroup SAS on April 15, 2015 and druck.at Druck-und Handelsgesellschäft mbH on April 17, 2015, as well as our investment in Printi LLC on August 7, 2014. See Notes 7, 14 and 15 in our accompanying financial statements in this Report for a discussion of these transactions.
(d) Includes the impact of the acquisitions of Printdeal B.V. on April 1, 2014 and Pixartprinting S.p.A. on April 3, 2014, as well as our investment in a joint business arrangement with Plaza Create Co. Ltd. in February 2014.
(e) Includes the impact of our July 10, 2012 equity investment in Namex Limited. During the fourth quarter of fiscal 2014 we disposed of this investment and recognized a loss on the sale of $12.7 million.
31
(f) We define working capital as current assets less current liabilities. Our working capital profile has evolved since fiscal 2013 as we have made long-term investments that seek to drive shareholder value through acquisitions, ordinary share purchases, and other strategic initiatives. We have financed these investments through a mix of cash on hand, cash flows generated from operations and external debt financing.
(g) On March 24, 2015, we completed a private placement of $275.0 million of 7.0% senior unsecured notes due 2022. The proceeds from the sales of the notes were used to repay existing outstanding indebtedness under our unsecured line of credit, the indebtedness outstanding under our senior secured credit facility and for general corporate purposes. See Note 10 in our accompanying financial statements in this Report for additional discussion. The year-over-year increases in long-term debt have largely been driven by the funding of our recent acquisitions, as outlined in Note 7.
Item 7. Management’s Discussion and Analysis of Financial Condition and Results of Operations
This Report contains forward-looking statements that involve risks and uncertainties. The statements contained in this Report that are not purely historical are forward-looking statements within the meaning of Section 27A of the Securities Act of 1933 and Section 21E of the Securities Exchange Act of 1934, including but not limited to our statements about anticipated income and revenue growth rates, future profitability and market share, new and expanded products and services, geographic expansion and planned capital expenditures. Without limiting the foregoing, the words “may,” “should,” “could,” “expect,” “plan,” “intend,” “anticipate,” “believe,” “estimate,” “predict,” “designed,” “potential,” “continue,” “target,” “seek” and similar expressions are intended to identify forward-looking statements. All forward-looking statements included in this Report are based on information available to us up to, and including the date of this document, and we disclaim any obligation to update any such forward-looking statements. Our actual results could differ materially from those anticipated in these forward-looking statements as a result of certain important factors, including those set forth in this “Management's Discussion and Analysis of Financial Condition and Results of Operations” and “Risk Factors” and elsewhere in this Report. You should carefully review those factors and also carefully review the risks outlined in other documents that we file from time to time with the United States Securities and Exchange Commission.
Executive Overview
We are a technology driven company that aggregates, largely via the internet, large volumes of small, individually customized orders for a broad spectrum of print, signage, apparel and similar products. We operate in a largely decentralized manner. Our businesses, discussed in more detail below, fulfill orders with manufacturing capabilities that include Cimpress owned and operated manufacturing facilities and a network of third-party fulfillers to create customized products on-demand. Those businesses bring their products to market through a portfolio of customer-focused brands serving the needs of micro, small and medium sized businesses, resellers and consumers. These brands include Vistaprint, our global brand for micro business marketing products and services, as well as brands that we have acquired that serve the needs of various market segments, including resellers, micro, small and medium sized businesses with differentiated service needs, and consumers purchasing products for themselves and their families.
As of June 30, 2017, we have numerous operating segments under our management reporting structure which are reported in the following four reportable segments: Vistaprint, Upload and Print, National Pen, and All Other Businesses. Vistaprint represents our Vistaprint websites focused on the North America, Europe, Australia and New Zealand markets, and our Webs business, which is managed with the Vistaprint- digital business. Upload and Print includes the druck.at, Easyflyer, Exagroup, Pixartprinting, Printdeal, Tradeprint, and WIRmachenDRUCK businesses. National Pen includes the global operations of our National Pen business, which manufactures and markets custom writing instruments and promotional products, apparel and gifts for small- and medium-sized businesses. All Other Businesses segment includes the operations of our Albumprinter, Most of World and Corporate Solutions businesses.
Financial Summary
In evaluating the financial condition and operating performance of our business, management focuses on revenue growth, constant-currency revenue growth, operating income and adjusted net operating profit after tax (NOPAT). A summary of these key financial metrics for the year ended June 30, 2017 as compared to the year ended June 30, 2016 follows:
Fiscal Year 2017
• | Reported revenue increased by 19% to $2,135.4 million. |
32
• | Consolidated constant-currency revenue increased by 21% and excluding acquisitions completed in the last four quarters increased by 8%. |
• | Operating income decreased $123.9 million to an operating loss of $45.7 million. |
• | Adjusted NOPAT decreased $75.2 million to $64.6 million. |
For our fiscal year 2017, the increase in reported revenue growth was primarily due to the addition of the revenue of our WIRmachenDRUCK business, which we acquired in fiscal 2016 and therefore only partially contributed to the prior comparative period, and our recently acquired National Pen business, as well as continued growth in the Vistaprint business and Upload and Print businesses acquired more than twelve months prior.
The following items negatively impacted our operating income for the year ended June 30, 2017, leading to the decrease in operating income as compared to the prior period:
• | Increased organic investments in fiscal year 2017 compared to fiscal year 2016, which materially weighed on profitability. These investments include costs that impact our gross profit such as shipping price reductions, expanded design services, and new product introduction. |
• | Significant acquisition-related expense associated with our WIRmachenDRUCK contingent earn-out arrangement, due to its continued strong performance, as well as $7.1 million of amortization expense for acquired intangible assets of our newly acquired National Pen business. |
• | Restructuring-related charges related to our reorganization, which was announced in January 2017, resulting in one-time employee termination costs as well as third party professional fees. |
• | Declines from the termination of two partner contracts within our Albumprinter and Corporate Solutions businesses. |
• | Increased third-party fulfillment and shipping costs during the second quarter of fiscal 2017 due to production inefficiencies in our Vistaprint business. |
• | Increased share-based compensation, excluding restructuring related charges, during the current fiscal year primarily driven by our new long-term incentive program and the accelerated vesting of equity awards from two acquisition-related arrangements. |
The decrease in adjusted NOPAT (a non-GAAP financial measure) was also negatively impacted by the items described above, with the exception of the restructuring-related charges, the expense associated with our WIRmachenDRUCK contingent earn-out arrangement and the National Pen intangible asset amortization, as these expenses are excluded from adjusted NOPAT.
Primarily as a result of the organizational changes announced on January 25, 2017, we incurred aggregate pre-tax restructuring charges of $26.7 million during the year ended June 30, 2017. The restructuring is substantially complete and we do not expect material charges in future quarters related to these changes. In fiscal 2018 as compared to the current period, we expect to realize net operating expense savings of approximately $50 million and pre-tax cash flow from operations savings of approximately $35 million, as a result of these reductions in headcount and related non-compensation savings.
Consolidated Results of Operations
Consolidated Revenue
We generate revenue primarily from the sale and shipping of customized manufactured products, and by providing digital services, website design and hosting, and email marketing services, as well as a small percentage from order referral fees and other third-party offerings.
For the years ended June 30, 2017 and 2016, our reported revenue increased, primarily due to the addition of revenue from our WIRmachenDRUCK business acquired on February 1, 2016 and our National Pen business acquired on December 30, 2016. Currency fluctuations negatively impacted our fiscal 2017 and 2016 reported revenue growth. The increases in constant-currency revenue excluding acquisitions for which there is no comparable year-over-year revenue were driven by continued growth in the Vistaprint business, as well as growth in our Upload and Print businesses acquired more than twelve months prior, which were partially offset by declines from the termination of two partner contracts within our Albumprinter and Corporate Solutions businesses.
33
Total revenue by reportable segment for the years ended June 30, 2017, 2016 and 2015 is shown in the following tables:
In thousands | Year Ended June 30, | Currency Impact: | Constant- Currency | Impact of Acquisitions: | Constant- Currency revenue growth | ||||||||||||
2017 (1) | 2016 (2) | % Change | (Favorable)/Unfavorable | Revenue Growth (4) | (Favorable)/Unfavorable | Excluding acquisitions (5) | |||||||||||
Vistaprint | $ | 1,305,285 | $ | 1,217,162 | 7% | 2% | 9% | —% | 9% | ||||||||
Upload and Print | 588,613 | 432,638 | 36% | 3% | 39% | (26)% | 13% | ||||||||||
National Pen | 112,712 | — | 100% | —% | 100% | (100)% | —% | ||||||||||
All Other Businesses | 128,795 | 138,244 | (7)% | —% | (7)% | —% | (7)% | ||||||||||
Total revenue | $ | 2,135,405 | $ | 1,788,044 | 19% | 2% | 21% | (13)% | 8% | ||||||||
In thousands | Year Ended June 30, | Currency Impact: | Constant- Currency | Impact of Acquisitions: | Constant- Currency revenue growth | ||||||||||||
2016 (2) | 2015 (3) | % Change | (Favorable)/Unfavorable | Revenue Growth (4) | (Favorable)/Unfavorable | Excluding acquisitions (5) | |||||||||||
Vistaprint | $ | 1,217,162 | $ | 1,149,706 | 6% | 4% | 10% | —% | 10% | ||||||||
Upload and Print | 432,638 | 197,075 | 120% | 7% | 127% | (100)% | 27% | ||||||||||
National Pen | — | — | —% | —% | —% | —% | —% | ||||||||||
All Other Businesses | 138,244 | 147,425 | (6)% | 8% | 2% | —% | 2% | ||||||||||
Total revenue | $ | 1,788,044 | $ | 1,494,206 | 20% | 4% | 24% | (13)% | 11% | ||||||||
_________________
(1) Fiscal 2017 includes the impact of National Pen from its acquisition date of December 30, 2016 in our National Pen segment.
(2) Fiscal 2016 includes the impact of Alcione, Tradeprint and WIRmachenDRUCK from their respective acquisition dates in our Upload and Print segment
(3) Fiscal 2015 includes from their respective acquisition dates, the impact of FotoKnudsen and Printi which are part of our All Other Businesses segment, as well as Easyflyer, Exagroup and druck.at which are part of our Upload and Print segment
(4) Constant-currency revenue growth, a non-GAAP financial measure, represents the change in total revenue between current and prior year periods at constant-currency exchange rates by translating all non-U.S. dollar denominated revenue generated in the current period using the prior year period’s average exchange rate for each currency to the U.S. dollar.
(5) Constant-currency revenue growth excluding acquisitions, a non-GAAP financial measure, excludes revenue results for businesses in the period in which there is no comparable year-over-year revenue. Revenue from our fiscal 2016 acquisitions is excluded from fiscal 2017 revenue growth for quarters with no comparable year-over-year revenue. For example, revenue from Tradeprint, which we acquired in Q1 2016, is excluded from Q1 2017 revenue growth since there are no full quarter results in the comparable period, but revenue from Tradeprint is included in Q2, Q3, and Q4 2017 revenue growth.
We have provided these non-GAAP financial measures because we believe they provide meaningful information regarding our results on a consistent and comparable basis for the periods presented. Management uses these non-GAAP financial measures, in addition to GAAP financial measures, to evaluate our operating results. These non-GAAP financial measures should be considered supplemental to and not a substitute for our reported financial results prepared in accordance with GAAP.
Consolidated Cost of Revenue
Cost of revenue includes materials used to manufacture our products, payroll and related expenses for production and design services personnel, depreciation of assets used in the production process and in support of digital marketing service offerings, shipping, handling and processing costs, third-party production costs, costs of free products and other related costs of products sold by us. Cost of revenue as a percent of revenue increased during the year ended June 30, 2017, primarily due to costs associated with new product and service launches, introduction of lower margin products, increased third-party fulfillment and shipping costs, and the increased weight of our Upload and Print portfolio, which as a percentage of revenue has higher cost of revenue than our traditional business.
Year Ended June 30, | |||||||||||
2017 | 2016 | 2015 | |||||||||
Cost of revenue | $ | 1,036,975 | $ | 773,640 | $ | 568,572 | |||||
% of revenue | 48.6 | % | 43.3 | % | 38.1 | % | |||||
34
For the year ended June 30, 2017, our cost of revenue increased due to $123.6 million of additional costs from our Upload and Print businesses, primarily due to the impact of our fiscal 2016 WIRmachenDRUCK acquisition which only partially contributed to the prior comparable period. In addition, the costs from our Vistaprint business increased by $91.1 million, primarily due to increased production volume; product mix; and planned investments including expanded design services, new product introduction, including via third-party fulfillers, and shipping price reductions that also result in higher shipping costs. The Vistaprint business also recognized higher costs from production inefficiencies in our second fiscal quarter resulting from higher temporary labor costs at our Canadian production facility, as well as inefficiencies that caused us to quickly turn to more expensive third-party fulfillers and use more expedited shipping during the peak holiday season. We recognized an additional $48.6 million of manufacturing costs from our National Pen business, which was acquired on December 30, 2016 and is therefore not included in the comparable period.
Cost of revenue for the year ended June 30, 2016 increased due to $157.5 million of higher costs in our Upload and Print businesses, largely due to incremental manufacturing costs of $143.8 million from our fiscal 2016 acquisitions of WIRmachenDRUCK and Tradeprint and increased manufacturing volume from our Pixartprinting and Printdeal businesses. In addition, the Vistaprint cost of revenue increased by $44.5 million, due to increased costs associated with production volume and product mix of $38.6 million and an $11.0 million loss for the abandonment of various proprietary production technologies, partially offset by aggregate benefits of currency, productivity and efficiency gains of $5.1 million.
Consolidated Operating Expenses
The following table summarizes our comparative operating expenses for the periods:
In thousands
Year Ended June 30, | |||||||||||
2017 | 2016 | 2015 | |||||||||
Technology and development expense | $ | 243,230 | $ | 210,080 | $ | 186,770 | |||||
% of revenue | 11.4 | % | 11.7 | % | 12.5 | % | |||||
Marketing and selling expense | $ | 610,932 | $ | 508,502 | $ | 472,079 | |||||
% of revenue | 28.6 | % | 28.4 | % | 31.5 | % | |||||
General and administrative expense | $ | 207,569 | $ | 145,844 | $ | 142,996 | |||||
% of revenue | 9.7 | % | 8.2 | % | 9.6 | % | |||||
Amortization of acquired intangible assets | $ | 46,145 | $ | 40,563 | $ | 24,263 | |||||
% of revenue | 2.2 | % | 2.3 | % | 1.6 | % | |||||
Restructuring expense | $ | 26,700 | $ | 381 | $ | 3,202 | |||||
% of revenue | 1.3 | % | 0.0 | % | 0.2 | % | |||||
Impairment of goodwill and acquired intangible assets | $ | 9,556 | $ | 30,841 | $ | — | |||||
% of revenue | 0.4 | % | 1.7 | % | — | % | |||||
Technology and development expense
Technology and development expense consists primarily of payroll and related expenses for our employees engaged in software and manufacturing engineering, information technology operations and content development, as well as amortization of capitalized software and website development costs, including hosting of our websites, asset depreciation, patent amortization, legal settlements in connection with patent-related claims, and other technology infrastructure-related costs. Depreciation expense for information technology equipment that directly supports the delivery of our digital marketing services products is included in cost of revenue.
The growth in our technology and development expenses of $33.2 million for the year ended June 30, 2017 as compared to the prior comparative period was primarily due to increased headcount-related expenses in our technology development and information technology support organizations of $15.8 million. The increase in headcount supports the continued development of our software-based mass customization platform as well as investments to enhance existing capabilities and address each of our businesses' specific needs. This increase is partially offset by headcount reductions as a result of the third quarter fiscal 2017 restructuring initiative. All employee severance related charges are reflected separately in restructuring expense. Additionally, our recent
35
acquisition of National Pen has resulted in increased technology and development expenses of $5.9 million for the year ended June 30, 2017, without costs in the prior comparable period. Other increases in technology and development expense include technology infrastructure-related costs, primarily due to increased IT cloud service costs, as well as software maintenance and licensing costs.
The growth in our technology and development expenses of $23.3 million for the year ended June 30, 2016 as compared to the prior comparative period was due to increased payroll, share-based compensation and facility-related costs of $14.7 million, as a result of increased headcount in our technology development and information technology support organizations. The increase in headcount is partly due to increases in software and manufacturing engineering resources related to the development of a software-based mass customization platform as well as expand product offerings, and partly due to headcount from acquired businesses. Technology infrastructure-related costs increased by $8.8 million, primarily due to increased software maintenance and licensing costs, as well as increased IT cloud service costs. Other technology and development expenses increased by $0.8 million primarily due to increased depreciation expense related to increased investments in computer software and equipment. Also during the year ended June 30, 2016, we had higher net capitalization of software costs of $1.0 million, due to an increase in costs that qualified for capitalization during the fiscal year.
Marketing and selling expense
Marketing and selling expense consists primarily of advertising and promotional costs; payroll and related expenses for our employees engaged in marketing, sales, customer support and public relations activities; direct-mail advertising costs; and third-party payment processing fees. Our Vistaprint and National Pen businesses have higher marketing and selling costs structures, as compared to our Upload and Print businesses.
Our marketing and selling expenses increased by $102.4 million during the year ended June 30, 2017 as compared to the prior comparative period, primarily due to the addition of National Pen which incurred $47.9 million of marketing and selling expense during the year ended June 30, 2017 primarily for direct-mail advertising and telesales costs that were not in our prior comparable period. In addition, advertising expense increased by $31.8 million, which is primarily a result of additional advertising spend in the Vistaprint business. Other increases include payroll and employee-related costs, inclusive of share-based compensation, as we expanded our marketing and customer service, sales support organization through our recent acquisitions and continued investment in the Vistaprint business customer service resources in order to provide higher value services to our customers.
Our marketing and selling expenses increased by $36.4 million during the year ended June 30, 2016 as compared to the prior period primarily due to increased advertising expense of $19.6 million as a result of product-focused television ad investments in both the U.S. and Canada during the first quarter of fiscal 2016 as well as strategic investments in certain European markets which included increased paid search and television ad spend during the fourth quarter of fiscal 2016 for the Vistaprint business. In addition, increased activity from the businesses we acquired during the fiscal years 2016 and 2015 also contributed to the increase in advertising expense. Our payroll and facility-related costs, inclusive of share-based compensation, increased $8.6 million, as we expanded our marketing and customer service, sales and design support organization through our recent acquisitions and continued investment in the Vistaprint businesses customer service resources in order to provide higher value services to our customers. Payment processing and third-party services were $5.7 million higher than the prior period, primarily due to increased order volumes. Other marketing and selling costs increased by $2.5 million, primarily due to increased travel and training costs.
General and administrative expense
General and administrative expense consists primarily of transaction costs, including third-party professional fees, insurance and payroll and related expenses of employees involved in executive management, finance, legal, strategy, human resources, and central procurement.
During the year ended June 30, 2017, general and administrative expenses increased by $61.7 million, as compared to the prior comparative period, driven by $37.3 million of incremental expense for the WIRmachenDRUCK earn-out primarily due to continued strong performance during fiscal 2017 and our expectation that a maximum payout will be achieved. Payroll, share-based compensation and facility-related costs increased by $12.0 million, due to additional expense recognized for the acceleration of vesting terms of certain restricted share awards associated with our investment in Printi and acquisition of Tradeprint, as well as an increase in share-based compensation resulting from our new long-term incentive program. These increases are partially offset by the
36
decrease in compensation expense due to headcount reductions as a result of the third quarter fiscal 2017 restructuring initiative. We also recognized an additional $12.4 million of expense from our acquisition of National Pen.
During the year ended June 30, 2016 our general and administrative expenses increased by $2.8 million, as compared to the prior period. The increase in fiscal 2016 was partially driven by increased payroll and facility-related costs of $4.5 million, as compared to the prior comparative period. We incurred additional expense of $6.0 million during the year ended June 30, 2016, related to contingent compensation arrangements from our WIRmachenDRUCK and Easyflyer acquisitions. In addition, our employee travel, training, and recruitment costs and third-party professional fees increased by $3.8 million, as compared to the prior comparative period. Other general and administrative costs increased by $3.4 million, which primarily related to third-party consulting fees. The increase was partially offset by the recognition of $14.9 million of expense during the year ended June 30, 2015, to remeasure the contingent consideration liabilities related to the Printdeal and Pixartprinting acquisitions which did not recur in fiscal 2016.
Amortization of acquired intangible assets
Amortization of acquired intangible assets consists of amortization expense associated with separately identifiable intangible assets capitalized as part of our acquisitions, including customer relationships, trade names, developed technologies, print networks, and customer and referral networks. Amortization of acquired intangible assets increased by $5.6 million during the year ended June 30, 2017, as compared to the year ended June 30, 2016, primarily due to amortization for our fiscal 2017 acquisition of National Pen and fiscal 2016 acquisition of WIRmachenDRUCK.
Amortization of acquired intangible assets increased $16.3 million during the year ended June 30, 2016 as compared to the year ended June 30, 2015, primarily due to our fiscal 2016 acquisitions of WIRmachenDruck and Tradeprint, as well as a full year of amortization related to our fiscal 2015 acquisitions.
Restructuring expense
Restructuring expense consists of costs directly incurred as a result of a restructuring initiative, inclusive of employee-related termination costs, third party professional fees, facility exit costs and write-off of abandoned assets.
The restructuring expense of $26.7 million that was recognized during the year ended June 30, 2017 consists of costs directly incurred as a result of our January 2017 restructuring initiative, inclusive of employee-related termination costs, third-party professional fees and our write-off of abandoned assets. Refer to Note 18 for additional details regarding the restructuring plan.
Impairment of goodwill and acquired intangible assets
For the years ended June 30, 2017 and 2016, we recognized impairment charges of $9.6 million and $30.8 million for our Tradeprint and Exagroup reporting units, respectively. These impairments were a result of their under performance during the impairment period, combined with lower profit outlooks when compared to the initial deal model upon which we based our purchase accounting. There were no impairment charges related to goodwill or acquired intangible assets during the year ended June 30, 2015. Refer to Note 8 for additional information relating to the impairments.
Other Consolidated Results
Other income, net
Other income, net generally consists of gains and losses from currency exchange rate fluctuations on transactions or balances denominated in currencies other than the functional currency of our subsidiaries, as well as the realized and unrealized gains and losses on some of our derivative instruments. In evaluating our currency hedging program and ability to achieve hedge accounting in light of our legal entity cash flows, we considered the benefits of hedge accounting relative to the additional economic cost of trade execution and administrative burden. Based on this analysis, we decided to execute certain currency derivative contracts that do not qualify for hedge accounting. The following table summarizes the components of other income:
37
Year Ended June 30, | |||||||||||
2017 | 2016 | 2015 | |||||||||
Gains on derivatives not designated as hedging instruments | $ | 936 | $ | 14,026 | $ | 9,317 | |||||
Currency-related gains, net | 5,577 | 6,864 | 10,245 | ||||||||
Other gains | 3,849 | 5,208 | 572 | ||||||||
Total other income, net | $ | 10,362 | $ | 26,098 | $ | 20,134 | |||||
The decrease in net gains during the year ended June 30, 2017, when compared to the prior comparative periods, is primarily due to the currency exchange rate volatility impacting our derivatives that are not designated as hedging instruments. We expect this volatility to continue in future periods as we do not currently apply hedge accounting for most of our derivative currency contracts. We also experienced lower currency-related gains due to currency exchange rate volatility on our non-functional currency intercompany relationships. These lower net gains are partially offset by the impact of certain cross-currency swap contracts designated as cash flow hedges.
In addition, during the year ended June 30, 2017, we recognized other gains of $3.8 million, which consist primarily of gains related to the sale of marketable securities. During fiscal year 2016, we recognized other gains of $5.2 million, primarily related to insurance recoveries.
Interest expense, net
Interest expense, net was $44.0 million, $38.2 million, and $16.7 million for the years ended June 30, 2017, 2016 and 2015, respectively. Interest expense, net primarily consists of interest paid on outstanding debt balances, amortization of debt issuance costs, interest related to capital lease obligations and realized gains (losses) on effective interest rate swap contracts and certain cross-currency swap contracts. We expect interest expense to be higher relative to historical trends as a result of increased borrowing levels on our senior secured credit facility which was expanded in July 2017, increased capital lease obligations for machinery and equipment, and if interest rates increase. Refer to Note 10 for additional details.
Income tax (benefit) provision
Year Ended June 30, | |||||||||||
2017 | 2016 | 2015 | |||||||||
Income tax (benefit) provision | $ | (7,118 | ) | $ | 15,684 | $ | 10,441 | ||||
Effective tax rate | 9.0 | % | 23.7 | % | 10.5 | % | |||||
The increase in income tax benefit for the year ended June 30, 2017 from income tax expense in prior periods is primarily attributable to pre-tax losses for the year ended June 30, 2017 as compared to pre-tax earnings for the fiscal years ended June 30, 2016 and 2015. This, combined with a more favorable geographical mix of earnings in fiscal year 2017, has resulted in a lower effective tax rate for the year. In addition, we recorded a larger goodwill impairment charge in fiscal year 2016 as compared to fiscal year 2017 (discussed in Note 8) which is non-deductible for tax purposes. This was offset by increased nondeductible acquisition-related charges in fiscal year 2017 as compared to fiscal year 2016. Also, in fiscal year 2017 we recognized increased tax benefits associated with the vesting of share-based compensation awards, research and development credits and other incentives (primarily in the U.S. and Italy) as compared to fiscal year 2016. Our tax rate was higher in fiscal year 2016 as compared to fiscal year 2015 primarily due to the nondeductible goodwill impairment charge in fiscal year 2016.
Our cash paid for income taxes for fiscal 2017 is higher than our income tax expense primarily as a result of non-cash tax benefits relating to tax losses for which the cash benefit is expected to occur in a future period. We expect our cash paid for income taxes for fiscal 2018 to be lower compared to fiscal 2017.
We believe that our income tax reserves are adequately maintained taking into consideration both the technical merits of our tax return positions and ongoing developments in our income tax audits. However, the final determination of our tax return positions, if audited, is uncertain, and there is a possibility that final resolution of these matters could have a material impact on our results of operations or cash flows. See Note 13 in our accompanying consolidated financial statements for additional discussion.
38
Reportable Segment Results
Our primary metric used to measure segment financial performance is adjusted net operating profit which excludes certain non-operational items including acquisition-related expenses, certain impairments and restructuring charges.
Vistaprint
Year Ended June 30, | |||||||||||||||||
2017 | 2016 | 2015 | 2017 vs. 2016 | 2016 vs. 2015 | |||||||||||||
Reported Revenue | $ | 1,305,285 | $ | 1,217,162 | $ | 1,149,706 | 7 | % | 6 | % | |||||||
Adjusted Net Operating Profit (1) | 165,193 | 213,027 | 193,048 | (22 | )% | 10 | % | ||||||||||
% of revenue | 13 | % | 18 | % | 17 | % | |||||||||||
_________________
(1) During the fourth quarter of fiscal 2017, we identified errors related to our unaudited segment profitability disclosures that were recast and reported during the third quarter of fiscal 2017. The impact of these errors have been revised for all periods presented. Refer to Note 16 for additional details.
Segment Revenue
Vistaprint's reported revenue growth for the year ended June 30, 2017 of 7% was negatively affected by currency impacts of 2%, resulting in constant-currency growth of 9%. The Vistaprint constant-currency growth was due to growth in both repeat customers and new customer bookings. While both new and repeat customer bookings contributed to this revenue growth, we continue to see stronger growth resulting from improved customer satisfaction among repeat customers. Performance continues to be stronger in the North American and Australian markets, with improving results in certain European markets. Revenue from our focus product categories including signage, marketing materials and promotional products and apparel is growing faster than the overall segment. In addition, some of our customer value proposition efforts, including our continued roll-out of shipping price reductions, have created revenue headwinds in certain markets, including France, Germany, the Netherlands, United Kingdom and the United States, but we expect these investments will attract higher-value customers and improve customer loyalty in future periods.
The Vistaprint business reported revenue growth of 6% for the year ended June 30, 2016 was negatively affected by currency impacts of 4%, resulting in constant-currency growth of 10%. The constant-currency revenue growth is due to repeat customer bookings growth, with improving growth in new customer bookings. We experienced strong revenue growth in the same focus product categories discussed above, and performance was stronger in North America and Australia.
Segment Profitability
Vistaprint's adjusted net operating profit decreased for the year ended June 30, 2017 as compared to the prior period, primarily due to the roll-out of planned investments including shipping price reductions, expanded design services and new product introduction that have negatively impacted gross profit. While these investments have reduced our current period profitability, we expect that these investments will attract higher-value customers and improve customer loyalty in future periods. These increases in planned investments were partially offset by operating expense efficiencies and incremental profits from revenue growth.
Adjusted net operating profit increased for the year ended June 30, 2016 as compared to the prior period, primarily due to $35.6 million in additional gross profit as a result of revenue growth, partially offset by an increase in planned advertising spend.
Upload and Print
Year Ended June 30, | |||||||||||||||||
2017 | 2016 | 2015 | 2017 vs. 2016 | 2016 vs. 2015 | |||||||||||||
Reported Revenue | $ | 588,613 | $ | 432,638 | $ | 197,075 | 36 | % | 120 | % | |||||||
Adjusted Net Operating Profit | 63,833 | 58,643 | 23,511 | 9 | % | 149 | % | ||||||||||
% of revenue | 11 | % | 14 | % | 12 | % | |||||||||||
39
Segment Revenue
The reported revenue growth of 36% for the year ended June 30, 2017 was primarily due to the addition of revenue from our fiscal 2016 acquisition of WIRmachenDRUCK. The reported revenue growth was negatively affected by currency impacts during the year ended June 30, 2017 of 3%. The Upload and Print constant-currency revenue growth excluding revenue from businesses acquired in the past twelve months was 13%, primarily driven by continued growth from our Pixartprinting, Printdeal and Exagroup businesses. Our growth in constant currency revenue excluding recent acquisitions has moderated as we passed the acquisition anniversary of some of the slower-growing acquisitions, and we also have seen some moderation in the growth rates of businesses we acquired in prior years.
For the year ended June 30, 2016, our reported revenue growth includes the addition of aggregate revenue of $205.4 million, from the businesses we acquired in fiscal 2016 and fiscal 2015 for quarters with no comparable revenue. The Upload and Print constant-currency revenue growth excluding revenue from businesses acquired in the past twelve months was 27% for the year ended June 30, 2016, due to continued strong performance from our Pixartprinting and Printdeal businesses, which we acquired in fiscal 2014.
Segment Profitability
The increase in adjusted net operating profit for the year ended June 30, 2017 as compared to the prior period is primarily due to our WIRmachenDRUCK business, which we acquired in fiscal 2016 and did not have a full comparable fiscal year, partially offset by a decline in the profitability of our Tradeprint business, as well as continued investments in oversight, technology, and marketing.
Upload and Print adjusted net operating profit increased for the year ended June 30, 2016, as compared to the prior period, primarily as a result of higher adjusted net operating profit of $21.4 million from the businesses we acquired during the fourth quarter of fiscal 2015 and fiscal 2016. In addition, both the Pixartprinting and Printdeal businesses have increased their contribution to adjusted net operating profit due to growth in revenue and improvements in gross margin.
National Pen
Year Ended June 30, | |||||||||||
2017 | 2016 | 2015 | 2017 vs. 2016 | 2016 vs. 2015 | |||||||
Reported Revenue | $ | 112,712 | n/a | n/a | n/a | n/a | |||||
Adjusted Net Operating Loss | (2,225 | ) | n/a | n/a | n/a | n/a | |||||
% of revenue | (2 | )% | n/a | n/a | |||||||
Segment Revenue and Profitability
As we acquired National Pen on December 30, 2016 there are no comparative operating results presented. For the year ended June 30, 2017 reported revenue was $112.7 million and adjusted net operating loss was $2.2 million. As National Pen profitability has traditionally been highly seasonal, we expect the first and second quarters of our fiscal year to be its strongest for both revenue and profitability.
All Other Businesses
Year Ended June 30, | |||||||||||||||||
2017 | 2016 | 2015 | 2017 vs. 2016 | 2016 vs. 2015 | |||||||||||||
Reported Revenue | $ | 128,795 | $ | 138,244 | $ | 147,425 | (7 | )% | (6 | )% | |||||||
Adjusted Net Operating Profit (Loss) | (30,747 | ) | (8,924 | ) | 10,699 | (245 | )% | 183 | % | ||||||||
% of revenue | (24 | )% | (6 | )% | 7 | % | |||||||||||
Segment Revenue
The All Other Businesses revenue decline for the year ended June 30, 2017 was due to the termination of certain partner contracts in both our Corporate Solutions and Albumprinter businesses. These declines were
40
partially offset by growth in Albumprinter's direct to consumer business and Corporate Solutions' new lines of business, as well as growth in our Most of World portfolio which continues to grow off a relatively small base.
Reported revenue was negatively affected by currency impacts during the year ended June 30, 2016 of 8%. The All Other business units constant-currency revenue growth of 2% for the year ended June 30, 2016 was primarily due to strong growth in our Most of World businesses, as well as the direct to consumer portion of our Albumprinter business partially offset by the decline in partner revenue in both our Corporate Solutions and Albumprinter businesses. The Most of World portfolio continued to grow faster than other parts of this segment, but is small relative to the size of the other components.
Segment Profitability
The decline in adjusted net operating profit for the year ended June 30, 2017 as compared to the prior period is primarily due to the reduction in partner related profits of $17.8 million, as well as increased investment in our Corporate Solutions and Most of World businesses, partially offset by growth in our Albumprinter business.
The All Other Businesses adjusted net operating profit decline for the year ended June 30, 2016 as compared to the prior period is due to continued investment in our Most of World portfolio and a decline in partner related profits of $5.7 million.
Liquidity and Capital Resources
Consolidated Statements of Cash Flows Data:
In thousands
Year Ended June 30, | |||||||||||
2017 | 2016 | 2015 | |||||||||
Net cash provided by operating activities | $ | 156,736 | $ | 247,358 | $ | 242,022 | |||||
Net cash used in investing activities | (301,789 | ) | (265,538 | ) | (217,190 | ) | |||||
Net cash provided by (used in) financing activities | 104,578 | (5,338 | ) | 25,166 | |||||||
At June 30, 2017, we had $37.7 million of cash and cash equivalents (inclusive of $12.0 million of cash classified as held for sale) and $882.6 million of outstanding debt, excluding debt issuance costs and debt discounts. The decline in cash and cash equivalent assets during the period, was primarily due to the implementation of a cash pooling program during fiscal 2017 for certain of our European bank accounts. We expect cash and cash equivalents and outstanding debt levels to fluctuate over time depending on our working capital needs, as well as our organic investment, share repurchase and acquisition activity. The cash flows during the year ended June 30, 2017 related primarily to the following items:
Cash inflows:
• | Proceeds of debt of $196.9 million, net of payments |
• | Adjustments for non-cash items of $230.0 million primarily related to positive adjustments for depreciation and amortization of $158.4 million, share-based compensation costs of $48.6 million, the change of our contingent earn-out liability of $39.4 million, unrealized currency-related gains of $10.1 million, impairment of goodwill and acquired intangible assets of $9.6 million offset by negative adjustments for non-cash tax related items of $41.4 million |
• | Proceeds from the sale of available-for-sale securities of $6.3 million |
• | Proceeds from the issuance of ordinary shares from the exercise of share options of $6.2 million |
• | Proceeds from the sale of assets of $4.5 million |
• | Changes in working capital balances of $1.2 million primarily driven by an increase in accounts payable |
41
Cash outflows:
• | Net loss of $72.2 million |
• | Payments for acquisitions, net of cash acquired, of $204.9 million |
• | Capital expenditures of $74.2 million of which $36.0 million were related to the purchase of manufacturing and automation equipment for our production facilities, $12.9 million were related to the purchase of land, facilities and leasehold improvements, and $25.3 million were related to computer and office equipment |
• | Purchases of our ordinary shares of $50.0 million |
• | Internal costs for software and website development that we have capitalized of $37.3 million |
• | Purchase of noncontrolling interests of $20.2 million |
• | Payments for capital lease arrangements of $15.9 million |
• | Payments of withholding taxes in connection with share awards of $14.6 million |
Additional Liquidity and Capital Resources Information. During the year ended June 30, 2017, we financed our operations and strategic investments through internally generated cash flows from operations and debt financing. As of June 30, 2017, a significant portion of our cash and cash equivalents was held by our subsidiaries, and undistributed earnings of our subsidiaries that are considered to be indefinitely reinvested were $27.4 million. We do not intend to repatriate these funds as the cash and cash equivalent balances are generally used and available, without legal restrictions, to fund ordinary business operations and investments of the respective subsidiaries. If there is a change in the future, the repatriation of undistributed earnings from certain subsidiaries, in the form of dividends or otherwise, could have tax consequences that could result in material cash outflows.
Debt. On July 13, 2017, we executed an amendment to our senior secured credit facility that, among other things, expanded the total capacity to $1,045.0 million, which includes $745.0 million of revolving loans and $300.0 million of term loans. We expect to use our expanded credit facility to fund investments intended to support our long-term growth strategy. Refer to Note 10 for additional details.
As of June 30, 2017, we had aggregate loan commitments from our senior secured credit facility totaling $814.0 million. The loan commitments consisted of revolving loans of $690.0 million and the remaining term loans of $124.0 million. We have other financial obligations that constitute additional indebtedness based on the definitions within the credit facility. As of June 30, 2017, the amount available for borrowing under our senior secured credit facility was as follows:
In thousands
June 30, 2017 | |||
Maximum aggregate available for borrowing | $ | 814,000 | |
Outstanding borrowings of senior secured credit facilities | (600,037 | ) | |
Remaining amount | 213,963 | ||
Limitations to borrowing due to debt covenants and other obligations (1) | (2,195 | ) | |
Amount available for borrowing as of June 30, 2017 (2) | $ | 211,768 | |
_________________
(1) Our borrowing ability under our senior secured credit facility can be limited by our debt covenants each quarter. These covenants may limit our borrowing capacity depending on our leverage, other indebtedness, such as notes, capital leases, letters of credit, and any other debt, as well as other factors that are outlined in the credit agreement.
(2) The use of available borrowings for share purchases, dividend payments, or corporate acquisitions is subject to more restrictive covenants that can lower available borrowings for such purposes relative to the general availability described in the above table.
42
Debt Covenants. Our credit agreement contains financial and other covenants, including but not limited to the following:
(1) The credit agreement contains financial covenants calculated on a trailing twelve month, or TTM, basis that:
• | our total leverage ratio, which is the ratio of our consolidated total indebtedness (*) to our TTM consolidated EBITDA (*), will not exceed 4.50 to 1.00. |
• | our senior secured leverage ratio, which is the ratio of our consolidated senior secured indebtedness (*) to our TTM consolidated EBITDA (*), will not exceed 3.25 to 1.00. |
• | our interest coverage ratio, which is the ratio of our consolidated EBITDA to our consolidated interest expense, will be at least 3.00 to 1.00. |
(2) Purchases of our ordinary shares, payments of dividends, and corporate acquisitions and dispositions are subject to more restrictive consolidated leverage ratio thresholds than those listed above when calculated on a proforma basis in certain scenarios. Also, regardless of our leverage ratio, the credit agreement limits the amount of purchases of our ordinary shares, payments of dividends, corporate acquisitions and dispositions, investments in joint ventures or minority interests, and consolidated capital expenditures that we may make. These limitations can include annual limits that vary from year-to-year and aggregate limits over the term of the credit facility. Therefore, our ability to make desired investments may be limited during the term of our senior secured credit facility.
(3) The credit agreement also places limitations on additional indebtedness and liens that we may incur, as well as on certain intercompany activities.
(*) The definitions of EBITDA, consolidated total indebtedness, and consolidated senior secured indebtedness are maintained in our credit agreement included as an exhibit to our Form 8-K filed on February 13, 2013, as amended by amendments no. 1 and no. 2 to the credit agreement included as exhibits to our Forms 8-K filed on January 22, 2014 and September 25, 2014.
The indenture under which our 7.0% senior unsecured notes due 2022 are issued contains various covenants, including covenants that, subject to certain exceptions, limit our and our restricted subsidiaries’ ability to incur and/or guarantee additional debt; pay dividends, repurchase shares or make certain other restricted payments; enter into agreements limiting dividends and certain other restricted payments; prepay, redeem or repurchase subordinated debt; grant liens on assets; enter into sale and leaseback transactions; merge, consolidate or transfer or dispose of substantially all of our consolidated assets; sell, transfer or otherwise dispose of property and assets; and engage in transactions with affiliates.
Our credit agreement and senior unsecured notes indenture also contain customary representations, warranties and events of default. As of June 30, 2017, we were in compliance with all financial and other covenants under the credit agreement and senior unsecured notes indenture.
Other debt. Other debt primarily consists of term loans acquired as part of our fiscal 2015 acquisition of Exagroup SAS. As of June 30, 2017 we had $7.5 million outstanding for other debt payable through September 2024.
Our expectations for fiscal year 2018. We believe that our available cash, cash flows generated from operations, and cash available under our committed debt financing will be sufficient to satisfy our liabilities and planned investments to support our long-term growth strategy for at least the next twelve months. We endeavor to invest large amounts of capital that we believe will generate returns that are above our weighted average cost of capital. We consider any use of cash that we expect to require more than 12 months to return our invested capital to be an allocation of capital. For fiscal 2018 we expect to allocate capital to the following broad categories and consider our capital to be fungible across all of these categories:
• | Organic investments will continue to be made across a wide spectrum of activities. These range from large, discrete, projects that we believe can provide us with materially important competitive capabilities and/or market positions over the longer term to smaller investments intended to maintain or improve our competitive position and support value-creating revenue growth. |
• | Purchases of ordinary shares |
• | Corporate acquisitions and similar investments |
43
• | Reduction of debt |
Contractual Obligations
Contractual obligations at June 30, 2017 are as follows:
In thousands | Payments Due by Period | ||||||||||||||||||
Total | Less than 1 year | 1-3 years | 3-5 years | More than 5 years | |||||||||||||||
Operating leases, net of subleases | $ | 50,143 | $ | 13,344 | $ | 18,339 | $ | 11,948 | $ | 6,512 | |||||||||
Build-to-suit lease | 109,248 | 12,569 | 25,138 | 25,138 | 46,403 | ||||||||||||||
Purchase commitments | 29,697 | 29,697 | — | — | — | ||||||||||||||
Senior unsecured notes and interest payments | 371,250 | 19,250 | 38,500 | 38,500 | 275,000 | ||||||||||||||
Other debt and interest payments | 658,843 | 53,084 | 600,436 | 3,239 | 2,084 | ||||||||||||||
Capital leases | 41,310 | 13,916 | 18,311 | 5,830 | 3,253 | ||||||||||||||
Other | 64,584 | 59,827 | 4,757 | — | — | ||||||||||||||
Total (1) | $ | 1,325,075 | $ | 201,687 | $ | 705,481 | $ | 84,655 | $ | 333,252 | |||||||||
(1) We may be required to make cash outlays related to our uncertain tax positions. However, due to the uncertainty of the timing of future cash flows associated with our uncertain tax positions, we are unable to make reasonably reliable estimates of the period of cash settlement, if any, with the respective taxing authorities. Accordingly, uncertain tax positions of $5.4 million as of June 30, 2017 have been excluded from the contractual obligations table above. For further information on uncertain tax positions, see Note 13 to the accompanying consolidated financial statements.
Operating Leases. We rent office space under operating leases expiring on various dates through 2026. Future minimum rental payments required under our leases are an aggregate of approximately $50.1 million. The terms of certain lease agreements require security deposits in the form of bank guarantees and letters of credit in the amount of $3.8 million.
Build-to-suit lease. Represents the cash payments for our leased facility in Waltham, Massachusetts, USA. Please refer to Note 2 in the accompanying consolidated financial statements for additional details.
Purchase Commitments. At June 30, 2017, we had unrecorded commitments under contract of $29.7 million. Purchase commitments consisted of professional and consulting fees of approximately $5.7 million, commitments for production and computer equipment purchases of approximately $5.5 million, third-party web services of $5.0 million, commitments for advertising campaigns of $2.6 million, inventory purchase commitments of $2.4 million, and other unrecorded purchase commitments of $8.5 million.
Senior unsecured notes and interest payments. Our 7.0% senior unsecured notes due 2022 bear interest at a rate of 7.0% per annum and mature on April 1, 2022. Interest on the notes is payable semi-annually on April 1 and October 1 of each year and has been included in the table above.
Other debt and interest payments. At June 30, 2017, the term loans of $124.0 million outstanding under our credit agreement have repayments due on various dates through September 23, 2019, with the revolving loans outstanding of $476.0 million due on September 23, 2019. Interest payable included in this table is based on the interest rate as of June 30, 2017 and assumes all revolving loan amounts outstanding will not be paid until maturity, but that the term loan amortization payments will be made according to our defined schedule. Interest payable includes the estimated impact of our interest rate swap agreements. On July 13, 2017, we amended our credit agreement to, among other things, expand the total capacity and extend the term of our term loans and revolving loans. Refer to Note 10 for additional information.
In addition, we have term loan debt which consists primarily of debt assumed as part of certain of our fiscal 2015 acquisitions, and as of June 30, 2017 we had $7.5 million outstanding for those obligations that have repayments due on various dates through September 2024.
Capital leases. We lease certain machinery and plant equipment under capital lease agreements that expire at various dates through 2022. The aggregate carrying value of the leased equipment under capital leases
44
included in property, plant and equipment, net in our consolidated balance sheet at June 30, 2017, is $40.8 million, net of accumulated depreciation of $26.6 million. The present value of lease installments not yet due included in other current liabilities and other liabilities in our consolidated balance sheet at June 30, 2017 amounts to $39.9 million.
Other Obligations. Other obligations includes the following:
• | Earn-out liability related to the WIRmachenDRUCK acquisition of $44.0 million, payable at our option in cash or ordinary shares, based on the achievement of a cumulative gross margin target for calendar years 2016 and 2017. |
• | Loan arrangement with two Printi employees, which includes an initial draw on the loans in the amount of $12,000 during the first quarter of fiscal 2018. Refer to Note 15 for additional details. |
• | Deferred payments related to our fiscal 2015 and 2016 acquisitions of $2.1 million, in aggregate. |
• | Installment obligation of $6.5 million related to the fiscal 2012 intra-entity transfer of the intellectual property of our subsidiary Webs, Inc., which resulted in tax being paid over a 7.5 year term and has been classified as a deferred tax liability in our consolidated balance sheet as of June 30, 2017. |
Non-GAAP Financial Measure
Adjusted net operating profit after tax (NOPAT) presented below is a supplemental measure of our performance that is not required by, or presented in accordance with, GAAP. This metric is the primary metric by which we measure our consolidated financial performance and is intended to supplement investors' understanding of our operating results. Adjusted NOPAT is defined as GAAP operating income excluding certain items such as acquisition-related amortization and depreciation, expense recognized for earn-out related charges, including the change in fair value of contingent consideration and compensation expense related to cash-based earn-out mechanisms dependent upon continued employment, share-based compensation related to investment consideration, certain impairment expense and restructuring charges. The interest expense associated with our Waltham lease, as well as realized gains (losses) on currency forward contracts that do not qualify for hedge accounting, are included in adjusted NOPAT.
This non-GAAP financial measure is provided to enhance investors' understanding of our current operating results from the underlying and ongoing business for the same reasons it is used by management. For example, as we have become more acquisitive over recent years we believe excluding the costs related to the purchase of a business (such as amortization of acquired intangible assets, contingent consideration, or impairment of goodwill) provides further insight into the performance of the underlying acquired business in addition to that provided by our GAAP operating income. As another example, as we do not apply hedge accounting for our currency forward contracts, we believe inclusion of realized gains and losses on these contracts that are intended to be matched against operational currency fluctuations provides further insight into our operating performance in addition to that provided by our GAAP operating income. We do not, nor do we suggest that investors should, consider such non-GAAP financial measures in isolation from, or as a substitute for, financial information prepared in accordance with GAAP.
45
The table below sets forth operating income and adjusted net operating profit after tax for each of the years ended June 30, 2017, 2016 and 2015:
Year Ended June 30, | |||||||||||
2017 | 2016 | 2015 | |||||||||
GAAP operating (loss) income | $ | (45,702 | ) | $ | 78,193 | $ | 96,324 | ||||
Less: Cash taxes attributable to current year (see below) | (31,104 | ) | (32,236 | ) | (24,986 | ) | |||||
Exclude expense (benefit) impact of: | |||||||||||
Acquisition-related amortization and depreciation | 46,402 | 40,834 | 24,264 | ||||||||
Earn-out related charges (1) | 40,384 | 6,378 | 15,275 | ||||||||
Share-based compensation related to investment consideration | 9,638 | 4,835 | 3,570 | ||||||||
Certain impairments (2) | 9,556 | 41,820 | — | ||||||||
Restructuring related charges | 26,700 | 381 | 3,202 | ||||||||
Less: Interest expense associated with Waltham lease | (7,727 | ) | (6,287 | ) | — | ||||||
Include: Realized gains on currency derivatives not included in operating income | 16,474 | 5,863 | 7,450 | ||||||||
Adjusted NOPAT (3) | $ | 64,621 | $ | 139,781 | $ | 125,099 | |||||
Cash taxes paid in the current period (4)(5) | $ | 49,342 | $ | 19,750 | $ | 14,284 | |||||
Less: cash taxes paid and related to prior periods (4) | (10,319 | ) | 934 | (5,477 | ) | ||||||
Plus: cash taxes attributable to the current period but not yet (received) paid | (5,650 | ) | 9,298 | 6,667 | |||||||
Plus: cash impact of excess tax benefit on equity awards attributable to current period | 8,003 | 5,574 | 12,932 | ||||||||
Less: cash tax (paid) received related to NOPAT exclusion items | (681 | ) | — | — | |||||||
Less: installment payment related to the transfer of intellectual property | (9,591 | ) | (3,320 | ) | (3,420 | ) | |||||
Cash taxes attributable to current period | $ | 31,104 | $ | 32,236 | $ | 24,986 | |||||
_________________
(1) Includes expense recognized for the change in fair value of contingent consideration and compensation expense related to cash-based earn-out mechanisms dependent upon continued employment.
(2) Includes the impact of certain impairments of goodwill and other long-lived assets as defined by ASC 350 - "Intangibles - Goodwill and Other".
(3) Adjusted NOPAT will include the impact of discontinued operations as defined by ASC 205-20 in periods in which they occur.
(4) For the fiscal year ended June 30, 2016, cash taxes paid in the current period includes a cash tax refund of $8,479, which is subsequently eliminated from cash taxes attributable to the current period as it relates to a refund of a prior years' taxes generated as a result of a prior year excess share-based compensation deduction. Therefore, the impact is not included in adjusted NOPAT for the current period.
(5) Overall cash taxes paid were higher in fiscal year 2017 as compared to fiscal year 2016 due to a.) the aforementioned cash tax refund received in fiscal year 2016, b.) increased prior year tax payments made in fiscal year 2017 primarily related to our Upload and Print businesses, and c.) one-time tax costs associated with National Pen post-acquisition restructuring.
Critical Accounting Policies and Estimates
Our financial statements are prepared in accordance with U.S. generally accepted accounting principles (“GAAP”). To apply these principles, we must make estimates and judgments that affect our reported amounts of assets, liabilities, revenues and expenses, and related disclosure of contingent assets and liabilities. In some instances, we reasonably could have used different accounting estimates and, in other instances, changes in the accounting estimates are reasonably likely to occur from period to period. Accordingly, actual results could differ significantly from our estimates. We base our estimates and judgments on historical experience and other assumptions that we believe to be reasonable at the time under the circumstances, and we evaluate these estimates and judgments on an ongoing basis. We refer to accounting estimates and judgments of this type as critical accounting policies and estimates, which we discuss further below. This section should be read in conjunction with Note 2, "Summary of Significant Accounting Policies," of our audited consolidated financial statements included elsewhere in this Report.
Revenue Recognition. We generate revenue primarily from the sale and shipping of customized manufactured products, as well as providing digital services, website design and hosting, email marketing services, and order referral fees. We recognize revenue arising from sales of products and services, net of discounts and applicable indirect taxes, when it is realized or realizable and earned. We consider revenue realized or realizable and earned when there is persuasive evidence of an arrangement, a product has been shipped or service rendered with no significant post-delivery obligation on our part, the net sales price is fixed or determinable and collection is reasonably assured. For arrangements with multiple deliverables, we allocate revenue to each deliverable based on
46
the relative selling price for each deliverable. We determine the relative selling price using a hierarchy of (1) company specific objective and reliable evidence, then (2) third-party evidence, then (3) best estimate of selling price. Shipping, handling and processing charges billed to customers are included in revenue at the time of shipment or rendering of service. Revenues from sales of prepaid orders on our websites are deferred until shipment of fulfilled orders or until the prepaid service has been rendered.
A reserve for estimated sales returns and allowances is recorded as a reduction of revenue, based on historical experience or specific identification of an event necessitating a reserve. This reserve is dependent upon customer return practices and will vary during the year due to volume or specific reserve requirements. Sales returns have not historically been significant to our net revenue and have been within our estimates.
Share-Based Compensation. We measure share-based compensation costs at fair value, and recognize the expense over the period that the recipient is required to provide service in exchange for the award, which generally is the vesting period. We recognize the impact of forfeitures as they occur.
Starting in fiscal 2017, we primarily issued performance share units, or PSUs, which are estimated at fair value on the date of grant, which is fixed throughout the vesting period. The fair value is determined using a Monte Carlo simulation valuation model. As the PSUs include both a service and market condition the related expense is recognized using the accelerated expense attribution method over the requisite service period for each separately vesting portion of the award. For PSUs that meet the service vesting condition, the expense recognized over the requisite service period will not be reversed if the market condition is not achieved.
Income Taxes. As part of the process of preparing our consolidated financial statements, we calculate our income taxes in each of the jurisdictions in which we operate. This process involves estimating our current tax expense, including assessing the risks associated with tax positions, together with assessing temporary and permanent differences resulting from differing treatment of items for tax and financial reporting purposes. We recognize deferred tax assets and liabilities for the temporary differences using the enacted tax rates and laws that will be in effect when we expect temporary differences to reverse. We assess the ability to realize our deferred tax assets based upon the weight of available evidence both positive and negative. To the extent we believe that it is more likely than not that some portion or all of the deferred tax assets will not be realized, we establish a valuation allowance. Our estimates can vary due to the profitability mix of jurisdictions, foreign exchange movements, changes in tax law, regulations or accounting principles, as well as certain discrete items. In the event that actual results differ from our estimates or we adjust our estimates in the future, we may need to increase or decrease income tax expense, which could have a material impact on our financial position and results of operations.
We establish reserves for tax-related uncertainties based on estimates of whether, and the extent to which, additional taxes will be due. These reserves are established when we believe that certain positions might be challenged despite our belief that our tax return positions are in accordance with applicable tax laws. We adjust these reserves in light of changing facts and circumstances, such as the closing of a tax audit, new tax legislation, or the change of an estimate based on new information. To the extent that the final outcome of these matters is different than the amounts recorded, such differences will affect the provision for income taxes in the period in which such determination is made. Interest and, if applicable, penalties related to unrecognized tax benefits are recorded in the provision for income taxes.
Software and Website Development Costs. We capitalize eligible salaries and payroll-related costs of employees who devote time to the development of our websites and internal-use computer software. Capitalization begins when the preliminary project stage is complete, management with the relevant authority authorizes and commits to the funding of the software project, and it is probable that the project will be completed and the software will be used to perform the function intended. These costs are amortized on a straight-line basis over the estimated useful life of the software, which is three years. Our judgment is required in determining whether a project provides new or additional functionality, the point at which various projects enter the stages at which costs may be capitalized, assessing the ongoing value and impairment of the capitalized costs, and determining the estimated useful lives over which the costs are amortized. Historically we have not had any significant impairments of our capitalized software and website development costs.
Business Combinations. We recognize the tangible and intangible assets acquired and liabilities assumed based on their estimated fair values at the date of acquisition. The fair value of identifiable intangible assets is based on detailed cash flow valuations that use information and assumptions provided by management. The
47
valuations are dependent upon a myriad of factors including historical financial results, estimated customer renewal rates, projected operating costs and discount rates. We estimate the fair value of contingent consideration at the time of the acquisition using all pertinent information known to us at the time to assess the probability of payment of contingent amounts or through the use of a Monte Carlo simulation model. We allocate any excess purchase price over the fair value of the net tangible and intangible assets acquired and liabilities assumed to goodwill. The assumptions used in the valuations for our acquisitions may differ materially from actual results depending on performance of the acquired businesses and other factors. While we believe the assumptions used were appropriate, different assumptions in the valuation of assets acquired and liabilities assumed could have a material impact on the timing and extent of impact on our statements of operations.
Goodwill is assigned to reporting units as of the date of the related acquisition. If goodwill is assigned to more than one reporting unit, we utilize a method that is consistent with the manner in which the amount of goodwill in a business combination is determined. Costs related to the acquisition of a business are expensed as incurred.
Goodwill, Indefinite-Lived Intangible Assets, and Other Definite Lived Long-Lived Assets. We evaluate goodwill and indefinite-lived intangible assets for impairment annually or more frequently when an event occurs or circumstances change that indicate that the carrying value may not be recoverable. We have the option to first assess qualitative factors to determine whether it is more likely than not that the fair value of a reporting unit is less than its carrying amount. We consider the timing of our most recent fair value assessment and associated headroom, the actual operating results as compared to the cash flow forecasts used in those fair value assessments, the current long-term forecasts for each reporting unit, and the general market and economic environment of each reporting unit. In addition to the specific factors mentioned above, we assess the following individual factors on an ongoing basis such as:
• | A significant adverse change in legal factors or the business climate; |
• | An adverse action or assessment by a regulator; |
• | Unanticipated competition; |
• | A loss of key personnel; and |
• | A more-likely-than-not expectation that a reporting unit or a significant portion of a reporting unit will be sold or otherwise disposed of. |
If the results of the qualitative analysis were to indicate that the fair value of a reporting unit is less than its carrying value, the quantitative test is required. Under the quantitative approach, we estimate the fair values of our reporting units using a discounted cash flow methodology. This analysis requires significant judgment and is based on our strategic plans and estimation of future cash flows, which is dependent on internal forecasts. Our annual analysis also requires significant judgment including the identification and aggregation of reporting units, as well as the determination of our discount rate and perpetual growth rate assumptions.
During fiscal 2017, we adopted the new goodwill accounting standard, which changes how we test goodwill for impairment by eliminating step two from the goodwill impairment test. We are now required to compare the fair value of the reporting unit with its carrying value and recognize an impairment charge for the amount by which the carrying amount exceeds the reporting unit's fair value.
We had a change in the composition of our Tradeprint reporting unit during our third quarter of fiscal 2017. This change, when combined with an updated profit outlook that was lower than originally forecasted as of the acquisition date, indicated that it is more likely than not that the fair value of the reporting unit is below the carrying amount. As a result, we performed the required testing which led to our recognition of a full goodwill impairment charge of $6.3 million associated with our Tradeprint reporting unit. Since our third quarter analysis, there have been no indications that additional impairment exists in any of our reporting units as of June 30, 2017.
We also performed a recoverability test of Tradeprint's long-lived assets and recognized an additional impairment charge of $3.3 million, relating to its acquired intangible assets. We are required to evaluate the estimated useful lives and recoverability of definite lived long-lived assets (for example, customer relationships, developed technology, property, and equipment) on an ongoing basis when indicators of impairment are present. For purposes of the recoverability test, long-lived assets are grouped with other assets and liabilities at the lowest
48
level for which identifiable cash flows are largely independent of the cash flows of other assets and liabilities. The test for recoverability compares the undiscounted future cash flows of the long-lived asset group to its carrying value. If the carrying values of the long-lived asset group exceed the undiscounted future cash flows, the assets are considered to be potentially impaired. The next step in the impairment measurement process is to determine the fair value of the individual net assets within the long-lived asset group. If the aggregate fair values of the individual net assets of the group are less than the carrying values, an impairment charge is recorded equal to the excess of the aggregate carrying value of the group over the aggregate fair value. The loss is allocated to each long-lived asset within the group based on their relative carrying values, with no asset reduced below its fair value. The identification and evaluation of a potential impairment requires judgment and is subject to change if events or circumstances pertaining to our business change.
Recently Issued or Adopted Accounting Pronouncements
See Item 8 of Part II, “Financial Statements and Supplementary Data — Note 2 — Summary of Significant Accounting Policies — Recently Issued or Adopted Accounting Pronouncements."
49
Item 7A. Quantitative and Qualitative Disclosures About Market Risk
Interest Rate Risk. Our exposure to interest rate risk relates primarily to our cash, cash equivalents and debt.
As of June 30, 2017, our cash and cash equivalents consisted of standard depository accounts which are held for working capital purposes. We do not believe we have a material exposure to interest rate fluctuations related to our cash and cash equivalents.
As of June 30, 2017, we had $600.0 million of variable rate debt and $6.5 million of variable rate installment obligation related to the fiscal 2012 intra-entity transfer of Webs' intellectual property. As a result, we have exposure to market risk for changes in interest rates related to these obligations. In order to mitigate our exposure to interest rate changes related to our variable rate debt, we execute interest rate swap contracts to fix the interest rate on a portion of our outstanding long-term debt with varying maturities. As of June 30, 2017, a hypothetical 100 basis point increase in rates, inclusive of our outstanding interest rate swaps, would result in an increase of interest expense of approximately $5.4 million over the next 12 months.
Currency Exchange Rate Risk. We conduct business in multiple currencies through our worldwide operations but report our financial results in U.S. dollars. We manage these risks through normal operating activities and, when deemed appropriate, through the use of derivative financial instruments. We have policies governing the use of derivative instruments and do not enter into financial instruments for trading or speculative purposes. The use of derivatives is intended to reduce, but does not entirely eliminate, the impact of adverse currency exchange rate movements. A summary of our currency risk is as follows:
• | Translation of our non-U.S. dollar revenues and expenses: Revenue and related expenses generated in currencies other than the U.S. dollar could result in higher or lower net (loss) income when, upon consolidation, those transactions are translated to U.S. dollars. When the value or timing of revenue and expenses in a given currency are materially different, we may be exposed to significant impacts on our net (loss) income and non-GAAP financial metrics, such as EBITDA. |
Our currency hedging objectives are targeted at reducing volatility in our forecasted U.S. dollar-equivalent EBITDA in order to protect our debt covenants. Since EBITDA excludes non-cash items such as depreciation and amortization that are included in net (loss) income, we may experience increased, not decreased, volatility in our GAAP results due to our hedging approach. Our most significant net currency exposures by volume are in the Euro and British Pound.
In addition, we elect to execute currency derivatives contracts that do not qualify for hedge accounting. As a result, we may experience volatility in our consolidated statements of operations due to (i) the impact of unrealized gains and losses reported in other income, net on the mark-to-market of outstanding contracts and (ii) realized gains and losses recognized in other income, net, whereas the offsetting economic gains and losses are reported in the line item of the underlying cash flow, for example, revenue.
• | Translation of our non-U.S. dollar assets and liabilities: Each of our subsidiaries translates its assets and liabilities to U.S. dollars at current rates of exchange in effect at the balance sheet date. The resulting gains and losses from translation are included as a component of accumulated other comprehensive (loss) income on the consolidated balance sheet. Fluctuations in exchange rates can materially impact the carrying value of our assets and liabilities. |
We have currency exposure arising from our net investments in foreign operations. We enter into cross-currency swap contracts to mitigate the impact of currency rate changes on certain net investments.
• | Remeasurement of monetary assets and liabilities: Transaction gains and losses generated from remeasurement of monetary assets and liabilities denominated in currencies other than the functional currency of a subsidiary are included in other income, net on the consolidated statements of operations. Certain of our subsidiaries hold intercompany loans denominated in a currency other than their functional currency. Due to the significance of these balances, the revaluation of intercompany loans can have a material impact on other income, net. We expect these impacts may be volatile in the future, although our largest intercompany loans do not have a U.S. dollar cash impact for the consolidated group because they are either 1) U.S. dollar loans or 2) we elect to hedge certain non-U.S. dollar loans with cross currency |
50
swaps. A hypothetical 10% change in currency exchange rates was applied to total net monetary assets denominated in currencies other than the functional currencies at the balance sheet dates to compute the impact these changes would have had on our income before taxes in the near term. The balances are inclusive of the notional value of any cross currency swaps designated as cash flow hedges. A hypothetical decrease in exchange rates of 10% against the functional currency of our subsidiaries would have resulted in an increase of $61.3 million, $21.3 million, and $18.8 million on our income before taxes for the years ended June 30, 2017, 2016 and 2015, respectively.
51
Item 8. Financial Statements and Supplementary Data
CIMPRESS N.V.
INDEX TO CONSOLIDATED FINANCIAL STATEMENTS
Report of Independent Registered Public Accounting Firm | ||
Consolidated Balance Sheets | ||
Consolidated Statements of Operations | ||
Consolidated Statements of Comprehensive (Loss) Income | ||
Consolidated Statements of Shareholders’ Equity | ||
Consolidated Statements of Cash Flows | ||
Notes to Consolidated Financial Statements | ||
52
REPORT OF INDEPENDENT REGISTERED PUBLIC ACCOUNTING FIRM
To the Supervisory Board and Shareholders of Cimpress N.V.
In our opinion, the accompanying consolidated balance sheets and the related consolidated statements of operations, comprehensive (loss) income, shareholders’ equity and cash flows present fairly, in all material respects, the financial position of Cimpress N.V. and its subsidiaries as of June 30, 2017 and June 30, 2016, and the results of their operations and their cash flows for each of the three years in the period ended June 30, 2017 in conformity with accounting principles generally accepted in the United States of America. Also in our opinion, the Company maintained, in all material respects, effective internal control over financial reporting as of June 30, 2017 based on criteria established in Internal Control - Integrated Framework (2013) issued by the Committee of Sponsoring Organizations of the Treadway Commission (COSO). The Company's management is responsible for these financial statements, for maintaining effective internal control over financial reporting and for its assessment of the effectiveness of internal control over financial reporting, included in Management's Report on Internal Control over Financial Reporting appearing under Item 9A. Our responsibility is to express opinions on these financial statements and on the Company's internal control over financial reporting based on our integrated audits. We conducted our audits in accordance with the standards of the Public Company Accounting Oversight Board (United States). Those standards require that we plan and perform the audits to obtain reasonable assurance about whether the financial statements are free of material misstatement and whether effective internal control over financial reporting was maintained in all material respects. Our audits of the financial statements included examining, on a test basis, evidence supporting the amounts and disclosures in the financial statements, assessing the accounting principles used and significant estimates made by management, and evaluating the overall financial statement presentation. Our audit of internal control over financial reporting included obtaining an understanding of internal control over financial reporting, assessing the risk that a material weakness exists, and testing and evaluating the design and operating effectiveness of internal control based on the assessed risk. Our audits also included performing such other procedures as we considered necessary in the circumstances. We believe that our audits provide a reasonable basis for our opinions.
A company’s internal control over financial reporting is a process designed to provide reasonable assurance regarding the reliability of financial reporting and the preparation of financial statements for external purposes in accordance with generally accepted accounting principles. A company’s internal control over financial reporting includes those policies and procedures that (i) pertain to the maintenance of records that, in reasonable detail, accurately and fairly reflect the transactions and dispositions of the assets of the company; (ii) provide reasonable assurance that transactions are recorded as necessary to permit preparation of financial statements in accordance with generally accepted accounting principles, and that receipts and expenditures of the company are being made only in accordance with authorizations of management and directors of the company; and (iii) provide reasonable assurance regarding prevention or timely detection of unauthorized acquisition, use, or disposition of the company’s assets that could have a material effect on the financial statements.
Because of its inherent limitations, internal control over financial reporting may not prevent or detect misstatements. Also, projections of any evaluation of effectiveness to future periods are subject to the risk that controls may become inadequate because of changes in conditions, or that the degree of compliance with the policies or procedures may deteriorate.
As described in Management’s Report on Internal Control over Financial Reporting appearing under Item 9A, management has excluded National Pen from its assessment of internal control over financial reporting as of June 30, 2017, because it was acquired by the Company in a purchase business combination during fiscal 2017. We have also excluded National Pen from our audit of internal control over financial reporting. National Pen is a wholly-owned subsidiary whose total assets and total revenues excluded from management’s assessment and our audit of internal control over financial reporting represent $91.3 million and $112.7 million, respectively, of the related consolidated financial statement amounts as of and for the year ended June 30, 2017.
/s/ PricewaterhouseCoopers LLP
Boston, Massachusetts
August 11, 2017
53
CIMPRESS N.V.
CONSOLIDATED BALANCE SHEETS
(in thousands, except share and per share data)
June 30, 2017 | June 30, 2016 | ||||||
Assets | |||||||
Current assets: | |||||||
Cash and cash equivalents | $ | 25,697 | $ | 77,426 | |||
Marketable securities | — | 7,893 | |||||
Accounts receivable, net of allowances of $3,590 and $490, respectively | 48,630 | 32,327 | |||||
Inventory | 46,563 | 18,125 | |||||
Prepaid expenses and other current assets | 78,835 | 64,997 | |||||
Assets held for sale | 46,276 | — | |||||
Total current assets | 246,001 | 200,768 | |||||
Property, plant and equipment, net | 511,947 | 493,163 | |||||
Software and web site development costs, net | 48,470 | 35,212 | |||||
Deferred tax assets | 48,004 | 26,093 | |||||
Goodwill | 514,963 | 466,005 | |||||
Intangible assets, net | 275,924 | 216,970 | |||||
Other assets | 34,560 | 25,658 | |||||
Total assets | $ | 1,679,869 | $ | 1,463,869 | |||
Liabilities, noncontrolling interests and shareholders’ equity | |||||||
Current liabilities: | |||||||
Accounts payable | $ | 127,386 | $ | 86,682 | |||
Accrued expenses | 175,567 | 178,987 | |||||
Deferred revenue | 30,372 | 25,842 | |||||
Short-term debt | 28,926 | 21,717 | |||||
Other current liabilities | 78,435 | 22,635 | |||||
Liabilities held for sale | 8,797 | — | |||||
Total current liabilities | 449,483 | 335,863 | |||||
Deferred tax liabilities | 60,743 | 69,430 | |||||
Lease financing obligation | 106,606 | 110,232 | |||||
Long-term debt | 847,730 | 656,794 | |||||
Other liabilities | 94,683 | 60,173 | |||||
Total liabilities | 1,559,245 | 1,232,492 | |||||
Commitments and contingencies (Note 17) | |||||||
Redeemable noncontrolling interests | 45,412 | 65,301 | |||||
Shareholders’ equity: | |||||||
Preferred shares, par value €0.01 per share, 100,000,000 shares authorized; none issued and outstanding | — | — | |||||
Ordinary shares, par value €0.01 per share, 100,000,000 shares authorized; 44,080,627 shares issued; and 31,415,503 and 31,536,732 shares outstanding, respectively | 615 | 615 | |||||
Treasury shares, at cost,12,665,124 and 12,543,895 shares, respectively | (588,365 | ) | (548,549 | ) | |||
Additional paid-in capital | 361,376 | 335,192 | |||||
Retained earnings | 414,771 | 486,482 | |||||
Accumulated other comprehensive loss | (113,398 | ) | (108,015 | ) | |||
Total shareholders’ equity attributable to Cimpress N.V. | 74,999 | 165,725 | |||||
Noncontrolling interests (Note 14) | 213 | 351 | |||||
Total shareholders' equity | 75,212 | 166,076 | |||||
Total liabilities, noncontrolling interests and shareholders’ equity | $ | 1,679,869 | $ | 1,463,869 | |||
See accompanying notes.
54
CIMPRESS N.V.
CONSOLIDATED STATEMENTS OF OPERATIONS
(in thousands, except share and per share data)
Year Ended June 30, | |||||||||||
2017 | 2016 | 2015 | |||||||||
Revenue | $ | 2,135,405 | $ | 1,788,044 | $ | 1,494,206 | |||||
Cost of revenue (1) | 1,036,975 | 773,640 | 568,572 | ||||||||
Technology and development expense (1) | 243,230 | 210,080 | 186,770 | ||||||||
Marketing and selling expense (1) | 610,932 | 508,502 | 472,079 | ||||||||
General and administrative expense (1) | 207,569 | 145,844 | 142,996 | ||||||||
Amortization of acquired intangible assets | 46,145 | 40,563 | 24,263 | ||||||||
Restructuring expense (1) | 26,700 | 381 | 3,202 | ||||||||
Impairment of goodwill and acquired intangible assets | 9,556 | 30,841 | — | ||||||||
(Loss) income from operations | (45,702 | ) | 78,193 | 96,324 | |||||||
Other income, net | 10,362 | 26,098 | 20,134 | ||||||||
Interest expense, net | (43,977 | ) | (38,196 | ) | (16,705 | ) | |||||
(Loss) income before income taxes | (79,317 | ) | 66,095 | 99,753 | |||||||
Income tax (benefit) provision | (7,118 | ) | 15,684 | 10,441 | |||||||
Net (loss) income | (72,199 | ) | 50,411 | 89,312 | |||||||
Add: Net loss attributable to noncontrolling interest | 488 | 3,938 | 2,900 | ||||||||
Net (loss) income attributable to Cimpress N.V. | $ | (71,711 | ) | $ | 54,349 | $ | 92,212 | ||||
Basic net (loss) income per share attributable to Cimpress N.V. | $ | (2.29 | ) | $ | 1.72 | $ | 2.82 | ||||
Diluted net (loss) income per share attributable to Cimpress N.V. | $ | (2.29 | ) | $ | 1.64 | $ | 2.73 | ||||
Weighted average shares outstanding — basic | 31,291,581 | 31,656,234 | 32,644,870 | ||||||||
Weighted average shares outstanding — diluted | 31,291,581 | 33,049,454 | 33,816,498 | ||||||||
____________________________________________
(1) Share-based compensation is allocated as follows:
Year Ended June 30, | |||||||||||
2017 | 2016 | 2015 | |||||||||
Cost of revenue | $ | 289 | $ | 72 | $ | 78 | |||||
Technology and development expense | 8,724 | 5,892 | 4,139 | ||||||||
Marketing and selling expense | 4,857 | 1,591 | 1,952 | ||||||||
General and administrative expense | 28,500 | 16,273 | 17,906 | ||||||||
Restructuring expense | 6,257 | — | — | ||||||||
See accompanying notes.
55
CIMPRESS N.V.
CONSOLIDATED STATEMENTS OF COMPREHENSIVE (LOSS) INCOME
(in thousands)
Year Ended June 30, | |||||||||||
2017 | 2016 | 2015 | |||||||||
Net (loss) income | $ | (72,199 | ) | $ | 50,411 | $ | 89,312 | ||||
Other comprehensive (loss) income, net of tax: | |||||||||||
Foreign currency translation losses, net of hedges | (4,681 | ) | (7,537 | ) | (93,627 | ) | |||||
Net unrealized losses on derivative instruments designated and qualifying as cash flow hedges | (1,297 | ) | (2,504 | ) | (1,417 | ) | |||||
Amounts reclassified from accumulated other comprehensive loss to net (loss) income on derivative instruments | 1,369 | 1,587 | 815 | ||||||||
Unrealized (loss) gain on available-for-sale-securities | (5,756 | ) | 517 | (6,275 | ) | ||||||
Amounts reclassified from accumulated other comprehensive loss to net (loss) income for realized gains on available-for-sale securities | 2,268 | — | — | ||||||||
Gain on pension benefit obligation, net | 2,194 | 561 | (388 | ) | |||||||
Comprehensive (loss) income | (78,102 | ) | 43,035 | (11,580 | ) | ||||||
Add: Comprehensive loss attributable to noncontrolling interests | 1,008 | 2,208 | 2,770 | ||||||||
Total comprehensive (loss) income attributable to Cimpress N.V. | $ | (77,094 | ) | $ | 45,243 | $ | (8,810 | ) | |||
See accompanying notes.
56
CIMPRESS N.V.
CONSOLIDATED STATEMENTS OF SHAREHOLDERS' EQUITY
(in thousands)
Ordinary Shares | Treasury Shares | ||||||||||||||||||||||||||||
Number of Shares Issued | Amount | Number of Shares | Amount | Additional Paid-in Capital | Retained Earnings | Accumulated Other Comprehensive Income (Loss) | Total Shareholders’ Equity | ||||||||||||||||||||||
Balance at June 30, 2014 | 44,080 | $ | 615 | (11,751 | ) | $ | (423,101 | ) | $ | 309,990 | $ | 342,840 | $ | 2,113 | $ | 232,457 | |||||||||||||
Issuance of ordinary shares due to share option exercises, net of shares withheld for taxes | 672 | 6,689 | (16,468 | ) | (9,779 | ) | |||||||||||||||||||||||
Restricted share units vested, net of shares withheld for taxes | 201 | 4,280 | (10,728 | ) | (6,448 | ) | |||||||||||||||||||||||
Excess tax benefits from share-based compensation | 20,763 | 20,763 | |||||||||||||||||||||||||||
Share-based compensation expense | 20,724 | 20,724 | |||||||||||||||||||||||||||
Net income attributable to Cimpress N.V. | 92,212 | 92,212 | |||||||||||||||||||||||||||
Net unrealized loss on derivative instruments designated and qualifying as cash flow hedges | (602 | ) | (602 | ) | |||||||||||||||||||||||||
Unrealized gain on marketable securities | (6,275 | ) | (6,275 | ) | |||||||||||||||||||||||||
Foreign currency translation, net of hedges | (93,757 | ) | (93,757 | ) | |||||||||||||||||||||||||
Unrealized loss on pension benefit obligation, net of tax | (388 | ) | (388 | ) | |||||||||||||||||||||||||
Balance at June 30, 2015 | 44,080 | $ | 615 | (10,878 | ) | $ | (412,132 | ) | $ | 324,281 | $ | 435,052 | $ | (98,909 | ) | $ | 248,907 | ||||||||||||
Cumulative effect adjustment related to adoption of share-based compensation standard (ASU 2016-09) | 546 | 2,000 | 2,546 | ||||||||||||||||||||||||||
Issuance of ordinary shares due to share option exercises, net of shares withheld for taxes | 120 | 5,199 | (493 | ) | 4,706 | ||||||||||||||||||||||||
Issuance of ordinary shares in conjunction with WIRmachenDRUCK acquisition | 112 | 4,900 | 3,910 | 8,810 | |||||||||||||||||||||||||
Restricted share units vested, net of shares withheld for taxes | 180 | 3,857 | (11,326 | ) | (7,469 | ) | |||||||||||||||||||||||
Grant of restricted share awards | 82 | 3,094 | (3,094 | ) | — | ||||||||||||||||||||||||
Share-based compensation expense | 21,368 | 21,368 | |||||||||||||||||||||||||||
Purchase of ordinary shares | (2,160 | ) | (153,467 | ) | (153,467 | ) | |||||||||||||||||||||||
Redeemable noncontrolling interest accretion to redemption value | (4,919 | ) | (4,919 | ) | |||||||||||||||||||||||||
Net income attributable to Cimpress N.V. | 54,349 | 54,349 | |||||||||||||||||||||||||||
Net unrealized loss on derivative instruments designated and qualifying as cash flow hedges | (917 | ) | (917 | ) | |||||||||||||||||||||||||
Unrealized gain on marketable securities | 517 | 517 | |||||||||||||||||||||||||||
Foreign currency translation, net of hedges | (9,267 | ) | (9,267 | ) | |||||||||||||||||||||||||
Unrealized gain on pension benefit obligation, net of tax | 561 | 561 | |||||||||||||||||||||||||||
Balance at June 30, 2016 | 44,080 | $ | 615 | (12,544 | ) | $ | (548,549 | ) | $ | 335,192 | $ | 486,482 | $ | (108,015 | ) | $ | 165,725 | ||||||||||||
Issuance of ordinary shares due to share option exercises, net of shares withheld for taxes | 319 | 6,949 | (3,455 | ) | 3,494 | ||||||||||||||||||||||||
Restricted share units vested, net of shares withheld for taxes | 154 | 3,243 | (10,576 | ) | (7,333 | ) | |||||||||||||||||||||||
Share-based compensation expense | 43,504 | 43,504 | |||||||||||||||||||||||||||
Purchase of ordinary shares | (594 | ) | (50,008 | ) | (50,008 | ) | |||||||||||||||||||||||
Net loss attributable to Cimpress N.V. | (71,711 | ) | (71,711 | ) | |||||||||||||||||||||||||
Redeemable noncontrolling interest accretion to redemption value | 68 | 68 | |||||||||||||||||||||||||||
57
CIMPRESS N.V.
CONSOLIDATED STATEMENTS OF SHAREHOLDERS' EQUITY (CONTINUED)
(in thousands)
Reclassification of mandatorily redeemable noncontrolling interest | (3,357 | ) | (3,357 | ) | |||||||||||||||||||||||||
Net unrealized gain on derivative instruments designated and qualifying as cash flow hedges | 72 | 72 | |||||||||||||||||||||||||||
Unrealized loss on marketable securities | (5,756 | ) | (5,756 | ) | |||||||||||||||||||||||||
Realized gain on sale of marketable securities | 2,268 | 2,268 | |||||||||||||||||||||||||||
Foreign currency translation, net of hedges | (4,161 | ) | (4,161 | ) | |||||||||||||||||||||||||
Unrealized gain on pension benefit obligation, net of tax | 2,194 | 2,194 | |||||||||||||||||||||||||||
Balance at June 30, 2017 | 44,080 | $ | 615 | (12,665 | ) | $ | (588,365 | ) | $ | 361,376 | $ | 414,771 | $ | (113,398 | ) | $ | 74,999 | ||||||||||||
58
CIMPRESS N.V.
CONSOLIDATED STATEMENTS OF CASH FLOWS
(in thousands)
Year Ended June 30, | |||||||||||
2017 | 2016 | 2015 | |||||||||
Operating activities | |||||||||||
Net (loss) income | $ | (72,199 | ) | $ | 50,411 | $ | 89,312 | ||||
Adjustments to reconcile net (loss) income to net cash provided by operating activities: | |||||||||||
Depreciation and amortization | 158,400 | 131,918 | 97,500 | ||||||||
Impairment of goodwill and acquired intangible assets | 9,556 | 30,841 | — | ||||||||
Share-based compensation expense | 48,627 | 23,772 | 24,075 | ||||||||
Deferred taxes | (41,358 | ) | (15,922 | ) | (14,940 | ) | |||||
Abandonment of long-lived assets | 2,408 | 10,979 | — | ||||||||
Change in contingent earn-out liability | 39,377 | — | 14,890 | ||||||||
Gain on sale of available-for-sale securities | (2,268 | ) | — | — | |||||||
Unrealized loss (gain) on derivatives not designated as hedging instruments included in net (loss) income | 15,813 | (8,163 | ) | (1,868 | ) | ||||||
Payments of contingent consideration in excess of acquisition date fair value | — | (8,613 | ) | (8,055 | ) | ||||||
Effect of exchange rate changes on monetary assets and liabilities denominated in non-functional currency | (5,690 | ) | (9,199 | ) | (6,455 | ) | |||||
Other non-cash items | 2,886 | 5,784 | 4,130 | ||||||||
Gain on proceeds from insurance | — | (3,136 | ) | — | |||||||
Changes in operating assets and liabilities: | |||||||||||
Accounts receivable | 4,701 | 6,766 | 2,057 | ||||||||
Inventory | (8,699 | ) | (11 | ) | (4,491 | ) | |||||
Prepaid expenses and other assets | 521 | (7,668 | ) | 8,597 | |||||||
Accounts payable | 25,332 | 25,670 | (4,026 | ) | |||||||
Accrued expenses and other liabilities | (20,671 | ) | 13,929 | 41,296 | |||||||
Net cash provided by operating activities | 156,736 | 247,358 | 242,022 | ||||||||
Investing activities | |||||||||||
Purchases of property, plant and equipment | (74,157 | ) | (80,435 | ) | (75,813 | ) | |||||
Business acquisitions, net of cash acquired | (204,875 | ) | (164,412 | ) | (123,804 | ) | |||||
Purchases of intangible assets | (197 | ) | (476 | ) | (250 | ) | |||||
Capitalization of software and website development costs | (37,307 | ) | (26,324 | ) | (17,323 | ) | |||||
Proceeds from sale of available-for-sale securities | 6,346 | — | — | ||||||||
Proceeds from the sale of assets | 4,513 | — | — | ||||||||
Proceeds from insurance related to investing activities | — | 3,624 | — | ||||||||
Other investing activities | 3,888 | 2,485 | — | ||||||||
Net cash used in investing activities | (301,789 | ) | (265,538 | ) | (217,190 | ) | |||||
Financing activities | |||||||||||
Proceeds from borrowings of debt | 737,075 | 598,008 | 367,500 | ||||||||
Proceeds from issuance of senior notes | — | — | 275,000 | ||||||||
Payments of debt and debt issuance costs | (540,142 | ) | (430,692 | ) | (588,293 | ) | |||||
Payments of purchase consideration included in acquisition-date fair value | (539 | ) | (7,330 | ) | (11,105 | ) | |||||
Payments of withholding taxes in connection with equity awards | (14,568 | ) | (7,467 | ) | (29,351 | ) | |||||
Payments of capital lease obligations | (15,887 | ) | (13,933 | ) | (5,750 | ) | |||||
See accompanying notes.
59
CIMPRESS N.V.
CONSOLIDATED STATEMENTS OF CASH FLOWS (CONTINUED)
(in thousands)
Year Ended June 30, | ||||||||||
2017 | 2016 | 2015 | ||||||||
Financing activities (continued) | ||||||||||
Purchase of ordinary shares | (50,008 | ) | (153,467 | ) | — | |||||
Purchase of noncontrolling interests | (20,230 | ) | — | — | ||||||
Proceeds from issuance of ordinary shares | 6,192 | 4,705 | 13,123 | |||||||
Capital contribution from noncontrolling interest | 1,404 | 5,141 | 4,160 | |||||||
Other financing activities | 1,281 | (303 | ) | (118 | ) | |||||
Net cash provided by (used in) financing activities | 104,578 | (5,338 | ) | 25,166 | ||||||
Effect of exchange rate changes on cash | 788 | (2,640 | ) | (8,922 | ) | |||||
Increase in cash held for sale | 12,042 | — | — | |||||||
Net decrease in cash and cash equivalents | (51,729 | ) | (26,158 | ) | 41,076 | |||||
Cash and cash equivalents at beginning of period | 77,426 | 103,584 | 62,508 | |||||||
Cash and cash equivalents at end of period | $ | 25,697 | $ | 77,426 | 103,584 | |||||
Supplemental disclosures of cash flow information: | |||||||||||
Cash paid during the period for: | |||||||||||
Interest | $ | 45,275 | $ | 37,623 | $ | 8,520 | |||||
Income taxes | 49,342 | 19,750 | 14,284 | ||||||||
Non-cash investing and financing activities: | |||||||||||
Capitalization of construction costs related to financing lease obligation | $ | — | $ | 19,264 | $ | 86,198 | |||||
Property and equipment acquired under capital leases | 14,422 | 7,535 | 13,194 | ||||||||
Amounts accrued related to business acquisitions | 46,124 | 5,868 | 20,122 | ||||||||
See accompanying notes.
60
CIMPRESS N.V.
NOTES TO CONSOLIDATED FINANCIAL STATEMENTS
Years Ended June 30, 2017, 2016 and 2015
(in thousands, except share and per share data)
1. Description of the Business
We are a technology driven company that aggregates, largely via the internet, large volumes of small, individually customized orders for a broad spectrum of print, signage, apparel and similar products. We operate in a largely decentralized manner. Our businesses, discussed in more detail below, fulfill orders with manufacturing capabilities that include Cimpress owned and operated manufacturing facilities and a network of third-party fulfillers to create customized products on-demand. Those businesses bring their products to market through a portfolio of customer-focused brands serving the needs of micro, small and medium sized businesses, resellers and consumers. These brands include Vistaprint, our global brand for micro business marketing products and services, as well as brands that we have acquired that serve the needs of various market segments, including resellers, micro, small and medium sized businesses with differentiated service needs, and consumers purchasing products for themselves and their families.
2. Summary of Significant Accounting Policies
Basis of Presentation
The consolidated financial statements include the accounts of Cimpress N.V., its wholly owned subsidiaries, entities in which we maintain a controlling financial interest, and those entities in which we have a variable interest and are the primary beneficiary. Intercompany balances and transactions have been eliminated. Investments in entities in which we can exercise significant influence, but do not own a majority equity interest or otherwise control, are accounted for using the equity method and are included as investments in equity interests on the consolidated balance sheets.
Changes in Presentation of Financial Statements
During fiscal 2017 we changed the presentation of amortization expense for acquired intangible assets. The expense was previously classified within each of the respective expense lines of our consolidated statement of operations and now is presented as a separate financial statement line item, "Amortization of acquired intangible assets." Prior period results have been recast to reflect this change.
In addition, given the significance of our current fiscal year restructuring charges we are presenting these expenses as a separate financial statement line item, "Restructuring expense", in our consolidated statement of operations. Restructuring expense includes costs associated with restructuring initiatives, including one-time and contractual termination benefits, share-based compensation, consulting or legal fees directly related to the restructuring initiative, costs associated with facility-related exit activities, and other related charges. Prior period results have been recast to reflect this change.
Assets and Liabilities Held for Sale
We classify assets and liabilities (disposal groups) to be sold as held for sale in the period in which all of the following criteria are met: management, having the authority to approve the action, commits to a plan to sell the disposal group; the disposal group is being actively marketed for sale at a price that is reasonable in relation to the current fair value; the disposal group is available for immediate sale in its present condition subject only to terms that are usual and customary for sales of such disposal groups; an active program to locate a buyer and other actions required to complete the plan to sell the disposal group have been initiated; the sale of the disposal group is probable, and the sale is expected to be complete within one year. We measure a disposal group that is classified as held for sale at the lower of its carrying value or fair value less any costs to sell. Any loss resulting from this measurement is recognized in the period in which the held for sale criteria are met.
During the fourth quarter of fiscal 2017, we met the held-for-sale criteria for our planned sale of our Albumprinter business, which is part of our All Other Businesses reportable segment. As of June 30, 2017, we have presented the Albumprinter disposal group as held for sale, resulting in the classification of all related assets and liabilities as held for sale in our consolidated balance sheet as follows:
61
June 30, 2017 | |||
Cash and cash equivalents | $ | 12,042 | |
Accounts receivable, net | 783 | ||
Inventory | 498 | ||
Prepaid and other current assets | 1,759 | ||
Software and web site development costs, net | 2,702 | ||
Property, plant and equipment, net | 9,735 | ||
Goodwill | 13,540 | ||
Intangible assets, net | 4,632 | ||
Other non-current assets | 585 | ||
Total assets held for sale | $ | 46,276 | |
Accounts payable | $ | 3,052 | |
Accrued expenses | 4,480 | ||
Deferred revenue | 562 | ||
Deferred tax liabilities | 703 | ||
Total liabilities held for sale | $ | 8,797 | |
On July 21, 2017 we entered into a definitive agreement to sell our Albumprinter business and we expect cash proceeds of approximately €92,000 prior to any fees and pre-closing dividends, subject to customary closing conditions. We expect the sale to be completed during the first quarter of fiscal 2018. For the year ended June 30, 2017, we did not recognize an adjustment when measuring the assets and liabilities at the lower of it carrying value or fair value.
Use of Estimates
The preparation of financial statements in conformity with GAAP requires management to make estimates and assumptions that affect the amounts reported in the consolidated financial statements and accompanying notes. We believe our most significant estimates are associated with the ongoing evaluation of the recoverability of our long-lived assets and goodwill, estimated useful lives of assets, share-based compensation, accounting for business combinations, and income taxes and related valuation allowances, among others. By their nature, estimates are subject to an inherent degree of uncertainty. Actual results could differ from those estimates.
Cash and Cash Equivalents
We consider all highly liquid investments purchased with an original maturity of three months or less to be the equivalent of cash for the purpose of balance sheet and statement of cash flows presentation. Cash equivalents consist of depository accounts and money market funds. Cash and cash equivalents restricted for use were $520 and $409 as of June 30, 2017 and 2016, respectively, and are included in other assets in the accompanying consolidated balance sheets.
Marketable Securities
We determine the appropriate classification of marketable securities at the date of purchase and reevaluate the classification at each balance sheet date. Our marketable securities are classified as "available-for-sale" and carried at fair value, with the unrealized gains and losses, net of taxes if applicable, reported as a separate component of accumulated other comprehensive (loss) income. On December 22, 2016, we sold all of our Plaza Create Co. Ltd. common shares, which were classified as held for sale. We recognized a net gain of $2,268 as part of other income, net on our statement of operations for the year ended June 30, 2017. We did not sell marketable securities during the years ended June 30, 2016 or 2015.
62
Accounts Receivable
Accounts receivable includes amounts due from customers. We offset gross trade accounts receivable with an allowance for doubtful accounts, which is our best estimate of the amount of probable credit losses in existing accounts receivable. Account balances are charged off against the allowance when the potential for recovery is no longer reasonably assured.
Inventories
Inventories consist primarily of raw materials and are recorded at the lower of cost or net realizable value using the first-in, first-out method. Costs to produce free products are included in cost of revenues as incurred.
Property, Plant and Equipment
Property, plant and equipment are stated at cost less accumulated depreciation and amortization. Additions and improvements that substantially extend the useful life of a particular asset are capitalized while repairs and maintenance costs are expensed as incurred. Assets that qualify for the capitalization of interest cost during their construction period are evaluated on a per project basis and, if material, the costs are capitalized. No interest costs associated with our construction projects were capitalized in fiscal 2017 or 2016 as the amounts were not material. Depreciation of plant and equipment is recorded on a straight-line basis over the estimated useful lives of the assets.
Software and Web Site Development Costs
We capitalize eligible salaries and payroll-related costs of employees who devote time to the development of websites and internal-use computer software. Capitalization begins when the preliminary project stage is complete, management with the relevant authority authorizes and commits to the funding of the software project, and it is probable that the project will be completed and the software will be used to perform the function intended. These costs are amortized on a straight-line basis over the estimated useful life of the software. Costs associated with preliminary stage software development, repair, maintenance or the development of website content are expensed as incurred.
Amortization of previously capitalized amounts in the years ended June 30, 2017, 2016 and 2015 was $24,571, $14,355 and $8,666, respectively, resulting in accumulated amortization of $59,554 and $34,737 at June 30, 2017 and 2016, respectively.
Leases
We categorize leases at their inception as either operating or capital leases. Costs for operating leases that include incentives such as payment escalations or rent abatements are recognized on a straight-line basis over the term of the lease. Additionally, inducements received are treated as a reduction of our costs over the term of the agreement. Leasehold improvements are capitalized at cost and amortized over the shorter of their expected useful life or the life of the lease, excluding renewal periods.
Capital leases are accounted for as an acquisition of an asset and incurrence of an obligation. Assets held under capital leases are recorded at the lower of the present value of the minimum lease payments or the fair value of the leased asset at the inception of the lease, and amortized over the useful life of the asset. The corresponding capital lease obligation is recorded at the present value of the minimum lease payments at inception of the lease.
For lease arrangements where we are deemed to be involved in the construction of structural improvements prior to the commencement of the lease or take some level of construction risk, we are considered the owner of the assets during the construction period. Accordingly, as the lessor incurs the construction project costs, the assets and corresponding financial obligation are recorded in our consolidated balance sheet. Once the construction is completed, if the lease meets certain “sale-leaseback” criteria, we will remove the asset and related financial obligation from the balance sheet and treat the building lease as either an operating or capital lease based on our assessment of the guidance. If upon completion of construction, the project does not meet the “sale-leaseback” criteria, the lease will be treated as a financing obligation and we will depreciate the asset over its estimated useful life for financial reporting purposes.
63
Insurance Recoveries
Insurance proceeds related to incurred losses are recognized when recovery is probable, while business interruption recoveries follow the gain contingency model and are recognized when realized or realizable and earned. During the year ended June 30, 2017, we experienced a flood at our Windsor, Canada production facility, resulting in the receipt of insurance proceeds of $829, consisting of $298 related to business interruption losses. The cash received related to business interruption loses was allocated between cost of goods sold and other income based on their relative percentage of business interruption losses, which equated to $141 and $157, respectively. As of June 30, 2017, this insurance claim is closed, and we do not anticipate any additional recoveries relating to this claim.
During the year ended June 30, 2016, we received $11,943 in cash for payments from an insurance settlement related to a fire that occurred at our Venlo, Netherlands production facility. The insurance proceeds were used to offset incurred losses, including the write-off of the net book value of damaged machinery, equipment and inventory and property-related cleanup costs, as well as claim preparation costs. We also received insurance proceeds for business interruption losses for increased shipping and outsourcing costs recognized as a reduction to cost of revenue and lost profits recognized as a gain within other income, net. We recognized $7,996 as a reduction of expenses, including $2,634 relating to business interruption recoveries recognized as a reduction to cost of revenue. We recognized a net gain of $3,947 as a component of other income, net in our consolidated statement of operations, including $811 for business interruption lost profits, with the remainder related the recovery of the replacement value of damaged machinery and equipment in excess of carrying value. This insurance claim is closed.
Intangible Assets
We capitalize the costs of purchasing patents from unrelated third parties and amortize these costs over the estimated useful life of the patent. The costs related to patent applications, pursuing others who we believe infringe on our patents, and defending against patent-infringement claims are expensed as incurred.
We record acquired intangible assets at fair value on the date of acquisition and amortize such assets using the straight-line method over the expected useful life of the asset, unless another amortization method is deemed to be more appropriate. We evaluate the remaining useful life of intangible assets on a periodic basis to determine whether events and circumstances warrant a revision to the remaining useful life. If the estimate of an intangible asset’s remaining useful life is changed, we amortize the remaining carrying value of the intangible asset prospectively over the revised remaining useful life.
Long-Lived Assets
Long-lived assets with a finite life are reviewed for impairment whenever events or changes in circumstances indicate that the carrying amount of the assets might not be recoverable. Conditions that would necessitate an impairment assessment include a significant decline in the observable market value of an asset, a significant change in the extent or manner in which an asset is used, or any other significant adverse change that would indicate that the carrying amount of an asset or group of assets may not be recoverable. During the year ended June 30, 2017, we recognized a partial impairment charge for the acquired intangible assets of our Tradeprint reporting unit of $3,211. Refer to Note 8 for additional information.
During the years ended June 30, 2017 and 2016 we committed to plans to abandon certain manufacturing equipment and recognized a loss of $2,408 and $10,979, respectively. The related loss during the year ended June 30, 2017 was recognized in cost of revenue, technology and development expense, and restructuring expense for $1,119, $678, and $611, respectively, while the entire loss for the previous year was allocated to cost of revenue. We did not recognize any abandonment charges during the fiscal year ended June 30, 2015.
Business Combinations
We recognize the assets acquired and liabilities assumed in business combinations on the basis of their fair values at the date of acquisition. We assess the fair value of assets, including intangible assets, using a variety of methods and each asset is measured at fair value from the perspective of a market participant. The method used to estimate the fair values of intangible assets incorporates significant assumptions regarding the estimates a market participant would make in order to evaluate an asset, including a market participant’s use of the asset and the
64
appropriate discount rates. Assets acquired that are determined to not have economic use for us are expensed immediately. Any excess purchase price over the fair value of the net tangible and intangible assets acquired is allocated to goodwill. Transaction costs and restructuring costs associated with a business combination are expensed as incurred.
The consideration for our acquisitions often includes future payments that are contingent upon the occurrence of a particular event. For acquisitions that qualify as business combinations, we record an obligation for such contingent payments at fair value on the acquisition date. We estimate the fair value of contingent consideration obligations through valuation models that incorporate probability adjusted assumptions related to the achievement of the milestones and thus likelihood of making related payments or by using a Monte Carlo simulation model. We revalue these contingent consideration obligations each reporting period. Changes in the fair value of our contingent consideration obligations are recognized within general and administrative expense in our consolidated statements of operations.
Goodwill
The evaluation of goodwill for impairment is performed at a level referred to as a reporting unit. A reporting unit is either the “operating segment level” or one level below, which is referred to as a “component.” The level at which the impairment test is performed requires an assessment as to whether the operations below the operating segment should be aggregated as one reporting unit due to their similarity or reviewed individually. Goodwill is evaluated for impairment on an annual basis or more frequently when an event occurs or circumstances change that indicate that the carrying value may not be recoverable. Goodwill is considered to be impaired when the carrying amount of a reporting unit exceeds its estimated fair value.
We have the option to first assess qualitative factors to determine whether it is more likely than not that the fair value of a reporting unit is less than its carrying value. If the results of this analysis indicate that the fair value of a reporting unit is less than its carrying value, the quantitative impairment test is required; otherwise, no further assessment is necessary. To perform the quantitative approach, we estimate the fair value of our reporting units using a discounted cash flow methodology. If the carrying value of the net assets assigned to the reporting unit exceeds the fair value of the reporting unit, then a second step of the impairment test is performed in order to determine the implied fair value of our reporting unit’s goodwill. If the carrying value of a reporting unit’s goodwill exceeds its implied fair value, then we record an impairment loss equal to the difference.
For our annual impairment test as of May 31, 2017, we evaluated each of our eleven reporting units with goodwill individually. We considered the timing of our most recent fair value assessment and associated headroom, the actual operating results as compared to the cash flow forecasts used those fair value assessments, the current long-term forecasts for each reporting unit, and the general market and economic environment of each reporting unit. We performed a qualitative assessment for nine of our reporting units and determined that there was no indication that the carrying value of any of these reporting units exceeds its fair value. We also performed a quantitative analysis for two of our reporting units during this testing cycle in order to gain additional assurance there was no impairment related to its goodwill. There have been no indications of impairment that would require an impairment test as of June 30, 2017.
Debt Issuance Costs
Expenses associated with the issuance of debt instruments are capitalized and are amortized over the terms of the respective financing arrangement using the effective interest method, or on a straight-line basis through the maturity date for our revolving credit facility. During the years ended June 30, 2017 and 2016, we capitalized debt issuance costs related to our senior secured credit facility and senior unsecured notes of $229 and $151, respectively. Amortization and write-off of these costs is included in interest expense, net in the consolidated statements of operations and amounted to $1,578, $1,588, and $1,272, for the years ended June 30, 2017, 2016 and 2015, respectively. Unamortized debt issuance costs were $5,661 and $7,010 as of June 30, 2017 and 2016, respectively. When we make changes to our financing arrangements, we re-evaluate the capitalization of these costs which could result in the immediate recognition of any unamortized debt issuance costs in our statement of operations.
65
Derivative Financial Instruments
We record all derivatives on the consolidated balance sheet at fair value. We apply hedge accounting to arrangements that qualify and are designated for hedge accounting treatment, which includes cash flow and net investment hedges. Hedge accounting is discontinued prospectively if the hedging relationship ceases to be effective or the hedging or hedged items cease to exist as a result of maturity, sale, termination or cancellation.
Derivatives designated and qualifying as hedges of the exposure to variability in expected future cash flows, or other types of forecasted transactions, are considered cash flow hedges which could include interest rate swap contracts and forward currency contracts. In a cash flow hedging relationship, the effective portion of the change in the fair value of the hedging derivative is initially recorded in accumulated other comprehensive (loss) income, while any ineffective portion is recognized directly in earnings, as a component of other income, net. The portion of gain or loss on the derivative instrument previously recorded in accumulated other comprehensive (loss) income remains in accumulated other comprehensive (loss) income until the forecasted transaction is recognized in earnings.
Derivatives designated and qualifying as hedges of currency exposure of a net investment in a foreign operation are considered net investment hedges which could include cross-currency swap contracts. In hedging the currency exposure of a net investment in a foreign operation, the effective portion of gains and losses on the hedging instruments is recognized in accumulated other comprehensive (loss) income as part of currency translation adjustment, while any ineffective portion is recognized directly in earnings, as a component of other income. The portion of gain or loss on the derivative instrument previously recorded in accumulated other comprehensive (loss) income remains in accumulated other comprehensive (loss) income until we reduce our investment in the hedged foreign operation through a sale or substantial liquidation.
We also enter into derivative contracts that are intended to economically hedge certain of our risks, even though we may not elect to apply hedge accounting or the instrument may not qualify for hedge accounting. When hedge accounting is not applied, the changes in the fair value of the derivatives are recorded directly in earnings as a component of other income, net.
In accordance with the fair value measurement guidance, our accounting policy is to measure the credit risk of our derivative financial instruments that are subject to master netting agreements on a net basis by counterparty portfolio. We execute our derivative instruments with financial institutions that we judge to be credit-worthy, defined as institutions that hold an investment grade credit rating.
Mandatorily Redeemable Noncontrolling Interest
Noncontrolling interests held by third parties in consolidated subsidiaries are considered mandatorily redeemable when they are subject to an unconditional obligation to be redeemed by both parties. The redeemable noncontrolling interest must be required to be repurchased on a specified date or on the occurrence of a specified event that is certain to occur and are to be redeemed via the transfer of assets. Mandatorily redeemable noncontrolling interests are presented as liability-based financial instruments and are re-measured on a recurring basis to the expected redemption value. During the year ended June 30, 2017, the terms of our arrangement with the shareholders of Printi LLC were amended, resulting in the inclusion of a mandatory redemption feature as part of the amended arrangement. Refer to Note 15 for additional details.
Shareholders’ Equity
Comprehensive (loss) Income
Comprehensive (loss) income is defined as the change in equity of a business enterprise during a period from transactions and other events and circumstances from non-owner sources. Comprehensive (loss) income is composed of net (loss) income, unrealized gains and losses on marketable securities and derivatives, unrealized loss on pension benefit obligation, and cumulative foreign currency translation adjustments, which are included in the accompanying consolidated statements of comprehensive income.
66
Treasury Shares
Treasury shares are accounted for using the cost method and are included as a component of shareholders' equity. We reissue treasury shares as part of our share-based compensation programs and upon issuance we determine the cost using the average cost method.
Revenue Recognition
We generate revenue primarily from the sale and shipping of customized manufactured products, as well as providing digital services, website design and hosting, email marketing services, order referral fees and other third party offerings. We recognize revenue arising from sales of products and services when we have persuasive evidence of an arrangement, the product has been shipped or service rendered with no significant post-delivery obligations on our part, the net sales price is fixed or determinable and collectability is reasonably assured. For subscription services we recognize revenue for the fees charged to customers ratably over the term of the service arrangement. Revenue is recognized net of discounts we offer to our customers as part of advertising campaigns. Revenue from sales of prepaid orders on our websites are deferred until shipment of fulfilled orders or until the prepaid service has been rendered.
For arrangements with multiple deliverables, we allocate revenue to each deliverable if the delivered item(s) has value to the customer on a standalone basis and, if the arrangement includes a general right of return relative to the delivered item, delivery or performance of the undelivered item(s) is considered probable and substantially within our control. The stand-alone selling price for a deliverable is determined using a hierarchy of (1) Company specific objective and reliable evidence, then (2) third-party evidence, then (3) best estimate of selling price. We allocate total arrangement fee to each of the deliverables based on their relative stand-alone selling prices.
Shipping, handling and processing costs billed to customers are included in revenue and the related costs are included in cost of revenue at the time of shipment or rendering of service. Sales and purchases in jurisdictions which are subject to indirect taxes, such as value added tax (“VAT”), are recorded net of tax collected and paid as we act as an agent for the government.
For promotions through discount voucher websites, we recognize revenue on a gross basis, as we are the primary obligor, when redeemed items are shipped. As the vouchers do not expire, any unredeemed vouchers are recorded as deferred revenue. We recognize revenue on the portion of unredeemed vouchers when the likelihood of redemption becomes remote (referred to as "breakage") and we determine there is no legal obligation to remit the value of the unredeemed coupons to government agencies. We estimate the breakage rate based upon the pattern of historical redemptions.
Restructuring
Restructuring costs are recorded in connection with initiatives designed to improve efficiency or enhance competitiveness. Restructuring initiatives require us to make estimates in several areas, including expenses for severance and other employee separation costs and our ability to generate sublease income to enable us to terminate lease obligations at the estimated amounts. One-time termination benefits are expensed at the date we notify the employee, unless the employee must provide future service beyond the statutory minimum retention period, in which case the benefits are expensed ratably over the future service period. Liabilities for costs associated with a facility exit or disposal activity are recognized when the liability is incurred, as opposed to when management commits to an exit plan, and are measured at fair value. Restructuring costs are presented as a separate financial statement line within our consolidated statement of operations.
Advertising Expense
Our advertising costs are primarily expensed as incurred and included in marketing and selling expense. We capitalize direct response advertising, which consists of customized product sample mailings, and amortize over the expected future revenue stream. Amortization of capitalized advertising costs is determined using historical revenue data. The capitalized costs of direct response advertising are amortized, commencing with the date the product samples are mailed. Capitalized direct response advertising costs included in prepaid expenses and other current assets as of June 30, 2017 was $4,861. These capitalized costs relate to direct response marketing initiatives of our National Pen business. No costs were capitalized in the prior comparative period, as National Pen was acquired in fiscal 2017. Advertising expense for the years ended June 30, 2017, 2016 and 2015 was
67
$363,936, $305,701, and $286,132, respectively, which consisted of external costs related to customer acquisition and retention marketing campaigns.
Research and Development Expense
Research and development costs are expensed as incurred and included in technology and development expense. Research and development expense for the years ended June 30, 2017, 2016 and 2015 was $51,811, $35,449, and $30,849, respectively, which consisted of costs related to enhancing our manufacturing engineering and technology capabilities.
Income Taxes
As part of the process of preparing our consolidated financial statements, we calculate our income taxes in each of the jurisdictions in which we operate. This process involves estimating our current tax expense and deferred tax expense based on assessing temporary and permanent differences resulting from differing treatment of items for tax and financial reporting purposes. We recognize deferred tax assets and liabilities for the temporary differences using the enacted tax rates and laws that will be in effect when we expect temporary differences to reverse. We assess the ability to realize our deferred tax assets based upon the weight of available evidence both positive and negative. To the extent we believe that it is more likely than not that some portion or all of the deferred tax assets will not be realized, we establish a valuation allowance. In the event that actual results differ from our estimates or we adjust our estimates in the future, we may need to increase or decrease income tax expense, which could have a material impact on our financial position and results of operations.
We recognize the tax benefit from an uncertain tax position only if it is more likely than not that the tax position will be sustained upon examination by the taxing authorities, based on the technical merits of the tax position. The tax benefits recognized in our financial statements from such positions are measured as the largest benefit that has a greater than 50% likelihood of being realized upon ultimate resolution. The unrecognized tax benefits will reduce our effective tax rate if recognized. Interest and, if applicable, penalties related to unrecognized tax benefits are recorded in the provision for income taxes.
Foreign Currency Translation
Our non-U.S. dollar functional currency subsidiaries translate their assets and liabilities denominated in their functional currency to U.S. dollars at current rates of exchange in effect at the balance sheet date, and revenues and expenses are translated at average rates prevailing throughout the period. The resulting gains and losses from translation are included as a component of accumulated other comprehensive loss. Transaction gains and losses and remeasurement of assets and liabilities denominated in currencies other than an entity’s functional currency are included in other income, net in our consolidated statements of operations.
68
Other income, net
The following table summarizes the components of other income, net:
Year Ended June 30, | |||||||||||
2017 | 2016 | 2015 | |||||||||
Gains on derivatives not designated as hedging instruments (1) | $ | 936 | $ | 14,026 | $ | 9,317 | |||||
Currency-related gains, net (2) | 5,577 | 6,864 | 10,245 | ||||||||
Other gains (3) | 3,849 | 5,208 | 572 | ||||||||
Total other income, net | $ | 10,362 | $ | 26,098 | $ | 20,134 | |||||
_____________________
(1) Primarily relates to both realized and unrealized gains on derivative currency forward and option contracts not designated as hedging instruments.
(2) We have significant non-functional currency intercompany financing relationships subject to currency exchange rate volatility and the net currency-related gains for the years ended June 30, 2017, 2016 and 2015 are primarily driven by this intercompany activity. In addition, we have certain cross-currency swaps designated as cash flow hedges, which hedge against the remeasurement of certain intercompany loans, both presented in the same component above. Includes unrealized losses of $3,737 and $1,991 for the years ended June 30, 2017 and 2016, respectively, related to cross currency swaps designated as cash-flow hedges. We did not have any cross currency swap activity designated as cash flow hedges during fiscal 2015.
(3) The gain recognized during the year ended June 30, 2017, primarily relates to the gain on the sale of Plaza Create Co. Ltd. available-for-sale securities of $2,268. During the year ended June 30, 2016, other gains were primarily related to insurance recoveries of $3,947.
Net (Loss) Income Per Share Attributable to Cimpress N.V.
Basic net (loss) income per share attributable to Cimpress N.V. is computed by dividing net (loss) income attributable to Cimpress N.V. by the weighted-average number of ordinary shares outstanding for the respective period. Diluted net (loss) income per share attributable to Cimpress N.V. gives effect to all potentially dilutive securities, including share options, restricted share units (“RSUs”), restricted share awards ("RSAs") and PSUs, if the effect of the securities is dilutive using the treasury stock method. Awards with performance or market conditions are included using the treasury stock method only if the conditions would have been met as of the end of the reporting period and their effect is dilutive.
The following table sets forth the reconciliation of the weighted-average number of ordinary shares:
Year Ended June 30, | ||||||||
2017 | 2016 | 2015 | ||||||
Weighted average shares outstanding, basic | 31,291,581 | 31,656,234 | 32,644,870 | |||||
Weighted average shares issuable upon exercise/vesting of outstanding share options/RSUs/RSAs (1) | — | 1,393,220 | 1,171,628 | |||||
Shares used in computing diluted net (loss) income per share attributable to Cimpress N.V. | 31,291,581 | 33,049,454 | 33,816,498 | |||||
Weighted average anti-dilutive shares excluded from diluted net (loss) income per share attributable to Cimpress N.V. | 21,978 | 35,725 | 289,356 | |||||
_____________________
(1) In the periods in which a net loss is recognized, the impact of share options, RSUs, and RSAs is not included as they are anti-dilutive.
Compensation Expense
Share-Based Compensation
Compensation expense for all share-based awards is measured at fair value on the date of grant and recognized over the requisite service period. We recognize the impact of forfeitures as they occur. The fair value of share options is determined using the Black-Scholes valuation model, or lattice model for share options with a market condition or subsidiary share options. The fair value of RSUs and RSAs is determined based on the quoted price of our ordinary shares on the date of the grant. Such value is recognized ratably as expense over the requisite service period, or on an accelerated method for awards with a performance or market condition. For awards that are ultimately settleable in cash, we treat as liability awards and mark the award to market each reporting period recognizing any gain or loss in our statements of operations. For awards with a performance condition vesting feature, compensation cost is recorded if it is probable that the performance condition will be achieved.
69
During the first quarter of fiscal 2017, we began granting performance share units, or PSUs, associated with our new long-term incentive program. Compensation expense for our PSUs is estimated at fair value on the date of grant, which is fixed throughout the vesting period. The fair value is determined using a Monte Carlo simulation valuation model. As the PSUs include both a service and market condition the related expense is recognized using the accelerated expense attribution method over the requisite service period for each separately vesting portion of the award. For PSUs that meet the service vesting condition, the expense recognized over the requisite service period will not be reversed if the market condition is not achieved.
Sabbatical Leave
Compensation expense associated with a sabbatical leave, or other similar benefit arrangements, is accrued over the requisite service period during which an employee earns the benefit, net of estimated forfeitures, and is included in other liabilities on our consolidated balance sheets.
Concentrations of Credit Risk
We monitor the creditworthiness of our customers to which we grant credit terms in the normal course of business. We do not have any customers that accounted for greater than 10% of our accounts receivable as of June 30, 2017 and 2016. We do not have any customers that accounted for greater than 10% of our revenue for the years ended June 30, 2017, 2016 and 2015.
We maintain an allowance for doubtful accounts for potential credit losses based upon specific customer accounts and historical trends, and such losses to date in the aggregate have not materially exceeded our expectations.
Waltham Lease Arrangement
In July 2013, we executed a lease agreement to move our Lexington, Massachusetts, USA operations to a then yet to be constructed facility in Waltham, Massachusetts, USA. During the first quarter of fiscal 2016, the building was completed and we commenced lease payments in September 2015 and will make lease payments through September 2026.
For accounting purposes, we were deemed to be the owner of the Waltham building during the construction period, and accordingly we recorded the construction project costs incurred by the landlord as an asset with a corresponding financing obligation on our balance sheet. We evaluated the Waltham lease in the first quarter of fiscal 2016 and determined that the transaction did not meet the criteria for "sale-leaseback" treatment due to our planned subleasing activity over the term of the lease. Accordingly, we began depreciating the asset and incurring interest expense related to the financing obligation recorded on our consolidated balance sheet. We bifurcate the lease payments pursuant to the Waltham lease into (i) a portion that is allocated to the building and (ii) a portion that is allocated to the land on which the building was constructed. The portion of the lease obligations allocated to the land is treated as an operating lease that commenced in fiscal 2014.
Property, plant and equipment, net, included $116,045 and $120,168 as of June 30, 2017 and June 30, 2016, respectively, related to the building. The financing lease obligation and deferred rent credit related to the building on our consolidated balance sheets was $119,176 and $122,801 as of June 30, 2017 and June 30, 2016, respectively.
Recently Issued or Adopted Accounting Pronouncements
New Accounting Standards Adopted
In January 2017, the Financial Accounting Standards Board, or FASB, issued Accounting Standards Update No. 2017-04, "Intangibles - Goodwill and Other (Topic 350): Simplifying the Test for Goodwill Impairment," (ASU 2017-04), which changes how an entity is required to test for goodwill impairment by eliminating Step 2 from the goodwill impairment test. We are now required to compare the fair value of a reporting unit with its carrying value and recognize an impairment charge for the amount by which the carrying amount exceeds the reporting unit's fair value. The new standard is effective for us on July 1, 2020. We elected to early adopt this standard effective for the third quarter of fiscal 2017. We applied the new standard when performing the goodwill impairment test discussed in Note 8.
70
In July 2015, the FASB issued Accounting Standards Update No. 2015-11,"Simplifying the Measurement of Inventory" (ASU 2015-11), which requires an entity to measure inventory at the lower of cost and net realizable value. Net realizable value is the estimated selling price in the ordinary course of business, less reasonably predictable costs of completion, disposal, and transportation. The new standard is effective for us on July 1, 2017 and will be applied prospectively as of the interim or annual period of adoption. We elected to early adopt the new standard effective for the fourth quarter of fiscal 2017. The application of the new standard did not have a material impact on our consolidated financial statements.
In August 2016, the FASB issued Accounting Standards Update No. 2016-15, “Statement of Cash Flows (Topic 230): Classification of Certain Cash Receipts and Cash Payments” (ASU 2016-15), which reduces the existing diversity in practice related to the presentation of the statement cash flows under Topic 230, Statement of Cash Flows, and other Topics. The new standard is effective for us on July 1, 2018, and early adoption is permitted. We elected to adopt this new guidance effective for the first quarter of fiscal 2017, and we have applied the changes retrospectively to all periods presented. Our prior period classification of contingent consideration payments and proceeds from the settlement of insurance aligns with the requirements of this new standard and did not require adjustments to the prior period presented.
In September 2015, the FASB issued Accounting Standards Update No. 2015-16,"Business Combinations (Topic 805): Simplifying the Accounting for Measurement-Period Adjustments," (ASU 2015-16) which requires that an acquirer recognize adjustments to provisional amounts that are identified during the measurement period in the reporting period in which the adjustment amounts are determined. We adopted this new standard during the first quarter of fiscal 2017. The adoption of this standard did not have a material effect on our consolidated financial statements.
In February 2015, the FASB issued Accounting Standards Update No. 2015-02,"Consolidation (Topic 810): Amendments to the Consolidation Analysis," (ASU 2015-02) which places more emphasis in the consolidation evaluation on variable interests other than fee arrangements such as principal investment risk (for example, debt or equity interests), guarantees of the value of the assets or liabilities of the variable interest entity (VIE), written put options on the assets of the VIE, or similar obligations. We adopted this new standard during the first quarter of fiscal 2017. The adoption of this standard did not have a material effect on our consolidated financial statements.
Issued Accounting Standards to be Adopted
In May 2017, the FASB issued Accounting Standards Update No. 2017-09, "Compensation - Stock Compensation (Topic 718)," (ASU 2012-09), which clarifies the application of Topic 718 when accounting for changes in the terms and conditions of a share-based payment award. The update will require an entity to account for a modification to an award unless there is no change to the fair value after modification, there is no change to the vesting conditions after modification, and the classification of the award stays the same after modification. The amendment is effective for us on July 1, 2018 and permits early adoption. The amendment is to be applied prospectively, and we currently evaluating the impact on our financial statements.
In November 2016, the FASB issued Accounting Standards Update No. 2016-18, "Statement of Cash Flows (Topic 230) Restricted Cash" (ASU 2016-18), which requires that a statement of cash flows explain the change during the period in the total of cash, cash equivalents, and amounts generally described as restricted cash or restricted cash equivalents. Therefore, amounts generally described as restricted cash and restricted cash equivalents should be included with cash and cash equivalents when reconciling the beginning-of-period and end-of-period total amounts shown on the statement of cash flows. The amendment is effective for us on July 1, 2018 and permits early adoption. This amendment will affect the presentation of our statement of cash flows once adopted, and we do not expect it to have material impact on our consolidated financial statements.
In October 2016, the FASB issued Accounting Standards Update No. 2016-16, "Income Taxes (Topic 740): Intra-Entity Transfers of Assets Other Than Inventory" (ASU 2016-16), which requires the recognition for income tax consequences of an intra-entity transfer of an asset other than inventory when the transfer occurs. The new standard is effective for us on July 1, 2018 and permits early adoption. We expect to adopt the new standard during the first quarter of fiscal 2018, and we expect the impact of the new standard will result in a reduction to prepaid and other current assets of approximately $25,000, an increase in deferred tax assets of approximately $19,000 and a cumulative-effect adjustment to retained earnings of approximately $6,000.
71
In March 2016, the FASB issued Accounting Standards Update No. 2016-04,"Liabilities - Extinguishment of Liabilities (Subtopic 405-20): Recognition of Breakage for Certain Prepaid Stored-Value Products" (ASU 2016-04), which requires an entity to recognize breakage for a liability resulting from the sale of a prepaid stored-value product in proportion to the pattern of rights expected to be exercised by the product holder only to the extent that it is probable that a significant reversal of the recognized breakage amount will not subsequently occur. The new standard is effective for us on July 1, 2018. The standard permits early adoption and should be applied either retrospectively to each period presented or by means of a cumulative adjustment to retained earnings as of the beginning of the fiscal year adopted. We do not expect the effect of ASU 2016-04 to have a material impact on our consolidated financial statements.
In March 2016, the FASB issued Accounting Standards Update No. 2016-02,"Leases (Topic 842)" (ASU 2016-02), which requires the recognition of lease assets and lease liabilities by lessees for those leases currently classified as operating lease. The standard also retains a distinction between finance leases and operating leases. The new standard is effective for us on July 1, 2019. The standard permits early adoption. We are currently evaluating our adoption timing and the effect that ASU 2016-02 will have on our consolidated financial statements.
In May 2014, the FASB issued Accounting Standards Update No. 2014-09,"Revenue from Contracts with Customers" (ASU 2014-09), which requires an entity to recognize the amount of revenue to which it expects to be entitled for the transfer of promised goods or services to customers. This guidance will replace most existing revenue recognition guidance in U.S. GAAP when it becomes effective. The new standard is effective beginning after December 15, 2017, which would result in an effective date for us of July 1, 2018, with early application permitted one year earlier. The standard permits the use of either the retrospective or cumulative catch-up transition method. We are currently evaluating our adoption timing and the effect that ASU 2014-09 will have on our consolidated financial statements.
3. Fair Value Measurements
The following table summarizes our investments in marketable securities:
June 30, 2016 | |||||||||||
Amortized Cost Basis (2) | Unrealized gain | Estimated Fair Value | |||||||||
Available-for-sale securities | |||||||||||
Plaza Create Co. Ltd. common shares (1) | $ | 4,405 | $ | 3,488 | $ | 7,893 | |||||
Total investments in available-for-sale securities | $ | 4,405 | $ | 3,488 | $ | 7,893 | |||||
________________________
(1) On December 22, 2016, we sold all available-for-sale securities held in Plaza Create Co. Ltd recognizing a gain of $2,268 as a part of other income, net, for the year ended June 30, 2017.
(2) Amortized cost basis represents our initial investment adjusted for currency translation.
We use a three-level valuation hierarchy for measuring fair value and include detailed financial statement disclosures about fair value measurements. The valuation hierarchy is based upon the transparency of inputs to the valuation of an asset or liability as of the measurement date. The three levels are defined as follows:
• | Level 1: Inputs to the valuation methodology are quoted prices (unadjusted) for identical assets or liabilities in active markets. |
• | Level 2: Inputs to the valuation methodology include quoted prices for similar assets and liabilities in active markets, quoted prices for identical or similar assets in markets that are not active and inputs that are observable for the asset or liability, either directly or indirectly, for substantially the full term of the financial instrument. |
• | Level 3: Inputs to the valuation methodology are unobservable and significant to the fair value measurement. |
A financial instrument’s categorization within the valuation hierarchy is based upon the lowest level of input that is significant to the fair value measurement. The following tables summarize our assets and liabilities that are measured at fair value on a recurring basis and are categorized using the fair value hierarchy:
72
June 30, 2017 | |||||||||||||||
Total | Quoted Prices in Active Markets for Identical Assets (Level 1) | Significant Other Observable Inputs (Level 2) | Significant Unobservable Inputs (Level 3) | ||||||||||||
Assets | |||||||||||||||
Interest rate swap contracts | $ | 1,717 | $ | — | $ | 1,717 | $ | — | |||||||
Total assets recorded at fair value | $ | 1,717 | $ | — | $ | 1,717 | $ | — | |||||||
Liabilities | |||||||||||||||
Interest rate swap contracts | $ | (483 | ) | $ | — | $ | (483 | ) | $ | — | |||||
Cross-currency swap contracts | (19,760 | ) | — | (19,760 | ) | — | |||||||||
Currency forward contracts | (14,700 | ) | — | (14,700 | ) | — | |||||||||
Currency option contracts | (651 | ) | — | (651 | ) | — | |||||||||
Contingent consideration | (5,453 | ) | — | — | (5,453 | ) | |||||||||
Total liabilities recorded at fair value | $ | (41,047 | ) | $ | — | $ | (35,594 | ) | $ | (5,453 | ) | ||||
June 30, 2016 | |||||||||||||||
Total | Quoted Prices in Active Markets for Identical Assets (Level 1) | Significant Other Observable Inputs (Level 2) | Significant Unobservable Inputs (Level 3) | ||||||||||||
Assets | |||||||||||||||
Available-for-sale securities | $ | 7,893 | $ | 7,893 | $ | — | $ | — | |||||||
Currency forward contracts | 9,821 | — | 9,821 | — | |||||||||||
Total assets recorded at fair value | $ | 17,714 | $ | 7,893 | $ | 9,821 | $ | — | |||||||
Liabilities | |||||||||||||||
Interest rate swap contracts | $ | (2,180 | ) | $ | — | $ | (2,180 | ) | $ | — | |||||
Cross-currency swap contracts | (8,850 | ) | — | (8,850 | ) | — | |||||||||
Currency forward contracts | (315 | ) | — | (315 | ) | — | |||||||||
Contingent consideration | (1,212 | ) | — | — | (1,212 | ) | |||||||||
Total liabilities recorded at fair value | $ | (12,557 | ) | $ | — | $ | (11,345 | ) | $ | (1,212 | ) | ||||
During the years ended June 30, 2017 and 2016, there were no significant transfers in or out of Level 1, Level 2 and Level 3 classifications.
The valuations of the derivatives intended to mitigate our interest rate and currency risk are determined using widely accepted valuation techniques, including discounted cash flow analysis on the expected cash flows of each instrument. This analysis utilizes observable market-based inputs, including interest rate curves, interest rate volatility, or spot and forward exchange rates, and reflects the contractual terms of these instruments, including the period to maturity. We incorporate credit valuation adjustments to appropriately reflect both our own nonperformance risk and the respective counterparties' nonperformance risk in the fair value measurements. In adjusting the fair value of our derivative contracts for the effect of nonperformance risk, we have considered the impact of netting and any applicable credit enhancements.
Although we have determined that the majority of the inputs used to value our derivatives fall within Level 2 of the fair value hierarchy, the credit valuation adjustments associated with our derivatives utilize Level 3 inputs, such as estimates of current credit spreads, to appropriately reflect both our own nonperformance risk and the respective counterparties' nonperformance risk in the fair value measurement. However, as of June 30, 2017, we have assessed the significance of the impact of the credit valuation adjustments on the overall valuation of our derivative positions and have determined that the credit valuation adjustments are not significant to the overall valuation of our derivatives. As a result, we have determined that our derivative valuations in their entirety are classified in Level 2 in the fair value hierarchy.
73
Contingent consideration obligations are measured at fair value and are based on significant inputs not observable in the market, which represents a Level 3 measurement within the fair value hierarchy. The valuation of contingent consideration uses assumptions and estimates to forecast a range of outcomes and probabilities for the contingent consideration. Certain contingent consideration obligations are valued using a Monte Carlo simulation model. We assess these assumptions and estimates on a quarterly basis as additional data impacting the assumptions is obtained. Any changes in the fair value of contingent consideration related to updated assumptions and estimates will be recognized within general and administrative expenses in the consolidated statements of operations during the period in which the change occurs.
As part of the acquisition of WIRmachenDRUCK on February 1, 2016, we agreed to a contingent payment payable at our option in cash or shares during the third quarter of fiscal 2018 based on the achievement of a cumulative gross profit target for calendar years 2016 and 2017. The fair value of this contingent liability is $44,049 as of June 30, 2017, of which $5,453 is considered contingent consideration and included in the table below. The remaining portion of the liability is classified as a compensation arrangement and is discussed in Note 9. During the fourth quarter of fiscal 2017, we determined it was reasonably certain, based on recent performance, that the maximum earn-out would be achieved. We utilized a probability-based model assuming the maximum payment would be achieved and then discounted appropriately to derive the fair value as of June 30, 2017.
The following table represents the changes in fair value of Level 3 contingent consideration:
Total Contingent Consideration | ||||
Balance at June 30, 2015 (1) | $ | 7,833 | ||
Fair value at acquisition date | 1,185 | |||
Cash payments (2) | (7,819 | ) | ||
Foreign currency impact | 13 | |||
Balance at June 30, 2016 (1) | $ | 1,212 | ||
Fair value adjustment | 4,030 | |||
Foreign currency impact | 211 | |||
Balance at June 30, 2017 (1) | $ | 5,453 | ||
_____________________
(1) Classified as a current liability as of June 30, 2015, long-term liability as of June 30, 2016 and current liability as of June 30, 2017 on the consolidated balance sheet.
(2) Payments during the year ended June 30, 2016, included $7,819 for the Printdeal earn-out arrangement.
As of June 30, 2017 and June 30, 2016, the carrying amounts of our cash and cash equivalents, accounts receivables, accounts payable, and other current liabilities approximated their estimated fair values. As of June 30, 2017 and June 30, 2016 the carrying value of our debt, excluding debt issuance costs and debt discounts, was $882,578 and $685,897, respectively, and the fair value was $906,744 and $686,409, respectively. Our debt at June 30, 2017 includes variable rate debt instruments indexed to LIBOR that resets periodically and fixed rate debt instruments. The estimated fair value of our debt was determined using available market information based on recent trades or activity of debt instruments with substantially similar risks, terms and maturities, which fall within Level 2 under the fair value hierarchy. The estimated fair value of assets and liabilities disclosed above may not be representative of actual values that could have been or will be realized in the future.
4. Derivative Financial Instruments
We use derivative financial instruments, such as interest rate swap contracts, cross-currency swap contracts, and currency forward and option contracts, to manage interest rate and foreign currency exposures. Derivatives are recorded in the consolidated balance sheets at fair value. If the derivative is designated as a cash flow hedge or net investment hedge, then the effective portion of changes in the fair value of the derivative is recorded in accumulated other comprehensive loss and is subsequently reclassified into earnings in the period the hedged forecasted transaction affects earnings. If a derivative is deemed to be ineffective, then the ineffective portion of the change in fair value of the derivative is recognized directly in earnings. The change in the fair value of derivatives not designated as hedges is recognized directly in earnings, as a component of other income net.
74
Hedges of Interest Rate Risk
We enter into interest rate swap contracts to manage variability in the amount of our known or expected cash payments related to a portion of our debt. Our objective in using interest rate swaps is to add stability to interest expense and to manage our exposure to interest rate movements. We designate our interest rate swaps as cash flow hedges. Interest rate swaps designated as cash flow hedges involve the receipt of variable amounts from a counterparty in exchange for us making fixed-rate payments over the life of the contract agreements without exchange of the underlying notional amount. Realized gains or losses from interest rate swaps are recorded in earnings, as a component of interest expense, net. A portion of two of our interest rate swap contracts was deemed to be ineffective during the year ended June 30, 2017 and one of our contracts was deemed to be ineffective during the prior comparative period.
Amounts reported in accumulated other comprehensive loss related to interest rate swap contracts will be reclassified to interest expense as interest payments are accrued or made on our variable-rate debt. As of June 30, 2017, we estimate that $417 will be reclassified from accumulated other comprehensive loss to interest expense during the twelve months ending June 30, 2018. As of June 30, 2017, we had five outstanding interest rate swap contracts indexed to one-month LIBOR. These instruments were designated as cash flow hedges of interest rate risk and have varying start dates and maturity dates through June 2024.
Interest rate swap contracts outstanding: | Notional Amounts | |||
Contracts accruing interest as of June 30, 2017 | $ | 60,000 | ||
Contracts with a future start date | 140,000 | |||
Total | $ | 200,000 | ||
Hedges of Currency Risk
Cross-Currency Swap Contracts
From time to time, we execute cross-currency swap contracts designated as cash flow hedges or net investment hedges. Cross-currency swaps involve an initial receipt of the notional amount in the hedge currency in exchange for our reporting currency based on a contracted exchange rate. Subsequently, we receive fixed rate payments in our reporting currency in exchange for fixed rate payments in the hedged currency over the life of the contract. At maturity, the final exchange involves the receipt of our reporting currency in exchange for the notional amount in the hedged currency.
Cross-currency swap contracts designated as cash flow hedges are executed to mitigate our currency exposure to the interest receipts as well as the principal remeasurement and repayment associated with certain intercompany loans denominated in a currency other than our reporting currency, the U.S. Dollar. As of June 30, 2017, we had two outstanding cross-currency swap contracts designated as cash flow hedges with a total notional amount of $120,011, both maturing during June 2019. We entered into the two cross-currency swap contracts to hedge the risk of changes in one Euro denominated intercompany loan entered into with one of our consolidated subsidiaries that has the Euro as its functional currency.
Amounts reported in accumulated other comprehensive loss will be reclassified to other income net as interest payments are accrued or paid and upon remeasuring the intercompany loan. As of June 30, 2017, we estimate that $1,620 will be reclassified from accumulated other comprehensive loss to other income, net during the twelve months ending June 30, 2018.
Cross-currency swap contracts designated as net investment hedges are executed to mitigate our currency exposure of net investments in subsidiaries that have reporting currencies other than the U.S. Dollar. As of June 30, 2017, we had two outstanding cross-currency swap contracts designated as net investment hedges with a total notional amount of $122,969, both maturing during April 2019. We entered into the two cross-currency swap contracts to hedge the risk of changes in the U.S. Dollar equivalent value of a portion of our net investment in a consolidated subsidiary that has the Euro as its functional currency. Amounts reported in accumulated other comprehensive loss are recognized as a component of our cumulative translation adjustment.
75
We did not hold any ineffective cross-currency swaps during the year ended June 30, 2017 and 2016, and we did not hold any cross-currency swap contracts during the year ended June 30, 2015.
Other Currency Contracts
We execute currency forward and option contracts in order to mitigate our exposure to fluctuations in various currencies against our reporting currency, the U.S. Dollar.
As of June 30, 2017, we had six currency forward contracts designated as net investment hedges with a total notional amount of $175,262, maturing during various dates through October 2022. We entered into these contracts to hedge the risk of changes in the U.S. Dollar equivalent value of a portion of our net investment in a consolidated subsidiary that has the Euro as its functional currency. Amounts reported in accumulated other comprehensive loss are recognized as a component of our cumulative translation adjustment.
We have elected not to apply hedge accounting for all other currency forward and option contracts. During the year ended June 30, 2017, we have experienced volatility within other income net in our consolidated statements of operations from unrealized gains and losses on the mark-to-market of outstanding currency forward and option contracts. We expect this volatility to continue in future periods for contracts for which we do not apply hedge accounting. Additionally, since our hedging objectives may be targeted at non-GAAP financial metrics that exclude non-cash items such as depreciation and amortization, we may experience increased, not decreased, volatility in our GAAP results as a result of our currency hedging program.
As of June 30, 2017, we had the following outstanding currency derivative contracts that were not designated for hedge accounting and were used to hedge fluctuations in the U.S. Dollar value of forecasted transactions denominated in Australian Dollar, British Pound, Canadian Dollar, Danish Krone, Euro, Indian Rupee, Japanese Yen, Mexican Peso, New Zealand Dollar, Norwegian Krone, and Swedish Krona:
Notional Amount | Effective Date | Maturity Date | Number of Instruments | Index | ||||
$349,280 | March 2016 through June 2017 | Various dates through December 2018 | 481 | Various | ||||
76
Financial Instrument Presentation
The table below presents the fair value of our derivative financial instruments as well as their classification on the balance sheet as of June 30, 2017 and June 30, 2016:
June 30, 2017 | |||||||||||||||||||||||||||
Asset Derivatives | Liability Derivatives | ||||||||||||||||||||||||||
Derivatives designated as hedging instruments | Balance Sheet line item | Gross amounts of recognized assets | Gross amount offset in consolidated balance sheet | Net amount | Balance Sheet line item | Gross amounts of recognized liabilities | Gross amount offset in consolidated balance sheet | Net amount | |||||||||||||||||||
Derivatives in Cash Flow Hedging Relationships | |||||||||||||||||||||||||||
Interest rate swaps | Other non-current assets | $ | 2,072 | $ | (355 | ) | $ | 1,717 | Other current liabilities / other liabilities | $ | (483 | ) | $ | — | $ | (483 | ) | ||||||||||
Cross-currency swaps | Other non-current assets | — | — | — | Other liabilities | (7,640 | ) | — | (7,640 | ) | |||||||||||||||||
Derivatives in Net Investment Hedging Relationships | |||||||||||||||||||||||||||
Cross-currency swaps | Other non-current assets | — | — | — | Other liabilities | (12,120 | ) | — | (12,120 | ) | |||||||||||||||||
Currency forward contracts | Other non-current assets | — | — | — | Other liabilities | (9,896 | ) | — | (9,896 | ) | |||||||||||||||||
Total derivatives designated as hedging instruments | $ | 2,072 | $ | (355 | ) | $ | 1,717 | $ | (30,139 | ) | $ | — | $ | (30,139 | ) | ||||||||||||
Derivatives not designated as hedging instruments | |||||||||||||||||||||||||||
Currency forward contracts | Other current assets / other assets | $ | — | $ | — | $ | — | Other current liabilities / other liabilities | $ | (8,033 | ) | $ | 3,229 | $ | (4,804 | ) | |||||||||||
Currency option contracts | Other current assets / other assets | — | — | — | Other current liabilities / other liabilities | (651 | ) | — | (651 | ) | |||||||||||||||||
Total derivatives not designated as hedging instruments | $ | — | $ | — | $ | — | $ | (8,684 | ) | $ | 3,229 | $ | (5,455 | ) | |||||||||||||
77
June 30, 2016 | |||||||||||||||||||||||||||
Asset Derivatives | Liability Derivatives | ||||||||||||||||||||||||||
Derivatives designated as hedging instruments | Balance Sheet line item | Gross amounts of recognized assets | Gross amount offset in consolidated balance sheet | Net amount | Balance Sheet line item | Gross amounts of recognized liabilities | Gross amount offset in consolidated balance sheet | Net amount | |||||||||||||||||||
Derivatives in Cash Flow Hedging Relationships | |||||||||||||||||||||||||||
Interest rate swaps | Other non-current assets | $ | — | $ | — | $ | — | Other current liabilities / other liabilities | $ | (2,180 | ) | $ | — | $ | (2,180 | ) | |||||||||||
Cross-currency swaps | Other non-current assets | — | — | — | Other liabilities | (2,080 | ) | — | (2,080 | ) | |||||||||||||||||
Derivatives in Net Investment Hedging Relationships | |||||||||||||||||||||||||||
Cross-currency swaps | Other non-current assets | — | — | — | Other liabilities | (6,770 | ) | — | (6,770 | ) | |||||||||||||||||
Currency forward contracts | Other non-current assets | — | — | — | Other liabilities | (165 | ) | — | (165 | ) | |||||||||||||||||
Total derivatives designated as hedging instruments | $ | — | $ | — | $ | — | $ | (11,195 | ) | $ | — | $ | (11,195 | ) | |||||||||||||
Derivatives not designated as hedging instruments | |||||||||||||||||||||||||||
Currency forward contracts | Other current assets | $ | 10,748 | $ | (927 | ) | $ | 9,821 | Other current liabilities | $ | (508 | ) | $ | 358 | $ | (150 | ) | ||||||||||
Total derivatives not designated as hedging instruments | $ | 10,748 | $ | (927 | ) | $ | 9,821 | $ | (508 | ) | $ | 358 | $ | (150 | ) | ||||||||||||
The following table presents the effect of our derivative financial instruments designated as hedging instruments and their classification within comprehensive loss for the years ended June 30, 2017, 2016 and 2015:
Derivatives in Hedging Relationships | Amount of Gain (Loss) Recognized in Comprehensive (Loss) Income on Derivatives (Effective Portion) | ||||||||||
Year Ended June 30, | |||||||||||
In thousands | 2017 | 2016 | 2015 | ||||||||
Derivatives in Cash Flow Hedging Relationships | |||||||||||
Interest rate swaps | $ | 2,287 | $ | (1,736 | ) | $ | (1,417 | ) | |||
Cross-currency swaps | (3,584 | ) | (769 | ) | (7,779 | ) | |||||
Derivatives in Net Investment Hedging Relationships | |||||||||||
Cross-currency swaps | (3,721 | ) | 2,951 | — | |||||||
Currency forward contracts | (8,362 | ) | (81 | ) | — | ||||||
$ | (13,380 | ) | $ | 365 | $ | (9,196 | ) | ||||
78
The following table presents reclassifications out of accumulated other comprehensive loss for the years ended June 30, 2017, 2016 and 2015:
Details about Accumulated Other Comprehensive Loss Components | Amount Reclassified from Accumulated Other Comprehensive Loss to Net (loss) Income | Affected line item in the Statement of Operations | |||||||||||
Year Ended June 30, | |||||||||||||
In thousands | 2017 | 2016 | 2015 | ||||||||||
Derivatives in Cash Flow Hedging Relationships | |||||||||||||
Interest rate swaps | $ | (205 | ) | $ | (947 | ) | $ | (1,087 | ) | Interest expense, net | |||
Cross-currency swaps | (1,621 | ) | (1,171 | ) | — | Other income, net | |||||||
Total before income tax | (1,826 | ) | (2,118 | ) | (1,087 | ) | (Loss) income before income taxes | ||||||
Income tax | 457 | 531 | 272 | Income tax (benefit) provision | |||||||||
Total | $ | (1,369 | ) | $ | (1,587 | ) | $ | (815 | ) | ||||
The following table presents the adjustment to fair value recorded within the consolidated statements of operations for derivative instruments for which we did not elect hedge accounting, as well as the effect of the ineffective portion and de-designated derivative financial instruments that no longer qualify as hedging instruments in the period:
Amount of Gain (Loss) Recognized in Net (loss) Income | Location of Gain (Loss) Recognized in Income (Ineffective Portion) | ||||||||||||
Year Ended June 30, | |||||||||||||
In thousands | 2017 | 2016 | 2015 | ||||||||||
Derivatives not designated as hedging instruments | |||||||||||||
Currency contracts | $ | 663 | $ | 14,037 | $ | 9,370 | Other income, net | ||||||
Interest rate swaps | 273 | (11 | ) | (53 | ) | Other income, net | |||||||
$ | 936 | $ | 14,026 | $ | 9,317 | ||||||||
79
5. Accumulated Other Comprehensive Loss
The following table presents a roll forward of amounts recognized in accumulated other comprehensive loss by component, net of tax of $(710), $293, and $195 for the years ended June 30, 2017, 2016 and 2015:
Gains (losses) on cash flow hedges (1) | Gains (losses) on available for sale securities | Gains (losses) on pension benefit obligation | Translation adjustments, net of hedges (2) | Total | |||||||||||||||
Balance as of June 30, 2014 | $ | (803 | ) | $ | 9,246 | $ | (2,724 | ) | $ | (3,606 | ) | $ | 2,113 | ||||||
Other comprehensive (loss) income before reclassifications | (1,417 | ) | (6,275 | ) | (388 | ) | (93,757 | ) | (101,837 | ) | |||||||||
Amounts reclassified from accumulated other comprehensive (loss) income to net income | 815 | — | — | — | 815 | ||||||||||||||
Net current period other comprehensive (loss) income | (602 | ) | (6,275 | ) | (388 | ) | (93,757 | ) | (101,022 | ) | |||||||||
Balance as of June 30, 2015 | (1,405 | ) | 2,971 | (3,112 | ) | (97,363 | ) | (98,909 | ) | ||||||||||
Other comprehensive income (loss) before reclassifications | (2,504 | ) | 517 | 561 | (9,267 | ) | (10,693 | ) | |||||||||||
Amounts reclassified from accumulated other comprehensive loss to net (loss) income | 1,587 | — | — | — | 1,587 | ||||||||||||||
Net current period other comprehensive income (loss) | (917 | ) | 517 | 561 | (9,267 | ) | (9,106 | ) | |||||||||||
Balance as of June 30, 2016 | (2,322 | ) | 3,488 | (2,551 | ) | (106,630 | ) | (108,015 | ) | ||||||||||
Other comprehensive income (loss) before reclassifications | (1,297 | ) | (5,756 | ) | 2,194 | (4,161 | ) | (9,020 | ) | ||||||||||
Amounts reclassified from accumulated other comprehensive loss to net (loss) income | 1,369 | 2,268 | — | — | 3,637 | ||||||||||||||
Net current period other comprehensive income (loss) | 72 | (3,488 | ) | 2,194 | (4,161 | ) | (5,383 | ) | |||||||||||
Balance as of June 30, 2017 | $ | (2,250 | ) | $ | — | $ | (357 | ) | $ | (110,791 | ) | $ | (113,398 | ) | |||||
________________________
(1) Gains (losses) on cash flow hedges include our interest rates swap and cross-currency swap contracts designated in cash flow hedging relationships.
(2) As of June 30, 2017, 2016 and 2015, the translation adjustment is inclusive of the effects of our net investment hedges, of which, unrealized losses of $17,048, $4,965 and $7,779, respectively, net of tax, have been included in accumulated other comprehensive loss.
6. Property, Plant, and Equipment, Net
Property, plant, and equipment, net consists of the following:
June 30, | |||||||||
Estimated useful lives | 2017 | 2016 | |||||||
Land improvements | 10 years | $ | 2,235 | $ | 2,137 | ||||
Building and building improvements | 10 - 35 years | 319,822 | 300,558 | ||||||
Machinery and production equipment | 4 - 10 years | 274,813 | 270,835 | ||||||
Machinery and production equipment under capital lease | 4 - 10 years | 54,673 | 46,498 | ||||||
Computer software and equipment | 3 - 5 years | 165,812 | 148,853 | ||||||
Furniture, fixtures and office equipment | 5 - 7 years | 41,612 | 25,574 | ||||||
Leasehold improvements | Shorter of lease term or expected life of the asset | 51,582 | 40,203 | ||||||
Construction in progress | 12,240 | 5,910 | |||||||
922,789 | 840,568 | ||||||||
Less accumulated depreciation, inclusive of assets under capital lease | (443,273 | ) | (379,077 | ) | |||||
479,516 | 461,491 | ||||||||
Land | 32,431 | 31,672 | |||||||
Property, plant, and equipment, net | $ | 511,947 | $ | 493,163 | |||||
Depreciation expense, inclusive of assets under capital leases, totaled $87,145, $76,435, and $62,970 for
80
the years ended June 30, 2017, 2016 and 2015, respectively.
7. Business Combinations
Fiscal 2017 acquisition
Acquisition of National Pen Co. LLC
On December 30, 2016, we acquired 100% of the equity interests of National Pen Co. LLC, a manufacturer and marketer of custom writing instruments for small- and medium-sized businesses. At closing, we paid $214,573 in cash, subject to post closing adjustments based on acquired cash, debt and working capital balances. During the third quarter of fiscal 2017, we finalized and received payment for the post closing adjustment, which reduced the purchase price by $1,941. The acquisition supports our strategy to build competitively differentiated supply chain capabilities that we can make available via our mass customization platform, which we bring to market through a portfolio of focused brands. We expect National Pen will also complement our organic investments in technology and supply chain capabilities for promotional products, apparel and gift offerings.
The table below details the consideration transferred to acquire National Pen:
Cash consideration | $ | 214,573 | ||||
Final post closing adjustment | (1,941 | ) | ||||
Total purchase price | $ | 212,632 | ||||
The excess purchase price over the fair value of National Pen's net assets was recorded as goodwill, which is primarily attributable to the value of its workforce, its manufacturing and marketing process and know-how, as well as synergies which include leveraging National Pen's scale-based sourcing channels, integrating into our mass customization platform, and supporting the development of its e-commerce platform. We attributed $34,520 of goodwill to the National Pen reportable segment, and allocated $23,200 of goodwill to the Vistaprint segment for certain synergies that are expected to be realized by the Vistaprint segment as a result of the acquisition. The amount of goodwill that is deductible for tax purposes is approximately $19,000.
The fair value of the assets acquired and liabilities assumed was:
Amount | Weighted Average Useful Life in Years | ||||
Tangible assets acquired and liabilities assumed (1): | |||||
Cash and cash equivalents | $ | 8,337 | n/a | ||
Accounts receivable, net | 20,921 | n/a | |||
Inventory | 19,854 | n/a | |||
Other current assets | 11,281 | n/a | |||
Property, plant and equipment, net | 29,472 | n/a | |||
Other non-current assets | 1,270 | n/a | |||
Accounts payable | (12,590 | ) | n/a | ||
Accrued expenses | (17,805 | ) | n/a | ||
Other current liabilities | (908 | ) | n/a | ||
Deferred tax liabilities (2) | (3,255 | ) | n/a | ||
Long-term liabilities | (9,665 | ) | n/a | ||
Identifiable intangible assets: | |||||
Developed Technology | 19,000 | 6 | |||
Trade Name | 33,000 | 11 | |||
Customer Relationships | 56,000 | 7 | |||
Goodwill (2) | 57,720 | n/a | |||
Total purchase price | $ | 212,632 | |||
(1) National Pen has materially impacted our working capital balances post-acquisition, resulting in increased accounts receivable, inventory,
81
accounts payable and accrued expenses balances in our consolidated balance sheet.
(2) During the fourth quarter of fiscal 2017 we recorded adjustments, which resulted in a measurement period adjustment of $13,770 between deferred tax liabilities and goodwill.
National Pen Pro Forma Financial Information
National Pen has been included in our consolidated financial statements starting on its acquisition date. The following unaudited pro forma financial information presents our results as if the National Pen acquisition had occurred on July 1, 2015. The pro forma financial information for all periods presented adjusts for the effects of material business combination items, including estimated amortization of acquired intangible assets and transaction related costs. The unaudited pro forma results are not necessarily indicative of what actually would have occurred had the acquisition been in effect for the periods presented as the pre-acquisition results include revenue and profit related to certain operations that are no longer active:
Year Ended June 30, | ||||||||
2017 | 2016 | |||||||
Pro forma revenue | $ | 2,294,347 | $ | 2,060,426 | ||||
Pro forma net (loss) income attributable to Cimpress N.V. | (71,084 | ) | 41,370 | |||||
We utilized proceeds from our credit facility in order to finance the acquisition. In connection with the acquisition, we incurred $2,005 in general and administrative expenses during the year ended June 30, 2017, primarily related to legal, financial, and other professional services.
Fiscal 2016 acquisitions
Acquisition of WIRmachenDRUCK GmbH
On February 1, 2016, we acquired 100% of the outstanding shares of WIRmachenDRUCK GmbH, a web-to-print business focused primarily on the German market. At closing, we paid €138,383 ($150,128 based on the exchange rate as of the date of acquisition) in cash and transferred €8,121 ($8,810 based on the exchange rate as of the date of acquisition) in ordinary shares of Cimpress N.V. We paid €1,850 in cash ($2,082 based on the exchange rate on the date of payment) during the fourth quarter of fiscal 2016 as a post-closing adjustment based on WIRmachenDRUCK's net cash and working capital position as of the acquisition date.
In addition, we agreed to a sliding scale earn-out of up to €40,000 ($43,395 based on the exchange rate as of the date of acquisition) based on the achievement of a cumulative gross profit target for calendar years 2016 and 2017 and is payable at our option in cash or ordinary shares. Refer to Note 9 for additional discussion relating to the earn-out arrangement.
The acquisition supports our strategy to invest in and build customer-focused entrepreneurial, mass customization businesses for the long-term, which we manage in a decentralized and autonomous manner and complements similar previous investments in Europe. WIRmachenDRUCK brings internet-based capabilities that aggregate and route large numbers of small orders to a network of specialized production partners. Their outsourced supply chain model allows them to compete across a vast selection of product types, formats, sizes, finishing options and delivery choices.
Our consolidated financial statements include WIRmachenDRUCK from February 1, 2016, the date of acquisition. WIRmachenDRUCK's revenue included in our consolidated revenues for the year ended June 30, 2016 was $72,620. WIRmachenDRUCK's net income included in our consolidated net income attributable to Cimpress N.V. for the year ended June 30, 2016 was $3,420, inclusive of amortization of identifiable intangible assets but exclusive of earn-out related compensation expense and corporate level interest expense.
82
The table below details the consideration transferred to acquire WIRmachenDRUCK:
Cash consideration | $ | 152,100 | |
Cimpress N.V. shares transferred | 8,810 | ||
Fair value of contingent consideration | 1,185 | ||
Total consideration | $ | 162,095 | |
The excess of the purchase price paid over the fair value of WIRmachenDRUCK's net assets was recorded as goodwill, which is primarily attributed to expected expansion of the customer base and value of the workforce of WIRmachenDRUCK. Goodwill is not expected to be deductible for tax purposes, and has been attributed to our Upload and Print reportable segment. The fair value of the assets acquired and liabilities assumed was:
Amount | Weighted Average Useful Life in Years | ||||
Tangible assets acquired and liabilities assumed | |||||
Cash and cash equivalents | $ | 15,220 | n/a | ||
Other current assets | 5,231 | n/a | |||
Other non-current assets | 1,259 | n/a | |||
Accounts payable and other current liabilities | (17,566 | ) | n/a | ||
Deferred tax liability | (26,863 | ) | n/a | ||
Identifiable intangible assets: | |||||
Customer relationships | 24,952 | 7 | |||
Trade name | 24,952 | 15 | |||
Print network | 23,867 | 9 | |||
Referral network | 10,849 | 7 | |||
Developed technology | 8,679 | 3 | |||
Goodwill | 91,515 | n/a | |||
Total purchase price | $ | 162,095 | |||
Other fiscal 2016 acquisitions
During the first quarter of fiscal 2016, we acquired two businesses that were not material to our results either individually or in the aggregate. Complementing our Upload and Print segment, we acquired all of the outstanding capital stock of Tradeprint Distribution Limited (formerly known as Fairprint Distribution Limited) and Litotipografia Alcione S.r.l. on July 31, 2015 and July 29, 2015, respectively. The aggregate consideration for these two acquisitions was $25,547, net of cash acquired. The consideration was allocated to the fair value of the assets acquired and liabilities assumed based on estimated fair values as of the respective acquisition dates. The aggregate allocation to goodwill, intangible assets, and net tangible assets was $9,571, $14,359 and $1,617, respectively. During the third quarter of fiscal 2017 we recognized a charge for the full impairment of goodwill and a portion of the intangible assets related to the Tradeprint reporting unit. Refer to our discussion in Note 8 for additional details of the impairment loss.
Goodwill is calculated as the excess of the consideration over the fair value of the net assets, including intangible assets, and is primarily related to expected synergies from the transactions. The goodwill for these two acquisitions is not deductible for tax purposes, and has been attributed to our Upload and Print reportable segment. The results of these acquisitions have been included in the consolidated financial statements from the date of purchase and were not material for the year ended June 30, 2016.
We utilized proceeds from our credit facility to finance our fiscal 2016 acquisitions. In connection with these acquisitions, we incurred transaction costs related to investment banking, legal, financial, and other professional services of $1,289 during the year ended June 30, 2016. We have not presented pro forma results of the operations of the companies we acquired in fiscal 2016 because the effects of the acquired companies are not material to our consolidated financial statements.
83
Fiscal 2015 acquisitions
Acquisition of Exagroup SAS
On April 15, 2015, we acquired 70% of the shares of Exagroup SAS, a French simplified joint stock company, for a purchase price of €91,305 ($97,012 based on the exchange rate as of the date of acquisition), plus the post-closing adjustment of €4,575 ($4,862 based on the exchange rate as of the date of payment) based on Exagroup's working capital and debt, of which €3,261 ($3,678 based on the exchange rate on the payment date) was paid during fiscal 2016 and the remaining €1,314 is expected to be paid in fiscal 2019. All shareholders of Exagroup sold the entirety of their Exagroup holdings, with the exception of Nicolas Dematté and Marise Dematté (the “Remaining Shareholders”), who each retained a 15% ownership interest in Exagroup. We utilized proceeds from our credit facility to finance the acquisition. The acquisition supports our strategy to invest in and build customer-focused entrepreneurial, mass customization businesses for the long-term, which we manage in a decentralized and autonomous manner and complements similar previous investments in Europe.
Our consolidated financial statements include Exagroup from April 15, 2015, the date of acquisition. Exagroup's revenue included in our consolidated revenues for the year ended June 30, 2015 was $18,155. Exagroup's net income included in our consolidated net income attributable to Cimpress N.V. for the year ended June 30, 2015 was $563, inclusive of amortization of identifiable intangible assets.
Noncontrolling Interest
At the closing, we entered into reciprocal put and call options with the Remaining Shareholders with respect to the 30% of Exagroup shares held by the Remaining Shareholders, pursuant to which each of the Remaining Shareholders has the right to put his or her Exagroup shares to us for a period of 30 days beginning on April 15, 2019. If one or both of the Remaining Shareholders does not exercise his or her put option, then we have the right to exercise our call option on such Remaining Shareholder's Exagroup shares for a period of 30 days beginning on January 10, 2020. If the put or call options are exercised, the aggregate purchase and sale price for such shares will be €39,000. We may pay an additional contingent payment that is dependent on Exagroup’s achievement of certain revenue targets for calendar year 2017, as well as the continued employment of the Remaining Shareholders. This potential additional payment is contingent upon the Remaining Shareholders' post-acquisition employment and is recognized as compensation expense over the vesting period (through December 31, 2017). The maximum remaining contingent payment is €4,000 as one of the Remaining Shareholders ceased to be an employee. We estimate the value of the potential payment based on the achievement targets to be zero as of June 30, 2017.
The table below details the consideration transferred to acquire Exagroup:
Cash paid | $ | 97,012 | ||
Working capital and debt adjustment | 4,832 | |||
Total consideration | $ | 101,844 | ||
The excess of the purchase price paid over the fair value of Exagroup's net assets was recorded as goodwill, which is primarily attributable to cost synergies expected from manufacturing and tax efficiency opportunities, as well as the value of the workforce of Exagroup. Goodwill is not deductible for tax purposes, and has been attributed to our Upload and Print reportable segment. The fair value of the assets acquired and liabilities assumed was:
84
Weighted Average | |||||
Amount | Useful Life in Years | ||||
Tangible assets acquired and liabilities assumed: | |||||
Cash and cash equivalents | $ | 18,991 | n/a | ||
Other current assets (1) | 14,318 | n/a | |||
Non-current assets | 18,711 | n/a | |||
Accounts payable and other current liabilities | (21,008 | ) | n/a | ||
Deferred tax liability | (21,655 | ) | n/a | ||
Other long term liabilities | (9,966 | ) | n/a | ||
Identifiable intangible assets: | |||||
Customer relationships | 35,434 | 7-9 | |||
Trade name | 11,900 | 10-14 | |||
Developed technology | 9,669 | 3 | |||
Noncontrolling interest | (43,354 | ) | |||
Goodwill (2) | 88,804 | n/a | |||
Total purchase price | $ | 101,844 | |||
__________________
(1) Includes real estate assets classified as held for sale of $1,971.
(2) Refer to Note 8 for discussion of the goodwill impairment loss recognized for the Exagroup reporting unit during the year ended June 30, 2016 of $30,841.
Other fiscal 2015 acquisitions
During fiscal 2015, we acquired three businesses that were not material to our results either individually or in the aggregate. Two of the businesses complement our Upload and Print segment: FL Print SAS (which we refer to as Easyflyer) and druck.at Druck-und Handelsgesellschäft mbH (which we refer to as druck.at), acquired on April 9, 2015 and April 17, 2015, respectively. The third, FotoKnudsen AS, acquired on July 31, 2014, expands our photo product offerings to the Norwegian market. The aggregate consideration for these three acquisitions was $45,935. The aggregate allocation to goodwill, intangible assets, and net tangible assets was $19,224, $5,174 and $21,537, respectively. The FotoKnudsen AS business has been included as part of the expected sale of our Albumprinter business. Refer to Note 2 for additional details.
Goodwill for each of these acquisitions is not deductible for tax purposes. Easyflyer and druck.at have been attributed to our Upload and Print reportable segment and FotoKnudsen AS has been attributed to our All Other Businesses reportable segment. The revenue and earnings included in our consolidated financial statements for the year ended June 30, 2015 were not material. We utilized proceeds from various debt sources to finance our fiscal 2015 acquisitions. In connection with these acquisitions, we incurred transaction costs related to investment banking, legal, financial, and other professional services of $2,576 which were recorded during the year ended June 30, 2015 in general and administrative expenses. Pro forma results of the operations have not been presented because the effects of the fiscal 2015 acquisitions were not material to the consolidated financial statements.
85
8. Goodwill and Acquired Intangible Assets
Goodwill
The carrying amount of goodwill by reportable segment as of June 30, 2017 and 2016 is as follows:
Vistaprint | Upload and Print | National Pen | All Other Businesses | Total | |||||||||||||||
Balance as of June 30, 2015 | $ | 124,636 | $ | 250,487 | $ | — | $ | 25,506 | $ | 400,629 | |||||||||
Acquisitions (1) | — | 101,379 | — | — | 101,379 | ||||||||||||||
Impairments (2) | — | (30,841 | ) | — | — | (30,841 | ) | ||||||||||||
Adjustments | — | (720 | ) | — | — | (720 | ) | ||||||||||||
Effect of currency translation adjustments (5) | (2,884 | ) | (932 | ) | — | (626 | ) | (4,442 | ) | ||||||||||
Balance as of June 30, 2016 | $ | 121,752 | $ | 319,373 | $ | — | $ | 24,880 | $ | 466,005 | |||||||||
Acquisitions (1) | — | — | 57,720 | — | 57,720 | ||||||||||||||
Impairments (2) | — | (6,345 | ) | — | — | (6,345 | ) | ||||||||||||
Adjustments (3)(4) | 23,200 | (228 | ) | (23,200 | ) | (13,540 | ) | (13,768 | ) | ||||||||||
Effect of currency translation adjustments (5) | 2,255 | 9,005 | — | 91 | 11,351 | ||||||||||||||
Balance as of June 30, 2017 | $ | 147,207 | $ | 321,805 | $ | 34,520 | $ | 11,431 | $ | 514,963 | |||||||||
_________________
(1) Refer to Note 7 for additional details related to our acquisitions.
(2) During fiscal 2017 and 2016 we recorded impairment charges of $6,345 and $30,841, respectively, related to our Tradeprint and Exagroup reporting units. See below for additional details.
(3) We allocated $23,200 of goodwill to the Vistaprint segment for certain synergies that are expected to be realized by the Vistaprint segment as a result of the National Pen acquisition. Refer to Note 7 for additional details.
(4) As of June 30, 2017, our Albumprinter business, part of our All Other Businesses reportable segment, has been reclassified as held for sale on the consolidated balance sheet. Refer to Note 2 for additional details.
(5) Relates to goodwill held by subsidiaries whose functional currency is not the U.S. Dollar.
Impairment Review
Fiscal 2017
Our annual goodwill impairment test is performed as of May 31; however, during the third quarter fiscal 2017, we had a change in the composition of our Tradeprint reporting unit (a part of our Upload and Print reportable segment). This change, when combined with an updated profit outlook that was lower than originally forecasted as of the acquisition date, indicated that it was more likely than not that the fair value of the reporting unit is below the carrying amount.
As required, prior to performing the quantitative goodwill impairment test, we first evaluated the recoverability of the Tradeprint long-lived assets as the change in expected long-term cash flows is indicative of a potential impairment. We performed the recoverability test using undiscounted cash flows for our Tradeprint asset group and concluded that an impairment of long-lived assets existed. We proceeded to estimate the fair value the assets, using an income and cost approach based on market participant assumptions and recognized a partial impairment charge for our acquired intangible assets of $3,211.
Subsequent to performing the long-lived asset impairment test, we performed our goodwill impairment test which resulted in an additional impairment charge of the total goodwill of the Tradeprint reporting unit of $6,345. In order to execute the quantitative goodwill impairment test, we compared the fair value of the Tradeprint reporting unit to its carrying value. We used the income approach, specifically the discounted cash flow method, to derive the fair value. This approach calculates fair value by estimating the after-tax cash flows attributable to a reporting unit and then discounting the after-tax cash flows to a present value using a risk-adjusted discount rate. We selected this method as being the most meaningful in preparing our goodwill assessment as we believe the income approach most appropriately measures our income producing assets. We considered using the market approach but concluded it was not appropriate in valuing this particular reporting unit given the lack of relevant market comparisons available for application of the market approach. The cash flow projections in the Tradeprint fair value analysis are based on management's estimates of revenue growth rates and operating margins, taking into consideration historical results, as well as industry and market conditions. The discount rate is based on a weighted
86
average cost of capital (“WACC”), which represents the average rate a business must pay its providers of debt and equity, plus a risk premium. The WACC of 11.5% used to test the Tradeprint goodwill was derived from a group of comparable companies.
Fiscal 2016
During the third quarter of fiscal 2016, we concluded that the goodwill of our Exagroup reporting unit, part of our Upload and Print reportable segment, was not fully recoverable as the reporting unit was forecasting lower projected revenue and profitability levels than originally estimated as of the acquisition date. The carrying amount of the goodwill as of January 1, 2016 was compared to the implied fair value of the goodwill, resulting in a partial impairment loss of $30,841 during the third quarter of fiscal 2016. A portion of the impairment loss was attributed to the noncontrolling interest based on its third-party shareholders' 30% ownership interest.
Our goodwill analysis requires significant judgment, including the identification of reporting units and the amount and timing of expected future cash flows. While we believe our assumptions are reasonable, actual results could differ from our projections. There have been no indications of impairment that would require analysis for any of our other reporting units as of June 30, 2017 or 2016.
Acquired Intangible Assets
June 30, 2017 | June 30, 2016 | ||||||||||||||||||||||
Gross Carrying Amount | Accumulated Amortization | Net Carrying Amount | Gross Carrying Amount | Accumulated Amortization | Net Carrying Amount | ||||||||||||||||||
Trade name | $ | 97,728 | $ | (14,839 | ) | $ | 82,889 | $ | 72,806 | $ | (13,391 | ) | $ | 59,415 | |||||||||
Developed technology | 55,423 | (28,943 | ) | 26,480 | 44,694 | (25,490 | ) | 19,204 | |||||||||||||||
Customer relationships | 179,715 | (44,475 | ) | 135,240 | 146,506 | (43,525 | ) | 102,981 | |||||||||||||||
Customer network and other | 16,291 | (6,185 | ) | 10,106 | 15,974 | (3,896 | ) | 12,078 | |||||||||||||||
Print network | 25,171 | (3,962 | ) | 21,209 | 24,423 | (1,131 | ) | 23,292 | |||||||||||||||
Total intangible assets | $ | 374,328 | $ | (98,404 | ) | $ | 275,924 | $ | 304,403 | $ | (87,433 | ) | $ | 216,970 | |||||||||
Acquired intangible assets amortization expense for the years ended June 30, 2017, 2016 and 2015 was $46,145, $40,563, and $24,263, respectively. The increase in acquired intangible asset amortization is primarily related to our fiscal 2017 acquisition of National Pen and our fiscal 2016 acquisition of WIRmachenDRUCK. Estimated intangible assets amortization expense for each of the five succeeding fiscal years is as follows:
2018 | $ | 48,340 | ||
2019 | 42,126 | |||
2020 | 37,630 | |||
2021 | 37,525 | |||
2022 | 35,996 | |||
$ | 201,617 | |||
87
9. Other Balance Sheet Components
Accrued expenses included the following:
June 30, 2017 | June 30, 2016 | ||||||
Compensation costs | $ | 54,487 | $ | 59,207 | |||
Income and indirect taxes | 34,469 | 39,802 | |||||
Advertising costs | 26,641 | 26,372 | |||||
Interest payable | 5,263 | 5,172 | |||||
Shipping costs | 6,651 | 6,843 | |||||
Production costs | 7,472 | 3,251 | |||||
Sales returns | 4,474 | 2,882 | |||||
Purchases of property, plant and equipment | 3,786 | 4,614 | |||||
Professional costs | 3,021 | 1,543 | |||||
Other | 29,303 | 29,301 | |||||
Total accrued expenses (1) | $ | 175,567 | $ | 178,987 | |||
_____________________
(1) Accrued expenses was impacted by our acquisition of National Pen, resulting in an additional $15,040 of accruals as of June 30, 2017, which are included in each of the respective categories within the table.
Other current liabilities included the following:
June 30, 2017 | June 30, 2016 | ||||||
Contingent earn-out liability (2) | $ | 44,049 | $ | — | |||
Current portion of lease financing obligation | 12,569 | 12,569 | |||||
Current portion of capital lease obligations | 11,573 | 8,011 | |||||
Short-term derivative liabilities | 7,243 | 1,681 | |||||
Mandatorily redeemable noncontrolling interest (3) | 901 | — | |||||
Other | 2,100 | 374 | |||||
Total other current liabilities | $ | 78,435 | $ | 22,635 | |||
Other liabilities included the following:
June 30, 2017 | June 30, 2016 | ||||||
Contingent earn-out liability (2) | $ | — | $ | 3,146 | |||
Long-term capital lease obligations | 28,306 | 21,318 | |||||
Long-term derivative liabilities | 31,936 | 10,949 | |||||
Mandatorily redeemable noncontrolling interest (3) | 2,456 | — | |||||
Other (4) | 31,985 | 24,760 | |||||
Total other liabilities (5) | $ | 94,683 | $ | 60,173 | |||
_____________________
(2) During the third quarter of fiscal 2017, the contingent earn-out liability related to our WIRmachenDRUCK acquisition was reclassified to current liabilities as payment is due in the third quarter of fiscal 2018.
(3) Relates to the mandatorily redeemable noncontrolling interest of Printi LLC. Refer to Note 15 for additional details.
(4) Other liabilities includes $8,713 related to share-based compensation awards associated with our investment in Printi LLC. Refer to Note 15 for additional details.
(5) Total other liabilities was impacted by our acquisition of National Pen, resulting in an additional $8,506 of other liabilities as of June 30, 2017, primarily relating to capital lease obligations, which are included in each of the respective categories within the table.
Contingent earn-out liability
Under the original terms of the WIRmachenDRUCK earn-out arrangement, a portion of the earn-out attributed to the minority selling shareholders was included as a component of purchase consideration as of the
88
acquisition date, with any subsequent changes to fair value recognized within general and administrative expense. This earn-out is calculated on a sliding scale, based on the achievement of cumulative gross profit against a predetermined target. The maximum payout is €40,000 and can be paid at our option in cash or ordinary shares.
The remaining portion of the amount payable to the two majority selling shareholders in the WIRmachenDRUCK acquisition was not included as part of the purchase consideration as of the acquisition date as it was contingent upon their post-acquisition employment and planned to be recognized as expense through the required employment period. During the first quarter of fiscal 2017, in response to a statutory tax notice we amended the terms of the compensation portion of the arrangement with the two majority selling shareholders and we removed the post-acquisition employment requirement. As the arrangement was no longer contingent upon continued employment, we accelerated the recognition of the remaining unrecognized compensation expense.
In addition, the estimated fair value of the contingent liability payable to all selling shareholders in the WIRmachenDRUCK acquisition increased, due to the recent business performance relative to performance targets and the time value impact within the Monte Carlo simulation model. During the fourth quarter of fiscal 2017, we determined it was reasonably certain, based on recent performance, that the maximum earn-out would be achieved. We utilized a probability-based model assuming the maximum payment would be achieved and then discounted appropriately to derive the fair value as of June 30, 2017. We recognized $32,550 and $1,961 of expense during the years ended June 30, 2017 and 2016, respectively, as part of general and administrative expense. As of June 30, 2017, the total liability is $44,049, of which $38,596 relates to the majority shareholders and $5,453 relates to the minority shareholders, which is further discussed in Note 3.
10. Debt
June 30, 2017 | June 30, 2016 | ||||||
Senior secured credit facility | $ | 600,037 | $ | 400,809 | |||
7.0% Senior unsecured notes due 2022 | 275,000 | 275,000 | |||||
Other | 7,541 | 10,088 | |||||
Debt issuance costs and debt discounts | (5,922 | ) | (7,386 | ) | |||
Total debt outstanding, net | 876,656 | 678,511 | |||||
Less short-term debt (1) | 28,926 | 21,717 | |||||
Long-term debt | $ | 847,730 | $ | 656,794 | |||
_____________________
(1) Balances as of June 30, 2017 and June 30, 2016 are both inclusive of short-term debt issuance costs and debt discounts of $1,693 in both periods.
Our Debt
Our various debt arrangements described below contain customary representations, warranties and events of default. As of June 30, 2017, we were in compliance with all financial and other covenants related to our debt.
Senior Secured Credit Facility
As of June 30, 2017, we had a senior secured credit facility of $814,000 as follows:
• | Revolving loans of $690,000 with a maturity date of September 23, 2019 |
• | Term loan of $124,000 amortizing over the loan period, with a final maturity date of September 23, 2019 |
Under the terms of our credit agreement, borrowings bear interest at a variable rate of interest based on LIBOR plus 1.50% to 2.25% depending on our leverage ratio, which is the ratio of our consolidated total indebtedness to our consolidated EBITDA, as defined by the credit agreement. As of June 30, 2017, the weighted-average interest rate on outstanding borrowings was 3.56%, inclusive of interest rate swap rates. We are also required to pay a commitment fee on unused balances of 0.225% to 0.400% depending on our leverage ratio. We have pledged the assets and/or share capital of several of our subsidiaries as collateral for our outstanding debt as of June 30, 2017.
89
On July 13, 2017, we executed an amendment to our senior secured credit facility, and we expanded the total capacity to $1,045,000, which includes $745,000 of revolving loans and $300,000 of term loans. The amendment also extended the maturity date of the senior secured credit facility to July 13, 2022.
Indenture and Senior Unsecured Notes due 2022
On March 24, 2015, we completed a private placement of $275,000 in aggregate principal amount of 7.0% senior unsecured notes due 2022 (the “Notes”). We issued the Notes pursuant to a senior notes indenture dated as of March 24, 2015 among Cimpress N.V., our subsidiary guarantors, and MUFG Union Bank, N.A., as trustee (the "Indenture"). We used the proceeds from the Notes to pay outstanding indebtedness under our unsecured line of credit and our senior secured credit facility and for general corporate purposes.
The Notes bear interest at a rate of 7.0% per annum and mature on April 1, 2022. Interest on the Notes is payable semi-annually on April 1 and October 1 of each year, commencing on October 1, 2015, to the holders of record of the Notes at the close of business on March 15 and September 15, respectively, preceding such interest payment date.
The Notes are senior unsecured obligations and rank equally in right of payment to all our existing and future senior unsecured debt and senior in right of payment to all of our existing and future subordinated debt. The Notes are effectively subordinated to any of our existing and future secured debt to the extent of the value of the assets securing such debt. Subject to certain exceptions, each of our existing and future subsidiaries that is a borrower under or guarantees our senior secured credit facilities will guarantee the Notes.
The Indenture contains various covenants, including covenants that, subject to certain exceptions, limit our and our restricted subsidiaries’ ability to incur and/or guarantee additional debt; pay dividends, repurchase shares or make certain other restricted payments; enter into agreements limiting dividends and certain other restricted payments; prepay, redeem or repurchase subordinated debt; grant liens on assets; enter into sale and leaseback transactions; merge, consolidate or transfer or dispose of substantially all of our consolidated assets; sell, transfer or otherwise dispose of property and assets; and engage in transactions with affiliates.
At any time prior to April 1, 2018, we may redeem some or all of the Notes at a redemption price equal to 100% of the principal amount redeemed, plus a make-whole amount as set forth in the Indenture, plus, in each case, accrued and unpaid interest to, but not including, the redemption date. In addition, at any time prior to April 1, 2018, we may redeem up to 35% of the aggregate outstanding principal amount of the Notes at a redemption price equal to 107% of the principal amount thereof, plus accrued and unpaid interest to, but not including, the redemption date, with the net proceeds of certain equity offerings by Cimpress. At any time on or after April 1, 2018, we may redeem some or all of the Notes at the redemption prices specified in the Indenture, plus accrued and unpaid interest to, but not including, the redemption date.
Other debt
Other debt consists of term loans acquired primarily as part of our fiscal 2015 acquisition of Exagroup SAS. As of June 30, 2017 we had $7,541 outstanding for those obligations that are payable through September 2024.
11. Shareholders’ Equity
Treasury shares
On February 22, 2016 we announced that our Supervisory Board authorized the purchase of up to 6,300,000 of our ordinary shares and during the year ended June 30, 2017 we purchased 593,763 shares under this program for a cost of $50,008. On March 22, 2017, our Supervisory Board authorized the repurchase of up to 6,300,000 of our issued and outstanding ordinary shares on the open market. As of June 30, 2017, no shares have been repurchased under this authorization.
Share-based awards
The 2016 Performance Equity Plan (the "2016 Plan") became effective upon shareholder approval on May 27, 2016 and allows us to grant PSUs, entitling the recipient to receive Cimpress ordinary shares based upon continued service to Cimpress and the achievement of objective, predetermined appreciation of Cimpress' three-
90
year moving average share price. We may grant PSUs under the 2016 Plan to our employees, officers, directors (including members of the Management Board and Supervisory Board), consultants, and advisers. Subject to adjustment in the event of stock splits, stock dividends and other similar events, we may make awards under the 2016 Plan for up to 8,000,000 of our ordinary shares.
The 2011 Equity Incentive Plan (the “2011 Plan”) became effective upon shareholder approval on June 30, 2011 and allows us to grant share options, share appreciation rights, restricted shares, restricted share units and other awards based on our ordinary shares to our employees, officers, non-employee directors, consultants and advisors. Among other terms, the 2011 Plan requires that the exercise price of any share option or share appreciation right granted under the 2011 Plan be at least 100% of the fair market value of the ordinary shares on the date of grant; limits the term of any share option or share appreciation right to a maximum period of 10 years; provides that shares underlying outstanding awards under the Amended and Restated 2005 Equity Incentive Plan that are canceled, forfeited, expired or otherwise terminated without having been issued in full will become available for the grant of new awards under the 2011 Plan; and prohibits the repricing of any share options or share appreciation rights without shareholder approval. In addition, the 2011 Plan provides that the number of ordinary shares available for issuance under the plan will be reduced by (i) 1.56 ordinary shares for each share subject to a restricted share or other share-based award with a per share or per unit purchase price lower than 100% of the fair market value of the ordinary shares on the date of grant and (ii) one ordinary share for each share subject to any other award under the 2011 Plan.
Our 2005 Non-Employee Directors’ Share Option Plan allows us to grant share options to our non-employee directors upon initial appointment as a director and annually thereafter in connection with our annual general meeting of shareholders if they are continuing to serve as a director at such time. We also have two additional plans with outstanding awards from which we will not grant any additional awards.
An aggregate of 9,523,532 ordinary shares were available for future awards under all of our share-based award plans as of June 30, 2017. For PSUs under our 2016 Plan, we assumed that we would issue ordinary shares equal to 250% of the outstanding PSUs, which is the maximum potential share issuance. A combination of new shares and treasury shares has historically been used in fulfillment of our share based awards.
Share options
We have granted options to purchase ordinary shares at prices that are at least equal to the fair market value of the shares on the date the option is granted and have a contractual term of approximately eight to ten years. Options generally vest over 3 years for non-employee supervisory directors and over 4 years for employees.
The fair value of each option award subject only to service period vesting is estimated on the date of grant using the Black-Scholes option pricing model and is recognized as expense on a straight-line basis over the requisite service period. Use of a valuation model requires management to make certain assumptions with respect to inputs. The expected volatility assumption is based upon historical volatility of our share price. The expected term assumption is based on the contractual and vesting term of the option and historical experience. The risk-free interest rate is based on the U.S. Treasury yield curve with a maturity equal to the expected life assumed at the grant date. We value share options with a market condition using a lattice model with compensation expense recorded on an accelerated basis over the requisite service period.
We did not grant any share options in fiscal 2017. Weighted-average values used for option awards in fiscal 2016 and 2015 were as follows:
Year Ended June 30, | |||||||
2016 | 2015 | ||||||
Risk-free interest rate | 1.84 | % | 1.67 | % | |||
Expected dividend yield | — | % | — | % | |||
Expected term (years) | 6.00 | 6.00 | |||||
Expected volatility | 47 | % | 50 | % | |||
Weighted average fair value of options granted | $ | 38.18 | $ | 35.84 | |||
91
A summary of our share option activity and related information for the year ended June 30, 2017 is as follows:
Shares Pursuant to Options | Weighted- Average Exercise Price | Weighted- Average Remaining Contractual Term (years) | Aggregate Intrinsic Value | |||||||||
Outstanding at the beginning of the period | 2,659,991 | $ | 45.21 | 3.3 | ||||||||
Granted | — | — | ||||||||||
Exercised | (495,763 | ) | 38.62 | |||||||||
Forfeited/expired | (25,802 | ) | 50.00 | |||||||||
Outstanding at the end of the period | 2,138,426 | $ | 46.68 | 2.6 | $ | 102,321 | ||||||
Vested or expected to vest at the end of the period | 2,138,426 | $ | 46.68 | 2.6 | $ | 102,321 | ||||||
Exercisable at the end of the period | 1,869,762 | $ | 46.08 | 2.5 | $ | 90,584 | ||||||
The intrinsic value in the table above represents the total pre-tax amount, net of exercise price, which would have been received if all option holders exercised in-the-money options on June 30, 2017. The total intrinsic value of options exercised during the fiscal years ended June 30, 2017, 2016 and 2015 was $25,566, $5,494, and $61,531, respectively.
Performance share units - 2016 Performance Equity Plan
We began granting PSUs under our 2016 Performance Equity Plan during the first quarter of fiscal 2017. The PSU grants entitle the recipient to receive Cimpress ordinary shares between 0% and 250% of the granted amount, based upon continued service to Cimpress and the achievement of a compounded annual growth rate target based on Cimpress' three-year moving average share price that will be assessed annually in years 6 - 10 following the grant date. The fair value of the PSUs is based on a Monte Carlo simulation, and the resulting expense is recognized on an accelerated basis over the requisite service period.
A summary of our PSU activity and related information for the fiscal year ended June 30, 2017 is as follows:
PSUs | Weighted- Average Grant Date Fair Value | Aggregate Intrinsic Value | ||||||||
Outstanding at the beginning of the period | — | $ | — | |||||||
Granted | 441,985 | 123.51 | ||||||||
Vested and distributed | — | — | ||||||||
Forfeited | (66,947 | ) | 126.03 | |||||||
Outstanding at the end of the period | 375,038 | $ | 123.06 | $ | 35,452 | |||||
The weighted average fair value of PSUs granted during the fiscal year ended June 30, 2017 was $123.51 and the total intrinsic value of PSUs earned during the fiscal year ended June 30, 2017 was $35,452. As of June 30, 2017, the number of shares subject to PSUs included in the table above assumes the issuance of one share for each PSU, but based on actual performance that amount delivered can range from zero shares to a maximum of 937,595 shares.
Restricted share units
The fair value of an RSU award is equal to the fair market value of our ordinary shares on the date of grant and the expense is recognized on a straight-line basis over the requisite service period. RSUs generally vest over 2 years for non-employee directors and over 4 years for employees. For awards with a performance condition, we recognize compensation cost on an accelerated basis over the requisite service period when achievement of the performance condition is deemed probable. As of June 30, 2017, we had 164,000 RSUs outstanding that vest based on the achievement of various performance targets through fiscal 2020. The performance criteria for 140,000 of these RSUs are currently deemed not probable of achievement. Future changes in our probability conclusions could result in volatility of our share-based compensation expense as the units have a total fair value of $10,584.
92
A summary of our RSU activity and related information for the fiscal year ended June 30, 2017 is as follows:
RSUs | Weighted- Average Grant Date Fair Value | Aggregate Intrinsic Value | ||||||||
Unvested at the beginning of the period | 600,075 | $ | 67.77 | |||||||
Granted | 25,620 | 97.25 | ||||||||
Vested and distributed | (234,804 | ) | 61.00 | |||||||
Forfeited | (56,521 | ) | 69.07 | |||||||
Unvested at the end of the period | 334,370 | $ | 74.57 | $ | 31,608 | |||||
The weighted average fair value of RSUs granted during the fiscal years ended June 30, 2017, 2016 and 2015 was $97.25, $75.63 and $63.28, respectively. The total intrinsic value of RSUs vested during the fiscal years ended June 30, 2017, 2016 and 2015 was $21,130, $21,810 and $19,846, respectively.
Restricted share awards
As part of our acquisition of Tradeprint during the first quarter of fiscal 2016, we issued 65,050 restricted ordinary shares. The fair value of the RSAs was determined based on our share price on the date of grant and is recognized as share-based compensation expense over the applicable service period. These awards generally vest over a 2 to 4 year period.
A summary of our RSA activity and related information for the fiscal year ended June 30, 2017 is as follows:
RSAs | Weighted- Average Grant Date Fair Value | Aggregate Intrinsic Value | ||||||||
Unvested at the beginning of the period | 81,633 | $ | 68.41 | |||||||
Granted | — | — | ||||||||
Vested and distributed | (69,196 | ) | 87.33 | |||||||
Forfeited | — | — | ||||||||
Unvested at the end of the period | 12,437 | $ | 64.53 | $ | 1,176 | |||||
Share-based compensation
Total share-based compensation costs were $48,627, $23,828 and $24,075 for the years ended June 30, 2017, 2016 and 2015, respectively, and we elected to recognize the impact of forfeitures as they occur. From time to time we issue awards that are considered liability-based awards as they are settleable in cash. During the year ended June 30, 2017, we paid $10,947 for a liability based award associated with our 2014 acquisition of Pixartprinting. As of June 30, 2017, we have a liability-based award associated with our Printi LLC investment, accrued as part of other liabilities in the amount of $8,713. Refer to Note 15 for additional details.
Share-based compensation costs capitalized as part of software and website development costs were $1,546, $832 and $477 for the years ended June 30, 2017, 2016 and 2015, respectively.
As of June 30, 2017, there was $36,843 of total unrecognized compensation cost related to non-vested, share-based compensation arrangements. This cost is expected to be recognized over a weighted average period of 1.9 years.
12. Employees’ Savings Plans
Defined contribution plans
We maintain certain government mandated and defined contribution plans throughout the world. The most significant is our defined contribution retirement plan in the U.S. (the “Plan”) that complies with Section 401(k) of the Internal Revenue Code. Substantially all employees in the U.S. are eligible to participate in the Plan. Under the
93
provisions of the Plan, employees may voluntarily contribute up to 80% of eligible compensation, subject to IRS limitations. We match 50% of each participant’s voluntary contributions, subject to a maximum company contribution of 3% of the participant’s eligible compensation. Employee contributions are fully vested when contributed. Company matching contributions vest over 4 years.
We expensed $11,691, $9,073 and $8,619 for our government mandated and defined contribution plans in the years ended June 30, 2017, 2016 and 2015, respectively. Our expenses from these plans have increased during the year ended June 30, 2017 due to increased headcount, as well as the full year impact of our business acquisitions during the prior period.
Defined benefit plan
We currently have a defined benefit plan that covers substantially all of our employees in Switzerland. Our Swiss plan is a government-mandated retirement fund with benefits generally earned based on years of service and compensation during active employment; however, the level of benefits varies within the plan. Eligibility is determined in accordance with local statutory requirements. Under this plan, both we and certain of our employees with annual earnings in excess of government determined amounts are required to make contributions into a fund managed by an independent investment fiduciary. Employer contributions must be in an amount at least equal to the employee’s contribution. Minimum employee contributions are based on the respective employee’s age, salary, and gender. As of June 30, 2017 and 2016, the plan had an unfunded net pension obligation of approximately $1,658 and $4,007, respectively, and plan assets which totaled approximately $3,920 and $7,080, respectively. For the years ended June 30, 2017, 2016 and 2015 we recognized expense totaling $1,191, $1,820, and $2,043, respectively, related to our Swiss plan. During fiscal 2016, a component of the total expense related to a settlement loss of $506, as a result of headcount reductions in our Switzerland office.
13. Income Taxes
The following is a summary of our (loss) income before income taxes by geography:
Year Ended June 30, | |||||||||||
2017 | 2016 | 2015 | |||||||||
U.S. | $ | 13,390 | $ | 23,057 | $ | 21,567 | |||||
Non-U.S. | (92,707 | ) | 43,038 | 78,186 | |||||||
Total | $ | (79,317 | ) | $ | 66,095 | $ | 99,753 | ||||
The components of the (benefit) provision for income taxes are as follows:
Year Ended June 30, | |||||||||||
2017 | 2016 | 2015 | |||||||||
Current: | |||||||||||
U.S. Federal | $ | (1,144 | ) | $ | 7,915 | $ | 12,680 | ||||
U.S. State | 1,344 | 116 | 2,313 | ||||||||
Non-U.S. | 26,191 | 23,164 | 12,496 | ||||||||
Total current | 26,391 | 31,195 | 27,489 | ||||||||
Deferred: | |||||||||||
U.S. Federal | (1,999 | ) | (2,353 | ) | (4,505 | ) | |||||
U.S. State | (1,497 | ) | 13 | (1,070 | ) | ||||||
Non-U.S. | (30,013 | ) | (13,171 | ) | (11,473 | ) | |||||
Total deferred | (33,509 | ) | (15,511 | ) | (17,048 | ) | |||||
Total | $ | (7,118 | ) | $ | 15,684 | $ | 10,441 | ||||
94
The following is a reconciliation of the standard U.S. federal statutory tax rate and our effective tax rate:
Year Ended June 30, | ||||||||
2017 | 2016 | 2015 | ||||||
U.S. federal statutory income tax rate | 35.0 | % | 35.0 | % | 35.0 | % | ||
State taxes, net of federal effect | (0.1 | ) | 0.1 | 0.8 | ||||
Tax rate differential on non-U.S. earnings | (15.5 | ) | (35.7 | ) | (23.8 | ) | ||
Impact of goodwill impairment charge | (1.6 | ) | 16.1 | — | ||||
Compensation related items | 7.4 | (2.2 | ) | 0.8 | ||||
Change in valuation allowance | (21.9 | ) | 26.9 | 8.0 | ||||
Nondeductible acquisition-related payments | (18.0 | ) | 4.0 | 4.0 | ||||
Notional interest deduction (Italy) | 5.0 | (5.3 | ) | (2.5 | ) | |||
Net tax benefit on intellectual property transfer | 13.8 | (17.7 | ) | (12.2 | ) | |||
Tax on unremitted earnings | (1.3 | ) | 4.3 | 0.2 | ||||
Tax credits and incentives | 7.1 | (4.0 | ) | (1.7 | ) | |||
Other | (0.9 | ) | 2.2 | 1.9 | ||||
Effective income tax rate | 9.0 | % | 23.7 | % | 10.5 | % | ||
Our effective tax rate for all periods presented is below the U.S. federal statutory rate of 35% primarily as a result of the majority of our pretax income being earned in jurisdictions outside the U.S. where the applicable tax rates are lower than the U.S. federal statutory rate. The jurisdictions that have the most significant impact to our non-U.S. tax provision include Australia, Canada, France, Germany, Italy, the Netherlands, Spain and Switzerland. The applicable tax rates in these jurisdictions range from 10% - 34%. The total tax rate benefit from operating in non-U.S. jurisdictions is included in the line “Tax rate differential on non-U.S. earnings” in the above tax rate reconciliation table.
For the year ended June 30, 2017, our effective tax rate was 9.0% as compared to the prior year effective tax rate of 23.7%. The tax rate for fiscal year 2017 was based on a consolidated loss as compared to a profit in fiscal year 2016. This, combined with a more favorable geographical mix of earnings in fiscal year 2017, resulted in a lower effective tax rate for the year. In addition, we recorded a larger goodwill impairment charge in fiscal year 2016 as compared to fiscal year 2017 (discussed in Note 8) which is non-deductible for tax purposes. This was offset by increased nondeductible acquisition-related charges in fiscal year 2017 as compared to fiscal year 2016. Also, in fiscal year 2017 we recognized increased tax benefits associated with the vesting of share-based compensation awards, research and development credits and other incentives (primarily in the U.S. and Italy) as compared to fiscal year 2016. Our tax rate was higher in fiscal year 2016 as compared to fiscal year 2015 primarily due to the nondeductible goodwill impairment charge in fiscal year 2016.
In our fiscal year 2016 we adopted ASU No. 2016-09, "Compensation - Stock Compensation (Topic 718): Improvement to Employee Share-Based Payment Accounting." This resulted in tax benefits of $8,003 and $3,456 recognized in income tax (benefit) expense in the consolidated statement of operations for the years ended June 30, 2017 and 2016, respectively, which previously would have been recognized in additional paid-in capital in the consolidated balance sheet.
In fiscal year 2014, we made changes to our corporate entity operating structure, including transferring our intellectual property among certain of our subsidiaries, primarily to align our corporate entities with our evolving operations and business model. The transfer of assets occurred between wholly owned legal entities within the Cimpress group that are based in different tax jurisdictions. As the impact of the transfer was the result of an intra-entity transaction, any resulting gain or loss and immediate tax impact on the transfer is eliminated and not recognized in the consolidated financial statements under U.S. GAAP. The transferor entity recognized a gain on the transfer of assets that was not subject to income tax in its local jurisdiction. Our subsidiary based in Switzerland was the recipient of the intellectual property. In accordance with Swiss tax law, we are entitled to amortize the fair market value of the intellectual property received at the date of transfer over five years for tax purposes. The tax benefit associated with the amortization of the intellectual property was $12,696 and $12,764 in fiscal years ended June 30, 2017 and 2016, respectively. The impact of this tax benefit to our effective tax rate is included in the line "Net tax (benefit) expense on intellectual property transfer" in the above tax rate reconciliation table.
95
In fiscal year 2012, one of our subsidiaries purchased certain intellectual property and intangible assets of Webs, Inc., and we recognize the tax expense associated with the intra-entity transfer of these assets over a period equal to the expected economic lives of the assets. We elected to fund the transfer of these assets using an installment obligation payable over a 7.5-year period, and accordingly we recorded a deferred tax liability for the entire tax liability owed but not yet paid as of the date of the transaction with a corresponding asset in "Other Assets" to reflect the deferred tax charge to be recognized over the expected remaining lives of the assets. Refer to Note 17 - Commitment and Contingencies - for additional information regarding this obligation.
Significant components of our deferred income tax assets and liabilities consisted of the following at June 30, 2017 and 2016:
Year Ended June 30, | |||||||
2017 | 2016 | ||||||
Deferred tax assets: | |||||||
Net operating loss carryforwards | $ | 85,728 | $ | 52,469 | |||
Depreciation and amortization | 2,331 | 999 | |||||
Accrued expenses | 6,478 | 4,387 | |||||
Share-based compensation | 20,999 | 17,017 | |||||
Credit and other carryforwards | 2,688 | 953 | |||||
Derivative financial instruments | 7,121 | 2,799 | |||||
Other | 3,060 | 2,923 | |||||
Subtotal | 128,405 | 81,547 | |||||
Valuation allowance | (56,953 | ) | (35,429 | ) | |||
Total deferred tax assets | 71,452 | 46,118 | |||||
Deferred tax liabilities: | |||||||
Depreciation and amortization | (71,477 | ) | (75,390 | ) | |||
IP installment obligation | (6,460 | ) | (9,608 | ) | |||
Tax on unremitted earnings | (4,374 | ) | (3,233 | ) | |||
Other | (1,880 | ) | (1,223 | ) | |||
Total deferred tax liabilities | (84,191 | ) | (89,454 | ) | |||
Net deferred tax liabilities | $ | (12,739 | ) | $ | (43,336 | ) | |
In assessing the realizability of deferred tax assets, we consider whether it is more likely than not that some portion or all of the deferred tax assets will not be realized. The increase in the valuation allowance from the prior year relates primarily to losses incurred in certain jurisdictions (mainly Brazil, China, India, Japan and the Netherlands) for which management has determined, based on current profitability projections, that it is more likely than not that these losses will not be utilized within the applicable carryforward periods available under local law. We have not recorded a valuation allowance against $33,111 of deferred tax asset associated with current and prior year tax losses generated in Switzerland. Management believes there is sufficient positive evidence in the form of historical and future projected profitability to conclude that it is more likely than not that all of the losses in Switzerland will be utilized against future taxable profits within the available carryforward period. Our assessment is reliant on the attainment of our future operating profit goals. Failure to achieve these operating profit goals may change our assessment of this deferred tax asset, and such change would result in an additional valuation allowance and an increase in income tax expense to be recorded in the period of the change in assessment. We will continue to review our forecasts and profitability trends on a quarterly basis.
Additionally, we have recorded a full valuation allowance against $7,076 of deferred tax asset related to an interest rate derivative instrument for which management has determined, based on current profitability projections, that it is more likely than not that it will not be recognized in the foreseeable future. The impact of this deferred tax asset and associated valuation allowance has been recorded in accumulated other comprehensive (loss) income on the balance sheet.
No valuation allowance has been recorded against the $20,999 deferred tax asset associated with share-based compensation charges at June 30, 2017. However, in the future, if the underlying awards expire, are
96
released or are exercised with an intrinsic value less than the fair value of the awards on the date of grant, some or all of the benefit may not be realizable.
Based on the weight of available evidence at June 30, 2017, management believes that it is more likely than not that all other net deferred tax assets will be realized in the foreseeable future. We will continue to assess the realization of the deferred tax assets based on operating results.
A reconciliation of the beginning and ending amount of the valuation allowance for the year ended June 30, 2017 is as follows:
Balance at June 30, 2016 | $ | 35,429 | |
Charges to earnings (1) | 16,674 | ||
Charges to other accounts (2) | 4,850 | ||
Balance at June 30, 2017 | $ | 56,953 | |
_________________
(1) Amount is primarily related to non-U.S. net operating losses.
(2) Amount is primarily related to unrealized losses on cross-currency swap contracts included in other comprehensive income (loss) and an increase in deferred tax assets on non-U.S. net operating losses due to currency exchange rate changes.
The decrease in deferred tax liabilities during fiscal 2017 is primarily attributable to increased net operating losses in Switzerland, offset by deferred tax liabilities of $3,255 related to intangible and other assets from the acquisition of National Pen.
As of June 30, 2017, we had gross U.S. federal and state net operating losses of approximately $3,091 that expire on various dates from fiscal 2030 through fiscal 2035. We had gross non-U.S. net operating loss and other carryforwards of $523,754, a significant amount of which expire in fiscal 2021, with the remaining amounts expiring on various dates from fiscal 2019 through fiscal 2037. The benefits of these carryforwards are dependent upon the generation of taxable income in the jurisdictions where they arose.
We consider the following factors, among others, in evaluating our plans for indefinite reinvestment of our subsidiaries’ earnings: (i) the forecasts, budgets and financial requirements of both our parent company and its subsidiaries, both for the long term and for the short term; and (ii) the tax consequences of any decision to reinvest earnings of any subsidiary. As of June 30, 2017, no tax provision has been made for $27,406 of undistributed earnings of certain of our subsidiaries as these earnings are considered indefinitely reinvested. If, in the future, we decide to repatriate the undistributed earnings from these subsidiaries in the form of dividends or otherwise, we could be subject to withholding taxes payable in the range of $6,500 to $7,500 at that time. A cumulative deferred tax liability of $4,374 has been recorded attributable to undistributed earnings that we have deemed are no longer indefinitely reinvested. The remaining undistributed earnings of our subsidiaries are not deemed to be indefinitely reinvested and can be repatriated at no tax cost. Accordingly, there has been no provision for income or withholding taxes on these earnings.
A reconciliation of the gross beginning and ending amount of unrecognized tax benefits is as follows:
Balance June 30, 2015 | $ | 5,710 | |
Additions based on tax positions related to the current tax year | 328 | ||
Additions based on tax positions related to prior tax years | 132 | ||
Reductions based on tax positions related to prior tax years | (363 | ) | |
Reductions due to audit settlements | (1,129 | ) | |
Reductions due to lapse of statute of limitations | (429 | ) | |
Balance June 30, 2016 | $ | 4,249 | |
Additions based on tax positions related to the current tax year | 632 | ||
Additions based on tax positions related to prior tax years | 1,580 | ||
Reductions based on tax positions related to prior tax years | (30 | ) | |
Reductions due to audit settlements | (1,048 | ) | |
Balance June 30, 2017 | $ | 5,383 | |
97
For the years ended June 30, 2017 and 2016, the amount of unrecognized tax benefits (exclusive of interest) that, if recognized, would impact the effective tax rate is $3,069 and $1,893, respectively. We recognize interest and, if applicable, penalties related to unrecognized tax benefits in income tax expense. The accrued interest and penalties recognized as of June 30, 2017 and 2016 were $384 and $142, respectively. It is reasonably possible that a further change in unrecognized tax benefits in the range of $1,000 to $1,200 may occur within the next twelve months related to the settlement of one or more audits or the lapse of applicable statutes of limitations. We believe we have appropriately provided for all tax uncertainties.
We conduct business in a number of tax jurisdictions and, as such, are required to file income tax returns in multiple jurisdictions globally. The years 2013 through 2016 remain open for examination by the United States Internal Revenue Service (“IRS”) and the years 2011 through 2016 remain open for examination in the various states and non-US tax jurisdictions in which we file tax returns.
We are currently under income tax audit in certain jurisdictions globally. We believe that our income tax reserves are adequately maintained taking into consideration both the technical merits of our tax return positions and ongoing developments in our income tax audits. However, the final determination of our tax return positions, if audited, is uncertain, and there is a possibility that final resolution of these matters could have a material impact on our results of operations or cash flows.
14. Noncontrolling Interests
In certain of our strategic investments we have purchased a controlling equity stake, but there remains a minority portion of the equity that is owned by a third party. The balance sheet and operating activity of these entities are included in our consolidated financial statements and we adjust the net (loss) income in our consolidated statement of operations to exclude the noncontrolling interests' proportionate share of results. We present the proportionate share of equity attributable to the redeemable noncontrolling interests as temporary equity within our consolidated balance sheet and the proportionate share of noncontrolling interests not subject to a redemption provision that is outside of our control as equity.
Redeemable noncontrolling interests
On April 15, 2015, we acquired 70% of the outstanding shares of Exagroup SAS. The remaining 30% is considered a redeemable noncontrolling equity interest, as it is redeemable in the future and not solely within our control. The Exagroup noncontrolling interest, redeemable at a fixed amount of €39,000, was recorded at its fair value as of the acquisition date and will be adjusted to its redemption value on a periodic basis, if that amount exceeds its carrying value. During the year ended June 30, 2016, the losses attributable to the noncontrolling interest, primarily due to the goodwill impairment loss as discussed in Note 8, reduced the carrying value below the fixed redemption amount. We recorded an adjustment of $7,025 to increase the carrying value to the fixed redemption amount, which offset the net loss attributable to noncontrolling interest during the year ended June 30, 2016. As of June 30, 2017, the redemption value was less than the carrying value, and therefore no adjustment was required.
On April 3, 2014, we acquired 97% of the outstanding corporate capital of Pixartprinting S.p.A. The remaining 3% was considered a redeemable noncontrolling equity interest, as it was redeemable for cash based on financial results and was not solely within our control. During year ended June 30, 2016, we increased the carrying amount of the redeemable noncontrolling interest by $5,879 to reflect the estimated redemption value as of June 30, 2016. As the formulaic redemption value exceeded the fair value of noncontrolling interest as of June 30, 2016, $960 of the accretion was recorded as an offset to the net loss attributable to noncontrolling interest with the remaining accretion of $4,919 recorded to retained earnings. During fiscal 2017, we purchased the remaining equity interest for €10,406 ($10,947 based on the exchange rate as of the redemption date).
We previously owned a 51% controlling interest in a joint business arrangement with Plaza Create Co. Ltd., a leading Japanese retailer of photo products, to expand our market presence in Japan. During the second quarter of fiscal 2017, we purchased the remaining 49% noncontrolling interest for $9,352. The purchase was recognized as an equity transaction, which resulted in the difference between the carrying value of the noncontrolling interest and purchase price, adjusted within additional paid-in capital.
98
Noncontrolling interest
On August 7, 2014, we made a capital investment in Printi LLC; however during the fourth quarter of fiscal 2017 we modified the terms of the arrangement resulting in a reclassification of the noncontrolling interest to a liability as described in Note 15. As of June 30, 2017, the remaining noncontrolling interest includes a third-party investment in one of our acquired subsidiaries.
The following table presents the reconciliation of changes in our noncontrolling interests:
__________________
Redeemable noncontrolling interests | Noncontrolling interest | |||||||
Balance as of June 30, 2015 | $ | 57,738 | $ | 512 | ||||
Capital contribution from noncontrolling interest | 5,141 | — | ||||||
Accretion to redemption value recognized in retained earnings (1) | 4,919 | — | ||||||
Accretion to redemption value recognized in net loss attributable to noncontrolling interest (2) | 7,985 | — | ||||||
Adjustment to noncontrolling interest | — | (74 | ) | |||||
Net loss attributable to noncontrolling interest | (11,840 | ) | (83 | ) | ||||
Dividend paid to noncontrolling interest | (368 | ) | — | |||||
Foreign currency translation | 1,726 | (4 | ) | |||||
Balance as of June 30, 2016 | $ | 65,301 | $ | 351 | ||||
Capital contribution from noncontrolling interest | 1,404 | — | ||||||
Accretion to redemption value recognized in net loss attributable to noncontrolling interest (2) | 372 | — | ||||||
Net (loss) income attributable to noncontrolling interest | (864 | ) | 4 | |||||
Purchase of noncontrolling interests (3) | (20,299 | ) | — | |||||
Sale of noncontrolling interest | — | (90 | ) | |||||
Foreign currency translation | (502 | ) | (52 | ) | ||||
Balance as of June 30, 2017 | $ | 45,412 | $ | 213 | ||||
(1) Accretion of redeemable noncontrolling interests to redemption value recognized in retained earnings is the result of the redemption amount estimated to be greater than carrying value but less than fair value.
(2) Accretion to redemption value recognized in net loss attributable to noncontrolling interest is the result of the redemption amount estimated to be greater than both the carrying value and fair value of the noncontrolling interest.
(3) During fiscal 2017, we purchased the Pixartprinting and Japanese joint venture noncontrolling interests for $10,947 and $9,352, respectively.
15. Variable Interest Entity ("VIE")
On August 7, 2014, we made a capital investment in Printi LLC, which operates in Brazil. This investment provides us access to a new market and the opportunity to drive longer-term growth in Brazil and other geographies as Printi expands internationally in the future. As of June 30, 2017, we have a 49.99% equity interest in Printi. Based upon the level of equity investment at risk, Printi is considered a variable interest entity. The shareholders of Printi share profits and voting control on a pro-rata basis. While we do not manage the day to day operations of Printi, we do have the unilateral ability to exercise participating voting rights for specific transactions and as such no one shareholder is considered to be the primary beneficiary. However, certain significant shareholders cannot transfer their equity interests without our approval and as a result are considered de facto agents on our behalf in accordance with ASC 810-10-25-43.
In aggregating our rights, as well as those of our de facto agents, the group as a whole has both the power to direct the activities that most significantly impact the entity's economic performance and the obligation to absorb losses and the right to receive benefits from the entity. In situations where a de facto agency relationship is present, one party is required to be identified as the primary beneficiary and the evaluation requires significant judgment. The factors considered include the presence of a principal/agent relationship, the relationship and significance of activities to the reporting entity, the variability associated with the VIE's anticipated economics and the design of the VIE. The analysis is qualitative in nature and is based on weighting the relative importance of each of the factors in relation to the specifics of the VIE arrangement. Upon our investment we performed an analysis and concluded that we are the party that is most closely associated with Printi, as we are most exposed to the variability of the economics and therefore considered the primary beneficiary.
99
We previously had call options with certain employee shareholders to increase our ownership in Printi incrementally over an eight-year period. On May 22, 2017, we modified the terms of the future put and call options and agreed to purchase an additional 3.7% non-voting economic interest during the fourth quarter of fiscal 2018. In addition, we will acquire the remaining equity interest in Printi through a reciprocal put and call structure, exercisable from March 31, 2021 through a mandatory redemption date of July 31, 2023. As the remaining equity interests are mandatorily redeemable by all parties no later than a specified future date, the noncontrolling interest is within the scope of ASC 480 and is required to be presented as a liability on our consolidated balance sheet. As of the amendment date, we reclassified the mandatorily redeemable noncontrolling interest to a liability and adjusted the liability to the fair value of $3,357, using an option pricing model, with an offsetting adjustment to additional paid-in capital. We will adjust the liability to its estimated redemption value each reporting period and recognize any changes within interest expense, net in our consolidated statement of operations.
Under the original terms of our arrangement, a portion of our call options were for Printi restricted stock held by Printi employees that was contingent on post-acquisition employment and recognized as share-based compensation over a four-year vesting period. As part of the modification, we eliminated the employment vesting provisions resulting in the acceleration of expense for the remaining awards not previously vested. The awards will continue to be considered liability-based awards and marked to fair value each reporting period until cash settlement. As of June 30, 2017, through the use of an option pricing model we estimate the current fair value to be $8,713 and we have recognized $5,803, $1,517 and $1,405 in general and administrative expense for the years ended June 30, 2017, 2016 and 2015, respectively.
As part of the amended arrangement, we agreed to lend two Printi employees up to $24,000 that is payable on the date the put or call option is exercised, which will occur no later than July 31, 2023. On July 10, 2017, $12,000 of the loan was drawn and will be considered a long-term loan receivable in our consolidated financial statements in the first quarter of fiscal 2018. The loans carry 8.5% annual interest and the loans are not contingent upon continued employment. We expect that the loan proceeds will be used to offset our purchase of the remaining noncontrolling interest in the future.
16. Segment Information
Our operating segments are based upon the manner in which our operations are managed and the availability of separate financial information reported internally to the Chief Executive Officer, who is our Chief Operating Decision Maker (“CODM”) for purposes of making decisions about how to allocate resources and assess performance. As of June 30, 2017 we have numerous operating segments under our management reporting structure which are reported in the following four reportable segments:
• | Vistaprint - Includes the operations of our Vistaprint-branded websites focused on the North America, Europe, Australia and New Zealand markets, and our Webs-branded business, which is managed with the Vistaprint-branded digital business in the previously listed geographies. |
• | Upload and Print - Includes the results of our druck.at, Easyflyer, Exagroup, Pixartprinting, Printdeal, Tradeprint, and WIRmachenDRUCK branded businesses. |
• | National Pen - Includes the global operations of our National Pen branded businesses, which manufacture and market custom writing instruments and promotional products, apparel and gifts. |
• | All Other Businesses - Includes the operations of our Albumprinter, Most of World, and Corporate Solutions businesses. Our Most of World businesses are focused on our emerging market portfolio, including operations in Brazil, China, India and Japan. These businesses have been combined into one reportable segment based on materiality. |
As part of the reorganization announced in January 2017, several groups that previously were part of our corporate and global functions, including significant portions of our technology, manufacturing and supply chain, finance, legal and other related groups, have been decentralized into our operating segments. This change is intended to improve accountability for customer satisfaction and capital returns, simplify decision-making, improve the speed of execution, further develop our cadre of general managers, and release entrepreneurial energy. The majority of the groups transferred into our operating segments joined our Vistaprint business and to a smaller extent our Upload and Print businesses. We revised our presentation of all prior periods presented to reflect our revised segment reporting.
100
Corporate and global functions now consist primarily of global procurement and supplier research, a central technology team whose primary focus is building the mass customization platform, and essential corporate services, such as the corporate finance, communications, strategy and legal functions. Corporate and global functions is a cost center and does not meet the definition of an operating segment.
We began granting PSUs under our 2016 Plan during the first quarter of fiscal 2017. The PSU expense value is based on a Monte Carlo fair value analysis and is required to be expensed on an accelerated basis. In order to ensure comparability in measuring our businesses results, we allocate the straight-line portion of the fixed grant value to our businesses. Any expense in excess of the amount as a result of the fair value measurement of the PSUs and the accelerated expense profile of the awards is recognized within corporate and global functions.
Adjusted net operating profit (loss) is the primary metric by which our CODM measures segment financial performance and allocates resources. Certain items are excluded from segment adjusted net operating profit (loss), such as acquisition-related amortization and depreciation, expense recognized for contingent earn-out related charges, including the changes in fair value of contingent consideration and compensation expense related to cash-based earn-out mechanisms dependent upon continued employment, share-based compensation related to investment consideration, certain impairment expense, and restructuring charges. A portion of the interest expense associated with our Waltham lease is included as expense in adjusted net operating profit (loss) and allocated based on headcount to the appropriate business or corporate and global function. The interest expense represents a portion of the cash rent payment and is considered an operating expense for purposes of measuring our segment performance. There are no internal revenue transactions between our operating segments, and we do not allocate non-operating income to our segment results. All intersegment transfers are recorded at cost for presentation to the CODM; for example, we allocate costs related to products manufactured by our global network of production facilities to the applicable operating segment. There is no intercompany profit or loss recognized on these transactions.
Our All Other Businesses reportable segment includes our Most of World and Corporate Solutions businesses, which have operating losses as they are in the early stage of investment relative to the scale of the underlying businesses, which may limit its comparability to other segments regarding adjusted net operating profit (loss).
Our balance sheet information is not presented to the CODM on an allocated basis, and therefore we do not present asset information by segment.
Revenue by segment is based on the business-specific websites through which the customer’s order was transacted. The following tables set forth revenue, adjusted net operating profit (loss) by reportable segment, total (loss) income from operations and total (loss) income before taxes.
Year Ended June 30, | |||||||||||
2017 | 2016 | 2015 | |||||||||
Revenue: | |||||||||||
Vistaprint | $ | 1,305,285 | $ | 1,217,162 | $ | 1,149,706 | |||||
Upload and Print | 588,613 | 432,638 | 197,075 | ||||||||
National Pen | 112,712 | — | — | ||||||||
All Other Businesses | 128,795 | 138,244 | 147,425 | ||||||||
Total revenue | $ | 2,135,405 | $ | 1,788,044 | $ | 1,494,206 | |||||
During the fourth quarter of fiscal 2017, we identified errors related to our unaudited segment profitability disclosures that were recast and reported during the third quarter of fiscal 2017. As part of this process we transferred, in error, certain costs from our corporate and global functions cost center to our Vistaprint segment. This resulted in the understatement of Vistaprint's adjusted net operating profit of $5,591 and $7,998 for the nine months ended March 31, 2017 and 2016, respectively and $2,727 for the three months ended March 31, 2016. This also resulted in an offsetting understatement of the costs of our corporate and global functions for the same amounts for the periods included above. The impacts of these errors have been revised within our results for the years ended June 30, 2017 and 2016. We have determined that these errors were not material, individually or in the aggregate, to any of the previously issued financial statements. Revisions to the applicable prior periods are reflected in the financial information herein and will be reflected in future filings containing such financial
101
information. The revision had no net impact on our consolidated balance sheet, consolidated statements of comprehensive income (loss) and of cash flows for any prior periods.
Year Ended June 30, | |||||||||||
2017 | 2016 | 2015 | |||||||||
Adjusted net operating profit (loss) by segment: | |||||||||||
Vistaprint | $ | 165,193 | $ | 213,027 | $ | 193,048 | |||||
Upload and Print | 63,833 | 58,643 | 23,511 | ||||||||
National Pen | (2,225 | ) | — | — | |||||||
All Other Businesses | (30,747 | ) | (8,924 | ) | 10,699 | ||||||
Total adjusted net operating profit (loss) by segment | 196,054 | 262,746 | 227,258 | ||||||||
Corporate and global functions | (116,803 | ) | (96,592 | ) | (84,622 | ) | |||||
Acquisition-related amortization and depreciation | (46,402 | ) | (40,834 | ) | (24,265 | ) | |||||
Earn-out related charges (1) | (40,384 | ) | (6,378 | ) | (15,276 | ) | |||||
Share-based compensation related to investment consideration | (9,638 | ) | (4,835 | ) | (3,569 | ) | |||||
Certain impairments (2) | (9,556 | ) | (41,820 | ) | — | ||||||
Restructuring related charges | (26,700 | ) | (381 | ) | (3,202 | ) | |||||
Interest expense for Waltham lease | 7,727 | 6,287 | — | ||||||||
Total (loss) income from operations | (45,702 | ) | 78,193 | 96,324 | |||||||
Other income, net | 10,362 | 26,098 | 20,134 | ||||||||
Interest expense, net | (43,977 | ) | (38,196 | ) | (16,705 | ) | |||||
(Loss) income before income taxes | $ | (79,317 | ) | $ | 66,095 | $ | 99,753 | ||||
___________________
(1) Includes expense recognized for the change in fair value of contingent consideration and compensation expense related to cash-based earn-out mechanisms dependent upon continued employment.
(2) Includes the impact for certain impairments or abandonments of goodwill and other long-lived assets as defined by ASC 350 - "Intangibles - Goodwill and Other" or ASC 360 - "Property, plant, and equipment."
Year Ended June 30, | |||||||||||
2017 | 2016 | 2015 | |||||||||
Depreciation and amortization: | |||||||||||
Vistaprint | $ | 63,923 | $ | 40,686 | $ | 40,075 | |||||
Upload and Print | 56,073 | 47,696 | 24,539 | ||||||||
National Pen | 10,269 | — | — | ||||||||
All Other Businesses | 15,074 | 18,111 | 15,258 | ||||||||
Corporate and global functions | 13,061 | 25,425 | 17,628 | ||||||||
Total depreciation and amortization | $ | 158,400 | $ | 131,918 | $ | 97,500 | |||||
Enterprise Wide Disclosures:
The following tables set forth revenues by geographic area and groups of similar products and services:
Year Ended June 30, | |||||||||||
2017 | 2016 | 2015 | |||||||||
United States | $ | 901,061 | $ | 781,335 | $ | 718,072 | |||||
Germany (1) | 256,069 | 125,356 | 54,129 | ||||||||
Other (2) | 978,275 | 881,353 | 722,005 | ||||||||
Total revenue | $ | 2,135,405 | $ | 1,788,044 | $ | 1,494,206 | |||||
102
Year Ended June 30, | |||||||||||
2017 | 2016 | 2015 | |||||||||
Physical printed products and other (3) | $ | 2,076,564 | $ | 1,724,676 | $ | 1,423,110 | |||||
Digital products/services | 58,841 | 63,368 | 71,096 | ||||||||
Total revenue | $ | 2,135,405 | $ | 1,788,044 | $ | 1,494,206 | |||||
__________________
(1) During the fiscal year ended June 30, 2017, our revenues within the German market exceeded 10% of our total consolidated revenue. Therefore we have presented Germany as a significant geographic area and recast all prior periods.
(2) Our other revenue includes the Netherlands, our country of domicile.
(3) Other revenue includes miscellaneous items which account for less than 1% of revenue.
The following tables set forth long-lived assets by geographic area:
June 30, 2017 | June 30, 2016 | ||||||
Long-lived assets (4): | |||||||
Canada | $ | 85,926 | $ | 89,888 | |||
Netherlands | 83,223 | 91,053 | |||||
United States | 64,034 | 32,977 | |||||
Switzerland | 49,017 | 38,501 | |||||
Italy | 44,423 | 34,086 | |||||
Australia | 22,961 | 24,358 | |||||
France | 22,794 | 24,561 | |||||
Jamaica | 21,492 | 22,604 | |||||
Japan | 20,686 | 23,213 | |||||
Other | 64,377 | 53,059 | |||||
Total | $ | 478,933 | $ | 434,300 | |||
___________________
(4) Excludes goodwill of $514,963 and $466,005, intangible assets, net of $275,924 and $216,970, the Waltham lease asset of $116,045 and $120,168, and deferred tax assets of $48,004 and $26,093 as of June 30, 2017 and June 30, 2016, respectively.
17. Commitments and Contingencies
Lease Commitments
We have commitments under operating leases for our facilities that expire on various dates through 2026, including the Waltham lease arrangement discussed in Note 2. Total lease expense, net of sublease income, for the years ended June 30, 2017, 2016 and 2015 was $13,959, $12,943, and $16,926, respectively.
We lease certain machinery and plant equipment under both capital and operating lease agreements that expire at various dates through 2023. The aggregate carrying value of the leased equipment under capital leases included in property, plant and equipment, net in our consolidated balance sheet at June 30, 2017, is $40,771, net of accumulated depreciation of $26,550; the present value of lease installments not yet due included in other current liabilities and other liabilities in our consolidated balance sheet at June 30, 2017 amounts to $39,879.
Operating lease obligations | Build-to-suit lease obligation (1) | Capital lease obligation | Total lease obligations | ||||||||||||
2018 | $ | 13,344 | $ | 12,569 | $ | 13,916 | $ | 39,829 | |||||||
2019 | 9,446 | 12,569 | 10,721 | 32,736 | |||||||||||
2020 | 8,893 | 12,569 | 7,590 | 29,052 | |||||||||||
2021 | 7,426 | 12,569 | 3,992 | 23,987 | |||||||||||
2022 | 4,522 | 12,569 | 1,838 | 18,929 | |||||||||||
Thereafter | 6,512 | 46,403 | 3,253 | 56,168 | |||||||||||
Total | $ | 50,143 | $ | 109,248 | $ | 41,310 | $ | 200,701 | |||||||
__________
103
(1) Minimum payments relate to our Waltham lease obligation, refer to Note 2 for additional details.
Purchase Obligations
At June 30, 2017, we had unrecorded commitments under contract of $29,697, which were primarily composed of commitments for production and computer equipment purchases of approximately $5,540. In addition, we had purchase commitments for third-party web services of $5,000, professional and consulting fees of approximately $5,672, inventory purchase commitments of $2,358, commitments for advertising campaigns of $2,605, and other unrecorded purchase commitments of $8,522.
Debt
The required principal payments due during the next five years and thereafter under our outstanding long-term debt obligations at June 30, 2017 are as follows:
2018 | $ | 30,542 | ||
2019 | 79,452 | |||
2020 | 494,809 | |||
2021 | 1,184 | |||
2022 | 768 | |||
Thereafter | 275,823 | |||
Total | $ | 882,578 | ||
On July 13, 2017, we executed an amendment to our senior secured credit facility, and we expanded the total capacity to $1,045,000, which includes $745,000 of revolving loans and $300,000 of term loans. The amendment also extended the maturity date of the senior secured credit facility to July 13, 2022.
Other Obligations
We have an outstanding installment obligation of $6,460 related to the fiscal 2012 intra-entity transfer of the intellectual property of our subsidiary Webs, Inc., which results in tax being paid over a 7.5 year term and has been classified as a deferred tax liability in our consolidated balance sheet as of June 30, 2017. Other obligations also include a contingent earn-out liability for our fiscal 2016 WIRmachenDRUCK acquisition, based on the achievement of certain financial targets, payable at our option in cash or ordinary shares in fiscal 2018 of $44,049. Refer to Note 9 for additional discussion related to the contingent earn-out liability. We have also agreed to a loan arrangement with two Printi employees, which includes an initial draw on the loans in the amount of $12,000 during the first quarter of fiscal 2018. Refer to Note 15 for additional details. In addition, we have deferred payments related to our fiscal 2015 and 2016 acquisitions of $2,075 in aggregate.
Legal Proceedings
We are not currently party to any material legal proceedings. Although we cannot predict with certainty the results of litigation and claims to which we may be subject from time to time, we do not expect the resolution of any of our current matters to have a material adverse impact on our consolidated results of operations, cash flows or financial position. In all cases, at each reporting period, we evaluate whether or not a potential loss amount or a potential range of loss is probable and reasonably estimable under the provisions of the authoritative guidance that addresses accounting for contingencies. We expense the costs relating to our legal proceedings as those costs are incurred.
18. Restructuring Charges
On January 23, 2017, the Supervisory Board of Cimpress N.V. approved a plan to restructure the company and implement organizational changes that decentralized the company’s operations in order to improve accountability for customer satisfaction and capital returns, simplify decision-making, and improve the speed of execution. In order to enact the plan, we transferred approximately 3,000 team members that were part of central teams into our businesses. We also reduced the scope of certain other roles and functions that were previously
104
performed centrally, which led to the termination of approximately 135 employees, and reduction of planned hiring in targeted areas. We also eliminated the positions of four Cimpress executive officers who, as a result, left the company.
The restructuring event discussed above resulted in additional costs, within our corporate and global functions cost center of $25,584 for the year ended June 30, 2017. In addition, for the year ended June 30, 2017 we recognized $1,116 of restructuring costs within our National Pen business related to a separate initiative. Restructuring costs include one-time employee termination benefits, acceleration of share-based compensation, and other related costs including third-party professional and outplacement services and abandonment of production equipment. We do not expect any material additional restructuring charges in future periods as it relates to these restructuring activities.
The restructuring charges included in our consolidated statement of operations for the years ended June 30, 2017, 2016 and 2015 within restructuring expense is $26,700, $381, and $3,202, respectively.
The following table summarizes the restructuring activity during the year ended June 30, 2017:
Severance and Related Benefits | Other Restructuring Costs (1) | Total | |||||||||
Accrued restructuring liability as of June 30, 2016 | $ | — | $ | — | $ | — | |||||
Restructuring charges | 24,020 | 2,680 | 26,700 | ||||||||
Cash payments | (13,161 | ) | (1,861 | ) | (15,022 | ) | |||||
Non-cash charges (2) | (6,257 | ) | (611 | ) | (6,868 | ) | |||||
Accrued restructuring liability as of June 30, 2017 | $ | 4,602 | $ | 208 | $ | 4,810 | |||||
_____________________
(1) Includes restructuring charges for third party professional fees of $2,049, as well as $611 for the abandonment of production equipment which was not yet placed into service and under our decentralized operating model had no future use.
(2) Non-cash charges include acceleration of share-based compensation expenses, as well as abandonment charges for production equipment.
19. Quarterly Financial Data (unaudited)
Year Ended June 30, 2017 | First Quarter | Second Quarter | Third Quarter | Fourth Quarter | |||||||||||
Revenue | $ | 443,713 | $ | 576,851 | $ | 550,585 | $ | 564,256 | |||||||
Cost of revenue (1) | 213,050 | 276,366 | 268,482 | 279,077 | |||||||||||
Net income (loss) | (30,030 | ) | 35,022 | (42,678 | ) | (34,513 | ) | ||||||||
Net income (loss) attributable to Cimpress N.V. | (29,103 | ) | 35,028 | (42,934 | ) | (34,702 | ) | ||||||||
Net income (loss) per share attributable to Cimpress N.V.: | |||||||||||||||
Basic | $ | (0.92 | ) | $ | 1.12 | $ | (1.38 | ) | $ | (1.11 | ) | ||||
Diluted | $ | (0.92 | ) | $ | 1.07 | $ | (1.38 | ) | $ | (1.11 | ) | ||||
Year Ended June 30, 2016 | First Quarter | Second Quarter | Third Quarter | Fourth Quarter | |||||||||||
Revenue | $ | 375,748 | $ | 496,274 | $ | 436,817 | $ | 479,205 | |||||||
Cost of revenue (1) | 157,170 | 197,462 | 196,911 | 222,097 | |||||||||||
Net income (loss) | 10,022 | 58,991 | (35,771 | ) | 17,169 | ||||||||||
Net income (loss) attributable to Cimpress N.V. | 10,771 | 59,319 | (32,671 | ) | 16,930 | ||||||||||
Net income (loss) per share attributable to Cimpress N.V.: | |||||||||||||||
Basic | $ | 0.33 | $ | 1.89 | $ | (1.04 | ) | $ | 0.54 | ||||||
Diluted | $ | 0.32 | $ | 1.81 | $ | (1.04 | ) | $ | 0.51 | ||||||
(1) Cost of revenue as included within the quarterly financial data has been recast for all periods presented to reflect the change in presentation of amortization expense for acquired intangible assets. Refer to Note 2 for further information relating to this change in presentation.
Basic and diluted net income (loss) per share attributable to Cimpress N.V. are computed independently for each of the quarters presented. Therefore, the sum of quarterly basic and diluted per share information may not equal annual basic and diluted net income per share.
105
20. Subsequent Events
The following events occurred subsequent to June 30, 2017:
• | On July 13, 2017, we entered into an amendment to our senior secured credit facility. Refer to Note 10 for additional details. |
• | On July 21, 2017, we entered into a definitive agreement to sell our Albumprinter business, including its FotoKnudsen subsidiary. Refer to Note 2 for additional details. |
Item 9. Changes in and Disagreement with Accountants on Accounting and Financial Disclosure
None.
Item 9A. Controls and Procedures
Disclosure Controls and Procedures
Our management, with the participation of our chief executive officer and chief financial officer, evaluated the effectiveness of our disclosure controls and procedures as of June 30, 2017. The term “disclosure controls and procedures,” as defined in Rules 13a-15(e) and 15d-15(e) under the Securities Exchange Act of 1934, or Exchange Act, means controls and other procedures of a company that are designed to ensure that information required to be disclosed by a company in the reports that it files or submits under the Exchange Act is recorded, processed, summarized and reported, within the time periods specified in the SEC’s rules and forms. Disclosure controls and procedures include, without limitation, controls and procedures designed to ensure that information required to be disclosed by a company in the reports that it files or submits under the Exchange Act is accumulated and communicated to the company’s management, including its principal executive and principal financial officers, as appropriate to allow timely decisions regarding required disclosure. Management recognizes that any controls and procedures, no matter how well designed and operated, can provide only reasonable assurance of achieving their objectives and management necessarily applies its judgment in evaluating the cost-benefit relationship of possible controls and procedures. Based on the evaluation of our disclosure controls and procedures as of June 30, 2017, our chief executive officer and chief financial officer concluded that, as of such date, our disclosure controls and procedures were effective at the reasonable assurance level.
Changes in Internal Control Over Financial Reporting
There were no significant changes in our internal control over financial reporting (as defined in Rules 13a-15(f) and 15d-15(f) under the Exchange Act) during the three months ended June 30, 2017 that materially affect, or are reasonably likely to materially affect, our internal control over financial reporting.
Management's Report on Internal Control Over Financial Reporting
Our management is responsible for establishing and maintaining adequate internal control over financial reporting for the company. Internal control over financial reporting is defined in Rules 13a-15(f) and 15d-15(f) promulgated under the Exchange Act as a process designed by, or under the supervision of, the company’s chief executive officer and chief financial officer and effected by the company’s supervisory board, management and other personnel, to provide reasonable assurance regarding the reliability of financial reporting and the preparation of financial statements for external purposes in accordance with generally accepted accounting principles and includes those policies and procedures that:
• | Pertain to the maintenance of records that in reasonable detail accurately and fairly reflect the transactions and dispositions of the assets of the company; |
• | Provide reasonable assurance that transactions are recorded as necessary to permit preparation of financial statements in accordance with generally accepted accounting principles, and that receipts and expenditures of the company are being made only in accordance with authorizations of management and directors of the company; and |
• | Provide reasonable assurance regarding prevention or timely detection of unauthorized acquisition, use or disposition of the company’s assets that could have a material effect on the financial statements. |
106
Because of its inherent limitations, internal control over financial reporting may not prevent or detect misstatements. Projections of any evaluation of effectiveness to future periods are subject to the risk that controls may become inadequate because of changes in conditions, or that the degree of compliance with the policies or procedures may deteriorate.
The scope of management's assessment of the effectiveness of internal control over financial reporting as of June 30, 2017 excluded an assessment of the internal control over financial reporting of National Pen, which we acquired during fiscal 2017. The results of National Pen are included in our 2017 consolidated financial statements and represent approximately $91.3 million and $42.3 million of consolidated total assets and net assets, respectively, as of June 30, 2017 and $112.7 million and $7.2 million of consolidated revenue and net loss attributable to Cimpress N.V., respectively, for the year ended June 30, 2017.
Our management assessed the effectiveness of our internal control over financial reporting as of June 30, 2017. In making this assessment, our management used the criteria set forth in the Internal Control — Integrated Framework (2013) issued by the Committee of Sponsoring Organizations of the Treadway Commission (COSO). Based on our assessment, management concluded that, as of June 30, 2017, our internal control over financial reporting is effective based on criteria in Internal Control - Integrated Framework (2013) issued by the COSO. PricewaterhouseCoopers LLP, our independent registered public accounting firm, has audited the effectiveness of our internal control over financial reporting as of June 30, 2017, as stated in their report included on page 54.
Item 9B. Other Information
None.
PART III
Item 10. Directors, Executive Officers and Corporate Governance
The information required by this item is incorporated by reference to the information in the sections captioned “Information about our Supervisory Board members and Executive Officers,” “Corporate Governance” and “Section 16(a) Beneficial Ownership Reporting Compliance” contained in our definitive proxy statement for our 2017 Annual General Meeting of Shareholders, which we refer to as our 2017 Proxy Statement.
We have adopted a written code of business conduct and ethics that applies to all of our employees, including our principal executive officer, principal financial officer and principal accounting officer, and is available on our website at www.cimpress.com. We did not waive any provisions of this code during the fiscal year ended June 30, 2017. If we amend, or grant a waiver under, our code of business conduct and ethics that applies to our principal executive, financial or accounting officers, or persons performing similar functions, we will post information about such amendment or waiver on our website at www.cimpress.com.
Item 11. Executive Compensation
The information required by this item is incorporated by reference to the information contained in the sections of our 2017 Proxy Statement captioned “Executive Compensation,” “Compensation of Supervisory Board Members” and “Compensation Committee Interlocks and Insider Participation.”
Item 12. Security Ownership of Certain Beneficial Owners and Management and Related Stockholder
Matters
The information required by this item is incorporated by reference to the information contained in the sections of our 2017 Proxy Statement captioned “Security Ownership of Certain Beneficial Owners and Management” and “Securities Authorized for Issuance Under Equity Compensation Plans.”
Item 13. Certain Relationships and Related Transactions, and Director Independence
The information required by this item is incorporated by reference to the information contained in the sections of our 2017 Proxy Statement captioned “Certain Relationships and Related Transactions” and “Corporate Governance.”
107
Item 14. Principal Accountant Fees and Services
The information required by this item is incorporated by reference to the information contained in the section of our 2017 Proxy Statement captioned “Independent Registered Public Accounting Firm Fees and Other Matters.”
108
PART IV
Item 15. Exhibits and Financial Statement Schedules
(a) Consolidated Financial Statements.
For a list of the consolidated financial information included herein, see Index to the Consolidated Financial Statements on page 52 of this Report.
(b) List of Exhibits.
See the Exhibit Index attached to this Report.
(c) Financial Statement Schedules.
All schedules have been omitted because the information required to be set forth therein is not applicable or is shown in the accompanying consolidated financial statements or notes thereto.
109
SIGNATURES
Pursuant to the requirements of the Securities Exchange Act of 1934, the registrant has duly caused this report to be signed on its behalf by the undersigned, thereunto duly authorized.
August 11, 2017 Cimpress N.V.
By: | /s/ Robert S. Keane | |
Robert S. Keane | ||
Chief Executive Officer | ||
Pursuant to the requirements of the Securities Exchange Act of 1934, this report has been signed below by the following persons on behalf of the registrant and in the capacities and on the dates indicated.
Signature | Title | Date | ||
/s/ Robert S. Keane | President and Chief Executive Officer | August 11, 2017 | ||
Robert S. Keane | (Principal executive officer) | |||
/s/ Sean E. Quinn | Chief Financial Officer | August 11, 2017 | ||
Sean E. Quinn | (Principal financial and accounting officer) | |||
/s/ Paolo De Cesare | Member, Supervisory Board | August 11, 2017 | ||
Paolo De Cesare | ||||
/s/ Sophie A. Gasperment | Member, Supervisory Board | August 11, 2017 | ||
Sophie A. Gasperment | ||||
/s/ John J. Gavin Jr. | Member, Supervisory Board | August 11, 2017 | ||
John J. Gavin Jr. | ||||
/s/ Eric C. Olsen | Member, Supervisory Board | August 11, 2017 | ||
Eric C. Olsen | ||||
/s/ Richard T. Riley | Chairman, Supervisory Board | August 11, 2017 | ||
Richard T. Riley | ||||
/s/ Nadia Shouraboura | Member, Supervisory Board | August 11, 2017 | ||
Nadia Shouraboura | ||||
/s/ Mark T. Thomas | Member, Supervisory Board | August 11, 2017 | ||
Mark T. Thomas | ||||
/s/ Scott Vassalluzzo | Member, Supervisory Board | August 11, 2017 | ||
Scott Vassalluzzo | ||||
110
EXHIBIT INDEX
Exhibit | ||
No. | Description | |
3.1 | Articles of Association of Cimpress N.V., as amended, is incorporated by reference to our Quarterly Report on Form 10-Q for the fiscal quarter ended December 31, 2014 | |
4.1 | Senior Notes Indenture (including Form of Notes), dated as of March 24, 2015, between Cimpress N.V., certain subsidiaries of Cimpress N.V. as guarantors thereto, and MUFG Union Bank, N.A., as trustee, is incorporated by reference to our Current Report on Form 8-K filed with the SEC on March 24, 2015 | |
10.1* | 2005 Non-Employee Directors’ Share Option Plan, as amended, is incorporated by reference to our Quarterly Report on Form 10-Q for the fiscal quarter ended September 30, 2010 (File No. 000-51539) | |
10.2* | Form of Nonqualified Share Option Agreement under our 2005 Non-Employee Directors’ Share Option Plan is incorporated by reference to our Quarterly Report on Form 10-Q for the fiscal quarter ended September 30, 2009 (File No. 000-51539) | |
10.3* | Amended and Restated 2005 Equity Incentive Plan, as amended, is incorporated by reference to our Quarterly Report on Form 10-Q for the fiscal quarter ended September 30, 2010 (File No. 000-51539) | |
10.4* | Form of Nonqualified Share Option Agreement under our Amended and Restated 2005 Equity Incentive Plan is incorporated by reference to our Quarterly Report on Form 10-Q for the fiscal quarter ended September 30, 2009 (File No. 000-51539) | |
10.5* | 2011 Equity Incentive Plan is incorporated by reference to Appendix A to our Definitive Proxy Statement on Schedule 14A dated and filed with the SEC on June 8, 2011 (File No. 000-51539) | |
10.6* | Form of Nonqualified Share Option Agreement under our 2011 Equity Incentive Plan is incorporated by reference to our Quarterly Report on Form 10-Q for the fiscal quarter ended September 30, 2011 (File No. 000-51539) | |
10.7* | Form of Restricted Share Unit Agreement for employees and executives under our 2011 Equity Incentive Plan is incorporated by reference to our Quarterly Report on Form 10-Q for the fiscal quarter ended September 30, 2011 (File No. 000-51539) | |
10.8* | Form of Restricted Share Unit Agreement for Supervisory Board members under our 2011 Equity Incentive Plan is incorporated by reference to our Annual Report on Form 10-K for the fiscalyear ended June 30, 2015 | |
10.9* | 2016 Performance Equity Plan, as amended, is incorporated by reference to our Current Report on Form 8-K filed with the SEC on November 16, 2016 | |
10.10* | Form of Performance Share Unit Agreement for employees and executives under our 2016 Performance Equity Incentive Plan is incorporated by reference to our Quarterly Report on Form 10-Q for the fiscal quarter ended September 30, 2016 | |
10.11* | Form of Performance Share Unit Agreement for our Chief Executive Officer under our 2016 Performance Equity Incentive Plan is incorporated by reference to our Quarterly Report on Form 10-Q for the fiscal quarter ended September 30, 2016 | |
10.12* | Form of Performance Share Unit Agreement for Supervisory Board members under our 2016 Performance Equity Incentive Plan is incorporated by reference to our Quarterly Report on Form 10-Q for the fiscal quarter ended December 31, 2016 | |
10.13* | 2015 Inducement Share Plan is incorporated by reference to our Annual Report on Form 10-K for the fiscal year ended June 30, 2015 | |
10.14* | Form of Restricted Share Award Agreement under 2015 Inducement Share Plan is incorporated by reference to our Annual Report on Form 10-K for the fiscal year ended June 30, 2015 | |
10.15* | Amended and Restated Performance Incentive Plan for Covered Employees is incorporated by reference to Appendix A to our Definitive Proxy Statement on Schedule 14A dated and filed with the SEC on October 16, 2013 | |
10.16* | Form of Indemnification Agreement between Cimpress N.V. and each of our executive officers and members of our Supervisory Board and Management Board is incorporated by reference to our Current Report on Form 8-K filed with the SEC on August 31, 2009 (File No. 000-51539) | |
10.17* | Amended and Restated Executive Retention Agreement between Cimpress N.V. and Robert Keane dated as of October 23, 2009 is incorporated by reference to our Quarterly Report on Form 10-Q for the fiscal quarter ended September 30, 2009 (File No. 000-51539) | |
10.18* | Form of Executive Retention Agreement between Cimpress N.V. and Katryn Blake is incorporated by reference to our Quarterly Report on Form 10-Q for the fiscal quarter ended September 30, 2009 (File No. 000-51539) | |
10.19* | Form of Executive Retention Agreement between Cimpress N.V. and each of Donald LeBlanc and Sean Quinn is incorporated by reference to our Quarterly Report on Form 10-Q for the fiscal quarter ended September 30, 2016 (File No. 000-51539) | |
10.20* | Employment Agreement between Cimpress USA Incorporated and Robert Keane effective September 1, 2009 is incorporated by reference to our Quarterly Report on Form 10-Q for the fiscal quarter ended March 31, 2010 (File No. 000-51539) | |
10.21* | Amendment No. 1 to Employment Agreement between Cimpress USA Incorporated and Robert Keane dated June 14, 2010 is incorporated by reference to our Annual Report on Form 10-K for the fiscal year ended June 30, 2010 (File No. 000-51539) | |
111
10.22* | Amendment No. 2 to Employment Agreement between Cimpress USA Incorporated and Robert Keane dated September 28, 2011 is incorporated by reference to our Quarterly Report on Form 10-Q for the fiscal quarter ended September 30, 2011 (File No. 000-51539) | |
10.23* | Amendment No. 3 to Employment Agreement between Cimpress USA Incorporated and Robert Keane dated July 25, 2012 is incorporated by reference to our Annual Report on Form 10-K for the fiscal year ended June 30, 2012 (File No. 000-51539) | |
10.24* | Amendment No. 4 to Employment Agreement between Cimpress USA Incorporated and Robert Keane dated September 1, 2013 is incorporated by reference to our Quarterly Report on Form 10-Q for the fiscal quarter ended September 30, 2013 (File No. 000-51539) | |
10.25* | Amendment No. 5 to Employment Agreement between Cimpress USA Incorporated and Robert Keane dated September 30, 2014 is incorporated by reference to our Quarterly Report on Form 10-Q for the fiscal quarter ended September 30, 2014 (File No. 000-51539) | |
10.26* | Amendment No. 6 to Employment Agreement between Cimpress USA Incorporated and Robert Keane dated September 30, 2015 is incorporated by reference to our Quarterly Report on Form 10-Q for the fiscal quarter ended December 31, 2015 (File No. 000-51539) | |
10.27* | Amendment No. 7 to Employment Agreement between Cimpress USA Incorporated and Robert Keane dated August 23, 2016 is incorporated by reference to our Quarterly Report on Form 10-Q for the fiscal quarter ended September 30, 2016 (File No. 000-51539) | |
10.28* | Memorandum clarifying relative precedence of agreements between Cimpress N.V. and Robert Keane dated May 6, 2010 is incorporated by reference to our Annual Report on Form 10-K for the fiscal year ended June 30, 2010 (File No. 000-51539) | |
10.29* | Agreement Limiting PSU Awards dated May 13, 2016 between Cimpress N.V. and Robert Keane is incorporated by reference to our Current Report on Form 8-K filed with the SEC on May 17, 2016 | |
10.30* | Employment Agreement between Cimpress N.V. and Cornelis David Arends dated November 1, 2015 is incorporated by reference to our Quarterly Report on Form 10-Q for the fiscal quarter ended September 30, 2016 (File No. 000-51539) | |
10.31* | Long Term International Assignment Agreement between Cimpress N.V. and Cornelis David Arends dated December 9, 2015 is incorporated by reference to our Quarterly Report on Form 10-Q for the fiscal quarter ended September 30, 2016 (File No. 000-51539) | |
10.31* | Form of Invention and Non-Disclosure Agreement between Cimpress and each of Robert Keane, Katryn Blake, Donald LeBlanc, and Sean Quinn is incorporated by reference to our Registration Statement on Form S-1, as amended (File No. 333-125470) | |
10.32* | Form of Confidential Information and Non-Competition Agreement between Cimpress and each of Robert Keane, Katryn Blake, Donald LeBlanc, and Sean Quinn is incorporated by reference to our Registration Statement on Form S-1, as amended (File No. 333-125470) | |
10.33* | Summary of Compensatory Arrangements with Members of the Supervisory Board is incorporated by reference to our Quarterly Report on Form 10-Q for the fiscal quarter ended December 31, 2016 | |
10.34* | Separation Agreement dated February 17, 2017 between Cimpress USA Incorporated and Donald Nelson is incorporated by reference to our Current Report on Form 8-K filed with the Securities and Exchange Commission on February 22, 2017 | |
10.35* | Separation Agreement dated February 17, 2017 between Cimpress USA Incorporated and Lawrence Gold is incorporated by reference to our Quarterly Report on Form 10-Q for the fiscal quarter ended March 31, 2017 | |
10.36* | Protocol Transactionnel (Settlement Agreement) dated March 22, 2017 between Cimpress France SARL and Ashley Hubka is incorporated by reference to our Quarterly Report on Form 10-Q for the fiscal quarter ended March 31, 2017 | |
10.37* | Settlement Agreement dated February 17, 2017 between Vistaprint B.V. and Wilhelm G.A. Jacobs is incorporated by reference to our Quarterly Report on Form 10-Q for the fiscal quarter ended March 31, 2017 | |
10.38 | Call Option Agreement between Cimpress N.V. and Stichting Continuïteit Cimpress (formerly Stichting Continuïteit Vistaprint) dated November 16, 2009 is incorporated by reference to our Current Report on Form 8-K filed with the SEC on November 19, 2009 (File No. 000-51539) | |
10.39 | Amendment and Restatement Agreement dated as of July 13, 2017 among Cimpress N.V., Vistaprint Limited, Cimpress Schweiz GmbH, Vistaprint B.V., and Cimpress USA Incorporated, as borrowers (the “Borrowers”); the lenders named therein as lenders; and JPMorgan Chase Bank N.A., as administrative agent for the lenders (the “Administrative Agent”), which amends and restates the senior Credit Agreement dated as of October 21, 2011, as amended and restated as of February 8, 2013, among the Borrowers, the lenders named therein, and the Administrative Agent, is incorporated by reference to our Current Report on Form 8-K filed with the SEC on July 14, 2017 | |
10.40 | Second Amended and Restated Guaranty dated as of July 13, 2017 between Cimpress' subsidiary guarantors named therein as guarantors (the "Subsidiary Guarantors") and the Administrative Agent, which amends and restates the Amended and Restated Guaranty dated as of February 8, 2013 between the Subsidiary Guarantors and the Administrative Agent, is incorporated by reference to our Current Report on Form 8-K filed with the SEC on July 14, 2017 | |
112
10.43 | Amended and Restated Pledge and Security Agreement dated as of July 13, 2017 between Cimpress USA Incorporated, Vistaprint Limited, Cimpress Schweiz GmbH, and Vistaprint B.V., as Borrowers, and Cimpress USA Manufacturing Incorporated, National Pen Co. LLC, National Pen Tennessee LLC, NP Corporate Services LLC, Pixartprinting USA Incorporated, Vistaprint Corporate Solutions Incorporated, and Webs, Inc., as Subsidiary Guarantors, on one hand, and the Administrative Agent, on the other hand, which amends and restates the Pledge and Security Agreement dated as of February 8, 2013, between such Borrowers and Subsidiary Guarantors and the Administrative Agent, is incorporated by reference to our Current Report on Form 8-K filed with the SEC on July 14, 2017 | |
21.1 | Subsidiaries of Cimpress N.V. | |
23.1 | Consent of PricewaterhouseCoopers LLP, Independent Registered Public Accounting Firm | |
31.1 | Certification pursuant to Section 302 of the Sarbanes-Oxley Act of 2002, Rule 13a-14(a)/15d-14(a), by Chief Executive Officer | |
31.2 | Certification pursuant to Section 302 of the Sarbanes-Oxley Act of 2002, Rule 13a-14(a)/15d-14(a), by Chief Financial Officer | |
32.1 | Certification pursuant to 18 U.S.C. Section 1350, as adopted pursuant to Section 906 of the Sarbanes-Oxley Act of 2002, by Chief Executive Officer and Chief Financial Officer | |
101 | The following materials from this Annual Report on Form 10-K, formatted in Extensible Business Reporting Language (XBRL): (i) Condensed Consolidated Balance Sheets, (ii) Condensed Consolidated Statements of Operations, (iii) Condensed Consolidated Statements of Cash Flows, and (iv) Notes to Condensed Consolidated Financial Statements. | |
__________________
* | Management contract or compensatory plan or arrangement | |
113