Attached files
| file | filename |
|---|---|
| 8-K - 8-K - Delek US Holdings, Inc. | dk-8kxinvestorpresentation.htm |
August 2017
Delek US Holdings, Inc.
Investor Presentation
Disclaimers
2
Delek US Holdings, Inc. (“Delek US”) and Delek Logistics Partners, LP (“Delek Logistics”; collectively with Delek US, defined as “we”, “our”) are traded on the New York Stock
Exchange in the United States under the symbols “DK” and ”DKL” respectively, and, as such, are governed by the rules and regulations of the United States Securities and Exchange
Commission. These slides and any accompanying oral and written presentations contain forward-looking statements that are based upon current expectations and involve a
number of risks and uncertainties. Statements concerning current estimates, expectations and projections about future results, performance, prospects, opportunities, plans,
actions and events and other statements, concerns, or matters that are not historical facts are “forward-looking statements,” as that term is defined under the federal securities
laws. These forward-looking statements include, but are not limited to, statements regarding the post-merger integration and transition plan with Alon USA Energy Inc. (“Alon”),
synergies, opportunities, anticipated future performance and financial position, and other factors.
Investors are cautioned that the following important factors, among others, may affect these forward-looking statements. These factors include but are not limited to: risks and
uncertainties related to the ability to successfully integrate the businesses of Delek US and Alon, risks related to disruption of management time from ongoing business operations
due to the integration implementation, the risk that any announcements relating to the integration could have adverse effects on the market price of Delek US' common stock, the
risk that the transaction could have an adverse effect on the ability of Delek US and Alon to retain customers and retain and hire key personnel and maintain relationships with
their suppliers and customers and on their operating results and businesses generally, the risk that problems may arise in successfully integrating the businesses of the companies,
which may result in the combined company not operating as effectively and efficiently as expected, the risk that the combined company may be unable to achieve cost-cutting
synergies or it may take longer than expected to achieve those synergies, uncertainty related to timing and amount of future share repurchases and dividend payments, risks and
uncertainties with respect to the quantities and costs of crude oil we are able to obtain and the price of the refined petroleum products we ultimately sell; gains and losses from
derivative instruments; management's ability to execute its strategy of growth through acquisitions and the transactional risks associated with acquisitions and dispositions;
acquired assets may suffer a diminishment in fair value as a result of which we may need to record a write-down or impairment in carrying value of the asset; changes in the scope,
costs, and/or timing of capital and maintenance projects; operating hazards inherent in transporting, storing and processing crude oil and intermediate and finished petroleum
products; our competitive position and the effects of competition; the projected growth of the industries in which we operate; general economic and business conditions affecting
the geographic areas in which we operate; and other risks contained in Delek US’ and Delek Logistics’ filings with the United States Securities and Exchange Commission.
Forward-looking statements should not be read as a guarantee of future performance or results and will not be accurate indications of the times at, or by which such performance
or results will be achieved. Forward-looking information is based on information available at the time and/or management’s good faith belief with respect to future events, and is
subject to risks and uncertainties that could cause actual performance or results to differ materially from those expressed in the statements. Neither Delek US nor Delek Logistics
Partners undertakes any obligation to update or revise any such forward-looking statements.
Non-GAAP Disclosures:
Delek US and Delek Logistics each believe that the presentation of EBITDA, distributable cash flow and distribution coverage ratio provides useful information to investors in
assessing its financial condition, its results of operations and cash flow its business is generating. EBITDA, distributable cash flow and distribution coverage ratio should not be
considered as alternatives to net income, operating income, cash from operations or any other measure of financial performance or liquidity presented in accordance with U.S.
GAAP. EBITDA, distributable cash flow and distribution coverage ratio have important limitations as analytical tools because they exclude some, but not all items that affect net
income. Additionally, because EBITDA, distributable cash flow and distribution coverage ratio may be defined differently by other companies in its industry, Delek US' and Delek
Logistics’ definitions may not be comparable to similarly titled measures of other companies, thereby diminishing their utility. Please see reconciliations of EBITDA and
distributable cash flow to their most directly comparable financial measures calculated and presented in accordance with U.S. GAAP in the appendix.
Investment Highlights
(1) Based on price per common limited unit as of close of trading on August 1, 2017.
(2) Annualized dividend based on quarterly distribution for quarter ended June 30, 2017.
(3) Currently 5.4% of the ownership interest in the general partner is owned by three members of senior management of Delek US (who are also directors of the general partner). The remaining
ownership interest is held by a subsidiary of Delek US.
3
•Current Price: $23.64/unit (1)
•Market Capitalization: $1,924 million (1)
•Current Dividend: $0.15/share qtr.; $0.60/share annualized(2)
•NYSE: DKL: Own 63.5%, including 2% GP(3)
•NYSE: ALDW: Own 81.6% of LP units and 100% of GP
Overview (NYSE: DK)
• Historically grown through acquisitions
•Proven ability to acquire assets at the right time in the cycle
•Experience in improving asset base to increase performance
• Goal has been to double in size every five years
Growth Oriented
•Closed on July 1, 2017
•Purchased the remaining 53% ownership that DK did not already own
in an all stock transaction; exchange ratio 0.5040 share of DK for each
share for ALJ
•Doubled the size of the organization
Alon Acquisition
• June 30, 2017 balance sheet
• Delek US: $572.3 million of cash; $822.5 million of debt
• Alon: $215.3 million of cash; $564.8 million of debt
•Combined projected capitalization $787.6 million cash and $599.7
million net debt
Flexible Financial Position to
Support Growth
Alon transaction was completed on July 1
Acquisition of Alon Provides Platforms to Create Additional Value
4
• Integration of organizations began on July 1
• Target $95 million of annual synergies in 2018
• Combination of corporate, cost of capital, operations, commercial
Opportunity to Create
Synergies
• Ability to unlock logistics value through partnering with DKL
• Approximately $78 million of EBITDA for future potential dropdowns
• Provide potential growth to DKL and cash to Delek US
Unlock Value of
Logistics Assets
• Krotz Springs, LA refinery – evaluate crude transportation costs,
unit improvement options and go-to-market strategy
• California assets – explore opportunities to derive value
• Big Spring, Texas refinery – review opportunities to improve
operations and partnering with DKL for logistics support
Improve Operations
• Refining, retail and logistics asset located in the area
• Approx. 200,000 bpd of Permian Basin crude access in system
• Ability to partner with DKL for future logistics growth
Expand Permian
Position
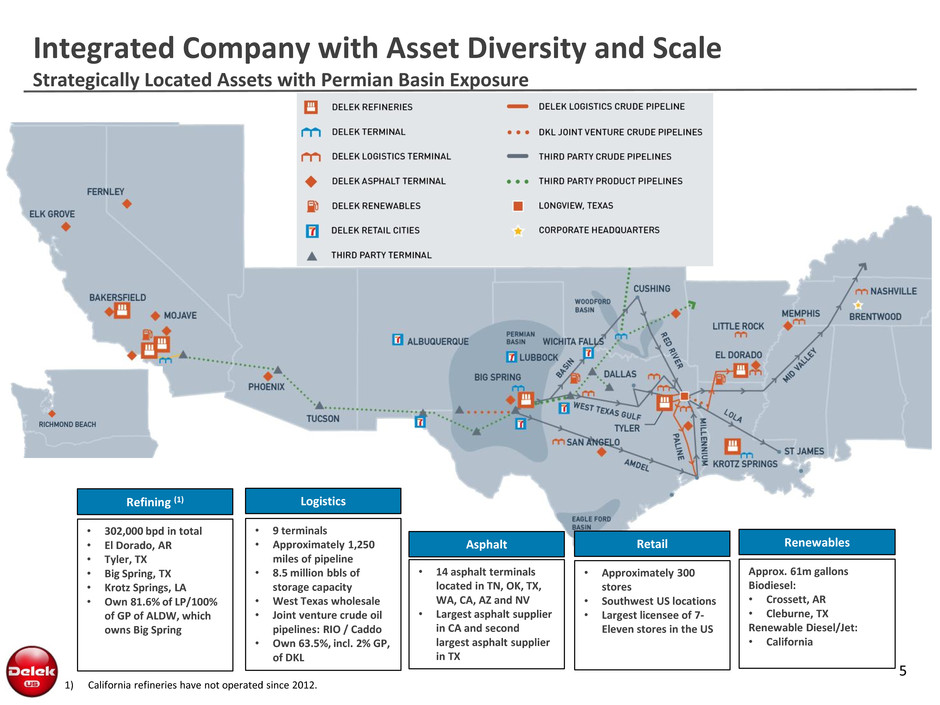
Integrated Company with Asset Diversity and Scale
Strategically Located Assets with Permian Basin Exposure
5
Retail
• Approximately 300
stores
• Southwest US locations
• Largest licensee of 7-
Eleven stores in the US
Asphalt
• 14 asphalt terminals
located in TN, OK, TX,
WA, CA, AZ and NV
• Largest asphalt supplier
in CA and second
largest asphalt supplier
in TX
Refining (1)
• 302,000 bpd in total
• El Dorado, AR
• Tyler, TX
• Big Spring, TX
• Krotz Springs, LA
• Own 81.6% of LP/100%
of GP of ALDW, which
owns Big Spring
Logistics
• 9 terminals
• Approximately 1,250
miles of pipeline
• 8.5 million bbls of
storage capacity
• West Texas wholesale
• Joint venture crude oil
pipelines: RIO / Caddo
• Own 63.5%, incl. 2% GP,
of DKL
1) California refineries have not operated since 2012.
Renewables
Approx. 61m gallons
Biodiesel:
• Crossett, AR
• Cleburne, TX
Renewable Diesel/Jet:
• California
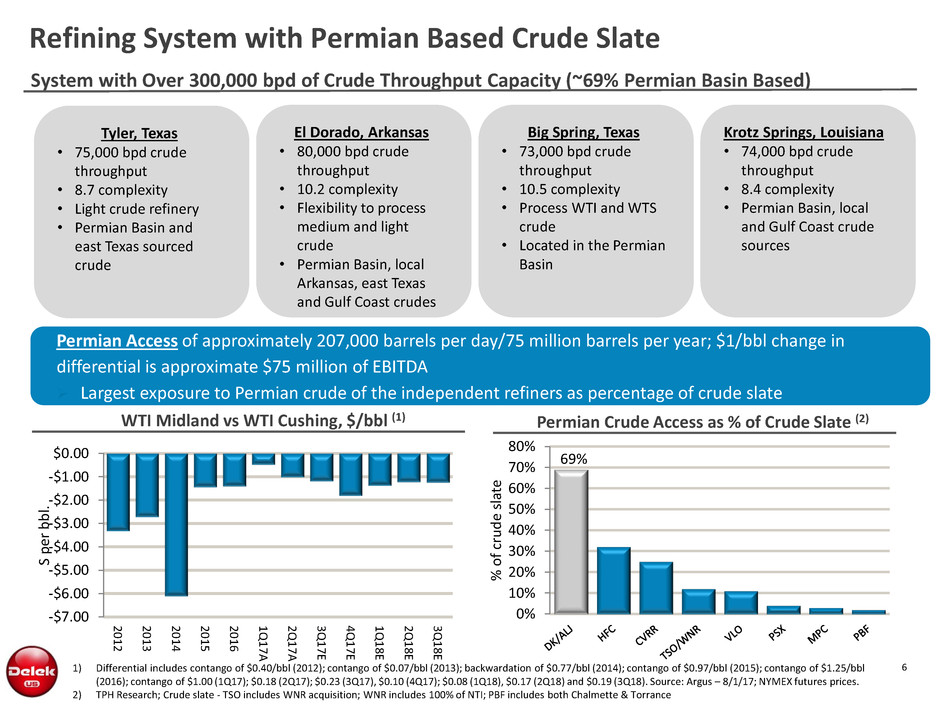
System with Over 300,000 bpd of Crude Throughput Capacity (~69% Permian Basin Based)
Refining System with Permian Based Crude Slate
6 1) Differential includes contango of $0.40/bbl (2012); contango of $0.07/bbl (2013); backwardation of $0.77/bbl (2014); contango of $0.97/bbl (2015); contango of $1.25/bbl
(2016); contango of $1.00 (1Q17); $0.18 (2Q17); $0.23 (3Q17), $0.10 (4Q17); $0.08 (1Q18), $0.17 (2Q18) and $0.19 (3Q18). Source: Argus – 8/1/17; NYMEX futures prices.
2) TPH Research; Crude slate - TSO includes WNR acquisition; WNR includes 100% of NTI; PBF includes both Chalmette & Torrance
Permian Crude Access as % of Crude Slate (2)
69%
0%
10%
20%
30%
40%
50%
60%
70%
80%
%
o
f
cr
u
d
e
sl
at
e
-$7.00
-$6.00
-$5.00
-$4.00
-$3.00
-$2.00
-$1.00
$0.00
2
0
1
2
2
0
1
3
2
0
1
4
2
0
1
5
2
0
1
6
1Q
1
7
A
2Q
1
7
A
3Q
1
7
E
4Q
1
7
E
1Q
1
8
E
2Q
1
8
E
3Q
1
8
E
S
p
er
b
b
l.
WTI Midland vs WTI Cushing, $/bbl (1)
Tyler, Texas
• 75,000 bpd crude
throughput
• 8.7 complexity
• Light crude refinery
• Permian Basin and
east Texas sourced
crude
El Dorado, Arkansas
• 80,000 bpd crude
throughput
• 10.2 complexity
• Flexibility to process
medium and light
crude
• Permian Basin, local
Arkansas, east Texas
and Gulf Coast crudes
Big Spring, Texas
• 73,000 bpd crude
throughput
• 10.5 complexity
• Process WTI and WTS
crude
• Located in the Permian
Basin
Krotz Springs, Louisiana
• 74,000 bpd crude
throughput
• 8.4 complexity
• Permian Basin, local
and Gulf Coast crude
sources
Permian Access of approximately 207,000 barrels per day/75 million barrels per year; $1/bbl change in
differential is approximate $75 million of EBITDA
Largest exposure to Permian crude of the independent refiners as percentage of crude slate

1) Deutsche Bank Research, Permian Basin: “You are still the one” 11/28/16, breakeven based on flat natural gas of $3.00/MMbtu; NGLs priced 35% of WTI; regional
commodity differential and 25% royalty.
2) EIA production data through July 17, 2017, Drilling Productivity Report; Baker Hughes rig count as of July 28, 2017.
3) WTI spot price as of August 1, 2017.
4) TPH Research report, “Oil Global Supply & Demand: Model Update”, Drillinginfo, EIA, - March 2017.
7
Crude Oil Production Grew Despite Rig Decline (2)
Permian Basin Estimated Breakeven Crude Oil Price(1)
$37.77
$37.95
$36.55
$39.57
$39.60
$39.86
$41.76
$42.39
$43.90
$45.20
$45.42
$45.51
$47.57
$47.68
$47.87
$49.27
$52.01
$52.45
$53.87
$54.83
$56.96
$59.52
$70.80
$- $20 $40 $60 $80
Lower Sprayberry - N Midland
Eagle Ford - Oil Window
Upper Wolfcamp - S Midland
Upper Wolfcamp - N Midland
STACK - Oil Window
Bakken - Core - McKenzie
Upper Wolfcamp - C Reeves
Avalon Oil - New Mexico
Upper Wolfcamp - S Reeves
Niobrara - Middle Core MRL
SCOOP -- Springer
Bone Spring - NM
Jo Mill - N Midland
Middle Sprayberry - N Midland
Niobrara - Middle Core XRL
Bone Spring, TX
Wolfcamp - NM
Bakken - non core
Eagle Ford - Condensate
Lower Wolfcamp - C Reeves
STACK - Condensate
Brushy Canyon - NM
Cline - N Midland
0
200
400
600
-
1,000
2,000
3,000
Jan-07 Jan-09 Feb-11 Mar-13 Apr-15 May-17
A
cti
ve
R
ig
C
o
u
n
t
C
ru
d
e
O
il
P
ro
d
. (
M
B
b
l/
d
)
Rig Count Oil Prod. (MBbl/d)
Permian WTI $49.79 (3)
Production continued to grow through the downturn in crude oil prices; Improved Efficiencies
Permian Basin Attractive Drilling Economics Support Growth
Permian Basin Crude Oil Production Growth (4)
0
2,000
4,000
2009 2011 2013 2015 2017E 2019E
In
0
0
0
b
p
d
WTI $/bbl (2)
$-
$50
$100
$150
Ja
n
-0
7
Ju
l-
0
7
Ja
n
-0
8
Ju
l-
0
8
Ja
n
-0
9
Ju
l-
0
9
Ja
n
-1
0
Ju
l-
1
0
Ja
n
-1
1
Ju
l-
1
1
Ja
n
-1
2
Ju
l-
1
2
Ja
n
-1
3
Ju
l-
1
3
Ja
n
-1
4
Ju
l-
1
4
Ja
n
-1
5
Ju
l-
1
5
Ja
n
-1
6
Ju
l-
1
6
Ja
n
-1
7
Ju
l-
1
7

Permian Basin Estimated Takeaway/Production Balance
Current pipeline takeaway capacity adequate, but production growth may tighten balance
8 Chart Source: Simmons & Company research, May 2017. Provided for illustrative purposes to show potential balance. Based on exit rate Permian production. Actual results will
vary based on market conditions, timing of projects, etc
Additional factors to consider:
A pipeline utilization rate of 85% to 90% should be applied to capacity to account for operating rates
Transportation cost becomes a key consideration in decision to ship when MVCs expire on pipelines
0
500
1,000
1,500
2,000
2,500
3,000
3,500
4,000
4,500
0
0
0
b
ar
re
ls
p
er
d
ay
PAA Permian to Cushing
Epic Permian to Corpus
EPD Midland to Sealy
PAA Cactus (Exp.)
SXL Permian Express 3
MMP/PAA Bridgetex (Exp.)
Permian Longview/ LA Ext.(PELA)
PAA Cactus
SXL Permian Express 2
MMP/PAA Bridgetex
MMP Longhorn
Amdel
West Texas Gulf
Centurion
Basin
Refining
SCI Crude Production Case 1
SCI Crude Production Case 2
Logistics Assets Positioned for
Growth
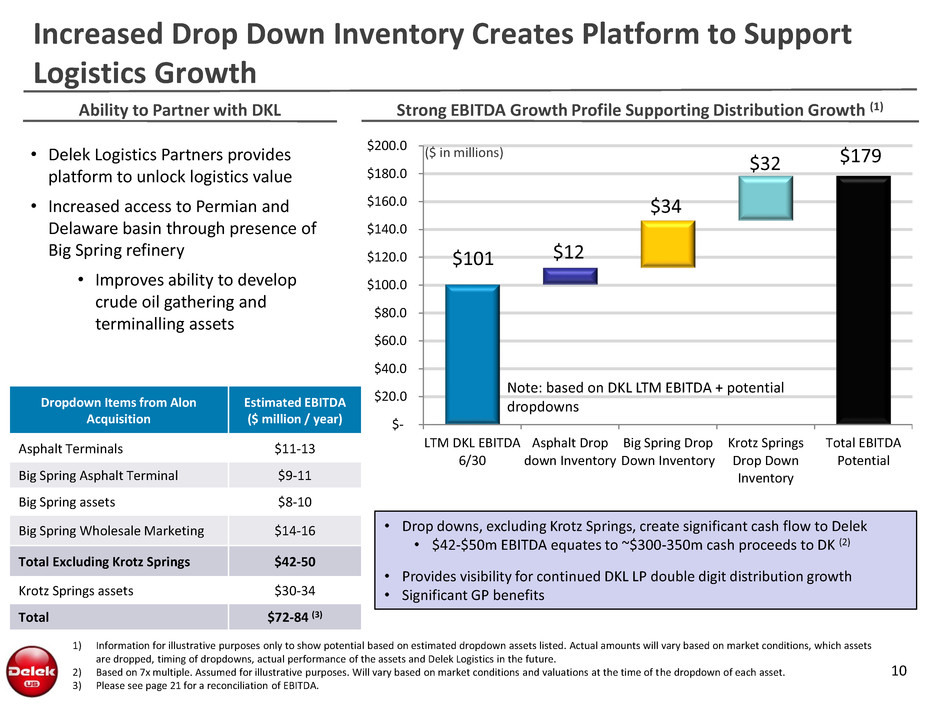
Increased Drop Down Inventory Creates Platform to Support
Logistics Growth
10
Ability to Partner with DKL
• Delek Logistics Partners provides
platform to unlock logistics value
• Increased access to Permian and
Delaware basin through presence of
Big Spring refinery
• Improves ability to develop
crude oil gathering and
terminalling assets
1) Information for illustrative purposes only to show potential based on estimated dropdown assets listed. Actual amounts will vary based on market conditions, which assets
are dropped, timing of dropdowns, actual performance of the assets and Delek Logistics in the future.
2) Based on 7x multiple. Assumed for illustrative purposes. Will vary based on market conditions and valuations at the time of the dropdown of each asset.
3) Please see page 21 for a reconciliation of EBITDA.
Strong EBITDA Growth Profile Supporting Distribution Growth (1)
$101 $12
$34
$32 $179
$-
$20.0
$40.0
$60.0
$80.0
$100.0
$120.0
$140.0
$160.0
$180.0
$200.0
LTM DKL EBITDA
6/30
Asphalt Drop
down Inventory
Big Spring Drop
Down Inventory
Krotz Springs
Drop Down
Inventory
Total EBITDA
Potential
• Drop downs, excluding Krotz Springs, create significant cash flow to Delek
• $42-$50m EBITDA equates to ~$300-350m cash proceeds to DK (2)
• Provides visibility for continued DKL LP double digit distribution growth
• Significant GP benefits
Dropdown Items from Alon
Acquisition
Estimated EBITDA
($ million / year)
Asphalt Terminals $11-13
Big Spring Asphalt Terminal $9-11
Big Spring assets $8-10
Big Spring Wholesale Marketing $14-16
Total Excluding Krotz Springs $42-50
Krotz Springs assets $30-34
Total $72-84 (3)
($ in millions)
Note: based on DKL LTM EBITDA + potential
dropdowns
NY008LRP - 912119_1.wor -L r - r- rLL P 912119_1.wo
San Angelo
Fort Worth Dallas
Waco
Tyler
Shreveport
Monroe
El Dorado
Beaumont New Orleans
Little Rock Memphis
Brentwood
Nashville
Knoxville
Abilene
Big Spring
Krotz Springs
NY008LRP - 912119_1.wor - rL 1.P 912119_
SALA GATHERING SYSTEM
AR
LA
Magnolia El Dorado
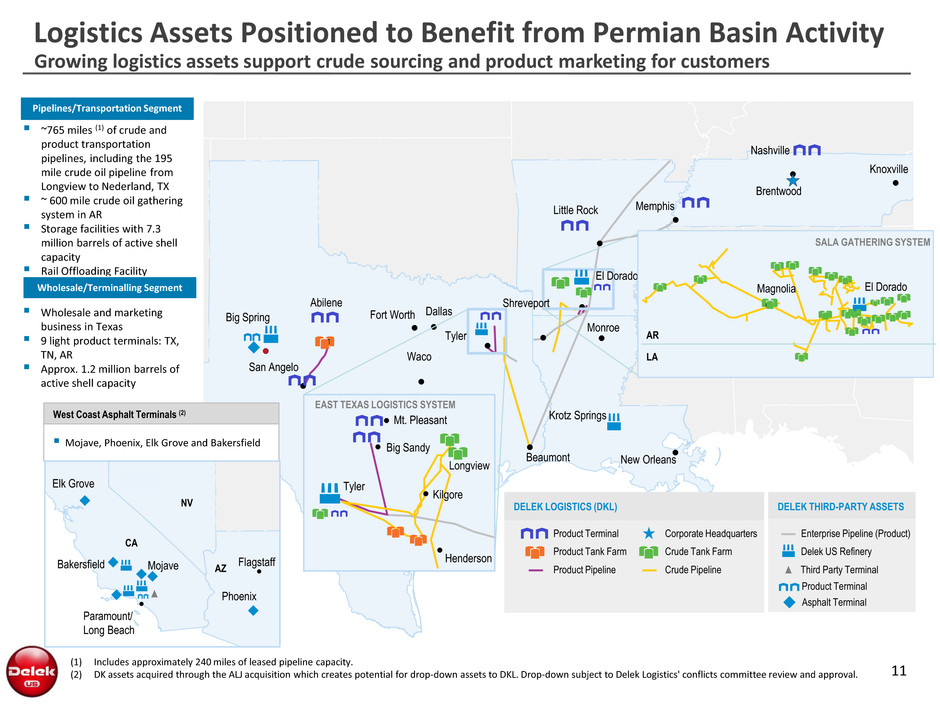
~765 miles (1) of crude and
product transportation
pipelines, including the 195
mile crude oil pipeline from
Longview to Nederland, TX
~ 600 mile crude oil gathering
system in AR
Storage facilities with 7.3
million barrels of active shell
capacity
Rail Offloading Facility
Pipelines/Transportation Segment
Wholesale and marketing
business in Texas
9 light product terminals: TX,
TN, AR
Approx. 1.2 million barrels of
active shell capacity
Wholesale/Terminalling Segment
11
Logistics Assets Positioned to Benefit from Permian Basin Activity
Growing logistics assets support crude sourcing and product marketing for customers
(NY008LRP) 912119_1.wor1. r) 912119 rr) 912119 1.1.) 912119(NY008LRP _ o
EAST TEXAS LOGISTICS SYSTEM
Mt. Pleasant
Big Sandy
Longview
Kilgore
Henderson
Tyler
DELEK THIRD-PARTY ASSETS
Enterprise Pipeline (Product)
Delek US Refinery
DELEK LOGISTICS (DKL)
Product Terminal
Product Tank Farm
Product Pipeline
Corporate Headquarters
Crude Tank Farm
Crude Pipeline Third Party Terminal
West Coast Asphalt Terminals (2)
Mojave, Phoenix, Elk Grove and Bakersfield
NY008LRP - 912119_1.wor - .P rL - .- .P rP r008L 912119_1LY R - . o - .
Paramount/
Long Beach
Mojave
CA
Bakersfield
Elk Grove
Flagstaff
Phoenix
NV
AZ
(1) Includes approximately 240 miles of leased pipeline capacity.
(2) DK assets acquired through the ALJ acquisition which creates potential for drop-down assets to DKL. Drop-down subject to Delek Logistics' conflicts committee review and approval.
Product Terminal
Asphalt Terminal
12
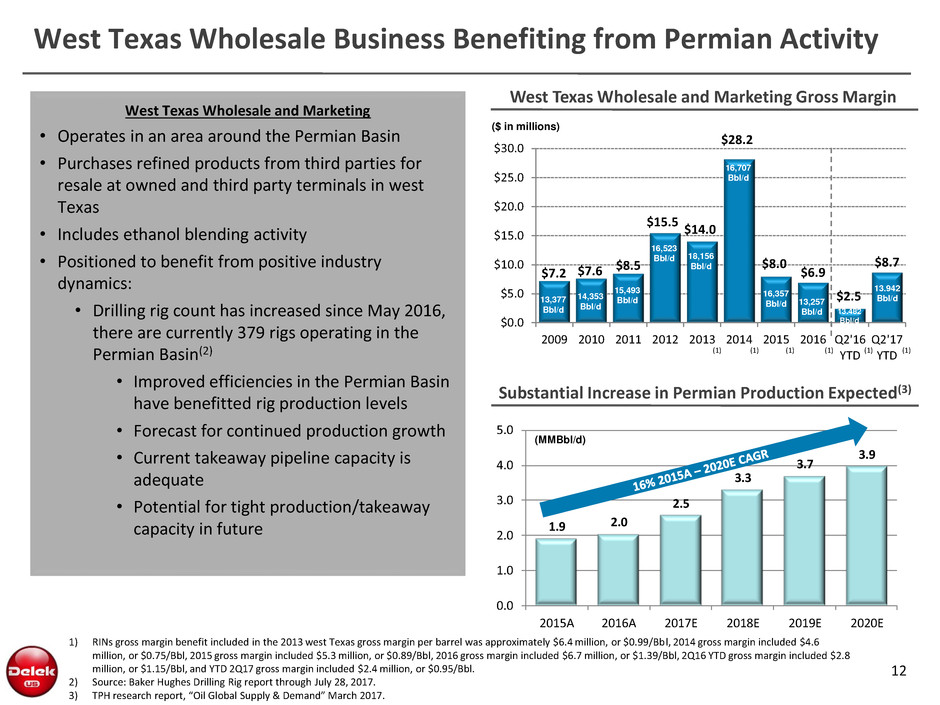
West Texas Wholesale Business Benefiting from Permian Activity
1) RINs gross margin benefit included in the 2013 west Texas gross margin per barrel was approximately $6.4 million, or $0.99/Bbl, 2014 gross margin included $4.6
million, or $0.75/Bbl, 2015 gross margin included $5.3 million, or $0.89/Bbl, 2016 gross margin included $6.7 million, or $1.39/Bbl, 2Q16 YTD gross margin included $2.8
million, or $1.15/Bbl, and YTD 2Q17 gross margin included $2.4 million, or $0.95/Bbl.
2) Source: Baker Hughes Drilling Rig report through July 28, 2017.
3) TPH research report, “Oil Global Supply & Demand” March 2017.
$7.2 $7.6
$8.5
$15.5
$14.0
$28.2
$8.0
$6.9
$2.5
$8.7
$0.0
$5.0
$10.0
$15.0
$20.0
$25.0
$30.0
2009 2010 2011 2012 2013 2014 2015 2016 Q2'16
YTD
Q2'17
YTD
West Texas Wholesale and Marketing Gross Margin
13,377
Bbl/d
14,353
Bbl/d
15,493
Bbl/d
16,523
Bbl/d 18,156
Bbl/d
16,707
Bbl/d
16,357
Bbl/d
13.482
Bbl/d
West Texas Wholesale and Marketing
• Operates in an area around the Permian Basin
• Purchases refined products from third parties for
resale at owned and third party terminals in west
Texas
• Includes ethanol blending activity
• Positioned to benefit from positive industry
dynamics:
• Drilling rig count has increased since May 2016,
there are currently 379 rigs operating in the
Permian Basin(2)
• Improved efficiencies in the Permian Basin
have benefitted rig production levels
• Forecast for continued production growth
• Current takeaway pipeline capacity is
adequate
• Potential for tight production/takeaway
capacity in future
(1) (1) (1) (1)
($ in millions)
.9 2.0
2.5
3.3
3.7
3.9
0.0
1.0
2.0
3.0
4.0
5.0
2015A 2016A 2017E 2018E 2019E 2020E
Substantial Increase in Permian Production Expected(3)
(MMBbl/d)
13.942
Bbl/d 13,257
Bbl/d
(1) (1)
13
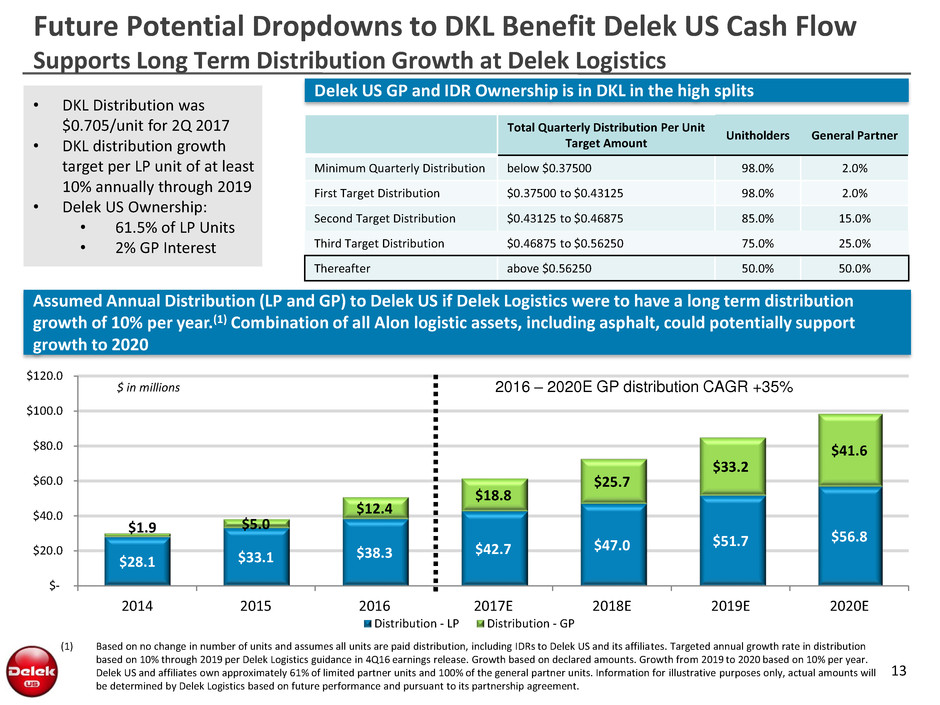
Delek US GP and IDR Ownership is in DKL in the high splits
Future Potential Dropdowns to DKL Benefit Delek US Cash Flow
Supports Long Term Distribution Growth at Delek Logistics
Total Quarterly Distribution Per Unit
Target Amount
Unitholders General Partner
Minimum Quarterly Distribution below $0.37500 98.0% 2.0%
First Target Distribution $0.37500 to $0.43125 98.0% 2.0%
Second Target Distribution $0.43125 to $0.46875 85.0% 15.0%
Third Target Distribution $0.46875 to $0.56250 75.0% 25.0%
Thereafter above $0.56250 50.0% 50.0%
• DKL Distribution was
$0.705/unit for 2Q 2017
• DKL distribution growth
target per LP unit of at least
10% annually through 2019
• Delek US Ownership:
• 61.5% of LP Units
• 2% GP Interest
(1) Based on no change in number of units and assumes all units are paid distribution, including IDRs to Delek US and its affiliates. Targeted annual growth rate in distribution
based on 10% through 2019 per Delek Logistics guidance in 4Q16 earnings release. Growth based on declared amounts. Growth from 2019 to 2020 based on 10% per year.
Delek US and affiliates own approximately 61% of limited partner units and 100% of the general partner units. Information for illustrative purposes only, actual amounts will
be determined by Delek Logistics based on future performance and pursuant to its partnership agreement.
Assumed Annual Distribution (LP and GP) to Delek US if Delek Logistics were to have a long term distribution
growth of 10% per year.(1) Combination of all Alon logistic assets, including asphalt, could potentially support
growth to 2020
$28.1 $33.1
$38.3 $42.7 $47.0
$51.7 $56.8
$1.9 $5.0
$12.4
$18.8
$25.7
$33.2
$41.6
$-
$20.0
$40.0
$60.0
$80.0
$100.0
$120.0
2014 2015 2016 2017E 2018E 2019E 2020E
Distribution - LP Distribution - GP
$ in millions 2016 – 2020E GP distribution CAGR +35%
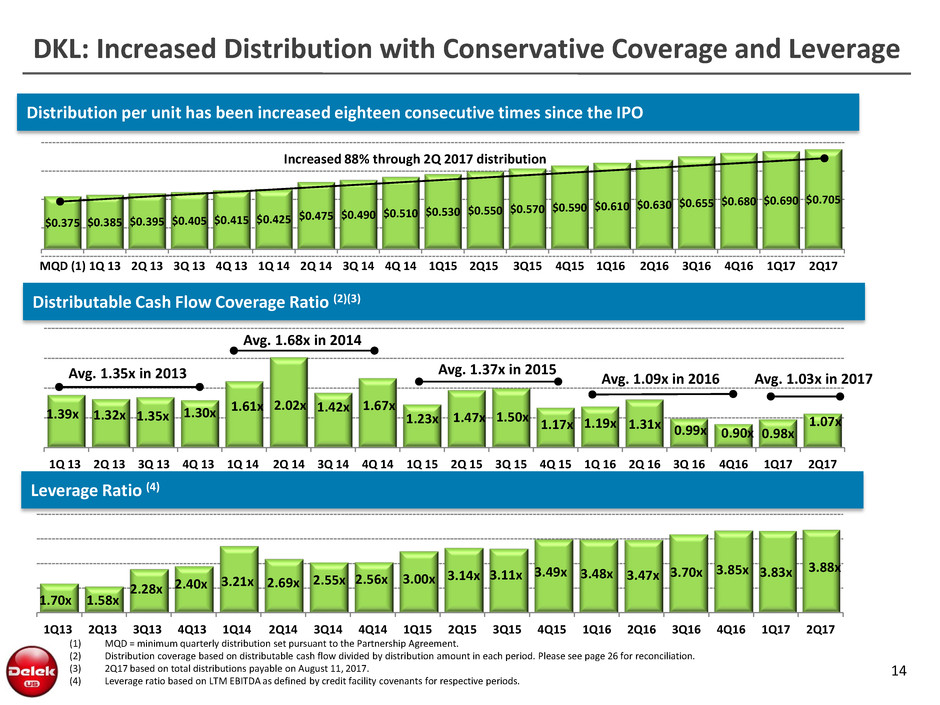
DKL: Increased Distribution with Conservative Coverage and Leverage
14
Distribution per unit has been increased eighteen consecutive times since the IPO
$0.375 $0.385 $0.395 $0.405 $0.415 $0.425
$0.475 $0.490 $0.510 $0.530 $0.550
$0.570 $0.590 $0.610 $0.630 $0.655
$0.680 $0.690 $0.705
MQD (1) 1Q 13 2Q 13 3Q 13 4Q 13 1Q 14 2Q 14 3Q 14 4Q 14 1Q15 2Q15 3Q15 4Q15 1Q16 2Q16 3Q16 4Q16 1Q17 2Q17
Increased 88% through 2Q 2017 distribution
1.39x 1.32x 1.35x 1.30x
1.61x 2.02x 1.42x 1.67x
1.23x 1.47x 1.50x 1.17x 1.19x 1.31x 0.99x 0.90x 0.98x
1.07x
1Q 13 2Q 13 3Q 13 4Q 13 1Q 14 2Q 14 3Q 14 4Q 14 1Q 15 2Q 15 3Q 15 4Q 15 1Q 16 2Q 16 3Q 16 4Q16 1Q17 2Q17
Distributable Cash Flow Coverage Ratio (2)(3)
1.70x 1.58x
2.28x 2.40x
3.21x 2.69x 2.55x 2.56x 3.00x
3.14x 3.11x 3.49x 3.48x 3.47x 3.70x 3.85x 3.83x
3.88x
1Q13 2Q13 3Q13 4Q13 1Q14 2Q14 3Q14 4Q14 1Q15 2Q15 3Q15 4Q15 1Q16 2Q16 3Q16 4Q16 1Q17 2Q17
Leverage Ratio (4)
(1) MQD = minimum quarterly distribution set pursuant to the Partnership Agreement.
(2) Distribution coverage based on distributable cash flow divided by distribution amount in each period. Please see page 26 for reconciliation.
(3) 2Q17 based on total distributions payable on August 11, 2017.
(4) Leverage ratio based on LTM EBITDA as defined by credit facility covenants for respective periods.
Avg. 1.35x in 2013
Avg. 1.68x in 2014
Avg. 1.37x in 2015
Avg. 1.09x in 2016 Avg. 1.03x in 2017
Retail/ Wholesale System in Southwest
Integrated wholesale marketing and retail network at Big Spring; complementary to DKL west Texas
15
Refineries
Legend:
Big Spring
Krotz
Springs
Branded license agreement and payment card location
Branded company-operated and distributor location
Unbranded supply available
Phoenix
Tucson
El Paso
Abilene
Wichita
Falls
Albuquerque
DKL served terminals
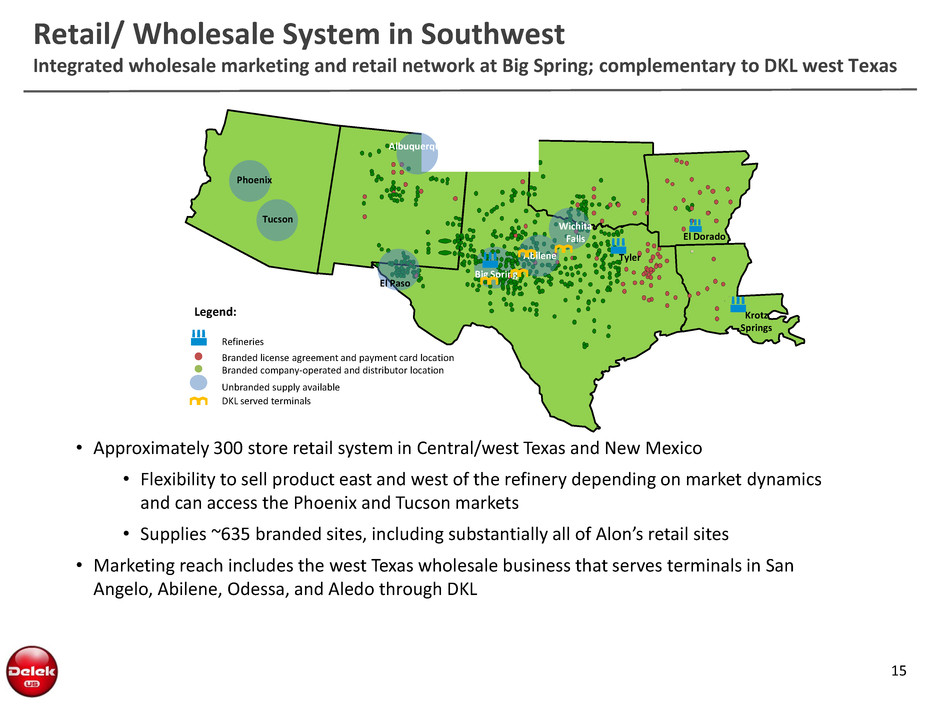
• Approximately 300 store retail system in Central/west Texas and New Mexico
• Flexibility to sell product east and west of the refinery depending on market dynamics
and can access the Phoenix and Tucson markets
• Supplies ~635 branded sites, including substantially all of Alon’s retail sites
• Marketing reach includes the west Texas wholesale business that serves terminals in San
Angelo, Abilene, Odessa, and Aledo through DKL
El Dorado
Tyler
Robust Synergy Opportunity from DK/ALJ Combination
16
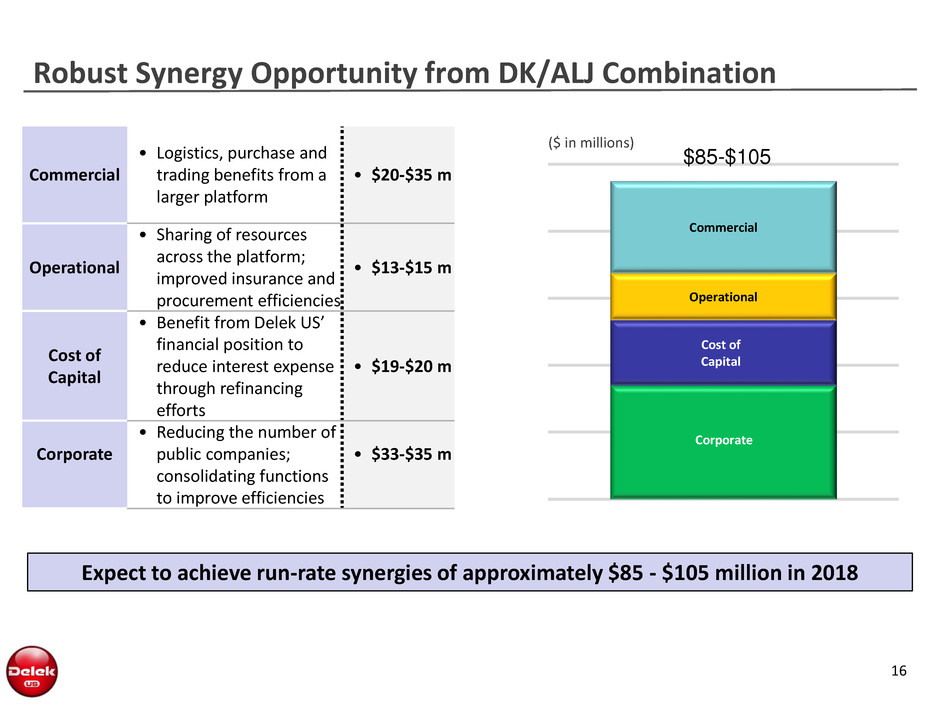
Expect to achieve run-rate synergies of approximately $85 - $105 million in 2018
Commercial
• Logistics, purchase and
trading benefits from a
larger platform
• $20-$35 m
Operational
• Sharing of resources
across the platform;
improved insurance and
procurement efficiencies
• $13-$15 m
Cost of
Capital
• Benefit from Delek US’
financial position to
reduce interest expense
through refinancing
efforts
• $19-$20 m
Corporate
• Reducing the number of
public companies;
consolidating functions
to improve efficiencies
• $33-$35 m
Corporate
Cost of
Capital
Operational
Commercial
$85-$105
($ in millions)
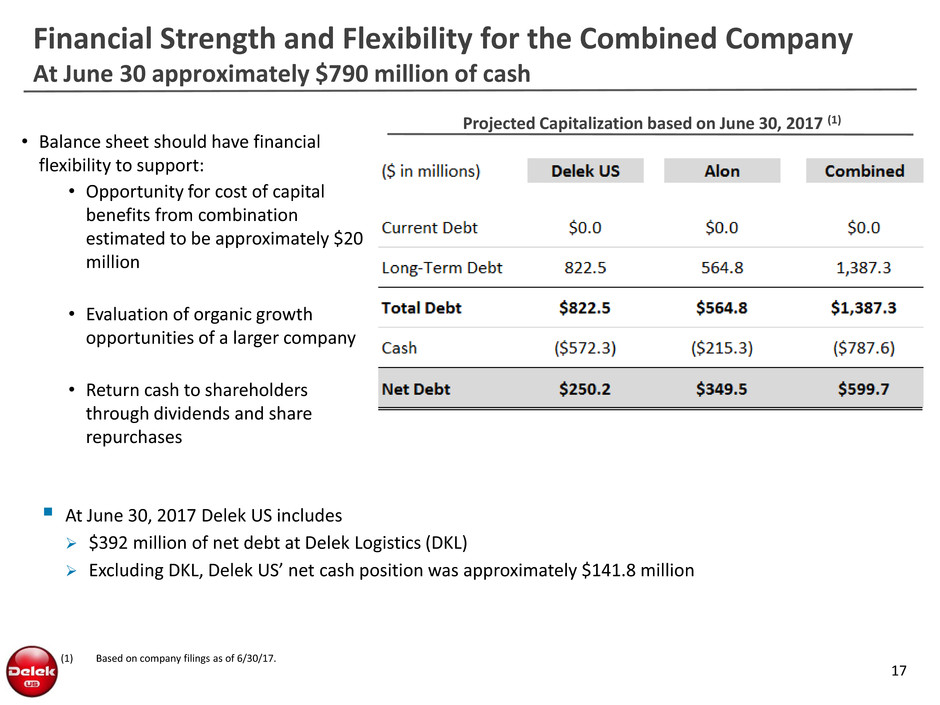
At June 30, 2017 Delek US includes
$392 million of net debt at Delek Logistics (DKL)
Excluding DKL, Delek US’ net cash position was approximately $141.8 million
Financial Strength and Flexibility for the Combined Company
At June 30 approximately $790 million of cash
17
• Balance sheet should have financial
flexibility to support:
• Opportunity for cost of capital
benefits from combination
estimated to be approximately $20
million
• Evaluation of organic growth
opportunities of a larger company
• Return cash to shareholders
through dividends and share
repurchases
(1) Based on company filings as of 6/30/17.
Projected Capitalization based on June 30, 2017 (1)
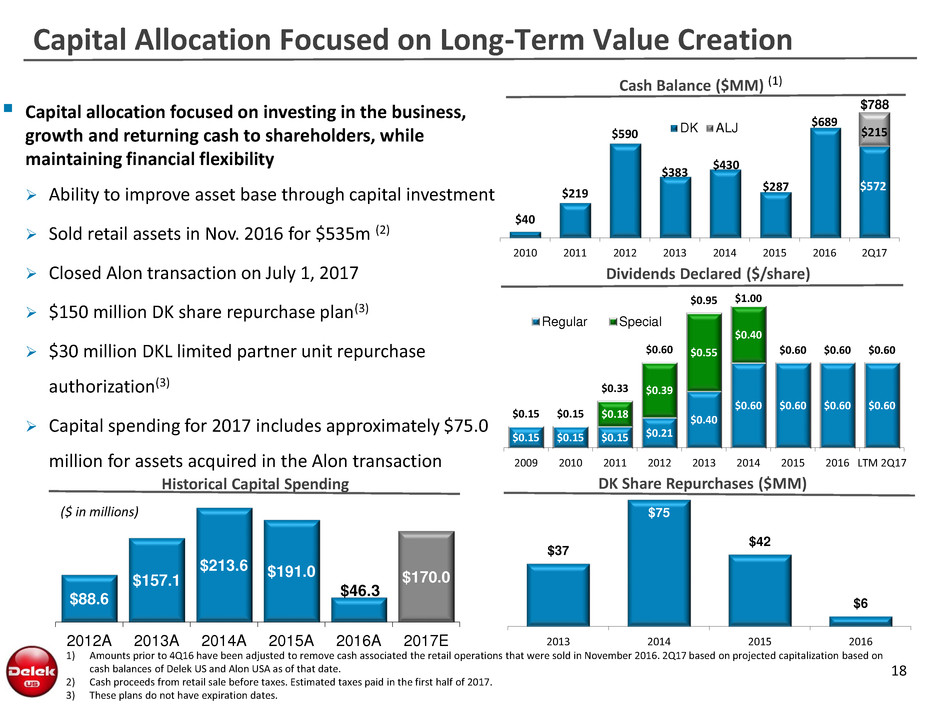
Capital allocation focused on investing in the business,
growth and returning cash to shareholders, while
maintaining financial flexibility
Ability to improve asset base through capital investment
Sold retail assets in Nov. 2016 for $535m (2)
Closed Alon transaction on July 1, 2017
$150 million DK share repurchase plan(3)
$30 million DKL limited partner unit repurchase
authorization(3)
Capital spending for 2017 includes approximately $75.0
million for assets acquired in the Alon transaction
Cash Balance ($MM) (1)
Capital Allocation Focused on Long-Term Value Creation
18
$40
$219
$590
$383
$430
$287
$689
$572
$215
2010 2011 2012 2013 2014 2015 2016 2Q17
DK ALJ
Dividends Declared ($/share)
$0.15 $0.15 $0.15 $0.21
$0.40
$0.60 $0.60 $0.60 $0.60
$0.18
$0.39
$0.55
$0.40
$0.15 $0.15
$0.33
$0.60
$0.95 $1.00
$0.60 $0.60 $0.60
2009 2010 2011 2012 2013 2014 2015 2016 LTM 2Q17
Regular Special
$37
$75
$42
$6
2013 2014 2015 2016
DK Share Repurchases ($MM)
1) Amounts prior to 4Q16 have been adjusted to remove cash associated the retail operations that were sold in November 2016. 2Q17 based on projected capitalization based on
cash balances of Delek US and Alon USA as of that date.
2) Cash proceeds from retail sale before taxes. Estimated taxes paid in the first half of 2017.
3) These plans do not have expiration dates.
$88.6
$157.1
$213.6 $191.0
$46.3
$170.0
2012A 2013A 2014A 2015A 2016A 2017E
Historical Capital Spending
($ in millions)
$788
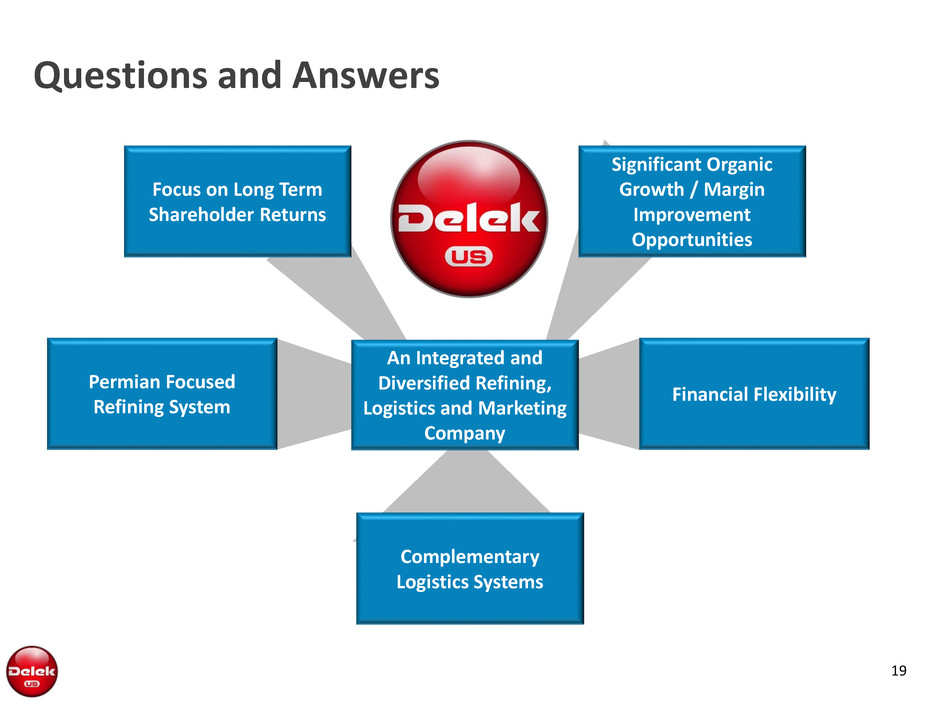
19
Complementary
Logistics Systems
Significant Organic
Growth / Margin
Improvement
Opportunities
Focus on Long Term
Shareholder Returns
Financial Flexibility
Permian Focused
Refining System
Questions and Answers
An Integrated and
Diversified Refining,
Logistics and Marketing
Company
Appendix
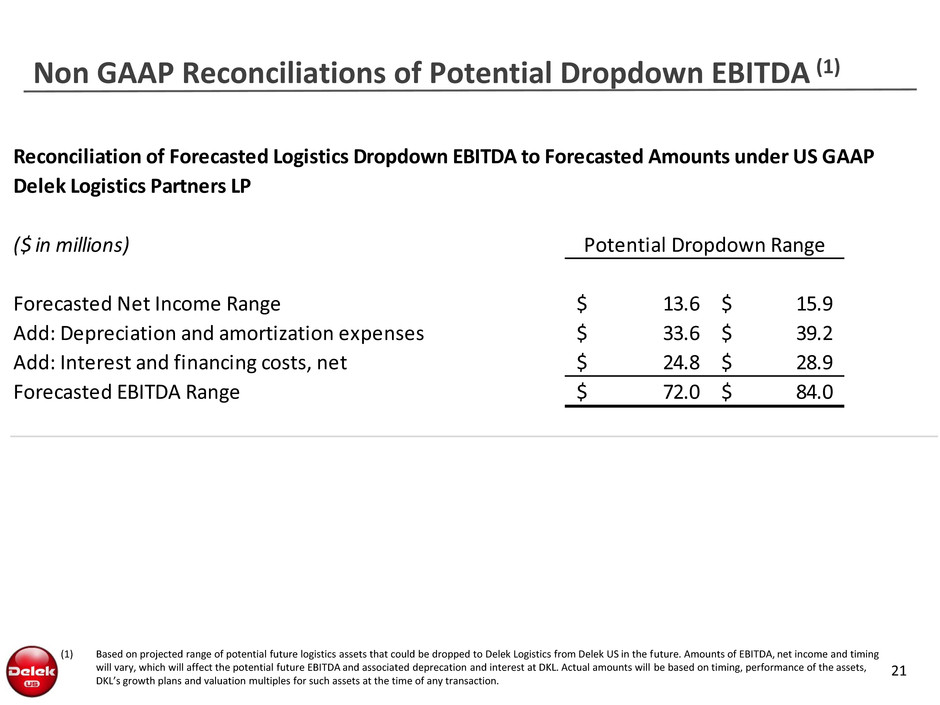
Non GAAP Reconciliations of Potential Dropdown EBITDA (1)
21
(1) Based on projected range of potential future logistics assets that could be dropped to Delek Logistics from Delek US in the future. Amounts of EBITDA, net income and timing
will vary, which will affect the potential future EBITDA and associated deprecation and interest at DKL. Actual amounts will be based on timing, performance of the assets,
DKL’s growth plans and valuation multiples for such assets at the time of any transaction.
Reconciliation of Forecasted Logistics Dropdown EBITDA to Forecasted Amounts under US GAAP
Delek Logistics Partners LP
($ in millions)
Forecasted Net Income Range 13.6$ 15.9$
Add: Depreciation and amortization expenses 33.6$ 39.2$
Add: Interest and financing costs, net 24.8$ 28.9$
Forecasted EBITDA Range 72.0$ 84.0$
Potential Dropdown Range
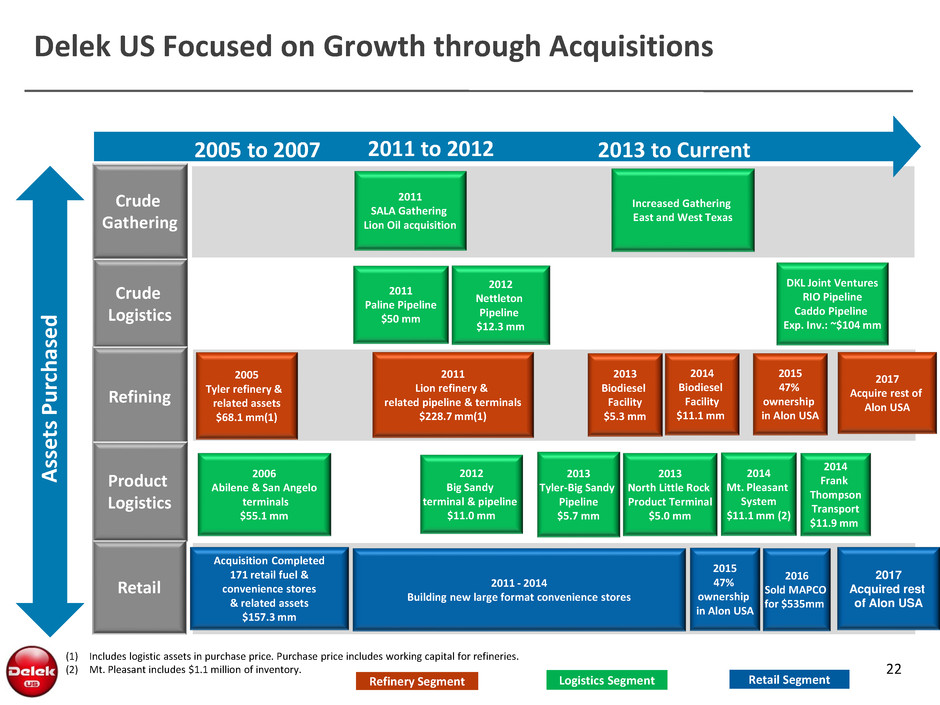
Delek US Focused on Growth through Acquisitions
(1) Includes logistic assets in purchase price. Purchase price includes working capital for refineries.
(2) Mt. Pleasant includes $1.1 million of inventory.
2006
Abilene & San Angelo
terminals
$55.1 mm
2012
Nettleton
Pipeline
$12.3 mm
2011
Paline Pipeline
$50 mm
Acquisition Completed
171 retail fuel &
convenience stores
& related assets
$157.3 mm
2005 to 2007 2011 to 2012 2013 to Current
Crude
Gathering
2013
Biodiesel
Facility
$5.3 mm
2011
Lion refinery &
related pipeline & terminals
$228.7 mm(1)
2005
Tyler refinery &
related assets
$68.1 mm(1)
2011 - 2014
Building new large format convenience stores
2013
Tyler-Big Sandy
Pipeline
$5.7 mm
2014
Biodiesel
Facility
$11.1 mm
Logistics Segment Retail Segment Refinery Segment
Crude
Logistics
Refining
Product
Logistics
Retail
2012
Big Sandy
terminal & pipeline
$11.0 mm
2013
North Little Rock
Product Terminal
$5.0 mm
2011
SALA Gathering
Lion Oil acquisition
Assets
P
u
rc
h
as
e
d
Increased Gathering
East and West Texas
22
2014
Mt. Pleasant
System
$11.1 mm (2)
2014
Frank
Thompson
Transport
$11.9 mm
DKL Joint Ventures
RIO Pipeline
Caddo Pipeline
Exp. Inv.: ~$104 mm
2015
47%
ownership
in Alon USA
2015
47%
ownership
in Alon USA
2016
Sold MAPCO
for $535mm
2017
Acquire rest of
Alon USA
2017
Acquired rest
of Alon USA

23
Summary Organization Structure
(1) As of June 30, 2017, a 5.4% interest in the Delek US ownership interest in the general partner is held by three members of senior management of Delek US. The remaining
ownership interest is indirectly held by Delek.
Market cap based on share prices on August 8, 2017.
94.6%
ownership interest (1)
2.0% interest
General partner interest
Incentive distribution
rights
Delek Logistics Partners, LP
NYSE: DKL
Market Cap: $755 million
Delek Logistics GP, LLC
(the General Partner)
Delek US Holdings, Inc.
NYSE: DK
Market Cap: $1.9 billion
61.5% interest
Alon USA Partners, LP
NYSE: ALDW
Market Cap: $758 million
81.6% interest
-$30
-$20
-$10
$0
$10
$20
$30
$40
$50
J
a
n
-1
0
Fe
b
-1
0
Ma
r-
1
0
A
p
r-
1
0
Ma
y
-1
0
J
u
n
-1
0
J
u
l-
1
0
A
u
g
-1
0
S
e
p
-1
0
O
c
t-
1
0
N
o
v
-1
0
D
e
c
-1
0
J
a
n
-1
1
Fe
b
-1
1
Ma
r-
1
1
A
p
r-
1
1
Ma
y
-1
1
J
u
n
-1
1
J
u
l-
1
1
A
u
g
-1
1
S
e
p
-1
1
O
c
t-
1
1
N
o
v
-1
1
D
e
c
-1
1
J
a
n
-1
2
Fe
b
-1
2
Ma
r-
1
2
A
p
r-
1
2
Ma
y
-1
2
J
u
n
-1
2
J
u
l-
1
2
A
u
g
-1
2
S
e
p
-1
2
O
c
t-
1
2
N
o
v
-1
2
D
e
c
-1
2
J
a
n
-1
3
Fe
b
-1
3
Ma
r-
1
3
A
p
r-
1
3
Ma
y
-1
3
J
u
n
-1
3
J
u
l-
1
3
A
u
g
-1
3
S
e
p
-1
3
O
c
t-
1
3
N
o
v
-1
3
D
e
c
-1
3
J
a
n
-1
4
Fe
b
-1
4
Ma
r-
1
4
A
p
r-
1
4
Ma
y
-1
4
J
u
n
-1
4
J
u
l-
1
4
A
u
g
-1
4
S
e
p
-1
4
O
c
t-
1
4
N
o
v
-1
4
D
e
c
-1
4
J
a
n
-1
5
Fe
b
-1
5
Ma
r-
1
5
A
p
r-
1
5
Ma
y
-1
5
J
u
n
-1
5
J
u
l-
1
5
A
u
g
-1
5
S
e
p
-1
5
O
c
t-
1
5
N
o
v
-1
5
D
e
c
-1
5
J
a
n
-1
6
Fe
b
-1
6
Ma
r-
1
6
A
p
r-
1
6
Ma
y
-1
6
J
u
n
-1
6
J
u
l-
1
6
A
u
g
-1
6
S
e
p
-1
6
O
c
t-
1
6
N
o
v
-1
6
D
e
c
-1
6
J
a
n
-1
7
Fe
b
-1
7
Ma
r-
1
7
A
p
r-
1
7
Ma
y
-1
7
J
u
n
-1
7
J
u
l-
1
7
A
u
g
-1
7
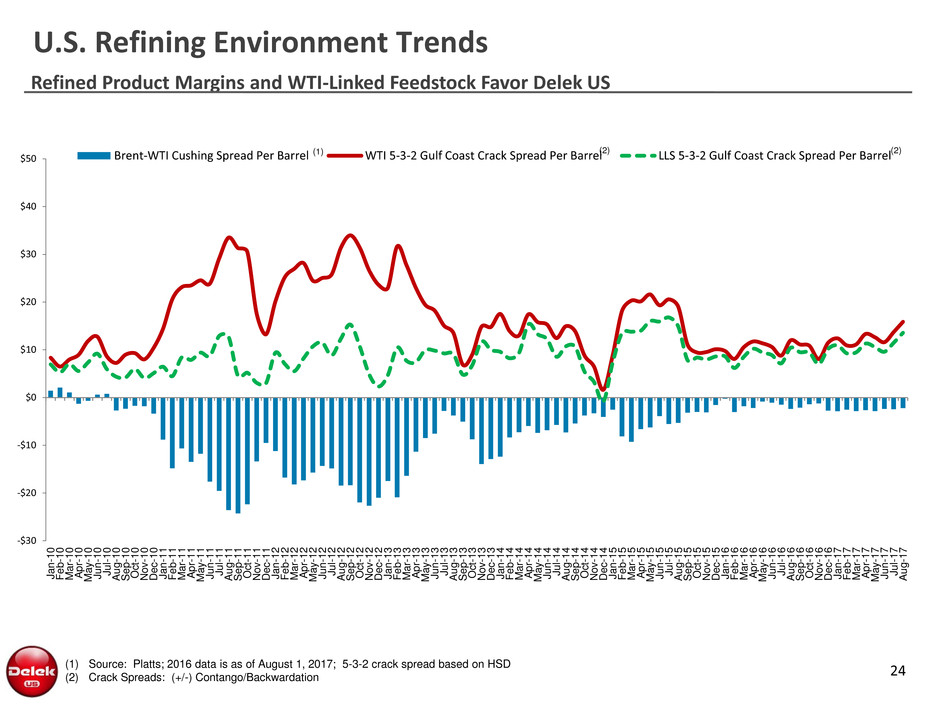
Brent-WTI Cushing Spread Per Barrel WTI 5-3-2 Gulf Coast Crack Spread Per Barrel LLS 5-3-2 Gulf Coast Crack Spread Per Barrel
U.S. Refining Environment Trends
Refined Product Margins and WTI-Linked Feedstock Favor Delek US
(1) Source: Platts; 2016 data is as of August 1, 2017; 5-3-2 crack spread based on HSD
(2) Crack Spreads: (+/-) Contango/Backwardation
(1) (2) (2)
24
($14.00)
($12.00)
($10.00)
($8.00)
($6.00)
($4.00)
($2.00)
$0.00
$2.00
Ja
n
-1
1
Fe
b
-1
1
M
ar
-1
1
A
p
r-
11
M
ay
-1
1
Ju
n
-1
1
Ju
l-1
1
A
u
g-
1
1
Se
p
-1
1
O
ct-1
1
N
o
v-
1
1
De
c-
1
1
Ja
n
-1
2
Fe
b
-1
2
M
ar
-1
2
A
p
r-
12
M
ay
-1
2
Ju
n
-1
2
Ju
l-1
2
A
u
g-
1
2
Se
p
-1
2
O
ct-1
2
N
o
v-
1
2
De
c-
1
2
Ja
n
-1
3
Fe
b
-1
3
M
ar
-1
3
A
p
r-
13
M
ay
-1
3
Ju
n
-1
3
Ju
l-1
3
A
u
g-
1
3
Se
p
-1
3
O
ct-1
3
N
o
v-
1
3
De
c-
1
3
Ja
n
-1
4
Fe
b
-1
4
M
ar
-1
4
A
p
r-
14
M
ay
-1
4
Ju
n
-1
4
Ju
l-1
4
A
u
g-
1
4
Se
p
-1
4
O
ct-1
4
N
o
v-
1
4
De
c-
1
4
Ja
n
-1
5
Fe
b
-1
5
M
ar
-1
5
A
p
r-
15
M
ay
-1
5
Ju
n
-1
5
Ju
l-1
5
A
u
g-
1
5
Se
p
-1
5
O
ct-1
5
N
o
v-
1
5
De
c-
1
5
Ja
n
-1
6
Fe
b
-1
6
M
ar
-1
6
A
p
r-
16
M
ay
-1
6
Ju
n
-1
6
Ju
l-1
6
A
u
g-
1
6
Se
p
-1
6
O
ct-1
6
N
o
v-
1
6
De
c-
1
6
Ja
n
-1
7
Fe
b
-1
7
M
ar
-1
7
A
p
r-
17
M
ay
-1
7
Ju
n
-1
7
Ju
l-1
7
A
u
g-
1
7
Se
p
-1
7
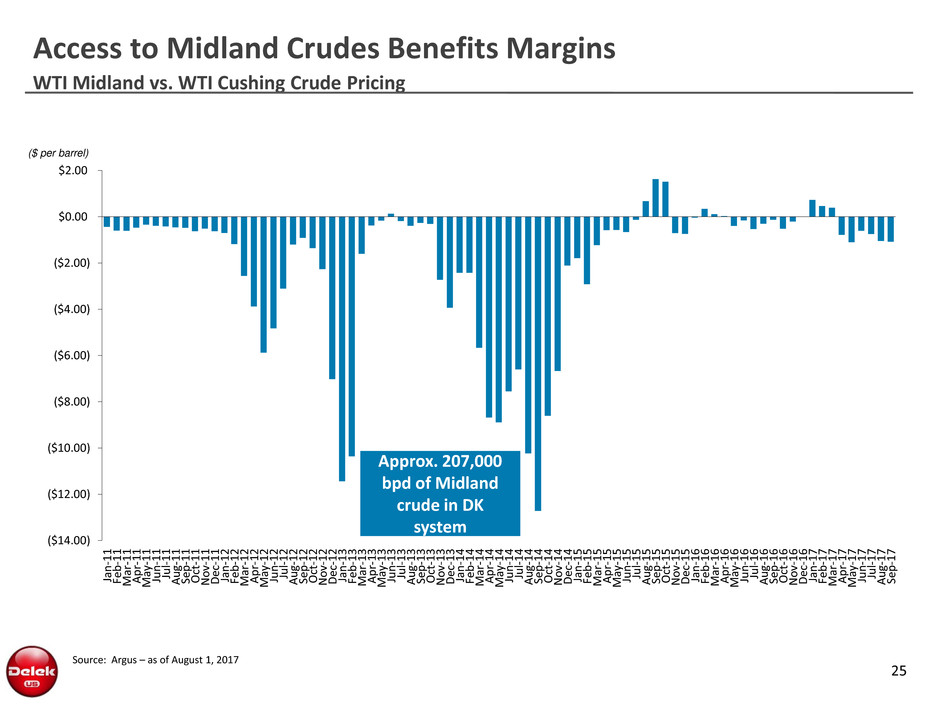
WTI Midland vs. WTI Cushing Crude Pricing
Access to Midland Crudes Benefits Margins
($ per barrel)
Approx. 207,000
bpd of Midland
crude in DK
system
25
Source: Argus – as of August 1, 2017
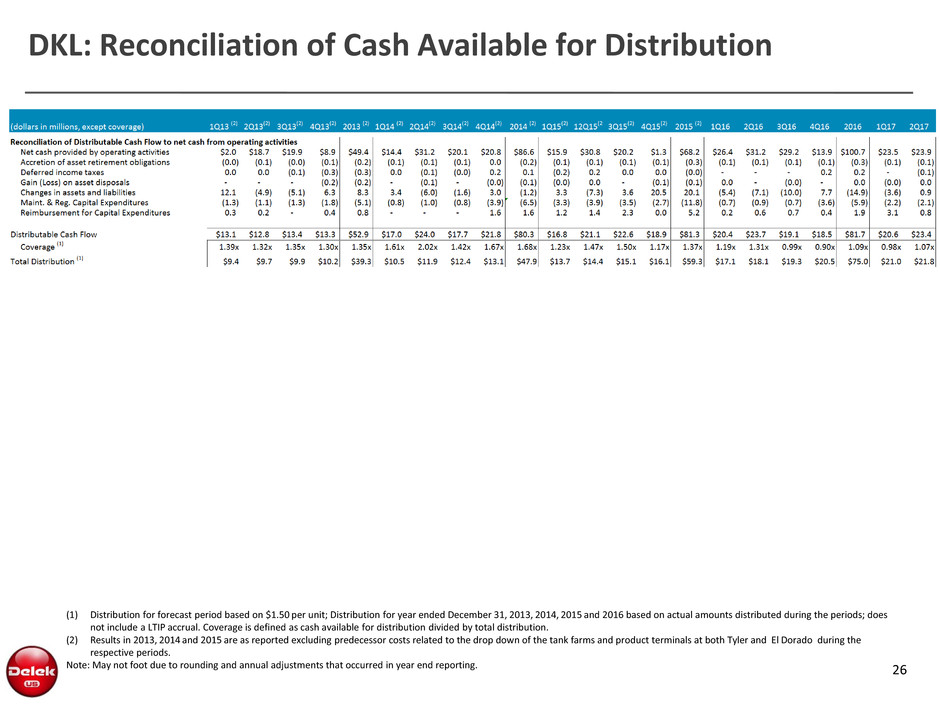
DKL: Reconciliation of Cash Available for Distribution
26
(1) Distribution for forecast period based on $1.50 per unit; Distribution for year ended December 31, 2013, 2014, 2015 and 2016 based on actual amounts distributed during the periods; does
not include a LTIP accrual. Coverage is defined as cash available for distribution divided by total distribution.
(2) Results in 2013, 2014 and 2015 are as reported excluding predecessor costs related to the drop down of the tank farms and product terminals at both Tyler and El Dorado during the
respective periods.
Note: May not foot due to rounding and annual adjustments that occurred in year end reporting.
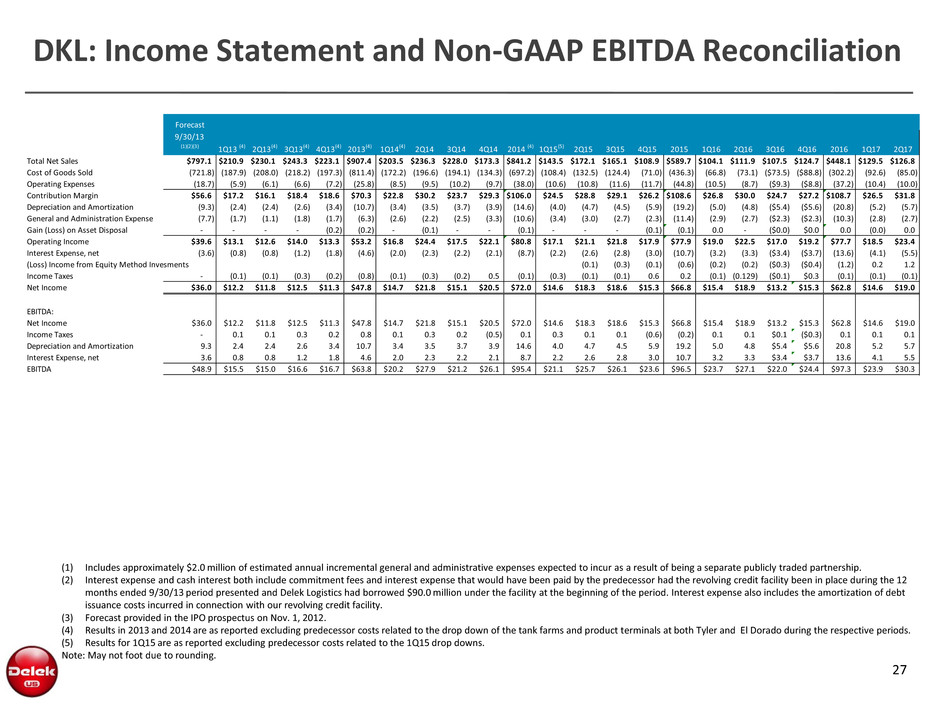
DKL: Income Statement and Non-GAAP EBITDA Reconciliation
27
(1) Includes approximately $2.0 million of estimated annual incremental general and administrative expenses expected to incur as a result of being a separate publicly traded partnership.
(2) Interest expense and cash interest both include commitment fees and interest expense that would have been paid by the predecessor had the revolving credit facility been in place during the 12
months ended 9/30/13 period presented and Delek Logistics had borrowed $90.0 million under the facility at the beginning of the period. Interest expense also includes the amortization of debt
issuance costs incurred in connection with our revolving credit facility.
(3) Forecast provided in the IPO prospectus on Nov. 1, 2012.
(4) Results in 2013 and 2014 are as reported excluding predecessor costs related to the drop down of the tank farms and product terminals at both Tyler and El Dorado during the respective periods.
(5) Results for 1Q15 are as reported excluding predecessor costs related to the 1Q15 drop downs.
Note: May not foot due to rounding.
Forecast12 Months
9/30/13
(1)(2)(3) 1Q13 (4) 2Q13(4) 3Q13(4) 4Q13(4) 2013(4) 1Q14(4) 2Q14 3Q14 4Q14 2014 (4) 1Q15(5) 2Q15 3Q15 4Q15 2015 1Q16 2Q16 3Q16 4Q16 2016 1Q17 2Q17
Total Net Sales $797.1 $210.9 $230.1 $243.3 $223.1 $907.4 $203.5 $236.3 $228.0 $173.3 $841.2 $143.5 $172.1 $165.1 $108.9 $589.7 $104.1 $111.9 $107.5 $124.7 $448.1 $129.5 $126.8
Cost of Goods Sold (721.8) (187.9) (208.0) (218.2) (197.3) (811.4) (172.2) (196.6) (194.1) (134.3) (697.2) (108.4) (132.5) (124.4) (71.0) (436.3) (66.8) (73.1) ($73.5) ($88.8) (302.2) (92.6) (85.0)
Operating Expenses (18.7) (5.9) (6.1) (6.6) (7.2) (25.8) (8.5) (9.5) (10.2) (9.7) (38.0) (10.6) (10.8) (11.6) (11.7) (44.8) (10.5) (8.7) ($9.3) ($8.8) (37.2) (10.4) (10.0)
Contribution Margin $56.6 $17.2 $16.1 $18.4 $18.6 $70.3 $22.8 $30.2 $23.7 $29.3 $106.0 $24.5 $28.8 $29.1 $26.2 $108.6 $26.8 $30.0 $24.7 $27.2 $108.7 $26.5 $31.8
Depreciation and Amortization (9.3) (2.4) (2.4) (2.6) (3.4) (10.7) (3.4) (3.5) (3.7) (3.9) (14.6) (4.0) (4.7) (4.5) (5.9) (19.2) (5.0) (4.8) ($5.4) ($5.6) (20.8) (5.2) (5.7)
General and Administration Expense (7.7) (1.7) (1.1) (1.8) (1.7) (6.3) (2.6) (2.2) (2.5) (3.3) (10.6) (3.4) (3.0) (2.7) (2.3) (11.4) (2.9) (2.7) ($2.3) ($2.3) (10.3) (2.8) (2.7)
Gain (Loss) on Asset Disposal - - - - (0.2) (0.2) - (0.1) - - (0.1) - - - (0.1) (0.1) 0.0 - ($0.0) $0.0 0.0 (0.0) 0.0
Operating Income $39.6 $13.1 $12.6 $14.0 $13.3 $53.2 $16.8 $24.4 $17.5 $22.1 $80.8 $17.1 $21.1 $21.8 $17.9 $77.9 $19.0 $22.5 $17.0 $19.2 $77.7 $18.5 $23.4
Interest Expense, net (3.6) (0.8) (0.8) (1.2) (1.8) (4.6) (2.0) (2.3) (2.2) (2.1) (8.7) (2.2) (2.6) (2.8) (3.0) (10.7) (3.2) (3.3) ($3.4) ($3.7) (13.6) (4.1) (5.5)
(Loss) Income from Equity Method Invesments (0.1) (0.3) (0.1) (0.6) (0.2) (0.2) ($0.3) ($0.4) (1.2) 0.2 1.2
Income Taxes - (0.1) (0.1) (0.3) (0.2) (0.8) (0.1) (0.3) (0.2) 0.5 (0.1) (0.3) (0.1) (0.1) 0.6 0.2 (0.1) (0.129) ($0.1) $0.3 (0.1) (0.1) (0.1)
Net Income $36.0 $12.2 $11.8 $12.5 $11.3 $47.8 $14.7 $21.8 $15.1 $20.5 $72.0 $14.6 $18.3 $18.6 $15.3 $66.8 $15.4 $18.9 $13.2 $15.3 $62.8 $14.6 $19.0
EBITDA:
Net Income $36.0 $12.2 $11.8 $12.5 $11.3 $47.8 $14.7 $21.8 $15.1 $20.5 $72.0 $14.6 $18.3 $18.6 $15.3 $66.8 $15.4 $18.9 $13.2 $15.3 $62.8 $14.6 $19.0
Income Taxes - 0.1 0.1 0.3 0.2 0.8 0.1 0.3 0.2 (0.5) 0.1 0.3 0.1 0.1 (0.6) (0.2) 0.1 0.1 $0.1 ($0.3) 0.1 0.1 0.1
Depreciation and Amortization 9.3 2.4 2.4 2.6 3.4 10.7 3.4 3.5 3.7 3.9 14.6 4.0 4.7 4.5 5.9 19.2 5.0 4.8 $5.4 $5.6 20.8 5.2 5.7
Interest Expense, net 3.6 0.8 0.8 1.2 1.8 4.6 2.0 2.3 2.2 2.1 8.7 2.2 2.6 2.8 3.0 10.7 3.2 3.3 $3.4 $3.7 13.6 4.1 5.5
EBITDA $48.9 $15.5 $15.0 $16.6 $16.7 $63.8 $20.2 $27.9 $21.2 $26.1 $95.4 $21.1 $25.7 $26.1 $23.6 $96.5 $23.7 $27.1 $22.0 $24.4 $97.3 $23.9 $30.3
Investor Relations Contact:
Kevin Kremke Keith Johnson
Executive Vice President, CFO Vice President of Investor Relations
615-224-1323 615-435-1366
